stability programme update - minhafp.gob.es€¦ · stability programme update ... offamily aid and...
TRANSCRIPT

STABILITY PROGRAMME UPDATE
SPAIN
2009 2013

CONTENTS
CONTENTS ....................................................................................... 1 1. EXECUTIVE SUMMARY ........................................................................ 3 2. GENERAL ECONOMIC POLICY FRAMEWORK AND EXIT STRATEGY FROM
THE CRISIS ...................................................................................... 4 2.1 Exit strategy from the crisis .......................................................... 4 2.2 Quantifying the economic impact of some of the measures envisaged in the Sustainable Economy draft Bill ................................................... 7
3. CURRENT ECONOMIC SITUATION AND OUTLOOK ................................ 14 3.1 Economic situation in 2009 ......................................................... 14 3.2 External assumptions and monetary, financial and fiscal conditions .. 17 3.3 Projections 20092013 for Spain .................................................. 18 3.4 Sectoral balances ...................................................................... 21
4. BUDGETARY CONSOLIDATION STRATEGY IN THE FRAMEWORK OF THE EXCESS DEFICIT PROCEDURE ........................................................... 22 4.1 Public finances in 2009 ............................................................... 22 4.2 Budgetary consolidation strategy ................................................. 23 4.3 Structural balance and fiscal stance ............................................. 28 4.4 Government debt developments .................................................. 29
5. COMPARISON WITH THE PREVIOUS UPDATE AND SENSITIVITY ANALYSIS 30 5.1 Comparison with the previous update ........................................... 30 5.2 Sensitivity analysis .................................................................... 31
6. QUALITY OF PUBLIC FINANCES ......................................................... 33 6.1 Introduction .............................................................................. 33 6.2 Breakdown of expenditure .......................................................... 33 6.3 Breakdown of revenues .............................................................. 35
7. SUSTAINABILITY OF PUBLIC FINANCES ............................................. 36 7.1 Longterm budgetary projections ................................................. 36 7.2 Strategy ................................................................................... 37
8. INSTITUTIONAL FRAMEWORK OF PUBLIC FINANCES ............................ 40 8.1 Application of budgetary stability laws .......................................... 40 8.2 Reinforcing budget stability ......................................................... 40 8.3 Reform of Territorial Financing System ......................................... 41
1 Stability Programme 20092013

TABLES
2.1 Sustainable Economy draft Bill: measures to improve the economic environment
2.2 Sustainable Economy draft Bill: measures to promote competitiveness
2.3 Sustainable Economy draft Bill: measures to preserve the environment
2.4 Sustainable Economy draft Bill: tax measures 3.1 Impact of fiscal policy on economic activity 3.2 External and financial assumptions 3.3 Macroeconomic prospects 3.4 Labour market developments 3.5 Price developments 3.6 Sectoral balances 4.1 Recent developments in public accounts 4.2 Consolidation of the Central Government budget for 2010 4.3 Budgetary prospects 4.4 Cyclical developments 4.5 General government debt developments 5.1 Comparison with the previous Stability Programme Update 5.2 Sensitivity analysis 7.1 Projections of expenditure associated to ageing from the
European Union Economic Policy Committee (2009)
FIGURES
3.1 Composition of quarterly GDP growth 3.2 Headline and core inflation and differential with EMU 6.1 Productive public expenditure, by component 6.2 Public investment and convergence in per capita public
infrastructure endowment
2 Stability Programme 20092013

1. EXECUTIVE SUMMARY
In 2009, the Spanish economy and those of the other developed countries experienced the deepest recession in recent history. Only concerted action by all the economic authorities avoided an even sharper deterioration, with the social costs which that would have entailed. However, this was achieved at the expense of a notable deterioration in public finances, which will have to be corrected in the coming years, as required by Spanish legislation on budgetary stability and by European regulations. For that reason, this Stability Programme Update details the actions to be taken in the coming years in response to the Recommendation made by the Council on 2 December 2009 under article 126.7 of the Treaty on the Functioning of the European Union (TFEU) to correct the excess deficit by 2013 at the latest.
In any event, the challenge facing the Spanish economy lies in implementing an ambitious exit strategy from the crisis, which includes two main lines of action in addition to budgetary consolidation. On the one hand, the financial system must be strengthened to ensure that credit is effectively channelled to the private sector; on the other, there is the exit strategy for the real economy, which includes the necessary structural reforms to lay the foundation for robust, sustainable, balanced growth in the future. Only in this context can effective budgetary consolidation be achieved. For that reason, this Update also describes and assesses the broad range of measures being proposed in the framework of the Strategy for a Sustainable Economy, specifically through the Strategy's basic instrument, the Sustainable Economy Bill.
The government's fiscal exit strategy combines firm curtailment of expenditure with a moderate increase in revenues. In fact, this consolidation process commenced with the Central Government Budget for 2010, by raising certain taxes and significantly reducing current expenditure. Subsequently, on 29 January 2010, the Government approved two plans to cut public spending in the sphere of the Central Government (the Immediate Action Plan 2010 and the Austerity Plan 20112013) and proposed two Framework Agreements with the Autonomous Communities and Local Governments which set out the measures that will enable the necessary adjustments to be made in expenditure, with all levels of government being committed to this goal. Additionally, initiatives are being taken for the medium and long term that will significantly improve the sustainability of public finances. The Sustainable Economy draft Bill (which is in the process of approval) envisages partly eliminating the home purchase tax deduction, and on 29 January 2010 the Government proposed to the Toledo Pact and the Social Partners an ambitious reform of the pension system which modifies some of the current system's parameters (including the statutory retirement age) and improves the system of family aid and the incentives for supplementary voluntary pension schemes.
The Cabinet approved the remittal of this Update to the European institutions on 29 January 2010.
3 Stability Programme 20092013
2. GENERAL ECONOMIC POLICY FRAMEWORK AND EXIT STRATEGY FROM THE CRISIS
2.1 Exit strategy from the crisis
The economic crisis that arose in 2008 and was exacerbated in 2009 has been one of the most serious and widespread in history. Only determined concerted action by all the economic authorities avoided a collapse of the financial markets and an even deeper deterioration in the real economy, and the consequent social costs. The European Union coordinated the response to the crisis via the European Economic Recovery Plan and the decisions adopted by the Economic and Financial Affairs (ECOFIN) Council and the European Council in late 2008. In Spain, this programme was implemented in the form of the Spanish Stimulus Plan for Growth and Jobs, whose main measures are detailed in the following sections. Also, as in the other euro area countries, the monetary policy decisions adopted by the European Central Bank provided considerable support for the financial sector and the real economy.
Signs of recovery are now visible. When the time is right, the exceptional government support must be withdrawn gradually and in a coordinated manner. The challenge now is to undertake an ambitious strategy to overcome the crisis based on three mutuallyenhancing lines of action. The first is budgetary consolidation. The second is restructuring and strengthening the financial system. The third is an exit strategy for the real economy, which includes the necessary structural reforms to lay the foundation for robust, sustainable, balanced growth so as to avoid the repetition of a crisis of this magnitude in the future.
Spain's fiscal exit strategy was designed on the basis of the Council Recommendation on 2 December 2009, under article 126.7 TFEU, that the excess deficit be corrected by 2013 at the latest. As on previous occasions, the ECOFIN Council Opinion of the previous Update, the Integrated Guidelines for 20082011 and the Eurogroup's Orientations based on the midyear budgetary review were also taken into account. The Update is also consistent with the latest Progress Report of the National Reform Programme, presented to the European institutions in November 2009. The structure and information contained in this Update conform to the Code of Conduct.
The goal for public finances is to achieve a deficit of 3% of GDP by 2013. Each year through 2013, a fiscal effort over 1.5% of GPD on average will be made, with more intense efforts being made in the years of stronger economic growth. The details of this fiscal consolidation process are set out in section 4 of this Update, which presents the basic tools approved by the Spanish Government to achieve this goal: the Central Government Budget for 2010, the plans to cut public expenditure in the sphere of the Central Government (Immediate Action Plan 2010 and Austerity Plan 20112013), and the Framework Agreements on the Sustainability of Public Finances with the Autonomous Communities and Local Governments. Moreover, in compliance with the Stability and Growth Pact, it is necessary to review the mediumterm objective in accordance with the new methodology agreed by the Council in
4 Stability Programme 20092013
July 2009, which includes the implicit liabilities associated to population ageing. In the case of Spain, the mediumterm objective continues to be an ambitious one: a cyclically adjusted budget balance, which will enable Spain to finance over 33% of the projected cost of ageing, as agreed within the EU. Therefore, if economic growth exceeds the projections of this Update, the additional revenues will be used to reduce the deficit and, once the deficit has hit the 3% target, fiscal consolidation will continue beyond 2013 in order to attain a balanced budget.
Regarding the second pillar of the exit strategy, i.e. the financial sector, the measures implemented by the Government to date during the crisis have focused on palliating the shortage of liquidity in the international financial markets and supporting the flow of credit to the private sector. Three measures stand out in particular: the Financial Assets Acquisition Fund (FAAF), the programme of government guarantees for bonds issued by credit institutions, and the expansion of intermediation lines at the Instituto de Credito Oficial (ICO). The FAAF, created in October 2008, held four auctions between November 2008 and January 2009 to acquire highquality financial assets issued by Spanish credit institutions; 54 institutions obtained a total of 19.341 billion euro of funding at a maximum maturity of three years. The FAAF has not held auctions since February 2009 due to the implementation of other measures by the Government and the unconventional monetary policy measures by the European Central Bank. By law, the FAAF is not allowed to hold auctions after 31 December 2009.
In 2009, the government guarantee programme for securities issued by credit institutions directly covered nearly 150 issues of bonds and commercial paper by 41 institutions, amounting to a total of 48 billion euro. The European Commission authorised the prolongation of Spain's guarantee scheme to 30 June 2010, thus extending the window for guaranteed issues that have already been granted. Any extension of the issue date beyond that deadline depends on approval by the European Commission of additional prolongations of the scheme, which is reviewed every six months. Moreover, there is no limit reservation in the 2010 Central Government Budget Act for guarantees for bank securities; accordingly, there will be no further guarantees apart from those already authorised under the 2008 and 2009 Central Government Budgets.
Late in 2008 and in 2009, the ICO greatly expanded its financial intermediation activities. Specifically, its assets rose from 40 billion euro at 2007 yearend to over 60 billion euro at present, and it financed a very significant proportion of new lending by private financial institutions. An extensive approach was adopted initially, under which new finance lines were created to cover a broad range of possibilities, including financing companies' working capital and risk sharing with private financial institutions; however, the degree to which these facilities have been used has varied. The ICO must gradually focus on supporting the individuals and companies that encounter the greatest restrictions in financial markets. The first steps in this direction are taken by simplifying and unifying the intermediation lines and creating the
5 Stability Programme 20092013

role of financial facilitator, who can channel information from entrepreneurs who face difficulties in obtaining funding from private institutions.
Regarding structural measures to strengthen the financial sector, the Government has designed a strategy for bank restructuring and credit institutions equity reinforcement. Its main instrument, the Fund for Orderly Bank Restructuring (FROB), was created in June 2009. Although the Fund has not participated in any transaction to date, its modus operandi and financing were established in 2009, and it issued 3 billion euro bonds with 5year maturity in favourable conditions.
The third pillar of structural reforms consists of the Strategy for a Sustainable Economy, which includes a broad range of reforms and horizontal actions to lay the foundations for sustainable, balanced growth that assures economic recovery and makes budgetary consolidation possible. This Strategy consists of: first, the Sustainable Economy draft Bill (in the process of approval); second, measures to address other key aspects of the economy, such as the labour market and the Social Security system; and lastly, a number of actions and programmes to implement and develop the reforms defined in the Strategy over the coming years.
The Sustainable Economy draft Bill is structured in three main areas: i) improving the economic environment by modernising and simplifying government activities as well as increasing general government discipline (Table 2.1); ii) improving companies' competitiveness by reducing the administrative burden and promoting sectors that are at the base of economic activity, such as R&D, innovation and training, and improving support for their integration into the overall value chain (Table 2.2); iii) a commitment with environmental sustainability, mainly through improvements in the mechanisms for managing, planning and regulating industries with a strong environmental impact, such as energy and transportation (Table 2.3). Furthermore, the draft Bill includes a number of tax measures as set out in Table 2.4.
Actions and programmes outside the scope of the draft Bill but covered in the Strategy include two particularly relevant points: labour market functioning, and the pension system. With regard to the labour market, the Government has undertaken to refer to the Social Dialogue, on 5 February 2010, a number of measures aimed at favouring job creation and adapting labour relations to companies' situations while protecting workers' rights. Those proposals will include measures to reform collective bargaining to adapt it better to bilateral situations; measures to foster youth employment and provide training; measures to improve labour intermediation and control of sick leave; measures to progress further in female integration in the labour market; and measures aimed at improving job stability by reducing the segmentation that exists in the labour market.
To ensure social sustainability, it is important to strengthen the Social Security system and, to that end, on 29 January 2010 the Government agreed to refer a number of farreaching measures to the Toledo Pact
6 Stability Programme 20092013

Commission and the Social Dialogue. Specifically, the proposed reform involves gradually increasing the statutory age of retirement to 67 and the consistent modification of other parameters of the system. An ambitious implementation of these proposals will significantly reduce the projected expenditure associated with ageing.
Another set of measures in the draft Bill refers to the real estate industry and will have a decisive impact in the change of the growth pattern. The elimination of the home purchase tax deduction except for lowincome taxpayers from 2011, matching the tax incentives for tenants to those for owneroccupiers, improving the legal protection for landlords (which should increase the offering of rental accommodation and reduce its cost), and the creation of Real Estate Investment Traded Societies (Sociedades de Inversión Inmobiliaria) should be sufficient to ensure greater development of alternative stores of wealth, such as mutual funds or pension funds and human capital. Reducing the real estate industry's importance in the economy will improve the productivity of the overall economy, exceeding the levels attained in the latest expansive cycle of the Spanish economy.
2.2 Quantifying the economic impact of some of the measures envisaged in the Sustainable Economy draft Bill
Quantitative estimates of the economic impact of the measures in the Sustainable Economy draft Bill and the goals set by the Strategy are necessarily very complex, given the scale and horizontal nature of the measures. No quantitative model covers all the aspects envisaged in the Strategy. Moreover, many of the reforms are qualitative and, therefore, difficult to incorporate into the standard models. Despite these difficulties, the Ministry of Economy and Finance made a quantitative estimate of the economic impact of some of the measures contained in the second axis of the draft Bill, that related to business competitiveness and of some of the objectives established by the Strategy. For that reason, it is essential that progress towards meeting these objectives be evaluated in the future and that measures be taken to correct for any deviations. In any event, the numerical results should be used with caution since they are subject to error. Specifically, this section quantifies the economic impact of: i) reducing the costs of creating a company; ii) shortening the time taken to pay companies; iii) eliminating red tape; iv) increasing investment in R&D and innovation; and v) improving the population's level of training and education.
The time it takes to create a company, and the related costs, can be viewed as a barrier to entry in the goods and services market. The greater such barriers, the lower will be the degree of competition in the markets and, therefore, the higher product prices will be. Moreover, entry barriers will also impair firm dynamics, with the result that the least efficient companies will not disappear to be replaced by more productive companies. Based on data compiled by the National Agency for the Assessment of Public Policy and Service Quality1, the
1 AEVAL [2008]: “Trámites administrativos para la creación de empresas en España”.
7 Stability Programme 20092013

reform will reduce the cost of creating a standard2 Spanish company from €617 to €203 and the time will be cut from 3040 days to 17 days, i.e. a 54% reduction in the combined barriers to entry. Using the QUEST model developed by the European Commission3, this reduction of entry barriers will boost GDP by 0.8% from 2020 when compared with the estimate without the reform, the same as with the compensation of employees (wages and employment). This will lead to a 0.07 percentage point increase each year in Spain's growth potential over the next decade. Moreover, these effects will be in addition to the impact of the entry into force in 2010 of the transposition of the Services Directive (analysed in the previous Stability Programme Update), which will have even greater economic effects.
With regard to companies' funding costs, the draft Bill also contains measures to accelerate payments, both by all levels of government and between companies. In the case of public administrations, shortening payment periods by one month will reduce the private sector's costs by around 750 million euro by enabling it to resort less to costbearing external financing. In the case of payments between companies, aggregate average funding costs will also be reduced since smaller companies are the ones that obtain external funding in the least favourable conditions. Specifically, reducing the average payment period from the current 124 days to 60 days will save nonfinancial firms about 1.7 billion euro. According to the results of the Ministry of Economy and Finance's REMS general equilibrium model4, this saving on financial costs will boost GDP by 0.2% from 2020 onwards, including a strong increase in investment (0.5%) and a smaller increase in employment (0.1%). In the year it is implemented, the measure may add around 0.1 percentage points to the potential growth rate.
The administrative burden is defined as the costs incurred by companies as a result of the existence of regulation, and therefore, those costs make no direct contribution to the production process. Even considering that regulation is needed where there are market failures, the authorities' goal should be to eliminate administrative burdens that are redundant, unnecessary or obsolete and to use technology that minimises compliance costs, which impair companies' competitiveness. Moreover, since administrative burdens have a large fix component that is independent of company size, they are particularly harmful to small companies (which constitute the bulk of our business structure). Applying the methodology set out in a recent publication by the Bank of Spain5 in the framework of the REMS model, the impact of attaining the goal set in the Strategy for a Sustainable Economy of cutting red tape by 50% by 2020 can be evaluated. If this measure is applied progressively, GDP
2 Like other countries, Spain has a range of different forms of business (selfemployed workers, limited
liability company, limited company by shares, etc.). The standard company is obtained from an average of all types, weighted by their actual numbers. The reduction in the cost of creating a company that is envisaged by the draft Bill refers solely to limited liability companies. 3 Ratto, Roeger and Veld (2008): "QUEST III: An Estimated DSGE Model of the Euro Area with Fiscal and
Monetary Policy", European Economy, Economic Papers, No. 335. 4 Boscá, Díaz, Doménech, Ferri, Pérez and Puch (2007): “A Rational Expectations Model for Simulation and
Policy Evaluation of the Spanish Economy”, Working Paper WP200704, Ministry of Economy and Finance. 5 López, Estrada and Thomas (2008): “Una primera estimación del impacto económico de una reducción de
las cargas administrativas en España”, Bank of Spain Economic Bulletin, JulyAugust 2008.
8 Stability Programme 20092013

in 2020 will be permanently 0.7% higher than projected, with a slightly lower improvement in productivity. Accordingly, potential GDP growth will increase by 0.06 percentage points per year.
Raising investment in R&D and innovation to 3% of GDP by 2020, as proposed in the Strategy, will also have a major impact since it represents a doubling of its current share of the economy (1.4% in 2008). Theory and empirical evidence coincide in that one of the main longterm drivers of productivity is technological change, which is a consequence of innovation in both products and processes. However, innovation requires investment in research and development; moreover, it is evident that, without such investment, it is increasingly more difficult to absorb technological progress produced elsewhere in the world. Therefore, discounting the recent trend in R&D and innovation expenditure in Spain, the additional investment required to attain that objective was entered into the European Commission's QUEST model, giving a permanent impact of 0.8% on GDP in 2020, with a moderate increase in employment and a much larger increase in real wages. If this measure is incorporated progressively, it will add around 0.07 percentage points to potential growth until the end of the next decade.
The last measure that is quantified is the goal set by the Strategy for a Sustainable Economy of improving education and training. In this case, the goals include reducing the early school leaving rate. According to estimates by the Ministry of Economy and Finance, steadily attaining these goals will mean that 22% more young people will remain in the education system beyond compulsory secondary education (ESO). This is equivalent to bringing a larger percentage of bettertrained workers into the labour force. As a result, slightly over 4% of the labour force will be better qualified by 2020. Putting this shift from lowskill to higherskill workers (in average terms) into the European Commission's QUEST model reveals that GDP in 2020 will be 1.3% higher and employment will be 1% higher than it would have been in the absence of the reforms. If the measures that are taken bring us steadily closer to the objective, that will add around 0.12 percentage points of growth until the end of the next decade. Moreover, the effects in this case will not be exhausted in 2020 since the lower school leaving rates will be consolidated.
9 Stability Programme 20092013

Table 2.1. Sustainable Economy draft Bill: measures to improve the economic environment
The draft Bill undertakes a horizontal reform of the structure and rules concerning the regulatory bodies for the network industries (National Energy Commission, Telecommunications Market Commission, National Postal Service Commission) and the National Competition Commission so as to enhance their coordination, independence and accountability.
The government also continues to adopt measures to improve supervision of the financial market. One of the main measures is the requirement that listed companies provide shareholders with a report on compensation and that it be voted as a separate item on the agenda of the Shareholders' Meeting; also, in line with the proposals by the G20 and the Financial Stability Board, the Bank of Spain may require that credit institutions apply compensation policies that are coherent with responsible risk management.
With regard to public accounts, a special group will be created to evaluate the efficiency and effectiveness of public spending, and all levels of government will be required to share liability for any penalties imposed by the European Union for an excessive deficit.
Additionally, the rules on public procurement are being improved (through a reform of the Public Procurement Act—Ley de Contratos del Sector Público); contracts with the administration may not be modified except where this possibility was already provided in the bidding specifications or the contract award or in cases of force majeure (and the modification in those cases may not amount to more than 20% of the original price). In order to encourage small and mediumsized enterprises to bid for public contracts, the cap on subcontracting has been raised from 30% to 50%. The regulation governing cooperation between the public and private sectors in the form of publicprivate partnerships (Sociedades de Economía Mixta) will be revised and those partnerships will be allowed to obtain financial support from the Central Government in the form of guarantees.
10 Stability Programme 20092013
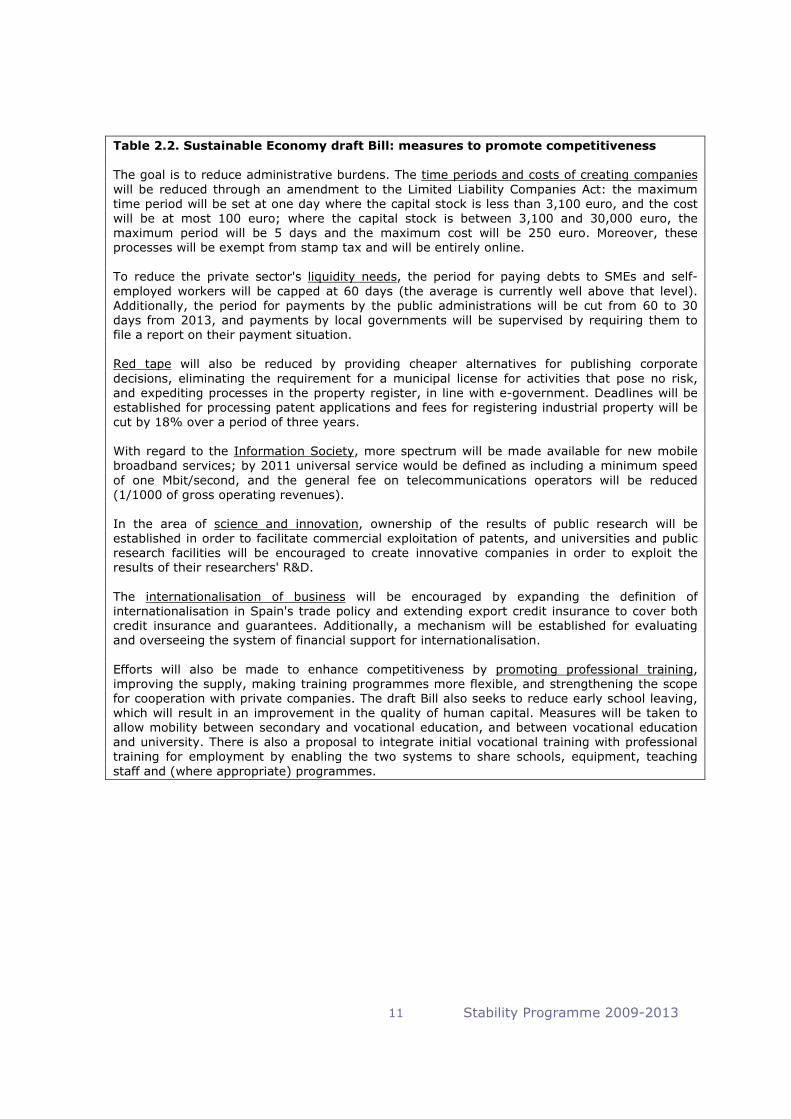
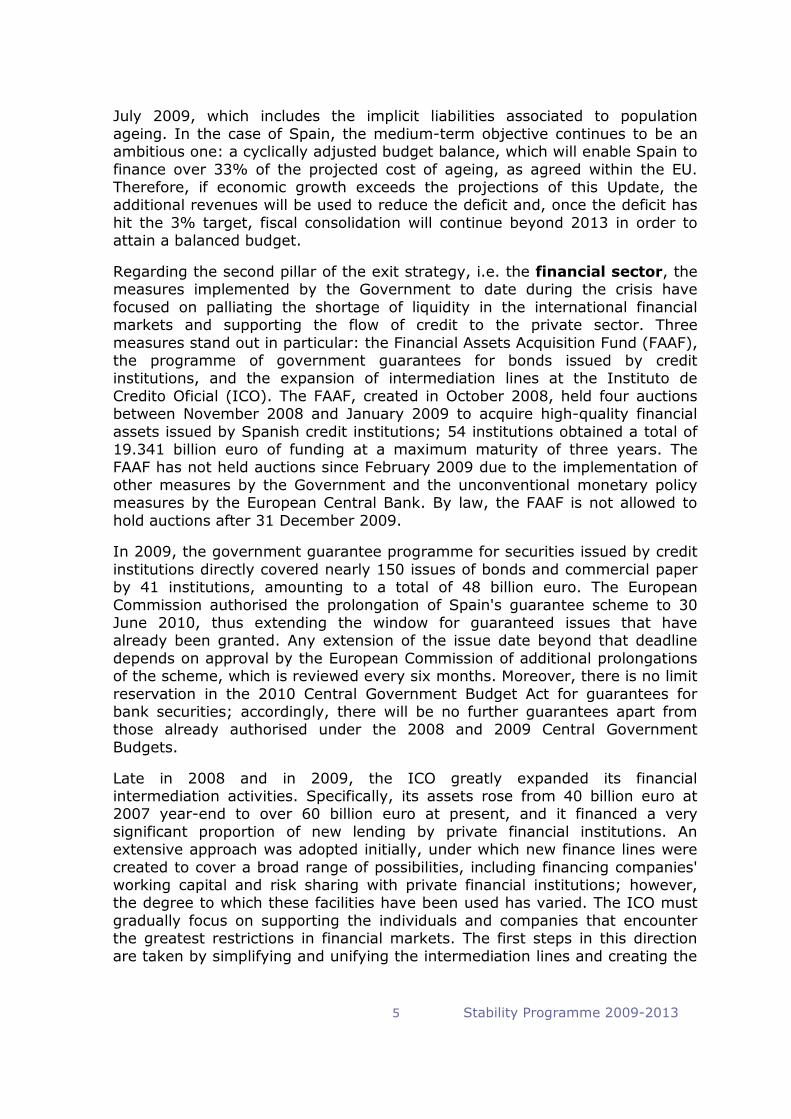
Table 2.2. Sustainable Economy draft Bill: measures to promote competitiveness
The goal is to reduce administrative burdens. The time periods and costs of creating companies will be reduced through an amendment to the Limited Liability Companies Act: the maximum time period will be set at one day where the capital stock is less than 3,100 euro, and the cost will be at most 100 euro; where the capital stock is between 3,100 and 30,000 euro, the maximum period will be 5 days and the maximum cost will be 250 euro. Moreover, these processes will be exempt from stamp tax and will be entirely online.
To reduce the private sector's liquidity needs, the period for paying debts to SMEs and selfemployed workers will be capped at 60 days (the average is currently well above that level). Additionally, the period for payments by the public administrations will be cut from 60 to 30 days from 2013, and payments by local governments will be supervised by requiring them to file a report on their payment situation.
Red tape will also be reduced by providing cheaper alternatives for publishing corporate decisions, eliminating the requirement for a municipal license for activities that pose no risk, and expediting processes in the property register, in line with egovernment. Deadlines will be established for processing patent applications and fees for registering industrial property will be cut by 18% over a period of three years.
With regard to the Information Society, more spectrum will be made available for new mobile broadband services; by 2011 universal service would be defined as including a minimum speed of one Mbit/second, and the general fee on telecommunications operators will be reduced (1/1000 of gross operating revenues).
In the area of science and innovation, ownership of the results of public research will be established in order to facilitate commercial exploitation of patents, and universities and public research facilities will be encouraged to create innovative companies in order to exploit the results of their researchers' R&D.
The internationalisation of business will be encouraged by expanding the definition of internationalisation in Spain's trade policy and extending export credit insurance to cover both credit insurance and guarantees. Additionally, a mechanism will be established for evaluating and overseeing the system of financial support for internationalisation.
Efforts will also be made to enhance competitiveness by promoting professional training, improving the supply, making training programmes more flexible, and strengthening the scope for cooperation with private companies. The draft Bill also seeks to reduce early school leaving, which will result in an improvement in the quality of human capital. Measures will be taken to allow mobility between secondary and vocational education, and between vocational education and university. There is also a proposal to integrate initial vocational training with professional training for employment by enabling the two systems to share schools, equipment, teaching staff and (where appropriate) programmes.
11 Stability Programme 20092013

Table 2.3. Sustainable Economy draft Bill: measures to preserve the environment
Firstly, the foundations are laid for future energy policy, which must guarantee supply security, economic efficiency and compliance with acquired environmental commitments. To that end, objectives will be established for energy saving and efficiency (by promoting R&D and innovation, and the creation of energy services companies, among other measures) and for renewable energy share, based on overall cost criteria that include the environmental impact.
Secondly, to reduce greenhouse gas emissions, the measures detailed below will be adopted: i) increase the absorption capacity of CO2 sinks, ii) establish the possibility of offsets, and iii) create a fund to acquire emission reductions.
The goal with regard to transport is to favour competition, efficiency and environmental protection. To that end, the various markets will be classified and subsidies will be confined to services designated as being of public interest. Priorities will also be set in the area of infrastructure based on overall cost and interconnection capacity. The drafting of Sustainable Mobility Plans will be encouraged at all levels of government, as will the use of clean, efficient means of transport.
The residential sector will be encouraged to reduce greenhouse gas emissions, noise and waste, and to reduce energy and water consumption. To that end, emphasis will be placed on renovation and refurbishment of homes and tourist facilities.
12 Stability Programme 20092013

Table 2.4. Sustainable Economy draft Bill: tax measures
1) Real estate industry and rentals
Improved tax treatment for refurbishment work on homes to improve energy efficiency and save water (and for accessibility by persons with impaired mobility).
A new 10% personal income tax credit for projects that pursue those objectives. A multiyear maximum will be established of 10,000 euro per home.
Application of the reduced VAT rate
Amendment of the tax credit for home purchase: the current tax deduction (15% of amounts paid in the year, subject to a cap of 9,040 euro per year) will be maintained for taxpayers whose taxable income is less than 17,707.2 euro. The tax deduction will be reduced on a straight line basis between that figure and a taxable income of 24,107.2 euro. Above that income, the tax deduction will be eliminated effective 1 January 2011. Taxpayers who purchased their home before 31 December 2010 will be grandfathered.
Home rental will obtain the same tax treatment as home purchase: the taxable income ceilings that apply to this tax deduction will be raised in line with the deduction for home purchase. At present, tenants qualify for a 10.05% deduction on rent paid up to a maximum of 9,040 euro per year, provided that their taxable income is less than 12,000 euro per year. Effective 1 January 2011, that limit will be raised from 12,000 to 17,707.2 euro. The base of the tax deduction will be reduced progressively for taxable incomes between 17,707.2 and 24,107.2 euro, with no deduction for incomes above the latter figure.
Review of the tax treatment for building rental: the percentage of rental income that is taxfree will be raised from 50% to 60%, while the cap on the tenant's age for the 100% exemption will be reduced from 35 to 30.
2) R&D and innovation
Improved company tax incentives: the tax deduction for innovation activities is increased from 8% to 12%. Additionally, in April 2009 the government extended the company tax deduction for R&D and innovation indefinitely (Royal DecreeAct 3/2009).
3) Environmental protection
Employer subsidies for public transport season tickets will be exempted from personal income tax up to 1,500 euro per year.
The environmental deduction under company tax, which was due to be phased out in 2011, is being maintained and expanded. The percentage of the deduction has been raised from 4% to 8%.
4) Improvements to make the tax system more progressive.
Taxation of income obtained over a period of several years: the law establishes an absolute cap of 600,000 euro for applying the 40% deduction for income obtained over a period of more than two years. The tax deduction will apply up to that cap, but amounts over the cap do not qualify.
The tax treatment for income from the exercise of stock options granted to employees is maintained, but the 600,000 euro limit will also apply.
13 Stability Programme 20092013

3. CURRENT ECONOMIC SITUATION AND OUTLOOK
3.1 Economic situation in 2009
The Spanish economy was already exposed to a sharp readjustment of its housebuilding, when suffered the full impact of the collapse by the international financial markets and the drastic contraction of world trade following the fall of Lehman Brothers, with the result that the economic recession was particularly severe in the first half of 2009. Specifically, according to Quarterly National Accounts (CNTR) estimates, real GDP shrank 1.6% quarteronquarter in the first quarter of 2009 and by 1.1% in the second quarter, but the decline then eased significantly (Figure 3.1). The contraction had a particular impact on employment, with over one million jobs being destroyed in annual average terms. Although 40% of job destruction was in the construction industry, the adjustment spread to other industries through certain labour market inefficiencies, resulting in a sizeable social cost.
FIGURE 3 .1. COMPOSITION OF GDP QUARTERLY G ROWTH contribution in percentage points
2000 2001 2002 2003 2004 2005 2006 2007 2008 2009
3
2
1
0
-1 GDP (percentage change)
-2 Domestic demand
Net foreign balance -3
Source: INE and MEH
The decline in economic activity was the result of very weak domestic demand and exports, impacted by the sharp decline in world trade. The decline in private consumption expenditure accelerated in the first half of 2009 as a result of the intense job destruction, deteriorating confidence, raised lending standards and the reduction in household wealth. Accordingly, although households' disposable income increased broadly as a result of actions by the public sector (including the automatic stabilisers) and of the reductions in interest rates, imported commodity prices and business margins, the saving rate increased to record levels (close to 20% in annual average terms). The recovery in confidence and higher equity prices in the second half of the year were complemented by car purchase subsidies under the Plan 2000E, with the result that private consumption expenditure practically stabilised.
Fixed capital formation also declined sharply in the first six months of 2009 as a result of weak performance by its main components (particularly, investment in capital goods). Tighter lending standards, deteriorating business expectations and the reduction in demand were the main factors that prevented business from implementing investment projects. The decline in
14 Stability Programme 20092013
construction investment accelerated as a result of deterioration by the residential segment, which was not offset by the recovery in investment in other construction (broadly favoured by local government projects linked to the Central Government Fund for Local Public Investment). Nevertheless, investment in capital goods advanced modestly in the second half of 2009 as a result of lower uncertainty, low interest rates, less stringent lending standards and the stock market recovery.
Exports of goods and services shrank 8.7% in quarteronquarter terms in the first three months of 2009 but stabilised in the second quarter and recovered thereafter. The initial decline was sharper in the case of goods exports, but so too was the subsequent rebound, and Spain improved its share of world exports slightly from the beginning of the year due to improved pricecompetitiveness. Tourism exports also fell notably as a result of the economic recession in our main client countries, an effect that was exacerbated in the case of the UK by the depreciation of the sterling. Nevertheless, whereas the foreign sector's contribution to GDP has traditionally been negative, it changed sign in the first quarter of 2008 and then increased until the second quarter of 2009. This was the result of the drastic adjustment in imports, mainly as a result of their greater cyclesensitivity when compared with domestic demand, but also of improvements in competitiveness.
The deterioration in the labour market since the beginning of the crisis was also gradually attenuated. Whereas nearly 500,000 jobs were lost in the first three months of 2009 (seasonally adjusted figures), the loss was less than 100,000 in the final months of the year. Workers on temporary contracts bore the brunt of the adjustment, although permanent workers also began to be affected in the third quarter of 2009. Additionally, the labour force decelerated intensely during the year, and declined in the fourth quarter, which is more in line with the current economic situation. As a result, the unemployment rate rose drastically to 18% in the year as a whole. Despite the notable deterioration in the labour market, inflationadjusted wages increased at a good pace (over 4%). Although the increase in the recurring component of labour costs was somewhat more moderate, it contributed to accentuating the real adjustment in the economy. For that reason, although productivity improved largely, business margins shrank for the third consecutive year, by 0.5% in 2009.
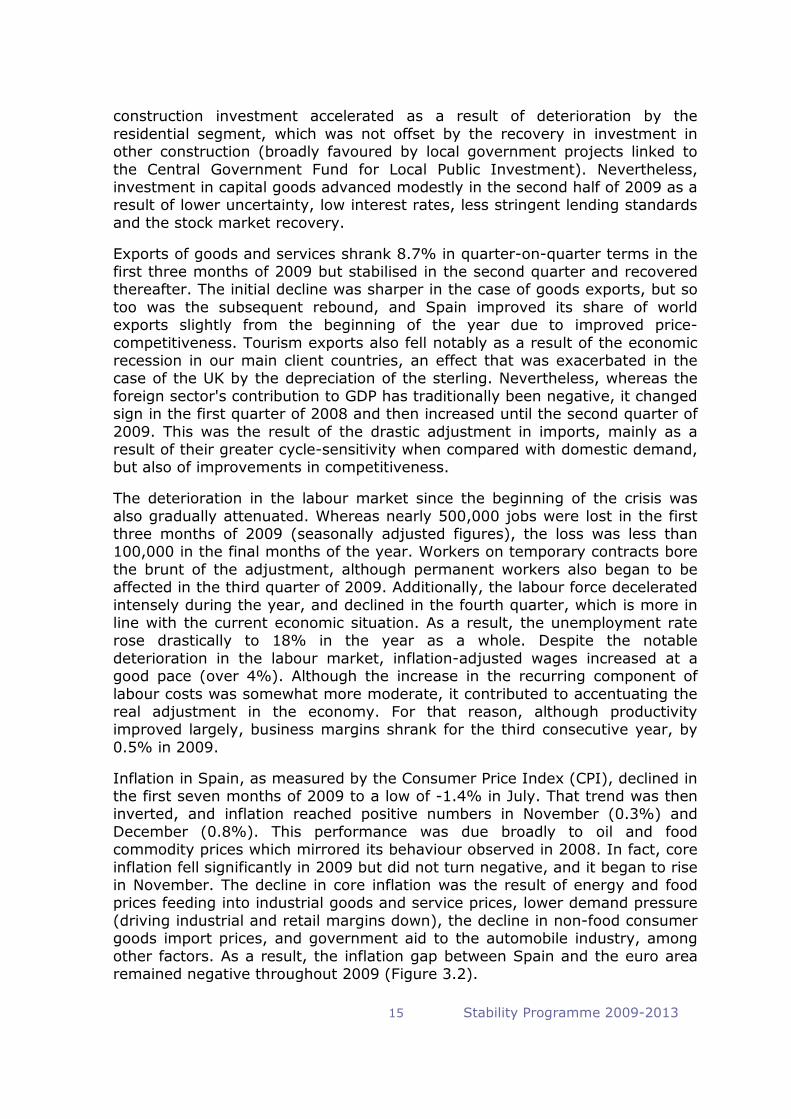
Inflation in Spain, as measured by the Consumer Price Index (CPI), declined in the first seven months of 2009 to a low of 1.4% in July. That trend was then inverted, and inflation reached positive numbers in November (0.3%) and December (0.8%). This performance was due broadly to oil and food commodity prices which mirrored its behaviour observed in 2008. In fact, core inflation fell significantly in 2009 but did not turn negative, and it began to rise in November. The decline in core inflation was the result of energy and food prices feeding into industrial goods and service prices, lower demand pressure (driving industrial and retail margins down), the decline in nonfood consumer goods import prices, and government aid to the automobile industry, among other factors. As a result, the inflation gap between Spain and the euro area remained negative throughout 2009 (Figure 3.2).
15 Stability Programme 20092013

FIGURE 3.2. HEADLINE AND CORE INFLATION AND DIFFERENTIAL WITH EMU year on year percentage change
6
4
2
0
-2
Headline
Core
Differential Spain - EMU (percentage points)
2000 2001 2002 2003 2004 2005 2006 2007 2008 2009
Source: INE, Eurostat and MEH
In this context, the Spanish Government reacted rapidly to palliate the adjustment in demand and sustain confidence in the economy in line with the recommendations agreed upon with the other Member States. In fact, fiscal policy adopted a twopronged strategy in response to the crisis. Firstly, by allowing the automatic stabilisers to operate freely, including strengthening some social protection mechanisms. Secondly, by using specific measures designed to restore credit flows, boost household disposable income, and provide liquidity to companies.
It is difficult to quantify the impact of these measures on economic activity since the available tools do not include many of the feedback and interaction channels that were activated during the crisis. Nevertheless, Table 3.1 summarises the impact of the main measures adopted on GDP growth as evaluated using the REMS model. Those figures should be interpreted as lower bounds of the actual effects since in this model there is little interaction between the financial and real components of the economy, and uncertainty does not affect agents' decisions. Nevertheless, the effect is sizeable: 1.5 percentage points in 2009 in the case of the discretionary measures discussed here, which do not include the actions of the Instituto de Credito Oficial or the other measures aimed at the financial sector, and 0.6 points in the case of the automatic stabilisers.
Table 3.1. IMPACT OF FISCAL POLICY ON THE ECONOMY Contribution to GDP growth
2009 Central Government Fund for Local Public Investment Fund to Revitalise the Economy and Employment 400 euro personal income tax credit Tax measures to support liquidity (*)
Total discretionary measures
Automatic stabilisers
TOTAL
0.7 0.1 0.4 0.3
1.5
0.6
2.1
(*) Monthly refunds of VAT for small companies, early recognition of home purchase credit under personal income tax, and longer deferrals of tax obligations. Source: Ministry of Economy and Finance.
16 Stability Programme 20092013

Considering also the impact of conventional and unconventional monetary policy measures, the actions by the fiscal and monetary authorities provided major support for the economy in 2009.
3.2 External assumptions and monetary, financial and fiscal conditions
Like Spain, the world economy entered 2009 in the depths of a recession, but the economic situation and global prospects began to improve in the Spring. The recovery first became visible in some emerging countries and then spread to the industrialised economies. The European Commission expects the recovery to persist and, following a 0.4% decline in nonEU world GDP in 2009, it projects growth of 3.8% in 2010 and 4.1% in 2011 (Table 3.2). The developing countries will continue to drive the world economic recovery; in contrast, performance will be much more subdued in the industrialised countries. At the same time, the sharp decline by the EU's foreign markets in 2009 (12.8%) will be gradually overcome, with projected growth of 2.1% in 2010 and 4% in 2011.
Table 3.2. EXTERNAL AND FINANCIAL ASSUMPTIONS 2008 (A)
2009 (F)
2010 (F)
2011 (F)
2012 (F)
2013 (F)
Interest rates Shortterm interest rates 4.6 1.3 1.5 2.5 2.8 3.0 Longterm interest rates
Exchange rates
4.3 3.2 3.5 3.8 4.0 4.2
Dollars per euro 1.47 1.39 1.48 1.48 1.48 1.48 Nominal effective exchange rate in the euro area (% change) 4.4 2.7 1.6 0 0 0 Nominal effective exchange rate in the EU27 (% change)
GDP and world trade
1.5 5.4 2.3 0 0 0
World excluding EU, GDP growth (*) 3.8 0.4 3.8 4.1 4.4 4.5 EU GDP growth (*) 0.8 4.1 0.7 1.6 1.7 1.8 Export market growth, EU (**) 2.2 12.8 2.1 4.0 5.4 5.5 World imports, excluding EU
Commodity prices
4.6 12.6 4.6 5.0 6.2 6.7
Oil prices (Brent, USD/barrel) 98.5 61.3 76.5 80.5 80.5 80.5
(*) Real percentage change (**) Intra and extraEU trade
(A) Advance; (F) Forecast Source: European Commission and Ministry of Economy and Finance
The recovery hinges initially on the major stimulus plans that have been implemented. Specifically, the International Monetary Fund estimates that the exante budgetary cost of the fiscal measures to combat the crisis amounted to around 2% of the G20 countries' combined GDP, with the percentage being slightly higher in emerging countries than in the advanced economies (in 2010, discretionary measures will amount 1.6% of GDP, with no significant differences between the two groups of countries). The monetary authorities also reacted rapidly to the crisis, adopting a broad range of measures, from traditional moves, such as cutting interest rates or keeping them at record lows, to less conventional moves, such as massive injections of liquidity into financial institutions. These actions played a crucial role in attenuating the adjustment in demand, stabilising the financial system and restoring confidence on the part of economic agents, which are the factors that must take over as drivers of aggregate spending. To that end, these extraordinary
17 Stability Programme 20092013

support mechanisms must be withdrawn in an orderly, coordinated fashion. Monetary policy must gradually drain the liquidity without creating volatility in shortterm rates (Table 3.2). Fiscal policy must also steadily address budgetary consolidation so as to keep longterm interest rates at moderate levels.
The crisis had and will continue to have an adverse impact on the overall labour market, reducing hours worked per person and destroying jobs, not just in 2009 but also in 2010. In nominal terms, the sharp adjustment in commodity prices, the low production capacity utilisation rate and the increase in unemployment suggest that inflation will remain very moderate in the coming years. Specifically, the European Commission estimates a 20% decline in nonenergy commodity prices in 2009 and a recovery of 5.8% in 2010, slowing to 0.9% in 2011. The price of Brent crude is expected to go from an average of 61.3 dollars per barrel in 2009 to 76.5 in 2010 and 80.5 in 2011.
3.3 Projections 20092013 for Spain
The baseline scenario of this analysis (Table 3.3) is for a decline in real GDP in 2009 (3.6%) continuing into 2010 in annual average terms (0.3%) even though there will be no quarteronquarter declines in 2010. A more solid recovery will commence in 2011 (1.8%), gathering pace in 2012 (2.9%) and 2013 (3.1%). These projections are consistent with a closing of the gap between demand and potential GDP in 2013, after peaking in 2010 (4.1%), based on the Ministry of Economy and Finance methodology, that estimates the Spanish economy's potential growth bottoming in 2010 (0.6%) and then climbing to 1.6% in 2013.
Table 3.3. MACROECONOMIC PROSPECTS Chained volume indices. 2000=100, unless otherwise indicated
SEC Code
2008 (A) 2009 (F)
2010 (F)
2011 (F)
2012 (F)
2013 (F)
Level Rate of change (% y/y)
1. Real GDP
2. Nominal GDP. Billion euro
B1*g
B1*g
127.6
1088.5
0.9
3.4
3.6
3.4
0.3
0.2
1.8
3.3
2.9
4.9
3.1
5.2
3. Domestic private final consumption expenditure (*)4.General government final consumption expenditure
5. Gross fixed capital formation
6. Change in inventories (% of GDP)
7. Exports of goods and services
8. Imports of goods and services
Components of real GDP
P.3 P.3
P.51
P.52+P.53
P.6
P.7
127.1 148.5
138.3
134.4
132.6
153.9
0.6 5.5
4.4
0.5
1.0
4.9
5.0 5.2
15.7
0.5
12.4
18.7
0.1 1.2
6.5
0.5
2.8
1.3
2.5 0.4
0.3
0.4
5.2
3.7
3.3 1.1
4.2
0.4
6.9
5.8
3.3 1.4
5.9
0.4
7.4
6.8
9. Final domestic demand
10. Changes in inventories
11. External balance
Contribution to real GDP growth
P.52+P.53
B.11
133.5
134.4
510.6
0.7
0.1
1.4
6.4
0.0
2.8
1.4
0.0
1.1
1.4
0.0
0.4
2.6
0.0
0.3
3.0
0.0
0.1
(*) Includes households and NPISH (nonprofit institutions serving households)
(A) Advance; (F) Forecast Source: INE and Ministry of Economy and Finance
18 Stability Programme 20092013
The practical stabilisation of the Spanish economy in 2010 will be the result of less recessive performance by domestic demand, which will detract 1.4 percentage points from GDP growth, compared with 6.4 in 2009. That will amply offset the reduction of almost 2 percentage points in the net contribution by external demand (to 1.1 percentage points). The recovery by domestic demand will accelerate in 20112013, gradually gaining in importance as the foreign sector's positive contribution declines to almost zero in 2013 (0.1 percentage points).
As regards private consumption expenditure, household consumption expenditure is expected to stabilise this year (0.1%) due to improved lending standards and growing confidence, higher financial wealth, reduced real interest rates and the progressive stabilisation of the labour market. In 20112013, household consumption expenditure will accelerate to over 3% growth by the end of the projection period. This implies a gradual reduction in the saving rate, which is compatible with a rapid process of deleveraging due to the adjustment of investment in housing. Household debt would fall to 2005 levels (118.7%) in 2010 if households used their entire financial capacity to pay down debt; if this process continued to 2013, indebtedness could fall to close to 80% (81% in 2000).
Public consumption expenditure will decelerate appreciably throughout the projection period. In fact, the austerity measures described in section four of this Stability Programme Update represent a significant adjustment in general government activity as a percentage of the economy and in its contribution to growth.
Capital expenditure is expected to recover steadily in 2010 (particularly investment in capital equipment). Although this item will end the year with a negative average growth rate (0.5% yearonyear), it will continue to track external and domestic demand. Less stringent lending standards, the climate of lower uncertainty, consolidation of favourable prospects for demand and the progressive recovery in yields will impact business investment, leading it to grow rapidly in the later years of the projection period (8.6% in 2012 and 9.3% in 2013). Moreover, the decline in investment in construction will slow slightly in 2010 (9.3% compared with 11.4% in 2009). This trend will be due to attenuation of the decline by the residential segment, where sales will revive to a great extent, boosted by the decline in home prices, improved confidence and financial conditions, and changes in taxation. However, the large stock of unsold homes (around 700,000) will limit new housing starts and depress residential investment in the subsequent two years. Investment in other construction will decline this year (2.2%) as a result of the cutback in the Central Government Fund for Local Public Investment and the budgetary adjustment; it will increase very moderately during the rest of the projection period since the recovery by business will be partly offset by the adjustment in public investment as required by the austerity plan in the public finances.
Exports will benefit from the more dynamic performance by Spain's export markets that is implicit in the European Commission's assumptions. Moreover, the projected moderation of labour costs will enhance Spain's external
19 Stability Programme 20092013

competitiveness. As a result, Spain will register a slight gain in world export market share, as it did in 2009. Boosted by final demand, import growth will gradually match export growth, with the result that the foreign sector's net contribution to growth will be practically zero by 2013.
Regarding labour, the expected stabilisation of prices, the unemployment rate and the reduction in the number of layoffs will greatly reduce wage growth to moderate levels throughout the projection period. That, coupled with growth in demand, means that there will be net job creation towards the end of 2010 and the unemployment produced by the recession will be gradually absorbed starting in 2011, leading to an unemployment rate of 15.5% in 2013 (Table 3.4). Labour productivity will decelerate in 2010 but will still reflect the impact of the adjustment in residential construction, converging on rates of around 1% in 20122013. That will be a gain of slightly over half a percentage point in comparison with the average productivity in 19952008, due both to the decline in the importance of the construction sector (whose productivity is lower than the rest of the economy) and the implementation of the measures under the Strategy for a Sustainable Economy.
Table 3.4. LABOUR MARKET DEVELOPMENTS (*)
SEC Code
2008 (A)
2009 (F)
2010 (F)
2011 (F)
2012 (F)
2013 (F)
Level Rate of change (% y/y)
1.Employment, persons (million)
2.Employment, FTEQ (million people)
3.Labour productivity (thousand euro)
4. Labour productivity, FTEQ (thousand euro)
5. Compensation per employee (**) (thousand euro)
6. Unemployment (% of labour force)
D1
20.5
19.0
39.2
42.4
32.2
11.3
6.7
6.8
3.2
3.4
3.9
18.0
1.9
2.0
1.6
1.6
1.0
19.0
0.7
0.6
1.1
1.2
1.5
18.4
1.9
1.8
1.0
1.0
1.8
17.0
2.3
2.2
0.9
0.9
1.9
15.5
(*) National Accounts definition, except the unemployment rate
(**) Compensation of employees, FTEQ
(A) Advance; (F) Forecast Source: INE and Ministry of Economy and Finance
Inflation will remain low during the recovery, below the European Central Bank's limit for price stability (Table 3.5). This performance will be the result of a moderate increase in unit labour costs due to slower wage growth, while business margins will recover some of the ground lost in the last three years and import prices will accelerate slightly. The increase in value added tax (VAT) rates will have a moderate impact on average inflation figures in 2010 and 2011 (around 0.4 points and 0.2 points, respectively).
20 Stability Programme 20092013
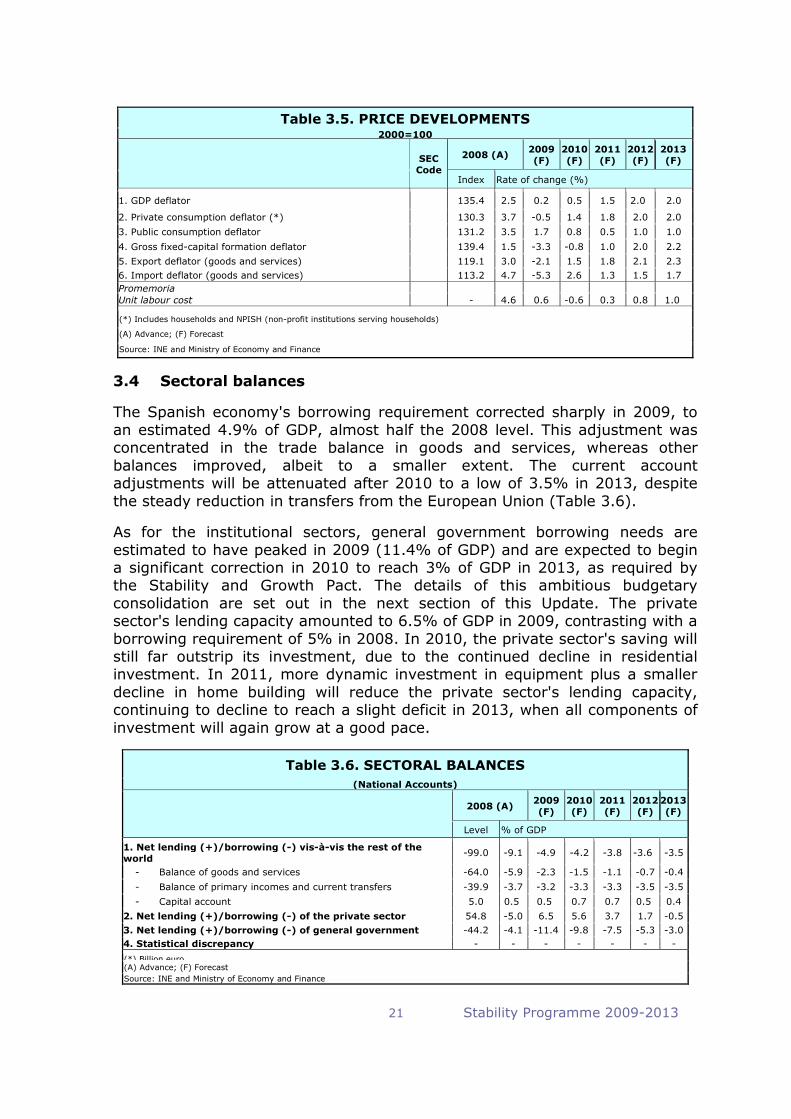
Table 3.5. PRICE DEVELOPMENTS 2000=100
SEC Code
2008 (A) 2009 (F)
2010 (F)
2011 (F)
2012 (F)
2013 (F)
Index Rate of change (%)
1. GDP deflator
2. Private consumption deflator (*)
3. Public consumption deflator
4. Gross fixedcapital formation deflator
5. Export deflator (goods and services)
6. Import deflator (goods and services)
135.4
130.3
131.2
139.4
119.1
113.2
2.5
3.7
3.5
1.5
3.0
4.7
0.2
0.5
1.7
3.3
2.1
5.3
0.5
1.4
0.8
0.8
1.5
2.6
1.5
1.8
0.5
1.0
1.8
1.3
2.0
2.0
1.0
2.0
2.1
1.5
2.0
2.0
1.0
2.2
2.3
1.7
Promemoria Unit labour cost 4.6 0.6 0.6 0.3 0.8 1.0
(*) Includes households and NPISH (nonprofit institutions serving households)
(A) Advance; (F) Forecast
Source: INE and Ministry of Economy and Finance
3.4 Sectoral balances
The Spanish economy's borrowing requirement corrected sharply in 2009, to an estimated 4.9% of GDP, almost half the 2008 level. This adjustment was concentrated in the trade balance in goods and services, whereas other balances improved, albeit to a smaller extent. The current account adjustments will be attenuated after 2010 to a low of 3.5% in 2013, despite the steady reduction in transfers from the European Union (Table 3.6).
As for the institutional sectors, general government borrowing needs are estimated to have peaked in 2009 (11.4% of GDP) and are expected to begin a significant correction in 2010 to reach 3% of GDP in 2013, as required by the Stability and Growth Pact. The details of this ambitious budgetary consolidation are set out in the next section of this Update. The private sector's lending capacity amounted to 6.5% of GDP in 2009, contrasting with a borrowing requirement of 5% in 2008. In 2010, the private sector's saving will still far outstrip its investment, due to the continued decline in residential investment. In 2011, more dynamic investment in equipment plus a smaller decline in home building will reduce the private sector's lending capacity, continuing to decline to reach a slight deficit in 2013, when all components of investment will again grow at a good pace.
Table 3.6. SECTORAL BALANCES (National Accounts)
2008 (A) 2009 (F)
2010 (F)
2011 (F)
2012 (F)
2013 (F)
Level % of GDP
1. Net lending (+)/borrowing () visàvis the rest of the world
Balance of goods and services
Balance of primary incomes and current transfers
Capital account
2. Net lending (+)/borrowing () of the private sector
3. Net lending (+)/borrowing () of general government
4. Statistical discrepancy
99.0
64.0
39.9
5.0
54.8
44.2
9.1
5.9
3.7
0.5
5.0
4.1
4.9
2.3
3.2
0.5
6.5
11.4
4.2
1.5
3.3
0.7
5.6
9.8
3.8
1.1
3.3
0.7
3.7
7.5
3.6
0.7
3.5
0.5
1.7
5.3
3.5
0.4
3.5
0.4
0.5
3.0
(*) Billion euro (A) Advance; (F) Forecast
Source: INE and Ministry of Economy and Finance
21 Stability Programme 20092013

1
4. BUDGETARY CONSOLIDATION STRATEGY IN THE FRAMEWORK OF THE EXCESS DEFICIT PROCEDURE
4.1 Public finances in 2009
Spain's overall general government deficit in 2009 is estimated provisionally at 11.4% of GDP, compared with 4.1% in 2008. This considerable deterioration is the result of the impact of the crisis on the various items of revenue and expenditure and also of the temporary measures taken by the Government to palliate the decline in demand and maintain confidence in the economy.
Revenues declined by 2.4 percentage points of GDP, i.e. 0.5 points less than taxes (Table 4.1). This adjustment in tax revenues is due partly to cyclical factors. Specifically, the fact that the gap between demand and potential GDP turned negative was responsible for onethird of that decline; another halfpoint decline is attributable to changes in certain taxes whose tax bases are not counted in GDP (increases in assets values) but which are more cyclical. Moreover, discretionary decisions by the Government with a transitory impact on the budget also had a major effect. They include measures to improve liquidity for companies (changes in VAT management) and households (paying personal income tax refunds early), whose cost in 2009 was 0.7% of GDP, and the greater flexibility in granting deferrals of VAT and company tax payments, which cost 0.5% of GDP. The latter practice has also been extended to social security payments (0.2% of GDP).
Table 4.1. RECENT DEVELOPMENTS IN PUBLIC ACCOUNTS
SEC Code 2008 (A) 2009 (F)
Level (million euro) % of GDP
1. Total revenue TR 402,677 37.0 34.6
1.1. Total taxes D2+D5+D9 229,802 21.1 18.2
1.2. Social contributions D61 143,043 13.1 13.5
1.3. Property income D4 11,223 1.0 1.1
1.4. Other revenues 18,609 1.7 1.8
2. Total expenditure TE 446,937 41.1 46.1
2.1. Compensation of employees + intermediate consumption D1+P2 177,470 16.3 18.0
2.2. Social transfers D62+D63 163,636 15.0 17.4
2.4. Interest expenditure EDP D41 17,229 1.6 1.9
2.4. Subsidies D3 11,687 1.1 1.1
2.5. Gross fixed capital formation P51 41,642 3.8 4.8
2.6. Other expenditure 35,273 3.2 2.9
3. General government S13 44,260 4.1 11.4 3.1. Structural balance (*) 5.0 10.0
3.2. Primary structural balance (*) 3.4 8.1
3.3. Transitory measures 2.5
3.3.1. Tax measures in support of liquidity 0.7
3.3.2. Extraordinary deferrals of tax obligations 0.7
3.3.3. Extraordinary funds 1.1
4. Structural primary balance excluding transitory measures (*)
3.4 5.7
5. Gross debt 432,023 39.7 55.2 (*) Ministry of Economy and Finance methodology (A) Advance; (F) Forecast Source: INE and Ministry of Economy and Finance
Expenses increased by 5 points of GDP to 46.1%. A large proportion of this increase is attributable to social welfare benefits related to unemployment, which increased by over 12 billion euro in 2009. Moreover, public investment
22 Stability Programme 20092013

increased its share of GDP by one percentage point, mainly as a result of the funds contributed by the Central Government Fund for Local Public Investment, which is also a temporary measure (0.8% of GDP). The Fund to Revitalise the Economy and Employment contributed an additional 0.3% of GDP in expenditure in 2009. Interest payments reflected the rapid increase in debt, and the other components, including compensation of employees and intermediate consumption, expanded by less overall (4%); however, taking account of the reduction in nominal GDP this year, the outcome is a sizeable increase in these items relative importance.
Since the cyclical component of the deficit is 1.4% of GDP, based on the output gap estimated by the Ministry of Economy and Finance, the cycleadjusted budget balance was estimated at 10% of GDP in 2009 (8.1% if interest is excluded). Since the impact of transitory measures on the budget will disappear in future years, the structural primary deficit excluding these measures is estimated at 5.7% of GDP. That is the magnitude of the fiscal adjustment that the Spanish economy must undertake in this and the subsequent three years.
The public debt increased considerably in 2009 to 55.2% of GDP (provisional figure), compared with 78.2% in the euro area. That 15.5point increase is composed of the over 11point increase in the public deficit, plus the effect of the reduction in nominal GDP (1.4 percentage points) and the amounts contributed by the Central Government to the Financial Asset Acquisition Fund (FAAF) and the Fund for Orderly Bank Restructuring (FROB), which result in the debtdeficit adjustment being larger than usual (2.6 percentage points).
4.2 Budgetary consolidation strategy
The Spanish Government's budgetary consolidation strategy combines firm curtailment of expenditure with a moderate increase in revenues, which will gradually restore the relative level of revenues that prevailed before the recession (except for those related to the excessive growth by the real estate sector). There are two instruments for this purpose. Firstly, the Central Government Budget for 2010, approved in December 2009; secondly, the initiatives approved by the Cabinet on 29 January 2010, which includes two plans affecting the Central Government (Immediate Action Plan 2010 and Austerity Plan 20112013), and two Framework Agreements on the Sustainability of Public Finances with the Autonomous Communities and the Local Governments. Additionally, the Sustainable Economy draft Bill includes a number of fiscal measures with a budgetary impact.
The Central Government Budget for 2010 marked the beginning of the process of restoring balance in the public accounts. Regarding revenues, the fiscal stimuli approved in mid2008 will begin to be withdrawn gradually, commencing with the elimination of the 400 euro personal income tax credit (except for lowincome taxpayers). This policy is being complemented by the increase in VAT rates from July 2010 (the standard rate is being increased from 16% to 18% and the reduced rate from 7% to 8%), plus greater progressivity in the taxation of savings (increasing the tax rate on the first
23 Stability Programme 20092013

D2+D5+D9
D
TE
6,000 euro of income from 18% to 19% and applying 21% to the remainder). A measure to stimulate job creation by SMEs is the reduction in the corporate tax rate (from 25% to 20%) for those SMEs that maintain or increase employment. Finally excise taxes on tobacco and hydrocarbons were increased in June 2009. These tax measures together will provide additional revenues amounting to 1.4% of GDP in a normal full year (Table 4.2).
Table 4.2. CONSOLIDATION IN THE CENTRAL GOVERNMENT BUDGET FOR 2010 (*)
Revenue Expenditure
% of GDP
1. Increase in VAT rates 2. Increase in excise taxes (**)
3. Elimination of 400 euro personal income tax credit (***)
4. Increased taxation of saving
5. Reduction in company tax for SMEs
6. Cuts in current expenditure
7. Extraordinary fund
0.7 0.3
0.4
0.1
0.1
0.8
0.5
8. Total revenue
9. Total expenditure
1.4
0.3
(*) All these impacts refer to the general government in a normal year (zero output gap) so as to assess the mediumterm impact of the measures
(**) Implemented in June 2009. (***) Except for lowincome taxpayers
Source: Ministry of Economy and Finance.
On the expenditure side, the 2010 Budget makes major efforts at austerity while safeguarding items that cover basic social needs (including improved justice and police services) and strengthening the Spanish economy's growth potential. For that reason, it was necessary to cut all other budget items, including notably the practical freeze on public sector pay and the moderate (1%) increase in pensions. As a result, the Central Government's nonfinancial expenditure will be 4% lower than in 2009. Also, in line with the strategy of gradually withdrawing the fiscal stimuli, a new Central Government Fund for Jobs and Local Sustainability has been created with a budget of 5 billion euro. Excluding this fund, the consolidated Central Government Budget is estimated to include a permanent reduction of expenditure amounting 0.8% of GDP. As for the Autonomous Communities, the 2010 budgets generally present a scenario of austerity and containment of expenditure. Specifically, the aggregate nonfinancial budget of all the Autonomous Communities is practically frozen (a 0.2% increase).
Therefore, the measures adopted in this Budget (and last summer) with a mediumterm impact represent a reduction of 2.1 percentage points of GDP in the primary structural deficit excluding transitory measures (i.e. excluding the extraordinary fund created in 2010).
The Sustainable Economy draft Bill includes a number of fiscal measures (see Table 2.4) that will fully impact future general government tax revenues beyond the projection period to which this Update refers. The tax deduction for home purchase currently amounts to over 6 billion euro; therefore, partly eliminating those benefits starting in 2011 will increase personal income tax revenues by around 0.4 points of GDP. In contrast, the new tax deduction for
24 Stability Programme 20092013

home refurbishment will have a cost of 1.2 billion euro (0.1% of GDP). The additional measures included in the draft Bill combined will reduce revenues by about 300 million euro.
Apart from the saving measures envisaged in the Central Government Budget for 2010, the remainder of the effort required to bring the general government deficit down to 3% of GDP by 2013 is detailed in the initiatives approved by the Cabinet on 29 January 2010. Those initiatives include: the Immediate Action Plan 2010 and the Austerity Plan 20112013 for the Central Government, and the proposals for Framework Agreements for the Sustainability of Public Finances with the Autonomous Communities and Local Governments. These last two proposals should be approved by the Fiscal and Financial Policy Council and the National Commission for Local Government, respectively. Therefore, the forecasted path for annual general deficit for 2010, 2011 and 2012 should be confirmed by these institutions in order to achieve the target for 2013 as stated in table 4.3.
Therefore, considering that the Central Government Budget for 2010 entails a 2.1 percentage point reduction in the permanent component of the public deficit, the initial structural primary balance (excluding transitory measures and taking account of the mediumterm revenue impact of the tax changes) is 3.6% of GDP in 2010. Additionally, the interest burden will amount to around 3.1% of GDP in 2013, meaning that the structural primary balance should be slightly positive in that year in order to comply with the Council’s Recommendation (0.1% of GDP). The general government will also have to incur additional expenditure already committed amounting to 0.6 points of GDP in these four years for transfers to the EU, supplementary pensions, funds related to the new financing of the Autonomous Communities and the deployment of the longterm care system, among others. Therefore, the necessary reduction in expenditure to be achieved amounts to 4.3 percentage points of GDP; it is important to note that all levels of government will participate in this effort.
The first of the instruments, the Immediate Action Plan for 2010, will basically affect the Central Government Budget for 2010 and result in a reduction of 0.5% of GDP with respect to the initially planned expenditure. This will entail, firstly, a reduction in the allocation to the Contingency Fund. Moreover, spending allocations relating to real investments, capital and current transfers and (to a lesser extent) operating expenses will be blocked. A provisional distribution of the spending blocks among the ministries has been drawn up, and the ministries must propose to the Ministry of Economy and Finance the specific items to which the spending cut will apply. Additionally, this Plan provides that public sector hiring in 2010 will be reduced, overall and without exceptions, to 10% of the replacement rate, and that no new temporary personnel will be hired. Finally, the Ministry of Economy and Finance is authorised to take all necessary measures to ensure that these provisions are complied with.
The Austerity Plan 20112013 and the Framework Agreements contain a range of new measures to reduce expenditure. The Austerity and Immediate Plans
25 Stability Programme 20092013

together will account for the 4.3 percentage points of GDP that are the estimated fiscal consolidation requirement for general government as a whole. The main measures are detailed below:
• A reduction in compensation of employees amounting to 1.9 points of GDP (equivalent to a 4% cut in nominal terms with respect to 2009). This will be achieved by practically freezing the public sector hiring process (filling just 10% of vacancies overall) and sharply curtailing wage increases. To put this measure into context, around 7% of the general government workforce will reach retirement age between now and 2013. Moreover, between 2000 and 2008, Spanish public sector wages increased at an average rate of 5.1%, compared with 3.2% in the rest of the European Union (Eurostat figures).
• Intermediate consumption, transfers and other expenses will be reduced permanently in the same period by 1 percentage point of GDP in a context of rationalisation of the working day and more effective use of material resources. Excepted from the cuts are social welfare benefits, longterm care, student grants, and the contribution to the European Union.
• Gross fixed capital formation will decline by 0.9 points of GDP (excluding the transitory extraordinary funds), i.e. a 14% decline with respect to 2009. Investment in infrastructure will be affected the least, but the impact will still be notable. Since the mid1990s, the public sector has made major investments in infrastructure, averaging 3.5% of GDP per year, compared with 2.4% in the EU27 countries. In fact, despite the planned cutback, public investment will still amount to 2.9% of GDP in 2013, according to the plan. This will make it possible to continue to narrow the difference in public per capita infrastructure endowments with respect to our EU partners in the coming years (see Section 6).
• Finally, subsidies will be cut by 0.5 points of GDP.
In order to effectively implement all these measures, by 1 May 2010 the Government will approve a Public Expenditure Restructuring Plan, which will involve a thorough review of all Central Government spending programmes and the policies of both Central Government and stateowned companies. To supplement that Plan, before 1 March 2010 all the ministries will be urged to present to the Ministry of Economy and Finance a specific proposal for each department, autonomous entity and company, in accordance with the measures described above. This is a significant advance on the deployment calendar proposed in the Sustainable Economy draft Bill. Furthermore, Central Government approval of any proposed new spending action in this period will depend on the targets quantified in the Immediate Action Plan and the Austerity Plan, so that measures proposed by ministries do not entail a net increase in spending.
Also, within three months from the adoption of the Framework Agreement on the Sustainability of Public Finances by the Fiscal and Financial Policy Council
26 Stability Programme 20092013
or by the National Commission for Local Administration, the governments of the Autonomous Communities and Autonomous Cities and Local Governments must adopt a public expenditure restructuring plan with similar content to that of the Central Government with the aim of effectively reducing expenditure. At the same time, the Fiscal and Financial Policy Council will establish a working group which will be entrusted with drawing up a framework agreement for monitoring the actions taken to reduce the deficit. This monitoring will be based on quarterly reports to be presented by the Autonomous Communities and Autonomous Cities to the Fiscal and Financial Policy Council with information on all expenditure incurred and not yet applied to the year's budget. The Council will also establish a working group to draw up proposals for improving the efficiency of the services provided by the Autonomous Communities, including mechanisms for cooperation between Autonomous Communities to optimise available resources, particularly in the area of healthcare and longterm care.
In the event of a divergence in the performance of revenues and expenditure such as to endanger the budgetary consolidation plan, the Government will take further steps to realign the deficit with the targets.
Alongside these deficitrelated objectives, the plans and Framework Agreements contain another commitment relating to the general government debt: maintain it below the average of the euro area countries and regain the trend of reducing the debt as a percentage of GDP so as to attain and maintain, in the medium term, the limit of 60% of GDP established in the Stability and Growth Pact.
Accordingly, the trend in the main revenue and expenditure items is that shown in Table 4.3. Between 2009 and 2013, general government revenues will increase by 3.7 percentage points of GDP, reflecting the trend in tax revenues. Specifically, indirect taxes will rise by 1.9 percentage points of GDP, of which 0.6 points correspond to the normalisation of the monthly VAT refund, 1 point to increases in VAT and excise tax rates, and 0.3 points to the reversal of the deferrals. Direct taxes will increase by 1.5 points of GDP: 0.7 points associated with the cyclical upswing in economic activity, 0.4 points with the partial elimination of the 400 euro tax deduction, and 0.4 points with the reversal of early personal income tax rebates, reversal of deferrals, and fraud prevention. The 0.2point increase in social security contributions is entirely attributable to the reversal of the extraordinary deferrals granted in 2009. Overall, the tax burden in 2013 will be 34.2%, similar to 2004 and well below the record high of 37.1% registered in 2007.
27 Stability Programme 20092013

Table 4.3. BUDGETARY PROSPECTS (Excessive Deficit Procedure)
SEC Code 2008 (A)
2009 (F)
2010 (F)
2011 (F)
2012 (F)
2013 (F)
Level % of GDP
Net lending (+)/borrowing () (EDP. 89)
1. General government
2. Central government
3. Autonomous Communities
4. Local government
5. Social security administration
S.13
S.1311
S.1312
S.1313
S.1314
44260
30500
16992
5230
8462
4.1
2.8
1.6
0.5
0.8
11.4
9.5
2.2
0.5
0.8
9.8
6.2
3.2
0.7
0.2
7.5
2.5
4.2
1.0
0.2
5.3
3.8
1.5
0.3
0.2
3.0
1.9
1.1
0.2
0.2
General government (S. 13)
6. Total revenue
7. Total expenditure
8. Financing capacity or need
9. Interest expenditure
10. Primary balance
TR
TE
EDP. B9
EDP. D41
402677
446937
44260
17229
27031
37.0
41.1
4.1
1.6
2.5
34.6
46.1
11.4
1.9
9.6
35.7
45.5
9.8
2.2
7.7
36.7
44.2
7.5
2.6
4.9
37.5
42.8
5.3
2.9
2.3
38.3
41.3
3.0
3.1
0.1
Selected components of revenue
11. Total taxes
11a. Taxes on production and imports
11b.Current taxes on income, wealth, etc.
11c. Capital taxes
12. Social contributions
13. Property income
14. Other
15. Total revenue
p.m.: Tax burden
D.2
D.5
D.91
D.61
D.4
TR
229802
107641
117483
4678
143043
11223
18609
402677
360318
21.1
9.9
10.8
0.4
13.1
1.0
1.7
37.0
33.1
18.2
8.3
9.5
0.5
13.5
1.1
1.8
34.6
30.4
19.5
9.1
10.0
0.5
13.6
1.2
1.5
35.7
31.5
20.3
9.5
10.3
0.5
13.7
1.2
1.6
36.7
32.5
20.9
9.8
10.6
0.5
13.7
1.1
1.7
37.5
33.4
21.6
10.1
11.0
0.5
13.7
1.1
1.9
38.3
34.2
Selected components of expenditure
16. Compensation of employees + intermediate consumption (16=16a+16b) 16a. Compensation of employees
16b. Intermediate consumption
17. Social transfers (17=17a+17b)
17a. Social transfers in kind via market
17b. Social transfers other than in kind
18. Interest expenditure
19. Subsidies
20. Gross fixed capital formation
21. Other
22. Total expenditure
p.m.: Public consumption expenditure
D.1+P.2
D.1
P.2
D.63 (*)
D.62
EDP D.41
D.3
P.51
TE
P.3
177470
117641
59829
163636
28176
135460
17229
11687
41642
35273
446937
211095
16.3
10.8
5.5
15.0
2.6
12.4
1.6
1.1
3.8
3.2
41.1
19.4
18.0
11.9
6.1
17.4
2.9
14.5
1.9
1.1
4.8
2.9
46.1
21.5
18.1
11.9
6.2
18.3
3.0
15.3
2.2
0.7
4.1
2.2
45.5
21.9
17.3
11.3
5.9
18.3
3.0
15.3
2.6
0.6
3.4
2.1
44.2
21.2
16.2
10.7
5.5
17.9
3.0
15.0
2.9
0.6
3.1
2.0
42.8
20.2
15.1
10.0
5.1
17.5
3.0
14.5
3.1
0.6
2.9
2.1
41.3
19.1
(*) D.63=D.6311+D.63121+D.63131
(A) Advance; (F) Forecast Source: Ministry of Economy and Finance.
4.3 Structural balance and fiscal stance
Based on estimates of the Spanish economy's potential output and output gap, Table 4.4 shows that fiscal policy became markedly expansionary in 2008 and 2009. In fact, the primary structural deficit increased sharply, largely because of the transitory measures adopted by the Spanish Government to address the crisis within the European Economic Recovery Plan.
In order to steer Spain's public finances towards a track of sustainability over time, and within the commitments made to the European Union under the Stability and Growth Pact, the measures taken by the Government discussed in the previous section will steadily correct the deficit and lead to a slight primary structural surplus, offsetting an interest burden that will exceed the 3% barrier.
28 Stability Programme 20092013

Table 4.4. CYCLICAL DEVELOPMENTS (*) % of GDP, unless otherwise stated
2008 2009 2010 2011 2012 2013
1. Real GDP growth 0.9 3.6 0.3 1.8 2.9 3.1
2. Net lending (+) / Borrowing () 4.1 11.4 9.8 7.5 5.3 3.0
3. Interest expenditure (incl. FISIM) 1.6 1.9 2.2 2.6 2.9 3.1
4. Potential GDP growth (%) 2.1 1.6 0.6 0.9 1.1 1.6
Contributions: Labour 0.3 0.1 0.2 0.1 0.2 0.4
Capital 1.4 0.9 0.2 0.2 0.3 0.4
Total factor productivity 0.4 0.5 0.6 0.7 0.7 0.8
5. Output gap 2.1 3.2 4.1 3.2 1.6 0.1
6. Cyclical budgetary component 0.9 1.4 1.7 1.4 0.7 0.0
7. Structural balance (26) 5.0 10.0 8.1 6.1 4.6 2.9
8. Structural primary balance (7+3) 3.4 8.1 5.9 3.5 1.7 0.1
(*) Using potential GDP (production function)
Source: Ministry of Economy and Finance.
4.4 Government debt developments
Public debt is expected to increase by about 19 percentage points of GDP to 74.1%, but the debt ratio is expected to have begun to decline slightly by the end of the period (see Table 4.5). In line with the fiscal consolidation measures presented in this Update, the primary budget deficit will decrease gradually, turning into a slight surplus in 2013, so that the contribution to increased debt over the period will be less than 15 points. This correction will offset the positive gap in some of the projection years between estimated implicit interest rates and nominal GDP growth. Interest expenditure, which will continue to rise steadily over the period in terms of GDP, will contribute nearly 11 points to the increase in debt, while the gradual economic recovery will bring nominal GDP growth back into positive territory in 2010, thus subtracting slightly over 9 points from the debt increase. Finally, it is estimated that the debtdeficit adjustment will decline significantly from the high level of 2009, primarily as a result of lower financial contributions expected to be made by the FAAF and the FROB, in a context of greater financial stability, and of the revenues that those funds will recover from their contributions.
Table 4.5. GENERAL GOVERNMENT DEBT DEVELOPMENTS % of GDP
2008 2009 2010 2011 2012 2013 Change
20092013
1. Gross debt
2. Change in gross debt
39.7
3.5
55.2
15.5
65.9
10.8
71.9
5.9
74.3
2.4
74.1
0.2
18.9
18.9
Contributions to change in gross debt
3. Primary budget balance
4. Interest expenditure
7. Effect of nominal GDP growth
8. Other factors (debtdeficit adjustment)
2.5
1.6
1.2
0.7
9.6
1.9
1.4
2.6
7.7
2.2
0.1
1.0
4.9
2.6
2.1
0.5
2.3
2.9
3.4
0.5
0.1
3.1
3.6
0.5
14.8
10.8
9.2
2.5
p.m.: Implicit interest rate on debt 4.53 4.56 3.96 4.06 4.28 4.44
Source: Ministry of Economy and Finance.
29 Stability Programme 20092013

5. COMPARISON WITH THE PREVIOUS UPDATE AND SENSITIVITY ANALYSIS
5.1 Comparison with the previous update
The crisis has had a very significant impact on these new projections. In fact, as shown in Table 5.1, not only is the rate of change of GDP for 2009 two percentage points lower than projected in the last Update, but the growth projections for 2010 and 2011 have been revised down (by 1.5 and 0.8 percentage points, respectively), reflecting quite a persistent impact of the recession. The change in the private consumption deflator will also be lower than predicted in 2009 (by 1.5 percentage points), while the projections for the subsequent two years have been adjusted downward to a lesser extent due to the increase in VAT rates. There is an appreciable deterioration in the general government accounts, as the deficit was revised upward by 5.6 points of GDP in 2009 and the gross debt by somewhat more due to the capital allocated to the funds created to support the financial sector. The revisions of the projections for the following two years also involve higher deficits and debt.
Table 5.1. COMPARISON WITH THE PREVIOUS STABILITY PROGRAMME UPDATE
2009 2010 2011 Real GDP growth (%)
Previous update 1.6 1.2 2.6 Current update 3.6 0.3 1.8 Difference 2.0 1.5 0.8 Due to change of assumptions 4.3 2.0
Private consumption expenditure deflator (% change) Previous update 1.0 2.2 2.3 Current update 0.5 1.4 1.8 Difference 1.5 0.8 0.5 Due to change of assumptions 2.8 1.5
Budget balance (% of GDP) Previous update 5.8 4.8 3.9 Current update 11.4 9.8 7.5 Difference 5.6 5.0 3.6 Due to change of assumptions 1.3 0.6
Government debt (% of GDP) Previous update 47.3 51.6 53.7 Current update 55.2 65.9 71.9 Difference 7.9 14.3 18.2 Due to change of assumptions 3.7 2.5 Source: Ministry of Economy and Finance.
A unique feature of this Update is the significant change that has occurred in the common macroeconomic assumptions made by the European Commission. Therefore, an estimate was made to quantify how much the forecasts would have changed due solely to the change of the Commission’s assumptions. To that end, these new trends in exogenous variables were plugged into an overall forecasting model for the Spanish economy 6, resulting in the impacts shown in italics in Table 5.1. In 2009, the change in the assumptions would have led to a much larger downward revision in both GDP and inflation than was actually observed; in contrast, the deficit and government debt would not have increased by so much. This adverse effect is due mainly to export
Estrada, Fernández, Moral y Regil (2004): “A quarterly macroeconometric model of the Spanish Economy”, Bank of Spain Working Paper 0413.
30 Stability Programme 20092013
6
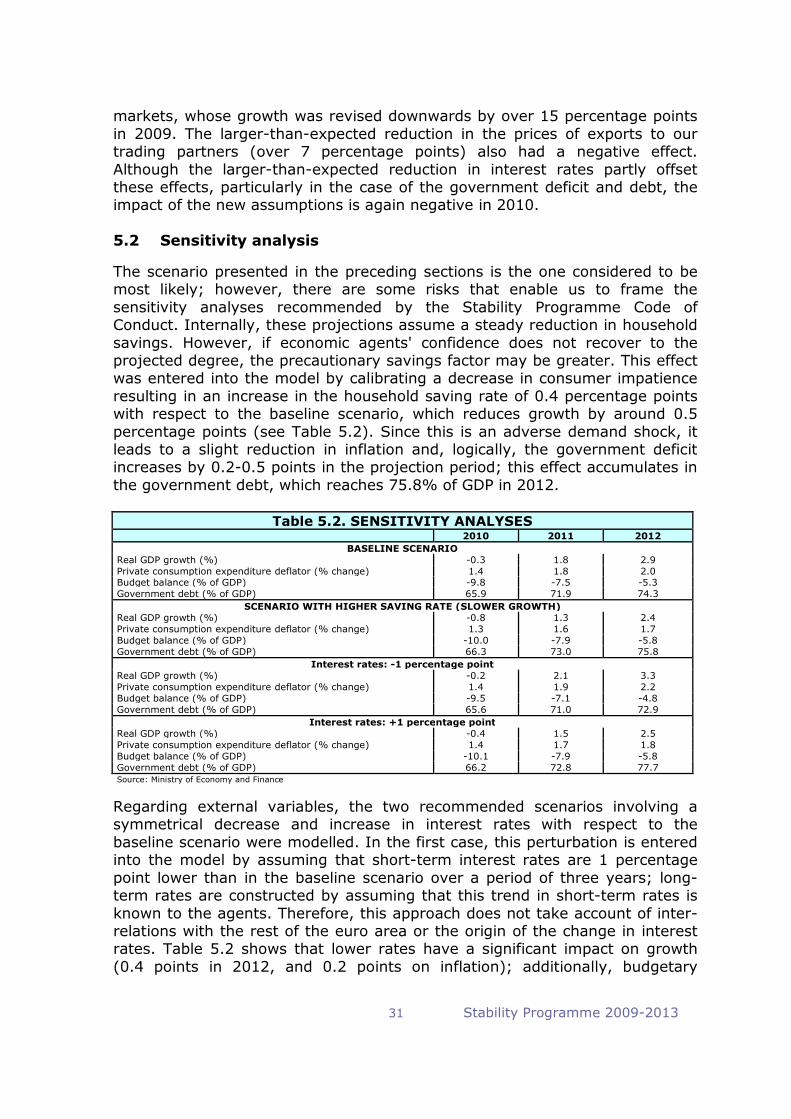
markets, whose growth was revised downwards by over 15 percentage points in 2009. The largerthanexpected reduction in the prices of exports to our trading partners (over 7 percentage points) also had a negative effect. Although the largerthanexpected reduction in interest rates partly offset these effects, particularly in the case of the government deficit and debt, the impact of the new assumptions is again negative in 2010.
5.2 Sensitivity analysis
The scenario presented in the preceding sections is the one considered to be most likely; however, there are some risks that enable us to frame the sensitivity analyses recommended by the Stability Programme Code of Conduct. Internally, these projections assume a steady reduction in household savings. However, if economic agents' confidence does not recover to the projected degree, the precautionary savings factor may be greater. This effect was entered into the model by calibrating a decrease in consumer impatience resulting in an increase in the household saving rate of 0.4 percentage points with respect to the baseline scenario, which reduces growth by around 0.5 percentage points (see Table 5.2). Since this is an adverse demand shock, it leads to a slight reduction in inflation and, logically, the government deficit increases by 0.20.5 points in the projection period; this effect accumulates in the government debt, which reaches 75.8% of GDP in 2012.
Table 5.2. SENSITIVITY ANALYSES 2010 2011 2012
BASELINE SCENARIO Real GDP growth (%) 0.3 1.8 Private consumption expenditure deflator (% change) 1.4 1.8 Budget balance (% of GDP) 9.8 7.5 Government debt (% of GDP) 65.9 71.9
2.9 2.0 5.3 74.3
SCENARIO WITH HIGHER SAVING RATE (SLOWER GROWTH) Real GDP growth (%) 0.8 1.3 Private consumption expenditure deflator (% change) 1.3 1.6 Budget balance (% of GDP) 10.0 7.9 Government debt (% of GDP) 66.3 73.0
2.4 1.7 5.8 75.8
Interest rates: 1 percentage point Real GDP growth (%) 0.2 2.1 Private consumption expenditure deflator (% change) 1.4 1.9 Budget balance (% of GDP) 9.5 7.1 Government debt (% of GDP) 65.6 71.0
3.3 2.2 4.8 72.9
Interest rates: +1 percentage point Real GDP growth (%) 0.4 1.5 Private consumption expenditure deflator (% change) 1.4 1.7 Budget balance (% of GDP) 10.1 7.9 Government debt (% of GDP) 66.2 72.8
2.5 1.8 5.8 77.7
Source: Ministry of Economy and Finance
Regarding external variables, the two recommended scenarios involving a symmetrical decrease and increase in interest rates with respect to the baseline scenario were modelled. In the first case, this perturbation is entered into the model by assuming that shortterm interest rates are 1 percentage point lower than in the baseline scenario over a period of three years; longterm rates are constructed by assuming that this trend in shortterm rates is known to the agents. Therefore, this approach does not take account of interrelations with the rest of the euro area or the origin of the change in interest rates. Table 5.2 shows that lower rates have a significant impact on growth (0.4 points in 2012, and 0.2 points on inflation); additionally, budgetary
31 Stability Programme 20092013

consolidation is much more intense and less government debt is accumulated. The second scenario, involving higher interest rates, is practically symmetrical given the limitations in the model. In this case, the fiscal adjustment is logically less intense, and more government debt is accumulated.
32 Stability Programme 20092013

6. QUALITY OF PUBLIC FINANCES
6.1 Introduction
Under Europeanlevel multilateral supervision of economic policies, the quality of public finances becomes increasingly important. This is fully consistent with the Integrated Guidelines, the Stability and Growth Pact and the various Conclusions adopted by the ECOFIN Council. The quality of public finances in Spain has been a key driver of budgetary decisions in recent years, with priority being given to productive spending.
The quality of public finances plays an even bigger role in the fiscal strategy set out in this Stability Programme Update 20092013. The proposed fiscal consolidation hinges on efficient use of scarce resources and their allocation to areas upon which future recovery and growth are based. Consequently, the quality of public finances occupies a central position in the global strategy for overcoming the crisis. The Central Government Budget 2010, the Strategy for a Sustainable Economy and the initiatives adopted by the Cabinet on 29 January 2010 to achieve the fiscal consolidation by 2013 introduce the principal new features that will strengthen the quality of public finances in the coming years.
6.2 Breakdown of expenditure
The Central Government Budget for 2010 has three objectives: palliate the effects of the crisis, lay the foundations for rebalancing the public accounts, and allocate funding to productive expenditure, in a context of austerity. Specifically, investment in R&D, innovation and education should drive the change in the pattern of longterm growth, while also converging on European standards in terms of per capita infrastructure endowment. Evident efforts have been made to maintain this productive spending, currently at historically high levels (see Table 6.1). Although total expenditure for 2010 will decline by 4%, the budget for infrastructure and civil R&D and innovation will suffer a much smaller cut (1.4% in both cases). The budget for education will increase 3.5%, reflecting the government's commitment to a knowledgebased society.
The Sustainable Economy draft Bill envisages the creation of two funds to finance activities in sectors related to the sustainable economy, contributing decisively to guiding public expenditure productively:
• The Central Government Fund for Jobs and Local Sustainability (with a budget of 5 billion euro) will finance development of science and technology parks, deployment and access to nextgeneration telecommunications networks, energy efficiency and saving projects, development of renewable energies and sustainable urban mobility projects, and social and health services centres, among other initiatives.
• The Fund for a Sustainable Economy, which is a capitalisation fund with a budget of up to 20 billion euro in 2010 and 2011, will be managed by the Instituto de Credito Oficial (ICO) and will be cofinanced by private financial institutions which will establish the allocation criteria. The Fund's aim will
33 Stability Programme 20092013

be to provide funding to private sector investment projects that contribute to technological innovation and development, ICT, the knowledgebased society, energy saving and efficiency, environmental preservation and improvement, the development of social and health services, and business internationalisation.
FIGURE 6.1. PRODUCTIVE PUBLIC EXPENDITURE BY COMPONENTS percentage of GDP (%)
12
Total Public investment R & D public Education 10
8
6
4
2
0
Sources: INE, IGAE and MEH
2005 2006 2007 2008 (F) 2009 (F)
Moreover, the Strategy for a Sustainable Economy includes certain normative factors aimed at improving efficient expenditure. First, a special expenditure evaluation group will be established to analyse the programmes, structure and procedures of the various ministries and public bodies and submit proposals for rationalisation and efficiency improvement. Second, a system will be implemented to evaluate and oversee certain government actions. The schedules for implementing these measures have been brought forward significantly as a result of the approval of the measures on the sustainability of public finances adopted by the Cabinet on 29 January 2010.
Those measures were designed on the basis of public expenditure being reoriented towards more productive activities. In fact, the bulk of the necessary adjustment in spending to bring the deficit down to 3% of GDP by 2013 will be borne by current expenditure, while investment in R&D and education is maintained or even increased in some cases. Investment in infrastructure will be cut by less than other areas of investment. Nevertheless, Spain's investment continues to exceed the European Union average (Figure 6.2). This will enable Spain to continue converging on our EU partners in terms of public infrastructure endowment per capita, since population growth will return to more moderate levels (according to forecasts by the Instituto Oficial de Estadistica—INE).
34 Stability Programme 20092013
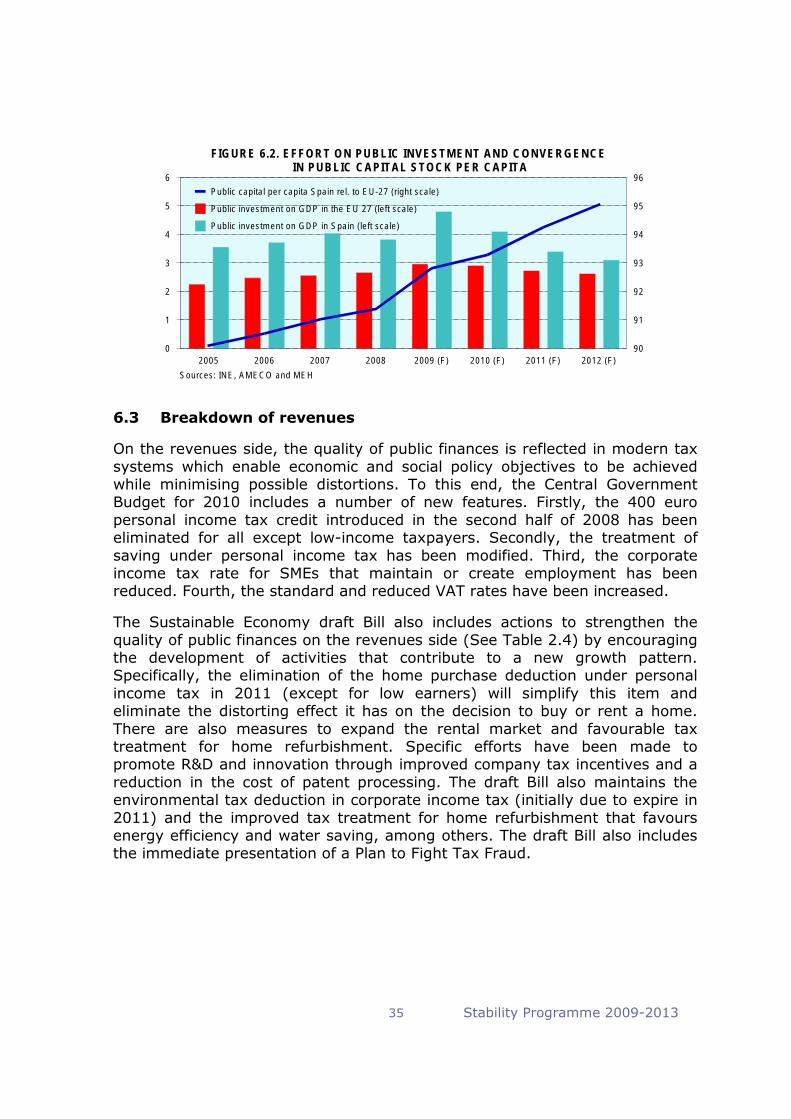
FIGURE 6.2. EFFORT ON PUBLIC INVESTMENT AND CONVERGENCE IN PUBLIC CAPITAL STOCK PER CAPITA
2005 2006 2007 2008 2009 (F) 2010 (F) 2011 (F) 2012 (F)
6 96
Public capital per capita Spain rel. to EU-27 (right scale)
5 95 Public investment on GDP in the EU 27 (left scale)
Public investment on GDP in Spain (left scale) 4 94
3 93
2 92
1 91
0 90
Sources: INE, AMECO and MEH
6.3 Breakdown of revenues
On the revenues side, the quality of public finances is reflected in modern tax systems which enable economic and social policy objectives to be achieved while minimising possible distortions. To this end, the Central Government Budget for 2010 includes a number of new features. Firstly, the 400 euro personal income tax credit introduced in the second half of 2008 has been eliminated for all except lowincome taxpayers. Secondly, the treatment of saving under personal income tax has been modified. Third, the corporate income tax rate for SMEs that maintain or create employment has been reduced. Fourth, the standard and reduced VAT rates have been increased.
The Sustainable Economy draft Bill also includes actions to strengthen the quality of public finances on the revenues side (See Table 2.4) by encouraging the development of activities that contribute to a new growth pattern. Specifically, the elimination of the home purchase deduction under personal income tax in 2011 (except for low earners) will simplify this item and eliminate the distorting effect it has on the decision to buy or rent a home. There are also measures to expand the rental market and favourable tax treatment for home refurbishment. Specific efforts have been made to promote R&D and innovation through improved company tax incentives and a reduction in the cost of patent processing. The draft Bill also maintains the environmental tax deduction in corporate income tax (initially due to expire in 2011) and the improved tax treatment for home refurbishment that favours energy efficiency and water saving, among others. The draft Bill also includes the immediate presentation of a Plan to Fight Tax Fraud.
35 Stability Programme 20092013

7. SUSTAINABILITY OF PUBLIC FINANCES
7.1 Longterm budgetary projections
This section presents projections of public expenditure related to population ageing for all EU countries drawn up by the Ageing Working Group of the Economic Policy Committee and by the European Commission. In accordance with the mandate of the ECOFIN Council, the 2006 budgetary projections were updated in 2009 using the new demographic projections EUROPOP2008 provided by Eurostat, the macroeconomic assumptions agreed with the European Commission and assuming no policy changes. The projections cover five categories of public expenditure: pensions, healthcare, longterm care, education and unemployment benefits (for more information, see the 2009 Ageing Report7).
Table 7.1 summarises the principal figures obtained for Spain. Although the new projections are based on a slightly more positive demographic scenario than the 2006 report, potential growth and public finances will be affected by ageing:
• The average growth rate of Spain's potential GDP will decline from 3% in 20072010 to 1.4% in the last decade of the projections (20502060), slightly higher than the EU average (from 2.5% to 1.3%). However, per capita income will broadly accelerate.
• Expenditure on ageing as a percentage of GDP will increase by 9 percentage points between 2007 and 2060, to 28.2%. This is mainly due to pension expenditure (which will expand by 6.7 points), while the increase in expenditure on health and longterm care will be more moderate (1.6 and 0.9 points, respectively). In contrast, education expenditure will remain practically unchanged and unemployment benefits expenditure will decline slightly (0.4 points).
Based on these projections, the European Commission has conducted a new assessment of the sustainability of public finances in the 27 countries (for more information, see the European Commission's Sustainability Report 2009), with scant changes to the diagnosis. In the case of Spain, as in other countries, updating ageingrelated expenditure projections barely affects the sustainability indicator (S2); in fact, the indicator improves 0.5 points with respect to 2006. That improvement, however, is not enough to offset the significant slide in the indicator, since its starting point is radically different now that it coincides with a situation of deteriorated public finances, primarily as a result of the crisis.
Given the sensitivity of this analysis to the starting point, the European Commission calculates the indicators under the alternative assumption that countries reach between 2010 and 2015 their mediumterm objectives (MTO), as defined in the previous Stability Programme Updates. This analysis leads to
7 “2009 Ageing Report: economic and budgetary projections for the EU27 Member States (20082060)”, European Economy 2/2009.
36 Stability Programme 20092013

a significant improvement in indicators, underlining the importance of achieving sound public finances in the medium term so as to successfully address the cost of ageing.
TABLE 7.1. PROJECTIONS OF EXPENDITURE ASSOCIATED TO AGEING FROM THE EUROPEAN UNION ECONOMIC POLICY COMMITTEE (2009)
(% of GDP)
2007 2010 2020 2030 2040 2050 2060
Total contributory pension expenditure (1+2) 8.4 8.9 9.5 10.8 13.2 15.5 15.1
Contributory Social Security pension expenditure (1) (*) 7.6 8.1 8.7 10.0 12.5 14.8 14.6
Oldage and early retirement pensions 5.0
0.9
1.6
5.5
1.0
1.7
6.0
1.0
1.6
7.1
1.2
1.6
9.4
1.3
1.8
11.8
1.2
1.9
11.7
1.1
1.7
Disability
Survivors' pensions
Non social security benefits (2) 0.8 0.8 0.9 0.9 0.8 0.6 0.5
Healthcare expenditure 5.5 5.6 5.9 6.3 6.8 7.1 7.2
Longterm care expenditure (**) 0.5 0.7 0.9 1.0 1.1 1.3 1.4
Education expenditure 3.5 3.4 3.5 3.4 3.2 3.5 3.6
Unemployment expenditure 1.3 1.4 0.9 0.9 0.9 0.9 0.9 Total expenditure on ageing 19.2 20.0 20.7 22.4 25.2 28.3 28.2
Pro memoria: Assumptions
Real potential GDP growth
Labour productivity growth
Participation rate males (aged 1564)
Participation rate females (aged 1564)
Total participation rate (aged 1564)
Unemployment rate in ages 1564 Population aged 65+ as % of total population of working age (1564)
3.7
1.0
81.5
61.5
71.6
8.3 24.2
2.9
0.8
82.0
64.3
73.3
8.8 24.4
3.4
2.7
81.5
69.6
75.7
6.2 27.4
1.8
1.9
81.0
71.5
76.4
6.2 34.3
0.9
1.7
81.3
72.9
77.2
6.2 46.4
1.1
1.7
81.9
73.2
77.6
6.2 58.7
1.6
1.7
81.6
72.9
77.3
6.2 59.1
(*) Includes minimum pensions (**) Includes potential impact of the LongTerm Care Act. Source: 20082060 Baseline Scenario of the Report on Projected Public Expenditure associated with Population Ageing. EPC and European Commission, 2009.
7.2 Strategy
Pressure on public spending associated with ageing will become manifest in the long term; however, the early but progressive adoption of palliative measures will allow to adjust the cost in the short term. For this reason, in compliance with the commitments made under the Strategy for a Sustainable Economy, the Cabinet decided on 29 January 2010 to refer to the Toledo Pact and the Social Dialogue an ambitious programme of reforms that represent an important transformation of Spain's pension system. This proposal jointly with the approved reforms to rebalance of the public accounts, the increase in the employment rate and the increase in productivity that are an integral part of Spain's strategy for overcoming the crisis, as presented in this Update, fully guarantee the longterm sustainability of public finances.
Pension reform
The European Commission gave a positive rating to the social security reforms implemented in 2002 and 2007 estimating that their combined impact will rise the average exit age from the labour market by 1.3 years between 2006 and 2025. However, the recent deterioration in sustainability indicators and the
37 Stability Programme 20092013

new demographic projections evidence the need for more ambitious changes in line with those undertaken by most other EU Member States in recent years. The proposals to be referred by the Government to the Toledo Pact and the Social Dialogue entail the following: i) strengthening the linkage between contribution and benefit (including the possibility of establishing notional accounts in a part of the system); ii) greater transparency of contributions; iii) completing the integration of the various social security regimes; iv) a sufficient and more efficient policy of family assistance; v) a more flexible relationship between supplementary voluntary pension schemes and the public social security system; and vi) the steady increase in the retirement age to 67 and the possibility of linking other parameters of the current system (minimum retirement age, minimum years' contribution required to qualify for a pension, and period for calculating the pension, among others) to this extension of the working life.
The latter proposal is essential because, since the average life expectancy increases by about one year per decade, there is a growing number of pensions to be funded by the system without an equivalent increase in revenues. According to available studies for Spain, these measures may have a major impact on the projections of agerelated expenditure. For instance, for each year by which the statutory retirement age be raised, pension expenditure would diminish by 1 point of GDP; for each year by which the number of years used to calculate a pension was extended, an additional reduction of 0.2 points could be obtained. This would entail a very substantial improvement in the European Commission's sustainability indicator (S2).
Consolidation of public finances and the Social Security Reserve Fund
Considering also the fiscal consolidation strategy for 20102013 presented in section 4, which will eliminate the structural primary deficit by 2013, the aggregated sustainability indicator (S2) for Spain would be among the most favourable of our European partners. Moreover, the pension system has reserve assets resulting from the social security surpluses obtained even in the midst of the recession. As a result of continuous allocations since its creation in 2000, the Social Security Reserve Fund had 60.022 billion euro (5.7% of GDP) in December 2009 with which to cater for future benefit payments. In 2009, the Fund's investment policy respected the principles of safety, profitability, risk diversification and duration matching. Because a Social Security surplus of 0.2% of GDP is projected in 2010, the social security budget includes an allocation of 2,249.16 million euro to this fund.
Controlling pharmaceutical expenditure
Measures to control pharmaceutical expenditure continue to have a very positive effect. In contrast with the doubledigit growth rate pre2004, spending in 2008 slowed to 6.9% increase and available data for 2009 indicate that this trend is being accentuated. Policies to promote rational use of medicines, the effect of the reference price system and an increase in generic medicine use have all played a role. In May 2009, prices were reduced again as a result of the application of the reference price system, saving an
38 Stability Programme 20092013

estimated 343.6 million euro. Moreover, the Ministerial Order to determine new groups of medicines and their reference prices for 2010 was approved; its application could cut pharmaceutical expenditure by 431.8 million euro.
LongTerm Care Act
Since its approval in December 20068, the new system for caring for dependent citizens is being implemented gradually. The rollout process, which is expected to be completed in 2015, requires the collaboration of all levels of government to guarantee care and protection throughout Spain. According to September 2009 figures, the system already provides services for 654 thousand people.
Progressive application entails another increase in the annual allocation projected in the 2010 Budget to 1,581.07 million euro, 36.5% more than the previous year. This allocation includes the funding of the minimum level which is guaranteed by the State, coverage of specific expenditure items and the social contributions by non professional health carers.
8 Act 39/2006, of 14 December, on Personal Autonomy and Care for Dependent Persons
39 Stability Programme 20092013

8. INSTITUTIONAL FRAMEWORK OF PUBLIC FINANCES
8.1 Application of budgetary stability laws
In line with the Stability and Growth Pact, Spain's budgetary stability laws are both preventive and corrective. Corrective provisions, which prevail in times of significant imbalances, require every level of government that is responsible for the imbalance to draft and present economic and financial rebalancing plans.
In compliance with this legal framework, on 30 October 2009 the Spanish Cabinet approved the Central Government economic and financial rebalancing plan for 20102012, to be submitted to Parliament. Parliamentary processing of the plan was later postponed in order to enable it to be recast in accordance with the ECOFIN Council Decision to extend the period for reducing the deficit to under 3% of GDP to 2013, which was approved by the Cabinet on 29 January 2010 as part of the initiatives proposed in order to safeguard the sustainability of public finances. Last June, Parliament approved the Autonomous Communities' stability targets for 20102012, establishing caps dependent on the presentation of the economic and financial rebalancing plans referred to in Organic Act 5/2001. In the coming months they will discuss the Framework Agreement in the corresponding bodies and will redefine their targets accordingly. Thus, the budgetary stability acts are being applied in line with the established protocols.
8.2 Reinforcing budget stability
A key component of the Sustainable Economy draft Bill is the financial sustainability of the Public Administration. To this end, the draft Bill includes a number of provisions aimed at reinforcing fiscal consolidation and ensuring sustainability of the public accounts. Specifically, the government must implement a rationalisation and cost containment policy and conform to the principles of budgetary stability, transparency and efficacy, while adopting a multiyear perspective. Accordingly, all the laws, regulations, administrative decisions, contracts and cooperation agreements and any other action by any level of government must take account of its repercussions and effects so as to guarantee budgetary stability in the medium term. Additionally, all spending must be assessed in the light of the principles of efficiency and simplification of the services provided. In particular, the Central Government must encourage cooperation among Public Administrations to improve efficiency in public service provision and to reduce costs.
One of the broadestranging measures of the draft Bill is the drafting of a Central Government Expenditure Austerity and Quality Plan, whose objective is twofold: to maintain a balanced budget over the economic cycle, and to adapt spending programmes to available budget resources in the medium and long term. The Plan will be enhanced by the creation of a special expenditure assessment group that will draw up proposals for rationalisation and efficiency improvement. Moreover, all levels of government will be responsible in the event of penalties by the European Union due to an excessive deficit.
40 Stability Programme 20092013

Measures adopted by the Cabinet on 29 January 2010 provide legal support for all these initiatives and bring them forward by several months.
8.3 Reform of Territorial Financing System
On 18 December 2009, Parliament approved Act 22/2009, which regulates the system of financing the common regime Autonomous Communities and the Autonomous Cities and amends certain tax regulations. The new financing system replaces the one approved in 2001 and is a substantial improvement in the territorial financing model. It is based on the following principles: i) reinforcing the benefits of the Welfare State, ii) increasing fairness and sufficiency in financing of all powers within its scope, iii) increasing autonomy and joint responsibility, and iv) improving the system's dynamics and stability and its ability to adapt to citizens' needs. Reform of the system was completed with Organic Act 3/2009, of 18 December, which amends Organic Act 8/1980, of 22 September, on Autonomous Community Financing.
One of the most important new features of the system concerns the transfer of central government taxes. Specifically, the percentage of tax revenues that are transferred has increased from 33% to 50% in the case of income tax, from 35% to 50% in the case of valueadded tax, and from 40% to 58% in the case of certain excise taxes. Additionally, more regulatory powers have been transferred to the Autonomous Communities in order to expand their capacity to decide on the composition and volume of their revenues. Cooperation between Regional Tax Authorities and the Central Government Tax Authority will be reinforced, among others, through the creation of a Higher Council for Tax Management and Coordination and through the actions by the Territorial Committees for Tax Management and Coordination.
Another new feature is the creation of a series of funds which help the new system adapt to the principles of solidarity, fairness and sufficiency. The Overall Sufficiency Fund guarantees financing for all powers within its scope, and ensures that no Autonomous Community receives less funding than under the previous model. The Basic Public Services Guarantee Fund ensures that all Autonomous Communities will receive the same funding per capita, in adjusted population terms. Two Regional Convergence Funds have also been regulated: the Competitiveness Fund and the Cooperation Fund. The former will reinforce fairness and efficiency in funding citizens' needs and reduce differences between regions in per capita funding, encouraging joint responsibility and penalising fiscal competition. The Cooperation Fund will seek to balance and harmonise regional development, fostering the convergence of per capita income between regions.
41 Stability Programme 20092013