stad01
DESCRIPTION
Omega Research System Trading and Development ClubTRANSCRIPT
Information in this document is subject to change without notice.
THE TRADING SYSTEMS IN THIS BOOK ARE EXAMPLES ONLY, AND HAVE BEEN INCLUDED SOLELY FOR EDUCATIONAL PURPOSES. OMEGA RESEARCH DOES NOT RECOMMEND THAT YOU USE ANY SUCH TRADING SYSTEM, AS THE USE OF ANY SUCH TRADING SYSTEM DOES NOT GUARANTEE THAT YOU WILL MAKE PROFITS, INCREASE PROFITS, OR MINIMIZE LOSSES. THE SOLE INTENDED USES OF THE TRADING SYSTEMS INCLUDED IN THIS BOOK ARE TO DEMONSTRATE THE WAYS IN WHICH EASYLANGUAGE CAN BE USED TO DESIGN PERSONAL TRADING SYSTEMS AND TO SHOW SOME EXAMPLES OF HOW CERTAIN POPULAR, WELL-KNOWN TRADING STRATEGIES MAY BE INCORPORATED INTO PERSONAL TRADING SYSTEMS. OMEGA RESEARCH, INC. IS NOT ENGAGED IN RENDERING ANY INVESTMENT OR OTHER PROFESSIONAL ADVICE. IF INVESTMENT OR OTHER PROFESSIONAL ADVICE IS REQUIRED, THE SERVICES OF A COMPETENT PROFESSIONAL SHOULD BE SOUGHT.
Copyright © 1997 Omega Research Inc.
All rights reserved. No part of this publication may be reproduced, stored in a retrieval system, or transmitted in any form or by any means, electronic, mechanical, photocopying, recording, or otherwise, without prior written permission of Omega Research, Inc. Printed in the United States of America.
TradeStation® and SuperCharts® are registered trademarks of Omega Research, Inc. EasyLanguage, PaintBar and ShowMe are trademarks of Omega Research, Inc. Microsoft is a registered trademark of Microsoft Corporation and MS-DOS, Windows, and Excel are trademarks of Microsoft Corporation. DBC Signal and BMI are trademarks of Data Broadcasting Corp. Price data supplied courtesy of Global Market Information, Inc.
)UTZKTZY
/4:85*;):/54ììììììììììììììììììììììììììììììììììììììììììììììììììììììììììììììììììììììììììììììììììììììììììììììììììììììììììììììììììììììììììììììì é)UTZKTZYúGZúGú-RGTIKú ììììììììììììììììììììììììììììììììììììììììììììììììììììììììììììììììììììììììììììììììììììììììììììììììììììììììììììììììììììììììììììììììììììììììììììììììììì úè
/YúZNOYúGú(KMOTTKX©Yú(UUQ%ú ììììììììììììììììììììììììììììììììììììììììììììììììììììììììììììììììììììììììììììììììììììììììììììììììììììììììììììììììììììììììììììììììììììììììììì è
'JJOZOUTGRú+J[IGZOUTGRú9KX\OIKYú ììììììììììììììììììììììììììììììììììììììììììììììììììììììììììììììììììììììììììììììììììììììììììììììììììììììììììììììììììììììììììììììììì è
Video Course .............................................................................................................................................. 2
Workshops .................................................................................................................................................. 3
EasyLanguage Resource Center ................................................................................................................. 3
0UOTúZNKú)R[H ìììììììììììììììììììììììììììììììììììììììììììììììììììììììììììììììììììììììììììììììììììììììììììììììììììììììììììììììììììììììììììììììììììììììììììììììììììììììììììììììììì æ
-KZZOTMú9ZGXZKJ ììììììììììììììììììììììììììììììììììììììììììììììììììììììììììììììììììììììììììììììììììììììììììììììììììììììììììììììììììììììììììììììììììììììììììììììììììììììììììììììì æ
).'6:+8úé ú-KTKXGRú9_YZKSú*K\KRUVSKTZú)UTIKVZY ììììììììììììììììììììììììììììììììììììììììììììììììììììììììììììììì å9KRKIZú_U[Xú3GXQKZúGTJú9_YZKSú:_VKúìììììììììììììììììììììììììììììììììììììììììììììììììììììììììììììììììììììììììììììììììììììììììììììììììììììììììììììììììììììììììì ä
Trending Market ......................................................................................................................................... 6
Directionless Market .................................................................................................................................. 7
Volatile Market .......................................................................................................................................... 8
9KRKIZú_U[Xú:OSKú,XGSKúìììììììììììììììììììììììììììììììììììììììììììììììììììììììììììììììììììììììììììììììììììììììììììììììììììììììììììììììììììììììììììììììììììììììììììììììì á
Daily Charts ............................................................................................................................................... 9
Weekly Charts ............................................................................................................................................ 9
Intra-Day Charts ......................................................................................................................................... 9
:OVYúLUXú*KLOTOTMú_U[Xú:XGJOTMú8[RKYúìììììììììììììììììììììììììììììììììììììììììììììììììììììììììììììììììììììììììììììììììììììììììììììììììììììììììììììììììììììììììì á
TradeStation Basics .................................................................................................................................. 10
).'6:+8úè ú:XKTJOTMú9_YZKSY ìììììììììììììììììììììììììììììììììììììììììììììììììììììììììììììììììììììììììììììììììììììììììììììììììì éé3U\OTMú'\KXGMKú)XUYYU\KXúìììììììììììììììììììììììììììììììììììììììììììììììììììììììììììììììììììììììììììììììììììììììììììììììììììììììììììììììììììììììììììììììììììììììì éè
Defining your Trading Rules ................................................................................................................... 14
Designing & Formatting .......................................................................................................................... 14
Testing & Improving ................................................................................................................................ 19
OOúúúúúúúúúú)UTZKTZY
3U\OTMú'\KXGMKú)UT\KXMKTIKú*O\KXMKTIKúò3')*ñú(XKGQU[Zú ììììììììììììììììììììììììììììììììììììììììììììììììììììììììììììììììììììììììììììììììììììììììììììììì èé
Defining your Trading Rules ...................................................................................................................................22
Designing & Formatting ..........................................................................................................................................23
Testing & Improving ...............................................................................................................................................26
:XKTJú2OTKú'[ZUSGZOIú ììììììììììììììììììììììììììììììììììììììììììììììììììììììììììììììììììììììììììììììììììììììììììììììììììììììììììììììììììììììììììììììììììììììììììììììììììììììììììììììììì èâ
Defining your Trading Rules ...................................................................................................................................30
Designing & Formatting ..........................................................................................................................................30
Testing & Improving ...............................................................................................................................................34
:XKTJú,URRU]KXú ìììììììììììììììììììììììììììììììììììììììììììììììììììììììììììììììììììììììììììììììììììììììììììììììììììììììììììììììììììììììììììììììììììììììììììììììììììììììììììììììììììììììììììì çå
Defining your Trading Rules ...................................................................................................................................37
Designing & Formatting ..........................................................................................................................................37
Testing & Improving ...............................................................................................................................................40
).'6:+8úç ú9[VVUXZúôú8KYOYZGTIKú9_YZKSYìììììììììììììììììììììììììììììììììììììììììììììììììììììììììììììììììììììììììììììììììììììììììì æç9VXKGJúìììììììììììììììììììììììììììììììììììììììììììììììììììììììììììììììììììììììììììììììììììììììììììììììììììììììììììììììììììììììììììììììììììììììììììììììììììììììììììììììììììììììììììììììììììììììììì ææ
Defining your Trading Rules ...................................................................................................................................45
Designing & Formatting ..........................................................................................................................................45
Testing & Improving ...............................................................................................................................................49
9[VVUXZúGTJú8KYOYZGTIKú2K\KRYúììììììììììììììììììììììììììììììììììììììììììììììììììììììììììììììììììììììììììììììììììììììììììììììììììììììììììììììììììììììììììììììììììììììììììììììììì æá
Defining your Trading Rules ...................................................................................................................................51
Designing & Formatting ..........................................................................................................................................52
Testing & Improving ...............................................................................................................................................57
).'6:+8úæ ú<URGZOROZ_ú(XKGQU[Zú9_YZKSYìììììììììììììììììììììììììììììììììììììììììììììììììììììììììììììììììììììììììììììììììììììììììììììììì åá6O\UZú6UOTZYú ììììììììììììììììììììììììììììììììììììììììììììììììììììììììììììììììììììììììììììììììììììììììììììììììììììììììììììììììììììììììììììììììììììììììììììììììììììììììììììììììììììììììììììììììì äê
Defining your Trading Rules ...................................................................................................................................61
Designing & Formatting ..........................................................................................................................................61
Testing & Improving ...............................................................................................................................................64
6O\UZYú6UOTZYú/TZXGíJG_ú ììììììììììììììììììììììììììììììììììììììììììììììììììììììììììììììììììììììììììììììììììììììììììììììììììììììììììììììììììììììììììììììììììììììììììììììììììììììììììììììì äå
Defining your Trading Rules ...................................................................................................................................66
Designing & Formatting ..........................................................................................................................................66
Testing & Improving ...............................................................................................................................................69
)NGTTKRú(XKGQU[Zú ììììììììììììììììììììììììììììììììììììììììììììììììììììììììììììììììììììììììììììììììììììììììììììììììììììììììììììììììììììììììììììììììììììììììììììììììììììììììììììììììììììììì ãê
Defining your Trading Rules ...................................................................................................................................71
Designing & Formatting ..........................................................................................................................................71
Testing & Improving ...............................................................................................................................................74
<URGZOROZ_ú+^VGTYOUTúò<UR+^ñúììììììììììììììììììììììììììììììììììììììììììììììììììììììììììììììììììììììììììììììììììììììììììììììììììììììììììììììììììììììììììììììììììììììììììììììììììììììì ãä
Defining your Trading Rules ...................................................................................................................................77
Designing & Formatting ..........................................................................................................................................77
Testing & Improving ...............................................................................................................................................80
/4*+>ú ììììììììììììììììììììììììììììììììììììììììììììììììììììììììììììììììììììììììììììììììììììììììììììììììììììììììììììììììììììììììììììììììììììììììììììììììììììììììì âç

I N T R O D U C T I O N
=KRIUSKúZUúZNKú)R[H
Now that you’ve determined that system trading is the way to go—that most successful traders are system traders—where do you start? How do you go from having some ideas to actually creating a system?
That’s where the Omega Research System Trading and Development Club comes in.
This first volume, Volume I, of the Omega Research System Trading and Development Club contains 10 systems we’ve created to help you get started developing your own systems. These systems incorporate popular concepts such as moving average crossovers, pivot points and spreads. We’ve identified the most common problems with these types of systems and identified techniques to overcome them. By reviewing and testing these 10 systems, you’ll be able to understand these techniques and use them or a variation in your own systems.
To help you do that, this book walks you step-by-step through the process we went through to develop these systems, from coming up with a feasible trading idea, to writing down your trading rules, to writing them in EasyLanguage, to taking into consideration money management and risk control factors.
Our goal is for you to understand why we wrote these systems the way we did. We recommend you study the EasyLanguage techniques we used, look at the System Report, read about the factors we took into account to deem that a system may have merit, and think about how you can combine some of these popular ideas with your own to develop a system you want to trade.
When you join the Omega Research System Trading and Development Club, you’ll receive an additional volume approximately every 2 months, with 10 new systems and this comprehensive guide to help you understand and get the most out of the systems.
èúúúúúúúúúú)UTZKTZYúGZúGú-RGTIKúúúúúúúúúú 5SKMGú8KYKGXINú9_YZKSú:XGJOTMúGTJú*K\KRUVSKTZú)R[Húíú<UR[SKú/
IMPORTANT NOTICE: The trading systems in this book are examples only, and have been included solely for educational purposes. Omega Research does not recommend that you use any such trading system, as the use of any such trading system does not guarantee that you will make profits, increase profits, or minimize losses. The sole intended uses of the trading systems included in this book are to demonstrate the ways in which EasyLanguage can be used to design personal trading systems and to show some examples of how certain popular, well-known trading strategies may be incorporated into personal trading systems.
)UTZKTZYúGZúGú-RGTIKThis book begins by discussing some of the broader concepts of system development before moving on to the description of each system. We grouped the different types of systems together. The contents are:
� Chapter 1: General System Development Concepts
� Chapter 2: Trending Systems
� Chapter 3: Support & Resistance Systems
� Chapter 4: Volatility Breakout Systems
� Index
We suggest you read the book from front to back because there is instructional material in each section and it is not repeated throughout.
/YúZNOYúGú(KMOTTKX©Yú(UUQ%You’ll get the most out of this book if you are already familiar with EasyLanguage to some degree. This book is intended for the TradeStation user who has already started writing systems—perhaps the systems aren’t as successful as you’d like them to be, or maybe they are but you’d really like some new ideas or techniques to try.
But if you are a beginner, don’t worry! You can still apply the systems, study them either on paper or in the PowerEditor, and begin to understand what system development is all about. And most importantly, you’ll begin to understand where system ideas come from and to get started developing them. You may also want to consider taking advantage of some of the additional EasyLanguage and system development educational services we offer.
If you are on the other side of the spectrum and are an experienced system developer, what you’ll get out of this book is ideas. Perhaps we accomplished a task using a slightly different technique than you did, or in a way that you hadn’t thought of. You can use the techniques in this club and apply them as is or somewhat differently, or you can vary and mold them into something even more useful for you.
'JJOZOUTGRú+J[IGZOUTGRú9KX\OIKYOmega Research is committed to enhancing individual trading potential through quality education. To help you learn more about system trading, an Omega Research product or EasyLanguage, visit our web site at www.omegaresearch.com or call 800-439-7995 (outside U.S. 305-551-9991) and ask about the following educational services.
<OJKUú)U[XYKWe offer a comprehensive video course that introduces you to EasyLanguage, starting with the very basics and taking you through writing actual trading systems. It includes a follow-along workbook that contains exercises and real-life examples and applications.
Once you finish this course, you’ll be able to write your own indicators, ShowMe and PaintBar studies, and trading systems. This course is perfect for those who want to learn EasyLanguage at their own pace.

/TZXUJ[IZOUT 0UOTúZNKú)R[Húúúúúúúúúúç
=UXQYNUVYOmega Research offers a variety of workshops on the products and technical analysis. Workshops are an excellent way to learn how to use the products, learn about technical analysis and system trading and/or EasyLanguage. Spend a day with a Product Training Specialist and exchange ideas with other users like yourself.
+GY_2GTM[GMKú8KYU[XIKú)KTZKXOne of the best ways to learn is by example, and the EasyLanguage Resource Center on our web site is an excellent source of examples. In this Resource Center, we list all the analysis techniques—indicators and trading systems—published in Stocks and Commodities Magazine, as well as popular analysis techniques worth taking a look at. Access to this Resource Center is free of charge, feel free to download and review any of the analysis techniques and their descriptions. Our web site address is www.omegaresearch.com.
0UOTúZNKú)R[HIf you haven’t joined the Omega Research System Trading and Development Club, don’t delay! When you join the club, every two months you’ll receive ten new systems along with the comprehensive handbook explaining in detail each system and the process used to develop it. Keep in mind that the club is risk free—if you’re not completely satisfied with any of the volumes you receive, simply return it for an immediate refund. You can cancel your membership at any time without further obligation.
To become a charter member of the club and radically increase your ability to design and develop trading systems, call Omega Research at 800-439-7995 (outside the U.S. 305-551-9991).
-KZZOTMú9ZGXZKJTo begin reviewing your systems, transfer the analysis techniques into your TradeStation library and then apply the system you want to review to a chart. Use the System Report to view the system results and take a look at the EasyLanguage instructions by opening the system in the PowerEditor.
To transfer the analysis techniques into TradeStation:
1. Place the System Trading and Development Club CD in the CD-ROM drive.
2. Start the PowerEditor. In Windows 95, click Start, choose Programs, choose Omega Research and choose TradeStation PowerEditor. In Windows 3.x, choose TradeStation PowerEditor from the Omega Research program group.
3. In the PowerEditor, use the File - Open menu sequence.
4. Click Transfer.
5. Select the Transfer analysis techniques FROM EasyLanguage Archive File option and click OK .
6. Click Scan.
7. In the Enter drive letter to scan edit box, enter the drive letter for your CD-ROM drive (normally D), and click OK . The ELA file on the CD is placed in the list.
8. Choose JANFEB98.ELA from the list and click OK .
9. In the Transfer dialog box, select Transfer All and click OK .
10. Once the files are transferred and verified, a dialog box appears informing you that the transfer was performed successfully. Click OK .
You can now open the systems and indicators in the PowerEditor and view the EasyLanguage instructions and/or apply them to a chart in TradeStation. You can remove your CD from the CD-ROM drive and store it in a safe place. As you apply the systems and work with them, refer to this book for detailed explanations of the systems and the EasyLanguage used to create them. For instructions on applying systems and viewing the System Report, please refer to the TradeStation User’s Manual.

æúúúúúúúúúú-KZZOTMú9ZGXZKJúúúúúúúúúú 5SKMGú8KYKGXINú9_YZKSú:XGJOTMúGTJú*K\KRUVSKTZú)R[Húíú<UR[SKú/

C H A P T E R 1
-KTKXGRú9_YZKSú*K\KRUVSKTZú)UTIKVZY
When you are developing your systems, there are certain rules of thumb that you should follow. These are guidelines that our users have discovered through years of trial and effort, and we are providing them for you here. For example, you should know that there are three basic types of markets—trending, volatile and directionless—and no one system can work well in all three. The key is to develop a system that works well in one market type and limits your losses in the other market types. This is a basic but very important concept.
Another concept is that you don’t need to look at the system as a whole at the beginning. For example, you can have a great idea for an entry signal and really no idea as to how you will want to exit. That doesn’t mean you can’t start writing a great system. It means you can start by developing your entries until they work really well, then, once that’s done, start working on the exits. Maybe you even have several favorite exits that you try with your different entries.
The point is, before you begin developing your systems, read this chapter—it could save you hours of work and headaches!
/Tú:NOYú)NGVZKX
� Select your Market and System Type........................................2
� Select your Time Frame......................6
� Tips for Defining your Trading Rules ....................................12
äúúúúúúúúúú9KRKIZú_U[Xú3GXQKZúGTJú9_YZKSú:_VKúúúúúúúúúú 5SKMGú8KYKGXINú9_YZKSú:XGJOTMúGTJú*K\KRUVSKTZú)R[Húíú<UR[SKú/
9KRKIZú_U[Xú3GXQKZúGTJú9_YZKSú:_VKThe very first step in developing a system is to decide on the market type you want to trade. This is an important decision because it determines the type of system you will be developing. This section will help you to understand some of the conditions that can occur in the different types of markets and the types of systems that complement those markets. Once you are familiar with the basic system types, you will be able to select the one that you want to use.
Generally, there are three types of markets. The three market types, or phases, are derived from three distinct chart patterns that appear when there is a shift in market action. The phases are trending, volatile, and directionless, and each can be characterized by specific price activity. Each of the three types of markets are tradable, but with markedly different trading systems. Let’s take a look at each type of market behavior and the systems that are appropriate to that type of market.
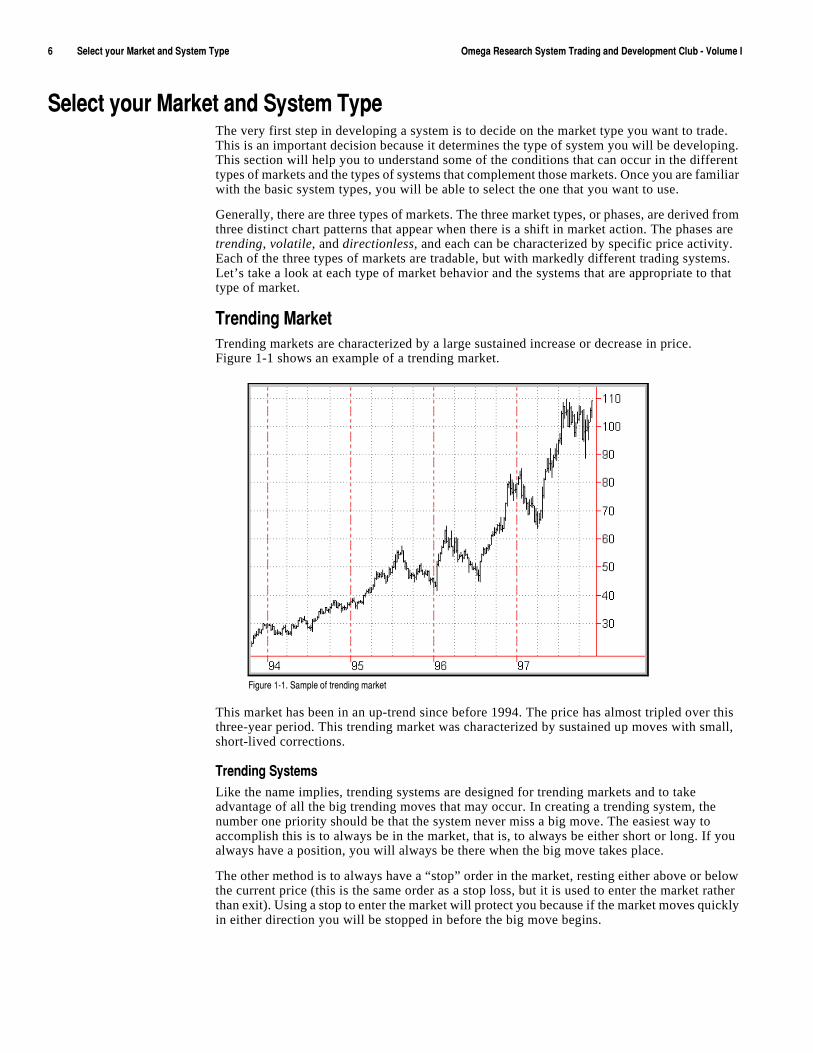
:XKTJOTMú3GXQKZúTrending markets are characterized by a large sustained increase or decrease in price. Figure 1-1 shows an example of a trending market.
This market has been in an up-trend since before 1994. The price has almost tripled over this three-year period. This trending market was characterized by sustained up moves with small, short-lived corrections.
:XKTJOTMú9_YZKSYLike the name implies, trending systems are designed for trending markets and to take advantage of all the big trending moves that may occur. In creating a trending system, the number one priority should be that the system never miss a big move. The easiest way to accomplish this is to always be in the market, that is, to always be either short or long. If you always have a position, you will always be there when the big move takes place.
The other method is to always have a “stop” order in the market, resting either above or below the current price (this is the same order as a stop loss, but it is used to enter the market rather than exit). Using a stop to enter the market will protect you because if the market moves quickly in either direction you will be stopped in before the big move begins.
,OM[XKúéíéìú9GSVRKúULúZXKTJOTMúSGXQKZú
)NGVZKXúéúúúúúú-KTKXGRú9_YZKSú*K\KRUVSKTZú)UTIKVZY 9KRKIZú_U[Xú3GXQKZúGTJú9_YZKSú:_VKúúúúúúúúúã
Keep in mind that trending systems tend to lose money in choppy, or directionless phases of the market. They have a small percentage of winning trades, that is, they make their money in a few big trades. This means that if you miss a big move, you may not have enough capital to hold out through the drawdown as you wait for the next big move.
Another design characteristic should be to limit your losses during the market’s sideways mode. Remember, no system will make money in every market condition. If the system is designed to make money in a trending market, it will lose money in the choppy phase. Your priority should be to minimize the losses in the directionless market.
Many trending systems make their money in one or two months of the year and break even or lose money for the rest. The most common indicator used in trend following systems is moving averages, most often two—a short moving average and a longer moving average.
Trending Systems have the following characteristics:
✓ They make 80% of their profits on 20% of their trades. This is the difficult part of trend trading—a low percentage of winning trades. You need a lot of positive self-esteem and confidence in your abilities to trade a system that loses money on 60 or 65% of its trades. You should also be able to sit through significant drawdown as the market drifts through a directionless period.
✓ Many researchers have estimated that any market is in the trend mode 15% of the time and is directionless 85% of the time. A trend following system then, by definition, has a low percentage of profitable trades. A trend following system is psychologically difficult to trade, but if you think you can successfully trade without constant positive feedback, it can prove to be very profitable.
Trending systems are the most popular type of system. With a high percentage of losing trades, you might be wondering why is it so popular. Very simply, trend-following systems can be very profitable overall, and this is why people attempt to trade them. Another reason is that people like to follow (and make money on) the big trends. It is human nature to want to cash in on the big moves in the market. It is innately satisfying to get in early on a trend and watch your profits soar.
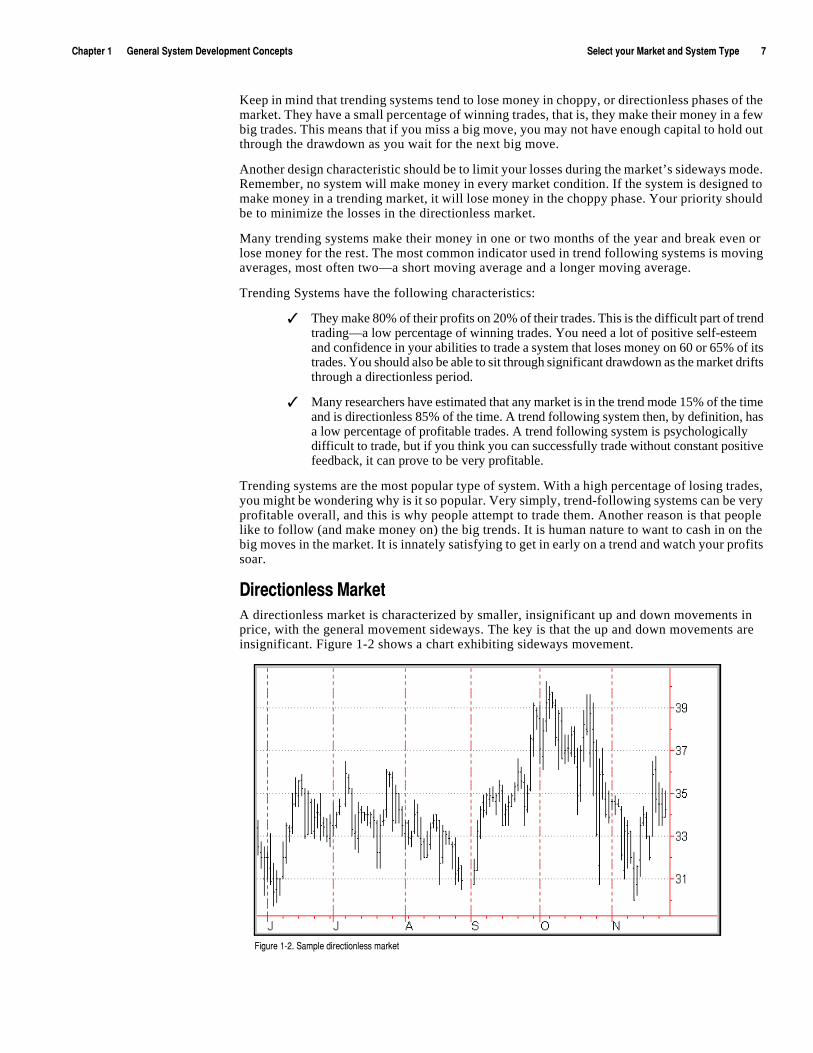
*OXKIZOUTRKYYú3GXQKZúA directionless market is characterized by smaller, insignificant up and down movements in price, with the general movement sideways. The key is that the up and down movements are insignificant. Figure 1-2 shows a chart exhibiting sideways movement.
,OM[XKúéíèìú9GSVRKúJOXKIZOUTRKYYúSGXQKZú
âúúúúúúúúúú9KRKIZú_U[Xú3GXQKZúGTJú9_YZKSú:_VKúúúúúúúúúú 5SKMGú8KYKGXINú9_YZKSú:XGJOTMúGTJú*K\KRUVSKTZú)R[Húíú<UR[SKú/
9[VVUXZúôú8KYOYZGTIKú9_YZKSYúThe main focus of a Support & Resistance system is to profit from the price swings that occur in directionless markets. Support and resistance systems start with the premise that markets are directionless 85% of the time. The system attempts to take advantage of this price movement and catch the small swings that take place in sideways or choppy markets. This type of system has a higher number of winning trades, with small profits on each trade. It misses the full trend because it exits early in the trend move as the market becomes quickly overbought or oversold.
An Support & Resistance system is built on the premise of buying low and selling high. As you are buying when prices are low and selling when prices go up, you are actually trading against the trend. Essentially, you are picking tops and bottoms. You buy low and sell high, but the market keeps going higher. You keep selling as the market goes higher, and keep taking small losses until the market finally turns down and gives you a profitable trade.
Although an Support & Resistance system is easier to trade emotionally, many traders don’t trade this type of system because they miss the big move. The drawback of support and resistance systems is that they usually have small profits and larger losses, losing money as the market trends; the system keeps shorting a market that is in an up-trend or buying a market that is a down-trend.
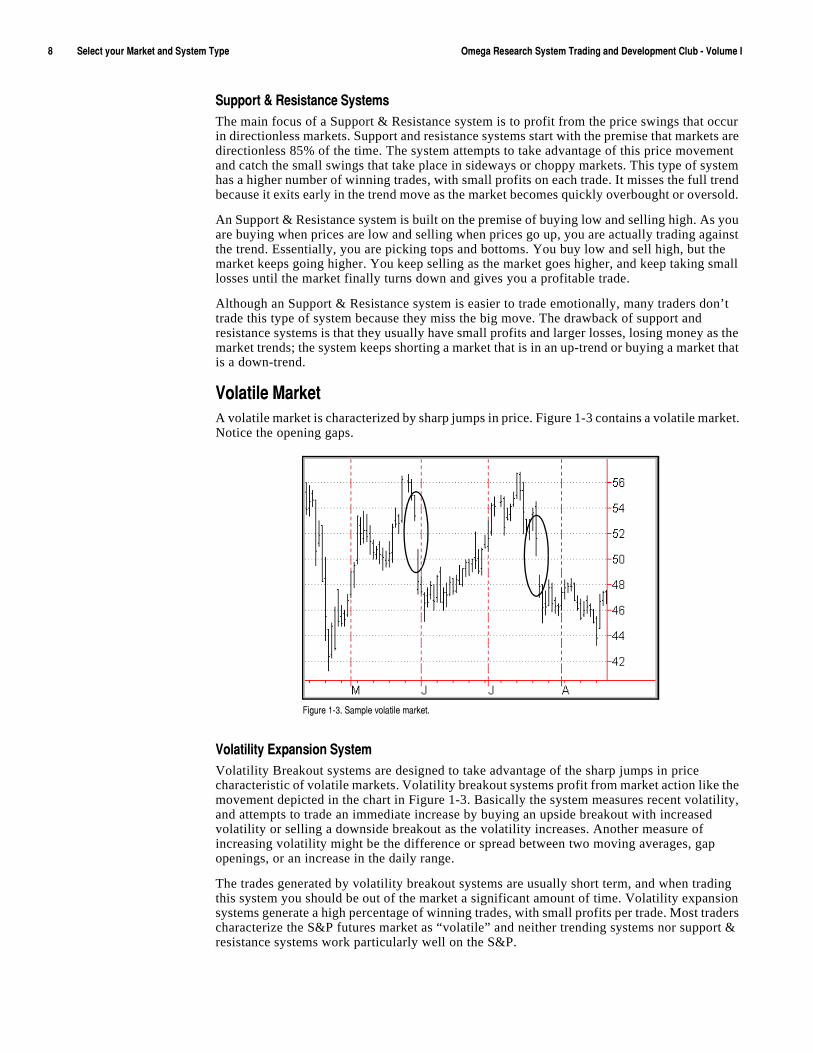
<URGZORKú3GXQKZúA volatile market is characterized by sharp jumps in price. Figure 1-3 contains a volatile market. Notice the opening gaps.
<URGZOROZ_ú+^VGTYOUTú9_YZKSúVolatility Breakout systems are designed to take advantage of the sharp jumps in price characteristic of volatile markets. Volatility breakout systems profit from market action like the movement depicted in the chart in Figure 1-3. Basically the system measures recent volatility, and attempts to trade an immediate increase by buying an upside breakout with increased volatility or selling a downside breakout as the volatility increases. Another measure of increasing volatility might be the difference or spread between two moving averages, gap openings, or an increase in the daily range.
The trades generated by volatility breakout systems are usually short term, and when trading this system you should be out of the market a significant amount of time. Volatility expansion systems generate a high percentage of winning trades, with small profits per trade. Most traders characterize the S&P futures market as “volatile” and neither trending systems nor support & resistance systems work particularly well on the S&P.
,OM[XKúéíçìú9GSVRKú\URGZORKúSGXQKZìú
)NGVZKXúéúúúúúú-KTKXGRú9_YZKSú*K\KRUVSKTZú)UTIKVZY 9KRKIZú_U[Xú:OSKú,XGSKúúúúúúúúúá
9KRKIZú_U[Xú:OSKú,XGSKAs you look at a chart and are evaluating market action type, it is important to consider the time frame of your chart. In fact, choosing which time frame is appropriate for you is almost as important as the type of market action and system you want to trade. You can take the same chart and time period and when you change the time frame, say from daily to weekly, the market action type may be completely different. We’ll discuss three basic types of charts: daily, weekly and intra-day.
*GOR_ú)NGXZYThe most common chart used by traders is the daily chart. Daily charts are the most common for several reasons. First, as most traders also have day jobs, they want to keep abreast of the market as much as possible without it intruding into their workday. The daily chart is perfect for this type of trader. You are able to review the markets each night and make your decisions for the next day.
=KKQR_ú)NGXZYúWeekly charts are much more difficult to trade because it takes more discipline. To trade weekly charts you make your decisions on the weekends and don’t make any changes until the next weekend. For most traders, this is very difficult to do. It’s hard not to look at the market during the week and be tempted to move a stop loss or a money management stop, or not to want to keep your profits and exit the market early.
However, most people don’t think of trading weekly charts, and a lot of traders agree that to make money in the markets you have to tread where the average traders do not tread. Weekly charts are one of those places.
Also, some systems work better on a weekly chart than on a daily. Very few people have the patience and the discipline to trade weekly charts. By their very nature, weekly charts smooth the price fluctuations of the daily chart. If there is a long trending market, we should be in the trend longer. We might get in the trend a little later than on the daily chart, and out later, but we will probably not get whipsawed as much in the directionless markets.
/TZXGí*G_ú)NGXZYúIntra-day charts are the 5-, 10-, 30-, and 60-minute charts that are compiled from intra-day tick data. Intra-day data, if used correctly, can give you a distinct advantage over using daily charts. If you have the time and energy, you can take advantage of the microscopic look at the markets.
However, to trade intra-day charts, you must give almost your full attention to the markets during the day. It is virtually impossible to have a full-time job and trade intra-day charts well. Relatively few traders are able to trade during the day. As with weekly charts, the relative lack of competition is probably in your favor trading intra-day.
Once you select the market action and therefore the system type you want to use and the time frame you will be trading, you’re ready to start defining your trading rules.
:OVYúLUXú*KLOTOTMú_U[Xú:XGJOTMú8[RKYA large part of system development involves writing your rules clearly, without any ambiguity. In fact, you should be able to state your rules so clearly that anyone, using only the Data Window and a calculator, should be able to generate buy and sell signals. It sounds simple until you try it. Unless you have stated your rules in a way that is completely non-ambiguous, you won’t be able to do it. And certainly, TradeStation won’t be able to interpret your rules either.
When people first start developing systems, they tend to focus on the visual aspect. They try to describe their entry criteria, for example, based on the pattern they see in the chart. However, EasyLanguage is mathematical, so eliminating the visual aspect and focusing on the
éêúúúúúúúúúú:OVYúLUXú*KLOTOTMú_U[Xú:XGJOTMú8[RKYúúúúúúúúúú 5SKMGú8KYKGXINú9_YZKSú:XGJOTMúGTJú*K\KRUVSKTZú)R[Húíú<UR[SKú/
mathematical aspect goes a long way to making sure your system does exactly what you want it to do.
Another stumbling block for beginning system developers is that sometimes they try to develop the entire system all at once. If you find an idea that you think is significant, don’t rush to build a system around it. First, see if it’s a valid idea. For example, you may want to write a ShowMe study to identify the criteria on the chart. Then, you can see if it’s worth pursuing.
Once you decide an idea is worth pursuing and start writing a system, you still don’t have to build the entire system. For instance, you can define your entry points only and use just a standard exit like a trailing stop. Or maybe work on the short side only, leaving out the long side. Many system developers have a handful of favorite exits which they use with the entries they develop. In other words, they spend their time developing the entries.
:XGJK9ZGZOUTú(GYOIYKeep the following in mind when you are developing your systems:
✓ You can develop what are called reversal systems, which will reverse your position but never exit you from the market.
To do this, you use ([_ and 9KRR orders without +^OZ2UTM or +^OZ9NUXZ. This is not to say that you wouldn’t get stopped out of the market, but your buy and sell orders do not ever exit you from the market. For example, if you are long 1 share, and the sell criteria is met, the system would sell 2 shares. If you are short 1 share, and the buy criteria is met, the system would buy 2 shares.
✓ When testing a system, make sure you take into account commissions, margin (if applicable) and slippage. Many times, you’ll be evaluating a system and it will look real good until you factor in the above costs.
Most importantly, don’t throw away an idea because it didn’t work right away. Play with it, some ideas just need refining before you can see their true worth.
C H A P T E R 2
:XKTJOTMú9_YZKSY
Trending systems are systems designed for trending markets—they have the following characteristics:
� The systems are designed never to miss the big move; they will either always be in the market or contain stop orders that will stop you into the market.
� They attempt to limit losses during the market’s sideways mode; no system will make money in every market condition, but a good system will limit losses in market conditions for which it was not designed.
� Profits are concentrated in a few big trades; they have a low percentage of profitable trades. This makes them psychologically difficult to trade and underscores the importance of never missing a big move.
Even though trending systems are difficult to trade, they are popular—it’s human nature to want to cash in on the big moves. In this chapter, we present four trending systems that differ in their approach but are all designed to capture big moves and limit losses during directionless and/or volatile phases.
/Tú:NOYú)NGVZKX
� Moving Average Crossover ............ 12
� Moving Average Convergence Divergence (MACD) Breakout ....... 21
� Trend Line Automatic .....................28
� Trend Follower.................................35
éèúúúúúúúúúú3U\OTMú'\KXGMKú)XUYYU\KXúúúúúúúúúú 5SKMGú8KYKGXINú9_YZKSú:XGJOTMúGTJú*K\KRUVSKTZú)R[Húíú<UR[SKú/
3U\OTMú'\KXGMKú)XUYYU\KXTraditional Moving Average Crossover systems look for a crossing of the slow- and fast-moving averages in an effort to capture trends. They buy when the fast-moving average crosses over the slow-moving average, expecting the market to trend up, and sell when the opposite occurs, expecting the market to trend down. This technique can work well in trending market conditions, but when the market moves sideways or becomes choppy, the averages cross frequently and produce a lot of false signals that result in losing trades.
We wanted to develop a Moving Average Crossover (MACO) system that takes advantage of a trend but tries to avoid or minimizes any false signals. The goal was to identify trends but not act unless we could confirm that it was in fact the beginning of a trend.
To accomplish this, our system uses the crossing of the slow- and fast-moving averages to identify the possible start of a trend but then waits to generate a buy or sell signal until the up- or down-trend has been confirmed. It attempts to confirm the trend by placing buy or sell stop orders on the next bar, which remain active for a certain number of bars.
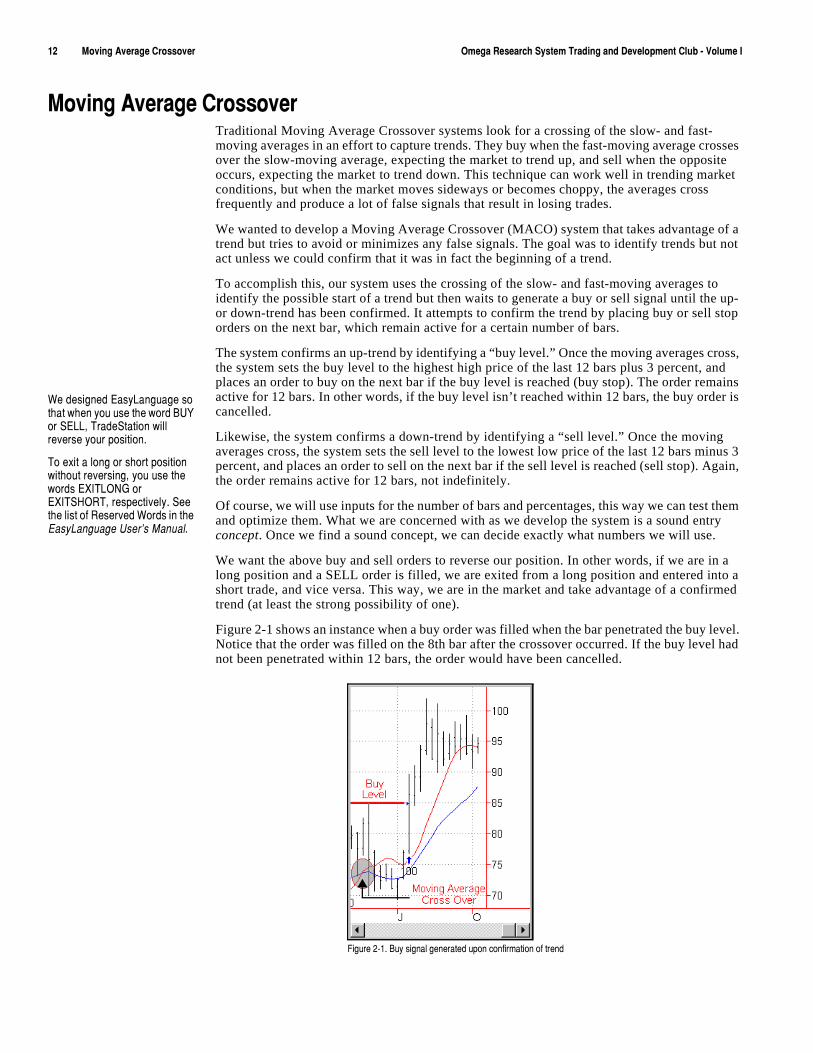
The system confirms an up-trend by identifying a “buy level.” Once the moving averages cross, the system sets the buy level to the highest high price of the last 12 bars plus 3 percent, and places an order to buy on the next bar if the buy level is reached (buy stop). The order remains active for 12 bars. In other words, if the buy level isn’t reached within 12 bars, the buy order is cancelled.
Likewise, the system confirms a down-trend by identifying a “sell level.” Once the moving averages cross, the system sets the sell level to the lowest low price of the last 12 bars minus 3 percent, and places an order to sell on the next bar if the sell level is reached (sell stop). Again, the order remains active for 12 bars, not indefinitely.
Of course, we will use inputs for the number of bars and percentages, this way we can test them and optimize them. What we are concerned with as we develop the system is a sound entry concept. Once we find a sound concept, we can decide exactly what numbers we will use.
We want the above buy and sell orders to reverse our position. In other words, if we are in a long position and a SELL order is filled, we are exited from a long position and entered into a short trade, and vice versa. This way, we are in the market and take advantage of a confirmed trend (at least the strong possibility of one).
Figure 2-1 shows an instance when a buy order was filled when the bar penetrated the buy level. Notice that the order was filled on the 8th bar after the crossover occurred. If the buy level had not been penetrated within 12 bars, the order would have been cancelled.
,OM[XKúèíéìú([_úYOMTGRúMKTKXGZKJú[VUTúIUTLOXSGZOUTúULúZXKTJúú
=KúJKYOMTKJú+GY_2GTM[GMKúYUúZNGZú]NKTú_U[ú[YKúZNKú]UXJú(;?úUXú9+22îú:XGJK9ZGZOUTú]ORRúXK\KXYKú_U[XúVUYOZOUTìú
:UúK^OZúGúRUTMúUXúYNUXZúVUYOZOUTú]OZNU[ZúXK\KXYOTMîú_U[ú[YKúZNKú]UXJYú+>/:254-úUXú+>/:9.58:îúXKYVKIZO\KR_ìú9KKúZNKúROYZúULú8KYKX\KJú=UXJYúOTúZNKú+GY_2GTM[GMKú;YKX©Yú3GT[GRì
)NGVZKXúèúúúúúú:XKTJOTMú9_YZKSY 3U\OTMú'\KXGMKú)XUYYU\KXúúúúúúúúúúéç
This entry technique works well because it avoids your being in the market in drawdown periods immediately after a crossover occurs, as shown in Figure 1, and also avoids your entering the market on a false crossover signal.
Once we were happy with the entry criteria for our system, and found them to provide satisfactory results, we focused on the exits. Because it is a trending system, we wanted to exit when the trend was ending or starting to reverse.
In an attempt to anticipate the end or reversal of the trend, we will have our system exit from all long positions if the price reaches a substantially low price, or from all short positions if the price reaches a substantially high price, relatively speaking. We decided on a price level equal to or lower than the lowest low of the last 8 bars for the long exit, and equal to or higher that the highest high of the last 8 bars for the short exit. This works well to lock in profits. The higher the price goes, the higher our stop will be placed.
We are going to use the type of exit order that renders our position flat—in other words—it exits us from the market. We want to exit because we are confirming only that the trend is ending or potentially reversing, we already have criteria in place to enter the market when a strong trend is anticipated.
In evaluating the exit order, we realized that the above exit technique would sometimes result in a premature exit and cause the system to lose out on a large amount of profit. To compensate for this, we decided to include some re-entry criteria that will re-establish the original position if the trend continues.
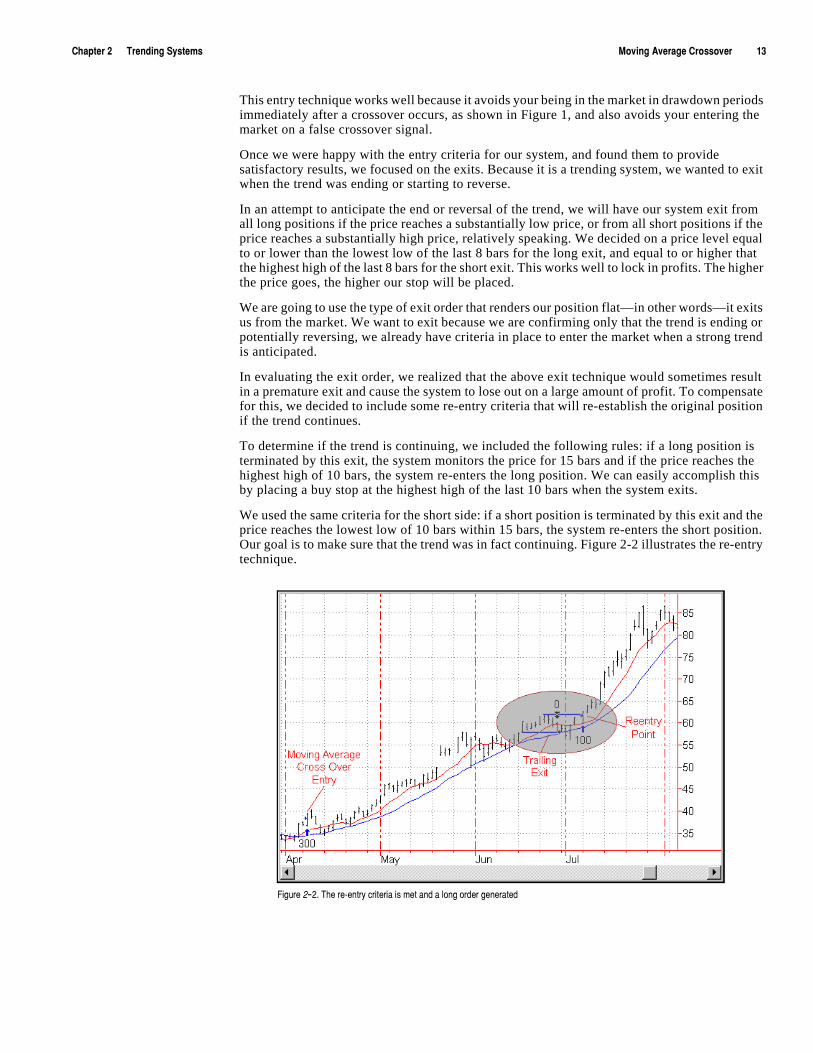
To determine if the trend is continuing, we included the following rules: if a long position is terminated by this exit, the system monitors the price for 15 bars and if the price reaches the highest high of 10 bars, the system re-enters the long position. We can easily accomplish this by placing a buy stop at the highest high of the last 10 bars when the system exits.
We used the same criteria for the short side: if a short position is terminated by this exit and the price reaches the lowest low of 10 bars within 15 bars, the system re-enters the short position. Our goal is to make sure that the trend was in fact continuing. Figure 2-2 illustrates the re-entry technique.
,OM[XKúè-èìú:NKúXKíKTZX_úIXOZKXOGúOYúSKZúGTJúGúRUTMúUXJKXúMKTKXGZKJú
éæúúúúúúúúúú3U\OTMú'\KXGMKú)XUYYU\KXúúúúúúúúúú 5SKMGú8KYKGXINú9_YZKSú:XGJOTMúGTJú*K\KRUVSKTZú)R[Húíú<UR[SKú/
*KLOTOTMú_U[Xú:XGJOTMú8[RKYIn this system, we defined both long entries and short entries as well as exit orders. Again, the long and short entries reverse your position, whereas the exits will close out your existing position and exit you from the market. The entries and exits are described next.
2UTMú+TZXOKYa) If the fast-moving average (9 bars) crosses over the slow-moving average (18 bars), find the highest high price of the last 8 bars and multiply it by 1.03. This is the long entry price.
b) Once a cross over occurs, place a buy stop order at the long entry price and keep the order active for the 12 bars after the cross over. Buy a specified number of shares, in this case 300.
c) If the system is in a long position and exited by any of the exit rules, place a buy stop order at the highest high price of the last 10 bars and keep the order active for 15 bars after the exit.
9NUXZú+TZXOKYd) If the fast-moving average crosses under the slow-moving average, find the lowest low price of the last 8 bars and multiply it by .97. This is the short entry price.
e) Once the cross over occurs, place a sell stop order at the short entry price and keep the order active for the 12 bars after the cross over. Sell a specified number of shares, in this case 300.
f) If the system is in a short position and this position was covered (exited), place a sell stop order at the lowest low price of the last 10 bars and keep the order active for 15 bars after the exit.
+^OZYg) Exit from any long position if the lowest low price of the last 8 bars is reached.
h) Exit from any short position if the highest high price of the last 8 bars is reached.
i) Place a money management protective stop (stop loss), the dollar amount of which will depend on what and how many shares/contracts we’re trading .
*KYOMTOTMúôú,UXSGZZOTMThis section presents the EasyLanguage instructions and formatting for the system, with the EasyLanguage instructions broken down and explained line by line.
)NGVZKXúèúúúúúú:XKTJOTMú9_YZKSY 3U\OTMú'\KXGMKú)XUYYU\KXúúúúúúúúúúéå
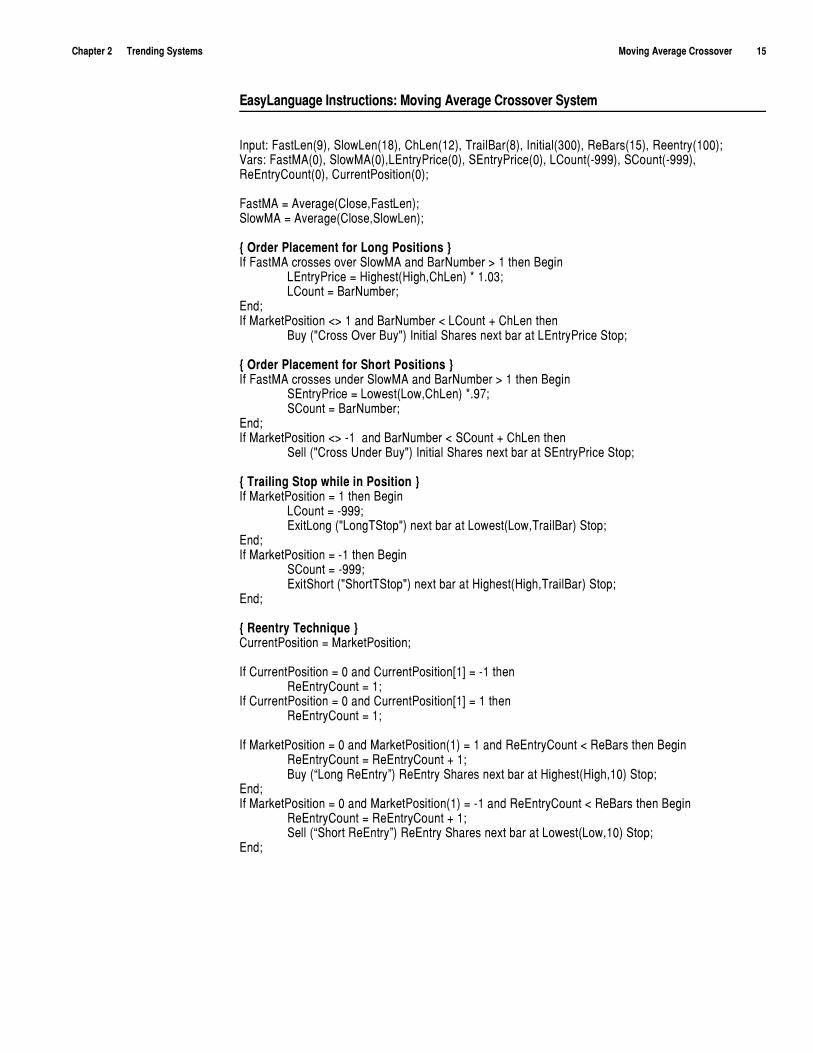
+GY_2GTM[GMKú/TYZX[IZOUTY ú3U\OTMú'\KXGMKú)XUYYU\KXú9_YZKS
/TV[Z ú,GYZ2KTòáñîú9RU]2KTòéâñîú)N2KTòéèñîú:XGOR(GXòâñîú/TOZOGRòçêêñîú8K(GXYòéåñîú8KKTZX_òéêêñ!<GXY ú,GYZ3'òêñîú9RU]3'òêñî2+TZX_6XOIKòêñîú9+TZX_6XOIKòêñîú2)U[TZòíáááñîú9)U[TZòíáááñîú8K+TZX_)U[TZòêñîú)[XXKTZ6UYOZOUTòêñ!
,GYZ3'ú#ú'\KXGMKò)RUYKî,GYZ2KTñ!9RU]3'ú#ú'\KXGMKò)RUYKî9RU]2KTñ!
aú5XJKXú6RGIKSKTZúLUXú2UTMú6UYOZOUTYúc/Lú,GYZ3'úIXUYYKYúU\KXú9RU]3'úGTJú(GX4[SHKXú$úéúZNKTú(KMOT
2+TZX_6XOIKú#ú.OMNKYZò.OMNî)N2KTñúðúéìêç!2)U[TZú#ú(GX4[SHKX!
+TJ!/Lú3GXQKZ6UYOZOUTú"$úéúGTJú(GX4[SHKXú"ú2)U[TZúïú)N2KTúZNKT
([_úòø)XUYYú5\KXú([_øñú/TOZOGRú9NGXKYúTK^ZúHGXúGZú2+TZX_6XOIKú9ZUV!
aú5XJKXú6RGIKSKTZúLUXú9NUXZú6UYOZOUTYúc/Lú,GYZ3'úIXUYYKYú[TJKXú9RU]3'úGTJú(GX4[SHKXú$úéúZNKTú(KMOT
9+TZX_6XOIKú#ú2U]KYZò2U]î)N2KTñúðìáã!9)U[TZú#ú(GX4[SHKX!
+TJ!/Lú3GXQKZ6UYOZOUTú"$úíéúúGTJú(GX4[SHKXú"ú9)U[TZúïú)N2KTúZNKT
9KRRúòø)XUYYú;TJKXú([_øñú/TOZOGRú9NGXKYúTK^ZúHGXúGZú9+TZX_6XOIKú9ZUV!
aú:XGOROTMú9ZUVú]NORKúOTú6UYOZOUTúc/Lú3GXQKZ6UYOZOUTú#úéúZNKTú(KMOT
2)U[TZú#úíááá!+^OZ2UTMúòø2UTM:9ZUVøñúTK^ZúHGXúGZú2U]KYZò2U]î:XGOR(GXñú9ZUV!
+TJ!/Lú3GXQKZ6UYOZOUTú#úíéúZNKTú(KMOT
9)U[TZú#úíááá!+^OZ9NUXZúòø9NUXZ:9ZUVøñúTK^ZúHGXúGZú.OMNKYZò.OMNî:XGOR(GXñú9ZUV!
+TJ!
aú8KKTZX_ú:KINTOW[Kúc)[XXKTZ6UYOZOUTú#ú3GXQKZ6UYOZOUT!ú
/Lú)[XXKTZ6UYOZOUTú#úêúGTJú)[XXKTZ6UYOZOUTAéCú#úíéúZNKTú8K+TZX_)U[TZú#úé!ú
/Lú)[XXKTZ6UYOZOUTú#úêúGTJú)[XXKTZ6UYOZOUTAéCú#úéúZNKT8K+TZX_)U[TZú#úé!
/Lú3GXQKZ6UYOZOUTú#úêúGTJú3GXQKZ6UYOZOUTòéñú#úéúGTJú8K+TZX_)U[TZú"ú8K(GXYúZNKTú(KMOT8K+TZX_)U[TZú#ú8K+TZX_)U[TZúïúé!([_úò¦2UTMú8K+TZX_§ñú8K+TZX_ú9NGXKYúTK^ZúHGXúGZú.OMNKYZò.OMNîéêñú9ZUV!
+TJ!/Lú3GXQKZ6UYOZOUTú#úêúGTJú3GXQKZ6UYOZOUTòéñú#úíéúGTJú8K+TZX_)U[TZú"ú8K(GXYúZNKTú(KMOT
8K+TZX_)U[TZú#ú8K+TZX_)U[TZúïúé!9KRRúò¦9NUXZú8K+TZX_§ñú8K+TZX_ú9NGXKYúTK^ZúHGXúGZú2U]KYZò2U]îéêñú9ZUV!
+TJ!
éäúúúúúúúúúú3U\OTMú'\KXGMKú)XUYYU\KXúúúúúúúúúú 5SKMGú8KYKGXINú9_YZKSú:XGJOTMúGTJú*K\KRUVSKTZú)R[Húíú<UR[SKú/
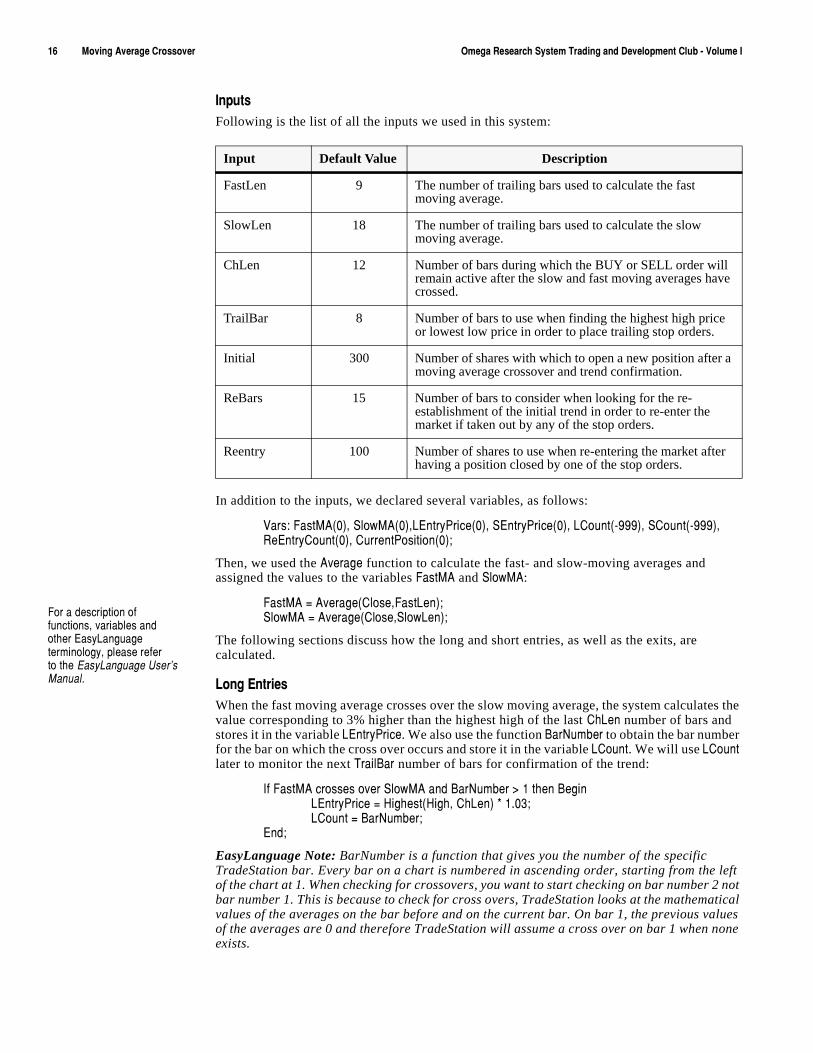
/TV[ZYFollowing is the list of all the inputs we used in this system:
In addition to the inputs, we declared several variables, as follows:
<GXY ú,GYZ3'òêñîú9RU]3'òêñî2+TZX_6XOIKòêñîú9+TZX_6XOIKòêñîú2)U[TZòíáááñîú9)U[TZòíáááñî8K+TZX_)U[TZòêñîú)[XXKTZ6UYOZOUTòêñ!
Then, we used the '\KXGMK function to calculate the fast- and slow-moving averages and assigned the values to the variables ,GYZ3' and 9RU]3':
,GYZ3'ú#ú'\KXGMKò)RUYKî,GYZ2KTñ!9RU]3'ú#ú'\KXGMKò)RUYKî9RU]2KTñ!
The following sections discuss how the long and short entries, as well as the exits, are calculated.
2UTMú+TZXOKYWhen the fast moving average crosses over the slow moving average, the system calculates the value corresponding to 3% higher than the highest high of the last )N2KT number of bars and stores it in the variable 2+TZX_6XOIK. We also use the function (GX4[SHKX to obtain the bar number for the bar on which the cross over occurs and store it in the variable 2)U[TZ. We will use 2)U[TZ later to monitor the next :XGOR(GX number of bars for confirmation of the trend:
/Lú,GYZ3'úIXUYYKYúU\KXú9RU]3'úGTJú(GX4[SHKXú$úéúZNKTú(KMOT2+TZX_6XOIKú#ú.OMNKYZò.OMNîú)N2KTñúðúéìêç!2)U[TZú#ú(GX4[SHKX!
+TJ!
EasyLanguage Note: BarNumber is a function that gives you the number of the specific TradeStation bar. Every bar on a chart is numbered in ascending order, starting from the left of the chart at 1. When checking for crossovers, you want to start checking on bar number 2 not bar number 1. This is because to check for cross overs, TradeStation looks at the mathematical values of the averages on the bar before and on the current bar. On bar 1, the previous values of the averages are 0 and therefore TradeStation will assume a cross over on bar 1 when none exists.
Input Default Value Description
FastLen 9 The number of trailing bars used to calculate the fast moving average.
SlowLen 18 The number of trailing bars used to calculate the slow moving average.
ChLen 12 Number of bars during which the BUY or SELL order will remain active after the slow and fast moving averages have crossed.
TrailBar 8 Number of bars to use when finding the highest high price or lowest low price in order to place trailing stop orders.
Initial 300 Number of shares with which to open a new position after a moving average crossover and trend confirmation.
ReBars 15 Number of bars to consider when looking for the re-establishment of the initial trend in order to re-enter the market if taken out by any of the stop orders.
Reentry 100 Number of shares to use when re-entering the market after having a position closed by one of the stop orders.
,UXúGúJKYIXOVZOUTúULúL[TIZOUTYîú\GXOGHRKYúGTJúUZNKXú+GY_2GTM[GMKúZKXSOTURUM_îúVRKGYKúXKLKXúZUúZNKú+GY_2GTM[GMKú;YKX©Yú3GT[GRìú
)NGVZKXúèúúúúúú:XKTJOTMú9_YZKSY 3U\OTMú'\KXGMKú)XUYYU\KXúúúúúúúúúúéã
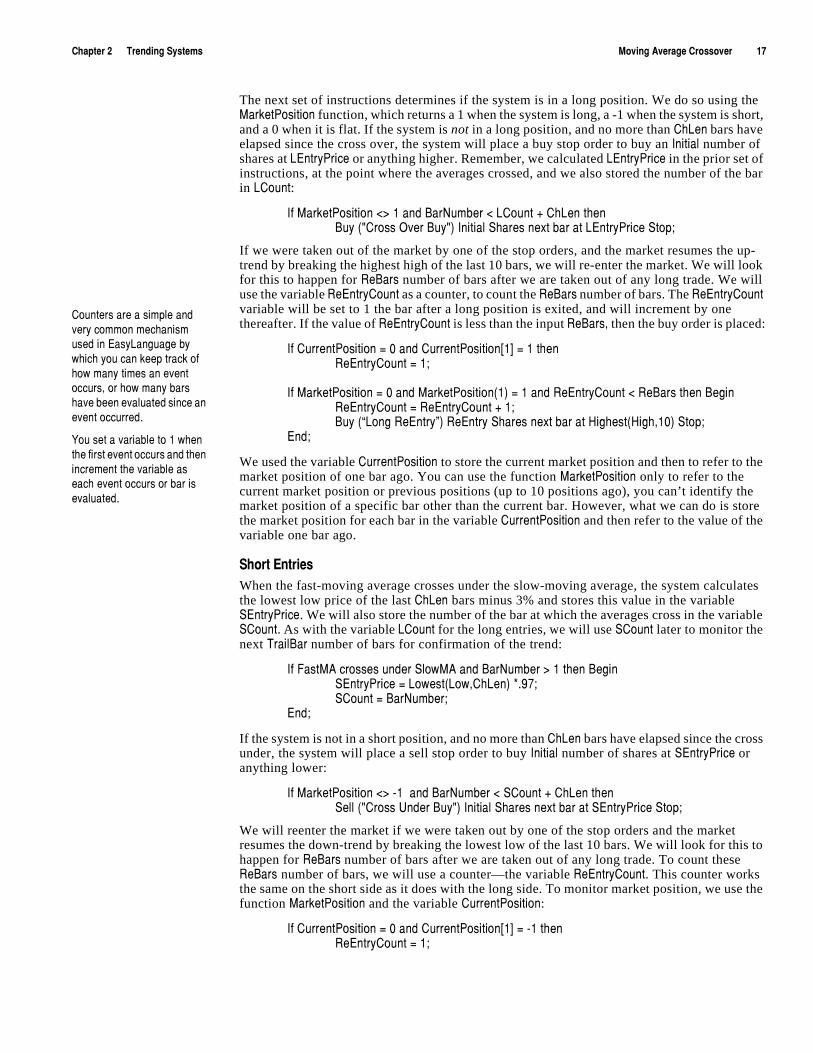
The next set of instructions determines if the system is in a long position. We do so using the 3GXQKZ6UYOZOUT function, which returns a 1 when the system is long, a -1 when the system is short, and a 0 when it is flat. If the system is not in a long position, and no more than )N2KT bars have elapsed since the cross over, the system will place a buy stop order to buy an /TOZOGR number of shares at 2+TZX_6XOIK or anything higher. Remember, we calculated 2+TZX_6XOIK in the prior set of instructions, at the point where the averages crossed, and we also stored the number of the bar in 2)U[TZ:
/Lú3GXQKZ6UYOZOUTú"$úéúGTJú(GX4[SHKXú"ú2)U[TZúïú)N2KTúZNKT([_úòø)XUYYú5\KXú([_øñú/TOZOGRú9NGXKYúTK^ZúHGXúGZú2+TZX_6XOIKú9ZUV!
If we were taken out of the market by one of the stop orders, and the market resumes the up-trend by breaking the highest high of the last 10 bars, we will re-enter the market. We will look for this to happen for 8K(GXY number of bars after we are taken out of any long trade. We will use the variable 8K+TZX_)U[TZ as a counter, to count the 8K(GXY number of bars. The 8K+TZX_)U[TZ variable will be set to 1 the bar after a long position is exited, and will increment by one thereafter. If the value of 8K+TZX_)U[TZ is less than the input 8K(GXYî then the buy order is placed:
/Lú)[XXKTZ6UYOZOUTú#úêúGTJú)[XXKTZ6UYOZOUTAéCú#úéúZNKT8K+TZX_)U[TZú#úé!
/Lú3GXQKZ6UYOZOUTú#úêúGTJú3GXQKZ6UYOZOUTòéñú#úéúGTJú8K+TZX_)U[TZú"ú8K(GXYúZNKTú(KMOT8K+TZX_)U[TZú#ú8K+TZX_)U[TZúïúé!([_úò¦2UTMú8K+TZX_§ñú8K+TZX_ú9NGXKYúTK^ZúHGXúGZú.OMNKYZò.OMNîéêñú9ZUV!
+TJ!
We used the variable )[XXKTZ6UYOZOUT to store the current market position and then to refer to the market position of one bar ago. You can use the function 3GXQKZ6UYOZOUT only to refer to the current market position or previous positions (up to 10 positions ago), you can’t identify the market position of a specific bar other than the current bar. However, what we can do is store the market position for each bar in the variable )[XXKTZ6UYOZOUT and then refer to the value of the variable one bar ago.
9NUXZú+TZXOKYWhen the fast-moving average crosses under the slow-moving average, the system calculates the lowest low price of the last )N2KT bars minus 3% and stores this value in the variable 9+TZX_6XOIK. We will also store the number of the bar at which the averages cross in the variable 9)U[TZìúAs with the variableú2)U[TZúfor the long entries,úwe will use 9)U[TZ later to monitor the next :XGOR(GX number of bars for confirmation of the trend:
/Lú,GYZ3'úIXUYYKYú[TJKXú9RU]3'úGTJú(GX4[SHKXú$úéúZNKTú(KMOT9+TZX_6XOIKú#ú2U]KYZò2U]î)N2KTñúðìáã!9)U[TZú#ú(GX4[SHKX!
+TJ!
If the system is not in a short position, and no more than )N2KT bars have elapsed since the cross under, the system will place a sell stop order to buy /TOZOGR number of shares at 9+TZX_6XOIK or anything lower:
/Lú3GXQKZ6UYOZOUTú"$úíéúúGTJú(GX4[SHKXú"ú9)U[TZúïú)N2KTúZNKT9KRRúòø)XUYYú;TJKXú([_øñú/TOZOGRú9NGXKYúTK^ZúHGXúGZú9+TZX_6XOIKú9ZUV!
We will reenter the market if we were taken out by one of the stop orders and the market resumes the down-trend by breaking the lowest low of the last 10 bars. We will look for this to happen for 8K(GXY number of bars after we are taken out of any long trade. To count these 8K(GXY number of bars, we will use a counter—the variable 8K+TZX_)U[TZ. This counter works the same on the short side as it does with the long side. To monitor market position, we use the function 3GXQKZ6UYOZOUT and the variable )[XXKTZ6UYOZOUT:
/Lú)[XXKTZ6UYOZOUTú#úêúGTJú)[XXKTZ6UYOZOUTAéCú#úíéúZNKTú8K+TZX_)U[TZú#úé!ú
)U[TZKXYúGXKúGúYOSVRKúGTJú\KX_úIUSSUTúSKINGTOYSú[YKJúOTú+GY_2GTM[GMKúH_ú]NOINú_U[úIGTúQKKVúZXGIQúULúNU]úSGT_úZOSKYúGTúK\KTZúUII[XYîúUXúNU]úSGT_úHGXYúNG\KúHKKTúK\GR[GZKJúYOTIKúGTúK\KTZúUII[XXKJìú
?U[úYKZúGú\GXOGHRKúZUúéú]NKTúZNKúLOXYZúK\KTZúUII[XYúGTJúZNKTúOTIXKSKTZúZNKú\GXOGHRKúGYúKGINúK\KTZúUII[XYúUXúHGXúOYúK\GR[GZKJì
éâúúúúúúúúúú3U\OTMú'\KXGMKú)XUYYU\KXúúúúúúúúúú 5SKMGú8KYKGXINú9_YZKSú:XGJOTMúGTJú*K\KRUVSKTZú)R[Húíú<UR[SKú/
/Lú3GXQKZ6UYOZOUTú#úêúGTJú3GXQKZ6UYOZOUTòéñú#úíéúGTJú8K+TZX_)U[TZú"ú8K(GXYúZNKTú(KMOT8K+TZX_)U[TZú#ú8K+TZX_)U[TZúïúé!9KRRúò¦9NUXZú8K+TZX_§ñú8K+TZX_ú9NGXKYúTK^ZúHGXúGZú2U]KYZò2U]îéêñú9ZUV!
+TJ!
+^OZú5XJKXYOnce the system is in a long position, it will place a trailing stop at the lowest low of :XGORHGX bars:
/Lú3GXQKZ6UYOZOUTú#úéúZNKTú(KMOT2)U[TZú#úíááá!+^OZ2UTMúòø2UTM:9ZUVøñúTK^ZúHGXúGZú2U]KYZò2U]î:XGOR(GXñú9ZUV!
+TJ!Notice that we set the variable 2)U[TZ to -999. This keeps the system from placing another buy order after the cross over. For example, let’s say the system generates a buy signal after a cross over and confirmation. Then on the 8th bar after the cross over an exit signal is generated by the trailing stop. At that point, 2)U[TZ would still be less than 12 and the system could generate another buy signal. We want to limit the system to generating one buy signal per cross over.
The inverse technique is used for short trades:
/Lú3GXQKZ6UYOZOUTú#úíéúZNKTú(KMOT9)U[TZú#úíááá!+^OZ9NUXZúòø9NUXZ:9ZUVøñúTK^ZúHGXúGZú.OMNKYZò.OMNî:XGOR(GXñú9ZUV!
+TJ!Note: As discussed in the next section, we set the system not to pyramid; however, the pyramid setting will not affect the above instructions. We have to use the variable to avoid another signal.
-KTKXGRú9_YZKSú,UXSGZWhen we apply this system to a chart, we use the options in the Format dialog box to format it as follows:
a) In the Costs tab, we entered the appropriate amounts for commission and slippage. We did not include margin because we designed this system for stocks, and we did not include a default number of contracts to trade per order because we are specifying this using the input /TOZOGR.
Note: Remember that commissions are calculated on a per contract/share basis. When you are trading stocks, you would enter the average commission you are charged divided by the number of shares the system is buying and selling. In this system, this is specified by the input /TOZOGR. If the system did not specify how many shares/contracts to handle per transaction, this would be determined by the Default Contracts option on this tab.
b) Under the Stops tab, we enabled a money management stop (the Money Mngmnt check box) and entered an appropriate dollar amount in the edit box. This option can hold the dollar amount per position or dollar amount per contract/share you want to risk before exiting out of the position.
Note: When you are trading stocks and you choose the stop to be tracked on a per share (contract) basis, you will type in the number of points you are willing to lose before you are exited out. When you are trading futures or any instrument that has a different dollar-point value, you would type the maximum number of dollars you are willing to risk per contract traded.
c) In the Properties tab, we selected the Do not allow multiple entries in same direction option. If the system is in a long position and market conditions generate another long entry order, the order is ignored. This is also the case when we’re in a short position and market conditions generate another short entry order.
)NGVZKXúèúúúúúú:XKTJOTMú9_YZKSY 3U\OTMú'\KXGMKú)XUYYU\KXúúúúúúúúúúéá
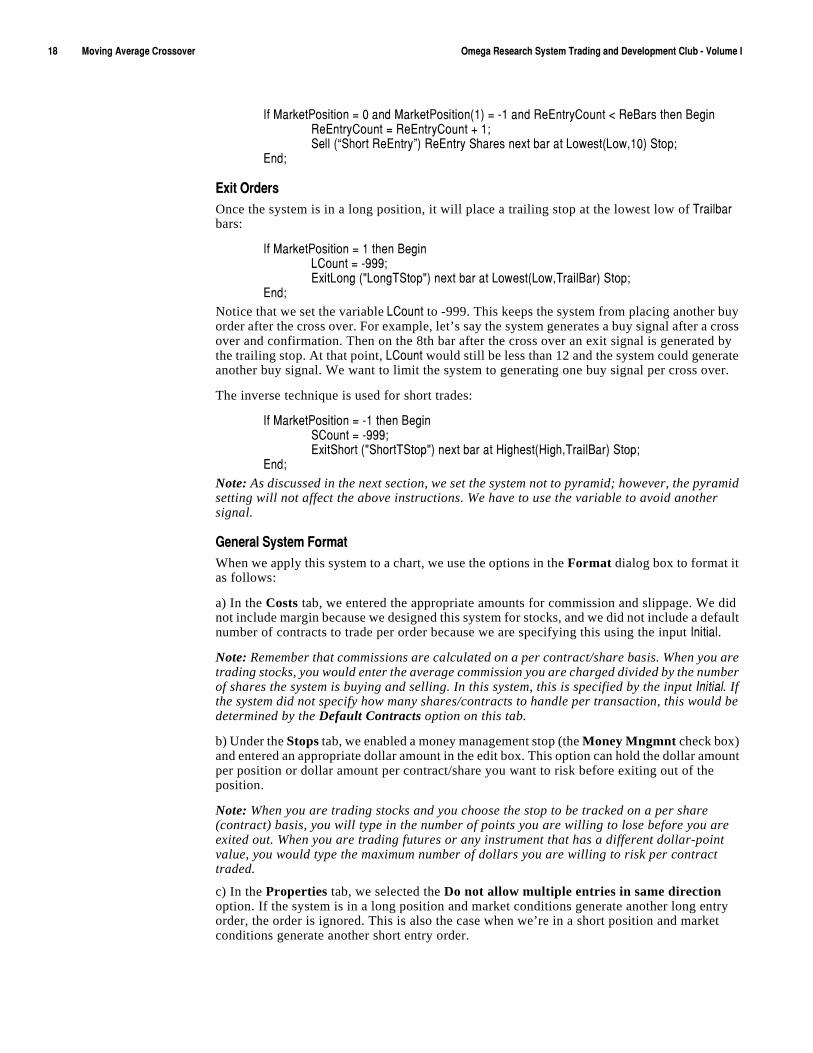
:KYZOTMúôú/SVXU\OTMWe applied the MACO system to a chart; the resulting System Report is shown in Figure 2-3.
Notice that the percentage of profitable trades is under 50 (46%), but the average wining trade is more than twice the average losing trade. Obviously, the higher the percent of profitable trades the better the system, but as we’ve discussed, trending systems by their nature have a large number of trades, a handful of which are highly profitable.
When evaluating your trending system, also look for big winning trades—the system should always be in the market whenever there is a sustained move in one direction.
You should always be concerned with the amount of data on which you back test your systems, and more so with the number of trades taken by the system throughout the tested data. Beware of trending systems that show few trades and the largest wining trade is close to the entire or a significant portion of the net profit.
There is no strict rule of thumb, but you should be happy with the net profits and with the average wining trade after excluding the largest wining trade. Also, always look at the maximum intra-day drawdown. It should not be significant compared to the net profits, and of course you should be able to afford it.
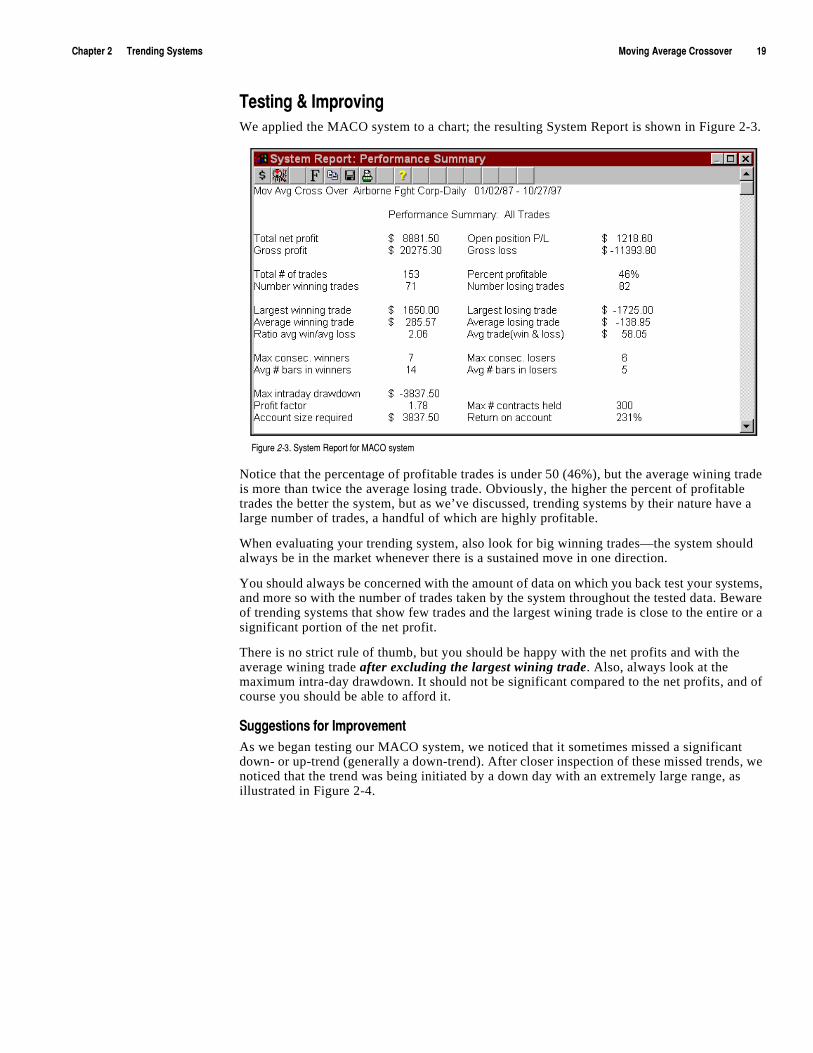
9[MMKYZOUTYúLUXú/SVXU\KSKTZAs we began testing our MACO system, we noticed that it sometimes missed a significant down- or up-trend (generally a down-trend). After closer inspection of these missed trends, we noticed that the trend was being initiated by a down day with an extremely large range, as illustrated in Figure 2-4.
,OM[XKúèíçìú9_YZKSú8KVUXZúLUXú3')5úY_YZKS
èêúúúúúúúúúú3U\OTMú'\KXGMKú)XUYYU\KXúúúúúúúúúú 5SKMGú8KYKGXINú9_YZKSú:XGJOTMúGTJú*K\KRUVSKTZú)R[Húíú<UR[SKú/
When the system looks for the lowest low of the last 10 bar, it includes this down bar and an order is not generated because the market was slowly down trending. To avoid this, when finding the sell price, we can find the lowest low price of )N2KT number of bars, but offset it by one, so the current bar is not included:
/Lú,GYZ3'úIXUYYKYú[TJKXú9RU]3'úGTJú(GX4[SHKXú$úéúZNKTú(KMOT9+TZX_6XOIKú#ú2U]KYZòú2U]úîú)N2KTúñAéCúðìáã!9)U[TZú#ú(GX4[SHKX!
+TJ!
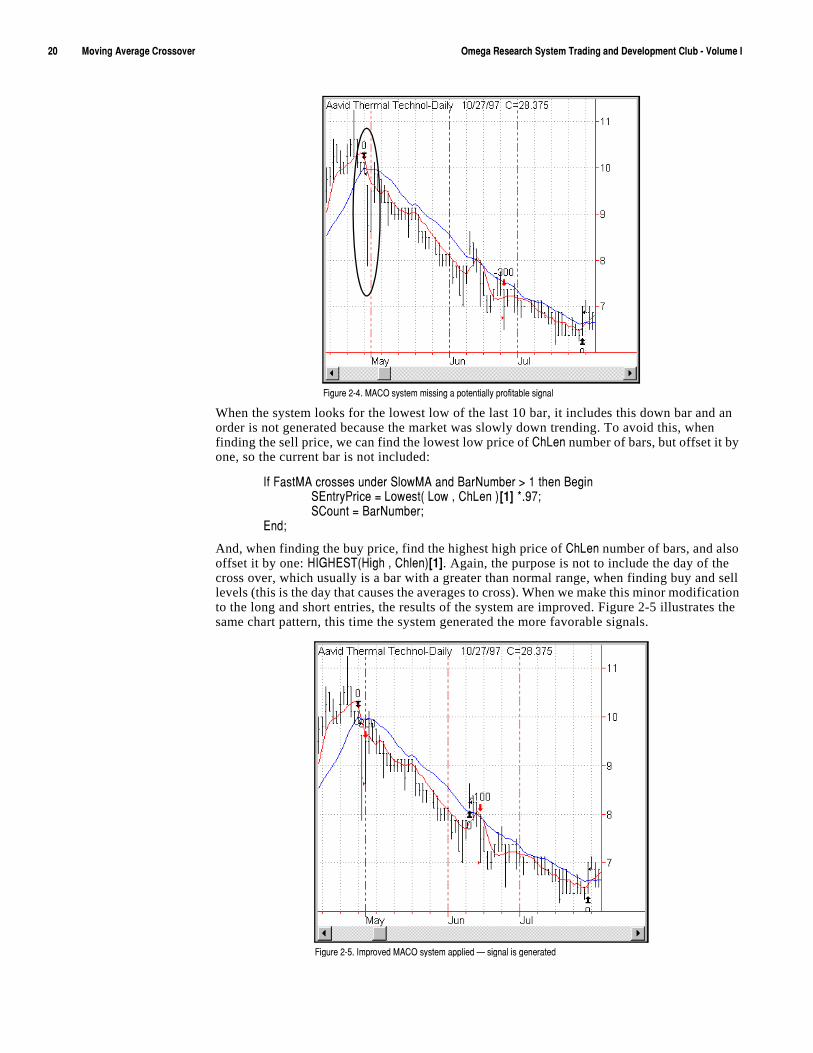
And, when finding the buy price, find the highest high price of )N2KT number of bars, and also offset it by one: ./-.+9:ò.OMNúîú)NRKTñAéC. Again, the purpose is not to include the day of the cross over, which usually is a bar with a greater than normal range, when finding buy and sell levels (this is the day that causes the averages to cross). When we make this minor modification to the long and short entries, the results of the system are improved. Figure 2-5 illustrates the same chart pattern, this time the system generated the more favorable signals.
,OM[XKúèíæìú3')5úY_YZKSúSOYYOTMúGúVUZKTZOGRR_úVXULOZGHRKúYOMTGR
,OM[XKúèíåìú/SVXU\KJú3')5úY_YZKSúGVVROKJú¥úYOMTGRúOYúMKTKXGZKJ
)NGVZKXúèúúúúúú:XKTJOTMú9_YZKSY 3U\OTMú'\KXGMKú)UT\KXMKTIKú*O\KXMKTIKúò3')*ñú(XKGQU[Zúúúúúúúúúúèé
Also, this system is somewhat active. To improve the performance, we may want to look for an additional filter to avoid trades when the market is moving sideways and is very volatile (high bar ranges).
One way we could do this is with directional indicators (like the ADX or the DMI) in combination with volatility measurements of the market. For example, when the directional indicators are indicating no trend and volatility is high, we might want to stay away from entry orders or move entry levels further away from the current market price.
3U\OTMú'\KXGMKú)UT\KXMKTIKú*O\KXMKTIKúò3')*ñú(XKGQU[ZAs we discussed, for the most part, markets tend to be choppy or move sideways, falling into up- or down-trends only about 15% of the time. Like the Moving Average Crossover system, this system, the Moving Average Convergence Divergence (MACD) Breakout attempts to determine when the market is starting to trend in order to take advantage of the trend.
However, instead of using fast- and slow-moving average cross overs to identify the possible beginning of a trend, this system creates a channel using a differential calculation of the Moving Average Convergence Divergence (MACD) and an exponential average of the MACD. Once a channel is established, the system looks for a break out of the upper band to establish a long position and a break out of the lower band to establish a short position.
To create the channel, the system monitors the MACD differential to determine when it crosses under or over zero (0). The system calculates the differential as follows:
3<GRú#ú3')*ò)RUYKî,GYZ3'î9RU]3'ñ!3'\Mú#ú>'\KXGMKò3')*ò)RUYKî,GYZ3'î9RU]3'ñî3GIJ3'ñ!3*OLú#ú3<GRúíú3'\M!
The first line calculates the MACD using the close price and two lengths (in this system we use 12 and 26). The second line calculates the exponential moving average of the MACD (in this system we use a length of 9). The third line subtracts the exponential average of the MACD form the MACD, resulting in the differential value we compare to zero (0).
Our idea is that when the MACD differential crosses under or over zero frequently, we consider the market to be in a sideways mode. This system looks at the last 50 bars and when it finds 4 cross overs and/or cross unders within the 50 bars, it uses the bars making up the cross overs and/or unders and establishes the channel.
The upper band, or buy level, is determined by finding the highest high of the last 4 cross overs or unders, and adding an extra measure. The extra measure is half of the 4-bar average of the true range. The lower band, or sell level, is determined in a similar way, finding the lowest low of the same 4 bars, and subtracting one half the 4-bar average of thetrue range. When the system finds the 4 cross overs and/or unders, it places buy and sell stops at the buy and sell levels, respectively. Then, when the price penetrates the buy level, a buy order is generated. Likewise, when the price penetrates the sell level, a sell order is generated.
Sometimes, we find it useful to create an indicator, ShowMe or PaintBar study to help visualize our idea. In fact, a lot of times we’ll create an indicator or study just to see (visually) if an entry idea has any merit before we consider creating a system with it. In this instance, we created an indicator with three plots, called MACD Breakout. The first plot paints a dot on the bars that cross under or over, and the other two plots draw the upper and lower bands.
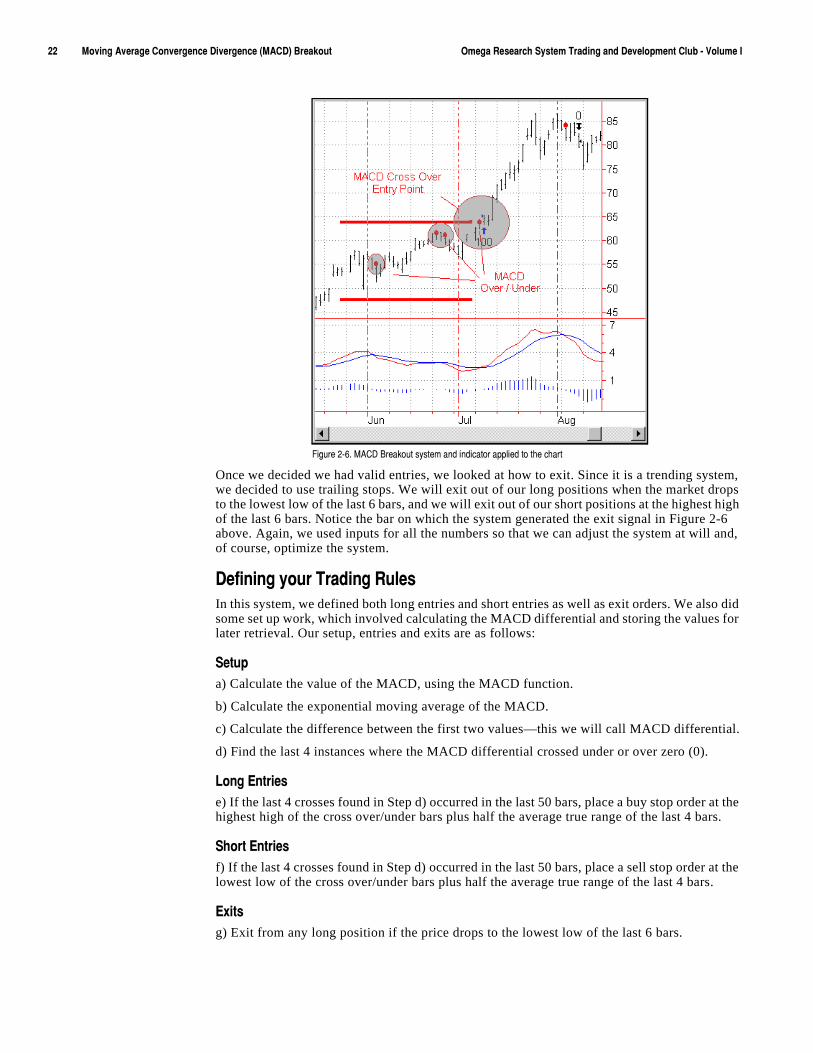
Figure 2-6 shows the system and the indicator we created applied to a chart. We also applied the standard MACD indicator (making sure to use the same inputs for both indicators). Notice that the system found 4 cross overs and/or unders within 50 bars and therefore placed buy stop and sell stop orders using the buy and sell levels. When the buy level was penetrated, the order was generated. The indicator shows the channel and cross over and/or under bars.
:NKú3')*ú/TJOIGZUXú]GYúJK\KRUVKJúH_ú-KXGRJú'VVKRîúGTJúOYúHUZNúGúZXKTJúLURRU]OTMúOTJOIGZUXúGTJúGTúUYIORRGZUXìú/ZúIGRI[RGZKYúSU\OTMúG\KXGMKYúZNGZúIGTúSUTOZUXúGTJúYOMTGRúZXKTJYîúGTJúOZúGRYUúNKRVYúYVUZúJO\KXMKTIKYúZNGZúGOJúOTúJKZKXSOTOTMú]NKTúGúZXKTJúOYúU\KXHU[MNZúUXúU\KXYURJìú
'YúYUUTúGYúæúIXUYYúU\KXYúUXúIXUYYú[TJKXYúGXKúLU[TJîúYKRRúYZUVúGTJúH[_úYZUVúUXJKXYúGXKúVRGIKJìú:NKYKúUXJKXYúYZG_úGIZO\KúGYúRUTMúGYúZNKXKúGXKúæúIXUYYúU\KXYúGTJëUXú[TJKXYú]OZNOTúZNKúRGYZúåêúHGXYìú
=NKXKúXGTMKúOYúZNKúJOLLKXKTIKúHKZ]KKTúZNKúNOMNúGTJúRU]úVXOIKYúULúGúHGXîúZX[KúXGTMKúZGQKYúOTZUúGIIU[TZúZNKúIRUYKúULúZNKúVXK\OU[YúHGXúGTJúXKVXKYKTZYúZNKúGIZ[GRúXGTMKúULúSU\KSKTZúLXUSúUTKúHGXúZUúZNKúTK^Zìú
èèúúúúúúúúúú3U\OTMú'\KXGMKú)UT\KXMKTIKú*O\KXMKTIKúò3')*ñú(XKGQU[Zúúúúúúúúúú 5SKMGú8KYKGXINú9_YZKSú:XGJOTMúGTJú*K\KRUVSKTZú)R[Húíú<UR[SKú/
Once we decided we had valid entries, we looked at how to exit. Since it is a trending system, we decided to use trailing stops. We will exit out of our long positions when the market drops to the lowest low of the last 6 bars, and we will exit out of our short positions at the highest high of the last 6 bars. Notice the bar on which the system generated the exit signal in Figure 2-6 above. Again, we used inputs for all the numbers so that we can adjust the system at will and, of course, optimize the system.
*KLOTOTMú_U[Xú:XGJOTMú8[RKYIn this system, we defined both long entries and short entries as well as exit orders. We also did some set up work, which involved calculating the MACD differential and storing the values for later retrieval. Our setup, entries and exits are as follows:
9KZ[Va) Calculate the value of the MACD, using the MACD function.
b) Calculate the exponential moving average of the MACD.
c) Calculate the difference between the first two values—this we will call MACD differential.
d) Find the last 4 instances where the MACD differential crossed under or over zero (0).
2UTMú+TZXOKYe) If the last 4 crosses found in Step d) occurred in the last 50 bars, place a buy stop order at the highest high of the cross over/under bars plus half the average true range of the last 4 bars.
9NUXZú+TZXOKYf) If the last 4 crosses found in Step d) occurred in the last 50 bars, place a sell stop order at the lowest low of the cross over/under bars plus half the average true range of the last 4 bars.
+^OZYg) Exit from any long position if the price drops to the lowest low of the last 6 bars.
,OM[XKúèíäìú3')*ú(XKGQU[ZúY_YZKSúGTJúOTJOIGZUXúGVVROKJúZUúZNKúINGXZú
)NGVZKXúèúúúúúú:XKTJOTMú9_YZKSY 3U\OTMú'\KXGMKú)UT\KXMKTIKú*O\KXMKTIKúò3')*ñú(XKGQU[Zúúúúúúúúúúèç
h) Exit from any short position if the price reaches the highest high of the last 6 bars.
*KYOMTOTMúôú,UXSGZZOTMThis section presents the EasyLanguage instructions and formatting for the system, with the EasyLanguage instructions broken down and explained line by line.
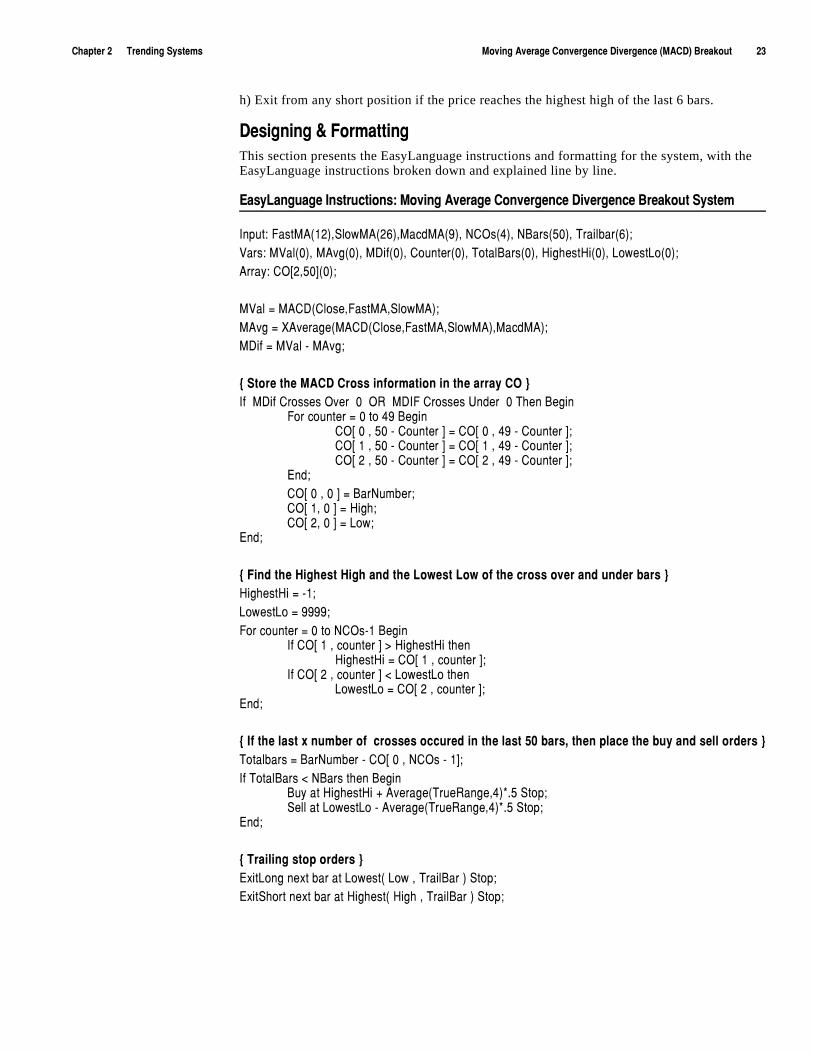
+GY_2GTM[GMKú/TYZX[IZOUTY ú3U\OTMú'\KXGMKú)UT\KXMKTIKú*O\KXMKTIKú(XKGQU[Zú9_YZKS
/TV[Z ú,GYZ3'òéèñî9RU]3'òèäñî3GIJ3'òáñîú4)5Yòæñîú4(GXYòåêñîú:XGORHGXòäñ!<GXY ú3<GRòêñîú3'\Mòêñîú3*OLòêñîú)U[TZKXòêñîú:UZGR(GXYòêñîú.OMNKYZ.Oòêñîú2U]KYZ2Uòêñ!'XXG_ ú)5AèîåêCòêñ!
3<GRú#ú3')*ò)RUYKî,GYZ3'î9RU]3'ñ!3'\Mú#ú>'\KXGMKò3')*ò)RUYKî,GYZ3'î9RU]3'ñî3GIJ3'ñ!3*OLú#ú3<GRúíú3'\M!
aú9ZUXKúZNKú3')*ú)XUYYúOTLUXSGZOUTúOTúZNKúGXXG_ú)5úc/Lúú3*OLú)XUYYKYú5\KXúúêúú58úú3*/,ú)XUYYKYú;TJKXúúêú:NKTú(KMOT
,UXúIU[TZKXú#úêúZUúæáú(KMOT)5Aúêúîúåêúíú)U[TZKXúCú#ú)5Aúêúîúæáúíú)U[TZKXúC!)5Aúéúîúåêúíú)U[TZKXúCú#ú)5Aúéúîúæáúíú)U[TZKXúC!)5Aúèúîúåêúíú)U[TZKXúCú#ú)5Aúèúîúæáúíú)U[TZKXúC!
+TJ!)5AúêúîúêúCú#ú(GX4[SHKX!)5AúéîúêúCú#ú.OMN!)5AúèîúêúCú#ú2U]!
+TJ!
aú,OTJúZNKú.OMNKYZú.OMNúGTJúZNKú2U]KYZú2U]úULúZNKúIXUYYúU\KXúGTJú[TJKXúHGXYúc.OMNKYZ.Oú#úíé!2U]KYZ2Uú#úáááá!,UXúIU[TZKXú#úêúZUú4)5Yíéú(KMOT
/Lú)5AúéúîúIU[TZKXúCú$ú.OMNKYZ.OúZNKT.OMNKYZ.Oú#ú)5AúéúîúIU[TZKXúC!
/Lú)5AúèúîúIU[TZKXúCú"ú2U]KYZ2UúZNKT2U]KYZ2Uú#ú)5AúèúîúIU[TZKXúC!
+TJ!
aú/LúZNKúRGYZú^úT[SHKXúULúúIXUYYKYúUII[XKJúOTúZNKúRGYZúåêúHGXYîúZNKTúVRGIKúZNKúH[_úGTJúYKRRúUXJKXYúc:UZGRHGXYú#ú(GX4[SHKXúíú)5Aúêúîú4)5YúíúéC!/Lú:UZGR(GXYú"ú4(GXYúZNKTú(KMOT
([_úGZú.OMNKYZ.Oúïú'\KXGMKò:X[K8GTMKîæñðìåú9ZUV!ú9KRRúGZú2U]KYZ2Uúíú'\KXGMKò:X[K8GTMKîæñðìåú9ZUV!
+TJ!
aú:XGOROTMúYZUVúUXJKXYúc+^OZ2UTMúTK^ZúHGXúGZú2U]KYZòú2U]úîú:XGOR(GXúñú9ZUV!+^OZ9NUXZúTK^ZúHGXúGZú.OMNKYZòú.OMNúîú:XGOR(GXúñú9ZUV!
èæúúúúúúúúúú3U\OTMú'\KXGMKú)UT\KXMKTIKú*O\KXMKTIKúò3')*ñú(XKGQU[Zúúúúúúúúúú 5SKMGú8KYKGXINú9_YZKSú:XGJOTMúGTJú*K\KRUVSKTZú)R[Húíú<UR[SKú/
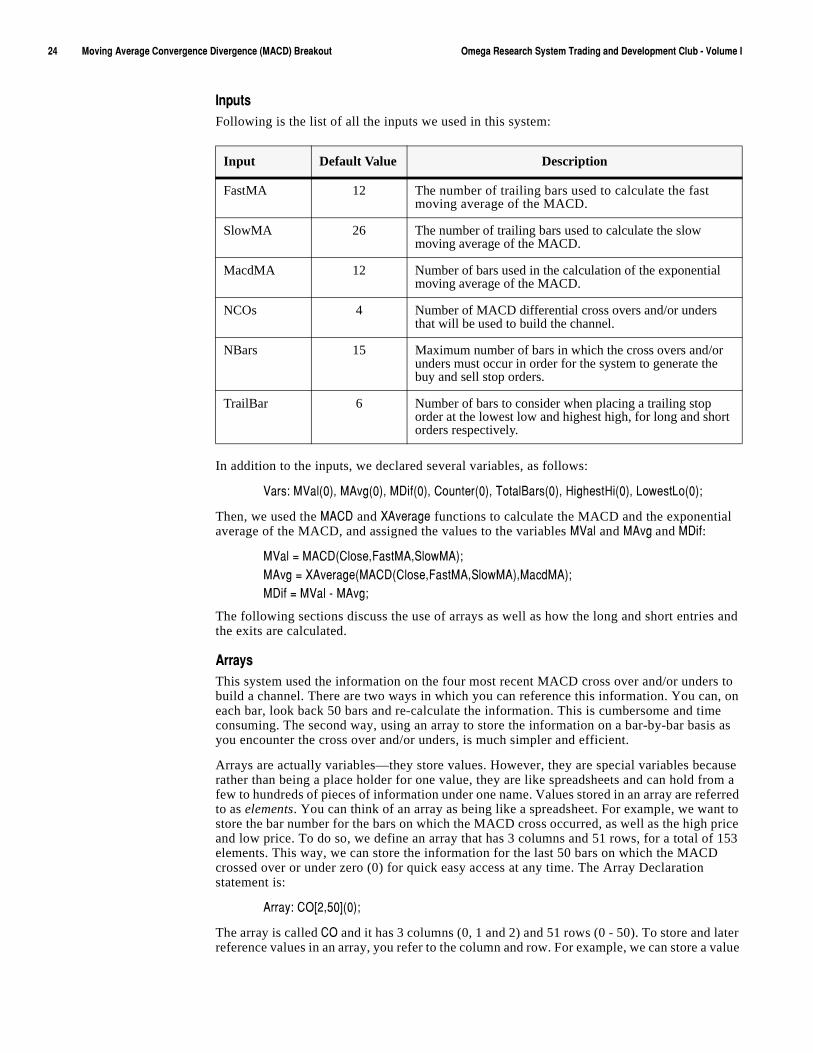
/TV[ZYFollowing is the list of all the inputs we used in this system:
In addition to the inputs, we declared several variables, as follows:
<GXY ú3<GRòêñîú3'\Mòêñîú3*OLòêñîú)U[TZKXòêñîú:UZGR(GXYòêñîú.OMNKYZ.Oòêñîú2U]KYZ2Uòêñ!
Then, we used the 3')* and >'\KXGMK functions to calculate the MACD and the exponential average of the MACD, and assigned the values to the variables 3<GR and 3'\Múandú3*OL:
3<GRú#ú3')*ò)RUYKî,GYZ3'î9RU]3'ñ!3'\Mú#ú>'\KXGMKò3')*ò)RUYKî,GYZ3'î9RU]3'ñî3GIJ3'ñ!3*OLú#ú3<GRúíú3'\M!
The following sections discuss the use of arrays as well as how the long and short entries and the exits are calculated.
'XXG_YThis system used the information on the four most recent MACD cross over and/or unders to build a channel. There are two ways in which you can reference this information. You can, on each bar, look back 50 bars and re-calculate the information. This is cumbersome and time consuming. The second way, using an array to store the information on a bar-by-bar basis as you encounter the cross over and/or unders, is much simpler and efficient.
Arrays are actually variables—they store values. However, they are special variables because rather than being a place holder for one value, they are like spreadsheets and can hold from a few to hundreds of pieces of information under one name. Values stored in an array are referred to as elements. You can think of an array as being like a spreadsheet. For example, we want to store the bar number for the bars on which the MACD cross occurred, as well as the high price and low price. To do so, we define an array that has 3 columns and 51 rows, for a total of 153 elements. This way, we can store the information for the last 50 bars on which the MACD crossed over or under zero (0) for quick easy access at any time. The Array Declaration statement is:
'XXG_ ú)5AèîåêCòêñ!
The array is called )5 and it has 3 columns (0, 1 and 2) and 51 rows (0 - 50). To store and later reference values in an array, you refer to the column and row. For example, we can store a value
Input Default Value Description
FastMA 12 The number of trailing bars used to calculate the fast moving average of the MACD.
SlowMA 26 The number of trailing bars used to calculate the slow moving average of the MACD.
MacdMA 12 Number of bars used in the calculation of the exponential moving average of the MACD.
NCOs 4 Number of MACD differential cross overs and/or unders that will be used to build the channel.
NBars 15 Maximum number of bars in which the cross overs and/or unders must occur in order for the system to generate the buy and sell stop orders.
TrailBar 6 Number of bars to consider when placing a trailing stop order at the lowest low and highest high, for long and short orders respectively.
)NGVZKXúèúúúúúú:XKTJOTMú9_YZKSY 3U\OTMú'\KXGMKú)UT\KXMKTIKú*O\KXMKTIKúò3')*ñú(XKGQU[Zúúúúúúúúúúèå
in )5AêîéC. To later retrieve this element, we reference the same array name and column and row numbers.
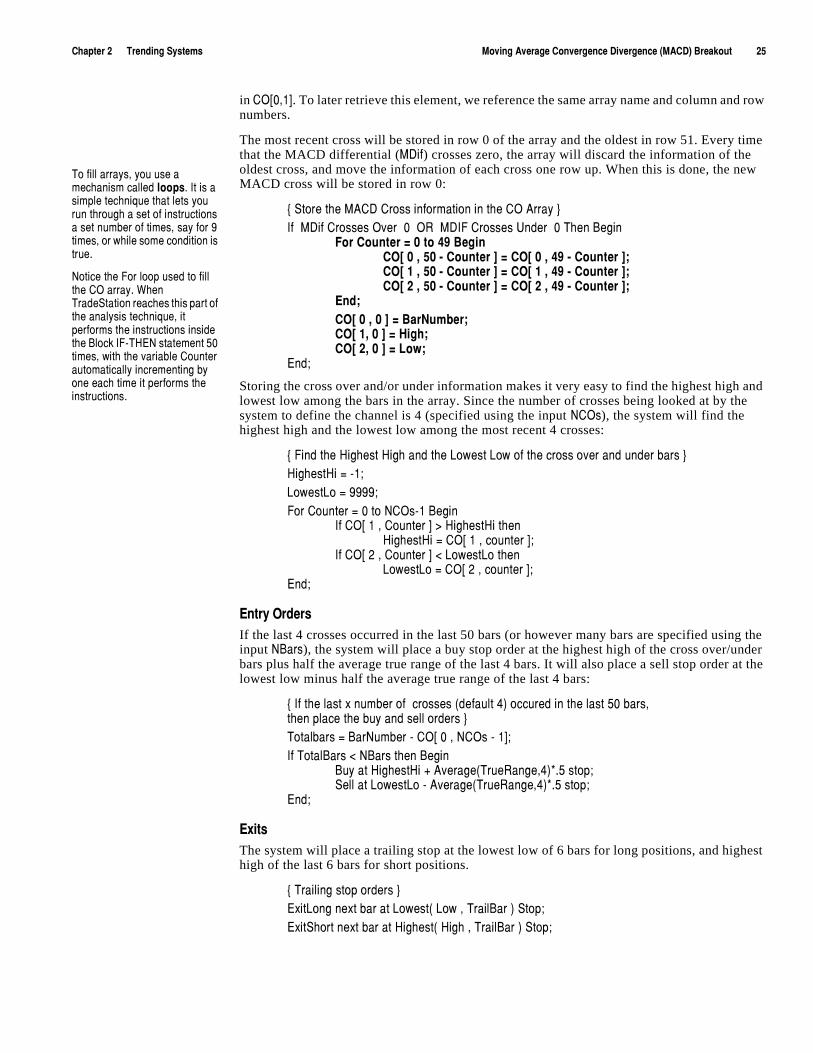
The most recent cross will be stored in row 0 of the array and the oldest in row 51. Every time that the MACD differential (3*OL) crosses zero, the array will discard the information of the oldest cross, and move the information of each cross one row up. When this is done, the new MACD cross will be stored in row 0:
aú9ZUXKúZNKú3')*ú)XUYYúOTLUXSGZOUTúOTúZNKú)5ú'XXG_úc/Lúú3*OLú)XUYYKYú5\KXúúêúú58úú3*/,ú)XUYYKYú;TJKXúúêú:NKTú(KMOT
,UXú)U[TZKXú#úêúZUúæáú(KMOT)5Aúêúîúåêúíú)U[TZKXúCú#ú)5Aúêúîúæáúíú)U[TZKXúC!)5Aúéúîúåêúíú)U[TZKXúCú#ú)5Aúéúîúæáúíú)U[TZKXúC!)5Aúèúîúåêúíú)U[TZKXúCú#ú)5Aúèúîúæáúíú)U[TZKXúC!
+TJ!)5AúêúîúêúCú#ú(GX4[SHKX!)5AúéîúêúCú#ú.OMN!)5AúèîúêúCú#ú2U]!
+TJ!
Storing the cross over and/or under information makes it very easy to find the highest high and lowest low among the bars in the array. Since the number of crosses being looked at by the system to define the channel is 4 (specified using the input 4)5Y), the system will find the highest high and the lowest low among the most recent 4 crosses:
aú,OTJúZNKú.OMNKYZú.OMNúGTJúZNKú2U]KYZú2U]úULúZNKúIXUYYúU\KXúGTJú[TJKXúHGXYúc.OMNKYZ.Oú#úíé!2U]KYZ2Uú#úáááá!,UXú)U[TZKXú#úêúZUú4)5Yíéú(KMOT
/Lú)5Aúéúîú)U[TZKXúCú$ú.OMNKYZ.OúZNKT.OMNKYZ.Oú#ú)5AúéúîúIU[TZKXúC!
/Lú)5Aúèúîú)U[TZKXúCú"ú2U]KYZ2UúZNKT2U]KYZ2Uú#ú)5AúèúîúIU[TZKXúC!
+TJ!
+TZX_ú5XJKXYIf the last 4 crosses occurred in the last 50 bars (or however many bars are specified using the input 4(GXY), the system will place a buy stop order at the highest high of the cross over/under bars plus half the average true range of the last 4 bars. It will also place a sell stop order at the lowest low minus half the average true range of the last 4 bars:
aú/LúZNKúRGYZú^úT[SHKXúULúúIXUYYKYúòJKLG[RZúæñúUII[XKJúOTúZNKúRGYZúåêúHGXYîúZNKTúVRGIKúZNKúH[_úGTJúYKRRúUXJKXYúc:UZGRHGXYú#ú(GX4[SHKXúíú)5Aúêúîú4)5YúíúéC!/Lú:UZGR(GXYú"ú4(GXYúZNKTú(KMOT
([_úGZú.OMNKYZ.Oúïú'\KXGMKò:X[K8GTMKîæñðìåúYZUV!ú9KRRúGZú2U]KYZ2Uúíú'\KXGMKò:X[K8GTMKîæñðìåúYZUV!
+TJ!
+^OZYThe system will place a trailing stop at the lowest low of 6 bars for long positions, and highest high of the last 6 bars for short positions.
aú:XGOROTMúYZUVúUXJKXYúc+^OZ2UTMúTK^ZúHGXúGZú2U]KYZòú2U]úîú:XGOR(GXúñú9ZUV!+^OZ9NUXZúTK^ZúHGXúGZú.OMNKYZòú.OMNúîú:XGOR(GXúñú9ZUV!
:UúLORRúGXXG_Yîú_U[ú[YKúGúSKINGTOYSúIGRRKJúRUUVYìú/ZúOYúGúYOSVRKúZKINTOW[KúZNGZúRKZYú_U[úX[TúZNXU[MNúGúYKZúULúOTYZX[IZOUTYúGúYKZúT[SHKXúULúZOSKYîúYG_úLUXúáúZOSKYîúUXú]NORKúYUSKúIUTJOZOUTúOYúZX[Kìú
4UZOIKúZNKú,UXúRUUVú[YKJúZUúLORRúZNKú)5úGXXG_ìú=NKTú:XGJK9ZGZOUTúXKGINKYúZNOYúVGXZúULúZNKúGTGR_YOYúZKINTOW[KîúOZúVKXLUXSYúZNKúOTYZX[IZOUTYúOTYOJKúZNKú(RUIQú/,í:.+4úYZGZKSKTZúåêúZOSKYîú]OZNúZNKú\GXOGHRKú)U[TZKXúG[ZUSGZOIGRR_úOTIXKSKTZOTMúH_úUTKúKGINúZOSKúOZúVKXLUXSYúZNKúOTYZX[IZOUTYìú
èäúúúúúúúúúú3U\OTMú'\KXGMKú)UT\KXMKTIKú*O\KXMKTIKúò3')*ñú(XKGQU[Zúúúúúúúúúú 5SKMGú8KYKGXINú9_YZKSú:XGJOTMúGTJú*K\KRUVSKTZú)R[Húíú<UR[SKú/
-KTKXGRú9_YZKSú,UXSGZWhen we apply this system to a chart, we use the options in the Format dialog box to format it as follows:
a) In the Costs tab, we entered the appropriate amounts for the default number of contracts to trade, commission and slippage. We did not include margin because we designed this system for stocks.
Note: Remember that commissions are calculated on a per contract/share basis. When you are trading stocks, you would enter the average commission you are charged divided by the number of shares the system is buying and selling. Unless specified within the system, this is determined by the Default Contracts option on this tab.
b) Under the Stops tab, we enabled a money management stop (the Money Mngmnt check box) and entered an appropriate dollar amount in the edit box. This option can hold the dollar amount per position or dollar amount per contract/share you want to risk before exiting out of the position.
Note: When you are trading stocks and you choose the stop to be tracked on a per share (contract) basis, you will type in the number of points you are willing to lose before you are exited out. When you are trading futures or any instrument that has a different dollar-point value, you would type the maximum number of dollars you are willing to risk per contract traded.
c) In the Properties tab, we selected the Do not allow multiple entries in same direction option. If the system is in a long position and market conditions generate another long entry order, the order is ignored. This is also the case when we’re in a short position and market conditions generate another short entry order.
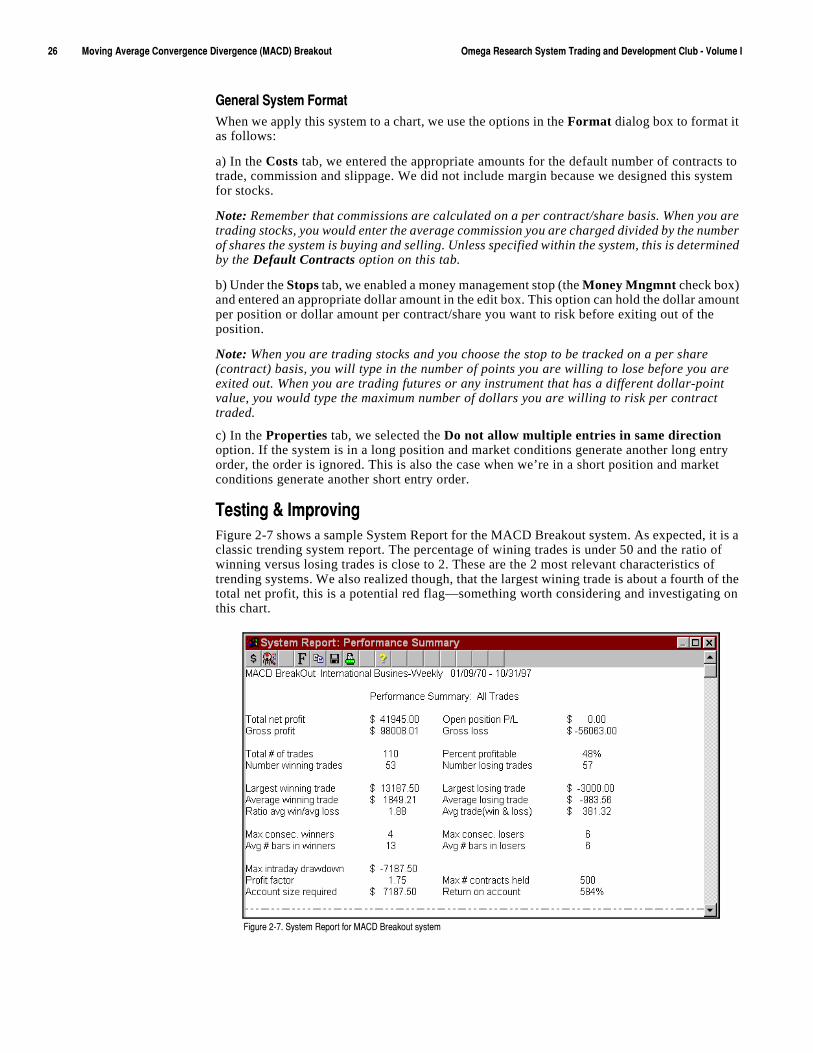
:KYZOTMúôú/SVXU\OTMFigure 2-7 shows a sample System Report for the MACD Breakout system. As expected, it is a classic trending system report. The percentage of wining trades is under 50 and the ratio of winning versus losing trades is close to 2. These are the 2 most relevant characteristics of trending systems. We also realized though, that the largest wining trade is about a fourth of the total net profit, this is a potential red flag—something worth considering and investigating on this chart.
,OM[XKúèíãìú9_YZKSú8KVUXZúLUXú3')*ú(XKGQU[ZúY_YZKS
)NGVZKXúèúúúúúú:XKTJOTMú9_YZKSY 3U\OTMú'\KXGMKú)UT\KXMKTIKú*O\KXMKTIKúò3')*ñú(XKGQU[Zúúúúúúúúúúèã
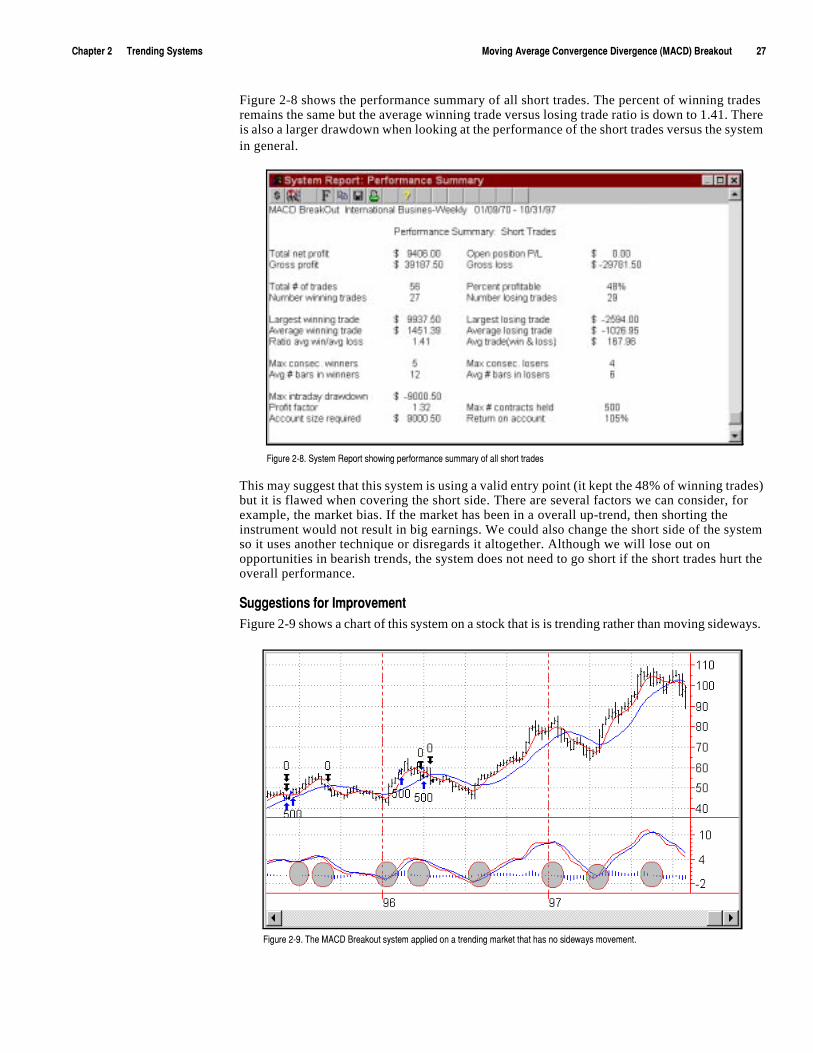
Figure 2-8 shows the performance summary of all short trades. The percent of winning trades remains the same but the average winning trade versus losing trade ratio is down to 1.41. There is also a larger drawdown when looking at the performance of the short trades versus the system in general.
This may suggest that this system is using a valid entry point (it kept the 48% of winning trades) but it is flawed when covering the short side. There are several factors we can consider, for example, the market bias. If the market has been in a overall up-trend, then shorting the instrument would not result in big earnings. We could also change the short side of the system so it uses another technique or disregards it altogether. Although we will lose out on opportunities in bearish trends, the system does not need to go short if the short trades hurt the overall performance.
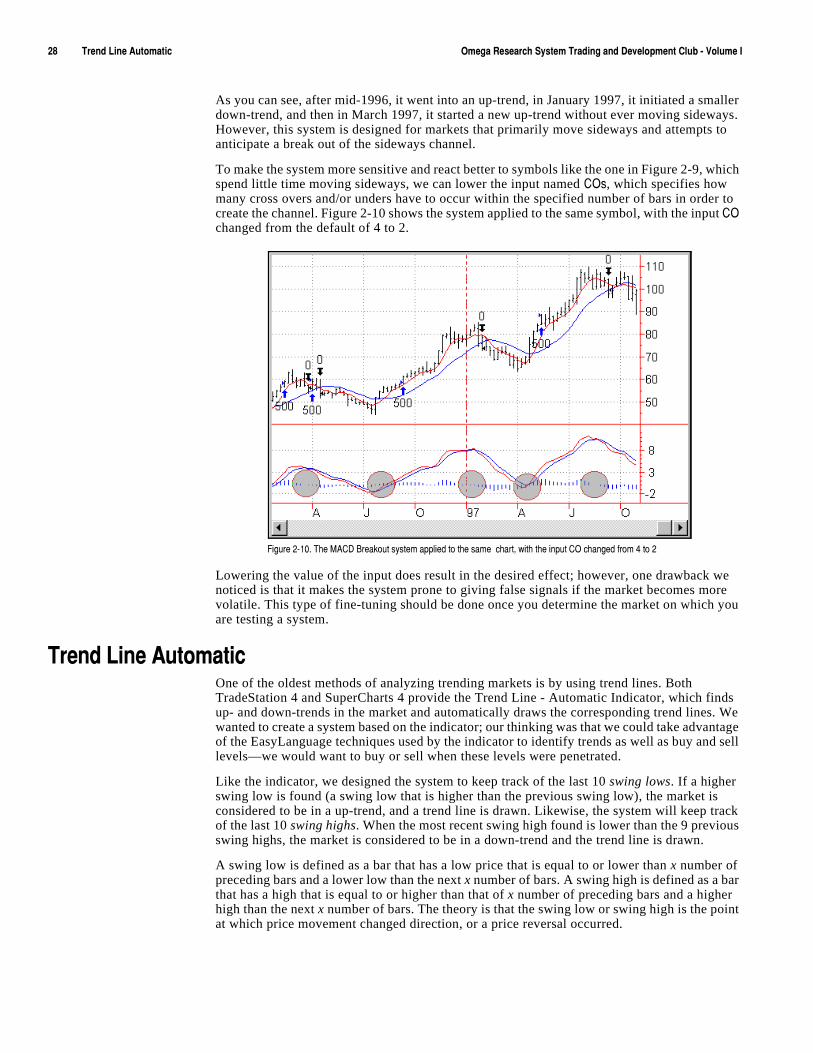
9[MMKYZOUTYúLUXú/SVXU\KSKTZFigure 2-9 shows a chart of this system on a stock that is is trending rather than moving sideways.
,OM[XKúèíâìú9_YZKSú8KVUXZúYNU]OTMúVKXLUXSGTIKúY[SSGX_úULúGRRúYNUXZúZXGJKY
,OM[XKúèíáìú:NKú3')*ú(XKGQU[ZúY_YZKSúGVVROKJúUTúGúZXKTJOTMúSGXQKZúZNGZúNGYúTUúYOJK]G_YúSU\KSKTZìú
èâúúúúúúúúúú:XKTJú2OTKú'[ZUSGZOIúúúúúúúúúú 5SKMGú8KYKGXINú9_YZKSú:XGJOTMúGTJú*K\KRUVSKTZú)R[Húíú<UR[SKú/
As you can see, after mid-1996, it went into an up-trend, in January 1997, it initiated a smaller down-trend, and then in March 1997, it started a new up-trend without ever moving sideways. However, this system is designed for markets that primarily move sideways and attempts to anticipate a break out of the sideways channel.
To make the system more sensitive and react better to symbols like the one in Figure 2-9, which spend little time moving sideways, we can lower the input named )5Y, which specifies how many cross overs and/or unders have to occur within the specified number of bars in order to create the channel. Figure 2-10 shows the system applied to the same symbol, with the input )5 changed from the default of 4 to 2.
Lowering the value of the input does result in the desired effect; however, one drawback we noticed is that it makes the system prone to giving false signals if the market becomes more volatile. This type of fine-tuning should be done once you determine the market on which you are testing a system.
:XKTJú2OTKú'[ZUSGZOIOne of the oldest methods of analyzing trending markets is by using trend lines. Both TradeStation 4 and SuperCharts 4 provide the Trend Line - Automatic Indicator, which finds up- and down-trends in the market and automatically draws the corresponding trend lines. We wanted to create a system based on the indicator; our thinking was that we could take advantage of the EasyLanguage techniques used by the indicator to identify trends as well as buy and sell levels—we would want to buy or sell when these levels were penetrated.
Like the indicator, we designed the system to keep track of the last 10 swing lows. If a higher swing low is found (a swing low that is higher than the previous swing low), the market is considered to be in a up-trend, and a trend line is drawn. Likewise, the system will keep track of the last 10 swing highs. When the most recent swing high found is lower than the 9 previous swing highs, the market is considered to be in a down-trend and the trend line is drawn.
A swing low is defined as a bar that has a low price that is equal to or lower than x number of preceding bars and a lower low than the next x number of bars. A swing high is defined as a bar that has a high that is equal to or higher than that of x number of preceding bars and a higher high than the next x number of bars. The theory is that the swing low or swing high is the point at which price movement changed direction, or a price reversal occurred.
,OM[XKúèíéêìú:NKú3')*ú(XKGQU[ZúY_YZKSúGVVROKJúZUúZNKúYGSKúúINGXZîú]OZNúZNKúOTV[Zú)5úINGTMKJúLXUSúæúZUúè
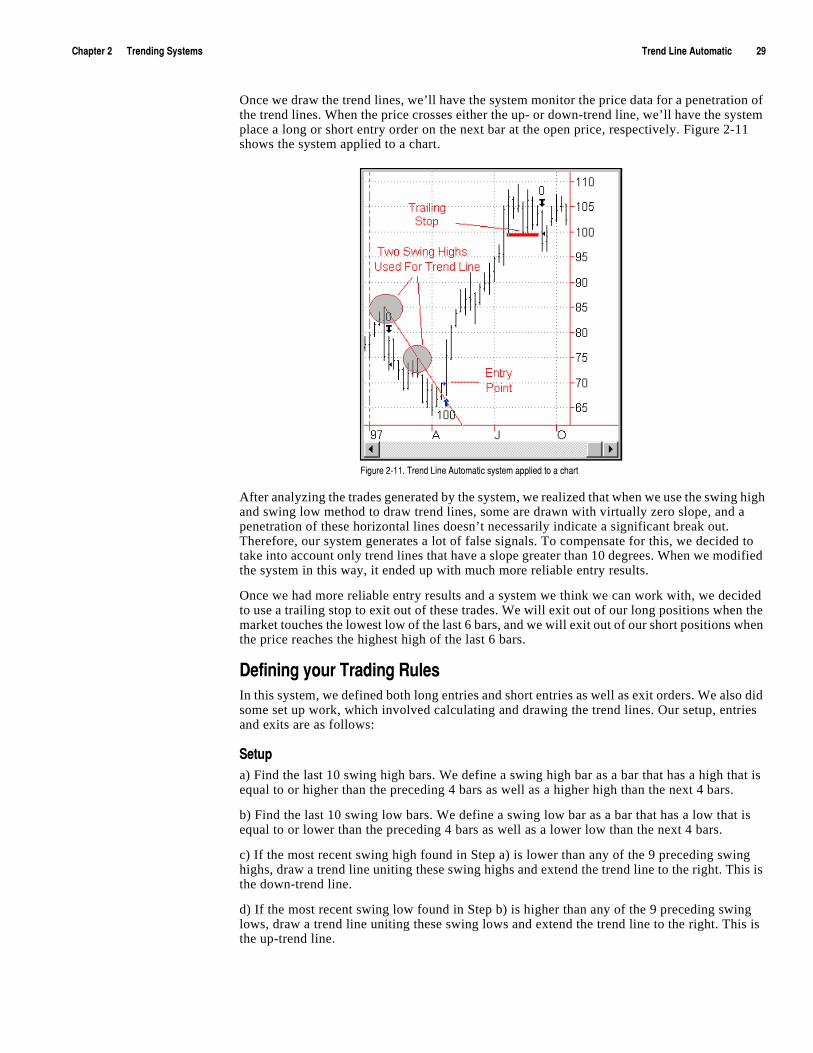
)NGVZKXúèúúúúúú:XKTJOTMú9_YZKSY :XKTJú2OTKú'[ZUSGZOIúúúúúúúúúúèá
Once we draw the trend lines, we’ll have the system monitor the price data for a penetration of the trend lines. When the price crosses either the up- or down-trend line, we’ll have the system place a long or short entry order on the next bar at the open price, respectively. Figure 2-11 shows the system applied to a chart.
After analyzing the trades generated by the system, we realized that when we use the swing high and swing low method to draw trend lines, some are drawn with virtually zero slope, and a penetration of these horizontal lines doesn’t necessarily indicate a significant break out. Therefore, our system generates a lot of false signals. To compensate for this, we decided to take into account only trend lines that have a slope greater than 10 degrees. When we modified the system in this way, it ended up with much more reliable entry results.
Once we had more reliable entry results and a system we think we can work with, we decided to use a trailing stop to exit out of these trades. We will exit out of our long positions when the market touches the lowest low of the last 6 bars, and we will exit out of our short positions when the price reaches the highest high of the last 6 bars.
*KLOTOTMú_U[Xú:XGJOTMú8[RKYIn this system, we defined both long entries and short entries as well as exit orders. We also did some set up work, which involved calculating and drawing the trend lines. Our setup, entries and exits are as follows:
9KZ[Va) Find the last 10 swing high bars. We define a swing high bar as a bar that has a high that is equal to or higher than the preceding 4 bars as well as a higher high than the next 4 bars.
b) Find the last 10 swing low bars. We define a swing low bar as a bar that has a low that is equal to or lower than the preceding 4 bars as well as a lower low than the next 4 bars.
c) If the most recent swing high found in Step a) is lower than any of the 9 preceding swing highs, draw a trend line uniting these swing highs and extend the trend line to the right. This is the down-trend line.
d) If the most recent swing low found in Step b) is higher than any of the 9 preceding swing lows, draw a trend line uniting these swing lows and extend the trend line to the right. This is the up-trend line.
,OM[XKúèíééìú:XKTJú2OTKú'[ZUSGZOIúY_YZKSúGVVROKJúZUúGúINGXZ
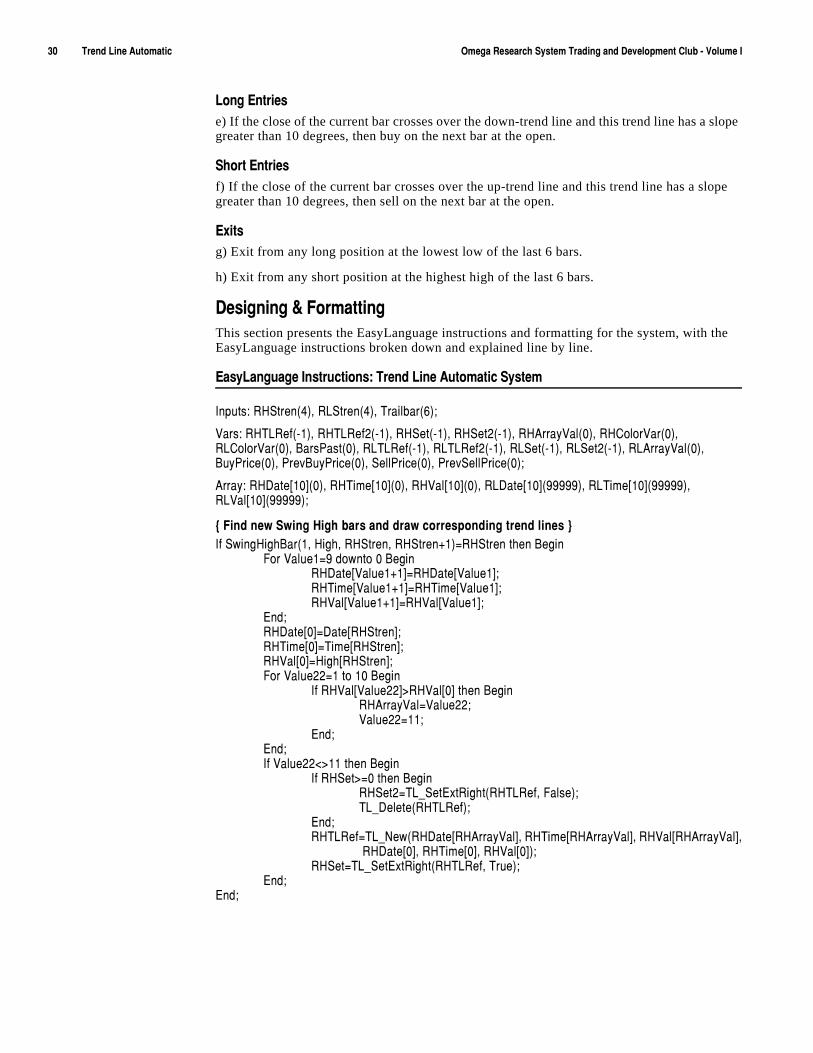
çêúúúúúúúúúú:XKTJú2OTKú'[ZUSGZOIúúúúúúúúúú 5SKMGú8KYKGXINú9_YZKSú:XGJOTMúGTJú*K\KRUVSKTZú)R[Húíú<UR[SKú/
2UTMú+TZXOKYe) If the close of the current bar crosses over the down-trend line and this trend line has a slope greater than 10 degrees, then buy on the next bar at the open.
9NUXZú+TZXOKYf) If the close of the current bar crosses over the up-trend line and this trend line has a slope greater than 10 degrees, then sell on the next bar at the open.
+^OZYg) Exit from any long position at the lowest low of the last 6 bars.
h) Exit from any short position at the highest high of the last 6 bars.
*KYOMTOTMúôú,UXSGZZOTMThis section presents the EasyLanguage instructions and formatting for the system, with the EasyLanguage instructions broken down and explained line by line.
+GY_2GTM[GMKú/TYZX[IZOUTY ú:XKTJú2OTKú'[ZUSGZOIú9_YZKS
/TV[ZY ú8.9ZXKTòæñîú829ZXKTòæñîú:XGORHGXòäñ!
<GXY ú8.:28KLòíéñîú8.:28KLèòíéñîú8.9KZòíéñîú8.9KZèòíéñîú8.'XXG_<GRòêñîú8.)URUX<GXòêñîú82)URUX<GXòêñîú(GXY6GYZòêñîú82:28KLòíéñîú82:28KLèòíéñîú829KZòíéñîú829KZèòíéñîú82'XXG_<GRòêñîú([_6XOIKòêñîú6XK\([_6XOIKòêñîú9KRR6XOIKòêñîú6XK\9KRR6XOIKòêñ!
'XXG_ ú8.*GZKAéêCòêñîú8.:OSKAéêCòêñîú8.<GRAéêCòêñîú82*GZKAéêCòáááááñîú82:OSKAéêCòáááááñîú82<GRAéêCòáááááñ!
aú,OTJúTK]ú9]OTMú.OMNúHGXYúGTJúJXG]úIUXXKYVUTJOTMúZXKTJúROTKYúc/Lú9]OTM.OMN(GXòéîú.OMNîú8.9ZXKTîú8.9ZXKTïéñ#8.9ZXKTúZNKTú(KMOT
,UXú<GR[Ké#áúJU]TZUúêú(KMOT8.*GZKA<GR[KéïéC#8.*GZKA<GR[KéC!8.:OSKA<GR[KéïéC#8.:OSKA<GR[KéC!8.<GRA<GR[KéïéC#8.<GRA<GR[KéC!
+TJ!8.*GZKAêC#*GZKA8.9ZXKTC!8.:OSKAêC#:OSKA8.9ZXKTC!8.<GRAêC#.OMNA8.9ZXKTC!,UXú<GR[Kèè#éúZUúéêú(KMOT
/Lú8.<GRA<GR[KèèC$8.<GRAêCúZNKTú(KMOT8.'XXG_<GR#<GR[Kèè!<GR[Kèè#éé!
+TJ!+TJ!/Lú<GR[Kèè"$ééúZNKTú(KMOT
/Lú8.9KZ$#êúZNKTú(KMOT8.9KZè#:2E9KZ+^Z8OMNZò8.:28KLîú,GRYKñ!:2E*KRKZKò8.:28KLñ!
+TJ!8.:28KL#:2E4K]ò8.*GZKA8.'XXG_<GRCîú8.:OSKA8.'XXG_<GRCîú8.<GRA8.'XXG_<GRCî
ú8.*GZKAêCîú8.:OSKAêCîú8.<GRAêCñ!8.9KZ#:2E9KZ+^Z8OMNZò8.:28KLîú:X[Kñ!
+TJ!+TJ!
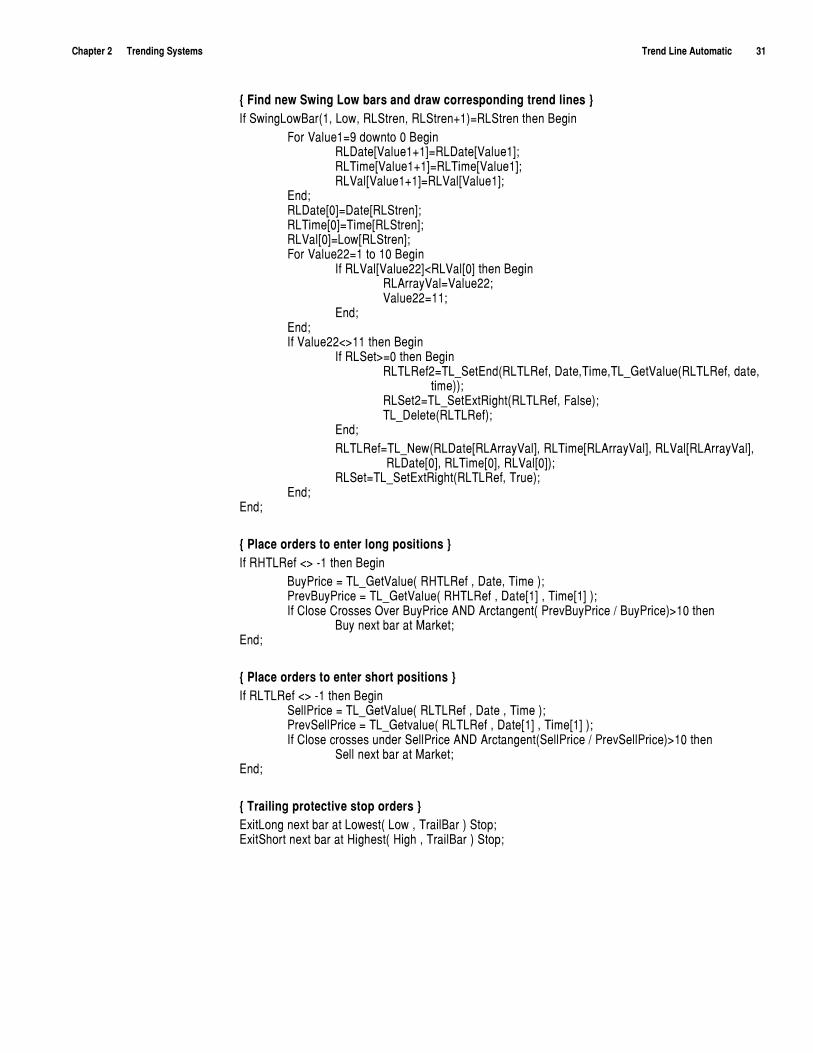
)NGVZKXúèúúúúúú:XKTJOTMú9_YZKSY :XKTJú2OTKú'[ZUSGZOIúúúúúúúúúúçé
aú,OTJúTK]ú9]OTMú2U]úHGXYúGTJúJXG]úIUXXKYVUTJOTMúZXKTJúROTKYúc/Lú9]OTM2U](GXòéîú2U]îú829ZXKTîú829ZXKTïéñ#829ZXKTúZNKTú(KMOT
,UXú<GR[Ké#áúJU]TZUúêú(KMOT82*GZKA<GR[KéïéC#82*GZKA<GR[KéC!82:OSKA<GR[KéïéC#82:OSKA<GR[KéC!82<GRA<GR[KéïéC#82<GRA<GR[KéC!
+TJ!82*GZKAêC#*GZKA829ZXKTC!82:OSKAêC#:OSKA829ZXKTC!82<GRAêC#2U]A829ZXKTC!,UXú<GR[Kèè#éúZUúéêú(KMOT
/Lú82<GRA<GR[KèèC"82<GRAêCúZNKTú(KMOT82'XXG_<GR#<GR[Kèè!<GR[Kèè#éé!
+TJ!+TJ!/Lú<GR[Kèè"$ééúZNKTú(KMOT
/Lú829KZ$#êúZNKTú(KMOT82:28KLè#:2E9KZ+TJò82:28KLîú*GZKî:OSKî:2E-KZ<GR[Kò82:28KLîúJGZKî
ú ZOSKññ!829KZè#:2E9KZ+^Z8OMNZò82:28KLîú,GRYKñ!:2E*KRKZKò82:28KLñ!
+TJ!82:28KL#:2E4K]ò82*GZKA82'XXG_<GRCîú82:OSKA82'XXG_<GRCîú82<GRA82'XXG_<GRCî
ú82*GZKAêCîú82:OSKAêCîú82<GRAêCñ!829KZ#:2E9KZ+^Z8OMNZò82:28KLîú:X[Kñ!
+TJ!+TJ!
aú6RGIKúUXJKXYúZUúKTZKXúRUTMúVUYOZOUTYúc/Lú8.:28KLú"$úíéúZNKTú(KMOT
([_6XOIKú#ú:2E-KZ<GR[Kòú8.:28KLúîú*GZKîú:OSKúñ!6XK\([_6XOIKú#ú:2E-KZ<GR[Kòú8.:28KLúîú*GZKAéCúîú:OSKAéCúñ!/Lú)RUYKú)XUYYKYú5\KXú([_6XOIKú'4*ú'XIZGTMKTZòú6XK\([_6XOIKúëú([_6XOIKñ$éêúZNKT
([_úTK^ZúHGXúGZú3GXQKZ!+TJ!
aú6RGIKúUXJKXYúZUúKTZKXúYNUXZúVUYOZOUTYúc/Lú82:28KLú"$úíéúZNKTú(KMOT
9KRR6XOIKú#ú:2E-KZ<GR[Kòú82:28KLúîú*GZKúîú:OSKúñ!6XK\9KRR6XOIKú#ú:2E-KZ\GR[Kòú82:28KLúîú*GZKAéCúîú:OSKAéCúñ!/Lú)RUYKúIXUYYKYú[TJKXú9KRR6XOIKú'4*ú'XIZGTMKTZò9KRR6XOIKúëú6XK\9KRR6XOIKñ$éêúZNKT
9KRRúTK^ZúHGXúGZú3GXQKZ!+TJ!ú
aú:XGOROTMúVXUZKIZO\KúYZUVúUXJKXYúc+^OZ2UTMúTK^ZúHGXúGZú2U]KYZòú2U]úîú:XGOR(GXúñú9ZUV!+^OZ9NUXZúTK^ZúHGXúGZú.OMNKYZòú.OMNúîú:XGOR(GXúñú9ZUV!
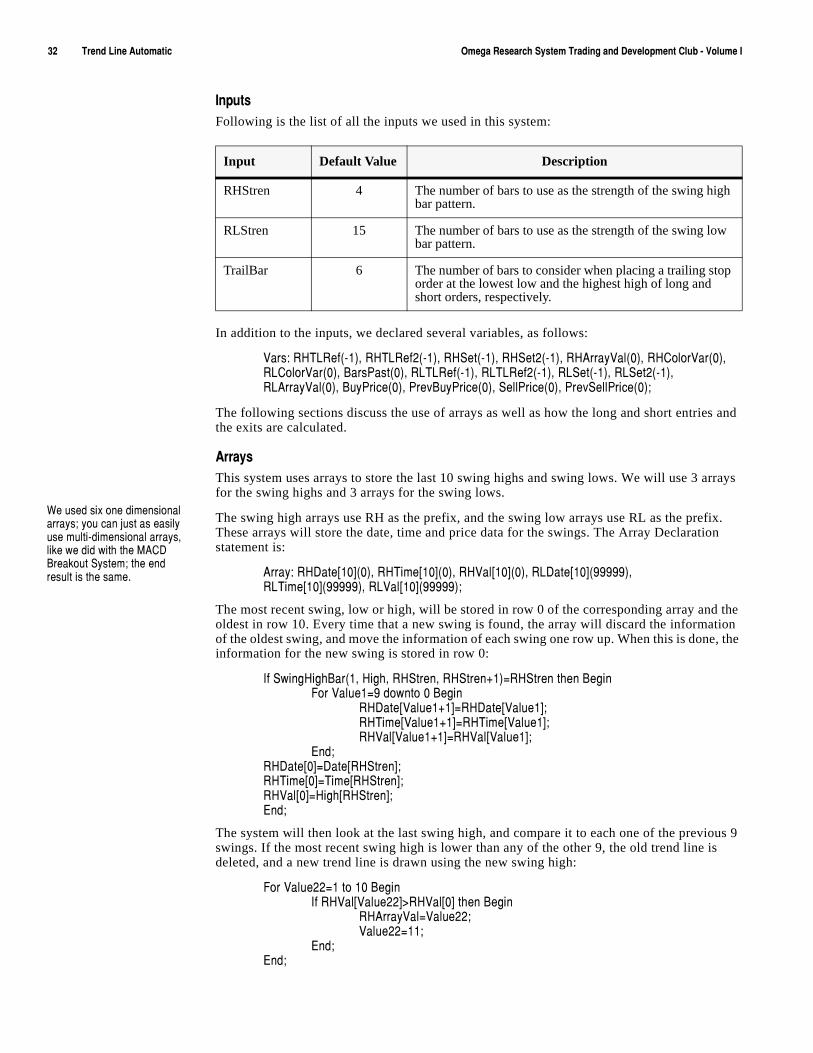
çèúúúúúúúúúú:XKTJú2OTKú'[ZUSGZOIúúúúúúúúúú 5SKMGú8KYKGXINú9_YZKSú:XGJOTMúGTJú*K\KRUVSKTZú)R[Húíú<UR[SKú/
/TV[ZYFollowing is the list of all the inputs we used in this system:
In addition to the inputs, we declared several variables, as follows:
<GXY ú8.:28KLòíéñîú8.:28KLèòíéñîú8.9KZòíéñîú8.9KZèòíéñîú8.'XXG_<GRòêñîú8.)URUX<GXòêñîú 82)URUX<GXòêñîú(GXY6GYZòêñîú82:28KLòíéñîú82:28KLèòíéñîú829KZòíéñîú829KZèòíéñîú
82'XXG_<GRòêñîú([_6XOIKòêñîú6XK\([_6XOIKòêñîú9KRR6XOIKòêñîú6XK\9KRR6XOIKòêñ!
The following sections discuss the use of arrays as well as how the long and short entries and the exits are calculated.
'XXG_YThis system uses arrays to store the last 10 swing highs and swing lows. We will use 3 arrays for the swing highs and 3 arrays for the swing lows.
The swing high arrays use RH as the prefix, and the swing low arrays use RL as the prefix. These arrays will store the date, time and price data for the swings. The Array Declaration statement is:
'XXG_ ú8.*GZKAéêCòêñîú8.:OSKAéêCòêñîú8.<GRAéêCòêñîú82*GZKAéêCòáááááñîú82:OSKAéêCòáááááñîú82<GRAéêCòáááááñ!
The most recent swing, low or high, will be stored in row 0 of the corresponding array and the oldest in row 10. Every time that a new swing is found, the array will discard the information of the oldest swing, and move the information of each swing one row up. When this is done, the information for the new swing is stored in row 0:
/Lú9]OTM.OMN(GXòéîú.OMNîú8.9ZXKTîú8.9ZXKTïéñ#8.9ZXKTúZNKTú(KMOT,UXú<GR[Ké#áúJU]TZUúêú(KMOT
8.*GZKA<GR[KéïéC#8.*GZKA<GR[KéC!8.:OSKA<GR[KéïéC#8.:OSKA<GR[KéC!8.<GRA<GR[KéïéC#8.<GRA<GR[KéC!
+TJ!8.*GZKAêC#*GZKA8.9ZXKTC!8.:OSKAêC#:OSKA8.9ZXKTC!8.<GRAêC#.OMNA8.9ZXKTC!+TJ!
The system will then look at the last swing high, and compare it to each one of the previous 9 swings. If the most recent swing high is lower than any of the other 9, the old trend line is deleted, and a new trend line is drawn using the new swing high:
,UXú<GR[Kèè#éúZUúéêú(KMOT/Lú8.<GRA<GR[KèèC$8.<GRAêCúZNKTú(KMOT
8.'XXG_<GR#<GR[Kèè!<GR[Kèè#éé!
+TJ!+TJ!
Input Default Value Description
RHStren 4 The number of bars to use as the strength of the swing high bar pattern.
RLStren 15 The number of bars to use as the strength of the swing low bar pattern.
TrailBar 6 The number of bars to consider when placing a trailing stop order at the lowest low and the highest high of long and short orders, respectively.
=Kú[YKJúYO^úUTKúJOSKTYOUTGRúGXXG_Y!ú_U[úIGTúP[YZúGYúKGYOR_ú[YKúS[RZOíJOSKTYOUTGRúGXXG_YîúROQKú]KúJOJú]OZNúZNKú3')*ú(XKGQU[Zú9_YZKS!úZNKúKTJúXKY[RZúOYúZNKúYGSKìú
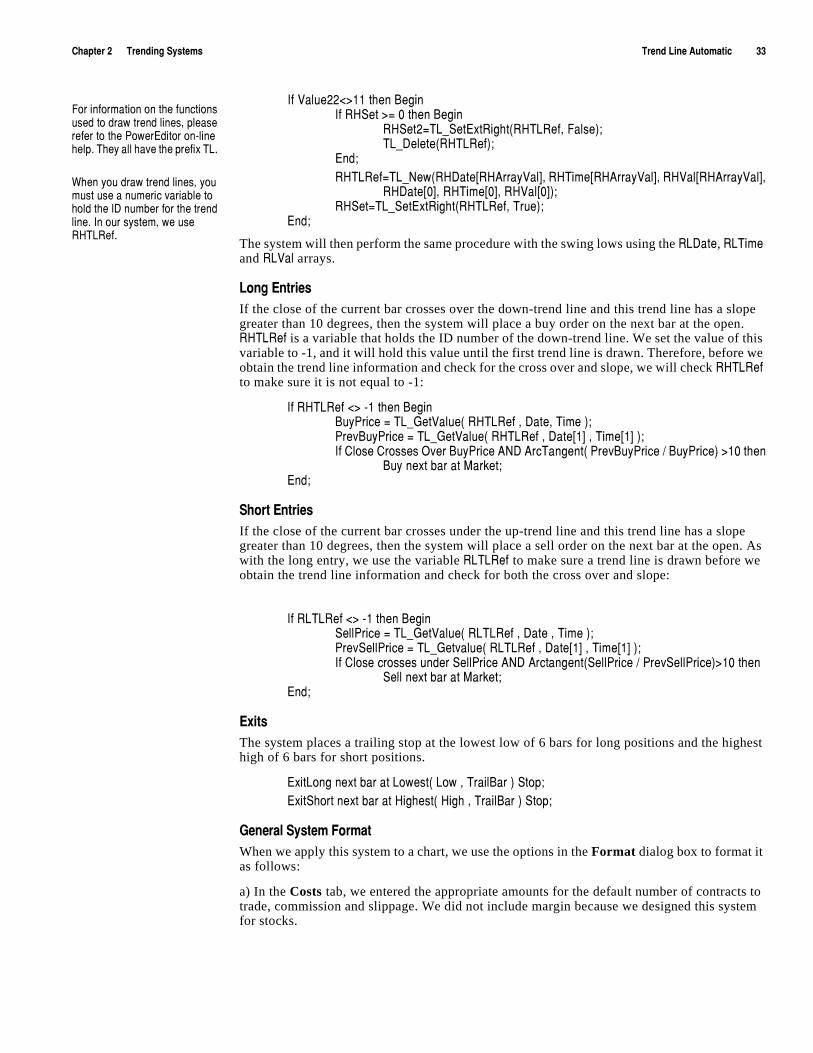
)NGVZKXúèúúúúúú:XKTJOTMú9_YZKSY :XKTJú2OTKú'[ZUSGZOIúúúúúúúúúúçç
/Lú<GR[Kèè"$ééúZNKTú(KMOT/Lú8.9KZú$#úêúZNKTú(KMOT
8.9KZè#:2E9KZ+^Z8OMNZò8.:28KLîú,GRYKñ!:2E*KRKZKò8.:28KLñ!
+TJ!8.:28KL#:2E4K]ò8.*GZKA8.'XXG_<GRCîú8.:OSKA8.'XXG_<GRCîú8.<GRA8.'XXG_<GRCî
8.*GZKAêCîú8.:OSKAêCîú8.<GRAêCñ!8.9KZ#:2E9KZ+^Z8OMNZò8.:28KLîú:X[Kñ!
+TJ!
The system will then perform the same procedure with the swing lows using the 82*GZK, 82:OSK and 82<GR arrays.
2UTMú+TZXOKYIf the close of the current bar crosses over the down-trend line and this trend line has a slope greater than 10 degrees, then the system will place a buy order on the next bar at the open. 8.:28KL is a variable that holds the ID number of the down-trend line. We set the value of this variable to -1, and it will hold this value until the first trend line is drawn. Therefore, before we obtain the trend line information and check for the cross over and slope, we will check 8.:28KL to make sure it is not equal to -1:
/Lú8.:28KLú"$úíéúZNKTú(KMOT([_6XOIKú#ú:2E-KZ<GR[Kòú8.:28KLúîú*GZKîú:OSKúñ!6XK\([_6XOIKú#ú:2E-KZ<GR[Kòú8.:28KLúîú*GZKAéCúîú:OSKAéCúñ!/Lú)RUYKú)XUYYKYú5\KXú([_6XOIKú'4*ú'XI:GTMKTZòú6XK\([_6XOIKúëú([_6XOIKñú$éêúZNKT
([_úTK^ZúHGXúGZú3GXQKZ!+TJ!
9NUXZú+TZXOKYIf the close of the current bar crosses under the up-trend line and this trend line has a slope greater than 10 degrees, then the system will place a sell order on the next bar at the open. As with the long entry, we use the variable 82:28KL to make sure a trend line is drawn before we obtain the trend line information and check for both the cross over and slope:
/Lú82:28KLú"$úíéúZNKTú(KMOT9KRR6XOIKú#ú:2E-KZ<GR[Kòú82:28KLúîú*GZKúîú:OSKúñ!6XK\9KRR6XOIKú#ú:2E-KZ\GR[Kòú82:28KLúîú*GZKAéCúîú:OSKAéCúñ!/Lú)RUYKúIXUYYKYú[TJKXú9KRR6XOIKú'4*ú'XIZGTMKTZò9KRR6XOIKúëú6XK\9KRR6XOIKñ$éêúZNKT
9KRRúTK^ZúHGXúGZú3GXQKZ!+TJ!ú
+^OZYThe system places a trailing stop at the lowest low of 6 bars for long positions and the highest high of 6 bars for short positions.
+^OZ2UTMúTK^ZúHGXúGZú2U]KYZòú2U]úîú:XGOR(GXúñú9ZUV!+^OZ9NUXZúTK^ZúHGXúGZú.OMNKYZòú.OMNúîú:XGOR(GXúñú9ZUV!
-KTKXGRú9_YZKSú,UXSGZWhen we apply this system to a chart, we use the options in the Format dialog box to format it as follows:
a) In the Costs tab, we entered the appropriate amounts for the default number of contracts to trade, commission and slippage. We did not include margin because we designed this system for stocks.
,UXúOTLUXSGZOUTúUTúZNKúL[TIZOUTYú[YKJúZUúJXG]úZXKTJúROTKYîúVRKGYKúXKLKXúZUúZNKú6U]KX+JOZUXúUTíROTKúNKRVìú:NK_úGRRúNG\KúZNKúVXKLO^ú:2ìú
=NKTú_U[úJXG]úZXKTJúROTKYîú_U[úS[YZú[YKúGúT[SKXOIú\GXOGHRKúZUúNURJúZNKú/*úT[SHKXúLUXúZNKúZXKTJúROTKìú/TúU[XúY_YZKSîú]Kú[YKú8.:28KLìú
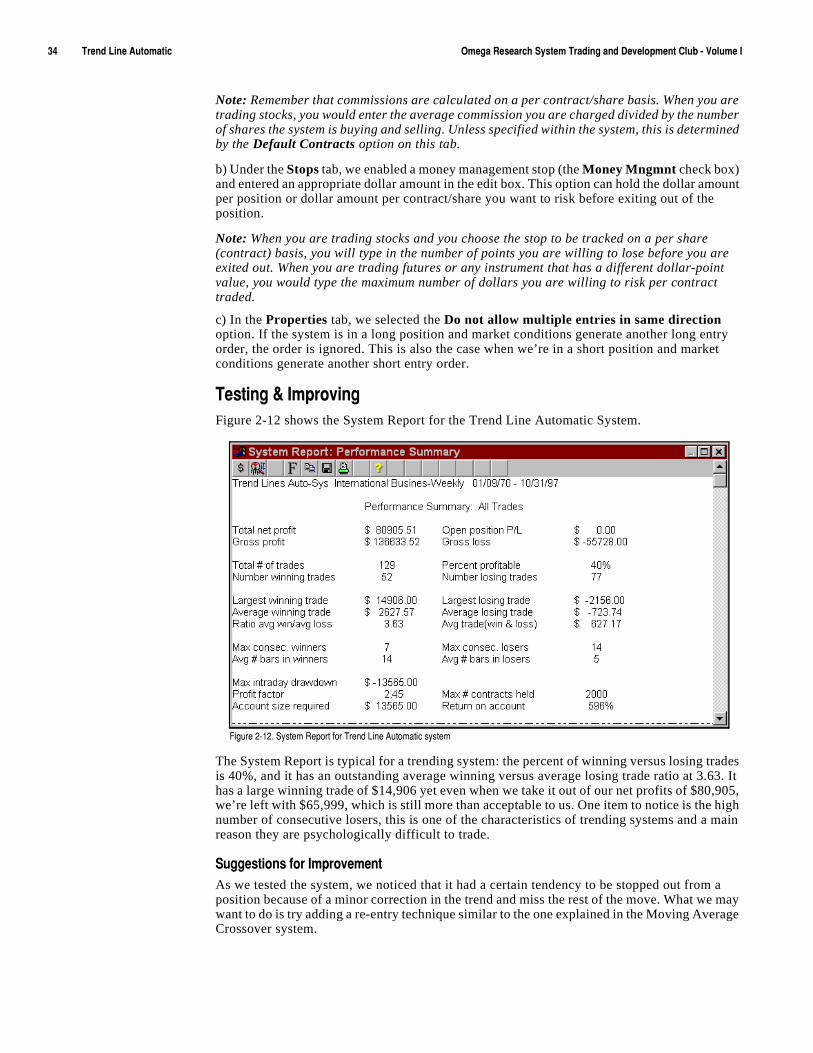
çæúúúúúúúúúú:XKTJú2OTKú'[ZUSGZOIúúúúúúúúúú 5SKMGú8KYKGXINú9_YZKSú:XGJOTMúGTJú*K\KRUVSKTZú)R[Húíú<UR[SKú/
Note: Remember that commissions are calculated on a per contract/share basis. When you are trading stocks, you would enter the average commission you are charged divided by the number of shares the system is buying and selling. Unless specified within the system, this is determined by the Default Contracts option on this tab.
b) Under the Stops tab, we enabled a money management stop (the Money Mngmnt check box) and entered an appropriate dollar amount in the edit box. This option can hold the dollar amount per position or dollar amount per contract/share you want to risk before exiting out of the position.
Note: When you are trading stocks and you choose the stop to be tracked on a per share (contract) basis, you will type in the number of points you are willing to lose before you are exited out. When you are trading futures or any instrument that has a different dollar-point value, you would type the maximum number of dollars you are willing to risk per contract traded.
c) In the Properties tab, we selected the Do not allow multiple entries in same direction option. If the system is in a long position and market conditions generate another long entry order, the order is ignored. This is also the case when we’re in a short position and market conditions generate another short entry order.
:KYZOTMúôú/SVXU\OTMFigure 2-12 shows the System Report for the Trend Line Automatic System.
The System Report is typical for a trending system: the percent of winning versus losing trades is 40%, and it has an outstanding average winning versus average losing trade ratio at 3.63. It has a large winning trade of $14,906 yet even when we take it out of our net profits of $80,905, we’re left with $65,999, which is still more than acceptable to us. One item to notice is the high number of consecutive losers, this is one of the characteristics of trending systems and a main reason they are psychologically difficult to trade.
9[MMKYZOUTYúLUXú/SVXU\KSKTZAs we tested the system, we noticed that it had a certain tendency to be stopped out from a position because of a minor correction in the trend and miss the rest of the move. What we may want to do is try adding a re-entry technique similar to the one explained in the Moving Average Crossover system.
,OM[XKúèíéèìú9_YZKSú8KVUXZúLUXú:XKTJú2OTKú'[ZUSGZOIúY_YZKS
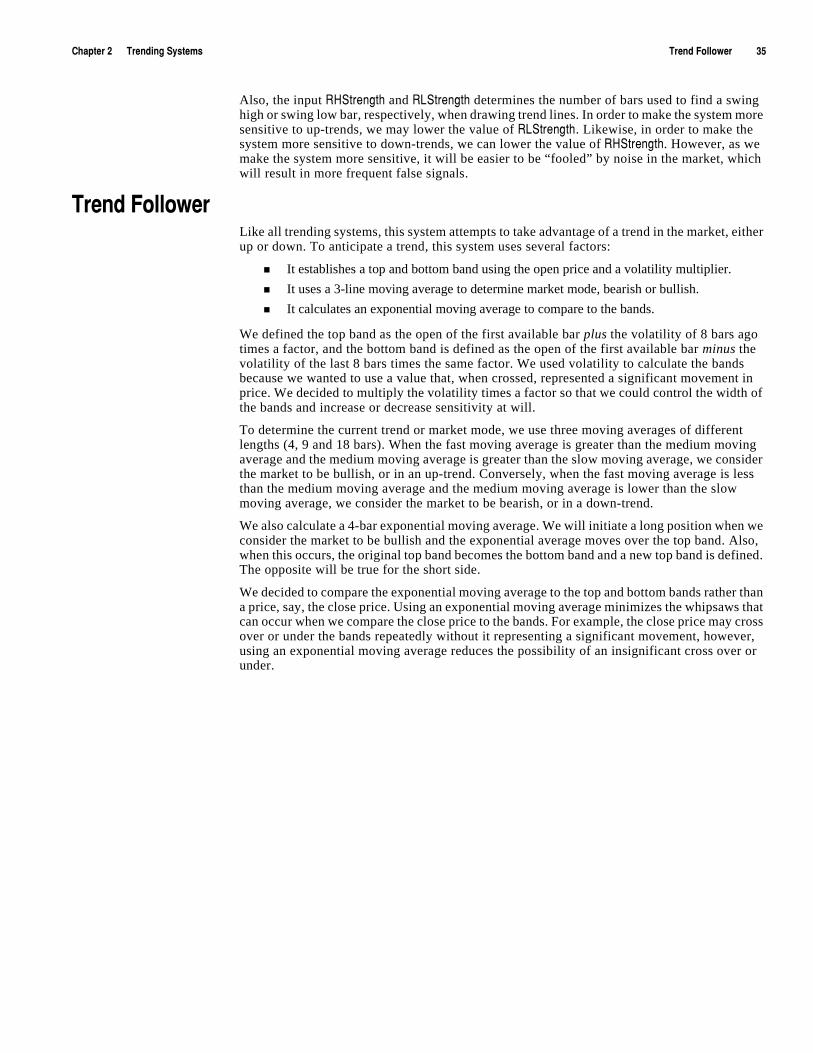
)NGVZKXúèúúúúúú:XKTJOTMú9_YZKSY :XKTJú,URRU]KXúúúúúúúúúúçå
Also, the input 8.9ZXKTMZN and 829ZXKTMZN determines the number of bars used to find a swing high or swing low bar, respectively, when drawing trend lines. In order to make the system more sensitive to up-trends, we may lower the value of 829ZXKTMZN. Likewise, in order to make the system more sensitive to down-trends, we can lower the value of 8.9ZXKTMZN. However, as we make the system more sensitive, it will be easier to be “fooled” by noise in the market, which will result in more frequent false signals.
:XKTJú,URRU]KXLike all trending systems, this system attempts to take advantage of a trend in the market, either up or down. To anticipate a trend, this system uses several factors:
� It establishes a top and bottom band using the open price and a volatility multiplier.
� It uses a 3-line moving average to determine market mode, bearish or bullish.
� It calculates an exponential moving average to compare to the bands.
We defined the top band as the open of the first available bar plus the volatility of 8 bars ago times a factor, and the bottom band is defined as the open of the first available bar minus the volatility of the last 8 bars times the same factor. We used volatility to calculate the bands because we wanted to use a value that, when crossed, represented a significant movement in price. We decided to multiply the volatility times a factor so that we could control the width of the bands and increase or decrease sensitivity at will.
To determine the current trend or market mode, we use three moving averages of different lengths (4, 9 and 18 bars). When the fast moving average is greater than the medium moving average and the medium moving average is greater than the slow moving average, we consider the market to be bullish, or in an up-trend. Conversely, when the fast moving average is less than the medium moving average and the medium moving average is lower than the slow moving average, we consider the market to be bearish, or in a down-trend.
We also calculate a 4-bar exponential moving average. We will initiate a long position when we consider the market to be bullish and the exponential average moves over the top band. Also, when this occurs, the original top band becomes the bottom band and a new top band is defined. The opposite will be true for the short side.
We decided to compare the exponential moving average to the top and bottom bands rather than a price, say, the close price. Using an exponential moving average minimizes the whipsaws that can occur when we compare the close price to the bands. For example, the close price may cross over or under the bands repeatedly without it representing a significant movement, however, using an exponential moving average reduces the possibility of an insignificant cross over or under.
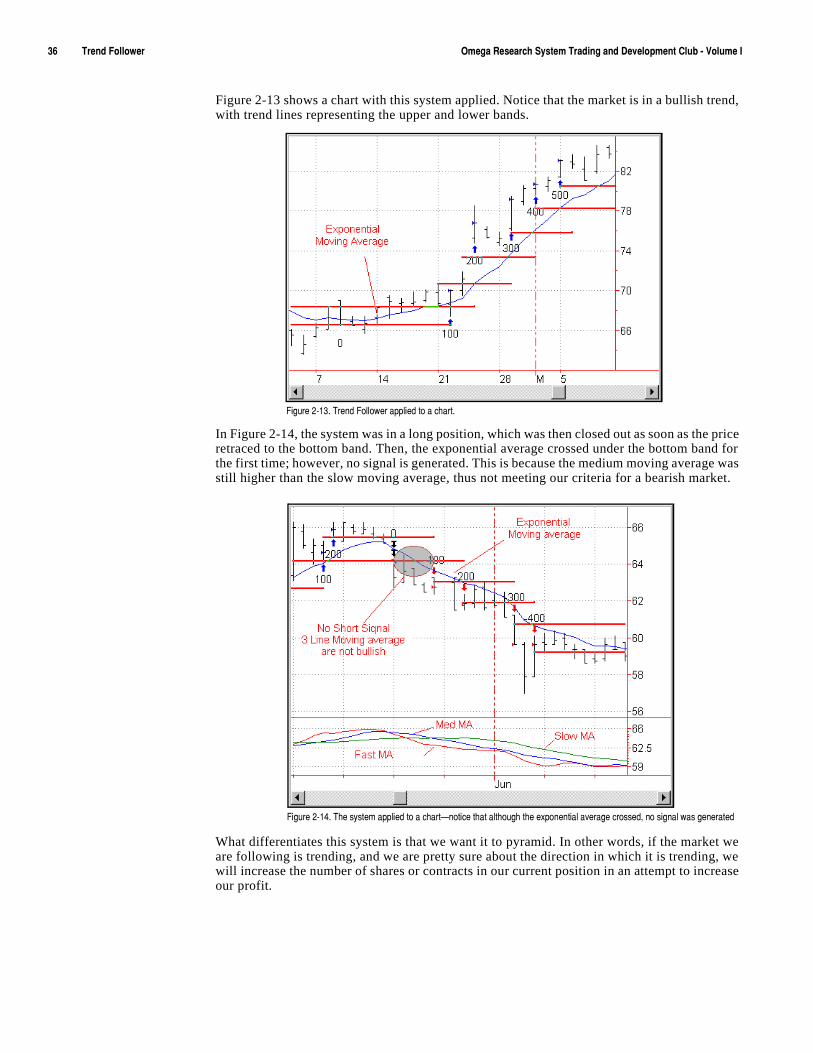
çäúúúúúúúúúú:XKTJú,URRU]KXúúúúúúúúúú 5SKMGú8KYKGXINú9_YZKSú:XGJOTMúGTJú*K\KRUVSKTZú)R[Húíú<UR[SKú/
Figure 2-13 shows a chart with this system applied. Notice that the market is in a bullish trend, with trend lines representing the upper and lower bands.
In Figure 2-14, the system was in a long position, which was then closed out as soon as the price retraced to the bottom band. Then, the exponential average crossed under the bottom band for the first time; however, no signal is generated. This is because the medium moving average was still higher than the slow moving average, thus not meeting our criteria for a bearish market.
What differentiates this system is that we want it to pyramid. In other words, if the market we are following is trending, and we are pretty sure about the direction in which it is trending, we will increase the number of shares or contracts in our current position in an attempt to increase our profit.
,OM[XKúèíéçìú:XKTJú,URRU]KXúGVVROKJúZUúGúINGXZì
,OM[XKúèíéæìú:NKúY_YZKSúGVVROKJúZUúGúINGXZ¥TUZOIKúZNGZúGRZNU[MNúZNKúK^VUTKTZOGRúG\KXGMKúIXUYYKJîúTUúYOMTGRú]GYúMKTKXGZKJ
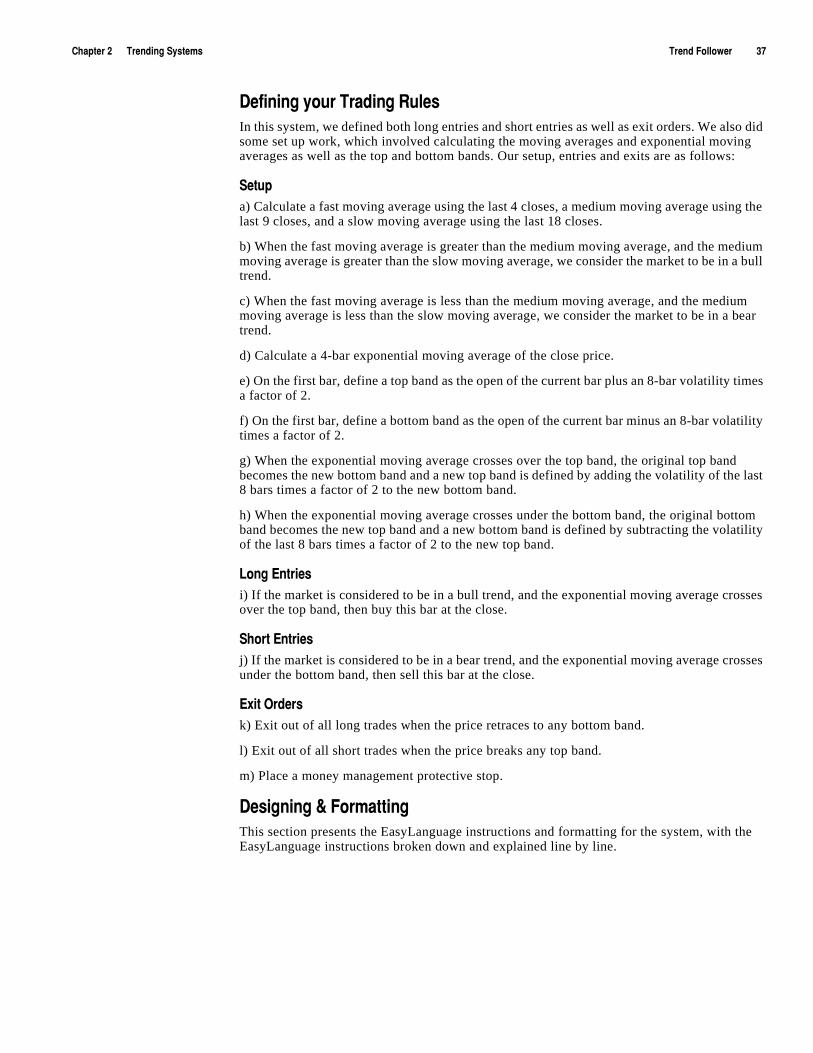
)NGVZKXúèúúúúúú:XKTJOTMú9_YZKSY :XKTJú,URRU]KXúúúúúúúúúúçã
*KLOTOTMú_U[Xú:XGJOTMú8[RKYIn this system, we defined both long entries and short entries as well as exit orders. We also did some set up work, which involved calculating the moving averages and exponential moving averages as well as the top and bottom bands. Our setup, entries and exits are as follows:
9KZ[Va) Calculate a fast moving average using the last 4 closes, a medium moving average using the last 9 closes, and a slow moving average using the last 18 closes.
b) When the fast moving average is greater than the medium moving average, and the medium moving average is greater than the slow moving average, we consider the market to be in a bull trend.
c) When the fast moving average is less than the medium moving average, and the medium moving average is less than the slow moving average, we consider the market to be in a bear trend.
d) Calculate a 4-bar exponential moving average of the close price.
e) On the first bar, define a top band as the open of the current bar plus an 8-bar volatility times a factor of 2.
f) On the first bar, define a bottom band as the open of the current bar minus an 8-bar volatility times a factor of 2.
g) When the exponential moving average crosses over the top band, the original top band becomes the new bottom band and a new top band is defined by adding the volatility of the last 8 bars times a factor of 2 to the new bottom band.
h) When the exponential moving average crosses under the bottom band, the original bottom band becomes the new top band and a new bottom band is defined by subtracting the volatility of the last 8 bars times a factor of 2 to the new top band.
2UTMú+TZXOKYi) If the market is considered to be in a bull trend, and the exponential moving average crosses over the top band, then buy this bar at the close.
9NUXZú+TZXOKYj) If the market is considered to be in a bear trend, and the exponential moving average crosses under the bottom band, then sell this bar at the close.
+^OZú5XJKXYk) Exit out of all long trades when the price retraces to any bottom band.
l) Exit out of all short trades when the price breaks any top band.
m) Place a money management protective stop.
*KYOMTOTMúôú,UXSGZZOTMThis section presents the EasyLanguage instructions and formatting for the system, with the EasyLanguage instructions broken down and explained line by line.
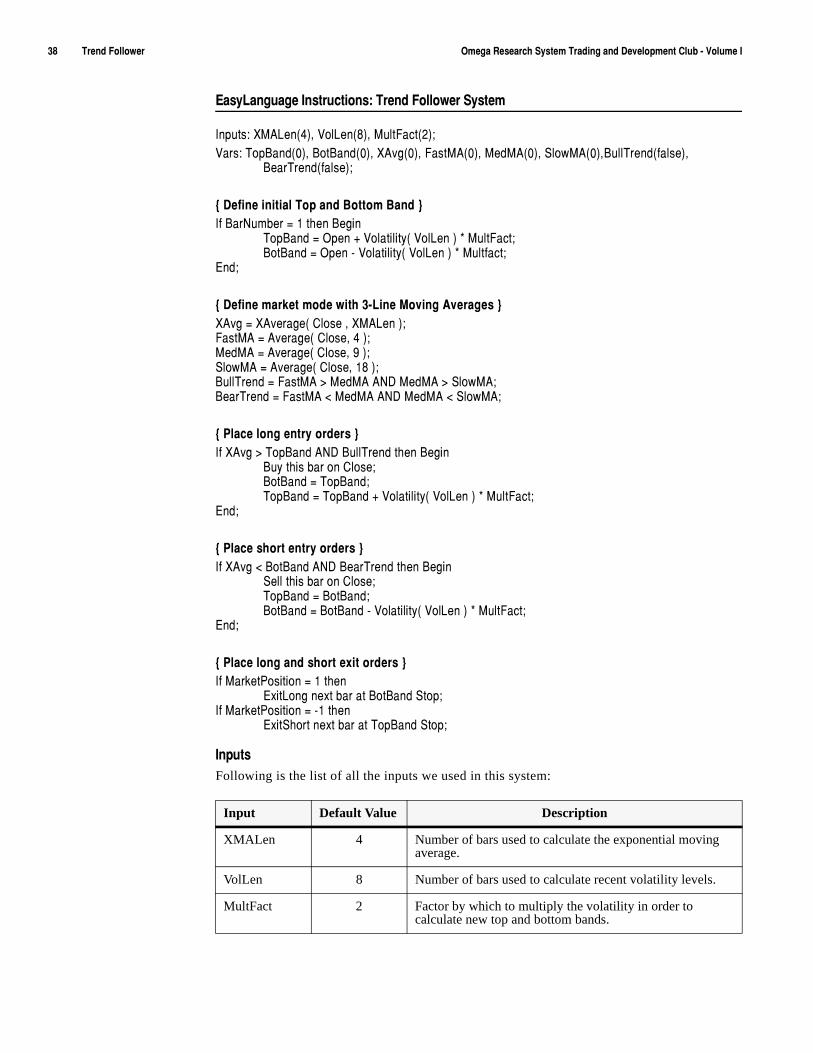
çâúúúúúúúúúú:XKTJú,URRU]KXúúúúúúúúúú 5SKMGú8KYKGXINú9_YZKSú:XGJOTMúGTJú*K\KRUVSKTZú)R[Húíú<UR[SKú/
+GY_2GTM[GMKú/TYZX[IZOUTY ú:XKTJú,URRU]KXú9_YZKS
/TV[ZY ú>3'2KTòæñîú<UR2KTòâñîú3[RZ,GIZòèñ!<GXY ú:UV(GTJòêñîú(UZ(GTJòêñîú>'\Mòêñîú,GYZ3'òêñîú3KJ3'òêñîú9RU]3'òêñî([RR:XKTJòLGRYKñîú (KGX:XKTJòLGRYKñ!
aú*KLOTKúOTOZOGRú:UVúGTJú(UZZUSú(GTJúc/Lú(GX4[SHKXú#úéúZNKTú(KMOT
:UV(GTJú#ú5VKTúïú<URGZOROZ_òú<UR2KTúñúðú3[RZ,GIZ!(UZ(GTJú#ú5VKTúíú<URGZOROZ_òú<UR2KTúñúðú3[RZLGIZ!
+TJ!
aú*KLOTKúSGXQKZúSUJKú]OZNúçí2OTKú3U\OTMú'\KXGMKYúc>'\Mú#ú>'\KXGMKòú)RUYKúîú>3'2KTúñ!,GYZ3'ú#ú'\KXGMKòú)RUYKîúæúñ!3KJ3'ú#ú'\KXGMKòú)RUYKîúáúñ!9RU]3'ú#ú'\KXGMKòú)RUYKîúéâúñ!([RR:XKTJú#ú,GYZ3'ú$ú3KJ3'ú'4*ú3KJ3'ú$ú9RU]3'!(KGX:XKTJú#ú,GYZ3'ú"ú3KJ3'ú'4*ú3KJ3'ú"ú9RU]3'!
aú6RGIKúRUTMúKTZX_úUXJKXYúc/Lú>'\Mú$ú:UV(GTJú'4*ú([RR:XKTJúZNKTú(KMOT
([_úZNOYúHGXúUTú)RUYK!(UZ(GTJú#ú:UV(GTJ!:UV(GTJú#ú:UV(GTJúïú<URGZOROZ_òú<UR2KTúñúðú3[RZ,GIZ!
+TJ!
aú6RGIKúYNUXZúKTZX_úUXJKXYúc/Lú>'\Mú"ú(UZ(GTJú'4*ú(KGX:XKTJúZNKTú(KMOT
9KRRúZNOYúHGXúUTú)RUYK!:UV(GTJú#ú(UZ(GTJ!(UZ(GTJú#ú(UZ(GTJúíú<URGZOROZ_òú<UR2KTúñúðú3[RZ,GIZ!
+TJ!
aú6RGIKúRUTMúGTJúYNUXZúK^OZúUXJKXYúc/Lú3GXQKZ6UYOZOUTú#úéúZNKT
+^OZ2UTMúTK^ZúHGXúGZú(UZ(GTJú9ZUV!/Lú3GXQKZ6UYOZOUTú#úíéúZNKT
+^OZ9NUXZúTK^ZúHGXúGZú:UV(GTJú9ZUV!
/TV[ZYFollowing is the list of all the inputs we used in this system:
Input Default Value Description
XMALen 4 Number of bars used to calculate the exponential moving average.
VolLen 8 Number of bars used to calculate recent volatility levels.
MultFact 2 Factor by which to multiply the volatility in order to calculate new top and bottom bands.
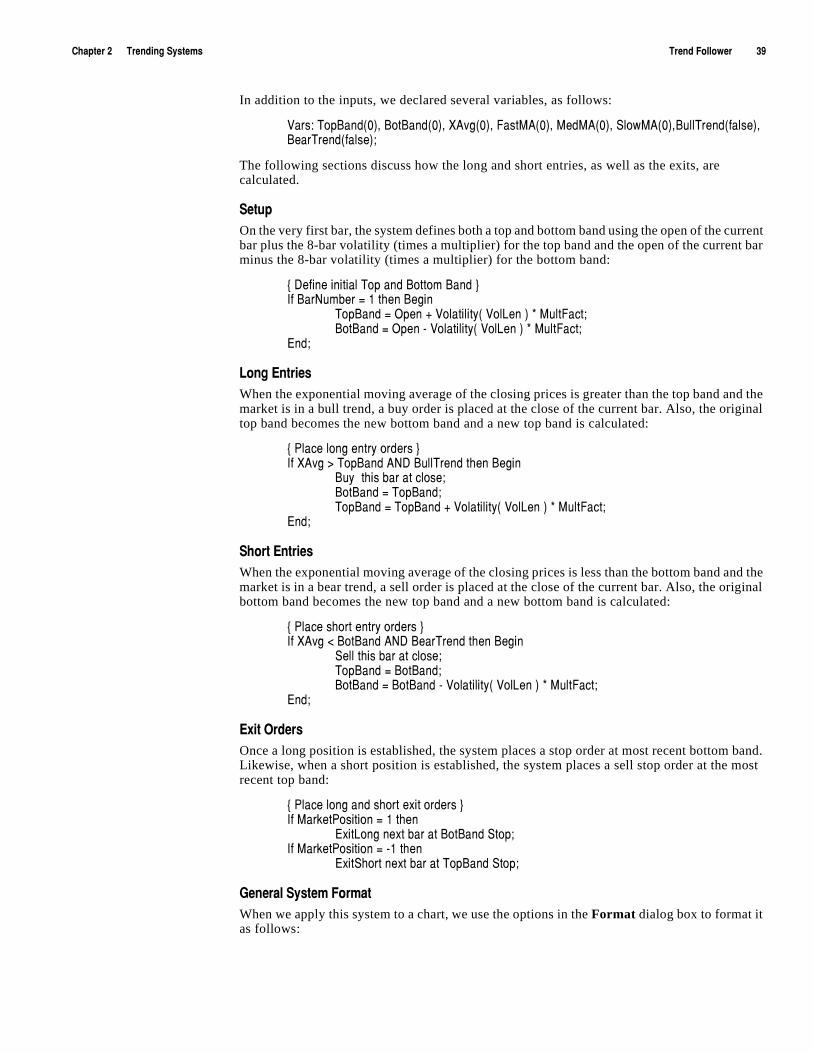
)NGVZKXúèúúúúúú:XKTJOTMú9_YZKSY :XKTJú,URRU]KXúúúúúúúúúúçá
In addition to the inputs, we declared several variables, as follows:
<GXY ú:UV(GTJòêñîú(UZ(GTJòêñîú>'\Mòêñîú,GYZ3'òêñîú3KJ3'òêñîú9RU]3'òêñî([RR:XKTJòLGRYKñîú (KGX:XKTJòLGRYKñ!
The following sections discuss how the long and short entries, as well as the exits, are calculated.
9KZ[VOn the very first bar, the system defines both a top and bottom band using the open of the current bar plus the 8-bar volatility (times a multiplier) for the top band and the open of the current bar minus the 8-bar volatility (times a multiplier) for the bottom band:
aú*KLOTKúOTOZOGRú:UVúGTJú(UZZUSú(GTJúc/Lú(GX4[SHKXú#úéúZNKTú(KMOT
:UV(GTJú#ú5VKTúïú<URGZOROZ_òú<UR2KTúñúðú3[RZ,GIZ!(UZ(GTJú#ú5VKTúíú<URGZOROZ_òú<UR2KTúñúðú3[RZ,GIZ!
+TJ!
2UTMú+TZXOKYWhen the exponential moving average of the closing prices is greater than the top band and the market is in a bull trend, a buy order is placed at the close of the current bar. Also, the original top band becomes the new bottom band and a new top band is calculated:
aú6RGIKúRUTMúKTZX_úUXJKXYúc/Lú>'\Mú$ú:UV(GTJú'4*ú([RR:XKTJúZNKTú(KMOT
([_úúZNOYúHGXúGZúIRUYK!(UZ(GTJú#ú:UV(GTJ!:UV(GTJú#ú:UV(GTJúïú<URGZOROZ_òú<UR2KTúñúðú3[RZ,GIZ!
+TJ!
9NUXZú+TZXOKYWhen the exponential moving average of the closing prices is less than the bottom band and the market is in a bear trend, a sell order is placed at the close of the current bar. Also, the original bottom band becomes the new top band and a new bottom band is calculated:
aú6RGIKúYNUXZúKTZX_úUXJKXYúc/Lú>'\Mú"ú(UZ(GTJú'4*ú(KGX:XKTJúZNKTú(KMOT
9KRRúZNOYúHGXúGZúIRUYK!:UV(GTJú#ú(UZ(GTJ!(UZ(GTJú#ú(UZ(GTJúíú<URGZOROZ_òú<UR2KTúñúðú3[RZ,GIZ!
+TJ!
+^OZú5XJKXYOnce a long position is established, the system places a stop order at most recent bottom band. Likewise, when a short position is established, the system places a sell stop order at the most recent top band:
aú6RGIKúRUTMúGTJúYNUXZúK^OZúUXJKXYúc/Lú3GXQKZ6UYOZOUTú#úéúZNKT
+^OZ2UTMúTK^ZúHGXúGZú(UZ(GTJú9ZUV!/Lú3GXQKZ6UYOZOUTú#úíéúZNKT
+^OZ9NUXZúTK^ZúHGXúGZú:UV(GTJú9ZUV!
-KTKXGRú9_YZKSú,UXSGZWhen we apply this system to a chart, we use the options in the Format dialog box to format it as follows:
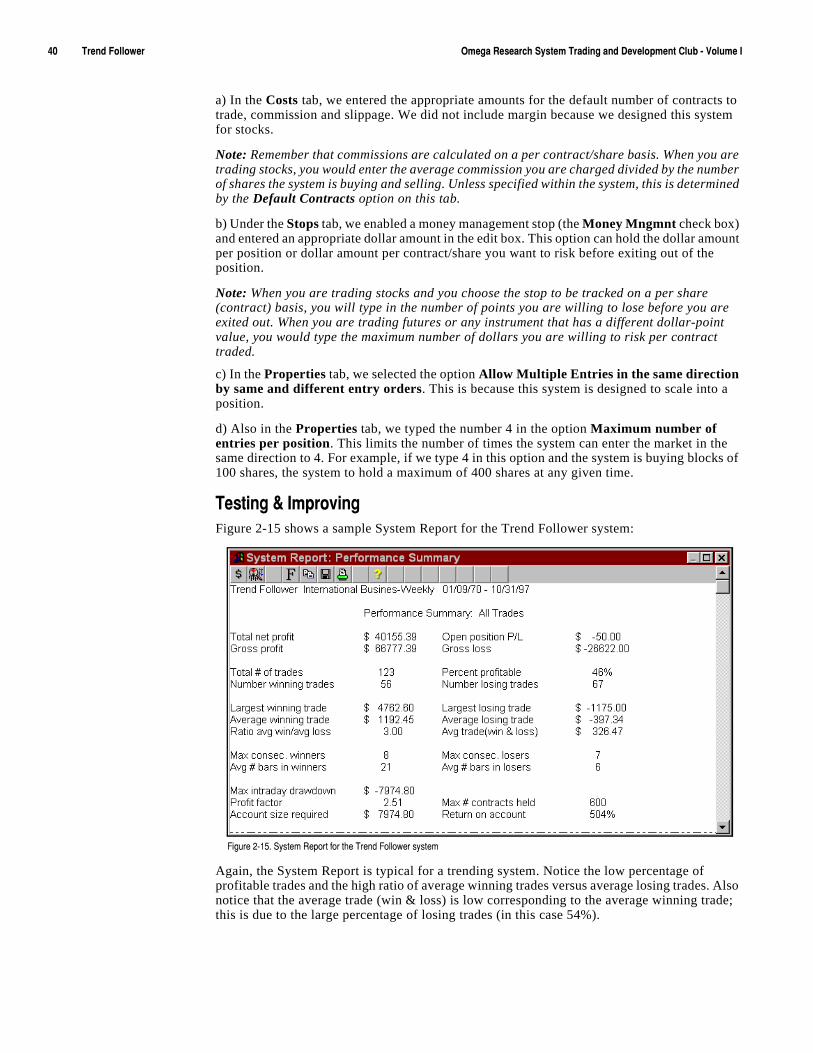
æêúúúúúúúúúú:XKTJú,URRU]KXúúúúúúúúúú 5SKMGú8KYKGXINú9_YZKSú:XGJOTMúGTJú*K\KRUVSKTZú)R[Húíú<UR[SKú/
a) In the Costs tab, we entered the appropriate amounts for the default number of contracts to trade, commission and slippage. We did not include margin because we designed this system for stocks.
Note: Remember that commissions are calculated on a per contract/share basis. When you are trading stocks, you would enter the average commission you are charged divided by the number of shares the system is buying and selling. Unless specified within the system, this is determined by the Default Contracts option on this tab.
b) Under the Stops tab, we enabled a money management stop (the Money Mngmnt check box) and entered an appropriate dollar amount in the edit box. This option can hold the dollar amount per position or dollar amount per contract/share you want to risk before exiting out of the position.
Note: When you are trading stocks and you choose the stop to be tracked on a per share (contract) basis, you will type in the number of points you are willing to lose before you are exited out. When you are trading futures or any instrument that has a different dollar-point value, you would type the maximum number of dollars you are willing to risk per contract traded.
c) In the Properties tab, we selected the option Allow Multiple Entries in the same direction by same and different entry orders. This is because this system is designed to scale into a position.
d) Also in the Properties tab, we typed the number 4 in the option Maximum number of entries per position. This limits the number of times the system can enter the market in the same direction to 4. For example, if we type 4 in this option and the system is buying blocks of 100 shares, the system to hold a maximum of 400 shares at any given time.
:KYZOTMúôú/SVXU\OTMFigure 2-15 shows a sample System Report for the Trend Follower system:
Again, the System Report is typical for a trending system. Notice the low percentage of profitable trades and the high ratio of average winning trades versus average losing trades. Also notice that the average trade (win & loss) is low corresponding to the average winning trade; this is due to the large percentage of losing trades (in this case 54%).
,OM[XKúèíéåìú9_YZKSú8KVUXZúLUXúZNKú:XKTJú,URRU]KXúY_YZKS

)NGVZKXúèúúúúúú:XKTJOTMú9_YZKSY :XKTJú,URRU]KXúúúúúúúúúúæé
9[MMKYZOUTYúLUXú/SVXU\KSKTZOne item we can play with is the value used for the input 3[RZ,GIZ, which determines the width of the channel. When we reduce the value of this input, the system becomes more sensitive and our positions will increment at a faster pace. However, the system will also be more susceptible to noise in the market. Therefore, we will adjust this input depending on the market we are trading in order to find a satisfactory balance between sensitivity and noise.
This system attempts to ride the movement of the price, either up or down. However, it uses only one filter—three moving averages. Therefore, we might want to use the pyramid technique this system uses in conjunction with another entry and confirmation technique. For example, we may want to use the technique used by the Trend Line Automatic System to enter the market initially and then use the technique used by the Trend Follower to determine when increment the position and exit.

æèúúúúúúúúúú:XKTJú,URRU]KXúúúúúúúúúú 5SKMGú8KYKGXINú9_YZKSú:XGJOTMúGTJú*K\KRUVSKTZú)R[Húíú<UR[SKú/

C H A P T E R 3
9[VVUXZúôú8KYOYZGTIKú9_YZKSY
Support & Resistance Systems are designed for sideways or directionless markets and they typically have the following attributes:
� They buy low and sell high in an attempt to take advantage of the sideways price movement characterizing directionless markets.
� They have a high number of winning trades, with small profits on each trade. They sell as the market goes higher and take small losses until the market finally turns down and results in a profitable trade.
� They are easier to trade emotionally.
By design, these systems miss the big move—they usually have small profits and larger losses as markets trend. The system keeps shorting a market that is in an up-trend or buying a market that is in a down-trend. Therefore, when traders use Support &Resistance systems, they use them within a group of systems that also includes trending systems and perhaps one or more volatility systems.
In this chapter, we present two support & resistance systems that differ in their approach but are all designed to make the most of the sideways movement of a market.
/Tú:NOYú)NGVZKX
� Spread .............................................. 44� Support and Resistance Levels..........49
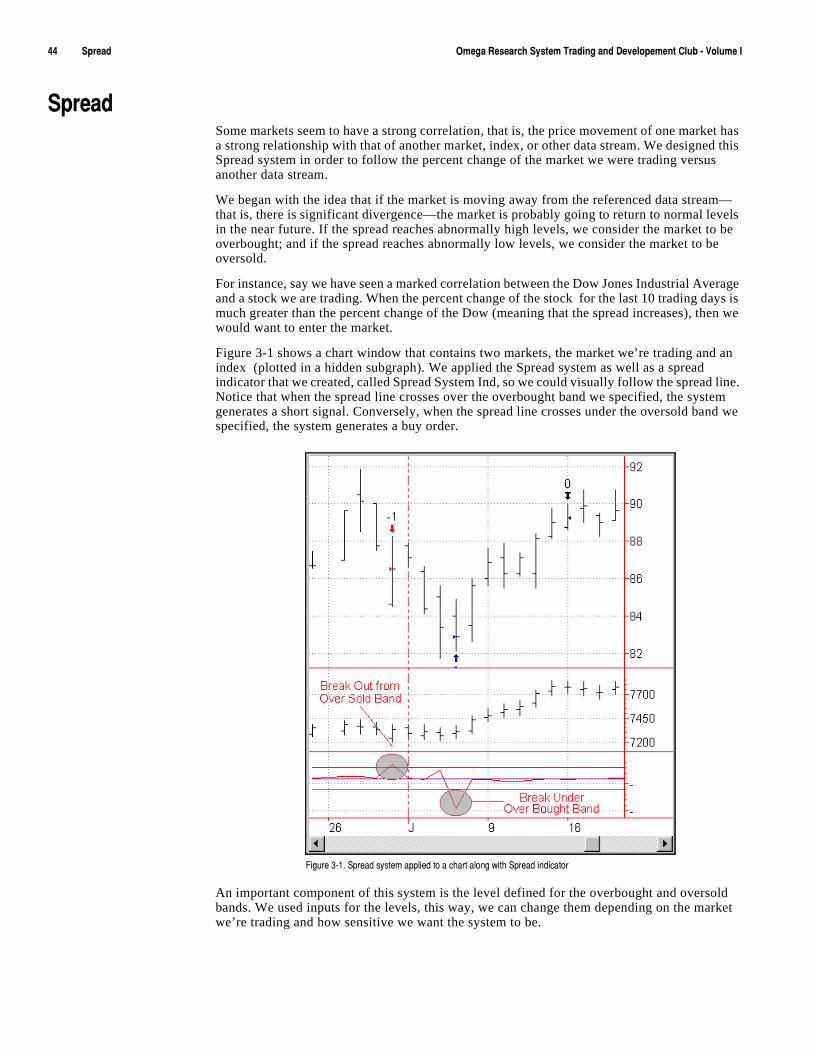
ææúúúúúúúúúú9VXKGJúúúúúúúúúú 5SKMGú8KYKGXINú9_YZKSú:XGJOTMúGTJú*K\KRUVKSKTZú)R[Húíú<UR[SKú/
9VXKGJúSome markets seem to have a strong correlation, that is, the price movement of one market has a strong relationship with that of another market, index, or other data stream. We designed this Spread system in order to follow the percent change of the market we were trading versus another data stream.
We began with the idea that if the market is moving away from the referenced data stream—that is, there is significant divergence—the market is probably going to return to normal levels in the near future. If the spread reaches abnormally high levels, we consider the market to be overbought; and if the spread reaches abnormally low levels, we consider the market to be oversold.
For instance, say we have seen a marked correlation between the Dow Jones Industrial Average and a stock we are trading. When the percent change of the stock for the last 10 trading days is much greater than the percent change of the Dow (meaning that the spread increases), then we would want to enter the market.
Figure 3-1 shows a chart window that contains two markets, the market we’re trading and an index (plotted in a hidden subgraph). We applied the Spread system as well as a spread indicator that we created, called Spread System Ind, so we could visually follow the spread line. Notice that when the spread line crosses over the overbought band we specified, the system generates a short signal. Conversely, when the spread line crosses under the oversold band we specified, the system generates a buy order.
An important component of this system is the level defined for the overbought and oversold bands. We used inputs for the levels, this way, we can change them depending on the market we’re trading and how sensitive we want the system to be.
,OM[XKúçíéìú9VXKGJúY_YZKSúGVVROKJúZUúGúINGXZúGRUTMú]OZNú9VXKGJúOTJOIGZUXúú
)NGVZKXúçúúúúúú9[VVUXZúôú8KYOYZGTIKú9_YZKSY 9VXKGJúúúúúúúúúúæå
To exit from our positions, we’ll use trailing stops, but we’ll wait for the position to generate some profit before placing the stops. We are looking to buy at the support and sell at the resistance, and when we place a trailing stop, we want to capture profits; therefore, we will want to wait for the position to generate a profit first.
To place the trailing stops, we will use our standard criteria and exit out of our long positions at the lowest low of the last 6 bars and out of our short positions at the lowest low of the last 6 bars. Again, we will place these orders only once we’ve registered a profit, and we’ll use an input and add or subtract an extra measure to the highest high or from lowest low, respectively.
Plus, since this is a Support & Resistance system, it is possible for the system to be in a stale position. That is, in a position that is not necessarily losing money, but it’s not generating any profit either. Therefore, we’ll place exit orders once we’ve been in a position more than six bars and the profit is less than 100 dollars.
As a final method of risk control, we are going to use a money management stop. The level or amount we specify for this stop will depend on how much money we have invested.
*KLOTOTMú_U[Xú:XGJOTMú8[RKYIn this system, we defined both long entries and short entries as well as exit orders. We also did some setup work to calculate the percent change values and the spread. The setup, entries and exits are described next:
9KZ[Va) Calculate the percent change of the traded instrument:
*GZGéú6KXIKTZú)NGTMKú#úòú)RUYKúULúI[XXKTZúHGXúëú)RUYKúULúéêúHGXYúGMUúúíúúéúñúðúéêê
b) Calculate the percent change of the index or related instrument:
*GZGèú6KXIKTZú)NGTMKú#úòú)RUYKúULúI[XXKTZúHGXúëú)RUYKúULúéêúHGXYúGMUúúíúúéúñúðúéêê
c) Calculate the relative strength of the percent change of the traded instrument versus the percent change of the index:
9VXKGJú#úòú*GZGéú6KXIKTZú)NGTMKúëú*GZGèú6KXIKTZú)NGTMKúúíúúéúñúðúéêê
2UTMú+TZXOKYd) If the spread is less than the oversold level (92), then buy this bar on the close.
9NUXZú+TZXOKYe) If the spread is higher than the overbought level (108), then sell this bar on the close.
+^OZYf) Exit out of all long positions when the market retraces to the lowest low of the last 6 bars.
g) Exit out of all short positions when the market breaks out of the highest high of the last 6 bars.
h) If 6 bars have gone by without any significant profit, exit all positions.
*KYOMTOTMúôú,UXSGZZOTMThis section presents the EasyLanguage instructions and formatting for the system, with the EasyLanguage instructions broken down and explained line by line.
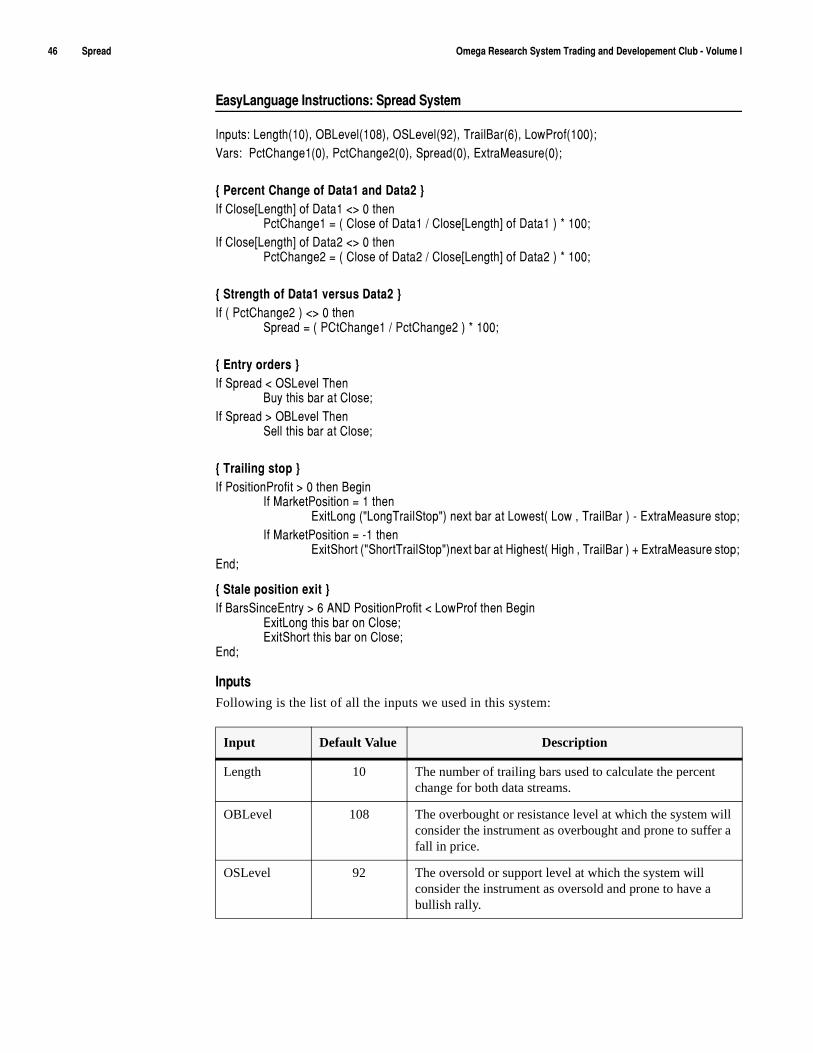
æäúúúúúúúúúú9VXKGJúúúúúúúúúú 5SKMGú8KYKGXINú9_YZKSú:XGJOTMúGTJú*K\KRUVKSKTZú)R[Húíú<UR[SKú/
+GY_2GTM[GMKú/TYZX[IZOUTY ú9VXKGJú9_YZKS
/TV[ZY ú2KTMZNòéêñîú5(2K\KRòéêâñîú592K\KRòáèñîú:XGOR(GXòäñîú2U]6XULòéêêñ!<GXY úú6IZ)NGTMKéòêñîú6IZ)NGTMKèòêñîú9VXKGJòêñîú+^ZXG3KGY[XKòêñ!
aú6KXIKTZú)NGTMKúULú*GZGéúGTJú*GZGèúc/Lú)RUYKA2KTMZNCúULú*GZGéú"$úêúZNKT
6IZ)NGTMKéú#úòú)RUYKúULú*GZGéúëú)RUYKA2KTMZNCúULú*GZGéúñúðúéêê!/Lú)RUYKA2KTMZNCúULú*GZGèú"$úêúZNKT
6IZ)NGTMKèú#úòú)RUYKúULú*GZGèúëú)RUYKA2KTMZNCúULú*GZGèúñúðúéêê!
aú9ZXKTMZNúULú*GZGéú\KXY[Yú*GZGèúc/Lúòú6IZ)NGTMKèúñú"$úêúZNKT
9VXKGJú#úòú6)Z)NGTMKéúëú6IZ)NGTMKèúñúðúéêê!
aú+TZX_úUXJKXYúc/Lú9VXKGJú"ú592K\KRú:NKT
([_úZNOYúHGXúGZú)RUYK!/Lú9VXKGJú$ú5(2K\KRú:NKT
9KRRúZNOYúHGXúGZú)RUYK!
aú:XGOROTMúYZUVúc/Lú6UYOZOUT6XULOZú$úêúZNKTú(KMOT
/Lú3GXQKZ6UYOZOUTú#úéúZNKT+^OZ2UTMúòø2UTM:XGOR9ZUVøñúTK^ZúHGXúGZú2U]KYZòú2U]úîú:XGOR(GXúñúíú+^ZXG3KGY[XKúYZUV!
/Lú3GXQKZ6UYOZOUTú#úíéúZNKT+^OZ9NUXZúòø9NUXZ:XGOR9ZUVøñTK^ZúHGXúGZú.OMNKYZòú.OMNúîú:XGOR(GXúñúïú+^ZXG3KGY[XKúYZUV!ú
+TJ!
aú9ZGRKúVUYOZOUTúK^OZúc/Lú(GXY9OTIK+TZX_ú$úäú'4*ú6UYOZOUT6XULOZú"ú2U]6XULúZNKTú(KMOT
+^OZ2UTMúZNOYúHGXúUTú)RUYK!+^OZ9NUXZúZNOYúHGXúUTú)RUYK!
+TJ!
/TV[ZYFollowing is the list of all the inputs we used in this system:
Input Default Value Description
Length 10 The number of trailing bars used to calculate the percent change for both data streams.
OBLevel 108 The overbought or resistance level at which the system will consider the instrument as overbought and prone to suffer a fall in price.
OSLevel 92 The oversold or support level at which the system will consider the instrument as oversold and prone to have a bullish rally.
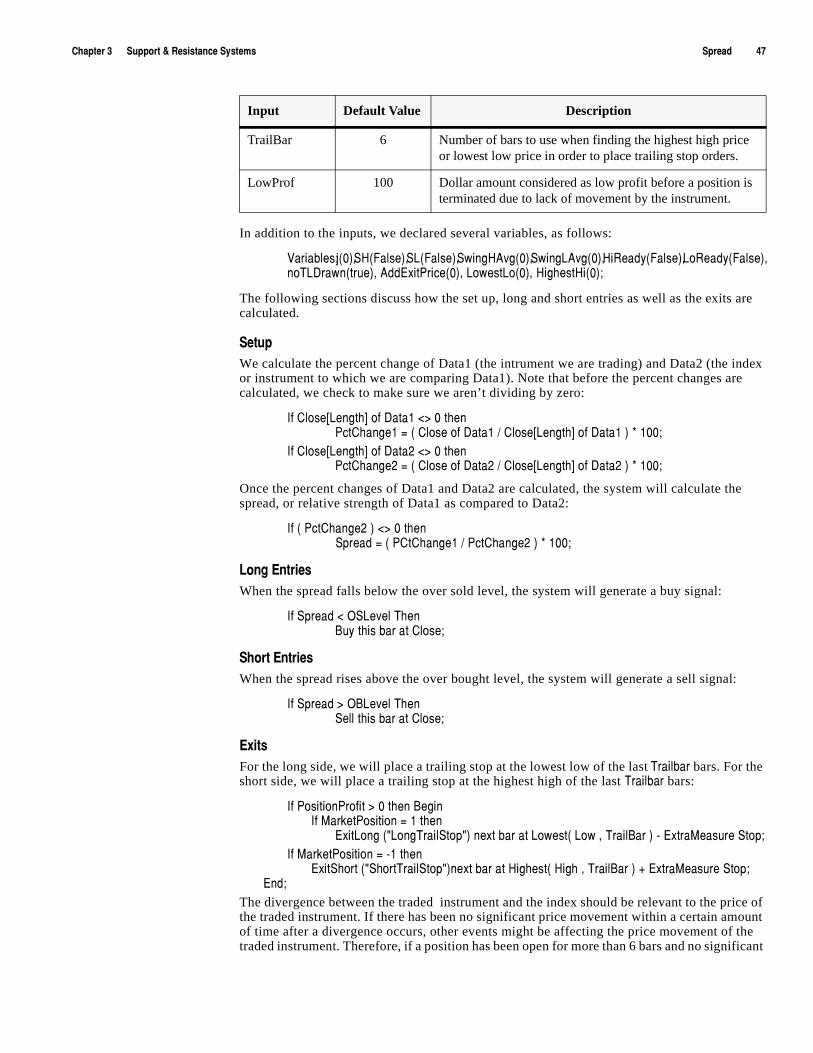
)NGVZKXúçúúúúúú9[VVUXZúôú8KYOYZGTIKú9_YZKSY 9VXKGJúúúúúúúúúúæã
In addition to the inputs, we declared several variables, as follows:
<GXOGHRKY úPòêñîú9.ò,GRYKñîú92ò,GRYKñîú9]OTM.'\Mòêñîú9]OTM2'\Mòêñîú.O8KGJ_ò,GRYKñîú2U8KGJ_ò,GRYKñîúTU:2*XG]TòZX[Kñîú'JJ+^OZ6XOIKòêñîú2U]KYZ2Uòêñîú.OMNKYZ.Oòêñ!
The following sections discuss how the set up, long and short entries as well as the exits are calculated.
9KZ[VWe calculate the percent change of Data1 (the intrument we are trading) and Data2 (the index or instrument to which we are comparing Data1). Note that before the percent changes are calculated, we check to make sure we aren’t dividing by zero:
/Lú)RUYKA2KTMZNCúULú*GZGéú"$úêúZNKTú6IZ)NGTMKéú#úòú)RUYKúULú*GZGéúëú)RUYKA2KTMZNCúULú*GZGéúñúðúéêê!
/Lú)RUYKA2KTMZNCúULú*GZGèú"$úêúZNKT6IZ)NGTMKèú#úòú)RUYKúULú*GZGèúëú)RUYKA2KTMZNCúULú*GZGèúñúðúéêê!
Once the percent changes of Data1 and Data2 are calculated, the system will calculate the spread, or relative strength of Data1 as compared to Data2:
/Lúòú6IZ)NGTMKèúñú"$úêúZNKT9VXKGJú#úòú6)Z)NGTMKéúëú6IZ)NGTMKèúñúðúéêê!
2UTMú+TZXOKYWhen the spread falls below the over sold level, the system will generate a buy signal:
/Lú9VXKGJú"ú592K\KRú:NKT([_úZNOYúHGXúGZú)RUYK!
9NUXZú+TZXOKYWhen the spread rises above the over bought level, the system will generate a sell signal:
/Lú9VXKGJú$ú5(2K\KRú:NKT9KRRúZNOYúHGXúGZú)RUYK!
+^OZYFor the long side, we will place a trailing stop at the lowest low of the last :XGORHGX bars. For the short side, we will place a trailing stop at the highest high of the last :XGORHGX bars:
/Lú6UYOZOUT6XULOZú$úêúZNKTú(KMOT/Lú3GXQKZ6UYOZOUTú#úéúZNKT
+^OZ2UTMúòø2UTM:XGOR9ZUVøñúTK^ZúHGXúGZú2U]KYZòú2U]úîú:XGOR(GXúñúíú+^ZXG3KGY[XKú9ZUV!/Lú3GXQKZ6UYOZOUTú#úíéúZNKT
+^OZ9NUXZúòø9NUXZ:XGOR9ZUVøñTK^ZúHGXúGZú.OMNKYZòú.OMNúîú:XGOR(GXúñúïú+^ZXG3KGY[XKú9ZUV!ú+TJ!
The divergence between the traded instrument and the index should be relevant to the price of the traded instrument. If there has been no significant price movement within a certain amount of time after a divergence occurs, other events might be affecting the price movement of the traded instrument. Therefore, if a position has been open for more than 6 bars and no significant
TrailBar 6 Number of bars to use when finding the highest high price or lowest low price in order to place trailing stop orders.
LowProf 100 Dollar amount considered as low profit before a position is terminated due to lack of movement by the instrument.
Input Default Value Description
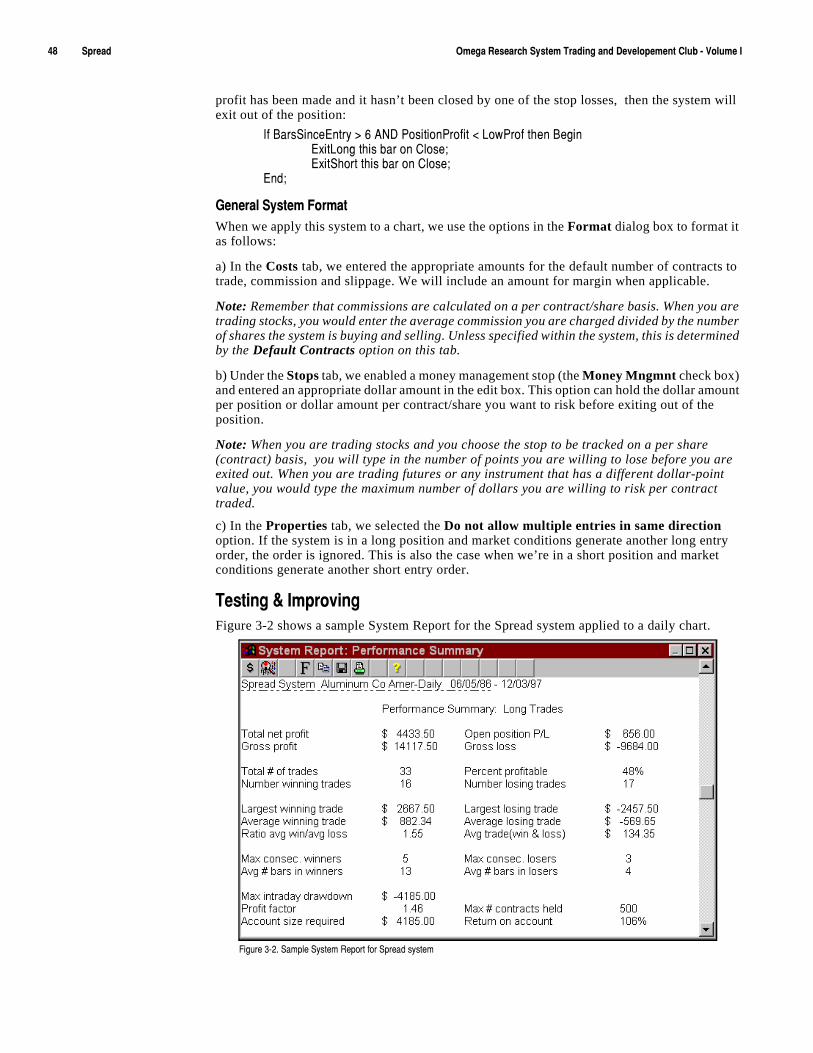
æâúúúúúúúúúú9VXKGJúúúúúúúúúú 5SKMGú8KYKGXINú9_YZKSú:XGJOTMúGTJú*K\KRUVKSKTZú)R[Húíú<UR[SKú/
profit has been made and it hasn’t been closed by one of the stop losses, then the system will exit out of the position:
/Lú(GXY9OTIK+TZX_ú$úäú'4*ú6UYOZOUT6XULOZú"ú2U]6XULúZNKTú(KMOT+^OZ2UTMúZNOYúHGXúUTú)RUYK!+^OZ9NUXZúZNOYúHGXúUTú)RUYK!
+TJ!
-KTKXGRú9_YZKSú,UXSGZWhen we apply this system to a chart, we use the options in the Format dialog box to format it as follows:
a) In the Costs tab, we entered the appropriate amounts for the default number of contracts to trade, commission and slippage. We will include an amount for margin when applicable.
Note: Remember that commissions are calculated on a per contract/share basis. When you are trading stocks, you would enter the average commission you are charged divided by the number of shares the system is buying and selling. Unless specified within the system, this is determined by the Default Contracts option on this tab.
b) Under the Stops tab, we enabled a money management stop (the Money Mngmnt check box) and entered an appropriate dollar amount in the edit box. This option can hold the dollar amount per position or dollar amount per contract/share you want to risk before exiting out of the position.
Note: When you are trading stocks and you choose the stop to be tracked on a per share (contract) basis, you will type in the number of points you are willing to lose before you are exited out. When you are trading futures or any instrument that has a different dollar-point value, you would type the maximum number of dollars you are willing to risk per contract traded.
c) In the Properties tab, we selected the Do not allow multiple entries in same direction option. If the system is in a long position and market conditions generate another long entry order, the order is ignored. This is also the case when we’re in a short position and market conditions generate another short entry order.
:KYZOTMúôú/SVXU\OTMFigure 3-2 shows a sample System Report for the Spread system applied to a daily chart.
,OM[XKúçíèìú9GSVRKú9_YZKSú8KVUXZúLUXú9VXKGJúY_YZKS
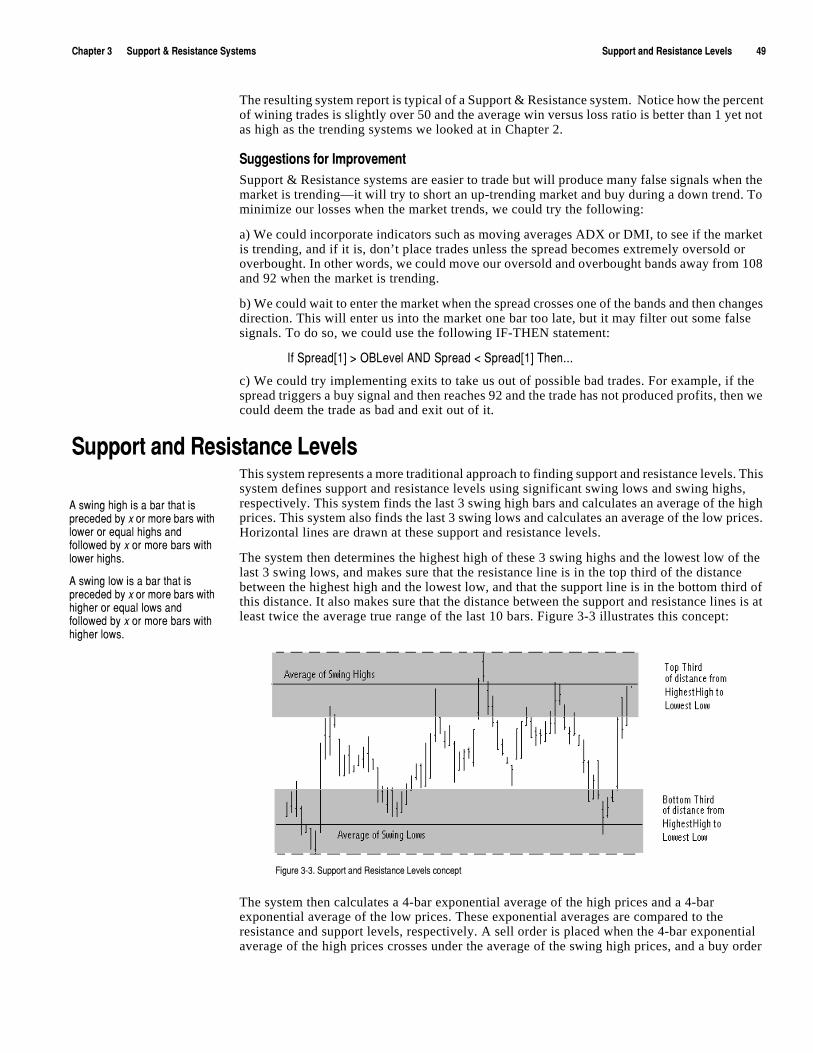
)NGVZKXúçúúúúúú9[VVUXZúôú8KYOYZGTIKú9_YZKSY 9[VVUXZúGTJú8KYOYZGTIKú2K\KRYúúúúúúúúúúæá
The resulting system report is typical of a Support & Resistance system. Notice how the percent of wining trades is slightly over 50 and the average win versus loss ratio is better than 1 yet not as high as the trending systems we looked at in Chapter 2.
9[MMKYZOUTYúLUXú/SVXU\KSKTZSupport & Resistance systems are easier to trade but will produce many false signals when the market is trending—it will try to short an up-trending market and buy during a down trend. To minimize our losses when the market trends, we could try the following:
a) We could incorporate indicators such as moving averages ADX or DMI, to see if the market is trending, and if it is, don’t place trades unless the spread becomes extremely oversold or overbought. In other words, we could move our oversold and overbought bands away from 108 and 92 when the market is trending.
b) We could wait to enter the market when the spread crosses one of the bands and then changes direction. This will enter us into the market one bar too late, but it may filter out some false signals. To do so, we could use the following IF-THEN statement:
/Lú9VXKGJAéCú$ú5(2K\KRú'4*ú9VXKGJú"ú9VXKGJAéCú:NKTìììúú
c) We could try implementing exits to take us out of possible bad trades. For example, if the spread triggers a buy signal and then reaches 92 and the trade has not produced profits, then we could deem the trade as bad and exit out of it.
9[VVUXZúGTJú8KYOYZGTIKú2K\KRYúThis system represents a more traditional approach to finding support and resistance levels. This system defines support and resistance levels using significant swing lows and swing highs, respectively. This system finds the last 3 swing high bars and calculates an average of the high prices. This system also finds the last 3 swing lows and calculates an average of the low prices. Horizontal lines are drawn at these support and resistance levels.
The system then determines the highest high of these 3 swing highs and the lowest low of the last 3 swing lows, and makes sure that the resistance line is in the top third of the distance between the highest high and the lowest low, and that the support line is in the bottom third of this distance. It also makes sure that the distance between the support and resistance lines is at least twice the average true range of the last 10 bars. Figure 3-3 illustrates this concept:
The system then calculates a 4-bar exponential average of the high prices and a 4-bar exponential average of the low prices. These exponential averages are compared to the resistance and support levels, respectively. A sell order is placed when the 4-bar exponential average of the high prices crosses under the average of the swing high prices, and a buy order
,OM[XKúçíçìú9[VVUXZúGTJú8KYOYZGTIKú2K\KRYúIUTIKVZ
'úY]OTMúNOMNúOYúGúHGXúZNGZúOYúVXKIKJKJúH_ú^úUXúSUXKúHGXYú]OZNúRU]KXúUXúKW[GRúNOMNYúGTJúLURRU]KJúH_ú^úUXúSUXKúHGXYú]OZNúRU]KXúNOMNYìú
'úY]OTMúRU]úOYúGúHGXúZNGZúOYúVXKIKJKJúH_ú^úUXúSUXKúHGXYú]OZNúNOMNKXúUXúKW[GRúRU]YúGTJúLURRU]KJúH_ú^úUXúSUXKúHGXYú]OZNúNOMNKXúRU]Yì
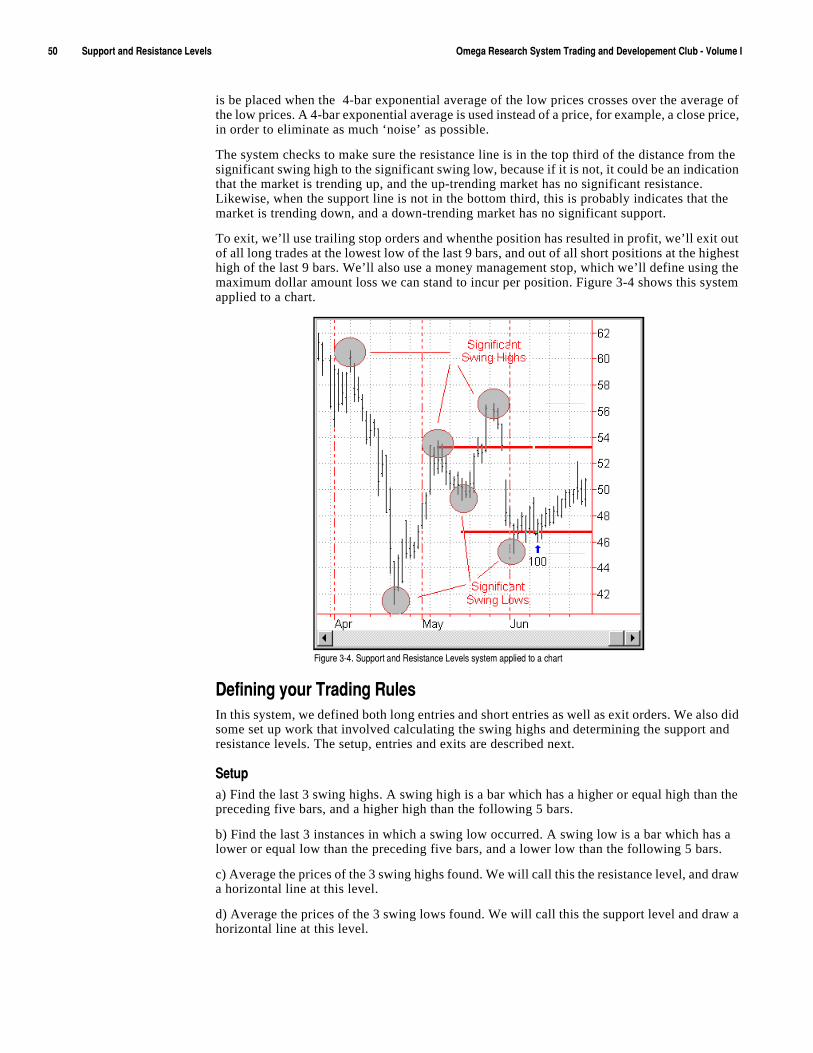
åêúúúúúúúúúú9[VVUXZúGTJú8KYOYZGTIKú2K\KRYúúúúúúúúúú 5SKMGú8KYKGXINú9_YZKSú:XGJOTMúGTJú*K\KRUVKSKTZú)R[Húíú<UR[SKú/
is be placed when the 4-bar exponential average of the low prices crosses over the average of the low prices. A 4-bar exponential average is used instead of a price, for example, a close price, in order to eliminate as much ‘noise’ as possible.
The system checks to make sure the resistance line is in the top third of the distance from the significant swing high to the significant swing low, because if it is not, it could be an indication that the market is trending up, and the up-trending market has no significant resistance. Likewise, when the support line is not in the bottom third, this is probably indicates that the market is trending down, and a down-trending market has no significant support.
To exit, we’ll use trailing stop orders and whenthe position has resulted in profit, we’ll exit out of all long trades at the lowest low of the last 9 bars, and out of all short positions at the highest high of the last 9 bars. We’ll also use a money management stop, which we’ll define using the maximum dollar amount loss we can stand to incur per position. Figure 3-4 shows this system applied to a chart.
*KLOTOTMú_U[Xú:XGJOTMú8[RKYIn this system, we defined both long entries and short entries as well as exit orders. We also did some set up work that involved calculating the swing highs and determining the support and resistance levels. The setup, entries and exits are described next.
9KZ[Va) Find the last 3 swing highs. A swing high is a bar which has a higher or equal high than the preceding five bars, and a higher high than the following 5 bars.
b) Find the last 3 instances in which a swing low occurred. A swing low is a bar which has a lower or equal low than the preceding five bars, and a lower low than the following 5 bars.
c) Average the prices of the 3 swing highs found. We will call this the resistance level, and draw a horizontal line at this level.
d) Average the prices of the 3 swing lows found. We will call this the support level and draw a horizontal line at this level.
,OM[XKúçíæìú9[VVUXZúGTJú8KYOYZGTIKú2K\KRYúY_YZKSúGVVROKJúZUúGúINGXZ
)NGVZKXúçúúúúúú9[VVUXZúôú8KYOYZGTIKú9_YZKSY 9[VVUXZúGTJú8KYOYZGTIKú2K\KRYúúúúúúúúúúåé
e) Determine if the swing high average is in the top third of the distance between the highest high of the swing highs and the lowest low of the swing lows.
òú9]OTMú.OMNú'\KXGMKúíú2U]KYZú2U]úñúëúòú.OMNKYZú.OMNúíú2U]KYZú2U]úñ
f) Determine if the swing low average is in the bottom third of the distance between the highest high of the swing highs and the lowest low of the swing lows.
òú9]OTMú2U]ú'\KXGMKúíú2U]KYZú2U]úñúëúòú.OMNKYZú.OMNúíú2U]KYZú2U]úñ
2UTMú+TZXOKYg) If the following conditions are true, place a buy order on the next bar at the open price:
1) The distance from the swing high average to the swing low average is greater than twice the average of the true range of the last 10 bars.
2) The swing high average is in the top third of the distance between the highest high of the swing highs and the lowest low of the swing lows.
3) The swing low average is in the bottom third of the distance between the highest high of the swing highs and the lowest low of the swing lows.
4) The exponential average of the last 4 lows crosses under the resistance level.
9NUXZú+TZXOKYh) If the following conditions are true, place a sell order on the next bar at the open price:
1) The distance from the swing high average to the swing low average is greater than twice the average of the true range of the last 10 bars.
2) The swing high average is in the top third of the distance between the highest high of the swing highs and the lowest low of the swing lows.
3) The swing low average is in the bottom third of the distance between the highest high of the swing highs and the lowest low of the swing lows.
4) The exponential average of the last 4 highs crosses over the support level.
+^OZú5XJKXYi) Place a money management protective stop order.
j) If an open long position has a profit, exit when the market retraces to the lowest low of the last 8 bars.
k) If an open short position has a profit, exit when the market breaks out of the highest high of the last 8 bars.
*KYOMTOTMúôú,UXSGZZOTMThis section presents the EasyLanguage instructions and formatting for the system, with the EasyLanguage instructions broken down and explained line by line.
+GY_2GTM[GMKú/TYZX[IZOUTY ú9[VVUXZúGTJú8KYOYZGTIKú2K\KRYú9_YZKS
/TV[Z ú.O6XOIKò.OMNñîú2U6XOIKò2U]ñîú9ZXKTMZNòåñîú4[S9]OTMòçñîú:XGOR(GXòåñîú2TM9NXYòéêêñîú9NXZ9NXYòéêêñ!<GXOGHRKY úPòêñîú9.ò,GRYKñîú92ò,GRYKñîú9]OTM.'\Mòêñîú9]OTM2'\Mòêñîú.O8KGJ_ò,GRYKñîú2U8KGJ_ò,GRYKñîúTU:2*XG]TòZX[Kñîú'JJ+^OZ6XOIKòêñîú2U]KYZ2Uòêñîú.OMNKYZ.Oòêñ!'XXG_Y ú9]OTM.OAèîèêCòêñîú9]OTM2UAèîèêCòêñ!
åèúúúúúúúúúú9[VVUXZúGTJú8KYOYZGTIKú2K\KRYúúúúúúúúúú 5SKMGú8KYKGXINú9_YZKSú:XGJOTMúGTJú*K\KRUVKSKTZú)R[Húíú<UR[SKú/
aú,OTJOTMúGú9]OTMú.OMNúGTJúYZUXOTMúOZúOTúZNKúGXXG_úc9.ú#ú9]OTM.OMN(GXòúéúîú.O6XOIKúîú9ZXKTMZNúîú9ZXKTMZNïéúñú#ú9ZXKTMZN!/Lú9.úZNKTú(KMOT
,UXúPú#úêúZUúéáú(KMOT9]OTM.OAêúîúèêúíúPCú#ú9]OTM.OAêúîúéáúíúPC!9]OTM.OAéîúèêúíúPCú#ú9]OTM.OAéúîúéáúíúPC!9]OTM.OAèîúèêúíúPCú#ú9]OTM.OAèúîúéáúíúPC!
+TJ!9]OTM.OAêîêCú#ú*GZKA9ZXKTMZNC!9]OTM.OAéîêCú#ú:OSKA9ZXKTMZNC!9]OTM.OAèîêCú#ú.O6XOIKA9ZXKTMZNC!/Lú9]OTM.OAúéîúT[SY]OTMúíúéCú"$úêúZNKTú
.O8KGJ_ú#ú:X[K!+TJ!
aú,/TJOTMúGú9]OTMú2U]úGTJúYZUXOTMúOZúOTúZNKúGXXG_úc92ú#ú9]OTM2U](GXòúéúîú2U6XOIKúîú9ZXKTMZNúîú9ZXKTMZNïéúñú#ú9ZXKTMZN!/Lú92úZNKTú(KMOT
,UXúPú#úêúZUúéáú(KMOT9]OTM2UAêúîúèêúíúPCú#ú9]OTM2UAêúîúéáúíúPC!9]OTM2UAéîúèêúíúPCú#ú9]OTM2UAéúîúéáúíúPC!9]OTM2UAèîúèêúíúPCú#ú9]OTM2UAèúîúéáúíúPC!
+TJ!9]OTM2UAêîêCú#ú*GZKA9ZXKTMZNC!9]OTM2UAéîêCú#ú:OSKA9ZXKTMZNC!9]OTM2UAèîêCú#ú2U6XOIKA9ZXKTMZNC!/Lú9]OTM2UAúéîúT[SY]OTMúíúéCú"$úêúZNKT
2U8KGJ_ú#ú:X[K!+TJ!2U]KYZ2Uú#úáááá!ú.OMNKYZ.Oú#úê!9]OTM.'\Mú#úê!ú9]OTM2'\Mú#úê!,UXúPú#úêúZUú4[S9]OTMíéú(KMOT
9]OTM.'\Mú#ú9]OTM.'\Múïú9]OTM.OAúèúîúPúC!9]OTM2'\Mú#ú9]OTM2'\Múïú9]OTM2UAúèúîúPúC!/Lú9]OTM.OAúèîúPúCú$ú.OMNKYZ.OúZNKT
.OMNKYZ.Oú#ú9]OTM.OAúèúîúPúC!/Lú9]OTM2UAúèîúPúCú"ú2U]KYZ2UúZNKT
2U]KYZ2Uú#ú9]OTM2UAúèúîúPúC!+TJ!9]OTM.'\Mú#ú9]OTM.'\Múëú4[S9]OTM!9]OTM2'\Mú#ú9]OTM2'\Múëú4[S9]OTM!/Lú.O8KGJ_úGTJú2U8KGJ_ú'4*úTU:2*XG]TúZNKTú(KMOT
<GR[Kéú#ú:2E4K]òú9]OTM.OAúêúîú4[S9]OTMúíúéCúîú9]OTM.OAúéúîú4[S9]OTMúíúéCîú9]OTM.'\Mî9]OTM.OAúêúîúêCúîú9]OTM.OAúéúîúêCîú9]OTM.'\Mñ!
<GR[Kèú#ú:2E4K]òú9]OTM2UAúêúîú4[S9]OTMúíúéCúîú9]OTM2UAúéúîú4[S9]OTMúíúéCîú9]OTM2'\Mî9]OTM2UAúêúîúêCúîú9]OTM2UAúéúîúêCîú9]OTM2'\Mñ!
<GR[Kááú#ú:2E9KZ+^Z8OMNZòú\GR[Kéúîú:X[Kúñ!<GR[Kááú#ú:2E9KZ+^Z8OMNZòú\GR[Kèúîú:X[Kúñ!TU:2*XG]Tú#ú,GRYK!
+TJ!
/LúTU:2*XG]Tú#ú,GRYKúZNKTú(KMOT<GR[Kááú#ú:2E9KZ+TJò\GR[Kéîú9]OTM.OAúêúîú4[S9]OTMúíúéCúîú9]OTM.OAúéúîú4[S9]OTMúíúéCî
ú9]OTM.'\Mñ!ú <GR[Kááú#ú:2E9KZ(KMOTò\GR[Kéúîúú9]OTM.OAúêúîúêCúîú9]OTM.OAúéúîúêCúîú9]OTM.'\Mñ!
<GR[Kááú#ú:2E9KZ+TJò\GR[Kèîú9]OTM2UAúêúîú4[S9]OTMúíúéCúîú9]OTM2UAúéúîú4[S9]OTMúíúéCîú9]OTM2'\Mñ!
)NGVZKXúçúúúúúú9[VVUXZúôú8KYOYZGTIKú9_YZKSY 9[VVUXZúGTJú8KYOYZGTIKú2K\KRYúúúúúúúúúúåç
ú <GR[Kááú#ú:2E9KZ(KMOTò\GR[Kèîú9]OTM2UAúêúîúêCúîú9]OTMRUúAúéúîúêCúîú9]OTM2'\Mñ!+TJ!
/Lú.OMNKYZ.Oúíú2U]KYZ2Uú"$úêúZNKTú(KMOT<GR[Kéãú#úòú9]OTM.'\Múíú2U]KYZ2Uúñúëúúòú.OMNKYZ.Oúíú2U]KYZ2Uúñ!<GR[Kéâú#úòú9]OTM2'\Múíú2U]KYZ2Uúñúëúòú.OMNKYZ.Oúíú2U]KYZ2Uúñ!
+TJ!
)UTJOZOUTéú#ú9]OTM.'\Múíú9]OTM2'\Mú$ú'\KXGMKòú:X[K8GTMKúîúéêúñðè!)UTJOZOUTèú#ú<GR[Kéãú$úìääú'4*ú<GR[Kéâú"úìçç!)UTJOZOUTçú#ú)RUYKú"ú9]OTM.'\Mú'4*ú)RUYKú$ú9]OTM2'\M!/Lú)UTJOZOUTéú'4*ú)UTJOZOUTèú'4*ú)UTJOZOUTçúúZNKTú(KMOT
/Lú>'\KXGMKòú.OMNúîúæúñú)XUYYKYú;TJKXú9]OTM.'\MúZNKT9KRRú9NXZ9NXYú9NGXKYúTK^ZúHGXúGZú3GXQKZ!
/Lú>'\KXGMKòú2U]úîúæúñú)XUYYKYú5\KXú9]OTM2'\MúZNKT([_ú2TM9NXYú9NGXKYúTK^ZúHGXúGZú3GXQKZ!
+TJ!
/Lú6UYOZOUT6XULOZú$úêúZNKTú(KMOT+^OZ2UTMúTK^ZúHGXúGZú2U]KYZòú2U]úîú:XGORHGXúñú9ZUV!+^OZ9NUXZúTK^ZúHGXúGZú.OMNKYZòú.OMNúîú:XGORHGXúñú9ZUV!
+TJ!
/TV[ZYFollowing is the list of all the inputs we used in this system:
In addition to the inputs, we declared several variables, as follows:
<GXY úú6IZ)NGTMKéòêñîú6IZ)NGTMKèòêñîú9VXKGJòêñîú+^ZXG3KGY[XKòêñ!
The following sections discuss how the set up, long and short entries, as well as the exits, are calculated.
9KZ[VThis system will use 2 arrays to track the swing highs and the swing lows. These arrays will hold the information of the last 20 swings, with the most recent swing in row 0 and the oldest swing in row 20:
Input Default Value Description
HiPrice High Price series used when finding significant swing high points.
LoPrice Low Price series used when finding significant swing low points.
Strength 5 Number of bars to the left and right to be used when finding swing high and swing low bars.
NumSwing 3 Number of swing highs and swing lows to use when defining resistance and support levels respectively.
TrailBar 5 Number of bars to consider when placing trailing stop orders at the lowest low and highest high of long and short orders respectively.
LngShrs 100 Number of shares or contracts to buy when a long order is generated.
ShrtShrs 100 Number of shares or contracts to buy when a short signal is generated.
åæúúúúúúúúúú9[VVUXZúGTJú8KYOYZGTIKú2K\KRYúúúúúúúúúú 5SKMGú8KYKGXINú9_YZKSú:XGJOTMúGTJú*K\KRUVKSKTZú)R[Húíú<UR[SKú/
'XXG_Y ú9]OTM.OAèîèêCòêñîú9]OTM2UAèîèêCòêñ!
As mentioned before, the most recent swing will be stored in row 0 of the array and the oldest in row 20. Every time that a new swing is found, the array will discard the information of the oldest swing, and move the information of each swing one row up. When this is done, the information for the new swing is stored in row 0:
aú,OTJOTMúGú9]OTMú.OMNúGTJúYZUXOTMúOZúOTúZNKúGXXG_úc9.ú#ú9]OTM.OMN(GXòúéúîú.O6XOIKúîú9ZXKTMZNúîú9ZXKTMZNïéúñú#ú9ZXKTMZN!/Lú9.úZNKTú(KMOT
,UXúPú#úêúZUúéáú(KMOT9]OTM.OAêúîúèêúíúPCú#ú9]OTM.OAêúîúéáúíúPC!9]OTM.OAéîúèêúíúPCú#ú9]OTM.OAéúîúéáúíúPC!9]OTM.OAèîúèêúíúPCú#ú9]OTM.OAèúîúéáúíúPC!
+TJ!9]OTM.OAêîêCú#ú*GZKA9ZXKTMZNC!9]OTM.OAéîêCú#ú:OSKA9ZXKTMZNC!9]OTM.OAèîêCú#ú.O6XOIKA9ZXKTMZNC!/Lú9]OTM.OAúéîú4[S9]OTMúíúéCú"$úêúZNKT
.O8KGJ_ú#ú:X[K!+TJ!
The last instruction before the end of the block IF-THEN statement (the instruction in the bold font above) will set the variable .O8KGJ_ to true as soon as there are enough swing highs to establish a resistance level. The system performs the same procedures with the swing lows. Next, the system finds the highest swing high, the lowest swing low, the average of the swing highs, and the average of the swing lows:
2U]KYZ2Uú#úáááá!ú.OMNKYZ.Oú#úê!9]OTM.'\Mú#úê!ú9]OTM2'\Mú#úê!,UXúPú#úêúZUú4[S9]OTMíéú(KMOT
9]OTM.'\Mú#ú9]OTM.'\Múïú9]OTM.OAúèúîúPúC!9]OTM2'\Mú#ú9]OTM2'\Múïú9]OTM2UAúèúîúPúC!/Lú9]OTM.OAúèîúPúCú$ú.OMNKYZ.OúZNKT
.OMNKYZ.Oú#ú9]OTM.OAúèúîúPúC!/Lú9]OTM2UAúèîúPúCú"ú2U]KYZ2UúZNKT
2U]KYZ2Uú#ú9]OTM2UAúèúîúPúC!+TJ!9]OTM.'\Mú#ú9]OTM.'\Múëú4[S9]OTM!9]OTM2'\Mú#ú9]OTM2'\Múëú4[S9]OTM!
In the following section, the system will draw trend lines and extend these trend lines to the right in the support and resistance levels. Note that it will attempt to draw the trend lines only if the there have been no trend lines drawn before and the variables .O8KGJ_ and 2U8KGJ_ are true:
/Lú.O8KGJ_úGTJú2U8KGJ_ú'4*úTU:2*XG]TúZNKTú(KMOT<GR[Kéú#ú:2E4K]òú9]OTM.OAúêúîú4[S9]OTMúíúéCúîú9]OTM.OAúéúîú4[S9]OTMúíúéCî9]OTM.'\Mîú9]OTM.OAúêúîúêCúîú9]OTM.OAúéúîúêCîú9]OTM.'\Mñ!<GR[Kèú#ú:2E4K]òú9]OTM2UAúêúîú4[S9]OTMúíúéCúîú9]OTM2UAúéúîú4[S9]OTMúíúéCî9]OTM2'\Mîú9]OTM2UAúêúîúêCúîú9]OTM2UAúéúîúêCîú9]OTM2'\Mñ!<GR[Kááú#ú:2E9KZ+^Z8OMNZòú<GR[Kéúîú:X[Kúñ!<GR[Kááú#ú:2E9KZ+^Z8OMNZòú<GR[Kèúîú:X[Kúñ!TU:2*XG]Tú#ú,GRYK!
+TJ!
Once the trend lines are drawn, the variable TU:2*XG]T will be false, so on every bar thereafter the system will adjust the beginning and ending points of the trend lines according to the most recent swing points found:
)NGVZKXúçúúúúúú9[VVUXZúôú8KYOYZGTIKú9_YZKSY 9[VVUXZúGTJú8KYOYZGTIKú2K\KRYúúúúúúúúúúåå
/LúTU:2*XG]Tú#ú,GRYKúZNKTú(KMOT<GR[Kááú#ú:2E9KZ+TJò\GR[Kéîú9]OTM.OAúêúîú4[S9]OTMúíúéCúîú9]OTM.OAúéúîú4[S9]OTMúíúéCîú9]OTM.'\Mñ!
ú <GR[Kááú#ú:2E9KZ(KMOTò<GR[Kéúîúú9]OTM.OAúêúîúêCúîú9]OTM.OAúéúîúêCúîú9]OTM.'\Mñ!<GR[Kááú#ú:2E9KZ+TJò<GR[Kèîú9]OTM2UAúêúîú4[S9]OTMúíúéCúîú9]OTM2UAúéúîú4[S9]OTMúíúéCî
ú 9]OTM2'\Mñ!ú <GR[Kááú#ú:2E9KZ(KMOTò<GR[Kèîú9]OTM2UAúêúîúêCúîú9]OTMRUúAúéúîúêCúîú9]OTM2'\Mñ!+TJ!
The system will then identify the position the support in resistance levels in respect to the highest and lowest swings found:
/Lú.OMNKYZ.Oúíú2U]KYZ2Uú"$úêúZNKTú(KMOT<GR[Kéãú#úòú9]OTM.'\Múíú2U]KYZ2Uúñúëúúòú.OMNKYZ.Oúíú2U]KYZ2Uúñ!ú<GR[Kéâú#úòú9]OTM2'\Múíú2U]KYZ2Uúñúëúòú.OMNKYZ.Oúíú2U]KYZ2Uúñ!
+TJ!
2UTMú+TZXOKYThree conditions will have to be met for the system to place orders: first, the distance from the resistance to the support line has to be at least twice the average true range of the last 10 bars, the support line has to be in the lower third of the range between the highest swing high and the lowest swing low (Value18 < .33 ) and the resistance line has to be in the upper third of the range between the highest swing high and the lowest swing low (Value17 > .66), and last the close of the bar has to be within the support and resistance levels:
)UTJOZOUTéú#ú9]OTM.'\Múíú9]OTM2'\Mú$ú'\KXGMKòú:X[K8GTMKúîúéêúñðè!)UTJOZOUTèú#ú<GR[Kéãú$úìääú'4*ú<GR[Kéâú"úìçç!)UTJOZOUTçú#ú)RUYKú"ú9]OTM.'\Mú'4*ú)RUYKú$ú9]OTM2'\M!/Lú)UTJOZOUTéú'4*ú)UTJOZOUTèú'4*ú)UTJOZOUTçúúZNKTú(KMOT
/Lú>'\KXGMKòú.OMNúîúæúñú)XUYYKYú;TJKXú9]OTM.'\MúZNKT9KRRú9NXZ9NXYú9NGXKYúTK^ZúHGXúGZú3GXQKZ!
/Lú>'\KXGMKòú2U]úîúæúñú)XUYYKYú5\KXú9]OTM2'\MúZNKT([_ú2TM9NXYú9NGXKYúTK^ZúHGXúGZú3GXQKZ!
+TJ!
+^OZú5XJKXYBecause we are looking to buy at the support and sell at the resistance, and we want to place atrailing stop to capture profits, we will wait for the system to give profit to place the trailing stops.
A trailing stop will be placed in the long side at the lowest low of the last :XGORHGX bars and on the short side at the highest high of the last :XGORHGX bars. To protect for losses at the bar of entry or If an order has not given profit, a money management stop will be placed. Please refer to the general system format section below.
/Lú6UYOZOUT6XULOZú$úêúZNKTú(KMOT+^OZ2UTMúTK^ZúHGXúGZú2U]KYZòú2U]úîú:XGORHGXúñú9ZUV!+^OZ9NUXZúTK^ZúHGXúGZú.OMNKYZòú.OMNúîú:XGORHGXúñú9ZUV!
+TJ!
-KTKXGRú9_YZKSú,UXSGZa) In the Costs tab, we entered the appropriate amounts for commission and slippage. If applicable, we would include margin. We did not change the Default Contracts option, we left it at one.
Note: Remember that commissions are calculated on a per contract/share basis. When you are trading stocks, you would enter the average commission you are charged divided by the number
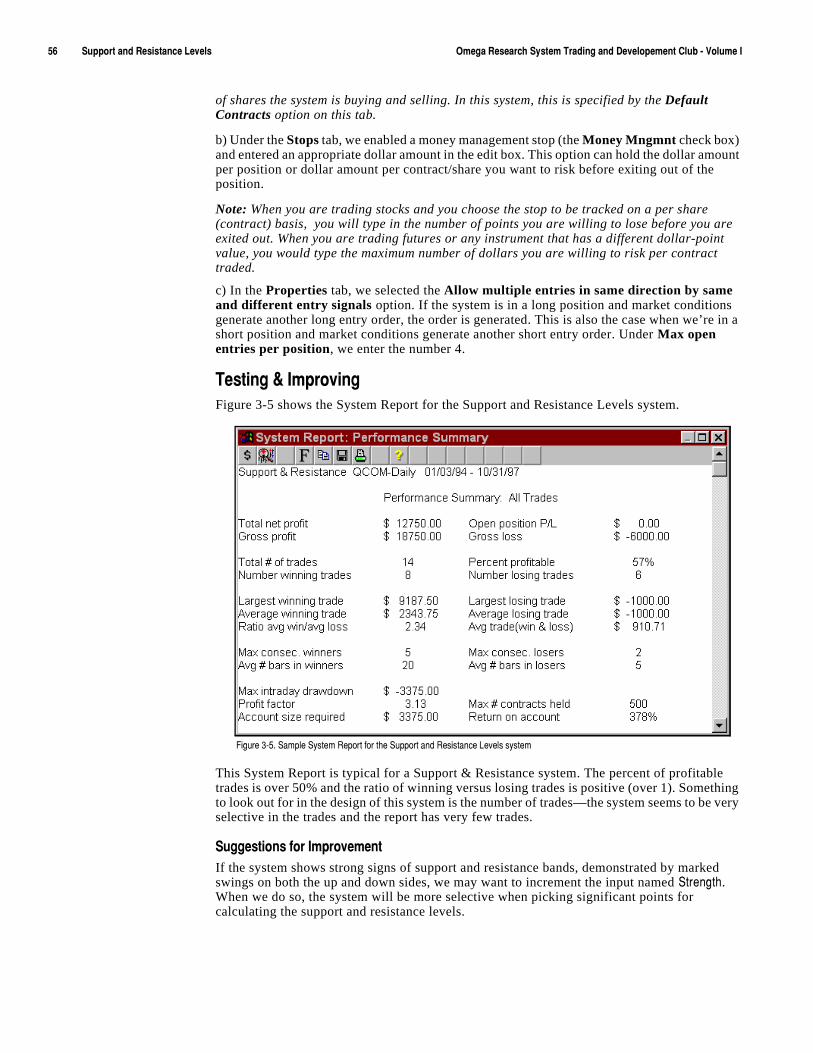
åäúúúúúúúúúú9[VVUXZúGTJú8KYOYZGTIKú2K\KRYúúúúúúúúúú 5SKMGú8KYKGXINú9_YZKSú:XGJOTMúGTJú*K\KRUVKSKTZú)R[Húíú<UR[SKú/
of shares the system is buying and selling. In this system, this is specified by the Default Contracts option on this tab.
b) Under the Stops tab, we enabled a money management stop (the Money Mngmnt check box) and entered an appropriate dollar amount in the edit box. This option can hold the dollar amount per position or dollar amount per contract/share you want to risk before exiting out of the position.
Note: When you are trading stocks and you choose the stop to be tracked on a per share (contract) basis, you will type in the number of points you are willing to lose before you are exited out. When you are trading futures or any instrument that has a different dollar-point value, you would type the maximum number of dollars you are willing to risk per contract traded.
c) In the Properties tab, we selected the Allow multiple entries in same direction by same and different entry signals option. If the system is in a long position and market conditions generate another long entry order, the order is generated. This is also the case when we’re in a short position and market conditions generate another short entry order. Under Max open entries per position, we enter the number 4.
:KYZOTMúôú/SVXU\OTMFigure 3-5 shows the System Report for the Support and Resistance Levels system.
This System Report is typical for a Support & Resistance system. The percent of profitable trades is over 50% and the ratio of winning versus losing trades is positive (over 1). Something to look out for in the design of this system is the number of trades—the system seems to be very selective in the trades and the report has very few trades.
9[MMKYZOUTYúLUXú/SVXU\KSKTZIf the system shows strong signs of support and resistance bands, demonstrated by marked swings on both the up and down sides, we may want to increment the input named 9ZXKTMZN. When we do so, the system will be more selective when picking significant points for calculating the support and resistance levels.
,OM[XKúçíåìú9GSVRKú9_YZKSú8KVUXZúLUXúZNKú9[VVUXZúGTJú8KYOYZGTIKú2K\KRYúY_YZKS

)NGVZKXúçúúúúúú9[VVUXZúôú8KYOYZGTIKú9_YZKSY 9[VVUXZúGTJú8KYOYZGTIKú2K\KRYúúúúúúúúúúåã
Also, if the market tends to stay in a price range for longer periods of time, we may want to increment the value of the input named 4[S9]OTM. This will make the system consider more significant points when determining the support and resistance levels. Currently, the input defaults to 3, and we may want to consider 4 or 5 points instead.
Aside from changing the inputs, we may want to consider the following ideas:
a) We may want to change the orders to Limit orders. We would buy limit at the resistance level and sell limit at the support level. This will make the system more active but more susceptible to bad signals. To counter this, we could add an extra measure to the support and resistance levels.
b) Instead of just exiting out of a trade when the price action penetrates the support or resistance levels, we could place stop orders to reverse our position if the market starts trending past these levels. So if we are in a short position when the market action reaches the resistance level, but the symbol breaks through the resistance and starts to trend upwards, we will be exited from the short position and entered into a long position.

åâúúúúúúúúúú9[VVUXZúGTJú8KYOYZGTIKú2K\KRYúúúúúúúúúú 5SKMGú8KYKGXINú9_YZKSú:XGJOTMúGTJú*K\KRUVKSKTZú)R[Húíú<UR[SKú/
C H A P T E R 4
<URGZOROZ_ú(XKGQU[Zú9_YZKSY
Volatile markets are characterized by sharp jumps in price, and volatility breakout systems are designed to take advantage of this type of change in volatility. Volatility breakout systems generally have the following characteristics:
� Substantial amount of time out of the market.
� High percentage of winning trades, but with a small profit per trade.
� Don’t take advantage of big moves.
� Exciting to trade because trades are quick and short-term.
� Based solely on price movement.
When designing this type of system, the key is to effectively anticipate and take advantage of a significant change in volatility and then exit the position before a loss of profit. In this chapter, we present four volatility breakout systems, three of which differ in their approach but are all designed to capture significant change in volatility and limit losses during directionless and/or trending phases.
/Tú:NOYú)NGVZKX
� Pivot Points .....................................60
� Pivot Points Intra-day .....................65
� Channel Breakout ............................70
� Volatility Expansion (Volex) ...........76
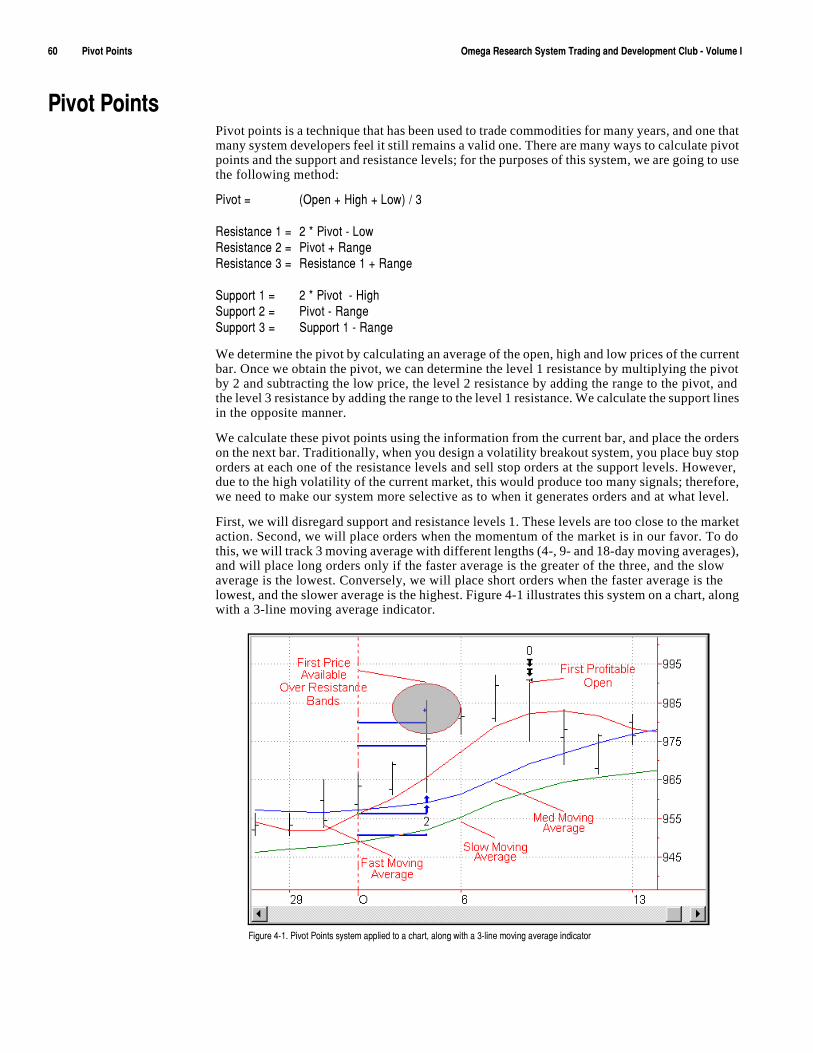
äêúúúúúúúúúú6O\UZú6UOTZYúúúúúúúúúú 5SKMGú8KYKGXINú9_YZKSú:XGJOTMúGTJú*K\KRUVSKTZú)R[Húíú<UR[SKú/
6O\UZú6UOTZYPivot points is a technique that has been used to trade commodities for many years, and one that many system developers feel it still remains a valid one. There are many ways to calculate pivot points and the support and resistance levels; for the purposes of this system, we are going to use the following method:
6O\UZú#ú ò5VKTúïú.OMNúïú2U]ñúëúç
8KYOYZGTIKúéú#úúèúðú6O\UZúíú2U]8KYOYZGTIKúèú#ú 6O\UZúïú8GTMK8KYOYZGTIKúçú#ú 8KYOYZGTIKúéúïú8GTMKú
9[VVUXZúéú# èúðú6O\UZúúíú.OMN9[VVUXZúèú#ú 6O\UZúíú8GTMK9[VVUXZúçú#ú 9[VVUXZúéúíú8GTMK
We determine the pivot by calculating an average of the open, high and low prices of the current bar. Once we obtain the pivot, we can determine the level 1 resistance by multiplying the pivot by 2 and subtracting the low price, the level 2 resistance by adding the range to the pivot, and the level 3 resistance by adding the range to the level 1 resistance. We calculate the support lines in the opposite manner.
We calculate these pivot points using the information from the current bar, and place the orders on the next bar. Traditionally, when you design a volatility breakout system, you place buy stop orders at each one of the resistance levels and sell stop orders at the support levels. However, due to the high volatility of the current market, this would produce too many signals; therefore, we need to make our system more selective as to when it generates orders and at what level.
First, we will disregard support and resistance levels 1. These levels are too close to the market action. Second, we will place orders when the momentum of the market is in our favor. To do this, we will track 3 moving average with different lengths (4-, 9- and 18-day moving averages), and will place long orders only if the faster average is the greater of the three, and the slow average is the lowest. Conversely, we will place short orders when the faster average is the lowest, and the slower average is the highest. Figure 4-1 illustrates this system on a chart, along with a 3-line moving average indicator.
,OM[XKúæíéìú6O\UZú6UOTZYúY_YZKSúGVVROKJúZUúGúINGXZîúGRUTMú]OZNúGúçíROTKúSU\OTMúG\KXGMKúOTJOIGZUX
)NGVZKXúæúúúúúú<URGZOROZ_ú(XKGQU[Zú9_YZKSY 6O\UZú6UOTZYúúúúúúúúúúäé
Figure 4-1 shows how a buy order was filled at the first available price above the resistance level.
For our exits, we will exit in a few different ways. First, we will exit all positions, short or long, at the first profitable open. However, in case we do not have a profit, we will place trailing stops that will exit long positions at the lowest low of the last 4 bars and short positions at the highest high of the last 4 bars. Also, we will use a money management stop, the level of which will depend on how much money we are investing.
*KLOTOTMú_U[Xú:XGJOTMú8[RKYIn this system, we defined both long entries and short entries as well as exit orders. We also did some setup work which included calculating the pivot point and the support and resistance lines. How we calculated the setup, entries and exits is described next.
9KZ[Va) Calculate the pivot points and the support and resistance lines as follows:
6O\UZú#úòú2U]úïú.OMNúïú)RUYKúñúëúç!8KYOYZGTIKéú#úòú6O\UZúðúèúñúíú2U]!8KYOYZGTIKèú#ú6O\UZúïú8GTMK!8KYOYZGTIKçú#ú8KYOYZGTIKéúïú8GTMK!9[VVUXZéú#úòú6O\UZúðúèúñúíú.OMN!9[VVUXZèú#ú6O\UZúíú8GTMK!9[VVUXZçú#ú9[VVUXZéúíú8GTMK!
b) We will consider the market to be in a bull trend if the fast moving average is greater than the medium moving average, and the medium moving average is greater than the slow moving average.
c) We will consider the market to be in a bear trend if the fast moving average is less than the medium moving average, and the medium moving average is less than the slow moving average.
2UTMú+TZXOKYd) If the market is considered to be in a bull trend, then buy when either the resistance 2 or resistance 3 level is reached.
9NUXZú+TZXOKYe) If the market is considered to be in a bear trend, then sell when either support 2 or support 3 level is penetrated.
+^OZYf) Exit at the first profitable open of any long or short trade (factoring in commissions).
g) When in a long position, exit if the price retraces to the lowest low of the last 4 bars.
h) When in a short position, exit if the price breaks the highest high of the last 4 bars.
i) Place a money management protective stop.
*KYOMTOTMúôú,UXSGZZOTMThis section presents the EasyLanguage instructions and formatting for the system, with the EasyLanguage instructions broken down and explained line by line.
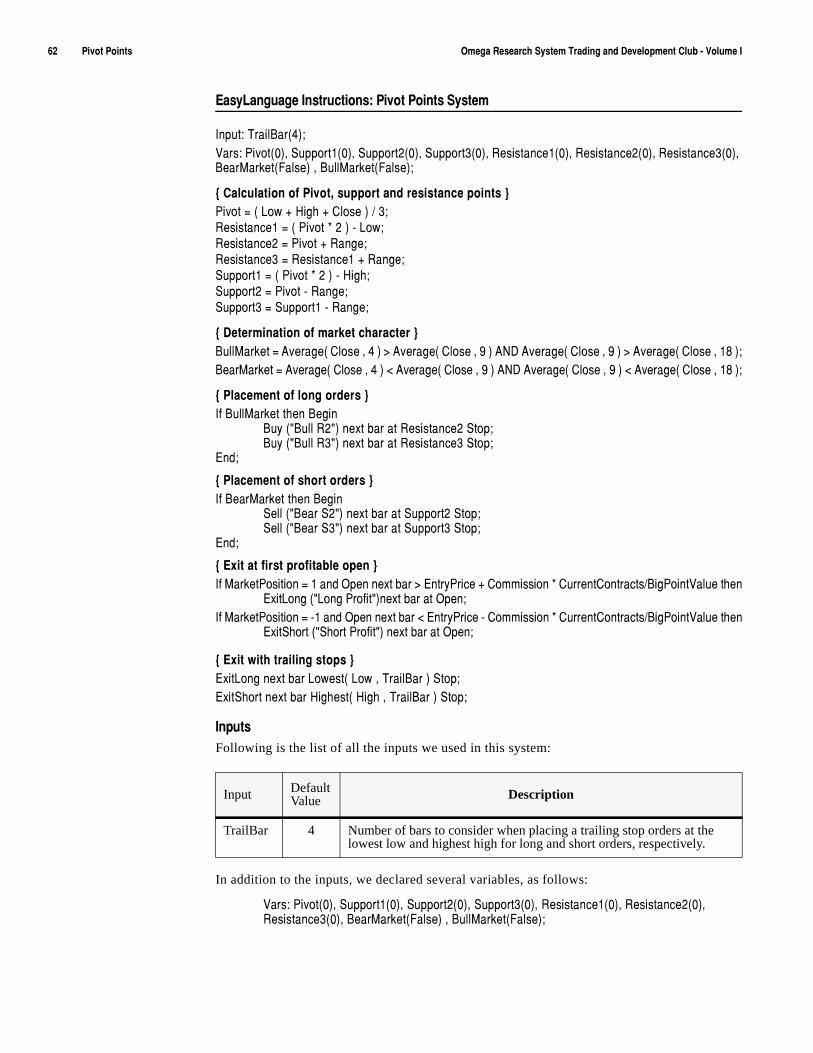
äèúúúúúúúúúú6O\UZú6UOTZYúúúúúúúúúú 5SKMGú8KYKGXINú9_YZKSú:XGJOTMúGTJú*K\KRUVSKTZú)R[Húíú<UR[SKú/
+GY_2GTM[GMKú/TYZX[IZOUTY ú6O\UZú6UOTZYú9_YZKS
/TV[Z ú:XGOR(GXòæñ!<GXY ú6O\UZòêñîú9[VVUXZéòêñîú9[VVUXZèòêñîú9[VVUXZçòêñîú8KYOYZGTIKéòêñîú8KYOYZGTIKèòêñîú8KYOYZGTIKçòêñîú(KGX3GXQKZò,GRYKñúîú([RR3GXQKZò,GRYKñ!
aú)GRI[RGZOUTúULú6O\UZîúY[VVUXZúGTJúXKYOYZGTIKúVUOTZYúc6O\UZú#úòú2U]úïú.OMNúïú)RUYKúñúëúç!8KYOYZGTIKéú#úòú6O\UZúðúèúñúíú2U]!8KYOYZGTIKèú#ú6O\UZúïú8GTMK!8KYOYZGTIKçú#ú8KYOYZGTIKéúïú8GTMK!9[VVUXZéú#úòú6O\UZúðúèúñúíú.OMN!9[VVUXZèú#ú6O\UZúíú8GTMK!9[VVUXZçú#ú9[VVUXZéúíú8GTMK!
aú*KZKXSOTGZOUTúULúSGXQKZúINGXGIZKXúc([RR3GXQKZú#ú'\KXGMKòú)RUYKúîúæúñú$ú'\KXGMKòú)RUYKúîúáúñú'4*ú'\KXGMKòú)RUYKúîúáúñú$ú'\KXGMKòú)RUYKúîúéâúñ!(KGX3GXQKZú#ú'\KXGMKòú)RUYKúîúæúñú"ú'\KXGMKòú)RUYKúîúáúñú'4*ú'\KXGMKòú)RUYKúîúáúñú"ú'\KXGMKòú)RUYKúîúéâúñ!
aú6RGIKSKTZúULúRUTMúUXJKXYúc/Lú([RR3GXQKZúZNKTú(KMOT
([_úòø([RRú8èøñúTK^ZúHGXúGZú8KYOYZGTIKèú9ZUV!([_úòø([RRú8çøñúTK^ZúHGXúGZú8KYOYZGTIKçú9ZUV!
+TJ!
aú6RGIKSKTZúULúYNUXZúUXJKXYúc/Lú(KGX3GXQKZúZNKTú(KMOT
9KRRúòø(KGXú9èøñúTK^ZúHGXúGZú9[VVUXZèú9ZUV!9KRRúòø(KGXú9çøñúTK^ZúHGXúGZú9[VVUXZçú9ZUV!
+TJ!
aú+^OZúGZúLOXYZúVXULOZGHRKúUVKTúc/Lú3GXQKZ6UYOZOUTú#úéúGTJú5VKTúTK^ZúHGXú$ú+TZX_6XOIKúïú)USSOYYOUTúðú)[XXKTZ)UTZXGIZYë(OM6UOTZ<GR[KúZNKT
+^OZ2UTMúòø2UTMú6XULOZøñTK^ZúHGXúGZú5VKT!/Lú3GXQKZ6UYOZOUTú#úíéúGTJú5VKTúTK^ZúHGXú"ú+TZX_6XOIKúíú)USSOYYOUTúðú)[XXKTZ)UTZXGIZYë(OM6UOTZ<GR[KúZNKTú +^OZ9NUXZúòø9NUXZú6XULOZøñúTK^ZúHGXúGZú5VKT!
aú+^OZú]OZNúZXGOROTMúYZUVYúc+^OZ2UTMúTK^ZúHGXú2U]KYZòú2U]úîú:XGOR(GXúñú9ZUV!+^OZ9NUXZúTK^ZúHGXú.OMNKYZòú.OMNúîú:XGOR(GXúñú9ZUV!ú
/TV[ZYFollowing is the list of all the inputs we used in this system:
In addition to the inputs, we declared several variables, as follows:
<GXY ú6O\UZòêñîú9[VVUXZéòêñîú9[VVUXZèòêñîú9[VVUXZçòêñîú8KYOYZGTIKéòêñîú8KYOYZGTIKèòêñîú 8KYOYZGTIKçòêñîú(KGX3GXQKZò,GRYKñúîú([RR3GXQKZò,GRYKñ!
Input Default Value Description
TrailBar 4 Number of bars to consider when placing a trailing stop orders at the lowest low and highest high for long and short orders, respectively.
)NGVZKXúæúúúúúú<URGZOROZ_ú(XKGQU[Zú9_YZKSY 6O\UZú6UOTZYúúúúúúúúúúäç
The following sections discuss the setup and how the long and short entries, as well as the exits, are calculated.
9KZ[VThe pivot point and the support and resistance levels will be calculated using the following expressions:
6O\UZú#úòú2U]úïú.OMNúïú)RUYKúñúëúç!8KYOYZGTIKéú#úòú6O\UZúðúèúñúíú2U]!8KYOYZGTIKèú#ú6O\UZúïú8GTMK!8KYOYZGTIKçú#ú8KYOYZGTIKéúïú8GTMK!9[VVUXZéú#úòú6O\UZúðúèúñúíú.OMN!9[VVUXZèú#ú6O\UZúíú8GTMK!9[VVUXZçú#ú9[VVUXZéúíú8GTMK!
We will determine the character of the market, bullish or bearish, by making the following comparisons:
([RR3GXQKZú#ú'\KXGMKòú)RUYKúîúæúñú$ú'\KXGMKòú)RUYKúîúáúñú'4*ú'\KXGMKòú)RUYKúîúáúñú$ú'\KXGMKòú)RUYKúîúéâúñ!(KGX3GXQKZú#ú'\KXGMKòú)RUYKúîúæúñú"ú'\KXGMKòú)RUYKúîúáúñú'4*ú'\KXGMKòú)RUYKúîúáúñú"ú'\KXGMKòú)RUYKúîúéâúñ!
2UTMú+TZXOKYIf the market is considered bullish, the system will place orders to enter a long position at either the resistance 2 and resistance 3 level:
/Lú([RR3GXQKZúZNKTú(KMOT([_úòø([RRú8èøñúTK^ZúHGXúGZú8KYOYZGTIKèú9ZUV!([_úòø([RRú8çøñúTK^ZúHGXúGZú8KYOYZGTIKçú9ZUV!
+TJ!
9NUXZú+TZXOKYIf the market is considered bearish, the system will place orders to enter a short position at either the support 2 and support 3 level:
/Lú(KGX3GXQKZúZNKTúHKMOT9KRRúòø(KGXú9èøñúTK^ZúHGXúGZú9[VVUXZèú9ZUV!9KRRúòø(KGXú9çøñúTK^ZúHGXúGZú9[VVUXZçú9ZUV!
+TJ!
+^OZYThis system will exit in a number of different ways. First, we will exit out of any position at the first profitable open. To determine when the first profitable open occurs, we compare the open of the next bar to the entry price, making sure we take into account commissions. Commissions are specified on a per contract/share basis; therefore, we have to multiply the value returned by the )USSOYYOUT function by the number of contracts held (returned by the )[XXKTZ)UTZXGIZY function), and then divide this value by the big point value of the instrument. The big point value is the dollar value of a full point move; we can easily obtain it using the (OM6UOTZ<GR[K function:
/Lú3GXQKZ6UYOZOUT#éúGTJú5VKTúTK^ZúHGXú$ú+TZX_6XOIKï)USSOYYOUTúðú)[XXKTZ)UTZXGIZYúëú(OM6UOTZ<GR[KúZNKTú+^OZ2UTMúòø2UTMú6XULOZøñTK^ZúHGXúGZú5VKT!
/Lú3GXQKZ6UYOZOUT#íéúGTJú5VKTúTK^ZúHGXú"ú+TZX_6XOIKí)USSOYYOUTð)[XXKTZ)UTZXGIZYë(OM6UOTZ<GR[KúZNKT+^OZ9NUXZúòø9NUXZú6XULOZøñúTK^ZúHGXúGZú5VKT!
Second, the system will place a trailing stop at the lowest low of :XGOR(GX bars for long positions and a stop order at the highest high of the last :XGOR(GX bars for short positions.
+^OZ2UTMúTK^ZúHGXú2U]KYZòú2U]úîú:XGOR(GXúñú9ZUV!+^OZ9NUXZúTK^ZúHGXú.OMNKYZòú.OMNúîú:XGOR(GXúñú9ZUV!
Third, we’ll use a money management stop, as discussed in the next section.
:NKú8GTMKúL[TIZOUTúOYúVXU\OJKJúH_ú:XGJK9ZGZOUT!úOZúZGQKYúZNKúRU]úULúZNKúHGXúGTJúY[HZXGIZYúOZúLXUSúZNKúNOMNúULúZNKúHGXì
4UZOIKúZNGZúOTúZNKúYGSKúYZGZKSKTZú]KúIUSVGXKJúZNKúUVKTúULúZNKúTK^ZúHGXúZUúGú\GR[KúGTJúVRGIKJúGTúUXJKXúLUXúZNKúYGSKúUVKTúULúZNKúTK^ZúHGXìú
?U[úIGTTUZúXKLKXKTIKúZNKúUVKTúULúZNKúTK^ZúHGXú[TRKYYú_U[©XKúVRGIOTMúUXJKXYúLUXúZNKúTK^ZúHGXîúGTJú_U[úIGTTUZúXKLKXKTIKúZNKúUVKTúULúZNKúTK^ZúHGXú]NKTú[YOTMúS[RZOVRKúJGZGúYKXOKYì
:NOYúX[RKúJUKYT©ZúGVVR_ú]NKTú[YOTMúZNKú/TIR[JK9_YZKSúYZGZKSKTZìú
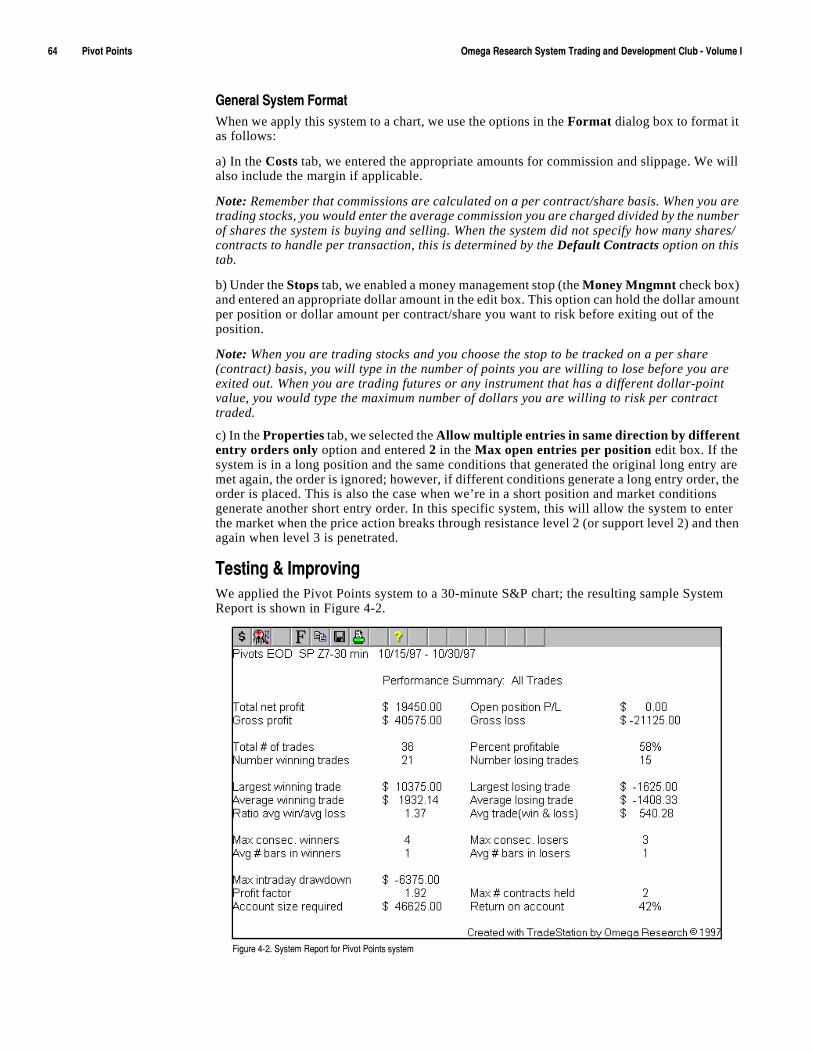
äæúúúúúúúúúú6O\UZú6UOTZYúúúúúúúúúú 5SKMGú8KYKGXINú9_YZKSú:XGJOTMúGTJú*K\KRUVSKTZú)R[Húíú<UR[SKú/
-KTKXGRú9_YZKSú,UXSGZWhen we apply this system to a chart, we use the options in the Format dialog box to format it as follows:
a) In the Costs tab, we entered the appropriate amounts for commission and slippage. We will also include the margin if applicable.
Note: Remember that commissions are calculated on a per contract/share basis. When you are trading stocks, you would enter the average commission you are charged divided by the number of shares the system is buying and selling. When the system did not specify how many shares/contracts to handle per transaction, this is determined by the Default Contracts option on this tab.
b) Under the Stops tab, we enabled a money management stop (the Money Mngmnt check box) and entered an appropriate dollar amount in the edit box. This option can hold the dollar amount per position or dollar amount per contract/share you want to risk before exiting out of the position.
Note: When you are trading stocks and you choose the stop to be tracked on a per share (contract) basis, you will type in the number of points you are willing to lose before you are exited out. When you are trading futures or any instrument that has a different dollar-point value, you would type the maximum number of dollars you are willing to risk per contract traded.
c) In the Properties tab, we selected the Allow multiple entries in same direction by different entry orders only option and entered 2 in the Max open entries per position edit box. If the system is in a long position and the same conditions that generated the original long entry are met again, the order is ignored; however, if different conditions generate a long entry order, the order is placed. This is also the case when we’re in a short position and market conditions generate another short entry order. In this specific system, this will allow the system to enter the market when the price action breaks through resistance level 2 (or support level 2) and then again when level 3 is penetrated.
:KYZOTMúôú/SVXU\OTMWe applied the Pivot Points system to a 30-minute S&P chart; the resulting sample System Report is shown in Figure 4-2.
,OM[XKúæíèìú9_YZKSú8KVUXZúLUXú6O\UZú6UOTZYúY_YZKS
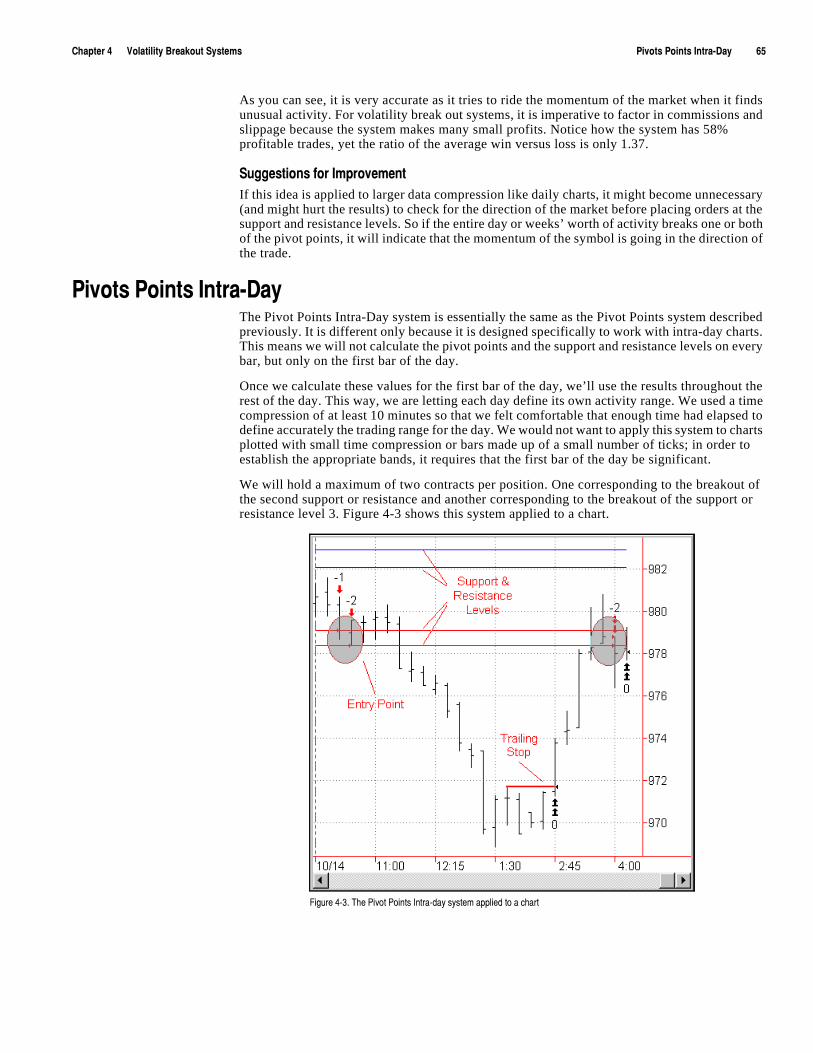
)NGVZKXúæúúúúúú<URGZOROZ_ú(XKGQU[Zú9_YZKSY 6O\UZYú6UOTZYú/TZXGí*G_úúúúúúúúúúäå
As you can see, it is very accurate as it tries to ride the momentum of the market when it finds unusual activity. For volatility break out systems, it is imperative to factor in commissions and slippage because the system makes many small profits. Notice how the system has 58% profitable trades, yet the ratio of the average win versus loss is only 1.37.
9[MMKYZOUTYúLUXú/SVXU\KSKTZIf this idea is applied to larger data compression like daily charts, it might become unnecessary (and might hurt the results) to check for the direction of the market before placing orders at the support and resistance levels. So if the entire day or weeks’ worth of activity breaks one or both of the pivot points, it will indicate that the momentum of the symbol is going in the direction of the trade.
6O\UZYú6UOTZYú/TZXGí*G_The Pivot Points Intra-Day system is essentially the same as the Pivot Points system described previously. It is different only because it is designed specifically to work with intra-day charts. This means we will not calculate the pivot points and the support and resistance levels on every bar, but only on the first bar of the day.
Once we calculate these values for the first bar of the day, we’ll use the results throughout the rest of the day. This way, we are letting each day define its own activity range. We used a time compression of at least 10 minutes so that we felt comfortable that enough time had elapsed to define accurately the trading range for the day. We would not want to apply this system to charts plotted with small time compression or bars made up of a small number of ticks; in order to establish the appropriate bands, it requires that the first bar of the day be significant.
We will hold a maximum of two contracts per position. One corresponding to the breakout of the second support or resistance and another corresponding to the breakout of the support or resistance level 3. Figure 4-3 shows this system applied to a chart.
,OM[XKúæíçìú:NKú6O\UZú6UOTZYú/TZXGíJG_úY_YZKSúGVVROKJúZUúGúINGXZ
ääúúúúúúúúúú6O\UZYú6UOTZYú/TZXGí*G_úúúúúúúúúú 5SKMGú8KYKGXINú9_YZKSú:XGJOTMúGTJú*K\KRUVSKTZú)R[Húíú<UR[SKú/
In terms of exits, we will exit out of any long positions if the price drops to the lowest low of the last 4 bars, and out of any short positions if the price reaches the highest high of the last 4 bars.
*KLOTOTMú_U[Xú:XGJOTMú8[RKYIn this system, we defined both long entries and short entries as well as exit orders. Again, the long and short entries reverse your position, whereas the exits will close out your existing position and exit you from the market. The entries and exits are described next.
9KZ[Va) Calculate the pivot points and the support and resistance lines using the prices available in the first intra-day period of the trading session:
6O\UZú#úòú2U]úïú.OMNúïú)RUYKúñúëúç!8KYOYZGTIKéú#úòú6O\UZúðúèúñúíú2U]!8KYOYZGTIKèú#ú6O\UZúïú8GTMK!8KYOYZGTIKçú#ú8KYOYZGTIKéúïú8GTMK!9[VVUXZéú#úòú6O\UZúðúèúñúíú.OMN!9[VVUXZèú#ú6O\UZúíú8GTMK!9[VVUXZçú#ú9[VVUXZéúíú8GTMK!
2UTMú+TZXOKYb) Unless it is the last trading period, buy at the resistance 2 or resistance 3 level or anything higher.
9NUXZú+TZXOKYc) Unless it is the last trading period, sell at the support 2 or support 3 level or anything lower.
+^OZú5XJKXYd) Exit out of any long positions if the price retraces to the lowest low of the last 4 bars.
e) Exit out of any short positions if the price breaks the highest high of the last 4 bars.
*KYOMTOTMúôú,UXSGZZOTMThis section presents the EasyLanguage instructions and formatting for the system, with the EasyLanguage instructions broken down and explained line by line.
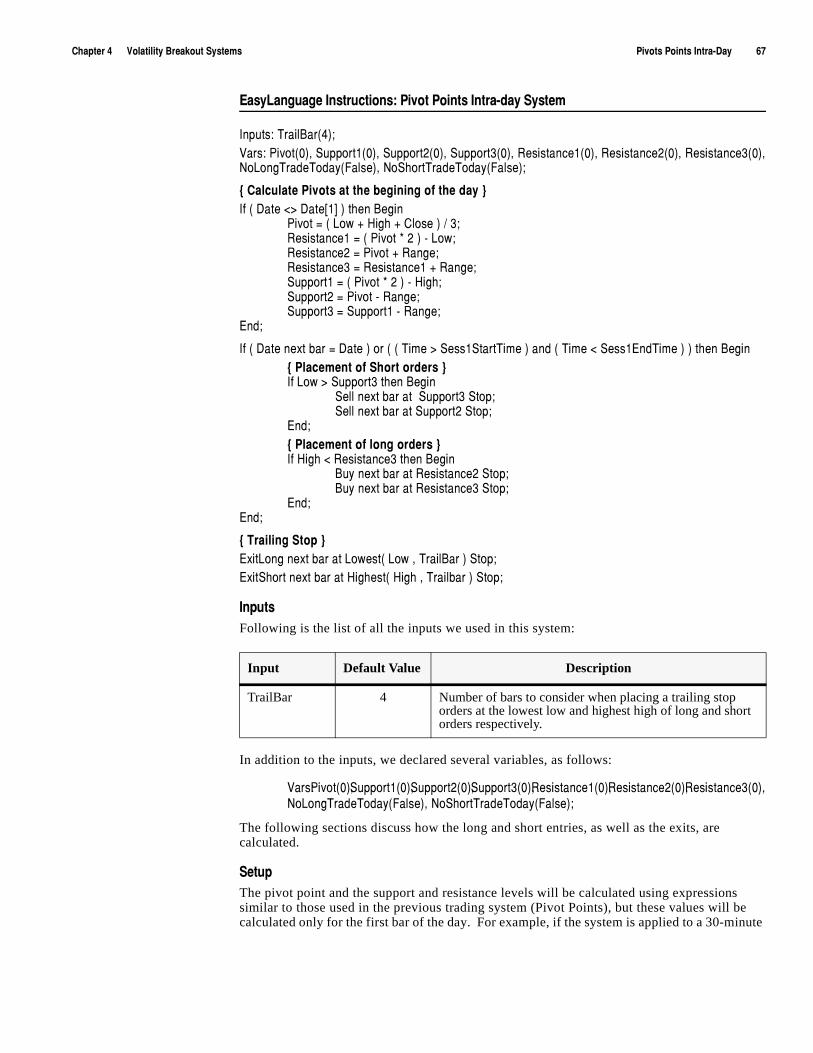
)NGVZKXúæúúúúúú<URGZOROZ_ú(XKGQU[Zú9_YZKSY 6O\UZYú6UOTZYú/TZXGí*G_úúúúúúúúúúäã
+GY_2GTM[GMKú/TYZX[IZOUTY ú6O\UZú6UOTZYú/TZXGíJG_ú9_YZKS
/TV[ZY ú:XGOR(GXòæñ!<GXY ú6O\UZòêñîú9[VVUXZéòêñîú9[VVUXZèòêñîú9[VVUXZçòêñîú8KYOYZGTIKéòêñîú8KYOYZGTIKèòêñîú8KYOYZGTIKçòêñî4U2UTM:XGJK:UJG_ò,GRYKñîú4U9NUXZ:XGJK:UJG_ò,GRYKñ!
aú)GRI[RGZKú6O\UZYúGZúZNKúHKMOTOTMúULúZNKúJG_úc/Lúòú*GZKú"$ú*GZKAéCúñúZNKTú(KMOT
6O\UZú#úòú2U]úïú.OMNúïú)RUYKúñúëúç!8KYOYZGTIKéú#úòú6O\UZúðúèúñúíú2U]!8KYOYZGTIKèú#ú6O\UZúïú8GTMK!8KYOYZGTIKçú#ú8KYOYZGTIKéúïú8GTMK!9[VVUXZéú#úòú6O\UZúðúèúñúíú.OMN!9[VVUXZèú#ú6O\UZúíú8GTMK!9[VVUXZçú#ú9[VVUXZéúíú8GTMK!
+TJ!
/Lúòú*GZKúTK^ZúHGXú#ú*GZKúñúUXúòúòú:OSKú$ú9KYYé9ZGXZ:OSKúñúGTJúòú:OSKú"ú9KYYé+TJ:OSKúñúñúZNKTú(KMOTaú6RGIKSKTZúULú9NUXZúUXJKXYúc/Lú2U]ú$ú9[VVUXZçúZNKTú(KMOT
9KRRúTK^ZúHGXúGZúú9[VVUXZçú9ZUV!9KRRúTK^ZúHGXúGZú9[VVUXZèú9ZUV!
+TJ!aú6RGIKSKTZúULúRUTMúUXJKXYúc/Lú.OMNú"ú8KYOYZGTIKçúZNKTú(KMOT
([_úTK^ZúHGXúGZú8KYOYZGTIKèú9ZUV!([_úTK^ZúHGXúGZú8KYOYZGTIKçú9ZUV!
+TJ!+TJ!
aú:XGOROTMú9ZUVúc+^OZ2UTMúTK^ZúHGXúGZú2U]KYZòú2U]úîú:XGOR(GXúñú9ZUV!+^OZ9NUXZúTK^ZúHGXúGZú.OMNKYZòú.OMNúîú:XGORHGXúñú9ZUV!
/TV[ZYFollowing is the list of all the inputs we used in this system:
In addition to the inputs, we declared several variables, as follows:
<GXY ú6O\UZòêñîú9[VVUXZéòêñîú9[VVUXZèòêñîú9[VVUXZçòêñîú8KYOYZGTIKéòêñîú8KYOYZGTIKèòêñîú8KYOYZGTIKçòêñî4U2UTM:XGJK:UJG_ò,GRYKñîú4U9NUXZ:XGJK:UJG_ò,GRYKñ!
The following sections discuss how the long and short entries, as well as the exits, are calculated.
9KZ[VThe pivot point and the support and resistance levels will be calculated using expressions similar to those used in the previous trading system (Pivot Points), but these values will be calculated only for the first bar of the day. For example, if the system is applied to a 30-minute
Input Default Value Description
TrailBar 4 Number of bars to consider when placing a trailing stop orders at the lowest low and highest high of long and short orders respectively.
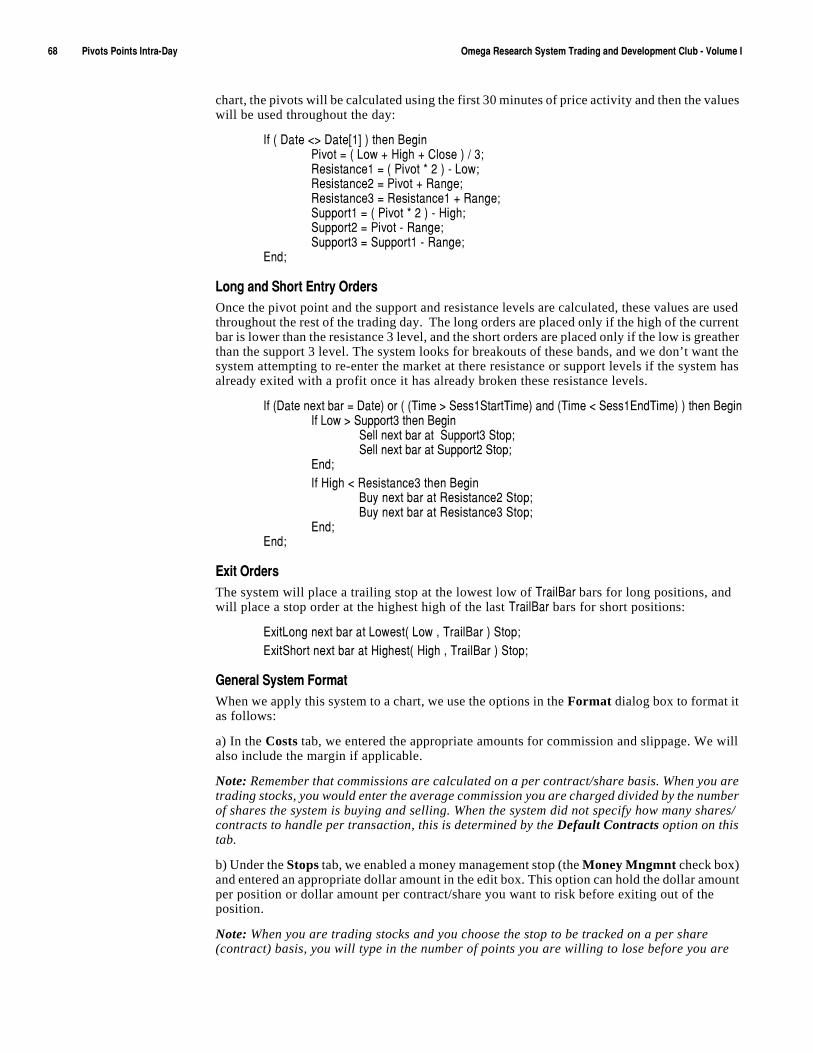
äâúúúúúúúúúú6O\UZYú6UOTZYú/TZXGí*G_úúúúúúúúúú 5SKMGú8KYKGXINú9_YZKSú:XGJOTMúGTJú*K\KRUVSKTZú)R[Húíú<UR[SKú/
chart, the pivots will be calculated using the first 30 minutes of price activity and then the values will be used throughout the day:
/Lúòú*GZKú"$ú*GZKAéCúñúZNKTú(KMOT6O\UZú#úòú2U]úïú.OMNúïú)RUYKúñúëúç!8KYOYZGTIKéú#úòú6O\UZúðúèúñúíú2U]!8KYOYZGTIKèú#ú6O\UZúïú8GTMK!8KYOYZGTIKçú#ú8KYOYZGTIKéúïú8GTMK!9[VVUXZéú#úòú6O\UZúðúèúñúíú.OMN!9[VVUXZèú#ú6O\UZúíú8GTMK!9[VVUXZçú#ú9[VVUXZéúíú8GTMK!
+TJ!
2UTMúGTJú9NUXZú+TZX_ú5XJKXYOnce the pivot point and the support and resistance levels are calculated, these values are used throughout the rest of the trading day. The long orders are placed only if the high of the current bar is lower than the resistance 3 level, and the short orders are placed only if the low is greather than the support 3 level. The system looks for breakouts of these bands, and we don’t want the system attempting to re-enter the market at there resistance or support levels if the system has already exited with a profit once it has already broken these resistance levels.
/Lúò*GZKúTK^ZúHGXú#ú*GZKñúUXúòúò:OSKú$ú9KYYé9ZGXZ:OSKñúGTJúò:OSKú"ú9KYYé+TJ:OSKñúñúZNKTú(KMOT/Lú2U]ú$ú9[VVUXZçúZNKTú(KMOT
9KRRúTK^ZúHGXúGZúú9[VVUXZçú9ZUV!9KRRúTK^ZúHGXúGZú9[VVUXZèú9ZUV!
+TJ!/Lú.OMNú"ú8KYOYZGTIKçúZNKTú(KMOT
([_úTK^ZúHGXúGZú8KYOYZGTIKèú9ZUV!([_úTK^ZúHGXúGZú8KYOYZGTIKçú9ZUV!
+TJ!+TJ!
+^OZú5XJKXYThe system will place a trailing stop at the lowest low of :XGOR(GXúbars for long positions, and will place a stop order at the highest high of the last :XGOR(GX bars for short positions:
+^OZ2UTMúTK^ZúHGXúGZú2U]KYZòú2U]úîú:XGOR(GXúñú9ZUV!+^OZ9NUXZúTK^ZúHGXúGZú.OMNKYZòú.OMNúîú:XGOR(GXúñú9ZUV!
-KTKXGRú9_YZKSú,UXSGZWhen we apply this system to a chart, we use the options in the Format dialog box to format it as follows:
a) In the Costs tab, we entered the appropriate amounts for commission and slippage. We will also include the margin if applicable.
Note: Remember that commissions are calculated on a per contract/share basis. When you are trading stocks, you would enter the average commission you are charged divided by the number of shares the system is buying and selling. When the system did not specify how many shares/contracts to handle per transaction, this is determined by the Default Contracts option on this tab.
b) Under the Stops tab, we enabled a money management stop (the Money Mngmnt check box) and entered an appropriate dollar amount in the edit box. This option can hold the dollar amount per position or dollar amount per contract/share you want to risk before exiting out of the position.
Note: When you are trading stocks and you choose the stop to be tracked on a per share (contract) basis, you will type in the number of points you are willing to lose before you are
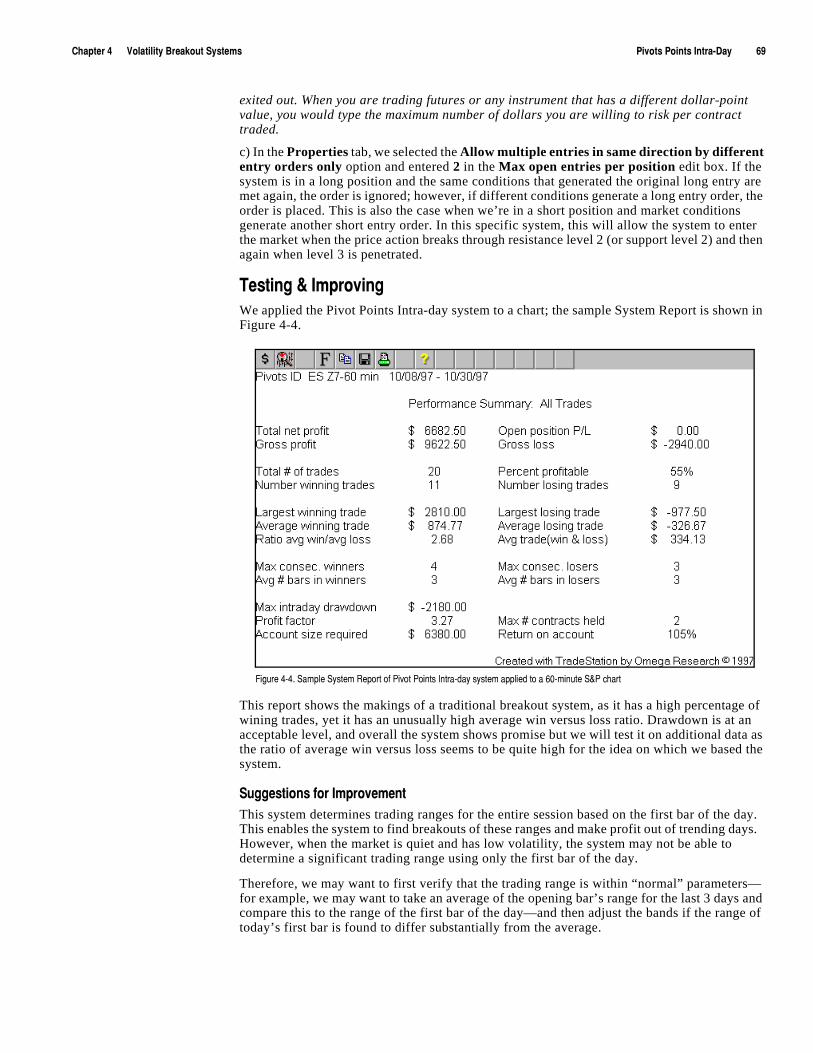
)NGVZKXúæúúúúúú<URGZOROZ_ú(XKGQU[Zú9_YZKSY 6O\UZYú6UOTZYú/TZXGí*G_úúúúúúúúúúäá
exited out. When you are trading futures or any instrument that has a different dollar-point value, you would type the maximum number of dollars you are willing to risk per contract traded.
c) In the Properties tab, we selected the Allow multiple entries in same direction by different entry orders only option and entered 2 in the Max open entries per position edit box. If the system is in a long position and the same conditions that generated the original long entry are met again, the order is ignored; however, if different conditions generate a long entry order, the order is placed. This is also the case when we’re in a short position and market conditions generate another short entry order. In this specific system, this will allow the system to enter the market when the price action breaks through resistance level 2 (or support level 2) and then again when level 3 is penetrated.
:KYZOTMúôú/SVXU\OTMWe applied the Pivot Points Intra-day system to a chart; the sample System Report is shown in Figure 4-4.
This report shows the makings of a traditional breakout system, as it has a high percentage of wining trades, yet it has an unusually high average win versus loss ratio. Drawdown is at an acceptable level, and overall the system shows promise but we will test it on additional data as the ratio of average win versus loss seems to be quite high for the idea on which we based the system.
9[MMKYZOUTYúLUXú/SVXU\KSKTZThis system determines trading ranges for the entire session based on the first bar of the day. This enables the system to find breakouts of these ranges and make profit out of trending days. However, when the market is quiet and has low volatility, the system may not be able to determine a significant trading range using only the first bar of the day.
Therefore, we may want to first verify that the trading range is within “normal” parameters—for example, we may want to take an average of the opening bar’s range for the last 3 days and compare this to the range of the first bar of the day—and then adjust the bands if the range of today’s first bar is found to differ substantially from the average.
,OM[XKúæíæìú9GSVRKú9_YZKSú8KVUXZúULú6O\UZú6UOTZYú/TZXGíJG_úY_YZKSúGVVROKJúZUúGúäêíSOT[ZKú9ô6úINGXZ
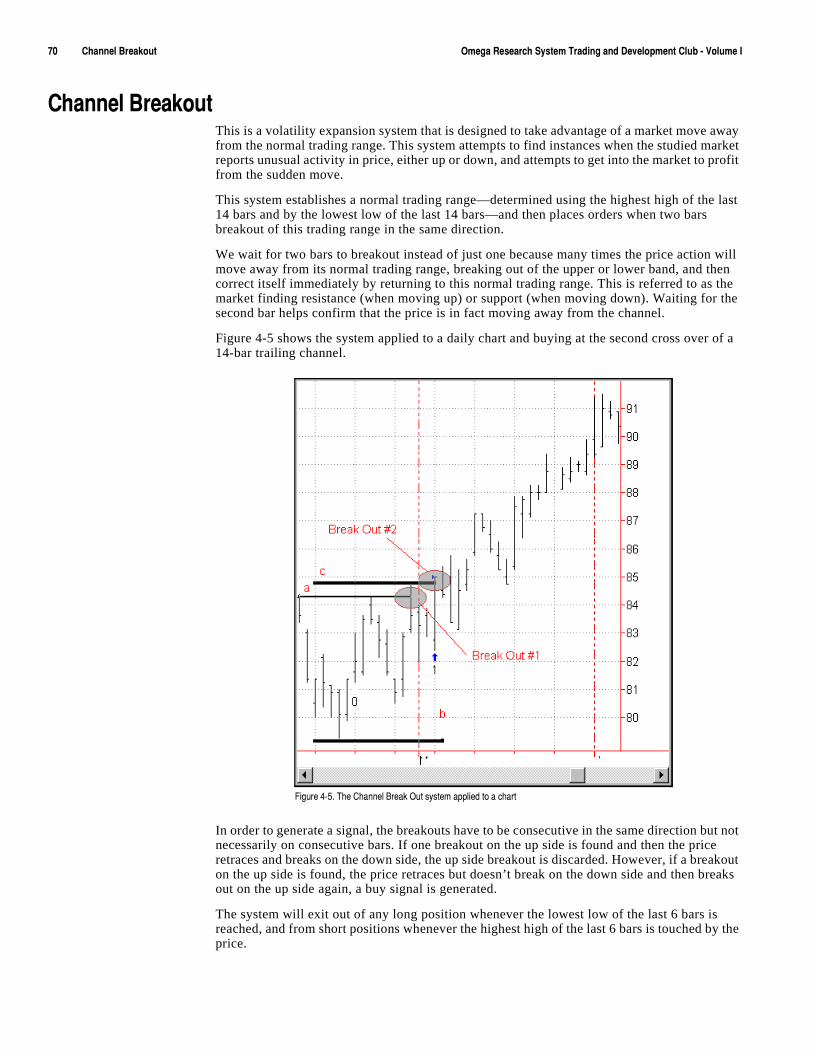
ãêúúúúúúúúúú)NGTTKRú(XKGQU[Zúúúúúúúúúú 5SKMGú8KYKGXINú9_YZKSú:XGJOTMúGTJú*K\KRUVSKTZú)R[Húíú<UR[SKú/
)NGTTKRú(XKGQU[ZúThis is a volatility expansion system that is designed to take advantage of a market move away from the normal trading range. This system attempts to find instances when the studied market reports unusual activity in price, either up or down, and attempts to get into the market to profit from the sudden move.
This system establishes a normal trading range—determined using the highest high of the last 14 bars and by the lowest low of the last 14 bars—and then places orders when two bars breakout of this trading range in the same direction.
We wait for two bars to breakout instead of just one because many times the price action will move away from its normal trading range, breaking out of the upper or lower band, and then correct itself immediately by returning to this normal trading range. This is referred to as the market finding resistance (when moving up) or support (when moving down). Waiting for the second bar helps confirm that the price is in fact moving away from the channel.
Figure 4-5 shows the system applied to a daily chart and buying at the second cross over of a 14-bar trailing channel.
In order to generate a signal, the breakouts have to be consecutive in the same direction but not necessarily on consecutive bars. If one breakout on the up side is found and then the price retraces and breaks on the down side, the up side breakout is discarded. However, if a breakout on the up side is found, the price retraces but doesn’t break on the down side and then breaks out on the up side again, a buy signal is generated.
The system will exit out of any long position whenever the lowest low of the last 6 bars is reached, and from short positions whenever the highest high of the last 6 bars is touched by the price.
,OM[XKúæíåìú:NKú)NGTTKRú(XKGQú5[ZúY_YZKSúGVVROKJúZUúGúINGXZ
)NGVZKXúæúúúúúú<URGZOROZ_ú(XKGQU[Zú9_YZKSY )NGTTKRú(XKGQU[Zúúúúúúúúúúãé
*KLOTOTMú_U[Xú:XGJOTMú8[RKYIn this system, we defined both long entries and short entries as well as exit orders. There is minimal set up work, which involves calculating the top and bottom values for the channel. The set up, entries and exits are described next.
9KZ[Va) Calculate the top and bottom values for the trailing channel. For the top value, use the highest high of the last 10 bars. For the bottom value, use the lowest low of the last 10 bars.
2UTMú+TZX_úb) Buy at the second break out of th 10-bar high trailing channel. These breakouts do not have to be consecutive, but there should be no breakout of the low trailing channel (short entry signal) between the two.
9NUXZú+TZX_c) Sell at the second break under of the 10-bar low trailing channel. These breakouts do not have to be consecutive, but there should no breakout of a high trailing channel (long entry signal) between the two.
+^OZú5XJKXYd) Exit out of any long positions if the market retraces to the lowest low of the last 6 bars.
e) Exit out of any short positions if the market breaks the highest high of the last 6 bars
*KYOMTOTMúôú,UXSGZZOTMThis section presents the EasyLanguage instructions and formatting for the system, with the EasyLanguage instructions broken down and explained line by line.
+GY_2GTM[GMKú/TYZX[IZOUTY ú)NGTTKRú(XKGQU[Zú9_YZKS
/TV[Z ú2KTMZNòéêñîú(XQ5[ZYòèñîú:XGOR9ZVòäñ!
<GXY ú.OMN)NGTTKRòêñîú2U])NGTTKRòêñîú(XKGQ5[Z)U[TZKXòêñîú(XKGQ;TJKX)U[TZKXòêñ!
.OMN)NGTTKRú#ú.OMNKYZòú.OMNúîú2KTMZNúñAéC!2U])NGTTKRú#ú2U]KYZòú2U]úîú2KTMZNúñAéC!
/Lú.OMNú$ú.OMN)NGTTKRúZNKTú(KMOT(XKGQ5[Z)U[TZKXú#ú(XKGQ5[Z)U[TZKXïúé!(XKGQ;TJKX)U[TZKXú#úê!
+TJ!
/Lú2U]ú"ú2U])NGTTKRúZNKTú(KMOT(XKGQ;TJKX)U[TZKXú#ú(XKGQ;TJKX)U[TZKXúïúé!(XKGQ5[Z)U[TZKX#úê!
+TJ!
/Lú(XKGQ5[Z)U[TZKXú$#ú(XQ5[ZYúZNKTú(KMOT([_úZNOYúHGXúUTú)RUYK!ú(XKGQ5[Z)U[TZKXú#úé!
+TJ!
/Lú(XKGQ;TJKX)U[TZKXú$#ú(XQ5[ZYúZNKTú(KMOT9KRRúZNOYúHGXúUTú)RUYK!(XKGQ;TJKX)U[TZKXú#úé!
+TJ!
+^OZ2UTMúTK^ZúHGXúGZú2U]KYZòú2U]úîú:XGOR9ZVúñú9ZUV!+^OZ9NUXZúTK^ZúHGXúGZú.OMNKYZòú.OMNúîú:XGOR9ZVúñú9ZUV!
ãèúúúúúúúúúú)NGTTKRú(XKGQU[Zúúúúúúúúúú 5SKMGú8KYKGXINú9_YZKSú:XGJOTMúGTJú*K\KRUVSKTZú)R[Húíú<UR[SKú/
/TV[ZYFollowing is the list of all the inputs we used in this system:
In addition to the inputs, we declared several variables, as follows:
<GXY ú.OMN)NGTTKRòêñîú2U])NGTTKRòêñîú(XKGQ5[Z)U[TZKXòêñîú(XKGQ;TJKX)U[TZKXòêñ!
The following sections discuss how the long and short entries, as well as the exits, are calculated.
9KZ[VThe system stores the value of the high and low channel in the variables .OMN)NGTTKR and 2U])NGTTKR, respectively. Note that when we use the functionsú.OMNKYZòúñ and 2U]KYZòúñîúwe make sure to refer to one bar ago. This is because these functions include the current bar in their calculations and the high of the current bar will never be higher than itself:
.OMN)NGTTKRú#ú.OMNKYZòú.OMNúîú2KTMZNúñAéC!2U])NGTTKRú#ú2U]KYZòú2U]úîú2KTMZNúñAéC!
When a breakout of the high channel is found, the system increments the variable (XKGQ5[Z)U[TZKX by one. This variable serves as a counter and is used to store the number of breakouts the system encounters on the long side. When a breakout of the high channel is found, the system also sets to zero the variable we use as a counter for the breakouts of the low channel ((XKGQ;TJKX)U[TZKX):
/Lú.OMNú$ú.OMN)NGTTKRúZNKTú(KMOT(XKGQ5[Z)U[TZKXú#ú(XKGQ5[Z)U[TZKXúïúé!(XKGQ;TJKX)U[TZKXú#úê!
+TJ!
Likewise, when a break under of the low channel is found, the system will increment the counter (XKGQ;TJKX)U[TZKXúby one. This variable is used to store the number of break unders that the system encounters on the short side. When a break under of the low channel is found, the system also sets to zero the counter for the break out ((XKGQ5[Z)U[TZKX ):
/Lú2U]ú"ú2U])NGTTKRúZNKTú(KMOT(XKGQ;TJKX)U[TZKXú#ú(XKGQ;TJKX)U[TZKXúïúé!(XKGQ5[Z)U[TZKXú#úê!
+TJ!
2UTMú+TZX_úWhen the variable (XKGQ5[Z)U[TZKX is equal to or greater than the input (XQ5[ZY, it places a long order at the close of the current bar, and resets the long counter to 1:
/Lú(XKGQ5[Z)U[TZKXú$#ú(XQ5[ZYúZNKTú(KMOT([_úZNOYúHGXúUTú)RUYK!ú(XKGQ5[Z)U[TZKXú#úé!
+TJ!
Input Default Value Description
Length 10 Number of bars to use to build the channel around the price activity.
BrkOuts 2 Number of breakouts required for the system to places an order.
TrailStp 6 Number of bars to consider when placing a trailing stop orders at the lowest low and highest high of long and short orders respectively.
)NGVZKXúæúúúúúú<URGZOROZ_ú(XKGQU[Zú9_YZKSY )NGTTKRú(XKGQU[Zúúúúúúúúúúãç
9NUXZú+TZX_Similar to the long side, when the variable (XKGQ;TJKX)U[TZKX is equal to or greater than the input (XQ5[ZY, it places a short order at the close of the current bar, and resets the short counter to 1:
/Lú(XKGQ;TJKX)U[TZKXú$#ú(XQ5[ZYúZNKTú(KMOT9KRRúZNOYúHGXúUTú)RUYK!(XKGQ;TJKX)U[TZKXú#úé!
+TJ!
+^OZú5XJKXYThe system will place a trailing stop at the lowest low of :XGOR9ZV bars for long positions, and at the highest high of the last :XGOR9ZV bars for short positions:
+^OZ2UTMúTK^ZúHGXúGZú2U]KYZòú2U]úîú:XGOR9ZVúñú9ZUV!+^OZ9NUXZúTK^ZúHGXúGZú.OMNKYZòú.OMNúîú:XGOR9ZVúñú9ZUV!
-KTKXGRú9_YZKSú,UXSGZWhen we apply this system to a chart, we use the options in the Format dialog box to format it as follows:
a) In the Costs tab, we entered the appropriate amounts for commission and slippage. We will also include the margin if applicable.
Note: Remember that commissions are calculated on a per contract/share basis. When you are trading stocks, you would enter the average commission you are charged divided by the number of shares the system is buying and selling. When the system did not specify how many shares/contracts to handle per transaction, this is determined by the Default Contracts option on this tab.
b) Under the Stops tab, we enabled a money management stop (the Money Mngmnt check box) and entered an appropriate dollar amount in the edit box. This option can hold the dollar amount per position or dollar amount per contract/share you want to risk before exiting out of the position.
Note: When you are trading stocks and you choose the stop to be tracked on a per share (contract) basis, you will type in the number of points you are willing to lose before you are exited out. When you are trading futures or any instrument that has a different dollar-point value, you would type the maximum number of dollars you are willing to risk per contract traded.
c) In the Properties tab, we selected the Do not allow multiple entries in the same direction option. If the system is in a long position and market conditions generate another long entry order, the order is ignored. This is also the case when we’re in a short position and market conditions generate another short entry order.
We have chosen to develop this system without pyramiding, but it will work with pyramiding (or scaling into positions). Let’s look at the entry orders on the long side:
/Lú.OMNú$ú.OMN)NGTTKRúZNKTú(KMOT(XKGQ5[Z)U[TZKXú#ú(XKGQ5[Z)U[TZKXúïúé!(XKGQ;TJKX)U[TZKXú#úê!
+TJ!/Lú(XKGQ5[Z)U[TZKXú$#ú(XQ5[ZYúZNKTú(KMOT
([_úZNOYúHGXúUTú)RUYK!ú(XKGQ5[Z)U[TZKXú#úé!
+TJ!
If a breakout is found, the variable (XKGQ5[Z)U[TZKX is incremented, and if a certain number of breakouts have occurred, as specified by the input (XQ5[ZY, a long position will be established. At this point, the breakout counter is set to 1 and will be incremented again if another breakout
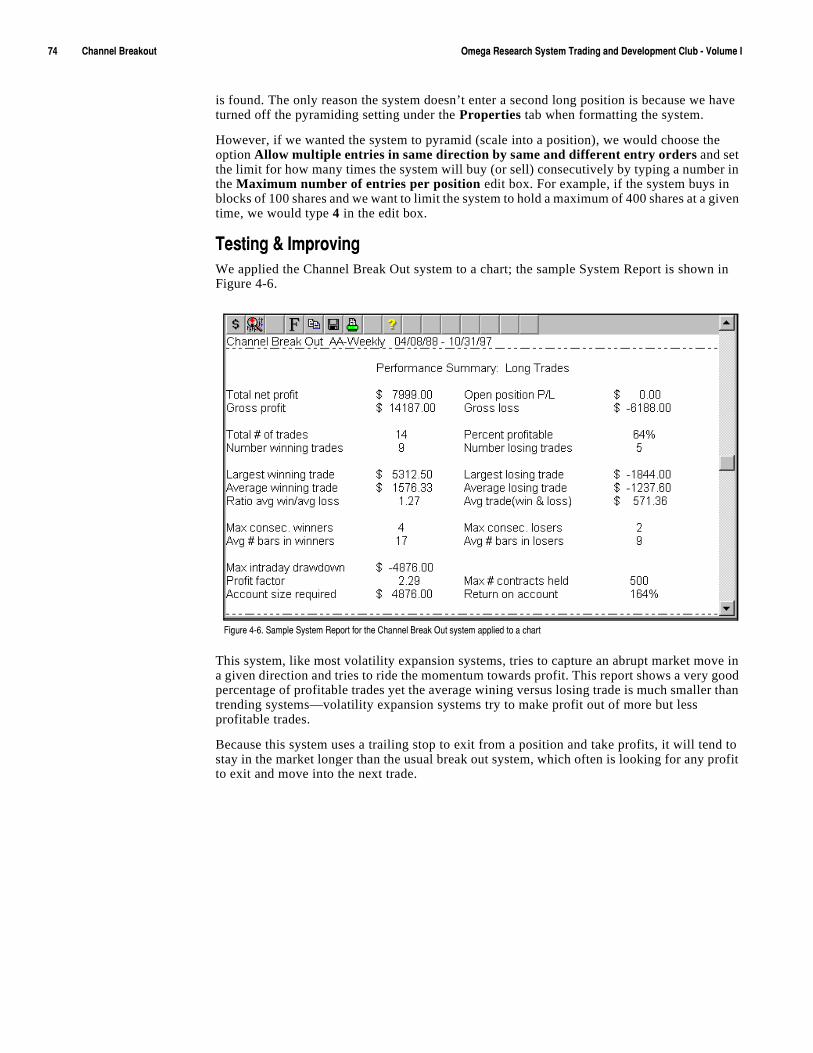
ãæúúúúúúúúúú)NGTTKRú(XKGQU[Zúúúúúúúúúú 5SKMGú8KYKGXINú9_YZKSú:XGJOTMúGTJú*K\KRUVSKTZú)R[Húíú<UR[SKú/
is found. The only reason the system doesn’t enter a second long position is because we have turned off the pyramiding setting under the Properties tab when formatting the system.
However, if we wanted the system to pyramid (scale into a position), we would choose the option Allow multiple entries in same direction by same and different entry orders and set the limit for how many times the system will buy (or sell) consecutively by typing a number in the Maximum number of entries per position edit box. For example, if the system buys in blocks of 100 shares and we want to limit the system to hold a maximum of 400 shares at a given time, we would type 4 in the edit box.
:KYZOTMúôú/SVXU\OTMWe applied the Channel Break Out system to a chart; the sample System Report is shown in Figure 4-6.
This system, like most volatility expansion systems, tries to capture an abrupt market move in a given direction and tries to ride the momentum towards profit. This report shows a very good percentage of profitable trades yet the average wining versus losing trade is much smaller than trending systems—volatility expansion systems try to make profit out of more but less profitable trades.
Because this system uses a trailing stop to exit from a position and take profits, it will tend to stay in the market longer than the usual break out system, which often is looking for any profit to exit and move into the next trade.
,OM[XKúæíäìú9GSVRKú9_YZKSú8KVUXZúLUXúZNKú)NGTTKRú(XKGQú5[ZúY_YZKSúGVVROKJúZUúGúINGXZ
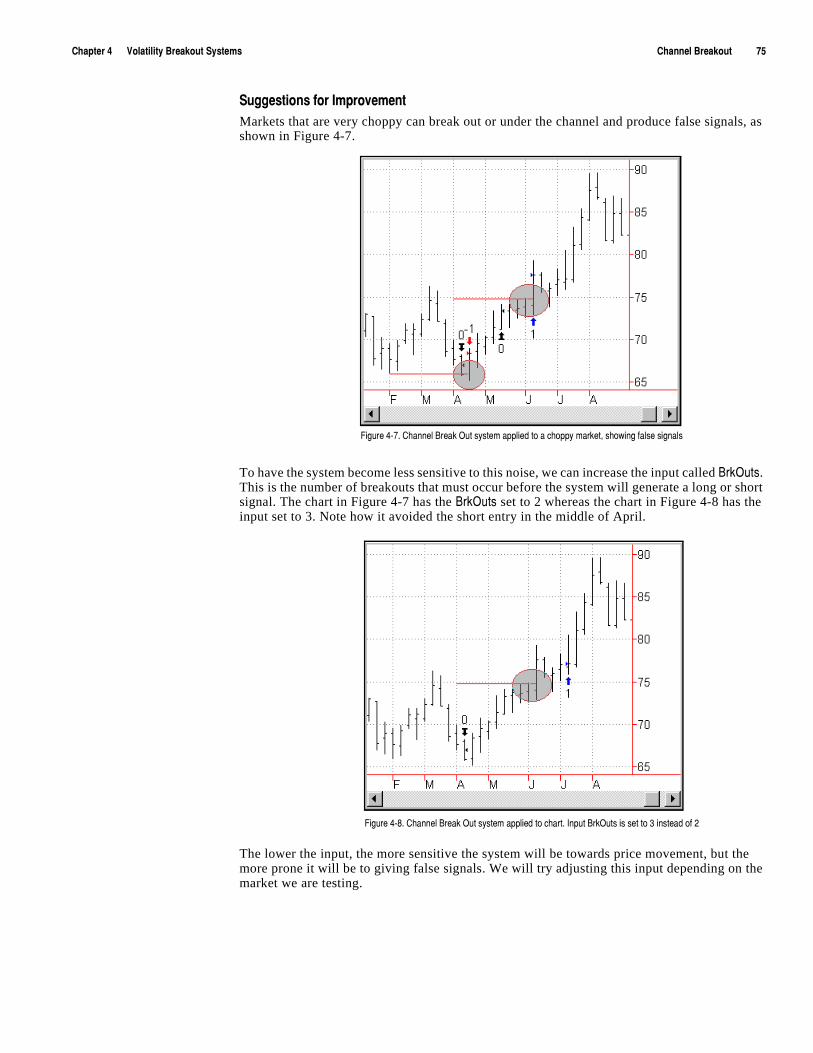
)NGVZKXúæúúúúúú<URGZOROZ_ú(XKGQU[Zú9_YZKSY )NGTTKRú(XKGQU[Zúúúúúúúúúúãå
9[MMKYZOUTYúLUXú/SVXU\KSKTZMarkets that are very choppy can break out or under the channel and produce false signals, as shown in Figure 4-7.
To have the system become less sensitive to this noise, we can increase the input called (XQ5[ZY. This is the number of breakouts that must occur before the system will generate a long or short signal. The chart in Figure 4-7 has the (XQ5[ZY set to 2 whereas the chart in Figure 4-8 has the input set to 3. Note how it avoided the short entry in the middle of April.
The lower the input, the more sensitive the system will be towards price movement, but the more prone it will be to giving false signals. We will try adjusting this input depending on the market we are testing.
,OM[XKúæíãìú)NGTTKRú(XKGQú5[ZúY_YZKSúGVVROKJúZUúGúINUVV_úSGXQKZîúYNU]OTMúLGRYKúYOMTGRYú
,OM[XKúæíâìú)NGTTKRú(XKGQú5[ZúY_YZKSúGVVROKJúZUúINGXZìú/TV[Zú(XQ5[ZYúOYúYKZúZUúçúOTYZKGJúULúèú
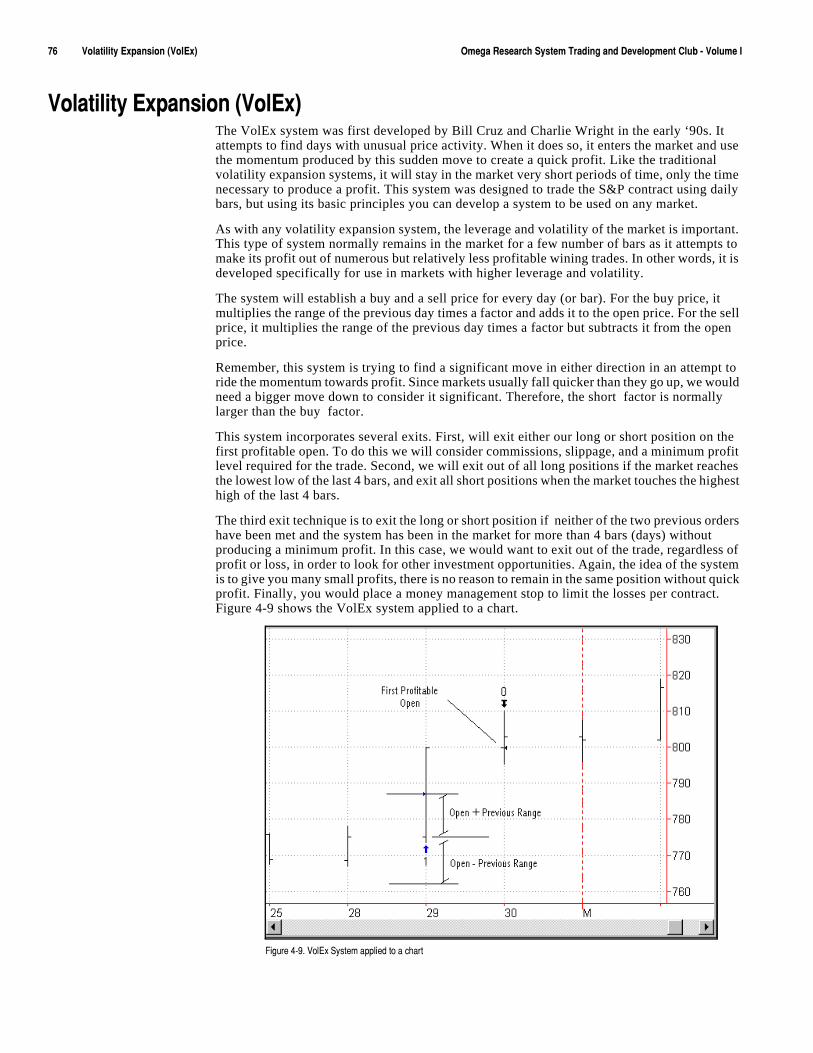
ãäúúúúúúúúúú<URGZOROZ_ú+^VGTYOUTúò<UR+^ñúúúúúúúúúú 5SKMGú8KYKGXINú9_YZKSú:XGJOTMúGTJú*K\KRUVSKTZú)R[Húíú<UR[SKú/
<URGZOROZ_ú+^VGTYOUTúò<UR+^ñThe VolEx system was first developed by Bill Cruz and Charlie Wright in the early ‘90s. It attempts to find days with unusual price activity. When it does so, it enters the market and use the momentum produced by this sudden move to create a quick profit. Like the traditional volatility expansion systems, it will stay in the market very short periods of time, only the time necessary to produce a profit. This system was designed to trade the S&P contract using daily bars, but using its basic principles you can develop a system to be used on any market.
As with any volatility expansion system, the leverage and volatility of the market is important. This type of system normally remains in the market for a few number of bars as it attempts to make its profit out of numerous but relatively less profitable wining trades. In other words, it is developed specifically for use in markets with higher leverage and volatility.
The system will establish a buy and a sell price for every day (or bar). For the buy price, it multiplies the range of the previous day times a factor and adds it to the open price. For the sell price, it multiplies the range of the previous day times a factor but subtracts it from the open price.
Remember, this system is trying to find a significant move in either direction in an attempt to ride the momentum towards profit. Since markets usually fall quicker than they go up, we would need a bigger move down to consider it significant. Therefore, the short factor is normally larger than the buy factor.
This system incorporates several exits. First, will exit either our long or short position on the first profitable open. To do this we will consider commissions, slippage, and a minimum profit level required for the trade. Second, we will exit out of all long positions if the market reaches the lowest low of the last 4 bars, and exit all short positions when the market touches the highest high of the last 4 bars.
The third exit technique is to exit the long or short position if neither of the two previous orders have been met and the system has been in the market for more than 4 bars (days) without producing a minimum profit. In this case, we would want to exit out of the trade, regardless of profit or loss, in order to look for other investment opportunities. Again, the idea of the system is to give you many small profits, there is no reason to remain in the same position without quick profit. Finally, you would place a money management stop to limit the losses per contract. Figure 4-9 shows the VolEx system applied to a chart.
,OM[XKúæíáìú<UR+^ú9_YZKSúGVVROKJúZUúGúINGXZ
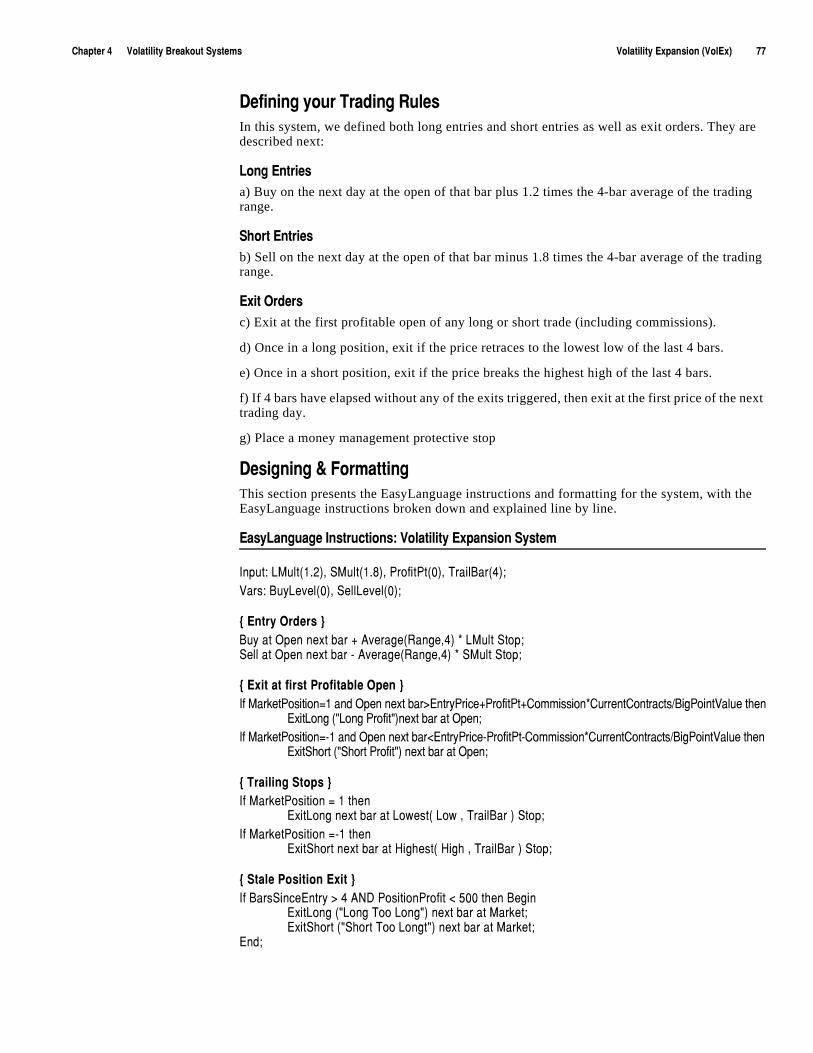
)NGVZKXúæúúúúúú<URGZOROZ_ú(XKGQU[Zú9_YZKSY <URGZOROZ_ú+^VGTYOUTúò<UR+^ñúúúúúúúúúúãã
*KLOTOTMú_U[Xú:XGJOTMú8[RKYIn this system, we defined both long entries and short entries as well as exit orders. They are described next:
2UTMú+TZXOKYa) Buy on the next day at the open of that bar plus 1.2 times the 4-bar average of the trading range.
9NUXZú+TZXOKYb) Sell on the next day at the open of that bar minus 1.8 times the 4-bar average of the trading range.
+^OZú5XJKXYúúc) Exit at the first profitable open of any long or short trade (including commissions).
d) Once in a long position, exit if the price retraces to the lowest low of the last 4 bars.
e) Once in a short position, exit if the price breaks the highest high of the last 4 bars.
f) If 4 bars have elapsed without any of the exits triggered, then exit at the first price of the next trading day.
g) Place a money management protective stop
*KYOMTOTMúôú,UXSGZZOTMThis section presents the EasyLanguage instructions and formatting for the system, with the EasyLanguage instructions broken down and explained line by line.
+GY_2GTM[GMKú/TYZX[IZOUTY ú<URGZOROZ_ú+^VGTYOUTú9_YZKS
/TV[Z ú23[RZòéìèñîú93[RZòéìâñîú6XULOZ6Zòêñîú:XGOR(GXòæñ!<GXY ú([_2K\KRòêñîú9KRR2K\KRòêñ!
aú+TZX_ú5XJKXYúc([_úGZú5VKTúTK^ZúHGXúïú'\KXGMKò8GTMKîæñúðú23[RZú9ZUV!9KRRúGZú5VKTúTK^ZúHGXúíú'\KXGMKò8GTMKîæñúðú93[RZú9ZUV!
aú+^OZúGZúLOXYZú6XULOZGHRKú5VKTúc/Lú3GXQKZ6UYOZOUT#éúGTJú5VKTúTK^ZúHGX$+TZX_6XOIKï6XULOZ6Zï)USSOYYOUTð)[XXKTZ)UTZXGIZYë(OM6UOTZ<GR[KúZNKT
+^OZ2UTMúòø2UTMú6XULOZøñTK^ZúHGXúGZú5VKT!/Lú3GXQKZ6UYOZOUT#íéúGTJú5VKTúTK^ZúHGX"+TZX_6XOIKí6XULOZ6Zí)USSOYYOUTð)[XXKTZ)UTZXGIZYë(OM6UOTZ<GR[KúZNKT
+^OZ9NUXZúòø9NUXZú6XULOZøñúTK^ZúHGXúGZú5VKT!
aú:XGOROTMú9ZUVYúc/Lú3GXQKZ6UYOZOUTú#úéúZNKT
+^OZ2UTMúTK^ZúHGXúGZú2U]KYZòú2U]úîú:XGOR(GXúñú9ZUV!/Lú3GXQKZ6UYOZOUTú#íéúZNKT
+^OZ9NUXZúTK^ZúHGXúGZú.OMNKYZòú.OMNúîú:XGOR(GXúñú9ZUV!
aú9ZGRKú6UYOZOUTú+^OZúc/Lú(GXY9OTIK+TZX_ú$úæú'4*ú6UYOZOUT6XULOZú"úåêêúZNKTú(KMOT
+^OZ2UTMúòø2UTMú:UUú2UTMøñúTK^ZúHGXúGZú3GXQKZ!+^OZ9NUXZúòø9NUXZú:UUú2UTMZøñúTK^ZúHGXúGZú3GXQKZ!
+TJ!
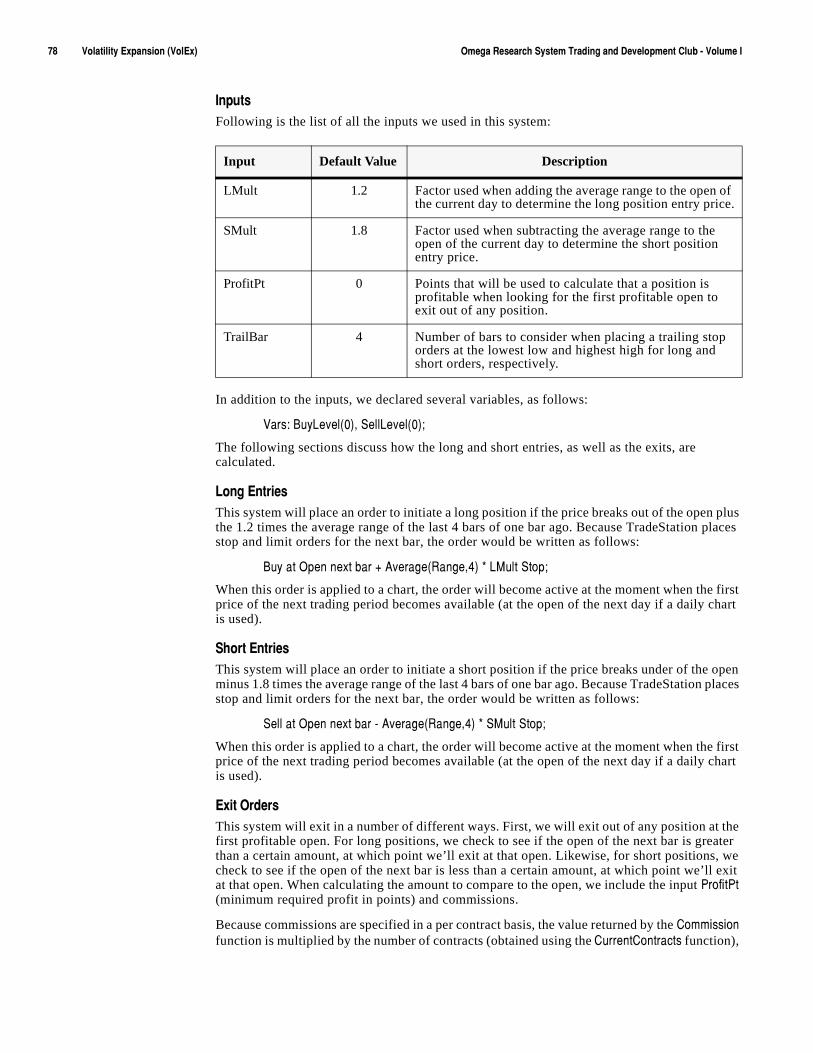
ãâúúúúúúúúúú<URGZOROZ_ú+^VGTYOUTúò<UR+^ñúúúúúúúúúú 5SKMGú8KYKGXINú9_YZKSú:XGJOTMúGTJú*K\KRUVSKTZú)R[Húíú<UR[SKú/
/TV[ZYFollowing is the list of all the inputs we used in this system:
In addition to the inputs, we declared several variables, as follows:
<GXY ú([_2K\KRòêñîú9KRR2K\KRòêñ!
The following sections discuss how the long and short entries, as well as the exits, are calculated.
2UTMú+TZXOKYThis system will place an order to initiate a long position if the price breaks out of the open plus the 1.2 times the average range of the last 4 bars of one bar ago. Because TradeStation places stop and limit orders for the next bar, the order would be written as follows:
([_úGZú5VKTúTK^ZúHGXúïú'\KXGMKò8GTMKîæñúðú23[RZú9ZUV!
When this order is applied to a chart, the order will become active at the moment when the first price of the next trading period becomes available (at the open of the next day if a daily chart is used).
9NUXZú+TZXOKYThis system will place an order to initiate a short position if the price breaks under of the open minus 1.8 times the average range of the last 4 bars of one bar ago. Because TradeStation places stop and limit orders for the next bar, the order would be written as follows:
9KRRúGZú5VKTúTK^ZúHGXúíú'\KXGMKò8GTMKîæñúðú93[RZú9ZUV!
When this order is applied to a chart, the order will become active at the moment when the first price of the next trading period becomes available (at the open of the next day if a daily chart is used).
+^OZú5XJKXYThis system will exit in a number of different ways. First, we will exit out of any position at the first profitable open. For long positions, we check to see if the open of the next bar is greater than a certain amount, at which point we’ll exit at that open. Likewise, for short positions, we check to see if the open of the next bar is less than a certain amount, at which point we’ll exit at that open. When calculating the amount to compare to the open, we include the input 6XULOZ6Z (minimum required profit in points) and commissions.
Because commissions are specified in a per contract basis, the value returned by the )USSOYYOUT function is multiplied by the number of contracts (obtained using the )[XXKTZ)UTZXGIZY function),
Input Default Value Description
LMult 1.2 Factor used when adding the average range to the open of the current day to determine the long position entry price.
SMult 1.8 Factor used when subtracting the average range to the open of the current day to determine the short position entry price.
ProfitPt 0 Points that will be used to calculate that a position is profitable when looking for the first profitable open to exit out of any position.
TrailBar 4 Number of bars to consider when placing a trailing stop orders at the lowest low and highest high for long and short orders, respectively.
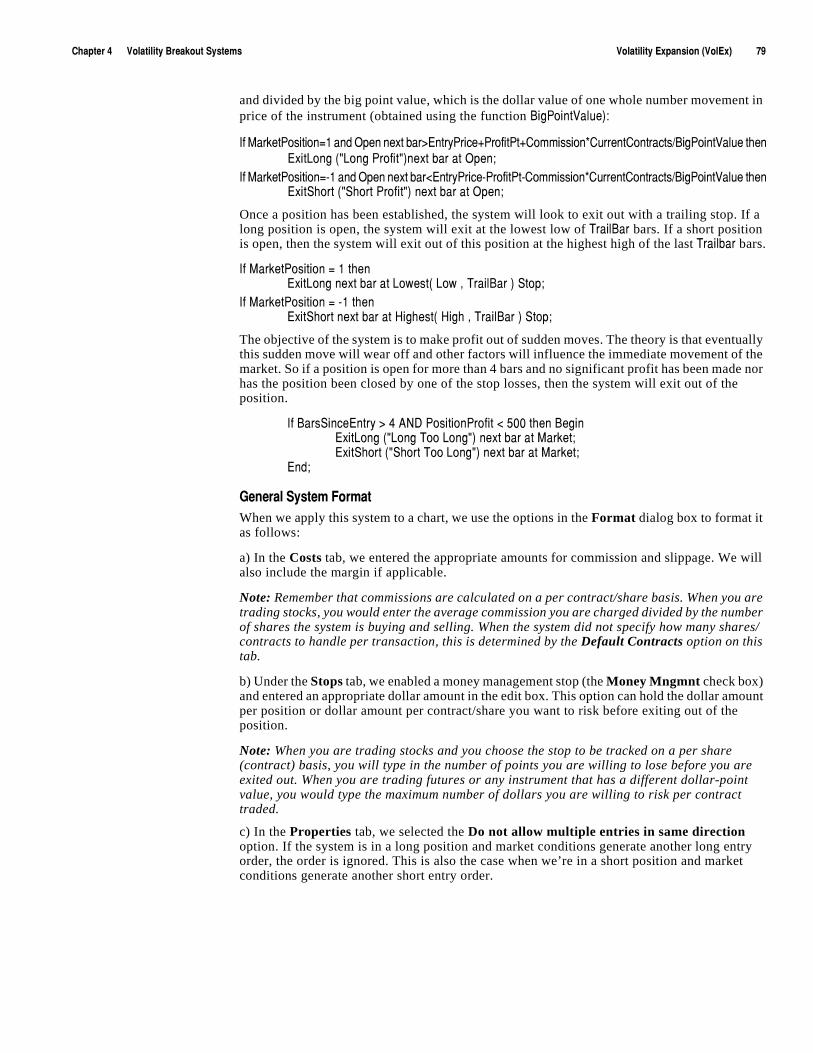
)NGVZKXúæúúúúúú<URGZOROZ_ú(XKGQU[Zú9_YZKSY <URGZOROZ_ú+^VGTYOUTúò<UR+^ñúúúúúúúúúúãá
and divided by the big point value, which is the dollar value of one whole number movement in price of the instrument (obtained using the function (OM6UOTZ<GR[Kñ
/Lú3GXQKZ6UYOZOUT#éúGTJú5VKTúTK^ZúHGX$+TZX_6XOIKï6XULOZ6Zï)USSOYYOUTð)[XXKTZ)UTZXGIZYë(OM6UOTZ<GR[KúZNKT+^OZ2UTMúòø2UTMú6XULOZøñTK^ZúHGXúGZú5VKT!
/Lú3GXQKZ6UYOZOUT#íéúGTJú5VKTúTK^ZúHGX"+TZX_6XOIKí6XULOZ6Zí)USSOYYOUTð)[XXKTZ)UTZXGIZYë(OM6UOTZ<GR[KúZNKT+^OZ9NUXZúòø9NUXZú6XULOZøñúTK^ZúHGXúGZú5VKT!
Once a position has been established, the system will look to exit out with a trailing stop. If a long position is open, the system will exit at the lowest low of :XGOR(GX bars. If a short position is open, then the system will exit out of this position at the highest high of the last :XGORHGX bars.
/Lú3GXQKZ6UYOZOUTú#úéúZNKT+^OZ2UTMúTK^ZúHGXúGZú2U]KYZòú2U]úîú:XGOR(GXúñú9ZUV!
/Lú3GXQKZ6UYOZOUTú#úíéúZNKT+^OZ9NUXZúTK^ZúHGXúGZú.OMNKYZòú.OMNúîú:XGOR(GXúñú9ZUV!
The objective of the system is to make profit out of sudden moves. The theory is that eventually this sudden move will wear off and other factors will influence the immediate movement of the market. So if a position is open for more than 4 bars and no significant profit has been made nor has the position been closed by one of the stop losses, then the system will exit out of the position.
/Lú(GXY9OTIK+TZX_ú$úæú'4*ú6UYOZOUT6XULOZú"úåêêúZNKTú(KMOT+^OZ2UTMúòø2UTMú:UUú2UTMøñúTK^ZúHGXúGZú3GXQKZ!+^OZ9NUXZúòø9NUXZú:UUú2UTMøñúTK^ZúHGXúGZú3GXQKZ!
+TJ!
-KTKXGRú9_YZKSú,UXSGZWhen we apply this system to a chart, we use the options in the Format dialog box to format it as follows:
a) In the Costs tab, we entered the appropriate amounts for commission and slippage. We will also include the margin if applicable.
Note: Remember that commissions are calculated on a per contract/share basis. When you are trading stocks, you would enter the average commission you are charged divided by the number of shares the system is buying and selling. When the system did not specify how many shares/contracts to handle per transaction, this is determined by the Default Contracts option on this tab.
b) Under the Stops tab, we enabled a money management stop (the Money Mngmnt check box) and entered an appropriate dollar amount in the edit box. This option can hold the dollar amount per position or dollar amount per contract/share you want to risk before exiting out of the position.
Note: When you are trading stocks and you choose the stop to be tracked on a per share (contract) basis, you will type in the number of points you are willing to lose before you are exited out. When you are trading futures or any instrument that has a different dollar-point value, you would type the maximum number of dollars you are willing to risk per contract traded.
c) In the Properties tab, we selected the Do not allow multiple entries in same direction option. If the system is in a long position and market conditions generate another long entry order, the order is ignored. This is also the case when we’re in a short position and market conditions generate another short entry order.
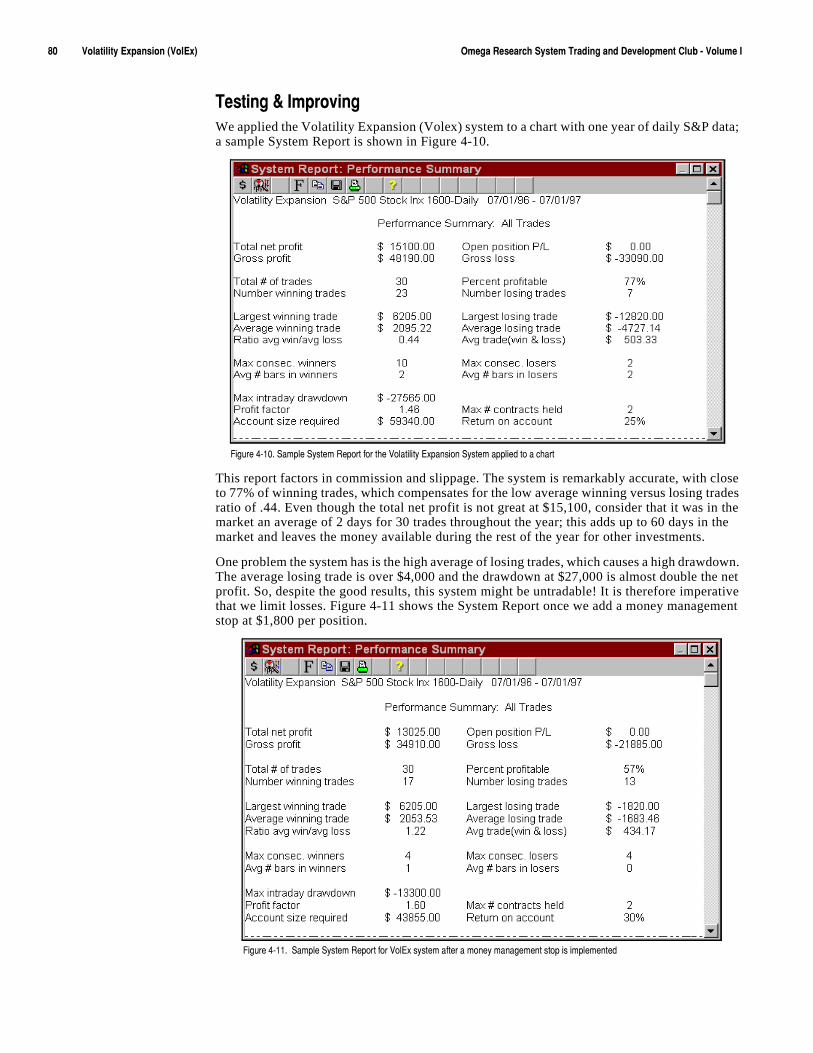
âêúúúúúúúúúú<URGZOROZ_ú+^VGTYOUTúò<UR+^ñúúúúúúúúúú 5SKMGú8KYKGXINú9_YZKSú:XGJOTMúGTJú*K\KRUVSKTZú)R[Húíú<UR[SKú/
:KYZOTMúôú/SVXU\OTMWe applied the Volatility Expansion (Volex) system to a chart with one year of daily S&P data; a sample System Report is shown in Figure 4-10.
This report factors in commission and slippage. The system is remarkably accurate, with close to 77% of winning trades, which compensates for the low average winning versus losing trades ratio of .44. Even though the total net profit is not great at $15,100, consider that it was in the market an average of 2 days for 30 trades throughout the year; this adds up to 60 days in the market and leaves the money available during the rest of the year for other investments.
One problem the system has is the high average of losing trades, which causes a high drawdown. The average losing trade is over $4,000 and the drawdown at $27,000 is almost double the net profit. So, despite the good results, this system might be untradable! It is therefore imperative that we limit losses. Figure 4-11 shows the System Report once we add a money management stop at $1,800 per position.
,OM[XKúæíéêìú9GSVRKú9_YZKSú8KVUXZúLUXúZNKú<URGZOROZ_ú+^VGTYOUTú9_YZKSúGVVROKJúZUúGúINGXZ
,OM[XKúæíééìúú9GSVRKú9_YZKSú8KVUXZúLUXú<UR+^úY_YZKSúGLZKXúGúSUTK_úSGTGMKSKTZúYZUVúOYúOSVRKSKTZKJú
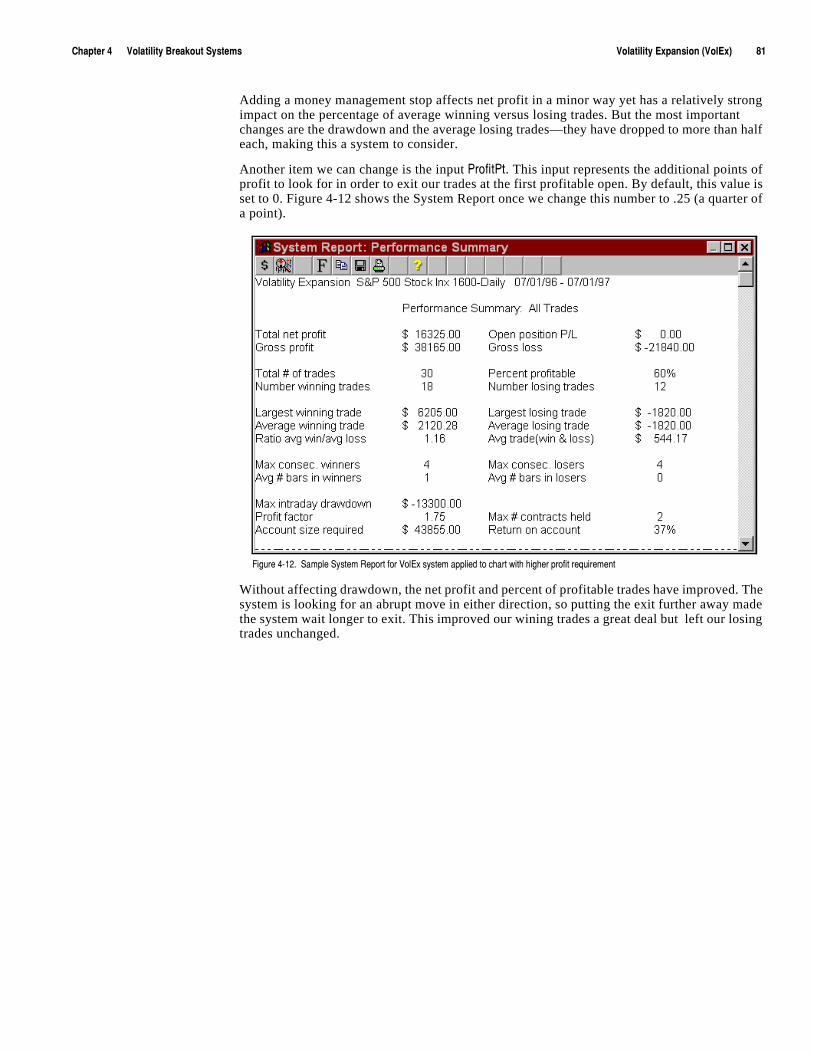
)NGVZKXúæúúúúúú<URGZOROZ_ú(XKGQU[Zú9_YZKSY <URGZOROZ_ú+^VGTYOUTúò<UR+^ñúúúúúúúúúúâé
Adding a money management stop affects net profit in a minor way yet has a relatively strong impact on the percentage of average winning versus losing trades. But the most important changes are the drawdown and the average losing trades—they have dropped to more than half each, making this a system to consider.
Another item we can change is the input 6XULOZ6Z. This input represents the additional points of profit to look for in order to exit our trades at the first profitable open. By default, this value is set to 0. Figure 4-12 shows the System Report once we change this number to .25 (a quarter of a point).
Without affecting drawdown, the net profit and percent of profitable trades have improved. The system is looking for an abrupt move in either direction, so putting the exit further away made the system wait longer to exit. This improved our wining trades a great deal but left our losing trades unchanged.
,OM[XKúæíéèìúú9GSVRKú9_YZKSú8KVUXZúLUXú<UR+^úY_YZKSúGVVROKJúZUúINGXZú]OZNúNOMNKXúVXULOZúXKW[OXKSKTZú

âèúúúúúúúúúú<URGZOROZ_ú+^VGTYOUTúò<UR+^ñúúúúúúúúúú 5SKMGú8KYKGXINú9_YZKSú:XGJOTMúGTJú*K\KRUVSKTZú)R[Húíú<UR[SKú/
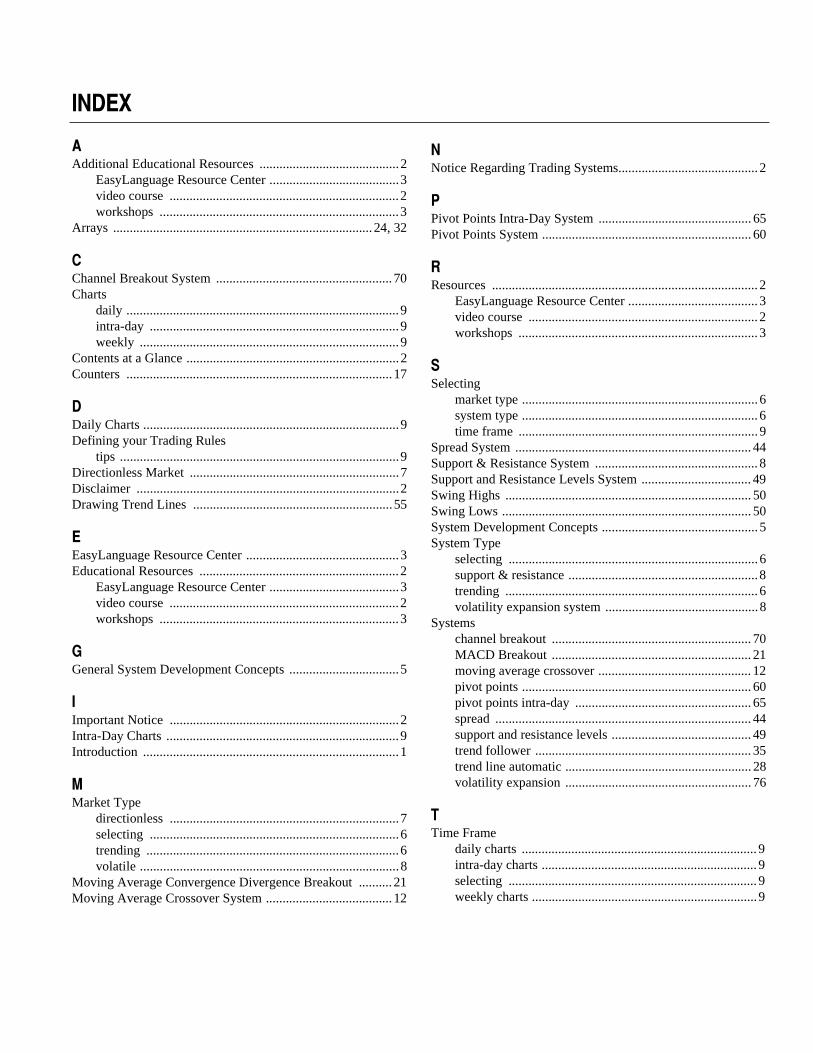
/4*+>
'Additional Educational Resources ..........................................2
EasyLanguage Resource Center .......................................3video course .....................................................................2workshops ........................................................................3
Arrays ..............................................................................24, 32
)Channel Breakout System .....................................................70Charts
daily ..................................................................................9intra-day ...........................................................................9weekly ..............................................................................9
Contents at a Glance ................................................................2Counters ................................................................................17
*Daily Charts .............................................................................9Defining your Trading Rules
tips ....................................................................................9Directionless Market ...............................................................7Disclaimer ...............................................................................2Drawing Trend Lines ............................................................55
+EasyLanguage Resource Center ..............................................3Educational Resources ............................................................2
EasyLanguage Resource Center .......................................3video course .....................................................................2workshops ........................................................................3
-General System Development Concepts .................................5
/Important Notice .....................................................................2Intra-Day Charts ......................................................................9Introduction .............................................................................1
3Market Type
directionless .....................................................................7selecting ...........................................................................6trending ............................................................................6volatile ..............................................................................8
Moving Average Convergence Divergence Breakout ..........21Moving Average Crossover System ......................................12
4Notice Regarding Trading Systems..........................................2
6Pivot Points Intra-Day System .............................................. 65Pivot Points System ............................................................... 60
8Resources ................................................................................2
EasyLanguage Resource Center .......................................3video course .....................................................................2workshops ........................................................................3
9Selecting
market type .......................................................................6system type .......................................................................6time frame ........................................................................9
Spread System ....................................................................... 44Support & Resistance System .................................................8Support and Resistance Levels System ................................. 49Swing Highs .......................................................................... 50Swing Lows ........................................................................... 50System Development Concepts ...............................................5System Type
selecting ...........................................................................6support & resistance .........................................................8trending ............................................................................6volatility expansion system ..............................................8
Systemschannel breakout ............................................................ 70MACD Breakout ............................................................ 21moving average crossover .............................................. 12pivot points ..................................................................... 60pivot points intra-day ..................................................... 65spread ............................................................................. 44support and resistance levels .......................................... 49trend follower ................................................................. 35trend line automatic ........................................................ 28volatility expansion ........................................................ 76
:Time Frame
daily charts .......................................................................9intra-day charts .................................................................9selecting ...........................................................................9weekly charts ....................................................................9
âæúúúúúúúúú/TJK^úúúúúúúúú
:úò)UTZ©JñTips for Defining your Trading Rules .....................................9Trend Follower System .........................................................35Trend Line Automatic System ...............................................28Trend Lines
drawing ...........................................................................55Trending Market ......................................................................6Trending Systems ....................................................................6
<Video Courses .........................................................................2Volatile Market ........................................................................8Volatility Expansion System .............................................8, 76VolEx System ........................................................................76
=Weekly Charts .........................................................................9Workshops ...............................................................................3