staff pension plan 2013 year in review · this report provides a summary of the major highlights...
TRANSCRIPT
2013 Year In ReviewStaff Pension Plan

Contents
About This Report 3
Plan Purpose and Overview 4
2013 in Summary 5
Membership and Financial Highlights 7
Membership Statistics 8
Financial Statistics 13
Investment Review 15

STAFF PENSION PLAN 2013 Year in Review 3
About This Report
This report provides a summary of the major highlights and events that occurred
over the course of 2013 for the Staff Pension Plan of the University of the British
Columbia. The report also includes a brief plan overview, membership and
fi nancial statistics, and an investment review from the Plan’s investment manager.

STAFF PENSION PLAN 2013 Year in Review 4
Plan Overview
The Staff Pension Plan (SPP), established January 1, 1972, is a Defi ned Benefi t pension plan that provides
retirement, termination, and death benefi ts for eligible staff of the University of British Columbia and related
employers. The Plan is funded by fi xed contributions from Plan members and the University. Beyond these
contributions, neither have any further fi nancial responsibility to fund the Plan. Members contribute 6.5%
of their salary, and the University contributes 10% of the member’s salary less a 1.8% CPP offset, which on
average represents 8.7% of member salaries.
As of July 1, 2009, pensions for new members entering the Plan are calculated according to a formula of 1.8%
of salary multiplied by years of pensionable service. Members who also have service prior to July 1, 2009 will
have their pension calculated using the pre-July 1, 2009 and post-July 1, 2009 formulas. Retirement pensions
are indexed subject to the SPP Board’s approval and the Plan’s ability to pay. If there is not adequate funding, the
Plan’s policy for balancing benefi ts and funding requires a reduction of benefi ts, starting with future indexing.
The Plan’s Actuary determines if there is adequate funding based on the results of the latest Actuarial Valuation
report. The Actuarial Valuation commenced on December 31, 2013, making 2014 a valuation year.
The University has delegated the day-to-day administration of the Plan to the SPP Board, and administration
services are provided by the Pension Administration Offi ce (PAO) in Human Resources. Amendments to the Plan
Text are recommended by the SPP Board, reviewed by the University Administration and approved by the UBC
Board of Governors. The SPP also employs several advisors and consultants to provide expertise and advice on
specifi c areas.
Balancing assets and liabilities is critical to providing stable lifetime retirement pensions. The SPP funds
($1,091.2M as at December 31, 2013) are invested in accordance with the Statement of Policies and Procedures
(SIPP). The SIPP is prepared by the SPP Board with the assistance of the Plan’s investment consultant, PBI
Actuarial Consultants (PBI) Ltd. and input of the investment manager, UBC Investment Management Trust
(IMANT) Inc., and is approved by the UBC Board of Governors.
The Plan’s British Columbia Registration Number is P085439-1 and CRA Registration Number is 0572362.
Plan Purpose
The purpose of the UBC Staff Pension Plan is to provide stable lifetime retirement pensions for its members.

STAFF PENSION PLAN 2013 Year in Review 5
2013 in Summary
It was a year of growth for the UBC Staff Pension Plan in both membership and
Plan assets. As of December 31, 2013, the Plan had $1,091.2M in assets and total
membership grew by 6.8% in 2013. Below is a summary of the major events that
occurred over the course of 2013:
Progress in Plan GovernanceThe year 2013 was the Plan’s second year under the new governance policy, which was approved on February
2, 2012. The Executive Director of the Plan on behalf of the SPP Board reported to the UBC Board of Governors
three times in 2013. The SPP Board completes an annual governance report for each calendar year and presents
the report to the UBC Board of Governors in April of the following year. These reports are available on the Plan’s
website in the Plan Governance section.
Actuarial Valuation as at December 31, 2013Every three years, the Plan is required to undergo a fi nancial checkup called an Actuarial Valuation, conducted by
the Plan`s actuary. The key impact of the actuarial valuation for Plan members is that the valuation determines
the level of benefi ts that the Plan can support for the years following the valuation. If there is a shortfall in funding,
the Pension Board will examine options for adjusting benefi ts.
The last valuation that occurred as at December 31, 2010 revealed that the Plan could support indexing of
pensions at 50% of infl ation (CPI), which was applied to retiree pensions at the beginning of 2012, 2013 and
2014. The indexing adjustment at January 1, 2015 will depend on the results of the new valuation.
The Pension Board expects the valuation report to be presented at its September 2014 meeting. At that time,
the Board will review the actuarial valuation and the actuary’s recommendations and a communication will go to
members in the November 2014 SPP Update newsletter.
New Pension Benefi ts Standards Act (PBSA)The B.C. Government introduced a new PBSA that received royal assent on May 31, 2012. It was anticipated that
it would become law by January 1, 2014. The Plan received news in 2013 that the regulations were delayed and
may not be released until sometime in 2015. The Pension Board will continue to work with the UBC Board of
Governors and the University and the Plan`s advisors in preparation for these new regulations. We anticipate that
these new regulations will be helpful in the administration of the Plan as they will specifi cally address the Plan`s
unique design. Updates on the new regulations will be provided on the Plan’s website and newsletter when they
become available.
CUPE 116 Hourly EmployeesEffective April 1, 2013, the University changed the eligibility rules for the UBC Staff Pension Plan and 300 CUPE
116 hourly employees became eligible to join the Plan. Many people at UBC worked very hard to make all the
changes necessary to welcome these employees into the Staff Pension Plan. We would like to acknowledge the
work of Payroll, Human Resources and CUPE 116 staff. In the month of April, 250 CUPE 116 employees were
enrolled in to the Plan. By the end of year, 290 or 97% of eligible employees had elected to join the Plan. This
group accounts for approximately 25% of enrollments in 2013.

STAFF PENSION PLAN 2013 Year in Review 6
Additional Voluntary Contributions (AVC)On May 14, 2013, the Pension Board amended the Plan Text to remove the Additional Voluntary Contribution
(AVC) option (referred to as Voluntary Contribution Account in the Plan Text). Effective June 1, 2013, no further
AVCs would be accepted in the Plan. The Plan Text amendment also required existing AVC account balances to
be transferred out of the Plan.
The AVC option has been closed to new participants since January 1, 2000; however, those members who were
already making AVCs or had balances prior to this date were permitted to continue participation. Since 2000,
the number of members with AVCs has declined and the Plan now has very few members with this option. The
Pension Board carefully considered the additional administrative efforts and costs associated with administering
AVCs and decided to not continue the option. Members with AVCs were given six months` notice and all
accounts were transferred by the end of 2013.
SPP Board MembershipThere was one new Director appointed to the SPP Pension Board in 2013. Mike Leslie was appointed by the
UBC Board of Governors for a four-year term beginning January 1, 2013. Mr. Leslie is the Executive Director of
Investments for the UBC Faculty Pension Plan.
Effective January 1, 2014, the UBC Board of Governors re-appointed Mr. Harry Satanove as the Independent Non-
Voting Chair of the SPP Board for a second two-year term. Mr. Satanove is an actuary and a Chartered Financial
Analyst and owns a pension and investment consulting fi rm. Jay Parker was also re-appointed by the Board of
Governors to a four-year term beginning January 1, 2014. Mr. Parker is the Executive Director of the UBC Staff
Pension Plan.
2014 is an election year for elected Directors on the SPP Board. There are two elected Directors on the Board.
Every two years, there are elections to elect two Directors to each serve a four-year term. Mr. Brian Evans and Mr.
George McLaughlin’s current four-year terms end on December 31, 2014. Elections will be held in the fall of 2014
for two elected Directors.
Pension Administration Offi ce (PAO)The year 2013 was a busy year for the PAO. There were two longtime staff who retired in 2013 and new staff were
hired and trained to assume their positions. Plan membership has grown considerably (71%) since 2001; as a
result, new positions were added in 2013 in the areas of communication and administration.
Over the last year, senior management from both the Staff and Faculty Plans have worked together on a
succession plan for the Pension Administration Offi ce. This succession plan will consider upcoming retirements
and how to best serve both pension plans and their members over the coming years.
2013 in Summary cont’d

STAFF PENSION PLAN 2013 Year in Review 7
Membership and Financial Highlights
Over the past 5 years, total membership has grown on average 3.7% annually.
3.7%
7,164 Active Members6.8% increase from
2012
1,646 Deferred Members5.1% increase from
2012
Average age
44.9 yrs
Average age
47.0 yrs
Average age
62 yrs
1,890 Retired Members7.8% increase from
2012
The average age of new enrollees in the Plan is 38.8 years.
38.8 yrs
1,138 New Enrollments in 2013, 43.3% increase from 2012
43.3%s
as at December 31, 2013
MEMBERSHIP HIGHLIGHTS

STAFF PENSION PLAN 2013 Year in Review 8
Membership Statistics
The Plan’s membership numbers are never constant; there are always employees
joining and leaving the Plan. It is important to maintain or increase the number of
members joining the Plan, as contributions made by these members go towards
funding the Plan. These funds, along with investment returns and employer
contributions, provide pension benefi ts for members retiring from the Plan.
Growth in Plan MembershipMembership Statistics as of December 31 for Years 1971 to 2013 illustrates that since 2001 total membership
has grown by 71%. Total membership includes Active (contributing members), Deferred (members no longer
contributing and have not yet elected an option from the Plan), and Retired members. The Staff Pension Plan
provides retirement, termination, and death benefi ts for these groups as well as for staff of related employers.
Membership Statistics as of December 31 for Years 1971 to 2013
* There were 1006 individuals as at December 31, 1971 who were part of a prior UBC pension plan. These individuals became members of the SPP when the Plan was established in 1972.
** For years 1971 to 1981, Active and Deferred members are combined.
Membership **1971 **1981 1991 2001 2011 2013
Active*1006 2272
3002 4327 6484 7164
Deferred 765 890 1728 1646
Retired 0 298 710 1057 1650 1890
Total 1006 2570 4477 6274 9862 10700

STAFF PENSION PLAN 2013 Year in Review 9
Membership Statistics cont’d
Number of Members as at December 31The following graph shows the number of members in the Plan at year-end for the last fi ve years. In 2013, Active,
Deferred and Retired members grew by 6.8%, 5.1%, and 7.8% respectively.
6,224 6,345 6,484 6,706 7,164
1,570 1,663 1,728 1,5661,646
1,468 1,543 1,650 1,7531,890
2009 2010 2011 2012 2013
Active Deferred Retired
9,262 9,5519,862 10,025
10,700
New Enrollments as at December 31There were 1,138 new enrollments into the Plan in 2013, which was an increase of 43.3% from 2012. This increase
is largely due to changes to the Plan’s eligibility rules, which allowed hourly CUPE 116 employees to join the Plan
as of April 1, 2013. In 2013, 290 CUPE 116 members joined the Plan, which accounted for approximately 25% of
enrollments in that year.
686 697791 794
1138
2009 2010 2011 2012 2013

STAFF PENSION PLAN 2013 Year in Review 10
Membership Statistics cont’d
Active Members by AgeActive members are members who are making contributions into the Plan. The average age of Active members
in 2013 was 44.9 years, with a median age of 45 years. The fi nancial health of a pension plan, like the UBC Staff
Pension Plan, is somewhat dependent on there being new members entering the Plan to help fi nance the pension
benefi ts of retiring members.
0
500
1000
1500
2000
2500
Under Age 30 Age 30 to 39 Age 40 to 49 Age 50 to 59 Age 60 and Over
Num
ber o
f Mem
bers

STAFF PENSION PLAN 2013 Year in Review 11
Retirees by AgeThe following graph, Retirees by Age, illustrates the age distribution of the Plan’s Retired members. These
members are receiving a pension from the Plan. Since members age 55 and over must elect a pension option
from the Plan (unless they qualify for a small pension lump sump payout), we will see growth in this group as
more members will be receiving pensions from the Plan. Also, retirees are living longer because of longer life
expectancies.
Membership Statistics cont’d
0
100
200
300
400
500
600
700
800
900
Under Age 60 Age 60 to 69 Age 70 to 79 Age 80 to 89 Age 90 and Over
Num
ber o
f Mem
bers

STAFF PENSION PLAN 2013 Year in Review 12
Membership Statistics cont’d
2013 Retirements by AgeThe graph below illustrates that, in 2013, the greatest number of retirements (19%) occurred at age 60. These
retirees took a Monthly Lifetime Pension or Monthly Lifetime Pension with a Lump Sum as their retirement
option.
0
5
10
15
20
25
30
35
7170696867666564636261605958575655Age
Nu
mb
er
of
Me
mb
ers

STAFF PENSION PLAN 2013 Year in Review 13
Financial Statistics
Member and Employer Contributions as at December 31($ Millions)The Staff Pension Plan provides for fi xed contributions levels (from both the Plan members and the University and
its related employers) to provide a certain level of benefi t - a target benefi t (known as your SPP basic benefi t). For
more information on Plan contributions, please refer to the SPP at a Glance page on the Plan’s website.
Employer Contributions includes contributions from the University and its related employers
Operating and Investment Expenses as at December 31The following table shows the Plan’s operating and investment expenses for the last fi ve years.
• The fee percentages for operating and investment expenses are calculated based on average market value.
• UBC IMANT has been responsible for investing the funds since July 1, 2004.
• The Plan’s investment expenses in 2013 are higher than previous years for two reasons. Further efforts were made in
2013 to explicitly record investment management fees for most alternative investments which are typically netted by
managers from the funds. In addition, as part of the new Long Term Asset Policy mix (see page 16 of the 2013 Investment
Review), the Plan is now investing in more alternative investments such as real estate and infrastructure equity, which
have higher investment management fee structures.
$17.0M
$22.5M
$23.1M
$24.3M
$26.4M
$28.6M
$30.1M
$30.8M
$32.3M
$35.2M
2009
2010
2011
2012
2013
Employer Contributions Member Contributions
Year Operating Expenses % per Assets Investment Expenses % per Assets
2009 $1,452,994 0.21% $2,000,265 0.30%
2010 $1,313,353 0.18% $1,780,267 0.24%
2011 $1,647,705 0.20% $2,107,281 0.26%
2012 $1,596,866 0.18% $2,544,239 0.29%
2013 $1,836,692 0.19% $4,188,636 0.43%
STAFF PENSION PLAN 2013 Year in Review 14
Financial Statistics cont’d
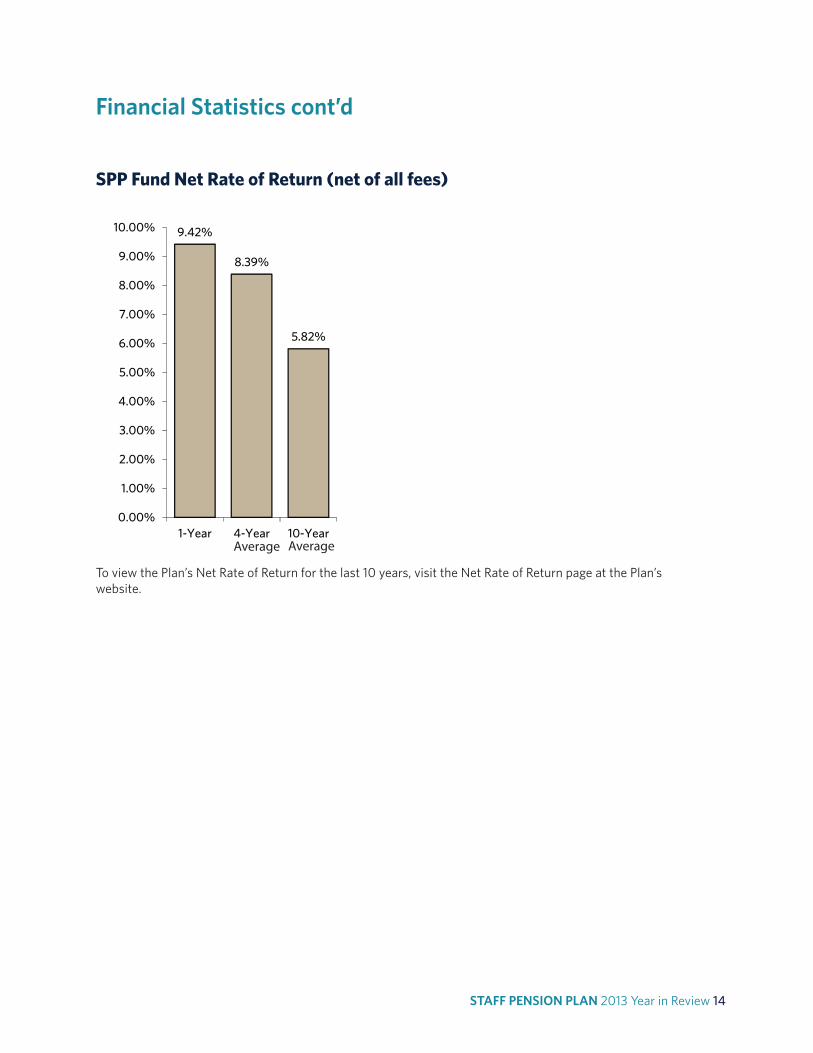
SPP Fund Net Rate of Return (net of all fees)
To view the Plan’s Net Rate of Return for the last 10 years, visit the Net Rate of Return page at the Plan’s
website.
9.42%
8.39%
5.82%
0.00%
1.00%
2.00%
3.00%
4.00%
5.00%
6.00%
7.00%
8.00%
9.00%
10.00%
1-Year 4-Year 10-YearAverage Average
STAFF PENSION PLAN 2013 Year in Review 15
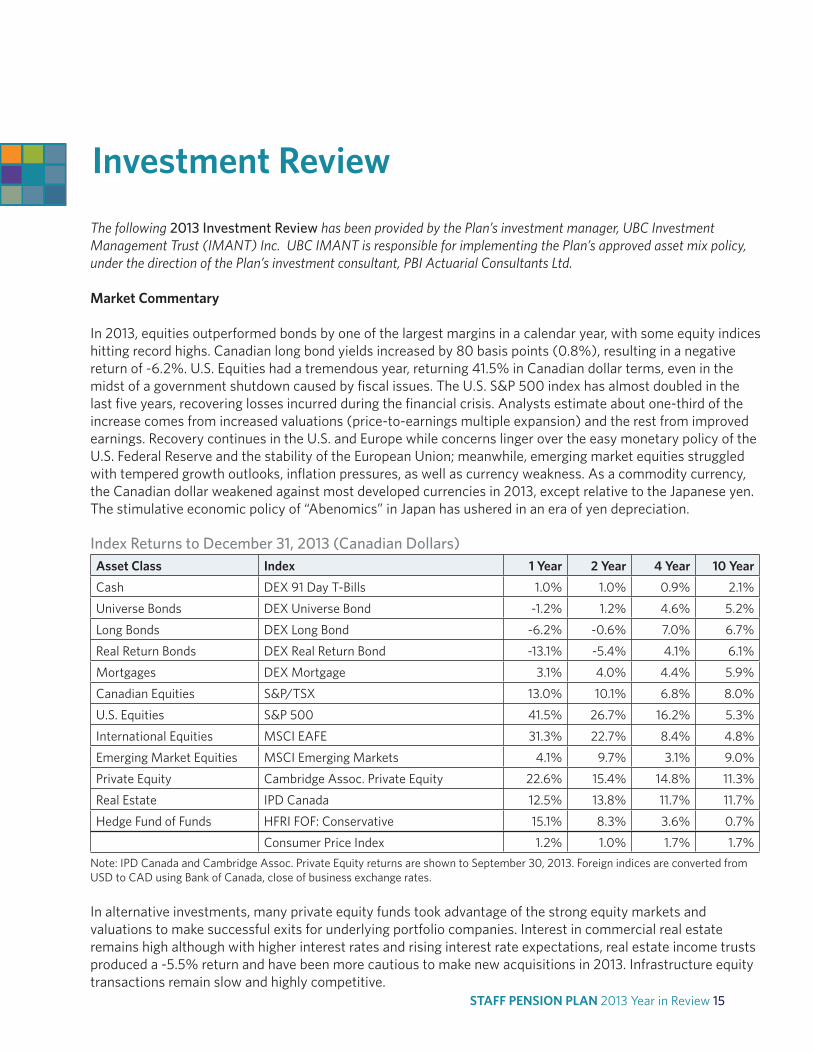
Investment Review
The following 2013 Investment Review has been provided by the Plan’s investment manager, UBC Investment
Management Trust (IMANT) Inc. UBC IMANT is responsible for implementing the Plan’s approved asset mix policy,
under the direction of the Plan’s investment consultant, PBI Actuarial Consultants Ltd.
Market Commentary
In 2013, equities outperformed bonds by one of the largest margins in a calendar year, with some equity indices
hitting record highs. Canadian long bond yields increased by 80 basis points (0.8%), resulting in a negative
return of -6.2%. U.S. Equities had a tremendous year, returning 41.5% in Canadian dollar terms, even in the
midst of a government shutdown caused by fi scal issues. The U.S. S&P 500 index has almost doubled in the
last fi ve years, recovering losses incurred during the fi nancial crisis. Analysts estimate about one-third of the
increase comes from increased valuations (price-to-earnings multiple expansion) and the rest from improved
earnings. Recovery continues in the U.S. and Europe while concerns linger over the easy monetary policy of the
U.S. Federal Reserve and the stability of the European Union; meanwhile, emerging market equities struggled
with tempered growth outlooks, infl ation pressures, as well as currency weakness. As a commodity currency,
the Canadian dollar weakened against most developed currencies in 2013, except relative to the Japanese yen.
The stimulative economic policy of “Abenomics” in Japan has ushered in an era of yen depreciation.
Asset Class Index 1 Year 2 Year 4 Year 10 Year
Cash DEX 91 Day T-Bills 1.0% 1.0% 0.9% 2.1%
Universe Bonds DEX Universe Bond -1.2% 1.2% 4.6% 5.2%
Long Bonds DEX Long Bond -6.2% -0.6% 7.0% 6.7%
Real Return Bonds DEX Real Return Bond -13.1% -5.4% 4.1% 6.1%
Mortgages DEX Mortgage 3.1% 4.0% 4.4% 5.9%
Canadian Equities S&P/TSX 13.0% 10.1% 6.8% 8.0%
U.S. Equities S&P 500 41.5% 26.7% 16.2% 5.3%
International Equities MSCI EAFE 31.3% 22.7% 8.4% 4.8%
Emerging Market Equities MSCI Emerging Markets 4.1% 9.7% 3.1% 9.0%
Private Equity Cambridge Assoc. Private Equity 22.6% 15.4% 14.8% 11.3%
Real Estate IPD Canada 12.5% 13.8% 11.7% 11.7%
Hedge Fund of Funds HFRI FOF: Conservative 15.1% 8.3% 3.6% 0.7%
Consumer Price Index 1.2% 1.0% 1.7% 1.7%
Note: IPD Canada and Cambridge Assoc. Private Equity returns are shown to September 30, 2013. Foreign indices are converted from
USD to CAD using Bank of Canada, close of business exchange rates.
In alternative investments, many private equity funds took advantage of the strong equity markets and
valuations to make successful exits for underlying portfolio companies. Interest in commercial real estate
remains high although with higher interest rates and rising interest rate expectations, real estate income trusts
produced a -5.5% return and have been more cautious to make new acquisitions in 2013. Infrastructure equity
transactions remain slow and highly competitive.
Index Returns to December 31, 2013 (Canadian Dollars)

STAFF PENSION PLAN 2013 Year in Review 16
Investment Review cont’d
Transition to the Long Term Policy
The SPP’s assets are invested to provide stable lifetime retirement pensions in accordance with the Statement
of Policies and Procedures approved by the UBC Board of Governors. The following table contains the actual
asset mixes at the end of December 2012 and December 2013 along with the revised long term policy asset
mix adopted in April 2013.
Asset Mix Prior Policy December 2012
December 2013
Revised Long Term Policy
Cash and Net Currency Forwards 1.0% 1.3% 1.7% 1.0%
Long Bonds 24.0% 25.4% 23.3% 24.0%
Real Return Bonds 5.0% 4.7% 3.6% 5.0%
Mortgages 5.0% 5.0% 4.3% 5.0%
Infrastructure Debt 10.0% 4.6% 9.2% 10.0%
Total Fixed Income 45.0% 40.9% 42.2% 45.0%
Canadian Equities 15.0% 15.6% 15.8% 10.0%
Global Equities (including U.S. and International) 15.0% 22.2% 17.8% 10.0%
Emerging Market Equities 0.0% 0.2% 4.8% 5.0%
Total Equities 30.0% 38.1% 38.3% 25.0%
Private Equity 5.0% 6.6% 5.8% 5.0%
Real Estate 8.0% 9.3% 8.7% 12.5%
Infrastructure Equity 12.0% 4.2% 4.5% 12.5%
Hedge Fund of Funds 0.0% 1.0% 0.5% 0.0%
Total Alternatives 25.0% 21.1% 19.5% 30.0%
Total 100.0% 100.0% 100.0% 100.0%
In the revised long term policy asset mix, U.S. equities (7.5%) and international equities (7.5%) allocations
were combined to create a 10% Global equities allocation and a 5% Emerging Market equities allocation. The
previous 15% Canadian equities allocation was reduced to 10%. The Real Estate (8%) and Infrastructure Equity
(12%) allocations were both increased to 12.5%.
The long term policy asset mix was revised to further strengthen the security of the basic pension benefi t.
With the new allocation to Emerging Market equities, the SPP portfolio will benefi t from the emerging market
countries’ higher expected economic growth and higher expected equity returns relative to developed market
equities. With the increased allocations to Real Estate and Infrastructure Equity, the portfolio will benefi t from
investments that have infl ation adjusted cash fl ows and better matching characteristics to pension liabilities.
The SPP continued its multi-year transition to its long term investment policy in 2013. In fi xed income, the long
term infrastructure debt allocation was funded by the overweight from long bonds and is close to fully invested
at a weight of 9.2%. In equities, the new 5% Emerging markets equities allocation was implemented and two-
thirds invested with a fundamental manager and one-third with a low volatility manager.
Transition to the Long Term Policy as at December 31, 2013
STAFF PENSION PLAN 2013 Year in Review 17
Investment Review cont’d
In alternative asset classes, investments will occur over time as commitments made to external managers are
drawn. As funds are drawn for additional infrastructure equity and real estate investments, they will be funded
by selling Canadian and Global equity investments, which will reduce to their long term policy weights over
time. In the private equity program, $22 million was received in net distributions, bringing down the asset class
weight to 5.8% versus a long term policy weight of 5%. This will allow capacity for new commitments to be
made. In real estate, $4 million was received in net distributions and no new commitments were made in 2013.
Actual real estate investments now account for 8.7% of the Fund (9.7% including outstanding commitments)
versus a new long term policy weight of 12.5%.
In the infrastructure equity portfolio, a $50 million commitment was made to the B.C. Investment Management
Corporation infrastructure program, which will serve as a core component of the SPP’s infrastructure program.
In addition, a $15 million commitment was made to an open ended global infrastructure fund. At the end
of 2013, actual investments to infrastructure equity totaled 4.5% of the Fund (12.1% including outstanding
commitments) versus a new long term policy weight of 12.5%.
During the year, redemptions from hedge fund of funds continued with $5 million in proceeds received by the
Fund. Approximately 0.5% of the total Fund remains in this asset class.
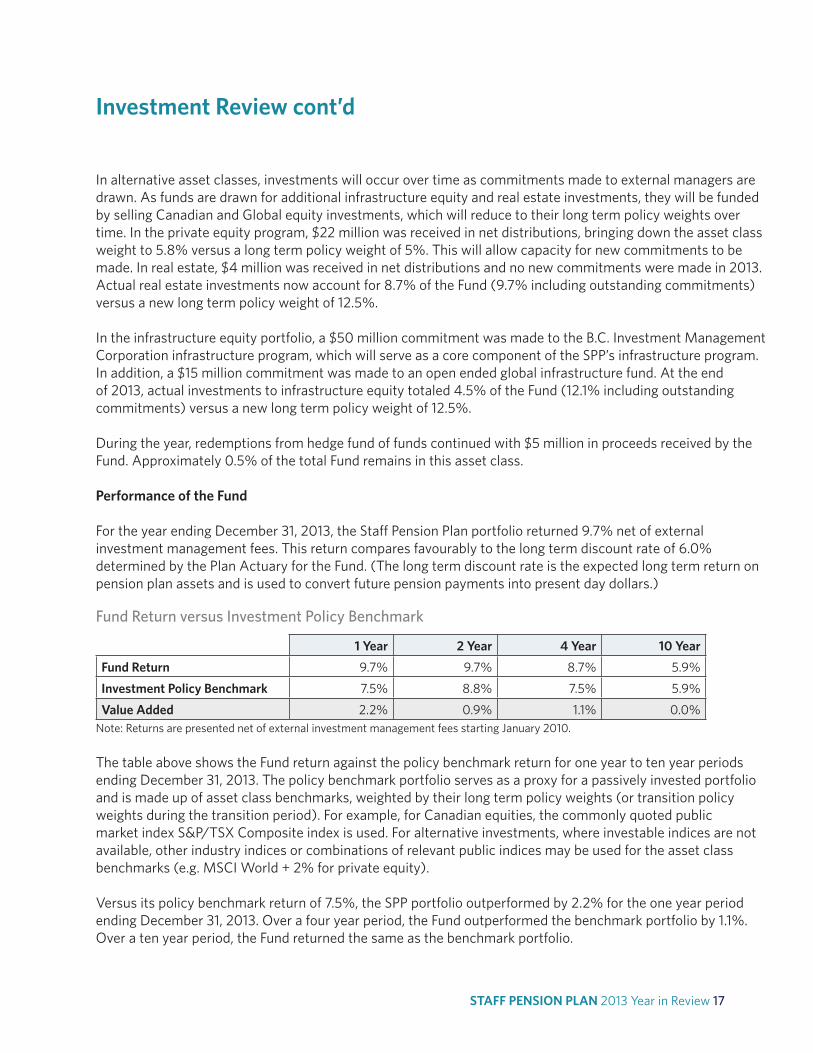
Performance of the Fund
For the year ending December 31, 2013, the Staff Pension Plan portfolio returned 9.7% net of external
investment management fees. This return compares favourably to the long term discount rate of 6.0%
determined by the Plan Actuary for the Fund. (The long term discount rate is the expected long term return on
pension plan assets and is used to convert future pension payments into present day dollars.)
Fund Return versus Investment Policy Benchmark
1 Year 2 Year 4 Year 10 Year
Fund Return 9.7% 9.7% 8.7% 5.9%
Investment Policy Benchmark 7.5% 8.8% 7.5% 5.9%
Value Added 2.2% 0.9% 1.1% 0.0%
Note: Returns are presented net of external investment management fees starting January 2010.
The table above shows the Fund return against the policy benchmark return for one year to ten year periods
ending December 31, 2013. The policy benchmark portfolio serves as a proxy for a passively invested portfolio
and is made up of asset class benchmarks, weighted by their long term policy weights (or transition policy
weights during the transition period). For example, for Canadian equities, the commonly quoted public
market index S&P/TSX Composite index is used. For alternative investments, where investable indices are not
available, other industry indices or combinations of relevant public indices may be used for the asset class
benchmarks (e.g. MSCI World + 2% for private equity).
Versus its policy benchmark return of 7.5%, the SPP portfolio outperformed by 2.2% for the one year period
ending December 31, 2013. Over a four year period, the Fund outperformed the benchmark portfolio by 1.1%.
Over a ten year period, the Fund returned the same as the benchmark portfolio.

STAFF PENSION PLAN 2013 Year in Review 18
Investment Review cont’d
The outperformance in 2013 came from a variety of sources. An underweight in long bonds and overweight
in equities added value to the portfolio as Canadian bonds experienced negative returns while most equity
markets performed strongly. SPP’s Canadian equity value and dividend managers performed very well again in
2013 against the S&P/TSX benchmark. However, this was partially offset by disappointing results from some
of the foreign equity managers. In alternative investments, private equity investments were helped by strong
equity markets and returned a net $22 million in distributions to the Fund. Infrastructure equity investments
outperformed the asset class benchmark with steady cash fl ows and were boosted by foreign currency
appreciation against the Canadian dollar. Below is a graph of one year asset class returns versus benchmarks.
9.7%
-6.0%
-13.1%
-3.1%-4.3%
21.9%
33.6%32.6%
7.3%
14.2%
12.2%
7.5%
-6.2%
-13.1%
-5.3%
-7.1%
13.0%
35.4%
31.0%
9.2%
6.6%
15.1%
-20.0%
-10.0%
0.0%
10.0%
20.0%
30.0%
40.0%
TOTAL FUND Long Bonds Real Return
Bonds
Mortgages Infrastructure
Debt
Canadian
Equities
Global Equities Private Equity Real Estate Infrastructure
Equity
Hedge Fund of
Funds
Fund Benchmark
One Year Asset Class Returns versus Benchmarks
Notes: Emerging market equities returns are not shown as the asset class does not have a one year history. Global Equities combines US
equities, International equities and Global equities and are compared to the MSCI World Index. Asset class benchmarks presented: Long
Bonds: DEX Long Bond Index; Real Return Bonds: DEX Real Return Bond Index; Mortgages: 65%/35% DEX Long/ Mid Federal Government
Index + 1.35%; Infrastructure Debt: DEX Long Federal Government Index + 1.9%; Canadian Equities: S&P /TSX Composite Index; Global
Equities: MSCI World Net Index (CAD); Private Equity: MSCI World Net Index (CAD) +2% (lagged 3 months); Real Estate: CPI + 4.0% since
April 2013 (previously IPD Canada lagged 3 months); Infrastructure Equity: CPI + 4.5% (previously 30% DEX Real Return Bond/70% MSCI
World Index Net (CAD) (lagged 3 months); Hedge Fund of Funds: HFRI Fund of Funds: Conservative Index (CAD).

STAFF PENSION PLAN 2013 Year in Review 19
Investment Review cont’d
Entire Portfolio by Geographic Region
Canada
68%
United
States
13%
Western
Europe
9%
Asia
Pacifi c
7%
Other
3%
Consumer
Discretionary
11%
Energy
11%
Financials
25%
Communications
8%Utilities
5%
Diversifi ed/
Other
1%Basic
Materials
7%Technology
4%
Consumer
Staples
16%
Fixed Income Exposure by Credit Rating Fixed Income Exposure by Borrower
Credit Rating
AAA 25%
AA 21%
A 25%
BBB 6%
Other (unrated, mortgages and
infrastructure debt)
23%
Other
1%Federal
21%
Provincial
32%
Corporate
35%
Mortgage
11%
Public Equity Exposure by Sector
Portfolio Breakdown by Geography, Sector, and Credit Ratings
As part of UBC IMANT’s risk assessment and management of the SPP portfolio, information on underlying
holdings in external manager pooled funds is collected and aggregated to provide a more thorough picture
of portfolio exposures and to confi rm that portfolio risk characteristics are in line with the investment policy.
Exposures in the SPP’s equity and fi xed income portfolio at December 31, 2013 are provided below for
information.