staff report - efis.psc.mo.gov
TRANSCRIPT

MISSOURI PUBLIC SERVICE COMMISSION
STAFF REPORT
COST OF SERVICE
Revenue Requirement
ST0-3\ Exhibit No ?.0\ rW DateL\ \'i. - 15"""Reporter ¥-1
File No ~ ~ - 8u'u.... _,-.J ~"5 I
THE EMPIRE DISTRICT ELECTRIC COMPANY
CASE NO. ER-2014-0351
Jefferson City, Missouri January 29, 2015
** Denotes Highly Confidential Information **
NP
FILED May 7, 2015 Data Center
Missouri Public Service Commission
TABLE OF CONTENTS OF COST OF SERVICE REPORT
THE EMPIRE DISTRICT ELECTRIC COMPANY CASE NO. ER-2014-0351
I. Executive Summary ............................................................................................................... 1 A. Major Issues .............................................................................................................. 1 B. Regulatory Trackers .................................................................................................. 2 C. Use of Budgeted or Projected Expenses ................................................................... 3
II. Background of Empire ........................................................................................................... 3 III. Test Year/Update Period/True-Up ......................................................................................... 4 IV. Asbury Environmental Retrofit Project (AERP) Construction Audit.. .................................. 5
Staff Expert/Witness: Kimberly K. Bolin, Sections I, II, III and IV .................................... 6 V. Economic Considerations ...................................................................................................... 6
Staff Expert/Witness: Michael L. Stahlman ....................................................................... 10 VI. Rate of Return ...................................................................................................................... 11
A. Introduction .................................................................................................................... 11 B. Analytical Parameters .................................................................................................... 12 C. Current Economic and Capital Market Conditions ........................................................ 15
1. Economic Conditions .............................................................................................. 15 2. Capital Market Conditions ...................................................................................... 17
a. Utility Debt Markets ........................................................................................... 17 b. Utility Equity Markets ........................................................................................ 17
D. Empire's Operations ....................................................................................................... 25 E. Empire's Credit Ratings ................................................................................................. 26 F. Cost of Capital ................................................................................................................ 27
1. Capital Structure ...................................................................................................... 27 2. Embedded Cost of Debt .......................................................................................... 28 3. Cost of Common Equity .......................................................................................... 28
a. The Proxy Groups ............................................................................................... 28 b. The Constant-growth DCF ................................................................................. 32 c. The Multi-stage DCF .......................................................................................... 34
G. Tests of Reasonableness ................................................................................................. 43
1. The CAPM .............................................................................................................. 43 2. Other Tests .............................................................................................................. 45
a. The "Rule of Thumb" ......................................................................................... 45 b. Average Authorized Returns .............................................................................. 46
H. Conclusion ...................................................................................................................... 47 Staff Expert/Witness: Shana Griffin ................................................................................... 48
VII. Rate Base ............................................. : ............................................................................... 49 A. Plant in Service ............................................................................................................... 49
1. Plant in Service as of August 31, 2014 ................................................................... 49
StaffExpert/Witness: Brooke M. Richter ........................................................................... 49 2. Plant Adjustments: Allocation to Gas ..................................................................... 49
StaffExpert/Witness: Brooke M. Richter ........................................................................... 49 B. Depreciation Reserve ..................................................................................................... 49
1. Depreciation Reserve as of August 31, 2014 .......................................................... 49
Staff Expert/Witness: Brooke M. Richter ........................................................................... 49 2. Reserve Adjustments: Allocation to Gas ............................................................... 49
StaffExpert!Witness: Brooke M. Richter ........................................................................... 49 3. Plant & Depreciation Reserve Adjustments:
Capitalized Incentive Compensation ...................................................................... 49
Staff Expert/Witness: Jermaine Green ............................................................................... 50
C. Cash Working Capital (CWC) ....................................................................................... 50
Staff Expert/Witness: Ashley R. Sarver ............................................................................. 54 D. Prepayments and Materials and Supplies ....................................................................... 55
Staff Expert/Witness: Brooke M. Richter ........................................................................... 56 E. Fuel Inventories .............................................................................................................. 56
Staff Expert/Witness: Paul R. Harrison .............................................................................. 57
F. Amortization of Electric Plant ........................................................................................ 57
Staff Expert/Witness: Brooke M. Richter ........................................................................... 57 G. Amortization ofPeopleSoft Intangible Asset ................................................................. 57
Staff Expert/Witness: Brooke M. Richter ........................................................................... 57 H. Customer Deposits ......................................................................................................... 57
Staff Expert/Witness: Brooke M. Richter ........................................................................... 58 I. Customer Advances ........................................................................................................ 58
Staff Expert/Witness: Brooke M. Richter ........................................................................... 58 J. Accumulated Deferred Income Taxes (ADIT) ............................................................... 58
Staff Expert/Witness: Kimberly K. Bolin ........................................................................... 59 K. Vegetation Management Tracker Regulatory Asset ...................................................... 59
Staff Expert/Witness: Jermaine Green ................................................................................ 60 L. I a tan and Plum Point Carrying Costs ............................................................................. 60
1. Iatan 1 ...................................................................................................................... 60
Staff Expert/Witness: Kimberly K. Bolin ........................................................................... 60 2. I a tan 2 ...................................................................................................................... 60
StaffExpert/Witness: Kimberly K. Bolin ........................................................................... 61 3. Plum Point ............................................................................................................... 61
Staff Expert/Witness: Kimberly K. Bolin ........................................................................... 61 4. Iatan Carrying Costs Amortization ......................................................................... 61
StaffExpert/Witness: Kimberly K. Bolin ........................................................................... 61
11

5. Southwestern Power Administration ("SWPA") Hydro Reimbursement.. ............. 62
Staff Expert/Witness: Kimberly K. Bolin ........................................................................... 62 VIII. Allocations ........................................................................................................................... 62
A. Corporate Allocations .................................................................................................... 62
Staff Expert/Witness: Paul R. Harrison .............................................................................. 63 B. Jurisdictional Demand Allocations ................................................................................ 63
1. Demand Allocation Factor ...................................................................................... 64 2. Energy Allocation Factor ........................................................................................ 65
Staff Expert/Witness: Alan J. Bax ...................................................................................... 65 IX. Income Statement ................................................................................................................. 65
A. Rate Revenues ................................................................................................................ 65
1. Introduction ............................................................................................................. 65
Staff Expert/Witness: Ashley R. Sarver ............................................................................. 66 2. Definitions ............................................................................................................... 66
Staff Expert/Witness: Ashley R. Sarver ............................................................................. 66
3. The Development of Rate Revenue in this Case ..................................................... 66
Staff Expert/Witness: Ashley R. Sarver ............................................................................. 67 4. Regulatory Adjustments to Update Period Usage and Rate Revenue ..................... 67
a. Update Period Adjustment ................................................................................. 67
Staff Experts/Witnesses: Robin Kliethermes and Brad J. Fortson ...................................... 67 b. Weather Normalization ...................................................................................... 67
Staff Expert/Witness: Seoung Joun Won, Ph.D .................................................................. 68 c. Weather Variables .............................................................................................. 68
Staff Expert/Witness: Seoung Joun Won, Ph.D .................................................................. 70 d. Weather Normalization ofUsage and Revenue ................................................. 71
Staff Experts/Witnesses: Robin Kliethermes and Brad J. Fortson ...................................... 71 e. 365-Days Adjustment to Revenue ...................................................................... 71
Staff Experts/Witnesses: Robin Kliethermes and Brad J. Fortson ...................................... 71
f. Missouri and Non-Missouri Large Power (LP) and Feed Mill & Grain Elevator Service (PFM) Annualizations .................................................. 72
Staff Expert/Witness: Brad J. Fortson ................................................................................. 72
g. Adjustments for Non-Missouri classes ............................................................... 72
Staff Expert/Witness: Brad J. Fortson ................................................................................. 72 h. Rate Switching .................................................................................................... 72
Staff Experts/Witnesses: Robin Kliethermes and Brad J. Fortson ...................................... 73 i. Customer Growth (Annualization) ..................................................................... 73
Staff Expert/Witness: Ashley R. Sarver ............................................................................. 74 j. Annualization of Excess Facility Charge Revenues ........................................... 74
Staff Expert/Witness: Brad J. Fortson ................................................................................. 74
k. Praxair and Special Contract Revenue Imputation ............................................. 74
Staff Expert/Witness: Sarah L. Kliethermes ....................................................................... 74
lll

5. Other Revenues ....................................................................................................... 74
a. FAC Revenues .................................................................................................... 74
Staff Expert/Witness: Ashley R. Sarver ............................................................................. 74
b. Unbilled Revenues .............................................................................................. 74
Staff Expert/Witness: Ashley R. Sarver ............................................................................. 75
c. Gross Receipts Revenues ................................................................................... 75 Staff Expert/Witness: Ashley R. Sarver ............................................................................. 75
d. S02 Allowances ................................................................................................. 75 Staff Expert/Witness: Ashley R. Sarver ............................................................................. 75
e. Renewable Energy Credits (REC) ...................................................................... 75 Staff Expert/Witness: Ashley R. Sarver ............................................................................. 76
f. Water Revenues .................................................................................................. 76
Staff Expert/Witness: Ashley R. Sarver ............................................................................. 76
g. Coal Fly Ash Revenues ...................................................................................... 76
Staff Expert/Witness: Paul R. Harrison .............................................................................. 76
h. Miscellaneous Revenues .................................................................................... 76
Staff Expert/Witness: Ashley R. Sarver ............................................................................. 76
B. Southwest Power Pool (SPP) Revenues and Expenses .................................................. 77
1. SPP Transmission Revenues ................................................................................... 77 Staff Expert/Witness: Kimberly K. Bolin ........................................................................... 77
2. SPP Transmission Expenses .................................................................................... 77
StaffExpert!Witness: Kimberly K. Bolin ........................................................................... 77
3. Ancillary Services Market Revenue and Expense .................................................. 77
Staff Expert/Witness: Kimberly K. Bolin ........................................................................... 77
4. Miscellaneous SPP Related Revenues and Expenses ............................................. 78
Staff Expert/Witness: Kimberly K. Bolin ........................................................................... 78
5. Off-system sales revenue and expense .................................................................... 78
Staff Expert/Witness: Paul R. Harrison .............................................................................. 78
C. Fuel and Purchased Power ............................................................................................. 78
Staff Expert/Witness: Paul R. Harrison .............................................................................. 78
1. Fixed Costs .............................................................................................................. 78
Staff Expert/Witness: Paul R. Harrison .............................................................................. 78
a. Fuel Adders ........................................................................................................ 79
StaffExpert!Witness: Paul R. Harrison .............................................................................. 79
b. Purchased Power- Capacity Charges ................................................................ 79
Staff Expert/Witness: Paul R. Harrison .............................................................................. 79
c. Fuel Prices .......................................................................................................... 79
Staff Expert/Witness: Paul R. Harrison .............................................................................. 80
2. Losses ...................................................................................................................... 81
Staff Expert/Witness: Alan J. Bax ...................................................................................... 82
iv

3. Variable Costs ......................................................................................................... 82
Staff Expert/Witness: Shawn E. Lange .............................................................................. 83
4. Planned and Forced Outages ................................................................................... 83
Staff Expert/Witness: Shawn E. Lange .............................................................................. 83
5. Capacity Contract Prices and Energy ...................................................................... 83
Staff Expert/Witness: Shawn E. Lange .............................................................................. 84
a. Normalized Net System Input ............................................................................ 84 Staff Experts/Witnesses: Shawn E. Lange and Seoung Joun Won, Ph.D .......................... 85
6. Purchased Power Prices .......................................................................................... 85
Staff Expert/Witness: Erin Maloney .................................................................................... 85
7. Entergy Transmission Contract ............................................................................... 86 Staff Expert/Witness: Paul R. Harrison .............................................................................. 86
D. Depreciation ................................................................................................................... 86
1. Regulatory Plan Amortization Redistribution ......................................................... 86 2. Iatan 2 Depreciation Reserve .................................................................................. 88 3. Depreciation Rate .................................................................................................... 89 4. Asbury Depreciation ............................................................................................... 89 5. Riverton Depreciation ............................................................................................. 89 6. Staff Depreciation Recommendation ...................................................................... 90
Staff Expert/Witness: John A. Robinett .............................................................................. 90
E. Payroll and Benefits ....................................................................................................... 91
1. Payroll, Payroll Taxes and 401(k) ........................................................................... 91 Staff Expert/Witness: Jermaine Green ................................................................................ 91
2. Incentive Compensation .......................................................................................... 92
a. Management Incentive Compensation Plan (MIP) ............................................ 92 b. Department Head Cash Incentive Plan ............................................................... 93 c. Lightning Bolts ................................................................................................... 93 d. Equity Incentive Compensation ......................................................................... 93 Staff Expert/Witness: Jermaine Green ......................................................... : ...................... 94
3. Payroll Benefits ....................................................................................................... 94 Staff Expert/Witness: Jermaine Green ................................................................................ 94
4. F AS 87 and F AS 88 Pension Costs ......................................................................... 94 StaffExpert!Witness: Paul R. Harrison .............................................................................. 95
5. FAS 106- Other Post Retirement Benefit Costs (OPEBs) ..................................... 95 Staff Expert/Witness: Paul R. Harrison .............................................................................. 96
6. Supplemental Executive Retirement Plan (SERP) .................................................. 96
Staff Expert/Witness: Paul R. Harrison .............................................................................. 97
F. Maintenance Normalization Adjustments ...................................................................... 97
1. Iatan ......................................................................................................................... 97 2. Asbury ..................................................................................................................... 97 3. Riverton ................................................................................................................... 98 4. State Line Combined Cycle (SLCC) and State Line Common ............................... 98
v

5. State Line ! .............................................................................................................. 98 6. Energy Center and Ozark Beach ............................................................................. 98 7. Operations and Maintenance (O&M) Expenses for Iatan 2, Iatan Common,
and Plum Point ....................................................................................................... 98 Staff Expert/Witness: Jermaine Green ................................................................................ 99
G. Other Non-Labor Expenses .......................................................................................... 100
1. Customer Deposit Interest Expense ...................................................................... 1 00 StaffExpert/Witness: Brooke M. Richter ......................................................................... 100
2. Property Tax Expense ........................................................................................... 100 StaffExpert/Witness: Ashley R. Sarver ........................................................................... 101
3. Corporate Franchise Taxes .................................................................................... 101 Staff Expert/Witness: Brooke M. Richter ......................................................................... 101
4. Amortization Expenses ......................................................................................... 101
a. Amortization ofElectric Plant .......................................................................... 101 Staff Expert/Witness: Brooke M. Richter ......................................................................... 101
b. Amortization of Stock Issuance Costs .............................................................. 102 Staff Expert/Witness: Ashley R. Sarver ........................................................................... 102
c. Amortization oflce Storm Costs ...................................................................... 102 Staff Expert/Witness: Brooke M. Richter ......................................................................... 102
5. I a tan Carrying Costs Amortization ....................................................................... 102 StaffExpert!Witness: Kimberly K. Bolin ......................................................................... 102
6. Demand Side Management ................................................................................... 103
a. Empire's DSM Programs and Cost Recovery Mechanism .............................. 103 StaffExperts/Witnesses: Kimberly K. Bolin and Hojong Kang, Ph.D ............................ 103
b. DSM Cost Recovery ......................................................................................... 103 StaffExpert!Witness: Kimberly K. Bolin ......................................................................... 104
c. Empire's MEEIA Filings .................................................................................. 104 Staff Expert/Witness: Hojong Kang, Ph.D ....................................................................... 104
7. Low Income Programs .......................................................................................... 1 04 Staff Expert/Witness: Michael L. Stahlman ..................................................................... 106
8. Current and Deferred Income Tax ....................................................... : ................ 106
a. Current Income Taxes ...................................................................................... 106 StaffExpert!Witness: Kimberly K. Bolin ......................................................................... 107
b. Deferred Income Taxes .................................................................................... 107 · StaffExpert!Witness: Kimberly K. Bolin ......................................................................... 108
c. State Income Tax Flow-Through ...................................................................... 108 StaffExpert!Witness: Kimberly K. Bolin ......................................................................... 108
9. Insurance Expense ................................................................................................. 108 Staff Expert/Witness: Ashley R. Sarver ........................................................................... I 08
10. Bad Debt Expense ............................................................................................. 109 StaffExpert!Witness: Ashley R. Sarver ............................................................................ 109
VI

11. Postage .............................................................................................................. 109 Staff Expert/Witness: Brooke M. Richter ......................................................................... l09
12. PSC Assessment and Rate Case Expense ......................................................... 109 Staff Expert/Witness: Ashley R. Sarver ........................................................................... 110
13. Injuries and Damages and Workers' Compensation ......................................... 110 Staff Expert/Witness: Ashley R. Sarver ........................................................................... Ill
14. Advertising Expense ......................................................................................... Ill Staff Expert/Witness: Brooke M. Richter ......................................................................... 112
15. Outside Services ................................................................................................ 112 Staff Expert/Witness: Brooke M. Richter ......................................................................... l12
16. Dues and Donations .......................................................................................... 112 Staff Expert/Witness: Brooke M. Richter ......................................................................... l13
17. EEl Dues .................................................................•......................................... 113 Staff Expert/Witness: Brooke M. Richter ......................................................................... l14
18. Tree Trimming Expense .................................................................................... 114 StaffExpert/Witness: Jermaine Green .............................................................................. 114
19. SWPA Amortization ......................................................................................... 114 StaffExpert!Witness: Kimberly K. Bolin ......................................................................... ll5
20. Lease Expense ................................................................................................... 115 StaffExpert/Witness: Ashley R. Sarver ........................................................................... 115
21. Tornado AAO Amortization ............................................................................. 115 Staff Expert/Witness: Kimberly K. Bolin ......................................................................... 115
22. Software Maintenance Expense ........................................................................ 116 StaffExpert/Witness: Paul R. Harrison ............................................................................ ll6
X. Fuel Adjustment Clause (F AC) ......................................................................................... 116 A. Policy ............................................................................................................................ 116
Staff Expert/Witness: David C. Roos ............................................................................... 117
B. History .......................................................................................................................... 117 Staff Expert/Witness: David C. Roos ............................................................................... 119
C. Continuation ofF AC .................................................................................................... 119 Staff Expert/Witness: David C. Roos ............................................................................... 122
D. Southwest Power Pool Integrated Market.. .................................................................. 122 Staff Expert/Witness: David C. Roos ............................................................................... 123
E. Revising the Base Factor .............................................................................................. 123 StaffExpert/Witness: David C. Roos ............................................................................... 125
F. Additional Reporting Requirements ............................................................................. 125 Staff Expert/Witness: David C. Roos ............................................................................... 126
G. Loss Study- Compliance with F AC Rules .................................................................. 126 Staff Expert/Witness: Alan J. Bax ..................................................................................... 126
H. Heat Rate Testing Review ............................................................................................ 126 StaffExpert/Witness: Randy S. Gross ............................................................................... l27
Vll

XI. Miscellaneous .................................................................................................................... 127 A. Smart Grid Status ......................................................................................................... 127
Staff Expert/Witness: Randy S. Gross ............................................................................... 131
B. Light Emitting Diode (LED) Street and Area Lighting ............................................... 131 Staff Expert/Witness: Hojong Kang, Ph.D ....................................................................... 132
C. Service Quality Reporting ..................................... ; ...................................................... 132 Staff Expert/Witness: Gary R. Bangert ............................................................................. 132
Appendices: ................................................................................................................................. 132
Vlll

1 COST OF SERVICE REPORT
211 I. Executive Summary
3 II The Staff of the Missouri Public Service Commission ("Commission" or "PSC") has
4 II conducted a review in Case No. ER-2014-0351 of all cost of service components (capital
511 structure and return on rate base, rate base, depreciation expense and operating expenses) which
6 comprise The Empire District Electric Company's ("Empire's" or "Company's") Missouri
7 II jurisdictional revenue requirement. This audit was performed in response to Empire's
8 II application to increase its Missouri jurisdictional permanent retail rates by approximately
9 II $24.3 million, exclusive of applicable gross receipts, sales, franchise or occupational fees or
10 II taxes, filed on August 29, 2014.
11 II The Staffs revenue requirement audit of Empire is based on a test year of the
12 il twelve months ending April 30, 2014. Staffis using an update period ending August 31, 2014.
13 II Major elements of the revenue requirement calculation for Empire were measured through
14 II August 31, 2014, in Staffs case. Staffs audit results for Empire at the mid-point of its return on
15 ~ equity (ROE) range of9.50% would be a rate increase of$6,193,690.
16 II Impact of Stafrs Revenue Requirement on Each Retail Rate Customer Class
17 ~ The impact of Staffs recommended revenue requirement for each retail rate customer
18 II class will be proposed in Staff's class cost of service report and rate design testimony that is to
19 II be filed on February 11, 2015.
20 II A. Major Issues
21 II The following are the major differences in traditional revenue requirement that exist
22 II between Staff and Empire based on their respective direct filings. A brief explanation of each
2311 item follows:
24 Return on Equity (ROE) - Staff has recommended a 9.5% ROE at the mid-point.
25 II Empire is requesting a 10.15% ROE. This issued is addressed in detail in the Section VI. of
26 II this Report.
27 II Depreciation - Staff recommends the current ordered depreciation rates remain m
28 II effect for the Riverton 8 unit and Riverton Common plant. Empire retired Riverton 7 in June of
29 II 2014. Staff is not recommending continued accrual of depreciation expense for Riverton 7 since
Page 1

1 II it is no longer used and useful. Empire has not yet retired the Riverton unit 8 and Riverton
2 II Common plant. Adequate depreciation reserve funds exist to cover the retirement of Riverton
3 unit 7 at this time.
4 Fuel and Purchase Power - In March, 2014, during the test year in this case, the
5 Southwest Power Pool (SPP) Integrated Marketplace (IM) replaced the Energy Imbalance
6 Service (EIS) market. Staff has calculated Empire's Fuel and Purchase Power using it fuel
711 model dispatch to simulate Empire's operations in the SPP IM. Empire calculated its fuel model
8 dispatch to simulate the Energy Imbalance Service (EIS) market.
9 There are various other issues between Staff and Empire based on their respective direct
10 filings which appear to be of lower dollar magnitude. These issues are discussed in this Report
11 as well.
12 II B. Regulatory Trackers
13 II The following are tracking mechanisms which the Company requests creating,
14 II continuing, or ending in its direct filing. While the trackers do not have an immediate direct
15 II effect on the revenue requirement, they may impact future rate cases and future revenue
16 II requirements. A brief explanation of each item follows:
17 II Vegetation Management Tracker- Empire requests to use projected figures in setting
18 II base rates to recover vegetation management expenses, and Empire also requests to continue its
19 II current vegetation management tracker. Because the vegetation management costs do not appear
20 i to have stabilized yet, Staff recommends continuing the tracker and using $11 million (Empire's
21 II recommendation) as the base in this proceeding.
22 II Iatan and Plum Point Operations & Maintenance (O&M) Trackers - Empire
23 II requests to continue the trackers for the Iatan and Plum Point O&M expenses since the units are
24 II relatively new and it argues that there has been little operating history to determine ongoing
25 II expense levels. Staff disagrees with the Company that these trackers should continue. These
26 II plants have been operating for approximately four years, which has given Staff enough prior
2711 history to determine a reasonable normalized level of O&M expense associated with these
28 generating units.
291 Riverton 12 Unit Maintenance Tracker- Empire has proposed a tracker similar to the
30 previous trackers for Iatan and Plum Point for a new maintenance contract with Siemens
Page2
1 II Instrumentation, Controls and Electrical Group for the Riverton 12 unit. Staff does not believe a
211 tracker is appropriate for this cost at this time. Staff has also not included any additional expense
3 in its cost of service for this new contract, since the contract became effective January 1, 2015,
4 II which is outside the update test year (12 months ending August 31, 20 14) for this rate case
511 proceeding. Staff will examine this cost in its true-up recommendation.
6 Pension and OPEBS Tracker - Staff recommends continuation of the pensiOn
711 and OPEB trackers that were last reauthorized in Empire's previous rate case, Case No.
8 ER-2012-0345.
9 II C. Use of Budgeted or Projected Expenses
10 II Empire's direct filing included many expenses and rate base items that were calculated .
11 II based on budgeted or projected information, instead of relying on test year or adjusted levels.
12 II Staffs case does not normally include any budgeted or projected information, because it is not
13 II known and measurable. The Commission has ordered a true-up in this case as of December 31,
14 II 2014. Staffs recommendation of issues that should be included in the true-up audit are addressed
15 II in Section III. of this Report. The following is a list of some of the items in which the Company
16 II has used budgeted information in its direct case while Staff has used known and measureable
17 information in this direct filing:
18 Plant 19 Accumulated Depreciation Reserve 20 Accumulated Deferred Income Tax 21 Fuel and Purchased Power Expense 22 Healthcare Expense 23 SPP Transmission Revenue and Expense 24 Pension and OPEB Expense 25 Vegetation Management Expense 26 0 & M Expense 27 Property Tax Expense 28 Rate Case Expense
2911 II. Background of Empire
30 II Empire is a Kansas corporation providing electrical utility services in Missouri, Kansas,
31 II Arkansas, and Oklahoma. Empire also provides water utility services and an affiliated company
32 II operates a natural gas distribution business, both in Missouri. As of August 31, 2014, Empire
Page3

1 served approximately 168,4 72 retail electric customers throughout its system of which
2 approximately 149,774 are Missouri customers.
3 In 2006, the Commission approved Empire's acquisition of the Missouri natural gas
4 II distribution operations of Aquila, Inc. ("Aquila"). The gas distribution business is operated by
511 Empire through its wholly owned subsidiary, The Empire District Gas Company.
6 Empire also provides non-regulated fiber optics services through its wholly-owned
7 II subsidiary, EDE Holdings, Inc.
811 Empire last sought to change its Missouri jurisdictional electric retail rates in Case
9 No. ER-2012-0345. Through its Order dated February 27, 2013 in that proceeding, the
10 II Commission granted Empire a total net increase in rates of$27,500,000.
11 On October 1, 2014, Empire filed an application to Modify its Fuel Adjustment
12 II Clause (FAC) rates. The Commission issued an order on November 12, 2014, approving the
13 II new rates to be effective December 1, 2014. Staff has rebased the FAC as a part of this case
14 II although the FAC rates will not reset to zero until the next Cost Adjustment Factor case
15 II following the effective dates of rates in this case. The change in rates for Empire recommended
16 II in the Staffs direct filing in this proceeding is based on the most recent available fuel
17 II information, which includes $1,765,858 currently being collected pursuant to Empire's FAC.
18 11 III. Test Year/Update Period/True-Up
19 II The purpose of an update period is to establish a cut-off point to which major elements of
20 II a utility's revenue requirement are to be updated, beyond the test year, for inclusion in Staff's
21 II and other parties' direct cases. In contrast, a true-up is are-audit and update of major elements
22 II of a utility's revenue requirement beyond the end of the ordered test year and update period.
23 II When ordered, true-ups involve the filing of an additional set of testimony and the scheduling of
24 II additional evidentiary hearings ordered by the Commission.
25 II Empire filed its case based upon an April 30, 2014, test year. The Commission ordered
26 II a test year based upon twelve months ending April 30, 2014, with an update period to
27 II reflect known and measureable changes through August 31, 2014. The Commission also ordered
28 II a true-up period through December 31, 2014.
291 For purposes of the true-up audit, Staff will update the following items through
30 December 31, 2014: plant in service; depreciation reserve, other rate base components (including
Page4
1 trackers); payroll expense; payroll-related benefits; fuel and purchased power costs; depreciation
2 and amortization expense; rate case expense; property taxes; related income tax effects; the
3 customer growth annualization for revenues, SPP transmission revenues and expenses, other
4 SPP revenues and expenses, capital structure, and debt costs used in determining the rate
5 II of return.
611 IV. Asbury Environmental Retrofit Project (AERP) Construction 7 Audit
8 II As of August 31, 2014, the end of the update period for this case, the Company was
9 II completing the construction of the Asbury AERP, also known as the Asbury Air Quality Control
10 II System ("AQCS"). On December 15, 2014, the in-service criteria were met for the Asbury
11 ~ AQCS. Staff is in the process of conducting a construction audit of the new plant and will
12 II provide the results of the audit during the true-up phase of this rate case proceeding. Staff has
13 II included in Staffs Accounting Schedules an estimate of the impact the addition of this plant will
14 II cause on Empire's revenue requirement.
15 II In Staffs construction audit and prudence review, it will determine the appropriate level
16 II of construction costs related to the Asbury AQCS constructed as the Asbury AERP to be used for
17 ~ purposes of setting rates, and to provide an independent and objective assessment of the utility's
18 II performance as it relates to these specific construction project activities. As part of its
19 II construction audit and prudence review, Staff is examining Empire's: (1) entry into agreements
20 ~ to pursue the AERP, (2) undertaking of the AERP, and (3) persisting with the AERP in light of
21 II whether those decisions or the costs associated with those decisions were (a) inappropriate,
22 II (b) unreasonable, (c) excessive, (d) unreasonably or inappropriately allocated, (e) not of benefit
23 ~ to Missouri ratepayers, or (f) related to unnecessary facilities; where such decision would result
24 I in harm to Empire's ratepayers, in light of the following factors established by Staff:
25 II 1. Impact on rate base,
26
27
28 29
30
2. Projected operation & maintenance expense,
3. Projected fuel and consumable-related expense,
4. Projected effect on the Fuel and Purchased-Power Cost Recovery Mechanisms,
5. Projected effect on depreciation rates and expense,
Page 5

1 2
3 4
5 6 7
6. Projected operational impacts, including plan dispatch ability, dispatch order, or reductions to net generation,
7. Consistency with the utility's Preferred Resource Plan effective at the time the project was undertaken, and as subsequently updated or superseded,
8. Compliance with State and Federal environmental and renewable energy standards and any other applicable State and Federal mandates in effect during the construction of the project,
8 II 9. Compliance with settlements or other agreements, and
9 II 10. Evaluation of other projects to improve this project.
10 II Empire has requested additional operations and maintenance expense due to the AQCS.
11 II Staff has included in its true-up estimate $238,300 (Empire's estimation) for the additional
12 II operations and maintenance expense. The AQCS was not in service during the test year or the
13 II update period. Staffwill examine this expense in its true-up audit.
14 II Staff Expert/Witness: Kimberly K Bolin, Sections L IL III and IV
15 II V. . Economic Considerations
16 II Missouri's general economic condition, specifically of the counties1 that compose the
17 II service area of Empire continues to experience challenges in the wake of the recession from
18 II December 2007 to June 2009. Figure 1 below shows that the real gross domestic product
19 II ("GDP") groWth of Missouri has been smaller than the United States as a whole since the
20 II recession ended, and was even negative for Missouri in the year 2011.
21
22
23
24
25
26
27
28
29 II continued on next page
1 According to Schedule 2 of the minimum filing requirements and the current tariffs, Empire serves a total of 16 counties.
Page 6

1
Figure 1: Real GOP Growth 2007-2013 (Percent)
3.00% 2.47%
2.00%
1.00%
0.00%
-1.00% - - -·
-2.00%
-3.00% -.... UU/U
El United States D Missouri
2
3 II As seen in Figure 2 below, the annual unemployment levels are still above the pre-recession
4 II levels. Although the unemployment rates for 2014 are preliminary estimations, the trend appears
5 II to show the Missouri unemployment rate leveling-off near six percent and the national trend
6 II continuing a downward trajectory. The combined unemployment rate for all of the counties that
711 Empire serves tends to be 0.3 to 0.4 percent less than Missouri's unemployment rate.
8
9
Figure 2: Comparison of Unemployment Rates For Empire Service Area
12.0
10.0
8.0
6.0 "~ -· u-~ ~ ... y-
4.0
2.0
o.o . 2007 2008 2009 2010 2011 2012 2013 2014 -e-Empire 4.6 5.5 9.1 8.9 8.2 6.7 6.1 6.0 .....;,~United States 4.6 5.8 9.3 9.6 8.9 8.1 7.4 6.2 -¢-Missouri 5.0 I 5.9 9.4 9.3 8.5 7.0 I 6.5 6.3
Page 7
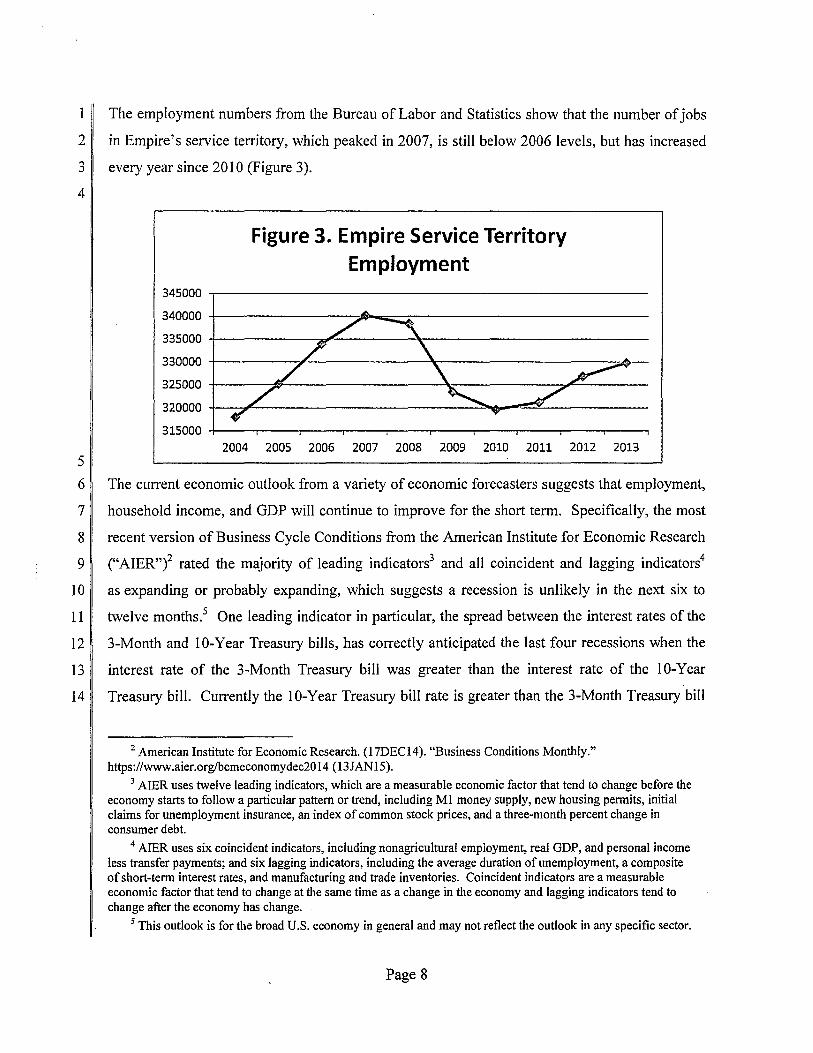
1 II The employment numbers from the Bureau of Labor and Statistics show that the number of jobs
2 in Empire's service territory, which peaked in 2007, is still below 2006 levels, but has increased
311 every year since 2010 (Figure 3).
4
5
Figure 3. Empire Service Territory Employment
345000 .--------------------------------------------------
340000 +---------------~~~~---------------------------
335000 +-----------~'-------~~-------------------------
330000 +---------~------------~r-------------------~~
325000 +-----~~----------------~~----------~~-------
320000 +-~~------------------------~~--~~-----------
315000 +---~----~--~----,---~----~--~----~--~~--~ 2004 2005 2006 2007 2008 2009 2010 2011 2012 2013
611 The current economic outlook from a variety of economic forecasters suggests that employment,
7 II household income, and GDP will continue to improve for the short term. Specifically, the most
8 II recent version of Business Cycle Conditions from the American Institute for Economic Research
9 i ("AIER"f rated the majority of leading indicators3 and all coincident and lagging indicators4
10 II as expanding or probably expanding, which suggests a recession is unlikely in the next six to
11 II twelve months.5 One leading indicator in particular, the spread between the interest rates of the
12 II 3-Month and 10-Year Treasury bills, has correctly anticipated the last four recessions when the
13 II interest rate of the 3-Month Treasury bill was greater than the interest rate of the 10-Year
14 II Treasury bill. Currently the 10-Year Treasury bill rate is greater than the 3-Month Treasury bill
2 American Institute for Economic Research. (17DEC14). "Business Conditions Monthly." https://www .aier.orglbcmeconomydec20 14 ( 13JAN15).
3 AIER uses twelve leading indicators, which are a measurable economic factor that tend to change before the economy starts to follow a particular pattern or trend, including Ml money supply, new housing permits, initial claims for unemployment insurance, an index of common stock prices, and a three-month percent change in consumer debt.
4 AIER uses six coincident indicators, including nonagricultural employment, real GDP, and personal income less transfer payments; and six Jagging indicators, including the average duration of unemployment, a composite of short-term interest rates, and manufacturing and trade inventories. Coincident indicators are a measurable economic factor that tend to change at the same time as a change in the economy and lagging indicators tend to change after the economy has change.
5 This outlook is for the broad U.S. economy in general and may not reflect the outlook in any specific sector.
Page 8
1 rate. The rate of the 1 0-Year Treasury bill has been falling and is now below two percent, but
2 the 3-Month Treasury bill rate is within a few hundredths of a percent from zero.
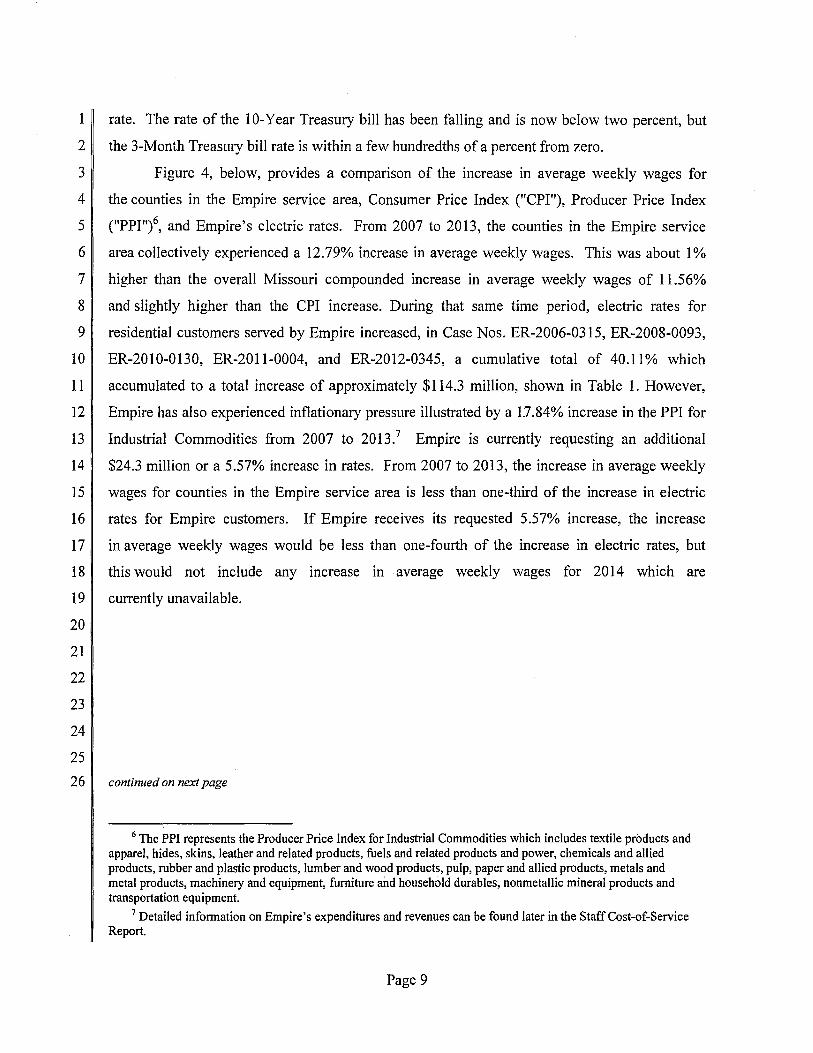
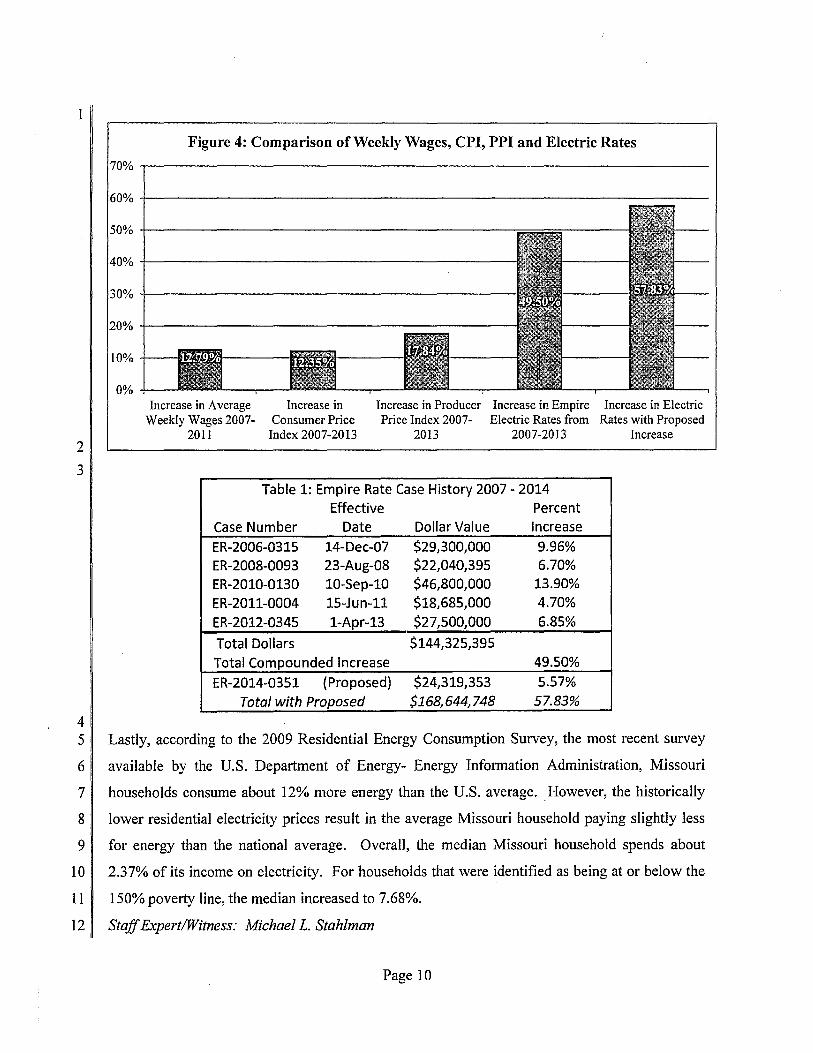
3 Figure 4, below, provides a comparison of the increase in average weekly wages for
4 the counties in the Empire service area, Consumer Price Index ("CPI"), Producer Price Index
51 ("PPI")6, and Empire's electric rates. From 2007 to 2013, the counties in the Empire service
6 area collectively experienced a 12.79% increase in average weekly wages. This was about 1%
7 higher than the overall Missouri compounded increase in average weekly wages of 11.56%
8 and slightly higher than the CPI increase. During that same time period, electric rates for
9 residential customers served by Empire increased, in Case Nos. ER-2006-0315, ER-2008-0093,
10 ER-2010-0130, ER-2011-0004, and ER-2012-0345, a cumulative total of 40.11% which
11 II accumulated to a total increase of approximately $114.3 million, shown in Table 1. However,
12 II Empire has also experienced inflationary pressure illustrated by a 1.7.84% increase in the PPI for
13 II Industrial Commodities from 2007 to 2013.7 Empire is currently requesting an additional
14 II $24.3 million or a 5.57% increase in rates. From 2007 to 2013, the increase in average weekly
15 II wages for counties in the Empire service area is less than one-third of the increase in electric
16 II rates for Empire customers. If Empire receives its requested 5.57% increase, the increase
17 II in average weekly wages would be less than one-fourth of the increase in electric rates, but
18 this would not include any increase in average weekly wages for 2014 which are
19 currently unavailable.
20
21
22
23
24
25
26 II continued on next page
6 The PPI represents the Producer Price Index for Industrial Commodities which includes textile products and apparel, hides, skins, leather and related products, fuels and related products and power, chemicals and allied products, rubber and plastic products, lumber and wood products, pulp, paper and allied products, metals and metal products, machinery and equipment, furniture and household durables, nonmetallic mineral products and transportation equipment.
7 Detailed information on Empire's expenditures and revenues can be found later in the Staff Cost-of-Service Report.
Page 9
2
3
4
Figure 4: Comparison of Weekly Wages, CPI, PPI and Electric Rates
70%
60%
50%
40% +--------------------------------------------
30% +--------------------------------------------------
20% ~------------------------------------=-------!
10% I fi
0% Increase in Average
Weekly Wages 2007-2011
Increase in Consumer Price
Index 2007-2013
Increase in Producer Increase in Empire Increase in Electric Price Index 2007- Electric Rates from Rates with Proposed
2013 2007-2013 Increase
Table 1: Empire Rate Case History 2007- 2014 Effective Percent
Case Number Date Dollar Value Increase
ER-2006-0315 14-Dec-07 $29,300,000 9.96%
ER-2008-0093 23-Aug-08 $22,040,395 6.70%
ER-2010-0130 10-Sep-10 $46,800,000 13.90%
ER-2011-0004 15-Jun-11 $18,685,000 4.70%
ER-2012-0345 1-Apr-13 $27,500,000 6.85%
Total Dollars $144,325,395
Total Compounded Increase 49.50%
ER-2014-0351 (Proposed) $24,319,353 5.57%
Total with Proposed $168,644,748 57.83%
5 II Lastly, according to the 2009 Residential Energy Consumption Survey, the most recent survey
6 II available by the U.S. Department of Energy- Energy Information Administration, Missouri
7 II households consume about 12% more energy than the U.S. average. However, the historically
8 II lower residential electricity prices result in the average Missouri household paying slightly less
9 II for energy than the national average. Overall, the median Missouri household spends about
10 II 2.37% of its income on electricity. For households that were identified as being at or below the
11 II 150% poverty line, the median increased to 7.68%.
12 II Staff Expert/Witness: Michael L. Stahlman
Page 10

111 VI. Rate of Return
2 II A. Introduction
3 II An essential ingredient of the cost-of-service ratemaking formula is the rate of
4 II return (ROR), which is usually premised on the goal of allowing a utility the opportunity to
5 II recover the costs required to secure debt and equity financing. If the allowed ROR is based on
6 II the costs to acquire capital, then it is synonymous with the utility's weighted average cost of
711 capital (WACC), which is calculated by multiplying each component ratio of the appropriate
8 capital structure by its cost and then summing the results. While the proportion and cost of most
9 II components of the capital structure are a matter of record, the cost of common equity must be
1 0 II determined through expert analysis. Staffs expert financial analyst, Shana Griffin, has estimated
11 II Empire's cost of common equity by applying well-respected and widely-used methodologies to
12 II data derived from a carefully-assembled group of comparable companies. Staff then compared
13 II that cost of common equity to Staffs cost of common equity estimates for Missouri's major
14 II electric utilities in 2012, which was the last time the Commission authorized ROEs for any
15 II Missouri electric utility. To the extent Staffs comparison showed a relative change in the cost
16 II of equity since the Commission last authorized ROEs for Missouri's electric utilities, Staff
17 II recommends the Commission change the level of the allowed ROEs by a similar amount.8
18 II Staffs analysis shows that the regulated electric utility industry's cost of equity, as measured by
19 II Staffs selected proxy group, has declined by at least 25 to 75 basis points, which implies an
20 II allowed ROE of 9.00% to 9.50% would be appropriate for Empire. However, because investors
21 ~ view Empire as having slightly more risk than the average regulated electric utility, Staff
22 II recommends the Commission set Empire's allowed ROR based on an allowed ROE of 9.25% to
23 II 9.75%, mid-point 9.50% (as of the August 31, 2014, update period). The details of the capital
24 II structure and the return components are detailed in the following table:
8 The cost of common equity is the return required by investors, determined by expert analysis of market data relating to a carefully-constructed group of proxy companies. The allowed return on equity (ROE), on the other hand, is the value selected by the Commission for use in calculating a utility's forward-looking rates for implementation at the end of the rate case.
Page 11

1 II
Allowed Rate of Return Using
Common Equity Return of: Percentage Embedded
Capital Component of Capital Cost 9.25% 9.50% 9.75%
Common Stock Equity 51.71% ---- 4.78% 4.91% 5.04%
Long-Term Debt 48.29% 5.56% 2.69% 2.69% 2.69%
Total 100.00% 7.47% 7.60% 7.73%
2
311 The details of Staffs analysis and recommendations are presented in Schedules 1-18 in
4 Appendix 2. Staffs workpapers will be provided to the parties at the time of filing Staffs Cost
5 II of Service Report. Staff will make any source documents of specific interest available upon the
6 II request of any party to this case or upon the Commission's request.
7 II B. Analytical Parameters
8 II The determination of a fair rate of return is guided by principles of economic and
9 II financial theory and by certain minimum Constitutional standards. Investor-owned public
10 II utilities such as Empire are private property that the state may not confiscate without
11 II appropriate compensation. The Constitution requires, therefore, that utility rates set by the
12 ~ government must allow a reasonable opportunity for the shareholders to earn a fair return on
13 II their investment. The United States Supreme Court has described the minimum characteristics
14 ~ of a Constitutionally-acceptable rate of return in two frequently-cited cases.9 In Bluefield Water
15 II Works & Improvement Co. v. Public Service Commission of West Virginia, the Court stated:10
16 A public utility is entitled to such rates as will permit it to earn a return on 17 the value of the property which it employs for the convenience of the 18 public equal to that generally being made at the same time and in the same 19 general part of the country on investments in other business undertakings 20 which are attended by corresponding risks and uncertainties; but it has no 21 constitutional right to profits such as are realized or anticipated in highly 22 profitable enterprises or speculative ventures. The return should be
9 Federal Power Commission v. Hope Natural Gas Co., 320 U.S. 591, 64 S.Ct. 281, 88 L.Ed. 333 (1943); Bluefield Water Works & Improvement Co. v. Public Service Commission of West Virginia, 262 U.S. 679, 43 S.Ct. 675, 67 L.Ed 1176 (1923).
10 262 U.S. at 692-693, 43 S.Ct. at 679,67 L.Ed. at 1176, 1182-83.
Page 12
1 reasonably sufficient to assure confidence in the financial soundness of the 2 utility and should be adequate, under efficient and economical 3 management, to maintain and support its credit and enable it to raise the 4 money necessary for the proper discharge of its public duties. A rate of 5 return may be reasonable at one time and become too high or too low by 6 changes affecting opportunities for investment, the money market and 7 business conditions generally.
8 II Similarly, in the later of the two cases, Federal Power Commission v. Hope Natural Gas Co., the
9 Court stated: I I
10 '[R]egulation does not insure that the business shall produce net 11 revenues.' But such considerations aside, the investor interest has a 12 legitimate concern with the financial integrity of the company whose rates 13 are being regulated. From the investor or company point of view it is 14 important that there be enough revenue not only for operating expenses 15 but also for the capital costs of the business. These include service on the 16 debt and dividends on the stock. By that standard the return to the equity 17 owner should be commensurate with returns on investments in other 18 enterprises having corresponding risks. That return, moreover, should be 19 sufficient to assure confidence in the financial integrity of the enterprise, 20 so as to maintain its credit and to attract capital.
21 II From these two decisions, Staff derives and applies the following principles to guide it in
22 II recommending a fair and reasonable ROR:
23
24 25
26
1.
2.
3.
A return consistent with returns of investments of comparable risk;
A return sufficient to assure confidence in the utility's financial integrity; and
A return that allows the utility to attract capital.
27 II Embodied in these three principles is the economic theory of the opportunity cost of investment.
28 II The opportunity cost of investment is the return that investors forego in order to invest in similar
29 II risk investment opportunities that vary depending on market and business conditions.
30 II The methodologies of financial analysis have advanced greatly since the Bluefield and
31 II Hope decisions. I2 Additionally, today's utilities compete for capital in a global market rather
32 II than a local market. Nonetheless, the parameters defined in those cases are readily met using
33 II current methods and theory. The principle of the commensurate return is based on the concept of
11 320 U.S. at 603, 64 S.Ct. at 288, 88 L.Ed. at 345. 12 Neither the Discounted Cash Flow (DCF) nor the Capital Asset Pricing Model {CAPM) methods were in
use when those decisions were issued.
Page 13
1 II risk. Financial theory holds that the return an investor may expect is reflective of the degree of
211 risk inherent in the investment, risk being a measure of the likelihood that an investment will not
3 perform as expected by that investor. Any line of business carries with it its own peculiar risks
4 II and it follows, therefore, that the return Empire's shareholders may expect is equal to that
5 required for comparable-risk utility companies.
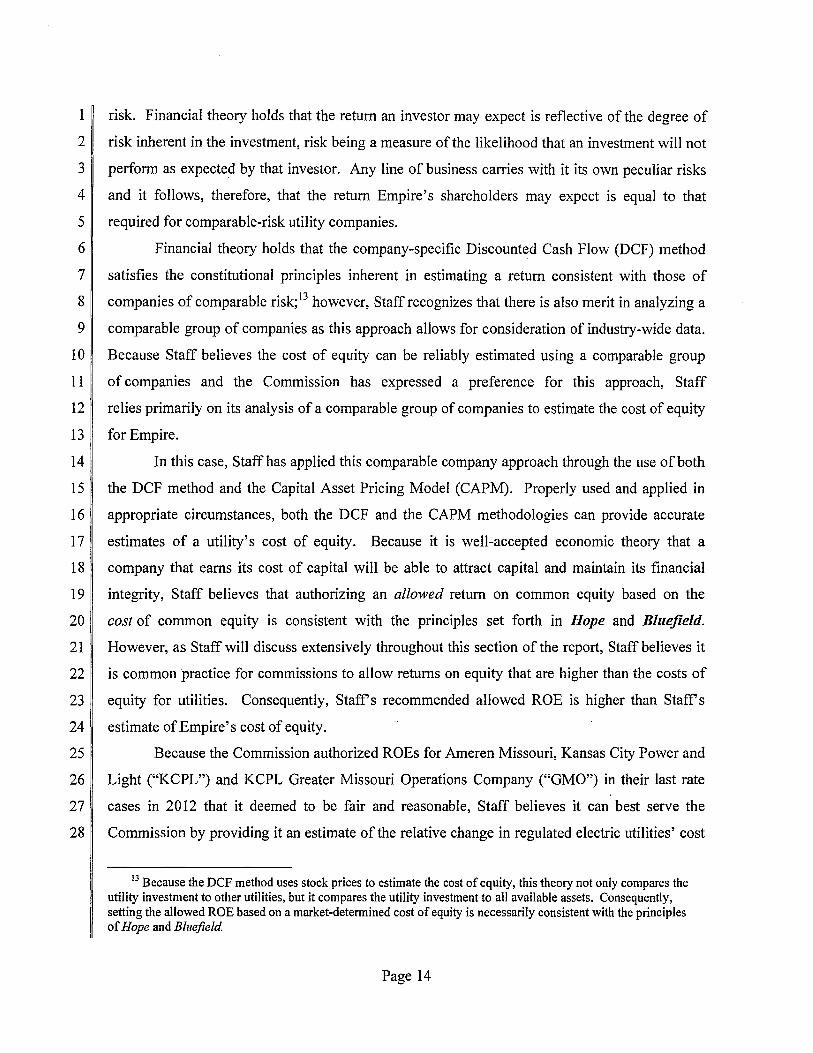
6 Financial theory holds that the company-specific Discounted Cash Flow (DCF) method
7 satisfies the constitutional principles inherent in estimating a return consistent with those of
8 II companies of comparable risk; 13 however, Staff recognizes that there is also merit in analyzing a
911 comparable group of companies as this approach allows for consideration of industry-wide data.
10 Because Staff believes the cost of equity can be reliably estimated using a comparable group
11 II of companies and the Commission has expressed a preference for this approach, Staff
12 II relies primarily on its analysis of a comparable group of companies to estimate the cost of equity
13 II for Empire.
14 II In this case, Staffhas applied this comparable company approach through the use ofboth
15 II the DCF method and the Capital Asset Pricing Model (CAPM). Properly used and applied in
16 II appropriate circumstances, both the DCF and the CAPM methodologies can provide accurate
17 II estimates of a utility's cost of equity. Because it is well-accepted economic theory that a
18 ! company that earns its cost of capital will be able to attract capital and maintain its financial
19 II integrity, Staff believes that authorizing an allowed return on common equity based on the
20 II cost of common equity is consistent with the principles set forth in Hope and Bluefield.
21 I However, as Staff will discuss extensively throughout this section of the report, Staff believes it
22 II is common practice for commissions to allow returns on equity that are higher than the costs of
23 II equity for utilities. Consequently, Staffs recommended allowed ROE is higher than Staffs
24 II estimate of Empire's cost of equity.
25 II Because the Commission authorized ROEs for Ameren Missouri, Kansas City Power and
26 II Light ("KCPL") and KCPL Greater Missouri Operations Company ("GMO") in their last rate
27 ! cases in 2012 that it deemed to be fair and reasonable, Staff believes it can best serve the
2811 Commission by providing it an estimate of the relative change in regulated electric utilities' cost
13 Because the DCF method uses stock prices to estimate the cost of equity, this theory not only compares the utility investment to other utilities, but it compares the utility investment to all available assets. Consequently, setting the allowed ROE based on a market-determined cost of equity is necessarily consistent with the principles of Hope and Bluefield
Page 14

1 II of equity in general, since these last rate cases, Case Nos. ER-2012-0166,
2 II ER-2012-0174 and ER-2012-0175 ("the 2012 rate cases"). Staff believes the cost of equity has
3 II declined since the 2012 rate cases. Consequently, Staff recommends the Commission allow
4 ~ Empire an ROE in a range of 9.25 to 9.75 percent with a point estimate of 9.50 percent. Staffs
511 recommended ROE for Empire is 25 basis points higher than Staffs recent recommendation in
6 the Ameren Missouri rate case because Staff added 25 basis points due to Empire's lower credit
7 II rating, which is based on the business and financial risks ofEmpire's regulated utility operations.
8 II The spread between 'BBB+' and 'BBB' rated utility bonds have averaged approximately
9 II 25 basis points during the period October 2014 through December 2014.14
10 II C. Current Economic and Capital Market Conditions
11 ~ Determining whether a cost of capital estimate is fair and reasonable requires a good
12 II understanding of the current economic and capital market conditions, with the former having a
13 II significant impact on the latter. With this in mind, Staff emphasizes that an estimate of a utility's
14 II cost of equity should pass the "common sense" test when considering the broader current
15 II economic and capital market conditions.
16 1. Economic Conditions
17 II Although the economy contracted in the first quarter of 2014, it has since grown at a
18 II fairly rapid pace in the second and third quarters. Real Gross Domestic Product ("GDP")
19 II contracted by 2.1 percent in the first quarter, increased 4.6 percent in the second quarter, and
20 II increased 5.0 percent in the third quarter. 15 Some economists attributed the contraction in real
21 II GDP in the first quarter to the extremely cold winter. The Commerce Department revised its
22 II third quarter GDP estimate up from an earlier estimate of 3.9 percent. As of December 2014, the
23 II Federal Reserve Board Members and the Federal Reserve Bank Presidents projected real GDP
24 II would grow between 2.6% and 3.0% in 2015, 2.5 to 3.0 percent in 2016 and 2.3 to 2.5 percent in
25 II 2017. The longer run projections for real GDP growth were between 2.0 to 2.3 percent. 16
14 Staff used bond yield data from BondsOnline.com pursuant to a subscription agreement Staff has with BondsOnline.
15 http://www.bea.gov/national/index htm#gdp. "Real" GDP is adjusted to reflect inflation. 16 http://www federalreserve.gov/monetarypolicy/files/fomcprojtabl20 140917 .pdf.
Page 15

1 II Information released from the Federal Open Market Committee (FOMC) meeting held on
2 December 17, 2014, shares the FOMC's intention regarding any future changes in the Federal
3 II Funds Rate. The following excerpt from the FOMC's press release provides direct comments
4 II from the FOMC regarding its views:
5 To support continued progress toward maximum employment and price 6 stability, the Committee today reaffirmed its view that the current 0 to 1/4 7 percent target range for the federal funds rate remains appropriate. In 8 determining how long to maintain this target range, the Committee will 9 assess progress--both realized and expected--toward its objectives of
10 maximum employment and 2 percent inflation. This assessment will take 11 into account a wide range of information, including measures of labor 12 market conditions, indicators of inflation pressures and inflation 13 expectations, and readings on financial developments. Based on its 14 current assessment, the Committee judges that it can be patient in 15 beginning to normalize the stance of monetary policy. The Committee 16 sees this guidance as consistent with its previous statement that it likely 17 will be appropriate to maintain the 0 to Y4 percent target range for the 18 federal funds rate for a considerable time following the end of its asset 19 purchase program in October, especially if projected inflation continues to 20 run below the Committee's 2 percent longer-run goal, and provided that 21 longer-term inflation expectations remain well anchored. However, if 22 incoming information indicates faster progress toward the Committee's 23 employment and inflation objectives than the Committee now expects, 24 then increases in the target range for the federal funds rate are likely to 25 occur sooner than currently anticipated. Conversely, if progress proves 26 slower than expected, then increases in the target range are likely to occur 27 later than currently anticipated.
28 The Committee is maintaining its existing policy of reinvesting principal 29 payments from its holdings of agency debt and agency mortgage-backed 30 securities in agency mortgage-backed securities and of rolling over 31 maturing Treasury securities at auction. This policy, by keeping the 32 Committee's holdings of longer-term securities at sizable levels, should 33 help maintain accommodative financial conditions.
34 When the Committee decides to begin to remove policy accommodation, 35 it will take a balanced approach consistent with its longer-run goals of 36 maximum employment and inflation of 2 percent. The Committee 37 currently anticipates that, even after employment and inflation are near 38 mandate-consistent levels, economic conditions may, for some time, 39 warrant keeping the target federal funds rate below levels the Committee 40 views as normal in the longer run. 17
17 Federal Reserve Press Release December 17,2014.
Page 16

1 2. Capital Market Conditions
2 II a. Utility Debt Markets
3 II Utility debt markets indicate a lower cost-of-capital environment than that which existed
4 II in 2012. If one were to assume that the risk premium 18 required for investing in utility stocks
5 II rather than utility bonds was constant, then the current lower utility debt yields translate into a
6 II lower required return on equity than in 2012.
7 II Although utility bond yields increased during the 2013 calendar year, they have generally
8 II declined through December 31, 2014, and on average are below the yields in 2012. The average
9 II utility bond yield for the first 6 months of 2012 (the general time frame in which capital market
10 II data was analyzed for the electric utility cases in which the Commission last made a
11 II determination on a fair and reasonable allowed ROE) was 4.94%. The average utility bond yield
12 II for the most recent 6 months in 2014 was 4.27%, a decline of 67 basis points. (see Schedules 4-1
13 II and 4-3). For the most recent 6 months through December 2014, the average spread between
14 II 30-year T-bonds (3.12%) and average utility bond yields (4.27%) was 115 basis points. For the
15 II first 6 months in 2012, the average spread between 30-year T-bonds (3.04%) and average utility
16 II bond yields (4.94%)19 was 190 basis points. The decline in the spread is explained mainly by the
17 II decline in utility bond yields because the 30-year T -bond yields have increased slightly since
18 II 2012. (see Schedules 4-3 and 4-4). Consequently, it appears that utility bond yields may have
19 II already factored in an expected increase in yields on treasury bonds at some point in time.
20 II b. Utility Equity Markets
21 II For the twelve months ending December 31, 2014, the total return on the Dow Jones
22 II Industrial Average was 7.52%, the total return on the Standard & Poor's 500 ("S&P 500")
23 II was 14.69%, and the total return on the Edison Electric Institute (EEl) Index of electric utilities
24 II was 31.08%. Typically, over long holding periods, utility indices tend to lag behind broader
25 II market indices that are increasing or decreasing. Regulated utilities are not expected to be as
26 II cyclical as the broader markets because of low demand elasticity; however, utilities with
27 II significant non-regulated operations are likely to be more affected by general economic trends.
18 Risk Premium in this context is the excess required return to invest in a company's equity rather than its debt.
19 For utility bond yields prior to September 2010, Staff used Mergent Bond Record. For utility bond yields subsequent to this period, Staff used data it receives from BondsOnline pursuant to a subscription agreement.
Page 17

1 II The equally weighted returns for the EEl's indices of electric utility companies since 2009 are
2 as follows:
3
4
5
6
7
EEl Broad Index
Regulated
Mostly Regulated
Diversified
2009 2010 2011 2012
14.1% 11.9% 21.4% 4.8%
14.2% 15.8% 22.3% 4.7%
15.6% 8.5% 19.5% 5.8%
8.1% -5.2% 21.4% 0.8%
2013 201420
17.3% 10.2%
17.0% 9.6%
16.0% 13.8%
47.5% -0.9%
8 II Chain linking21 these returns provides the following total return performance for all of the
911 categories provided by EEl: EEl Broad Index: 109.98%; EEl Regulated Index: 117.14%;
10 II EEl Mostly Regulated Index: 109.33%; and EEl Diversified Index: 83.31%.
11 II Although the above returns are equally-weighted returns and the S&P 500 is a
12 II market-weighted return, reviewing the performance of the S&P 500 over the same period is
13 II helpful in evaluating relative performance of utilities as they relate to the broader markets:
14 ~ 2009 2010 2011 2012 2013 2014
15 S&P 500 26.5% 15.1% 2.1% 16.0% 32.4% 8.3%
16 II Chain linking the S&P returns indicates total return performance of 147.27%, which is greater
17 II than the total return performance of all of EEl's indices. Traditionally, over long-term market
18 II periods, total returns on the S&P 500 should outperform regulated utilities by at least 25% to
19 II 30% because betas on regulated utilities typically are around 0.7, implying that utilities will lag
20 II the S&P 500 in gains by about 30%, but also lag the S&P 500 in losses by about 30%. For the
21 II period Staff analyzed above, the EEl regulated utility index lagged the S&P 500 by
22 II approximately 20%. This was slightly higher than the 10% it had lagged the S&P 500 just one
23 II quarter prior. Consequently,. there was some correction to the long-term return spread between
24 II the S&P 500 and the EEl regulated utility index in the third quarter of2014. However, the graph
25 II below depicts the effect of the abnormal circumstance in which the EEl Regulated Utility Index
2° For the first 9 months of2014 because as of January 7, 2015, EEl had not updated the returns through December 31,2014.
21 A process for combining periodic returns to produce an overall time-weighted rate of return. 2009 CF A Program Curriculum, Level ill, Volume 6, p. 120.
Page 18

1 ~ significantly outpaced the S&P 500 returns by a 2-to-1 margin through the end of the 2014
211 calendar year:
3
EEl Regulated Utility Index -11212014- 12/3112014 Total Return Performance 4 0 , .................................................... _____________ r····-····--·-···-·-····----··--·--·-· .. --····;···-······--.. ·-·--···· .. ··········-··················-·····-.,.-.. ·····--···----··--·······-··-·-··---··--,--··-··--·················-····-········-·-·--·-··-..,-
30-l : : .. I
........_
~ 20 E :J (i) a: iti 0 10 f-
0
-10~--------i---------+---------~------~---------l ~ ~~ 'to? OQ- ~ "'~
----EEl Regulated Utility Index (+32.86%) ---- S&P500 (+14.69%)
4
5 II The outperformance of the utility sector above can be largely explained by the unexpected drop
6 II in long-term interest rates during the fourth quarter. The decline in long-term interest rates was
7 II perplexing to most because the Fed discontinued the bond buying program, which had the
8 II intended effect of reducing long-term interest rates. Because the decline in long-term interest
9 II rates occurred at the same time as a drop in oil prices, it appears there may be concern about low
10 II growth and low interest rates globally. Quite simply, the lower interest rate environment has
11 II continued to support a low cost of capital environment for utilities for both their equity capital
12 II and their debt capital.
13 II In fact, many utility equity analysts during the past few years have consistently discussed
14 II the premium at which regulated utility stocks have traded as compared to the S&P 500, which is
Page 19

1 II not typical over the long-term in capital markets. Typically, due to the low-growth and
2 II high-dividend yield characteristics of utility stocks, the price-to-earnings ratios are lower for
3 II utility stocks as compared to the higher-growth, lower-yield profile of the S&P 500. Equity
4 II analysts consistently explain that the higher multiples are driven by the low interest rate
5 II environment, not higher growth expectations for the regulated utility industry as compared to the
6 II broader markets.
7 II Goldman Sachs' analysis consistently shows that utilities typically trade at a premium
8 II to the market when U.S. 10-year treasury yields trade below the 3% level and trade at a discount
911 to the market when U.S. 1 0-year treasury yields trade above 3%. The average yield on the
10 U.S. 10-year treasury was 2.21% for the month of December 2014. As of January 16, 2015, the
11 II U.S. 10-year treasury yield reached a low of 1.70%. Goldman Sachs also points out that the
12 projected compound annual growth rate (CAGR) in Earnings Per Share (EPS) for utilities for the
13 II 2013 through 2016 averages approximately 5%, which is below most all other sectors in the
14 II S&P 500. Coupling the fact that utilities are trading at a premium to the S&P 500 even though
15 II utilities have lower growth expectations than the S&P 500, clearly indicates that utilities' cost of
16 II equity is quite low in the current economic and capital market environment. Assuming the
17 II Commission accepts these capital market experts' views on the reason for the current higher
18 II valuation levels of utilities, then the key question the Commission needs to answer in
19 II determining a fair allowed return on equity in this case is whether changes since the Commission
20 II heard evidence in the 2012 rate cases when it authorized an ROE of 9.8% for Ameren Missouri
21 and 9.7% for KCPL and GMO justify a decrease, increase or no change to allowed ROEs now.
22 ~ Although Staff will provide more specific information about its specific cost of equity
23 II analysis of its proxy groups later in its testimony, Staff will provide a brief overview of the
24 II changes in the capital markets since the Commission authorized ROEs in the 2012 rate cases
25 II based on capital market evidence through approximately mid-2012.
26 II At the time Staff filed its direct testimony in the 2012 rate cases, the 6-month average
27 II utility bond yield through June 2012 was 4.94%. At the time Staff was preparing its testimony
28 II for this case, the 6-month average utility bond yield through December 2014 was 4.27%, a
29 II decline of 67 basis points. Although not as indicative of utility capital costs, the 6-month
30 II average U.S. 30-year Treasury,yield was 3.04% for the first 6-months of2012. At the time Staff
Page 20

1 II was preparing its testimony for this case, the 6-month average U.S. 30-year U.S. Treasury yield
2 II was 3.12%, an increase of 8 basis points.
3 II Although Staff believes the decline in utility bond yields provides the most tangible
4 II support for lowering the allowed ROE from the Commission's previous authorizations, it is
5 II important to evaluate the impact the lower bond yields have had on both the absolute and relative
6 II performance of electric utility indices and broader market indices over the period since the
7 II Commission last authorized ROEs for electric utilities in Missouri. As provided in the table
811 above (but partially reproduced below for convenience), the total returns for each of the indices
9
10
11
12
13
14
15
were as follows since January 1, 2012:
EEl Broad Index
Regulated
Mostly Regulated
Diversified
S&P 500
2012
4.8%
4.7%
5.8%
0.8%
16.0%
2013 2014
17.3% 10.2%
17.0% 9.6%
16.0% 13.8%
47.5% -0.9%
32.4% 8.3%
16 II Chain linking these returns provides the following total return performance for all of the indices:
17 ~ EEl Broad Index: 35.47%; EEl Regulated Index: 34.26%; EEl Mostly Regulated Index:
18 II 39.66%; EEl Diversified Index: 47.34%; S&P 500: 66.33%. This information clearly shows
19 ~ that the regulated utilities' total returns as compared to the S&P 500 were consistent with a
20 II typical capital market situation in which utilities' returns lag that of the broader markets by
21 II approximately 30%. Although this information provides insight on the performance of the
22 II market, without analyzing the reasons for the performance differences, it will not provide much
23 II insight on any potential changes in the cost of equity since 2012.
24 II Below is a graph of the change in the price-to-last-twelve-months'-earnings ratios
25 II ("p/e ratios") for EEl's current regulated utility index from the beginning of January 1, 2012,
26 II through December 31, 2014. As can be seen, the p/e ratios have increased since the Commission
27 I determined that an allowed ROE in the 2012 rate cases should be in the range of 9.70% to
28 II 9.80%. The increase in the p/e ratios for the electric utility industry indicates that the cost of
29 I equity has declined further since the Commission last decided an allowed ROE of 9.70% to
30 II 9.80% was fair and reasonable.
Page 21

1
2
EEl Regulated Utility lndex-113/2012-12/3112014 Price/ LTM EPS Performance
:8: (/') 0... LU
2 ~ .._ Q) u ·c 0...
2 2 ~···-···-·······-·-·····-········-·-······-····-·-··---····-···-·-·-·····-······-·- ··············-·-·---·········--··-·--·-···- ···················-···········-········· ················-·····-················-·····-··-- -···-·-··--···-·········-·····-···········--···········-···········
18
16
14 I
'% ..:'o'"
'.,:>
OQ>
..:'ol' '.,:>
'l'c-., .,:><?a
-+-EEl Regulated Utility lndeH (+27.85%)
~ ~..:'o
;;..
3 II As explained by EEl itself, the continued increase in electric utility stock prices is not explained
4 II by the fundamentals of the industry, but by the macroeconomic environment, which has
5 II caused investors to continue to lower their required ROE's, i.e. the cost of common equity.
6 II EEl specifically stated the following in its report on electric utility stocks through the second
7 II quarter of2014:
8 The EEl Index surged 18.0% in the first half of 2014, outperforming the 9 major averages after markedly trailing in 2012 and 2013. As has typically
10 been the case in recent years~ performance was influenced more by 11 macroeconomic trends (declining interest rates and firming natural gas 12 spot prices in early 2014) than any significant change in industry 13 fundamentals.22
14 II Although this commentary does not estimate how much the cost of equity has declined, it
15 II definitely provides evidence that it has declined since 2012.
22 Edison Electric Institute Second Quarter 2014 Financial Update.
Page 22
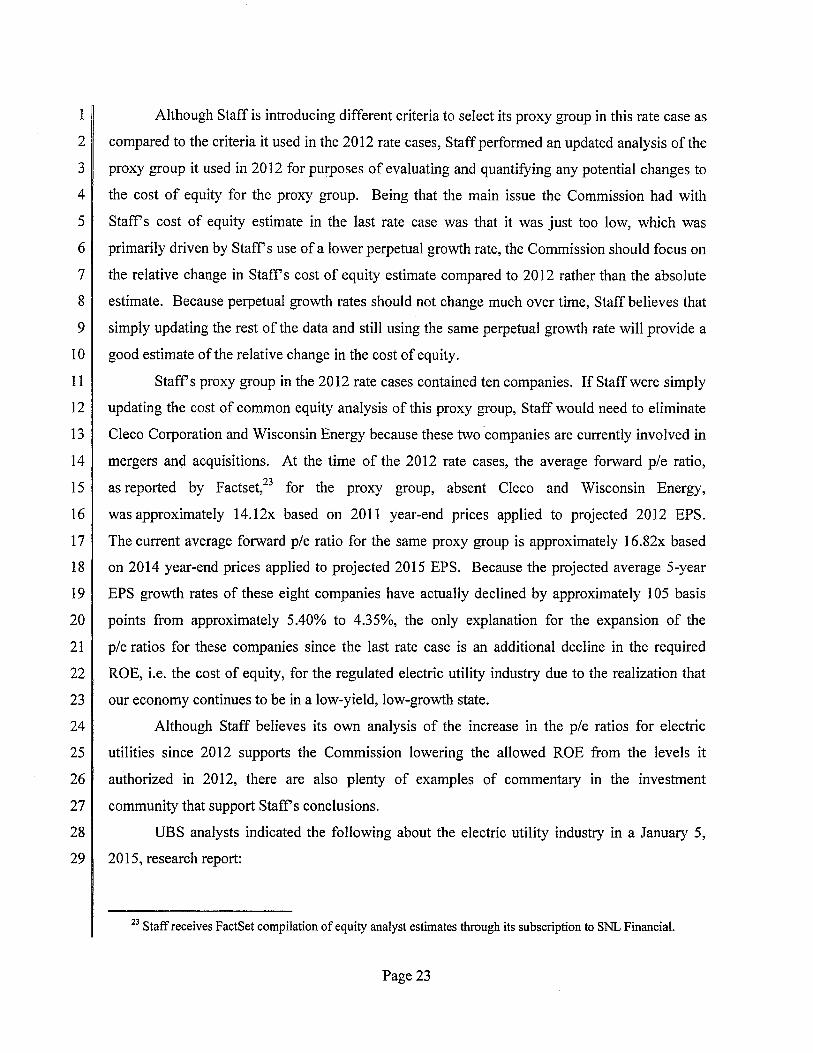
1 II Although Staff is introducing different criteria to select its proxy group in this rate case as
2 II compared to the criteria it used in the 2012 rate cases, Staff performed an updated analysis of the
3 II proxy group it used in 2012 for purposes of evaluating and quantifying any potential changes to
4 II the cost of equity for the proxy group. Being that the main issue the Commission had with
5 II Staffs cost of equity estimate in the last rate case was that it was just too low, which was
6 II primarily driven by Staffs use of a lower perpetual growth rate, the Commission should focus on
711 the relative change in Staffs cost of equity estimate compared to 2012 rather than the absolute
8 estimate. Because perpetual growth rates should not change much over time, Staff believes that
9 II simply updating the rest of the data and still using the same perpetual growth rate will provide a
I 0 II good estimate of the relative change in the cost of equity.
11 II Staffs proxy group in the 2012 rate cases contained ten companies. If Staff were simply
12 II updating the cost of common equity analysis of this proxy group, Staff would need to eliminate
13 II Cleco Corporation and Wisconsin Energy because these two companies are currently involved in
14 II mergers and acquisitions. At the time of the 2012 rate cases, the average forward pie ratio,
15 II as reported by Factset,23 for the proxy group, absent Cleco and Wisconsin Energy,
16 II was approximately 14.12x based on 2011 year-end prices applied to projected 2012 EPS.
17 II The current average forward pie ratio for the same proxy group is approximately 16.82x based
18 II on 2014 year-end prices applied to projected 2015 EPS. Because the projected average 5-year
19 II EPS growth rates of these eight companies have actually declined by approximately 1 05 basis
20 II points from approximately 5.40% to 4.35%, the only explanation for the expansion of the
21 II pie ratios for these companies since the last rate case is an additional decline in the required
22 II ROE, i.e. the cost of equity, for the regulated electric utility industry due to the realization that
23 II our economy continues to be in a low-yield, low-growth state.
24 II Although Staff believes its own analysis of the increase in the pie ratios for electric
25 II utilities since 2012 supports the Commission lowering the allowed ROE from the levels it
26 II authorized in 2012, there are also plenty of examples of commentary in the investment
27 II community that support Staffs conclusions.
28 II UBS analysts indicated the following about the electric utility industry in a January 5,
29 II 2015, research report:
23 Staff receives FactSet compilation of equity analyst estimates through its subscription to SNL Financial.
Page 23

1 With the group [utilities] now exceeding PIE valuations last seen in 2 2006, we're skittish Following the rally in utilities during its seasonally 3 strong year-end, we see an argument for an end to at least utility 4 outperformance. Following the December rally in the utilities we 5 calculate the sector is trading at a forward rolling PIE of 18.5x, 6 meaningfully ahead of the December 2006 peak of 18.2x. Meanwhile, the 7 sector has reclaimed its 13% premium to the wider S&P. Amidst these 8 record high valuations, we see a more challenging outlook for commodity 9 exposed names, as well as limited Yo Y growth for the wider sector in
10 2015 coming off tough Yo Y camps without the effect of the polar vortex 11 (leading to limited EPS growth). Moreover, we suspect this challenge 12 could yet be compounded as 1 Q results in May could look especially weak 13 as comps will show a clear negative trend.
14 II Retracing utilities vs. bond yields: it's still historically cheap though
15 While equities -and utilities -appear pricey, the search for yield would 16 still suggest higher income equities are trading at a discount to their 17 historic trends vs. not just the ten-year treasury but broader utility bond 18 indices. We estimate a return to normal relationship would support 26% 19 upside to utilities; the question remains to what extent investors are 20 willing to fully price in this historic yield relationship in equity markets, 21 despite the seemingly transient nature of interest rates (although 22 presumably longer rates stay at current levels, the more acceptable the old 23 utility-bond relationship appears to hold)?4
24 II Wells Fargo analysts indicated the following about the electric utility industry in a January 2,
25 II 2015, research report:
26 Summary. The S&P Utilities closed out a strong year on a high note in 27 December. For the year, the S&P Utilities strongly outpaced the broader 28 market providing a total return of 29% vs. the S&P 500 up 14% - for 29 December, the S&P Utilities index was up 3.3% on a total return basis vs. 30 the S&P 500 up 0.4%. We attribute the strong relative performance to the 31 following factor- in order of deemed importance- (1) a material decline 32 in long-term interest rates (the yield on the 10-Year Treasury declined 33 28% to 2.17% from 3.0% at the beginning of the year), (2) continued 34 strong fundamentals for the regulated utilities ... 25
24 Julien Dumoulin-Smith, Michael Weinstein, and Paul Zimbardo, "US IPP Weekly Power Points, Reaching a New High: Time for a Note of Caution," January 5, 2015, UBS Securities, LLC.
25 Neil Kalton, Sarah Akers, Jonathan Reeder, Glen F. Pruitt and Peter Flynn, "Between The Lines: Wells Fargo Utility Monthly," January 2, 2015, Wells Fargo Securities.
Page 24

1 II D. Empire's Operations
2 II The following excerpt from Empire's Form 10-K filing with the United States Securities
3 II and Exchange Commission ("SEC") for the 2013 calendar year, provides a good description of
4 II Empire's current business operations:
5 We operate our businesses as three segments: electric, gas and other. The 6 Empire District Electric Company (EDE), a Kansas corporation organized 7 in 1909, is an operating public utility engaged in the generation, purchase, 8 transmission, distribution and sale of electricity in parts of Missouri, 9 Kansas, Oklahoma and Arkansas. As part of our electric segment, we also
10 provide water service to three towns in Missouri. The Empire District Gas 11 Company (EDG) is our wholly owned subsidiary engaged in the 12 distribution of natural gas in Missouri. Our other segment consists of our 13 fiber optics business.
14 II Our gross operating revenues in 2013 were derived as follows:
15
16
17
18
19 20 21 22 23 24
25 26
27
28
29
30
31 32 33 34
Electric segment sales*
Gas segment sales
Other segment sales
90.3%
8.4
1.3
*Sales from our electric segment include 0.4% from the sale of water.
The territory served by our electric operations embraces an area of about 10,000 square miles, located principally in southwestern Missouri, and also includes smaller areas in southeastern Kansas, northeastern Oklahoma and northwestern Arkansas. The principal economic activities of these areas include light industry, agriculture and tourism. As of December 31, 2013, our electric operations served approximately 1698,800 customers.
Our retail electric revenues for 2013 by jurisdiction were derived as follows:
Missouri 89.8%
Kansas 4.8
Arkansas 2.5
Oklahoma 2.9
We supply electric service at retail to 119 incorporated communities as of December 31, 2013, and to various unincorporated areas and at wholesale to four municipally owned distribution systems. The largest urban area we serve is the city of Joplin Missouri, and its immediate vicinity, with a
Page 25

1 population of approximately 160,000. We operate under franchises 2 having original terms of twenty years or longer in virtually all of the 3 incorporated communities. Approximately 49% of our electric operating 4 revenues in 2013 were derived from incorporated communities with 5 franchises having at least ten years remaining and approximately 21% 6 were derived from incorporated communities in which our franchises have 7 remaining terms of ten years or less. Although our franchises contain no 8 renewal provisions, in recent years we have obtained renewals of all of our 9 expiring electric franchises prior to the expiration dates.
10 Our three largest classes of on-system customers are residential, II commercial and industrial, which provided 42.6%, 30.4%, and 15.1 %,
, 12 respectively, of our electric operating revenues in 2013.
13 II E. Empire's Credit Ratings
14 II Empire is currently rated by Moody's and Standard & Poor's ("S&P"). It is important to
15 II understand the current credit standing of Empire, as these ratings influence investors' views of
16 II the risk associated with investing in Empire.
17 II Empire's Moody's corporate credit rating is 'Baal' and its S&P corporate credit rating
18 II is 'BBB.'26 S&P's and Moody's ratings of Empire are both one notch higher than they were
1911 in 2012.
20 The following is an excerpt from S&P's September 8, 2014, credit-rating report on
21 II Empire, discussing Empire's business risk:
22 We view Empire's business risk profile as "strong," reflecting our 23 assessment of the regulated utility industry risk as "very low" and a "very 24 low" country risk because the company's operations are based in the U.S. 25 The business risk profile is also characterized by a predominantly 26 residential and commercial customer base, which limits susceptibility to 27 economic cyclicality and provides for generally stable cash flow 28 generation; regulation by state commissions that we view as 29 "strong/adequate"; satisfactory profitability, and limited competition for 30 essential electricity and natural gas distribution services. Although Empire 31 operates in four states, the bulk of its operations are carried out in 32 Missouri (about 90% of revenues), in an area that is prone to severe 33 weather. Empire has restored service as quickly as possible to all that 34 could receive power after the May 2011 tornado in Joplin, and the 35 company's systemwide customer count is now 400 greater than[sic] 36 the pre-tornado level. While we expect modest customer growth to 37 continue, usage is likely to decline due to energy efficiency and
26 Empire's SEC Form 10-Q filing for the third quarter ended September 30, 2014, p .45.
Page 26
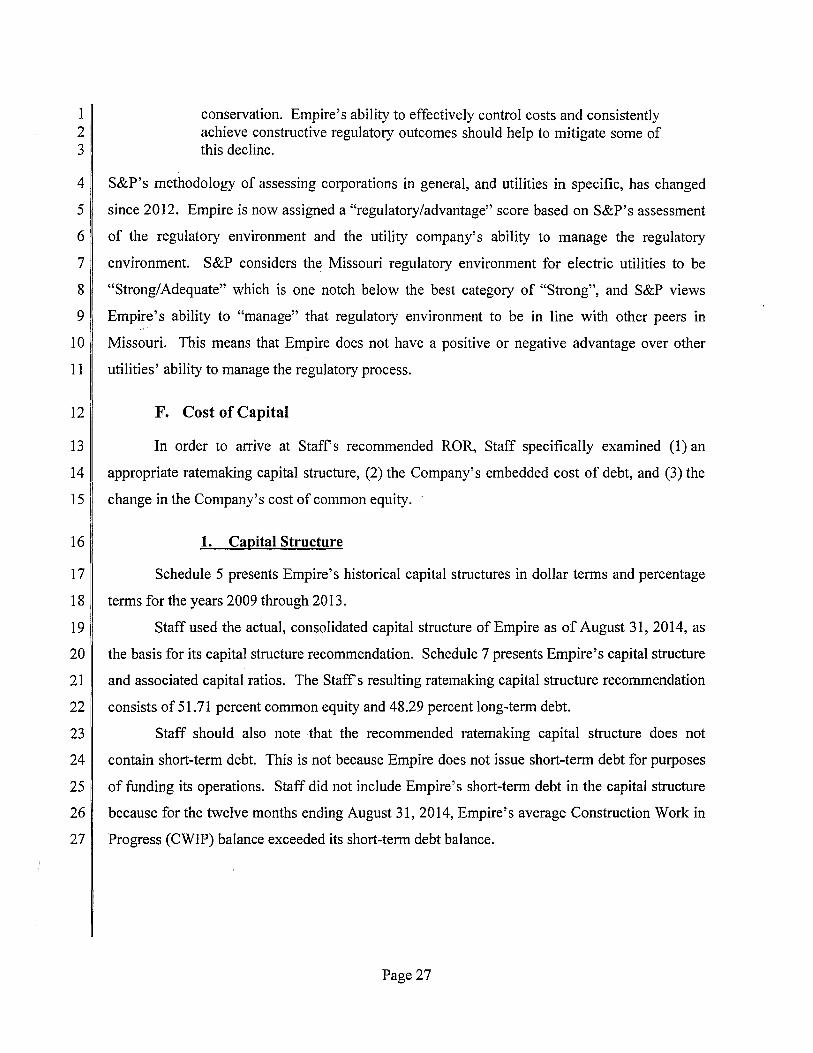
1 conservation. Empire's ability to effectively control costs and consistently 2 achieve constructive regulatory outcomes should help to mitigate some of 3 this decline.
4 II S&P's methodology of assessing corporations in general, and utilities in specific, has changed
5 II since 2012. Empire is now assigned a "regulatory/advantage" score based on S&P's assessment
6 II of the regulatory environment and the utility company's ability to manage the regulatory
7 II environment. S&P considers the Missouri regulatory environment for electric utilities to be
8 II "Strong/Adequate" which is one notch below the best category of "Strong", and S&P views
9 II Empire's ability to "manage" that regulatory environment to be in line with other peers in
10 II Missouri. This means that Empire does not have a positive or negative advantage over other
11 II utilities' ability to manage the regulatory process.
12 II F. Cost of Capital
13 II In order to arrive at Staffs recommended ROR, Staff specifically examined (1) an
14 II appropriate ratemaking capital structure, (2) the Company's embedded cost of debt, and (3) the
15 II change in the Company's cost of common equity.
16 1. Capital Structure
17 II Schedule 5 presents Empire's historical capital structures in dollar terms and percentage
18 II terms for the years 2009 through 2013.
19 II Staff used the actual, consolidated capital structure of Empire as of August 31, 2014, as
20 II the basis for its capital structure recommendation. Schedule 7 presents Empire's capital structure
21 II and associated capital ratios. The Staffs resulting ratemaking capital structure recommendation
22 II consists of 51.71 percent common equity and 48.29 percent long-term debt.
23 II Staff should also note that the recommended ratemaking capital structure does not
24 II contain short-term debt. This is not because Empire does not issue short-term debt for purposes
25 II of funding its operations. Staff did not include Empire's short-term debt in the capital structure
26 ~ because for the twelve months ending August 31, 2014, Empire's average Construction Work in
27 II Progress (CWIP) balance exceeded its short-term debt balance.
Page 27

1 II 2. Embedded Cost of Debt
2 II Staff's embedded cost of long-term debt of 5.56 percent is based on information provided
3 II by Empire in response to Staff Data Request No. 0079. Staff's embedded cost of long-term debt
4 II is slightly lower than that provided by Empire because Staff proposes to disallow the remaining
5 II unamortized expense balance of approximately $1,525,469 associated with Empire's
6 II $2.5 million of debt expenses incurred to amend its mortgage bond indenture in order to provide
7 II additional flexibility to pay its dividend. Staff subtracted this amount from Empire's cost of debt
8 II calculation for the period ending August 31, 2014. Staff has consistently proposed this
9 II disallowance in Empire's past rate cases as well. Staff provides the underlying details of its
10 II embedded cost of debt estimate in Schedule 6.
11 3. Cost of Common Equity
12 II Staff estimated Empire's cost of common equity through a comparable company
13 II cost-of-equity analysis of a broader proxy group and a more refined proxy group using the DCF
14 II method. Staff also compared the new proxy groups and the proxy group in Empire's last rate
15 II case to estimate the relative change in the cost of equity since 2012. Additionally, Staff used
16 II a CAPM analysis and a survey of other indicators as a check of the reasonableness of
17 II its recommendations.
18 II a. The Proxy Groups
19 II Staff decided to perform a cost of common equity analysis on two sets of proxy groups in
20 II this case. Although Staff has revised its selection criteria to select a current proxy group,
21 II considering the insight that can be gained about the relative change in the cost of common equity
22 II by evaluating the proxy group Staff used in the rate cases in 2012, Staff decided to update the
23 II cost of common equity analysis on this proxy group as well. Staff limited its DCF analysis of
24 II the old proxy group to the multi-stage DCF since Staff gave this the most weight in the last case
25 II and because it is dynamic enough to consider near-term growth rate impacts. The only changes
26 II Staff made to the proxy group from 2012 was to eliminate Cleco Corporation and Wisconsin
27 ·II Energy Resources because their stock prices are currently influenced by announced mergers and
28 II acquisitions. Staff will first explain how it selected the new proxy group and provide cost of
29 II common equity indications from this proxy group. Staff will then update the cost of common
Page 28
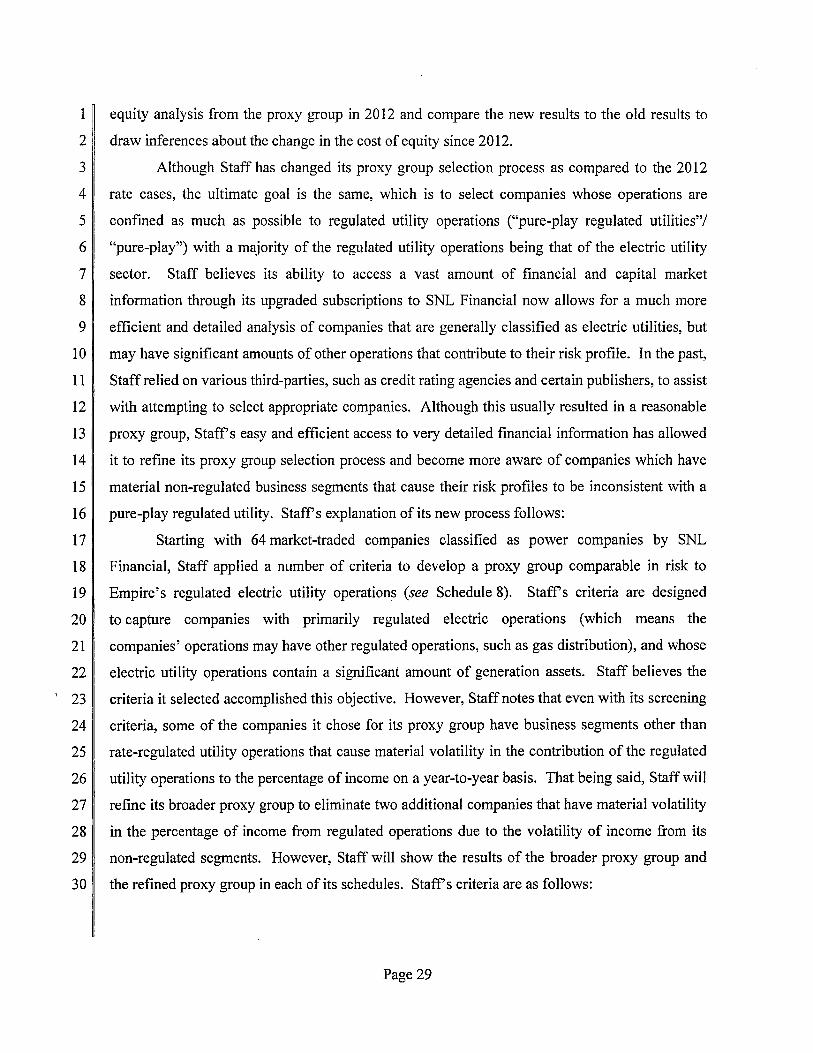
1 II equity analysis from the proxy group in 2012 and compare the new results to the old results to
2 II draw inferences about the change in the cost of equity since 2012.
3 II Although Staff has changed its proxy group selection process as compared to the 2012
4 II rate cases, the ultimate goal is the same, which is to select companies whose operations are
5 II confined as much as possible to regulated utility operations ("pure-play regulated utilities"/
6 II "pure-play") with a majority of the regulated utility operations being that of the electric utility
7 II sector. Staff believes its ability to access a vast amount of financial and capital market
8 II information through its upgraded subscriptions to SNL Financial now allows for a much more
9 II efficient and detailed analysis of companies that are generally classified as electric utilities, but
10 II may have significant amounts of other operations that contribute to their risk profile. In the past,
11 II Staff relied on various third-parties, such as credit rating agencies and certain publishers, to assist
12 II with attempting to select appropriate companies. Although this usually resulted in a reasonable
13 II proxy group, Staffs easy and efficient access to very detailed financial information has allowed
14 II it to refine its proxy group selection process and become more aware of companies which have
15 II material non-regulated business segments that cause their risk profiles to be inconsistent with a
16 II pure-play regulated utility. Staffs explanation of its new process follows:
17 II Starting with 64 market-traded companies classified as power companies by SNL
18 II Financial, Staff applied a number of criteria to develop a proxy group comparable in risk to
19 II Empire's regulated electric utility operations (see Schedule 8). Staffs criteria are designed
20 II to capture companies with primarily regulated electric operations (which means the
21 II companies' operations may have other regulated operations, such as gas distribution), and whose
22 II electric utility operations contain a significant amount of generation assets. Staff believes the
' 23 II criteria it selected accomplished this objective. However, Staff notes that even with its screening
24 II criteria, some of the companies it chose for its proxy group have business segments other than
25 II rate-regulated utility operations that cause material volatility in the contribution of the regulated
26 II utility operations to the percentage of income on a year-to-year basis. That being said, Staff will
27 II refine its broader proxy group to eliminate two additional companies that have material volatility
28 II in the percentage of income from regulated operations due to the volatility of income from its
29 II non-regulated segments. However, Staff will show the results of the broader proxy group and
30 II the refined proxy group in each of its schedules. Staffs criteria are as follows:
Page 29

1 II 1. Classified as a power company by SNL (64 companies);
2 II 2. Publicly-traded stock (one company eliminated, 63 remaining);
311 3. Followed by EEl and classified by EEl as a regulated utility 4 (29 companies eliminated, 34 remaining);
511 4. At least 50% of plant from electric utility operations ( 4 companies 6 eliminated, 30 remaining);
711 5. At least 25% of electric plant from generation (8 companies 8 eliminated, 22 remaining);
911 6. At least 80% of income from regulated utility operations 10 (2 companies eliminated, 20 remaining);
11 jj 7. No reduced dividend since 2011 (0 companies eliminated, 12 20 remaining);
1311 8. At least investment grade credit rating (0 companies eliminated, 14 20 remaining);
1511 9. At least 2 equity analysts providing long-term growth projections 16 in the last 90 days (6 companies eliminated, 14 remaining);
1711 10. No significant merger or acquisition announced recently 18 (0 companies eliminated, 14 remaining).
19 II The resulting final group of 14 publicly-traded electric utility companies ("the comparables")
20 II was used as the broader proxy group to estimate a cost of common equity for the electric utility
21 II industry. These companies are shown on Schedule 8.
22 II The final criterion used to eliminate any remaining companies that may have segments
23 II that have risks inconsistent with a regulated utility is criterion No. 6. In order to select
24 II companies that consistently received at least 80% of their income from rate-regulated utility
25 II operations, one has to review past performance (Staff chose the last 3 years). However, limiting
26 II the selection criteria to just looking at the average amount of income from regulated utility
27 II operations can cause the selection of companies that have material volatility in the percentage of
28 II income contributed by the regulated utility operations simply because a non-regulated segment
29 II may contribute 25% to margin in one year and then reduce margin by 10% in the following year.
30 II In the latter situation, one would erroneously conclude that the risk profile of the company is
31 II consistent with a regulated utility since the regulated income was over 100% of the company's
Page 30

1 II income. If one were to take a simple average of these two years, then the company would be
2 selected as a comparable company based simply on the fact that 92.5% of the average income
3 II came from regulated utility operations. Being that the non-regulated operations significantly
4 II increased the variability of income, it is important to add an additional criterion to eliminate
511 companies that have such volatile segments.
6 Consequently, Staff decided to further refine its broader proxy group to eliminate
7 II companies in which the contributions of income from rate-regulated utility operations had a
8 II standard deviation of greater than 10% for the most recent three years. If the contribution from
911 regulated utility operations is varying significantly from year to year, then this will make the cost
10 of capital inconsistent with the risks of the regulated utility operations. Staff used standard
11 II deviation because it measures the degree of dispersion from the mean. Staff chose 10% because
12 II this is the threshold for determining if a segment is material and must be reported according to
13 II Generally Accepted Accounting Principles (GAAP) that govern the requirements
14 II regarding segment reporting. Segment reporting requirements had been governed by
15 II Statement of Financial Accounting Standard 131, which has now been reclassified as Accounting
16 II Standard Codification No. 280. Materiality of a business segment, as defined by GAAP, is
17 defined as follows:
18 a. Its [operating segment] reported revenue, including both sales to external 19 customers and intersegment sales or transfers, is 10 percent or more of the 20 combined revenue, internal and external, of all operating segments.
21 II b. The absolute amount of its reported profit or loss is 10 percent or more of the 22 greater, in absolute amount, of either:
2311 1. The combined reported profit of all operating segments that did not 24 report a loss.
25 2. The combined reported loss of all operating segments that did report a 26 loss.
27 c. Its assets are 10 percent or more of the combined assets of all operating 28 segments.
29 II For purposes of evaluating whether a company's non-regulated segments were causing a material
30 II variability in income as to make its business risk inconsistent with the regulated business risk
31 II profile of a regulated electric utility, Staff decided to use the 10% threshold to define material
32 II volatility. Consequently, keeping with GAAP's definition of material being at least 10% of
33 II profit or loss, Staff excluded companies whose regulated utilities contribution to income had a
Page 31

1 standard deviation greater than 10%. However, if a company had swings in its regulated income
2 contribution of 10% or more, but it has since divested the segment that caused these swings, such
3 as Ameren, then Staff included these companies. The two companies that had a greater than
411 10% standard deviation in the percentage of income from regulated utility operations were
5 OGE Energy and TECO Energy. Staff will provide cost of common equity information for the
6 broader proxy group and for the refined group, which excludes OGE and TECO.
7 b. The Constant-growth DCF
811 Next, Staff estimated Empire's cost of common equity applying values derived from the
9 proxy group to the constant-growth DCF model. The constant-growth DCF model is widely
10 II used by investors to evaluate stable-growth investment opportunities, such as regulated utility
11 companies. The constant-growth version of the model is usually considered appropriate for
12 II mature industries such as the regulated utility industry.27 It may be expressed algebraically
13 II as follows:
14 II k = D 1/P o + g
15 Where: k is the cost of equity;
16 DI is the expected next 12 months dividend;
17 Po is the current price of the stock; and
18 g is the dividend growth rate.
19 II The term D1/PO, the expected next 12-months' dividend divided by current share price, is the
20 II dividend yield. Staff calculated the dividend yield for each of the comparable companies by
21 II dividing the 2015 fiscal year FactSet projected dividends per share (see Schedule 12) by the
22 II monthly high/low average stock price for the three months ending December 31, 2014
23 II (see Schedule 11 )?8 Staff used the above-described stock price because it reflects current market
24 II expectations. The projected average dividend yield for the broader proxy group of fourteen
27 Aswath Damodaran, Investment Valuation: Tools and techniques for determining the value of any asset, University Edition, John Wiley & Sons, Inc., 1996, p. 195-196; John D. Stowe, Thomas R. Robinson, Jerald E. Pinto and Dennis W. McLeavey, Analysis of Equity Investments: Valuation, Association for Investment Management and Research, 2002, p. 64.
28 The monthly high/low averaging technique minimizes the effects of short-term stock market volatility on the calculation of dividend yield. PO is calculated by averaging the highest and the lowest price for each month during the selected period.
Page 32

1 II comparable companies is approximately 3.70%, unadjusted for quarterly compounding. The
2 II projected average dividend yield for the refined proxy group of twelve comparable companies is
311 also approximately 3. 70%, unadjusted for quarterly compounding.
4 i. The Inputs
511 In the DCF method, the cost of equity is the sum of the dividend yield and a
6 growth rate ("g") that represents the projected capital appreciation of the stock. In estimating
7 II a growth rate, Staff considered the actual dividends per share (DPS), EPS and book value per
8 II share (BVPS) for each of the comparable companies and also the projected DPS, EPS and
9 II BVPS. In reviewing actual growth rates, Staff found the historical growth rates to be quite
10 II volatile, at least for a few of the companies in the proxy group.29 Staff ~lso reviewed equity
11 analysts' consensus estimates for long-term compound annual growth rates as reported by
12 II FactSet and provided by SNL Financial. The average consensus long-term growth rates for the
13 II broader proxy group is currently 5.63% as compared to 5.52% for the refined proxy group.
14 II (see Schedule 1 0-6).
15 II Based on the shorter-term projected EPS growth rate data, one may argue that electric
16 II utilities can grow at a rate of 5.5 to 5.65 percent, but it would be unreasonable to conclude that
17 II this growth rate is sustainable in perpetuity because it does not give consideration to empirical
18 II and logical information that suggests that utility companies should grow at a rate less than that of
19 II the overall economy due to the mere fact that investors invest in utility companies for yield and
20 II not growth. In fact, considering that companies in the S&P 500 (a proxy for the U.S. capital
21 II markets) in recent years have retained approximately 65% to 70% of their earnings for
22 II reinvestment,30 while electric utilities' retention ratio has been less than half that of the
23 II S&P 500,31 it makes logical sense that utilities will grow at a rate less than that of nominal GDP
24 II growth. Consequently, a projected long-term, steady-state nominal GDP growth rate32 should be
25 II considered as an upper constraint when testing the reasonableness of growth rates used to
26 II estimate the cost of equity for a regulated electric utility. Staff will provide more detail on
29 Schedule 10-1 depicts the annual compound growth rates for DPS, EPS and BVPS for each comparable company for the past ten years. Schedule 10-2lists the annual compound growth rates for DPS, EPS and BVPS for each of the comparable companies for the past five years.
30 Table B-95 and B-96 attached to the 2013 Economic Report of the President. 31 http://www .wvattresearch.com/article/ dividend-payout -ratio. 32 The nominal GDP growth rate, contrasted to the real GDP growth rate introduced earlier, is not adjusted for
inflation.
Page 33

1 economic growth projections when discussing the multi-stage DCF, but a high-end estimate for
2 nominal GDP is not much higher than 4.5%, causing an estimated constant growth rate over this
3 rate to be highly suspect.
4 II Because Staff is not relying on the constant-growth DCF to quantify the change in the
5 II cost of equity since the 2012 rate cases, Staff's growth rate estimate for the constant growth DCF
6 ~ is based on some common sense restraints on sustainable growth rates and the actual growth
7 II experience of the electric utility companies that have experienced more stable growth patterns.
8 II Several companies in Staff's proxy group have projected 5-year CAGR in EPS that simply are
9 II not sustainable in the long-term. Simply removing growth rates that exceed 6% reduces the
10 II projected 5-year CAGR in EPS to 4.86%. Considering that actual long-term growth experience
11 II in the electric utility industry barely supports a constant growth rate much more than 3%, Staff
12 II will use 3.5% as the low end and 4.5% for the high end investors' expectations of a constant
13 II growth rate. Consequently, for purposes of Staff's constant growth DCF for both the broader
14 II and more refined proxy group, Staff uses a growth rate range of3.5 to 4.5%.
15 II Using the growth rate range Staff established for the constant-growth DCF results in a
1611 cost of equity estimate of7.2% to 8.2%. However, Staffwill again rely on its multi-stage DCF
17 II analysis to provide what it believes to be a more reliable cost of common equity due to the
18 II non-sustainable growth rates of a few companies in its proxy group.
19 II c. The Multi-stage DCF
20 II i. Overview
21 The constant-growth DCF model may not yield reliable results if industry and/or
22 II economic circumstances cause expected near-term growth rates to be inconsistent with
23 II sustainable perpetual growth rates.33 Consequently, as in the last rate case, Staff again performed
24 ~ a multi-stage DCF analysis in this case and is relying primarily on this analysis to draw
25 II conclusions on the change in the cost of common equity since the last rate case because the
26 II multi-stage DCF is dynamic enough to consider changes in near-term growth rates, but still
27 ~ maintain a consistent perpetual growth rate as this rate should not change much, if any, because
28 II there have been no structural changes in the economy or industry to support it.
33 Dr. Aswath Damodaran, Professor of Finance of the New York University Stern School of Business, advocates using a multi-stage methodology if the constant-growth rate is expected to be 1-2% different than the earlier stage growth rates. Aswath Damodaran, Investment Valuation: Tools and techniques for determining the value of any asset, University Edition, John Wiley & Sons, Inc., 1996, p. 193.
Page 34

1 II A multi-stage DCF may use either two or more growth stages, depending on the situation
2 II being modeled. In any case, the last stage must use a sustainable rate as it is considered to last
3 II into perpetuity. In fact, in Staffs experience, most DCF analyses do not assume a growth rate
4 ~ for the final stage much higher than the expected rate of inflation, currently 2.0% to 2.5%. The
5 II ability of a multi-stage DCF analysis to reliably estimate the cost of common equity is primarily
6 II driven by the analyst using a reasonable growth rate for the final stage because this rate is
7 I assumed to last into perpetuity. Where three stages are used, the second stage is generally a
8 II transitional phase between the high-growth first stage and the constant-growth final stage.34
9 II In the present case, Staff used a three-stage DCF approach, the stages being years 1-5,
10 II years 6-10, and years 11 to infinity.35 For stage one, Staff gave full weight to the analysts'
11 II five-year EPS growth estimates. Staff adopts these EPS estimates for the first stage of its model,
12 II because Staff understands that these projections are designed to represent expectations over this
13 II same 5-year period. For stage two, Staff linearly reduced the growth rate from the stage one
14 II level to the constant-growth third stage level, in which Staff assumed a perpetual growth rate
15 II range of3.00% to 4.00%; mid-point 3.50% (see Schedules 14-1 through 14-3). Based on this set
16 ~ of assumptions, Staffs estimated cost of equity for both the broad and refined proxy group
17 II ranges from approximately 7.30% to 8.10%, mid-point of 7.70%.
18 II ii. Stage one
19 II The first stage of a multi-stage DCF is usually quite specific due to the ability to forecast
20 II cash flows in the near-term with more accuracy. In fact, it is often the case that the first stage of
21 II a multi-stage DCF will be based on discrete cash flows projected on an annual basis for the next
22 II several years. However, in the context of discounting expected future DPS, it is often the case
23 II that a compound growth rate is applied to the current DPS to estimate the expected DPS over the
24 ~ next several years. Although it is rare for a company to tie its targeted DPS growth rate directly
25 II to a 5-year EPS projected compound growth rate, because equity analysts' 5-year EPS forecasts
26 II are widely available and may provide some insight on expected DPS, Staff decided to use these
27 II growth rates for the first 5-years of its multi-stage DCF. However, Staff emphasizes that it has
28 II never seen an investment analysis of a utility company that used 5-year EPS forecasts for
29 II purposes of estimating the growth in DPS in a single-stage, constant-growth DCF or for the final
34 John D. Stowe, Thomas R. Robinson, Jerald E. Pinto and Dennis W. McLeavey, Analysis of Equity Investments: Valuation, Association for Investment Management and Research, 2002, p. 71-72.
35 In practice, Staff extended the third stage only to year 200.
Page 35

1 stage in a multi-stage DCF. Considering the fact that the very equity analysts that provide 5-year
2 EPS compound growth rates do not use them as a proxy for expected long-term DPS growth in
3 their own analyses should be proof in and of itself that stock prices do not reflect this
4 assumption. Consequently, Staff limited its use of these growth rates to the first five years of its
5 analysis, the very period these growth rates are intended to cover.
6 iii. Stage two
7 Stage two, i.e. the transition stage, is simply a gradual movement from above normal
8 growth to more normal/sustainable growth for the final stage. Although stage two can also
9 II consist of forecasted discrete cash flows, because it is a transitional period, it is logical to linearly
10 II reduce the high growth first-stage growth over a specific period in order to gradually reduce the
11 growth rate to the expected sustainable growth rate. Staff chose to do this over a 5-year period,
12 which is fairly conventional in multi-stage DCF analysis.
13 iv. Stage three
14 Stage three is the final/constant-growth stage. In fact, the final stage can be reduced to
15 II the single-stage, constant-growth form of the DCF. Although this is the "generic" stage, it is
16 II extremely important to select a reasonable growth rate for this stage to arrive at a reliable cost of
17 II equity estimate.
18 II Cost of equity estimat~s using multi-stage DCF methodologies are extremely sensitive to
19 II the assumed perpetual growth rate. Staff performed an extensive amount of research on the
20 II actual realized growth rates of electric utilities over a 30-year period to estimate a 3.00% to
21 II 4.00% growth rate as a reasonable proxy for perpetual growth for the electric utility industry.
22 II The Financial Analysis Unit has access to Value Line data on Central region electric
23 II utility companies dating back to 1968.36 Staff believes it is important to analyze electric utility
24 II industry financial data to at least the early 1970s since this was approximately the beginning of
25 II the last large construction cycle for the electric utility industry.37 Because 1968 is consistent
26 II with the starting point of the last construction cycle, Staff decided to capture data starting in that
27 II year. Ideally, Staff would have analyzed data through the beginning of the current construction
36 Value Line has consistently published information the electric utility industry based on three regions: East, West and Central. The Central Region electric utility industry data is published in Edition 5 of The Value Line Investment Survey data. Staff maintained consistent and comprehensive files for the Central Region for reports published back to 1985, which provides electric utility per share data dating back to 1968.
37 Daniel Ford, Gregg Orrill, Theodore W. Brooks, Ross A. Fowler, M. Beth Straka and Noah Howser, "Utilities Capital Management," July 16,2009, Barclays Capital, p. 13 (Attachment D).
Page 36

cycle, which started approximately during the middle of the past decade, but because many
2 II electric utility companies diversified into non-regulated merchant and trading operations towards
311 the end ofthe 1990s and there was much consolidation during this same period, this noise causes
4 any study relying on this more recent data to be less reliable in evaluating regulated electric
5 II utility growth rates. It appears that much of the disruption in the electric industry occurred
6 II subsequent to the Enron, Inc., bankruptcy in December 2001. Considering that much of this
7 II disruption was caused by deregulation, Staff does not consider the information during this
8 II period to be informative for understanding investors' growth expectations for regulated electric
9 II utility operations.
10 II Staff did not apply rigid selection criteria for purposes of selecting central region electric
11 utility companies contained in Edition 5 of the Value Line Investment Survey. However, Staff
12 II did eliminate companies that generally did not have at least 70% of revenues from electric utility
13 II operations in the late 1990s. Staff also eliminated companies that appeared to be impacted
14 II significantly by events related to the restructuring of the electric utility markets in the mid to late
15 II 1990s. Staff also eliminated companies that had data comparability problems due to major
16 II mergers, acquisitions and/or restructurings. Staff only included companies in which comparable
17 II data was available for each year of the period 1968 through 1999. The companies Staff selected
18 II are shown in Schedules 14-1 through 14-4.
19 II Staffs analysis of these electric utility companies' data over the last electric utility
20 II construction cycle indicates that average long-term growth slowly increased through the
21 II late 1980s and early 1990s and declined for the rest of the 1990s. The growth rates are based on
22 II Staffs calculation of a simple average of all of the companies' growth rates over this period.
23 II Because a simple average gives each company equal weight, Staff believes this approach is
24 II appropriate because it does not introduce size bias. As can be seen in the attached Schedules,
25 II the rolling average 1 0-year compound EPS growth rate for this period was 3.62%; the rolling
26 II 10-year compound DPS growth rate was 3.99%; the rolling 10-year compound BVPS growth
27 II rate was 3 .18%; and the overall average for DPS, EPS and BVPS was 3.5 9%.
28 II However, it is important to understand that these growth rates were achieved during a
29 II much more robust economic environment than the U.S. is expected to achieve in the foreseeable
30 II future. Also, considering that some rate of return witnesses' DCF analyses assume utilities can
Page 37

grow at the same rate as GDP in perpetuity, it is interesting to note that the average growth rate
2 II for these electric utilities was less than 50% of GDP growth over the same period.
311 Although Staff relied on the aforementioned proxy group for purposes of estimating a
4 going forward sustainable industry growth rate, another relevant proxy group to evaluate growth
5 II trends for electric utility companies is the growth of the utility companies that actually have a
6 II large amount of their electric utility operations in Missouri. In addition to evaluating the growth
7 II of Missouri electric utility companies for the period 1968-1999, Staff also evaluated the growth
8 II of Missouri electric utility companies through 2013. As can be seen in the chart below, if the
9 II growth rates of the Missouri utilities are evaluated for the period after the 201h century, it is quite
10 II apparent that including this period would reduce the actual realized growth rate:
11
5.00%
4.00%
3.00%
2.00%
1.00%
0.00% 1.0 00
-1.00% ~ co IX) .,;. 00
en en en .-1 .-1 .-1 .-1
0 0 0 0 .... .... .... .... 0 N
""" 1.0
I'- r;- I'- I'-cO I I
0 N """ 1.0 I'- I'- I'-
en en en en
12 .-1 .-1 .-1 .-1
Missouri Regulated Utility Growth of DPS, EPS and BVPS
-Combined DPS, EPS and BVPS
00 0 00 en <.b cO 00 00 en en ·m Oi Oi Oi en 0 0 0 0 0 0 .-1 .-1 .-1 .-1 .-1 .-1 .-1 N N N N N N 0 0 0 0 0 0 0 0 0 0 0 0 0 .... .... .... .... .... .... .... .... .... .... ..... .... .... 00 0 N """ 1.0 co 0 N
""" 1.0 co 0 N
I'- co co co co co en q> en en en 0 0 I cO 6 I .,;. <.b cO N .,;. I cO 6 1.0 N 0 1.0
I'- I'- co co co co co en en en en en 0 en en en en en en en en en en en en 0 .-1 .-1 .-1 .-1 .-1 .-1 .-1 .-1 .-1 .-1 .-1 .-1 N
1311 The average 10-year compound growth rates in DPS, EPS and BVPS for the period 1968
14 II through 2013 were 1.84%, 1.66% and 2.39%, respectively, with an overall average growth rate
15 II of 1.96%. The average 1 0-year compound growth rates in DPS, EPS and BVPS for the period
1611 1968 through 1999 were 3.59%, 3.11% and 2.57%, respectively, with an overall average growth
17 II rate of 3.09%. Consequently, including more recent financial data in evaluating the growth rate
Page 38

1 ~ trends of Missouri's electric utilities actually supports the use of a perpetual growth rate that is
2 II less than the 3% to 4% that Staff chose to use in its multi-stage DCF analysis.
3 II Of Missouri's utilities, The Empire District Electric Company's business operations have
4 II been the most consistent in being limited to regulated utility operations through the period
5 II analyzed. Although Great Plains Energy has owned some non-regulated operations during the
6 II period Staff analyzed (e.g., Strategic Energy), these operations did not disrupt the financial
7 II performance of the Company to a great extent, even though they did increase Great Plains
8 II Energy's risk profile. However, Ameren has incurred significant financial problems due to its
9 II ownership of merchant generation operations in Illinois. This exposure caused Ameren to incur
10 II significant losses in recent years, which would skew any financial growth rates that include this
11 ~ information. Although Empire and Great Plains Energy did not incur financial difficulties due to
12 ~ non-regulated operations, both companies did reduce their dividends in recent years. Because of
13 II these issues that occurred around or after the recession and financial crisis in 2008 and 2009,
14 II Staff also determined the average growth of Missouri's utilities through 2007. The average
15 II 10-year compound growth rates in DPS, EPS and BVPS for the period 1968 through 2007 were
16 II 2.85%, 2.03% and 2.27%, respectively, with an overall average growth rate of2.39%.
1711 Obviously, the actual experienced growth rates ofMissouri's electric utilities support the
18 II reasonable, if not lofty, perpetual growth rates Staff chose to use for its perpetual growth rate
19 II analysis. The actual realized growth rates of Missouri's utilities support a perpetual growth rate
. 20 II range of 2% to 3% rather than the 3% to 4% Staff decided to use. Although these growth rates
21 II are generally characterized as "low" when discussed in the utility ratemaking arena, these growth
22 II rates are more typical of those that are used by investors when determining a reasonable price to
23 II pay for a utility stock.38 Additionally, considering that the dividend yield from utility stocks has
24 II historically produced 2/3 of the total return on utility stocks, 39 and the fact that dividend yields
25 II for electric utilities are currently approximately 4%, a 2% capital appreciation rate in utility
26 II stocks is about what investors would expect. This translates into an approximate expected return
27 II of 6% for utility stocks, which is quite logical and rational in the current low-yield environment.
38 Staff has analyzed many utility stock research reports over the last several years and has consistently observed much lower perpetual growth rates than those typically assumed in models for estimating the cost of equity for utility ratemaking.
39 Hugh Wynne, Francois D. Broquin, Saurabh Singh, "U.S. Utilities: Our Dividend Growth Model Identifies Utilities Poised to Pay More," May 20, 2011, Bernstein Research.
Page 39

1 II v. Constraints on Long-term Growth Rates used in Stage Three
2 II In order to evaluate the credibility of an estimated perpetual growth rate for the electric
3 II utility industry, it is important to be aware of the changing fundamentals that have occurred and
4 II continue to occur within the electric utility industry due to changes in demand for electricity. In
5 II the past, growth in electric utility earnings and dividends was primarily driven by the increase in
6 II demand for electricity and the growth of customers using electricity. However, this dynamic has
7 II changed and the demand for electricity is no longer a primary growth driver for electric utilities.
8 i The decline in electricity demand growth is illustrated in the graph below:40
9
10
Electricitv demand •'
Growth in electricity use slows, but use still increases by 29% from 2012 to 2040
:Figure IHT-29. U.S. electricity df'.m:.md grm11.1.b in the Refe~·ence case, 1950-2040 (11ercent)
12 History 20 12 Projections
10
8
6
4
2
0
-2 1950 1960 1970 1980 1990 2000 2010 2020 2030 2040
11 II . The fact that the growth in electricity demand has been in a steady state of decline seems
12 II to explain the steady decline in electric utilities' financial performance over the period Staff
13 II analyzed in its previous discussion in this testimony. To the extent that potential financial
14 II growth for electric utilities is now limited to the ability to make additional investments and pass
15 II the cost of these investments (which includes the allowed ROR) onto a near-constant customer
16 II base, any growth higher than needed capital investment to replace existing infrastructure would
17 II seem to be highly speculative and not sustainable. However, Staff notes that much of the rate
40 Energy Information Administration's 2014 Annual Energy Outlook, p. MT-16.
Page 40
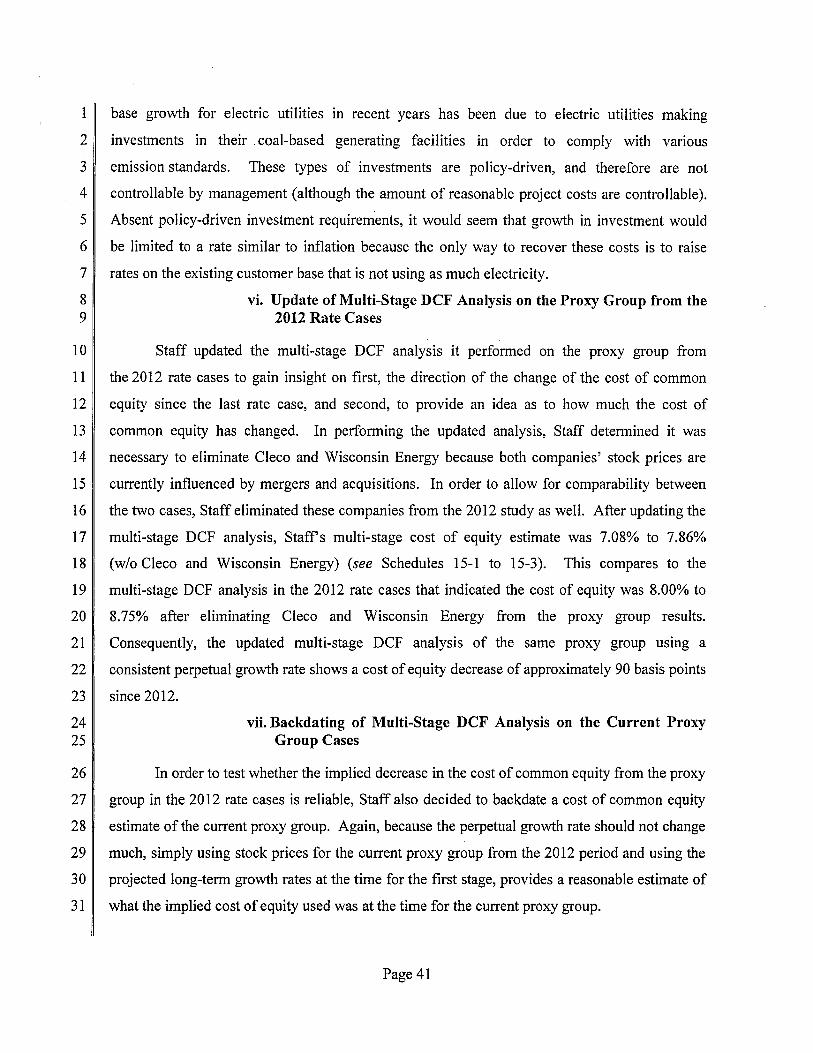
1 II base growth for electric utilities in recent years has been due to electric utilities making
2 II investments in their . coal-based generating facilities in order to comply with various
311 emission standards. These types of investments are policy-driven, and therefore are not
4 controllable by management (although the amount of reasonable project costs are controllable).
5 II Absent policy-driven investment requirements, it would seem that growth in investment would
6 II be limited to a rate similar to inflation because the only way to recover these costs is to raise
7 rates on the existing customer base that is not using as much electricity.
8 vi. Update of Multi-Stage DCF Analysis on the Proxy Group from the 9 2012 Rate Cases
10 II Staff updated the multi-stage DCF analysis it performed on the proxy group from
11 II the 2012 rate cases to gain insight on first, the direction of the change of the cost of common
12 II equity since the last rate case, and second, to provide an idea as to how much the cost of
13 II common equity has changed. In performing the updated analysis, Staff determined it was
14 II necessary to eliminate Cleco and Wisconsin Energy because both companies' stock prices are
15 II currently influenced by mergers and acquisitions. In order to allow for comparability between
16 II the two cases, Staff eliminated these companies from the 2012 study as well. After updating the
17 II multi-stage DCF analysis, Staffs multi-stage cost of equity estimate was 7.08% to 7.86%
18 II (w/o Cleco and Wisconsin Energy) (see Schedules 15-1 to 15-3). This compares to the
19 II multi-stage DCF analysis in the 2012 rate cases that indicated the cost of equity was 8.00% to
20 II 8.75% after eliminating Cleco and Wisconsin Energy from the proxy group results.
21 II Consequently, the updated multi-stage DCF analysis of the same proxy group using a
22 II consistent perpetual growth rate shows a cost of equity decrease of approximately 90 basis points
23 since 2012.
24 vii. Backdating of Multi-Stage DCF Analysis on the Current Proxy 25 Group Cases
26 II In order to test whether the implied decrease in the cost of common equity from the proxy
27 II group in the 2012 rate cases is reliable, Staff also decided to backdate a cost of common equity
28 II estimate of the current proxy group. Again, because the perpetual growth rate should not change
29 II much, simply using stock prices for the current proxy group from the 2012 period and using the
30 II projected long-term growth rates at the time for the first stage, provides a reasonable estimate of
31 II what the implied cost of equity used was at the time for the current proxy group.
Page 41

1 Finding historical stock prices is not difficult as this is available from many sources
2 online. However, looking back to 2012 and finding projected growth rates at the time is usually
3 a challenge. However, because Staff currently has an upgraded subscription to SNL Financial
4 and because SNL Financial maintains a database of this information, Staff was able to perform
5 this analysis. Staffs backdated multi-stage DCF analysis of the current proxy group, with the
6 exception of Ameren and PNM Resources because of financial difficulties they had at the time
7 unrelated to their regulated utility operations, shows that the cost of equity estimate would have
8 been approximately in the 8.23% to 8.84% range (see Schedules 16-1 to 16-3). This compares to
9 a current cost of equity estimate of 7.26% to 8.04% if Ameren and PNM Resource are removed.
10 Consequently, this supports an implied cost of equity reduction of approximately an 80-95 basis
11 II point range from the 2012 rate cases.
12 viii. Preference for GDP Growth
13 II Although Staff is confident that investors do not expect that utilities' per share growth
1411 rates can grow at the same rate of nominal GDP in the long-run, Staff recognizes that even
15 customer ROR witnesses have been willing to accept this assumption for purposes of estimating
16 II the cost of equity. Consequently, Staff will provide a cost of equity indication using this
17 II simplified approach.
18 II Projected GDP growth is available from a variety of sources and the Energy Information
19 II Administration (EIA) publishes many of these in its Annual Energy Outlook. Not only does EIA
20 II publish near-term projected GDP growth rates, but they also publish projected GDP growth rates
21 II over very long time periods. Because economists are projecting these growth rates over very
22 II long time periods, such growth rates represent economists current estimates of what they believe
23 II the U.S. economy's long-run sustainable growth rate may be, since it is impossible to take into
24 II consideration many specific economic issues when projecting these long-term growth rates.
25 II These projected long-term growth rates in U.S. GDP are consistent with the current low interest
26 II rate environment, which provide signals that the U.S. economy will not return to the growth it
27 II achieved during the last century. This is quite logical considering the maturity of the
28 II U.S. economy. The projected economic growth rates are shown below:41
41 Energy Information Administration's 2014 Annual Energy Outlook, p. CP-2.
Page 42
1
2
3
4
5
6
7
8
9
10
11
12
13
14
15
16
17
Table CPl. Comparisons of average annual economic growtlt projections, 2012-40
Average annual percentage growth rates
Projection 2012-2015 2012-2025 2025-2040 2012-2040
AE02014 (Reference case) 2.6 2.5
AE02013 (Reference case) 2.6 2.6
2.4
2.4 -······· ... . ........................ ,,,_,_ ········-····· ·····-····-·····.
2.6 2.5 2.4
2.7 2.6
CBO 2.6 2.5
INFORUM (November 2013) 2.4 2.6 2.3 -····-····-····-····--·· ······-·-····-··--··--··--·········-······-······
Soda I Security Administration (August 2013) 3.0 2.7 2.2
lEA (2013)b 2.6 2.8
2.4
2.5
2.5
2.4
2.4
2.4 ···--·--····-····-····- ···········--·-····-····-····-····-······
ExxonMobil 2.5 2.2 2.4
OEG (January 2013) 2.7 2.7 2.5 2.6
--=not reported or not applicable. •QMB and CBOprojectlons end In 2024, and growth rates cited are for 2012-24.AEO projections end In 2040. biEA publishes U.S. growth rates for certain Intervals: 2011-15 growth is2.6%, 2011-20 growth Is 2.8%, and 2011-35 growth Is 2.4%.
In each case in which the sources do not project a nominal GDP growth rate, Staff
recommends adding a GDP price deflator of 2.0%, which is the CBO's prediction of long-term
inflation and also the inflation rate which is targeted by the Federal Reserve. Considering the
fact that a perpetual growth rate is intended to measure the long-run trend growth rate supported
by the long-term fundamentals of the U.S.'s mature economy, Staff believes the most relevant
projections from the table above are for the period 2025 through 2040. Staff recommends using
the mid-point of the real GDP range of2.2 to 2.5%, which is 2.35%. Compounding the expected
GDP price deflator of 2.0% with the long-term real GDP growth of 2.35%, results in long-term
nominal GDP growth of approximately 4.40%. When using a 4.4% GDP growth rate in Staffs
multi-stage DCF results in a cost of equity estimate of approximately 8. 72% for the broad proxy
group and 8.67% for the refined proxy group.
G. Tests of Reasonableness
Staff has tested the reasonableness of its DCF results, both by use of a CAPM analysis
and consideration of other evidence.
1. The CAPM
18 II The CAPM is built on the premise that the variance in returns is the appropriate measure
19 ! of risk, but only the non-diversifiable variance (systematic risk) is rewarded. Systematic risks,
20 II also called market risks, are unanticipated events that affect almost all assets to some degree
Page 43

because the effects are economy wide. Systematic risk in an asset, relative to the average, is
2 measured by the Beta of that asset. Unsystematic risks, also called asset-specific risks, are
3 unanticipated events that affect single assets or small groups of assets. Because unsystematic
4 risks can be freely eliminated by diversification, the reward for bearing risk depends on the level
5 II of systematic risk. The CAPM shows that the expected return for a particular asset depends on
6 II the pure time value of money (measured by the risk free rate), the reward for bearing systematic
711 risk (measured by the market risk premium), and the amount of systematic risk (measured
8 by Beta). The general form of the CAPM is as follows:
9 II k = Rf + (J ( Rm - Rf) 10
11
12
13
Where: k
Rf
~ Rm-Rf
is the expected return on equity for a security;
is the risk-free rate;
is Beta; and
is the market risk premium.
14 II For inputs, Staff relied on historical capital market return information through the end of2013.
1511 For the risk-free rate (Rf), Staff used the average yield on 30-year U.S. Treasury bonds for the
16 three-month period ending December 31, 20 14; that figure was 2.97%. For beta (~), Staff relied
17 II on estimates directly calculated through an Excel spreadsheet designed specifically to be used
18 II with the SNL database of market and financial information. Although Staff is no longer using
19 II Value Line's published betas for purposes of its CAPM analysis in its direct testimony, because
20 II Value Line is used by many retail investors, Staff still believes Value Line's beta calculation
21 II methodology should be considered when performing a CAPM analysis. Because estimating beta
22 II is a matter of having access to financial data and performing statistical calculations, unless a
23 II financial services provider has a proprietary adjustment they make to their beta calculation,
24 II understanding the methodology used by a financial provider allows an analyst to approximately
25 II replicate betas of that provider. Fortunately, this is the case for Value Line's beta calculation
26 II methodology. Consistent with Value Line's approach to calculating beta, Staff used 5-years of
27 II historical weekly returns of the subject company and the New York Stock Exchange (NYSE)
28 II index. The covariance of the weekly returns on the NYSE index and the weekly returns on the
29 II subject company is divided by the variance of the weekly returns on the NYSE index to
30 II determine raw beta (unadjusted beta). Staff then adjusted the raw beta using the Blume
Page 44

1 II adjustment formula as used by Value Line: Adjusted Beta = (.35 + .67(Unadjusted Beta))
2 (see Schedule 17).
311 The average beta for the broader proxy group was 0.78 and 0.76 for the refined proxy
4 group. For the market risk premium (Rm - Rf) estimates, Staff relied on the historical difference
511 between earned returns on stocks and earned returns on bonds.42 The first risk premium was
6 based on the long-term arithmetic average of historical return differences from 1926-2013 -
7 6.20%. The second risk premium was based on the long-term geometric average of historical
8 return differences from 1926 to 2013-4.64 percent. The results using the long-term arithmetic
9 average risk premium and the long-term geometric risk premium are 7.82 and 6.60 percent,
10 respectively for the broad proxy group and 7. 70 and 6.51 percent for the refined proxy group.
11 These cost of common equity results support the reasonableness of Staffs cost of equity
12 II estimates derived from its DCF analysis. Staff again notes that both U.S. Treasury yields and
1311 utility bond yields are quite low (at levels last experienced in the early 1960s) and that the spread
14 between them is presently below their long-term average. It is not improbable that investors are
15 II only requiring returns on common equity in the 6 to 7 percent range for utility stocks. In fact, as
16 II Staff will explain in its other tests of reasonableness, these cost of equity estimates are consistent
17 II with common sense tests.
18 2. Other Tests
1911 a. The "Rule of Thumb"
20 A "rule of thumb" method allows an objective test of individual analysts' cost of equity
21 II estimates. Because this method is suggested in a textbook43 used for the curriculum for
22 II Chartered Financial Analyst (CF A) Program, Staff believes this method is free of any bias from
23 II those involved in utility ratemaking. It is also a useful test because it is very straightforward and
24 II limits the risk premium to a 1 00 basis point range. The cost of equity is estimated by simply
25 II adding a risk premium to the yield-to-maturity (YTM) of the subject company's long-term debt.
26 Based on experience in the U.S. markets, the typical risk premium is in the 3% to 4% range.
27 Considering that this is based on general U.S. capital-market experience and that regulated
28 utilities are on the low end of the risk spectrum of the general U.S. market, a risk premium closer
42 From Duff & Phelps 2014 Valuation Handbook: A Guide to the Cost of Capital. 43 John D. Stowe, Thomas R. Robinson, Jemld E. Pinto and Dennis W. McLeavey,Analysis of Equity
Investments: Valuation, Association for Investment Management and Research, 2002, p. 54.
Page 45

1 II to 3% seems logical. This is especially true considering that regulated utility stocks behave like
2 II bonds. For the months October, November and December 2014, "A" rated 30-year utility bonds
3 II and "Baa" rated 30-year utility bonds had average yields of 4.02% and 4.74% respectively.44
4 II Adding a 3% risk premium, the "rule of thumb" indicates a cost of common equity between
51 7.02% and 7.74%. Adding a 4% risk premium, the "rule of thumb" indicates a cost of common
6 equity between 8.02% and 8.74%.
7 II These simple, straight-forward tests of reasonableness of cost of common equity
8 II estimates provide a common sense check on whether a cost of common equity estimate is logical
9 II considering the bid up of utility bonds and stocks in the last several years. As a point of
10 II reference, and also evidence that the Commission should lower its authorized return from the
11 II 9.7% to 9.8% range it allowed in 2012, the cost of equity indications from this straight-forward
12 II test in the 2012 rate cases were as follows: 7.92% to 8.52% using a 3% risk premium and 8.92%
13 II to 9.52% using a 4% risk premium. The implied decline in the cost of common equity from rate
14 II cases in 2012 using this simple, straight-forward test is as much as 90 basis points.
15 II b. Average Authorized Returns
16 II In the past, the Commission has applied a test of reasonableness using average
17 II authorized returns published by Regulatory Research Associates (RRA) to test the
1811 reasonableness of its allowed ROE. To the extent the Commission chooses to use RRA data
19 again in this case, Staff believes the Commission should have information on allowed ROE's
20 II since 2012.
21 According to RRA, the average authorized return on equity authorized electric utilities
22 II was 9.92% in 2014 (based on 37 ROE determinations), compared to a 2013 calendar year
23 II average of 10.02% (based on 50 ROE determinations ).45 Excluding the effect of the
24 II surcharge/rider generation cases in Virginia, the average allowed electric ROEs were 9.76% for
25 II the 2014 calendar year and 9.80% for the 2013 calendar year. This compares to an average
2611 allowedROEof10.17%in2012.
44 BondsOnline.com, pursuant to a subscription agreement Staff has with BondsOnline. 45 RRA, Regulatory Focus- Major rate case decisions- -Calendar 2014- January 15, 2015:2014 data
includes four surcharge/rider generation cases in Virginia that incorporate plant-specific ROE premiums. Virginia statutes authorize the State Corporation Commission to approve ROE premiums of up to 200 basis points for certain generation projects.
Page 46
1 II In order to provide more specific information on the allowed ROE's by type of electric
2 II utility operations, Staff determined the allowed ROEs that were given to integrated electric
3 utility companies. Staff excluded allowed ROEs that were determined for dockets not involving
4 a full general rate case (i.e. rider only cases). Staff also continued to exclude the aforementioned
5 Virginia rate cases. The average allowed ROE for integrated electric utilities was 9.95% for the
6 2014 calendar year and 9.96% for the 2013 calendar year. This compares to an average allowed
7 ROE of 10.10% in 2012.
8 As a further refinement, Staff also evaluated allowed ROE information for only cases that
9 II were fully-litigated as in these cases, one would expect that each issue is determined based on its
10 II own merits. Allowed returns determined in context of a settled case are not as reliable because
11 II parties make adjustments to other elements of the ratemaking formula in order to arrive at an
12 overall reasonable number. It has been Staff's experience, that some companies do not want a
13 II lower ROE published in a settlement because this is a headline number. Consequently,
14 II companies may compromise on a more obscure area of the rate case in order to have a higher
15 II ROE published in the settlement. Allowed ROEs for fully-litigated cases were 10.05% for the
16 II 2014 calendar year, and 9.96% for the 2013 calendar year. This compares to an average allowed
1711 ROE for fully-litigated cases oflO.lO% in 2012.
18 II The allowed ROE information does not seem to provide any clear trends, but Staff
19 II believes the economic and capital market conditions clearly support a lower allowed ROE than
20 II the 9.7% and 9.8% the Commission authorized in 2012.
21 II H. Conclusion
22 II A just and reasonable rate is one that is fair to the investors and fair to the ratepayers.
23 II Fairness to the ratepayers means rates that are not one penny more than is necessary to be fair to
24 II the shareholders. Fairness to the shareholders means rates that will produce revenues, on an
25 II annual basis, sufficient to cover Empire's prudent cost of service, which includes an allowed
26 II ROR. Using widely-accepted methods of financial analysis, Staff believes the cost of common
27 II equity has declined by up to 95 basis points since 2012. Although this would justify an even
28 II larger reduction to the 2012 allowed ROEs than Staff's recent recommended reduction of25 to
29 II 75 basis points in Ameren Missouri's pending rate case, Staff believes it should continue to
30 II monitor the capital markets before recommending a larger reduction because this additional
Page 47

1 II implied reduction in the COE occurred within a relatively short-period of time. However, Staff
2 II believes the recent capital market events provide additional support for the reasonableness of
3 II Staffs recommended allowed ROE for Empire. Consequently, Staff recommends the
4 II Commission authorize an ROE for Empire in the range of 9.25 percent to 9.75 percent to atleast
5 II partially share the reduced cost of equity with ratepayers. Staffs recommended ROE for Empire
6 II is 25 basis points higher than Staffs recent recommendation for Ameren Missouri's rate case
7 II because Staff added 25 basis points due to Empire's lower credit rating, which is based on the
8 II business and financial risks of Empire's regulated utility operations. The spreads between
9 II 'BBB+' rated utility bonds and 'BBB' rated utility bonds have averaged approximately 25 basis
10 II points during the period October 2014 through December 2014.46 Given that the cost of capital
11 II is as real a cost as any other cost of service, reducing this cost in the ratemaking formula is
12 II consistent with the principles of cost-of-service ratemaking. Using this recommended allowed
13 II ROE results in weighted average cost of capital for Empire in the range of 7.47 percent
14 II to 7.73 percent (see Schedule 18). This rate was calculated by applying an embedded cost of
15 II long-term debt of 5.56% and an allowed return on common equity range of 9.25% to 9.75% to a
1611 capital structure consisting of 51.71% common equity and 48.29% long-term debt. Because
17 II there appears to be some concern in setting an allowed return on equity based on a reasonable
18 II estimate of the cost of equity, Staff recommends the Commission set the allowed ROE at 9.50%
19 II in this case. Although this is above what Staff estimates to be the cost of equity to be in the
20 II current capital market environment, this allowed ROE would balance the concern about the
21 II impact of a lower allowed ROE on investors' view of Missouri's regulatory environment, while
22 II still passing along the benefit of lower capital costs to ratepayers.
23 II Staff Expert/Witness: Shana Griffin
46 Staff used bond yield data from BondsOnline.com pursuant to a subscription agreement Staff has with BondsOnline.
Page 48
1 II VII. Rate Base
2 II A. Plant in Service
3 1. Plant in Service as of August 31, 2014
411 Accounting Schedule 3, Plant in Service, reflects the rate base value of Empire's plant in
5 service at August 31, 2014, by account.
6 II Staff Expert/Witness: Brooke M Richter
7 II 2. Plant Adjustments: Allocation to Gas
8 II Empire records its natural gas general plant in service balances entirely on its electric
9 II books. The Staff adjusted Empire's plant balances to allocate a portion of the Company's
10 II general plant to Empire's natural gas business for rate case purposes.
11 II Staff Expert/Witness: Brooke M Richter
12 II B. Depreciation Reserve
13 II 1. Depreciation Reserve as of August 31, 2014
14 II Accounting Schedule 4, Depreciation Reserve, reflects the rate base value of Empire's
15 II depreciation reserve at August 31, 2014, by account.
16 II Staff Expert/Witness: Brooke M Richter
17 II 2. Reserve Adjustments: Allocation to Gas
18 II Empire records its natural gas depreciation reserve associated with general plant entirely
19 II on its electric books. The Staff allocated a portion of the general plant depreciation reserve to
20 II Empire's natural gas business for rate case purposes.
21 II Staff Expert/Witness: Brooke M Richter
2211 3. Plant & Depreciation Reserve Adjustments: Capitalized Incentive 23 Compensation
24 II Since June 30, 2012 of the last rate case, No. ER-2012-0345 through the update period of
25 II this case, Empire capitalized a portion of its incentive compensation for the Employee Stock
26 II Purchase Plan and the Bonus Incentive Plan ("Lightning Bolts"). Staff made regulatory
Page 49
adjustments to the plant in service and depreciation reserve in order to eliminate these amounts
2 II from cost of service. Since the Staff removed these compensation expenses from its cost of
3 II service income statement (see Section IX. E. 2.), Staff is also making an adjustment to remove
4 II these costs from rate base in this case.
5 II Staff Expert/Witness: Jermaine Green
611 C. Cash Working Capital (CWC)
7 II Cash Working Capital (CWC) is the amount of funding necessary for a utility to pay the
8 II day-to-day expenses incurred in providing utility services to its customers. When a utility
911 expends funds in order to pay an expense necessary for the provision of service before its
10 customers provide any corresponding payment, the utility's shareholders are the source of the
11 II funds. This shareholder funding represents a portion of the shareholders' total investment in the
12 II utility, for which the shareholders are compensated by the inclusion of these funds in rate base.
1311 By including these funds in rate base, the shareholders earn a return on the CWC-related funding
14 they have invested.
15 II Conversely, customers supply ewe when they pay for electric services received
16 II before the utility pays expenses incurred in providing that service. Utility customers are
17 II compensated for the CWC they provide by a reduction to the utility's rate base. By removing
18 II these funds from rate base, the utility earns no return on that funding which was supplied by
1911 customers as ewe. 20 A positive CWC requirement indicates that, in the aggregate, the shareholders provided
21 II the ewe for the test year. This means that, on average, the utility paid the expenses incurred to
22 II provide the electric services to its customers before those customers had to pay the utility for the
23 ~ provision of these utility services. A negative ewe requirement indicates that, in the aggregate,
24 II the utility's customers provided the ewe for the test year. This means that, on average, the
25 II customers paid for the utility's electric services before the utility paid the expenses that the
26 ~ utility incurred to provide those services.
27 II To determine the amount of ewe provided by both the customers and shareholders, Staff
28 II performs a lead/lag study. The lead/lag study involves the analysis of the timing of when
29 II expenses are paid to suppliers, employees, etc. and when the utility receives revenues from
30 II customers for the services it provides.
Page 50

1 II Empire did not perform a lead/lag study specific to costs incurred during the test year
2 II (12 months ending April 30, 2014) in this case, but instead utilized the revenue and expense lags
3 II agreed to in Empire's last rate case, Case No. ER-2012-0345. Staff did not perform a complete
4 II CWC analysis in this case either. However, Staff did review the revenue lag and expense lags
5 II for fuel and purchased power in this case to determine whether those values· should change from
6 II the lags agreed to in Case No. ER-2012-0345. For all other lags contained in the CWC
7 II Accounting Schedule, Staff utilized the CWC lags that were agreed to by Empire and Staff in
8 II Empire's last case.
9 II The revenue lag is the amount of time between the day the Company provides the utility
10 II service, and the day it receives payment from the ratepayers for that service. Staff's overall
11 II revenue lag in this case is the sum of three (3) subcomponents. They are as follows:
12 1. Usage Lag: The midpoint of average time elapsed from the beginning of the 13 first day of a service period through the last day of that service period;
14 2. Billing Lag: The period of time between the last day of the service period and 15 the day the bill for that service period is placed in the mail by the Company; 16 and
17 3. Collection Lag: The period of time between the day the bill is placed in the mail 18 by the Company and the day the Company receives payment from the customer 19 for the services provided.
20 II Staffs recommended revenue lag in this case is presented as follows, and Staffs calculation for
21 II each component will then be explained:
22
Staff
Usage Lag 15.21
Billing Lag 2.84
Collection Lag 29.78
Total Revenue Lag 47.82
23 24 II The usage lag was determined by dividing the number of days in a typical year (365) by the
25 II number of months in a year (12) to yield the average number of days in a month (30.42). The
26 II 30.42 was then divided by two (2) to yield an average usage lag of 15.21 days. This further
27 II calculation using two (2) as the divisor is necessary since the Company bills monthly and it is
28 II assumed that service is delivered to the customer evenly throughout the month.
Page 51
1 II The billing lag is the time it takes between when the Company reads the meter and when
2 the bills are subsequently mailed to customers. As previously discussed, in the current case
3 II Empire used the revenue and expense lags that were calculated in its last rate case. In that case,
4 II Empire calculated the billing lag by measuring the time between the download date of the meter
511 data and the date the bill was placed in the mail each month for the test year (12-months ending
6 March 31, 2012). Empire used a biiling lag of 4.15 days.
7 II Staff calculated the billing lag using the customer billing information for the test year in
8 II this case- the 12-month period ended April 30, 2014. Staff determined the billing lag for this
9 II case by calculating the number of days between the last meter read dates to the date the bill was
10 II placed in the mail for each month ofthe test year.
1111 According to the Company's response to Staff Data Request No. 0171.10, all customer
12 II accounts are billed on a cycle basis. Each meter reader is assigned one route per billing cycle and
13 II is allowed up to five days from the download date to the last read date to complete the route.
14 II After the route is uploaded into the billing system, the read goes through various parameter
15 II checks. If the read is outside one of the parameters, it must be further reviewed, and approved or
16 II corrected, within two days. Customer accounts that are scheduled to charge are processed
17 II through the nightly batch process in the billing system. A statement is printed and mailed the
18 II following work day unless the customer is on "auto draft" or has requested a different due date.
19 II The routes that are read are accumulated daily based on the billing cycle and populated
20 II into the Host Download File a week before the billing date to ensure adequate time to obtain a
21 II meter read. Therefore, the readings are not necessarily billed after being uploaded to the billing
22 II cycle. The Company holds the information until all meters in the cycle are read. This delay
23 II between the "download date" and "last read date" increases the billing lag and the amount of
24 ~ CWC required by Empire. Therefore, Staff has determined that the "last read date" provides a
25 II more accurate endpoint for the billing lag calculations. Staffs calculations resulted in a billing
26 II lag of 2.84 days.
27 II The collection lag measures the number of days between mailing of the customer's bill
28 II by the utility to the date the bill is paid by the customer. The collection lag was calculated by
29 II using the "accounts receivable turnover" method. Staff determined the total receivables for the
30 II Company's Missouri portion by subtracting the 12-month ending April 31, 2014 bad debt
31 II percentage (.53%) from the accounts receivable ending balances for the same time period. The
Page 52
1 II receivables were then divided by 12-months to come up with the average receivables. The
2 II collection lag was calculated by dividing the number of days in a year (365) by the accounts
3 II receivable turnover (12.26 days). The collection lag for Empire is 29.78 days.
4 II Empire used the same collection lag (27.91 days) from the last Case No. ER-2012-0351.
5 II Staff determined that it was unlikely that the following lags had significantly changed
6 II since Empire's last rate Case No. ER-2012-0345; therefore, Staff did not propose any changes to
7 II the lag values for these items in the current case:
8 Payroll Expense
9 Federal Income Tax Withheld
10 FICA Taxes Withheld- Employee
11 State Income Tax Withheld
12 Employees 401K Withheld
13 II Employers 401K Matching
14 II Employers Life Insurance Matching
15 ! Employers Healthcare
1611 Employers Accidental Death & Dismemberment
17 Employers DentalNision
18 Vacation
19 Pension & OPEB Expense
20 Cash Vouchers
21 Employer FICA
22 II Federal Unemployment
23 State Unemployment
24 MO Gross Receipts Tax
25 Corporate Franchise Tax
26 Property Taxes
27 Sales Taxes
28 Gross Receipts Taxes
29 Income Tax
30 Federal Tax Offset
31 State Tax Offset
Page 53

1 II City Tax Offset
2 Interest Expense Offset
3 II The Staff performed its own lead/lag study on the following expense lags during the audit in this
4 II case: Fuel-Coal, Fuel-Gas, Fuel-Oil, and Purchased Power. Staff calculated expense lags in these
5 II areas because of the significant expense dollar amounts that were involved. The expense lag for
6 the Coal, Gas, and Purchased Power was calculated by using the midpoint between invoice date
7 II and the date that Empire paid the invoice. The Staffs expense lag results were: Coal-15.07 days,
8 Gas-37.61 days, Purchased Power-33.15 days. The expense lag used for oil was measured by
9 calculating the amount of time between when Empire receives the fuel from suppliers and the
10 date they make the payment for the fuel. The expense lag for oil is 11.49 days.
11 II Staff determined on average the time needed to recover revenues from customers after
12 II service has been provided (the revenue lag), and the time the utility can delay payment expenses
13 II incurred in providing service to customers beyond the utility's receipt of the service (the expense
14 II lead or lag). For each significant expense that a utility incurs, a separate line item is devoted to it
15 II in the lead/lag study, and the expense lag calculated for that expense item is compared to the
16 II overall revenue lag of the utility. In this way, for each of the utility's major expense items, a
17 II determination can be made if investors or customers are providing the CWC for that item. The
18 II sum total of the ewe requirements for each line item in the lead/lag study is the overall ewe 19 II requirement of the utility. Whether the bottom line result from the study is positive or negative
20 II indicates whether ewe in the aggregate has been provided to the utility investors or customers.
21 II In conclusion, the results of the study performed by Staff resulted in a positive CWC
22 II requirement. This means that, in the aggregate, the shareholders have provided the CWC to the
23 II Company during the test year. Therefore, the shareholders should be compensated for the CWC
24 ~ that they provide through an increase to rate base.
25 II The result of Staffs CW C analysis is reflected on Accounting Schedule 8, Cash Working
26 II Capital. Staffs CWC analysis result is also included as a line item in the Rate Base Accounting
27 II Schedule 2 in the section entitled "Add to Net Plant In Service." Other aspects of Staffs CWC
28 II analysis results are included in the Rate Base Schedule in the section entitled "Subtract From Net
29 II Plant" in the following line items: Federal Tax Offset, State Tax Offset, City Tax Offset and
30 II Interest Expense Offset.
31 II Staff Expert/Witness: Ashley R. Sarver
Page 54

1 II D. Prepayments and Materials and Supplies
2 II The Company has utilized shareholder funds to finance prepaid items such as insurance
3 II premiums and postage. The Company is reimbursed by customers for these costs once the items
4 II are charged to expense during a subsequent period. The Staff has included these prepayments in
5 II rate base at the 13-month average level ending August 2014. There were three prepayment
6 II accounts that were excluded in the Staffs average: Working Funds Iatan (165350), Working
7 II Funds Plum Point (165351), and KCPL Land Lease (165352). These are cash accounts, not
8 II actual investment in utility assets, and are therefore excluded from rate base.
9 II The Company also holds a variety of materials and supplies (M&S) in inventory so
10 II the items can be readily available when needed in performing its utility operations.
11 II Staffperformed an analysis of all of Empire's M&S accounts from January 2010 through
12 II August 2014. The 13-month average of Empire's M&S account balances as of August 31, 2014,
13 II the end ofthe Staffs update period in this case, was used to determine the average balance for
14 II several of Empire's M&S accounts. For these accounts, there was no upward or downward trend
15 II noted. In addition, there were twelve M&S accounts (154100, 163081, 163316, 184242, 184323,
16 II 184490, 184493, 184494, 184,621, 184622, 184630, and 184915) where the most current ending
1 7 II balance was used. These account balances showed a steady trend within the review period and
18 II using the last known balance for these twelve particular accounts is more appropriate than the
19 II 13-month average.
20 II Additionally, Account 184015 (Integrated Marketplace Southwest Power Pool Clearing
21 II Account) had a large irregular balance in August of 2014 because of a reversal adjustment to
22 II reflect a "Day Ahead Make Whole Payment correction." Empire determined that a payment
23 II should not have been awarded to Empire for the Day Ahead Make Whole Payment and contacted
24 II the Southwest Power Pool to resolve this issue. Southwest Power Pool agreed with Empire and
25 ! Empire filed a dispute to have the Day Ahead Make Whole Payment reversed. Empire reversed
26 II this erroneous payment entry on its books and records in August 2014; therefore, thisreversal
27 II accounting entry was excluded in Staffs analysis in order to reflect a normal level for this
2811 account. Staff also disallowed the dollar amount that was included in Account 184890
29 (EEl Dues) because it is associated with EEl dues that are being disallowed in this case
30 II (see Section IX. G. 17.).
Page 55

1 Empire's electric and water inventory is included on Empire's electric books and records;
2 therefore, an adjustment entry has to be made to eliminate the water M&S from Empire's electric
3 books. Staff used a 13-month average of Empire's water inventory to determine the level of
4 II M&S inventory that needed to be eliminated from Empire's rate base in this proceeding.
5 II Staff Expert/Witness: Brooke M Richter
6 II E. Fuel Inventories
7 II Coal Inventory - Staff used the results of its fuel model to calculate the annual amount
8 II of coal used by each Empire generating plant to meet its total company normalized native load.
9 II Empire operates in four retail jurisdictions: Missouri, Arkansas, Kansas, and Oklahoma.
10 II "Native load" is the kilowatt or megawatt demand placed upon Empire's electric system by its
11 II regulated retail electric customers. To determine the amount of coal inventory, the average daily
12 II bum by unit must be calculated. The average daily bum by unit is derived by dividing the
13 II annualized tons burned by the difference between 365 days and the number of annual
14 II planned outage days. Then, the average daily bum is multiplied by an appropriate number
15 II of days of inventory for each plant resulting in a bum inventory. The number of days of
16 II inventory of Powder River Basin (PRB), or "western" coal, for the Asbury 1 and 2 units is set by
17 II Empire at or around 60 days. The PRB coal in 2015 will be supplied by western coal suppliers:
1811 Arch Coal Sales.
19 Empire also normally carries an inventory of local (Kansas) bituminous coal supplied by
20 II Foresight Coal Sales, under contract; the days of inventory included for this coal is also 60 days.
21 II Staff has also used a 60-day calculation to establish Empire's rate base investment in
22 II the coal inventory maintained both at KCPL's Iatan Generating Stations, of which Empire is a
23 II 12% owner of Iatan 1 and 2; and Plum Point Energy Associates, LLC's Plum Point Energy
24 II Station, of which Empire is a 7.52% owner.
25 II Staff multiplied the resulting bum inventory for each unit by the delivered cost of coal
26 II per ton for that unit calculated by Staff. To this total Staff then added the fixed cost of basemat
27 II coal established in the prior Empire Rate Case No. ER-20 11-0004 for each unit, except for Plum
28 II Point. The basemat for that unit is capitalized as part of plant in service costs. Basemat coal is
29 II the bottom portion of a coal pile that is not usable as fuel due to contamination by soil, clay, and
30 II other contaminants. The total cost of the bum inventory and basemat was multiplied by Staffs
Page 56
1 energy jurisdictional factor to arrive at the Missouri allocated amount with the result being the
2 amountthat is reflected as part of Fuel Inventories in Accounting Schedule 2, Rate Base.
3 Fuel Oil Inventory - Staff used the 13-month average inventory quantities and a
4 II weighted average price for oil inventory levels.
5 II Gas Stored Underground- Staff reviewed Empire's General Ledger account for Natural
6 II Gas in Storage (Account 15154 7) and found activity during the test year. Staff reviewed
7 II Empire's calculation of the 13-month average inventory cost and concluded that this amount was
811 reasonable to include in Staffs rate base.
9 Staff Expert/Witness: Paul R. Harrison
10 II F. Amortization of Electric Plant
11 II Staff has adjusted the amortization reserve for electric plant intangible assets to reflect
12 II the updated balances up through August 31, 2014, the update period for this case. The
13 II amortization reserve balance as of August 31, 2014 is $12,795,551 and was included as an offset
14 II to rate base in Staffs Accounting Schedules.
15 II Staff Expert/Witness: Brooke M Richter
16 II G. Amortization ofPeopleSoft Intangible Asset
17 II Staff has adjusted the intangible asset for the Peoplesoft software costs to reflect the
18 II updated balances through August 31, 2014. The regulatory asset balance as of the end of the
19 II update period August 31, 2014 is $227,730 and was included as an addition to rate base in
20 II Staffs Accounting Schedules.
21 II Staff Expert/Witness: Brooke M Richter
22 II H. Customer Deposits
23 II The amount of customer deposits shown on Accounting Schedule 2, Rate Base,
24 II represents a 13-month average (August 2013 - August 2014) of Empire's customer deposits.
25 II Customer deposits are funds received from customers as security against potential loss arising
26 II from failure to pay for utility service. Since the deposits are interest-free loans to the Company,
27 II the Staff included a representative ongoing level of$9,976,580as an offset to rate base.
Page 57
1 II Interest on customer deposits is also included in the Company's rates because customers
2 II should receive a reasonable rate of return on their deposits until the monies are refunded to them.
3 II The appropriate amount of interest to include in the Company's expenses can be determined by
4 II review of the applicable sections of Empire's current filed Tariff. The Tariff (Section 3, Page 5)
5 II states that the "interest rate paid upon return of a deposit, per annum, compounded annually shall
6 II be equal to the prime rate published in the Wall Street Journal as being in effect on the last
7 business day of December of the prior year plus 1 %." The prime rate in effect as of
8 December 31, 2013 was 3.25%. One percent was added to this rate for a total of 4.25% interest
9 rate on customer deposits. The amount of interest on customer deposits, $424,005, is included in
10 II Staff Accounting Schedule 1 0, Adjustments to the Income Statement.
11 II Staff Expert/Witness: Brooke M Richter
12 I. Customer Advances
13 II Customer advances are funds provided to Empire by individual customers of the
14 II Company to assist in recovering the costs of electric plant construction projects in the provision
15 II of electric service to them under certain circumstances. These funds are interest-free money to
16 II the Company. Therefore, it is appropriate to include these funds as an offset to rate base. Unlike
17 II customer deposits, no interest is paid to customers for the use of this money. The 13-month
18 II average of the customer advances account balances as of August 31, 20 14; the end of the Staffs
19 II update period in this case, is shown on Accounting Schedule 2, Rate Base.
20 II Staff Expert/Witness: Brooke M Richter
21 II J. Accumulated Deferred Income Taxes (ADIT)
22 II Empire's ADIT represents, in effect, a net prepayment of income taxes by customers prior
23 II to payment by Empire. For example, because Empire is allowed to deduct depreciation expense
24 II on an accelerated basis for income tax purposes, the amount of depreciation expense used as a
25 II deduction for income taxes purposes by Empire is considerably higher than the amount of
26 II depreciation expense used for ratemaking purposes. This results in what is referred to as a
27 II "book-tax timing difference," and creates a deferral of income taxes to the future. The net credit
28 II balance in the ADIT accounts reserve represents a source of cost-free funds to Empire.
29 II Therefore, Empire's rate base is reduced by the ADIT balance to avoid having customers pay a
Page 58
1 II return on funds that are provided cost-free to the Company. Generally, deferred income taxes
2 II associated with all book-tax timing differences that are created through the ratemaking process
311 should be reflected in rate base. Staff has taken this approach in calculating the ADIT rate base
4 offset amount in this case.
5 II The deferred tax impact associated with the following past tax timing differences were
6 II included in Staffs rate base offset: Accelerated Depreciation, Loss on Hedge Transactions,
7 II Gain on Hedge Transactions, License Software Amortization, Loss on Reacquired Debt,
8 II Ice Storm Expenses, Deferred Federal Tax Asset-Miscellaneous, Deferred Tax Liability-Iatan
911 Deferred Charges, Deferred Tax-ITC Tax Basis-Iatan, Contributions in Aid of Construction,
10 Post-retirement Benefits -Pensions, and Capitalized Interest.
11 II In December 2014, Congress passed a "tax extender" package which includes an
12 II extension of the availability of bonus depreciation benefits through the end of 2014. Bonus
13 II depreciation allows the utility to deduct capital investments more quickly than under normal
14 II accelerated tax depreciation allowances. The bonus depreciation benefit was scheduled to expire
15 II at the end of2013 and was not extended until recently. Staffs direct case does not reflect the tax
16 II impacts of bonus depreciation on Empire's accumulated deferred income tax rate base off-set
17 II amount since the extension occurred after the end of the update period of August 31, 2014. Staff
18 II will review the revenue requirement impact of bonus depreciation for calendar year 2014 during
19 II its true-up audit.
20 II Staff Expert/Witness: Kimberly K Bolin
21 II K. Vegetation Management Tracker Regulatory Asset
22 II The current tracker reflects under-recovery in the amount of $5,162,156 since the tracker
23 II started. Staff also calculated $901,619 as the difference between the vegetation management
24 II costs and Empire's rate recoveries of vegetation management costs from June 30, 2012 to
25 II August 31, 2014. Staff has included these amounts in its rate base, and has included an
26 II adjustment to amortize that amount to expense over a five-year period. Based upon Staffs
27 II analysis of the recent and projected costs associated with the Company's vegetation management
28 II activities in the current case, Staff is recommending that the current tracker continue at least until
29 II Empire's next rate case. The vegetation management costs have fluctuated monthly since
Page 59
1 II Empire's last rate case and do not appear to have stabilized. If these costs stabilize by the next
2 rate case, a termination of the current tracker will be considered.
3 II Staff Expert/Witness: Jermaine Green
4 L. Iatan and Plum Point Carrying Costs
5 1. Iatan 1
6 II Pursuant to Empire's regulatory plan approved in Case No. E0-2005-0263,
7 II Empire deferred certain "carrying costs" associated with the Iatan 1 AQCS investment past its
811 in-service date into Account 182308, Iatan Deferred Carrying Costs. (The deferral of carrying
9 costs after a project's in-service date is also known as "construction accounting"). In the
10 II Report and Order in KCPL's Case No. ER-2010-0355, the Commission disallowed certain costs
11 II that had been booked to the Iatan accounts. The effect of these disallowances reduces the
12 II balance of the Iatan 1 AQCS plant balance. In Empire's last rate case, No. ER-2012-0345, Staff
13 II removed any construction accounting allowances associated with the portion of Iatan 1 AQCS
14 II approved disallowances that were allocated to Empire from its rate base and expense
15 II amortization calculations. For this rate case, Staff used the balance in Account 182308 as of
16 II June 30, 2012, and the annual amortization expense included in Staff's Accounting Schedules in
17 II Case ER-2012-0345, to determine the unamortized balance as of August 31, 2014, for this item
1811 to include in rate base.
19 Staff Expert/Witness: Kimberly K. Bolin
20 II 2. Iatan 2
21 II Pursuant to Empire's regulatory plan approved by the Commission in Case No.
22 II E0-2005-0263, Empire deferred certain "carrying costs" associated with the Iatan 2 generating
2311 unit investment past its in-service date into Account 182332, MO Iatanii Df Chg
24 ER-2010-0130. In the Report and Order in KCPL's Case No. ER-2010-0355, the Commission
2511 disallowed certain costs that had been booked to the Iatan accounts. Staff has removed
26 any construction accounting allowances associated with the portion of Iatan 2 disallowances
27 II that were allocated to Empire from its rate base and expense amortization calculations. The
28 II balance of Iatan 2 carrying costs was also reduced by Empire's deferral of fuel and purchased
29 II power expense savings it has incurred due to the addition of Iatan 2 to its generating system from
Page 60

1 the unit's in-service date through June 30, 2012. For this rate case, Staff used the balance in
2 Account 182332 as of June 30, 2012 and the annual amortization expense included in Staffs
3 Accounting Schedules in Case ER-2012-0345 to determine the unamortized balance as of
4 II August 31, 2014, for this item to include in rate base.
5 Staff Expert/Witness: Kimberly K. Bolin
6 3. Plum Point
711 Pursuant to Commission approval of the Non-Unanimous Stipulation and Agreement and
8 Joint Proposal Regarding Certain Procedural Matters dated February 25, 2010, in Case No.
9 II ER-2010-0130, Empire deferred certain "carrying costs" associated with the Plum Point
10 II generating unit investment past its in-service date into Account 182331, MO PlumPt Df Chgs
11 II ER-2010-0130. Based on the results of its Construction Audit and Prudence Review for
1211 Plum Point (submitted in Case No. ER-2011-0004), Staff recommended one disallowance to
13 Empire's Plum Point plant balances. For this rate case, Staff used the balance in
14 II Account 182331 as of June 30, 2012, and the annual amortization expense included in Staffs
15 II Accounting Schedules in Case ER-2012-0345 to determine the unamortized balance as of
16 II August 31, 2014, for this item to include in rate base.
17 II Staff Expert/Witness: Kimberly K. Bolin
18 II 4. Iatan Carrying Costs Amortization
19 II Pursuant to earlier agreements, the Company deferred certain carrying costs (monthly
20 II debt and equity-derived carrying charges) and monthly deprecation for its Iatan 1 AQCS
21 II Account 182.308- Iatan Deferred Carrying Costs, Iatan 2 Account 182.332- MO Iatanii DfChg
22 II ER-2010-0130 and Plum Point Account 182331 - MO PlumPt Df Chgs ER-2010-0130. This
23 ~ deferral of carrying costs on the Iatan 1 AQCS, Iatan 2, and Plum Point investments was
24 II authorized under previous agreements, approved by the Commission. In Empire's last rate case,
25 II Staff recommended amortization of these carrying costs into cost of service using a composite
26 II amortization rate derived from dividing the total depreciation expense for each plant by the total
27 II plant balance for each plant. Staff used these composite rates and calculated amortization
28 II amounts of $84,729 for Iatan 1 AQCS, $44,828 for Iatan 2, and $1,987 for Plum Point. Staff
29 II used the same amortization amounts in this case.
30 II Staff Expert/Witness: Kimberly K. Bolin
Page 61

1 5. Southwestern Power Administration ("SWPA") Hydro Reimbursement
2 II On September 16, 2010, Empire received a payment in the amount of $26,563,700 from
3 II the Southwestern Power Administration ("SWP A"), to compensate Empire for the expected
4 II financial impact of a future reduction in capacity at its Ozark Beach hydroelectric plant.
5 II The reduction in capacity at Ozark Beach is due to the Energy and Water Development Act of
6 II 2006, federal legislation which requires a decrease in available head waters at Ozark Beach.
7 II In Case No. ER-2011-0004, Empire agreed to flow the SWPA payment back to the customers
8 II over a ten year period via a tracker mechanism. Staff has included as an offset to rate base the
9 II unamortized balance ofthis regulatory liability.
10 II Staff Expert/Witness: Kimberly K. Bolin
11 II VIII. Allocations
12 II A. Corporate Allocations
13 \\ As discussed earlier in this Report, Empire is engaged in both regulated and
14 II non-regulated business operations. Staff reviewed Empire's methods for assigning and
15 II allocating costs to its regulated electric, gas, and water operations, as well as to its various
16 II non-regulated operations. Under Empire's corporate cost allocation system, costs are either
17 II directly assigned by Empire to business units (Empire refers to this assignment as
18 II "direct billing"), indirectly allocated to the business units, or allocated through use of a
19 II general factor.
20 II Under the direct assignment approach, certain costs are directly assigned by Empire to its
21 II regulated electric operations by use of either vendor invoices or by labor charges. In the case of
22 II assignment by vendor invoice, each vendor invoice that includes charges for either goods and
23 II services that are a direct benefit to a specific business unit are directly assigned to the appropriate
24 II corresponding business unit. In the case of assignment by labor, employees are required to
25 II record their time electronically and to allocate such time based on the time each employee
26 II spends each month working on or for each business unit. Then, the system appropriately
27 II allocates a portion of that employee's salary to the appropriate business unit. The portion
28 II allocated to each business unit includes not only salary but also associated payroll taxes and
29 II fringe benefits.
Page 62

1 II Empire's indirect allocation factor is based upon a "unit of service method," which is
2 II employed by the Company in the event that incurred costs cannot be directly billed to the
3 II individual business units as described above. Empire uses the unit service method based on
4 II certain unit drivers. Examples of Empire's unit drivers are as follows: number of vouchers,
51 number of active customers, number of purchase orders and number of personal computers. An
6 allocation rate is then calculated based on information obtained from various general ledger
7 II entries and adjusted periodically.
8 II For costs that cannot be direct assigned or that have no unit drivers,
9 II a "Modified Massachusetts" formula is used. A "Massachusetts formula" is a general allocation
10 II factor based upon three (3) separate measurements of directly assigned costs, and which is used
11 II to allocate a company's common costs that cannot be reasonably directly 'assigned or indirectly
12 II allocated to a company's business units. The "Modified Massachusetts" formula used by
13 II Empire consists of the averages of (1) profit margin, (2) payroll and net property, and (3) plant
14 II and equipment.
15 II Staff reviewed Empire's methods for allocating costs among its different business units,
16 II and has concluded they are reasonable. However, Staff modified some of the various allocation
17 II factors to reflect Staffs adjusted numbers that were included in its cost of service. Please
18 II reference Staffs Exhibit Modeling System (EMS) that was filled with its cost of service report in
19 II this case for the allocation factors used by Staff.
20 II Staff Expert/Witness: Paul R. Harrison
21 II B. Jurisdictional Demand Allocations
22 II Jurisdictional allocation factors are used to allocate demand-related and energy-related
23 II costs to the applicable jurisdictions. Fixed costs, such as the capital costs associated with
24 II generation and transmission plant, are allocated on the basis of demand. Variable costs, such
25 II as fuel, are more appropriately allocated on the basis of energy consumption. In this case,
26 II demand-related and energy-related costs are divided among three jurisdictions: Missouri Retail
27 II Operations, Non-Missouri Retail Operations and Wholesale Opera,tions. The particular
28 II allocation factor applied is dependent upon the type of cost that is being allocated.
Page 63

1 1. Demand Allocation Factor
2 II Demand refers to the rate at which electric energy is delivered to a system to match
3 II the requirements of its customers ("load"), generally expressed in kilowatts (kWs) or
4 II megawatts (MW s ), either at an instant in time or averaged over a specified time interval.
5 II System peak demand is the largest electric requirement ("load") that occurs within a specified
6 II period oftime, (e.g. hour, day, month, season and year) on a utility's system. Since generation
7 II units and transmission lines are planned, designed, and constructed to meet a utility's anticipated
8 II system peak demands, plus required reserves, the contribution of each of Empire's three
9 II jurisdictions: Missouri Retail Operations, Non-Missouri Retail Operations and Wholesale
10 II Operations, coincident to the system peak demand, i.e., each jurisdiction's demand at the time of
11 II the system peak, is the appropriate basis on which to allocate these facilities. Thus, the term
12 II coincident peak (CP) refers to the load, generally in kWs or MWs, in each of the jurisdictions
13 II that coincides with Empire's overall system peak recorded for the time period in the
14 II corresponding analysis. Staff is utilizing a Twelve Coincident Peak (12 CP) methodology to
15 II determine demand allocation factors for Empire. Staff determined the demand allocation factor
1611 for each jurisdiction using the following process:
17
18 19
20 21
22
a.
b.
c.
Identify Empire's peak hourly load in each month for the time period September 2013 through August 2014 and sum the hourly peak loads.
Sum the particular jurisdiction's corresponding loads for the hours identified in a. above.
Divide b. by a. above.
23 II The result is the allocation factor for each jurisdiction:
24
25
26
27
Retail Operations:
Missouri-
Non- Missouri-
Wholesale Operations:
.8401
.1056
.0543
Page 64

1 2. Energy Allocation Factor
2 II Variable expenses, such as fuel, are allocated to the jurisdictions based on energy
3 II consumption. The energy allocation factor, for each individual jurisdiction, is the ratio of the
4 II normalized annual kilowatt-hour (kWh) usage of each particular jurisdiction to the total
511 normalized Empire kWh usage. The kWh usage data includes adjustments for anticipated
6 growth, annualizations and non-normal weather. Staff witnesses Ashley Sarver and Robin
7 II Kliethermes, respectively, provided the growth and annualization adjustments. Staff witness
8 II Seoung Joun Won provided the weather adjustments. Staff has calculated the following energy
911 allocation factors for the particular jurisdictions, utilizing the twelve month period ending
10 August 2014:
11 II Retail Operations:
12
13
14
Missouri-
Non- Missouri-
Wholesale Operations:
.8286
.1067
.0647
15 II Staff witness Paul R. Harrison used these demand and energy jurisdictional allocation factors in
16 II determining Staffs cost of service for Empire in this case.
17 II Staff Expert/Witness: Alan J Bax
18 II IX. Income Statement
19
20
A. Rate Revenues
1. Introduction
21 II Since the largest component of operating revenues results from rates charged to Empire's
22 II Missouri retail customers, a comparison of operating revenues with cost of service is
23 II fundamentally a test of the adequacy of the currently effective Missouri jurisdictional retail
24 II electricity rates. If the overall cost of providing service to Missouri retail customers exceeds
25 II operating revenues, an increase in the current rates that Empire charges to Missouri retail
26 II customers for electricity is appropriate.
Page 65
1 II One of the major tasks in a rate case is not only to determine whether a deficiency
2 (or excess) between cost of service and operating revenues exists, but also to determine the
311 magnitude of any sue~ deficiency (or excess): ~y de~cienc: (or ~xcess) ide.ntified can only be
4 made up (or otherwise addressed) by adjustmg Missoun retml rates (I.e., rate revenues)
511 prospectively, on a going-forward basis.
6 Staff Expert/Witness: Ashley R. Sarver
7
8
9
10
11
12
13
14
15
16
17
18
19
20
21
22
2~
2. Definitions
Operating Revenues are composed of Retail Rate Revenue and Other Operating Revenue.
Each is defined respectively as follows:
Retail Rate Revenue: Test year rate revenues consist solely of the revenues derived
from the current rates Empire charges for providing electric service to its Missouri retail
customers (i.e., native load and customer charges). Empire's charges are determined by
multiplying each customer's usage by the per unit rates established in its tariff. Empire's tariff
provides that different rates apply to different types of charges (demand vs. energy) and different
times of the year (summer vs. winter); and to customers in different rate classes (differentiation
by type and amount of use). Revenues from the Fuel Adjustment Clause (FAC) represent
collections or refunds of prior period fuel costs and are excluded in determining the annualized
level of ongoing rate revenues.
Other Operating Revenue:
the forfeited discounts, reconnect
miscellaneous charges.
Staff Expert/Witness: Ashley R. Sarver
This category includes revenues from such items as
charges, rent from electric property, and other
3. The Development of Rate Revenue in this Case
24 II The objective of this section is to determine normalized and annualized test year usage
25 II and revenues by rate class. The intent of the Staff's adjustments to test year Missouri usage and
26 II rate revenues is to determine the level of revenue that the Company would have collected on an
271 annual, normal-weather basis, based on information "known and measurable" at the end of the
28 update period.
Page 66

1 II The two major categories of revenue adjustments are known as "normalization" and
2 "annualization." Normalization adjustments eliminate the impact from revenues of test year
3 II events that are unusual and unlikely to be repeated in the years when the new rates from this case
4 II are in effect. Test year weather is an example of normalization. Annualizations are adjustments
5 II that re-state test year results as if conditions known at the end of the update period had
6 II existed throughout the entire test year. Adjustments for customer growth are an example of
711 an annualization.
8 Staff Expert/Witness: Ashley R. Sarver
9 4. Regulatory Adjustments to Update Period Usage and Rate Revenue
10 a. Update Period Adjustment
11 To provide a more current basis for normalization, annualization, and growth
12 calculations, Staff determined that usage data used to determine revenue in this case should be
13 II updated to reflect the 12 month period ending August 2014.
14 II Staff Experts/Witnesses: Robin Kliethermes and Brad J. Fortson
1511 b. Weather Normalization
16 In many of the classes of service, electricity consumption is highly responsive to the
17 II weather, specifically temperature. As the weather becomes hot and temperature increases the
18 II demand for additional cooling, air conditioning and fans, increases customers' consumption of
19 II electricity. As the weather becomes cold and temperature falls, the demand for additional
20 II heating, electric space heating for example, also increases customers' electricity consumption.
21 II Electric air conditioning and space heating is prevalent in Empire's service territory; therefore, it
22 II follows that Empire's electric load is linked and responsive to daily changes in temperature.
23 II Empire's test year ran from May 1, 2013, through April 31,2014. In an attempt to capture
24 II a more likely forward-looking indictor of non-weather related electricity usage per customer,
25 II Staff determined to use the most recent temperature and load data available and, therefore, based
26 II its analysis on an updated period of September 1, 2013, through August 31, 2014.
2711 October 2013 through March 2014 experienced temperatures colder than normal,
28 resulting in electric energy usage above that which would have been expected under normal
29 II weather conditions. July 2014 experienced temperatures more mild than normal resulting in
30 II usage below that which would have been anticipated under normal conditions. The temperatures
Page 67
1 II in the update period used by Staff deviated from normal, thus Staff performed a weather
2 !I impact analysis.
3 II Staff's model and methodology contained elements important in the class level weather
4 II normalization process: use of daily load research data to determine non-linear class specific
511 responses to changes in temperature with the incorporation of different base usage parameters to
6 account for different days of the week, months of the year and holidays. The results of Staff's
7 II analysis were provided to Staff witness Robin Kliethermes and Brad J. Fortson to be used in the
811 normalization of revenues for the weather sensitive classes: Residential ("RG"), Commercial
9 ("CB"), Small Heating (SH), Total Electric Building (TEB) and General Power (GP) classes.
10 II Staff did not weather normalize the Large Power (LP) Service class. The members of this
11 II class are not homogeneous and, consequently, a weather response function created for one
12 II member should not be applied to any other member, and individual LP customer hourly usage
13 II data is not available. Staff concludes it is both appropriate and necessary to annualize rather than
14 ~ normalize LP for changes in customer usage and count. Please see Large Power Annualization
15 II by Staffwitness Brad J. Fortson for a more detailed explanation of the annualization adjustments
1611 for the LP class.
17 Staff Expert/Witness: Seoung Joun Won, Ph.D.
1811 c. Weather Variables
19 Historical Data Used to Calculate Weather Variables- Each year's weather is unique;
20 II consequently, test year usage, hourly loads, revenue, and fuel and purchased power expense need
21 II to be adjusted to "normal" weather so that rates will be designed on the basis of normal weather
22 II rather than any anomalous weather in the test year. In the quantification of the relationship
23 II between test year weather and energy sales, Staff used weather observations of the Springfield
24 II Regional Airport ("SGF") in Springfield, Missouri for the update period, September 1, 2013,
25 II through August 31,2014.
26 II As a measure of "normal" weather, Staff used a 30-year period of "climate normals"
27 II ("normals") published by the National Climatic Data Center (NCDC) of the U.S. National
28 II Oceanic and Atmospheric Administration ("NOAA"). According to NOAA, a climate normal is
29 II defined as the arithmetic mean of a climatological element computed over three consecutive
Page 68

1 II decades.47
To conform to the NOAA's three consecutive decades for determining normal
2 temperatures, Staff used observed maximum and minimum daily temperatures for the 30-year
3 II period of January 1, 1981, through December 31,2010. Therefore, Staff bases its calculations on
4 II the time period of the most recent climate normals produced by NCDC. 48
511 Although the definition of normal· weather is relatively simple, the actual calculations
6 may be more complicated. Inconsistencies and biases in the 30-year time series of daily
7 II temperature observations occur if weather instruments are relocated, replaced, or recalibrated.
8 II Changes in observation procedures or in an instrument's environment may also occur during the
9 30-year period. NOAA accounted for these anomalies in calculating the normal temperatures it
10 published in July 2011.
11 Staff verified the adjustments for anomalies in the SGF time series by direct
1211 communication with NCDC, and through Staff's own review of the daily observations.
13 According to NCDC, the serially-complete monthly minimum and maximum temperature data
14 II sets have been adjusted to remove all inconsistencies and biases due to changes in the associated
15 II historical database. In addition, NCDC confirmed that the observed temperature data needs no
16 II adjustment in the period after 2001. Furthermore, Staff's review of NCDC's peer-reviewed,
17 II published paper49 that explains the meteorological and statistical soundness of the NCDC's
18 II monthly temperature series homogenization procedure for removing documented and
19 II undocumented anomalies, and found it to be statistically sound.
20 II Because Staff uses daily temperature observations to calculate normal weather values and
21 II NOAA's normals are monthly values, Staff adjusted the observed daily temperatures so that the
22 II monthly average temperature calculated from these adjusted daily values are the same as the
23 II NCDC's serially-complete monthly temperature time series. Staff derived the daily mean
24 II temperature time series, daily two-day weighted mean temperatures, and normal daily
25 II temperatures from these adjusted daily temperatures.
26 II Weather Variables - Because weather fluctuates greatly from day-to-day, the SGF
27 II temperature variables required to weather-normalize sales are the update period actual
47 Retrieved on June 27, 2014, http://www.ncdc noaa.gov/data-access/land-based-station-datalland-baseddatasets/climate-normals.
48 Retrieved on June 27, 2014, http://www.ncdc noaa.gov/data-access/land-based-station-datalland-baseddatasets/climate-normals/1981-20 1 0-normals-data.
49 Menne, M.J., and C.N. Williams, Jr., (2009) Homogenization of temperature series via pairwise comparisons. J. Climate, 22, 1700- I 717.
Page 69

temperatures and the 30-year normal two-day weighted daily mean temperatures. The day's
2 II daily mean temperature is generally defined as the simple average of the day's maximum daily
3 II temperature and minimum daily temperature. The daily two-day weighted mean temperature is
4 II calculated using the previous day's mean daily temperature with a one-third weight and the
5 II current day's mean daily temperature with a two-thirds weight.50
6 II This was done because in the Empire service area, yesterday's weather effects how
7 II electricity is used today. This is likely due to heat retention by the structures in the service area.
8 II For example, if today's temperature is mild, but yesterday's temperature was hot and the
9 II air conditioner was on, it is likely that the air conditioner will also be used today. Similarly,
10 II ifyesterday's temperature was mild and air conditioning was not used, then if today's
11 II temperature is warmer, air conditioning may not be used until later in the day. Staff used the
12 II SGF daily two-day weighted mean temperature data series to normalize both class usage and
13 ! hourly net system loads.
14 II Calculation of "Normal Weather" - Staff used a ranking method to calculate normal
15 II weather estimates of daily normal temperature values, ranging from the temperature that is
16 I "normally" the hottest to the temperature that is "normally" the coldest, thus estimating "normal
17 II extremes." Staff ranked the two-day weighted temperatures for each year of the 30-year history
18 II from hottest to coldest and then calculated the normal daily temperature values by averaging the
19 II ranked two-day weighted mean temperatures for each rank, irrespective of the calendar date.
20 II This results in the normal extreme being the average of the most extreme temperatures in
21 II each year of the 30-year normals period. The second most extreme temperature is based on the
22 II average of the second most extreme day of each year, and so forth. Staff's calculation of daily
23 II normal temperatures is not the same as NOAA's calculation of smoothed daily normal
24 ! temperatures. Because the test year temperatures do not follow smooth patterns from day to day,
25 II Staff calculated normal daily temperatures based on the rankings of the actual temperatures of
26 II the update period.
27 II Staf!Expert!Witness: SeoungJoun Won, Ph.D.
50 To calculate the Dth day's two-day weighted mean temperature (TWMT0 ), the current day's (D) daily mean temperature (DMT0 ) is averaged with the prior day's (D-1) daily mean temperature (DMTo.1), applying a 2/3 weight on the current day and 113 weight on the prior day: TWMT0 = (2/3) DMT0 + (1/3) DMT0 . 1
Page 70
1 II d. Weather Normalization of Usage and Revenue
2 Usage and revenue were normalized for the RG, CB, SH, TEB, and GP rate classes, after
3 II billing adjustments were applied.
4 II Staff applied a regression to model the relationship between average use per customer
511 and the percentage of update period usage that were priced in the first rate block for rate classes
6 RG, CB and SH. This relationship was then applied to the monthly use per customer before
711 and after the weather adjustment, using the normalization factors that Staff witness Seoung
8 Joun Won had provided. This computation resulted in normalized usage by rate block, which
911 were then converted to total normalized revenues by multiplying rate block usage by the
1 0 appropriate rates.
11 II The GP and TEB class billing units were further subdivided by voltage with separate
12 II regression models and weather adjustments being applied to each voltage level.
13 II Staff Experts/Witnesses: Robin Kliethermes and Brad J. Fortson
14 II e. 365-Days Adjustment to Revenue
15 II Calendar months and revenue months differ from one another because the time periods
16 II they cover begin and end differently. Calendar months coincide with the calendar, beginning on
17 II the first day of the month and ending on the last day of the month. Revenue. months are an
18 II aggregation of bill cycles and begin on the first day of the first billing cycle and end on the last
19 II day of the last billing cycle. This aggregation of bill cycles may or may not coincide with a
20 II 365 day calendar year. In order to account for this difference, a "days adjustment" to convert the
21 II annual weather normalized revenue month usage to equate with the annual weather normalized
22 II calendar month usage was calculated. The adjustment was made to the update period months in
23 II proportion to the actual usage occurring in each month and then appropriate rates were applied to
24 II determine the revenue adjustment.
25 II For Missouri Large Power, rate revenue and usage is measured by revenue month
26 II (the period of time over which the staggered bill cycles result in each customer being billed
27 II precisely once) rather than by calendar month. The difference between total usage days during
28 II the update period and 365 days gives us the days adjustment.
29 II Staff Experts/Witnesses: Robin Kliethermes and Brad J. Fortson
Page 71
1 II f. Missouri and Non-Missouri Large Power (LP) and Feed Mill & 2 Grain Elevator Service (PFM) Annualizations
3 II Staff determined annualized, normalized update period usage and revenues for the rate
4 II classes LP and PFM on an individual customer basis.
5 II The adjustments are for the update period of September 1, 2013- August 31, 2014. There
6 II were 38 customers in the Missouri LP rate class during the update period.
7 II Because each LP customer uses significant amounts of electricity, and the class is
8 II heterogeneous in electric use and load factor, class sales and revenues were annualized on an
9 II individual customer (account) basis. Each Missouri LP customer's individual monthly demand
10 II and energy use, measured over multiple years prior to the update period and the 12 months of the
11 II update period, were examined graphically to determine whether an adjustment was needed.
12 II Out of the 38 Missouri LP customers, one LP customer's load was adjusted. Additionally,
13 II one customer left the LP class permanently and one customer entered the LP rate class, therefore
14 II those customer's loads were annualized to reflect the loss and gain.
15 II Also, within the LP class there were customer expansions and contractions to account for
16 II through the update period. Three customer's loads were adjusted and annualized based off
17 II Empire data and Staff analysis.
18 II The thirteen Non-Missouri LP customers were also annualized on an individual customer
19 II (account) basis.
20 II Staff Expert/Witness: Brad J Fortson
21 II g. Adjustments for Non-Missouri classes
22 II Staff adjusted the RG, CB, SH, TEB, and GP classes' usage for non-Missouri customers
23 II for weather to provide normalized kWh and for the days adjustment. These adjusted usages were
24 II provided to the Staff auditors for growth, and to Staff witness Shawn E. Lange for inclusion in
25 II Net System Input, and to Staffwitness Alan J. Bax for inclusion in jurisdictional allocations.
26 II Staff Expert/Witness: Brad J Fortson
27 II h. Rate Switching
28 II During the update period, excluding residential customers, approximately 107 customers
29 II switched rate classes. Table 1, below shows a summary of the number of customers that
Page 72

1 II switched between classes. Large Power customers were analyzed separately and are not shown in
211 Table 1, below.51
3
4
5
6
Table 1: Update Period Rate Switchers Number of Customers 2013 2014 Rate Sep Oct Nov Dec Jan Feb Mar Apr May Residential RG 0 0 0 0 0 0 0 0 0 Commercial CB 80 80 79 80 76 -1 1 1 1 Small Heating SH 27 27 26 25 24 0 0 0 0 General Power GP -83 -83 -82 -83 -79 0 -2 -2 -2 Tot. Elec. Bldg. TEB -24 -24 -24 -23 -22 0 0 0 0
Billing data indicated that the customers represented in Table 1, switched rate classes for
economic reasons rather than for changes in load. Customers who switched between classes due
7 II to changes in load were annualized through the customer growth adjustment. The overall effect
8 II of rate switching on usage nets to zero (one class' increase exactly equals the other class'
9 II decrease), however the overall effect of rate switching is a slight decrease to revenue.52
10 II Those customers who switched into and out of each of these classes were handled
11 separately. The billing units and revenues of these customers were removed from their original
12 II rate code and their usage was added to their final rate code where it was re-priced to match rates
1311 in the final rate code.
14 Staff Experts/Witnesses: Robin Kliethermes and Brad J. Fortson
15 II i. Customer Growth (Annualization)
16 II Staff made customer growth adjustments to test year kWh sales and rate revenue to
1711 reflect the additional kWh sales and rate revenue that would have occurred if the number of
18 customers taking service at the end of the update period (August 31, 20 14) had existed
19 II throughout the entire test year. Customer growth was calculated for the RG, CB, SH, TEB, and
20 II GP customer classes.
21 The only retail customer rate classes for which this approach is not taken is the
22 II Large Power (LP) group and the Feed Mill & Grain Elevator Service (PFM) group. The process
51 One customer moved from LP to GP and one moved from GP to LP. 52 The customer who moved from GP to LP shows up as a negative to the GP class, but since the LP class is
not shown in Table I, there is not an offsetting positive. The customer, who moved from LP to GP, moved due to a change in load and therefore, is not represented in Table I.
Page 73
1 II used for the LP and PFM rate classes are described in the above subsection f. of the Report.
2 II The Staff's customer growth adjustment to test year revenues for all retail customer groups
311 combines the results of the analysis described above for RG, CB, SH, TEB, and GP in order to
4 provide the annualized level of sales and revenues at August 31, 2014.
5 II Staff Expert/Witness: Ashley R. Sarver
6 II j. Annualization of Excess Facility Charge Revenues
7 II These revenues result from charges to customers for facilities provided in excess of the
8 II facilities normally made available to similarly sized customers. These revenues are annualized
911 for changes during the update period in the facilities provided to determine the revenue that
1 0 would have been earned had these facilities been in use the entire update period.
11 II Staff Expert/Witness: Brad J. Fortson
12 II k. Praxair and Special Contract Revenue Imputation
13 II Staff reviewed Praxair on an individual customer basis. After reviewing the
14 II Update Period data for Praxair, Staff determined that no annualization adjustment was required
15 II for that customer. The special treatment of the interruptible credits associated with Special
16 II Transmission Service Contract: Praxair, Schedule SC-P continues effective through the
1711 Update Period; however, revenues were imputed as if the contract did not exist to prevent harm
18 to other ratepayers.
19 II Staff Expert/Witness: Sarah L. Kliethermes
20 5. Other Revenues
21 II a. FAC Revenues
22 Staff removed from the Fuel Adjustment Clause (FAC) revenues from the Company's
23 II test year. This adjustment is made because this revenue will now be collected in base rates rather
24 II than through the F AC.
25 II Staff Expert/Witness: Ashley R. Sarver
26 b. Unbilled Revenues
27 Staff has eliminated unbilled revenue from its determination of revenue requirement to
28 ensure only 365 days of revenue are included and to reflect revenues on an "as billed" basis.
29 The recording of unbilled revenue on the books of the Company recognizes sales of electricity
Page 74

1 II that have occurred, but have not yet been billed to the customer. Therefore, it is necessary for
2 II Staff to remove unbilled revenue in order to reach an accurate revenue requirement based upon
3 II electricity sales billed to and revenues collected from Missouri customers.
4 II Staff Expert/Witness: Ashley R. Sarver
5 II c. Gross Receipts Revenues
6 II For this item, Empire acts merely as a collecting agent and remits the taxes collected
7 II from customers to the appropriate taxing entities. The Gross Revenue Taxes (GRT); also known
8 II as city franchise taxes, included on a customer's bill are collected by the Company and remitted
9 II to the appropriate taxing authority. The GRT included on a customers' bill is recorded as revenue
10 II on the books of the Company, with a corresponding charge booked to GRT expense.
11 II Theoretically, the revenue and expense offset one another and, therefore, have no effect on net
12 II income. GRT are reported as both a revenue and expense item on Empire's books. Staff has
13 II made adjustments to eliminate both the revenue and expense associated with GRT.
14 II Staff Expert/Witness: Ashley R. Sarver
1511 d. 802 Allowances
16 On January 18, 2005 the Commission approved the Unanimous Stipulation
17 II and Agreement relating to Empire's "S02 Allowance Management Policy ("SAMP")" in Case
18 II No. E0-2005-0020 ("2005 Agreement"). In this document, the parties agreed that Empire
19 II should be allowed to manage its sulfur dioxide emissions allowance inventory according to the
20 II SAMP as detailed in the 2005 Agreement. In this case, Case No. ER-2014-0351, the Staff is not
21 II proposing an adjustment to S02 Allowances.
22 II 802 Allowances are currently reflected in Empire's PAC calculations and the Staff
2311 recommends that this treatment continue.
24 Staff Expert/Witness: Ashley R. Sarver
25 II e. Renewable Energy Credits (REC)
26 II In 2005, Empire began receiving wind energy from Elk River Wind farm pursuant to a
27 II contract. In addition, Empire began receiving wind energy from Cloud County Wind Farm in
28 II 2008, also pursuant to contract. Empire is currently receiving wind energy from both of these
29 II entities to meet its customers' energy demand. As a result of these contracts, Empire receives
30 II Renewable Energy Credits or Certificates (RECs), which are credits issued under the
Page 75

1 II Center for Resource Solutions' "green-e" program to certify that one megawatt-hour of
2 II electricity has been generated by a facility engaged in the production of renewable energy, such
3 II as wind, solar or biomass. RECs are tradable and can be bought and sold. Staff made an
4 II adjustment to remove non-Missouri jurisdictional accounts.
5 Staff Expert/Witness: Ashley R. Sarver
6 f. Water Revenues
7 Empire recoded electric revenues amounts that relate to reconnect charges, trip charges,
8 II late fees, return check fees associated with Empire's water business. Staff has eliminated the test
9 II year water revenue related amounts from the revenue requirement in this case.
10 II Staff Expert/Witness: Ashley R. Sarver
11 II g. Coal Fly Ash Revenues
12 II "Coal fly ash" is a byproduct created as a result of the burning of coal in generating
13 II stations to produce electricity. Fly ash has a number of possible industrial uses, primarily as an
14 II ingredient in concrete products. Depending on where and how it is used, concrete requires
15 II varying specifications for its ingredients. Over the past several years, Empire has been selling its
16 II fly ash to several different industrial companies to be used in concrete. By recycling fly ash,
17 II Empire not only receives a profit, but also provides positive environmental benefits. During the
18 II test year, Empire collected $64,826 of revenue for the sale of this product. Staff used a five-year
1911 average to normalize coal fly ash revenues in this case and made an adjustment of $7,148 to the
20 test year amount.
21 II Staff Expert/Witness: Paul R. Harrison
2211 h. Miscellaneous Revenues
23 Empire's miscellaneous other revenues consist of provisions for rate refunds, forfeited
24 II discounts, rents from property, reconnect, and surge arrester fees.
25 II Staff's analysis reflected a review of these revenue levels over a five year period
26 II including the test year ending April 30, 2014. Based upon Staff's review, the miscellaneous
27 II revenue levels at a twelve-month period ending April30, 2014 appear reasonable for inclusion in
28 II customer cost of service, except for the provision of rate refunds. Staff made an adjustment to
29 II remove the provision for rate refunds recorded by Empire from the test year, because it is not
30 II within Missouri's jurisdiction.
31 II Staff Expert/Witness: Ashley R. Sarver
Page 76

1
2
B. Southwest Power Pool (SPP) Revenues and Expenses
1. SPP Transmission Revenues
3 II Empire receives revenues from the Southwest Power Pool (SPP) to reimburse it for its
4 II costs associated with transmission of electricity to other SPP members. Staff reviewed the
5 II monthly amount of revenues received from SPP since November 2010 for any trends in the data
6 II which would indicate that a revenue amount other than the test year revenue would be
7 II appropriate to include in the cost of service. Staffs review indicates that the amount of SPP
8 II revenues received in the period of March 2014 through August 2014, which is the end of the
9 II update period in the case, is the most appropriate revenue to use to normalize the SPP
10 II transmission revenues.
11 II Staff Expert/Witness: Kimberly K. Bolin
12 2. SPP Transmission Expenses
13 II The SPP is a not-for-profit, regional transmission organization (RTO) which maintains
14 II functional control over the transmission assets of its members and provides transmission service
15 II through its FERC approved open access transmission tariff (OATT). SPP' s costs must be
16 II recovered from its member companies, including Empire. Staff recommends that the most
17 II current data, for the six months ending August 31, 2014, be used in determining the SPP
18 II annualized transmission expense amount to reflect in Empire's cost of service.
19 II Staff Expert/Witness: Kimberly K. Bolin
20 II 3. Ancillary Services Market Revenue and Expense
21 II Empire began participating in SPP's Ancillary Services Market (ASM) in March 2014.
22 II Empire entered the ASM to acquire ancillary services for its retail load and also to be able to
23 II provide the services to other SPP members when available from its own generation. Staff has
24 II annualized test year ASM revenue and expense levels by using data for the 6 months of
25 II March 2014 through August 2014, which is the end of the update period in this case. Staff
26 II will continue to review Empire's ASM transactions as additional information becomes available
27 II through the true-up period.
28 II Staff Expert/Witness: Kimberly K. Bolin
Page 77

4. Miscellaneous SPP Related Revenues and Expenses
2 II Empire also received certain miscellaneous revenues and incurred expenses as a result of
311 participating in SPP's Integrated Market beginning in March 2014. Staff has annualized these
4 revenues and expenses by using data for the 6 months of March 2014 through August 2014,
5 which is the end of the updated period in this case. Staff will continue to review these
6 miscellaneous revenues and expenses as additional information becomes available through the
7 true-up period.
8 II Staff Expert/Witness: Kimberly K. Bolin
9 5. Off-system sales revenue and expense
10 II Off-system sales (OSS) is the difference in value between the excess energy Empire sells
11 II through the SPP Integrated Market (IM) and the energy that Empire purchases through the IM to
12 II serve native load. Prior to March 2014, Empire's OSS activities were transacted in the SPP's
1311 Energy Imbalance Service (EIS). The EIS was deactivated when the IM was introduced. Staff
14 made adjustments to remove OSS revenues and expenses incurred through the EIS market during
15 II the test year. In Staffs fuel run, Empire generated $14.6 million sales and purchased
16 II $38.1 million of energy through the IM to result in a net purchased power expense of
17 II $23.6 million.
18 II Staff Expert/Witness: Paul R. Harrison
19 II C. Fuel and Purchased Power
20 II Staffs adjustments to annualize and normalize Empire's fuel expense are reflected
21 II in Accounting Schedule 10, Adjustments to Income Statement.
22 ~ Staff Expert/Witness: Paul R. Harrison
23 II 1. Fixed Costs
24 II Staff does not include fuel and purchased power costs that do not vary directly with fuel
25 II burned in its fuel model. These costs are determined separately. The non-variable fuel costs
26 II included in fuel expense are typically referred to as fuel adders, described in the section below.
27 II The non-variable purchased power costs are referred to as capacity charges and these costs are
2811 annualized separately from purchased power energy costs.
29 Staff Expert/Witness: Paul R. Harrison
Page 78

1 II a. Fuel Adders
2 II The costs of fuel adders are determined separately from fuel model costs and are added to
311 the level of fuel expense calculated by the model to determine overall fuel expense. The fuel
4 adders in this case are natural gas transportation costs and freeze treatment costs for coal
511 deliveries. Staff annualized the natural gas transportation expense based on Empire's current
6 contractual obligations with Southern Star which began on January 1, 2010. In regard to freeze
7 II treatment costs, all Powder River Basin (PRB) western coal delivered by rail to Asbury may be
8 II subject to being sprayed with a side release for freeze conditioning during the winter months.
9 II However, Staff could not confirm the treatment was being applied consistently in order to
10 II determine an annualized cost. Therefore, Staff used the actual costs for freeze treatment incurred
11 II in the test year to add to the total fuel costs.
12 II Staff Expert/Witness: Paul R. Harrison
13 II b. Purchased Power- Capacity Charges
14 II In addition to its ownership interest in the Plum Point unit through Plum Point Energy
15 II Associates, LLC, Empire has contracted for a reservation of 50 MW capacity from Plum Point
16 II through a purchased power contract. For this 50 MW of power, Empire pays for a fixed
17 II component and an energy component. The fixed amounts Empire pays are referred to as
18 II capacity charges. Generally, there is an amount for Plum Point operation and maintenance costs
19 II included within the energy charge. The fixed component is paid as a "demand charge,"
20 II generally on a monthly basis, regardless of the level of power actually purchased. This amount
21 II is for the "right" to purchase the power in much the same way that natural gas utilities purchase
22 II reservation of capacity from pipelines through reservation payments. The demand charges are
23 II intended to cover part of the fixed expenses of operating a generating facility.
24 II Staffs adjustment to purchased power expense in this case annualizes demand charges
25 II for Empire's Plum Point Purchase Power Agreement.
26 II Staff Expert/Witness: Paul R. Harrison
2711 c. Fuel Prices
28 Generally, Staff computed its level of fuel expense using prices and quantities contracted
29 II by Empire for delivery in 2015, including prices and quantities agreed to in fuel contracts that
30 II will become effective as of January 1, 2015 (with one exception described in the "Coal Prices"
Page 79

1 II section below) and for current freight contracts. These fuel prices included prices for coal,
2 II natural gas, and oil, as well as associated transportation charges.
3 Staff Expert/Witness: Paul R. Harrison
4 i. Coal Prices
5 Staff determined its coal price by generation facility based on a review and analysis of
6 II Empire's current coal purchase and coal transportation contracts. Staff's recommended PRB
7 II coal prices reflect Empire's actual contracted coal purchase prices in effect at January 1, 2015
8 II and a 12-month average of transportation costs incurred through the update period, August 31,
9 II 2014. Staffs local bituminous coal price reflects Empire's actual contracted coal purchase price
10 II in effect at January 1, 2015. For the Plum Point unit, Staffs recommended coal prices reflect the
11 II actual contracted coal purchase and transportation prices in effect for 2015. For the Iatan 1 and 2
12 II units, Staffs recommended coal prices reflect KCPL's projected weighted average contracted
13 II coal purchase and transportation prices for 2015.
14 II Staff Expert/Witness: P au! R. Harrison
1511 ii. Natural Gas Prices
16 The natural gas price recommended in this case by Staff of $4.03 per MMBtu
17 II is composed of two components: hedged and non-hedged (spot) prices. Staff calculated the
18 II non-hedged component of natural gas prices using an eighteen-month weighted average of
19 II Empire's actual commodity cost of natural gas purchased on the spot market during the eighteen
20 II months ending August 28, 2014. The weighted average price for the non-hedged component is
21 II $4.136 per MMBtu. Staff calculated the hedged component of natural gas costs by applying a
2211 weighted average for the actual hedged purchases contracted for at August 31, 2015, that is
23 II applicable to Empire's forecasted gas needs for the twelve months ending August 31, 2015. The
24 II weighted average price for the hedged component is $3.983 per MMBtu. Staff weighted the
25 II hedged gas price at 69% of its overall gas price recommendation, as Empire has contracted to
26 II meet approximately 69% of its projected natural gas usage from September 30, 2014 through
27 II August 31, 2015, with hedged gas supplies. Empire's natural gas transportation costs are
28 II annualized and normalized separately as a part of fuel adders.
29 II As noted above, a substantial amount of Empire's natural gas purchases for its electric
30 II operations are hedged in advance, with a smaller percentage of such purchases obtained from the
31 II spot market. Empire's current policy governing its hedging of natural gas purchases dates back
Page 80

1 II to the early to middle years of the last decade, when natural gas prices were highly volatile.
2 II In the last five to six years, natural gas prices have generally become less volatile in nature.
3 II However, during the months of February and March 2014, natural gas prices spiked due to the
4 II increase in demand and the decrease in natural gas reserves caused by unusually cold weather.
5 II (the "polar vortex"). Therefore, Staff used a 18-month average of the spot purchased of natural
6 II gas to normalize this cost in this case to mitigate the abnormality in the test year data for natural
7 II gas prices.
8 II Staff Expert/Witness: Paul R. Harrison
911 iii. Fuel Oil Prices
10 Staff used a weighted average price of 2,371.28 cents per MMBtu to determine the
11 II fuel oil cost input in the fuel model in this case. Staff calculated this weighted average price
12 II by: (1) converting each month's number of barrels purchased over a 13-month period into
13 II gallons; (2) dividing a total month's purchase in gallons by that month's total purchase costs to
14 II derive an average monthly price per gallon; (3) summing the totals for the 13-month period to
15 II calculate a weighted 13-month average cost per gallon which, in this case, is $3.230288; and
16 II ( 4) converting this per gallon price into the cents per MMBtu, 2,317 .28. Empire burns fuel oil
17 II mainly as a secondary fuel or, in some instances, for flame stabilization. Empire does maintain
18 II onsite storage at its various facilities in sufficient capacity that only occasional purchases are
19 II necessary. As a result, Empire does not contract for or hedge oil costs.
20 II Staff Expert/Witness: Paul R. Harrison
21 II 2. Losses
22 System energy losses largely consist of the energy losses that occur in the
23 II electrical equipment (e.g., transmission and distribution lines, transformers, etc.) between
24 II Empire's generating sources and its customers' meters. In addition, small, fractional amounts of
25 II energy that is either diverted (stolen) or unmetered (unmetered usage) are included as system
26 II energy losses.
27 II The basis for calculating system energy losses is that Net System Input (NSI) equals the
28 II sum of "Retail Sales" + "Wholesale Sales" and "System Energy Losses." This can be expressed
29 II mathematically as:
30 II NSI = Retail Sales + Wholesale Sales + System Energy Losses
Page 81

1 II NSI, Retail Sales and Wholesale Sales are known quantities; therefore, system energy losses may
2 II be calculated as follows:
3 ~ System Energy Losses= NSI- (Retail Sales+ Wholesale Sales)
4 II The system energy loss percentage is the ratio of system energy losses to NSI multiplied by 100:
5 II System Energy Loss Percentage = (System Energy Losses + NSI) X 1 00
6 II NSI is also equal to the sum of the Company's net generation and net interchange.
7 II Net interchange is the difference between off-system purchases and off-system sales.
8 II Net generation is the total energy output of each generating plant minus the energy consumed
9 II internally to enable the production of electricity at each plant. The output of each generating
10 II plant is monitored and metered continuously. The net of off-system purchases and off-system
11 II sales (Net Interchange) is also similarly monitored.
12 II Staff calculated the loss percentage of Empire's system, for the twelve months ending
13 II August 2014, as 6.34% ofNSI. Staff witness Seoung Joun Won used this loss percentage in the
14 II development ofhourly loads used in Staffs fuel model.
15 II Staff Expert/Witness: Alan J. Bax
16 II 3. Variable Costs
17 II Staff estimates Empire's variable fuel and purchased power expense to be $120,431,495
18 II for the twelve months ending August 31, 2014.
19 II Staff uses the Plexos production cost model to perform an hour-by-hour chronological
20 II simulation of a utility's generation and power purchases. Staff uses this model to determine
21 II annual variable cost of fuel and net purchased power energy costs and fuel consumption
22 II necessary to economically meet a utility's load within the operating constraints of the utility's
23 II resources used to meet that load. These amounts are supplied to Staff auditors who use this input
24 II in the annualization of fuel expense.
25 II Staff used market prices in its fuel model dispatch to simulate Empire's operations in
26 II the SPP's IM. The price for energy in the IM dictates the amount of energy Empire sells in the
27 II IM, so Staff's fuel run dispatches Empire's generation to match Empire's load, which simulates
28 II how the SPP would dispatch if that generation was being dispatched into the SPP IM based on
29 II prices set by the SPP's regional load requirements.
Page 82
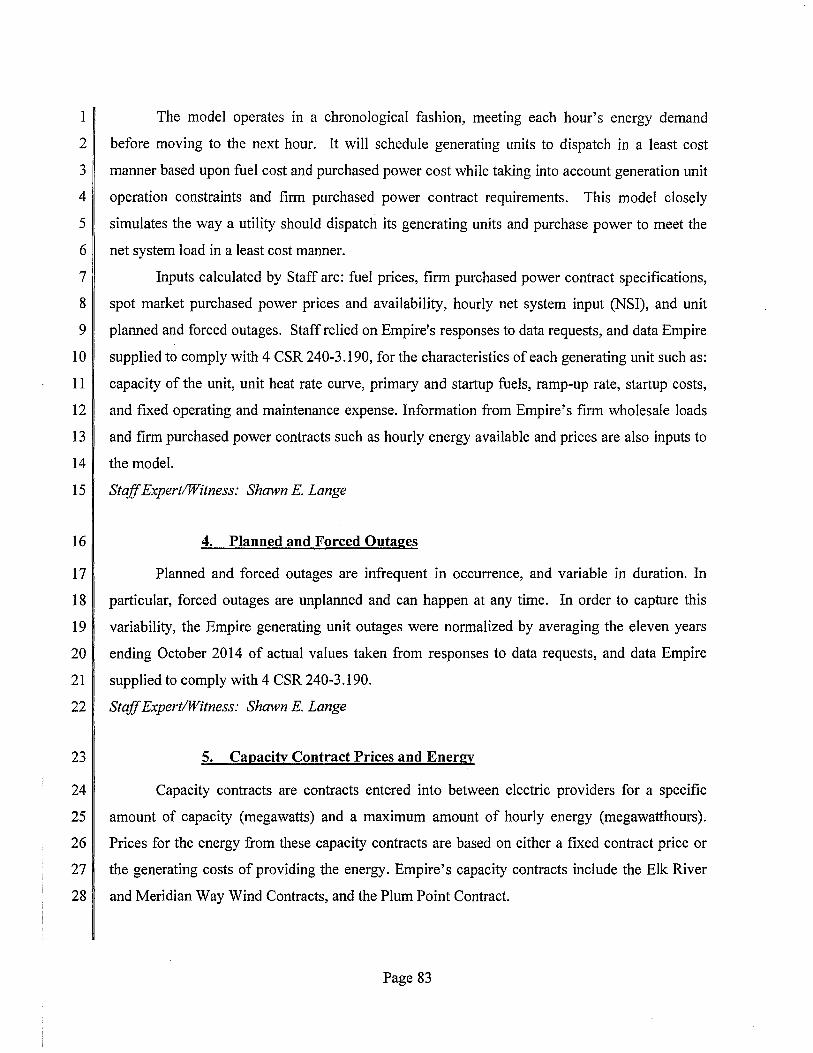
1 II The model operates in a chronological fashion, meeting each hour's energy demand
2 II before moving to the next hour. It will schedule generating units to dispatch in a least cost
311 manner based upon fuel cost and purchased power cost while taking into account generation unit
4 operation constraints and firm purchased power contract requirements. This model closely
5 II simulates the way a utility should dispatch its generating units and purchase power to meet the
6 II net system load in a least cost manner.
7 II Inputs calculated by Staff are: fuel prices, firm purchased power contract specifications,
8 II spot market purchased power prices and availability, hourly net system input (NSI), and unit
9 II planned and forced outages. Staff relied on Empire's responses to data requests, and data Empire
10 II supplied to comply with 4 CSR 240-3.190, for the characteristics of each generating unit such as:
11 II capacity of the unit, unit heat rate curve, primary and startup fuels, ramp-up rate, startup costs,
12 II and fixed operating and maintenance expense. Information from Empire's firm wholesale loads
13 II and firm purchased power contracts such as hourly energy available and prices are also inputs to
14 II the model.
15 II Staff Expert/Witness: Shawn E. Lange
16 4. Planned and Forced Outages
17 II Planned and forced outages are infrequent in occurrence, and variable in duration. In
18 II particular, forced outages are unplanned and can happen at any time. In order to capture this
19 II variability, the Empire generating unit outages were normalized by averaging the eleven years
20 II ending October 2014 of actual values taken from responses to data requests, and data Empire
21 II supplied to comply with 4 CSR 240-3.190.
22 II Staff Expert/Witness: Shawn E. Lange
23 5. Capacity Contract Prices and Energy
24 II Capacity contracts are contracts entered into between electric providers for a specific
25 II amount of capacity (megawatts) and a maximum amount of hourly energy (megawatthours).
26 II Prices for the energy from these capacity contracts are based on either a fixed contract price or
27 II the generating costs of providing the energy. Empire's capacity contracts include the Elk River
28 II and Meridian Way Wind Contracts, and the Plum Point Contract.
Page 83

1 II Empire's actual hourly contract transaction prices were obtained from the data Empire
2 II supplied to comply with 4 CSR 240-3.190 and were used by the Staff to calculate each contract's
3 II average monthly prices.
4 II Staff Expert/Witness: Shawn E. Lange
511 a. Normalized Net System Input
6 Hourly net system input is the hourly electric supply necessary to meet the hourly energy
7 II demands of the utility's customers and is net of (i.e., does not include) station use, which is the
8 II electricity requirement of the utility's generating plants.
9 II Due to the presence of significant air conditioning and electric space heating in Empire's
10 II service territory, the magnitude and shape of Empire's net system input is directly related to
11 II daily temperatures. To normalize net system input Staff used actual and normal daily
12 II temperatures provided by Staff witness Seoung Joun Won in its analysis. The actual daily
13 II temperatures for the modified year period differed from normal daily temperatures. Therefore,
14 II to reflect normal weather, daily peak and average net system loads are each adjusted
15 II independently, but using the same methodology.
16 II Daily average load is the summation of the hourly load for the day divided by
17 II twenty-four hours and the daily peak is the maximum hourly load for the day. Staff uses
18 II separate regression models to estimate both a base component, which is allowed to fluctuate
19 II across time, and a weather sensitive component, which measures the response to daily
20 II fluctuations in weather for daily average loads and peak loads. Independent regression models
21 II are necessary because daily average loads respond differently to weather than peak loads. The
22 II model's regression parameters, along with the difference between normal and actual cooling and
23 II heating measures, are used to calculate weather adjustments to both the average and peak loads
24 II for each day. The adjustments for each day are added respectively to the actual average and to
25 II the peak loads of each day. The starting point for allocating the weather-normalized daily peak
26 II and average loads to the hours is the actual hourly loads for the year being normalized.
27 II A unitized load curve is calculated for each day as a function of the actual peak and average
28 II loads for that day. Staff uses the corresponding weather normalized daily peak and average
29 II loads, along with the unitized load curves, to calculate weather normalized hourly loads for each
30 II hour of the year.
Page 84
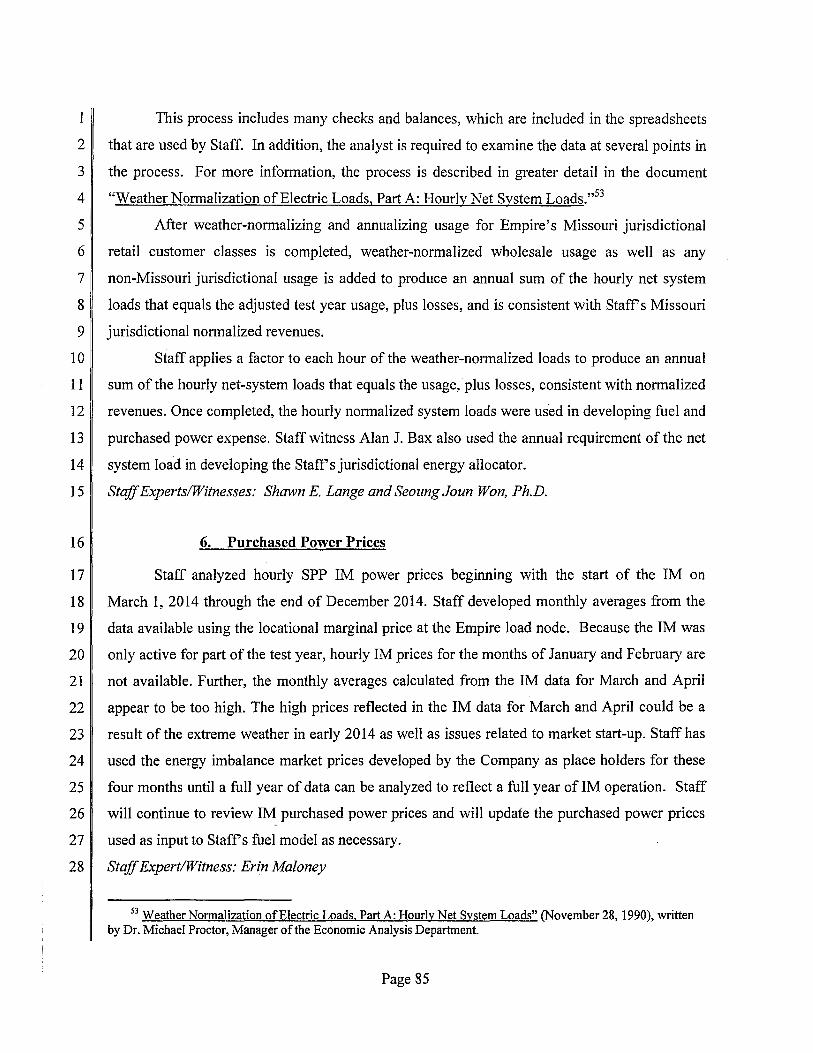
1 II This process includes many checks and balances, which are included in the spreadsheets
2 that are used by Staff. In addition, the analyst is required to examine the data at several points in
3 II the process. For more information, the process is described in greater detail in the document
4 II "Weather Normalization of Electric Loads, Part A: Hourly Net System Loads."53
5 ~ After weather-normalizing and annualizing usage for Empire's Missouri jurisdictional
6 II retail customer classes is completed, weather-normalized wholesale usage as well as any
7 II non-Missouri jurisdictional usage is added to produce an annual sum of the hourly net system
8 II loads that equals the adjusted test year usage, plus losses, and is consistent with Staffs Missouri
9 II jurisdictional normalized revenues.
10 II Staff applies a factor to each hour of the weather-normalized loads to produce an annual
11 II sum of the hourly net-system loads that equals the usage, plus losses, consistent with normalized
12 II revenues. Once completed, the hourly normalized system loads were used in developing fuel and
13 II purchased power expense. Staff witness Alan J. Bax also used the annual requirement of the net
14 II system load in developing the Staffs jurisdictional energy allocator.
15 II Staff Experts/Witnesses: Shawn E. Lange and Seoung Joun Won, Ph.D.
16 II 6. Purchased Power Prices
1 7 II Staff analyzed hourly SPP IM power prices beginning with the start of the IM on
18 II March 1, 2014 through the end of December 2014. Staff developed monthly averages from the
19 II data available using the locational marginal price at the Empire load node. Because the IM was
20 II only active for part of the test year, hourly IM prices for the months of January and February are
21 II not available. Further, the monthly averages calculated from the IM data for March and April
22 II appear to be too high. The high prices reflected in the IM data for March and April could be a
23 II result of the extreme weather in early 2014 as well as issues related to market start-up. Staff has
24 II used the energy imbalance market prices developed by the Company as place holders for these
25 II four months until a full year of data can be analyzed to reflect a full year of IM operation. Staff
26 II will continue to review 1M purchased power prices and will update the purchased power prices
27 II used as input to Staffs fuel model as necessary.
28 II Staff Expert/Witness: Erin Maloney
53 WeatherNonnalization ofElectric Loads. Part A: Hourly Net System Loads" (November 28, 1990), written by Dr. Michael Proctor, Manager of the Economic Analysis Department.
Page 85

1 II 7. Entergy Transmission Contract
2 II Empire has a contract with Entergy Solutions, Inc. for Firm Point-to-Point Transmission
3 II Service to transmit power generated from the Plum Point Energy Station to Empire. Staff
4 II included an adjustment that annualizes the cost of this service at the current contract rate
5 II effective December 1, 2014.
6 II Staff Expert/Witness: Paul R. Harrison
7 II D. Depreciation
8 II 1. Regulatory Plan Amortization Redistribution
9 II Staff recommends the Commission order Empire to make certain accounting adjustments
10 ~ regarding the accumulated additional amortizations ("additional amortizations") to adjust for
11 II unitization changes Empire has made to the Iatan 2 account balances since Case No.
12 II ER-2011-0004. Unitization is the process of defining identifiable pieces of property into the
13 II appropriate plant accounts in a manner that the pieces of property can be identified and retired in
141 the future.
15 In the order approving the nonunanimous stipulation and agreement in Case No.
16 ~ ER-2011-0004 the Commission authorized Empire to set up accounts to record the additional
17 II amortizations against the rate base of Iatan 2 and to ensure that the additional amortizations were
18 II identifiable in the future. At the time of the 2011 case Empire had not yet completed the
19 ~ unitization process. Now that unitization has been completed, plant balances are no longer
20 II reflective of the assets that are recorded to each additional amortization account. The accounting
21 II authorization made in Case No. ER-2011-0004 distributed the additional amortizations against
22 ~ the projected plant balances on a dollar weighted average percent of plant in service for Iatan 2.
23 II Those distributions were as follows:
24
25
26
27
28
29
. Account # Account Description
311.05 Structures and Improvements
312.05 Boiler Plant Equipment
314.05 Turbogenerator Units
315.05 Accessory Electrical Equip
316.05 Mise Power Plant Equip
Page 86
% Iatan 2 Total Plant
10.47%
46.92%
7.82%
7.80%
26.99%
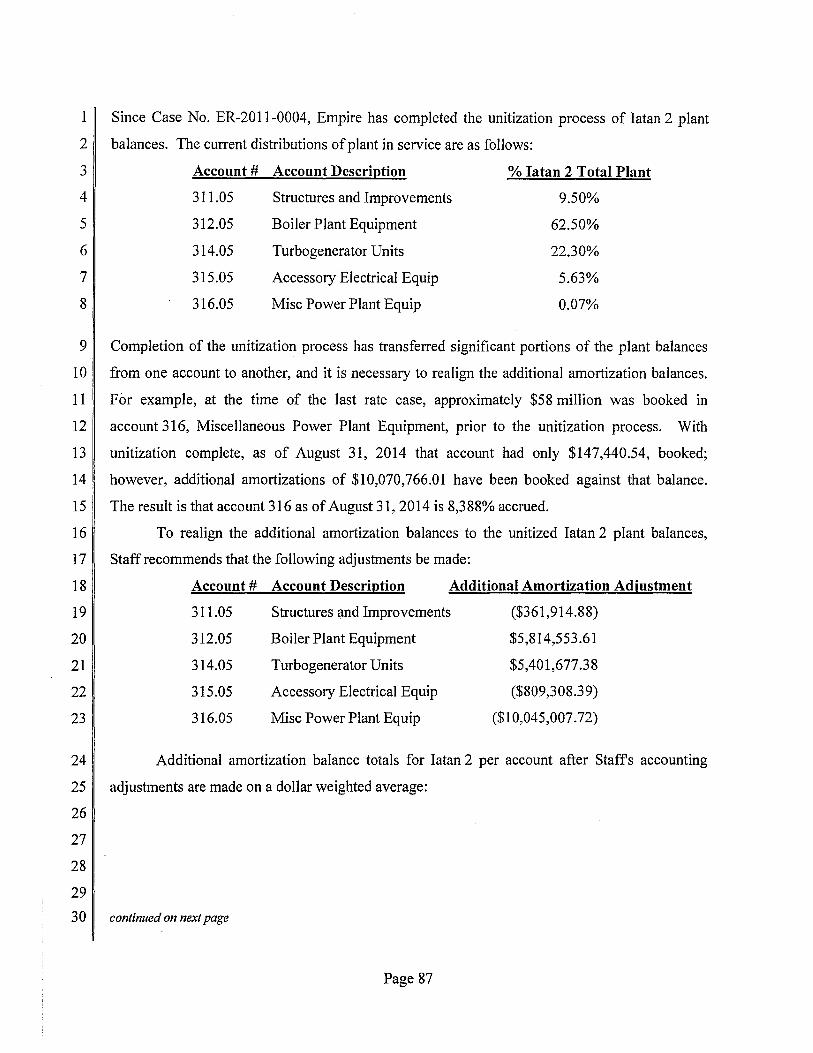
1 II Since Case No. ER-2011-0004, Empire has completed the unitization process of Iatan 2 plant
211 balances. The current distributions of plant in service are as follows:
3
4
5
6
7
8
Account#
311.05
312.05
314.05
315.05
316.05
Account Descri.Qtion
Structures and Improvements
Boiler Plant Equipment
Turbogenerator Units
Accessory Electrical Equip
Mise Power Plant Equip
% Iatan 2 Total Plant
9.50%
62.50%
22.30%
5.63%
0.07%
911 Completion of the unitization process has transferred significant portions of the plant balances
10 from one account to another, and it is necessary to realign the additional amortization balances.
11 II For example, at the time of the last rate case, approximately $58 million was booked in
12 account 316, Miscellaneous Power Plant Equipment, prior to the unitization process. With
13 II unitization complete, as of August 31, 2014 that account had only $147,440.54, booked;
14 II however, additional amortizations of $10,070,766.01 have been booked against that balance.
15 II The result is that account 316 as of August 31,2014 is 8,388% accrued.
16 II To realign the additional amortization balances to the unitized Iatan 2 plant balances,
17 II Staff recommends that the following adjustments be made:
18
19
20
21
22
23
Account # Account Description Additional Amortization Adjustment
311.05 Structures and Improvements ($361,914.88)
312.05 Boiler Plant Equipment $5,814,553.61
314.05 Turbogenerator Units $5,401,677.38
315.05 Accessory Electrical Equip ($809,308.39)
316.05 Mise Power Plant Equip ($1 0,045,007.72)
24 II Additional amortization balance totals for Iatan 2 per account after Staffs accounting
2511 adjustments are made on a dollar weighted average:
26
27
28
29
3 0 II continued on next page
Page 87

1
2
3
4
5
6
Account#
311.05
312.05
314.05
315.05
316.05
Account DescriJ!tion
Structures and Improvements
Boiler Plant Equipment
Turbogenerator Units
Accessory Electrical Equip
Mise Power Plant Equip
7 2. Iatan 2 Depreciation Reserve
Additional Amortization Balance
$3,544,751.30
$23,321,791.17
$8,319,550.30
$2,101,101.94
$25,758.29
8 After the adjustments to the additional amortization just discussed, the reserve balance
9 II for account 316 Miscellaneous Power Plant Equipment at August 31, 2014 is $2,297,040.24.
10 II However the plant balance is $147,440.54, which results the account being 1,558% accrued. This
11 II percent accrual number does not contain the adjusted amount for the additional amortization part
12 II of the reserve. During the unitization process for Iatan 2, plant in service was transferred into the
13 II appropriate plant accounts. However, depreciation reserves for Iatan 2 do not appear to have
14 II been transferred between accounts with the corresponding plant balances. Depreciation Staff
15 recommend the following total plant depreciation reserve adjustments to reflect the unitization of
16 Iatan 2:
17
18
19
20
21
22
Account#
31112
312I2
314I2
315I2
316I2
Account Description Depreciation Reserve Adjustment
Structures and Improvements $101,450.83
Boiler Plant Equipment $1,494,664.97
Turbogenerator Units $963,628.98
Accessory Electrical Equip ($281,415.67)
Mise Power Plant Equip ($2,278,329.11)
2311 With the adjustments above the new reserve totals by account for Iatan 2 are as follows:
24
25
26
27
28
29
Account#
31112
31212
314I2
31512
316I2
Account Description Adjusted Depreciation Reserve
Structures and Improvements $1,313,249.15
Boiler Plant Equipment $9,077,591.39
Turbogenerator Units $2,904,888.73
Accessory Electrical Equip $727,616.12
Mise Power Plant Equip $18,711.13
Page 88
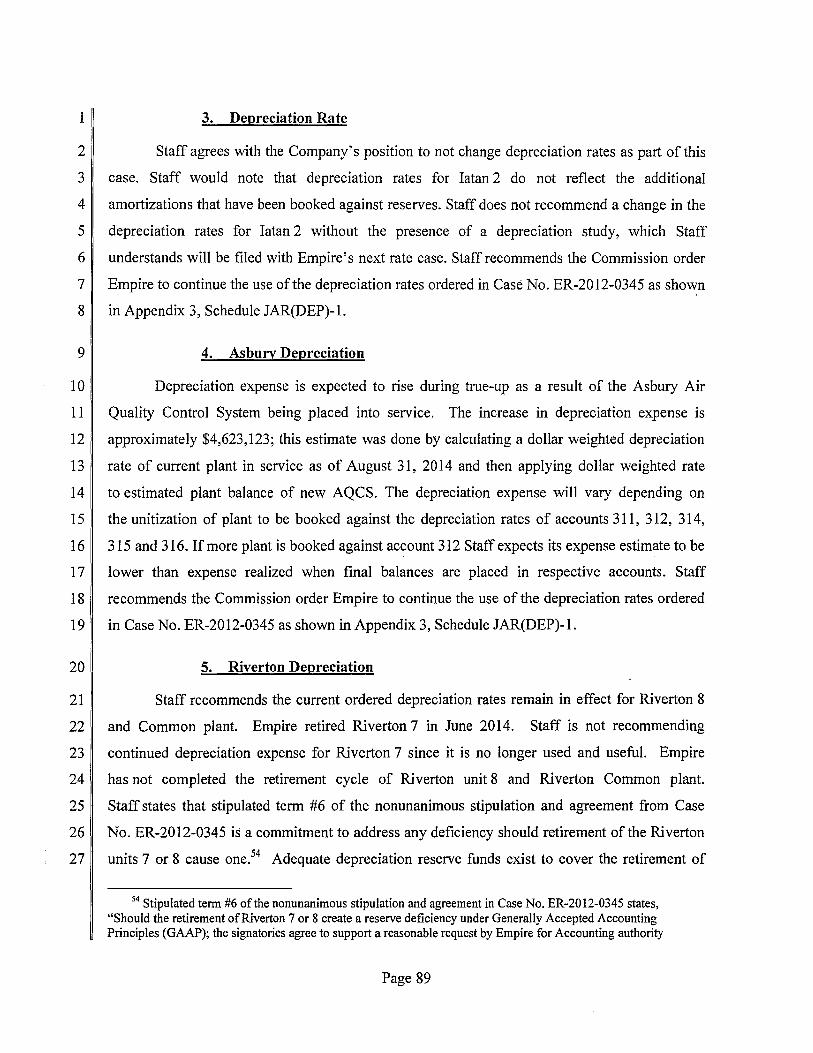
1 3. Depreciation Rate
2 II Staff agrees with the Company's position to not change depreciation rates as part of this
3 II case. Staff would note that depreciation rates for Iatan 2 do not reflect the additional
4 II amortizations that have been booked against reserves. Staff does not recommend a change in the
5 II depreciation rates for Iatan 2 without the presence of a depreciation study, which Staff
6 II understands will be filed with Empire's next rate case. Staff recommends the Commission order
7 II Empire to continue the use ofthe depreciation rates ordered in Case No. ER-2012-0345 as shown
8 II in Appendix 3, Schedule JAR(DEP)-1.
9 4. Asbury Depreciation
10 II Depreciation expense is expected to rise during true-up as a result of the Asbury Air
11 II Quality Control System being placed into service. The increase in depreciation expense is
12 II approximately $4,623,123; this estimate was done by calculating a dollar weighted depreciation
13 II rate of current plant in service as of August 31, 2014 and then applying dollar weighted rate
14 II to estimated plant balance of new AQCS. The depreciation expense will vary depending on
15 II the unitization of plant to be booked against the depreciation rates of accounts 311, 312, 314,
16 II 315 and 316. If more plant is booked against account 312 Staff expects its expense estimate to be
17 II lower than expense realized when final balances are placed in respective accounts. Staff
18 II recommends the Commission order Empire to continue the use of the depreciation rates ordered
19 II in Case No. ER-2012-0345 as shown in Appendix 3, Schedule JAR(DEP)-1.
20 5. Riverton Depreciation
21 II Staff recommends the current ordered depreciation rates remain in effect for Riverton 8
22 II and Common plant. Empire retired Riverton 7 in June 2014. Staff is not recommending
23 II continued depreciation expense for Riverton 7 since it is no longer used and useful. Empire
24 II has not completed the retirement cycle of Riverton unit 8 and Riverton Common plant.
25 II Staff states that stipulated term #6 of the nonunanimous stipulation and agreement from Case
26 II No. ER-2012-0345 is a commitment to address any deficiency should retirement of the Riverton
27 II units 7 or 8 cause one.54 Adequate depreciation reserve funds exist to cover the retirement of
54 Stipulated tenn #6 of the nonunanimous stipulation and agreement in Case No. ER-2012-0345 states, "Should the retirement of Riverton 7 or 8 create a reserve deficiency under Generally Accepted Accounting Principles (GAAP); the signatories agree to support a reasonable request by Empire for Accounting authority
Page 89

1 II Riverton unit 7 at this time. Staff understands Empire's next rate case will be filed shortly after
2 II the conclusion of the current case as a result of the Riverton Combined Cycle Unit 12 being
3 II placed into service. At that time the depreciation reserve funds will be reexamined again.
4 6. Staff Depreciation Recommendation
5 II Staff recommends the Commission order Empire to continue the use of the depreciation
6 II rates ordered in Case No. ER-2012-0345 as shown in Appendix 3, Schedule JAR(DEP)-1.
7 II Depreciation Staff recommend the following total company depreciation reserve
8 II adjustments be made to reflect the unitization oflatan 2 plant:
9
10
11
12
13
14
Account#
311!2
31212
31412
31512
31612
Account Description
Structures and Improvements
Boiler Plant Equipment
Turbogenerator Units
Accessory Electrical Equip
Mise Power Plant Equip
Depreciation Reserve Adjustment
$101,450.83
$1,494,664.97
$963,628.98
($281 ,415 .67)
($2,278,329.11)
15 II Staff recommends that the following adjustments be made to the additional amortization
16 II balances recorded in separate subaccounts in reserves to reflect the unitization Iatan 2 plant
17 II balances:
18
19
20
21
22
23
Account#
311.05
312.05
314.05
315.05
316.05
Account Description Additional Amortization Adjustment
Structures and Improvements ($361,914.88)
Boiler Plant Equipment $5,814,553.61
Turbogenerator Units $5,401,677.38
Accessory Electrical Equip ($809,308.39)
Mise Power Plant Equip ($1 0,045,007. 72)
24 II Staff Expert/Witness: John A. Robinett
pursuant to Accounting Standard 980 (F AS 71) to reallocate the depreciation reserve to cover the cost of removal of such plant."
Page 90
1 E. Payroll and Benefits
2 1. Payroll, Payroll Taxes and 401(k)
3 II Staff adjusted Empire's test year payroll expense to reflect annualized levels of payroll,
4 II payroll taxes, and 401(k) benefit costs as of August 31, 2014. Base payroll was calculated by
5 ~ multiplying the employee levels as of August 31, 2014, by the appropriate salary or wage rate
6 II current at that time to derive the annualized payroll cost. Staff calculated a reasonable overtime
7 II payroll level for Empire by multiplying an overtime percentage computed for the non-union and
8 II union employees based upon a five-year average of overtime hours actually incurred by the
9 II current rate paid for overtime as of August 2014, excluding the overtime hours associated with
10 II the May 2011 Joplin tornado. Staff then divided that product by Staffs pro forma base payroll
11 II amount. In regard to the Joplin tornado, Empire was granted an Accounting Authority Order
12 II (AAO) to defer all incremental operations & maintenance (O&M) costs associated with the
13 II tornado for future recovery in rates. Any overtime costs incurred as a result of this tornado
1411 needed to be removed from the overtime calculation in this rate case in order to avoid a situation
15 where Empire could potentially recover those costs twice in rates.
16 II Staff determined an allocation rate for distributing the payroll adjustments by using the
17 II percentage of Empire's total electric payroll costs. After allocation between expense and
18 II construction based on a five (5) year O&M average, Staff distributed the total amount of the
19 II adjustment to individual Federal Energy Regulatory Commission Uniform System of Accounts
20 II (FERC USOA) based upon the actual distribution by FERC account experienced by Empire for
21 II the twelve months ending April 30, 2014. Staffs Accounting Schedule 10, Adjustments to the
22 II Income Statement, reflects all payroll adjustments, segregated by the FERC USOA Account, to
23 II reflect Staffs total adjustment required to restate the test year payroll to an annualized level as of
24 II August 31,2014.
25 II Staff calculated payroll taxes based upon August 31, 2014 wage levels and current tax
26 II rates. This included Federal Unemployment Taxes (FUTA), State Unemployment Taxes
27 II (SUTA), and Federal Insurance Contributions Act (FICA) tax. In addition, Staff computed FICA
28 II payroll taxes for allowable non-financial incentive payments incurred in the test year and
29 II annualized the Company's 401(k) benefit costs by applying Empire's actual 401(k) match rate
30 II for each employee to the annualized payroll as of August 31, 2014.
31 II Staff Expert/Witness: Jermaine Green
Page 91
2. Incentive Compensation
2 Staff has reviewed Empire's portfolio of incentive compensation plans offered to its
3 employees. Based upon this review, Staff is proposing adjustments to the Company's test year
4 incentive compensation expenses related to the Management Incentive Compensation
511 Plan ("MIP"), the cash incentives offered to Empire department heads, lump-sum payments
6 offered to certain employees called "Lightning Bolts," and equity incentive compensation
7 II offered to the Company's executives. These disallowances are not stated as separate
8 II income statement adjustments, but are embedded within Staffs previously described total
9 payroll adjustments.
10 a. Ma·nagement Incentive Compensation Plan (MIP)
11 II Empire's MIP program offers awards to Empire senior officers for the achievement of
12 certain pre-set goals. In 2013, each senior officer had a list of goals pertaining to areas such as
13 II expense control, capital markets, regulatory performance, customer service, project completion,
14 II operations, financial performance, corporate governance, and safety. Each of these goals was
15 II attributed a specific performance measure and weighting, thus assigning a target cash payout.
16 II The amount of the award determinations is based upon attainment of a specific performance
17 II level by the senior officer:
18 II Threshold (50% oftarget payout)
19 II Target (100% target payout)
20 II Maximum (200% of target payout)
21 II If the results for a specific goal are below the threshold, the senior officer does not receive
22 II an MIP award related to that specific goal. If the results are at or above the level set for the
23 II maximum goal, the senior officer receives double the target MIP award for that specific goal.
24 II In order to determine the appropriate amount to include for the MIP in this case,
25 II Staff performed a review of all the incentive metrics used to measure each individual goal and
26 II the actual award received. Staff then disallowed all the actual awards paid out to
27 II Empire's executives associated with performance measures tied to meeting financial goals;
28 i.e., "earnings per share" targets. Any incentive goals associated with enhancing the value of a
29 utility's stock price and the achievement of these goals benefits Empire's shareholders, not
30 Empire's ratepayers; therefore, Staff removed this expense from inclusion in rates.
Page 92

1 II b. Department Head Cash Incentive Plan
2 II The cash incentive plan for Department Heads is similar to the executive officer plan
3 II described above. The metrics are established and approved by each Department Head's
4 II executive officer. The metrics consist of a list of goals pertaining to areas such as expense
5 II control, capital markets, regulatory performance, customer service, project completion,
6 II operations, financial performance, corporate governance, and safety. The total target cash
7 II incentive amount for each of the executives is tied to a specific performance measure and
8 II weighting accounts for 12.5% ofthe employee's base salary. If the results for a specific goal are
9 II below the threshold, the department head does not receive an award related to that specific goal.
10 II If the results are at or above the level set for the maximum goal, the department head receives
11 II double the target award opportunity for that specific goal.
12 II In order to determine the appropriate amount to include for the Department Head Cash
13 II Incentive Plan in this case, Staff performed a review of all the incentive metrics used to measure
14 II each individual goal and the actual award received. Staff then disallowed all the actual awards
15 II paid out to Empire's executives associated with performance measures tied to meeting financial
16 II goals and Legislative Governance; i.e., "earnings per share" and "lobbying" targets. Any
17 II incentive goals associated with enhancing the value of a utility's stock price and the achievement
18 II of these goals benefits Empire's shareholders, not Empire's ratepayers; therefore, Staffreinoved
19 II this expense from inclusion in rates.
20 II c. Lightning Bolts
21 II Empire's "Lightning Bolts" program offers one-time incentive payments to certain
22 II employees in the form of bonuses. Staff in the past has disallowed the cost of these discretionary
23 II bonuses paid in the test year. The Commission's Report and Order in Case No. ER-2006-0315
24 II adopted Staff's recommended disallowance of short-term incentive compensation tied to
25 II discretionary bonuses that are unsupported by well-defined goals and for which the criteria for
26 II granting awards is not known to the employee in advance.
27 II d. Equity Incentive Compensation
28 II In Empire's past rate cases, Staff also recommended a disallowance of long-term stock
29 II incentive compensation awarded to Empire's executive management as part of the senior
30 II officer's total compensation each year. The senior officers do not have any specific goals to meet
31 II in order to be granted these stock options. These stock option awards only benefits Empire's
Page 93
1 II shareholders, not Empire's ratepayers. Additionally, unlike other expense recognition in the
2 II income statement, expense recognition for equity-based incentive compensation does not result
3 II in a cash outlay by Empire. Staff has eliminated stock options recognized as an expense in the
4 II test year consistent with the Commission's Report and Order in Case No. ER-2006-0315.
5 II Staff Expert/Witness: Jermaine Green
6 II 3. Payroll Benefits
7 II Empire currently offers its employees Dental, Vision, Healthcare and Life Insurance
8 II benefits. Staff performed an analysis of the employee benefit costs included in Account 926 from
9 II the general ledger. Staff annualized each expense by examining the individual costs over a
10 II three (3) year period to determine the appropriate amount to include for each expense.
11 II Health and Dental Insurance showed significant fluctuations year over year. Staff performed a
12 II 3-year average through the update period to annualize these expenses ending August 31, 2014.
13 II Vision and Life Insurance showed minor fluctuations year over year. Staff performed a 3-year
14 II average through the update period to annualize these expenses ending August 31, 2014.
15 II Staff Expert/Witness: Jermaine Green
16 II 4. FAS 87 and FAS 88 Pension Costs
17 II In Case No. ER-2004-0570, the Staff, Empire and other parties entered into a
18 II Stipulation and Agreement as to Certain Issues, addressing, among other items, the ratemaking
19 II treatment for annual pension cost under Financial Accounting Standard No. 87 (FAS 87). This
20 II agreement, and thus treatment of annual pension cost, was later modified by the documents
21 II entitled Stipulation and Agreement as to Certain Issues entered into in Case Nos. ER-2006-0315,
22 II ER-2008-0093, ER-2010-0130, ER-2011-0004, and ER-2012-0345. These above-referenced
23 II agreements provide for Empire to generally have its pension rate allowance set equal to its most
24 II current annual level of pension expense as calculated under F AS 87. Furthermore, these
25 II agreements established a tracker mechanism for Empire's pension expense, in which any excess
26 II or deficiency in the Company's pension rate allowance, as compared to its ongoing levels of
27 II FAS 87 expense, is to be treated as a regulatory asset or liability. The resulting pension tracker
28 II regulatory asset or pension tracker regulatory liability is then to be included in Empire's rate
29 II base, and amortized as an addition or reduction to pension expense over a five-year period.
Page 94
1 II Pension cost under F AS 87 is reflected in the Staffs income statement in this case in a
2 II consistent manner with the ratemaking treatment agreed upon by the signatories to the stipulation
311 and agreements approved by the Commission in Empire's last six electric rate cases. Empire's
4 rate base, as determined by the Staff, includes the F AS 87 Regulatory Asset, which represents
5 II the cumulative difference between F AS 87 pension costs recovered in rates and F AS 87 pension
6 II costs recognized in the financial statements between rate cases.
7 II Additionally, Staff has included a prepaid pension asset (PPA) in rate base in the amount
8 II of $16,105,735. The PPA represents the cumulative amount of contributions in excess of
9 II actuarial costs as of August 31, 2014. These contributions were made to prevent the pension plan
10 II from becoming "at-risk" as defined under the Pension Protection Act, and to meet the
11 II obligations of the Pension Benefit Guarantee Corporation. Staffs cost of service does not
12 II include an amortization ofthis PPA. Future contributions will be reduced by this PPA amount.
13 II Empire's pension costs in this case were based upon the amounts found within Exhibit 1
14 II of Empire's 2014 Pension Expense Actuarial Report. Staff will update the pension costs to
15 II reflect the tracker balance and amortization in its True-Up testimony. The results of the Staffs
16 II review ofEmpire's pension costs in this case are as follows:
17 18
19 20 21
22 23
24 25
1.
2.
3.
4.
The Company's ongoing F AS 87 expense recommended to be recognized in rates in this case is $6,274,848.
The balance in the Regulatory Asset account at August 31, 2014, was $3,173,170, which is to be amortized over five years as an expense in the amount of $634,634.
The amount to be included in rate base for Empire's ongoing pension expense tracker mechanism is $3,173,170, as noted above.
An amount of $16,106,735 is included in Empire's rate base as a prepaid pension asset.
26 II Staff Expert/Witness: Paul R. Harrison
27 II 5. FAS 106- Other Post Retirement Benefit Costs (OPEBs)
28 II In Case No. ER-2006-0315, the signatory parties entered into a Non-Unanimous
29 II Stipulation and Agreement as to Certain Issues, addressing the ratemaking treatment for annual
30 II other post-retirement benefit costs (also known as OPEBs) under Financial Accounting
31 II Standard No. 106 (FAS 106). OPEBs primarily relate to medical benefits owed by Empire to
Page 95
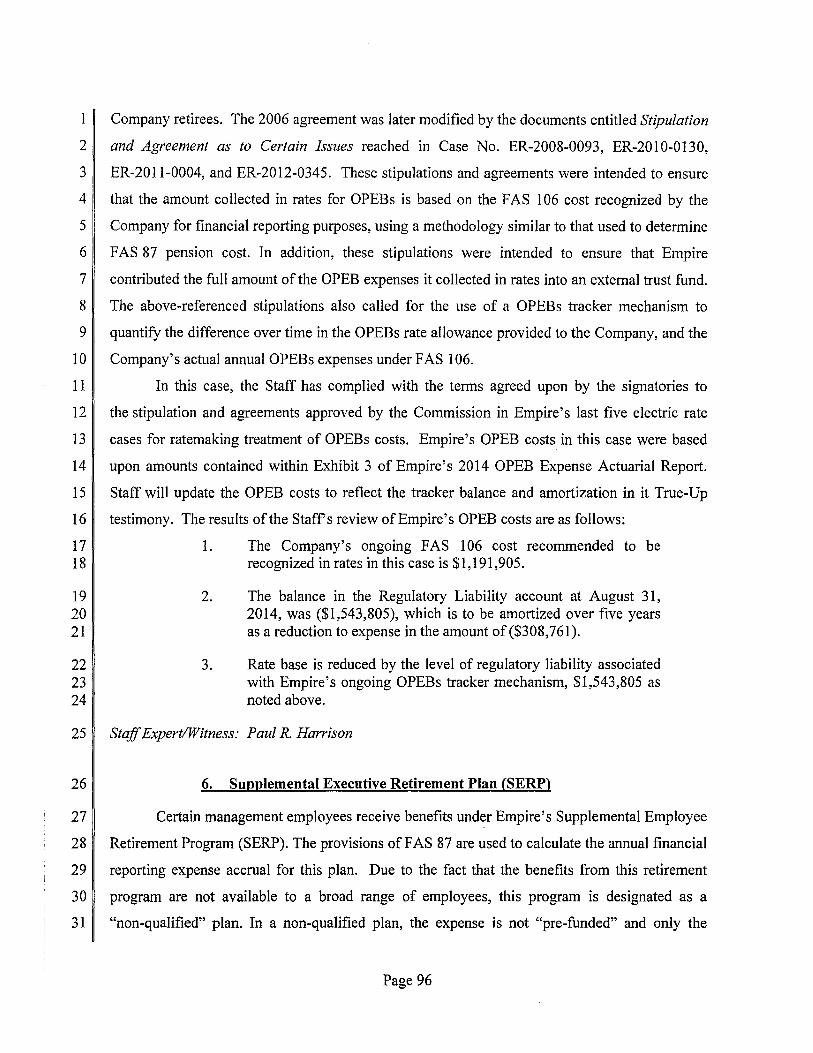
1 II Company retirees. The 2006 agreement was later modified by the documents entitled Stipulation
2 and Agreement as to Certain Issues reached in Case No. ER-2008-0093, ER-2010-0130,
3 ER-2011-0004, and ER-2012-0345. These stipulations and agreements were intended to ensure
4 that the amount collected in rates for OPEBs is based on the F AS 1 06 cost recognized by the
511 Company for financial reporting purposes, using a methodology similar to that used to determine
6 F AS 87 pension cost. In addition, these stipulations were intended to ensure that Empire
7 II contributed the full amount of the OPEB expenses it collected in rates into an external trust fund.
8 II The above-referenced stipulations also called for the use of a OPEBs tracker mechanism to
911 quantify the difference over time in the OPEBs rate allowance provided to the Company, and the
10 Company's actual annual OPEBs expenses under F AS 106.
11 II In this case, the Staff has complied with the terms agreed upon by the signatories to
12 II the stipulation and agreements approved by the Commission in Empire's last five electric rate
13 II cases for ratemaking treatment of OPEBs costs. Empire's OPEB costs in this case were based
14 II upon amounts contained within Exhibit 3 of Empire's 2014 OPEB Expense Actuarial Report.
15 II Staff will update the OPEB costs to reflect the tracker balance and amortization in it True-Up
16 II testimony. The results of the Staffs review ofEmpire's OPEB costs are as follows:
17 18
19 20 21
22 23 24
1.
2.
3.
The Company's ongoing FAS 106 cost recommended to be recognized in rates in this case is $1,191,905.
The balance in the Regulatory Liability account at August 31, 2014, was ($1,543,805), which is to be amortized over five years as a reduction to expense in the amount of ($308,761).
Rate base is reduced by the level of regulatory liability associated with Empire's ongoing OPEBs tracker mechanism, $1,543,805 as noted above.
25 II Staff Expert/Witness: Paul R. Harrison
26 6. Supplemental Executive Retirement Plan CSERP)
27 II Certain management employees receive benefits under Empire's Supplemental Employee
28 II Retirement Program (SERP). The provisions ofF AS 87 are used to calculate the annual financial
29 II reporting expense accrual for this plan. Due to the fact that the benefits from this retirement
30 II program are not available to a broad range of employees, this program is designated as a
31 II "non-qualified" plan. In a non-qualified plan, the expense is not "pre-funded" and only the
Page 96

1 amounts paid to beneficiaries are tax deductible. Therefore, Staffs policy has been to limit
2 utilities' rate recovery of this item to actual benefit payments to employees, if reasonable. Since
3 the last Empire rate case this expense has trended upward; therefore, Staff used the ending
4 balance of actual payments made for the twelve months ending August 31, 2014 to determine the
5 II annual cost of the SERP for inclusion in rates.
6 II Staff Expert/Witness: Paul R. Harrison
7 II F. Maintenance Normalization Adjustments
8 II Empire's maintenance expenses for its generating facilities (production stations) tend to
911 fluctuate from year to year, since unscheduled outages occur at irregular and unpredictable times,
10 and major planned outages do not occur annually. The maintenance account for each production
11 II station was reviewed and analyzed separately. The production facilities examined included
12 Iatan 1, Iatan 2, Iatan Common, Asbury, Riverton, State Line Combined Cycle, State Line 1,
13 II Energy Center, Ozark Beach and Plum Point. These units were examined individually because
14 II each of them is on a different maintenance cycle and to group them would have either overstated
15 II or understated the final annualized maintenance costs. The adjustments were combined when
16 II possible in an effort to reduce the volume of adjustments.
17 II The Staffs proposed production maintenance normalization adjustments pertain to
18 II Empire's non-labor maintenance costs only; labor maintenance costs are handled as part of the
19 II Staffs overall payroll adjustments.
20 1. Iatan
21 II Staff noted the Iatan 1 production station is on a six-year major maintenance cycle. For
22 II that reason, Staff used a six-year average of maintenance costs. Empire owns only 12% of the
23 II Iatan 1 unit.
24 2. Asbury
2511 The Asbury maintenance expense is based on a five-year overhaul schedule of the boiler
26 and turbine. Staffs adjustment is based upon a five-year average of maintenance costs.
Page 97

3. Riverton
2 II The Riverton maintenance expense is based on a five-year overhaul schedule of the boiler
3 II and turbine. Staff's adjustment is based on a five-year average of maintenance costs.
4 4. State Line Combined Cycle (SLCC) and State Line Common
5 II The SLCC maintenance expense is based on a five-year overhaul schedule of the
6 II boiler and turbine. Empire owns 60% of the SLCC unit, with Westar Energy owning the
7 II remaining 40%. Empire is also responsible for 66.7% of the State Line Common maintenance
8 II expenses, while Westar Energy is responsible for the remaining 33.3%. Staff applied an
9 II adjustment based on a five-year average of Empire's portion of maintenance costs as booked for
10 II both generating units.
11 5. State Line 1
12 II Empire has had a contract with Siemens Instrumentation, Controls and Electrical
13 II ("IC&E") group, related to the maintenance of this production unit, since June 29, 2001.
14 II The terms of the contract require Siemens to conduct maintenance service for the turbines, which
15 II are required to run for"'a specified number of hours per year. If a turbine does not meet the annual
16 II hours requirement, a credit is due to Empire and, if the turbine exceeds the hours, then the
17 II Company incurs more costs. The nature of this expense varies greatly from year to year and,
18 II therefore, Staff is recommending using a five-year average to normalize this expense. The actual
19 II test year amount is subtracted from the five-year average to derive Staff's adjustment.
20 6. Energy Center and Ozark Beach
21 II The Energy Center and Ozark Beach maintenance expense is based on a five-year
22 II overhaul schedule of the boiler and turbine. Staff's adjustment is based on a five-year average of
23 II maintenance costs.
24 25
7. Operations and Maintenance (O&M) Expenses for Iatan 2, Iatan Common, and Plum Point
26 II In Case No. ER-2012-0345, Staff recommended a continuation of use of the tracker
27 II mechanism for Iatan 2, Iatan Common and Plum Point non-labor O&M expense, because there
28 II was not adequate historical information at that time to develop a reasonable annualized and
Page 98

1 II normalized expense level for these newer generating units. Empire and other signatory parties
211 agreed through a Global Agreement in Case No. ER-2012-0345 to continue a tracker for Iatan 2,
3 Iatan Common, and Plum Point O&M costs. A similar tracker mechanism has been approved for
4 II Kansas City Power & Light Company (KCPL) by the Commission in relation to the portion of
511 the Iatan 2 and Iatan Common generating facilities that it owns.
6 For this case, Staff is recommending a discontinuation the O&M tracker initially
71 established in Case No. ER-2011-004 for Iatan 2, Iatan Common and Plum Point. Empire
8 currently owns 12% oflatan 2 and Iatan Common generating facilities and 7.52% of Plum Point.
9 II KCPL, the majority owner of Iatan 2 and Iatan Common, has requested discontinuance of the
10 II O&M tracker for those units in its current rate case filing, Case No. ER-2014-0370. lfKCPL is
11 II no longer seeking use of a tracker mechanism for these units, it stands to reason that Empire
12 II also does not require special ratemaking treatment. The Iatan 2 and Iatan Common properties
13 II were declared to be in-service on August 26, 2010, and the Plum Point unit was declared to be
14 II in-service on August 13, 2010. For each of these units, there is approximately four years of
15 II actual cost information for non-labor O&M costs; current as of the end of the update period for
16 II this proceeding, on which reasonable allowances for these costs may be based going forward.
17 II In this case, Staff determined a normalized level of the O&M expenses for Iatan 2,
18 ~ Iatan Common and Plum Point. Staffs adjustment is based on a four-year average of
19 II actual maintenance costs associated with these generating facilities. As of August 31, 2014, the
20 ~ update period in this case; Iatan 2, Iatan Common & Plum had only four ( 4) years of actual
21 II O&M expenses.
22 II Additionally, in this case, Staff analyzed the Iatan 2, Iatan Common, and Plum Point
23 II O&M costs beginning June 30, 2012, through August 31, 2014, the update period for this case.
24 II For this same time period, Staff then calculated the total O&M costs, including only the accounts
25 II identified in the computation of the base tracker amounts established in Case No. ER-2012-0345.
26 II Staff identified base tracker amounts for latan 2, Iatan Common and Plum Point. Staff then
27 II compared the total O&M costs from June 30, 2012, through August 31, 2014 to the base tracker
28 II amounts to determine the associated regulatory asset or liability for each plant. Staff
29 II recommends a three (3)-year amortization of the regulatory liability incurred for all three
30 II generating units in the annual amount of $(588,232).
31 Staff Expert/Witness: Jermaine Green
Page 99

G. Other Non-Labor Expenses 1
2 1. Customer Deposit Interest Expense
311 See the discussion in Section VII. H., Rate Base-Customer Deposits.
4 Staff Expert/Witness: Brooke M Richter
5 II 2. Property Tax Expense
6 II For property assessment purposes, utility companies are required to file a valuation
711 of their utility property with their respective taxing authorities at the beginning of each
8 assessment year, which is January 1st. Several months later, based on the information provided
9 II by the utility, the taxing authority will in turn send the company its "assessed values" for every
10 II category of the company's property. The taxing authority will issue to the utility company a
11 II property tax rate later in the year. The final step in the process is when the taxing authority
12 II issues a property tax bill to the company late in each calendar year with a "due date" of
13 II December 31st. The billed amount of property taxes is based on the property tax rate applied to
14 II the previously determined assessed values of the utility's plant in service balances as of
15 II January 1st ofthe same year.
16 II Staff determined its adjustment for property taxes by developing a property tax rate to be
17 II applied to total electric plant in service as of December 31, 2013. To develop the property tax
18 II rate, the Staff divided the amount of total property taxes due in calendar year 2013 by the total
19 II plant in service on December 31, 2012. This property tax rate was then applied to total electric
20 II plant in service on December 31, 2013, to arrive at annualized property taxes. The annualized
21 II property tax expense was then subtracted from test year (12-month period ending April30, 2014)
22 II property tax expense to derive the adjustment. Since property tax rate has increased significantly
23 II from 2012 to 2013, Staff determined this manner is the best estimate available of ongoing levels
24 II of these taxes.
25 II One minor difference in the current rate case for property taxes is the treatment of
26 II the Plum Point Generating Unit located in Arkansas. The owners of the Plum Point unit,
27 II including Empire, have entered into an agreement with the City of Osceola, Arkansas;
28 II Mississippi County, Arkansas; Osceola School District No. 1 of Mississippi County, Arkansas;
29 II and Mississippi County Community College District of Arkansas to make an annual Payment in
Page 100

1 II Lieu of Taxes (PILOT) instead of paying property taxes on the unit in the normal manner.
2 A PILOT agreement allows the owners of the Plum Point unit to pay one flat amount of property
3 II taxes on the Plum Point unit for 30 years with the potential for an extension at the end of the
4 II 30 year term, regardless of any additions or retirements made to the unit since its in-service date.
5 II To appropriately calculate the overall property tax amount for Empire, the amount of Empire's
6 II share of the Plum Point plant had to be subtracted from total plant in service so as not to be
7 II included in the development of the annualized property taxes. The set amount of PILOT taxes
8 II that Empire has agreed to pay for Plum Point was then added to the annualized property tax
9 II calculation to determine the total property tax adjustment.
10 II Staff Expert/Witness: Ashley R. Sarver
11 3. Corporate Franchise Taxes
12 II Empire pays a corporate franchise tax (franchise tax) in order to conduct business in the
13 II State of Missouri. Franchise tax is based on the greater of the company's total assets or the par
14 II value of the company's issued and outstanding capital stock. For Empire, the franchise tax basis
15 II is the basis of assets as of the first day of the taxable year, the twelve months ending
16 II December 31, 2013, from Schedule MO-FT. The franchise tax rate is 1/150 of 1% (.000067) for
17 II the tax year 2015. Staffs recommendation for franchise tax expense is to annualize the
18 II corporate franchise tax. Staff used the franchise tax rate for the tax year of 2015, multiplied by
19 II the company's total assets which are located on line 6 ofthe Schedule MO-FT.
20 II Staff Expert/Witness: Brooke M Richter
21 II 4. Amortization Expenses
22 II a. Amortization of Electric Plant
23 II Staff reviewed all of Empire's amortization expense booked to Account 404.000,
24 II Amortization-Limited Term Electric Plant. After reviewing this data, Staff made an adjustment
25 II to increase this expense to reflect the annualized amortization based on updated information
26 II through August 31, 2014, (as described earlier in Section VII. F.). Amortizations that expired
27 II .during the test year or will expire through the true-up period in this case (December 31, 2014)
28 II were eliminated from the annualization of this expense.
29 II Staff Expert/Witness: Brooke M Richter
Page 101

b. Amortization of Stock Issuance Costs
2ll In 2010 and 2011, Empire made additional issuances of common equity. In making all of
311 these issuances, the Company incurred issuance costs totaling $1,523,065 (including incremental
4 costs incurred by Empire to its equity distribution program since its inception) for its electric
5 II operations. It is Staffs position that these costs be recovered through rates as an above-the-line
6 II adjustment to operating expenses. Staff recommends that these costs continue to be amortized
7 II over a five-year period for purposes of this proceeding.
8 II Staff Expert/Witness: Ashley R. Sarver
911 c. Amortization oflce Storm Costs
10 Empire booked ice storm amortizations in account 593599 from the other states in which
11 II it has operations. Therefore, Staff made an adjustment to eliminate the amortized amount of the
12 II ice storm amortizations that was included in the test year from the cost of service in this case.
13 II Staff Expert/Witness: Brooke M Richter
14 II 5. Iatan Carrying Costs Amortization
15 II Pursuant to earlier agreements, the Company deferred certain carrying costs (monthly
16 II debt and equity-derived carrying charges) and monthly deprecation for its Iatan I AQCS
17 II Account 182.308 - Iatan Deferred Carrying Costs, Iatan 2 Account 182.332 - MO Iatanii Df Chg
18 II ER-2010-0130 and Plum Point Account 182331 - MO PlumPt Df Chgs ER-2010-0130. This
19 II deferral of carrying costs on the Iatan 1 AQCS, Iatan 2, and Plum Point investments was
20 II authorized under previous agreements, approved by the Commission. In Empire's last rate case,
21 II Staff recommended amortization of these carrying costs into cost of service using a composite
22 II amortization rate derived from dividing the total depreciation expense for each plant by the total
23 II plant balance for each plant. Staff used these composite rates and calculated amortization
24 II amounts of $84,729 for Iatan 1 AQCS, $44,828 for Iatan 2, and $1,987 for Plum Point. Staff
2511 used the same amortization amounts in this case.
26 Staff Expert/Witness: Kimberly K Bolin
Page 102

1 6. Demand Side Management
211 a. Empire's DSM Programs and Cost Recovery Mechanism
3 As part of Empire's Experimental Regulatory Plan approved in Case No. E0-2005-0263,
4 II Empire's Customer Programs Collaborative (CPC) was ordered to include Staff, Public Counsel,
511 Department of Natural Resources55 and other interested parties to advise Empire on the
6 development, implementation, monitoring and evaluation of demand response, energy efficiency
7 II and affordability programs for Empire's Missouri customers.
8 II Empire's Experimental Regulatory Plan expired on June 15, 2011, the effective date of
9 II the initial rates that reflect inclusion of the Iatan 2 investment on customer's bills, as a result of
10 II the Commission's June 1, 2011 Order Approving Global Agreement in Case No. ER-2011-0004.
11 II Empire changed the name ofthe CPC to DSM Advisory Group.
12 II The DSM Regulatory Asset Account, No. 182318, contains direct costs that have been
13 II incurred for seven DSM programs56, along with indirect program costs for administration,
14 II advertising, evaluation, measurement and verification and market potential study. Based on
15 II Staffs participation in Empire's DSM Advisory Group and Staffs review of the costs in
16 II Account 182318, Staff has no recommended disallowances to the levels of costs contained in
17 II Empire's DSM Regulatory Asset Account. All unamortized actual costs associated with all
18 II DSM programs are to be included in rate base as a regulatory asset as a result of the
19 II Commission's Order Approving Stipulation and Agreement in Case No. ER-2012-0345. The
20 II Staff is using the August 31, 2014 balance of this regulatory asset in rate base in this case. The
21 II Staff has also included an adjustment in the Income Statement to amortize these costs to expense.
22 II Staff Experts/Witnesses: Kimberly K Bolin and Hojong Kang, Ph.D.
23 II b. DSM Cost Recovery
2411 Empire's Account 182318 contains costs of the Company's DSM programs that are in
25 II various stages of development and implementation. Staff participated in the previously
26 II authorized (and now expired) Customer Programs Collaborative (CPC) and participates in the
27 II current authorized DSM advisory group established to assist Empire in the development of DSM
55 Now, the Missouri State Division of Energy is attending the meetings. 56 DSM programs consist of demand response, energy efficiency and affordability programs, including the
Low-Income Weatherization programs and are described in more detail in the Staff's DSM Status Reports, Case No. A0-2011-0035.
Page 103

1 II programs. Based upon Staffs participation in these groups, as well as Staffs review ofthe costs
2 II in Account 182318, Staff has amortized the amounts incurred by Empire prior to the end of the
3 II its Regulatory Plan (June 15, 2011) over ten years in accordance with the terms of the
4 II Commission's Order Approving Stipulation and Agreement in Case No. ER-2012-0345. Any
5 amounts incurred after the end of the Regulatory Plan to date are amortized over a period of six
6 years, per the Nonunanimous Stipulation and Agreement. The DSM costs include the payments
7 to Empire's customers that participate in the programs.
8 II Staff Expert/Witness: Kimberly K. Bolin
9 II c. Empire's MEEIA Filings
10 II Empire filed its first MEEIA application on February 28, 2012, in File No.
11 II E0-2012-0206 and withdrew it on July 5, 2012. Empire filed its second MEEIA application on
12 October 29, 2013 in File No. E0-2014-0030; however, the procedural schedule was suspended
13 on January 14, 2014 to allow additional time for technical conferences and settlement
14 discussions. To date Empire and its stakeholders have not been able to agree on DSM programs
15 II and a demand-side programs investment mechanism for Empire's second MEEIA application.
16 II Staff Expert/Witness: Hojong Kang, Ph.D.
17 II 7. Low Income Programs
18 II Empire currently has two low income programs: Low-Income Weatherization and
1911 Low-Income New Homes. The Low-Income Weatherization program works with Community
20 II Action Agencies to assist customers through conservation, education and weatherization to
21 II reduce their use of energy; thus reducing the level of bad debts experienced by Empire. The
22 II Low-Income New Homes program works with non-profit organizations, such as the Habitat for
23 II Humanity, and .local government community development organizations to provide financial
24 II incentives for increased energy efficiency in the building shell insulation and for high-efficiency
25 II central air conditioners, heat pumps, refrigerators, and lighting fixtures.
26 II In addition to those two programs, Empire also offers two other programs to assist the
27 II elderly and disabled. The first program is entitled Empire's Action to Support the Elderly
28 II ("EASE"). EASE allows Empire to wave late penalties and deposits, adjust due dates, and notify
29 II third parties when an account becomes delinquent. Finally, Empire jointly works with
30 II Crosslines Churches in Joplin and the voluntary donations of customers to offer Project Help.
Page 104

1 II Project Help is an assistance program created to meet emergency energy~ related expenses of the
2 II elderly and/or disabled residents in Empire's electric service area.
3 II The Missouri Low Income Weatherization Assistance Program ("Weatherization
4 II Program") is administered by the Missouri Department of Economic Development, Division of
5 II Energy ("DED-DE") using federal, state, and utility funding. The DED-DE Weatherization
6 II Program is administered locally by Community Action Agencies or other local agencies
7 II ("Weatherization Agencies"). The Empire Low-Income Weatherization Program is administered
8 II by the DED-DE and the three DED-DE Weatherization Agencies, the Economic Security
9 II Corporation, the Ozark Area Community Action Corporation and the West Central Missouri
10 II Community Action Agency. Empire provides supplemental funding to the three DED-DE
11 II Weatherization Agencies to cover the cost of weatherization measures.
12 II Empire's last evaluation of the Low-Income Weatherization program was completed in
13 II 2009. There have been large changes to the program since 2009. Through the American
14 II Recovery and Reinvestment Act (ARRA), special federal funding of $128 million was provided
15 II for the DED-DE Weatherization Program for the period of April 2009 - March 2013
16 II ("ARRA Period"). The ARRA provided an average of $6,500 of weatherization for households
17 II with income at 200% or less of the Federal Poverty Guidelines (FPG). In the three year period
18 II (2006-2008), prior to the ARRA Period, federal funding for the DED-DE Weatherization
19 II Program was approximately $18 million and the average amount of weatherization per
20 II household was $3,000. The Weatherization Agencies had until June 2013 to utilize the ARRA
21 II funding. The 200% of FPG qualification was continued and the spending limit of $6,500 was
22 II retained and is indexed each year so the most recent maximum expenditure was $6,987.
23 II Due to these changes, Staff recommends that Empire perform another evaluation of the
24 II Low-Income Weatherization program. In order to get a better picture of the full impact of
25 II weatherization on low-income homes, Staff recommends that the evaluation should include a
26 II representative sample of homes that use both electricity and natural gas for space conditioning,
27 II including homes served Missouri Gas Energy (MGE), provided that information necessary to
28! determine cost effectiveness can be obtained from MGE. Therefore, Staff recommends that
29 II Empire invite MGE to one or more of the collaborative meetings to discuss the evaluation and
30 i the potential of providing the evaluator with a customer's natural gas information.
Page 105
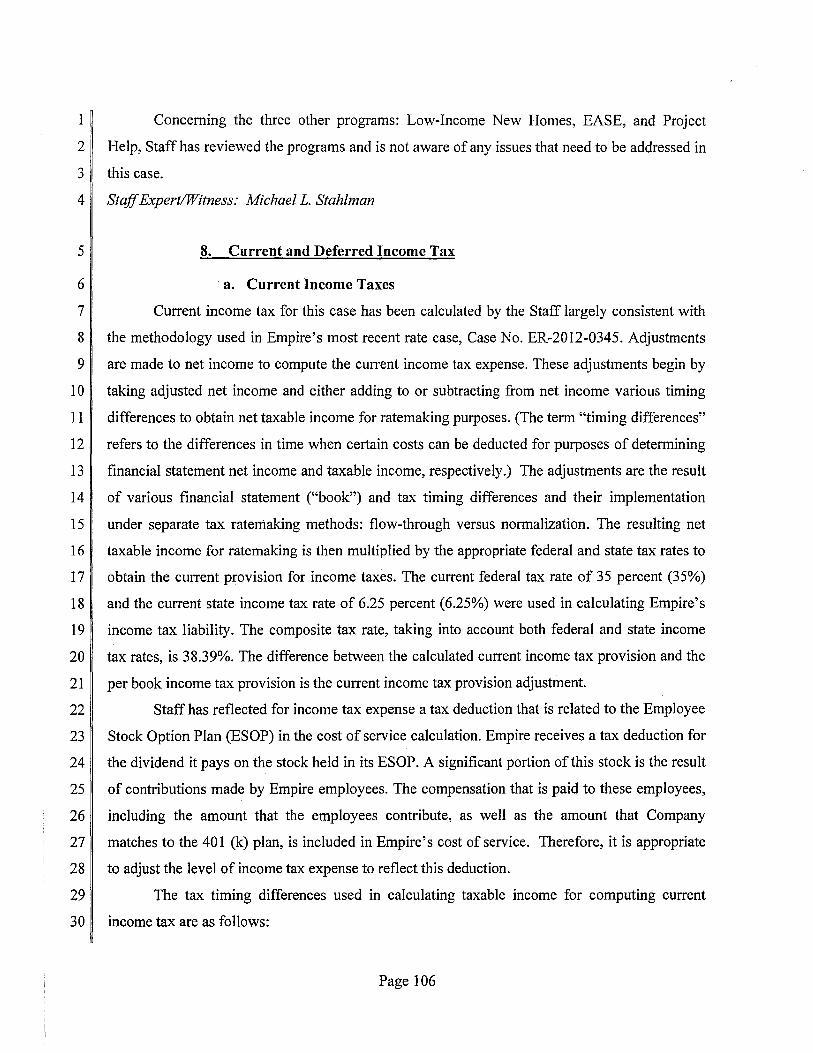
1 II Concerning the three other programs: Low-Income New Homes, EASE, and Project
2 II Help, Staff has reviewed the programs and is not aware of any issues that need to be addressed in
311 this case.
4 Staff Expert/Witness: Michael L. Stahlman
5 8. Current and Deferred Income Tax
6 II a. Current Income Taxes
7 II Current income tax for this case has been calculated by the Staff largely consistent with
8 II the methodology used in Empire's most recent rate case, Case No. ER-2012-0345. Adjustments
9 II are made to net income to compute the current income tax expense. These adjustments begin by
10 II taking adjusted net income and either adding to or subtracting from net income various timing
11 II differences to obtain net taxable income for ratemaking purposes. (The term "timing differences"
12 II refers to the differences in time when certain costs can be deducted for purposes of determining
13 II financial statement net income and taxable income, respectively.) The adjustments are the result
14 II of various financial statement ("book") and tax timing differences and their implementation
15 II under separate tax raterriaking methods: flow-through versus normalization. The resulting net
16 II taxable income for ratemaking is then multiplied by the appropriate federal and state tax rates to
17 II obtain the current provision for income taxes. The current federal tax rate of 35 percent (35%)
18 II and the current state income tax rate of 6.25 percent (6.25%) were used in calculating Empire's
19 II income tax liability. The composite tax rate, taking into account both federal and state income
20 II tax rates, is 38.39%. The difference between the calculated current income tax provision and the
21 II per book income tax provision is the current income tax provision adjustment.
22 II Staff has reflected for income tax expense a tax deduction that is related to the Employee
23 II Stock Option Plan (ESOP) in the cost of service calculation. Empire receives a tax deduction for
24 II the dividend it pays on the stock held in its ESOP. A significant portion of this stock is the result
25 II of contributions made by Empire employees. The compensation that is paid to these employees,
26 II including the amount that the employees contribute, as well as the amount that Company
27 II matches to the 401 (k) plan, is included in Empire's cost of service. Therefore, it is appropriate
28 II to adjust the level of income tax expense to reflect this deduction.
29 II The tax timing differences used in calculating taxable income for computing current
30 II income tax are as follows:
Page 106

1 II Add Back to Operating Income Before Taxes:
2 Book Depreciation Expense
3 II Non-Deductible Expense- Non-deductible meals and dues
4 II Contributions In Aid of Construction
511 Book Amortization
6 Subtractions from Operating Income:
7 II Interest Expense - Weighted Cost of Debt X Rate Base
8 II Tax Depreciation- Straight-Line
9 II Tax Depreciation- Excess
10 II Employee Stock Option Deduction (ESOP)
11 II Staff Expert/Witness: Kimberly K. Bolin
1211 b. Deferred Income Taxes
13 When a tax timing difference is reflected for ratemaking purposes consistent with the
14 II timing used in determining taxable income for the calculation of current income tax payable to
15 II the Internal Revenue Service (IRS), the timing difference is given "flow-through" treatment.
16 II When a current year timing difference is deferred and recognized for ratemaking
17 II purposes consistent with the timing used in calculating pre-tax operating income in the
18 II financial statements, then that timing difference is given "normalization" treatment for
19 II ratemaking purposes. Deferred income tax expense for a regulated utility reflects the tax
20 II impact of "normalizing" tax timing differences for ratemaking purposes. Current IRS rules for
21 II regulated utilities, in effect, require normalization treatment for the timing difference related to
22 II accelerated depreciation.
23 II For most utilities, it is necessary to break out a utility's tax depreciation into two separate
24 II components: tax straight-line depreciation and excess tax depreciation. Tax straight-line
25 II depreciation is different from book straight-line depreciation due to the different tax basis of
26 II property allowed under the tax code. Excess tax depreciation differs from straight-line book
27 II depreciation due to the higher depreciation rates allowed in the early years of an asset's life
28 II under the current tax code compared to "straight-line" book depreciation rates. Most tax basis
29 II differences were eliminated for assets placed into service after 1986 due to the Tax Reform Act
30 II (TRA) enacted that year.
Page 107

1 Staff's deferred income tax adjustment in this rate case consists of three components:
2 1. Depreciation tax timing difference: the difference between tax 3 straight-line depreciation expense and tax depreciation expense. Staff has 4 normalized this difference consistent with the treatment of this item in past 5 Empire rate proceedings.
6 2. Other IRS timing differences: contributions in aid of construction. 7 This amount is normalized consistent with Staff's calculation in the prior 8 rate case filing.
9 3. Excess deferred income taxes resulting from the 1986 Tax Reform 10 Act (TRA): Enactment of the TRA, which reduced the corporate income 11 tax rates applicable to utilities, created excess deferred tax amounts 12 associated with prior depreciation timing differences. As such, an 13 amortization is used to return excess deferred taxes resulting from the 14 change in tax rates back to customers.
15 II Staff Expert/Witness: Kimberly K Bolin
16 II c. State Income Tax Flow-Through
17 II In Empire's workpapers that support its rate increase request, Empire has included an
18 II adjustment to increase its income tax expense associated with an amount of state income tax
19 II allegedly flowed through to customers in Empire's Missouri rate proceedings prior to August 15,
20 II 1994. However, Empire did not discuss this adjustment in its Direct Testimony. Staff has not
21 II included an adjustment for this expense in its direct cost of service and it should not be recovered
22 II in rates.
23 II Staff Expert/Witness: Kimberly K Bolin
24 9. Insurance Expense
25 II Insurance expense is the cost of protection obtained from third parties by utilities
26 II against the risk of financial loss associated with unanticipated events or occurrences. Utilities,
27 II like non-regulated entities, routinely incur insurance expense in order to minimize their
28 II liability (and, potentially, that of their customers) associated with unanticipated losses.
29 II Staffmade an adjustment to annualize Empire's insurance expense to reflect the premiums paid
30 II as of August 31, 2014, the end ofthe update period.
31 II Staff Expert/Witness: Ashley R. Sarver
Page 108

1 II 10. Bad Debt Expense
2 II Bad debt or uncollectible expense is the portion of retail revenue that Empire is unable to
3 II collect from retail customers due to non-payment of bills. After a certain amount of time has
4 II passed, Empire's delinquent customer accounts are written off and turned over for collection.
5 II Empire and its collection agencies have been successful in collecting some portion of the
6 II delinquent amounts owed from customers even after they are written-off.
7 II Staff examined the most recent five-year (May 2009 - April 2014) history of Empire's
8 II bad debt write-offs that were never collected (i.e., write-offs net of amounts subsequently
9 II collected). It is apparent from a review of this data that Empire's bad debt expense fluctuates
10 II from one year to the next. Therefore, Staff calculated a five-year average of the uncollectable
11 II percentage of bad debt to revenue, which was then applied to the Staff's annualized and adjusted
12 II level of test year retail rate revenues to obtain the normalized level of bad debt expense.
13 II Staff Expert/Witness: Ashley R. Sarver
14 II 11. Postage
15 II Staff annualized Empire's test year postage expense to reflect the postal increase that
16 II went into effect on January 26, 2014.
17 II Staff Expert/Witness: Brooke M Richter
18 II 12. PSC Assessment and Rate Case Expense
19 II Staff included the actual costs incurred by Empire for rate case expense as of January 23,
20 II 2015, directly related to this case (No. ER-2014-0351). Staff's rate case expense adjustment is
21 II based upon all costs associated with filing and bringing this case before the Commission such as
22 II consulting fees, employee travel expenditures and legal representation. Staff has normalized the
23 II rate case expense over a two (2) year period. The ultimate amount of rate case expense incurred
24 II by the Company in this proceeding will be directly associated with the length of the case through
25 II the settlement conference and hearing process.
26 II Staff removed from Account 928, Regulatory Commission Expense, all expenses booked
27 II in the test year. Staff has made two separate adjustments to add back costs associated with
28 II current rate case and the PSC annual assessment.
Page 109
1 II The exclusion of prior rate case expenses from ongoing rate recovery is appropriate
2 II because recovery in rates of normalized rate case expenses, as with other expenses, should be on
3 II a prospective basis only. It is inappropriate to allow specific recovery in rates of amounts
4 II related to past rate proceedings. Also, Staff does not agree that rate case expense is an item that
5 II should be "amortized" in a rate case, as that implies an obligation to allow recovery of any
6 II unamortized costs in the utility's next rate proceeding. Instead, Staff asserts that the rate case
7 II expense incurred in relation to a current rate proceeding should be included in rates on a
811 "normalized" basis.
9 Rate case expense will also be examined in the true-up portion of this case. Accordingly,
1 0 II Staff will continue to examine the actual costs incurred by Empire relating to the processing of
11 II the rate case and include all prudently incurred expenses in the cost of service analysis.
1211 In September 2013, Stafffiled a report in Case No. AW-2011-0330 concerning the topic
13 II of rate recovery of rate case expense. Within that report, Staff examined recent trends in incurred
14 II rate case expense by major Missouri utilities, and discussed several possible options for
15 II allocation of rate case expense responsibility between utility shareholders and customers. In this
16 II case, Staff is recommending that Empire's rate case expenses be treated in the traditional
17 II manner; that is, the Company should be allowed an opportunity to recover in rates the full
18 II amount of reasonable and prudent rate case expenses through an expense normalization
19 II approach. However, Staff will continue to monitor the rate case expenses incurred by Empire
20 ~ and other Missouri utilities in current and future rate proceedings, and Staff reserves the right to
21 II propose "sharing" or another appropriate alternative approach to rate recovery of this item in
22 ~ future cases, if appropriate.
23 II In addition to rate case expense, Staff has included an annualized amount for the
24 II Company's PSC assessment expense that was issued on July 1, 2014 (fiscal year 2015).
25 II Staff Expert/Witness: Ashley R. Sarver
26 II 13. Injuries and Damages and Workers' Compensation
27 II Empire maintains workers' compensation insurance for the benefit of its employees. The
28 II workers' compensation adjustment proposed by Staff annualizes this expense based upon the
29 II premiums in effect at August 2014 to reflect an ongoing and normal expense level for Empire.
Page 110

1 II From time to time, Empire is sued by claimants seeking payment of damages. If Empire
2 II loses the lawsuit, it is likely to be required to make a payout to the aggrieved party.
3 II Alternatively, it may choose to enter into an out-of-court settlement, also resulting in a payout.
4 II Based upon generally accepted accounting principles, Empire is required to charge to current
5 II expense an estimate of its future payouts for injuries and damages claims. To determine a
6 II normalized level of this expense, Staff used a five-year average of actual injuries and
7 II damages and workers' compensation payments in its cost of service report, instead of relying
8 II upon accounting estimates. Staff applied an allocation of 49.62 percent to the five year average
9 II of actual payments made for injuries and damages. The allocation of 49.62 percent represents
10 II the electric expense portion ofthe payments. The remaining amounts ofthe payments (50.38%)
11 II are allocated to the Company's construction, water operations and below-the-line activities. A
12 II five-year average of actual payments was used to normalize this expense because Staffs analysis
13 II shows a considerable fluctuation in the annual amount of payments from one year to the next.
14 II Staff Expert/Witness: Ashley R. Sarver
15 II 14. Advertising Expense
16 II Empire engaged in advertising activities during the test year. In making its
17 II recommendation of the allowable level of Empire's advertising expense, Staff relied on the
18 II principles that the Commission determined were appropriate in KCPL Case No. E0-85-185,
19 II et al.57 The Commission recognized five categories of advertisements, and specified rate
20 II treatment for each of the following categories:
21 22
23 24
25 26
27
28
1.
2.
3.
4.
5.
General: informational advertising that is· useful in the provision of adequate service;
Safety: advertising which conveys the ways to safely use electricity and to avoid accidents;
Promotional: advertising used to encourage or promote the use of electricity;
Institutional: advertising used to improve the company's public image;
Political: advertising associated with political issues.
57 Re: Kansas City Power and Light Company, 28 Mo. P.S.C. (N.S.) 228, 269-71 (1986).
Page 111

1 II The Commission adopted these categories of advertisements and provided the rationale that a
2 II utility's revenue requirement should: 1) always include the reasonable and necessary cost of
3 II general and safety advertisements; 2) never include the cost of institutional or political
4 II advertisements; and 3) include the cost of promotional advertisements only to the extent that the
5 II utility can provide cost-justification for the advertisement.
6 II Following this guidance, Staffs adjustment excludes promotional and institutional
7 II advertising expenses from recovery in rates, in the amount of $155,394. Appendix 3,
8 II Schedule BMR-1 and Schedule BMR-2, are the two promotional ads Empire has coded to these
9 II advertising expenses, which Staff has excluded.
10 II Staff Expert/Witness: Brooke M Richter
11 II 15. Outside Services
12 II Various outside (independent) contractors and vendors provide legal, auditing, and other
13 II services to Empire to carry out its operational activities as needed. Staff reviewed Empire's test
14 II year outside services expense booked to Accounts 923.045 through 923.04 7. Staff normalized
15 II the amounts of outside services on a going forward basis by calculating a five-year average of
16 II incurred costs for these accounts in the amount of $2,660,341. This adjustment does not include
17 II outside services related to rate case expense. Outside services incurred for rate case purposes are
18 II booked in a separate account.
19 II Staff Expert/Witness: Brooke M Richter
20 II 16. Dues and Donations
21 II Staff reviewed the list of membership dues paid, and donations made, to vanous
22 II organizations that Empire charged to its utility accounts during the test year. Staff
23 II recommends adjustments to exclude various dues and donations that were included by Empire in
24 II its above-the-line expense accounts. In Re: Missouri Public Service, a Division of UtiliCorp
25 II United, Inc., Case Nos. ER-97-394, et al., Report and Order, 7 Mo.P.S.C.3d 178,212 (1998), the
26 Commission stated:
27 The Commission has traditionally disallowed donations such as these. 28 The Commission finds nothing in the record to indicate any discernible 29 ratepayer benefit results from the payment of these donations. The 30 Commission agrees with the Staff in that membership in the various 31 organizations involved in this issue is not necessary for the provision of 32 safe and adequate service to the MPS ratepayers.
Page 112

1 II Staff excluded dues and donations that do not have any direct benefit to ratepayers and were not
2 II necessary for the provision of safe and adequate service. Allowing Empire to recover these
3 II expenses through rates causes the ratepayer to involuntarily contribute to these organizations.
4 II Examples of dues excluded from recovery in the rate case are dues paid to the Home Builders
5 II Association, Rotary Club, and Twin Hills Golf and Country Club, etc. Examples of donations
6 II that were excluded include donated merchandise purchased from Wal-Mart Inc. Area Chamber
7 II of Commerce dues were allowed, but National and State Chamber of Commerce dues were
8 II disallowed as being duplicative costs to the local Chamber of Commerce organizations.
9 II Staff Expert/Witness: Brooke M Richter
10 II 17. EEl Dues
11 II According to information obtained from the Edison Electric Institute (EEl) website
12 II (www.eei.org), EEl is an association of investor owned electric utilities and industrial affiliates.
13 II From the information concerning EEl reviewed by Staff in this case, it is clear that a primary
14 II function of EEl is to represent the interests of the electric utility industry in the legislative and
15 II regulatory arenas. This role includes engagement in lobbying activities by EEL
16 II In Case No. ER-83-49, a KCPL rate increase case, the Commission stated its
17 determination that EEl dues:
18 ... would be excluded as an expense until the company could better 19 quantify the benefit accruing to both the company's ratepayers and 20 shareholders. ·
21 II This position has been re-affirmed by the Commission in subsequent rate proceedings.
22 II In Re: Kansas City Power & Light Co., Case Nos. E0-85-185 et al., Report and Order,
23 II 28 Mo.P.S.C. (N.S.) 228,259 (1986), the Commission stated:
24 ... The argument that allocation is not necessary if the benefits lessen the 25 cost of service to the ratepayers by more than the cost of the dues, misses 26 the point.
27 It is not determinative that the quantification of benefits to the ratepayer is 28 greater that the EEl dues themselves. The determining factor is what 29 proportion of those benefits should be allocated to the ratepayer as 30 opposed to the shareholder. It is obvious that the interests of the electric 31 industry are not consistently the same as those of the ratepayers. The 32 ratepayers should not be required to pay the entire amount of EEl dues if 33 there is benefit accruing to the shareholders from EEl membership as well.
Page 113

1 The Commission finds this to be the case. The Company has been 2 informed in prior rate cases that it must allocate its quantified benefits 3 from membership in EEL That has not been done herein. Therefore, no 4 portion of EEl dues will be allowed in this case.
5 II Empire failed to quantify ratepayer and shareholder benefits from its participation in EEl;
6 II therefore, the Staff removed EEl dues in the amount of$147,299 from Empire's cost of service.
7 II Staff Expert/Witness: Brooke M Richter
8 II 18. Tree Trimming Expense
9 II In Case No. ER-2008-0093, the Commission authorized Empire to set up a two-way
10 II tracker mechanism to account for any differences between Empire's incurred vegetation
11 II management expenses (i.e., tree trimming) and infrastructure remediation inspection costs
12 II compared to an estimated target annual amount of $8,575,000 for both items at that time. In its
13 II last rate case, No. ER-2012-0345, Staff and the Company agreed to continue the vegetation
14 II tracker; however, in the Non-Unanimous Stipulation and Agreement in Case No. ER-2010-0130
15 II the infrastructure tracker approved in the 2008 rate case was terminated. In Empire's prior rate
16 II case, No. ER-2012-0345, Staff recommended the tracker base amount be increased from
17 II $9 million to $12 million. In this current case, Staff has accepted Empire's recommendation to
18 II rebase the tracker amount from $12 million to $11 million, while continuing use of the tracker
19 II mechanism for vegetation management costs. Therefore, Staff is proposing an adjustment of
20 II ($1 million) be made to test year tree trimming expense.
21 II Staff made an adjustment to the remediation costs incurred in this case. These
22 II remediation costs were the result of the Company's preventive maintenance on its transmission
23 II and distribution system during the inspection cycles mandated under the Commission's
24 II infrastructure inspection rule. The remediation costs incurred over the last four years ending
25 II December 31, 2013 were reviewed by Staff and annualized to increase the test year expense level
26 II in the amount of$230,591.
27 II Staff Expert/Witness: Jermaine Green
28 II 19. SWP A Amortization
29 II As described previously in this Report, in Case No. ER-2011-0004, Empire agreed to
30 II flow the SWP A payment back to the customers over a ten year period via a tracker mechanism.
Page 114

1 II This yearly amortization, unlike other amortizations discussed in this Report, does not increase
2 II the Company's expense levels but is a reduction or offset to expenses. Empire's test year
3 II reflected too much amortization expense for this item, so an adjustment of $389,653 (Missouri
4 II jurisdictional) to was made to reflect an appropriate amount of annual amortization expense.
5 II Staff Expert/Witness: Kimberly K Bolin
6 II 20. Lease Expense
7 II Lease costs are those costs incurred by Empire for the leasing of its equipment and office
8 II space. The Staff examined these costs for the test year, updated through August 31, 2014, and
9 ~ made an adjustment to annualize these costs in rates.
10 II Staff submitted Data Request No. 0073 to Empire asking for a list of all lease agreements
11 II (office, vehicle, computers, etc.) charged to Missouri electric operations, along with the lease
12 II costs and information concerning all changes to the lease amounts since the beginning of the test
13 II year (May I, 2013). Staff used the information provided in this response to adjust Empire's
14 II lease expense to an annualized level ending August 31, 2014.
15 II Staff Expert/Witness: Ashley R. Sarver
16 II 21. Tornado AAO Amortization
17 II The Commission issued an order on November 30, 2011, that approved and incorporated
18 II the Stipulation and Agreement in Case No. EU-2011-0387. In this Stipulation and Agreement,
19 II the parties to that case agreed to allow Empire to defer to Account 182.3, Other Regulatory
20 II Assets, incremental operations and maintenance expenses associated with repair, restoration and
21 II rebuild activities associated with the May 22, 2011, tornado, and depreciation and carrying
22 II charges equal to its ongoing Allowance for Funds Used During Construction rates associated
23 II with tornado-related capital expenses. The Company agreed that if it filed a general rate case in
24 II Missouri by June 1, 2013, then Empire would begin to amortize over a ten year period, the
25 II deferral balance beginning on the earlier of: 1) the effective date of new rate implemented in its
26 II next general rate increase case or rate complaint case; or 2) June 1, 2013. As of August 31,
27 II 2014, Empire had a deferred balance of$3,454,918 in Account 182 for tornado-related expenses.
28 II Staff has not included this balance in rate base. Staff has made an adjustment to include an
29 II annual amortization of $402,515 in its cost of service.
30 II Staff Expert/Witness: Kimberly K Bolin
Page 115

1 II 22. Software Maintenance Expense
2 II Empire has contracts, operating licenses, and agreements with vendors that provide
311 maintenance, upgrades to software, and support for its computer software. Several of Empire's
4 software maintenance agreements began in calendar year 2014 and did not have an entire year of
5 II costs included in the test year or update period. Therefore, Staff made an adjustment of$215,776
6 II in Account 921- Office Supplies and Account 923- Outside Services to increase the software
711 maintenance expense to reflect the annualized amount of$1,043,170 as of August 31,2014. The
8 II software items that are included in these maintenance expenses are Triple Point INSSINC -
9 II Futrack, Intergraph GMS, Intergraph OMS, Maximo User License, Oracle PeopleSoft,
1 0 II Power Plant and Budgeting.
11 II Staff Expert/Witness: Paul R. Harrison
1211 X. Fuel Adjustment Clause (FAC)
13 II A. Policy
14 II In summary, Staff makes the following recommendations to the Commission regarding
15 II Empire's Fuel Adjustment Clause (FAC):
16 II 1. Continue Empire's F AC with modifications;
17 II 2. Modify the F AC to reflect the replacement of Southwest Power Pool's (SPP)
18 II Energy Imbalance Service (EIS) Market with the Integrated Marketplace
19 II (IM);
20 II 3. Include a revised Base Factor58 in the F AC tariff sheets calculated from the
21 Base Energy Cost and Revenues59 that the Commission includes in the
22 II revenue requirement upon which it sets Empire's general rates in this case;
23 II and
58 Base Factor is defined in Empire's 8th Revised Tariff Sheet No. 17 as "BASE FACTOR ("BF"): The base factor is the base energy cost divided by net generation kWh determined by the Commission in the last general rate case.
59 Base Energy Cost and Revenues is defined in Empire's 81h Revised Tariff Sheet No. I 7 as "Base energy
cost are ordered by the Commission in the last rate case consistent with the costs and revenues included in the calculation of the Fuel and Purchased Power Adjustment ("FPA") and include fuel costs incurred to support sales ("FC") plus purchased power costs ("PC") plus net emission costs ("E") minus off-system sales revenues ("OSSR") minus renewable energy credit revenue ("REC").
Page 116

1 II 4. Order Empire to continue to provide the additional information as part of its
2 II monthly reports60 as Empire first agreed to do in the Non-Unanimous
3 II Stipulation and Agreement filed May 12, 2010 in Case No. ER-2010-0130,
4 II and has continued to provide in its monthly reports.
5 II At this time Staff does not have its estimate for the Base Factor for the F AC, but will provide
6 II it and a discussion on the calculation of the Base Factor when Staff files its Class Cost
7 II of Service/Rate Design Report on February 11, 2015. Staff will use the Base Energy Cost
8 II and Revenues and the kWh at the generator from its fuel run to develop the Base Factor.
9 II In addition, Staff will provide a redline version of the revised tariff sheets as part of the Staff
10 II Class Cost-of-Service/Rate Design Report to be filed on February 11, 2015.
11 II Staff Expert/Witness: David C. Roos
12 II B. History
13 II Senate Bill 17961 ("SB 179") was passed and enacted in 2005. It authorized
14 II investor-owned electric utilities to file applications with the Commission requesting authority to
15 II make periodic rate adjustments outside of general electric rate proceedings for their prudently-
16 II incurred fuel and purchased power costs. SB 179 granted the Commission the authority to
17 II approve, modify, or reject the electric utility's request. SB 179 also stated that the rate schedules
18 II implementing these rate adjustments outside of the rate case may provide the electric utility with
19 II incentives to improve the efficiency and cost-effectiveness of its fuel and purchased power
20 II procurement activities.
21 II Prior to the passage of SB 179, fuel and purchased power costs were estimated and
22 II included in the determination of the utility's revenue requirement in general electric rate
23 II proceedings. If the electric utility managed its fuel and purchased power procurement activities
24 II in a manner that allowed it to reliably serve its customers at a cost lower than what was included
25 II in its revenue requirement in the general electric rate proceeding, the savings were retained by
26 II the electric utility. If actual fuel and purchased power costs were greater than the cost included
60 Monthly reports are required by 4 CSR 240-3.161(5). 61 Section 386.266, RSMo.
Page 117
1 II in the revenue requirement in the general electric rate proceeding, the electric utility absorbed the
21 increased cost.
3 The Commission first authorized a F AC for Empire in its Report and Order in
4 II Empire's 2008 rate case (Case No. ER-2008-0093), and approved F AC tariff sheets in that
5 II case with an effective date of September 1~ 2008. In Empire's 2010 general rate case, Case No.
6 II ER-2010-0130, 2011 general rate case, Case No. ER-2011-0004, and 2012 general rate case,
7 II Case No. ER-2012-0345, the Commission authorized continuation, with modifications,
8 II ofEmpire's FAC. The primary features of Empire's present FAC (tariff sheet numbers
9 II 17 through 17e) include:
10 11
12 13
14 15
16
17
18 19 20
21 22 23
• Two 6-month accumulation periods: March through August and September through February;
• Two 6-month recovery periods: December through May and June through November;
• Fuel Adjustment Rate (FAR) filings semi-annually not later than April 1 and October 1;
• One Base Factor for all calendar months of the year;
• A 95%/5% sharing mechanism;
• FAR rates for individual service classifications adjusted for the two Empire service voltage levels, rounded to the nearest $0.00001, and charged on each kWh billed; and
• True-up of any over- or under-recovery of revenues following each recovery period with a true-up amount being included in the determination ofF AR for a subsequent recovery period.
24 II Empire has made twelve FAR filings (File Nos. E0-2009-0349, ER-2010-0105, ER-2010-0275,
25 II ER-2011-0095, ER-2011-0320, ER-2012-0098, ER-2012-0326, ER-2013-0122, ER-2013-0442,
26 II ER-2014-0087, ER-2014-0264, and ER-2015-0085). The resulting changes to the Empire FARs
27 II ordered by the Commission are summarized in the Continuation ofFAC section of this Report.
28 II The Base Factor was originally set in Empire's 2008 general rate case and was changed as a
29 II result ofthe negotiated settlements in Empire's 2010, 2011, and 2012 general rate cases.
Page 118

Staff has filed four prudence review reports62 (File Nos. E0-20 10-0084, E0-20 11-0285,
2 /1 E0-2013-0114, and E0-2014-0057) concerning its review of the costs and revenues of the
3 II Company's F AC and found no evidence of imprudent decisions by the Company's management
4 II related to fuel, purchased power and net emission allowance costs, off-system sales revenues and
5 II renewable energy credits revenues for the time periods reviewed
6 II Staff Expert/Witness: David C. Roos
7 II C. Continuation ofFAC
811 Staff recommends that the Commission approve, with modifications, the continuation of
9 Empire's FAC.
10 II The Company has filed for and received approval of changes to its F ARs for twelve
11 II completed accumulation periods (AP) (API through AP12). The primary and secondary voltage
1211 F ARs for each accumulation period are reflected in Chart 1 below.
13
14
15
16 17 18 19 20 21
$0.00500
$0.00400
$0.00300 .::::
$0.00200 ~ ..:.: $0.00100 I. Q,j
c. $-(I;
$(0.00100)
$(0.00200)
$(0.00300)
Chart 1: Empire Fuel Adjustment Rates
API AP2 AP3 AP4 AP5 AP6 AP7 AP8 AP9 APIOAP11AP12
Accumulation Periods
ElPrimary Voltage FAR El Secondary Voltage FAR
The time periods of the APs are as follows:
AP 1 Sep 08 -Feb 09 AP3 Sep 09- Feb 10 AP5 Sep 10 - Feb 11 AP7 Sep 11 -Feb 12 AP9 Sep 12- Feb 13 APll Sep 13 -Feb 14
AP2 Mar 09 -Aug 09 AP4 Mar 10 -Aug 10 AP6 Mar 11 -Aug 11 AP8 Mar 12- Aug 12 AP 10 Mar 13 -Aug 13 AP12 Mar 14-Aug 14
62 4 CSR 240-20.090(7) Prudence Reviews Respecting RAMs [rate adjustment mechanisms]. A prudence review of the costs subject to the RAM shall be conducted no less frequently than at eighteen (18)-month intervals.
Page 119

1 II The Company's actual Base Energy Cost and Revenues have exceeded the then-effective Base
2 Factors multiplied by monthly usage billed to Empire's customers' in eight out of twelve
3 II completed accumulation periods. Base Energy Cost and Revenues include: Empire's total
4 II booked costs as allocated to its Missouri retail jurisdiction for fuel consumed in the Company's
51 generating units, including the costs associated with the Company's fuel hedging program;
6 purchased power energy charges, including applicable transmission fees; Southwest Power Pool
7 II variable costs; air quality control system consumables, such as anhydrous ammonia, limestone,
8 and powder activated carbon, and emission allowance costs. Base Energy Cost and Revenues do
9 not include the purchased power demand costs. F AC costs are off-set by off-system sales
1 0 revenues, any emission allowance revenues collected, and renewable energy credit revenues.
11 II During AP2, AP7, AP8, and AP9, Empire's Net Base Energy Cost exceeded actual Total Energy
12 II Cost63; 95% of such excess amounts were returned to customers during recovery periods (RP)
13 II RP2, RP7, RP8 and RP9. In eight of its accumulation periods (API, AP3, AP4, AP5, AP6,
14 II AP10, APll, and AP12), Empire under-collected its actual Total Energy Costs, and 95% of the
1511 amounts of under-collection were recovered from Empire's Missouri customers during recovery
16 periods RPl, RP3, RP4, RP5, RP6, RPIO, RP11, and RP12.
17 II At the conclusions of its general electric rate cases, during AP3, AP6, and AP10- Case
18 II Nos. ER-2010-0130, ER-2011-0004, and ER-2012-0345, respectively - the Base Factors in
19 II Empire's PAC were re-set.
20 II Charts 2 and 3 illustrate the following information for the first twelve accumulation
21 II periods: 1) cumulative under collection amount which is equal to Total Energy Cost (TEC) less
22 II Net Base Energy Cost ("B") for Empire's Missouri jurisdiction64, and 2) percentage of
2311 cumulative under-collection amount which is equal to 1 OO*(TEC-B)/TEC.
24
25
26
27
28
29 II continued on next page
63 Total Energy Cost includes: fuel and purchased power costs, net emission allowance costs less off-system sales revenues and renewable energy credit revenues.
64 For AP12, this is the amount on line 5 of Empire's 4th Revised Sheet No. 17e.
Page 120
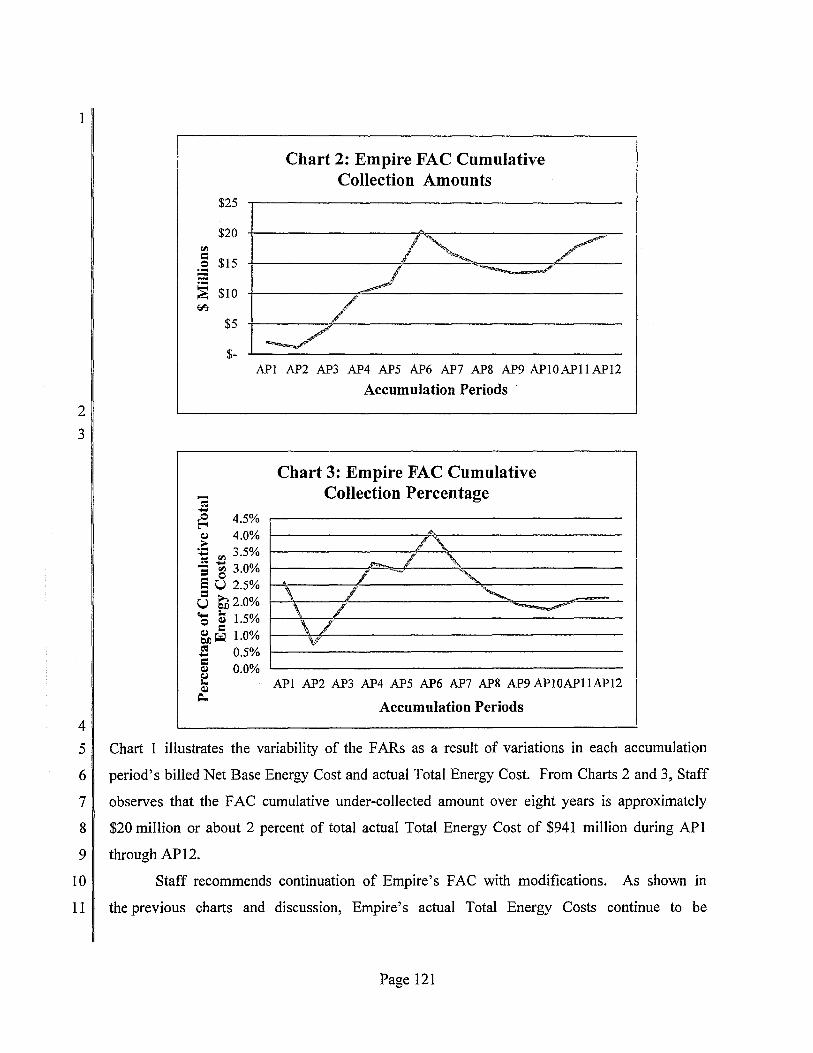
2
3
4
$25
$20 riJ
~ $15 -:§ $10 Gl':t
$5
$-
Chart 2: Empire FAC Cumulative Collection Amounts
___/ API AP2 AP3 AP4 AP5 AP6 AP7 AP8 AP9 APIOAPll API2
Accumulation Periods
] ~ 4.5%
~ 4.0% ~ riJ 3.5% = ~ 3.0% e u 2.5% = u 6Ji 2.0% '0 t 1.5% = ~~ 1.0% .s 0.5% = ~ 0.0%
""' Q,j
~
Chart 3: Empire FAC Cumulative Collection Percentage
A
/'\.. ~ / " / - ' ·-\ / ~ ........... ~, =
\ / \/ v
API AP2 AP3 AP4 AP5 AP6 AP7 AP8 AP9 APIOAPIIAPI2
Accumulation Periods
5 II Chart 1 illustrates the variability of the F ARs as a result of variations in each accumulation
6 ~ period's billed Net Base Energy Cost and actual Total Energy Cost. From Charts 2 and 3, Staff
7 II observes that the F AC cumulative under-collected amount over eight years is approximately
8 II $20 million or about 2 percent of total actual Total Energy Cost of $941 million during API
9 II through AP12.
10 II Staff recommends continuation of Empire's PAC with modifications. As shown in
II II the previous charts and discussion, Empire's actual Total Energy Costs continue to be
Page 121

1 II relatively large,65 volatile, and beyond the control of the Company. In addition, the SPP
2 II converting to the IM represents a fundamental change in how Empire's generation will be
3 II dispatched and how Empire serves its native load. By having an F AC that includes IM costs and
4 II revenues, the effects of the IM will flow through the FACto both the Company and its customers
5 II in a timely manner.
6 II Staff Expert/Witness: David C. Roos
7 II D. Southwest Power Pool Integrated Market
8 II On February 1, 2007, SPP started the EIS Market when it began dispatching wholesale
9 II electricity. The wholesale energy market is intended to allow for more efficient deployment of
10 II generation across the SPP region through the establishment of an offer-based market for energy
11 II imbalance services. The EIS market served as a real-time platform for generators to sell excess
12 II energy and for load servers to purchase that energy. The EIS helped to reduce the dependency
13 ~ on bilateral contracts, and sought to promote competition between generators to provide the
14 II lowest-priced energy, using locational imbalance pricing. The EIS Market has been replaced by
15 II the Integrated Marketplace (IM). The EIS Market was decommissioned March 11, 2014,
16 II following the start ofthe IM 10 days earlier, on March 1, 2014. This market expansion added a
17 II market functionality that coordinates next-day generation across the region with the goals of
18 II maximizing cost-effectiveness, providing participants with greater access to reserve energy,
19 II improving regional balancing of electricity supply and demand, and facilitating the integration of·
20 II renewable resources. Specifically, the Integrated Marketplace includes:
21 II • A Day-Ahead Market with Transmission Congestion Rights ("TCRs")
22 II • A Reliability Unit Commitment process
2311 • A Real-Time Balancing Market replacing SPP's Energy Imbalance Service 24 Market
25
26
• Incorporation of a price-based Operating Reserve Market
• Combining current Balancing Authorities into a single SPP Balancing Authority
27 II Empire is registered in the SPP IM as both a generating and load-serving entity. Empire's
28 II currently-approved F AC is structured to conform to the EIS market. In this rate case, Staff
65 Empire's proposed Base Energy Cost and Revenues for this case represent** __ **of the requested total revenue requirement.
Page 122 NP

1 II proposes changes to Empire's FAC tariff and the calculation of the FAC Base Factor to reflect
2 II Empire's participation in the new SPP IM. Staff's approach to modifying Empire's FAC is
3 II similar to the Company's approach in that both Staff and Empire used Ameren Missouri's
4 II current F AC tariff sheets as a template. The Ameren Missouri F AC tariff sheets were chosen as
5 II a template because parts of Empire's FAC tariff sheets, from Case No. ER-2012-0345, were
611 modeled after Ameren Missouri's FAC tariff sheets and because Ameren Missouri has been a
7 participant in the Midcontinent Independent System Operator (MISO) day ahead and real time
8 II markets since 2005, with MISO costs and revenues flowing through Ameren Missouri's F AC
9 II since January 2009. The SPP IM is similar to MISO's day ahead and real time markets.
10 II Staff Expert/Witness: David C. Roos
11 II E. Revising the Base Factor
12 II Correctly setting the Base Factor in Empire's FAC tariff sheets is critical to both a
13 II well-functioning FAC and a well-functioning FAC sharing mechanism. For the reasons below,
14 II Staff recommends the Commission require the Base Factor in Empire's FAC be set based on the
15 II Base Energy Cost and Revenues that the Commission includes in the revenue requirement which
16 II it sets Empire's general rates in this case.
17 II Table 1 below shows three scenarios in which the F AC Base Energy Costs and Revenues
18 II used to set the F AC Base Factor are equal to, less than, or greater than the Base Energy Cost and
1911 Revenues in the revenue requirement upon which the Commission sets general rates:
20
21
22
23
24
25
26
27
28
29
30 II continued on next page
Page 123

1 Table I: Base Energy Cost and Revenue Case Studies
Case3:Base Case 1: Base Energy Case 2: Base Energy Energy Cost in FAC
95%/5% Sharing Mechanism Example Cost in FAC.Eru!& Cost. in FAC Less Greater Than Base To Base Energy Cost Than Base Energy Energy Cost in Rev.
Line in Rev. Req. Cost in Rev. Req. Req. a Revenue Requirement $ 10,000,000 $ 10,000,000 $ 10,000,000 b Base Energy Cost and Revenue in Rev. Req. $ 4,000,000 $ 4,000,000 $ 4,000,000 c Base Energy Cost and Revenue in FAC $ 4,000,000 $ 3,900,000 $ 4,100,000
Outcome 1: Actual Energy Cost Greater Than Base Energy Cost in Revenue Requirement
d Actual Energy Cost and Revenue $ 4,200,000 $ 4,200,000 $ 4,200,000 Billed to Customer:
-b in Penmnent Rates $ 4,000,000 $ 4,000,000 $ 4,000,000
e = ( d - c ) x 0.95 throughFAC $ 190,000 $ 285,000 $ 95,000
f=b +e Total Billed to Customers $ 4,190,000 $ 4,285,000 $ 4,095,000
g -f-d Kept](Paid) by Com~ny $ (10,000) $ 85,000 $ (105,000)
Outcome 2: Actual Energy Cost Less Than Base Energy Cost in Revenue Requirement
h Actual Energy Cost and Revenue $ 3,800,000 $ 3,800,000 $ 3,800,000
Billed to Customer:
=b in Penmnent Rates $ 4,000,000 $ 4,000,000 $ 4,000,000
i=(h-c)x0.95 throughFAC $ (190,000) $ (95,000) $ (285,000]
j=b+i Total Billed to Customers $ 3,810,000 $ 3,905,000 $ 3,715,000
2 k=j-h Kept}(P_aid) by Com(J<lny $ 10,000 $ 105,000 $ (85,000]
3 II Case 1 illustrates that if the F AC Base Energy Costs and Revenues used for the
4 II Base Factor is equal to the Base Energy Costs and Revenues in the revenue requirement used for
5 II setting general rates, the utility does not over or under-collect as a result of the level of total
6 II actual energy costs. The F AC works as it is intended to.
7 II Case 2 illustrates that if the F AC Base Energy Costs and Revenues used for the Base
8 II Factor is less than the Base Energy Costs and Revenues in the revenue requirement used for
9 II setting general rates, the utility will collect more than was intended and customers pay more than
10 II the FAC was designed for them to pay, regardless of the level of actual energy costs.
11 II Case 3 illustrates that if the F AC Base Energy Costs and Revenues used for the
12 II Base Factor is greater than the Base Energy Costs and Revenues in the revenue requirement used
13 II for setting general rates, the utility will not collect all of the costs that was intended in the F AC
1411 design, and customers pay less than the entire amount intended regardless of the level of actual
15 energy costs.
1611 These three cases illustrate the importance of setting the Base Factor in the FAC
17 II correctly, i.e., revising the Base Factor to match the Base Energy Costs and Revenues in the
18 II revenue requirement used for setting general rates.
Page 124

1 II Another important reason to revise the Base Factor is to include the effects of SPP's IM.
2 II The accounting and calculations for the current Base Factor is based on the assumption that
3 II Empire is participating in SPP's EIS market. Since the EIS market has been replaced with the
4 II IM, the accounting and calculation of the Base Factor for this case must include the costs and
5 II revenues for the IM or the situations exemplified in either Case 2 or Case 3 will occur.
6 II Staff Expert/Witness: David C. Roos
7 II F. Additional Reporting Requirements
8 II Due to the accelerated Staff review process necessary with F AC adjustment filings66,
9 II Staff recommends the Commission order Empire to continue to provide the following
10 II information as part of its monthly reports as Empire first agreed to do in the Non-Unanimous
11 II Stipulation and Agreement filed May 12, 2010 in Case No. ER-2010-0130, and has continued to
12 II provide in its monthly reports:
13 II 1. Monthly Southwest Power Pool ("SPP") market settlements and revenue
14 II neutrality uplift charges;
15 II 2. Notify Staff within 30 days of entering a new long-term contract for
16 II transportation, coal, natural gas or other fuel; natural gas spot transactions are
17 II specifically excluded;
18 II 3. Provide Staff with a monthly natural gas fuel report that includes all
19 II transactions, spot and longer term; the report will include term, volumes, price
20 II and analysis of number ofbids;
21 II 4. Notify Staff within 30 days of any material change in Empire's fuel hedging .
22 II policy, and provide the Staff with access to new written policy;
23 II 5. Provide Staff its Missouri Fuel Adjustment Interest calculation workpapers in
24 II electronic format with all formulas intact when Empire files for a change in
25 II the cost adjustment factor;
26 II 6. Notify Staff within 30 days of any change in Empire's internal policies for
27 ~ participating in the SPP;
66 The Company must file its F AC adjustment 60 days prior to the effective date of its proposed tariff sheet. Staff has 30 days to review the filing and make a recommendation to the Commission. The Commission then has 30 days to approve or deny Staff's recommendation.
Page 125

1 II 7. Continue to provide Staff access to all contracts and policies upon Staff's
2 request, at Empire's corporate office in Joplin, Missouri.
3 II Staff Expert/Witness: David C. Roos
4 II G. Loss Study- Compliance with FAC Rules
511 Empire supplied Staff with a loss study in conjunction with the filing of their 2012 rate
6 case (ER-2012-0345). Although the Company did not file a loss study in the current case, the
7 loss study provided in 2012 allows Empire to remain in compliance with the rule requiring a
8 current loss study when requesting the initiation or the continuance of a Fuel Adjustment Clause
9 ("F AC") per 4 CSR 240-20.090(9). In order to remain in compliance with this rule, Empire
10 II should plan to provide a loss study in calendar year 2016 based on actual data recorded in
11 II calendar year 2015.
12 Sta.ffExpert/Witness: AlanJ. Bax
13 II H. Heat Rate Testing Review
14 II If an electric utility requests that a Rate Adjustment Mechanism, such as a Fuel
15 II Adjustment Clause (PAC) be continued or modified, Commission Rule 4 CSR 240-3.161(3)
16 II requires that the electric utility shall file specific information as part of its direct testimony in a
17 II general rate proceeding, including the following:
18 (Q) The results of heat rate tests and/or efficiency tests on all the 19 electric utility's nuclear and non-nuclear steam generators, HRSG, steam 20 turbines and combustion turbines conducted within the previous twenty-21 four (24) months;
22 II The Commission authorized Empire's PAC in Case No. ER-2008-0093. The PAC was continued
23 II in Case No. ER-2010-0130, Case No. ER-2011-0004 and Case No. ER-2012-0345.
24 II Empire has requested the F AC be continued in the current general rate proceeding, Case
25 II No. ER-2014-0351.
26 II Company witness Todd W. Tarter filed the results of the most recent heat rate/efficiency
27 II tests for the Company's generating units in his supplemental testimony as revised
28 II Schedule TWT-7 and also included revised Schedule TWT-7 in response to Data Request
29 II No. 0123. Staff has reviewed the summary results of those tests and compared the results
Page 126

1 II with the summary results from the previous general rate case proceeding and finds the results to
211 be similar.
3 With the exception of the Asbury unit, all generating units were tested within the
4 II previous 24 months, based on the filed data for the current general rate proceeding. Summary
5 II data provided for Asbury was completed in July of 2012, which is the month before the
6 II 24 month period in question. Empire has submitted an application for waiver concerning the
7 II 24 month heat rate testing requirement of Commission Rule 4 CSR 240-3.161(3)(Q) citing as
8 II good cause for the waiver recent modifications to the Asbury unit which Empire states will affect
9 II the unit's heat rate, and indicating the heat rate test will be completed and submitted to the
10 II Commission after the unit is operationa1.67 Staff finds Empire's approach and position
11 II concerning the Asbury heat rate testing to be reasonable and acceptable so long as the
12 II application is limited to a one-time variance and is not a permanent waiver.
13 II The heat rate/efficiency testing information for all other generating units appears to be
14 II reasonable and in compliance with Commission Rule 4 CSR 240-3.161(3)(Q).
15 II Staff Expert/Witness: Randy S. Gross
1611 XI. Miscellaneous
17 II A. Smart Grid Status
18 II This section provides information on the history and status of Empire's Smart Grid
19 II deployment and does not address any particular revenue requirements in this rate case. The
20 II Smart Grid electrical grid infrastructure components currently in operation or planned for the
21 II future includes the following:
22 23
24
25
• Smart Meters. Currently only electro-mechanical meters are deployed and the
Company has no Automated Meter Reading (AMR) meters deployed on its
system.68 There are currently no recent or near term studies planned concerning
AMI system implementation.69
67 Company response to Data Request MPSC No. 0123. 68 Empire Response to Data Request MPSC 0116. 69 Empire Response to Data Requests MPSC 0117 and 0119.
Page 127

1
2
3
4
5
6
7
8
9
10
11
12
13
14
15
16
17
18
19
20
21
22
23
24
25
• Transformer Insulating Oil Dissolved Gas Monitors. This equipment provides
real time monitoring of the moisture and combustible gases that are dissolved in
the insulating oil of three transmission (over 100 KV) autotransformers.70 The
detection of certain combustible gases and moisture provides an early warning
indication system of an impending transformer internal fault that will destroy the
transformer and cause significant collateral damage. **
**71
• Smart Line Switches. These devices are installed in Branson, M072, and detect
line disturbances and provide communication of abnormal electrical system
events to system operations personnel, isolate faulted lines, and restore service
via alternate paths.
**
**73
• Faulted Circuit Indicators. These devices provide information on line
disturbances and communicate this information to system operators in near real
time for faster identification of problems and locating faulted circuits. These
devices are currently installed where the three-phase supply service splits to serve
two different loads.74 ** -----------------------------------------
70 An autotransformer utilizes one set of windings with multiple connection points to change voltage levels. 71 Empire Response to Data Request MPSC 0105. 72 Empire Response to Data Request MPSC 0213 in Case No. ER-2012-0345. 73 Empire Response to Data Request MPSC 0101. 74 Empire Response to Data Request MPSC 0213 in Case No. ER-2012-0345.
Page 128 NP

1
2
3
4
5
6
7
8
9
10
11
12
13
14
15
16
17
18
19
20
21
22
23
**75
• Automatic Voltage Regulation and Control. Automatic voltage regulation is
installed at the majority of Empire's distribution substations and consists of
Voltage Regulators and/or Transformer load tap changers76. **
**77
• Automatic Supply Line Transfer. These systems are installed in Branson, M078
to detect supply line disturbances and automatically reconfigure distribution
substation switching to restore power following an outage.
**
**
• Microprocessor Relaying. For the past seventeen years, Empire has
been changing from electro-mechanical to digital relaying79 that provides
improved operating performance and self-diagnostic checks. **
**80
75 Empire Response to Data Request .MPSC 0 Ill. 76 Empire Response to Data Request .MPSC 0213 in Case No. ER-2012-0345. 77 Empire Response to Data Request .MPSC 0099. 78 Empire Response to Data Request .MPSC 0213 in Case No. ER-2012-0345. 79 Empire Response to Data Request .MPSC 0213 in Case No. ER-2012-0345. 80 Empire Response to Data Request .MPSC 0100.
Page 129 NP

• Phase Measurement Units (PMUs). These devices provide highly accurate
2 voltage, current, and frequency monitoring at strategic transmission points to
3 provide wide area situational awareness to detect impending serious upset
4 conditions and allow operator corrective actions to be taken to mitigate the event.
5 II **
6
7
8
9
10
11
12
13
14
15
16
17
18
19
20
21
22
23
24
**81
• Smart Line Regulators. The devices monitor and regulate line voltage via
remote control of the regulator's tap changing mechanism. **
**82
• Supervisory Control and Data Acquisition (SCADA). These systems are
deployed in the switchyards and provide real time outage notification for
enhanced outage response performance, improve operating flexibility, and
prevent overloads. Open Systems International (OSI)83 Energy Management
System (EMS) system upgrades were completed in September of201284•
• Outage Management System (OMS). This Intergraph85 InService Dispatcher
System was last upgraded in 2012 and is used as the outage and service order
management tool. This system determines the location of the failed field device
d . db 1· . 86 an IS use y me operatiOns.
• Wide Area Networks (WAN). A WAN is a high capacity communications
backbone network that transports large quantities of data to the Company's data
centers, most service centers and customer service offices. **
81 Empire Response to Data Request .MPSC 0110. 82 Empire Response to Data Request .MPSC 0112. 83 http://www.osii.com/index.asri?nsgc. 84 Empire Response to Data Request .MPSC 0213 in Case No. ER-2012-0345. 85 http://www.intergraph.com/utilities/oms.aspx. 86 Empire Response to Data Request MPSC 0104.
Page 130 NP

1 II **87 **
2 II **88
3 II Staff Expert/Witness: Randy S. Gross
4 II B. Light Emitting Diode (LED) Street and Area Lighting
5 II In paragraph 9 of the Nonunanimous Stipulation and Agreement Regarding
6 II Certain Revenue Requirement Issues, in Empire's most recent electric rate case, Case No.
7 II ER-2012-0345, Empire agreed to "either file LED street and area lighting ("SAL") tariff sheets
8 II or make an informational filing with the Commission to provide an update on an LED pilot study
9 II and plans for filing future LED SAL tariff sheets" within one year of the effective date of tariff
10 II sheets in Case No. ER-2012-0345, April1, 2014.
11 II On March 26, 2014, Empire had a meeting with Staff and the Office of the Public
12 II Counsel (OPC) to discuss its LED street lighting pilot approach. On April 1, 2014, Empire then
13 II filed a Notice Regarding LED SAL in Case No. ER-2012-0345. On July 10, 2014, Empire filed
14 II two (2) proposed tariff sheets bearing an effective date of August 9, 2014. The Commission
15 II assigned the tariff sheets Tariff Tracking No. JE-2015-0004. With these tariff sheets, Empire
16 II proposes a LED street light pilot program to gather financial and statistical information
17 II associated with LED technology for Empire's Missouri service area.
18 II Empire's proposed LED pilot program's primary goals are:
1911 1. Determine the overall suitability and feasibility of offering LED street lighting 20 as an option;
21 II 2. Determine community and municipal acceptance of LED street lighting;
22 3. Establish serviceability and maintenance costs associated with the LED street 23 lighting; and,
24 4. Facilitate the determination of permanent LED street lighting rates based upon 25 the financial and operating characteristics gathered during the LED pilot 26 program.
27 II Empire's proposed LED pilot program will be limited to up to five (5) different cities or
28 II municipalities within Empire's Missouri service territory currently taking street lighting service
87 Empire Response to Data Request MPSC 0213 in Case No. ER-2012-0345. 88 Empire Response to Data Request MPSC 0113.
Page 131 NP
1 II from Empire. Empire will select the location of each LED street light installation in consultation
2 II with the municipality involved. LED fixtures installed as part of the pilot study are limited to
3 II 150 and/or 250 W high-pressure sodium light equivalence. The rate charged for the LED lights
4 II installed during the duration for the LED pilot program will be the currently effective rates set
5 II forth in P.S.C. MO. No.5, Section 3, Sheet No. 1, which rates are subject to change from time to
6 II time pursuant to the authorization of the Commission. This pilot program will have a term of
7 II three years to facilitate the tracking of financial and mortality statistics over an extended period.
8 II All costs associated with the pilot program will be tracked to potentially facilitate the
9 II development of a permanent LED street light tariff at the conclusion of the pilot program. After
1 0 II two years of operation, Empire will evaluate the results of data at the pilot location and report the
11 I results to the Commission.
12 Staff Expert/Witness: Hojong Kang, Ph.D.
13 II C. Service Quality Reporting
14 II In the order approving the unanimous stipulation and agreement in Case No.
15 II, E0-2006-0205, the Commission required Empire to track and routinely report call center metrics
16 II to the Staff and the Office of the Public Counsel. Empire has provided these metrics including
17 II data on call center staffing, average speed of answer, and abandoned call rate on a quarterly
18 II basis. Staff receives comparable data from other utilities in the State of Missouri on a monthly
19 II basis. This data is valuable for monitoring trends and identifying service declines that can
20 II negatively impact customer service. In Staff's opinion the opportunity to review call center
21 II metrics on a monthly basis significantly improves its ability to identify important trends affecting
22 II customer service. The Staff recommends that the Commission require Empire to provide its call
23 II center metrics on a monthly basis rather than quarterly. Company management has indicated to
24 II Staff that it is exploring options to accommodate the Staff's request for monthly data.
25 II Staff Expert/Witness: Gary R. Bangert
26 II Appendices:
27 II Appendix 1: Staff Credentials
28 II Appendix 2: Support for Staff Cost of Capital Recommendation
29 II Appendix 3: Alphabetical Listing of Testimony Schedules
Page 132

BEFORE THE PUBLIC SERVICE COMMISSION
OF THE STATE OF MISSOURI
In the Matter of The Empire District Electric ) Company for Authority to File Tariffs ) Increasing Rates for Electric Service Provided ) to Customers in the Company's Missouri ) Service Area )
Case No. ER-2014-0351
AFFIDAVIT OF GARY BANGERT
STATE OF MISSOURI
COUNTY OF COLE
) ) )
ss
Gary Bangert, of lawful age, on his oath states: that he has participated in the preparation of the foregoing Staff Report as identified in the individual sections as identified in the Table of Contents of said Report; that he has knowledge of the matters set forth in such Report; and that such matters are true to the best of his knowledge and belief.
Subscribed and sworn to before me this c2? Ji day of January, 2015.
D. SUZIE MANKIN Notary Public - Notary Seal
State of Missouri Commissioned tor Cole
My Commission Expires: December Commission Number: 124120

BEFORE THE PUBLIC SERVICE COMMISSION
OF THE STATE OF MISSOURI
In the Matter of The Empire District Electric ) Company for Authority to File Tariffs ) Increasing Rates for Electric Service Provided ) to Customers in the Company's Missouri ) Service Area )
Case No. ER-2014-0351
AFFIDAVIT OF ALAN J. BAX
STATE OF MISSOURI
COUNTY OF COLE
) ) )
ss.
Alan J. Bax, of lawful age, on his oath states: that he has participated in the preparation of the foregoing Staff Report as identified in the individual sections as identified in the Table of Contents of said Report; that he has knowledge of the matters set forth in such Report; and that such matters are true to the best of his knowledge and belief.
dftl11W i
AlanJ. Bax
Subscribed and sworn to before me this 12 1? ./:{ day of January, 2015.
Commissioned for Cole County My Commission Expires: December 12, 2016
Commission Number: 12412070
ilL~~_L~ tary Public

BEFORE THE PUBLIC SERVICE COMMISSION
OF THE STATE OF MISSOURI
In the Matter of The Empire District Electric ) Company for Authority to File Tariffs ) Increasing Rates for Electric Service Provided ) to Customers in the Company's Missouri ) Service Area )
Case No. ER-2014-0351
AFFIDAVIT OF KIMBERLY K. BOLIN
STATE OF MISSOURI
COUNTY OF COLE
) ) )
ss.
Kimberly K. Bolin, of lawful age, on her oath states: that she has participated in the preparation of the foregoing Staff Report as identified in the individual sections as identified in the Table of Contents of said Report; that she has knowledge of the matters set forth in such Repmi; and that such matters are true to the best of her knowledge and belief
Subscribed and sworn to before me this ,529-4 day of January, 2015.
0. SUZIE MANKIN Notary Public - Notary Sea1
State of Missouri Commissioned for Cole Coutrty
My Commission Expires: December 12, Z\116 Commission Number: 124120

BEFORE THE PUBLIC SERVICE COMMISSION
OF THE STATE OF MISSOURI
In the Matter of The Empire District Electric ) Company for Authority to File Tariffs ) Increasing Rates for Electric Service Provided ) to Customers in the Company's Missouri ) Service Area )
Case No. ER-2014-0351
AFFIDAVIT OF BRAD J. FORTSON
STATE OF MISSOURI
COUNTY OF COLE
) ) )
ss.
Brad J. Fortson, of lawful age, on his oath states: that he has participated in the preparation of the foregoing Staff Report as identifl.ed in the individual sections as identified in the Table of Contents of said Report; that he has knowledge of the matters set forth in such Report; and that such matters are true to the best of his knowledge and belief.
Subscribed and sworn to before me this c2CJI:£ day of January, 2015.
0. SUZIE MANKIN Notary Public - Notary Seat
State of Missouri Commissioned for Cole county
My Commission Expires: December 12, 2016 .. Commission Number: 12412070
!)_L ~~ 1 No~blic

BEFORE THE PUBLIC SERVICE COMMISSION
OF THE STATE OF MISSOURI
In the Matter of The Empire District Electric ) Company for Authority to File Tariffs ) Increasing Rates for Electric Service Provided ) to Customers in the Company's Missouri ) Service Area )
Case No. ER-2014-0351
AFFIDAVIT OF JERMAINE GREEN
STATE OF MISSOURI
COUNTY OF COLE
) ) )
ss.
Jermaine Green, of lawful age, on his oath states: that he has participated in the preparation of the foregoing Staff Report as identified in the individual sections as identified in the Table of Contents of said Report; that he has knowledge of the matters set forth in such Report; and that such matters are true to the best of his knowledge and belief.
Subscribed and sworn to before me this c2 t./-lfi day of January, 2015.
D. SUZIE MANKIN Notary Public - Notary Seal
State of Missouri Commissioned for Cole County
My Commission Expires: December 12, 2{)16 Commi~§jgD Number: 12412070
[)j~ ~ NO' yPUblic

BEFORE THE PUBLIC SERVICE COMMISSION
OF THE STATE OF MISSOURI
In the Matter of The Empire District Electric ) Company for Authority to File Tariffs ) Increasing Rates for Electric Service Provided ) to Customers in the Company's Missouri ) Service Area )
Case No. ER-2014-0351
AFFIDAVIT OF SHANA GRIFFIN
STATE OF MISSOURI
COUNTY OF COLE
) ) )
ss.
Shana Griffin, of lawful age, on her oath states: that she has participated in the preparation of the foregoing Staff Report as identified in the individual sections as identified in the Table of Contents of said Report; that she has knowledge of the matters set forth in such Repmt; and that such matters are true to the best of her knowledge and belief.
Subscribed and sworn to before me this
0. SUZIE MANKIN Notary Public - Notary Seat
State of Missourf Commissioned for Cole County
My Commission Expires: December 12, 201 6 Commission Number: 12412070
d~) /:{ day of January, 2015.
~ ' NafYPUbiiC

BEFORE THE PUBLIC SERVICE COMMISSION
OF THE STATE OF MISSOURI
In the Matter of The Empire District Electric ) Company for Authority to File Tariffs ) Increasing Rates for Electric Service Provided ) to Customers in the Company's Missouri ) s~~kro )
Case No. ER-20 14-0351
AFFIDAVIT OF RANDY S. GROSS
STATE OF MISSOURI
COUNTY OF COLE
) ) )
ss.
Randy S. Gross, of lawful age, on his oath states: that he has participated in the preparation of the foregoing Staff Report as identified in the individual sections as identified in the Table of Contents of said Report; that he has knowledge of the matters set forth in such Report; and that such matters are true to the best of his knowledge and belief.
Subscribed and sworn to before me this
D. SUZIE MANKIN Notary Public - Notary Seal
State of Missouri Commissioned for Cole County
My Commission ExPires: December 12, 2016 Commission Number: 12412070
Uj) Randy S. Gross
c:J94 day of January, 2015.
BEFORE THE PUBLIC SERVICE COMMISSION
OF THE STATE OF MISSOURI
In the Matter of The Empire District Electric ) Company tbr Authority to File Tariffs ) Increasing Rates fbr Electric Service Provided ) to Customers in the Company's Missouri ) Service Area )
Case No. ER-2014-0351
AFFIDAVIT OF PAUL R. HARRISON
STATE OF MISSOURI
COUNTY OF COLE
) ) )
ss.
Paul R. Harrison, of lawful age, on his oath states: that he has participated in the preparation of the foregoing Staff Report as identified in the individual sections as identified in the Table of Contents of said Report; that he has knowledge of the matters set forth in such Report; and that such matters are true to the best of his knowledge and belief
Paul R. Harrison
Subscribed and sworn to before me this ,;2 9 /It day of January, 2015.
D. SUZIE MANKIN Notary Public • Notary Seal
State of Missouri Commissioned for Cole County
~~ My Commission Expires: December 12, 2016
Commission Number: 12412070
tary Public

BEFORE THE PUBLIC SERVICE COMMISSION
OF THE STATE OF MISSOURI
In the Matter of The Empire District Electric ) Company for Authority to File Tarifis ) Increasing Rates for Electric Service Provided ) to Customers in the Company's Missouri ) Service Area )
Case No. ER-2014-0351
AFFIDAVIT OF HOJONG KANG, PHD
STATE OF MISSOURI
COUNTY OF COLE
) )
) ss.
Hojong Kang, PhD, of lawful age, on his oath states: that he has participated in the preparation of the foregoing Staff Report as identified in the individual sections as identified in the Table of Contents of said Report; that he has knowledge of the matters set forth in such Report: and that such matters are true to the best of his knowledge and belief.
Subscribed and sworn to before me this d Cj /-4 day of January, 2015.
D. SUZIE MANKIN Notary Public - Notary Seal
State of Missouri Commissioned tor Cole County
My Commission Expires: December 12, 2016 Commission Number: 12412070
Jf)J. ~ ~ ".&::.
Nbtary Public

BEFORE THE PlJBLIC SERVICE COMMISSION
OF THE STATE OF MISSOURI
In the Matter of The Empire District Electric ) Company for Authority to File Tariffs ) Increasing Rates for Electric Service Provided ) to Customers in the Company's Missouri ) Service Area )
Case No. ER-2014-0351
AFFIDAVIT OF ROBIN KLIETHERMES
STATE OF MISSOURI
COUNTY OF COLE
) ) )
ss.
Robin Kliethennes, of lawful age, on her oath states: that she has participated in the preparation of the foregoing Staff Report as identified in the individual sections as identified in the Table of Contents of said Report; that she has knowledge of the matters set forth in such Report; and that such matters are true to the best of her knowledge and belief.
Subscribed and swom to before me this
D. SUZIE MANKIN Notary Public - Notary Seal
State of Missouri Commissioned for Cole County
My Commission Expires: December 12, 2016 Commission Number: 12412070
Robin Kliethermes
c2 9-1:£ day of January, 2015.
~- 1 <
~~~.J N: ry Public

BEFORE THE PUBLIC SERVICE COMMISSION
OF THE STATE OF MISSOURI
In the Matter of The Empire District Electric ) Company for Authority to File Tariffs ) Increasing Rates for Electric Service ) Provided to Customers in the Company's ) Missouri Service Area )
Case No. ER-2014-0351
AFFIDAVIT OF SARAH L. KLIETHERMES
STATE OF MISSOURI
COUNTY OF COLE
) ) )
ss.
Sarah L. Kliethem1es, of lawful age, on her oath states: that she has participated in the preparation of the foregoing Staff Report as identified in the individual sections as identified in the Table of Contents of said Report; that she has knowledge of the matters set forth in such Report; and that such matters are true to the best of her knowledge and belief.
~"'~ L Sarah L. Kliethermes
Subscribed and sworn to before me this c21-li._ day of January, 2015.
~ Not· Pubhc

BEFORE THE PUBLIC SERVICE COMMISSION
OF THE STATE OF MISSOURI
In the Matter of The Empire District Electric ) Company for Authority to File Tariffs ) Increasing Rates for Electric Service Provided ) to Customers in the Company's Missouri ) Service Area )
Case No. ER-2014-0351
AFFIDAVIT OF SHAWN E. LANGE
STATE OF MISSOURI
COUNTY OF COLE
) ) )
ss.
Shawn E. Lange, of lawful age, on his oath states: that he has participated in the preparation of the foregoing Staff Repm1 as identified in the individual sections as identified in the Table of Contents of said Report; that he has knowledge of the matters set forth in such Report; and that such matters are true to the best of his knowledge and belief.
Subscribed and sworn to before me this
D. SUZIE MANKIN Notary Public - Notary Sea!
State of Missouri Commissioned for Cole County
My Commission Expires: December 12, 2016 Commission Number: i 2412070
~~ t ckrNf
c214 day of January 2015.

BEFORE THE PUBLIC SERVICE COMMISSION
OF THE STATE OF MISSOURI
In the Matter of The Empire District Electric ) Company for Authority to File Tariffs ) Increasing Rates for Electric Service Provided ) to Customers in the Company's Missouri ) Service Area )
Case No. ER-2014-0351
AFFIDAVIT OF ERIN L. MALONEY
STATE OF MISSOURI
COUNTY OF COLE
) ) )
ss.
Erin L. Maloney, of lawful age, on her oath states: that she has participated in the preparation of the foregoing Staff Report as identified in the individual sections as identified in the Table of Contents of said Report; that she has knowledge of the matters set forth in such Report; and that such matters are true to the best of her knowledge and belief
Subscribed and sworn to before me this
D. SUZIE MANKIN Notary Public • Notary Seal
State of Missouri Commissioned for Cole County
My Commission Expires: December 12, 2016 Commission Number: 12412070
(:;2_ LJ 4 day of January 2015.
~~~ otary Public

BEFORE THE PUBLIC SERVICE COMMISSION
OF THE STATE OF MISSOURI
In the Matter of The Empire District Electric ) Company for Authority to File Tariffs ) Increasing Rates for Electric Service Provided ) to Customers in the Company's Missouri ) Service Area )
Case No. ER-2014-0351
AFFIDAVIT OF BROOKE M. RICHTER
STATE OF MISSOURI
COUNTY OF COLE
) ) )
ss.
Brooke M. Richter, of lawful age, on her oath states: that she has participated in the preparation of the foregoing Staff Report as identified in the individual sections as identified in the Table of Contents of said Report; that she has knowledge of the matters set forth in such Repmt; and that such matters are true to the best of her knowledge and belief.
Subscribed and sworn to before me this c21 /:i day of January, 2015.
D. SUZIE MANKIN Notary Public - Notary Seal
State of Missouri Commissioned for Cole County
My Commission Expires: December 12, 2016 Commission Number: 12412070
[)~ ' NfYPUbliC
BEFORE THE PUBLIC SERVICE COMMISSION
OF THE STATE OF MISSOURI
In the Matter of The Empire District Electric ) Company for Authority to File Tariffs ) Increasing Rates for Electric Service Provided ) to Customers in the Company's Missouri ) Service Area )
Case No. ER-2014-0351
AFFIDAVIT OF JOHN A. ROBINETT
STATE OF MISSOURI
COUNTY OF COLE
) ) )
ss.
John A. Robinett, of lawful age, on his oath states: that he has participated in the preparation of the foregoing Staff Repmi as identified in the individual sections as identified in the Table of Contents of said Report; that he has knowledge of the matters set forth in such Report; and that such matters are true to the best of his knowledge and belief.
Subscribed and sworn to before me this
D. SUZIE MANKiN Notary Public - Notary Seal
State of Missouri Commissioned for Cole County
My Commission Expires: December 12, 2016 Commission Number: 12412070
d-:a.~ John A. Robinett
c2 9-({ day of January, 2015.

BEFORE THE PUBLIC SERVICE COMMISSION
OF THE STATE OF MISSOURI
In the Matter of The Empire District Electric ) Company for Authority to File Tariffs ) Increasing Rates for Electric Service Provided ) to Customers in the Company's Missouri ) Service Area )
Case No. ER-2014-0351
AFFIDAVIT OF DAVID C. ROOS
STATE OF MISSOURI
COUNTY OF COLE
) ) )
ss
David C. Roos, of lawful age, on his oath states: that he has participated in the preparation of the foregoing Staff Report as identified in the individual sections as identified in the Table of Contents of said Report; that he has knowledge of the matters set forth in such Report; and that such matters are true to the best of his knowledge and belief.
Me~ David C. Roos
Subscribed and sworn to before me this c:2CJ4 day of January, 2015.
0. SUZIE MANKIN Notary Public - Notary Seal
State of Missouri Commissioned for Cole County
My Commlsslan Expires: December 12, 2016 Commission NumbAr 12412070 ~ N' aryPubhc

BEFORE THE PUBLIC SERVICE COMMISSION
OF THE STATE OF MISSOURI
In the Matter of The Empire District Electric ) Company for Authority to File Tarifis ) Increasing Rates for Electric Service Provided ) to Customers in the Company's Missouri ) Service Area )
Case No. ER-2014-0351
AFFIDAVIT OF ASHLEY R. SARVER
STATE OF MISSOURI
COUNTY OF COLE
) ) )
ss.
Ashley R. Sarver, of lavvful age, on her oath states: that she has participated in the preparation of the foregoing Staff Report as identified in the individual sections as identified in the Table of Contents of said Report; that she has knowledge of the matters set forth in such Report; and that such matters are true to the best of her knowledge and belief.
Subscribed and sworn to before me tllis c2 CJJi day of January, 2015.
Commissioned for Cole County My Commission Expires: December 12, 2016
Commission Number: 12412070 ~~ ~l~ ry Public

BEFORE THE PUBLIC SERVICE COMMISSION
OF THE STATE OF MISSOURI
In the Matter of The Empire District Electric ) Company for Authority to File Tariffs ) Increasing Rates for Electric Service Provided ) to Customers in the Company's Missouri ) Service Area )
Case No. ER-2014-0351
AFFIDAVIT OF MICHAEL L. STAHLMAN
STATE OF MISSOURI
COUNTY OF COLE
) ) )
ss.
Michael L. Stahlman, of lawful age, on his oath states: that he has participated in the preparation of the foregoing Staff Report as identified in the individual sections as identified in the Table of Contents of said Report; that he has knowledge of the matters set forth in such Report; and that such matters are true to the best of his knowledge and belief.
Michael L. Stahlman
Subscribed and sworn to before me this c.2 CJ 4 day of January 2015.
D. SUZIE MANKIN Notary Public - Notary Seal
State of Missouri Commissioned for Cole County
My Commission Expires: December 12,2016 Commission Number: 12412070
~ ~) ~~

BEFORE THE PUBLIC SERVICE COMMISSION
OF THE STATE OF MISSOURI
In the Matter of The Empire District Electric ) Company for Authority to File Tariffs ) Increasing Rates for Electric Service Provided ) to Customers in the Company's Missouri ) Service Area )
Case No. ER-2014-0351
AFFIDAVIT OF SEOUNG JOUN WON, PHD
STATE OF MISSOURI
COUNTY OF COLE
) ) )
ss.
Seoung Joun Won, PhD, of lav,rful age, on his oath states: that he has participated in the preparation of the foregoing Staff Report as identified in the individual sections as identified in the Table of Contents of said Report; that he has knowledge of the matters set forth in such Report; and that such matters are true to the best of his knowledge and belief.
s/
Subscribed and sworn to before me this c2 9-/!::.. day of January, 2015.
D. SUZIE MANKIN Notary Public - Notary Seal
State of Missouri Commissioned for Cole County
My Commission Expires: December 12, 2016 Commission Number: 12412070
Jli~) N• a