staffing statistics
TRANSCRIPT
Staffing Statistics Including Equality Act 2010 publication of equality
information
December 2020
Produced by Human Resources
2
Introduction
This is the thirteenth annual staffing statistics report produced by HR. The purpose of the report is to provide managers and other users with up to date information about UWE’s workforce profile and to highlight emerging trends. Managers and other users will be able to use this information to identify where we need to make improvements. UWE has a longstanding commitment to the promotion of equality, diversity and inclusivity and undertakes a wide range of activities to promote better outcomes and meet the needs of different groups of staff. In November 2016, we published Inclusivity 2020, our second full single equality scheme (2017-2020) which spells out how we intend to embed inclusivity in both strategic and day-to-day activities. It can be accessed on the UWE website: www.uwe.ac.uk/equalityanddiversity. This staffing statistics report provides the information needed to monitor progress; it also provides a rich source of data for managers carrying out equality analysis. This report will additionally assist us to track our equality objectives on staff recruitment, development and promotion. The data is taken from a snapshot of the staff population on 31 December 2020 held in the University’s HR payroll system, iTrent. The database is populated from information supplied by new staff on their application forms. iTrent Employee Self Service enables staff to update their own equality data directly into the system. This report should be read in conjunction with results from the most recent staff survey available in the HR intranet (UWE login required). The University’s latest statutory Gender pay gap reporting is available here. Information about Vice Chancellor pay is available in the University’s Annual Report and Financial Statement.
The University also publishes annual statistics on its students and the latest report can be found here. I hope you find the report interesting and informative. If you have any ideas for how it might be improved, or have any queries relating to the data and its analysis, then please contact Lesley Donnithorne in the Human Resources ([email protected]). Alison McIver Director of HR and OD May 2021

3
Contents
The report is separated into sections covering different topic areas.
Section 1 – Staff Employment Page
Staff/students full time equivalent (FTE) ratios………………………………………………….. 5 Total UWE expenditure and staff costs……………………………………………………………… 5 Staff by faculties or services…………………………………………………………………………….. 6/7 Staff by employee group…………………………………………………………………………………. 6 Section 1.1 – Staff Employment by Sex Employee group by sex ….. …………………………………………………………… 8 Female staff in senior academic/management grades………………………. 8 Female staff in senior professional services grades…………………………… 9 Family friendly leave……………………………………………………………………… 12 Child care vouchers……………………………………………………………………….. 13 Section 1.2 – Staff Employment by Ethnicity Staff by ethnicity and by ethnic origin....………………………………………….. 14 Black and minority ethnic staff in senior grades...…………………………….. 18 Staff by nationality………………………………………………………………………... 18 Section 1.3 – Staff Employment by Disabled Status Disabled staff, overall and in senior grades………………………………………. 19 Section 1.4 – Staff Employment by Age Staff by age band by sex………………………………………………………………... 22 Section 1.5 – Staff Employment by LGB Staff by sexual orientation………………………………………………………………. 23 Section 1.6 – Staff Employment by Religion and Belief Staff by religion and belief………………………………………………………….…… 24 Section 1.7 – Staff Employment by Trans/Transgender Staff by trans/transgender …………………….……………………………………….. 25 Section 1.8 – Staff Employment by Contract Term Staff by permanent, fixed term, temporary by equality group…………..… 26 Section 1.9 – Staff Employment by Contract Mode Staff by full time/part time contract by equality group………..…..………… 28

4
Section 2 – Staff Recruitment Success rates by equality group…………………………………………………………………..….. 30 Temporary Staff Unit recruitment success rates by equality group…………….………… 32 Internal candidate success rates by equality group……………………………………..…….. 34
Section 3 – Leavers Turnover rates……………………………………………………………………………………….………. 36 Reasons for leaving………………………………………………………………………………………… 36
Section 4 – Staff Development and Career Progression Internal training attendances by equality group…………………………………….…………. 39 Career progressions by equality group………………………………………………………..…… 40
Section 5 – Formal Procedures Staff grievances by equality group…………………………………………………………………… 42 Staff disciplinary cases by equality group…………………………………………….…………… 43
Section 6 – Sickness Absence UWE sickness rates overall and by faculty/service……………………………………..……… 44 UWE sickness rates by equality group…………….………………………………………..……… 45 Reasons for sickness absence…………………………………………………………………………. 46 ..
Section 7 – Employee Assistance Programme (EAP)
Use of EAP Services……………………………………………………………………………………….. 48
Section 8 – Benchmark Performance Indicators
Comparisons with other Universities and UWE targets……………………………….………. 49

5
Section 1 – Staff Employment
This chart shows over time the ratio of student Full Time Equivalents (FTEs) to each staff FTE, including all employee groups (senior management, academic and professional services). In 2019/20 the ratio was 7.5 students to each staff member.
UWE’s staff costs as a proportion of its total expenditure decreased in 2019/20 to 59.6% from 61.2% in 2018/19.

6
In 2020 51% of staff were located in faculties and 49% in services. In 2020 there has been a 1.1% increase in FTEs compared to 2019. A breakdown of the data, including by individual faculty and service, is in Table 1 on page 7.
Staff by Employee Group 2020
In term of headcount, the largest employee group is administrative/ professional and the smallest is senior management. A breakdown by sex including historical data is in Table 2 on page 10/11.

7
TABLE 1 – STAFF IN POST AT 31/12/2020
* FTE = full time equivalent 1 FTE relates to the total for the previous academic year.
FACULTY/SERVICE
HEADS
2020
FTE*
2020
HEADS
2019
FTE*
2019
HEADS
2018
FTE*
2018
ACE Faculty of Arts Crtv Inds & Eductn 364 297 363 295 343 276
FBL Faculty of Business & Law 315 295 309 288 319 294
FET Faculty of Environment & Technology 499 460 490 447 483 442
HAS Faculty of Health & Applied Sciences 652 566 625 544 600 522
Faculty totals 1830 1618 1787 1573 1745 1534
APD Academic Practice Directorate 15 12 18 14 14 12
DIR Directorate 47 44 45 42 44 41
FAC Facilities 499 389 503 392 499 387
FIN Finance Department 90 81 91 82 93 86
HRS Human Resources 65 57 63 54 74 64
ITS IT Services 168 162 180 173 177 171
LCI Library Careers and Inclusivity 244 190 233 183 228 173
RBI Research Business & Innovation 98 81 97 81 93 78
SAS Student and Academic Services 373 318 392 330 416 355
SCM Strategic Communications and Marketing 82 70 77 66 79 69
SFS Future Students 101 89 108 96 102 89
SPO Strategic Programmes Office 33 31 26 25 24 23
Service totals 1815 1525 1833 1536 1843 1547
Associate Lecturers/Instructors 1
379 97 363 82 392 65
Temporary staff (in assignment) 155 45 99 39 118 35
All staff 4179 3285 4082 3230 4098 3181
All staff excluding Associate
Lecturers/instructors/temporary staff 3645 3143 3620 3109 3588 3081

8
Section 1.1 - Staff by Sex
Employee Group by Sex 2020
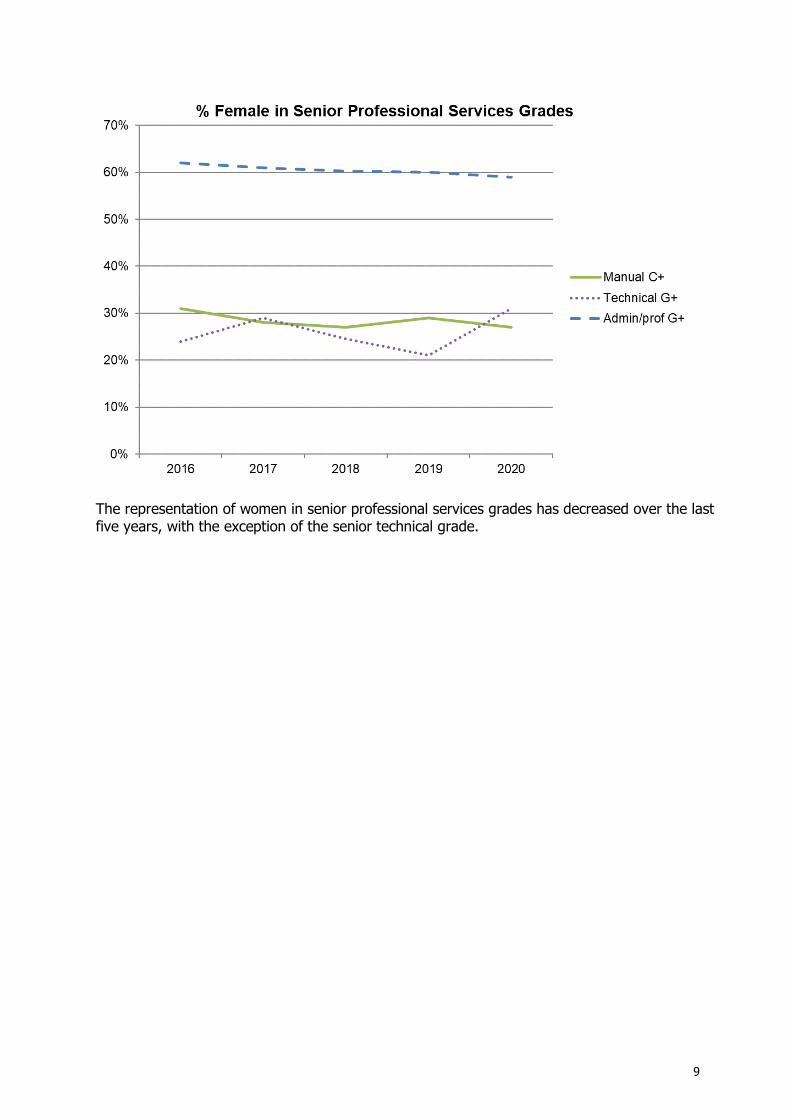
Academic and administrative/professional are the largest staff groups; senior management is the smallest. The UWE workforce is 59% female and 41% male but there are differences in male/female balance between the employee groups. A full breakdown, including historical data, is available in Table 2 on page 10.
The representation of women in senior academic and management grades has generally increased over time, with significant increases in the senior research grade.
9
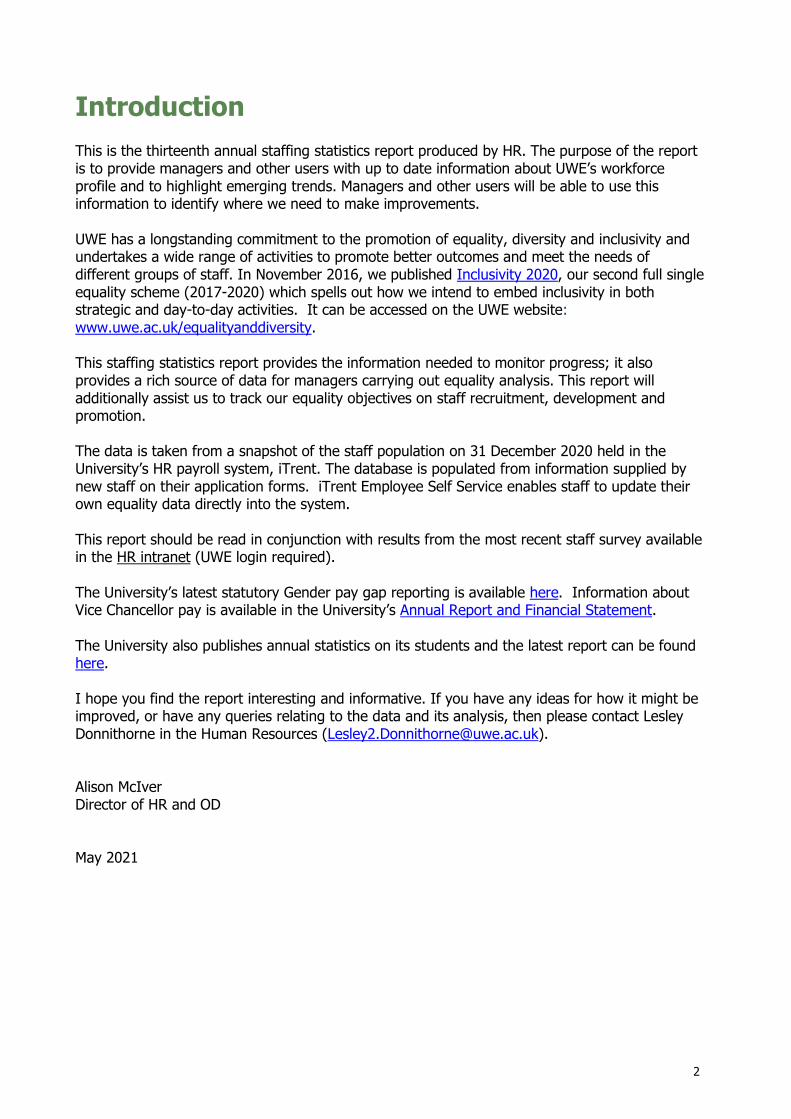
The representation of women in senior professional services grades has decreased over the last five years, with the exception of the senior technical grade.
10
TABLE 2 – EMPLOYEE GROUP AND GRADE BY SEX
Table continued on next page
GRADE YEAR ALL
HEADS
MALE MALE % FEMALE FEMALE %
2020 76 34 45% 42 55%
2019 73 35 48% 38 52%
2018 81 38 47% 43 53%
Grade F 2020 7 4 57% 3 43%
2019 7 3 43% 4 57%
2018 4 1 25% 3 75%
Grade G 2020 129 64 50% 65 50%
2019 116 53 46% 63 54%
2018 114 50 44% 64 56%
Grade H 2020 893 437 49% 456 51%
2019 856 417 49% 439 51%
2018 843 412 49% 431 51%
Grade I 2020 192 104 54% 88 46%
2019 198 109 55% 89 45%
2018 197 106 54% 91 46%
Grade J 2020 120 70 58% 50 42%
2019 127 70 55% 57 45%
2018 129 72 56% 57 44%
2020 338 142 42% 196 58%
2019 315 128 41% 187 59%
2018 338 132 39% 206 61%
Grade F&G 2020 140 63 45% 77 55%
2019 150 64 43% 86 57%
2018 135 61 45% 74 55%
Grade H 2020 40 12 30% 28 70%
2019 40 13 33% 27 68%
2018 31 14 45% 17 55%
Associate Lecturer
Research
Research
Academic
Academic
Academic
JOB GROUP
Academic
Academic
Senior Management

11
TABLE 2 – continued
GRADE YEAR ALL
HEADS
MALE MALE % FEMALE FEMALE %
Grade A to F 2020 1069 256 24% 813 76%
2019 1076 275 26% 801 74%
2018 1074 271 25% 803 75%
Grade G & Above 2020 476 193 41% 283 59%
2019 467 188 40% 279 60%
2018 470 187 40% 283 60%
Grade A to F 2020 198 126 64% 72 36%
2019 218 135 62% 83 38%
2018 222 141 64% 81 36%
Grade G & Above 2020 68 47 69% 21 31%
2019 66 52 79% 14 21%
2018 69 52 75% 17 25%
Grade A & B 2020 161 41 25% 120 75%
2019 154 39 25% 115 75%
2018 156 36 23% 120 77%
Grade C & D 2020 117 85 73% 32 27%
2019 120 85 71% 35 29%
2018 115 84 73% 31 27%
2020 155 53 34% 102 66%
2019 99 34 34% 65 66%
2018 118 35 30% 83 70%
2020 3686 1536 42% 2150 58%
2019 3642 1526 42% 2116 58%
2018 3486 1455 42% 2031 58%
2020 4179 1731 41% 2448 59%
2019 4082 1700 42% 2382 58%
2018 4098 1693 41% 2405 59%
Technical
Technical
ALL STAFF
ALL STAFF (excluding ALs/&TSU)
Temporary Staff
Manual
Manual
Admin & Prof
Admin & Prof
JOB GROUP
12
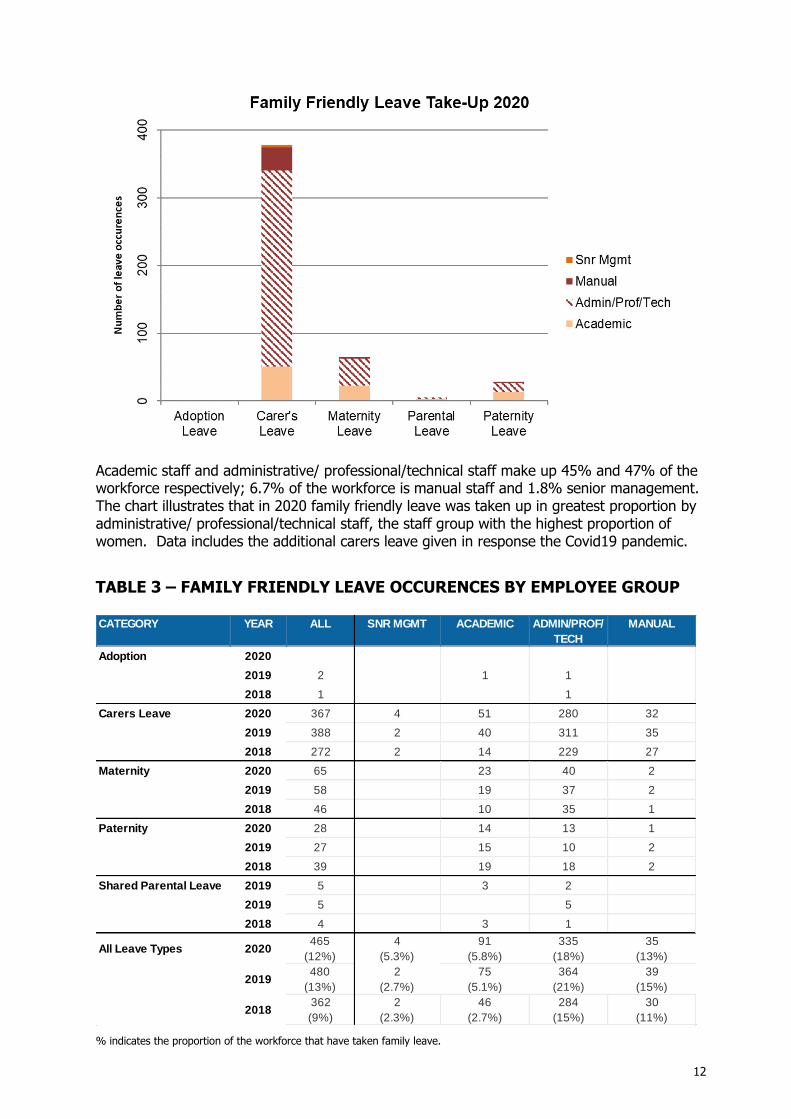
Academic staff and administrative/ professional/technical staff make up 45% and 47% of the workforce respectively; 6.7% of the workforce is manual staff and 1.8% senior management. The chart illustrates that in 2020 family friendly leave was taken up in greatest proportion by administrative/ professional/technical staff, the staff group with the highest proportion of women. Data includes the additional carers leave given in response the Covid19 pandemic.
TABLE 3 – FAMILY FRIENDLY LEAVE OCCURENCES BY EMPLOYEE GROUP
% indicates the proportion of the workforce that have taken family leave.
CATEGORY YEAR ALL SNR MGMT ACADEMIC ADMIN/PROF/
TECH
MANUAL
Adoption 2020
2019 2 1 1
2018 1 1
Carers Leave 2020 367 4 51 280 32
2019 388 2 40 311 35
2018 272 2 14 229 27
Maternity 2020 65 23 40 2
2019 58 19 37 2
2018 46 10 35 1
Paternity 2020 28 14 13 1
2019 27 15 10 2
2018 39 19 18 2
Shared Parental Leave 2019 5 3 2
2019 5 5
2018 4 3 1
All Leave Types 2020465
(12%)
4
(5.3%)
91
(5.8%)
335
(18%)
35
(13%)
2019480
(13%)
2
(2.7%)
75
(5.1%)
364
(21%)
39
(15%)
2018362
(9%)
2
(2.3%)
46
(2.7%)
284
(15%)
30
(11%)

13
This chart shows that as a proportion of the workforce, child care vouchers are taken up in much lower numbers by manual staff, an employee group with a high proportion of women but the lowest pay rates.
Child care vouchers are taken up by female staff in slightly higher proportion than by male staff compared to the workforce male/female split – see table below for historical data by sex. TABLE 4 – TAKE UP OF CHILD CARE VOUCHERS
YEAR ALL
Heads
MALE
Heads
MALE
Take Up
%
MALE
Workforce
%
FEMALE
Heads
FEMALE
Take Up
%
FEMALE
Workforce
%
2020 204 76 37% 41% 128 63% 59%
2019 258 97 38% 42% 161 62% 58%
2018 313 122 39% 41% 191 61% 59%

14
Section 1.2 - Staff by Ethnicity
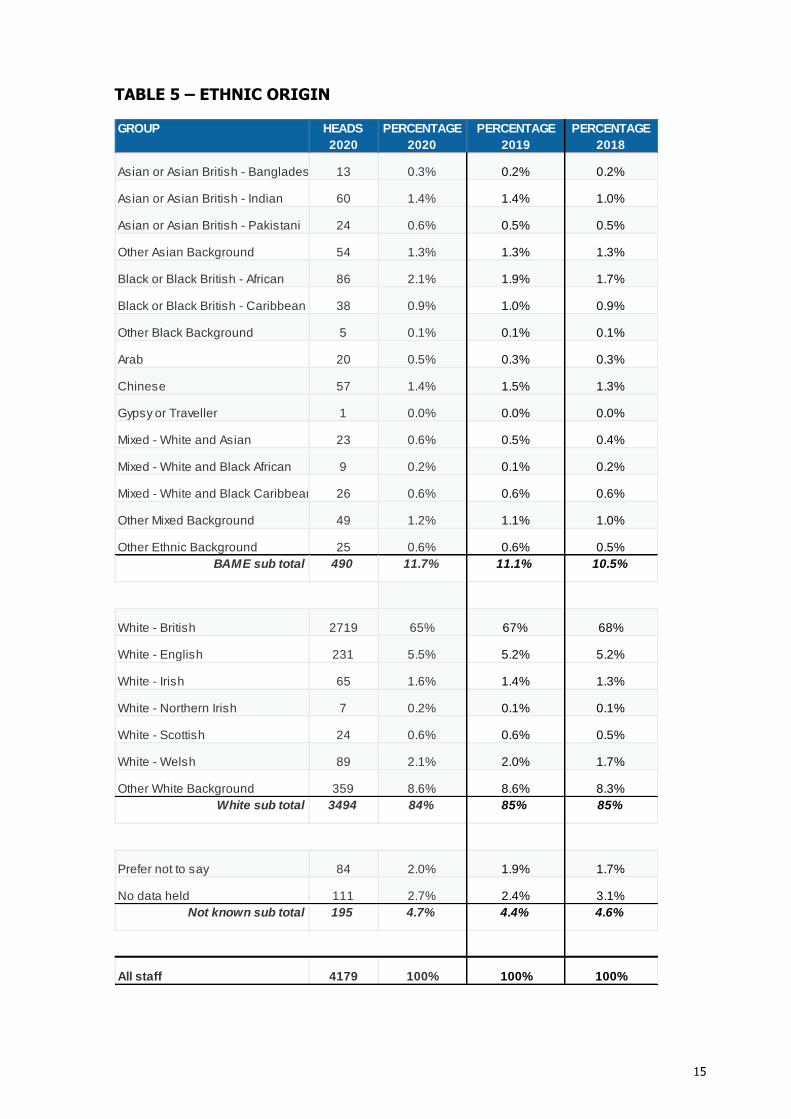
UWE’s BAME staff percentage has increased over time to 11.7% in 2020. The UWE workforce is 84% White. Data is not held for 4.7% of staff. See Table 6 on page 16 for a breakdown by employee group and grade.
BAME Ethnic Origin 2020
Black or Black British – African is the largest BAME group. A full breakdown, including historical data, is available in Table 5 below.
15
TABLE 5 – ETHNIC ORIGIN
HEADS
2020
PERCENTAGE
2020
PERCENTAGE
2019
13 0.3% 0.2%
60 1.4% 1.4%
24 0.6% 0.5%
54 1.3% 1.3%
86 2.1% 1.9%
38 0.9% 1.0%
5 0.1% 0.1%
20 0.5% 0.3%
57 1.4% 1.5%
1 0.0% 0.0%
23 0.6% 0.5%
9 0.2% 0.1%
26 0.6% 0.6%
49 1.2% 1.1%
25 0.6% 0.6%
490 11.7% 11.1%
2719 65% 67%
231 5.5% 5.2%
65 1.6% 1.4%
7 0.2% 0.1%
24 0.6% 0.6%
89 2.1% 2.0%
359 8.6% 8.6%
3494 84% 85%
84 2.0% 1.9%
111 2.7% 2.4%
195 4.7% 4.4%
4179 100% 100%
Asian or Asian British - Indian
Asian or Asian British - Pakistani
GROUP
Asian or Asian British - Bangladeshi
Black or Black British - Caribbean
Other Black Background
Other Asian Background
Black or Black British - African
Arab
Chinese
Gypsy or Traveller
White - British
Other Ethnic Background
BAME sub total
Mixed - White and Black Caribbean
Other Mixed Background
Mixed - White and Asian
Mixed - White and Black African
White - Irish
White - Northern Irish
White - English
White sub total
White - Scottish
White - Welsh
1.7%
All staff
No data held
Not known sub total
Prefer not to say
Other White Background
PERCENTAGE
2018
0.2%
1.0%
0.5%
1.3%
5.2%
1.3%
0.1%
0.5%
0.9%
0.1%
0.3%
1.3%
0.4%
0.0%
0.2%
100%
8.3%
85%
1.7%
3.1%
4.6%
1.7%
0.6%
1.0%
0.5%
10.5%
68%
16
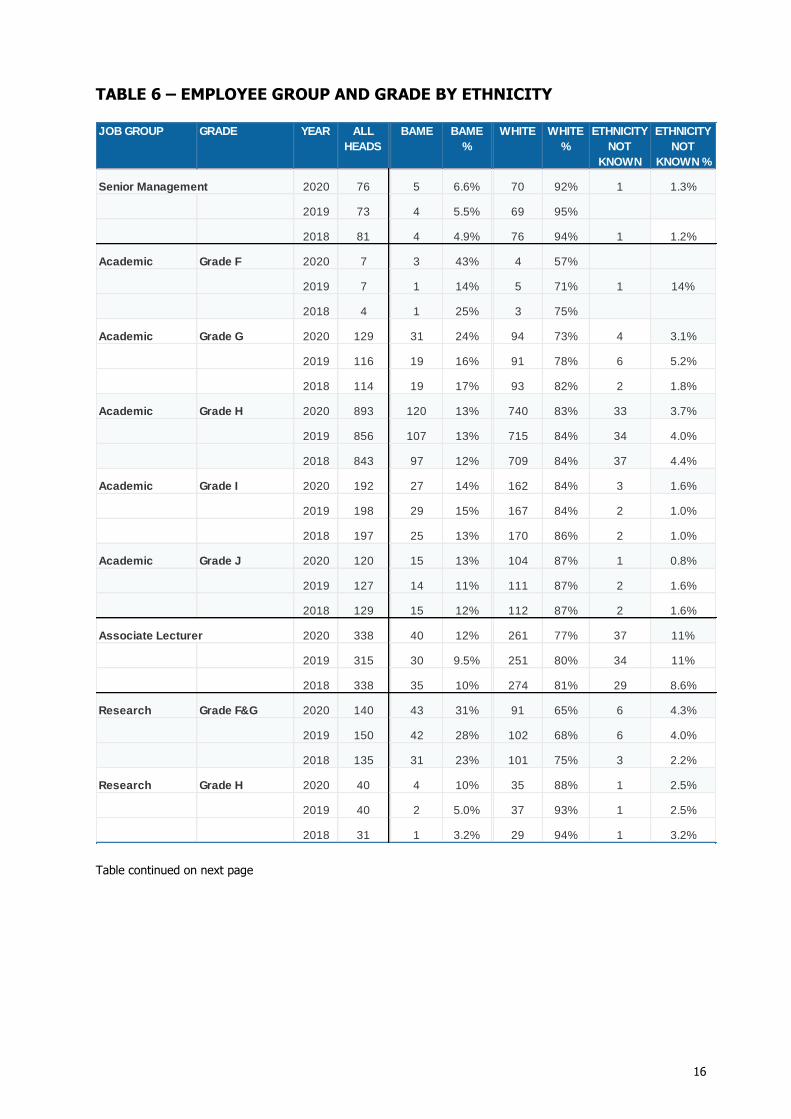
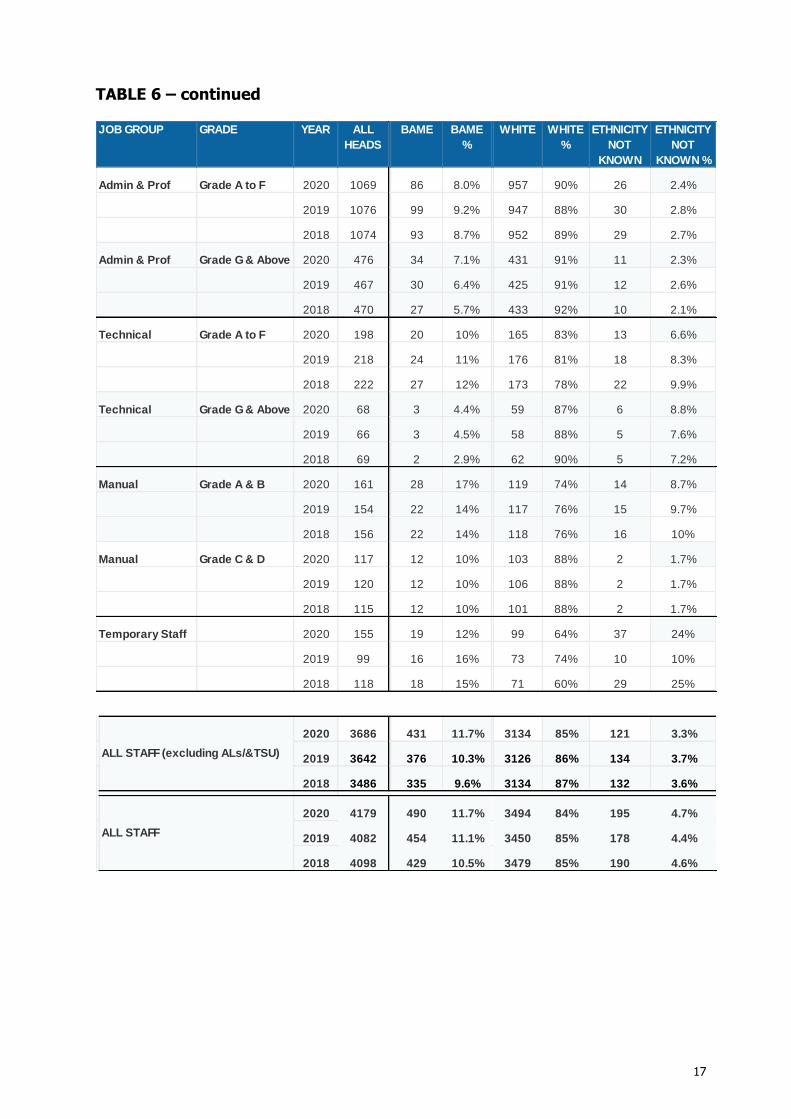
TABLE 6 – EMPLOYEE GROUP AND GRADE BY ETHNICITY
Table continued on next page
GRADE YEAR ALL
HEADS
M
A
L
BAME BAME
%
WHITE WHITE
%
ETHNICITY
NOT
KNOWN
ETHNICITY
NOT
KNOWN %
Senior Management 2020 76 5 6.6% 70 92% 1 1.3%
2019 73 4 5.5% 69 95%
2018 81 4 4.9% 76 94% 1 1.2%
Grade F 2020 7 3 43% 4 57%
2019 7 1 14% 5 71% 1 14%
2018 4 1 25% 3 75%
Grade G 2020 129 31 24% 94 73% 4 3.1%
2019 116 19 16% 91 78% 6 5.2%
2018 114 19 17% 93 82% 2 1.8%
Grade H 2020 893 120 13% 740 83% 33 3.7%
2019 856 107 13% 715 84% 34 4.0%
2018 843 97 12% 709 84% 37 4.4%
Grade I 2020 192 27 14% 162 84% 3 1.6%
2019 198 29 15% 167 84% 2 1.0%
2018 197 25 13% 170 86% 2 1.0%
Grade J 2020 120 15 13% 104 87% 1 0.8%
2019 127 14 11% 111 87% 2 1.6%
2018 129 15 12% 112 87% 2 1.6%
Associate Lecturer 2020 338 40 12% 261 77% 37 11%
2019 315 30 9.5% 251 80% 34 11%
2018 338 35 10% 274 81% 29 8.6%
Grade F&G 2020 140 43 31% 91 65% 6 4.3%
2019 150 42 28% 102 68% 6 4.0%
2018 135 31 23% 101 75% 3 2.2%
Grade H 2020 40 4 10% 35 88% 1 2.5%
2019 40 2 5.0% 37 93% 1 2.5%
2018 31 1 3.2% 29 94% 1 3.2%
Research
Research
Academic
Academic
Academic
JOB GROUP
Academic
Academic
17
TABLE 6 – continued
GRADE YEAR ALL
HEADS
M
A
L
BAME BAME
%
WHITE WHITE
%
ETHNICITY
NOT
KNOWN
ETHNICITY
NOT
KNOWN %
Grade A to F 2020 1069 86 8.0% 957 90% 26 2.4%
2019 1076 99 9.2% 947 88% 30 2.8%
2018 1074 93 8.7% 952 89% 29 2.7%
Grade G & Above 2020 476 34 7.1% 431 91% 11 2.3%
2019 467 30 6.4% 425 91% 12 2.6%
2018 470 27 5.7% 433 92% 10 2.1%
Grade A to F 2020 198 20 10% 165 83% 13 6.6%
2019 218 24 11% 176 81% 18 8.3%
2018 222 27 12% 173 78% 22 9.9%
Grade G & Above 2020 68 3 4.4% 59 87% 6 8.8%
2019 66 3 4.5% 58 88% 5 7.6%
2018 69 2 2.9% 62 90% 5 7.2%
Grade A & B 2020 161 28 17% 119 74% 14 8.7%
2019 154 22 14% 117 76% 15 9.7%
2018 156 22 14% 118 76% 16 10%
Grade C & D 2020 117 12 10% 103 88% 2 1.7%
2019 120 12 10% 106 88% 2 1.7%
2018 115 12 10% 101 88% 2 1.7%
2020 155 19 12% 99 64% 37 24%
2019 99 16 16% 73 74% 10 10%
2018 118 18 15% 71 60% 29 25%
2020 3686 431 11.7% 3134 85% 121 3.3%
2019 3642 376 10.3% 3126 86% 134 3.7%
2018 3486 335 9.6% 3134 87% 132 3.6%
2020 4179 490 11.7% 3494 84% 195 4.7%
2019 4082 454 11.1% 3450 85% 178 4.4%
2018 4098 429 10.5% 3479 85% 190 4.6%
Technical
Technical
ALL STAFF
ALL STAFF (excluding ALs/&TSU)
Temporary Staff
Manual
Manual
Admin & Prof
Admin & Prof
JOB GROUP

18
TABLE 7 – NATIONALITY
GROUP HEADS
2020
PERCENTAGE
2020
PERCENTAGE
2019
PERCENTAGE
2018
British 3569 85% 86% 87%
Irish 41 1.0% 1.0% 1.0%
Nigeria 39 0.9% 0.8% 0.6%
Italian 35 0.8% 0.8% 0.7%
German 34 0.8% 0.8% 0.8%
French 33 0.8% 0.7% 0.6%
Polish 27 0.6% 0.7% 0.7%
American 26 0.6% 0.8% 0.7%
Chinese 23 0.6% 0.6% 0.5%
Spanish 22 0.5% 0.6% 0.7%
Indian 21 0.5% 0.4% 0.2%
Sub total 3870 93% 93% 93%
All staff 4179 100% 100% 100%
The UWE workforce is 85% British and has another 79 nationalities – the top 10 of which are shown here. Historical data, is available in Table 7 below.
The BAME staff percentage in the senior grades has continued to increase, to 9.2% in 2020. Grades counted as senior are I and J for academic staff, H for research staff, G and above for admin/ professional/ technical staff, C and above for manual staff and the Senior Management grades.

19
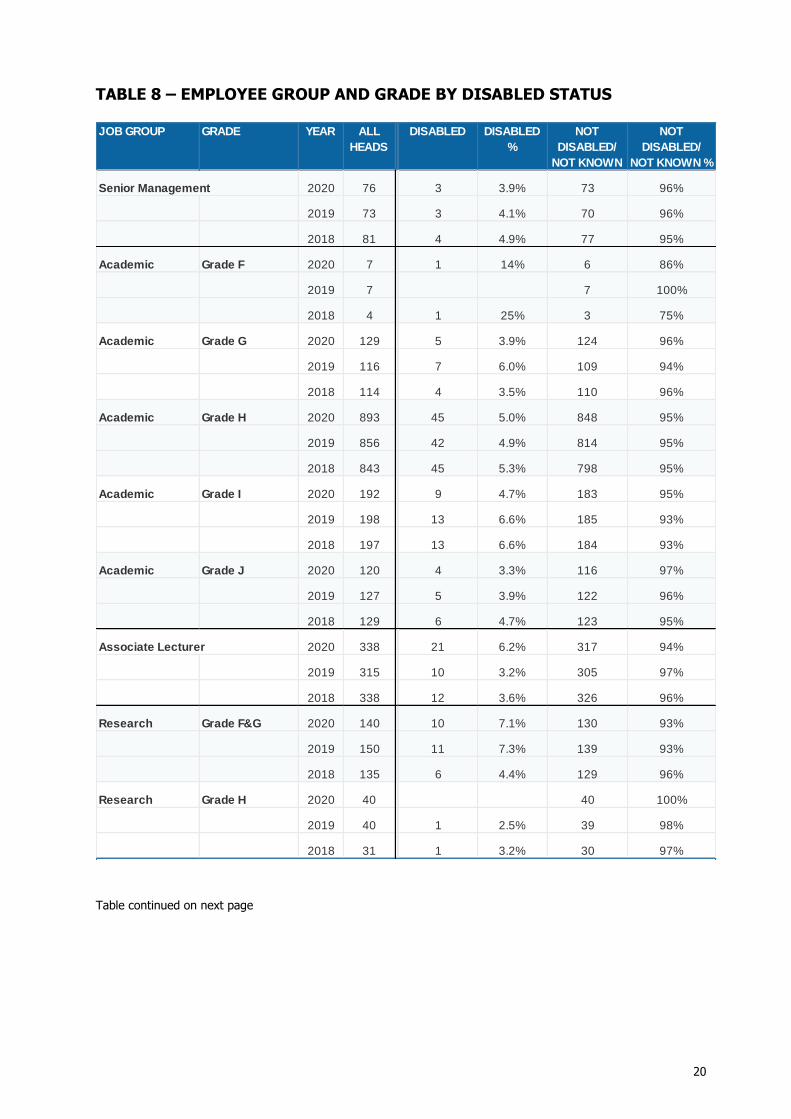
Section 1.3 - Staff by Disabled Status
The proportion of UWE Bristol staff who are disabled increased to 7.2% in 2020. A full breakdown, including data for the last 3 years, is available in Table 8 on page 20.
Disabled staff representation in senior grades has increased slightly in 2020 – see Table 8 on page 20 for details. Grades counted as senior are I and J for academic staff, H for research staff, G and above for admin/professional/ technical staff, C and above for manual staff and the Senior Management grades.
20
TABLE 8 – EMPLOYEE GROUP AND GRADE BY DISABLED STATUS
Table continued on next page
GRADE YEAR ALL
HEADS
M
A
L
DISABLED DISABLED
%
NOT
DISABLED/
NOT KNOWN
NOT
DISABLED/
NOT KNOWN %
Senior Management 2020 76 3 3.9% 73 96%
2019 73 3 4.1% 70 96%
2018 81 4 4.9% 77 95%
Grade F 2020 7 1 14% 6 86%
2019 7 7 100%
2018 4 1 25% 3 75%
Grade G 2020 129 5 3.9% 124 96%
2019 116 7 6.0% 109 94%
2018 114 4 3.5% 110 96%
Grade H 2020 893 45 5.0% 848 95%
2019 856 42 4.9% 814 95%
2018 843 45 5.3% 798 95%
Grade I 2020 192 9 4.7% 183 95%
2019 198 13 6.6% 185 93%
2018 197 13 6.6% 184 93%
Grade J 2020 120 4 3.3% 116 97%
2019 127 5 3.9% 122 96%
2018 129 6 4.7% 123 95%
Associate Lecturer 2020 338 21 6.2% 317 94%
2019 315 10 3.2% 305 97%
2018 338 12 3.6% 326 96%
Grade F&G 2020 140 10 7.1% 130 93%
2019 150 11 7.3% 139 93%
2018 135 6 4.4% 129 96%
Grade H 2020 40 40 100%
2019 40 1 2.5% 39 98%
2018 31 1 3.2% 30 97%
Research
Research
Academic
Academic
Academic
JOB GROUP
Academic
Academic
21
TABLE 8 - continued
GRADE YEAR ALL
HEADS
M
A
L
DISABLED DISABLED
%
NOT
DISABLED/
NOT KNOWN
NOT
DISABLED/
NOT KNOWN %
Grade A to F 2020 1069 106 9.9% 963 90%
2019 1076 97 9.0% 979 91%
2018 1074 102 9.5% 972 91%
Grade G & Above 2020 476 48 10% 428 90%
2019 467 41 8.8% 426 91%
2018 470 36 7.7% 434 92%
Grade A to F 2020 198 16 8.1% 182 92%
2019 218 19 8.7% 199 91%
2018 222 17 7.7% 205 92%
Grade G & Above 2020 68 2 2.9% 66 97%
2019 66 2 3.0% 64 97%
2018 69 2 2.9% 67 97%
Grade A & B 2020 161 13 8.1% 148 92%
2019 154 10 6.5% 144 94%
2018 156 9 5.8% 147 94%
Grade C & D 2020 117 9 7.7% 108 92%
2019 120 9 7.5% 111 93%
2018 115 8 7.0% 107 93%
2020 155 8 5.2% 147 95%
2019 99 5 5.1% 94 95%
2018 118 7 5.9% 111 94%
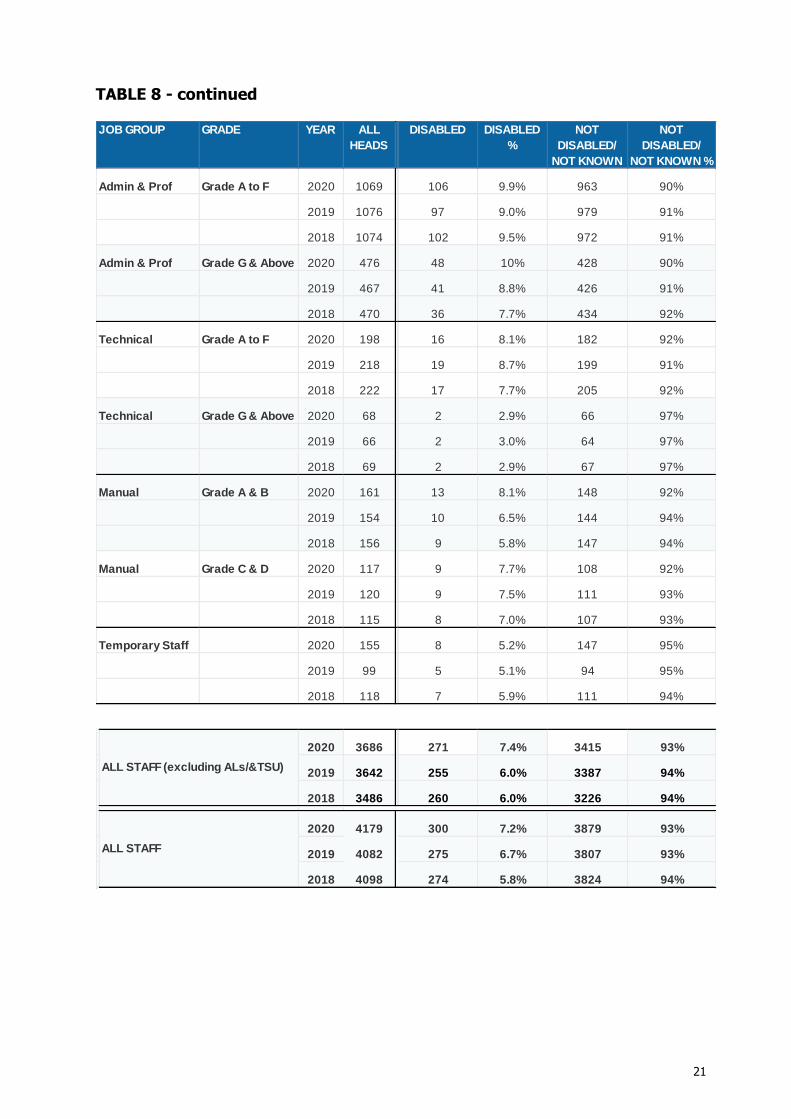
2020 3686 271 7.4% 3415 93%
2019 3642 255 6.0% 3387 94%
2018 3486 260 6.0% 3226 94%
2020 4179 300 7.2% 3879 93%
2019 4082 275 6.7% 3807 93%
2018 4098 274 5.8% 3824 94%
Technical
Technical
ALL STAFF
ALL STAFF (excluding ALs/&TSU)
Temporary Staff
Manual
Manual
Admin & Prof
Admin & Prof
JOB GROUP

22
Section 1.4 - Staff by Age
The average age of a UWE employee in 2020 is 45 years, the same as in 2019.
There are more academic, senior management and manual staff in the older age groups and more administrative, professional and technical staff in the younger age groups.
TABLE 9 – AGE BY SEX
AGE BAND HEADS
2020
Under 25 110
25-34 769
35-44 1225
45-54 1081
55-64 830
65-74 162
75 plus 2
PERCENTAGE
2018
FEMALE
2020
MALE
2020
PERCENTAGE
2020
PERCENTAGE
2019
479 290 18% 18% 19%
67 43 2.6% 3.0% 3.1%
637 444 26% 27% 27%
700 525 29% 28% 28%
64 98 3.9% 3.7% 3.0%
501 329 20% 20% 20%
2 0.05% 0.1% 0.1%
23
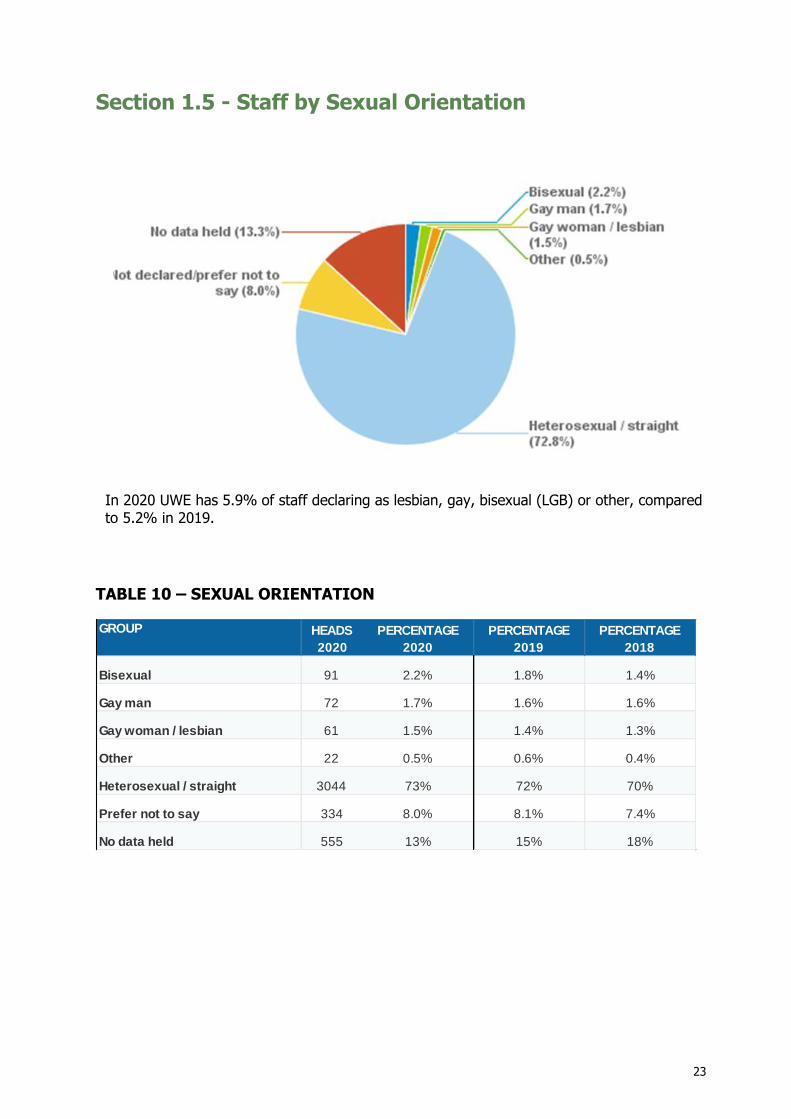
Section 1.5 - Staff by Sexual Orientation
In 2020 UWE has 5.9% of staff declaring as lesbian, gay, bisexual (LGB) or other, compared to 5.2% in 2019.
TABLE 10 – SEXUAL ORIENTATION
PERCENTAGE
2018
GROUP HEADS
2020
PERCENTAGE
2020
PERCENTAGE
2019
Gay man 72 1.7% 1.6% 1.6%
Bisexual 91 2.2% 1.8% 1.4%
Other 22 0.5% 0.6% 0.4%
Gay woman / lesbian 61 1.5% 1.4% 1.3%
Prefer not to say 334 8.0% 8.1% 7.4%
Heterosexual / straight 3044 73% 72% 70%
No data held 555 13% 15% 18%
24
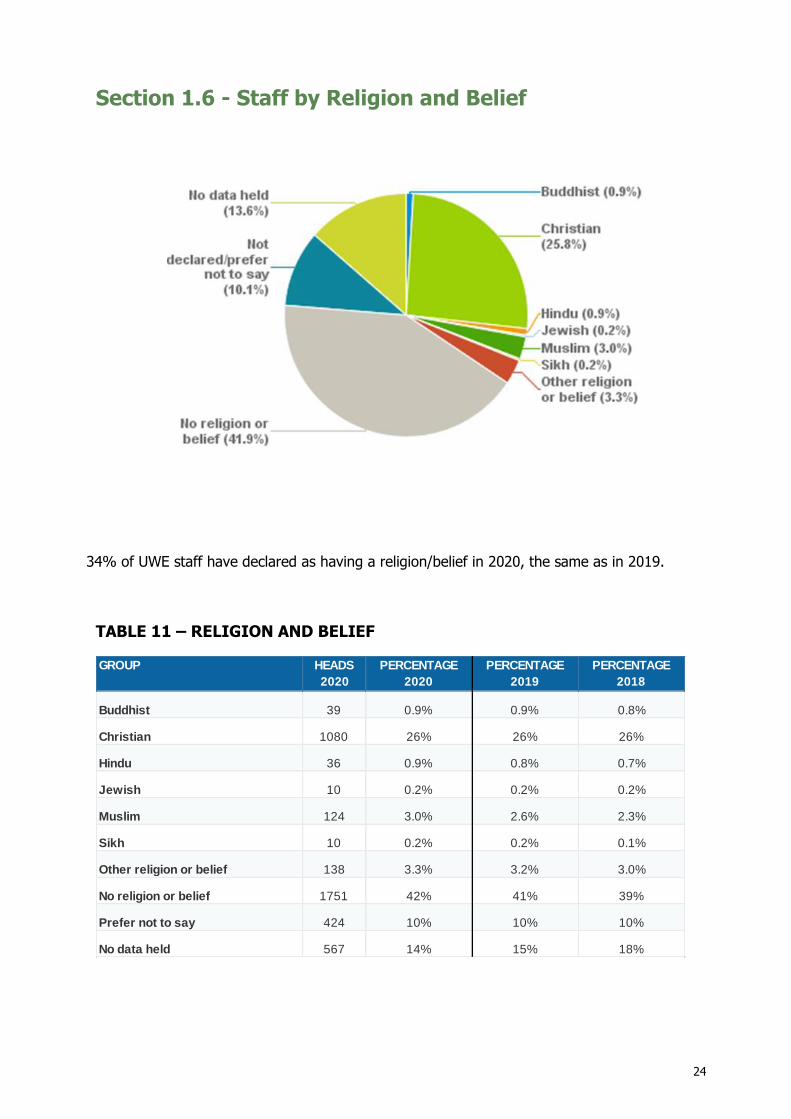
Section 1.6 - Staff by Religion and Belief
34% of UWE staff have declared as having a religion/belief in 2020, the same as in 2019.
TABLE 11 – RELIGION AND BELIEF
PERCENTAGE
2018
GROUP HEADS
2020
PERCENTAGE
2020
PERCENTAGE
2019
Christian 1080 26% 26% 26%
Buddhist 39 0.9% 0.9% 0.8%
Jewish 10 0.2% 0.2% 0.2%
Hindu 36 0.9% 0.8% 0.7%
Sikh 10 0.2% 0.2% 0.1%
Muslim 124 3.0% 2.6% 2.3%
No religion or belief 1751 42% 41% 39%
Other religion or belief 138 3.3% 3.2% 3.0%
No data held 567 14% 15% 18%
Prefer not to say 424 10% 10% 10%

25
Section 1.7 - Staff by Trans/Transgender
In 2020 UWE’s declared trans/transgender population is 0.2%, down from 0.4% in 2019.
TABLE 12 – TRANS/TRANSGENDER
HEADS
2020
8
1712
39
2420
Yes 0.2% 0.4% 0.3%
CATEGORY PERCENTAGE
2020
PERCENTAGE
2019
PERCENTAGE
2018
No data held 58% 59% 57%
No 41% 39% 41%
Prefer not to say 0.9% 1.1% 1.0%

26
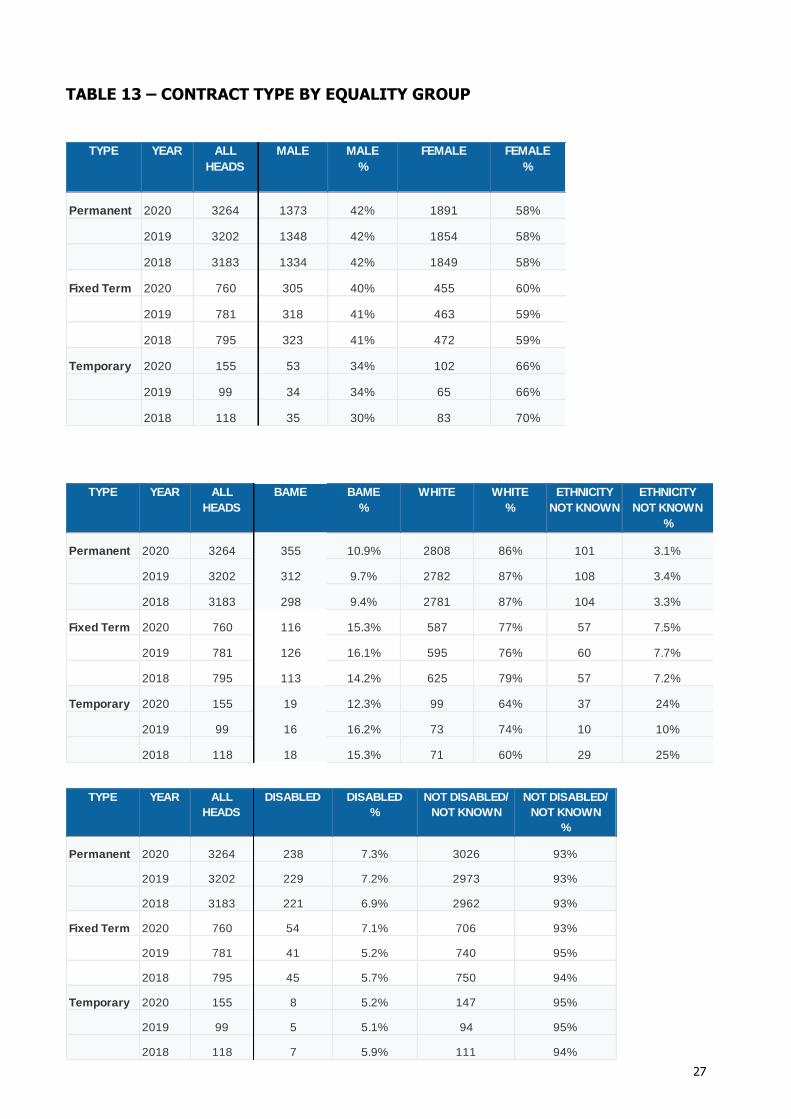
Section 1.8 - Staff by Contract Term
*NK = not known
In 2020 a slightly higher proportion of disabled staff were on permanent contracts compared to staff with no declared disability; a higher proportion of BAME staff were on fixed term and temporary contracts compared to white staff; a higher proportion of male staff were on permanent contracts than female staff.
Overall in 2020 the workforce is 78% permanent, 18% fixed term and 4% temporary.
Associate lecturers and research staff are mainly on fixed term contracts.
27
TABLE 13 – CONTRACT TYPE BY EQUALITY GROUP
TYPE YEAR ALL
HEADS
MALE MALE
%
FEMALE FEMALE
%
Permanent 2020 3264 1373 42% 1891 58%
2019 3202 1348 42% 1854 58%
2018 3183 1334 42% 1849 58%
Fixed Term 2020 760 305 40% 455 60%
2019 781 318 41% 463 59%
2018 795 323 41% 472 59%
Temporary 2020 155 53 34% 102 66%
2019 99 34 34% 65 66%
2018 118 35 30% 83 70%
TYPE YEAR ALL
HEADS
BAME BAME
%
WHITE WHITE
%
ETHNICITY
NOT KNOWN
ETHNICITY
NOT KNOWN
%
Permanent 2020 3264 355 10.9% 2808 86% 101 3.1%
2019 3202 312 9.7% 2782 87% 108 3.4%
2018 3183 298 9.4% 2781 87% 104 3.3%
Fixed Term 2020 760 116 15.3% 587 77% 57 7.5%
2019 781 126 16.1% 595 76% 60 7.7%
2018 795 113 14.2% 625 79% 57 7.2%
Temporary 2020 155 19 12.3% 99 64% 37 24%
2019 99 16 16.2% 73 74% 10 10%
2018 118 18 15.3% 71 60% 29 25%
TYPE YEAR ALL
HEADS
DISABLED DISABLED
%
NOT DISABLED/
NOT KNOWN
NOT DISABLED/
NOT KNOWN
%
Permanent 2020 3264 238 7.3% 3026 93%
2019 3202 229 7.2% 2973 93%
2018 3183 221 6.9% 2962 93%
Fixed Term 2020 760 54 7.1% 706 93%
2019 781 41 5.2% 740 95%
2018 795 45 5.7% 750 94%
Temporary 2020 155 8 5.2% 147 95%
2019 99 5 5.1% 94 95%
2018 118 7 5.9% 111 94%
28
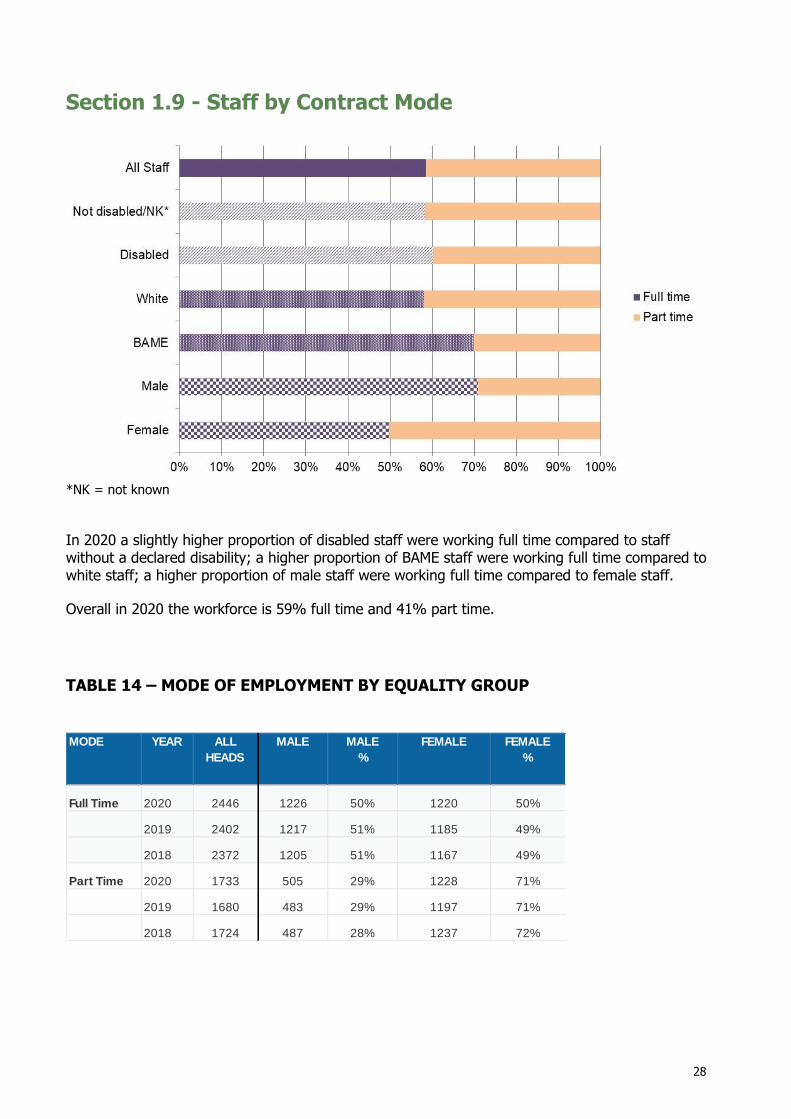
Section 1.9 - Staff by Contract Mode
*NK = not known
In 2020 a slightly higher proportion of disabled staff were working full time compared to staff without a declared disability; a higher proportion of BAME staff were working full time compared to white staff; a higher proportion of male staff were working full time compared to female staff.
Overall in 2020 the workforce is 59% full time and 41% part time.
TABLE 14 – MODE OF EMPLOYMENT BY EQUALITY GROUP
MODE YEAR ALL
HEADS
MALE MALE
%
FEMALE FEMALE
%
Full Time 2020 2446 1226 50% 1220 50%
2019 2402 1217 51% 1185 49%
2018 2372 1205 51% 1167 49%
Part Time 2020 1733 505 29% 1228 71%
2019 1680 483 29% 1197 71%
2018 1724 487 28% 1237 72%
29
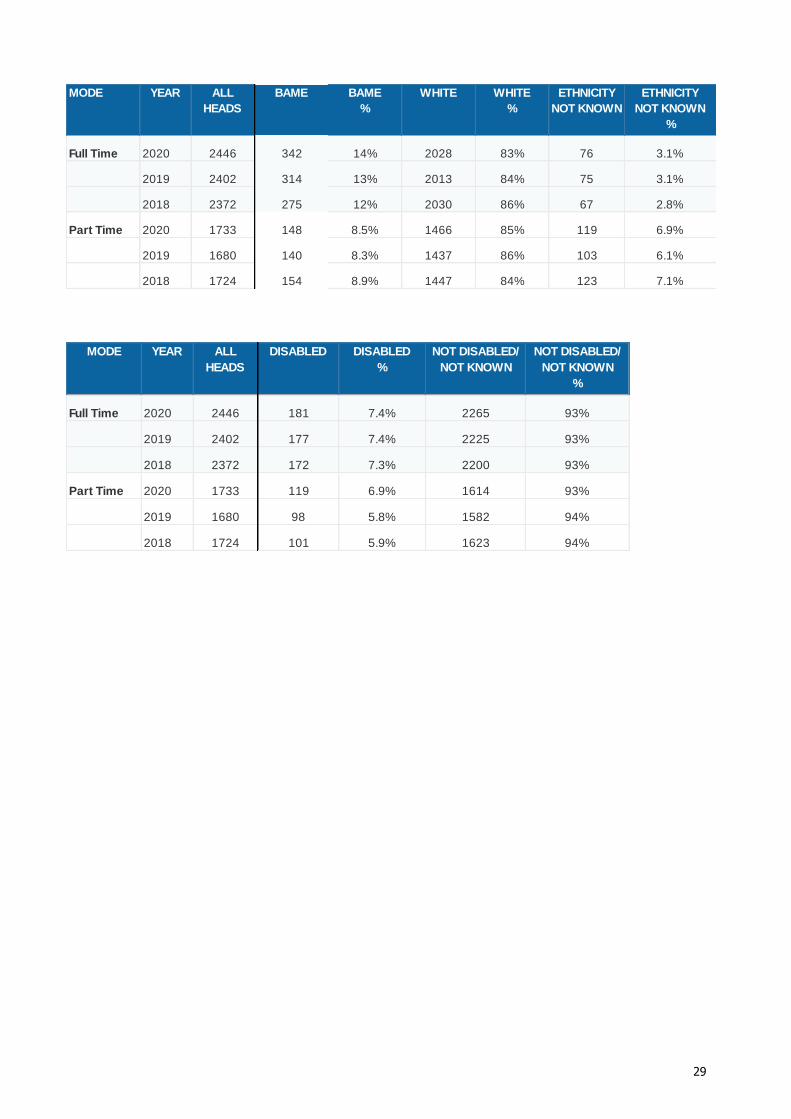
MODE YEAR ALL
HEADS
BAME BAME
%
WHITE WHITE
%
ETHNICITY
NOT KNOWN
ETHNICITY
NOT KNOWN
%
Full Time 2020 2446 342 14% 2028 83% 76 3.1%
2019 2402 314 13% 2013 84% 75 3.1%
2018 2372 275 12% 2030 86% 67 2.8%
Part Time 2020 1733 148 8.5% 1466 85% 119 6.9%
2019 1680 140 8.3% 1437 86% 103 6.1%
2018 1724 154 8.9% 1447 84% 123 7.1%
MODE YEAR ALL
HEADS
DISABLED DISABLED
%
NOT DISABLED/
NOT KNOWN
NOT DISABLED/
NOT KNOWN
%
Full Time 2020 2446 181 7.4% 2265 93%
2019 2402 177 7.4% 2225 93%
2018 2372 172 7.3% 2200 93%
Part Time 2020 1733 119 6.9% 1614 93%
2019 1680 98 5.8% 1582 94%
2018 1724 101 5.9% 1623 94%
30
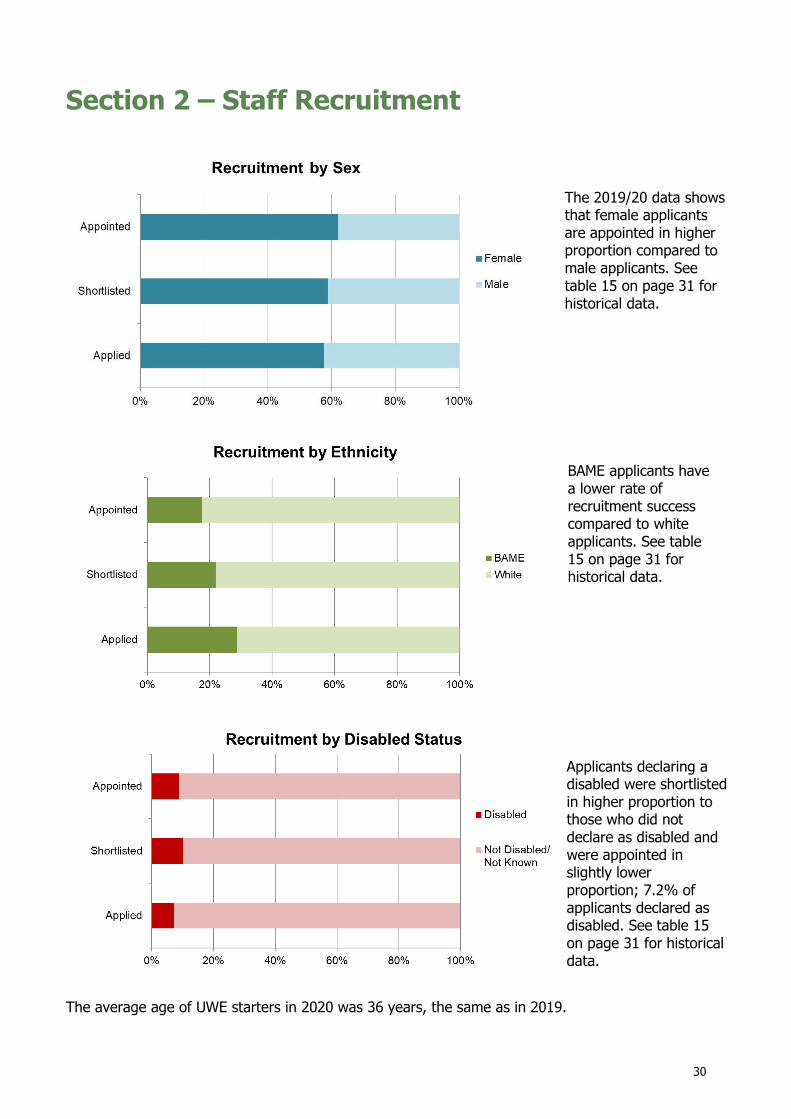
Section 2 – Staff Recruitment
The average age of UWE starters in 2020 was 36 years, the same as in 2019.
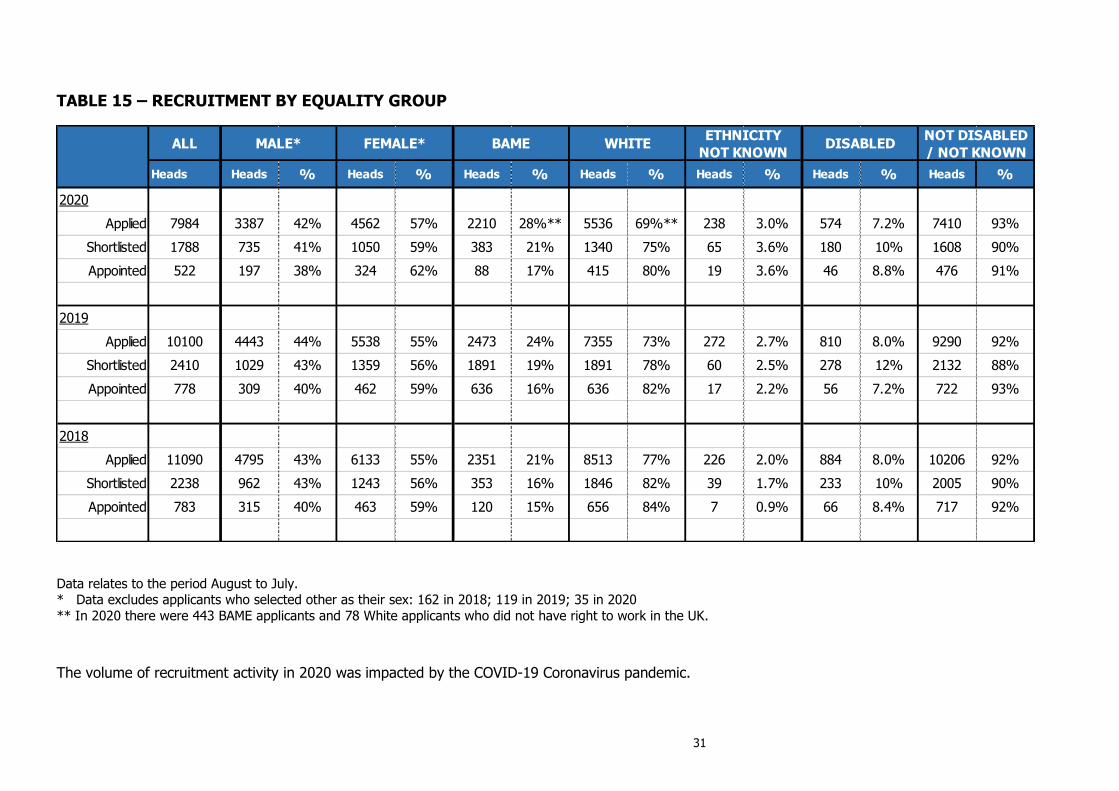
Applicants declaring a disabled were shortlisted in higher proportion to those who did not declare as disabled and were appointed in slightly lower proportion; 7.2% of applicants declared as disabled. See table 15 on page 31 for historical data.
The 2019/20 data shows that female applicants are appointed in higher proportion compared to male applicants. See table 15 on page 31 for historical data.
BAME applicants have a lower rate of recruitment success compared to white applicants. See table 15 on page 31 for historical data.
31
TABLE 15 – RECRUITMENT BY EQUALITY GROUP
Data relates to the period August to July. * Data excludes applicants who selected other as their sex: 162 in 2018; 119 in 2019; 35 in 2020
** In 2020 there were 443 BAME applicants and 78 White applicants who did not have right to work in the UK.
The volume of recruitment activity in 2020 was impacted by the COVID-19 Coronavirus pandemic.
ALL
Heads Heads % Heads % Heads % Heads % Heads % Heads % Heads %
2020
Applied 7984 3387 42% 4562 57% 2210 28%** 5536 69%** 238 3.0% 574 7.2% 7410 93%
Shortlisted 1788 735 41% 1050 59% 383 21% 1340 75% 65 3.6% 180 10% 1608 90%
Appointed 522 197 38% 324 62% 88 17% 415 80% 19 3.6% 46 8.8% 476 91%
2019
Applied 10100 4443 44% 5538 55% 2473 24% 7355 73% 272 2.7% 810 8.0% 9290 92%
Shortlisted 2410 1029 43% 1359 56% 1891 19% 1891 78% 60 2.5% 278 12% 2132 88%
Appointed 778 309 40% 462 59% 636 16% 636 82% 17 2.2% 56 7.2% 722 93%
2018
Applied 11090 4795 43% 6133 55% 2351 21% 8513 77% 226 2.0% 884 8.0% 10206 92%
Shortlisted 2238 962 43% 1243 56% 353 16% 1846 82% 39 1.7% 233 10% 2005 90%
Appointed 783 315 40% 463 59% 120 15% 656 84% 7 0.9% 66 8.4% 717 92%
DISABLEDNOT DISABLED
/ NOT KNOWNMALE* FEMALE* BAME WHITE
ETHNICITY
NOT KNOWN
32
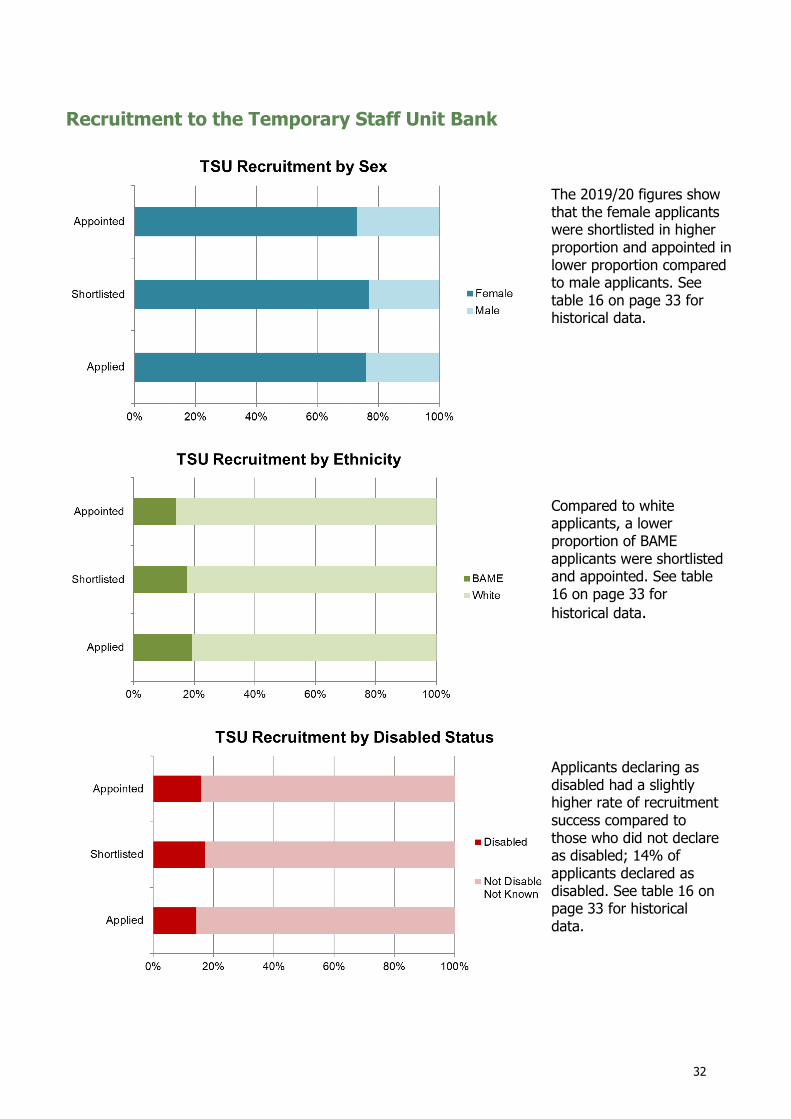
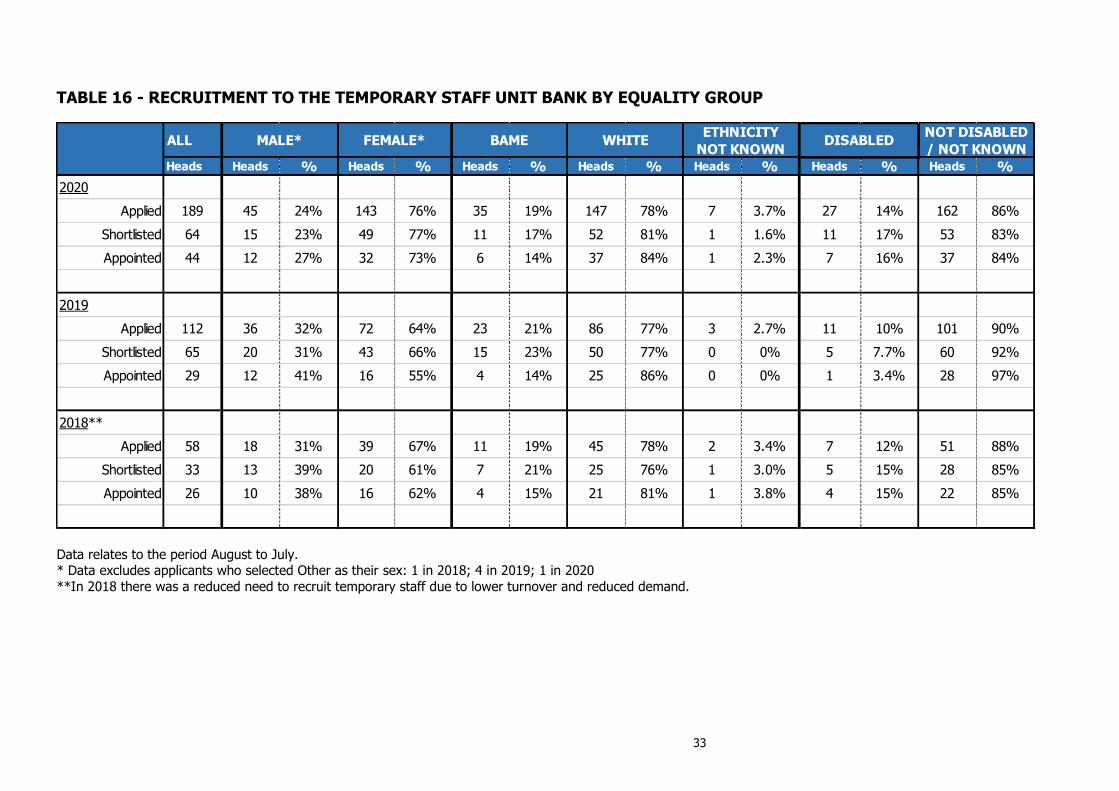
Recruitment to the Temporary Staff Unit Bank
The 2019/20 figures show that the female applicants were shortlisted in higher proportion and appointed in lower proportion compared to male applicants. See table 16 on page 33 for historical data.
Compared to white applicants, a lower proportion of BAME applicants were shortlisted and appointed. See table 16 on page 33 for
historical data.
Applicants declaring as disabled had a slightly higher rate of recruitment success compared to those who did not declare as disabled; 14% of applicants declared as disabled. See table 16 on page 33 for historical data.
33
TABLE 16 - RECRUITMENT TO THE TEMPORARY STAFF UNIT BANK BY EQUALITY GROUP
Data relates to the period August to July. * Data excludes applicants who selected Other as their sex: 1 in 2018; 4 in 2019; 1 in 2020
**In 2018 there was a reduced need to recruit temporary staff due to lower turnover and reduced demand.
ALL
Heads Heads % Heads % Heads % Heads % Heads % Heads % Heads %
2020
Applied 189 45 24% 143 76% 35 19% 147 78% 7 3.7% 27 14% 162 86%
Shortlisted 64 15 23% 49 77% 11 17% 52 81% 1 1.6% 11 17% 53 83%
Appointed 44 12 27% 32 73% 6 14% 37 84% 1 2.3% 7 16% 37 84%
2019
Applied 112 36 32% 72 64% 23 21% 86 77% 3 2.7% 11 10% 101 90%
Shortlisted 65 20 31% 43 66% 15 23% 50 77% 0 0% 5 7.7% 60 92%
Appointed 29 12 41% 16 55% 4 14% 25 86% 0 0% 1 3.4% 28 97%
2018**
Applied 58 18 31% 39 67% 11 19% 45 78% 2 3.4% 7 12% 51 88%
Shortlisted 33 13 39% 20 61% 7 21% 25 76% 1 3.0% 5 15% 28 85%
Appointed 26 10 38% 16 62% 4 15% 21 81% 1 3.8% 4 15% 22 85%
DISABLEDNOT DISABLED
/ NOT KNOWNMALE* FEMALE* BAME WHITE
ETHNICITY
NOT KNOWN
34
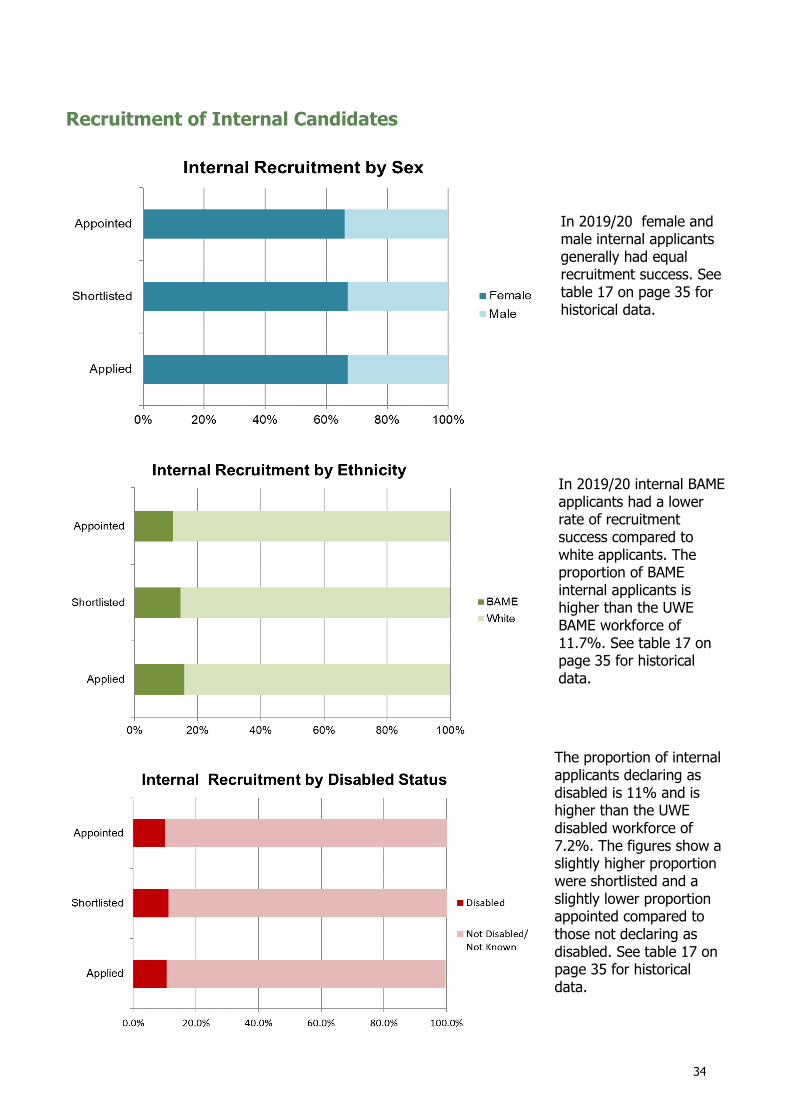
Recruitment of Internal Candidates
The proportion of internal applicants declaring as disabled is 11% and is higher than the UWE disabled workforce of 7.2%. The figures show a slightly higher proportion were shortlisted and a slightly lower proportion appointed compared to those not declaring as disabled. See table 17 on page 35 for historical data.
In 2019/20 internal BAME applicants had a lower rate of recruitment success compared to white applicants. The proportion of BAME internal applicants is higher than the UWE BAME workforce of 11.7%. See table 17 on page 35 for historical data.
In 2019/20 female and male internal applicants generally had equal recruitment success. See table 17 on page 35 for historical data.

35
TABLE 17 - INTERNAL RECRUITMENT ONLY BY EQUALITY GROUP
Data relates to the period August to July.
* Data excludes applicants who selected Other as their sex: 18 in 2018; 6 in 2019
ALL
Heads Heads % Heads % Heads % Heads % Heads % Heads % Heads %
2020
Applied 615 201 33% 414 67% 92 15% 489 80% 34 5.5% 66 11% 549 89%
Shortlisted 356 117 33% 239 67% 49 14% 289 81% 18 5.1% 40 11% 316 89%
Appointed 148 50 34% 98 66% 17 11% 125 84% 6 4.1% 15 10% 133 90%
2019
Applied 1142 428 37% 708 62% 217 19% 905 79% 20 1.8% 142 12% 1000 88%
Shortlisted 654 245 37% 405 62% 102 16% 540 83% 12 1.8% 97 15% 557 85%
Appointed 292 107 37% 183 63% 41 14% 246 84% 5 1.7% 30 10% 262 90%
2018
Applied 1215 501 41% 696 57% 191 16% 1006 83% 18 1.5% 128 11% 1087 89%
Shortlisted 655 257 39% 387 59% 93 14% 551 84% 11 1.7% 77 12% 578 88%
Appointed 324 124 38% 198 61% 50 15% 271 84% 3 0.9% 34 10% 290 90%
DISABLEDNOT DISABLED
/ NOT KNOWNMALE* FEMALE* BAME WHITE
ETHNICITY
NOT KNOWN
36
Section 3 - Leavers
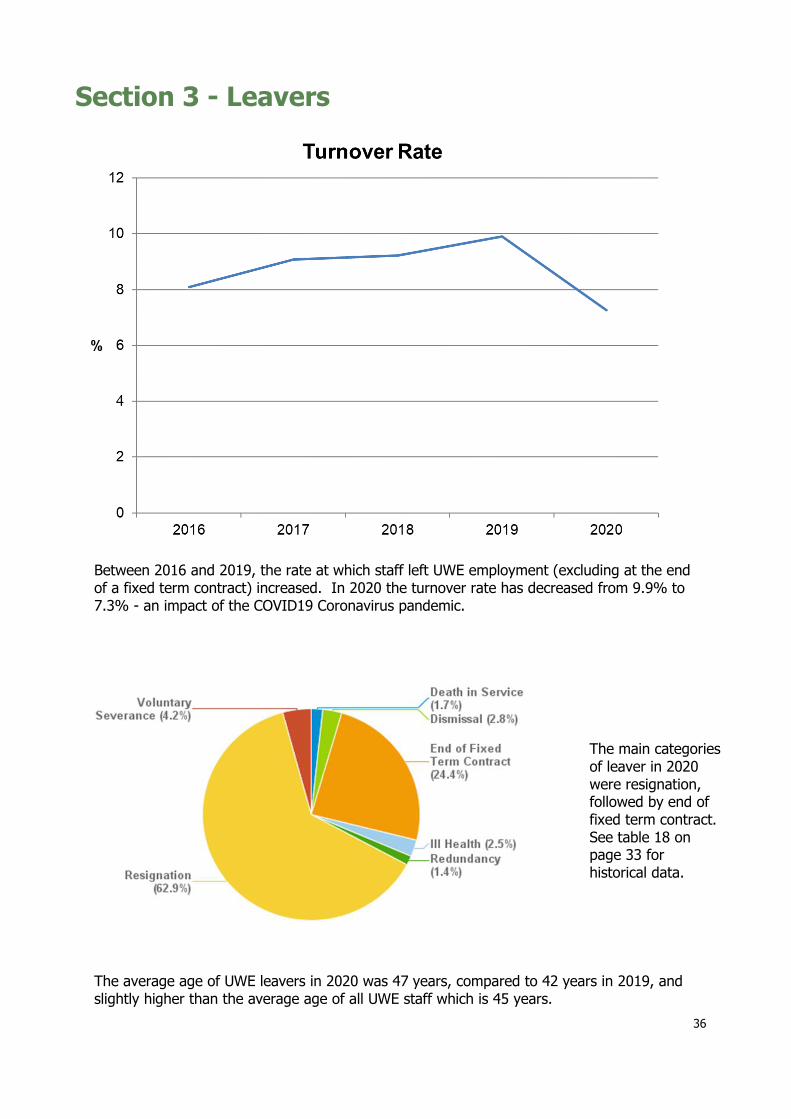
Between 2016 and 2019, the rate at which staff left UWE employment (excluding at the end of a fixed term contract) increased. In 2020 the turnover rate has decreased from 9.9% to 7.3% - an impact of the COVID19 Coronavirus pandemic.
The average age of UWE leavers in 2020 was 47 years, compared to 42 years in 2019, and slightly higher than the average age of all UWE staff which is 45 years.
The main categories of leaver in 2020 were resignation, followed by end of fixed term contract. See table 18 on page 33 for historical data.
37
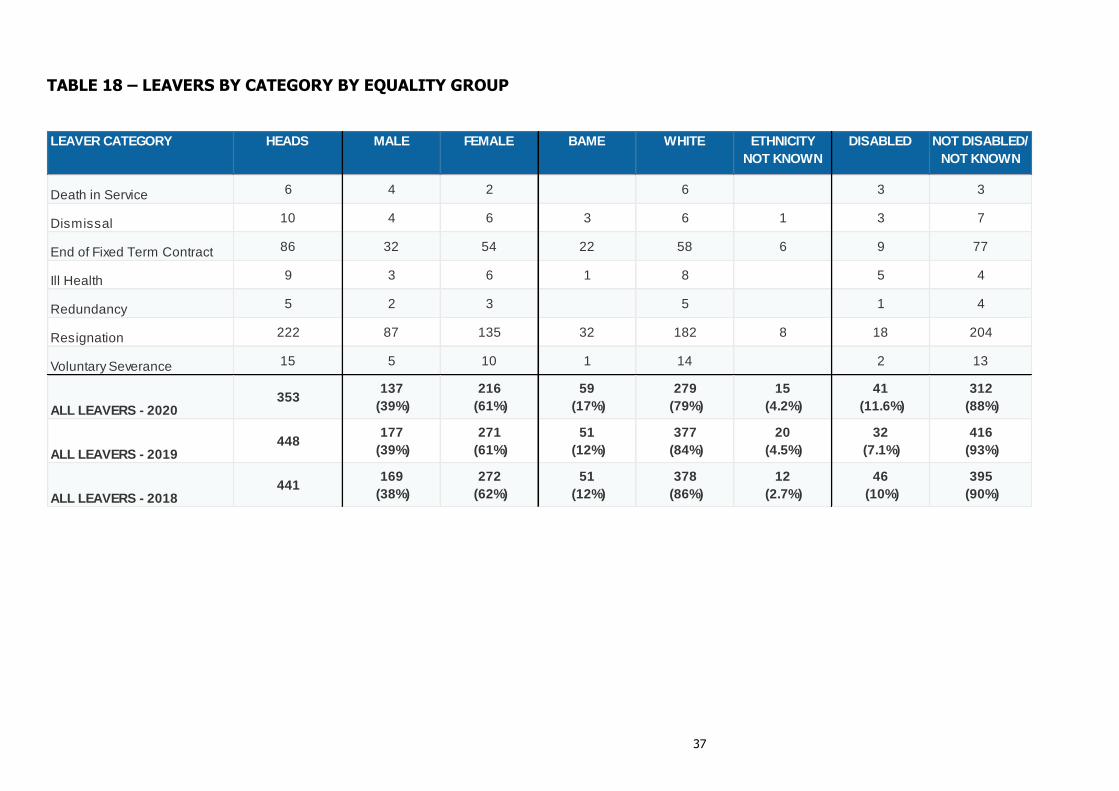
TABLE 18 – LEAVERS BY CATEGORY BY EQUALITY GROUP
HEADS MALE FEMALE BAME WHITE ETHNICITY
NOT KNOWN
DISABLED NOT DISABLED/
NOT KNOWN
6 4 2 6 3 3
10 4 6 3 6 1 3 7
86 32 54 22 58 6 9 77
9 3 6 1 8 5 4
5 2 3 5 1 4
222 87 135 32 182 8 18 204
15 5 10 1 14 2 13
353137
(39%)
216
(61%)
59
(17%)
279
(79%)
15
(4.2%)
41
(11.6%)
312
(88%)
448177
(39%)
271
(61%)
51
(12%)
377
(84%)
20
(4.5%)
32
(7.1%)
416
(93%)
441169
(38%)
272
(62%)
51
(12%)
378
(86%)
12
(2.7%)
46
(10%)
395
(90%)
ALL LEAVERS - 2020
ALL LEAVERS - 2019
ALL LEAVERS - 2018
LEAVER CATEGORY
Death in Service
Dismissal
End of Fixed Term Contract
Ill Health
Redundancy
Resignation
Voluntary Severance

38
TABLE 19 – REASONS FOR LEAVING (data is taken from the exit survey completed by leavers)
REASON FACULTIES SERVICES TOTALS TOTALS TOTALS
2020 2019 2018
Change of career path 3 4 7 12 16
Giving up employment 1 4 5 16 15
Seeking a more challenging role/development 1 2 3 15 13
Promotion/prospects 1 3 4 12 11
Moving out of area 2 2 4 9 7
End of fixed term contract 5 10 15 8 7
Personal/domestic reasons 2 3 5 5 6
Higher salary/better benefits 1 1 2 3 6
Workload demands/stress 1 0 1 3 5
Organisational culture/working relations 2 0 2 9 5
Management style 3 3 6 5
Job insecurity/impact of changes 2 1 3 2 4
Discrimination/harassment 0 0 0 2 4
Travel difficulties to/from work 1 0 1 1 3
Returning to education 0 0 0 0 1
Seeking more flexible working 0 0 0 0 1
Other 2 0 2 0 0
NUMBER OF RESPONDENTS 24 33 57 103 109
39
Section 4 – Staff Development and Career Progression
*NK = not known
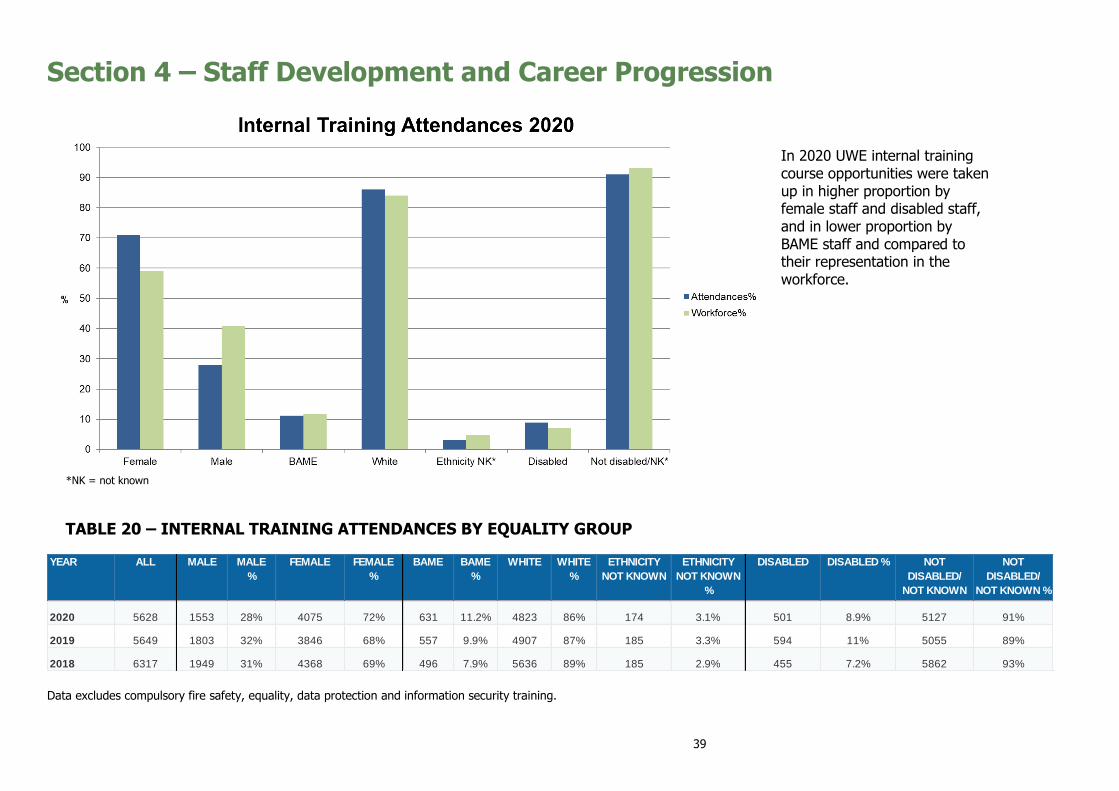
TABLE 20 – INTERNAL TRAINING ATTENDANCES BY EQUALITY GROUP
Data excludes compulsory fire safety, equality, data protection and information security training.
YEAR ALL MALE MALE
%
FEMALE FEMALE
%
BAME BAME
%
WHITE WHITE
%
ETHNICITY
NOT KNOWN
ETHNICITY
NOT KNOWN
%
DISABLED DISABLED % NOT
DISABLED/
NOT KNOWN
NOT
DISABLED/
NOT KNOWN %
2020 5628 1553 28% 4075 72% 631 11.2% 4823 86% 174 3.1% 501 8.9% 5127 91%
2019 5649 1803 32% 3846 68% 557 9.9% 4907 87% 185 3.3% 594 11% 5055 89%
2018 6317 1949 31% 4368 69% 496 7.9% 5636 89% 185 2.9% 455 7.2% 5862 93%
In 2020 UWE internal training course opportunities were taken up in higher proportion by female staff and disabled staff, and in lower proportion by BAME staff and compared to their representation in the workforce.

40
*NK = not known
TABLE 21 – CAREER PROGRESSION BY EQUALITY GROUP
TOTAL
Heads % Heads % Heads % Heads % Heads % Heads % Heads %
2020 155 56 36% 99 64% 20 13% 130 84% 5 3.2% 12 7.7% 143 92%
2019 262 87 33% 175 67% 28 11% 229 87% 5 1.9% 20 7.6% 242 92%
2018 302 117 39% 185 61% 34 11% 259 86% 9 3.0% 16 5.3% 286 95%
ETHNICITY DISABLED NOT DISABLED/ YEAR MALE FEMALE BAME WHITE
In 2020 career progression opportunities (promotion, regrading, secondment/ temporary upgrade) were taken up in higher proportion by female staff and by disabled staff compared to their representation in the workforce.
41
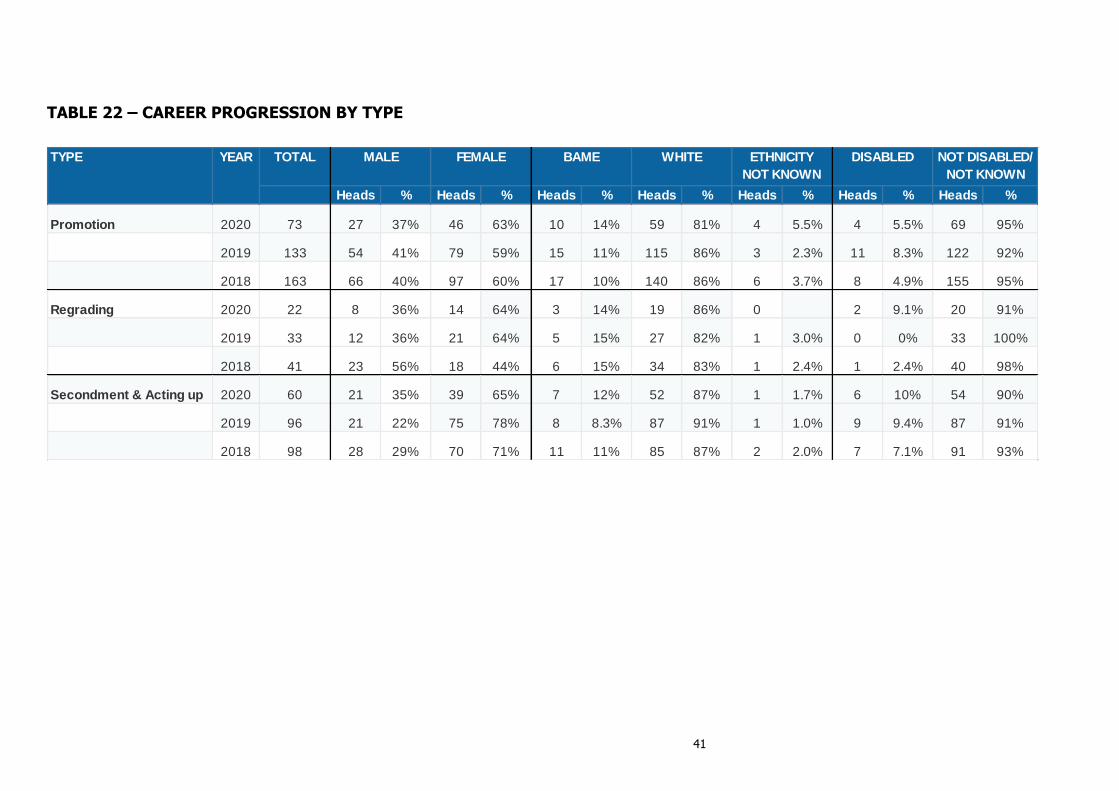
TABLE 22 – CAREER PROGRESSION BY TYPE
TOTAL
Heads % Heads % Heads % Heads % Heads % Heads % Heads %
Promotion 2020 73 27 37% 46 63% 10 14% 59 81% 4 5.5% 4 5.5% 69 95%
2019 133 54 41% 79 59% 15 11% 115 86% 3 2.3% 11 8.3% 122 92%
2018 163 66 40% 97 60% 17 10% 140 86% 6 3.7% 8 4.9% 155 95%
Regrading 2020 22 8 36% 14 64% 3 14% 19 86% 0 2 9.1% 20 91%
2019 33 12 36% 21 64% 5 15% 27 82% 1 3.0% 0 0% 33 100%
2018 41 23 56% 18 44% 6 15% 34 83% 1 2.4% 1 2.4% 40 98%
Secondment & Acting up 2020 60 21 35% 39 65% 7 12% 52 87% 1 1.7% 6 10% 54 90%
2019 96 21 22% 75 78% 8 8.3% 87 91% 1 1.0% 9 9.4% 87 91%
2018 98 28 29% 70 71% 11 11% 85 87% 2 2.0% 7 7.1% 91 93%
ETHNICITY
NOT KNOWN
DISABLED NOT DISABLED/
NOT KNOWN
WHITETYPE YEAR MALE FEMALE BAME
42
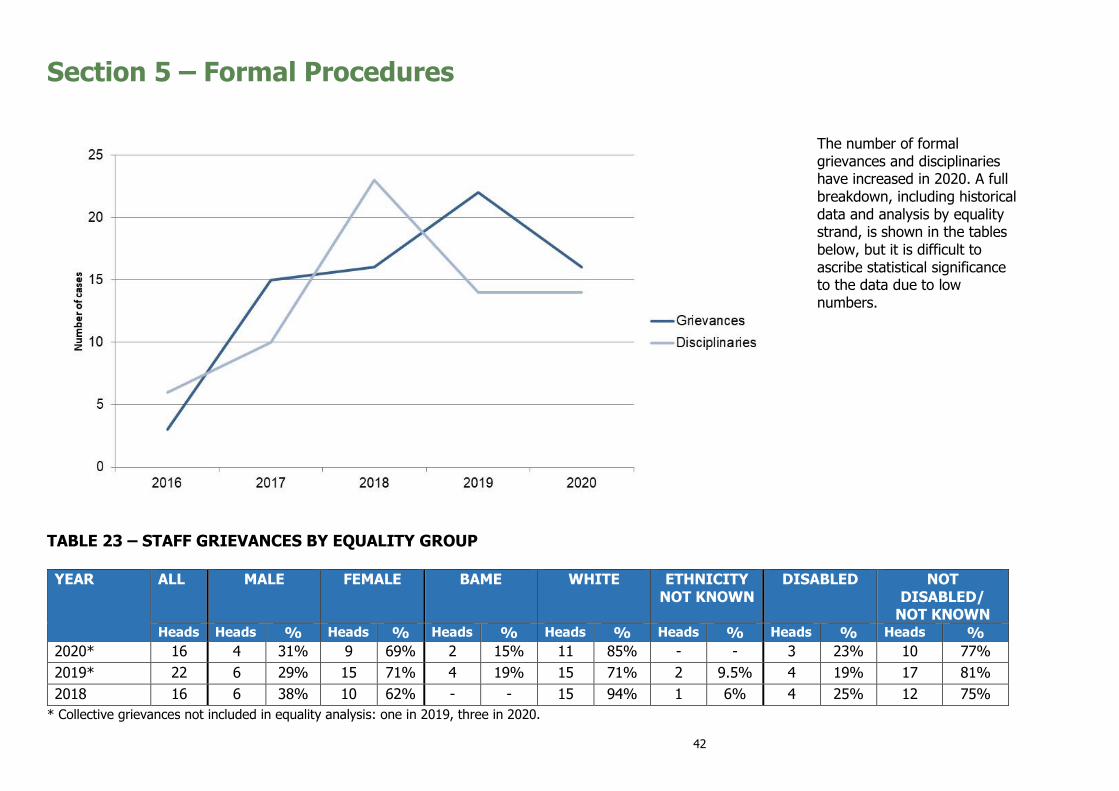
Section 5 – Formal Procedures
TABLE 23 – STAFF GRIEVANCES BY EQUALITY GROUP YEAR ALL MALE FEMALE BAME WHITE ETHNICITY
NOT KNOWN DISABLED NOT
DISABLED/ NOT KNOWN
Heads Heads % Heads % Heads % Heads % Heads % Heads % Heads %
2020* 16 4 31% 9 69% 2 15% 11 85% - - 3 23% 10 77%
2019* 22 6 29% 15 71% 4 19% 15 71% 2 9.5% 4 19% 17 81%
2018 16 6 38% 10 62% - - 15 94% 1 6% 4 25% 12 75%
* Collective grievances not included in equality analysis: one in 2019, three in 2020.
The number of formal grievances and disciplinaries have increased in 2020. A full breakdown, including historical data and analysis by equality strand, is shown in the tables below, but it is difficult to ascribe statistical significance to the data due to low numbers.

43
TABLE 24 – STAFF DISCIPLINARIES BY TYPE BY EQUALITY GROUP YEAR/TYPE ALL MALE FEMALE BAME WHITE ETHNICITY
NOT KNOWN DISABLED NOT
DISABLED/ NOT KNOWN
Heads Heads % Heads % Heads % Heads % Heads % Heads % Heads %
2020 Conduct Capability Performance
12 - 2
7 - 2
58% -
100%
5 - -
42% - -
5 - 1
42% -
50%
6 - 1
50% -
50%
1 -
8.3% - -
2 - 1
17% -
50%
10 - 1
83% -
50%
Total 2020 14 9 64% 5 36% 6 43% 7 50% 1 7.1% 3 21% 11 79%
Total 2019 14 12 86% 2 14% 3 21% 10 71% 1 7.1% - - 14 100%
Total 2018 23 12 52% 11 48% 4 17% 19 83% - - 2 9% 21 91%

44
Section 6 – Sickness Absence
In 2020 the sickness absence rate reduced to 2.2%, an impact of the COVID-19 pandemic. There were 19,585 days lost and 2,577 incidents, so on average sickness incidents were 7.6 days in duration.
TABLE 25 – SICKNESS ABSENCE RATES BY FACULTY/SERVICE
FACULTY/SERVICE
DAYS
LOST
2020
INCIDENTS
2020
ABSENCE
RATE 2020
ABSENCE
RATE 2019
ASBENCE
RATE 2018
ACE Faculty of Arts Creative Industries & Education 1567 160 1.7% 1.8% 2.2%
FBL Faculty of Business & Law 1150 86 1.4% 1.8% 2.1%
FET Faculty of Environment & Technology 1071 142 0.8% 1.3% 1.1%
HAS Faculty of Health & Applied Sciences 2517 207 1.5% 1.9% 2.1%
Faculty sub total 6305 595 1.4% 1.7% 1.8%
APD Academic Practice Directorate 197 7 5.4% 1.3% 0.9%
DIR Directorate 30 13 0.3% 0.3% 0.4%
FAC Facilities 5317 470 4.1% 4.8% 4.8%
FIN Finance Department 391 71 1.8% 2.8% 3.0%
HRS Human Resources 275 49 1.9% 4.4% 3.2%
ITS IT Services 864 157 2.0% 3.3% 3.0%
LCI Library Careers and Inclusivity 1085 250 2.0% 2.9% 3.0%
RBI Research Business & Innovation 461 110 2.0% 3.6% 2.6%
SAS Student and Academic Services 3504 629 4.1% 5.0% 4.3%
SCM Strategic Communications and Marketing 147 61 0.8% 3.3% 3.0%
SFS Future Students 894 139 3.6% 3.6% 2.6%
SPO Strategic Programmes Office 115 26 1.6% 2.6% 1.3%
Services sub total 13280 1982 3.0% 4.0% 3.7%
All services excluding manual staff 9181 1670 2.5% 3.6% 3.3%
Manual staff only 4099 312 5.4% 6.1% 5.3%
All Staff 19585 2577 2.2% 2.8% 2.7%
45
*NK = not known.
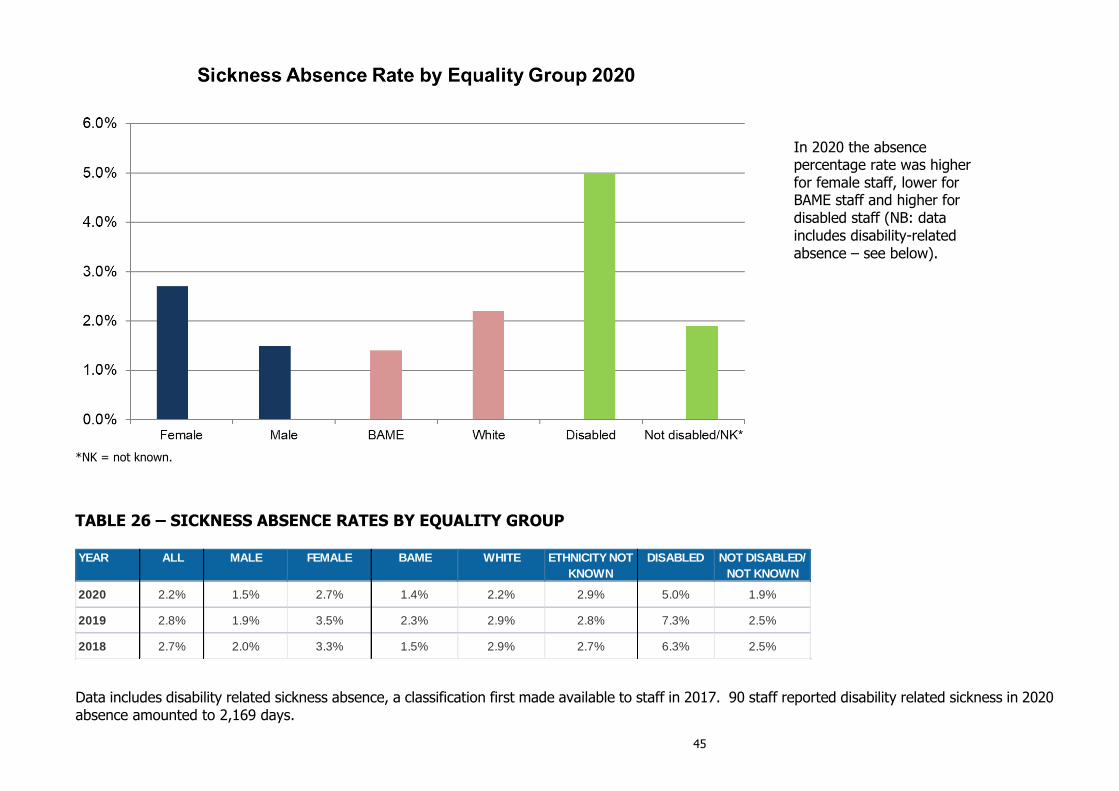
TABLE 26 – SICKNESS ABSENCE RATES BY EQUALITY GROUP
Data includes disability related sickness absence, a classification first made available to staff in 2017. 90 staff reported disability related sickness in 2020 absence amounted to 2,169 days.
YEAR ALL MALE FEMALE BAME WHITE ETHNICITY NOT
KNOWN
DISABLED NOT DISABLED/
NOT KNOWN
2020 2.2% 1.5% 2.7% 1.4% 2.2% 2.9% 5.0% 1.9%
2019 2.8% 1.9% 3.5% 2.3% 2.9% 2.8% 7.3% 2.5%
2018 2.7% 2.0% 3.3% 1.5% 2.9% 2.7% 6.3% 2.5%
In 2020 the absence percentage rate was higher for female staff, lower for BAME staff and higher for disabled staff (NB: data includes disability-related absence – see below).

46
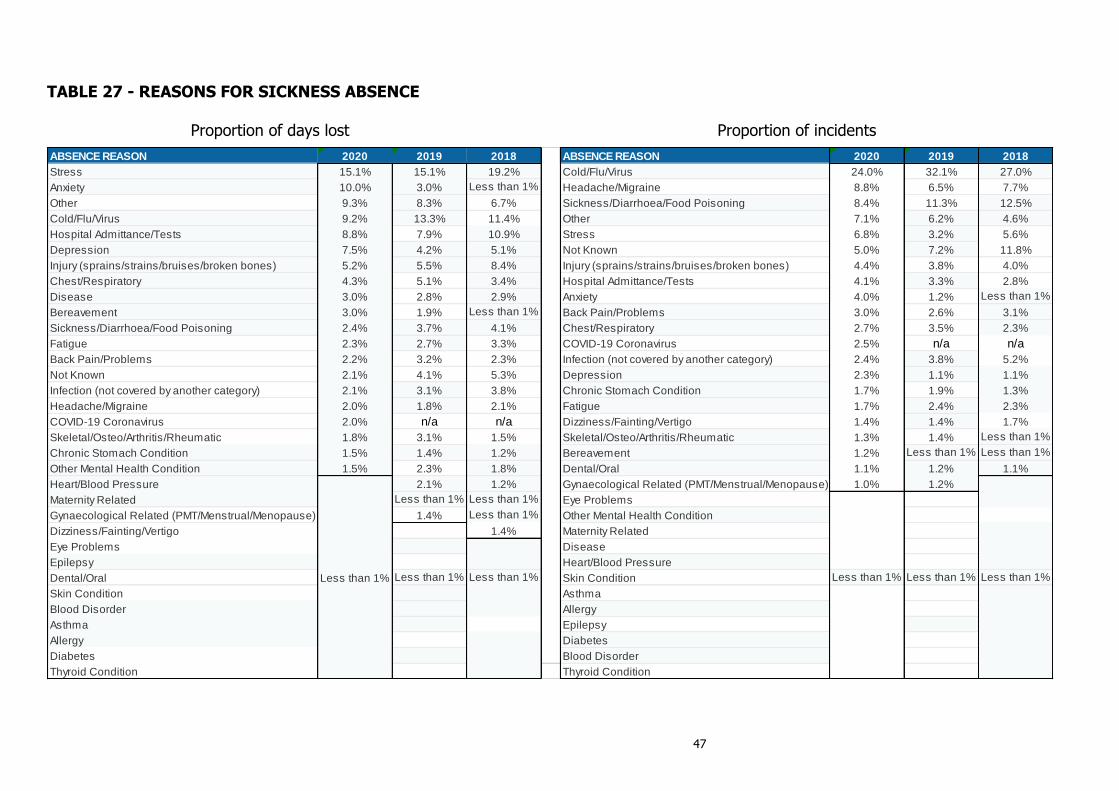
In 2020 the most days lost were due to stress/depression/anxiety/other mental health condition at 6,674 days (up from 6,189 in 2019).
Cold/flu/virus continues to be the reason with the highest incident rate at 618 incidents, but down significantly from 1,446 in 2019. This is suggestive of being an impact of the COVID19 pandemic.
The chart is restricted to reasons with an absence rate of 1% or more; data on all reasons and historical data is available in table 27 on page 41.
47
TABLE 27 - REASONS FOR SICKNESS ABSENCE Proportion of days lost Proportion of incidents
ABSENCE REASON 2020 2019 2018 ABSENCE REASON 2020 2019 2018
Stress 15.1% 15.1% 19.2% Cold/Flu/Virus 24.0% 32.1% 27.0%
Anxiety 10.0% 3.0% Less than 1% Headache/Migraine 8.8% 6.5% 7.7%
Other 9.3% 8.3% 6.7% Sickness/Diarrhoea/Food Poisoning 8.4% 11.3% 12.5%
Cold/Flu/Virus 9.2% 13.3% 11.4% Other 7.1% 6.2% 4.6%
Hospital Admittance/Tests 8.8% 7.9% 10.9% Stress 6.8% 3.2% 5.6%
Depression 7.5% 4.2% 5.1% Not Known 5.0% 7.2% 11.8%
Injury (sprains/strains/bruises/broken bones) 5.2% 5.5% 8.4% Injury (sprains/strains/bruises/broken bones) 4.4% 3.8% 4.0%
Chest/Respiratory 4.3% 5.1% 3.4% Hospital Admittance/Tests 4.1% 3.3% 2.8%
Disease 3.0% 2.8% 2.9% Anxiety 4.0% 1.2% Less than 1%
Bereavement 3.0% 1.9% Less than 1% Back Pain/Problems 3.0% 2.6% 3.1%
Sickness/Diarrhoea/Food Poisoning 2.4% 3.7% 4.1% Chest/Respiratory 2.7% 3.5% 2.3%
Fatigue 2.3% 2.7% 3.3% COVID-19 Coronavirus 2.5% n/a n/a
Back Pain/Problems 2.2% 3.2% 2.3% Infection (not covered by another category) 2.4% 3.8% 5.2%
Not Known 2.1% 4.1% 5.3% Depression 2.3% 1.1% 1.1%
Infection (not covered by another category) 2.1% 3.1% 3.8% Chronic Stomach Condition 1.7% 1.9% 1.3%
Headache/Migraine 2.0% 1.8% 2.1% Fatigue 1.7% 2.4% 2.3%
COVID-19 Coronavirus 2.0% n/a n/a Dizziness/Fainting/Vertigo 1.4% 1.4% 1.7%
Skeletal/Osteo/Arthritis/Rheumatic 1.8% 3.1% 1.5% Skeletal/Osteo/Arthritis/Rheumatic 1.3% 1.4% Less than 1%
Chronic Stomach Condition 1.5% 1.4% 1.2% Bereavement 1.2% Less than 1% Less than 1%
Other Mental Health Condition 1.5% 2.3% 1.8% Dental/Oral 1.1% 1.2% 1.1%
Heart/Blood Pressure 2.1% 1.2% Gynaecological Related (PMT/Menstrual/Menopause) 1.0% 1.2%
Maternity Related Less than 1% Less than 1% Eye Problems
Gynaecological Related (PMT/Menstrual/Menopause) 1.4% Less than 1% Other Mental Health Condition
Dizziness/Fainting/Vertigo 1.4% Maternity Related
Eye Problems Disease
Epilepsy Heart/Blood Pressure
Dental/Oral Less than 1% Less than 1% Less than 1% Skin Condition Less than 1% Less than 1% Less than 1%
Skin Condition Asthma
Blood Disorder Allergy
Asthma Epilepsy
Allergy Diabetes
Diabetes Blood Disorder
Thyroid Condition Thyroid Condition

48
Section 7 – Employee Assistance
The number of staff accessing the services of the Employee Assistance Programme reduced in 2020. The UWE workforce is 58% female and 42% male, therefore the data shows a higher proportion of female staff use the service compared to male staff, though male staff usage is increasing.
TABLE 28 – USE OF EAP SERVICES
TYPE 2020 2019 2018
HEADS MALE FEMALE HEADS MALE FEMALE HEADS MALE FEMALE
TOTAL HELPLINE
USAGE
Legal helpline
182
55
38% 62% 230
83
30% 70% 141
45
29% 71%
Telephone counselling
127 147 96
49
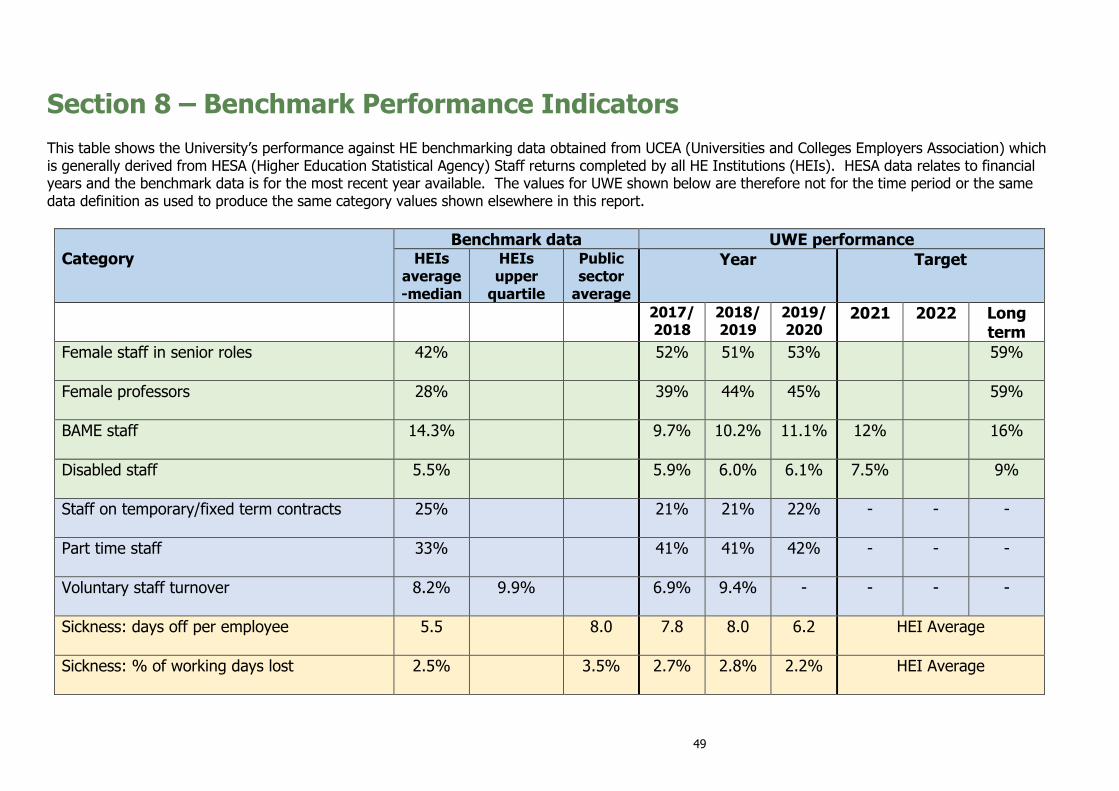
Section 8 – Benchmark Performance Indicators
This table shows the University’s performance against HE benchmarking data obtained from UCEA (Universities and Colleges Employers Association) which is generally derived from HESA (Higher Education Statistical Agency) Staff returns completed by all HE Institutions (HEIs). HESA data relates to financial years and the benchmark data is for the most recent year available. The values for UWE shown below are therefore not for the time period or the same data definition as used to produce the same category values shown elsewhere in this report.
Category
Benchmark data UWE performance HEIs
average-median
HEIs upper
quartile
Public sector
average
Year Target
2017/2018
2018/2019
2019/2020
2021 2022 Long term
Female staff in senior roles
42% 52% 51% 53% 59%
Female professors
28% 39% 44% 45% 59%
BAME staff
14.3% 9.7% 10.2% 11.1% 12% 16%
Disabled staff
5.5% 5.9% 6.0% 6.1% 7.5% 9%
Staff on temporary/fixed term contracts
25% 21% 21% 22% - - -
Part time staff
33% 41% 41% 42% - - -
Voluntary staff turnover
8.2% 9.9% 6.9% 9.4% - - - -
Sickness: days off per employee
5.5 8.0 7.8 8.0 6.2 HEI Average
Sickness: % of working days lost
2.5% 3.5% 2.7% 2.8% 2.2% HEI Average