stakeholder participation and sustainability challenges...
TRANSCRIPT
Stakeholder participation and sustainability challenges confronting
a small urban community-managed water supply project: Case
study of Buea, Cameroon
Mehdi Zian Sally
Department of Civil Engineering and Applied Mechanics
McGill University, Montreal
October 2011
A thesis submitted to McGill University in partial fulfillment of the requirements of the
degree of Master of Engineering
© Mehdi Zian Sally 2011

i
Abstract
Community-managed initiatives play an important role in global efforts to meet the
Millennium Development Goal for water supply provision of halving the population
without access to improved water sources, especially in developing countries. However,
in the context of growing urbanisation, these community-managed projects are
increasingly intersecting urban areas that by their very nature are at odds with traditional
rural community-based management practices. This research examines the case of a small
community-managed water supply scheme in Buea, a rapidly growing urban area in
Cameroon. The study adopted qualitative research methods (household questionnaires
and interviews of community water management and users) and applied choice
experiments to better understand the sustainability challenges facing community-
managed water supply projects in an urbanizing setting, a phenomenon of growing
importance in many developing areas.
This thesis presents and discusses the findings that in urban areas, community-managed
schemes face added management and planning pressures because of larger, more diverse,
populations and rapid population growth. Therefore they require greater support from
government, non-governmental organisations, and development agencies to provide them
with improved technical planning capacity and post-construction operation and
maintenance support. Furthermore, urban community-managed schemes require strong
political and institutional support to uphold their participatory mechanisms that due to the
urban context are at risk of failure. Lack of participation has the added consequences of
reducing accountability, reducing cost recovery, and impairing financial sustainability.
Based on the results of this research in Buea, failing the provision of support, the future
of community-managed schemes in urban areas is an unsustainable one, reneging on the
Millennium Development Goals and forcing a return to ―unimproved‖ sources of water.
ii
Resumé
Les projets gérés par les communautés jouent un rôle important dans les efforts
mondiaux pour atteindre l‘Objectif du Millénaire pour le Développement rélatif à
l'approvisionnement en eau, en particulier dans les pays en voie de développement.
Toutefois, dans le contexte de l'urbanisation croissante ces projets de développement
communautaires se trouvent de plus en plus dans les zones urbaines qui, par
leur nature même, sont en conflit avec les notions et pratiques traditionnelles de la
gestion communautaire rurale. Cette recherche examine le cas d'un projet de gestion
communautaire pour l‘approvisionnement de l‘eau à Buea, une région en pleine
expansion urbaine au Cameroun. L‘étude a adopté des méthodes de
recherche qualitative et a appliqué la modélisation de choix pour mieux comprendre
les défis auxquels font face les projets de gestion communautaire d'approvisionnement
en eau dans un contexte urbain, phénomène en pleine expansion dans de
nombreuses régions en voie de développement.
Les résultats de cette thèse font apparaitre que le contexte urbain rajoute des exigences
aux processus de planification et de gestion. Ce qui nécessite un plus grand soutien de la
part du gouvernement, des organisations non-gouvernementales, et des agences de
développement pour améliorer les capacités techniques de planification ainsi que le
fonctionnement et l‘entretien des réalisations post-construction. En outre, les projets de
gestion communautaires en milieu urbain ont aussi besoin de l‘appui politique
et institutionnel ferme pour assurer la durabilité de leurs mécanismes de
participation qui sont de plus en plus difficiles à soutenir en zone urbaine et sans lesquels
la viabilité financière de ces projets est mise en doute. A défaut d‘appui, l'avenir des
projets communautaires d‘approvisionnement de l‘eau dans les zones urbaines risque
d‘être compromis, affectant la réalisation des Objectifs du Millénaire pour le
Développement et obligeant un retour aux sources d'eau insalubres.
iii
Acknowledgements
I am indebted to the people and organisations that provided me with tremendous input
and support throughout these past semesters of intellectual and personal development.
First, I would like to thank all the wonderful people of Buea who made my stay
memorable, and who made me feel welcome from the first day. I am especially indebted
to Eselcha Derick Folefac, my good friend, guide, and research assistant, and all of his
friends for their hospitality. I would also like to thank Professor George Nkeng of the
Ecole Nationale Supérieure des Travaux Publics Yaounde, Dr. Lydia Lifongo and Dr.
Sunday Shende Kometa at the University of Buea for their input without which this thesis
would not be possible. I also thank Mr. Becke Smith Muloa, Chairman and Mr. Eko Peter
Ekenya, Technician of the Great Soppo Wokoko Molyko Community Water Supply
Scheme; Mr. Kedia Bassibang, journalist and group discussion moderator; Mr. Elinge,
Buea Rural Council; Dr. Richard Akoachere, University of Buea; Mr. Ako Andrew Ako,
University of Kumamoto for their help and technical support.
At McGill University, the logistical and financial support of the Department of Civil
Engineering and Applied Mechanics and the financial support of the Global
Environmental and Climate Change Centre (GEC3) Graduate Student Stipend are
acknowledged.
I owe the utmost to Professor Susan Gaskin, my thesis supervisor, for her patience,
guidance, and flexibility. Special thanks to Mr. Fidelis Folifac for our enlightening group
iv
discussions, advice, and the moral and logistical support provided in Buea. My friends
also cannot go unacknowledged for their moral support.
Finally, I thank my parents, Hilmy Sally and Liqa Raschid, for all their support,
inspiration, and for all of the opportunities that they have provided me with.

v
Table of Contents
Table of Contents ................................................................................................................ v
List of Figures .................................................................................................................... vii
List of Tables ..................................................................................................................... vii
1. Introduction ...................................................................................................................... 1
1.1 The Millennium Development Goals ......................................................................... 1
1.2 Buea’s water crisis .................................................................................................... 2
1.3 Objectives, significance, and background of the thesis ............................................ 7
1.4 The Great Soppo, Wokoko, Molyko Community Water Supply Scheme .................. 8
1.5 Research Questions ................................................................................................11
1.6 Organisation of the thesis .......................................................................................12
2. Literature Review ...........................................................................................................14
2.1 Community-managed water supply ........................................................................14
2.2 Sustainability of community water supply ...............................................................16
2.3 The importance of participation ...............................................................................20
2.4 Participatory Action Research .................................................................................24
2.5 Choice experiments in the water sector ..................................................................24
2.6 Summary .................................................................................................................27
3. Methodology ..................................................................................................................28
3.1 Field visit .................................................................................................................28
3.2 Definition of research and choice of study area ......................................................28
3.3 Personal observations and physical data ...............................................................29
3.4 Interviews ................................................................................................................30
3.5 Questionnaire ..........................................................................................................30
3.6 Choice Experiments ................................................................................................32
3.6.1 Explanation of attributes ..................................................................................33
3.6.2 Analysis of the choice model ...........................................................................34
4. Results and Discussion .................................................................................................36
4.1 Results ....................................................................................................................36
4.1.1 Description and location of the GWM scheme in Buea ...................................36
4.1.2 Demographics and the role of women in water in Buea ..................................42
4.1.3 Characteristics of community water use ..........................................................44
4.1.4 Key findings......................................................................................................47
4.2 A discussion of the problem ....................................................................................48
4.2.1 The context: about the GWM scheme .............................................................48
4.2.2 Understanding users’ “satisfaction”..................................................................49
vi
4.2.3 The extent of the problems: all is not well ........................................................51
4.2.4 Implications: the gravity of the problems .........................................................53
4.3 The underlying causes ............................................................................................56
4.3.1 Unsustainable development due to poor planning...........................................56
4.3.2 Ineffective management and insufficient capacity ...........................................60
4.4 The breakdown of participation and of the management committee ......................62
4.4.1 The “indigene” and “stranger” dynamic ............................................................63
4.4.2 Rapid population growth and the dynamic nature of urban population ...........65
4.4.3 Reduction of the feedback systems of rural community-managed schemes ..67
4.4.4 The logistical burden of participating in urban communities ............................68
4.5 The next step: the potential for financial self-sufficiency and cost recovery .......70
4.5.1 Barriers to payment ..........................................................................................70
4.5.2 Users’ satisfaction ............................................................................................72
4.5.3 Disutility of gratis water ....................................................................................73
4.6 Meeting the needs of users and designing appropriate policy ................................74
4.6.1 Importance of inclusive participation of women ...............................................74
4.6.2 Importance of treated water .............................................................................77
4.7 A role for PAR methodology in community water action in Buea ...........................78
5. Conclusions: the consequences of urbanization on community-managed water supply and the
way forward .......................................................................................................................80
5.1 Summary .................................................................................................................80
5.2 Adapting the “hard” side: project planning and technical support ...........................81
5.3 Adapting the “soft” side: political and institutional support for participation ............83
5.4 The future ................................................................................................................84
References ........................................................................................................................86
Appendix I. Transcripts of Interviews .................................................................................94
Appendix II. Sample Questionnaire and Choice Sets .....................................................107
Appendix III. Questionnaire Open-Ended Questions Qualitative Data ............................115
Appendix IV. Household Questionnaire Responses .......................................................119
Appendix V. Choice model output ...................................................................................125
Appendix VI. Datasheet about Great Soppo Wokoko Molyko Community Scheme .......131
vii
List of Figures
Figure 1.1 Location of Cameroon in Central Africa and Mount Cameroon Region (Fako) . 3
Figure 2.1 Sample Choice Experiment Set (reproduced from Hensher et al 2005) ..........26
Figure 4.1 Location of the GWM scheme (blue) in Buea ..................................................37
Figure 4.2 Dimensions of the GWM scheme .....................................................................38
Figure 4.3 Elevations of selected points in the GWM scheme pipeline ............................39
Figure 4.4 Prevalence of rainwater harvesting in the GWM scheme ................................54
Figure 4.5 Bar chart of distribution of rainwater volume (litres) collected per rainfall event by
community water users ......................................................................................................55
Figure 4.6 Chart of mean total monthly rainfall in Buea ....................................................55
List of Tables
Table 2.1 Factors influencing willingness to pay for community water .............................20
Table 3.1 Summary of attributes in Choice Experiment ....................................................33
Table 4.1 Flow in the GWM scheme network ....................................................................39
Table 4.2 Socio-economic profile of respondents .............................................................43
Table 4.3 Characteristics of community water use for GWM scheme ..............................46
Table 4.4 Contingency table of user satisfaction and sense of ownership .......................50
Table 4.5 Mean, median and mode of volume of rainwater collected per rainfall event ...54
Table 4.6 Results of the choice experiment ......................................................................73

viii
1
1. Introduction
1.1 The Millennium Development Goals
Much emphasis has been placed over the past decade on the fulfilment of the United
Nations‘ Millennium Development Goals (MDG). Target 7C of halving the world‘s
population without access to improved sources of water has been responded to
enthusiastically and many parts of the world are set to reach, or even exceed the target.
The importance of water to human life has resulted in the aim of fulfilling MDG 7C
being addressed through various local, community and private sector initiatives (Spencer
et al. 2008), yet there is no consensus on the best type of initiative to focus on to
contribute to the target. The ongoing debate about the privatization of water services in
developing countries encompasses questions of water as a human right on the one hand,
and concern that privatization will further marginalise low income groups‘ access to
water on the other. According to Budds and McGranahan (2003) privatization is
generally driven by broad political trends rather than evidence and experiences from the
water sector. In fact, Budds and McGranahan conclude that there is no justification for
continuing to promote private sector participation as a means of achieving the MDG
targets. Hence, the relative importance of the other initiatives, public sector and
community initiatives increases. There is evidence that demand-driven community
initiatives are able to deliver sustainable results in water provision (Whittington et al,
2009), and indeed, community management is being applied widely (Njoh, 2003).
However, the caveat as explained by Harvey and Reed (2007) is that some community
water initiatives are established without sufficient ongoing institutional and technical
2
support and as a result do not end up providing the originally intended levels of service
sustainability.
Effectively, the quality of management can either make or break the effectiveness of any
system, including that of a community-managed water system. Community-managed
water systems, in the context of this thesis, are small water supply networks serving small
rural or urban communities established by governmental, non-governmental, or private
actors, that are operated and managed locally by members of the community who are
neither highly skilled nor professional water managers using situation and skill-
appropriate technology. Because of this nature, these essentially volunteer-run networks
require some support in order to function effectively. There is much mention in the
academic literature about distribution system failures on the one hand, and on the other
there are success stories due to effective implementation, which will be discussed later in
the literature review. This research seeks to put the literature into context and apply it to
the particular case of a community managed water supply system in an urban setting, by
examining the challenges facing a small urban community water supply scheme in Buea
in the Southwest Region of Cameroon.
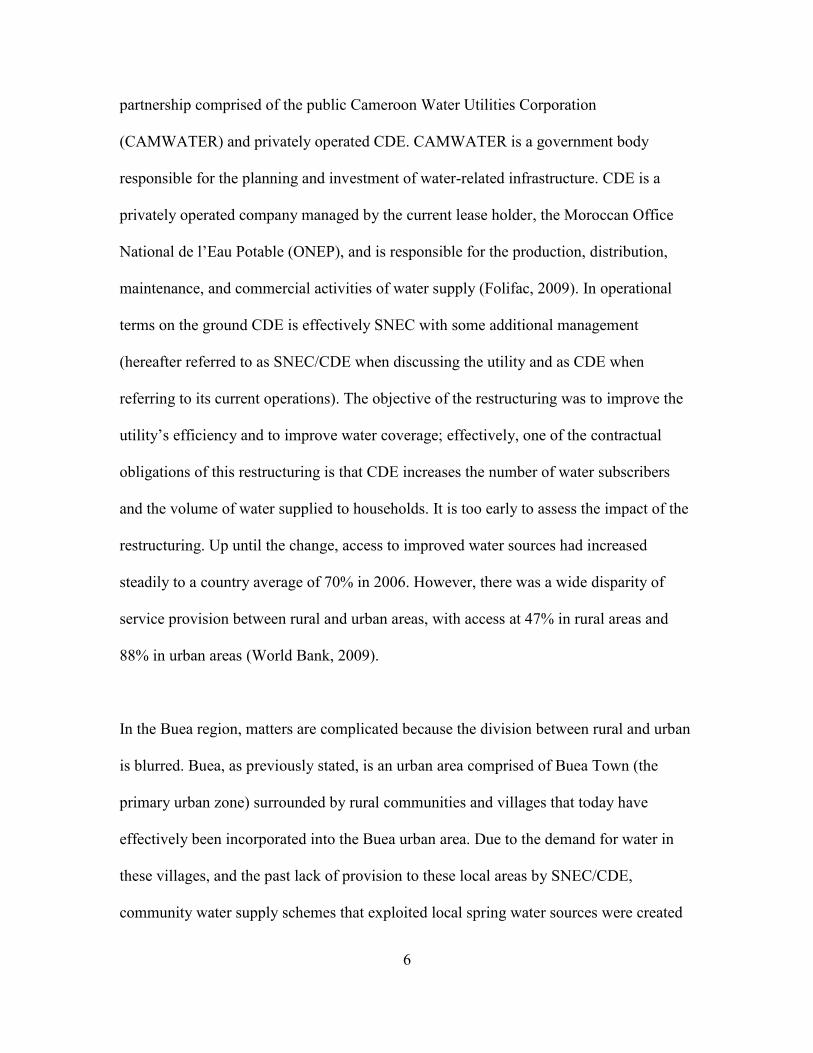
1.2 Buea’s water crisis
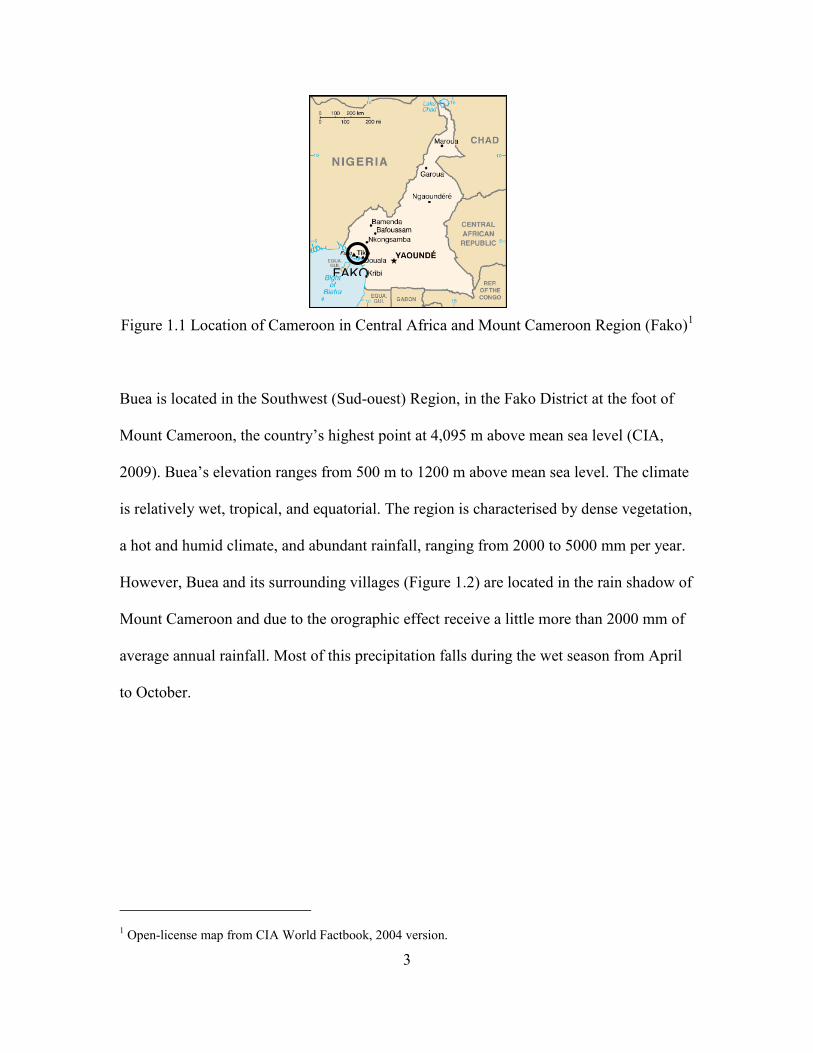
The Republic of Cameroon, in Western Africa, was formed at independence in 1961 from
the merger of the two colonies of French Cameroun and British Cameroons (Figure 1.1).
3
Figure 1.1 Location of Cameroon in Central Africa and Mount Cameroon Region (Fako)1
Buea is located in the Southwest (Sud-ouest) Region, in the Fako District at the foot of
Mount Cameroon, the country‘s highest point at 4,095 m above mean sea level (CIA,
2009). Buea‘s elevation ranges from 500 m to 1200 m above mean sea level. The climate
is relatively wet, tropical, and equatorial. The region is characterised by dense vegetation,
a hot and humid climate, and abundant rainfall, ranging from 2000 to 5000 mm per year.
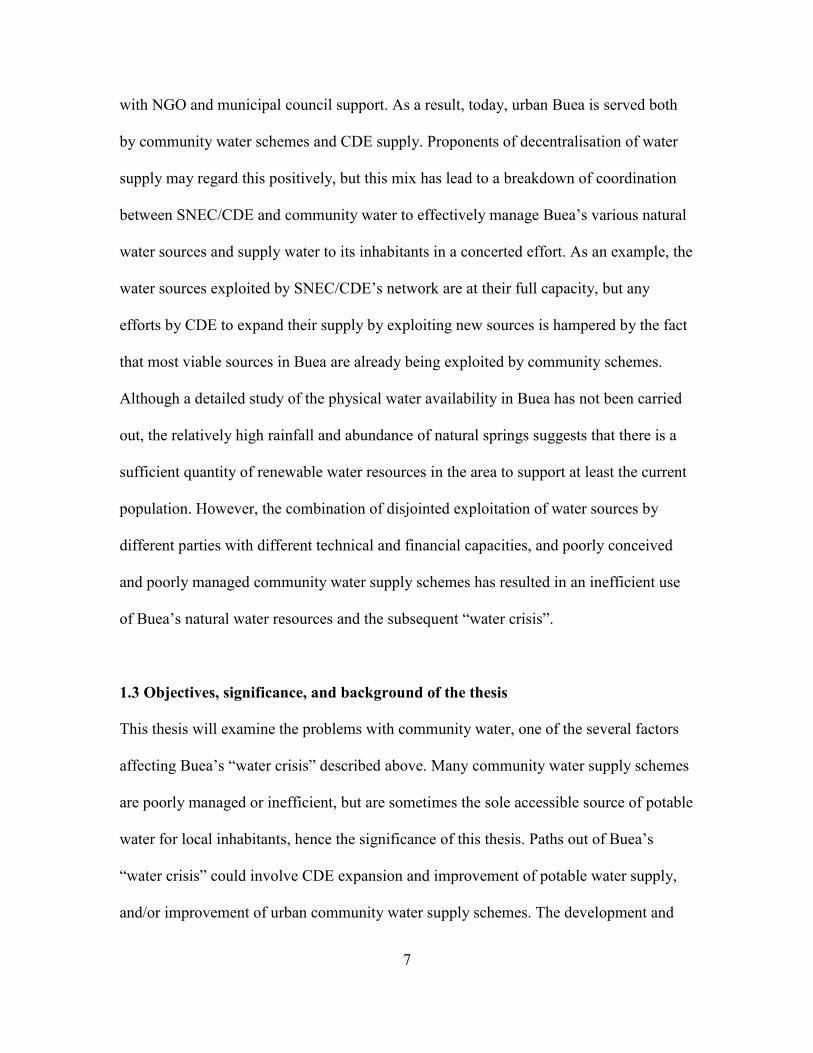
However, Buea and its surrounding villages (Figure 1.2) are located in the rain shadow of
Mount Cameroon and due to the orographic effect receive a little more than 2000 mm of
average annual rainfall. Most of this precipitation falls during the wet season from April
to October.
1 Open-license map from CIA World Factbook, 2004 version.
FAKO
4
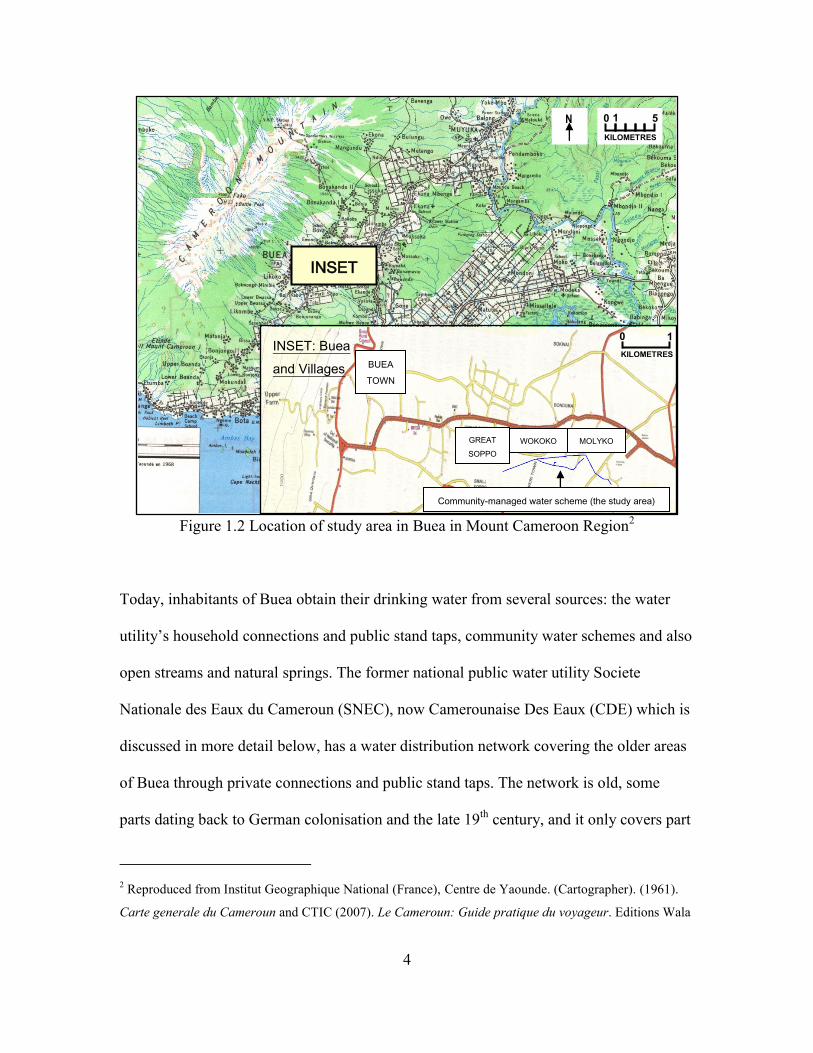
Figure 1.2 Location of study area in Buea in Mount Cameroon Region2
Today, inhabitants of Buea obtain their drinking water from several sources: the water
utility‘s household connections and public stand taps, community water schemes and also
open streams and natural springs. The former national public water utility Societe
Nationale des Eaux du Cameroun (SNEC), now Camerounaise Des Eaux (CDE) which is
discussed in more detail below, has a water distribution network covering the older areas
of Buea through private connections and public stand taps. The network is old, some
parts dating back to German colonisation and the late 19th
century, and it only covers part
2 Reproduced from Institut Geographique National (France), Centre de Yaounde. (Cartographer). (1961).
Carte generale du Cameroun and CTIC (2007). Le Cameroun: Guide pratique du voyageur. Editions Wala
INSET
INSET: Buea
and Villages
Community-managed water scheme (the study area)
GREAT
SOPPO
BUEA
TOWN
MOLYKO WOKOKO
1
KILOMETRES
0
1
KILOMETRES
0 5
N
5
of the modern town. Buea is the historic capital of the colonies of German Kamerun and
later of the British Southern Cameroons. Its political importance to Anglophone
Cameroonians in the unified independent Republic of Cameroon led it to being the site of
the first Anglophone university in Cameroon, the University of Buea, in 1993. Since the
establishment of the university the town has seen a dramatic increase in population and
urbanisation, which has resulted in the strain on its water resources seen today. Buea
Town itself has a population of only about 47,000 (Republique du Cameroun, 2006) but it
is surrounded by a built up area of about a dozen villages that make up the Buea urban
area, with a population of almost 200,000 (Buea Rural Council). The population density
in this area is 175 people per square kilometre, compared to the country‘s average of 34
(Republique du Cameroun, 2006).
The ―water crisis‖ as it is known locally, is a result of (1) demand exceeding supply and
(2) the poor management of current water supply infrastructure. Furthermore, Buea‘s
water supply shortfall is happening despite the relatively abundant annual rainfall and
natural water resources in the region. The first factor, excess demand, is a result of the
influx of migrants to the region after the University of Buea was established. The second
factor of poor management is, however, a more complex issue to understand, for which
one must examine the different water providers in Buea. Water provision in urban areas
was predominantly the responsibility of the government utility SNEC (Societe Nationale
des Eaux du Cameroun) until recently. In 2005, the government approved the
restructuring of the water sector under the guidance of the World Bank and International
Monetary Fund (IMF 2000): SNEC would be taken over and replaced by a public-private
6
partnership comprised of the public Cameroon Water Utilities Corporation
(CAMWATER) and privately operated CDE. CAMWATER is a government body
responsible for the planning and investment of water-related infrastructure. CDE is a
privately operated company managed by the current lease holder, the Moroccan Office
National de l‘Eau Potable (ONEP), and is responsible for the production, distribution,
maintenance, and commercial activities of water supply (Folifac, 2009). In operational
terms on the ground CDE is effectively SNEC with some additional management
(hereafter referred to as SNEC/CDE when discussing the utility and as CDE when
referring to its current operations). The objective of the restructuring was to improve the
utility‘s efficiency and to improve water coverage; effectively, one of the contractual
obligations of this restructuring is that CDE increases the number of water subscribers
and the volume of water supplied to households. It is too early to assess the impact of the
restructuring. Up until the change, access to improved water sources had increased
steadily to a country average of 70% in 2006. However, there was a wide disparity of
service provision between rural and urban areas, with access at 47% in rural areas and
88% in urban areas (World Bank, 2009).
In the Buea region, matters are complicated because the division between rural and urban
is blurred. Buea, as previously stated, is an urban area comprised of Buea Town (the
primary urban zone) surrounded by rural communities and villages that today have
effectively been incorporated into the Buea urban area. Due to the demand for water in
these villages, and the past lack of provision to these local areas by SNEC/CDE,
community water supply schemes that exploited local spring water sources were created
7
with NGO and municipal council support. As a result, today, urban Buea is served both
by community water schemes and CDE supply. Proponents of decentralisation of water
supply may regard this positively, but this mix has lead to a breakdown of coordination
between SNEC/CDE and community water to effectively manage Buea‘s various natural
water sources and supply water to its inhabitants in a concerted effort. As an example, the
water sources exploited by SNEC/CDE‘s network are at their full capacity, but any
efforts by CDE to expand their supply by exploiting new sources is hampered by the fact
that most viable sources in Buea are already being exploited by community schemes.
Although a detailed study of the physical water availability in Buea has not been carried
out, the relatively high rainfall and abundance of natural springs suggests that there is a
sufficient quantity of renewable water resources in the area to support at least the current
population. However, the combination of disjointed exploitation of water sources by
different parties with different technical and financial capacities, and poorly conceived
and poorly managed community water supply schemes has resulted in an inefficient use
of Buea‘s natural water resources and the subsequent ―water crisis‖.
1.3 Objectives, significance, and background of the thesis
This thesis will examine the problems with community water, one of the several factors
affecting Buea‘s ―water crisis‖ described above. Many community water supply schemes
are poorly managed or inefficient, but are sometimes the sole accessible source of potable
water for local inhabitants, hence the significance of this thesis. Paths out of Buea‘s
―water crisis‖ could involve CDE expansion and improvement of potable water supply,
and/or improvement of urban community water supply schemes. The development and
8
expansion of the CDE network is highly dependent on political initiatives and
government policy and is a traditional ―top-down‖ supply driven method of addressing
the crisis. However, community schemes represent a different, promising methodology:
they are small, local community driven initiatives with low-technology solutions and
require low capital costs with the potential to become self-sufficient. Communities have
more direct involvement with the definition of problems and planning of solutions with
theoretically better tailored, efficient solutions. Yet these schemes are still faced with
challenges that threaten their effective and efficient operation in the long term. Some
schemes suffer from irregular water supply, many are supplying untreated water, and
others find it difficult to truly be financially and operationally viable.
These are serious implications when it comes to understanding what progress towards
meeting MDG 7C means. The success of MDG 7C depends partly on the effectiveness of
community water schemes, and their ability to provide users with sustained
improvements in potable water supply. Therefore, this thesis examines one such small
community water supply scheme as a case study of the challenges facing a small urban
community water supply schemes, and identifies the factors behind the challenges while
proposing improvements for the future.
1.4 The Great Soppo, Wokoko, Molyko Community Water Supply Scheme
The Great Soppo, Wokoko, Molyko Community Water Supply Scheme--named after the
respective villages served by the scheme (see Figure 1.2) and which will be referred to as
the GWM Scheme--was envisioned in the late 1990s as a potable water supply system for

9
the inhabitants of those areas who lacked basic potable water supply. Before the scheme,
users relied on ―unimproved‖ water sources, such as open watercourses or on public
stand taps provided by the municipal council, but that were located several hundreds of
meters away from their homes. A source of potable water was needed because at the time
that the original SNEC distribution network was constructed, the area in question was
farmland, and it was not foreseen that someday the area would become more densely
settled.
The three villages are located on the slopes of Mount Cameroon; Great Soppo is at an
elevation of about 700m, Wokoko is around 600m and Molyko is around 550m above sea
level. The implementation of the project was conceived of as a three phase process. The
first phase, which is the only one currently in operation, is a gravity-driven network
serving the communities of Wokoko and Molyko, the two villages downhill from the
village of Great Soppo, using a water source located in Great Soppo. Although most
residents in Great Soppo do not benefit from the gravity-driven piped distribution
network of the GWM scheme because they are at the same elevation as the source of the
network, users in Great Soppo have access to the source itself, which is used as a point
source by residents in the immediate vicinity. The second phase of the project would have
continued downhill and served the University of Buea in Molyko, however, that part was
abandoned because of difficulties in maintenance due to vandalism. The third phase
would have been to supply the village of Great Soppo with water, by pumping water to a
tank at the highest point in Great Soppo and distributing it to the village. The

10
implementation of this phase was also abandoned because of lack of funds and logistical
difficulties of providing power for the pumping process.
The major actors involved in the conception and eventual construction of the GWM
scheme in 2001 and 2002 were: residents of the local communities of Great Soppo,
Wokoko, Molyko; Buea Rural Council; Organisation for Sustainable Rural Infrastructure
(OSRI), NGO – Kumba, Cameroon; and Helvetas Cameroon, NGO – Bamenda,
Cameroon. The GWM scheme was constructed in 2001 and 2002 at a cost of around
70,000,000 CFA (Helvetas Cameroon, 2006) equivalent to about 150,000 CAD in
January 20023. To date, the scheme provides water to approximately 80 to 100
households. The scheme was set up with the assistance of the Swiss development agency
Helvetas, who provided technical and financial assistance in partnership with local
NGO‘s and beneficiaries. The local NGO OSRI planned and built the scheme with help
from members of the local community, who contributed financially and provided
manpower.
A participatory process including local consultations was carried out. After construction,
the scheme was handed over to the Buea Rural Council. From the outset, the scheme was
intended to be community managed with a trained functional management committee in
place, as described in the Helvetas Cameroon (2007, p.5) report on the sustainability of
their interventions in Cameroon. A functional management committee would be in charge
of operation and maintenance of the scheme, hold regular meetings, have a bank account
3 Historical exchange rate obtained from http://www.xe.com/ict
11
and keep records (Helvetas Cameroon, 2007, p.5). They should also have the authority to
be able to track and punish defaulters who refuse either to pay dues or to participate in
community work. The outcomes of this research will describe and analyse the actual
effectiveness of the GWM Scheme‘s management on the ground.
1.5 Research Questions
One of the major challenges of community water supply schemes is ensuring financial
sustainability and self-sufficiency. According to Carter et al. (1999) many schemes fail
operationally because the financial costs that communities are expected to contribute are
impracticable or unacceptable, or communities may never have felt ownership of the
infrastructure so that repairs and maintenance are not carried out. Carter et al. (1999) also
found that even in cases where full community participation or management has been
planned, the community management system breaks down as committees and caretakers
lose interest or move away, and this is a particular risk if community organisation is on a
voluntary basis. The fact that the GWM scheme embodies a community approach in an
urban setting provides an interesting case to study the implications of urbanisation on the
community management paradigm. The research questions explored are (1) to determine
the barriers to financial and operational sustainability of an urban community scheme and
(2) to understand the potential for an urban community scheme to be self-sufficient and
financially viable through cost recovery by user fees. In order to understand the first
question, one must understand the problems facing the management team of the urban
community scheme and understand how and why community management mechanisms
may break down in an urban environment. To understand the second question, one must
12
look at users‘ willingness to pay and understand what affects users‘ perceptions and
expectations of, and satisfaction with community water. Through the research into this
second question, the practical challenges facing this community water supply scheme will
be highlighted, since these operational challenges and failures contribute to users‘
satisfaction with and willingness to pay for community water supply. Thus, this research
will answer these questions using the case study of the Great Soppo, Wokoko, Molyko
Scheme and a methodology combining field visits, personal observations, and qualitative
data obtained from stakeholders in the community scheme. The findings will contribute
to the understanding of effective implementation of community management in an urban
setting and will provide the background to inform future management decisions for the
GWM community scheme.
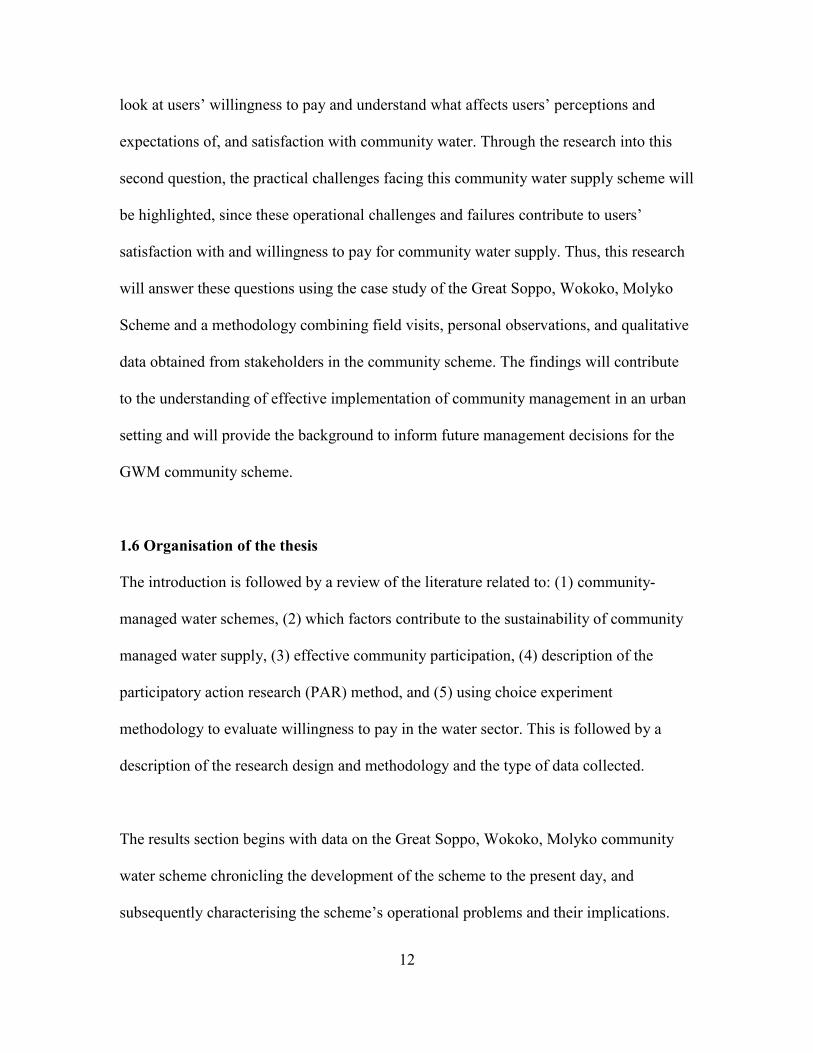
1.6 Organisation of the thesis
The introduction is followed by a review of the literature related to: (1) community-
managed water schemes, (2) which factors contribute to the sustainability of community
managed water supply, (3) effective community participation, (4) description of the
participatory action research (PAR) method, and (5) using choice experiment
methodology to evaluate willingness to pay in the water sector. This is followed by a
description of the research design and methodology and the type of data collected.
The results section begins with data on the Great Soppo, Wokoko, Molyko community
water scheme chronicling the development of the scheme to the present day, and
subsequently characterising the scheme‘s operational problems and their implications.
13
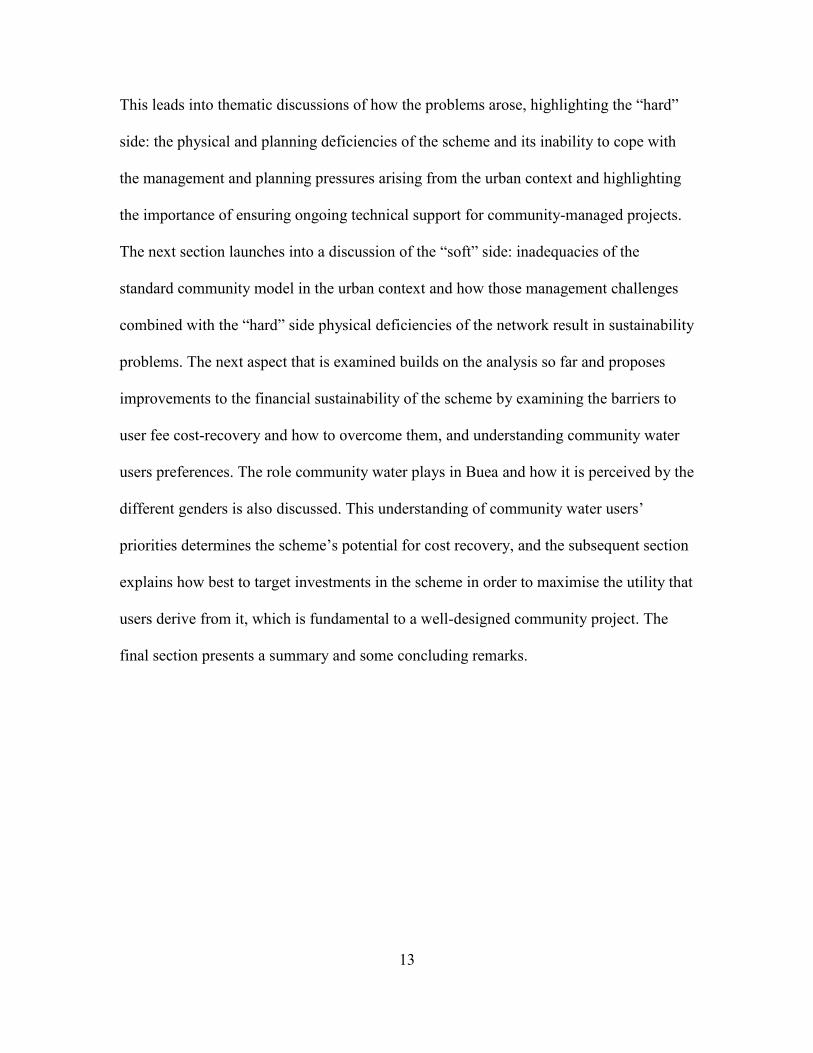
This leads into thematic discussions of how the problems arose, highlighting the ―hard‖
side: the physical and planning deficiencies of the scheme and its inability to cope with
the management and planning pressures arising from the urban context and highlighting
the importance of ensuring ongoing technical support for community-managed projects.
The next section launches into a discussion of the ―soft‖ side: inadequacies of the
standard community model in the urban context and how those management challenges
combined with the ―hard‖ side physical deficiencies of the network result in sustainability
problems. The next aspect that is examined builds on the analysis so far and proposes
improvements to the financial sustainability of the scheme by examining the barriers to
user fee cost-recovery and how to overcome them, and understanding community water
users preferences. The role community water plays in Buea and how it is perceived by the
different genders is also discussed. This understanding of community water users‘
priorities determines the scheme‘s potential for cost recovery, and the subsequent section
explains how best to target investments in the scheme in order to maximise the utility that
users derive from it, which is fundamental to a well-designed community project. The
final section presents a summary and some concluding remarks.

14
2. Literature Review
This thesis examines the sustainability challenges facing a community-managed water
supply scheme and its potential to be financially self-sufficient and sustainable. The
concepts that will be covered in this review include: a description of community-
managed water projects, an appraisal of the concept of sustainability of community water
supply in the literature, an examination of effective community participation, an overview
of participatory action research, and an explanation of the use of choice experiments to
model preferences in the water sector.
2.1 Community-managed water supply
There is a trend towards decentralisation in the provision of water supply and sanitation
to the hundreds of millions of people who lack them. Agenda 21 of the Earth Summit in
Rio de Janeiro in 1992 outlined a strategy for sustainable development in the 21st century.
A guiding principle according to Lammerink (1998) is ―community management of
services backed by measures to strengthen local institutions to implement and sustain
water and sanitation programmes.‖ Community-managed water supply is generally
understood among NGOs, governments, and individuals in the international development
community to be low-technology, non capital-intensive projects. Members of the local
community, who only receive basic training and are not necessarily professional, trained
water managers, are expected to participate significantly in planning and post-
construction management of the schemes and to ensure that the projects become
financially self-sufficient.
15
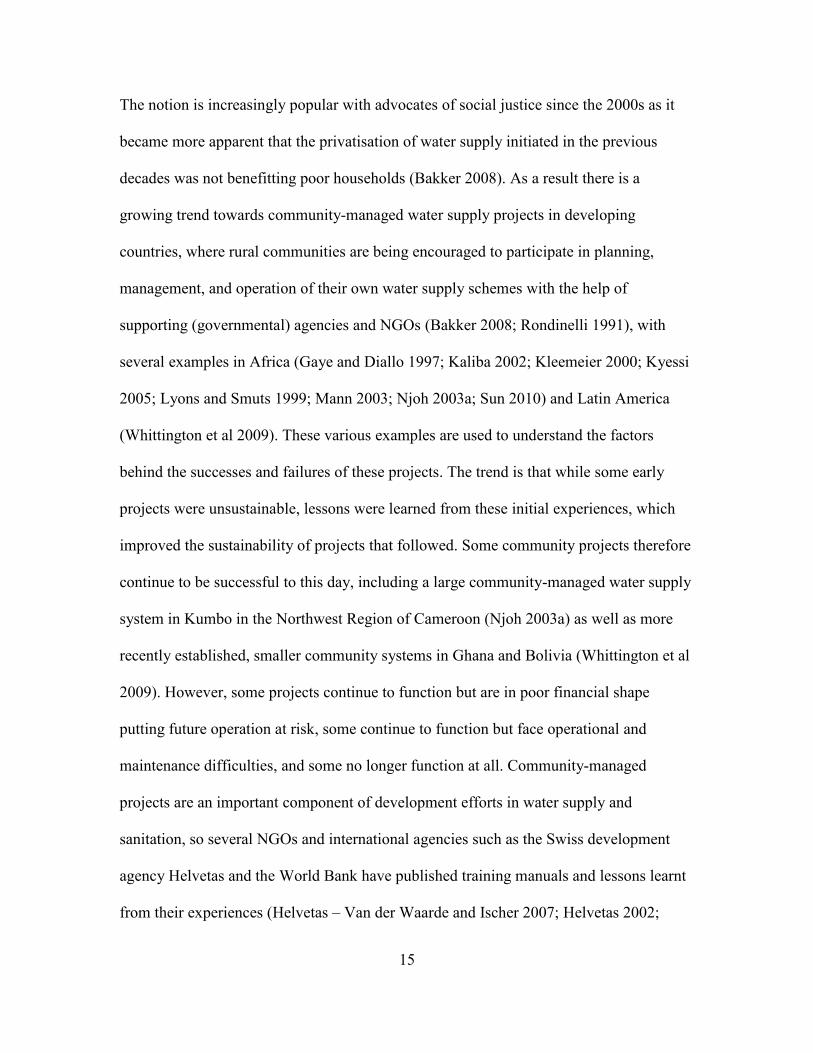
The notion is increasingly popular with advocates of social justice since the 2000s as it
became more apparent that the privatisation of water supply initiated in the previous
decades was not benefitting poor households (Bakker 2008). As a result there is a
growing trend towards community-managed water supply projects in developing
countries, where rural communities are being encouraged to participate in planning,
management, and operation of their own water supply schemes with the help of
supporting (governmental) agencies and NGOs (Bakker 2008; Rondinelli 1991), with
several examples in Africa (Gaye and Diallo 1997; Kaliba 2002; Kleemeier 2000; Kyessi
2005; Lyons and Smuts 1999; Mann 2003; Njoh 2003a; Sun 2010) and Latin America
(Whittington et al 2009). These various examples are used to understand the factors
behind the successes and failures of these projects. The trend is that while some early
projects were unsustainable, lessons were learned from these initial experiences, which
improved the sustainability of projects that followed. Some community projects therefore
continue to be successful to this day, including a large community-managed water supply
system in Kumbo in the Northwest Region of Cameroon (Njoh 2003a) as well as more
recently established, smaller community systems in Ghana and Bolivia (Whittington et al
2009). However, some projects continue to function but are in poor financial shape
putting future operation at risk, some continue to function but face operational and
maintenance difficulties, and some no longer function at all. Community-managed
projects are an important component of development efforts in water supply and
sanitation, so several NGOs and international agencies such as the Swiss development
agency Helvetas and the World Bank have published training manuals and lessons learnt
from their experiences (Helvetas – Van der Waarde and Ischer 2007; Helvetas 2002;

16
Helvetas Cameroon 2007; Helvetas Cameroon Tool 1.2; Leermakers 2000; World Bank –
Castro et al 2009) outlining the factors contributing to the success of community-
managed water supply projects. The comprehensiveness of these guidelines and manuals
is varied—the World Bank manual is very detailed and provides a well structured training
course tailored to the particular case of urban community managed water supply in Dar
Es Salaam, while the Helvetas documentation is much more general, drawing from varied
experiences from nearly half a century of experiences in many regions of Cameroon and
provides general guidelines for important components of projects such as local
ownership, securing commitments from local councils, and the role of Helvetas in
procuring technical and financial support. Sustainability of community water projects is
examined in more detail in Section 2.2.
2.2 Sustainability of community water supply
The concept of sustainability in development was defined by the Brundtland Commission
as the ability to meet development needs without compromising the ability of future
generations to meet their needs (Brundtland 1987). It is a combination of different targets,
comprising environmental, economic, social and institutional criteria of equal importance
(De Carvalho et al, 2009). The concept can be applied to many fields, and represents a
shift in ideology that is underway especially in the policy, planning, and development
fields. According to Gasson (2000), a ―sustainable city meets its present and future
human development objectives without growth in the throughput of matters and energy
beyond the regenerative and absorptive capacities of its local, national or international
hinterland.‖ De Carvalho et al., (2009) also describes a sustainable system as one that

17
emulates nature and its functions, the idea being that nature‘s course is sustainable and
that engineering designs should reflect this as much as possible. Another important
concept is that sustainability is not a fixed or constant goal but is time and space-relevant
(Ibid), being dependent on current knowledge and goals.
A further elucidation of what constitutes sustainability is provided by Valentin and
Spangenberg‘s (2000) ―prism of sustainability.‖ The prism in this case consists of four
dimensions: social, economic, environmental and institutional. Each corner of the prism
represents an aspect of sustainability and different sustainability goals can be situated
along different planes in the prism accordingly. In a more applied vein, De Carvalho et al.
(2009) designed their Sustainability Index for Integrated Urban Water Management
(SIUWM) using 5 components of sustainability: social/cultural related to social fairness
and equitable distribution; economic comprising economically sound principles,
economic growth and cost returns; environmental including environmental protection and
preservation of ecology; political meaning continued support and international
stewardship; and finally institutional/technological comprising of sustained capacity and
technological progress. A more strictly management perspective of sustainability is
Carter‘s (1999) ―sustainability chain,‖ which suggests that the steps to sustainable project
management include motivation, maintenance, cost recovery, and continuing support.
However, when it comes specifically to implementing sustainability into water supply
projects, especially in developing countries, despite some of the earliest literature on the
sustainability of water projects being published in the 1990s, very little work has
18
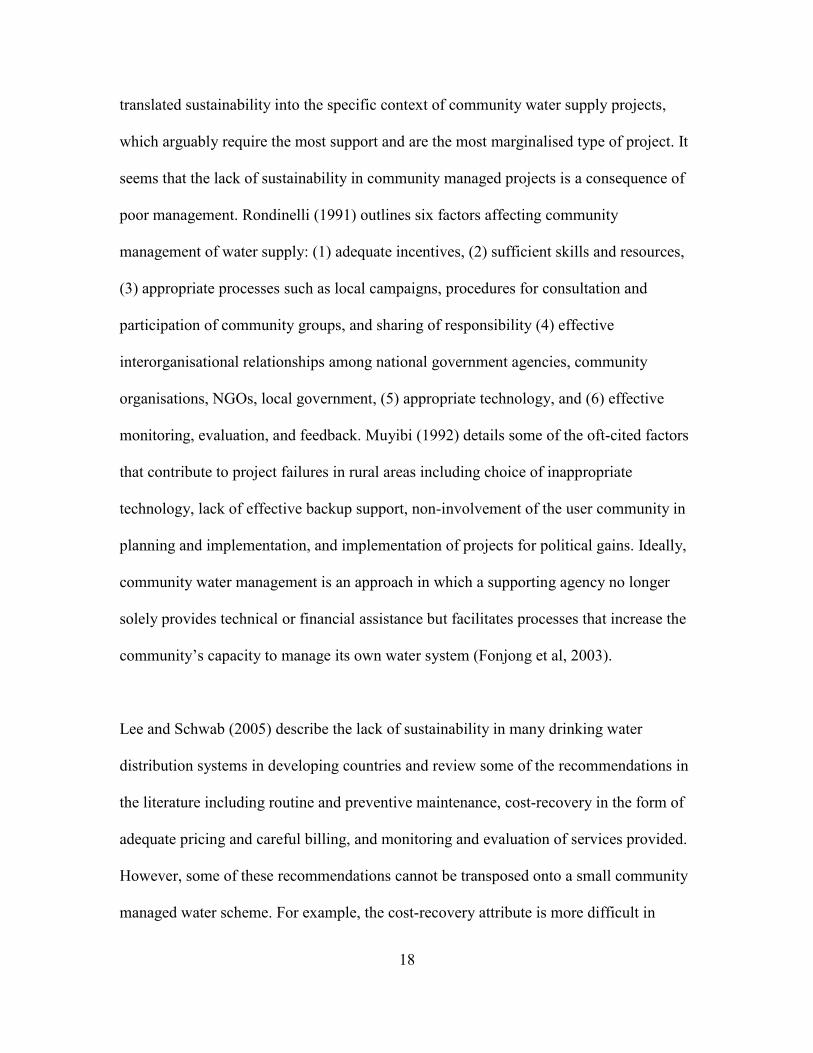
translated sustainability into the specific context of community water supply projects,
which arguably require the most support and are the most marginalised type of project. It
seems that the lack of sustainability in community managed projects is a consequence of
poor management. Rondinelli (1991) outlines six factors affecting community
management of water supply: (1) adequate incentives, (2) sufficient skills and resources,
(3) appropriate processes such as local campaigns, procedures for consultation and
participation of community groups, and sharing of responsibility (4) effective
interorganisational relationships among national government agencies, community
organisations, NGOs, local government, (5) appropriate technology, and (6) effective
monitoring, evaluation, and feedback. Muyibi (1992) details some of the oft-cited factors
that contribute to project failures in rural areas including choice of inappropriate
technology, lack of effective backup support, non-involvement of the user community in
planning and implementation, and implementation of projects for political gains. Ideally,
community water management is an approach in which a supporting agency no longer
solely provides technical or financial assistance but facilitates processes that increase the
community‘s capacity to manage its own water system (Fonjong et al, 2003).
Lee and Schwab (2005) describe the lack of sustainability in many drinking water
distribution systems in developing countries and review some of the recommendations in
the literature including routine and preventive maintenance, cost-recovery in the form of
adequate pricing and careful billing, and monitoring and evaluation of services provided.
However, some of these recommendations cannot be transposed onto a small community
managed water scheme. For example, the cost-recovery attribute is more difficult in
19
community schemes as noted in Carter (1999), one of the reasons according to Evans
(1992) being that some users still have a village mentality and continue to be attached to
their traditional free sources of water. People must understand the potential advantages of
improved water and sanitation such as improved quality, quantity, and more convenient
and reliable service, which should then encourage payment and cost-recovery; this
education and sensitization is part of ensuring sustainability of community managed
water. Furthermore, to ensure long-term financial sustainability and to eliminate
continued dependence on external funds, ―demand-driven‖ solutions are necessary,
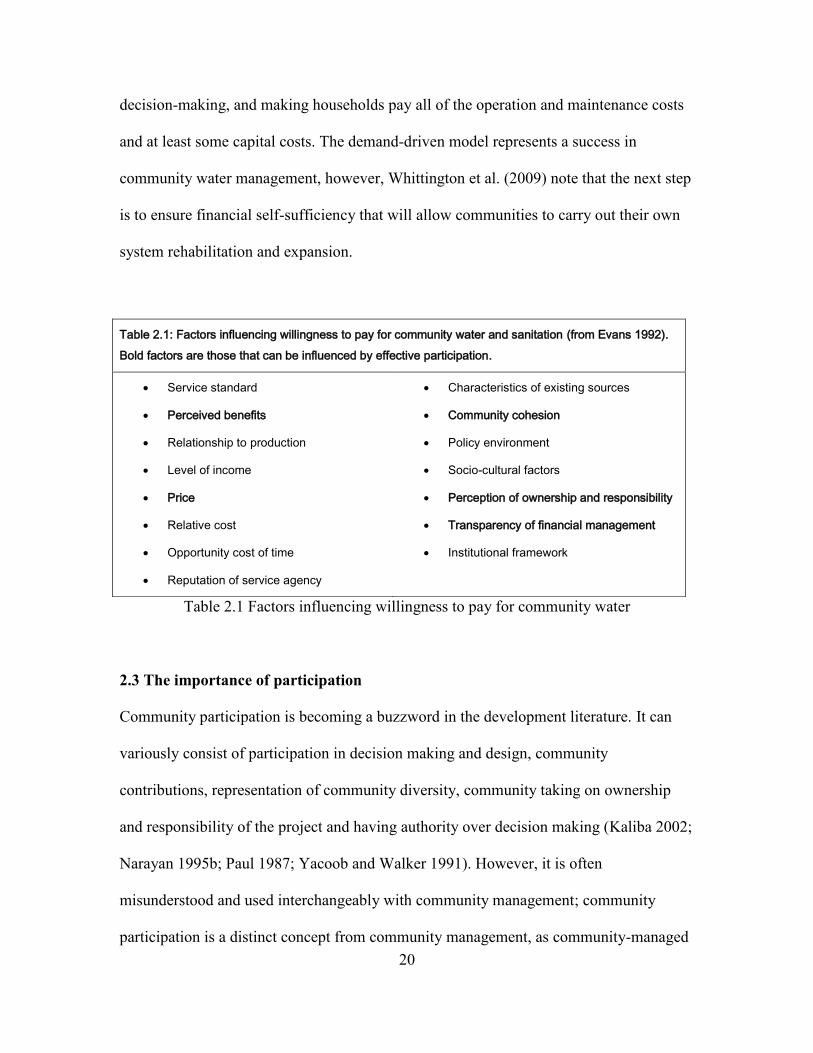
enabling cost recovery through user fees (Whittington et al. 2009). Evans (1992) details
the factors influencing willingness to pay for community water and sanitation (Table 2.1).
Whittington et al.‘s (2009) study of community managed rural water supply systems in
Peru, Bolivia and Ghana found that although the systems were in poor financial shape,
they were in working order. The ―demand-driven‖ community management model
coupled with post-construction support (access to spares and technical expertise)
successfully kept the systems working despite their lack of financial self-sufficiency.
These systems were kept functioning by the contributions of NGOs, religious groups, and
non-state actors, but Whittington et al., suggest that NGOs should be a catalyst for and
provide post-construction support rather than act as a dispenser of capital subsidies that
may undermine communities‘ own cost recovery efforts, thereby working to foster
―demand-driven‖ development. The ―demand-driven‖ aspect means that participation is
encouraged and included from the beginning, involving households in technological
choice and institutional/governance arrangements, giving women a larger role in
20
decision-making, and making households pay all of the operation and maintenance costs
and at least some capital costs. The demand-driven model represents a success in
community water management, however, Whittington et al. (2009) note that the next step
is to ensure financial self-sufficiency that will allow communities to carry out their own
system rehabilitation and expansion.
Table 2.1 Factors influencing willingness to pay for community water
2.3 The importance of participation
Community participation is becoming a buzzword in the development literature. It can
variously consist of participation in decision making and design, community
contributions, representation of community diversity, community taking on ownership
and responsibility of the project and having authority over decision making (Kaliba 2002;
Narayan 1995b; Paul 1987; Yacoob and Walker 1991). However, it is often
misunderstood and used interchangeably with community management; community
participation is a distinct concept from community management, as community-managed
Table 2.1: Factors influencing willingness to pay for community water and sanitation (from Evans 1992).
Bold factors are those that can be influenced by effective participation.
Service standard
Perceived benefits
Relationship to production
Level of income
Price
Relative cost
Opportunity cost of time
Reputation of service agency
Characteristics of existing sources
Community cohesion
Policy environment
Socio-cultural factors
Perception of ownership and responsibility
Transparency of financial management
Institutional framework
21
projects can be implemented without effective participation and conversely, effective
participation mechanisms can be implemented in projects that are not community-
managed. In her critique of the concept of ―community,‖ Bakker (2008) notes the
fallacious assumption by proponents of the concept that community management equals
greater accountability. Ownership is less important than the institutions or governance
involved. What makes community management effective in increasing accountability is
actually the institution of effective community participation which is usually embodied in
community management. In that sense, effective community participation is a necessary
condition for enabling many of the community management sustainability criteria
discussed in the preceding paragraphs. Bakker (2008) also notes that the literature tends
to romanticise communities as equitable social structures; again, effective participation is
the key to ensuring that community management successfully represents the interests of
all stakeholders. Returning to Table 2.1, the willingness-to-pay factors highlighted in
bold are those that can be affected by effective community participation, supporting the
notion that effective participation is necessary for the financial sustainability of
community managed projects. For example, in Table 2.1 perceived benefits of a water
supply system are influenced by users‘ understanding of the attributes of the water supply
and how well the water supply matches users‘ expectations, both of which are enhanced
by community participation. Similarly, an appropriate price is decided upon through
effective community participation. Community cohesion and perception of ownership and
responsibility are directly enhanced by greater community participation and an
appreciation that the project is communal. Community participation can also encourage

22
communication between community and management leading to better financial
transparency.
Fonjong et al. (2003) and Njoh (2003a) describe self-help community infrastructure
projects that have been implemented in other communities in Cameroon. Self-help
projects are those projects carried out with significant contributions from local
communities, involving them in self-determination, providing them with tools, training
and capacity to carry out appropriate projects with community participation (Njoh,
2003a; 2006). Theoretically, these projects should address the sustainability criteria noted
above, and by their very nature, are participatory. There is a long history of these projects
in Cameroon, dating back to colonial times. Colonial authorities provided training to
community development technicians and sought labour and financial contributions from
local populations in the development of communal infrastructure projects (Ibid). Fonjong
et al. (2003) describes the socio-economic benefits of these self-help ventures but also
documents that the management of potable water is a ―herculean task for most
communities after the departure of funding partners.‖ Therefore there still seems to be a
breakdown of sustainability in some projects, despite their participatory, self-help nature,
which begs the question, what is effective participation.
Effective participation enhances the participation of women and youth (Kaliba 2002;
Njoh 2002). Njoh (2002; 2003b) discusses some of the barriers to effective community
participation in his case study: governance issues such as paternalistic local authorities
and excessive state intervention can reduce participation because of selective
23
representation and inhibition of participatory platforms. Furthermore, communities can
lose interest and stop participating because of loss of faith due to delays to the project‘s
completion and because of soliciting of contributions well above the projected amount
and beyond the projected date of completion (Ibid). Njoh (2006) documents the success
of the Kumbo community water scheme in Cameroon. The strength of this scheme was
strong community awareness, and cohesion that was enabled by a relatively homogenous
population with a strong traditional hierarchy. This is further supported by Sun et al.‘s
(2010) study of community-based water and sanitation committees (WATSANs) in
Ghana, where communities with more existing community groups are more likely to have
functioning WATSANs while ethnically diverse communities are less likely to have these
organisations. Sun et al (2010) also note that giving authority to WATSANs regarding the
choice of contractors in charge of building the infrastructure and giving authority to
express discontent with contractors‘ work might be important to support the functioning
of WATSANs.
Kleemeier (2000) notes from her research in Malawi that the size of the water supply
scheme is important; Njoh (2002) also found that the participatory model works better for
smaller schemes. The standard participatory model sets up the institutional framework for
maintaining very small rural piped gravity schemes, but larger schemes are more likely to
run into problems that would require technical and financial input from the Government‘s
Water Department. Furthermore, Kleemeier notes that the Malawian schemes need more
management and repair capacity than volunteer committees can offer, and speculates
whether compensation would improve performance of the committees.
24
2.4 Participatory Action Research
This section and the next one review the literature relating to the methodology used in the
thesis, which will be explained in more detail in section three. The research methodology
was inspired by Participatory Action Research (PAR) in which the research takes on a
more applied role such that the roles of researcher and participant begin to intersect. PAR
is described in Kapoor and Jordan (2009, p.2) as being part of the wider movement of
democratization and of depoliticizing decision making. Participants are brought together
to reflect and act on their own social practices, to shape their own research and to discuss
and act upon the outcomes (Ibid, p.89). Discussions are two-way, with researcher and
participant actively engaged, leading to improved dissemination of the research to the
stakeholders such that research remains grounded closer to reality. PAR allows
communities and supporting agencies to share, analyse and increase their understanding
of the research issues and allows them to effectively plan and implement solutions
(Lammerink 1998). Some of the critical issues being dealt with in PAR literature are (1)
the use of PAR as a ‗buzzword‘ despite not embracing the researcher/collaborator
partnership, which should include diverse collaboration and (2) PAR that embraces
―facile notions of participation‖ that are ultimately just new forms of exclusion (Kapoor
and Jordan 2009, pp.119-120).
2.5 Choice experiments in the water sector
Willingness to pay and consumer valuation of goods and services are valuable inputs to
the design of any policy or infrastructure project. Stated preference techniques employ
hypothetical scenarios to elicit whether respondents would participate in a specified price
25
and alternative choice. Stated preference techniques have been used extensively in the
environmental field (Adamowicz et al 1998; Hanley et al 1998) because they are able to
explore ranges of parameters for environmental goods that are not available on the
market. There are two main stated preference techniques: contingent valuation (CV) and
choice experiments. In contingent valuation, a proposed change is described in detail, and
the respondent is usually asked to give an estimate of what the change is worth to them
through a bidding game or open-ended question (Virjee 2006). In a bidding game, the
respondent is required to either accept or reject a suggested value for the hypothetical
change, and CV has been criticized for inducing a bias towards acceptance because of the
hypothetical nature of the proposition (Ibid). On the other hand, CV methods usually
provide a numerical estimate of a certain hypothetical change or bundle, but provide little
information regarding relative values of attributes in a bundle and tradeoffs between these
attributes. This thesis focuses on choice experiments, which are more successful at
analysing these tradeoffs.
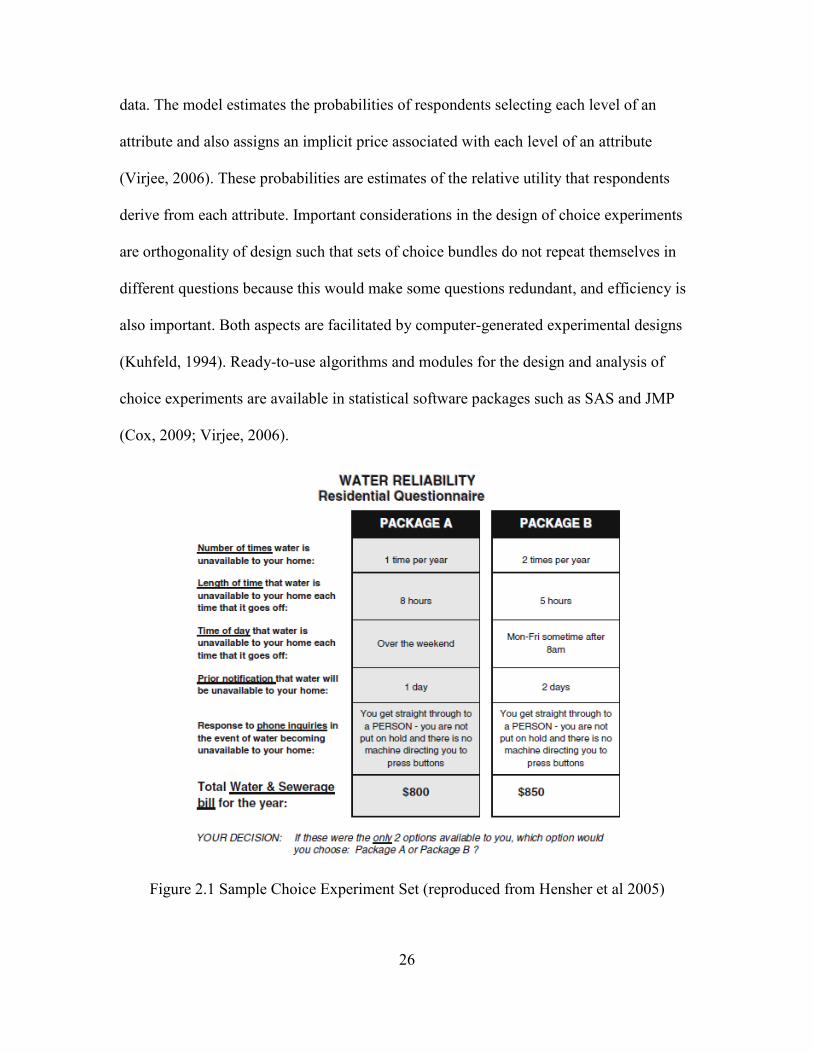
In choice experiments, sets of choice bundles are presented to the respondent, each
bundle comprising of predetermined attributes set to different levels. For example, when
administering a choice experiment about water supply, different attributes could be water
quality, water pressure, and flow reliability; the levels could be high or low water quality,
high or low water pressure, 5 days a week or 7 days a week of flow reliability. A price
attribute is also assigned. Respondents choose among discrete choice bundles (sample
choice set in Figure 2.1). The choice experiment estimates the utility the respondents
derive from each changing attribute by fitting a multinomial logit model to the response
26
data. The model estimates the probabilities of respondents selecting each level of an
attribute and also assigns an implicit price associated with each level of an attribute
(Virjee, 2006). These probabilities are estimates of the relative utility that respondents
derive from each attribute. Important considerations in the design of choice experiments
are orthogonality of design such that sets of choice bundles do not repeat themselves in
different questions because this would make some questions redundant, and efficiency is
also important. Both aspects are facilitated by computer-generated experimental designs
(Kuhfeld, 1994). Ready-to-use algorithms and modules for the design and analysis of
choice experiments are available in statistical software packages such as SAS and JMP
(Cox, 2009; Virjee, 2006).
Figure 2.1 Sample Choice Experiment Set (reproduced from Hensher et al 2005)

27
2.6 Summary
The issues in the literature cited above do not analyse community management in the
urban context, because it is more common for community managed water schemes to be
implemented in rural areas. However, community managed infrastructure projects are
seen in several urban case studies and are a promising alternative to centrally organised,
top-down infrastructure projects in developing cities (Gaye and Diallo, 1997; Kyessi,
2005). Furthermore, the highest urbanisation rates and urban populations are projected in
Sub-Saharan Africa and Asia (Montgomery, 2008). A sustainable community managed
project is one that continues to provide the intended services throughout the intended
service life. The sustainability of community managed schemes involves a combination
of effective participation, self-determination and motivation, capacity, cost recovery, and
continuing support. Effective participation is a necessary condition for community
management to function, enabling many of the other sustainability criteria to be met. It
appears that community managed schemes continue to fail, despite better understanding
of, and efforts to implement, community participation. Hence, this thesis will elucidate
some of the characteristics and causes of failure in an urban community managed scheme
using qualitative research methods, methodology inspired by participatory action
research, and choice experiments.

28
3. Methodology
3.1 Field visit
It was established early on that a field visit to Buea would be necessary to carry out the
research, for the purposes of study area familiarization and field data collection. A two-
month field visit was made between October and December 2010. The timing of the trip
was influenced by the fact that Buea would be transitioning from the rainy season (April
to October), with abundant water supply and diverse water sources, to the dry season
(December to March), which is characterised by little or no rainfall and reliance on a few,
particular sources such as standpipes. Working in the rainy season would have been
logistically difficult due to the heavy precipitation. Due to logistical constraints, only one
field visit could be organised, so it was hoped that the collection of quantitative and
qualitative data from the transition period would present (1) an accurate depiction of
community water use during relative abundance of water, while (2) being close enough to
the onset of the dry season to document the impending issues and coping strategies
during relative scarcity of water.
3.2 Definition of research and choice of study area
There are several urban community water supply schemes in Buea, but the Great Soppo,
Wokoko, Molyko Scheme was chosen because of convenience and the availability of
contacts. The first interview with the chairperson of the Water Management Committee
established a brief background and context of the scheme, and the main problems facing
the Committee. This information helped to focus the research on financial and operational

29
sustainability of the GWM scheme. Several sources of data were decided upon: personal
observations and physical data, interviews, and questionnaires.
3.3 Personal observations and physical data
Personal observations were made by the researcher during the entire two-month period.
These observations were important for shaping the research, providing a general
understanding of the context behind the ―water crisis,‖ and the social implications and
characteristics of water use in Buea.
Observations specific to the GWM scheme were also made. The researcher accompanied
one of the Scheme‘s technicians to the site of the distribution network and was introduced
to some of the residents. Upon a second visit to the scheme, a survey of the layout and
dimensions of the distribution network was made with the aid of a Garmin eTrex Vista
HCx Global Positioning System (GPS) unit. Additionally, dimensions of the storage tank
and intake pipes were taken, and an estimation of the flow was attempted at the spring
water source of the GWM scheme. These physical data were used as general engineering
background to inform the data analysis, but were subject to large inaccuracies in the
measurement of stream velocity due to the unavailability of appropriate equipment. These
errors prohibit the data from being used as a basis for future final designs for the GWM
scheme (Appendix VI).

30
3.4 Interviews
Interviews were carried out by the researcher with the chairperson of the Water
Management Committee of the GWM scheme, who was the sole remaining active
member, and with a technician of the GWM scheme. Interview guides were prepared
beforehand for both, but both followed an informal interview style, as dictated by the
setting. Audio recordings and transcriptions of the chairperson interviews were made
(Appendix I). The users‘ perspectives were obtained from the questionnaire (Appendices
II, III and IV) and associated informal interviews arising from the open-ended questions,
described in Section 3.5.
Furthermore, after the data collection phase, initial findings were presented to the
chairperson of the Water Management Committee, as inspired by PAR methodology in
which research findings are disseminated to and discussed with participants. This
influenced the announcement of a general meeting of the Water Management Committee
and some residents of the community to discuss improvements and changes to the current
system, which was also audio-recorded and transcribed (Appendix I).
3.5 Questionnaire
In order to assess the cost-recovery potential of the scheme through user fees, a
questionnaire was devised to understand barriers to payment, users‘ expectations, and
satisfaction of the water supply while incorporating choice experiments to understand
their valuation of community water and willingness to pay. The questionnaire data also
described users‘ water use behaviour such as which alternative water sources were used,
31
and it quantified rainwater harvesting. It elucidated how users responded to rainfall
unpredictability and community water failure, and also exploited users‘ experiences to
understand the history and factors behind the failure of community water (see Appendix
II).
Sampling
Since the GWM scheme serves approximately 100 households, a random sample of 46
households was deemed adequate and was obtained using a random sample in the direct
vicinity of the distribution network. The researcher and assistant conducted a random
walk around the network on several days between the 8th
and the 18th
of November 2010.
Design
A questionnaire guide was designed with some input from the local research assistant,
who was proficient in both Standard English and Pidgin English, the lingua franca.
Several open-ended questions were included in the questionnaire in order to thoroughly
understand issues such as payment, coping strategies, and experiences (see Appendix III).
In order to ensure that questions were understood and to accurately transcribe responses,
questionnaires were administered individually, door-to-door to household heads, and each
session was conducted more like an interview, where follow-up questions could be asked
to better understand and contextualise each response. The researcher referred to Mack et
al (2005) as a guide for these sessions.

32
3.6 Choice Experiments
The choice experiments were designed using the JMP 8.0 statistical software package
from the SAS Institute. The package was chosen because of easy access to the software in
the field and the Design of Experiments (DoE) module for the efficient design of choice
experiments. Five attributes were chosen (Table 3.1). Hensher et al., (2001) suggested
using 16 choice sets, but because of difficulty administering longer choice sets and
respondent fatigue, it was decided to use 2 different surveys each with 8 choice sets,
yielding a total of 16 different choice sets. According to Huber and Zwerina (1996),
specifying nonzero prior estimates for the mean and variance of the attributes estimated
by the multinomial logit model leads to a more efficient design. Priors would normally be
obtained via a pre-test of the choice experiment, but due to sampling difficulties and the
small population size, a pre-test was not carried out. However, priors were estimated
based on knowledge of water use from interviews and from past work, such that a unit
(+1) increase in utility was assumed as the levels of each attribute increases from left to
right in Table 3.1. Hence, for example under the ―Quality‖ attribute, ―Treated‖ was
assumed to have a higher utility than ―Not Treated‖ by one unit, and so on. Furthermore,
a uniform variance of 1 was assumed for each attribute. This was done because according
to Huber and Zwerina (1996), specifying any priors, even if they are misspecified,
increases the efficiency of the experimental design. Hence, the DoE module developed an
experimental design that satisfied the orthogonality and efficiency constraints.
33
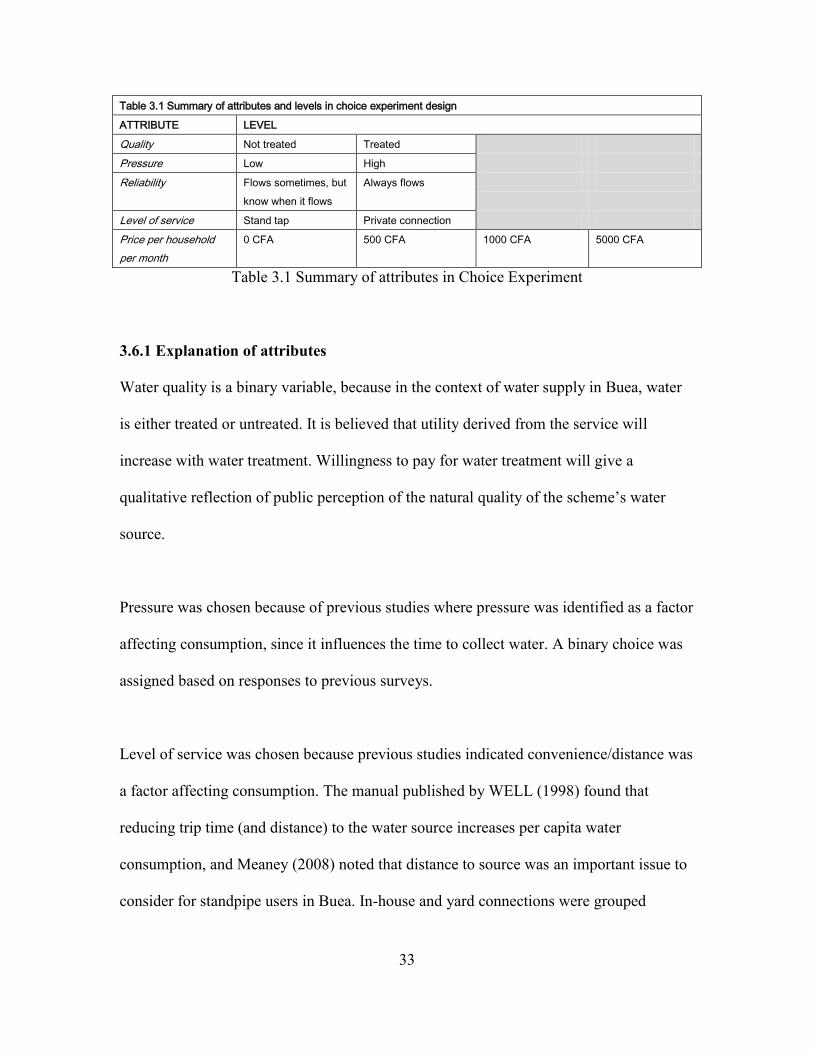
Table 3.1 Summary of attributes and levels in choice experiment design
ATTRIBUTE LEVEL
Quality Not treated Treated
Pressure Low High
Reliability Flows sometimes, but
know when it flows
Always flows
Level of service Stand tap Private connection
Price per household
per month
0 CFA 500 CFA 1000 CFA 5000 CFA
Table 3.1 Summary of attributes in Choice Experiment
3.6.1 Explanation of attributes
Water quality is a binary variable, because in the context of water supply in Buea, water
is either treated or untreated. It is believed that utility derived from the service will
increase with water treatment. Willingness to pay for water treatment will give a
qualitative reflection of public perception of the natural quality of the scheme‘s water
source.
Pressure was chosen because of previous studies where pressure was identified as a factor
affecting consumption, since it influences the time to collect water. A binary choice was
assigned based on responses to previous surveys.
Level of service was chosen because previous studies indicated convenience/distance was
a factor affecting consumption. The manual published by WELL (1998) found that
reducing trip time (and distance) to the water source increases per capita water
consumption, and Meaney (2008) noted that distance to source was an important issue to
consider for standpipe users in Buea. In-house and yard connections were grouped

34
together because in the GWM scheme, they are both synonymous with private
connection.
Reliability was chosen because from previous work it was highlighted as the most
important issue in water supply. Meaney (2008) found that of water users in Buea, the
largest cohort identified reliability as the aspect of water supply requiring immediate
improvement. It was simplified into two options: rationed flow with certainty of flow, or
constant flow of water.
The different monthly prices were chosen to give options of free water (0 CFA), a
nominal charge per household to access water from standpipes (500 CFA current rate for
standpipes; about 1.10 CAD), the current rate for households (1,000 CFA for private
connections; about 2.20 CAD), and the highest current price (5,000 CFA tariff for each
hostel; about 10.60 CAD)4. In the GWM scheme, users are charged flat rates for water
use because the system was built without water meters.
3.6.2 Analysis of the choice model
The output of the choice model in JMP 8.0 (see Appendix V) is a utility model fitted to
the response data. The model estimates the coefficient for each attribute in the utility
function. A p-value is also calculated for each attribute to evaluate the significance of the
effect of each attribute on the utility model. Based on which p-values are significant, it
can be inferred which attributes users find most important.
4 Exchange rates obtained from www.xe.com/ucc
35
In addition, the software outputs marginal utilities for each attribute. The marginal
utilities of price can be manipulated to obtain an average unit utility cost. For example, if
the marginal utility of a price increase from 0 to 1,000 CFA is a difference of -0.5 units of
utility, it can be estimated that the unit utility cost is 2,000 CFA per unit of utility. Then
this unit utility cost can be multiplied by the marginal utilities of the other water supply
attributes to obtain implicit prices for each water supply attribute.
Subject effects can be examined by coupling the choice response data with subject data
from the questionnaire. Thus, the interactions of gender, education, income, with choice
preferences can be inferred.
36
4. Results and Discussion
This section presents and discusses the research findings. It is organised by theme,
beginning with a chronicle of the development of the Great Soppo, Wokoko, Molyko
(GWM) community water supply scheme until the present day, followed by thematic
discussions of the issues facing the scheme, and ending with a discussion of the potential
for financial self-sufficiency.
4.1 Results
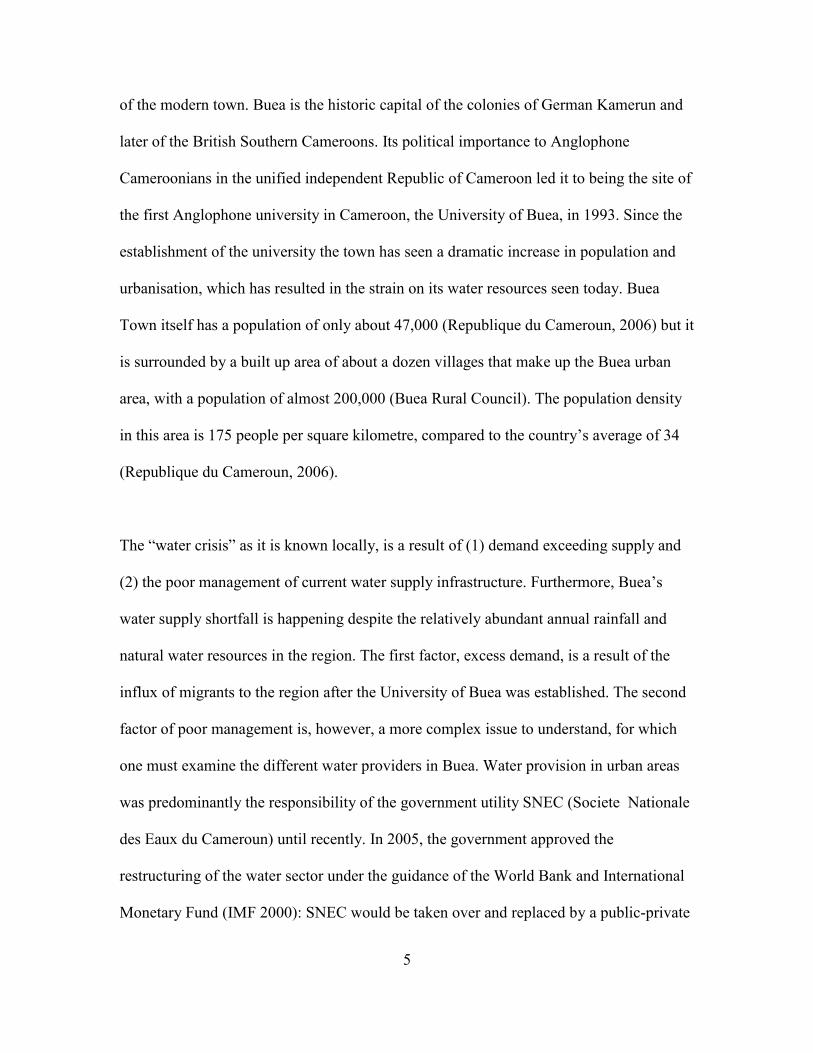
4.1.1 Description and location of the GWM scheme in Buea
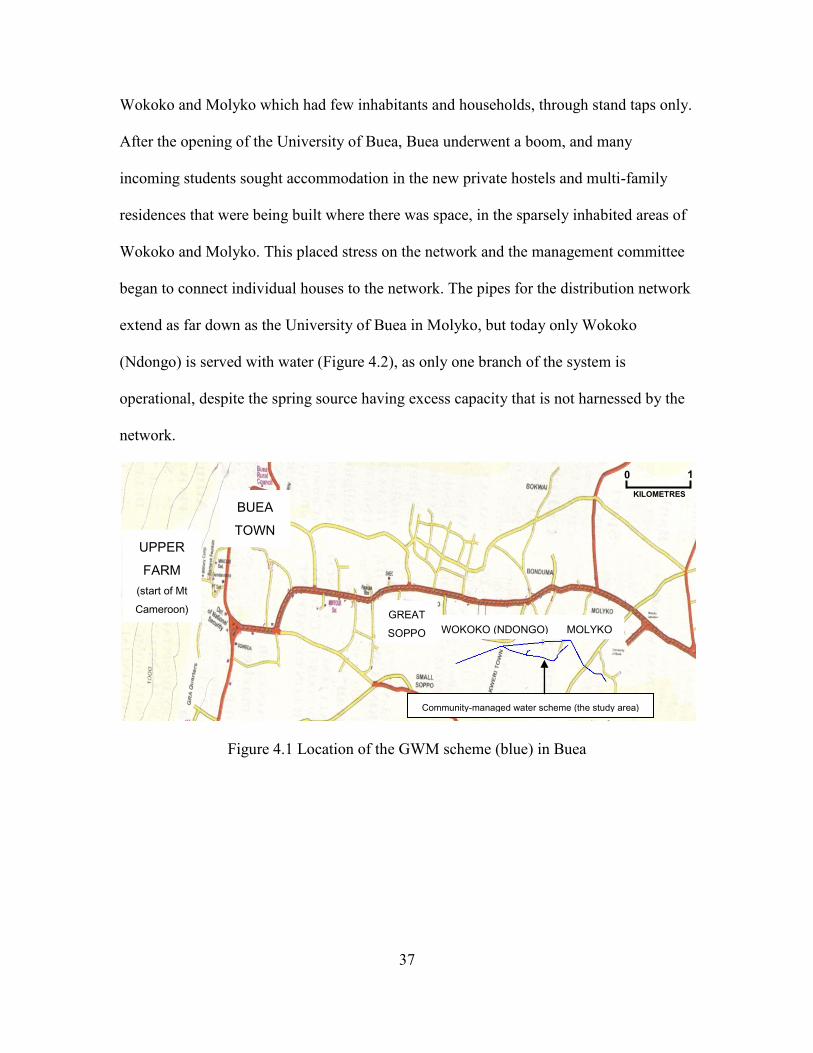
The GWM scheme was constructed in 2001 and 2002 (Figure 4.1). It harnesses a spring
source in Great Soppo, and while houses in Great Soppo are not connected directly to the
network, they benefit somewhat from having the source in their neighbourhood, from
which water is collected directly (Appendix VI). The scheme was designed to serve the
populations of Wokoko and Molyko that are located downhill of the urban core of the
town (households clustered around the blue highlighted scheme are shown in Figure 4.1).
Buea follows a linear settlement pattern, with development following the path of the main
road (the red artery in Figure 4.1) leading up the lower slopes of Mount Cameroon
towards Upper Farm and Buea Town. The villages of Wokoko and Molyko used to be
more sparsely populated and distinct from urban Buea, which is located around the higher
elevations of the main road. Today, due to the growth of the town, Wokoko and Molyko
are peri-urban neighbourhoods or suburbs of the urban Buea area, but they still have
some characteristics of rural areas such as poor road, electricity, and water supply
infrastructure. When originally conceived, the GWM scheme supplied the villages of
37
Wokoko and Molyko which had few inhabitants and households, through stand taps only.
After the opening of the University of Buea, Buea underwent a boom, and many
incoming students sought accommodation in the new private hostels and multi-family
residences that were being built where there was space, in the sparsely inhabited areas of
Wokoko and Molyko. This placed stress on the network and the management committee
began to connect individual houses to the network. The pipes for the distribution network
extend as far down as the University of Buea in Molyko, but today only Wokoko
(Ndongo) is served with water (Figure 4.2), as only one branch of the system is
operational, despite the spring source having excess capacity that is not harnessed by the
network.
Figure 4.1 Location of the GWM scheme (blue) in Buea
GREAT
SOPPO WOKOKO (NDONGO) MOLYKO
BUEA
TOWN
UPPER
FARM
(start of Mt
Cameroon)
Community-managed water scheme (the study area)
1
KILOMETRES
0
38
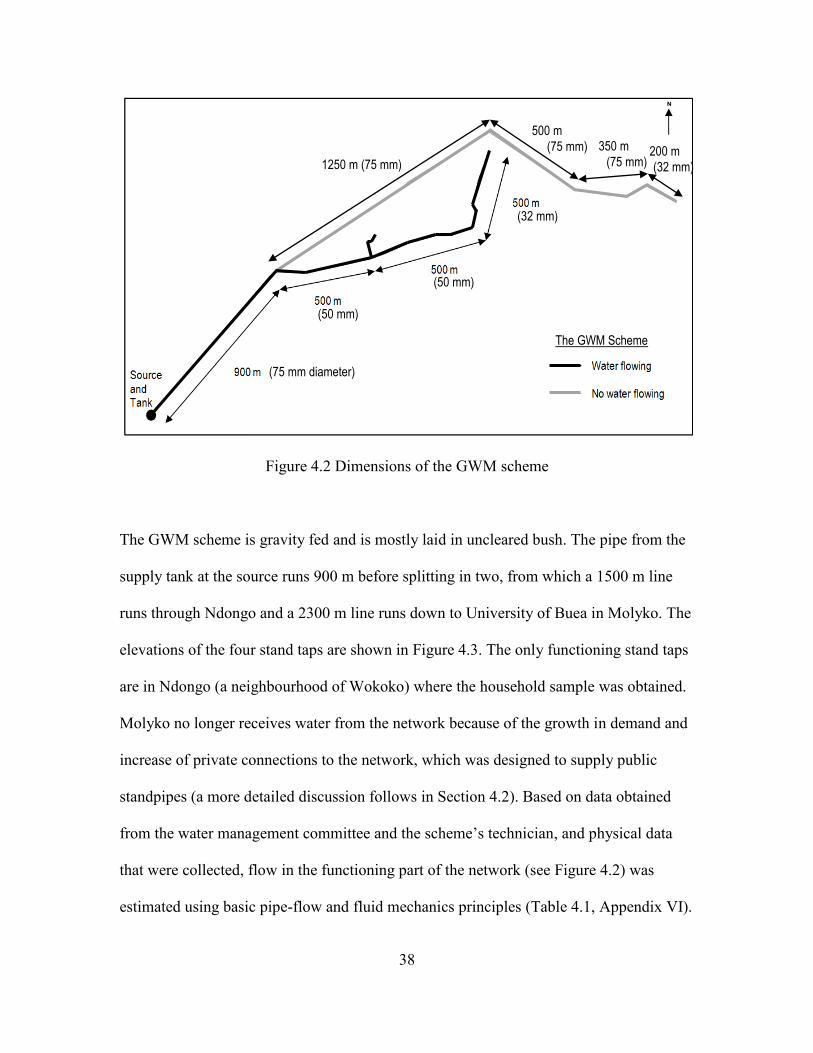
Figure 4.2 Dimensions of the GWM scheme
The GWM scheme is gravity fed and is mostly laid in uncleared bush. The pipe from the
supply tank at the source runs 900 m before splitting in two, from which a 1500 m line
runs through Ndongo and a 2300 m line runs down to University of Buea in Molyko. The
elevations of the four stand taps are shown in Figure 4.3. The only functioning stand taps
are in Ndongo (a neighbourhood of Wokoko) where the household sample was obtained.
Molyko no longer receives water from the network because of the growth in demand and
increase of private connections to the network, which was designed to supply public
standpipes (a more detailed discussion follows in Section 4.2). Based on data obtained
from the water management committee and the scheme‘s technician, and physical data
that were collected, flow in the functioning part of the network (see Figure 4.2) was
estimated using basic pipe-flow and fluid mechanics principles (Table 4.1, Appendix VI).
(75 mm diameter)
(50 mm)
(50 mm)
(32 mm)
The GWM Scheme
1250 m (75 mm)
500 m
(75 mm) 350 m
(75 mm) 200 m
(32 mm)
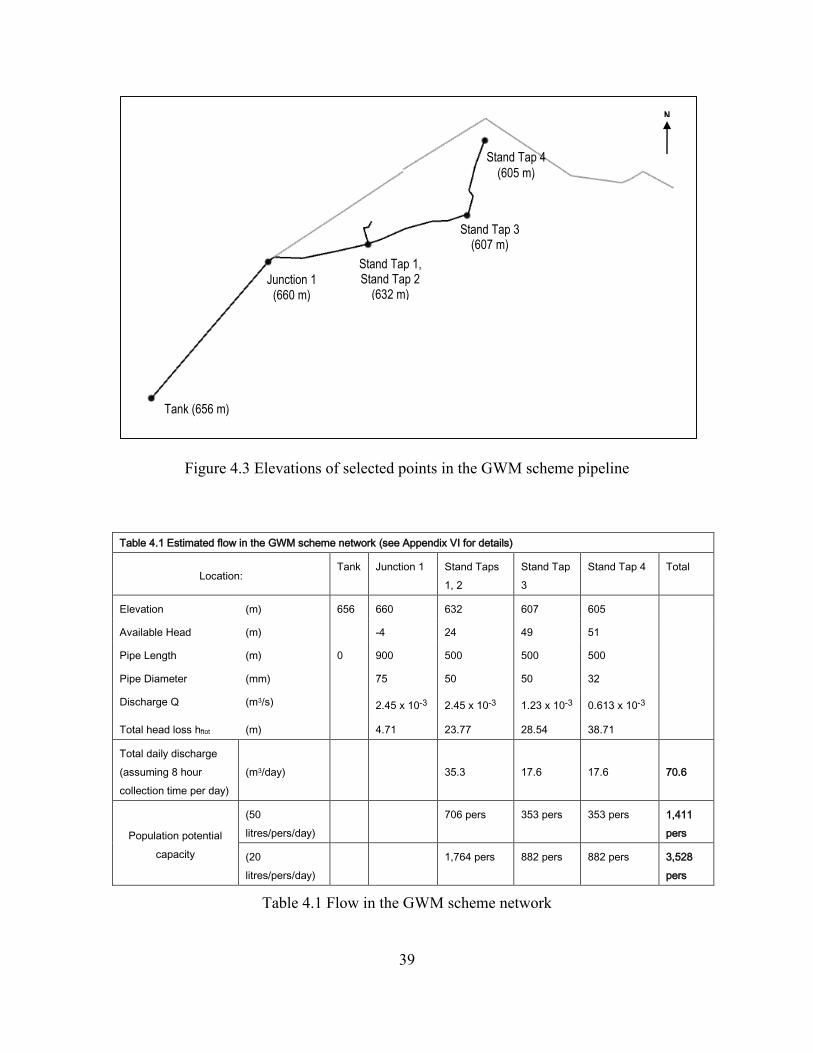
39
Figure 4.3 Elevations of selected points in the GWM scheme pipeline
Table 4.1 Estimated flow in the GWM scheme network (see Appendix VI for details)
Location: Tank Junction 1 Stand Taps
1, 2
Stand Tap
3
Stand Tap 4 Total
Elevation (m) 656 660 632 607 605
Available Head (m) -4 24 49 51
Pipe Length (m) 0 900 500 500 500
Pipe Diameter (mm) 75 50 50 32
Discharge Q (m3/s) 2.45 x 10⁻³ 2.45 x 10⁻³ 1.23 x 10⁻³ 0.613 x 10⁻³
Total head loss hftot (m) 4.71 23.77 28.54 38.71
Total daily discharge
(assuming 8 hour
collection time per day)
(m3/day) 35.3 17.6 17.6 70.6
Population potential
capacity
(50
litres/pers/day)
706 pers 353 pers 353 pers 1,411
pers
(20
litres/pers/day)
1,764 pers 882 pers 882 pers 3,528
pers
Table 4.1 Flow in the GWM scheme network
Tank (656 m)
Junction 1 (660 m)
Stand Tap 1, Stand Tap 2
(632 m)
Stand Tap 3 (607 m)
Stand Tap 4
(605 m)
N
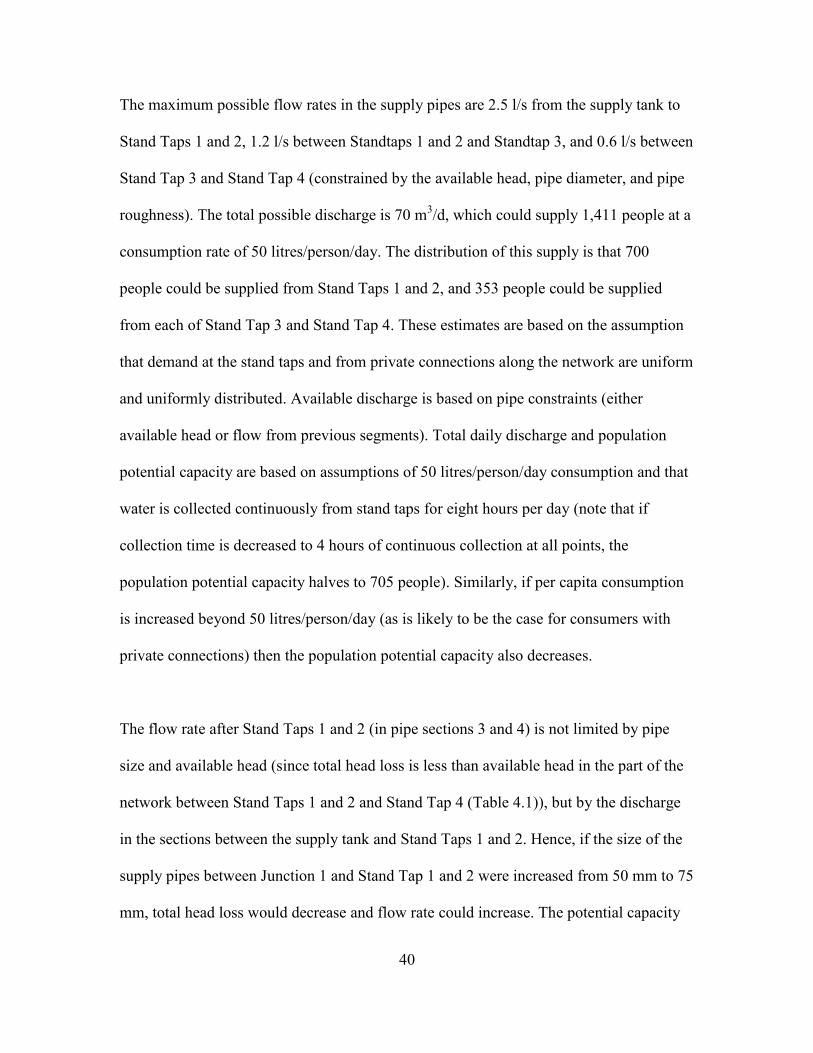
40
The maximum possible flow rates in the supply pipes are 2.5 l/s from the supply tank to
Stand Taps 1 and 2, 1.2 l/s between Standtaps 1 and 2 and Standtap 3, and 0.6 l/s between
Stand Tap 3 and Stand Tap 4 (constrained by the available head, pipe diameter, and pipe
roughness). The total possible discharge is 70 m3/d, which could supply 1,411 people at a
consumption rate of 50 litres/person/day. The distribution of this supply is that 700
people could be supplied from Stand Taps 1 and 2, and 353 people could be supplied
from each of Stand Tap 3 and Stand Tap 4. These estimates are based on the assumption
that demand at the stand taps and from private connections along the network are uniform
and uniformly distributed. Available discharge is based on pipe constraints (either
available head or flow from previous segments). Total daily discharge and population
potential capacity are based on assumptions of 50 litres/person/day consumption and that
water is collected continuously from stand taps for eight hours per day (note that if
collection time is decreased to 4 hours of continuous collection at all points, the
population potential capacity halves to 705 people). Similarly, if per capita consumption
is increased beyond 50 litres/person/day (as is likely to be the case for consumers with
private connections) then the population potential capacity also decreases.
The flow rate after Stand Taps 1 and 2 (in pipe sections 3 and 4) is not limited by pipe
size and available head (since total head loss is less than available head in the part of the
network between Stand Taps 1 and 2 and Stand Tap 4 (Table 4.1)), but by the discharge
in the sections between the supply tank and Stand Taps 1 and 2. Hence, if the size of the
supply pipes between Junction 1 and Stand Tap 1 and 2 were increased from 50 mm to 75
mm, total head loss would decrease and flow rate could increase. The potential capacity

41
of the network at 50 litres/person/day consumption could increase to 1,736 people
(Appendix VI for calculations).
According to the water management committee and technician, when it does not rain
heavily, the flow from the source reduces somewhat. This happened notably once since
the scheme opened, in 2003. There was water in the tank and pipes, but the tank was not
as full as it usually is. Information indicates that the spring probably originates at higher
elevations of Mount Cameroon, driven by rainfall and runoff that infiltrates to
groundwater and flows overland and through underground fractures characteristic of the
volcano. It is unknown whether climate change, or even anthropogenic activity around
the upper slopes of Mount Cameroon which recharge the spring will begin to impact the
capacity of the spring source. Without more detailed knowledge of the spring‘s capacity,
hydrogeology and recharge rate, this is unknown. Sometimes it rains very heavily, and
the combination of hilly topography and high runoff results in mass movements of earth
and mud, which can be dangerous for inhabitants of the area, and also has an effect on the
water quality of the spring source, with increased suspended material and debris from
runoff after heavy rain.
According to the scheme‘s technician, the spring continues to flow in the dry season with
little or no change in flow. If the committee had the financial means, they would employ
more workers to schedule water to different parts of the network to enable adequate water
pressure when demand exceeds supply. They would also increase the capacity of their
network by harnessing more water from the spring, by increasing the size of intake pipes,

42
building a larger tank and a second reservoir downstream of the first to increase the flow
rate in the network (thereby maintaining pressure) and improve the resilience of the
system to any fluctuations in flow. However, the network calculations show that the most
pressing constraint on the water supply is the diameter of the pipes given the available
head. A possible interim solution would be to have storage tanks at each stand tap that
would fill continuously from the tap. However, water quality problems due to the
standing water may preclude this as a workable solution.
An estimate of the spring‘s current capacity was attempted, but due to difficulties
associated with the terrain and sources of error, only an estimation of the flow was
obtained, at 3.5 m3
/ min or 5,000 m3
/ day with an estimated margin of error of 50%
(Appendix VI). By comparison, the current combined capacity of SNEC/CDE‘s springs is
about 6,500 m3
/ day. As mentioned earlier, the GWM scheme‘s source has large excess
capacity. At present only a fraction of the spring is harnessed for the network.
4.1.2 Demographics and the role of women in water in Buea
This section describes characteristics of community water users from the household
questionnaires (Appendix IV). First, a brief mention must be made about the gender
implications of water use, not only in Buea, but in many Sub-Saharan developing
countries. It became quickly evident from personal observations and informal
conversations with people in Buea that in most households women are the main actors
responsible for water management. In some instances, even when a male member of the
household was asked a question about water, he would refer to a woman from the
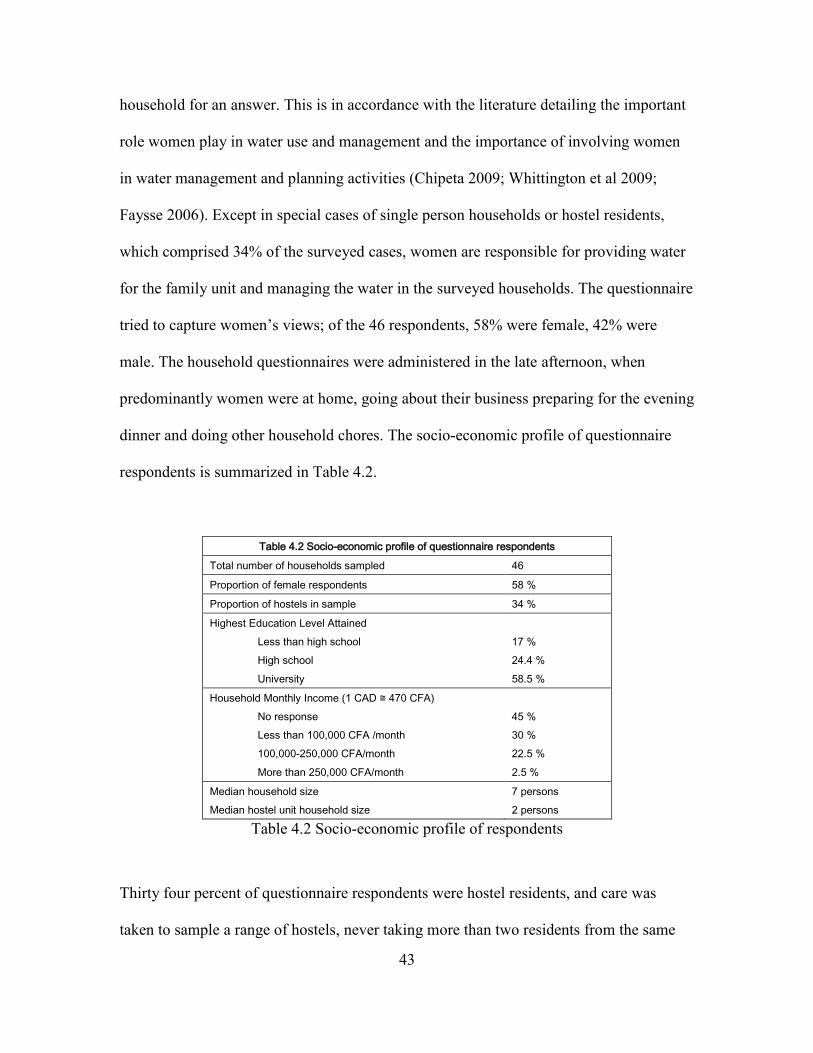
43
household for an answer. This is in accordance with the literature detailing the important
role women play in water use and management and the importance of involving women
in water management and planning activities (Chipeta 2009; Whittington et al 2009;
Faysse 2006). Except in special cases of single person households or hostel residents,
which comprised 34% of the surveyed cases, women are responsible for providing water
for the family unit and managing the water in the surveyed households. The questionnaire
tried to capture women‘s views; of the 46 respondents, 58% were female, 42% were
male. The household questionnaires were administered in the late afternoon, when
predominantly women were at home, going about their business preparing for the evening
dinner and doing other household chores. The socio-economic profile of questionnaire
respondents is summarized in Table 4.2.
Table 4.2 Socio-economic profile of questionnaire respondents
Total number of households sampled 46
Proportion of female respondents 58 %
Proportion of hostels in sample 34 %
Highest Education Level Attained
Less than high school
High school
University
17 %
24.4 %
58.5 %
Household Monthly Income (1 CAD ≅ 470 CFA)
No response
Less than 100,000 CFA /month
100,000-250,000 CFA/month
More than 250,000 CFA/month
45 %
30 %
22.5 %
2.5 %
Median household size
Median hostel unit household size
7 persons
2 persons
Table 4.2 Socio-economic profile of respondents
Thirty four percent of questionnaire respondents were hostel residents, and care was
taken to sample a range of hostels, never taking more than two residents from the same
44
hostel. Therefore, the Figure of 34 % is not reflective of the proportion of hostel residents
among the users of community water, but is more a reflection of the proportion of hostels
among all the buildings that use community water. The proportion of hostel residents
among community water users was not able to be estimated, but it is believed to be
greater than 34 % because each hostel is estimated to house between 10 to 30 residents,
which is greater than the median household size of around seven people. The median
household size is consistent with findings from household surveys administered in
previous research (Meaney 2008). In contrast, each unit in a hostel had a median number
of residents of two people, and personal observations suggested that hostels in the
neighbourhood comprised of between five and fifteen units each.
The large proportion of university-educated respondents is a phenomenon influenced by
Buea‘s position as a university town, both because of a large number of students and
because of a large number of alumni. Nearly half of respondents chose not to reveal their
income category, but those who did paint a picture of a large number of lower to middle
income households and students with little income. A small proportion (2.5 %) earn over
250,000 CFA/month5, which was chosen as the highest income category based on
previous research in Buea (Meaney 2008).
4.1.3 Characteristics of community water use
Table 4.3 summarises the characteristics of community water use in the GWM scheme.
The survey results indicate that community water‘s role is to provide an alternative to
5 Equivalent to about 530 CAD/month in 2011
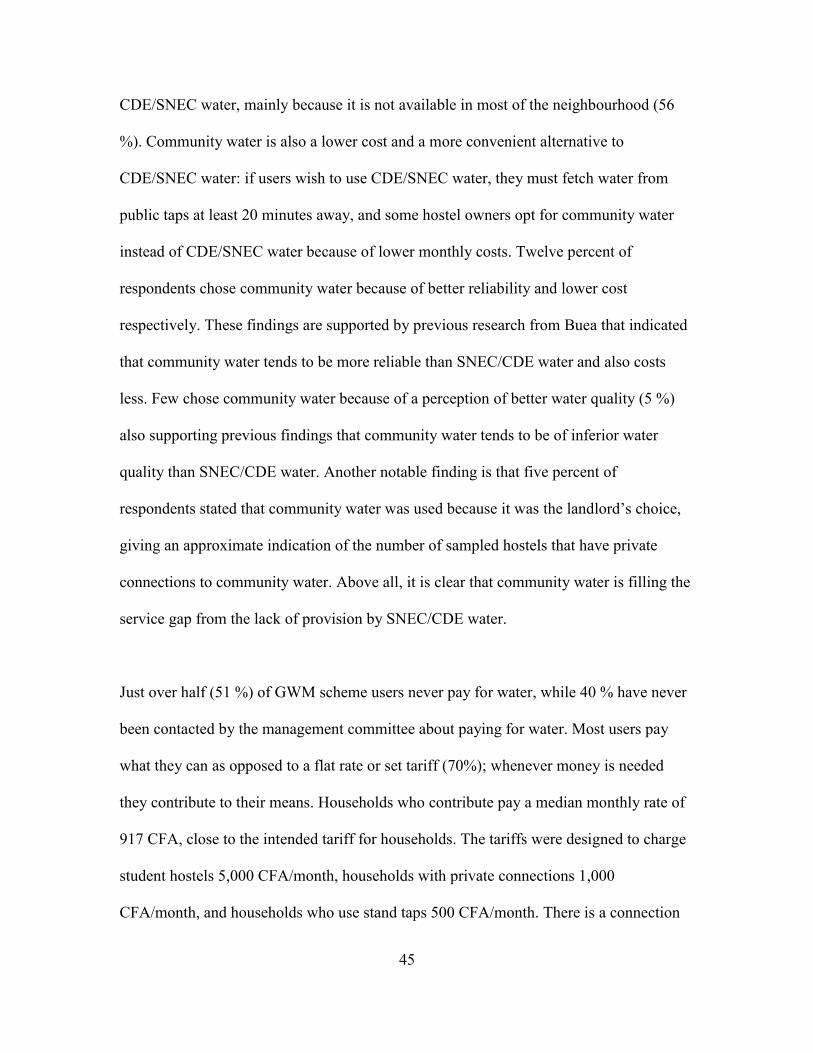
45
CDE/SNEC water, mainly because it is not available in most of the neighbourhood (56
%). Community water is also a lower cost and a more convenient alternative to
CDE/SNEC water: if users wish to use CDE/SNEC water, they must fetch water from
public taps at least 20 minutes away, and some hostel owners opt for community water
instead of CDE/SNEC water because of lower monthly costs. Twelve percent of
respondents chose community water because of better reliability and lower cost
respectively. These findings are supported by previous research from Buea that indicated
that community water tends to be more reliable than SNEC/CDE water and also costs
less. Few chose community water because of a perception of better water quality (5 %)
also supporting previous findings that community water tends to be of inferior water
quality than SNEC/CDE water. Another notable finding is that five percent of
respondents stated that community water was used because it was the landlord‘s choice,
giving an approximate indication of the number of sampled hostels that have private
connections to community water. Above all, it is clear that community water is filling the
service gap from the lack of provision by SNEC/CDE water.
Just over half (51 %) of GWM scheme users never pay for water, while 40 % have never
been contacted by the management committee about paying for water. Most users pay
what they can as opposed to a flat rate or set tariff (70%); whenever money is needed
they contribute to their means. Households who contribute pay a median monthly rate of
917 CFA, close to the intended tariff for households. The tariffs were designed to charge
student hostels 5,000 CFA/month, households with private connections 1,000
CFA/month, and households who use stand taps 500 CFA/month. There is a connection
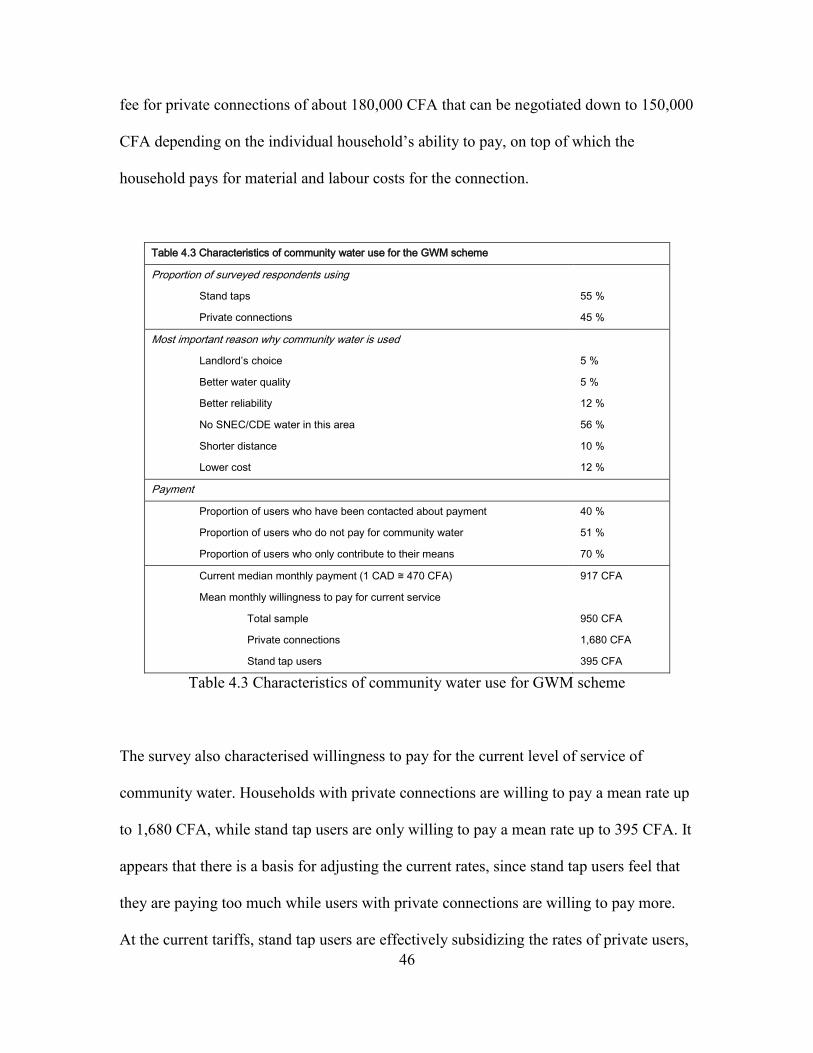
46
fee for private connections of about 180,000 CFA that can be negotiated down to 150,000
CFA depending on the individual household‘s ability to pay, on top of which the
household pays for material and labour costs for the connection.
Table 4.3 Characteristics of community water use for the GWM scheme
Proportion of surveyed respondents using
Stand taps
Private connections
55 %
45 %
Most important reason why community water is used
Landlord’s choice
Better water quality
Better reliability
No SNEC/CDE water in this area
Shorter distance
Lower cost
5 %
5 %
12 %
56 %
10 %
12 %
Payment
Proportion of users who have been contacted about payment
Proportion of users who do not pay for community water
Proportion of users who only contribute to their means
40 %
51 %
70 %
Current median monthly payment (1 CAD ≅ 470 CFA)
Mean monthly willingness to pay for current service
Total sample
Private connections
Stand tap users
917 CFA
950 CFA
1,680 CFA
395 CFA
Table 4.3 Characteristics of community water use for GWM scheme
The survey also characterised willingness to pay for the current level of service of
community water. Households with private connections are willing to pay a mean rate up
to 1,680 CFA, while stand tap users are only willing to pay a mean rate up to 395 CFA. It
appears that there is a basis for adjusting the current rates, since stand tap users feel that
they are paying too much while users with private connections are willing to pay more.
At the current tariffs, stand tap users are effectively subsidizing the rates of private users,
47
which undermines the management committee‘s attempts to make standtaps accessible to
marginalised users such as the poor and the elderly.
As Table 4.3 suggests, the enforcement of fee payment is difficult; when users refuse to
pay, they are disconnected until they decide to pay, using the several stopcocks at various
locations throughout the network. But many people turn to the community standpipes,
which de facto are free of charge because of the management committee‘s difficulties
with controlling who uses the taps.
4.1.4 Key findings
Rapid population growth exceeded the projections, placing stress on standpipe
infrastructure.
Deterioration of service resulted in the use of alternative water sources, including
a return to the use of ―unimproved‖ sources.
Poor planning resulted in loss of flow to parts of the network.
Action needs to be taken to improve participation and to uphold the participatory
mechanisms as originally intended.
Water treatment and price are the most important attributes to users.
The key findings summarised above will be discussed in the following sections. Many of
the findings relate to the fact that the Great Soppo, Wokoko, Molyko (GWM) community
scheme continues to function in a rapidly urbanising context. The following sections will
discuss in more detail how the problems arose, the implications of these water supply

48
problems, why the management committee was ineffective in dealing with the problems,
the breakdown of the participatory mechanism of the community scheme, and the results
of choice modelling experiments conducted on community water users.
4.2 A discussion of the problem
4.2.1 The context: about the GWM scheme
Approximately 80 paying households are on the management committee‘s books, in
addition to which many users of community water are students in student hostels. The
questionnaire sampled 46 households including students; 34 percent of the sampled
respondents lived in student hostels, and observations sometimes indicated more than one
person living in a single occupancy hostel. The remaining 66 percent of respondents were
households. Forty five percent of the sample accessed community water through an
individual connection, while 55 percent accessed water through a community stand tap.
According to the water management committee of the GWM scheme, the distribution
network was originally intended to supply only a standpipe level of service, but over
time, the growth in the number of students placed high pressures on the standpipe
infrastructure, resulting in long queues and deterioration of service. In response to this,
the water management committee took action by offering private connections to the
student hostels, thereby hoping to alleviate long queues and improve service from the
public taps, which the more marginalised population including the poor and the elderly
relied upon.

49
The problem can be put into context as follows. Given a median household size of 7
persons, the population of paying consumers on the management committee‘s books
(predominantly those with private connections) is 560 persons. Added to that number is
an unknown number of non-paying stand tap users who are not accounted for in the
management committee‘s records, and an estimate of between 750 and 1200 students
housed in hostels around the neighbourhood. Since the system‘s current population
potential capacity was estimated at 1400 persons (Section 4.1.1), this highlights that the
system is operating at or close to capacity with very small margins for error.
4.2.2 Understanding users’ “satisfaction”
The construction of the GWM scheme has undoubtedly improved the lives of residents of
Wokoko and Molyko. Where previously people had to rely on distant public stand taps
run by the national water utility SNEC/CDE or on unsafe traditional sources such as open
watercourses, after construction people had access to stand taps within a few minutes
from their homes supplying water from a more protected source upstream. Furthermore,
as rural areas that were quickly being subsumed by urbanisation into greater Buea, the
villages were faced with increasing population and population density which placed more
pressure on traditional sources of water and increased the risks of contamination, thus a
piped water distribution system would provide improvements in access and water quality.
It is clear, then, that community water users in Wokoko and Molyko have benefited from
the GWM scheme, and indeed, 60 percent of questionnaire respondents indicated that
they were satisfied with community water. This leads to the question: which factors
might be related to consumer satisfaction? Going beyond the obvious physical factors
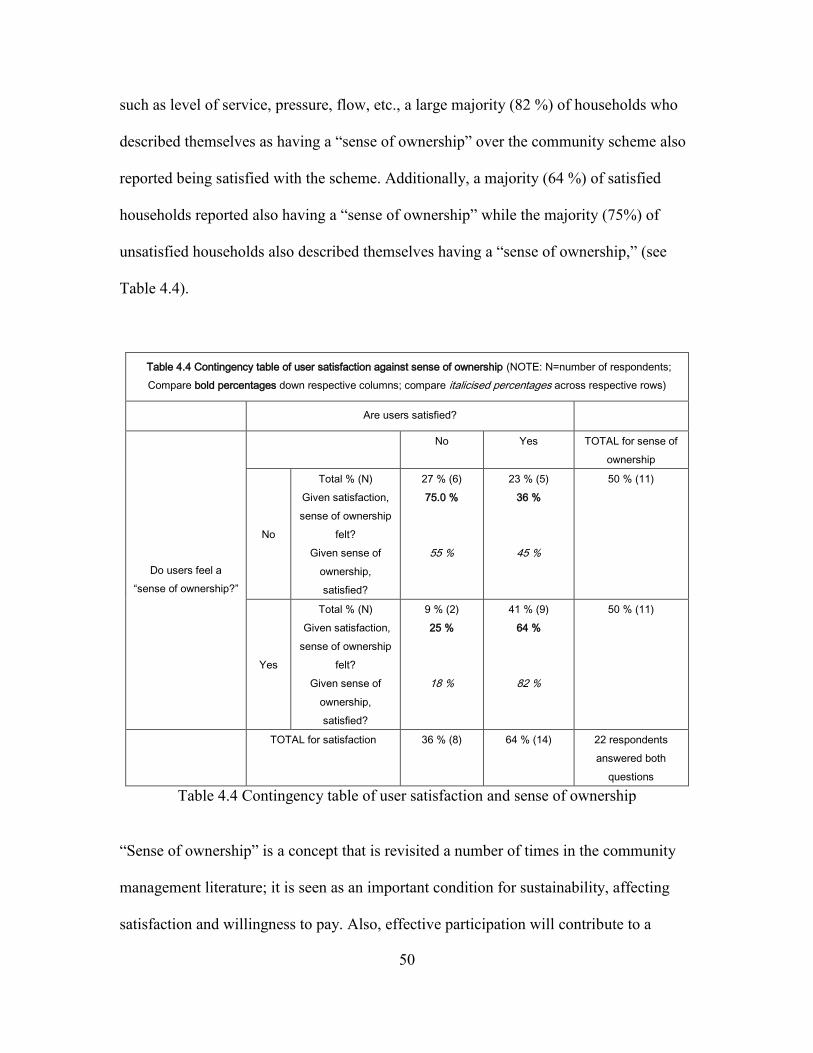
50
such as level of service, pressure, flow, etc., a large majority (82 %) of households who
described themselves as having a ―sense of ownership‖ over the community scheme also
reported being satisfied with the scheme. Additionally, a majority (64 %) of satisfied
households reported also having a ―sense of ownership‖ while the majority (75%) of
unsatisfied households also described themselves having a ―sense of ownership,‖ (see
Table 4.4).
Table 4.4 Contingency table of user satisfaction against sense of ownership (NOTE: N=number of respondents;
Compare bold percentages down respective columns; compare italicised percentages across respective rows)
Are users satisfied?
Do users feel a
“sense of ownership?”
No Yes TOTAL for sense of
ownership
No
Total % (N)
Given satisfaction,
sense of ownership
felt?
Given sense of
ownership,
satisfied?
27 % (6)
75.0 %
55 %
23 % (5)
36 %
45 %
50 % (11)
Yes
Total % (N)
Given satisfaction,
sense of ownership
felt?
Given sense of
ownership,
satisfied?
9 % (2)
25 %
18 %
41 % (9)
64 %
82 %
50 % (11)
TOTAL for satisfaction 36 % (8) 64 % (14) 22 respondents
answered both
questions
Table 4.4 Contingency table of user satisfaction and sense of ownership
―Sense of ownership‖ is a concept that is revisited a number of times in the community
management literature; it is seen as an important condition for sustainability, affecting
satisfaction and willingness to pay. Also, effective participation will contribute to a
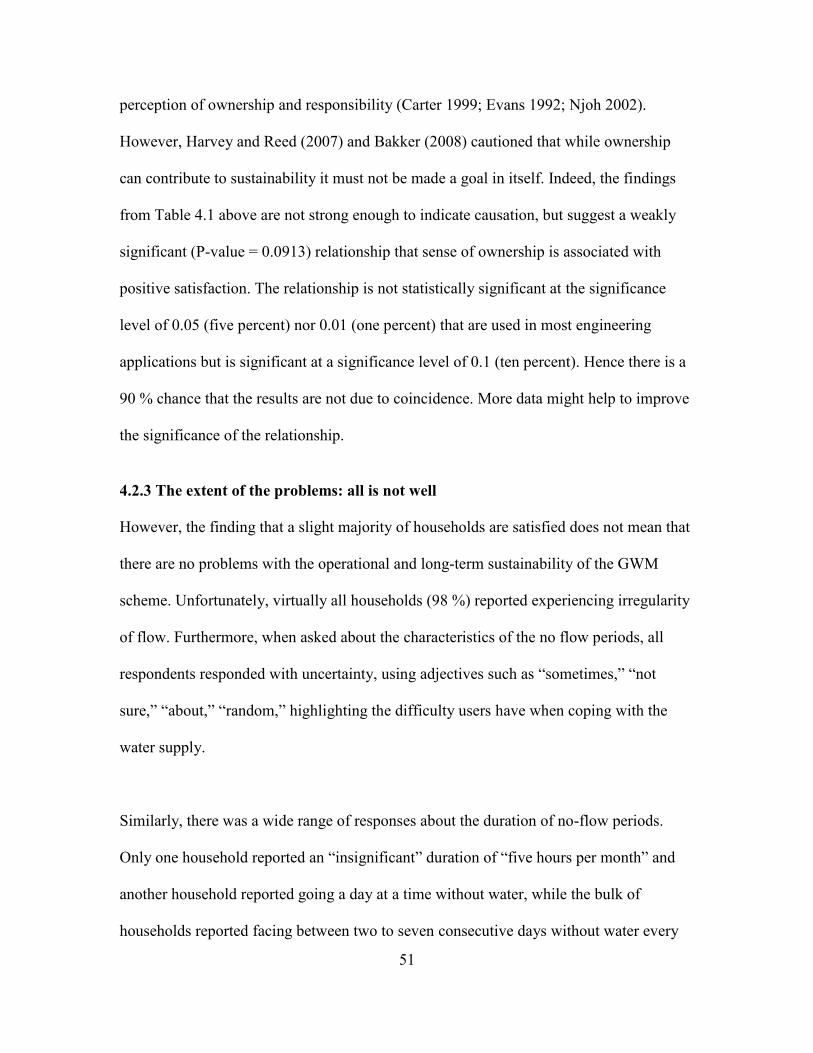
51
perception of ownership and responsibility (Carter 1999; Evans 1992; Njoh 2002).
However, Harvey and Reed (2007) and Bakker (2008) cautioned that while ownership
can contribute to sustainability it must not be made a goal in itself. Indeed, the findings
from Table 4.1 above are not strong enough to indicate causation, but suggest a weakly
significant (P-value = 0.0913) relationship that sense of ownership is associated with
positive satisfaction. The relationship is not statistically significant at the significance
level of 0.05 (five percent) nor 0.01 (one percent) that are used in most engineering
applications but is significant at a significance level of 0.1 (ten percent). Hence there is a
90 % chance that the results are not due to coincidence. More data might help to improve
the significance of the relationship.
4.2.3 The extent of the problems: all is not well
However, the finding that a slight majority of households are satisfied does not mean that
there are no problems with the operational and long-term sustainability of the GWM
scheme. Unfortunately, virtually all households (98 %) reported experiencing irregularity
of flow. Furthermore, when asked about the characteristics of the no flow periods, all
respondents responded with uncertainty, using adjectives such as ―sometimes,‖ ―not
sure,‖ ―about,‖ ―random,‖ highlighting the difficulty users have when coping with the
water supply.
Similarly, there was a wide range of responses about the duration of no-flow periods.
Only one household reported an ―insignificant‖ duration of ―five hours per month‖ and
another household reported going a day at a time without water, while the bulk of
households reported facing between two to seven consecutive days without water every
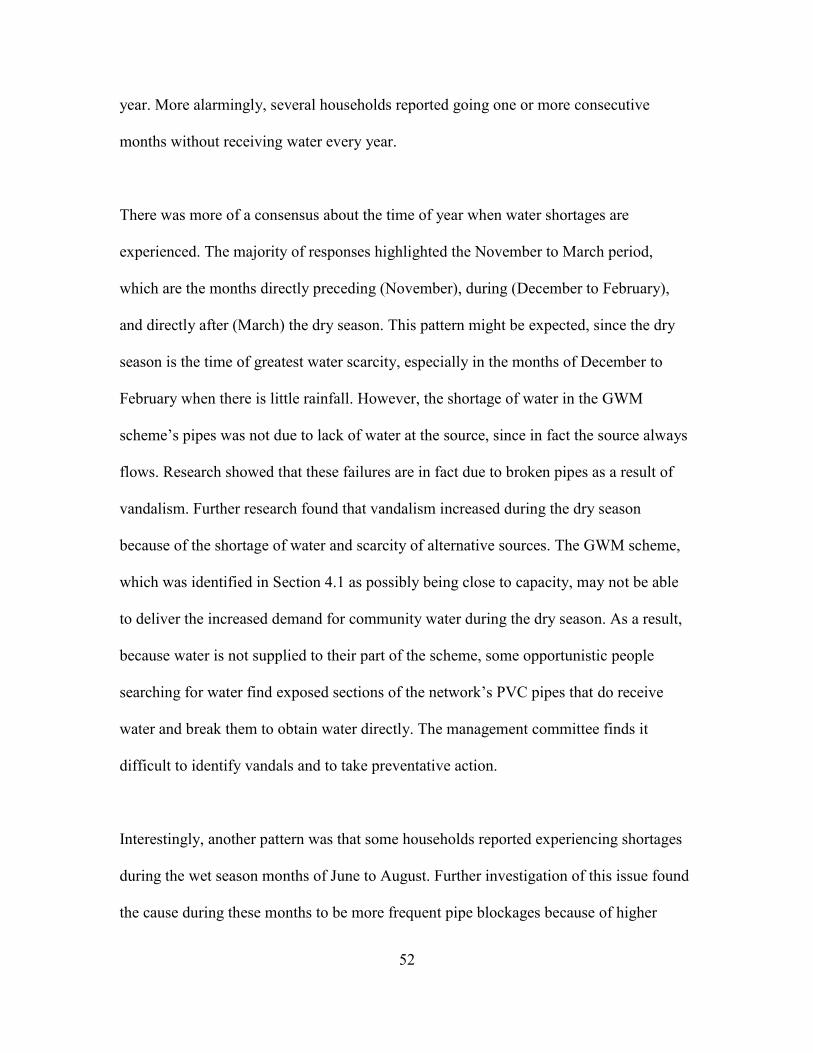
52
year. More alarmingly, several households reported going one or more consecutive
months without receiving water every year.
There was more of a consensus about the time of year when water shortages are
experienced. The majority of responses highlighted the November to March period,
which are the months directly preceding (November), during (December to February),
and directly after (March) the dry season. This pattern might be expected, since the dry
season is the time of greatest water scarcity, especially in the months of December to
February when there is little rainfall. However, the shortage of water in the GWM
scheme‘s pipes was not due to lack of water at the source, since in fact the source always
flows. Research showed that these failures are in fact due to broken pipes as a result of
vandalism. Further research found that vandalism increased during the dry season
because of the shortage of water and scarcity of alternative sources. The GWM scheme,
which was identified in Section 4.1 as possibly being close to capacity, may not be able
to deliver the increased demand for community water during the dry season. As a result,
because water is not supplied to their part of the scheme, some opportunistic people
searching for water find exposed sections of the network‘s PVC pipes that do receive
water and break them to obtain water directly. The management committee finds it
difficult to identify vandals and to take preventative action.
Interestingly, another pattern was that some households reported experiencing shortages
during the wet season months of June to August. Further investigation of this issue found
the cause during these months to be more frequent pipe blockages because of higher

53
sediment load from the increased runoff and biological debris from increased plant
growth.
4.2.4 Implications: the gravity of the problems
Water is a necessity for human survival and development, so when faced with shortages
from one water source, people will cope by finding other sources. This might manifest
itself as an increase in the burden of fetching water as users travel longer distances and
spend more time fetching safe water. For others, shortages may result in potential health
pitfalls as people fetch water from closer, more convenient, yet potentially more
dangerous unprotected sources. It was shown earlier that virtually all users of the GWM
scheme reported experiencing irregular flow. Eighty percent of households practice
rainwater harvesting to supplement or substitute for community water (Figure 4.4). The
rainwater harvesting is relatively informal: households leave containers of varying sizes
outside to collect precipitation directly or via a gutter. The two most common volumes of
rainwater collected per rainfall event as the container is emptied are 15 and 200 litres
(Figure 4.5). The 15 litre size corresponds to widely available plastic buckets while the
200 litre size corresponds to large barrels that some households have in their gardens. The
smaller containers would be emptied into separate storage containers and then replaced
outdoors in order to allow for continuous collecting of water during a rainfall event, while
the larger containers would usually be filled once and kept as storage. However, the
median volume of 25 litres indicates a tendency to collect smaller volumes of rainwater
as needed (Table 4.4 and Figure 4.5). This makes sense for most of the year, when
rainfall is fairly abundant, but historical records show that during the dry season months

54
of December to February when the community water shortages are also most acute, there
is little to no precipitation (Figure 4.6). Hence, users cannot rely on rainwater year-round,
and most are not equipped for large-scale rainwater collection and storage that would be
needed to make up for the absolute lack of precipitation during the dry season.
Figure 4.4 Prevalence of rainwater harvesting in the GWM scheme
Table 4.5 Volume of rainwater collected by community water users
Statistic Value (litres)
Mean 72.5
Std. Dev. 81.8
Median 25.0
Mode 15.0
Table 4.5 Mean, median and mode of volume of rainwater collected per rainfall event
55
Figure 4.5 Bar chart of distribution of rainwater volume (litres) collected per rainfall
event by community water users
Figure 4.6 Chart of mean total monthly rainfall in Buea
0
50
100
150
200
250
300
350
400
450
500
Jan Feb Mar Apr May Jun Jul Aug Sep Oct Nov Dec
mm
Mean Total Monthly Rainfall for Buea (data from Fraser et al., 1998)

56
Therefore, community water shortages mean that a majority of users (88 %) must also
rely on sources other than community water or rainwater. The most popular sources
included an open stream running through Wokoko, and a protected spring located half an
hour away. Eleven households recognized the health hazards of consuming water from an
unprotected source and only used the stream for nonpotable uses, however five
households use the stream for all household uses including for drinking. This reflects a
more general notion observed among many residents of Buea that the untreated water
from springs and streams is safe to drink, but this notion is changing because of more
research like that of Akoh (2009) showing that water quality in Buea is deteriorating.
4.3 The underlying causes
4.3.1 Unsustainable development due to poor planning
One of the contributing factors to the problems the GWM scheme is facing today is
rooted in deficiencies of the initial plan. The annual growth in student population in the
whole of Buea, estimated by the water management committee at around 1000-3000 new
students for each year the scheme was in existence, was not accounted for in the planning
of the system, despite the University of Buea already being in existence for several years
before the GWM scheme was planned. Furthermore, the decision to make water available
through individual connections to hostels was not ideal without knowing the capacity of
the network. So, besides the inability of the physical network to cope with the
unanticipated increase in connections, it appears also that the management committee
was unable to adapt to the demographic changes, which will be discussed in Section 4.4.
57
Unfortunately, this deficiency of planning appears to be somewhat symptomatic as it has
been observed in another nearby community scheme (Great Soppo-Bonduma Community
Water Supply) that is currently in the planning phase with a partnership between the
community and an NGO. Although the proposal for the GWM scheme could not be
obtained, the proposal for the Great Soppo-Bonduma community water supply project
illustrates the poor planning, lack of detail, and neglect of some technical aspects that
plagued the GWM scheme.
Great Soppo-Bonduma Proposal
While the Great Soppo-Bonduma proposal included an estimate of population to be
served, the choice of design population was not backed by a population growth rate or
other justification. The population is currently at 25,000 and estimated to increase to
40,000 inhabitants in 20 years. However it was not discussed what proportion of the
25,000 already have access to water from SNEC/CDE, and how many will actually use
community water, nor how the 40,000 figure was arrived at. Unfortunately, population
projections are difficult to make when demographic and population data are lacking as is
the case in many developing areas experiencing rapid growth, however participatory
methods can be used to obtain local knowledge and historical experience to counter this
uncertainty. For example, a quick compilation of the University of Buea admissions for
the 2010 academic year shows an intake of 6000 students6, many of whom come from
outside of Buea and stay in the town after graduating, indicating the scale of the growth
6 Data sourced from University of Buea website
(http://ubuea.net/index.php?option=com_content&view=category&id=3993&Itemid=195) and compiled by
author.
58
of the student body and giving an idea of the demographic pressures on Buea. The
University could play a larger role in the community by sharing its knowledge of student
demographics with project planners.
Another section of the proposal called for pumping stations, which appears to disregard
local difficulties related to power supply and technical capacity. Pumping requires more
technical capacity for operation and maintenance, requiring a skilled full-time technician,
and most importantly, observations showed that pumping would be subject to a
fluctuating and erratic power supply. No justification was made for proposing this more
expensive option, nor was there a discussion of the costs and benefits of pumping
compared to a gravity-fed network, which is also feasible given the elevations of the
source and the community served. Should the proposal go through, the project would risk
running into an operational failure.
Finally, the proposal made a provision for training of a ―maintenance committee,‖
charged with administering the project at all levels, collecting funds and levies from the
community for maintenance. Although community participation is evident in the
conception of this project, where it was a ―self-felt need‖ for the community, and the
maintenance committee is also designed to be participatory in nature and elected by
village assembly, there is no mention of continued monitoring and evaluation of these
mechanisms after project completion. This is not to say that the project should not be
realised; on the contrary, the social developmental benefits of the water supply project are
obvious. However, the proposal should have outlined a role for the partner NGO to return
59
to the project and ensure sustainability of not only the physical infrastructure, but also of
the management committee and participatory mechanisms.
It could be argued that giving the local partner NGO the role in post-construction
monitoring and evaluation is unfair due to limited resources. However, post-construction
support (in the form of access to spare parts and technical expertise) has been shown to
improve the sustainability of community managed rural water supply (Whittington et al.
2009). Therefore, future community projects should only be undertaken where adequate
resources to ensure post-construction support, including monitoring and evaluation of
technical and managerial aspects can be assured.
The Great Soppo-Bonduma project illustrates the short-sighted planning that also plagued
some aspects of the GWM scheme. It is important to address the deficient planning that is
evident in some community-managed schemes in order to avoid time delays, cost
overruns, unrealistic expectations, and unsustainable projects, all of which erode the
community‘s support for the project (Njoh 2003b) and may lead to project failure.
Furthermore, as was shown to be the case in the GWM scheme, deficient planning also
undermines the intended developmental goal of eliminating dependence on ―unimproved‖
water sources, which users return to rely upon even for potable uses such as drinking and
cooking.
60
4.3.2 Ineffective management and insufficient capacity
The problems faced by the GWM scheme are also attributable to the management
decisions taken after the community water supply project was planned and constructed.
For example, the decision taken by the management committee to connect individual
households to the network, while alleviating queues at standpipes, had a detrimental
effect to the overall level of service. According to the technician of the GWM scheme,
the many individual connections to hostels and households reduced pressure and flow in
the entire network, and due to the linear nature of the network resulted in the extremes
losing service completely. The network was originally intended only to supply
standpipes, and not intended to supply individual households, which would have affected
the design of the network. Connecting individual households, in particular those multi-
level hostels and residences that require higher water pressure, to the network had a
detrimental effect on the pressure in the pipes due to increased demand. Gleick (1996)
suggested that as distance to source decreases, water consumption increases. Easier
access encourages more water use. Therefore, it is likely that after connecting individual
households to the network, water consumption by those households increased, placing a
strain on the flow available in the distribution network that was designed to supply the
lower flow rate required by the standpipe level of service. In hindsight it would appear
that as a strategy to alleviate long queues, connecting several individual households to the
network was a poorer choice than extending supply to a few more key standpipes.
Therefore, unfortunately, it appears that the management decision to connect individual
households was taken quickly and without fully understanding the implications since
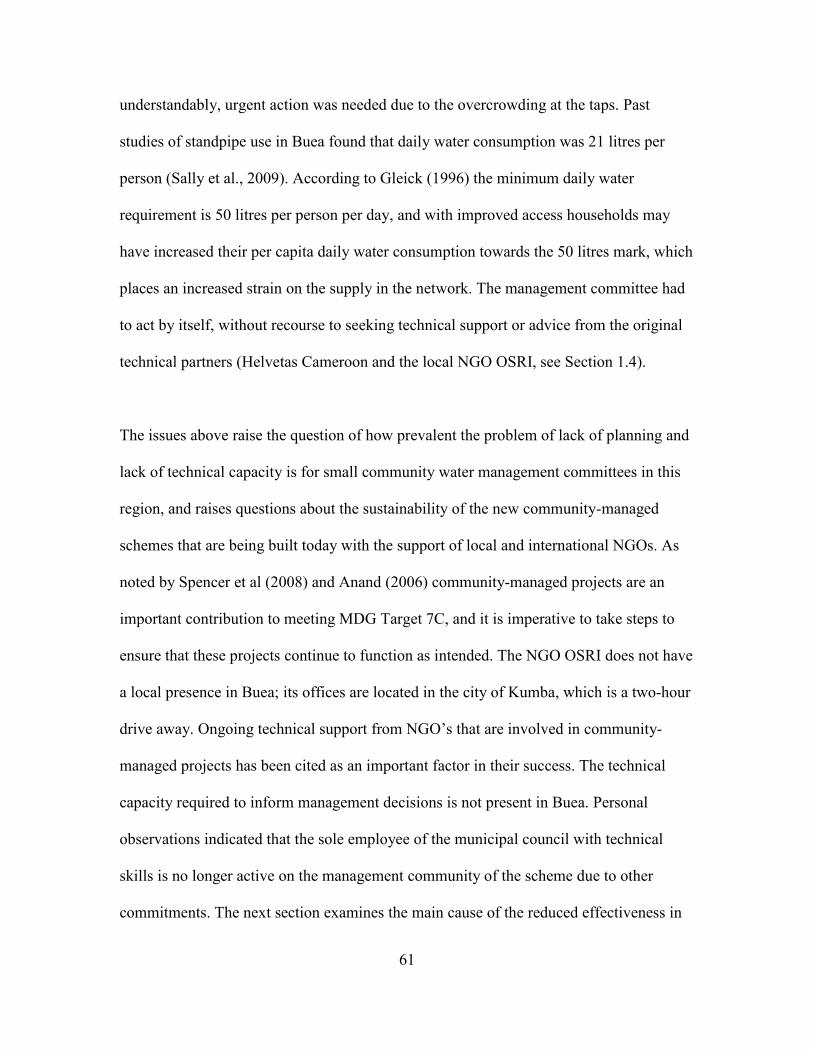
61
understandably, urgent action was needed due to the overcrowding at the taps. Past
studies of standpipe use in Buea found that daily water consumption was 21 litres per
person (Sally et al., 2009). According to Gleick (1996) the minimum daily water
requirement is 50 litres per person per day, and with improved access households may
have increased their per capita daily water consumption towards the 50 litres mark, which
places an increased strain on the supply in the network. The management committee had
to act by itself, without recourse to seeking technical support or advice from the original
technical partners (Helvetas Cameroon and the local NGO OSRI, see Section 1.4).
The issues above raise the question of how prevalent the problem of lack of planning and
lack of technical capacity is for small community water management committees in this
region, and raises questions about the sustainability of the new community-managed
schemes that are being built today with the support of local and international NGOs. As
noted by Spencer et al (2008) and Anand (2006) community-managed projects are an
important contribution to meeting MDG Target 7C, and it is imperative to take steps to
ensure that these projects continue to function as intended. The NGO OSRI does not have
a local presence in Buea; its offices are located in the city of Kumba, which is a two-hour
drive away. Ongoing technical support from NGO‘s that are involved in community-
managed projects has been cited as an important factor in their success. The technical
capacity required to inform management decisions is not present in Buea. Personal
observations indicated that the sole employee of the municipal council with technical
skills is no longer active on the management community of the scheme due to other
commitments. The next section examines the main cause of the reduced effectiveness in
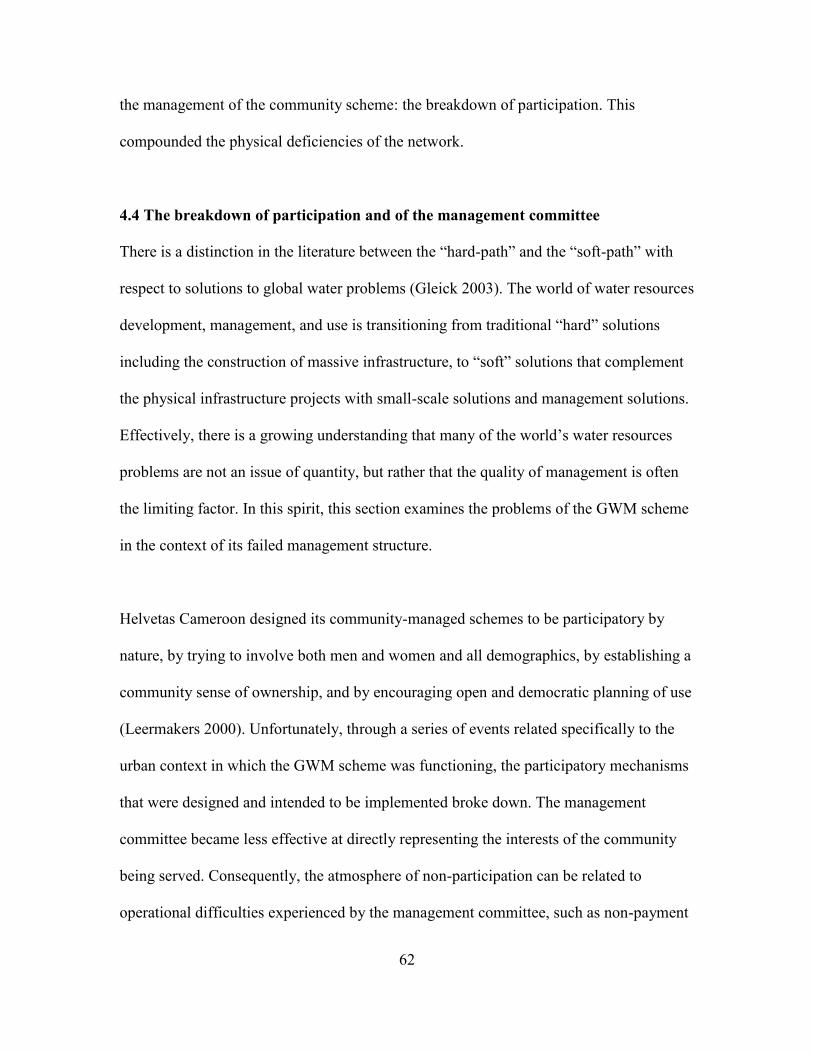
62
the management of the community scheme: the breakdown of participation. This
compounded the physical deficiencies of the network.
4.4 The breakdown of participation and of the management committee
There is a distinction in the literature between the ―hard-path‖ and the ―soft-path‖ with
respect to solutions to global water problems (Gleick 2003). The world of water resources
development, management, and use is transitioning from traditional ―hard‖ solutions
including the construction of massive infrastructure, to ―soft‖ solutions that complement
the physical infrastructure projects with small-scale solutions and management solutions.
Effectively, there is a growing understanding that many of the world‘s water resources
problems are not an issue of quantity, but rather that the quality of management is often
the limiting factor. In this spirit, this section examines the problems of the GWM scheme
in the context of its failed management structure.
Helvetas Cameroon designed its community-managed schemes to be participatory by
nature, by trying to involve both men and women and all demographics, by establishing a
community sense of ownership, and by encouraging open and democratic planning of use
(Leermakers 2000). Unfortunately, through a series of events related specifically to the
urban context in which the GWM scheme was functioning, the participatory mechanisms
that were designed and intended to be implemented broke down. The management
committee became less effective at directly representing the interests of the community
being served. Consequently, the atmosphere of non-participation can be related to
operational difficulties experienced by the management committee, such as non-payment
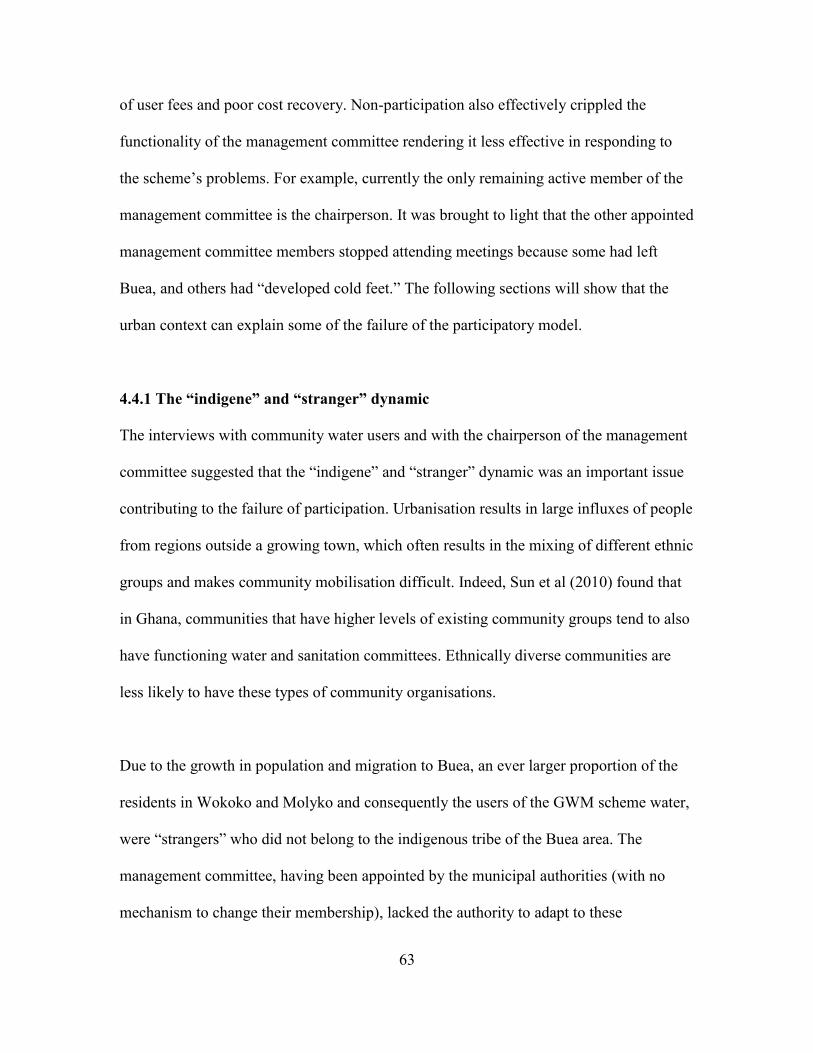
63
of user fees and poor cost recovery. Non-participation also effectively crippled the
functionality of the management committee rendering it less effective in responding to
the scheme‘s problems. For example, currently the only remaining active member of the
management committee is the chairperson. It was brought to light that the other appointed
management committee members stopped attending meetings because some had left
Buea, and others had ―developed cold feet.‖ The following sections will show that the
urban context can explain some of the failure of the participatory model.
4.4.1 The “indigene” and “stranger” dynamic
The interviews with community water users and with the chairperson of the management
committee suggested that the ―indigene‖ and ―stranger‖ dynamic was an important issue
contributing to the failure of participation. Urbanisation results in large influxes of people
from regions outside a growing town, which often results in the mixing of different ethnic
groups and makes community mobilisation difficult. Indeed, Sun et al (2010) found that
in Ghana, communities that have higher levels of existing community groups tend to also
have functioning water and sanitation committees. Ethnically diverse communities are
less likely to have these types of community organisations.
Due to the growth in population and migration to Buea, an ever larger proportion of the
residents in Wokoko and Molyko and consequently the users of the GWM scheme water,
were ―strangers‖ who did not belong to the indigenous tribe of the Buea area. The
management committee, having been appointed by the municipal authorities (with no
mechanism to change their membership), lacked the authority to adapt to these

64
demographic changes for two reasons. First, the municipal authorities‘ perception was
that involving ―strangers‖ from the community on the management committee might
imply ceding control of the water that belongs to the local people. Second, the
management committee itself was unable to adapt to the changes and seek new members
because the sole authority to appoint people to the committee resided with the mayor.
Hence, the management committee remained composed of members who were appointed
from outside the community being served, not necessarily resident or users of the
community water themselves. Instead, the research found that purported members of the
management committee include some local municipal council members, and other
prominent inhabitants of Buea, who were appointed on the basis of their competence and
merits only without ensuring that they actually had a stake in the GWM scheme. As it
happened, many original members of the committee left Buea. The municipality, in
having appointed the original management committee, had the sole authority to allow the
management committee to adapt to the changing demographics and become more
participatory in its representation, but this did not happen.
In the intended operational structure designed by Helvetas, management committees and
municipal authorities would be trained to create an enabling environment for participation
of consumers in a ―Demand Responsive Approach‖ to manage their systems (Helvetas
2002). However, in reality the management committee did not understand the importance
of community participation and consequently did not petition the municipal authority to
make changes, and no action was taken to petition for changes to the committee until
after this research was carried out. Additionally, the municipal authority was either
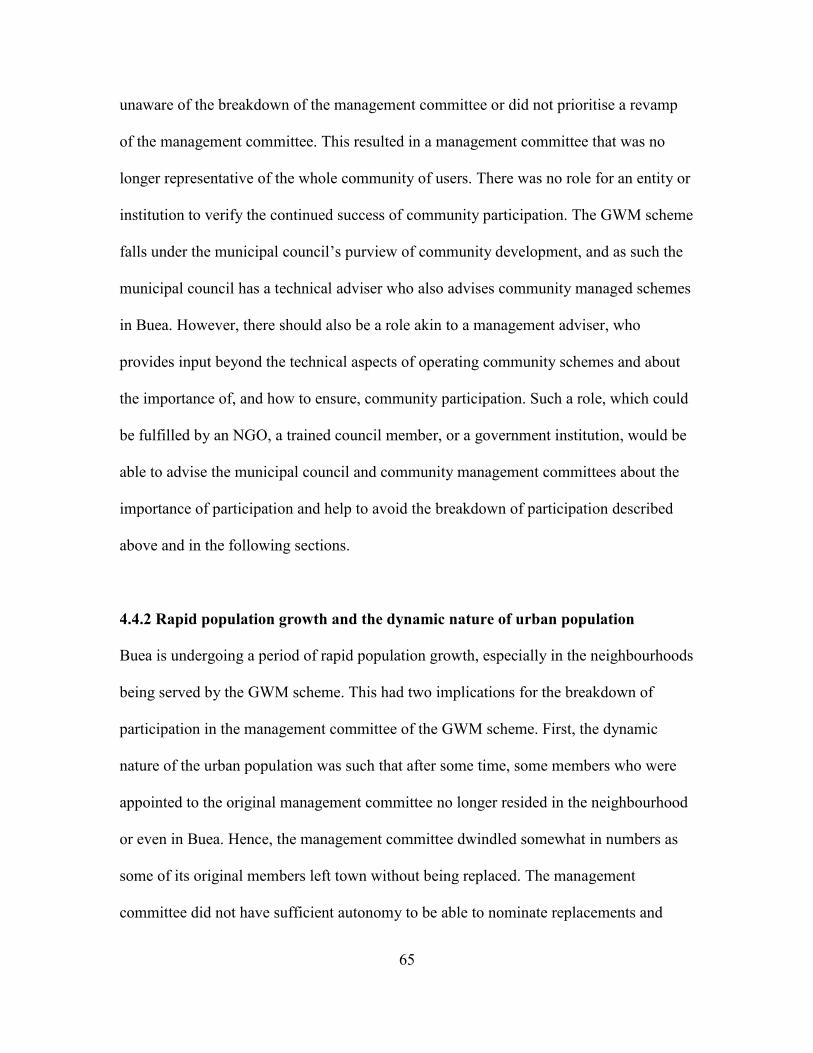
65
unaware of the breakdown of the management committee or did not prioritise a revamp
of the management committee. This resulted in a management committee that was no
longer representative of the whole community of users. There was no role for an entity or
institution to verify the continued success of community participation. The GWM scheme
falls under the municipal council‘s purview of community development, and as such the
municipal council has a technical adviser who also advises community managed schemes
in Buea. However, there should also be a role akin to a management adviser, who
provides input beyond the technical aspects of operating community schemes and about
the importance of, and how to ensure, community participation. Such a role, which could
be fulfilled by an NGO, a trained council member, or a government institution, would be
able to advise the municipal council and community management committees about the
importance of participation and help to avoid the breakdown of participation described
above and in the following sections.
4.4.2 Rapid population growth and the dynamic nature of urban population
Buea is undergoing a period of rapid population growth, especially in the neighbourhoods
being served by the GWM scheme. This had two implications for the breakdown of
participation in the management committee of the GWM scheme. First, the dynamic
nature of the urban population was such that after some time, some members who were
appointed to the original management committee no longer resided in the neighbourhood
or even in Buea. Hence, the management committee dwindled somewhat in numbers as
some of its original members left town without being replaced. The management
committee did not have sufficient autonomy to be able to nominate replacements and
66
adapt to the changing demographics without the support of the municipal authority,
which renders it ineffective to adapt quickly to change. As discussed in the previous
section, on the one hand the management committee chairperson did not understand the
importance of community participation so did not push hard for change, and on the other
hand the municipal authority either was unaware that change was needed or did not
prioritize an overhaul of the management committee. Thus, today the management
committee consists of only one ―active‖ member: the chairperson.
The second implication of rapid population growth and the dynamic nature of an urban
population was that traditional forms of hierarchy including the neighbourhood leaders or
―quarter heads‖ as they are called, though they still maintained their official relevance,
practically speaking they found their jobs increasingly difficult to carry out, resulting in
less community cohesion and making community mobilisation more difficult. The
increased size, turnover of population and new inhabitants makes keeping track of the
population of their quarters, and mobilising action as a community, more difficult. This is
why the success of neighbourhood standpipe committees similar to the ones described in
Northwest Cameroon by Njoh (2006) could not be replicated as effectively in Buea. In
the town of Kumbo in the Northwest, community-managed water has successfully been
implemented on a relatively large scale. However, the caveat is that the traditional
hierarchy of the Fon or leader in the Northwest Region is still very strong, which makes it
easier to mobilise people to manage a neighbourhood standpipe.

67
4.4.3 Reduction of the feedback systems of rural community-managed schemes
The third mechanism by which the urban context contributed to the breakdown of
participation is the reduction of feedback systems present in rural community-managed
schemes. The GWM scheme‘s management committee was plagued with non-attendance
and non-participation on behalf of its members. In rural community-managed schemes,
three mechanisms work as incentives encouraging the participation of management
committee members because they are also resident in the communities being served.
First, there is the positive reinforcement of vested interest. When committee members are
resident in the communities that they are serving, they have a vested interest in
participating in management decisions to ensure that the scheme operates successfully
because they would be directly benefitting from the fruits of their management and
participation. Second, there is a positive feedback system in the form of community
recognition of committee members by their peers in the community. For example, Sun et
al (2010) found that contrary to standard logic, regular competitive elections are not
needed to make management committees more accountable—community recognition
creates a stronger mechanism for accountability of the management committee. In effect,
committee members are encouraged to participate effectively because of the recognition,
gratitude, prestige, and social standing that successful management may bring, and that
recognition encourages them to continue to perform well. Conversely, the third
mechanism is a negative feedback system of community pressure. Committee members
who are unsuccessfully carrying out their management roles are pressured by their
community peers to perform better and when they are performing successfully, there is
68
less pressure on them. However, these mechanisms will break down if committee
members are not resident in the communities they serve.
In the case of the GWM scheme, members were appointed to the management committee
from outside the community being served, partly because of the ―indigene-stranger‖
dynamic described in Section 4.4.1, and partly because the implications of appointing
people from outside the community on the effectiveness of management were not evident
to the municipal authorities at the time. Appointed members were competent municipal
council members, the council‘s technical adviser, and some prominent inhabitants such as
the chairperson himself, who is a former mayor of Buea and public servant, but it was not
understood that in spite of the appointees‘ overall competence, community management
would risk failure as a result of the breakdown of the feedback mechanisms discussed
above.
4.4.4 The logistical burden of participating in urban communities
Finally, in urban areas, increased distances make it more expensive and time consuming
for committee members, who may reside outside of the community being served, to
commute to meetings. In the case of Buea, regularly commuting from one part of town to
another by car or taxi can be time consuming and costly, so the logistical burden of
attending meetings discourages participation. This point was raised by the chairperson of
the management committee who highlighted that a lack of payment or honorarium for
their ―sacrifices,‖ resulted in committee members defaulting. This issue obviously has to
do with appointing management committee members who are non-residents of the served
69
community because otherwise they would have other incentives or feedbacks, discussed
in the preceding sections, encouraging attendance. Yet this issue is also applicable to the
general case of urban community-managed schemes that cover a large area or where
meetings are held at a distant location. Larger distances between where committee
members reside and where meetings are held, coupled with a lack of remuneration results
in non-attendance at meetings, so appropriate incentives are required in these cases to
ensure that members participate in management committee meetings. Similar to any
design, building redundancy in the mechanisms to encourage participation is useful. This
way, even if the non-financial incentives are not effective, economic incentives or
honorariums still encourage participation and vice-versa.
Therefore, the research has shown that the urban context contributes to the breakdown of
participation on the ―soft,‖ management side of the scheme. These ―soft‖ problems
compound the ―hard‖ problems of the water supply infrastructure itself because they
make the management committee less effective at responding to problems. De Filippis et
al (2006) lament that community participation is sometimes perceived as a ―magic
variable‖ in much of the literature and it is applied blindly in the development world.
However, the experiences from this research show that improved community
participation can address some of the real problems facing urban community-managed
water supply projects. For example, one of the problems cited by the management
committee is the difficulty of maintenance because of frequent vandalism to the network.
The management committee was unable to respond because it did not have the manpower
or capacity to take action. Increased participation of the community on the management
70
committee could (1) encourage cohesive community action against the problem, (2) give
the management committee the manpower needed to control the vandalism, (3) might
also find the cause of the discontent and respond to it, or (4) by improving dialogue might
explain the reason for the lack of service and show that vandalism will not improve the
overall service. Another problem mentioned by the management committee was the
difficulty of operation and maintenance because of a lack of funds and non-payment of
user fees. However, it was clear from the research that users are reluctant to pay because
they are not seeing improvements in water supply. Improved community participation in
the management committee would encourage communication between users and the
committee, allow the management committee to present what they are doing and the costs
incurred, and thus let the community understand how their contributions are spent,
increasing transparency, accountability, and contributing to cost recovery.
4.5 The next step: the potential for financial self-sufficiency and cost recovery
This section presents a brief analysis of community water users‘ preferences and
willingness to pay in order to inform future decisions relating to cost recovery and
financial self-sufficiency. Choice experiments were used to model community water
users‘ preferences.
4.5.1 Barriers to payment
Evans (1992) described the factors influencing willingness to pay for water, which
include both factors related to water supply attributes as well as factors related to the
institutional environment and the users‘ confidence in the system (see Section 2.2). In the
71
case of the GWM scheme, while people were willing to pay for specific attributes of
water supply, they were not willing to contribute funds to the management committee
because they were not always aware of what they were paying fees for, and as suggested
by survey responses, their lack of satisfaction was a barrier to payment of user fees. This
lack of satisfaction was due to the deterioration of the service described in previous
sections coupled with the lack of dialogue between the community and the committee.
Therefore, the scheme entered into a vicious cycle in which the lack of satisfaction led to
defaulting of payment because the committee did not communicate the reasons for the
problems to the users, and because of the lack of funds, the management committee‘s
position further deteriorated as did the scheme.
The GWM scheme set out tariffs for its community water after some consultation with
the community. The main criterion was affordability, since it was felt that the role of
community water in Buea is to provide an alternative source to those for whom
SNEC/CDE water is neither accessible nor affordable. For example, initially the
standpipe rate was 1,000 CFA per household per month but after complaints that it was
not affordable, the GWM scheme decided to charge a flat monthly rate of 500 CFA per
household for standpipe users, in addition to monthly rates of 1,000 CFA per household
for private connections (as well as the one-off connection fee of 180,000 CFA) and 5,000
CFA per hostel (also subject to the same one-off connection fee). After some time, it was
found that stand tap use was difficult to control; hence they stopped charging households
who used stand taps. The rates are relatively low; in comparison, the monthly water bill

72
for a SNEC/CDE individually connected household ranges from 2,000 to 10,000 CFA7
and above per month.
4.5.2 Users’ satisfaction
Section 4.3.2 introduced the notion of the ―sense of ownership‖ and how that was related
to users‘ satisfaction. An aspect of this sense of ownership is the perception that
community water is meeting that user‘s needs and expectations. The results from the
choice experiment summarised in Table 4.6 and Section 4.6 will contribute to this
understanding of what users want from community water. User satisfaction is derived
from the following water supply attributes: treated water is very highly valued by
community water users; constant flow of water and high pressure are also important.
However, the premium on private connections versus stand tap connections is relatively
low, suggesting that there are better ways for the management committee to add value to
the water supply, and consequently warrant increased user fees, than by increasing
private connections. Rather, it appears that users will derive the most satisfaction from
having treated water, in which case conditions would be more amenable to cost recovery
through user fees. Furthermore, the results highlight some significant differences between
male and female preferences which are discussed in Section 4.6.1.
7 Equivalent to about 4 to 21 CAD in 2011
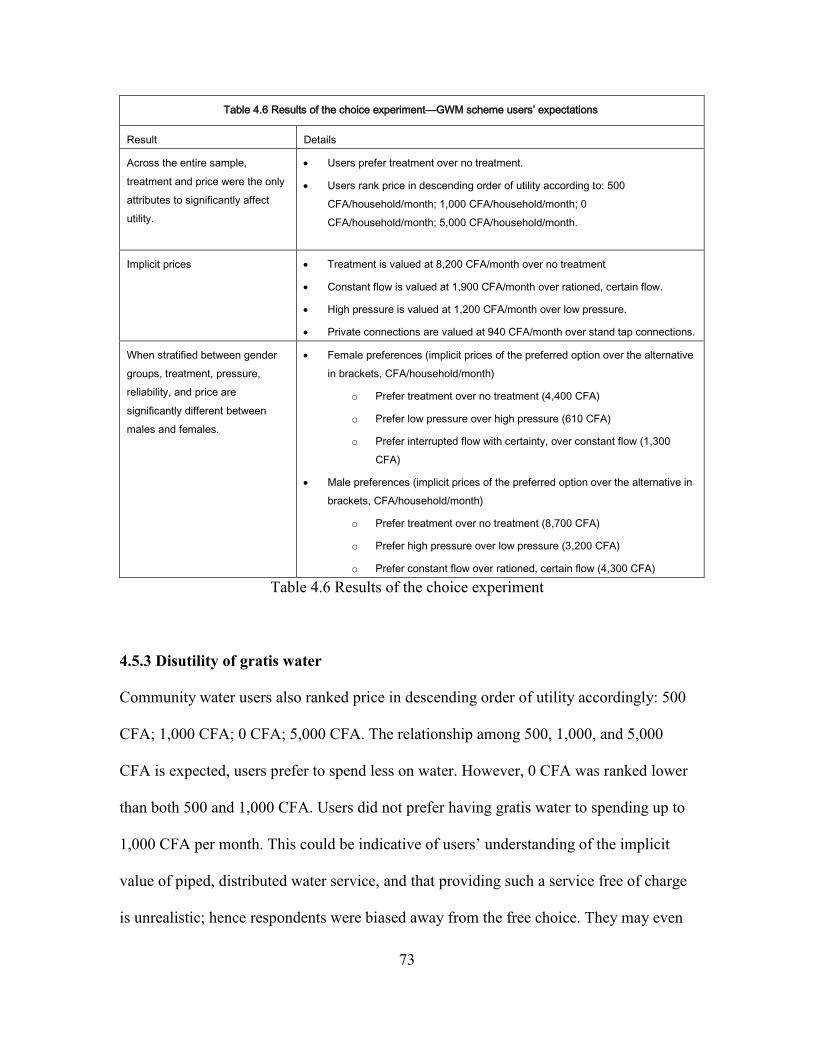
73
Table 4.6 Results of the choice experiment—GWM scheme users’ expectations
Result Details
Across the entire sample,
treatment and price were the only
attributes to significantly affect
utility.
Users prefer treatment over no treatment.
Users rank price in descending order of utility according to: 500
CFA/household/month; 1,000 CFA/household/month; 0
CFA/household/month; 5,000 CFA/household/month.
Implicit prices Treatment is valued at 8,200 CFA/month over no treatment
Constant flow is valued at 1,900 CFA/month over rationed, certain flow.
High pressure is valued at 1,200 CFA/month over low pressure.
Private connections are valued at 940 CFA/month over stand tap connections.
When stratified between gender
groups, treatment, pressure,
reliability, and price are
significantly different between
males and females.
Female preferences (implicit prices of the preferred option over the alternative
in brackets, CFA/household/month)
o Prefer treatment over no treatment (4,400 CFA)
o Prefer low pressure over high pressure (610 CFA)
o Prefer interrupted flow with certainty, over constant flow (1,300
CFA)
Male preferences (implicit prices of the preferred option over the alternative in
brackets, CFA/household/month)
o Prefer treatment over no treatment (8,700 CFA)
o Prefer high pressure over low pressure (3,200 CFA)
o Prefer constant flow over rationed, certain flow (4,300 CFA)
Table 4.6 Results of the choice experiment
4.5.3 Disutility of gratis water
Community water users also ranked price in descending order of utility accordingly: 500
CFA; 1,000 CFA; 0 CFA; 5,000 CFA. The relationship among 500, 1,000, and 5,000
CFA is expected, users prefer to spend less on water. However, 0 CFA was ranked lower
than both 500 and 1,000 CFA. Users did not prefer having gratis water to spending up to
1,000 CFA per month. This could be indicative of users‘ understanding of the implicit
value of piped, distributed water service, and that providing such a service free of charge
is unrealistic; hence respondents were biased away from the free choice. They may even
74
have been associating unpaid-for piped water with negative connotations. All this seems
to suggest that piped community water has a nonzero economic value to users. Hence, in
order to start cost recovery, it would appear that sensitization and education about the
value of piped community water and why it is important to pay for it plays a less
important role than simply assuring people that they will be guaranteed a reliable treated
water service if they pay.
4.6 Meeting the needs of users and designing appropriate policy
4.6.1 Importance of inclusive participation of women
Returning to Table 4.6, across the entire sample, treatment and price were the only
attributes that significantly affected users‘ utility. Therefore, the model suggests that
users prefer treatment over no treatment. This behaviour is to be expected, since
treatment adds value to a water supply system. However, it was surprising that of the
water supply attributes treatment, pressure, reliability, and level of service, only treatment
was significant, because previous studies from Buea (Meaney 2008) had suggested that
pressure, water quality, and reliability were all attributes requiring urgent action.
However, when evaluated for each gender group, pressure and reliability become
significant. This suggests that for community water users as a whole, treatment is the
only significant attribute. However, if community water were going to be designed
differently for women than for men, then pressure and reliability could be tailored to their
specific preferences.
Interestingly, whereas males tended to demonstrate strong preferences for the expected
options, preferring treatment, higher pressure, and constant flow, women‘s choices were
75
more unexpected. While the preference for treatment was expected, females also slightly
favoured low pressure and interrupted yet reliable flow. One wonders why, all other
things being equal, when given the choice between low and high pressure, or between
interrupted and constant flow, female community water users would tend to pick the
option associated with a lower service level. Furthermore, the relative strength of
females‘ preference for treatment is such that the implicit price for treatment
improvements is nearly four times that of the next highest implicit price. In contrast,
men‘s implicit price for treatment is only about two times that of the next highest implicit
price. It would seem to underline the point, though, that for female community water
users, improvements in pressure and reliability are not as important as improvements in
treatment are.
This finding could be explained as follows. Given the important role of women in water
management in Buea discussed in Section 4.1, one could assume that women in Buea
know more about water than men and therefore can make more nuanced, informed
decisions about water. This would seem to suggest that in answering the choice surveys,
men answered stereotypically by preferring the higher service levels, whereas women
made more nuanced choices, so their tradeoffs emphasised the realities of the situation.
The realities of water collecting in the neighbourhood served by the GWM scheme,
which women are more familiar with, are such that needs for access and convenience can
be met by the several alternative sources in the neighbourhood such as stream, spring,
and rainwater. Therefore, in the opinion of female community water users, if a proposed
community water project were to add any value to water supply in the neighborhood, it

76
would be through the provision of treated water. Hence, women tend to strongly prefer
treatment improvements as opposed to other service improvements in community water
because in terms of access and convenience, their needs for untreated water can be met
elsewhere.
Women also preferred the option of having scheduled intermittent flow for which it is
known with certainty when it flows as opposed to having continuous flow. Similarly, this
choice could have to do with the abundance of alternative sources of untreated water. A
possible explanation is that women‘s choices were biased towards the more realistic and
more immediately implementable scenario of scheduled, certain, intermittent flow. Any
improvements towards continuous flow for the entire network would require a significant
improvement in the engineering of the scheme, which would take more time and financial
investments than is required by the scheduling scenario. The scheduling scenario could
theoretically be implemented more immediately using the quantity of water that is
currently available and with a smaller economic requirement, only requiring the
additional manpower to make the system work. Women could be deriving utility from the
fact that scheduled flow could be implemented sooner than continuous flow, thus
providing them with the treated water option sooner rather than later. The fact that this
water would be scheduled does not bother them because again, to satisfy the need for
convenience they have access to alternative sources of untreated water, and the smaller
volumes of treated water required for cooking and drinking can be obtained easily from a
scheduled intermittent system.
77
It was found that women and men had different expectations of community-managed
water. The conclusion that can be drawn from the findings in the previous paragraphs is
that participation of both men and women in the planning and management of
community-run water is important because cross-gender, inclusive discussions of water
management can yield appropriate water solutions and help to meet users‘ expectations
and hence improve their satisfaction.
4.6.2 Importance of treated water
However, the conclusions drawn above do not mean that the GWM scheme can go ahead
and provide the community with safe, treated water that only flows once a month in a
trickle. Fundamentally, all the choice sets were designed with the implicit assumption
that in all the hypothetical situations, the community scheme is providing water. What the
choice sets compared was users‘ relative valuation of improvements to individual
attributes of a basic functioning scheme. That is to say, that users want a community
water supply system that is functioning, supplying water, but that whether it is accessed
via a private connection seconds away or a stand tap minutes or several hundreds of
meters away is of very little importance. Furthermore, whether the water is flowing out
slowly or bursting out of the tap, and whether users always have access to it or only at
predetermined, regular times are also not so important. But if users were to design their
scheme with one improved supply attribute in addition to a basic functioning scheme, it
would be that the water is treated.
78
Based on their choices, community water users therefore seem to be acutely aware of the
health hazards of drinking untreated water, and are placing a premium on having safe
water. Urban community water users are more concerned with obtaining safe water from
their community pipes rather than how easy it is to obtain. This fits in well with the
context of the scheme—as was discussed in an earlier section, community water users
have access to several alternative sources including a stream, spring, and rainwater. Thus,
for the commodity of untreated water, they are relatively spoilt for choice, year-round.
However, for the commodity of treated water, which is increasingly valuable as the
health implications of untreated water are beginning to be understood, they have very few
choices in their neighbourhood, so if they are going to use community water, it will have
to provide significant added value, and supplying treated water does just that.
4.7 A role for PAR methodology in community water action in Buea
The methodology for this research was partly inspired by Participatory Action Research
(PAR) methodology. First, as is typical of the community participation in PAR, the
formulation of the research topic was strongly influenced by initial meetings and
interviews with the management committee that highlighted the areas of most concern to
the GWM scheme. This enabled the author to make his research more relevant to the
context and to try to fulfill a real, self-felt need of the water supply scheme. Similar
research projects should be carried out in the future with this participatory aspect in mind,
as these types of applied research projects can be beneficial both to the researcher and the
subjects in developing countries. PAR is also well suited to empowering the subjects to
take ownership of their problems, shaping the research and then shaping the solutions.
79
One of the most valuable aspects of PAR methodology in this context was the direct
dissemination of preliminary research findings to the stakeholders. After the main data
collection and interviews had been completed, the author returned to the management
committee of the GWM scheme and presented his initial findings to the chairperson.
Based on the discussion that ensued, the chairperson decided to call a meeting of the
water management committee and to invite residents from the community to attend. This
simple sequence of events highlights the power of the PAR methodology in
disseminating results, promoting action, and empowering participants. The subsequent
water management committee meeting stimulated dialogue and discussion among
community residents and the chairperson and mapped the first steps towards
improvements for the future. It was decided, based on the discussions, to emphasise
source protection and treatment of water, to pursue action to solicit contributions from the
community for extension and improvement of the network, to research appropriate user
fees based on the experiences of other functioning community water supply schemes in
the region, and to write a letter appealing to the mayor to revamp the management
committee (summary in Appendix I).

80
5. Conclusions: the consequences of urbanization on community-managed
water supply and the way forward
5.1 Summary
The partnership between Helvetas Cameroon, the local community of the Great Soppo,
Wokoko, Molyko community water supply (GWM) scheme, the local council, and local
NGOs is fairly typical of community development projects. One of the roles that
international development agencies such as Helvetas fulfill in such a partnership is that of
the project consultant, using its decades of experience with community development
projects in the country to set out best practices and lay the foundation for sustainability.
However, a new context is rapidly emerging as many formerly rural and peri-urban areas
are urbanizing. In this context, which needs to be recognized by the international
community, community management structures are expected to function in urban settings
and the traditional community management structures are in many ways directly at odds
with the realities of urban areas. This thesis presented the findings from a case study and
it would be useful to examine similar cases in other areas to determine if these results can
be generalised to a wider context of small urban community management. The
mechanisms through which participation breaks down in an urban setting may be
particular to the context of Buea, which experienced fast population growth of
―strangers‖ due to the creation of the university, and indeed participation may not
necessarily be undermined in the same way in other community managed projects in
urbanising regions, particularly those with more homogeneous populations, but it is safe
to say that the challenges faced by urban community-managed water supply projects in
developing countries are different to those faced by rural projects. The recommendations
81
from the GWM scheme‘s case are in accordance with some of the other research in this
field. While the GWM scheme in Buea and the partnerships that led to its implementation
has its particularities, there are lessons that can be generalised from this context. In
particular, it highlighted the importance of a permanent presence from supporting
agencies and NGOs, who would provide post construction technical support, and the
presence of an entity in local councils or national institutions that would monitor
participatory processes in order to ensure that the sustainability of these schemes is not
undermined by the urban context.
5.2 Adapting the “hard” side: project planning and technical support
It was shown in the GWM scheme that the rapid population growth that is characteristic
of an urbanising region undermined the original project plans, and contributed to the
breakdown of the participatory model. First, community development projects, especially
in the case of the GWM scheme being limited in the access to sustained external technical
support, and having limited financial and managerial capacity, are not well-equipped to
deal with the increased planning and management pressures brought about by
urbanisation. This research and case study have shown that some modifications are
needed in order to keep community-managed schemes relevant in the urban context;
Kleemeier (2000), Whittington et al (2009) and Sun et al (2010) showed that forms of
post-construction support and technical assistance are necessary for the sustainability of
community schemes. Sun et al (2010) demonstrate that this could involve an institution
resembling the independent Community Water and Sanitation Agency that successfully
provides support to community water and sanitation committees (WATSANs) in Ghana.

82
NGO‘s should play a larger role in post-construction technical support and continue to
work closely after implementation with the urban projects that they establish.
The various local NGO‘s that are involved in community water supply projects in the
region are the legacy of valuable investments and contributions towards building local
capacity made by international development agencies such as Helvetas Cameroon. For
example, the NGO (Organisation for Rural Engineering and Environmental Development
OREEDEV) that was responsible for the Great-Soppo Bonduma proposal that was
described in Section 4.4.1 is made up of graduates from a technical school (SATA BTC
in Kumba, Southwest Region) that was implemented by Helvetas Cameroon to build the
capacity of local technicians and engineers to carry out local rural community
development projects. However, the unfortunate finding of this research is that this
technical capacity, while it may have been well suited to small rural development
projects, is not yet adapted to the changing environment of community-managed
development projects that are increasingly being implemented in urban settings.
The more complicated management decisions in urban settings require that management
committees have access to more technical support and capacity throughout the life of the
project that allows them to make more informed decisions when faced with urban
planning challenges, and urban community-managed projects should be subject to more
rigorous planning. For example, more sound population projections and assessment of
source capacity are important inputs to the planning stage of urban community-managed
83
schemes, since these schemes are subject to more variable conditions than those
experienced by rural schemes throughout their life.
5.3 Adapting the “soft” side: political and institutional support for participation
It was also shown how the particularities of the urban context contributed to the
breakdown of the GWM scheme‘s participatory mechanisms. It was shown by Kleemeier
(2000) that the standard participatory model is well suited to small rural schemes.
However, this research and case study have shown that in the urban context, the standard
participatory model needs more robust political and institutional support to ensure
participation because of increased tribal diversity, reduced community mobilisation,
reduced feedback from community pressures and community recognition, and increased
logistical difficulties of participation. Management committees of urban community-
managed water supply schemes (1) need to understand the importance of community
participation for the success and sustainability of the scheme, and (2) they need to be
given the political authority and independence to make changes in their structure and
membership to account for demographic changes to the urban communities which they
manage.
Furthermore, the main issue that was troubling the water management committee was the
shortage of funds to carry out operation and maintenance on the scheme. It was found
that many of the barriers to payment of user fees were related to lack of community
involvement in the management committee and the associated lack of accountability of
the management committee‘s operations and expenses. Additionally, this research
84
produced results that could help improve the design of community water user fees and
service levels in Buea. Choice modelling revealed that access to safe water was the
attribute of community water that users found most important to have. Community water
in Buea should provide safe water, that does not necessarily flow continuously and that
does not necessarily flow at high pressure. The research also suggests that there is a high
willingness to pay for an appropriate system with these characteristics. Therefore,
fulfilling users‘ expectations of community water and fostering a sense of ownership,
involvement, and community participation suggests a promising way forward for the
financial sustainability of the GWM scheme.
5.4 The future
Future work could apply a similar methodology to other urban community-managed
projects in other parts of Africa and the developing world to analyse their sustainability
challenges. To begin with, a similar analysis of neighbouring urban community-managed
water projects in other parts of Buea may yield interesting comparisons of projects that
are carried out under the same local governance and institutional arrangements. On a
wider level, more assessments need to be carried out on the technical and operational
challenges facing community-managed projects that have been implemented in urban
regions of Africa—a notable example of which is the Community Water Supply and
Sanitation Programme (CWSSP) in Dar Es Salaam, Tanzania—and in other parts of the
world. Dar Es Salaam, where the institutional support for community management is
relatively well-developed, could provide an interesting example of the effects of
providing adequate support to community projects but may also highlight new areas of
85
support that could still be improved even where the institutional support and capacity is
stronger.
The reality is that community-managed projects are usually implemented in developing
areas where the small scope of the projects allow for quick solutions to urgent water
supply problems, and can be implemented by NGO‘s and communities with limited
capacity and resources. However, it would also be interesting to see what kind of
challenges would be faced by similar small urban community-managed projects in
developed countries. For example, in remote First Nations communities of Canada where
community-style management of natural resources and especially water has been
implemented, the stakes may be different owing to different cultural contexts, but perhaps
the same fundamental challenges of ensuring adequate technical support would still be
present. Lessons could be learned from community-management successes. However, the
importance of this area of research for the developing world must be reiterated. As
mentioned earlier, developing urban areas are today facing some of the highest
population growth rates, and the concurrent growth in water services needed could be met
effectively with well-implemented community management. Similar work should be
done in other developing regions to assess the sustainability challenges of community-
managed water supply in the urban context to try to establish an accessible body of
knowledge on the subject and to build a consensus on the way forward for community
management.
86
References
Adamowicz, W., Boxall, P., Williams, M., & Louviere, J. (1998). Stated preference
approaches for measuring passive use values: choice experiments and contingent
valuation. Amer. J. Agr. Econ. , 80(1), 64-75.
Akoh, A. L. (2009). A physico-chemical and microbiological analysis of some drinking
water sources in Buea, Southwest Region of Cameroon. University of Buea, Buea.
Anand, P. B. (2006). Millennium Development Goal 7: An Assessment of Progress With
Respect to Water and Sanitation: Legacy, Synergy, Complacency or Policy? World
Institute for Development Economic Research (UNU-WIDER), Working Papers:
RP2006/01.
Bakker, K. (2008). The ambiguity of community: debating alternatives to private-sector
provision of urban water supply. Water Alternatives, 1(2), 236-252.
Brundtland et al. (1987). Report of the World Commission on Environment and
Development: "Our Common Future". New York: United Nations.
Budds, J., & McGranahan, G. (2003). Are the debates on water privatization missing the
point? Experiences from Africa, Asia and Latin America. Environment &
Urbanization, 15(2), 87-113.
Carter, R. C., Tyrrel, S. F., & Howsam, P. (1999). Impact and Sustainability of
Community Water Supply and Sanitation Programmes in Developing Countries.
Journal of the Chartered Institution of Water and Environmental Management, 13,
292-296.
87
Castro, V., Msuya, N., & Makoye, C. (2009). Sustainable community management of
urban water and sanitation schemes (a training manual). In Water and Sanitation
Program - Africa World Bank (Ed.). Nairobi: Dar es Salaam Water and Sewerage
Authority.
Chipeta, L. (2009). The water crisis in Blantyre City and its impact on women: the cases
of Mabyani and Ntopwa, Malawi. Journal of International Women's Studies, 10(4),
17-33.
CIA. (2009). Cameroon. The World Factbook. Retrieved 12 July, 2009, from
https://www.cia.gov/library/publications/the-world-factbook/geos/cm.html
Cox, I. (2009, 8 October 2009). Developing Products and Services People Want to Buy:
Using choice models to refine attributes and determine price elasticity. JMP
Germany User Forum, from
http://www.sas.com/offices/europe/germany/events/jmp_2009/cox2.pdf
De Carvalho, S., Carden, K., & Armitage, N. (2009). Application of a sustainability index
for integrated water management in Southern African cities: Case Study
comparison--Maputo and Hermanus. Water SA, 35(2), 144-151.
Evans, P. (1992) Paying the piper: an overview of community financing of water and
sanitation. Occasional paper series / IRC; no. 18. The Hague, Netherlands: IRC
International Water and Sanitation Centre.
Faysse, N. (2006). Troubles on the way: An analysis of the challenges faced by multi-
stakeholder platforms. Natural Resources Forum, 30, 219-229.
Folifac, F. (2009). Personal communication (PhD Candidate, School of Urban Planning,
McGill University). Montreal.
88
Fonjong, L., Ngwa, E., & Charles, F. (2005). Rethinking the contribution of indigenous
management in small-scale water provision among selected rural communities in
Cameroon. Environment, Development and Sustainability, 6, 429-451.
Fraser, P. J., Hall, J. B., & Healey, J. R. (1998). Climate of the Mount Cameroon Region:
long and medium term rainfall, temperature and sunshine data. (No. School of
Agricultural and Forest Sciences Publication Number 16): University of Wales,
Bangor; Mount Cameroon Project and Cameroon Development Corporation.
Gasson, B. (2003). Conceptualising the ecologically sustainable city: Frameworks and a
case study. Paper presented at the Green Cities Sustainable Cities Congress and
40th Congress of the Institute of Environment and Recreation Management (IERM)
(Africa), Midrand.
Gaye, M., & Diallo, F. (1997). Community participation in the management of the urban
environment in Rufisque (Senegal). Environment & Urbanization, 9(1), 9-30.
Gleick, P. H. (1996). Basic Water Requirements for Human Activities: Meeting Basic
Needs. Water International, 21(2), 83-92.
Gleick, P. (2003). Global Freshwater Resources: Soft-Path Solutions for the 21st Century.
Science, 302, 1524-1527.
Gaye, M., & Diallo, F. (1997). Community participation in the management of the urban
environment in Rufisque (Senegal). Environment & Urbanization, 9(1), 9-30.
Hanley, N., Wright, R. E., & Adamowicz, W. (1998). Using Choice Experiments to
Value the Environment. Environmental and Resource Economics, 11(3-4), 413-
428.

89
Harvey, P. A., & Reed, R. A. (2007). Community-managed water supplies in Africa:
sustainable or dispensable? Community Development Journal, 42(3), 365-378.
Helvetas. (2002). Strategy 2003-2007 for the Helvetas Working Area Infrastructure in
Rural Areas. Zurich: Helvetas.
Helvetas Cameroon. (2006). Supported Projects by Helvetas 1964-2006, Infrastructure
and Natural Resource Management, without capacity building events. Bamenda:
Helvetas Cameroon.
Helvetas Cameroon. Tool 1.2: Model contract between Helvetas and council: agreement
of cooperation. In Programme for Sustainable Water Supply and Sanitation
Services (Ed.). Bamenda.
Helvetas Cameroon. (2007). What is Helvetas leaving behind in Cameroon: A tool for
monitoring sustainability of Helvetas interventions in 4 councils in the NW
Province. Bamenda: Helvetas Cameroon.
Hensher, D., Shore, N., & Train, K. (2005). Households' willingness to pay for water
service attributes. Environmental and Resource Economics, 32, 509-531.
Hensher, D., Stopher, P. R., & Louviere, J. (2001). An exploratory analysis of the effect
of numbers of choice sets in designed choice experiments: an airline choice
application. Journal of Air Transport Management, 7, 373-379.
Huber, J., & Zwerina, K. (1996). The Importance of Utility Balance in Efficient Choice
Designs. Journal of Marketing Research, 32(August 1996), 307-317.
Hutton, G., Haller, L., & Bartram, J. (2007). Global cost-benefit analysis of water supply
and sanitation interventions. [Article]. Journal of Water & Health, 5(4), 481-502.
90
IMF International Monetary Fund. (2000). IMF Concludes Article IV Consultation with
Cameroon. Public Information Notice (PIN) No. 00/42 Retrieved 6 June 2011,
from http://www.imf.org/external/np/sec/pn/2000/pn0042.htm
Kaliba, A. R. M. (2002). Participatory evaluation of community-based water and
sanitation programs: the case of Central Tanzania. Kansas State University,
Manhattan, Kansas.
Kapoor, D., & Jordan, S. (Eds.). (2009). Education, Participatory Action Research, and
Social Change: International Perspectives. New York, USA: Palgrave Macmillan.
Kleemeier, E. (2000). The Impact of Participation on Sustainability: An Analysis of the
Malawi Rural Piped Scheme Program. World Development, 28(5), 929-944.
Kuhfeld, W. F., Tobias, R. D., & Garratt, M. (1994). Efficient Experimental Design with
Marketing Research Applications. Journal of Marketing Research, 331(November
1994), 545-557.
Kyessi, A. G. (2005). Community-based urban water management in fringe
neighbourhoods: the case of Dar es Salaam, Tanzania. Habitat International, 29(1),
1-25.
Lammerink, M. P. (1998). Community managed rural water supply: experiences from
participatory action research in Kenya, Cameroon, Nepal, Pakistan, Guatemala and
Colombia. Community Development Journal, 33(4), 342-352.
Lee, E. J., & Schwab, K. J. (2005). Deficiencies in drinking water distribution systems.
Journal of Water and Health, 3(2), 109-127.
91
Leermakers, M. (2000). 25 steps to safe water and sanitation. In M. H. Helvetas
Switzerland (Esther Oettli (Ed.), Experience and Learning in International
Cooperation - Helvetas Publications. Zurich: Helvetas.
Mack, N., Woodsong, C., MacQueen, K. M., Guest, G., & Namey, E. (2005). Module 1:
Qualitative Research Methods Overview Qualitative Research Methods: A Data
Collector's Field Guide. Research Triangle Park: Family Health International.
Meaney, K. (2008). Results from a household survey on municipal water supply in Buea,
Cameroon. Submitted to McGill University for BREE 671 (Bioresource
Engineering Project 1).
Montgomery, M. R. (2008). The Urban Transformation of the Developing World.
Science, 319(5864), 761-764.
Muyibi, S. (1992). Planning Water Supply and Sanitation Projects in Developing
Countries. Journal of Water Resources Planning and Management, 118(4), 351-
355.
Narayan, D. (1995) The contribution of people's participation: evidence from 121 rural
water supply projects. Environmentally sustainable development occasional paper
series; no.1. Washington D.C., USA: The World Bank.
Njoh, A. J. (2002). Barriers to community participation in development planning: lessons
from the Mutengene (Cameroon) self-help water project. Community Development
Journal, 37(3), 233-248.
Njoh, A. J. (2006). Determinants of success in community self-help projects.
International Development Planning Review, 28(3), 381-406.
92
Njoh, A. J. (2003a). Self-help water supply in Cameroon: lessons on community
participation in public works projects. Lewiston, New York: The Edwin Mellen
Press.
Njoh, A. J. (2003b). The role of community participation in public works projects in
LDCs: The case of the Bonadikombo, Limbe (Cameroon) self-help water supply
project. International Development Planning Review, 25(1), 85-103.
Paul, S. (1987) Community participation in development projects. World Bank discussion
papers; 6. Washington, DC: The World Bank.
Republique du Cameroun. Contrat d'affermage du service public de la production et de
la distribution d’eau potable dans les centres urbains et periurbains du Cameroun.
Republique du Cameroun. (2006). Annuaire Statistique du Cameroun Institut National de
la Statistique.
Rondinelli, D. A. (1991). Decentralizing water supply services in developing countries:
factors affecting the success of community management. Public Administration and
Development, 11, 415-430.
Sally, M. Z., Folifac, F., & Gaskin, S. (2009). Analysing the performance of the
standpipe water distribution network in Buea, Cameroon through a field survey.
McGill University ([email protected]).
Satterthwaite, D., & Mitlin, D. (2005). Community-driven development for water and
sanitation in urban areas : its contribution to meeting the Millennium Development
Goal targets: International institute for environment and development (IIED).
Human settlements programme : with WSSCC.
93
Spencer, J. H., Meng, B., Nguyen, H., & Guzinsky, C. (2008). Innovations in Local
Governance: Meeting Millennium Development Goal Number 7 in Southeast Asia.
Development, 51(2), 245-251.
Sun, Y., Asante, F., & Birner, R. (2010) Opportunities and Challenges of Community-
Based Rural Drinking Water Supplies. IFPRI Discussion Paper 01026:
International Food Policy Research Institute IFPRI.
United Nations. (2010). The Millennium Development Goals Report 2010. New York:
United Nations Department of Economic and Social Affairs.
Valentin, A., & Spangenberg, J. H. (2000). A guide to community sustainability
indicators. Environ. Impact Assess., 20, 381-392.
Van der Waarde, J., & Ischer, M. (2007). 45 Years Helvetas Cameroon: a history.
Bamenda: Helvetas Cameroon.
Virjee, K. (2006). Willingness to pay for change: The use of Contingent Valuation and
Choice Experiments in the Trinidad and Tobago Water Services Sector. McGill
University, Montreal.
WELL Water and Environmental Health at Loughborough and London (1998). Guidance
manual on water supply and sanitation programmes. London: WEDC for DFID.
Whittington, D., Davis, J., Prokopy, L., Komives, K., Thorsten, R., Lukacs, H., et al.
(2009). How well is the demand-driven, community management model for rural
water supply systems doing? Evidence from Bolivia, Peru and Ghana. Water
Policy, 11, 696-718.
Yacoob, M., & Walker, J. (1991). Community management in water supply and
sanitation project: costs and implications. J. Water SRT-Agua, 40, 30-34.
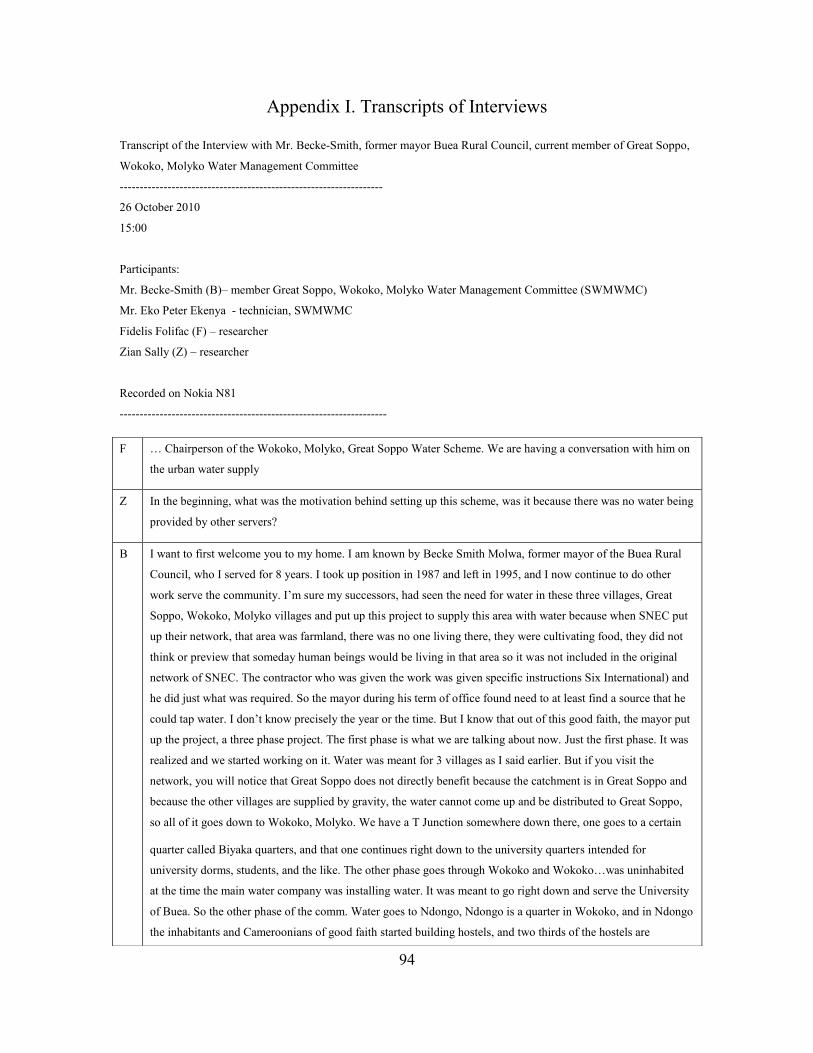
94
Appendix I. Transcripts of Interviews
Transcript of the Interview with Mr. Becke-Smith, former mayor Buea Rural Council, current member of Great Soppo,
Wokoko, Molyko Water Management Committee
------------------------------------------------------------------
26 October 2010
15:00
Participants:
Mr. Becke-Smith (B)– member Great Soppo, Wokoko, Molyko Water Management Committee (SWMWMC)
Mr. Eko Peter Ekenya - technician, SWMWMC
Fidelis Folifac (F) – researcher
Zian Sally (Z) – researcher
Recorded on Nokia N81
-------------------------------------------------------------------
F … Chairperson of the Wokoko, Molyko, Great Soppo Water Scheme. We are having a conversation with him on
the urban water supply
Z In the beginning, what was the motivation behind setting up this scheme, was it because there was no water being
provided by other servers?
B I want to first welcome you to my home. I am known by Becke Smith Molwa, former mayor of the Buea Rural
Council, who I served for 8 years. I took up position in 1987 and left in 1995, and I now continue to do other
work serve the community. I‘m sure my successors, had seen the need for water in these three villages, Great
Soppo, Wokoko, Molyko villages and put up this project to supply this area with water because when SNEC put
up their network, that area was farmland, there was no one living there, they were cultivating food, they did not
think or preview that someday human beings would be living in that area so it was not included in the original
network of SNEC. The contractor who was given the work was given specific instructions Six International) and
he did just what was required. So the mayor during his term of office found need to at least find a source that he
could tap water. I don‘t know precisely the year or the time. But I know that out of this good faith, the mayor put
up the project, a three phase project. The first phase is what we are talking about now. Just the first phase. It was
realized and we started working on it. Water was meant for 3 villages as I said earlier. But if you visit the
network, you will notice that Great Soppo does not directly benefit because the catchment is in Great Soppo and
because the other villages are supplied by gravity, the water cannot come up and be distributed to Great Soppo,
so all of it goes down to Wokoko, Molyko. We have a T Junction somewhere down there, one goes to a certain
quarter called Biyaka quarters, and that one continues right down to the university quarters intended for
university dorms, students, and the like. The other phase goes through Wokoko and Wokoko…was uninhabited
at the time the main water company was installing water. It was meant to go right down and serve the University
of Buea. So the other phase of the comm. Water goes to Ndongo, Ndongo is a quarter in Wokoko, and in Ndongo
the inhabitants and Cameroonians of good faith started building hostels, and two thirds of the hostels are

95
accommodating university students. They are some of the inhabitants, so this community water is very very
useful down there
Z But the water is always flowing?
B We have always tried to ensure that there is water in these pipes. But I will say that the demand is more than the
supply now
Z Even from your source here?
B Yes, even from our source the demand is more than supply. But the irony is that if I take you to our supply tank,
you will find water wasting and the men they want water? Because the distribution has not been improved. At the
time they were projecting for this water supply, the community down there has more than doubled, because each
year UB intake is 1000s and in five years, multiply that by 5000, it has increased by 25000 more than previewed
population, yet this project has not been revamped. The pipes are still the same size, the catchment is the same,
but demand is so much. The distribution means is our problem there. We don‘t have the means
Z But people who are connected through individual connections?
B The initial concept was only to supply public standpipes. But as time went on, there was a need to supply to
hostels. Some hostels are upstairs, and you need a lot of pressure. Some of the people in community also saw the
need for water in their homes. The past many years have suffered a lot of vandalism who break the pipes, do all
sorts of things to the water, it is sometimes wasted in the bushes. We don‘t have the means to carry out security
checks, but we have done our part, informed the police, but we have never heard that someone has been caught
for vandalizing the pipes. So maintenance has been our greatest challenge.
Z Are people making their own connections to the pipes, on their own terms? Do they consult with the committee
B They do it, we have our own plumbers. But it is not possible to always check the pipe to control clandestine
connections. We do it, and disconnect them. But our own duty is to ensure that there is water in the pipes every
day.
Z How? Monitoring?
B Yes, we do that. We don‘t have budget, this is one of our problems. This is Buea Rural Council project, when
they gave it to us, it was a challenge to see what we could do. We held meetings with beneficiaries, and came up
with decisions which they do not honour. I tried my best with my executive and beneficiaries. We had an office
[in Molyko] a meeting hall, one office, we employed a secretary, we sent out bills, like a company, collected
money to pay workers, maintain line. At one point, consumers disappointed us. Not able to pay rent, pay
secretary, unable to pay regularly, and pushed out of office, so now operate here in my house. Ledger here has a
long list of consumers who are not willing to pay. That‘s our greatest problem. But we have tried as much as we
can to ensure water in pipes
Z When you say pay, what do you mean? Regular payment, or when there are problems
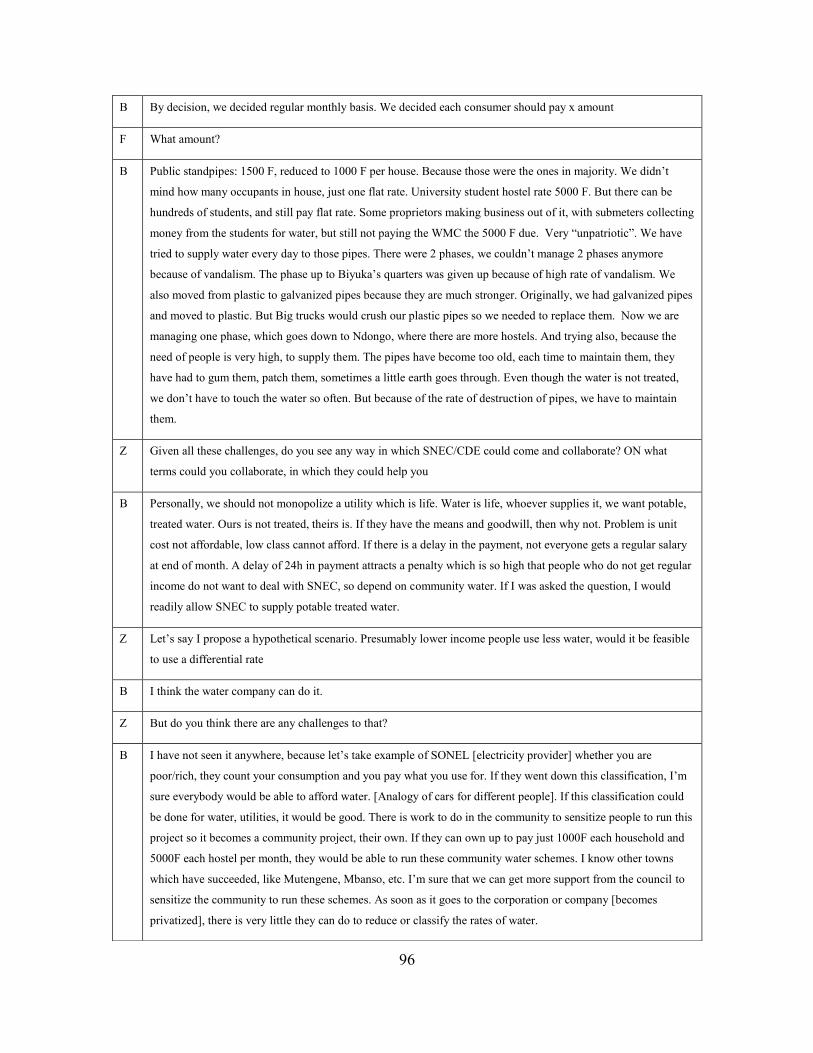
96
B By decision, we decided regular monthly basis. We decided each consumer should pay x amount
F What amount?
B Public standpipes: 1500 F, reduced to 1000 F per house. Because those were the ones in majority. We didn‘t
mind how many occupants in house, just one flat rate. University student hostel rate 5000 F. But there can be
hundreds of students, and still pay flat rate. Some proprietors making business out of it, with submeters collecting
money from the students for water, but still not paying the WMC the 5000 F due. Very ―unpatriotic‖. We have
tried to supply water every day to those pipes. There were 2 phases, we couldn‘t manage 2 phases anymore
because of vandalism. The phase up to Biyuka‘s quarters was given up because of high rate of vandalism. We
also moved from plastic to galvanized pipes because they are much stronger. Originally, we had galvanized pipes
and moved to plastic. But Big trucks would crush our plastic pipes so we needed to replace them. Now we are
managing one phase, which goes down to Ndongo, where there are more hostels. And trying also, because the
need of people is very high, to supply them. The pipes have become too old, each time to maintain them, they
have had to gum them, patch them, sometimes a little earth goes through. Even though the water is not treated,
we don‘t have to touch the water so often. But because of the rate of destruction of pipes, we have to maintain
them.
Z Given all these challenges, do you see any way in which SNEC/CDE could come and collaborate? ON what
terms could you collaborate, in which they could help you
B Personally, we should not monopolize a utility which is life. Water is life, whoever supplies it, we want potable,
treated water. Ours is not treated, theirs is. If they have the means and goodwill, then why not. Problem is unit
cost not affordable, low class cannot afford. If there is a delay in the payment, not everyone gets a regular salary
at end of month. A delay of 24h in payment attracts a penalty which is so high that people who do not get regular
income do not want to deal with SNEC, so depend on community water. If I was asked the question, I would
readily allow SNEC to supply potable treated water.
Z Let‘s say I propose a hypothetical scenario. Presumably lower income people use less water, would it be feasible
to use a differential rate
B I think the water company can do it.
Z But do you think there are any challenges to that?
B I have not seen it anywhere, because let‘s take example of SONEL [electricity provider] whether you are
poor/rich, they count your consumption and you pay what you use for. If they went down this classification, I‘m
sure everybody would be able to afford water. [Analogy of cars for different people]. If this classification could
be done for water, utilities, it would be good. There is work to do in the community to sensitize people to run this
project so it becomes a community project, their own. If they can own up to pay just 1000F each household and
5000F each hostel per month, they would be able to run these community water schemes. I know other towns
which have succeeded, like Mutengene, Mbanso, etc. I‘m sure that we can get more support from the council to
sensitize the community to run these schemes. As soon as it goes to the corporation or company [becomes
privatized], there is very little they can do to reduce or classify the rates of water.
97
Z Why people so unwilling to pay?
B Bad will. Because the water is there, it is free. Because it is Buea Rural Council water, it is free. We have told
them that there is nothing free, because it has been harnessed. IF it was running like an ordinary stream, it could
be free. But it has been harnessed to a catchment and pipes. With support from British taxpayers, Netherlands
specialists, community also contributed with labour to set up the schemes.
F I want to ask you specific questions to the project. How many households are connected to the project?
B Attempted, with the ledger, to identify this. 2007: 151 people. 2008: less than 100. But all in all, if we make that
census, it will be in the hundreds of people. At the time they were putting up the project, they were not as big.
Now, far more than 500 down there at university. There are many hostels that use the community water….. They
get connected with the WMC permission, with applications.
Z But there is no way to control whether they pay or not?
B We are trying, but that is the challenge. If they default, we disconnect them. But it is very risky, university
students can rise up. They know the worker so well, one time, I received a phone call because they had taken him
hostage. Give us water now or you don‘t go. They refused to send a delegate to talk to us, all of them wanted to
talk to us [at once]. They finally sent a delegation. The hostel proprietors were not there. They are the ones who
take money from them [the students] that‘s why it was difficult to manage that. If we had sufficient distribution
means, we would be able to satisfy the needs.
F I see the potential for self-financing of the system through the hostels. At that meeting at the chief‘s palace, I
noticed that some key stakeholders were not present. Who are some of the key players to the system that need to
be brought to the table to revamp this project?
B The community of Wokoko, Molyko, Great Soppo, the university community or family, and the council. If they
want to privatise the project, whoever will take this business will improve it and make money. It will be like a
water company here. If SNEC takes the system, they will improve the system because the water is there all the
time. ….The source is in Great Soppo… even though they are not benefiting or supplied. But the second phase,
and the third maybe, if it was realized, would have been to pump water up to a tank in the highest points in Great
Soppo (Baptist College) and distribute. Would not use SONEL, too expensive, but it was proposed to use solar
energy, use booster pumps to a supply tank and distribute by gravity to anywhere. The centrifugal pumps at the
supply points would always wear out always had to be replaced. It was gas powered, but people were unwilling
to pay 200 F a month to keep the gas pump running, even though they were willing to pay 300 F per day on a
beer. As mayor, we replaced them with electricity
F ….Who is responsible, who has the authority to invite stakeholders?
B The mayor.
F Why
B Because Helvetas [Swiss development agency] set up the project, technical facility, and then handed over project
98
to the council
F Do you have suggestions on how sensitization towards payment for water could occur?
B Carry out a campaign. There are some people who see the need, and pay voluntarily without force. IN order to
keep their water flowing. Those who pay are the ones who cannot afford the two systems. Those who are rich
enough, are connected to both SNEC and community. When both are flowing, they put off the SNEC and use
community. We have cases of hostels who previously said no to community water have come back begging to be
connected because SNEC bills are many times higher. These same proprietors tax students for water, make 99%
profit on community water. The sensitization can be done by the Buea rural councils or by even us if we are
given the means.
F Let me be precise, what means would be needed?
B We need financial means to travel, to carry out door to door advocacy in the communities. Call university dons,
hostels, students, campaigning and sensitizing people….Or we can carry out quarter meetings, church meetings.
For example, talk over the radio, newspapers, like the Cameroonian government was doing to inform people of
vaccinations against a new virus.
F If this sensitization picks up steam, do you think CDE SNEC will react badly, or run into some problems with
them?
B SNEC has a right to question us as far as water is concerned, they are the specialized company. But the question
is, can they supply water to every Cameroonian? I think no. If no, so what should all the others do? I think it
should be liberalized to some extent, the monopoly is what brings us with cost. If this [community] system
advanced to provide treatment, it wouldn‘t be too expensive to maintain. We can introduce treatment station in
community water. There are several community water committees in Buea. There is so much water but it is not
exploited. The water corporation does not have the will to expand their network. They are not interested in
exploiting the water in Buea. The accumulated water bills from standpipes in all local councils will never be paid
because they are far above the budgets of the councils. If SNEC connected everyone to their network, they would
be able to collect far more money, and capture the lost money from people using the free water from the
standpipes indiscriminately without knowing the value of the water. In the morning, washing of one leg uses 2 L
of water, because they don‘t understand the value, once they start to pay, they will feel the pinch. I have never
been comfortable with SNEC because they are doing nothing to expand. For example, if they did something to
take water to Ndongo, they would have so many customers. If they took over the community water, they would
be able to supply all these people. …..
Z Climate variability and impacts on community schemes
B This is a worry we all live with. We live in a volcanic area. We‘ve only experienced this once, that the water
level has dropped so low. But this year, with the rains, we have a high level of water. But we cannot guarantee
that it will be like this until December [heart of dry season]. We would like to discuss with the mayor how to
distribute the surplus water that overflows—we need bigger pipes from the catchment to the supply tank and
from the tank to the population. We need not only financial but also technical help. If we had the means, we

99
would ration the water [maybe valves to control flow to different areas of network].
100
Transcript of the Interview with Mr. Becke-Smith, former mayor Buea Rural Council, current member of Great Soppo,
Wokoko, Molyko Water Management Committee
------------------------------------------------------------------
16 November 2010
16:00
Participants:
Mr. Becke-Smith (B)– member Great Soppo, Wokoko, Molyko Water Management Committee (SWMWMC)
Zian Sally (Z) – researcher
Recorded on Nokia N81
-------------------------------------------------------------------
Z Discussion with Mr. Becke Smith Molua, chairperson… You mentioned sensitization towards payment, but one
thing that has come up in the interviews is the issue of accountability, to know what their money is being put
towards.
B People have the right to know. But when you invite people to a meeting they never come.
Z Do you have a provision in your budget or something like that for maintenance?
B Yes, have a maintenance fee, when you have a house like this, pay 2500 CFA per month so that you have access
to our technicians. It is not even enough to pay meter rent if you‘re with SNEC. The highest we charge is 5000
CFA per month. It‘s not enough to even give workers a stipend to live on in a month.
Z Some people are not seeing the fruits of their contributions. For example, they expect continuous supply, but they
are not getting supply even if their houses are connected.
B But that‘s nothing to do with the technicians, for instance December and January will be a difficult time for us.
Sometimes for a whole week the water corporation (SNEC) does not supply water. On the other hand, we have
some people who have never paid for 5 years, but they are having water. Our system is not sophisticated enough
to control flow of water. WE are only using stopcocks. More than half the consumers don‘t pay the 5000. The
accountability here is simple, because if we have to pay x amount of money and present our expenditure in a
budget it will not even account really for the running of the system, because most of it is sacrifice. For instance if
you place one plumber on min wage of 40000 CFA/month, he will never actually get paid that amount regularly.
We don‘t have a budget.
Z That‘s why people are reluctant to pay.
B We used to have an office, and our rents stood at x amounts. Due to bad faith and because people would never
pay us, we could never pay the rents, and the landlord pushed us out. No one has complained since, because
anyway they don‘t pay. We send bills at the end of every month. To prepare bills and send them we need
manpower. So now, I‘m operating from this house. But if they wanted this, I am prepared to go to radio, help
educate them, put our energy together, hold a meeting, but they never attend.

101
Z How many people attend, is it the same people
B Sometimes regular attendance from certain people. The people who attend are those who are connected. Hostel
proprietors do not attend. Why don‘t they come? And even the 5000 francs is not paid regularly, I have a list of
those who do not pay. They pay 5000 francs per month, and they have submeters. They are profiting. IF they
gave use 5000 francs, we would be able to have people to permanently serve the system.
Z What seems to have happened is that by connecting the hostels, this has contributed to other parts of the system
being cut off from supply. That has contributed to this load on the system meaning that other parts of the system
are not being supplied because water has been channelled. They are almost free riding, where they are
B For instance, we concentrate especially on this side (south side) of the road, there‘s an area with a concentration
of hostels, because it‘s the bush and there is space, and there is no SNEC network on this side. I have a personal
feeling for theses students because they do not have access to other sources of water. On the other side, students
live in hostels with SNEC water but they are complaining about the bills. But there are no two ways, you can
either live in scarcity or live with more bills to pay. What we are saying is that we can dialogue, I am prepared to
talk with them. My bias is with these students who are living in this area. I have seen the vice chancellor about it.
The university should be involved, should help bring development to this area, they should help us improve this
water system. It is for their dons who live in this part of the city and for their students. But the vice chancellor
has never done anything. I have continuously increased the connection fee to the hostels in order to raise money.
Z Who initially decided to connect the hostels?
B It was the demand. The first priority was stand taps so that those who are old and sickly can obtain water from
stand taps. There was consultation, even when deciding rates. But now no one is implementing. When people
began to crowd the stand taps, the taps would break, and no one was there to contribute to repair them. The main
consumers were the students, and they started drinking water from doubtful sources
Z What efforts have been made to involve the local community in the management of water. Because presumably if
they don‘t feel a sense of ownership they would not care as much.
B I will talk with the mayor about this. I have told him to relieve me from this responsibility.
Z People are willing to get involved.
B I cannot involve them, because I was appointed by the council. I can only propose to the mayor that he should
involve hotel proprietors, minicite proprietors in the management. There are members of the community, for
instance I know one [..] in his term of office, they initiated this water. But before I took over the management of
this water, there have been a lot of problems, like misgivings and all kinds of problems. They were going to go to
court. The mayor was threatening to take the man to court because of mismanagement. There are people who are
willing to come back, but I cannot involve them. It is the mayor who appointed this present committee. We can
revamp it so that we have many more people, if that will be the reason for their contributing. We can account for
money, have an office.
You know, this thing has a political undertone. The mayor will not appoint people who will run his
102
administration down. He may bring people there who will use their influence to do something else. With me
there, he knows I will protect his interest. For example, someone will say I can offer 500 million and use this to
win elections. It‘s complicated.
Z Who is on management committee?
B Management committee people, some are around this area, some are in Moliko, some are in Wokoko. They have
developed cold feet over these years because they will need certain facilities that we don‘t have. They want
allowance, but money is not there. I will propose to the mayor they should reconstitute that committee, appoint
some other people who will be able to sacrifice.
Z It is important to realize that there is a strong will from the users of the water to manage their water. They feel
that it is important, and it is my understanding that it is important for them to feel this sense of ownership,
responsibility, will start to have an interest in ensuring this scheme will function. Through that it will increase
their willingness to pay, to contribute.
B I understand this, and I am willing to recommend to the mayor this other step. We will recommend some people.
I will make recommendations of people who can revamp committee and I will try that.
Z Will you consult with community down there?
B We have to consult in a meeting. I will invite all those people. I have a list of people who attended several
meetings and they had cold feet. When we ask them to contribute money, they do not contribute. There are
several hostel owners, with 50 students who do not contribute even the 10000 francs per month. The greatest
problem we have is broken pipes, vandalism
Z That is due to scarcity of water
B People have to understand that it is nature, sometimes there is no water. IT is nature that the catchment is not as
full as it needs to be. Sometimes it is because people vandalise pipes in the bush, and that causes a shortage of
supply and pressure.
Z I want to go back to question about initial connection of hostels. Was there any thought about whether catchment
could supply this additional water.
B We had a meeting, and saw that number of hostels THEN could be served with volume of water that we had. But
today they have grown far beyond this. But we continued to connect them into their dwellings because they are in
a position where they have no other place to get water.
Z But at that stage did you weigh the pros and cons of having more standpipes vs individual connections?
B Problem with more standpipes was one that we cannot control usage and payment. WE tried to give people
responsibility to control the stand taps, but it was difficult. It is same situation as when the council cannot pay for
public stand taps. The other problem is queues are very long, and wastage is very high too, with huge drums,
inefficient use. I believe if people have public stand taps, there should be a performance contract, either with
SNEC or community water, where one tap will be put at disposal of few people, responsible for maintenance of
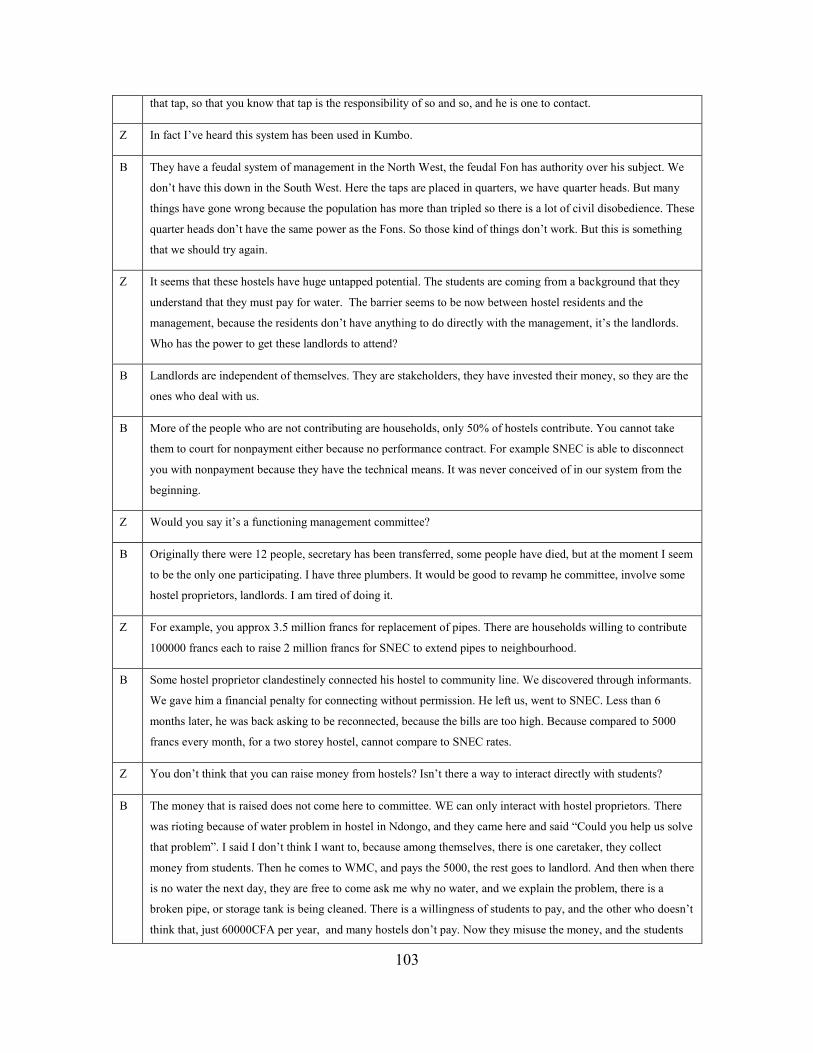
103
that tap, so that you know that tap is the responsibility of so and so, and he is one to contact.
Z In fact I‘ve heard this system has been used in Kumbo.
B They have a feudal system of management in the North West, the feudal Fon has authority over his subject. We
don‘t have this down in the South West. Here the taps are placed in quarters, we have quarter heads. But many
things have gone wrong because the population has more than tripled so there is a lot of civil disobedience. These
quarter heads don‘t have the same power as the Fons. So those kind of things don‘t work. But this is something
that we should try again.
Z It seems that these hostels have huge untapped potential. The students are coming from a background that they
understand that they must pay for water. The barrier seems to be now between hostel residents and the
management, because the residents don‘t have anything to do directly with the management, it‘s the landlords.
Who has the power to get these landlords to attend?
B Landlords are independent of themselves. They are stakeholders, they have invested their money, so they are the
ones who deal with us.
B More of the people who are not contributing are households, only 50% of hostels contribute. You cannot take
them to court for nonpayment either because no performance contract. For example SNEC is able to disconnect
you with nonpayment because they have the technical means. It was never conceived of in our system from the
beginning.
Z Would you say it‘s a functioning management committee?
B Originally there were 12 people, secretary has been transferred, some people have died, but at the moment I seem
to be the only one participating. I have three plumbers. It would be good to revamp he committee, involve some
hostel proprietors, landlords. I am tired of doing it.
Z For example, you approx 3.5 million francs for replacement of pipes. There are households willing to contribute
100000 francs each to raise 2 million francs for SNEC to extend pipes to neighbourhood.
B Some hostel proprietor clandestinely connected his hostel to community line. We discovered through informants.
We gave him a financial penalty for connecting without permission. He left us, went to SNEC. Less than 6
months later, he was back asking to be reconnected, because the bills are too high. Because compared to 5000
francs every month, for a two storey hostel, cannot compare to SNEC rates.
Z You don‘t think that you can raise money from hostels? Isn‘t there a way to interact directly with students?
B The money that is raised does not come here to committee. WE can only interact with hostel proprietors. There
was rioting because of water problem in hostel in Ndongo, and they came here and said ―Could you help us solve
that problem‖. I said I don‘t think I want to, because among themselves, there is one caretaker, they collect
money from students. Then he comes to WMC, and pays the 5000, the rest goes to landlord. And then when there
is no water the next day, they are free to come ask me why no water, and we explain the problem, there is a
broken pipe, or storage tank is being cleaned. There is a willingness of students to pay, and the other who doesn‘t
think that, just 60000CFA per year, and many hostels don‘t pay. Now they misuse the money, and the students

104
get angry because they are paying their money but not getting their money‘s worth because we are not getting the
money. Like I said, if we can have 5 hostel proprietors involved, and a student representation, if that can help us
generate enough administrative power, it would be in our interest.
B There is no budgetary provision in the council for us.
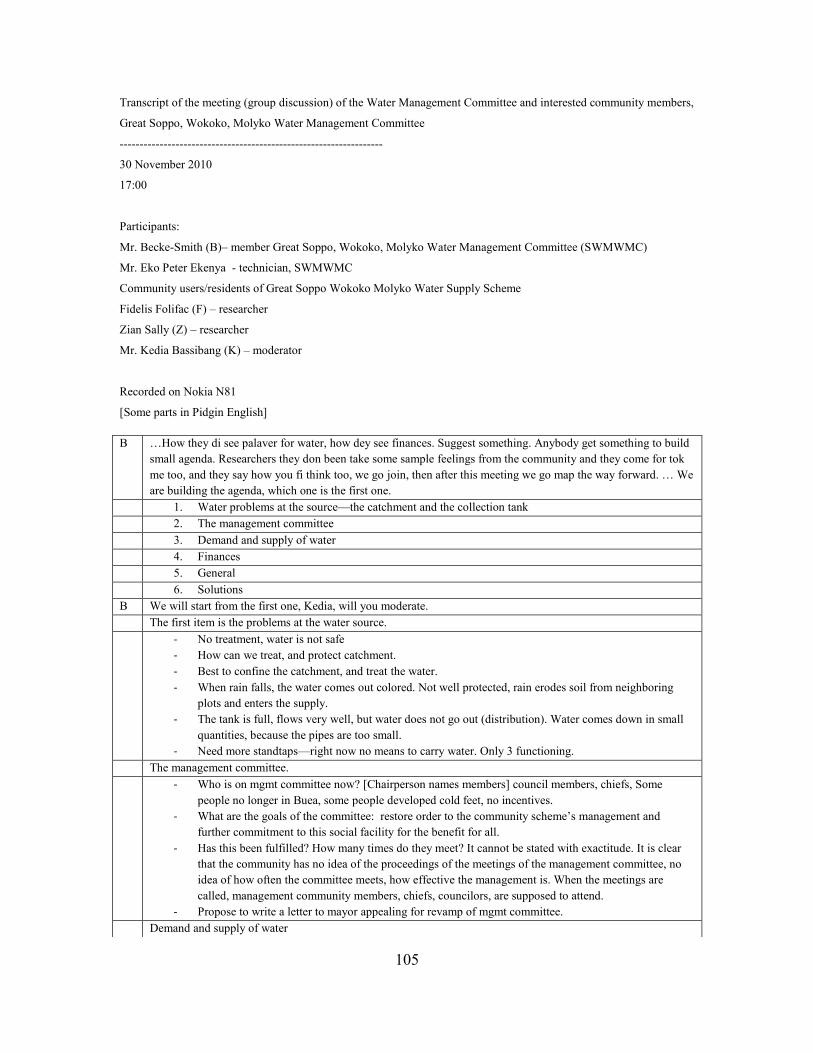
105
Transcript of the meeting (group discussion) of the Water Management Committee and interested community members,
Great Soppo, Wokoko, Molyko Water Management Committee
------------------------------------------------------------------
30 November 2010
17:00
Participants:
Mr. Becke-Smith (B)– member Great Soppo, Wokoko, Molyko Water Management Committee (SWMWMC)
Mr. Eko Peter Ekenya - technician, SWMWMC
Community users/residents of Great Soppo Wokoko Molyko Water Supply Scheme
Fidelis Folifac (F) – researcher
Zian Sally (Z) – researcher
Mr. Kedia Bassibang (K) – moderator
Recorded on Nokia N81
[Some parts in Pidgin English]
B …How they di see palaver for water, how dey see finances. Suggest something. Anybody get something to build
small agenda. Researchers they don been take some sample feelings from the community and they come for tok
me too, and they say how you fi think too, we go join, then after this meeting we go map the way forward. … We
are building the agenda, which one is the first one.
1. Water problems at the source—the catchment and the collection tank
2. The management committee
3. Demand and supply of water
4. Finances
5. General
6. Solutions
B We will start from the first one, Kedia, will you moderate.
The first item is the problems at the water source.
- No treatment, water is not safe
- How can we treat, and protect catchment.
- Best to confine the catchment, and treat the water.
- When rain falls, the water comes out colored. Not well protected, rain erodes soil from neighboring
plots and enters the supply.
- The tank is full, flows very well, but water does not go out (distribution). Water comes down in small
quantities, because the pipes are too small.
- Need more standtaps—right now no means to carry water. Only 3 functioning.
The management committee.
- Who is on mgmt committee now? [Chairperson names members] council members, chiefs, Some
people no longer in Buea, some people developed cold feet, no incentives.
- What are the goals of the committee: restore order to the community scheme‘s management and
further commitment to this social facility for the benefit for all.
- Has this been fulfilled? How many times do they meet? It cannot be stated with exactitude. It is clear
that the community has no idea of the proceedings of the meetings of the management committee, no
idea of how often the committee meets, how effective the management is. When the meetings are
called, management community members, chiefs, councilors, are supposed to attend.
- Propose to write a letter to mayor appealing for revamp of mgmt committee.
Demand and supply of water
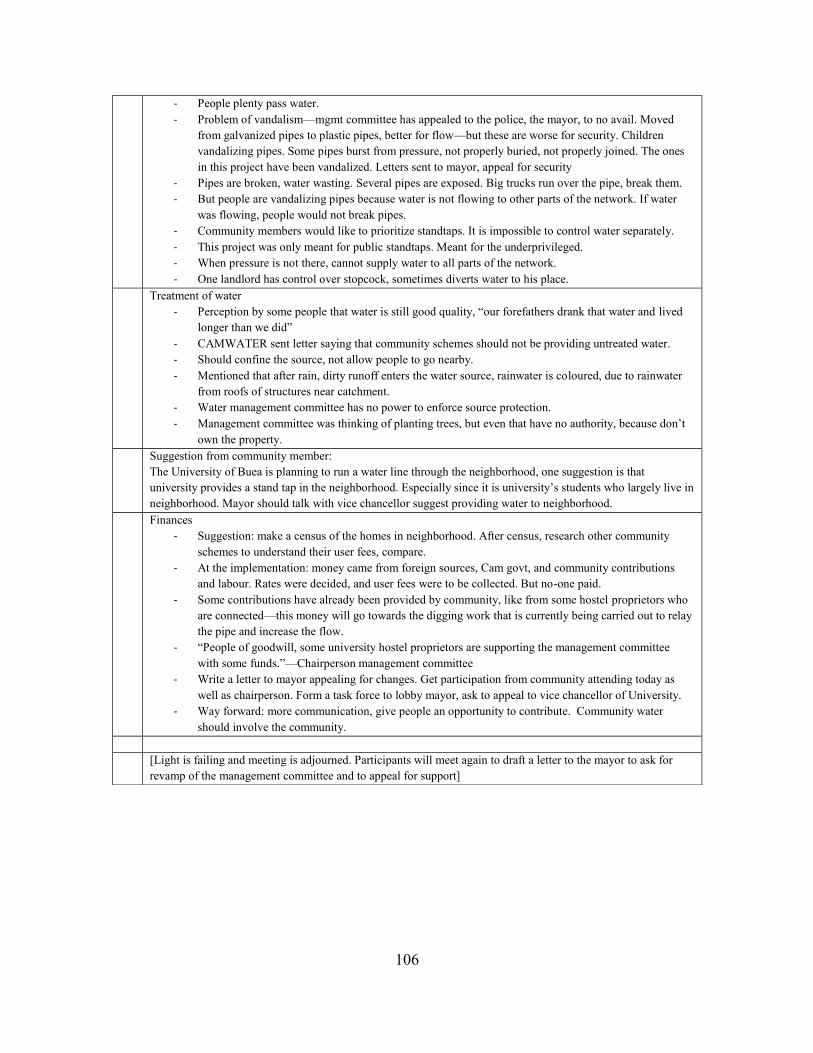
106
- People plenty pass water.
- Problem of vandalism—mgmt committee has appealed to the police, the mayor, to no avail. Moved
from galvanized pipes to plastic pipes, better for flow—but these are worse for security. Children
vandalizing pipes. Some pipes burst from pressure, not properly buried, not properly joined. The ones
in this project have been vandalized. Letters sent to mayor, appeal for security
- Pipes are broken, water wasting. Several pipes are exposed. Big trucks run over the pipe, break them.
- But people are vandalizing pipes because water is not flowing to other parts of the network. If water
was flowing, people would not break pipes.
- Community members would like to prioritize standtaps. It is impossible to control water separately.
- This project was only meant for public standtaps. Meant for the underprivileged.
- When pressure is not there, cannot supply water to all parts of the network.
- One landlord has control over stopcock, sometimes diverts water to his place.
Treatment of water
- Perception by some people that water is still good quality, ―our forefathers drank that water and lived
longer than we did‖
- CAMWATER sent letter saying that community schemes should not be providing untreated water.
- Should confine the source, not allow people to go nearby.
- Mentioned that after rain, dirty runoff enters the water source, rainwater is coloured, due to rainwater
from roofs of structures near catchment.
- Water management committee has no power to enforce source protection.
- Management committee was thinking of planting trees, but even that have no authority, because don‘t
own the property.
Suggestion from community member:
The University of Buea is planning to run a water line through the neighborhood, one suggestion is that
university provides a stand tap in the neighborhood. Especially since it is university‘s students who largely live in
neighborhood. Mayor should talk with vice chancellor suggest providing water to neighborhood.
Finances
- Suggestion: make a census of the homes in neighborhood. After census, research other community
schemes to understand their user fees, compare.
- At the implementation: money came from foreign sources, Cam govt, and community contributions
and labour. Rates were decided, and user fees were to be collected. But no-one paid.
- Some contributions have already been provided by community, like from some hostel proprietors who
are connected—this money will go towards the digging work that is currently being carried out to relay
the pipe and increase the flow.
- ―People of goodwill, some university hostel proprietors are supporting the management committee
with some funds.‖—Chairperson management committee
- Write a letter to mayor appealing for changes. Get participation from community attending today as
well as chairperson. Form a task force to lobby mayor, ask to appeal to vice chancellor of University.
- Way forward: more communication, give people an opportunity to contribute. Community water
should involve the community.
[Light is failing and meeting is adjourned. Participants will meet again to draft a letter to the mayor to ask for
revamp of the management committee and to appeal for support]
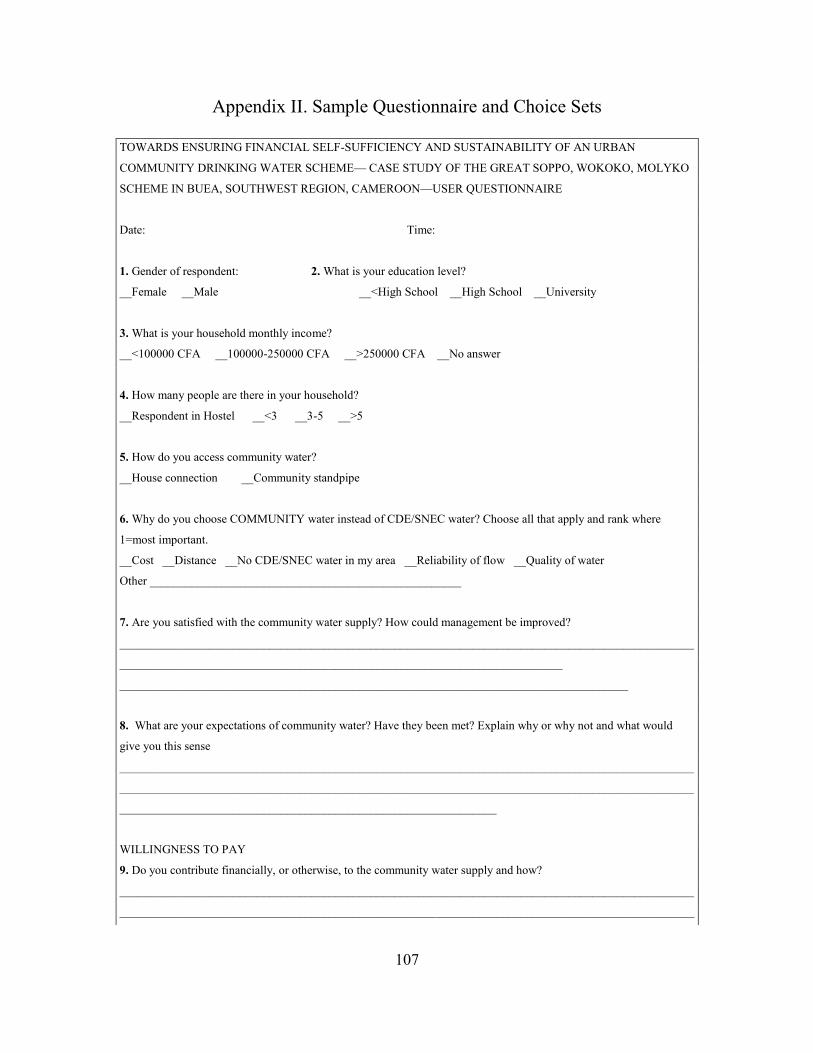
107
Appendix II. Sample Questionnaire and Choice Sets
TOWARDS ENSURING FINANCIAL SELF-SUFFICIENCY AND SUSTAINABILITY OF AN URBAN
COMMUNITY DRINKING WATER SCHEME— CASE STUDY OF THE GREAT SOPPO, WOKOKO, MOLYKO
SCHEME IN BUEA, SOUTHWEST REGION, CAMEROON—USER QUESTIONNAIRE
Date: Time:
1. Gender of respondent: 2. What is your education level?
__Female __Male __<High School __High School __University
3. What is your household monthly income?
__<100000 CFA __100000-250000 CFA __>250000 CFA __No answer
4. How many people are there in your household?
__Respondent in Hostel __<3 __3-5 __>5
5. How do you access community water?
__House connection __Community standpipe
6. Why do you choose COMMUNITY water instead of CDE/SNEC water? Choose all that apply and rank where
1=most important.
__Cost __Distance __No CDE/SNEC water in my area __Reliability of flow __Quality of water
Other ____________________________________________________
7. Are you satisfied with the community water supply? How could management be improved?
________________________________________________________________________________________________
__________________________________________________________________________
_____________________________________________________________________________________
8. What are your expectations of community water? Have they been met? Explain why or why not and what would
give you this sense
________________________________________________________________________________________________
________________________________________________________________________________________________
_______________________________________________________________
WILLINGNESS TO PAY
9. Do you contribute financially, or otherwise, to the community water supply and how?
________________________________________________________________________________________________
________________________________________________________________________________________________

108
________________________________________________________________________________________________
____________________________________________________
10. Has the community water management committee contacted you about paying for water?
__Yes __No
11. If you do not contribute to the community water supply, explain why?
________________________________________________________________________________________________
________________________________________________________________________________________________
________________________________________________________________________________________________
________________________________________________________________________________________________
_________________________________________
12. How much are you willing to pay for the community water supply services you currently receive? (Carry out
bidding game starting from maximum(500 CFA/month, current payment level) in increments of 500 CFA)
_____________________________________________________________________________________
13. Choice Experiments. Administer choice cards and record preferences.
DEPENDENCE ON RAINWATER AND OTHER SOURCES
14. Do you harvest or collect RAINWATER when it rains? 15. Size of storage:_______________
__Always __Sometimes __Rarely __Never
16. Why do you collect RAINWATER? Choose all that apply
__Free __When CDE (SNEC) water is not flowing __When COMMUNITY water is not flowing
17. What do you use RAINWATER for? Choose all that apply and rank where 1=most important.
__Drinking __Cooking __Cleaning __Bathing Other:_____________________________________
18. Are there periods in the year when community water does not flow? Explain
________________________________________________________________________________________________
________________________________________________________________________________________________
_______________________________________________________________
19. Do you use other sources of water besides community water and rainwater? Describe, what, when?
________________________________________________________________________________________________
________________________________________________________________________________________________
________________________________________________________________________________________________
____________________________________________________

109
20. How do you cope with rainfall variability/unpredictability? How do periods of drought affect you?
________________________________________________________________________________________________
________________________________________________________________________________________________
________________________________________________________________________________________________
____________________________________________________
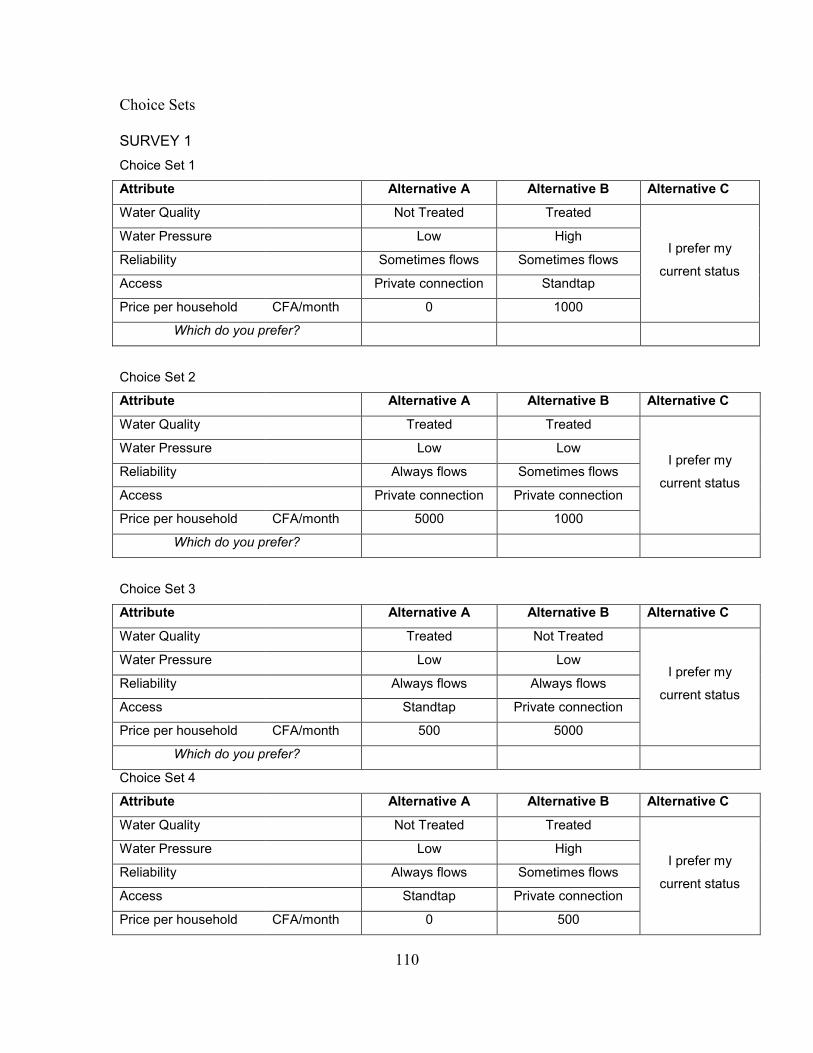
110
Choice Sets
SURVEY 1
Choice Set 1
Attribute Alternative A Alternative B Alternative C
Water Quality Not Treated Treated
I prefer my
current status
Water Pressure Low High
Reliability Sometimes flows Sometimes flows
Access Private connection Standtap
Price per household CFA/month 0 1000
Which do you prefer?
Choice Set 2
Attribute Alternative A Alternative B Alternative C
Water Quality Treated Treated
I prefer my
current status
Water Pressure Low Low
Reliability Always flows Sometimes flows
Access Private connection Private connection
Price per household CFA/month 5000 1000
Which do you prefer?
Choice Set 3
Attribute Alternative A Alternative B Alternative C
Water Quality Treated Not Treated
I prefer my
current status
Water Pressure Low Low
Reliability Always flows Always flows
Access Standtap Private connection
Price per household CFA/month 500 5000
Which do you prefer?
Choice Set 4
Attribute Alternative A Alternative B Alternative C
Water Quality Not Treated Treated
I prefer my
current status
Water Pressure Low High
Reliability Always flows Sometimes flows
Access Standtap Private connection
Price per household CFA/month 0 500
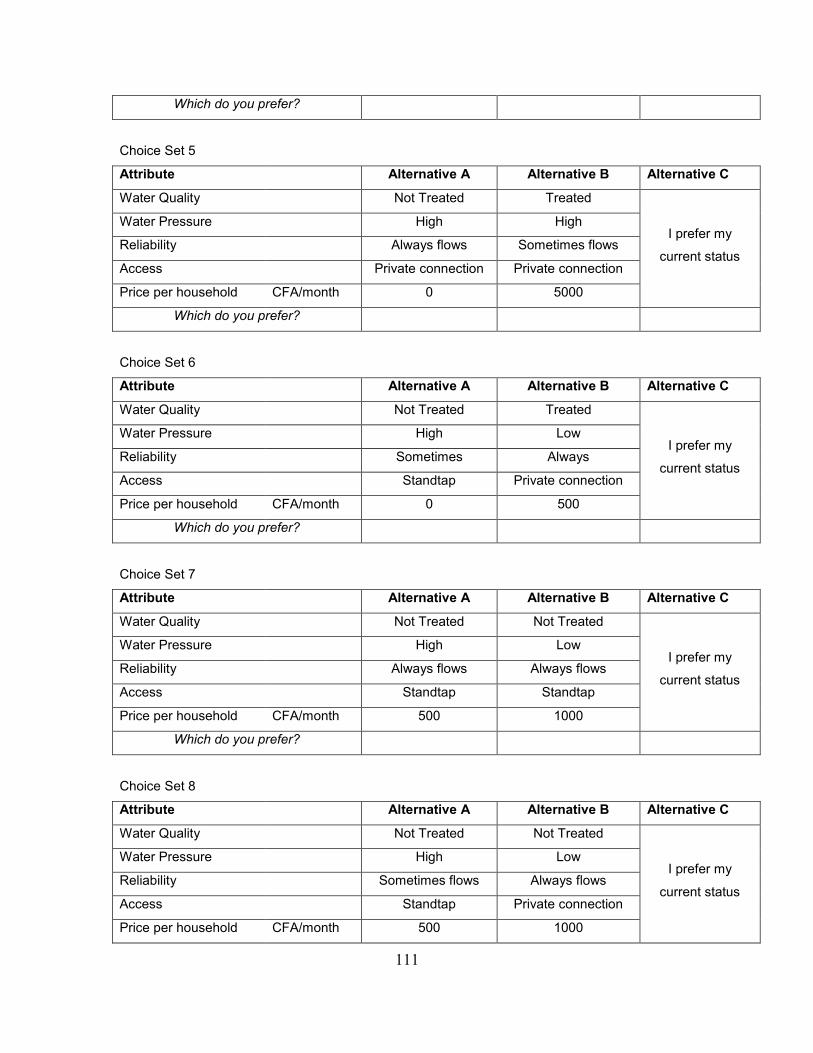
111
Which do you prefer?
Choice Set 5
Attribute Alternative A Alternative B Alternative C
Water Quality Not Treated Treated
I prefer my
current status
Water Pressure High High
Reliability Always flows Sometimes flows
Access Private connection Private connection
Price per household CFA/month 0 5000
Which do you prefer?
Choice Set 6
Attribute Alternative A Alternative B Alternative C
Water Quality Not Treated Treated
I prefer my
current status
Water Pressure High Low
Reliability Sometimes Always
Access Standtap Private connection
Price per household CFA/month 0 500
Which do you prefer?
Choice Set 7
Attribute Alternative A Alternative B Alternative C
Water Quality Not Treated Not Treated
I prefer my
current status
Water Pressure High Low
Reliability Always flows Always flows
Access Standtap Standtap
Price per household CFA/month 500 1000
Which do you prefer?
Choice Set 8
Attribute Alternative A Alternative B Alternative C
Water Quality Not Treated Not Treated
I prefer my
current status
Water Pressure High Low
Reliability Sometimes flows Always flows
Access Standtap Private connection
Price per household CFA/month 500 1000
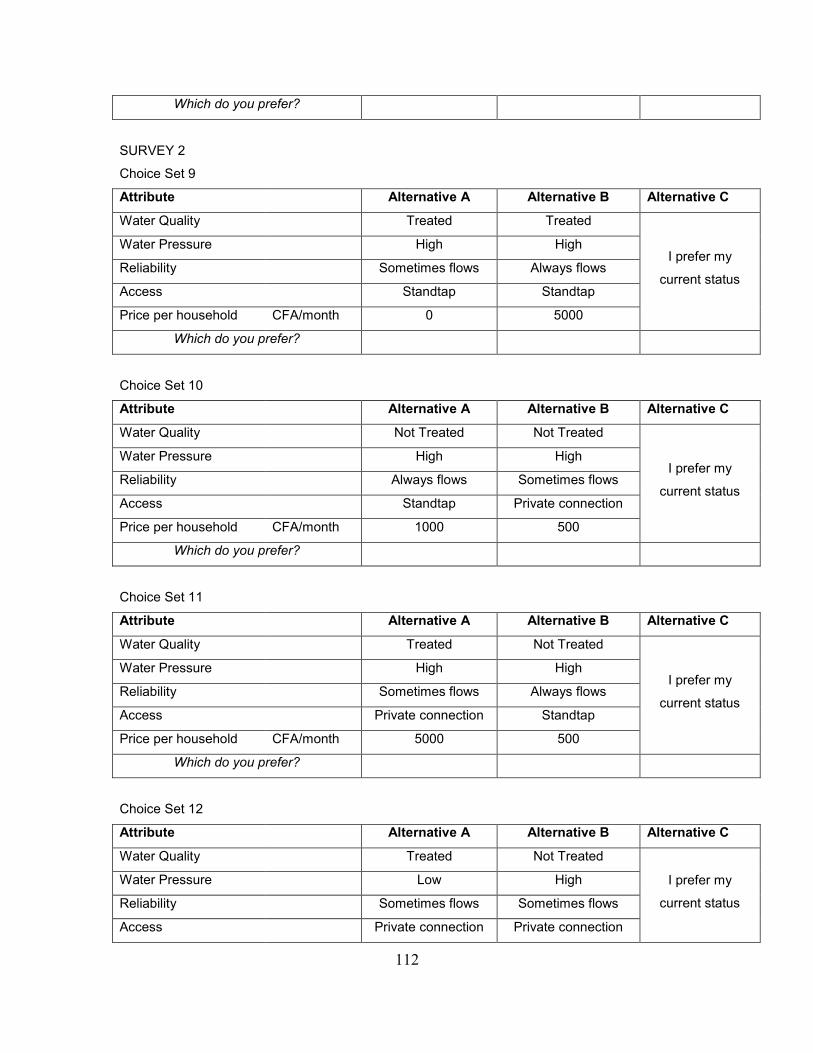
112
Which do you prefer?
SURVEY 2
Choice Set 9
Attribute Alternative A Alternative B Alternative C
Water Quality Treated Treated
I prefer my
current status
Water Pressure High High
Reliability Sometimes flows Always flows
Access Standtap Standtap
Price per household CFA/month 0 5000
Which do you prefer?
Choice Set 10
Attribute Alternative A Alternative B Alternative C
Water Quality Not Treated Not Treated
I prefer my
current status
Water Pressure High High
Reliability Always flows Sometimes flows
Access Standtap Private connection
Price per household CFA/month 1000 500
Which do you prefer?
Choice Set 11
Attribute Alternative A Alternative B Alternative C
Water Quality Treated Not Treated
I prefer my
current status
Water Pressure High High
Reliability Sometimes flows Always flows
Access Private connection Standtap
Price per household CFA/month 5000 500
Which do you prefer?
Choice Set 12
Attribute Alternative A Alternative B Alternative C
Water Quality Treated Not Treated
I prefer my
current status
Water Pressure Low High
Reliability Sometimes flows Sometimes flows
Access Private connection Private connection
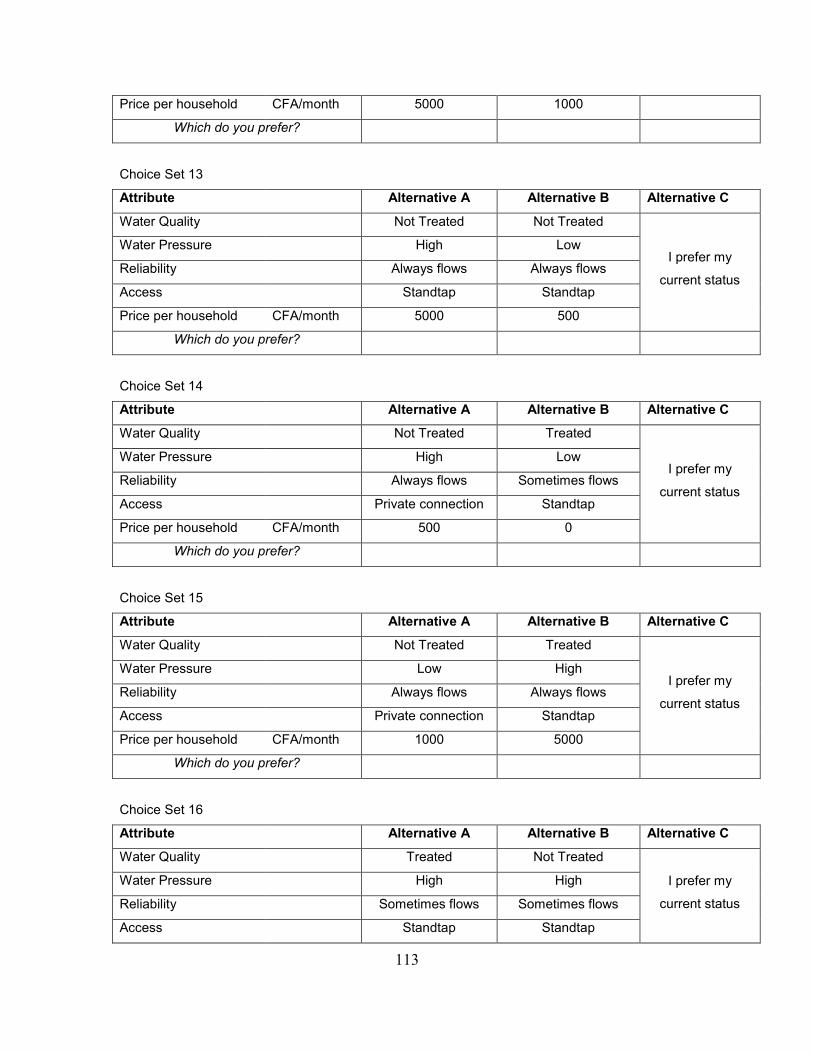
113
Price per household CFA/month 5000 1000
Which do you prefer?
Choice Set 13
Attribute Alternative A Alternative B Alternative C
Water Quality Not Treated Not Treated
I prefer my
current status
Water Pressure High Low
Reliability Always flows Always flows
Access Standtap Standtap
Price per household CFA/month 5000 500
Which do you prefer?
Choice Set 14
Attribute Alternative A Alternative B Alternative C
Water Quality Not Treated Treated
I prefer my
current status
Water Pressure High Low
Reliability Always flows Sometimes flows
Access Private connection Standtap
Price per household CFA/month 500 0
Which do you prefer?
Choice Set 15
Attribute Alternative A Alternative B Alternative C
Water Quality Not Treated Treated
I prefer my
current status
Water Pressure Low High
Reliability Always flows Always flows
Access Private connection Standtap
Price per household CFA/month 1000 5000
Which do you prefer?
Choice Set 16
Attribute Alternative A Alternative B Alternative C
Water Quality Treated Not Treated
I prefer my
current status
Water Pressure High High
Reliability Sometimes flows Sometimes flows
Access Standtap Standtap

114
Price per household CFA/month 500 5000
Which do you prefer?

115
Appendix III. Questionnaire Open-Ended Questions Qualitative Data
Great Soppo, Wokoko, Molyko Community Water Supply Scheme Questionnaire Data
Qualitative Data Analysis
7. Are you satisfied with community water supply? How could mgmt be improved?
8. Do you feel a sense of ownership over community scheme? Explain why or why not and what would
give you this sense.
9. Do you contribute financially, and how?
11. IF you do not contribute to community water, explain why?
18. Are there periods in the year when community water does not flow?
19. Do you use other sources besides community water and rainwater? What, when?
20. How do you cope with rainfall variability unpredictability? How do periods of drought affect your
water?
Each response to questions are arranged under themes, and the number in parentheses after the statement is
the count of how many times the statement was mentioned in all the responses.
Question Themes
7. HOW SATISFIED? IN OWN WORDS:
Not at all satisfied (2).
Not fully satisfied (2).
Very Satisfied.
WHY UNSATISFIED:
Irregular flow (15).
Poor water quality (2).
No water.
Low pressure (2).
Insufficient number of taps (4).
Mgmt committee collecting money but poor service (5).
Government should support with funds.
Ensure every hostel is supplied.
8. WHY NO SENSE OF OWNERSHIP:
We are not participating in management (10).
Contribute but no improvements, water shortage (4).
No contact with management committee (4).
Taps have locks, certain persons have keys.
Landlord connected, tenants pay landlord.
EXPECTATIONS OF COMMUNITY WATER:
Expectations are met (3).

116
Want continuous flow (14).
Regular flow (4).
Low cost (3).
Free water (2).
Alternative provider to SNEC (5).
Each person participates when work like maintenance is to be done (6).
Water quality should be good, clean water (7).
Contribute money (6).
Treatment (4).
Extended pipe borne network.
Involve community in management committee (4).
9. HOW DO YOU CONTRIBUTE:
Contribute to our means (7).
Contribute manually (4).
When network needs to be repaired, mgmt committee comes or notice posted near tap (11).
Pay regularly per year (5).
Pay regularly per month (3).
AMOUNT CONTRIBUTED:
15000 CFA/yr.
10000 CFA/yr.
5000 CFA/yr (2).
3000 CFA/yr.
2500 CFA/yr.
2000 CFA/yr.
3000 CFA/month.
1000-2000 CFA/month
11. WHY DON‘T CONTRIBUTE:
Because we access water from public stand tap, it should be free (6).
We already contributed manually (4).
Landlord takes care of it (10).
Would pay if had regular supply (4).
Lack of accountability.
Community water should be free (fine to pay SNEC for their water because they have
technical knowledge for treatment) (2).
WE have other options so don‘t pay.
No one asks us.
Should only pay for repairs.
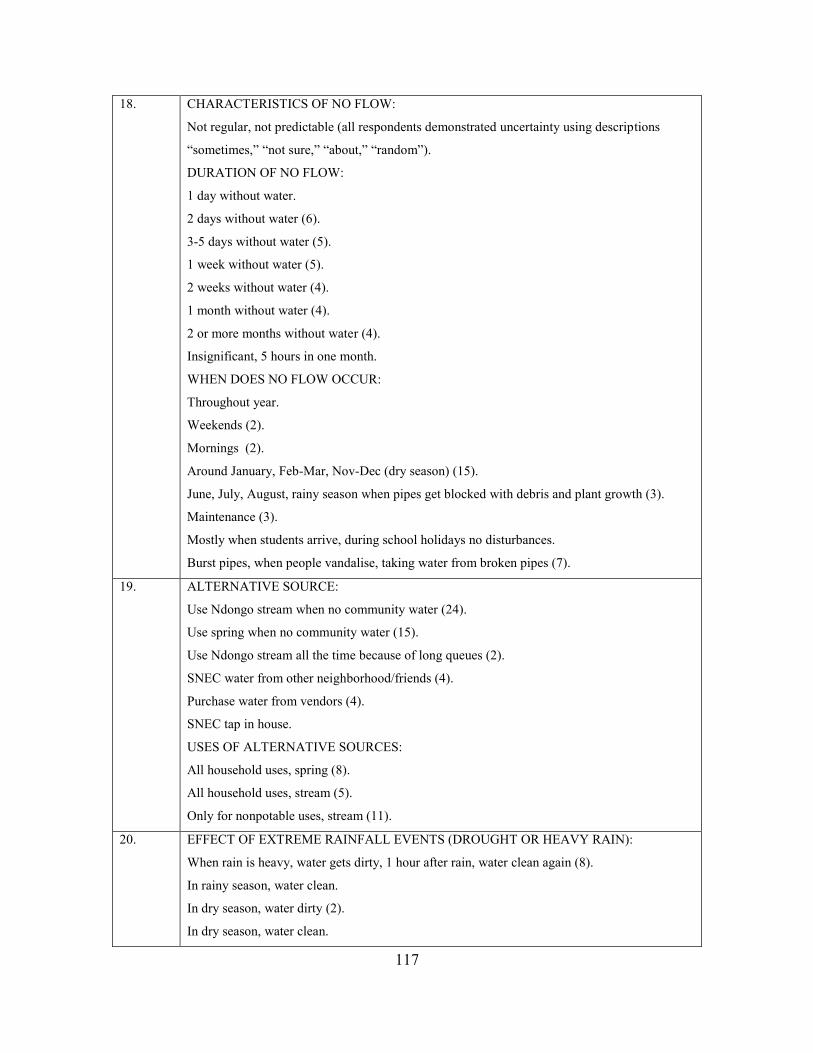
117
18. CHARACTERISTICS OF NO FLOW:
Not regular, not predictable (all respondents demonstrated uncertainty using descriptions
―sometimes,‖ ―not sure,‖ ―about,‖ ―random‖).
DURATION OF NO FLOW:
1 day without water.
2 days without water (6).
3-5 days without water (5).
1 week without water (5).
2 weeks without water (4).
1 month without water (4).
2 or more months without water (4).
Insignificant, 5 hours in one month.
WHEN DOES NO FLOW OCCUR:
Throughout year.
Weekends (2).
Mornings (2).
Around January, Feb-Mar, Nov-Dec (dry season) (15).
June, July, August, rainy season when pipes get blocked with debris and plant growth (3).
Maintenance (3).
Mostly when students arrive, during school holidays no disturbances.
Burst pipes, when people vandalise, taking water from broken pipes (7).
19. ALTERNATIVE SOURCE:
Use Ndongo stream when no community water (24).
Use spring when no community water (15).
Use Ndongo stream all the time because of long queues (2).
SNEC water from other neighborhood/friends (4).
Purchase water from vendors (4).
SNEC tap in house.
USES OF ALTERNATIVE SOURCES:
All household uses, spring (8).
All household uses, stream (5).
Only for nonpotable uses, stream (11).
20. EFFECT OF EXTREME RAINFALL EVENTS (DROUGHT OR HEAVY RAIN):
When rain is heavy, water gets dirty, 1 hour after rain, water clean again (8).
In rainy season, water clean.
In dry season, water dirty (2).
In dry season, water clean.
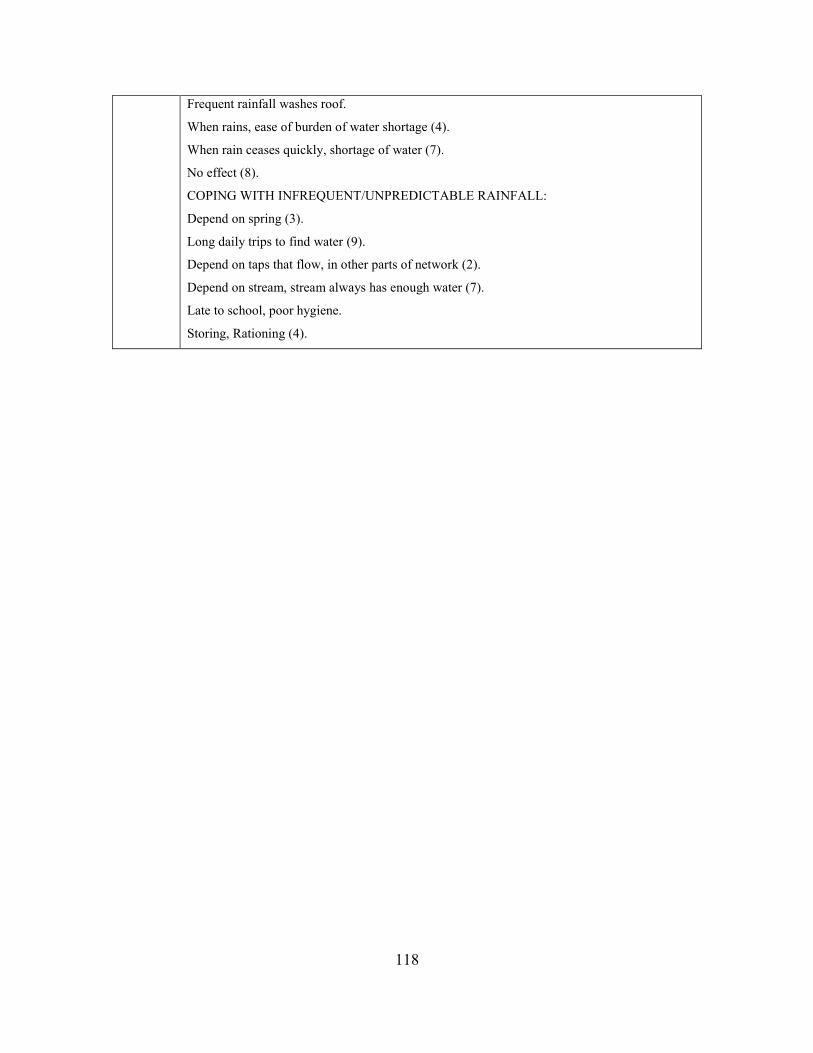
118
Frequent rainfall washes roof.
When rains, ease of burden of water shortage (4).
When rain ceases quickly, shortage of water (7).
No effect (8).
COPING WITH INFREQUENT/UNPREDICTABLE RAINFALL:
Depend on spring (3).
Long daily trips to find water (9).
Depend on taps that flow, in other parts of network (2).
Depend on stream, stream always has enough water (7).
Late to school, poor hygiene.
Storing, Rationing (4).
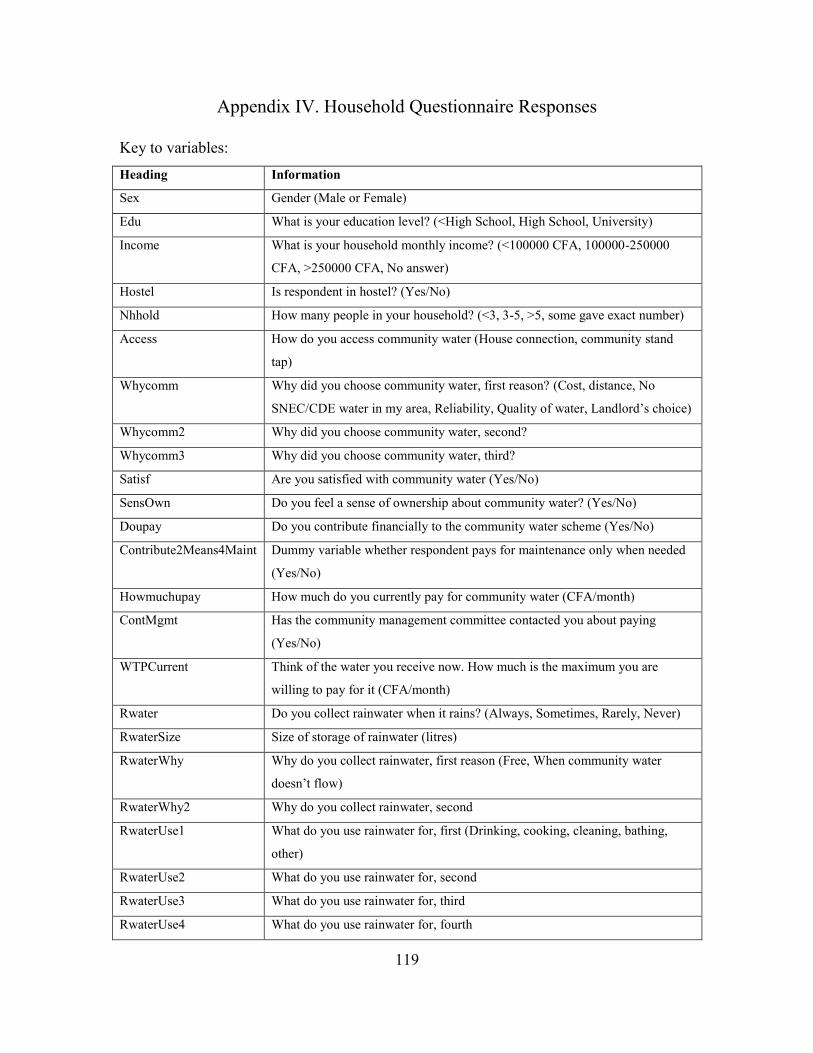
119
Appendix IV. Household Questionnaire Responses
Key to variables:
Heading Information
Sex Gender (Male or Female)
Edu What is your education level? (<High School, High School, University)
Income What is your household monthly income? (<100000 CFA, 100000-250000
CFA, >250000 CFA, No answer)
Hostel Is respondent in hostel? (Yes/No)
Nhhold How many people in your household? (<3, 3-5, >5, some gave exact number)
Access How do you access community water (House connection, community stand
tap)
Whycomm Why did you choose community water, first reason? (Cost, distance, No
SNEC/CDE water in my area, Reliability, Quality of water, Landlord‘s choice)
Whycomm2 Why did you choose community water, second?
Whycomm3 Why did you choose community water, third?
Satisf Are you satisfied with community water (Yes/No)
SensOwn Do you feel a sense of ownership about community water? (Yes/No)
Doupay Do you contribute financially to the community water scheme (Yes/No)
Contribute2Means4Maint Dummy variable whether respondent pays for maintenance only when needed
(Yes/No)
Howmuchupay How much do you currently pay for community water (CFA/month)
ContMgmt Has the community management committee contacted you about paying
(Yes/No)
WTPCurrent Think of the water you receive now. How much is the maximum you are
willing to pay for it (CFA/month)
Rwater Do you collect rainwater when it rains? (Always, Sometimes, Rarely, Never)
RwaterSize Size of storage of rainwater (litres)
RwaterWhy Why do you collect rainwater, first reason (Free, When community water
doesn‘t flow)
RwaterWhy2 Why do you collect rainwater, second
RwaterUse1 What do you use rainwater for, first (Drinking, cooking, cleaning, bathing,
other)
RwaterUse2 What do you use rainwater for, second
RwaterUse3 What do you use rainwater for, third
RwaterUse4 What do you use rainwater for, fourth

120
RwaterOtherResp If other was chosen, what was the response
IrregularityFlow Are there periods in the year when community water does not flow? (Yes/No)
OtherSourceUse Do you use other sources of water besides community water and rainwater
(Yes/No)
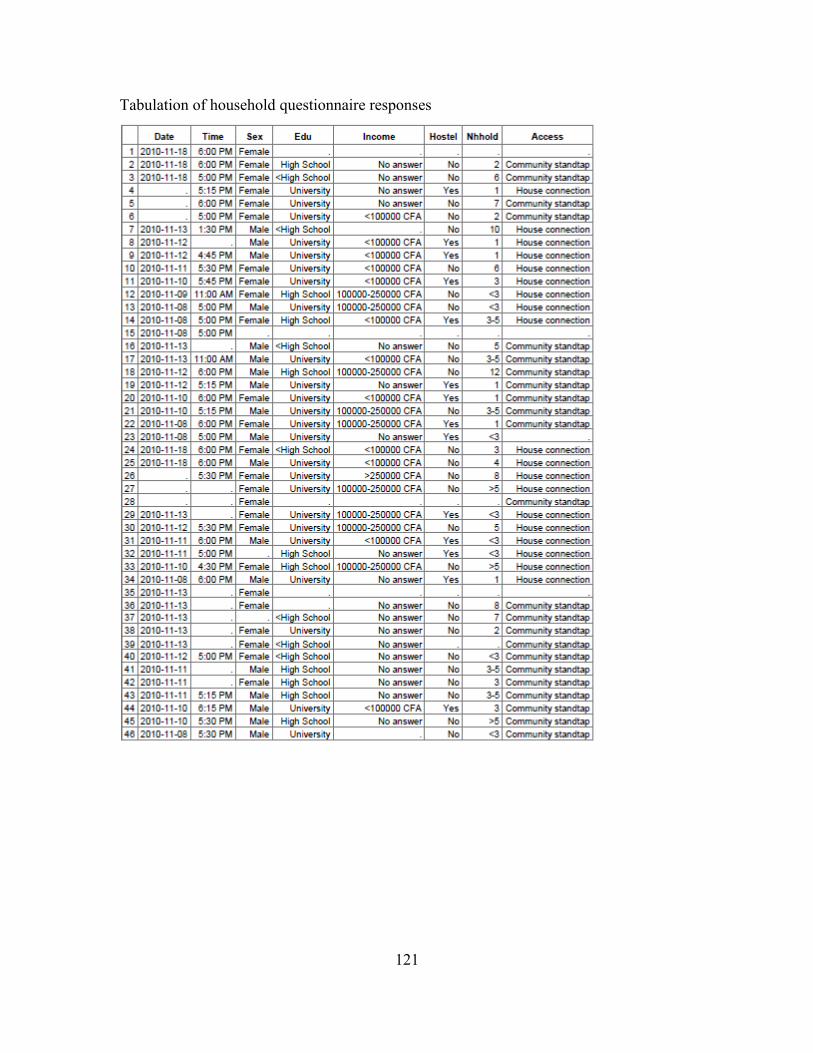
121
Tabulation of household questionnaire responses
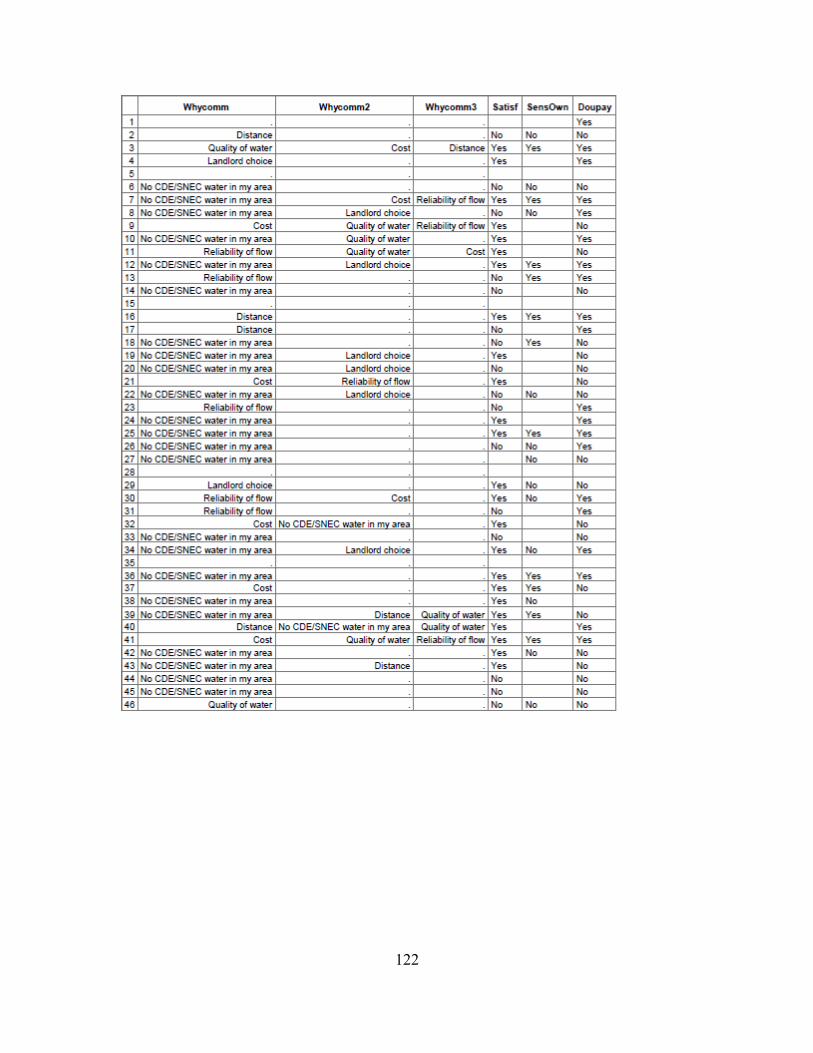
122
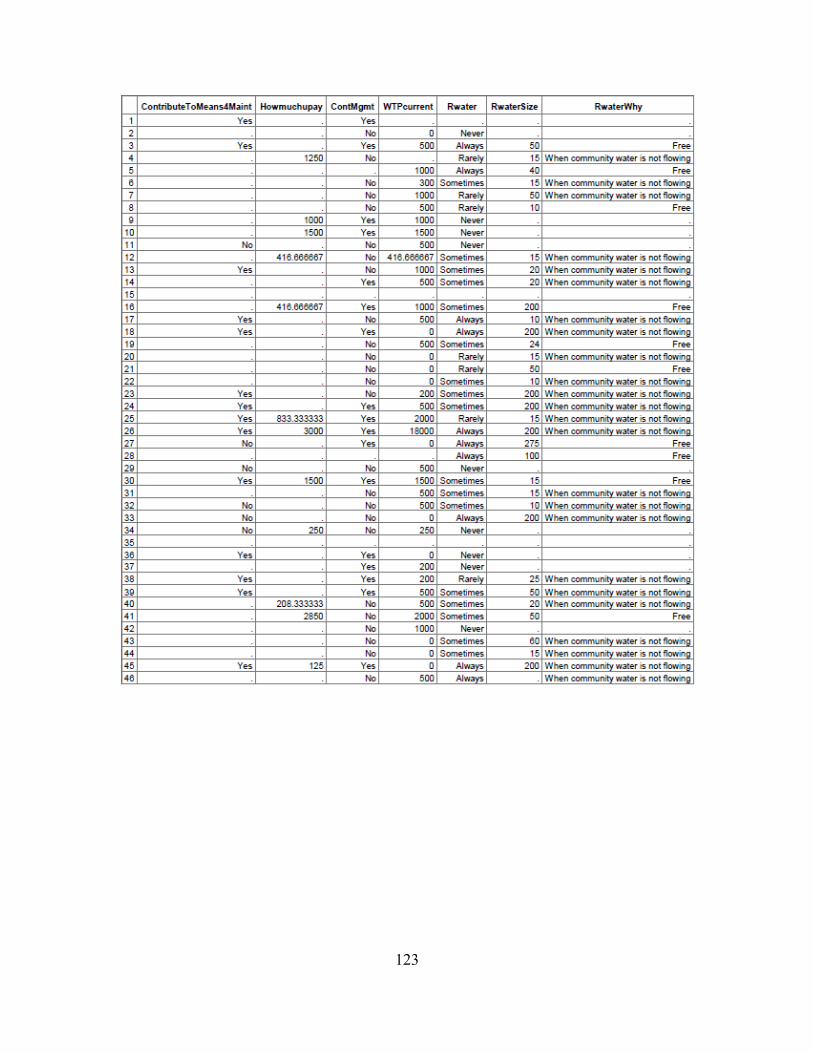
123
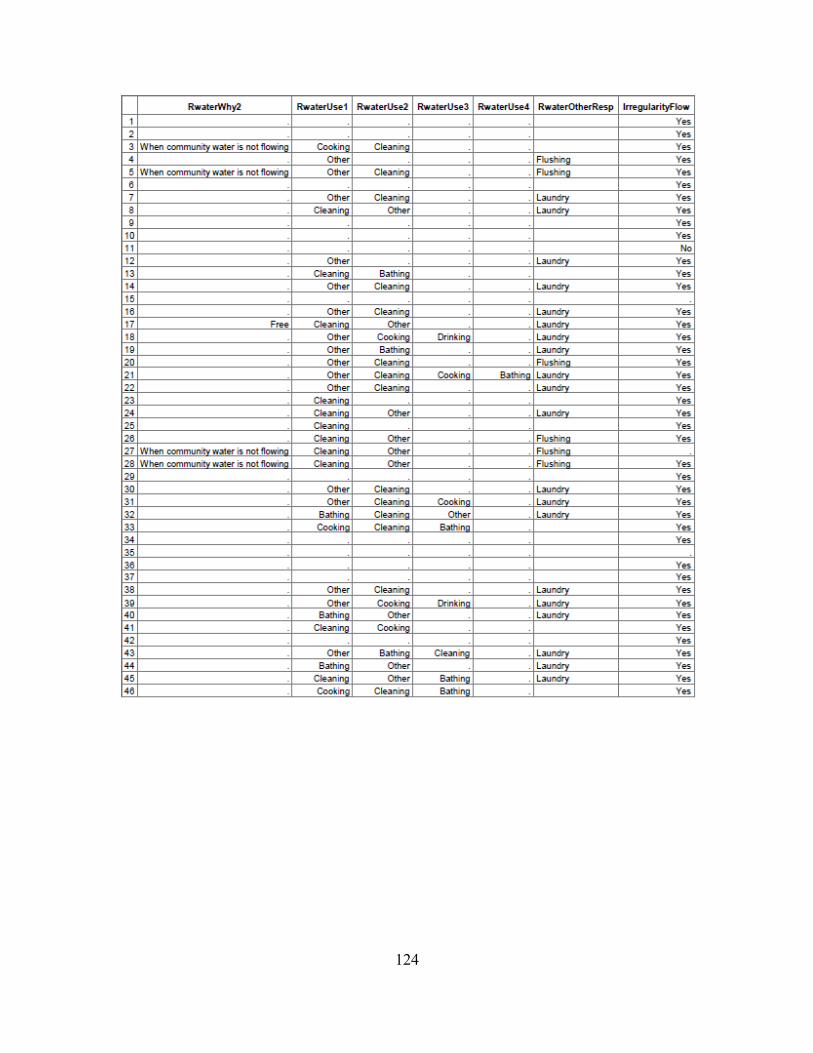
124
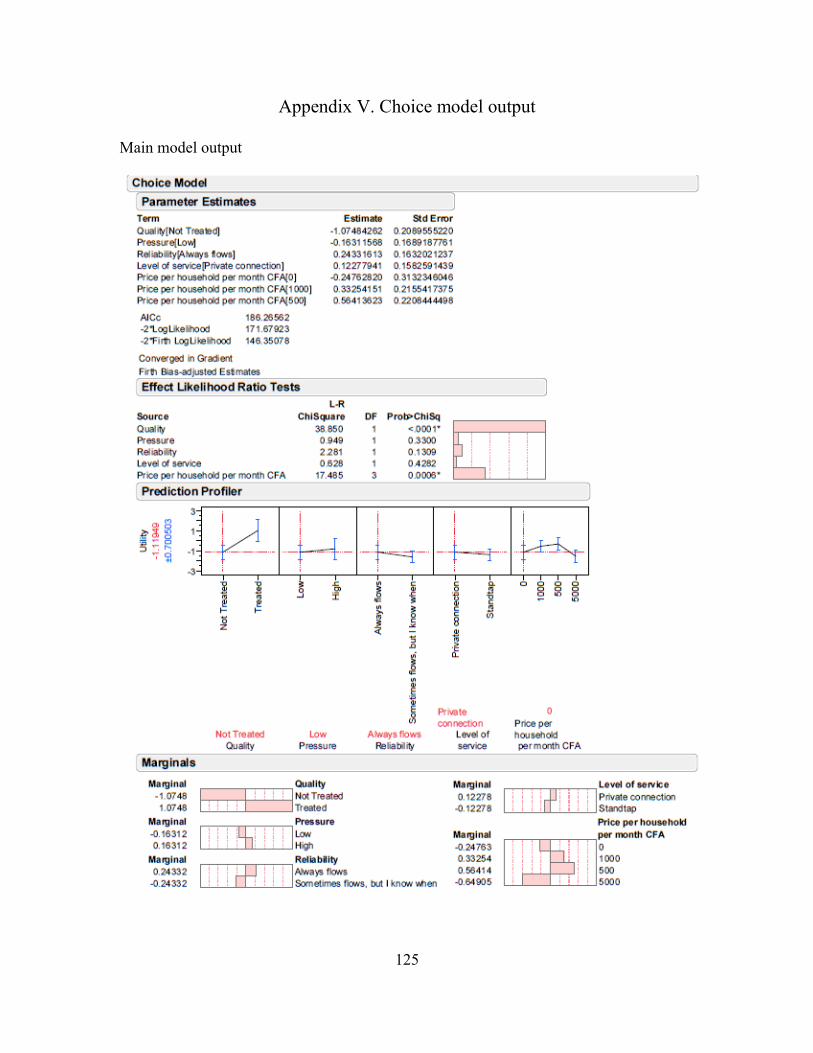
125
Appendix V. Choice model output
Main model output

126
Gender subject-effect interaction
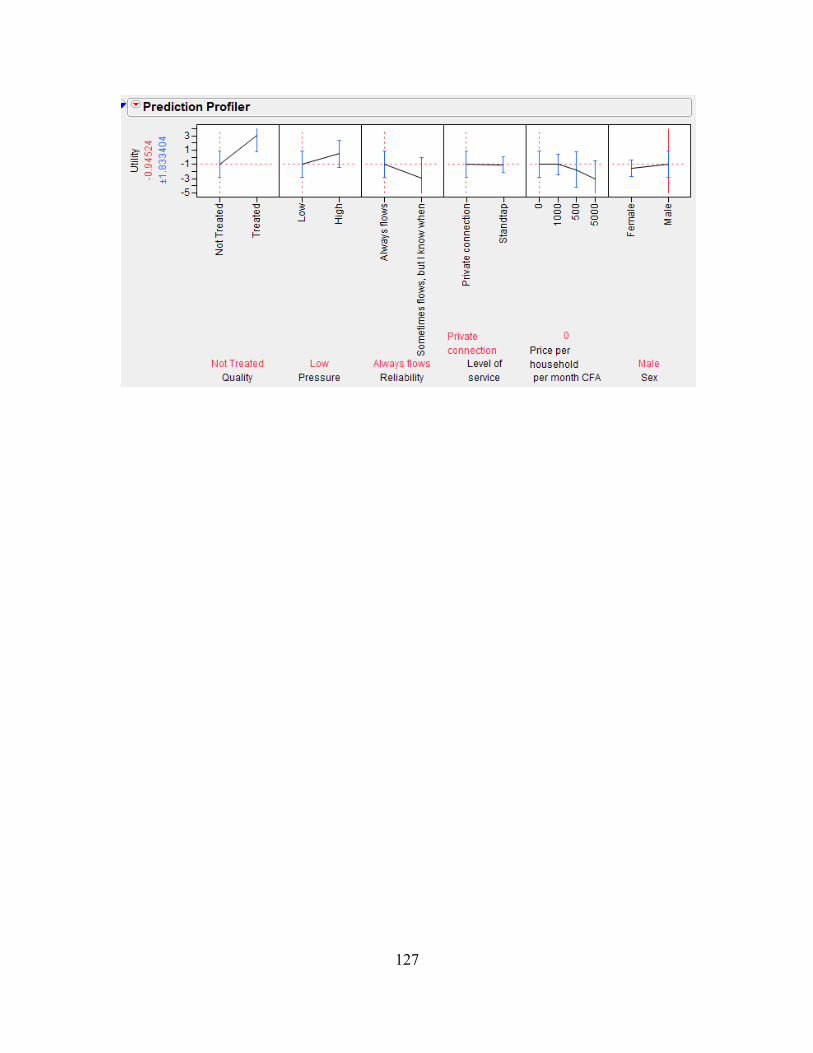
127
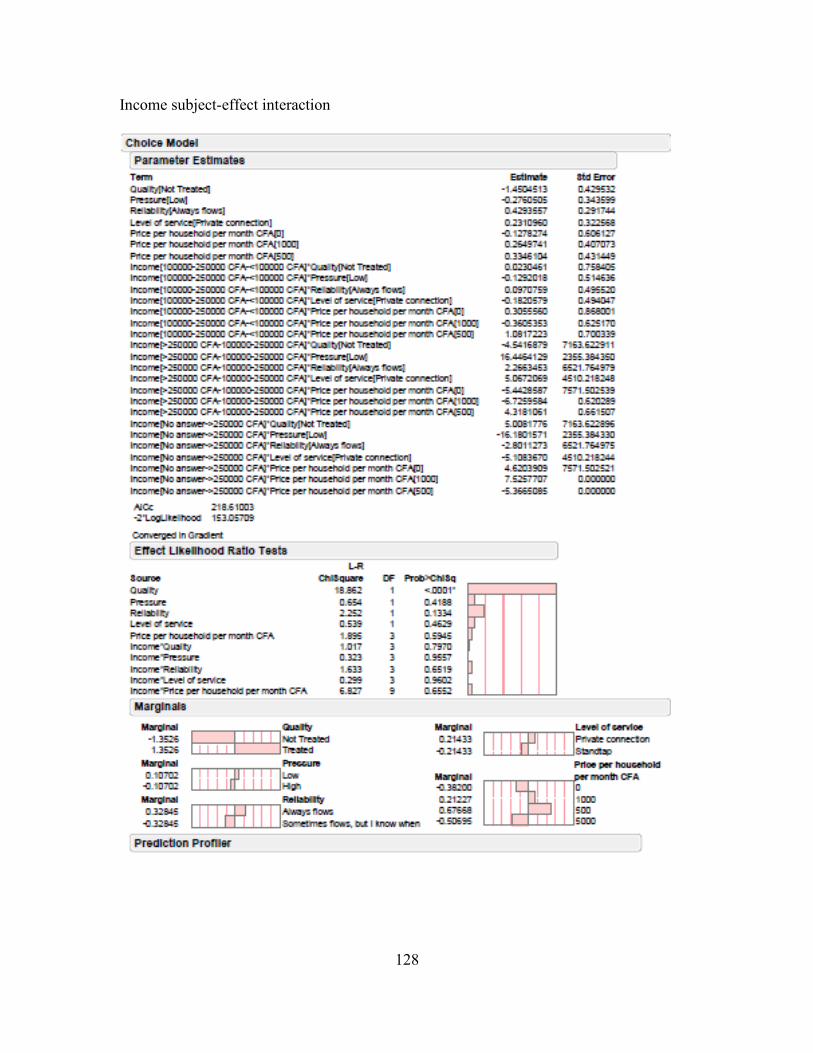
128
Income subject-effect interaction
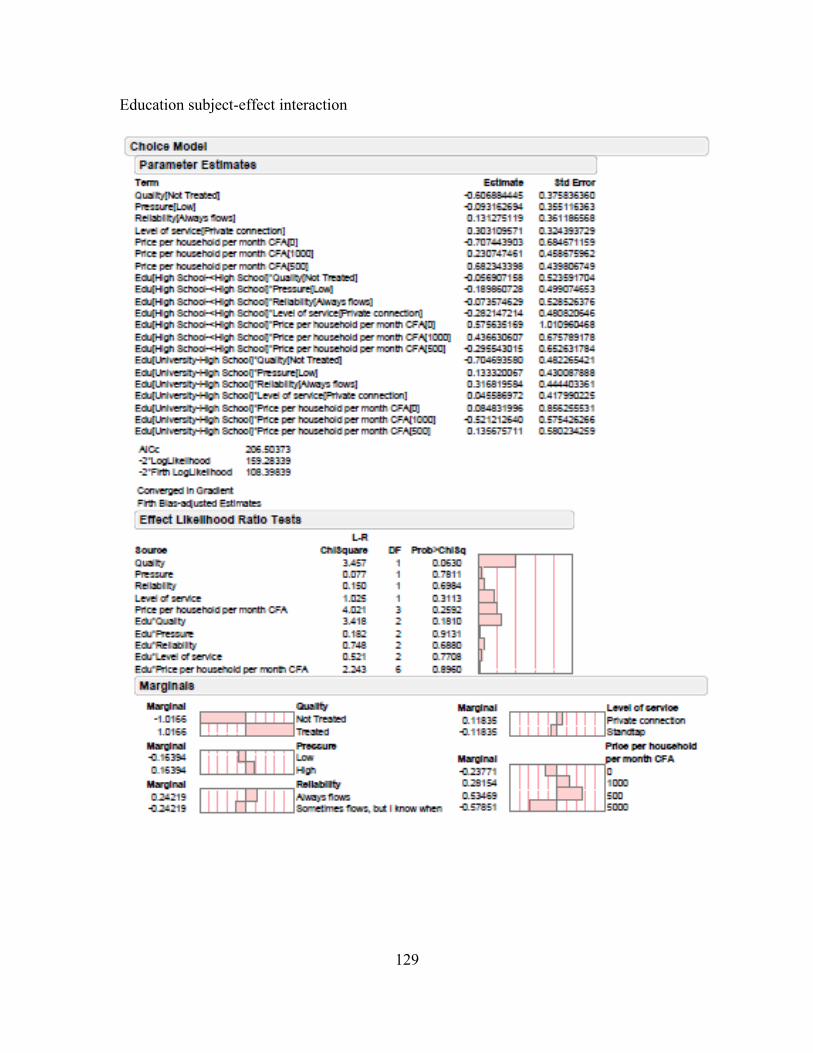
129
Education subject-effect interaction
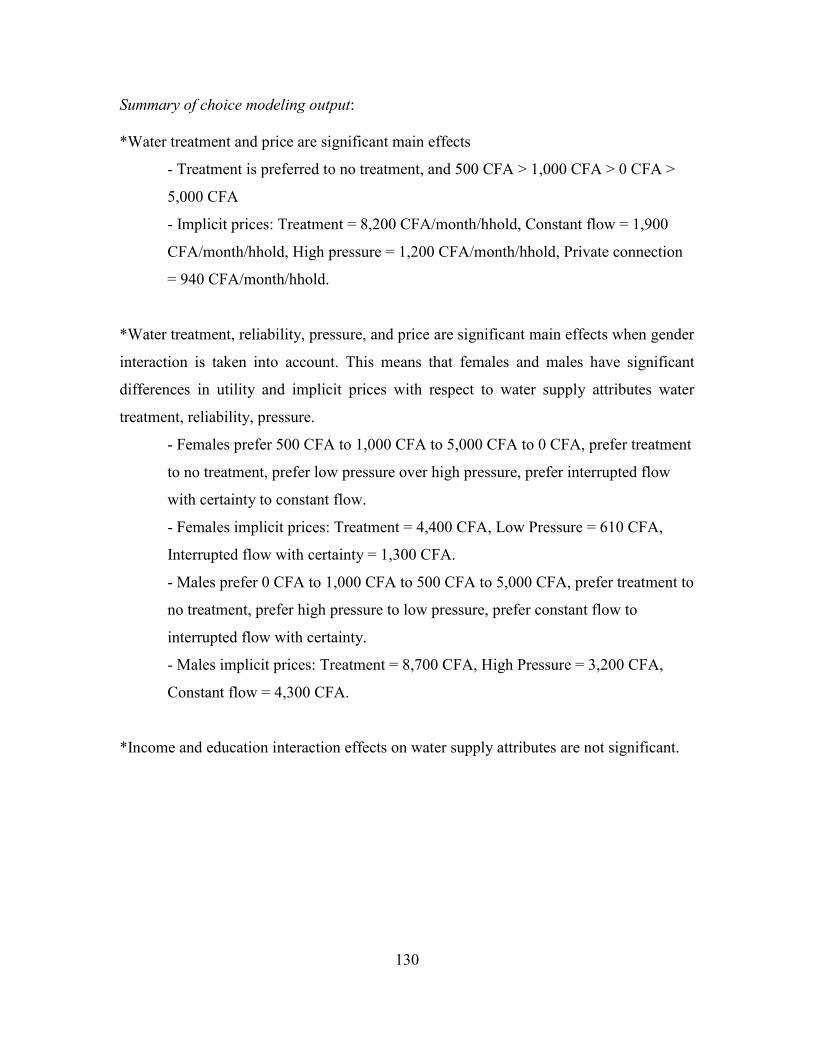
130
Summary of choice modeling output:
*Water treatment and price are significant main effects
- Treatment is preferred to no treatment, and 500 CFA > 1,000 CFA > 0 CFA >
5,000 CFA
- Implicit prices: Treatment = 8,200 CFA/month/hhold, Constant flow = 1,900
CFA/month/hhold, High pressure = 1,200 CFA/month/hhold, Private connection
= 940 CFA/month/hhold.
*Water treatment, reliability, pressure, and price are significant main effects when gender
interaction is taken into account. This means that females and males have significant
differences in utility and implicit prices with respect to water supply attributes water
treatment, reliability, pressure.
- Females prefer 500 CFA to 1,000 CFA to 5,000 CFA to 0 CFA, prefer treatment
to no treatment, prefer low pressure over high pressure, prefer interrupted flow
with certainty to constant flow.
- Females implicit prices: Treatment = 4,400 CFA, Low Pressure = 610 CFA,
Interrupted flow with certainty = 1,300 CFA.
- Males prefer 0 CFA to 1,000 CFA to 500 CFA to 5,000 CFA, prefer treatment to
no treatment, prefer high pressure to low pressure, prefer constant flow to
interrupted flow with certainty.
- Males implicit prices: Treatment = 8,700 CFA, High Pressure = 3,200 CFA,
Constant flow = 4,300 CFA.
*Income and education interaction effects on water supply attributes are not significant.
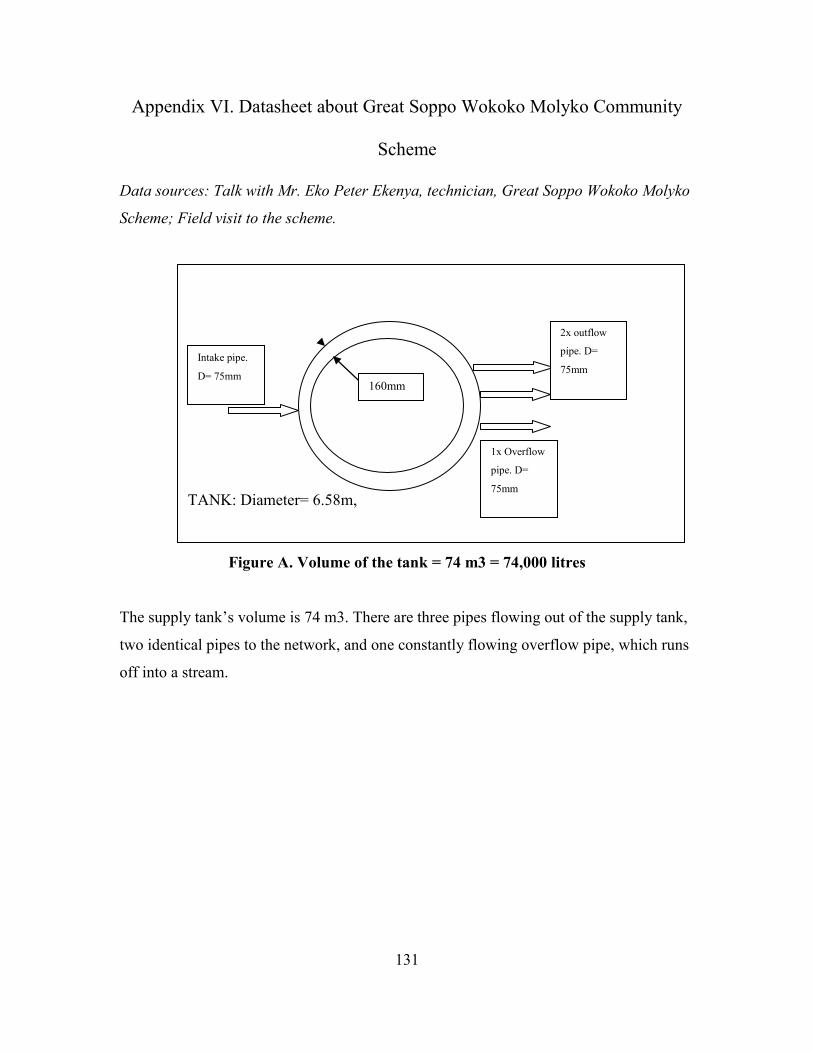
131
Appendix VI. Datasheet about Great Soppo Wokoko Molyko Community
Scheme
Data sources: Talk with Mr. Eko Peter Ekenya, technician, Great Soppo Wokoko Molyko
Scheme; Field visit to the scheme.
Figure A. Volume of the tank = 74 m3 = 74,000 litres
The supply tank‘s volume is 74 m3. There are three pipes flowing out of the supply tank,
two identical pipes to the network, and one constantly flowing overflow pipe, which runs
off into a stream.
160mm
Intake pipe.
D= 75mm
2x outflow
pipe. D=
75mm
1x Overflow
pipe. D=
75mm
TANK: Diameter= 6.58m,
Height=2.4m
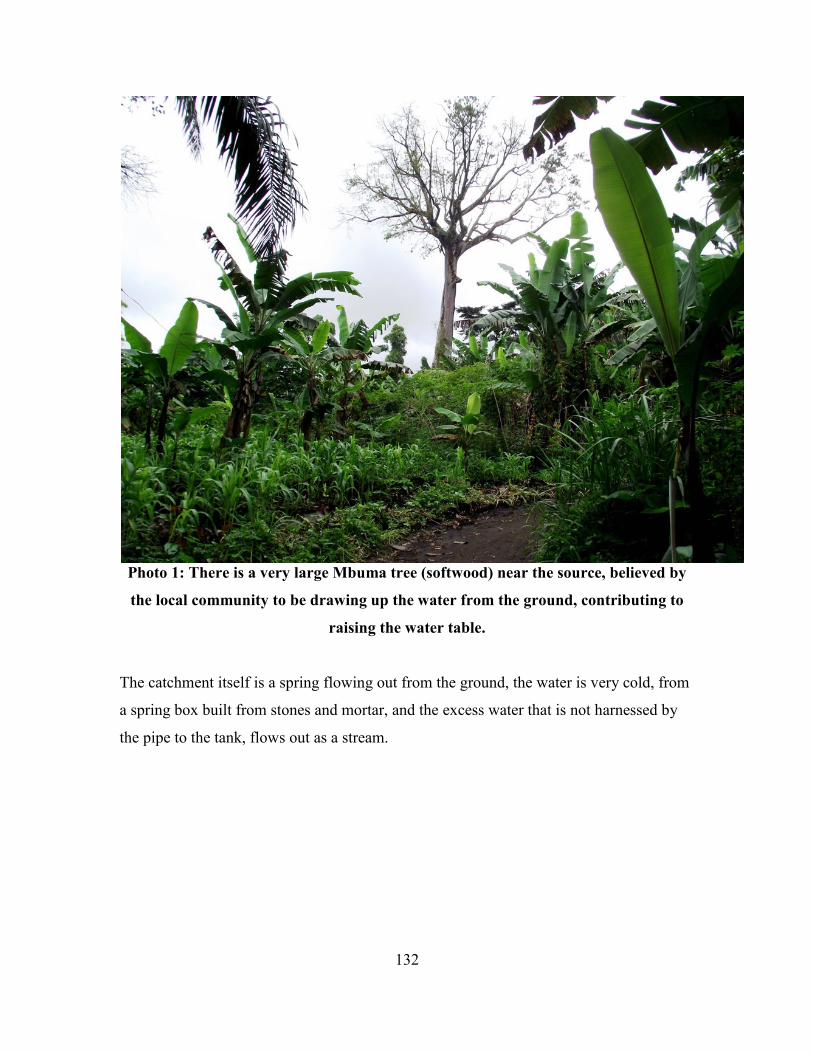
132
Photo 1: There is a very large Mbuma tree (softwood) near the source, believed by
the local community to be drawing up the water from the ground, contributing to
raising the water table.
The catchment itself is a spring flowing out from the ground, the water is very cold, from
a spring box built from stones and mortar, and the excess water that is not harnessed by
the pipe to the tank, flows out as a stream.
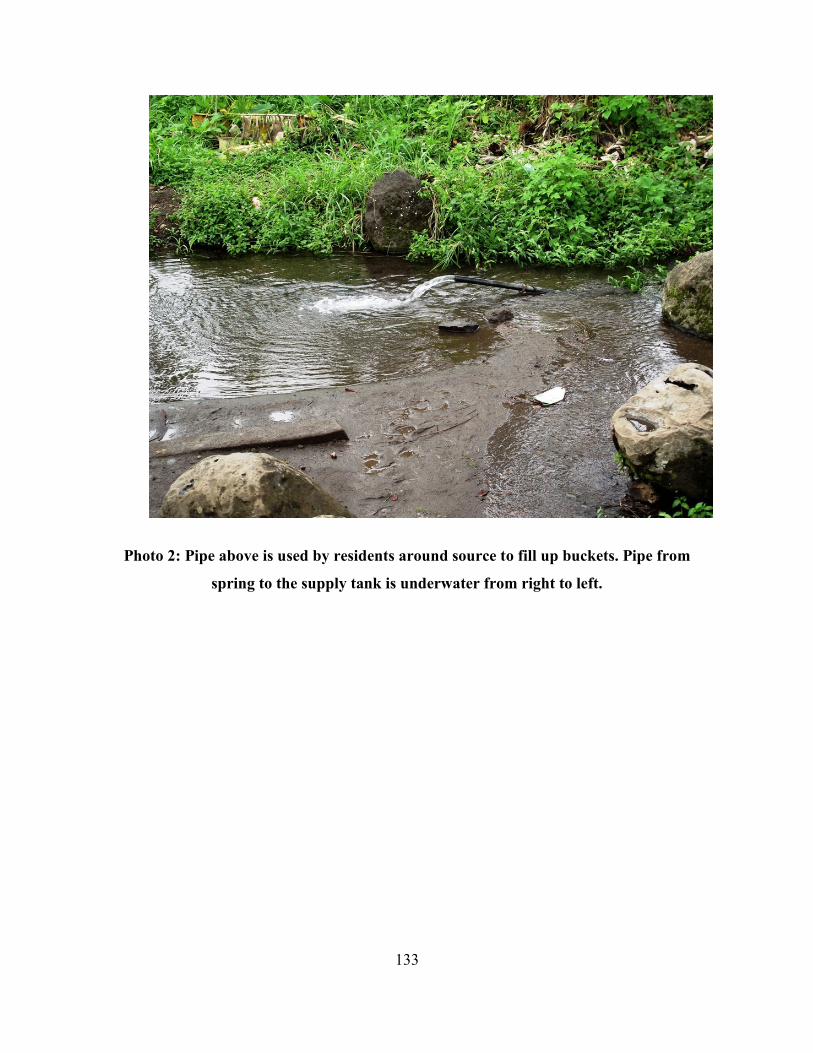
133
Photo 2: Pipe above is used by residents around source to fill up buckets. Pipe from
spring to the supply tank is underwater from right to left.
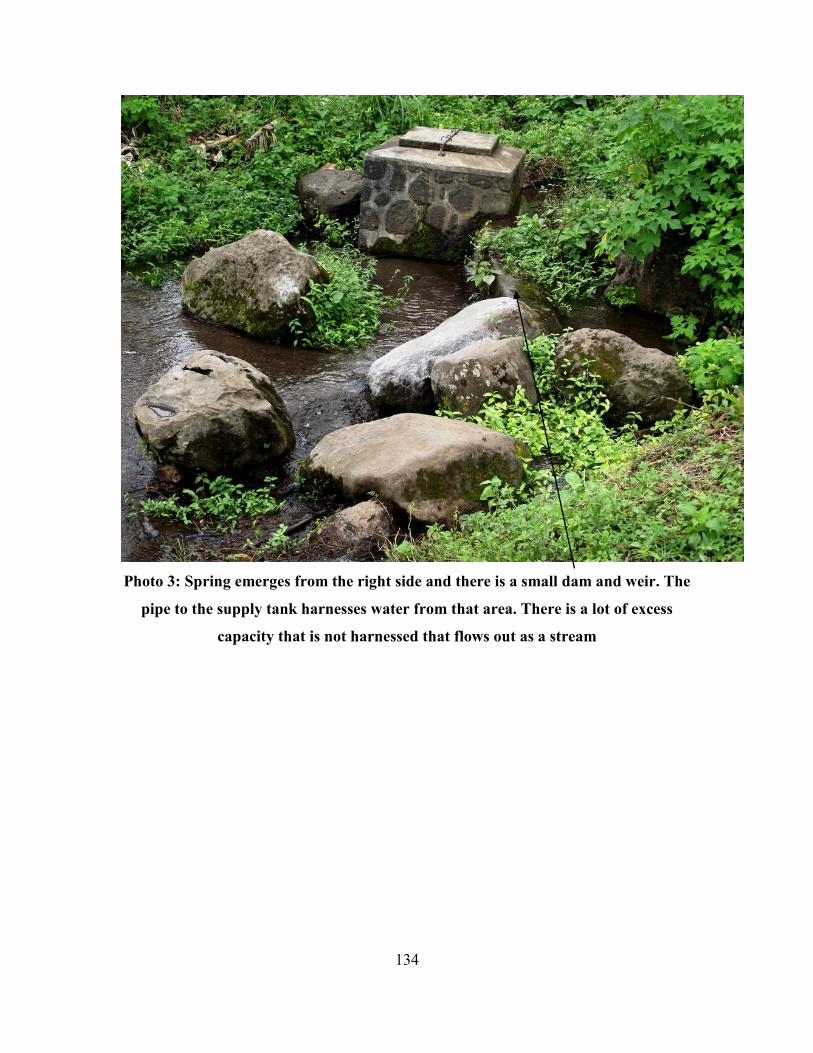
134
Photo 3: Spring emerges from the right side and there is a small dam and weir. The
pipe to the supply tank harnesses water from that area. There is a lot of excess
capacity that is not harnessed that flows out as a stream
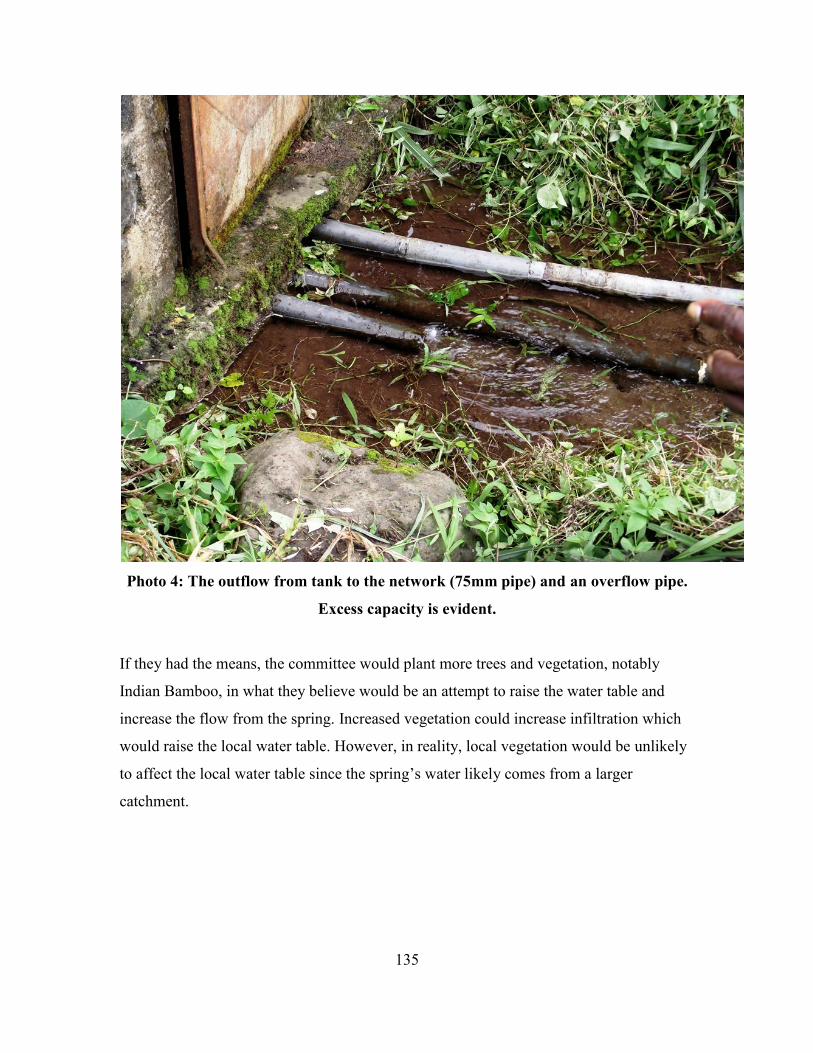
135
Photo 4: The outflow from tank to the network (75mm pipe) and an overflow pipe.
Excess capacity is evident.
If they had the means, the committee would plant more trees and vegetation, notably
Indian Bamboo, in what they believe would be an attempt to raise the water table and
increase the flow from the spring. Increased vegetation could increase infiltration which
would raise the local water table. However, in reality, local vegetation would be unlikely
to affect the local water table since the spring‘s water likely comes from a larger
catchment.
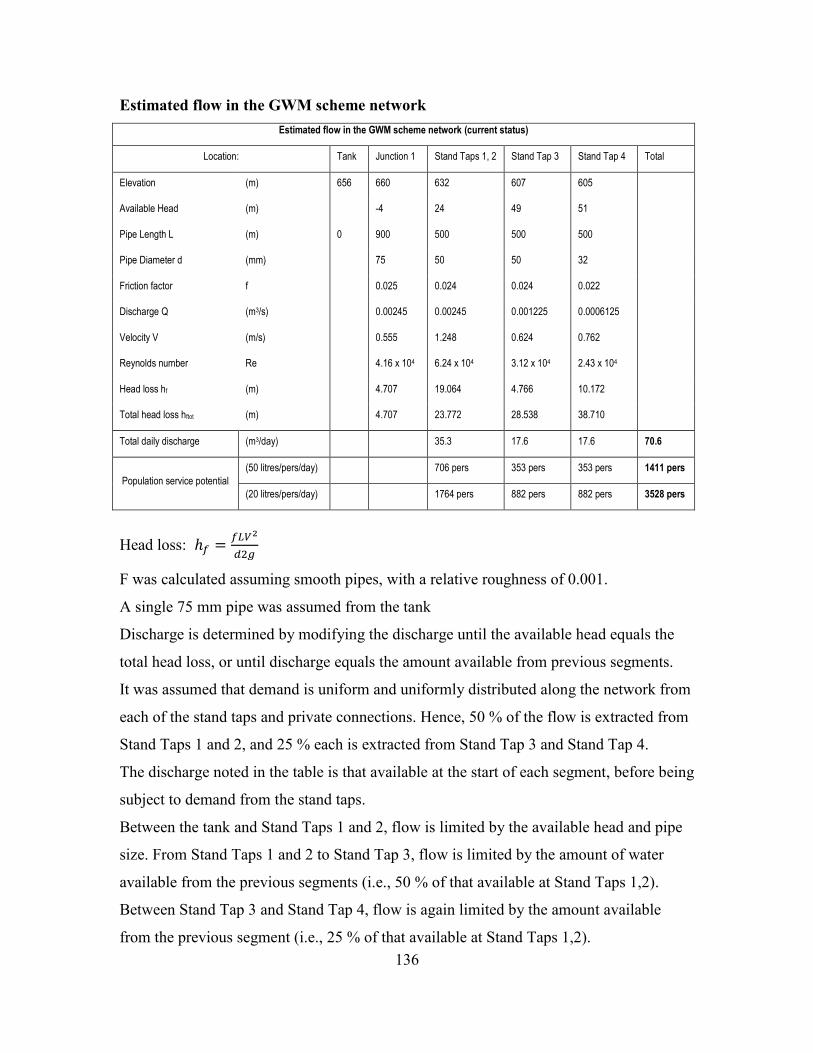
136
Estimated flow in the GWM scheme network
Estimated flow in the GWM scheme network (current status)
Location: Tank Junction 1 Stand Taps 1, 2 Stand Tap 3 Stand Tap 4 Total
Elevation (m) 656 660 632 607 605
Available Head (m) -4 24 49 51
Pipe Length L (m) 0 900 500 500 500
Pipe Diameter d (mm) 75 50 50 32
Friction factor f 0.025 0.024 0.024 0.022
Discharge Q (m3/s) 0.00245 0.00245 0.001225 0.0006125
Velocity V (m/s) 0.555 1.248 0.624 0.762
Reynolds number Re 4.16 x 10⁴ 6.24 x 10⁴ 3.12 x 10⁴ 2.43 x 10⁴
Head loss hf (m) 4.707 19.064 4.766 10.172
Total head loss hftot (m) 4.707 23.772 28.538 38.710
Total daily discharge (m3/day) 35.3 17.6 17.6 70.6
Population service potential
(50 litres/pers/day) 706 pers 353 pers 353 pers 1411 pers
(20 litres/pers/day) 1764 pers 882 pers 882 pers 3528 pers
Head loss:
F was calculated assuming smooth pipes, with a relative roughness of 0.001.
A single 75 mm pipe was assumed from the tank
Discharge is determined by modifying the discharge until the available head equals the
total head loss, or until discharge equals the amount available from previous segments.
It was assumed that demand is uniform and uniformly distributed along the network from
each of the stand taps and private connections. Hence, 50 % of the flow is extracted from
Stand Taps 1 and 2, and 25 % each is extracted from Stand Tap 3 and Stand Tap 4.
The discharge noted in the table is that available at the start of each segment, before being
subject to demand from the stand taps.
Between the tank and Stand Taps 1 and 2, flow is limited by the available head and pipe
size. From Stand Taps 1 and 2 to Stand Tap 3, flow is limited by the amount of water
available from the previous segments (i.e., 50 % of that available at Stand Taps 1,2).
Between Stand Tap 3 and Stand Tap 4, flow is again limited by the amount available
from the previous segment (i.e., 25 % of that available at Stand Taps 1,2).
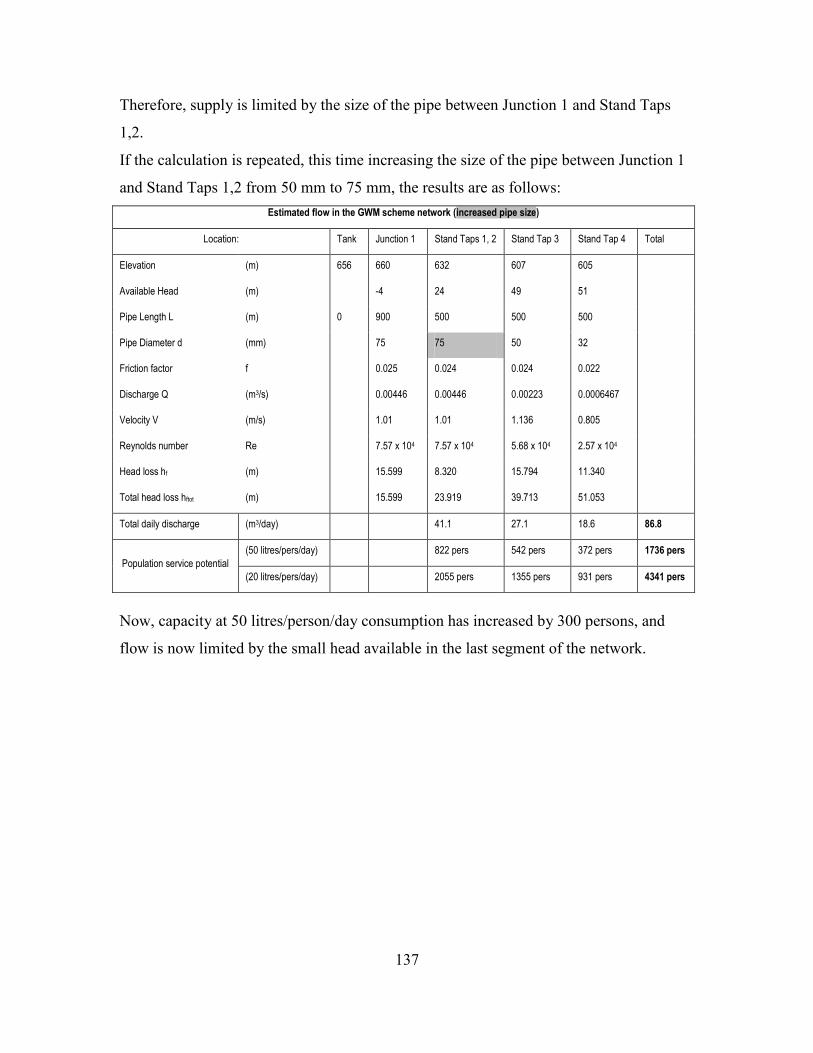
137
Therefore, supply is limited by the size of the pipe between Junction 1 and Stand Taps
1,2.
If the calculation is repeated, this time increasing the size of the pipe between Junction 1
and Stand Taps 1,2 from 50 mm to 75 mm, the results are as follows:
Estimated flow in the GWM scheme network (increased pipe size)
Location: Tank Junction 1 Stand Taps 1, 2 Stand Tap 3 Stand Tap 4 Total
Elevation (m) 656 660 632 607 605
Available Head (m) -4 24 49 51
Pipe Length L (m) 0 900 500 500 500
Pipe Diameter d (mm) 75 75 50 32
Friction factor f 0.025 0.024 0.024 0.022
Discharge Q (m3/s) 0.00446 0.00446 0.00223 0.0006467
Velocity V (m/s) 1.01 1.01 1.136 0.805
Reynolds number Re 7.57 x 10⁴ 7.57 x 10⁴ 5.68 x 10⁴ 2.57 x 10⁴
Head loss hf (m) 15.599 8.320 15.794 11.340
Total head loss hftot (m) 15.599 23.919 39.713 51.053
Total daily discharge (m3/day) 41.1 27.1 18.6 86.8
Population service potential
(50 litres/pers/day) 822 pers 542 pers 372 pers 1736 pers
(20 litres/pers/day) 2055 pers 1355 pers 931 pers 4341 pers
Now, capacity at 50 litres/person/day consumption has increased by 300 persons, and
flow is now limited by the small head available in the last segment of the network.

138
Streamflow estimation
The scheme harnesses water from the Bulu spring source, but the entire spring is not
harnessed. The excess flows as a stream through dense vegetation and bush towards Mile
16. An attempt was made to estimate the flow from this stream in order to obtain
information about the excess capacity of the source. The methodology used, due to
logistical constraints, was the floater method, using a partially submerged floater to
estimate stream velocity, and using a measuring tape to measure channel cross-sectional
area.
The measurements are instantaneous and represent a first estimate of the spring‘s flow in
the tail end of the wet season. It is important to note that this year, rains have been
prolonged into what is habitually the dry season from November to March.
Unfortunately, there were many potential sources of error. Due to dense vegetation
growth, much of the stream is hidden, passing through dense bush, or flowing
underground or under vegetation growth. Hence, it was difficult to find a suitable site for
velocity measurement. Furthermore, the nature of the streams is such that there is a main,
narrow channel with fast flow and depth next to a shallower, slower, wider channel for
which velocity measurement was infeasible due to rocks and debris and tortuosity of the
water path. Hence, velocity measurements could only be made for the main channel, and
as such sites were chosen where the main channel flow was maximized and the secondary
channel was estimated. This results in very large estimated variance of flow. The
estimate below represents an estimation (± 50%) of the flow from the source.
Two points were marked in the channel, at a distance of 5.4 m. The time (seconds)
required for the floater (an orange) to traverse the reach between the two points was
recorded.
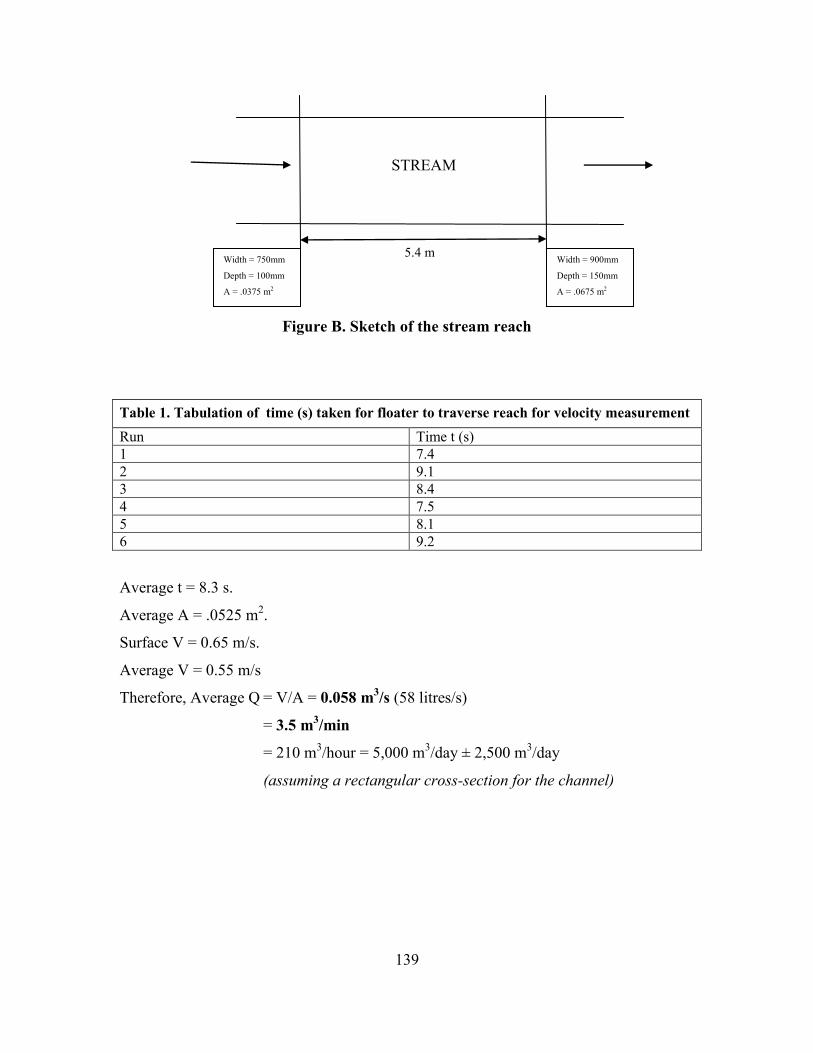
139
Figure B. Sketch of the stream reach
Table 1. Tabulation of time (s) taken for floater to traverse reach for velocity measurement
Run Time t (s)
1 7.4
2 9.1
3 8.4
4 7.5
5 8.1
6 9.2
Average t = 8.3 s.
Average A = .0525 m2.
Surface V = 0.65 m/s.
Average V = 0.55 m/s
Therefore, Average Q = V/A = 0.058 m3/s (58 litres/s)
= 3.5 m3/min
= 210 m3/hour = 5,000 m
3/day ± 2,500 m
3/day
(assuming a rectangular cross-section for the channel)
Width = 750mm
Depth = 100mm
A = .0375 m2
Width = 900mm
Depth = 150mm
A = .0675 m2
5.4 m
STREAM