standard benchmarking spreadsheet including...
TRANSCRIPT

Project Acronym : Green@Hospital
Grant Agreement numbers: : ICT PSP 297290
Project Title: : web-based enerGy management system foR the optimization of the EnErgy coNsumption in Hospitals
Website : www.greenhospital-project.eu
Document version : 9.0
Document Preparation Date : 08/11/2013
Dissemination level : Public
Author(s) : Giacomo Grigis (SCH), Davide Nardi Cesarini (AEA), David Barrachina (HML), Jesus Arbol Bailon (HVN), Ariadni Vasilomichelaki (TUC)
Work Package 2
Pilot’s solution set data analysis
Deliverable D2.5
Standard benchmarking spreadsheet
including manual

Page 2 of 45
Deliverable D2.5
Standard benchmarking spreadsheet including manual
Revision Date Author Organization
Description
1.0 25/06/2013 Giacomo Grigis SCH Index and content description
2.0 06/09/2013 Davide Nardi Cesarini
AEA Contribution concerning eeMeasure and AOR
3.0 13/09/2013 Ariadni Vasilomichelaki
TUC Contribution concerning SGH
4.0 18/09/2013 Jesus Arbol Bailon
HVN Contribution concerning HVN
5.0 27/09/2013 Giacomo Grigis SCH First Draft
6.0 04/10/2013 David Barrachina
HML Contribution concerning HML
7.0 08/10/2013 Giacomo Grigis SCH Second Draft
8.0 15/10/2013 Giacomo Grigis SCH Third Draft
9.0 05/11/2013 Giacomo Grigis SCH Final Version
Statement of originality:
This deliverable contains original unpublished work except where clearly indicated otherwise. Acknowledgement of previously published material and of the work of others has been made through appropriate citation, quotation or both.

Page 3 of 45
Deliverable D2.5
Standard benchmarking spreadsheet including manual
Table of Acronyms
AHU: Air Handling Unit
BMS: Building Management System
CAD: Computer Aided Design
EMCS: Energy Management and Control System
ESCO: Energy Service Company
EUI: energy use/utilization index
HVAC: Heating, Ventilation, Air Conditioning
ICT: Information and Communication Technology
PSP: Policy Support Program
SCADA: Supervisory Control And Data Acquisition
WP: Work Package

Page 4 of 45
Deliverable D2.5
Standard benchmarking spreadsheet including manual
Table of Contents
1. Introduction ..................................................................................................................... 7
2. Pilot Hospitals analysis ..................................................................................................... 8
2.1. Energy Audit analysis.................................................................................................... 8
2.1.1. Azienda Ospedaliero Universitaria Ospedali Riuniti Umberto I – G.M. Lancisi – G.
Salesi - AOR 8
2.1.2. General Hospital Chania Saint George ....................................................................9
2.1.3. Hospital Virgen de las Nieves ............................................................................... 10
2.1.4. Hospital de Mollet ............................................................................................... 12
2.2. BMS-SCADA-ICT check-list analysis ............................................................................. 13
2.2.1. Azienda Ospedaliero Universitaria Ospedali Riuniti Umberto I – G.M. Lancisi – G.
Salesi - AOR 13
2.2.2. General Hospital Chania Saint George .................................................................. 14
2.2.3. Hospital Virgen de las Nieves ............................................................................... 14
2.2.4. Hospital de Mollet ............................................................................................... 15
3. Energy saving solutions’ database .................................................................................. 16
3.1. Introduction ............................................................................................................... 16
3.2. Database description .................................................................................................. 17
3.2.1. Instructions Sheet ................................................................................................ 17
3.2.2. Case Studies Sheet ............................................................................................... 17
3.2.3. -Hospital- Sheet ................................................................................................... 18
4. Existing benchmark tools application ............................................................................. 19
4.1. Energy Star – Portfolio Manager tool ......................................................................... 19
4.1.1. Portfolio Manager tool description ...................................................................... 19
4.1.2. Use of Portfolio Manager Tool for hospital buildings ............................................ 20

Page 5 of 45
Deliverable D2.5
Standard benchmarking spreadsheet including manual
4.1.3. Use of Portfolio Manager in Green@Hospital ...................................................... 21
4.2. eeMeasure portal ....................................................................................................... 22
4.2.1. Tool description ................................................................................................... 22
4.2.2. Solution set registration....................................................................................... 23
4.2.3. Results and remarks on the use of the Tool in Green@Hospital ........................... 23
5. Pilot Hospitals energy consumption benchmark ............................................................. 25
5.1. General data analysis ................................................................................................. 26
5.2. Climate and Weather conditions ................................................................................ 33
5.3. Site and source energy use ......................................................................................... 37
5.4. Workers and Staffed bed influence on Energy use...................................................... 40
5.5. Results comparison with Spanish benchmark ............................................................. 43
5.6. Results comparison with Dutch benchmark ................................................................ 43
6. Conclusions .................................................................................................................... 44
7. References ..................................................................................................................... 45

Page 6 of 45
Deliverable D2.5
Standard benchmarking spreadsheet including manual
List of figures
Figure 1: Distribution of the facilities per countries ..................................................................... 27
Figure 2: Property floor area distribution .................................................................................... 29
Figure 3: Staffed bed and Full Time Equivalent distribution ......................................................... 30
Figure 4: Heating and Cooling Degree Days for the cases............................................................. 33
Figure 5: HDD and country benchmark ........................................................................................ 34
Figure 6: CDD and country benchmark ........................................................................................ 34
Figure 7: Degree Days absolute variation .................................................................................... 35
Figure 8: Degree Days relative variation ...................................................................................... 36
Figure 9: Weather influence on energy use ................................................................................. 37
Figure 10: Site and Source energy use for the current year.......................................................... 38
Figure 11: Energy Utilization Index for the current year ............................................................... 39
Figure 12: Energy Utilization Index related to facility area ........................................................... 39
Figure 13: Energy use per worker ................................................................................................ 40
Figure 14: Energy use per staffed bed ......................................................................................... 41
Figure 15: Energy use Vs number of workers ............................................................................... 42
Figure 16: Energy use Vs staffed bed ........................................................................................... 42
List of tables
Table 1: HVN energy data sources ............................................................................................... 10
Table 2: Main features of benchmark hospitals ........................................................................... 28
Table 3: Energy usage data distribution ....................................................................................... 31
Table 4: Baseline and Current year .............................................................................................. 32
Table 5: Conversion factors used for benchmark ......................................................................... 38
Page 7 of 45
Deliverable D2.5
Standard benchmarking spreadsheet including manual
1. Introduction
This document presents the final results of the analysis performed on the four pilot
hospitals, in terms of energy use benchmarking and energy saving solutions study,
application and comparison.
Data have been collected and elaborated in the framework of WP2 - Pilot’s solution set
data analysis.
With respect to energy saving potentials, they have been initially estimated using the
project partners experience and they have been presented in Deliverable 2.2 - Energy saving
solution set description. Then more detailed analysis based on field collected data analysis
and complex simulation models have been presented in Deliverable 2.4 - Report on data
collection analysis and saving potentials.
With respect to energy benchmark analysis, data collection has started at the very
beginning of WP2 through the implementation of an energy audit in each of the four pilot
hospitals. Feedbacks collected from final users during the audit are reported in chapter 2 of
this document.
The main information related to the solution sets implemented on each hospital have
been organized in a database tool; the structure and characteristics of the database are
presented in the third chapter of this document while the database has been included as
Annex I of this deliverable.
Some international tools have been tested in order to include in the benchmark a larger
number of healthcare facilities whose data have already been collected and validated in an
international context. These tools are described in Chapter 4 and feedbacks concerning their
use are provided in the same chapter.
Another initiative has been carried on to enlarge the hospital sample with the aim of
improving the quality and the relevance of the benchmarking: all project partners collected
energy consumption data from other healthcare facilities, both in their country and not, thus
having a further list of pilot cases to include in the benchmark.

Page 8 of 45
Deliverable D2.5
Standard benchmarking spreadsheet including manual
2. Pilot Hospitals analysis
Pilot hospital analysis has been carried on through site visits and data collection following
the energy audit procedure set and described in Deliverable D2.1 - Standard energy audit
procedure.
Two main forms have been used to collect data in a uniform and shared way: the Energy
Audit Report form and the BMS-SCADA-ICT check-list. In this chapter the partners’ feedbacks
collected after the onsite visits are presented, with a particular focus on strengths and
weaknesses of the proposed forms.
2.1. Energy Audit analysis
2.1.1. Azienda Ospedaliero Universitaria Ospedali Riuniti Umberto I – G.M.
Lancisi – G. Salesi - AOR
Energy audit level I form has been filled in with the contribution of two partners AOR and
AEA. Data concerning building have been collected from documents available in paper form.
Data concerning energy sources and energy use have been collected interviewing the
hospital engineering office personnel. Electricity and Natural Gas bills data collection
involved a third party: these data, in fact, are collected and owned by the energy service
company operating in the hospital facility. The hospital pays a fixed amount of money for the
energy supply and has not access rights to energy measures. For this reason data concerning
the last years are not available and energy source costs could not be referred to the last
years. Data concerning envelop description, artificial lighting and HVAC systems have been
collected during the technical inspection carried on by AEA and AOR personnel.
Feedbacks collected from the hospital personnel concerning the use of the Energy Audit
Level I template are globally positive. The following remarks were highlighted:
- Some information are difficult to collect in a facility where a third party such as an
energy service company is operating;

Page 9 of 45
Deliverable D2.5
Standard benchmarking spreadsheet including manual
- Data collection was time consuming and required the contribution of operators with
different experiences and roles.
The use of this tool brought the hospital personnel to be aware of the lack of information
available to the technical office and of the necessity to have access to energy consumption
data to optimize the management of the hospital facility.
2.1.2. General Hospital Chania Saint George
People from SGH and from TUC collaborated in order to fill the report of Energy audit
level I. Data concerning SGH’s building characteristics and envelope description have been
collected from reports and documents available in paper form. Statistical data concerning
preliminary building use have been used by Patient observation office. As for the energy
sources, data have been collected from information and notes of the hospital engineers and
technicians. Electricity and Oil bills have been analyzed in order to fill the Energy bill data
sheet as requested. Bills are available just in paper form and have been gathered from the
accountant's office of the hospital. Moreover data concerning artificial lighting and HVAC
systems have been collected during the technical inspection carried on by TUC and SGH
engineers and technicians.
Concerning the process of Energy audit level I reporting, it should be noted that it was
needed to dedicate a lot of time as the data collection was difficult due to the non-organized
documents that were necessary for the preparation of the audit. In addition the whole
process required the contribution of the hospital engineers and technicians and that was
sometimes difficult due to their heavy schedule. It should be remarked that the Energy audit
level I reporting has helped the hospital engineers to collect together all the data that
describe the energy behavior of the hospital and the report has been recognized as a useful
tool in order to optimize the energy efficiency of the building as now the energy
consumption is recorded in detail.

Page 10 of 45
Deliverable D2.5
Standard benchmarking spreadsheet including manual
2.1.3. Hospital Virgen de las Nieves
Energy audit level I form has been filled mainly using the available information owned by
the engineering and construction department belonging to HVN.
Using CAD graphical information, total areas and envelope characteristics (walls and
glazed surfaces) have been described. The structural characteristics of buildings and their
descriptions have been obtained by direct staff interviews and technical inspection visits.
With respect to air-conditioned areas calculation, existing administrative database of the
economic department have been used: in this document building areas are grouped in terms
of use. From this database it has been possible to identify the areas that do not have air
conditioning and.
Energy consumption data have been obtained from the historical record of consumption
of the hospital, fed with monthly bills both of the electrical energy companies and of Energy
Services Company that manages the cogeneration plant.
Data Data sources
Electricity (conventional) Electric supplier company
Conventional thermal ESCO
Electricity cogeneration ESCO
Thermal cogeneration ESCO
Total Natural Gas Natural gas supplier company. (Client ESCO)
Table 1: HVN energy data sources
Energy costs have been collected from the bills, indicating the portion of consumption,
contracted power, and cogeneration production, excluding taxes.
Since there is no possibility of splitting energy consumption by buildings, collected data
are affected by a small error because some energy produced by the hospital power plant is
delivered to a building which does not belong to the healthcare facility. However this
amount of energy is so low that can be considered negligible.
The lighting system features have been collected referring to previous surveys recently
conducted in the technical department.

Page 11 of 45
Deliverable D2.5
Standard benchmarking spreadsheet including manual
The main information concerning HVAC systems and AHUs have been derived from an
existing software application for maintenance management and also through HVN
inspections needed to identify power and flow characteristics. This was a tough task since
most of the AHUs are old and no technical documentation is available.
Data concerning elevators number and characteristics have been obtained from HVN
technical documentation.
Tool strengths observed during the use are:
• It provides rates of energy consumption per m2;
• It is useful to have an order of magnitude of the ratio of energy consumption/m2,
and costs/ kW excluding taxes, which facilitates the comparison with facilities located in
different countries;
• It summarizes the main features of the buildings energy uses;
• It highlights the lack of documentation of the old systems.
Tool weaknesses observed during the use are:
• HVN is made of multiple buildings powered by a single thermal plant and single point
of delivery, (administrative buildings, hospital buildings) without the possibility of
differentiating the consumption of each building. This has forced to sum the areas of all
buildings to get the correct ratio for power or energy per square meter. However it was not
possible to impute correctly all the energy services such as laundry for example that are fed
from another power plant. For these reasons it was necessary to modify the initial format of
the form to add the description of each building separately.
• The availability of a cogeneration plant was not foreseen in the form. This meant
adding more columns to target the energy and associated costs.
• The "Measured Demand (kW)" value could not be evaluated. This data is the
maximum of the sum of the power demand curve measured by the power supply company,
and the power curve of the Cogeneration Plant production. Unfortunately the latter value
was not available.

Page 12 of 45
Deliverable D2.5
Standard benchmarking spreadsheet including manual
• Furthermore the existence of a cogeneration plant makes also Energy Bill sheet filling
more complicated. Electricity and natural gas consumptions and costs are connected and
they should be evaluated as follows:
a. Total electricity consumption (as conventional electricity + sum of electricity
from cogeneration) and total heat consumption (as a sum of conventional thermal
energy + thermal energy cogeneration).
b. In terms of primary energy, the consumption of conventional electricity +
natural gas consumption (the latter is divided into electric energy cogeneration,
thermal energy from cogeneration and conventional thermal energy)
For presenting both options it was necessary to add a sheet on the form: ("Energy Bill 0"
and "Energy Bill")
• The factor used by spreadsheet to convert m3 of natural gas in kWh is a constant
value of 10.4 m3/kWh, however in the HVN, the data we have is that the PCS is about 11.8.
m3/kWh.
The Energy Audit Report form has been updated with this suggestion.
2.1.4. Hospital de Mollet
Energy audit level I form has been filled with the contributions of AGE, responsible for
the full maintenance and energy management of the Hospital, and ENERGEA a company
responsible for implementing the internal required energy audit for ISO 50001 certification.
Data concerning the building have been collected from the executive project, delivered
at the end of the Hospital construction. The Hospital of Mollet is a new hospital, with three
years of operation, and all the technical information is available for the technical staff from
Hospital of Mollet.

Page 13 of 45
Deliverable D2.5
Standard benchmarking spreadsheet including manual
Concerning energy sources and energy use, an energy manager from AGE is responsible
for all matters concerning the hospital energy consumption. The collection of Electricity and
Natural Gas bills involved also the accounting department.
Data concerning envelope description, artificial lighting and HVAC systems have been
collected in the commissioning phase of the installation. A complete inventory of all
equipment has been performed.
A total of 47 meters have been installed for the project purposes, both electrical and
thermal meters. They will be used to improve the awareness of the system performance and
its efficiency.
2.2. BMS-SCADA-ICT check-list analysis
2.2.1. Azienda Ospedaliero Universitaria Ospedali Riuniti Umberto I – G.M.
Lancisi – G. Salesi - AOR
BMS-SCADA-ICT check-list has been filled in with the contribution of AOR and AEA. Two
forms have been filled in: one for the overall hospital and one dedicated to the data center.
Data collection for the first form was particularly challenging since more than one BMS is
installed in the hospital and the systems are old fashioned. Moreover the system is not
managed directly by the hospital personnel but by the Energy Service Company operating in
AOR.
Concerning the second form dedicated to the Data Centre, data collection has been
much easier since the system has been implemented in 2011 by AOR and AEA: all the
documents needed to complete the form were available in electronic form.
The application of this tool was useful to highlight the lack of documentation concerning
the oldest systems and the lack of integration among the different management systems
installed: the Green@Hospital Web-EMCS is seen as the first step towards the centralization
of all the information concerning energy management.

Page 14 of 45
Deliverable D2.5
Standard benchmarking spreadsheet including manual
2.2.2. General Hospital Chania Saint George
SGH and TUC collaborated in order to fill the report of BMS SCADA-ICT check-list. Data
collection finalized to BMS SCADA-ICT check-list filling has been a quite difficult process as all
the necessary documents are available just in paper form and few of them in electronic form.
Another difficulty has been the recording of AHUs’ characteristics as technical sheets for
them are not available and technical inspection for all of them was requested. In addition
the whole process required the contribution of the hospital technicians and that was
sometime difficult due to their busy schedule.
It should be remarked the role of SGH BMS for the collection of data needed to fill in the
BMS SCADA-ICT check-list. Even if at the moment the BMS in SGH has mainly a monitoring
role, through this tool is shown clearly the potential of the system in order to optimize the
energy efficiency of the hospital playing active key role in the energy management of the
hospital.
2.2.3. Hospital Virgen de las Nieves
BMS-SCADA-ICT checklist has been filled from the collaboration with an external service
provider that has implemented the system in recent years.
The system management is a shared task: the external company performs more complex
tasks of configuration, set points change, historical data analysis or fault investigation, and
the personnel of HVN is responsible for the daily supervision of controlled installations
without having a deep knowledge of the technical features of the BMS-SCADA-ICT system.
For this reason most of the sections of the questionnaire was completed with the help of
the auxiliary company.
With respect to the data sheet "Technical audit", information were obtained from the
existing documents on the HVN and inspections. In some cases columns for each building
were inserted in order to to add more detailed data. It has been difficult to collect some of
the information required for AHU’s section.

Page 15 of 45
Deliverable D2.5
Standard benchmarking spreadsheet including manual
The main tool strengths observed during the use are listed below:
- It highlights the lack of documentation referring to the old systems;
- It summarizes the existing control systems and controlled systems;
- It makes system operators aware about the control systems potentials and their
exploitation.
2.2.4. Hospital de Mollet
BMS-SCADA-ICT check-list has been filled in with the contribution of AGE.
This part was fairly easy because in this hospital there is only one supervisory system for
all the equipments and the system is new if compared to other existing Hospitals. Moreover
the system is not managed directly by the hospital personnel or medical staff, but by the
technical staff from Hospital of Mollet.
The application of this tool is really easy to handle and allows to know and understand
the schedule of each lighting and air conditioning equipment.

Page 16 of 45
Deliverable D2.5
Standard benchmarking spreadsheet including manual
3. Energy saving solutions’ database
3.1. Introduction
The aim of the database is to provide a common tool to gather the most significant
information on hospital buildings retrofit solutions in order to evaluate the effectiveness of
the energy saving solution implemented and its impact on the whole building energy
efficiency.
Each solution consists of an ICT retrofit aimed at improving energy efficiency and building
management in specific hospital areas. The solution is usually described by a typical “before”
and “after” state, characteristics of its implementation and reached benefits.
To develop a useful database, some characteristics are needed, such as:
- Ease of filling;
- Ease of reading and interpretation;
- The structure of the database should match the type of information that the
database should gather and show (different information for: type of cell, unit of
measure, need of add notes and comments, multiple choice filling,…);
- Modularity: even if the database has been created in the context of Green@Hospital
project its use should not be limited to the project itself but it should be expandable
to other test cases.
The database has been developed at the same time as the analysis on saving potential on
the implemented solutions. In this way project partners have been able to work on energy
savings having a complete overview of the needed information.
The main benefits of the database are:
- Collection and availability of information from different case studies;
- Comparison of the energy consumption data and of solution set implementation;
- Evaluation on both qualitative and quantitative aspects of the solution’s
implementation;

Page 17 of 45
Deliverable D2.5
Standard benchmarking spreadsheet including manual
- Possibility to see and use information gathered in a standard way.
3.2. Database description
The database is based on Excel worksheets. The document is organized in sheets as
follows:
- Instructions sheet –this sheet presents the instructions for the database use;
- Case Studies sheet – the solution implemented are listed in a summarizing table;
- -Hospital- sheet – this is the main database sheet; it contains the main characteristics
of the described Hospital and the solutions implemented;
- Back up sheet – this is the last sheet and it contains the lists and the menus useful for
the document construction. In the final version this sheet will be hidden.
The worksheets filled in for each hospital are presented in Annex I to this deliverable.
3.2.1. Instructions Sheet
The Instruction sheet was built up in order to help the user to fill in the data base
template. Each field is introduced briefly in order to support the user during its activity and
each sheet is presented in terms of scope.
3.2.2. Case Studies Sheet
The Case Studies sheet presents a summary of the solutions and case studies included in
the database. As for the case studies, it is possible to indicate:
- The name of the Case study
- The country

Page 18 of 45
Deliverable D2.5
Standard benchmarking spreadsheet including manual
- The Acronym used to identify the case study
The table presents the energy efficiency solutions implemented on the hospitals divided
into the different systems involved by the solution and the type of solution. The solutions
implemented in this project belong to HVAC and Lighting systems; for this reason these are
the categories already present in the database. In a view of modularity and extension of the
database it is possible to add categories and type of solutions on needs.
3.2.3. -Hospital- Sheet
Each pilot case is described in a different datasheet to be renamed with the Pilot Case
name.
This sheet includes:
- General information of the case: this section includes location and information on the
size of the hospital
- Building energy saving: in this section the effect of all the solutions implemented in
each pilot case is shown. Data concerning site and source energy consumptions are
presented both before and after the implementation of the solution set in order to
appreciate the effect of all the energy saving measures on the overall energy
consumption
- Solution set: in this section the solutions are presented in order to understand the
characteristics and benefits of the single solution on energy consumption. Some
qualitative information is required to focus on the type of solution and its impact on
the existing systems. The quantitative information are used to evaluate the impact of
the solution both on the whole building and on the area and system interested by the
solution in order to be able to understand the benefits of the solution
implementation independently from the building characteristics and use.
The Instruction sheet explains the information needed for the “–Hospital– ” one, the type
of cell and the instructions for filling.

Page 19 of 45
Deliverable D2.5
Standard benchmarking spreadsheet including manual
4. Existing benchmark tools application
To assess the impact of the implementation of the solution set for each hospital, the
project team has evaluated the possibility of using some existing tools, with the aim of both
deepen the analysis of the solution set and test the operation of the chosen tools.
The two used tools are:
- Portfolio Manager of Energy Star portal;
- eeMeasure portal;
In the following paragraph the two tools and their application in this project are
presented.
4.1. Energy Star – Portfolio Manager tool
4.1.1. Portfolio Manager tool description
Energy Star is a government-industry partnership managed by the U.S. Environmental
Protection Agency and the U.S. Department of Energy. The program is diffused through a
website that offers information on energy saving strategies, benchmark software for
buildings and efficient product procurement guidelines.
Portfolio Manager is one of the tools proposed by the website; it can be used as an
interactive energy management tool to record energy consumption data, set targets and
assess the consumptions of individual buildings as well as buildings portfolios, being useful
for the single building manager up to the manager of a wide group of buildings.
In order to produce a useful and accurate assessment of a building performance, the
portal follows four criteria:
- Energy performance evaluation on the whole building: to assess the equipment and
its interaction with the building’s characteristics;

Page 20 of 45
Deliverable D2.5
Standard benchmarking spreadsheet including manual
- Use of real energy consumption data: the energy consumption is not predicted or
simulated, but comes from the direct input of the building energy use;
- Data normalization: data are normalized on the base of operation information such
as number of occupants, staffed beds, operating hours;
- Comparison among a group of peers: the benchmark is proposed among consistent
group of building, similar for main function, operating condition.
The U.S. Environmental Protection Agency periodically collects and verifies these data
through the Commercial Building Energy Consumption Survey (CBECS). EPA always uses a
statistically robust national dataset; the other buildings included by the tool’s final users are
not used to update the benchmark, they are only included so as the final user can analyze its
building in comparison to the data set proposed by the portal.
The main characteristic of this tool is that it is possible to track different metrics useful
for the building evaluation and comparison; it is possible to create graphs and reports and
choose the metrics that can be useful for different evaluation, creating a new report
template to be exported in the form of a spreadsheet.
4.1.2. Use of Portfolio Manager Tool for hospital buildings
Portfolio Manager proposes an energy consumption analysis distinguishing on the main
building uses, among which hospitals are included.
In order to produce an assessment related to buildings peers, the analysis takes into
account weather, climate and business activities. The significant aspects of building activities
depend on the primary function and are used in Portfolio Manager to normalize energy
consumption data.
For hospitals the analysis performed depends on the following business related aspects:
- Building size;
- Number of full-time equivalent workers;
Page 21 of 45
Deliverable D2.5
Standard benchmarking spreadsheet including manual
- Number of staffed beds;
- Number of magnetic resonance imaging (MRI) machines.
Reference data used to establish the peer building population in the United States is
based on data from an industry survey conducted by the American Society for Healthcare
Engineering (ASHE), a personal membership society of the American Hospital Association
(AHA). Energy Star staff has analyzed the data from the survey applying filters to define the
peer group of comparison and to overcome any technical limitations in the data. This
analysis brought to a set of 191 hospital buildings used for the energy benchmark. The
Chapter 5 of this document gives indications on the reference and the analysis performed by
Energy Star on the collected data.
The analysis is periodically updated; new data and benchmark are included just after an
accurate analysis of the collected data in order to avoid limitations and errors in the analysis.
For this reason the buildings added by the Portfolio Manager’s user does not affect
immediately the existing analysis and does not contribute to update the benchmark.
4.1.3. Use of Portfolio Manager in Green@Hospital
The four pilot hospitals have been added in the Portfolio Manager including the building
features and the energy consumption data collected during the audit. Getting recent data
about hospital consumption has been a complex task; collected data belong to one year but
the analyzed period is not the same for all the hospitals. Moreover, in one case, it has not
been possible to collect data concerning all energy sources because the contract between
the hospital and the external company who is responsible for its energy management does
not allow the hospital to make public data concerning energy consumption.
After the registration of the pilot cases it has been possible to assess the energy rating of
the hospitals as compared to the Portfolio Manager Benchmark. All the hospitals have
resulted in the highest section of the rating, scoring 100/100 of the Energy Star scale, which
is based on a percentile statistics. This may be resulted because the data used to determine

Page 22 of 45
Deliverable D2.5
Standard benchmarking spreadsheet including manual
correlations between energy and space attribute characteristics was obtained from a survey
of facilities within the United States performed by the American Hospital Association. The
AHA's survey included nearly all of the hospitals in the United States, but did not include
European hospitals. These found correlations are used to estimate the Portfolio Manager
facility's annual expected energy consumption given entered space attribute characteristics
and location information. The estimated annual energy consumption for the facility is then
compared to the facilities actual energy (user entered meter data) to generate the ENERGY
STAR score. Because of this, the non US or Canadian facilities may score high ENERGY STAR
points even if it may not really mean an outstanding performance among European buildings.
While the Portfolio Manager system can be used for international facilities, the system was
not designed specifically for countries outside of the United States.
4.2. eeMeasure portal
eeMeasure is the name of the web based software developed in the framework of the
project study - "Methodology for energy-efficiency measurements applicable to ICT in
buildings" (SERVICE CONTRACT SMART 2011/0072). eeMeasure enables to calculate and
record energy saving results using a consistent methodology. In turn this enables the
European Commission and other interested parties to produce a better quantitative analysis
of the energy savings potential of ICT based solutions in residential and non-residential
buildings. The main advantage of this tool consists in enabling the comparison among results
reached by different projects developed in the same framework such as ICT PSP projects.
4.2.1. Tool description
eeMeasure tool is a Web platform available at the URL
http://eemeasure.smartspaces.eu/. The web tool has been developed integrating the
“Residential methodology for energy saving measurement” which is a common deliverable
from the projects for sustainable growth in the residential sector and the “Non residential
methodology” developed in the framework of the eeMeasure project by Empirica. Both
methodologies are based on the International Performance Measurement and Verification

Page 23 of 45
Deliverable D2.5
Standard benchmarking spreadsheet including manual
Protocol (IPMVP). They are both developed from the experience of current and historic ICT
PSP projects which includes approximately 10,000 social dwellings and 30 public buildings
(e.g. hospitals, schools). The main output of this tool is a report presenting project results in
terms of energy savings calculated with a shared and common methodology. A complete
user guide is available to guide the user to load data in the platform.
4.2.2. Solution set registration
The tool expects to follow a four steps procedure to get to the final result:
- Upload baseline period data
- Create and edit a prediction model
- Upload test period data
- Calculate and edit results
The same process can be applied to different scales: project, building or solution set
scale. For each case energy data must be stored and loaded together with predictor
variables. A Predictor Variable is time series data that is used, along with energy
consumption data, to calculate a regression equation (the Prediction Model) and then used
to predict future energy consumption. The comparison between baseline period data and
test period data adequately normalized using predictor variables allow to calculate energy
savings.
The final report highlights energy savings and describes the main features of the project
and the building involved.
4.2.3. Results and remarks on the use of the Tool in Green@Hospital
The Published Results section of the tool has been searched for hospital related data;
only one report matches the search criteria: Universitair Medisch Centrum Groningen
(HosPilot project).

Page 24 of 45
Deliverable D2.5
Standard benchmarking spreadsheet including manual
The hospital has been contacted to get more data concerning the overall performance of
the building in order to compare not only the results reached by the Hospital in term of
energy saving percentage but also to collect other information concerning the building
useful to calculate the KPIs presented in Chapter 5.
The eeMeasure tool will be used during the final part of the project: baseline period data
and test period data will be uploaded in order to calculate energy savings according to
eeMeasure methodology. Each solution set will be evaluated according to this approach.
Furthermore the benchmarking model presented in Chapter 5 will allow to simulate baseline
period data and test period data for a virtual Green Hospital integrating all the solution sets
tested in the framework of this project.

Page 25 of 45
Deliverable D2.5
Standard benchmarking spreadsheet including manual
5. Pilot Hospitals energy consumption benchmark
In order to reduce energy consumption it is important, first of all, to know how much the
building and the activities analyzed are consuming, both in absolute and relative terms. This
means that data collection and information on energy consumption are fundamental to
understand the amount of energy and cost related to energy that a building or a smaller part
of it is using. To set a target of energy savings as more reliable and reasonable as possible, it
is also important to realize how much the hospital is consuming if compared to other ones,
assessed through the use of key performance indicators (KPIs).
The total amount of energy used for buildings is often reported as EUI, Energy Use Index.
The EUI is the most used KPI and represents the total amount of energy use for all the
sources, typically electric energy, gas and oil, per square meter, indicated on an annual basis;
the most used unit of measure is thus kWh/m2 year.
For hospital buildings, Portfolio Manager (ref Chapter 4.1) refers to the US Commercial
Building Energy Consumption Survey (CBECS) that is a US national database of building
operational energy use that provides a reference to how much energy buildings consume by
climate zone and by building use type. The national average site energy use index (EUI) for
hospitals surveyed by CBECS is 784.35 kWh/m2 Year; this value is much more higher than
the values found in the analysis of this project’s pilots and this is the reason why all the
hospitals had a score of 100.
Moreover, while this value is the US national average for energy use in hospitals, the
energy intensity usually varies in a wide range of EUI. The energy use is usually different
from one healthcare facility to another because the activities and the use of the buildings
can vary depending on the dimension, the presence of clinical spaces, and the activities
intensity. Many factors play a role in determining the energy use and a single index may be
not enough to evaluate the energy efficiency of a building, however for initial benchmarking
aims the EUI is a good parameter to compare different structures.

Page 26 of 45
Deliverable D2.5
Standard benchmarking spreadsheet including manual
In the Performance Metrics section of Deliverable 2.1 – Standard energy audit procedure,
an extended presentation of metrics set has been presented considering both energy and
system metrics.
The aim of this analysis is to compare the basic energy metrics evaluating the energy
performance of the building on the basis of whole building utility meter data. For this
comparison the partners have been asked to collect energy usage data also from other
hospital structures; this research brought to the availability of datasets from 13 hospitals.
The main results achieved are presented in the following paragraphs by means of graphics
and comments.
5.1. General data analysis
Data gathered from the four pilot hospitals have been analyzed and considered for the
benchmark.
In order to compare the energy performance of four pilots with a wider range of cases,
the partners tried to enlarge the sample group including other healthcare facilities. A form
has been prepared aimed at collecting the main characteristics of the facility and energy
usage data. Thirteen further facilities have been added to the analysis. Added facilities
belong to Greece, Netherlands and Spain. The facilities distribution divided into countries is
shown in the following figure: the majority of the cases are from Greece and Spain, countries
represented also by the project pilots, while no further Italian facilities have been added.
One Dutch facility has been included, even if there are no Dutch facilities among the pilot
cases.

Page 27 of 45
Deliverable D2.5
Standard benchmarking spreadsheet including manual
Figure 1: Distribution of the facilities per countries
The main general features of the 17 facilities are summarized in the following table. The
lines of the table highlighted in grey color are those referred to the project pilots.
Facility Name State/
Province City
Facility Floor Area (Buildings) (m²)
Year Built
G@H - Azienda Ospedaliero Universitaria Ospedali Riuniti
Italy Ancona 124230,0 1970
G@H - CHANIA GENERAL HOSPITAL Greece Chania 58993,0 2000
G@H - Hospital de Mollet Spain Barcelona 45270,0 2007
G@H - Hospital Universitario Virgen De Las Nieves
Spain Granada (ES) 91206,0 1953
University Medical Center in Groningen
Netherlands Groningen 388503,0 1980
Hospital Universitario San Cecilio Spain Granada 56372,0 1921
Hospital Universitario Virgen del Rocío
Spain Sevilla 208026,0 1956
Agencia Sanitaria Alto Quadalquivir Spain Andujar (Jaén)
19700,0 1998

Page 28 of 45
Deliverable D2.5
Standard benchmarking spreadsheet including manual
Facility Name State/
Province City
Facility Floor Area (Buildings) (m²)
Year Built
Hospital Universitario Virgen Macarena
Spain Sevilla 81411,0 1974
Hospital de Poniente Spain El Ejido 48429,0 1997
Agios Nikolaos General Hospital Greece Agios
Nikolaos 9546,0 1960
Sitia General hospital Greece Sitia 6870,0 1994
Venizeleio Pananio General Hospital Greece Heraklion 26031,0 1955
Fundaciò Hospital De L'Esperit Sant Spain Santa Coloma de Gramenet
27000,0 2007
Consorci Hospitalari De Vic Spain Vic 42725,0 2007
Sanitària Hospital De La Santa Creu i Sant Pau
Spain Barcelona 128319,0 2009
Consorci Sanitari Clìnic Spain Barcelona 101086,0 1906
Table 2: Main features of benchmark hospitals
The following graphs show some of the main features of the healthcare facilities. Figure 2
highlights the facility floor area for each hospital. It can be noticed that in the sample group
hospitals of various dimensions are represented.
Linear regression method has been applied to find a correlation between energy
consumption and some key normalization factors. The R2 (R squared) value has been
considered to evaluate the quality of the correlation.

Page 29 of 45
Deliverable D2.5
Standard benchmarking spreadsheet including manual
Figure 2: Property floor area distribution
Figure 3 highlights the relationship between number of staffed beds and full time
equivalent occupation on one side and gross floor area from the other side.
It can be seen that there is a good correlation between hospital gross area and number
of staffed bed while the correlation between equivalent occupation and gross floor area is
less significant.

Page 30 of 45
Deliverable D2.5
Standard benchmarking spreadsheet including manual
Figure 3: Staffed bed and Full Time Equivalent distribution
Some problems have been found in the data collection phase concerning energy use of
the facilities for two main reasons: the first is that in some cases energy data are managed
by a third party. The involvement of these third parties was not easy and in some cases
energy usage data could not be gathered because often it happens that a facility pays a fixed
cost for energy management independently from the amount of energy used and the service
company does not agree at giving the energy consumption data.
The other aspect of energy use data collection is that the data belong to different time
periods; in the data collection request it has been asked to collect energy use data divided
into entire months, as much recent as possible, and it was suggested to collect data for at
least two years. The following figure shows the available energy usage data per time period
and per facility.

Page 31 of 45
Deliverable D2.5
Standard benchmarking spreadsheet including manual
Table 3: Energy usage data distribution
In order to compare this data, a baseline and current year has been defined. The baseline
year consists in the oldest 12-months period of available energy data, the current year is the
most recent 12-month period of available energy data. In some cases the baseline and
current periods coincide because of lack of data. The comparison among the facilities is done
on the Current year.
The following table shows the baseline and current period for each facility.
2013
1st half 2nd half 1st half 2nd half 1st half 2nd half 1st half 2nd half 1st half 2nd half 1st half
Electric
Thermal (GAS)
Electric
Thermal (OIL)
Electric
Thermal (GAS)
Electric
Thermal (GAS)
Electric
Thermal (GAS)
Electric
Thermal (OIL)
Thermal (GPL)
Electric
Thermal (GAS)
Electric
Thermal (GAS)
Electric
Thermal (GAS)
Electric
Thermal (GAS)
Electric only costs only costs only costs only costs
Thermal (OIL)
Thermal (GPL)
Electric
Thermal (OIL) estimation estimation
Electric
Thermal (OIL)
Electric
Thermal (GAS)
Electric
Thermal (GAS)
Electric
Thermal (GAS)
Electric
Thermal (GAS)
Consorci
Sanitari Clìnic
2012
AOR
Fundaciò
Hospital
Consorci
Hospitalari
Sanitària
Hospital
Virgen del
Rocio
2008 2009 2010 2011
SGH
HML
HVN
UMCG
S. Cecilio
Alto
Guadalquivir
Virgen
Macarena
Poniente
Sitia
Venizeleio
Agios
Nikolaos

Page 32 of 45
Deliverable D2.5
Standard benchmarking spreadsheet including manual
Property Name Current Year
Ending Baseline Year
Ending State/
Province Notes and assumptions
G@H - Azienda Ospedaliero Universitaria
Ospedali Riuniti 31/12/2011 31/12/2011 Italy
Out of energy benchmark because electric energy
consumption not available G@H - CHANIA GENERAL
HOSPITAL 31/01/2013 31/01/2012 Greece
G@H - Hospital de Mollet 31/12/2012 31/12/2011 Spain
G@H - Hospital Universitario Virgen De Las
Nieves 30/06/2012 30/06/2011 Spain
University Medical Center in Groningen
31/12/2012 31/12/2011 Netherlands
Hospital Universitario San Cecilio
31/12/2012 31/12/2011 Spain
Hospital Universitario Virgen del Rocío
31/12/2012 31/12/2012 Spain One year of energy consumption data
Agencia Sanitaria Alto Quadalquivir
31/12/2012 31/12/2011 Spain
Hospital Universitario Virgen Macarena
31/12/2012 31/12/2012 Spain One year of energy consumption data
Hospital de Poniente 31/05/2013 31/05/2012 Spain
Agios Nikolaos General Hospital
31/12/2012 31/12/2011 Greece Electric energy use only in costs. Estimation of 0,057
€/kWh
Sitia General hospital 31/12/2009 31/12/2008 Greece
Venizeleio Pananio General Hospital
31/12/2012 31/12/2012 Greece One year of energy consumption data
Fundaciò Hospital De L'Esperit Sant
31/12/2012 31/12/2011 Spain
Consorci Hospitalari De Vic 31/12/2012 31/12/2011 Spain
Sanitària Hospital De La Santa Creu i Sant Pau
31/12/2012 31/12/2011 Spain
Consorci Sanitari Clìnic 31/12/2012 31/12/2011 Spain
Table 4: Baseline and Current year

Page 33 of 45
Deliverable D2.5
Standard benchmarking spreadsheet including manual
5.2. Climate and Weather conditions
The amount of energy needed to satisfy heating and cooling requirements is affected by
the climate of the area where the property is located and by the annual variations in
weather conditions.
Degree day concept has been used to evaluate climate and weather variations; degree
days have been chosen as normalizing factor. The reference for degree days data is Portfolio
Manager – Energy star that gives detailed data for different locations and different years of
the same location. Degree days are measured in relationship to a reference value of 18 °C.
Above 18 °C it is assumed that the facility needs to be cooled and below 18 °C it is assumed
that the facility needs to be heated. Heating Degree Days (HDD) is the annual equivalent
number of days that is needed to heat a building by 1 degree to accommodate the heating
requirement. Cooling Degree Days (CDD) is defined in a similar way.
The differences in climate conditions among the analyzed cases are shown in the
following graphs by means of heating and cooling degree days.
Figure 4: Heating and Cooling Degree Days for the cases

Page 34 of 45
Deliverable D2.5
Standard benchmarking spreadsheet including manual
In Figure 5 and Figure 6 data are grouped by Country.
Figure 5: HDD and country benchmark
Figure 6: CDD and country benchmark

Page 35 of 45
Deliverable D2.5
Standard benchmarking spreadsheet including manual
Even if it is not possible to know the used regression equation, Portfolio Manager
analysis takes into account climate variations in the calculation of the predicted energy use
in order to calculate the Energy Star Score. In this application it has not been possible to
appreciate the influence of the different climate on the facilities energy use because all the
facilities scored 100.
Energy Star proposes to take into account for yearly weather variations through the
index Weather Normalized Energy; this metric evaluates the effects of energy consumption
over the time, but does not account for differences between the building’s location and
other locations with different climates.
The HDD and CDD variation between the years is shown in Figure 7 and 8; clearly the
cases where only one year of energy data were available show no variation.
Figure 7: Degree Days absolute variation

Page 36 of 45
Deliverable D2.5
Standard benchmarking spreadsheet including manual
Figure 8: Degree Days relative variation
Figure 9 shows that in this analysis the degree days variation does not affect too much
the site energy use; the percentage variation of the data from the weather normalized ones
reaches a maximum of 7%. The analysis of degree days influence on energy use shows some
limits of application: these limits are mainly due to the lack of numerous data. In fact this
analysis should be deepened evaluating the variation of energy use on the basis of
occupation schedule and systems operation and calculating degree days on different
temperature bases. For this reason and considering the small variation of energy
consumption indexes for the analyzed cases, the energy use analysis has been carried on
analyzing the site and source data without weather normalization.

Page 37 of 45
Deliverable D2.5
Standard benchmarking spreadsheet including manual
Figure 9: Weather influence on energy use
5.3. Site and source energy use
As already described in Deliverable 2.1- Standard energy audit procedure, in order to
make the comparison among different hospitals possible, both site and source energy use
are evaluated.
Site energy is defined as the annual amount of the energy consumed by the property, as
reported in the utility bills, while source energy is defined as the total amount of raw fuel
used to operate the building. In addition to what the building consumes, source energy
considers also the losses that take place during generation, transmission and distribution of
the energy.
Conversion factors have been discussed and defined in Deliverable 2.1; for the following
analysis the used conversion factors are listed in Table 5.

Page 38 of 45
Deliverable D2.5
Standard benchmarking spreadsheet including manual
Energy carrier PEI
Electricity - grid purchased
Italy 2.17
Greece 2.90
Spain 2.28
Netherland 2.56
Europe 3.14
Natural gas 1.1
Oil 1.1
Table 5: Conversion factors used for benchmark
PEI: primary energy indicator (kWhprimary/kWhdelivered);
Figure 10 shows the site and source energy value for each healthcare facility.
Figure 10: Site and Source energy use for the current year
The facilities that show a higher energy use of energy are the Dutch one and Hospital
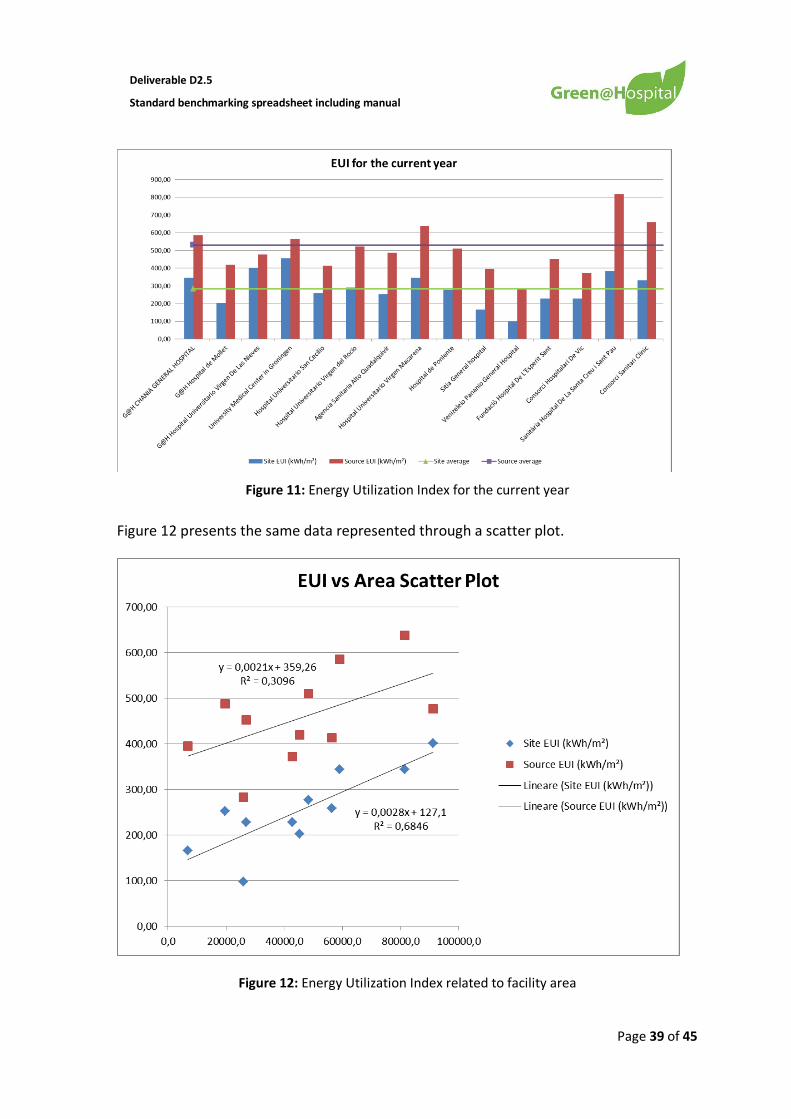
Universitario Virgen del Rocio. In Figure 11 the same values have been normalized with the gross
floor area and it is possible to see that this high use of energy is mainly due to the size of the facility.
Page 39 of 45
Deliverable D2.5
Standard benchmarking spreadsheet including manual
Figure 11: Energy Utilization Index for the current year
Figure 12 presents the same data represented through a scatter plot.
Figure 12: Energy Utilization Index related to facility area

Page 40 of 45
Deliverable D2.5
Standard benchmarking spreadsheet including manual
The site EUI shows a better correlation with the facility surface than the source EUI. This
can be interesting for the facility managers because the dimension of the hospital can be
related to the amount of energy needed to run the hospital. The source energy is less
related to the gross floor area and this may be also due to the different primary energy
factors used for electric energy use for facilities located in different countries.
5.4. Workers and Staffed bed influence on Energy use
Energy consumptions have been normalized also considering the above mentioned
normalization factors:
-Number of staffed beds
- Number of workers
The following figures show the relationship between energy consumptions and these two
variables.
Figure 13: Energy use per worker

Page 41 of 45
Deliverable D2.5
Standard benchmarking spreadsheet including manual
Figure 14: Energy use per staffed bed
The two graphs above show different characteristics of energy use on workers and
staffed bed. This can be due to different use of the hospitals in terms of services provided by
the structure and in terms of availability of patient hosting. This differences may be also due
to the different services provided by the hospitals that may bring to a different energy use of
the structure.
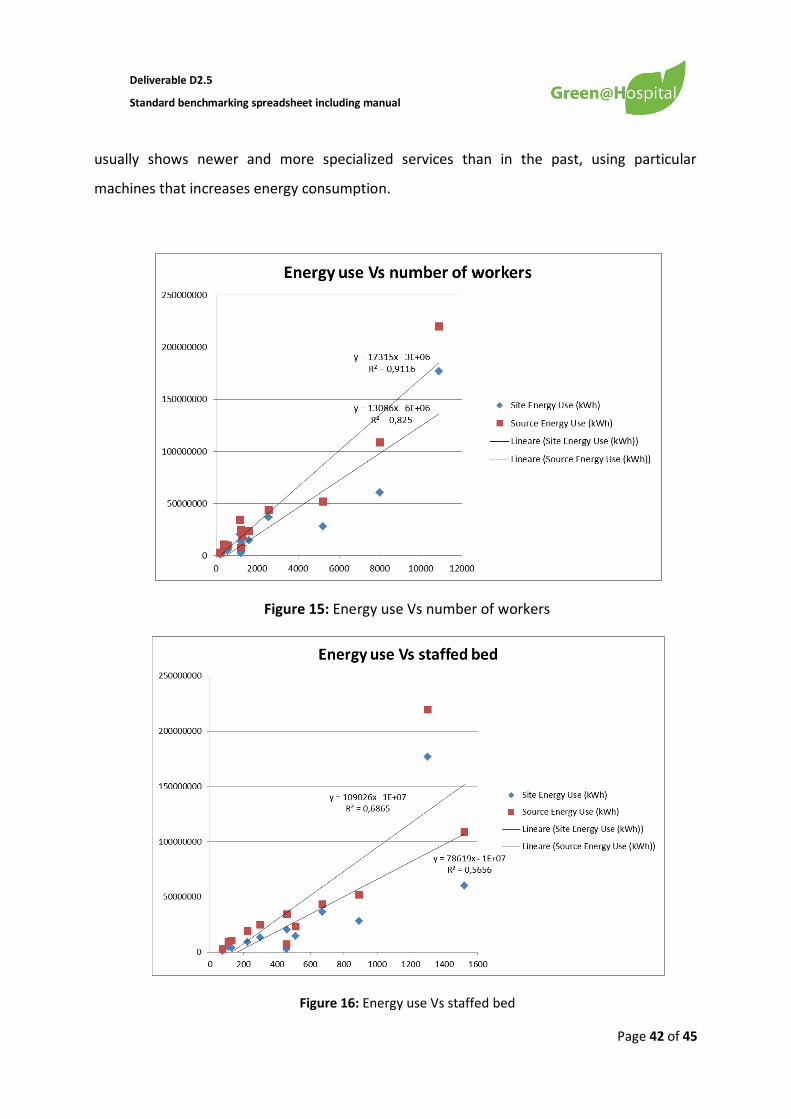
It is also important to verify if there is any direct correlation between energy use and the
two facility’s characteristics. The following graphs show a possible linear relation; it is
interesting to see that the analysis on the number of workers shows a better correlation
than the one on number of staffed beds, with an R2 of 0.91. This is justifiable because the
higher energy consumption of one facility in comparison to another depends more on the
basis of the services and treatments performed with special (and high consuming)
technologies rather than on the basis of the capacity of the facility to host more patients.
This relation is also more valid for present period analysis rather than for past energy
consumption data, because the present use and configuration of the modern hospitals
Page 42 of 45
Deliverable D2.5
Standard benchmarking spreadsheet including manual
usually shows newer and more specialized services than in the past, using particular
machines that increases energy consumption.
Figure 15: Energy use Vs number of workers
Figure 16: Energy use Vs staffed bed

Page 43 of 45
Deliverable D2.5
Standard benchmarking spreadsheet including manual
5.5. Results comparison with Spanish benchmark
The Departamento de Planificaciòn y Estudios of Spanish administration has developed
an analysis on energy use in Spanish hospital that brought to an official report prepared by
the Institute for Energy Diversification and Saving (IDAE). The analysis was addressed to the
more than 790 Spanish hospitals in terms of consumption of electricity and thermal energy,
per gross floor area, number of beds and different climatic zones, distinguishing between
public and private hospitals. Among these 790 hospitals, 250 have answered giving back the
energy use data for the years 2010 and 2011. The energy performance shown in the analysis
shows in general a better behavior of Spanish hospitals if compared to the Green@Hospital’s
cases; the KPI evaluated are: Energy Utilization Index and the energy use per staffed bed. As
for the energy use per worker it has not been possible to directly compare the results of the
project analysis to the Spanish analysis.
Spanish hospitals show in 2011 an average data of 292 kWh/m2 year versus a
Green@Hospital average of 284; as for the energy use per staffed bed, the value of about
39636 kWh/staffed bed year reported in the Spanish analysis is less than the value for
Green@Hospital cases, with an average of 43018 kWh/staffed bed year. This is an
interesting result, even if the direct comparison of these data may have limitations and may
need further in-depth analysis.
5.6. Results comparison with Dutch benchmark
Data sets concerning four Dutch pilot cases, have been collected. Data sets are limited to
whole-building energy usage, gross floor area of the buildings and energy costs of the
facilities. Energy usage data is based on records of hospital energy usage, and is displayed in
terms of MJ per square meter and reported in terms of source energy use. The average of
source energy consumption is 555 kWh/m2, while the median value is 561 kWh/m2. It is
interesting to compare the values highlighted by the Dutch benchmark the values obtained
from the Medical Center in Groningen. This hospital shows a value of source energy of 566
kWh/m2 which is in line with the average data described before.

Page 44 of 45
Deliverable D2.5
Standard benchmarking spreadsheet including manual
6. Conclusions
The document presents the results of the pilot hospitals analysis in terms of energy use
audit, solution set data collection and energy use benchmark.
The energy audit activity is presented with comments and suggestions on the use of the
Energy Audit and BMS-SCADA-ICT forms, frequently highlighting the difficulty of data
collection, due to the lack of documentation of the facility and, in some cases, to the
impossibility to reach energy consumption data because they are owned by a third party.
A solution set database has been proposed to gather the data on the implemented
measure in terms of characteristics of the measure itself and its impact on the whole energy
consumption of the facility.
Two existing tools have been tested in order to assess the impact of the implementation
of the solution set for each hospital, Energy Star Portfolio Manager and eeMeasure tool.
In parallel with the use of the already existing tools, an analysis of the energy
performance of the facilities has been proposed. It reports the comparison of the project
pilots with other facilities that it has been possible to analyze, proposing an evaluation of the
energy use as related to some connotative features of a hospital, in particular the gross floor
area, the number of staffed beds and the number of employees. Possible correlation
between energy use and these features have been analyzed and reported. In this way it will
be possible to extend the analysis of the energy saving results to other facilities.

Page 45 of 45
Deliverable D2.5
Standard benchmarking spreadsheet including manual
7. References
http://www.eia.doe.gov/emeu/cbecs/contents.html
http://www.energystar.gov/
http://www.energystar.gov/ia/business/healthcare/downloads/ES_2012_Healthc
are_Space_Classification_Guide_v7.pdf
http://www.energystar.gov/index.cfm?c=eligibility.bus_portfoliomanager_space_
types
Portfolio Manager Technical Reference: ENERGY STAR Score. July 2013
Portfolio Manager Technical Reference: ENERGY STAR Score for Hospitals. July
2013
Portfolio Manager Technical Reference: Climate and Weather. July 2013
EN 15603 - Energy Performance of Buildings – Overall energy use and definition of
energy rationgs – Annex E Factors and coefficients, CEN.
PHPP (2007) Passive House Planning Package, The Passive House Institute,
Darmstadt, DE
Instituto para la Diversification y Ahorrro de la Energia: Seguimentos Energèticos
Sectoriales. Sector Sanitario: Hospitales 2010-2011 – January 2013.
Analysis of hospital electricity gas heat usage per m2.1.0.xlsx – Netherlands