standard operating procedure 10: data analysis and
TRANSCRIPT

ERMN Benthic Macroinvertebrate Monitoring Protocol Implementation Plan
1
Standard Operating Procedure 10: Data Analysis and Reporting (Version 1.0)
Summary This SOP describes data analysis and reporting guidelines for the Eastern Rivers and Mountains Network Benthic Macroinvertebrate Monitoring protocol which are based on Klamath Network methods (Dinger et al. 2013). This SOP is separated into two sections: (1) General intent, target audiences, and recommended analysis approaches for Summary Reports, Analysis and Synthesis Reports, and Resource Briefs; and (2) guidelines for analyses. The purpose of the first section is to outline the reporting schedule to meet protocol objectives whereas section two is intended to ensure that data analysis is properly and consistently done.
Revision Log Original Version #
Date of Revision Revised By Changes Justification New Version #
NA 4/28/2016 C. Tzilkowski NA Protocol Implementation Plan publication
1.0

ERMN Benthic Macroinvertebrate Monitoring Protocol Implementation Plan
2
1.0. Reporting The target audience of reports is a broad group of interested parties, including park superintendents, resource managers, Inventory and Monitoring staff, external scientists, partners, and the public. Resource briefs will be targeted to park superintendents, interpretative staff, and park managers. Timelines and specific purposes of each report are detailed in Table 1.
1.1. Summary Reports Summary reports are the primary way that monitoring activities and BMI community condition information is conveyed. In all summary reports, an emphasis will be put on using basic descriptive statistics (measures of central tendency and dispersion) for core water quality parameters and BMI metrics. Findings of special interest (e.g., new species records) to resource managers or the public will be highlighted. In general, summary reports will not lend themselves to hypothesis testing; rather, hypothesis testing (on trends) will be covered in later Analysis and Synthesis reports. Summary report format will follow the formatting guidelines of the Natural Resource Publications series.
Summary Reports will typically include:
1. Executive summary.
2. Introduction with brief explanation of BMI Monitoring program.
3. Methods section, referencing this protocol, with a level of detail appropriate for scientific publication.
4. Summary of past ERMN efforts in relevant park units.
5. Summary of the most recently collected data.
6. Evaluation of core water quality data based on appropriate guidelines.
7. Public interest highlights.
Table 1. Overview of data reporting for Eastern Rivers and Mountains Network Wadeable Streams Monitoring Protocol.
Report Type Publication Year Purpose Analysis Approaches Summarize monitoring activities
Summary Reports Recurring upon panel
completion (i.e., 2016, 2018…)
Describe benthic macroinvertebrate community status
Descriptive statistics (Stoddard et al. 2005)
2019 Describe benthic macroinvertebrate community gradients and patterns Stoddard et al. 2005
Analysis and Synthesis Reports 2019 Describe expanded stream chemistry and
habitat gradients and patterns Kaufmann et al. 1999
2025 Trend analyses of ERMN wadeable stream ecological integrity
Chatfield 2004; Phillipi et al. 1998
ERMN Benthic Macroinvertebrate Monitoring Protocol Implementation Plan
3
1.1.1. Proportion of Streams Condition Assignment of proportion of different stream conditions based on bioassessment is a standard method for describing monitoring results (Stoddard et al. 2005, USEPA 2006). The number of miles (or kilometers) affected is typically the standard and is calculated by tallying the number of miles represented by the affected site and summing across all “impaired” miles. Tools to implement this approach are available in the psurvey.analysis R library provided by the EMP at: http://www.epa.gov/nheerl/arm/analysispages/software.htm.
For ease of calculation, the ERMN will use a more conservative estimate described by Dinger et al. (2013). For randomly chosen sites (that had equal inclusion probabilities) at Delaware Water Gap NRA and New River Gorge NR, the estimate will be based on a simple proportion of sites. If or when sampling commences at Gauley River NRA (pending additional land acquisition by NPS), the estimate will also be based on a simple proportion of sites. For example, if the Macroinvertebrate Index of Biotic Integrity (MIBI; see below) has eight out of 36 sites at New River Gorge NR that are in the lowest condition class, then the total percent of stream length in that class is 22% at that park. This method can be used for O/E scores, IBIs, and proportion of streams exceeding water quality standards.
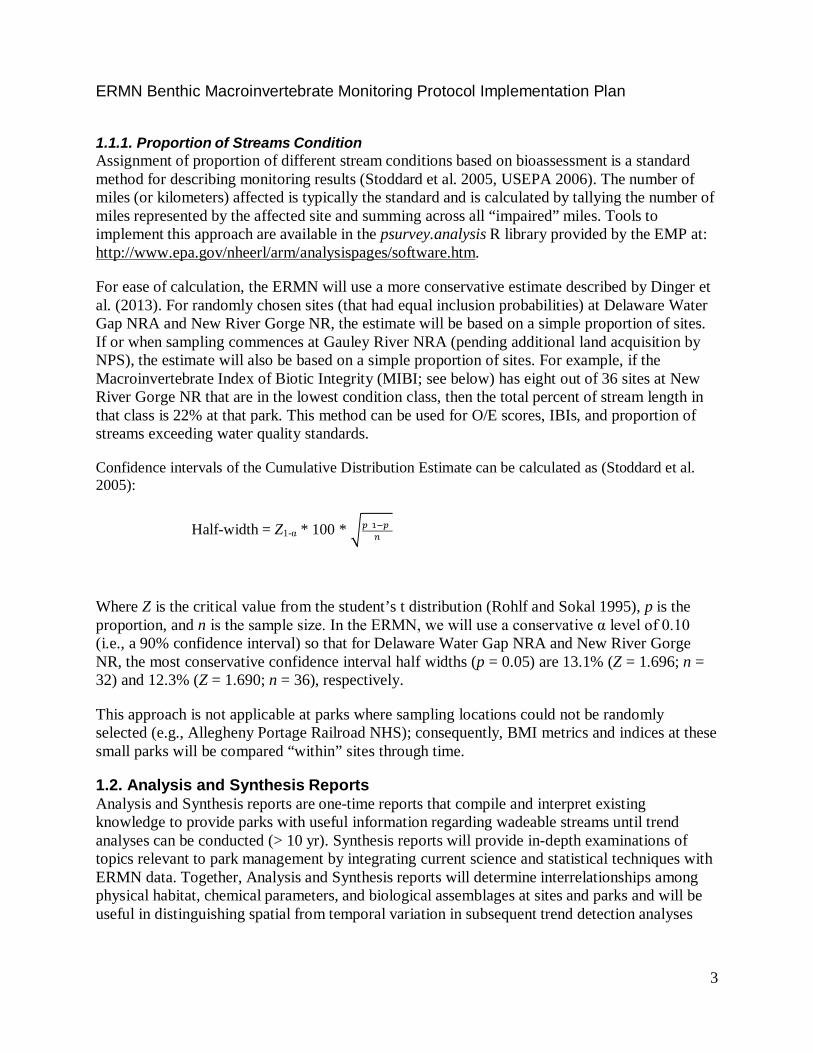
Confidence intervals of the Cumulative Distribution Estimate can be calculated as (Stoddard et al. 2005):
Half-width = Z1-α * 100 * �𝑝𝑝(1−𝑝𝑝)𝑛𝑛
Where Z is the critical value from the student’s t distribution (Rohlf and Sokal 1995), p is the proportion, and n is the sample size. In the ERMN, we will use a conservative α level of 0.10 (i.e., a 90% confidence interval) so that for Delaware Water Gap NRA and New River Gorge NR, the most conservative confidence interval half widths (p = 0.05) are 13.1% (Z = 1.696; n = 32) and 12.3% (Z = 1.690; n = 36), respectively.
This approach is not applicable at parks where sampling locations could not be randomly selected (e.g., Allegheny Portage Railroad NHS); consequently, BMI metrics and indices at these small parks will be compared “within” sites through time.
1.2. Analysis and Synthesis Reports Analysis and Synthesis reports are one-time reports that compile and interpret existing knowledge to provide parks with useful information regarding wadeable streams until trend analyses can be conducted (> 10 yr). Synthesis reports will provide in-depth examinations of topics relevant to park management by integrating current science and statistical techniques with ERMN data. Together, Analysis and Synthesis reports will determine interrelationships among physical habitat, chemical parameters, and biological assemblages at sites and parks and will be useful in distinguishing spatial from temporal variation in subsequent trend detection analyses

ERMN Benthic Macroinvertebrate Monitoring Protocol Implementation Plan
4
(Philippi et al. 1998). Depending upon length, complexity, and target audience, synthesis reports will be published in the NRTR series or in peer-reviewed publications.
1.2.1. Analysis and Synthesis Report 1: Physical Habitat and Water Chemistry Classification This report will synthesize a large data set collected at landscape (GIS) and reach scales to describe geomorphic types, physical habitat, and water chemistry gradients across the sampling frame in each park. The core of the physical habitat sampling approach will be based on U.S. EPA methods (U.S. EPA 2006) that were used to characterize reach scale habitat at BMI sampling sites in 2015. The main components of the physical habitat characterization include: 1) thalweg profile, 2) woody debris, 3) channel and riparian characterization, and 4) assessment of channel constraint, debris torrents, and major floods. Flow regime, quantity and size of sediment, and the topographic setting are known to set geomorphic thresholds that define changes in fluvial processes and form, separating riverine landscapes and habitats from one another (Church 2002). This variation in pattern and process comprises important dimensions of the stream ecosystem, with direct relevance to evaluations of ecological integrity (Sullivan et al. 2004). Understanding the available stream types and their attributes provides context for future reports. Assignment of stream habitats to specific classification units will follow standard rule-based systems (Rosgen 1994) to assign classes and will build upon other efforts (e.g., Olivero Sheldon et al., 2015).
Stream chemistry is known to vary due to fundamental watershed attributes (watershed geology, stream gradient) as well as transient dynamics of many types, such as vegetation growth, atmospheric dynamics, and pollution (Allan et al. 1997, Scott et al. 2002). This report will analyze and synthesize the spatial patterns in water chemistry (i.e., core water quality) to identify major water quality units of functional equivalence (low internal variance) and to identify areas with reference values or potential vulnerability. Expanded water chemistry data collected by the Pennsylvania State University (Webber 2012) will be further analyzed to identify relationships between watershed parameters (e.g., geology of the basin) and chemical attributes of ERMN wadeable streams.
1.2.2. Analysis and Synthesis Report 2: Benthic Macroinvertebrate Community Characterization Standard ordination and classification techniques will be used to identify the major BMI “units” and to assess their correlation with major environmental gradients in the ERMN, primarily at Delaware Water Gap NRA and New River Gorge NR (Tate and Heiny 1995, Heino et al. 2003). Species diversity, relative abundance, and productivity will also be summarized and compared among parks. Factors associated with differences in abundances and distribution will be analyzed using bubbleplots and biplots, using the physical and chemical factors examined in Analysis and Synthesis Report 1. How the physical and chemical templates influence the observed BMI community patterns will be a major component of this report, so that parks can understand their wadeable stream resources in the proper context.

ERMN Benthic Macroinvertebrate Monitoring Protocol Implementation Plan
5
1.2.3. Analysis and Synthesis Report 3: Trends in Environmental Integrity This will be the first analysis of temporal changes in selected parameters/metrics and will be performed after five sampling periods (10 years); consequently, the sample size for a temporal effect will still be somewhat limited and trend analyses before this point would be premature. The trend report will be analyzed with a "weight of evidence approach" using parametric and non-parametric techniques, on both univariate and multivariate parameters (Table 2).
Table 2. Proposed analyses for trend detection in Analysis and Synthesis Report 4. IBI = Index of Biological Integrity.
Parameters Analytical tests References Univariate
Parametric and non-parametric time series analysis (regression models and Mann-Kendall rank correlation tests)
Physical habitat (e.g., sinuosity, large woody debris)
Quinn and Keough (2002), Chatfield (2004)
Water Quality (e.g., specific conductance)
Biological (IBIs, O/E scores) Multivariate
Indices of multivariate seriation Warwick and Clarke (1991), Philippi et al. (1998), Clarke and Warwick (2001)
Benthic macroinvertebrates
Ecosystem changes should be evidenced by multiple, interrelated pieces of physical, chemical, and biological evidence. From such a perspective, redundancy is essential. Dinger et al. (2013) suggested two approaches for incorporating “weight of evidence.” The first is that important changes should also be detectable by multiple analytical approaches. For instance, if several tests (Mann-Kendall, regression, and multivariate) agree that a significant change has occurred, this will be taken as strong evidence of biologically significant change, whereas a single test showing significant change (e.g., only the Mann- Kendall) will be taken as weaker evidence of biologically significant change. The second approach is more traditional, where multiple indicators respond correspondingly (e.g., increasing BMI diversity, increasing habitat heterogeneity, etc.). We will utilize both concepts of weight of evidence.
Behind the weight of evidence approach is the concept that much of the information and insight about temporal change will be contained in presence, absence, and abundance of BMI taxa. Multivariate analyses can be used to efficiently explore data and identify progressive changes (Figure 1). Two specific techniques for analyzing plot data include assessing cumulative plot dissimilarity over time (Phillipi et al. 1998) and outlier determination and control chart development (McBean and Rovers 1998, Anderson and Thompson 2004; Figure 2). Compositional changes can provide compelling evidence that a meaningful ecological event has occurred or that an ecological threshold has been exceeded (Clarke and Warwick 2001, Anderson and Thompson 2004). At a minimum, cumulative dissimilarity ordinations (Figures 1 and 2) will be developed for each sampling frame from each park from 2015 to 2035.
Philippi et al. (1998) suggest tests for trends in matrices of similarity indices: (1) Non-parametric multivariate analysis of variance can be used with a matrix of dissimilarities which can be partitioned into residual sums of squares to test for trend from baseline conditions (time 1, or another time period or reference). Significance is determined through a test using randomization of date labels. (2) Mantel test of a locational dissimilarity matrix to the temporal time difference

ERMN Benthic Macroinvertebrate Monitoring Protocol Implementation Plan
6
matrix. Randomization following the traditional Mantel test then tests for significance of association between time and species composition (Manly 1997).
Figure 1. Cumulative change in species composition over nine sampling seasons (from Dinger et al. 2013). a.) An idealized two-dimensional ordination diagram illustrating the compositional position of a site at time one through nine, where Euclidean distance between each year (i.e., time steps t1, t2...t9) is proportional to species dissimilarity. The solid two-headed arrow is an ordination that illustrates the cumulative dissimilarity (progressive compositional change) over the whole period. b.) A graph of cumulative dissimilarity between the first year sample and successive years (i.e., t1 to t9). Note that the change is positive and sustained, suggesting a clear trend of changing composition over time.
Figure 2. Year-to-year change in species composition over nine sampling seasons, with a major change at year nine (from Dinger et al. 2013). a.) An idealized two-dimensional ordination diagram illustrating the

ERMN Benthic Macroinvertebrate Monitoring Protocol Implementation Plan
7
compositional position of a site at time one through nine where Euclidean distances between each pair of years (i.e., time steps t1, t2...t9) are proportional to pairwise species dissimilarity. The dashed arrow follows the year-to-year change in composition. b.) A graph of pairwise dissimilarity between each pair of successive time steps from years one to nine. Note that the composition is similar, but slightly variable in years one to eight, with a major change in year nine.
Other tests for progressive trend in assemblage data exist, such as canonical analysis of principal coordinates (CAP) as proposed by Anderson and Willis (2003) and Anderson and Robinson (2003), and the perMANOVA test. The CAP analysis can be implemented in the R software vegan package with the capscale() function. Also, perMANOVA could be used to test for differences amongst sampling periods, amongst sites, and the error term would be the site by sampling period interaction (Anderson 2001). This can be implemented in the vegan package as well with the adonis() function; this is another permutation approach so computational time is long and the number of iterations may need adjusted.
This report will also explore the standardization of the trends analyses, allowing future Analysis and Synthesis reports to include repeatable trend analyses through preparation of standardized “R” scripts, and other analyses incorporating new summary data. It is recognized that the current software of choice is “R” but that future analyses may use a yet undeveloped software package. We also expect that new techniques will emerge for studying trends that allow complex dynamics of species composition changes to be more clearly demonstrated. Emerging techniques will also be considered, and if applicable, applied to the trends Analysis and Synthesis report.
1.3. Resource Briefs Upon completion of each major report, a one or two page resource brief will be prepared for dissemination to resource managers and the public. Resource briefs are intended to convey recent activities and key findings. Generally, the audience of resource briefs will be park resource staff, and secondarily, interpreters. Format will follow the standard resource brief template in use by the Network at the time.

ERMN Benthic Macroinvertebrate Monitoring Protocol Implementation Plan
8
2.0. Standard Water Quality and Benthic Macroinvertebrate Community Analyses The purpose of this section is to ensure standardization so that analyses of data from this program are comparable across years.
2.1. Exploratory Data Analysis A part of any analytical prep work should include Exploratory Data Analysis (EDA). “EDA” is an “approach to data analysis that seeks to find patterns in data, to reveal structure, to suggest possible relationships among variables, and to find other hidden secrets in the data.” (Irwin 2011). EDA can take the form of summary statistics, outlier analysis, graphical presentations of the data, and general pattern analysis. A danger of a prescriptive SOP such as this one is that an investigator will only follow the prescribed analytical tools; and miss important trends or patterns because they are not “exploring” the data. The Aquatic Ecologist should engage in extensive EDA as part of any report (Summary or Analysis and Synthesis) preparation. However, due to the nature of EDA, there is no mandated or prescriptive reporting of the EDA step (any attempt at conclusive EDA reporting would both burden and overshadow the normal report content). The Aquatic Ecologist is encouraged to use Irwin (2011) as a guide to performing EDA.
2.2. Procedure for Calculating Benthic Macroinvertebrate Community Metrics and Density Microsoft Access 2010 is the primary software used for storing and managing BMI and stream habitat data, whereas the Invertebrate Data Analysis System (IDAS version 5, USGS, Raleigh, NC) is used for resolving taxonomic ambiguity issues and calculating metrics. The ERMN calculates BMI community metrics with IDAS, which are then imported into Microsoft Excel 2010 to calculate the MIBI (Klemm et al. 2003, Herlihy et al. 2008). Flow of BMI data is illustrated in Figure 3.

ERMN Benthic Macroinvertebrate Monitoring Protocol Implementation Plan
9
Figure 3. Benthic macroinvertebrate data flow for calculating the Macroinvertebrate Index of Biotic Integrity.
2.2.1. Exporting Benthic Macroinvertebrate Data from the Database After BMI data have been certified they are exported from the database using the “qexport_BioTDB” query. For additional information regarding IDAS formatting see the IDAS manual (Appendix A).
To export BMI data from the BMI Monitoring Database so that can be imported into IDAS:
1. In BMI Monitoring Database, locate and run the “qexport_BioTDB” query by double clicking on it.
a. Access will alert you that “You are about to run a make-table query that will modify data in your table”. Click “Yes”.
b. The alert “The existing table “_texport_BioTDB” will be deleted before you run the query” will appear. Click “Yes”.
c. The alert “You are about to paste XXXX row(s) into a new table” will appear. Click “Yes”.
2. Locate and open the table “_texport_BioTDB” by double clicking on it.
3. Export the table from the BMI Monitoring Database to an Excel spreadsheet by:
Calculate Macroinvertebrate Index of Biotic Integrity with MS Excel
Calculate Benthic Macroinvertebrate Metrics with IDAS and Export to MS Excel
Export Data from MS Access into Invertebrate Data Analysis System (IDAS)
Data Entry and Verification (QA/QC) in MS Access Database
Identification and Enumeration
Laboratory Processing and Subsampling
Sample Collection

ERMN Benthic Macroinvertebrate Monitoring Protocol Implementation Plan
10
a. Navigating to and clicking the “Excel” icon under the “External Data” tab.
b. Browse to the appropriate location to save the Excel file and click “OK”.
2.2.2. Importing Benthic Macroinvertebrate Data into the Invertebrate Data Analysis System The exported Excel file should have 21 columns and many rows (data from all years in the database are exported; Figure 4). The syntax of all column headers and rows must be in the exact format that is expected by IDAS; otherwise, the program will not recognize data you are trying to import.
Figure 4. Screen capture of the “_texport_BioTDB” file exported from the macroinvertebrate database to be imported into the Invertebrate Data Analysis System.
To import BMI data into IDAS as an MS Excel file:
1. Before attempting to import the Excel file into IDAS, inspect the Excel worksheet to be sure that it was exported properly.
a. Rename the Excel spreadsheet “_texport_BioTDB.xlxs” as “texport_BioTDB.xlxs”. The underscore that is automatically generated by the MS Access query causes a syntax error in IDAS that prevents the data from being imported.

ERMN Benthic Macroinvertebrate Monitoring Protocol Implementation Plan
11
b. Ensure that all column headers are labeled properly and that the appropriate cells are populated in the dataset.
2. Open IDAS and click on the “Data Preparation” button (Figure 5).
Figure 5. Main screen of the Invertebrate Data Analysis System.
3. Under “Files”, click on “Open”.
4. Navigate to and open “_texport_BioTDB.xlxs”. IDAS will prompt you to “Select data table for processing”. Select the “export_BioTDB” data table which will open the “Invertebrate sample preparation module”.
5. The “Invertebrate sample preparation module” has several options for customizing the way in which data are prepared. The current configuration that the ERMN is using is as follows (Figure 6):
a. “Options for processing data”
i. Sample type(s) to process = RTH (only “active” option).
ii. Calculate density = Yes.
iii. Deletions based on BG processing notes = NA.

ERMN Benthic Macroinvertebrate Monitoring Protocol Implementation Plan
12
iv. Deletions based on lifestages = “Adult – Delete adult lifestages (terrestrial adults only).
v. Options based on combining life stages = “Combine life stages: one entry per BU_ID”.
b. “Options for processing data”
i. Select lowest taxonomic level = “BU_ID”.
ii. Delete rare taxa if they are found at …. = NA.
c. “Options for resolving ambiguities”
i. Remove ambiguous taxa at or above = None.
ii. Resolve ambiguities by = Keeping samples separate.
iii. Methods for resolving taxonomic ambiguities = 4. Distribute Parent Among Children (DPAC).
6. Click “Run”.
Figure 6. Typical settings used in the “Invertebrate sample preparation module” in the Invertebrate Data Analysis System.

ERMN Benthic Macroinvertebrate Monitoring Protocol Implementation Plan
13
7. The IDAS “Processing status” window will appear and then a dialog box (“Enter a table name to store data”) will prompt you either specify a name or use the default “NoAmbig”. Click on “Accept”.
8. The IDAS “Processing status” window should show that the “Processing status” is 100% complete.
9. Close the “Processing status” window and exit the “Data Preparation” module.
2.2.3. Calculating Benthic Macroinvertebrate Community Metrics with the Invertebrate Data Analysis System
1. Click “Calculate Community Metrics” on the IDAS main screen.
2. Click on “Files>Open” then navigate to and open “_texport_BioTDB.xlxs”.
3. IDAS will prompt you to select the data table for processing (Figure 7). Select the “NoAmbig” table.
Figure 7. Dialog box used to specify data table for calculating benthic macroinvertebrate community metrics with the Invertebrate Data Analysis System.
4. Once the “NoAmbig” table is selected, the “Calculate community metrics” window will appear (Figure 8).
5. Check the “Select all” radio button under the “Selection Shortcuts” header to check all metric check boxes.

ERMN Benthic Macroinvertebrate Monitoring Protocol Implementation Plan
14
6. Click “Run” which will open a window (Figure 9) that is used to specify numerical thresholds that will define tolerant, intolerant, and moderately tolerant taxa. Specify the desired tolerance criteria and click “Accept”.
7. A window will appear that is used to navigate to the Excel file that contains BMI taxa attributes (e.g., functional group) used by IDAS to calculate the community metrics. There is a default attributes file included with IDAS but it does not contain attributes for all BMIs; consequently, the ERMN updates and saves new attributes files as “new” taxa are identified. IDAS provides an “Edit Data” application that aids in maintaining attributes files and when they are updated, they should be saved with a name that reflects the date they were updated (e.g., ERMNAttributes_BEHAV_20120908).
8. If there are taxa that need to be updated in the attributes file a warning window will appear (Figure 10). Use the “Edit Data” function in IDAS to update attribute files if necessary (see Appendix A for instructions). If the attribute table does not need updated, click on “Continue” which will open the “Options for tolerance and functional groups” window (Figure 11).
Figure 8. “Calculate community metrics” options window in the Invertebrate Data Analysis System.

ERMN Benthic Macroinvertebrate Monitoring Protocol Implementation Plan
15
Figure 9. Options window that allows tolerance class ranges to be specified while calculating benthic macroinvertebrate metrics in the Invertebrate Data Analysis System.
Figure 10. Warning window in the Invertebrate Data Analysis System that identifies taxa that are not included in the specified attributes file.

ERMN Benthic Macroinvertebrate Monitoring Protocol Implementation Plan
16
Figure 11. “Options for Tolerance and Functional Group metrics” window in the Invertebrate Data Analysis System.
9. In the “Options for tolerance and functional groups” window, select the criteria for the way that IDAS matches tolerances and functional groups and whether or not tolerance values should be supplemented. Click “Continue”.
10. IDAS will populate the “_texport_BioTDB.xlxs” file with separate worksheets for each metric group (e.g., richness, tolerance, dominance); additionally, worksheets are inserted into the file that contain the options (e.g., tolerance values) and statistics (e.g., sample abundance) pertaining to the analysis.

ERMN Benthic Macroinvertebrate Monitoring Protocol Implementation Plan
17
2.3. Bioassessment Tools The ERMN uses two general classes of bioassessment tools for wadeable streams: (1) Multi-metric indices (i.e., IBIs) and (2) Multivariate predictive models (O/E scores). Both of these tools can be distilled into clear, readily interpretable condition assessment for managers. Although these two approaches vary in their methodology, using both approaches gives a better assessment than any single tool by itself. Although we expect both methods to give comparable results in most circumstances, the deviations from this are not a paradox, but rather an indicator that suggests a closer inspection of the site.
Likewise, multiple models of IBIs or O/E scores exist. In this protocol, we typically use regional IBIs (EPA EMAP models). Broader models, fitted over a wider range of environmental conditions, are considered less precise than local ones; however, recent work has shown general corroboration between local and regional models (Meador et al. 2008). The use of a region-wide model has the benefit of being able to apply a single metric to a network-wide assessment.
2.3.1. Indices of Biotic Integrity Indices of Biotic Integrity (IBI) are bioassessment tools pioneered by James Karr for assessing the health of fish communities (Karr 1981). Since then, they have been applied to, and become the traditional approach to analyzing macroinvertebrate community data (Stoddard et al. 2005). Various composition, tolerance, and richness characteristics are summarized for a sample set, resulting in a set of candidate metrics. A subset of 5 to 10 “best performing” (based on their ability to distinguish disturbance) metrics are then combined into a multi-metric model and scored on the basis of regional reference sites. Metrics selected for inclusion often include life history or habit variables of taxa (e.g., the number of “clingers”). Although most prominent for use with invertebrates, IBIs are also used for other organisms including fishes (McCormick et al., 2001).
2.3.1.1. Macroinvertebrate Index of Biotic Integrity Rationale
For each report, a multimetric approach will be used to determine and summarize the status of BMI communities. The current approach, which will be used for the foreseeable future, is to compare the condition of BMI in ERMN streams to regional conditions using the Macroinvertebrate Index of Biotic Integrity (MIBI; Klemm et al. 2003, Herlihy et al. 2008). In addition to calculating the MIBI and its constituent metrics, selected other metrics that are typically used for BMI monitoring may be calculated; moreover, BMI density will be calculated and compared to running averages.
The MIBI was developed and regionalized for streams across the contiguous United States by the US Environmental Protection Agency (US EPA), Environmental Monitoring and Assessment Program and was ultimately used for the Wadeable Stream Assessment (USEPA 2006, Herlihy et al. 2008). The MIBI used in the ERMN was developed for upland and lowland streams dominated by riffle habitat in the Mid-Atlantic Highlands Region (Klemm et al. 2003). Moreover, the MIBI developed by Klemm et al. (2003) was thoroughly tested and reviewed and was based on a large dataset of 574 wadeable stream reaches throughout this region.

ERMN Benthic Macroinvertebrate Monitoring Protocol Implementation Plan
18
The MIBI consists of seven metrics selected from 100 metrics that are commonly used for bioassessment and biomonitoring. The metrics chosen were those that performed best in terms of range, precision, responsiveness to various human-induced disturbances, relationship to catchment area, and redundancy (Table 3; Klemm et al. 2003). Most MIBI metrics are counts or proportions of taxa in the community that are characterized as tolerant or intolerant to human perturbations. One of the metrics, the Macroinvertebrate Tolerance Index (MTI), is more complex because it incorporates values (0–10) for each taxon with respect to pollution tolerance (weighted by taxon abundance) and results in higher scores as the proportion of taxa tolerant to general pollution increases (Klemm et al. 2003). Pollution Tolerance Values (PTV) incorporated in the MTI were average tolerances to “various types of stressors” that are discussed by Klemm (et al. 2003).
Table 3. Multimetric Index of Biotic Integrity metric descriptions and their directions of response to increasing human perturbation (Response) from Klemm et al. (2003).
Metric Description Response Ephemeroptera richness Number of Ephemeroptera (mayfly) taxa Decrease Plecoptera richness Number of Plecoptera (stonefly) taxa Decrease Trichoptera richness Number of Trichoptera (caddisfly) taxa Decrease Collector-filterer richness Number of taxa with a collecting or filtering-feeding strategy Decrease Percent non-insect individuals Percentage of individuals that are not insects Increase Macroinvertebrate Tolerance Index ∑ipiti, where pi is the proportion of individuals in taxon i and ti is
the pollution tolerance value (PTV) for general pollution Increase
Percent five dominant taxa Percentage of individuals in the five numerically dominant taxa Increase 2.3.1.2. Macroinvertebrate Index of Biotic Integrity Calculation
The seven metrics that comprise the MIBI are calculated for each sample using formulas, floor values, and ceiling values provided by or derived from Klemm et al. (2003, Table 4). Note that metrics that are included in the MIBI can be calculated by IDAS but their names are not the same as those used by Klemm et al. (2003). Data exported by IDAS into the “_texport_BioTDB.xlxs” file are copied into a different Excel file (Appendix B) that contains macros that calculate scaled values (between 0 and 10) for each metric based upon the floor and ceiling values. For example, if Ephemeroptera richness in a sample is less than 5, the scaled value is 0, and if Ephemeroptera richness is greater than 15, the scaled value is 10. For all Ephemeroptera richness values between 6 and 14, the scaled value is calculated using the derived formula.
After the seven MIBI metrics are scaled, they are summed, multiplied by 100, and then divided by 70 which equals the MIBI score. In addition to the MIBI, the constituent metrics are compiled into a table for inclusion in reports. For summary Data Series reports, the average (and standard deviation) MIBI and its constituent metrics for multiple years may also be reported.

ERMN Benthic Macroinvertebrate Monitoring Protocol Implementation Plan
19
Table 4. Formulas, floor values (Floor), and ceiling values (Ceiling) for metrics that comprise the Macroinvertebrate Index of Biotic Integrity (based on Klemm et al. [2003]). The names for metrics and worksheets (in parentheses) exported by the Invertebrate Data Analysis System (IDAS) are provided in the column “IDAS Name”.
Metric (m) IDAS Name Floor Formula Ceiling Ephemeroptera richness
EPEMR (NoAmbig_R_Metrics)
y = 0 if m < 4.21 y = 1.01m – 4.20 y = 10 if m > 14.11
Plecoptera richness
PLECOR (NoAmbig_R_Metrics)
y = 0 if m < 3.56 y = 1.69m – 6.03 y = 10 if m > 9.46
Trichoptera richness
TRICHR (NoAmbig_R_Metrics)
y = 0 if m < 1.00 y = 1.67m – 1.67 y = 10 if m > 7.00
Collector-filterer richness
FC_rich (NoAmbig_FG_Metrics)
y = 0 if m < 3.88 y = 1.54m – 5.98 y = 10 if m > 10.37
Percent non-insect individuals
NONINSp (No_Ambig_pA_Metrics)
y = 10 if m = 0.00 y = -0.56m + 10.00 y = 0 if m > 17.89
Macroinvertebrate Tolerance Index
AbundTOL (NoAmbig_TOL_Metrics)
y = 10 if m < 3.65 y = -5.85m + 31.34 y = 0 if m > 5.36
Percent five dominant taxa
DOM 5 (NoAmbig_DOM_Metrics)
y = 10 if m < 42.39 y = -0.26m + 21.21 y = 0 if m > 80.18

ERMN Benthic Macroinvertebrate Monitoring Protocol Implementation Plan
20
2.3.2. Observed/Expected Ratios A fundamental estimate of impairment is the impoverishment of a biological community. Observed/expected ratios, also known as “taxa lost” or RIVPACS (River InVertebrate Prediction and Classification System) models, provides a conceptually simple method of bioassessment where the number of collected taxa is compared to the number expected under unimpaired conditions (Hawkins et al. 2000). Values below 1.0 represent “lost” taxa, indicating impairment. The ratio O/E is hence readily interpretable to managers and the public. For example, an O/E score of 0.8 indicates that only 80% of the expected taxa were present.
Although conceptually simple, the derivation of the expected values require a high level of statistical knowledge and a large sample size comprised of both reference sites and impacted sites. O/E values, however, are the primary method of the EPA to assign water quality grades based on macroinvertebrate assemblages (USEPA 2006), and are a valuable tool to monitoring the wadeable streams of the ERMN.
Calculation of O/E scores for the monitoring efforts of the ERMN can be obtained in one of two ways: (1) contract with the U.S. EPA National Aquatic Monitoring Center, which can provide O/E values based on U.S. EPA models, or (2) utilize the online software of the Western Center for Monitoring & Assessment of Freshwater Ecosystems (http://cnr.usu.edu/wmc/), which has complete instructions on how to use models to generate O/E scores.
ERMN Benthic Macroinvertebrate Monitoring Protocol Implementation Plan
21
3.0. Literature Cited Allan, J. D., D. L. Erickson, and J. Fay. 1997. The influence of catchment land use on stream
integrity across multiple spatial scales. Freshwater Biology 37:149-161.
Anderson, M. J. 2001. Permutation tests for univariate or multivariate analysis of variance and regression. Canadian Journal of Fisheries and Aquatic Sciences 58:626-639.
Anderson, M. J., and J. Robinson. 2003. Generalized discriminant analysis based on distances. Australian and New Zealand Journal of Statistics 45:301-318.
Anderson, M. J., and A. A. Thompson. 2004. Multivariate control charts for ecological and environmental monitoring. Ecological Applications 14:1921-1935.
Anderson, M. J., and T. J. Willis. 2003. Canonical analysis of principles coordinates: A useful method of constrained ordination for ecology. Ecology 84:511-525.
Chatfield, C. 2004. The analysis of time series: An Introduction. Chapman and Hall/CRC Press, New York, NY.
Church, M. 2002. Geomorphic thresholds in riverine landscapes. Freshwater Biology 47:541- 557.
Clarke, K. R. and R. M. Warwick. 2001. Change in marine communities, 2nd edition. PRIMER-E Ltd. Plymouth, United Kingdom.
Dinger, E. C., D. A. Sarr, S. R. Mohren, K. M. Irvine, and C. E. Stanley. 2013. Integrated aquatic community and water quality monitoring of wadeable streams in the Klamath Network: Narrative and standard operating procedures. Natural Resource Report NPS/KLMN/NRR—2013/669. National Park Service, Fort Collins, Colorado.
Hawkins, C. P., R. H. Norris, J. N. Hogue, and J. W. Feminella. 2000. Development and evaluation of predictive models for measuring the biological integrity of streams. Ecological Applications 10:1456-1477.
Heino J., T. Muotka, H. Mykrä, R. Paavola, H. Hämäläinen, and E. Koskenniemi. 2003. Defining macroinvertebrate assemblage types of headwater streams: Implications for bioassessment and conservation. Ecological Applications 13:842-852.
Herlihy, A. T., S. G. Paulsen, J. Van Sickle, J. L. Stoddard, C. P. Hawkins, and L. L. Yuan. 2008. Striving for consistency in a national assessment: the challenges of applying a reference-condition approach at a continental scale. Journal of the North American Benthological Society 27(4):860–877.
Irwin, R.J. 2011. Exploratory Data Analysis (EDA) for beginners. National Park Service, Water Resources Division. Fort Collins, CO. Distributed online via https://irma.nps.gov/ only.

ERMN Benthic Macroinvertebrate Monitoring Protocol Implementation Plan
22
Karr, J. R. 1981. Assessment of biotic integrity using fish communities. Fisheries 6:21-27.
Kaufmann, P. R., P. Levine, E. G. Robison, C. Seeliger, and D. V. Peck. 1999. Quantifying physical habitat in wadeable streams. EPA/620/R-99/003. U.S. Environmental Protection Agency, Washington, D.C.
Klemm, D. J., K. A. Blocksom, F. A. Fulk, A. T. Herlihy, R. M. Hughes, P. R. Kaufmann, D. V.Peck, J. L. Stoddard, W. T. Thoeny, M. B. Griffith, and W. S. Davis. 2003. Development and evaluation of a macroinvertebrate biotic integrity index (MBII) for regionally assessing mid-Atlantic highlands streams. Environmental Management 31(5):656–669.
Manly, B. 1997. RT: A program for randomization testing. Western EcoSystems Technology, Inc., Cheyenne, WY.
McBean, E, and F. Rovers. 1998. Statistical procedures for analysis of ecological monitoring data and risk assessment. Prentice Hall PTR, Upper Saddle River, NJ.
McCormick, F. H., R. M. Hughes, P. R. Kaufmann, D. V. Peck, J. L. Stoddard, and A. T. Herlihy. 2001. Development of an Index of Biotic Integrity for the Mid-Atlantic Highlands Region, Transactions of the American Fisheries Society, 130:5, 857-877.
Meador, M. R., T. R. Whittier, R. M. Goldstein, R. M. Hughes, and D. V. Peck. 2008. Evaluation of an index of biotic integrity approach used to assess biological condition in western U.S. streams and rivers at varying spatial scales. Transactions of the American Fisheries Society 137:13-22.
Olivero Sheldon, A., Barnett, A. and Anderson, M.G. 2015. A Stream Classification for the Appalachian Region. The Nature Conservancy, Eastern Conservation Science, Eastern Regional Office. Boston, MA.
Philippi, T. E., P. M. Dixon, and B. E. Taylor. 1998. Detecting trends in species composition. Ecological Applications 8:300-308.
Quinn, G. P., and M. J. Keough. 2002. Experimental design and data analysis for biologists. Cambridge University Press. Cambridge, United Kingdom.
Rohlf, F. J., and R. R. Sokal. 1995. Statistical tables, 3rd edition. W.H. Freeman and Company. New York, NY.
Rosgen, D. L. 1994. A classification of natural rivers. Catena 22:169-199.
Scott, M. C., G. S. Helfman, M. E. McTammany, E. F. Benfield, and P. V. Bolstad. 2002. Multiscale influences on physical and chemical stream conditions across blue ridge landscapes. Journal of the American Water Resources Association 38:1379-1392.

ERMN Benthic Macroinvertebrate Monitoring Protocol Implementation Plan
23
Stoddard, J. L., D. V. Peck, A. R. Olsen, D. P. Larsen, J. Van Sickle, C. P. Hawkins, R. M. Hughes, T. R. Whittier, G. Lomnicky, A. T. Herlihy, and others. 2005. Environmental Monitoring and Assessment Program (EMAP): western streams and rivers statistical summary. EPA620/R-05/006. Office of Research and Development, US Environmental Protection Agency, Washington, DC.
Sullivan, S. M. P., M. C. Watzin, and W. C. Hession. 2004. Understanding stream geomorphic state in relation to ecological integrity: Evidence using habitat assessments and macroinvertebrates. Environmental Management 34:669-683
Tate, C. M., and J. S. Heiny. 1995. The ordination of benthic invertebrate communities in the South Platte River Basin in relation to environmental factors. Freshwater Biology 33:439-454.
United States Environmental Protection Agency (US EPA). 2006. Wadeable streams assessment: A collaborative survey of the nation’s streams. Washington, D.C. EPA 841-B-06-002.
Warwick, R. M., and K. R. Clarke. 1991. A comparison of methods for analyzing changes in benthic community structure. Journal of the Marine Biological Association of the United Kingdom 71:225-244.
Webber, J. S. 2012. Water quality condition assessment of streams in national parks of the Mid-Atlantic USA integrating physical, chemical, and biological datasets. Thesis. The Pennsylvania State University. 220 pp.