standard potential of the silver-silver-chloride electrode from 0 … · 2017-10-26 · journal of...
TRANSCRIPT
Journal of Research of the National Bureau of Standards Vol. 53, No.5, November 1954 Research Paper 2546
Standard Potential of the Silver-Silver-Chloride Electrode from 0° to 95° C and the Thermodynamic Properties of Dilute Hydrochloric Acid Solutions
Roger G . Bates and Vincent E. Bower
From electro motive-force measurements of the cell wit hou t liquid junction :
Pt; H 2, HCI (m), AgCI; Ag
thro~lgh the range 0° to 95° C, calculations have been made of (1) t he standard potential of t he s Ilver-silver-chloride electrode, (2) the activity coefficient of hydrochloric acid in aqueous solutIOns from m (molality) = 0 t.o m~ O.l and from 0° to 90° C, (3) the relative partial mo lal hcat conte nt of hydrochIol'lc aCId , and (4) the relatIve partial molal heat capacity of hydrochloric acid.
The extrapolati?ns were made by the method of least squares with the a id of punch-card techl1lqu es . Data from at least 24 cells were analyzed at eae h temperature and 81 cells we re s tudied at 25° C. The valu e of the standard potential was [ound to be 0.22234 absolute volt at 25° C, and t he standard deviation was 0.02 millivolt at 0° C 0.01 mi lli volt at 25° C and 0.09 millivolt at 95° C. The resul ts from 0° to 60° C a re compared with earlier deterll1ina~ t lOns of t he sta ndard potential and other quantities derived from the electromotive fo rce.
1. Introduction
The silvel'- silver-chloride electrode is employed extensively in the dctermination of ionization constants and other thermodynamic data by the electromotive-force method [1].1 It is therefore important that the standard potential of this electrode be known as accurately as possible over a wide range of tempcrature.
Electromo tive-force measmemen Ls of cell A
Pt; Hi (g, 1 atm ), HCl (m) , AgOl; Ag, (A )
at value of m suffi cien tly low to be useful in determining the tandard potential by extrapolation to zero molality have been made by a number of investigators [2 to 16].2 The measurements of Glintelberg were made at 20° 0, and all of the other investigations, except that of Harned and Ehlers which covered the range 0° to 60° 0, were confined to 25° O. R ecently, Harned and Paxton [17] have calculated the standard poten tial for the range 0° to 50 ° 0 from the electromotive force of cells of type A containing aqueous mixtures of hydrochloric acid and stron tium chloridc. In connection wi th the establishment of pH standards, the standard potential was n eeded in the range 60° to 95° O. In view of the extensive use of this electrode in electrochemical studies, it was deemed desirable to redetermine the standard potential at lower temperatures as well.
The measurements reported here were made at 17 temperatures from 0° to 95° 0 and were limited to molalit ies between 0.001 and 0.12 . The number of
1 Figures in brackets indicate the literatlUc references at the end of this paper. ' T he calculation of the standard poten Ual from the data of Ham cd and Ehlcrs
has been exa min ed by Hamcd and Wright flO]. Prentiss and Scatchard [11) Hamel', Bunoll , and Acroe [12). Hills and I ves [13). and Swinehart [14). '
cells tudied ranged from 24 at 45° 0 and 55° 0 to 80 at 60° 0 and 81 at 25° O. The equations used for extrapolation were obtained by the method of least squares. Punchcard techniques aided in the calcula tiol1.
2 . Experimental Procedures
Hydrochloric acid of reagent grade was distilled in .an all-gla s still ; th e middle fraction (about twothu'ds) of the distillate wa collected andl'edistilled. The middle fraction of the distillate from the second distillation was diluted, a needed, with water to about .O.~ m ~nd was s~andardized gravimetrically by wmghmg SlIver chlonde. Test of the undiluted acid revealed no bromide [18]. One of th e three O.l-m stock solutions was tandardized three time over a period of 8 months ; the concentration appeared to have changed only 0.02 percent in tbat t ime.
The cell solutions were prepared as needed by diluting portions of the stock solutions with water that had a conductivity of about 0.8 X 10- 6 ohm- 1 cm- 1 at room temperature. Dissolved air was removed from most of the solutions by bubbling mtrogen; the rest of the solutions were saturated with hydrogen or boiled under vacuum. When the latter procedure was used, the weight of the solution was determined after boiling so that the final concentratiol?- could be calculated accurately. The elec.trolytlC hydrogen, obtained in cylinders, was pUrIfied by passage over a platinum catalyst at room temperature and then over copper at 500° C.
.Each of the cells, described elsewhere [19], contamed two hydrogen electrodes and two silversilver-chloride electrodes. The latter were of the thermal-electroly tic type [2, 20]. The silver oxide from which theYa:were prepared was wa hecl40 times
283

with distilled water. The ] -1\1£ hydrochloric acid in which they were chloridized was a distilled sample free of bromide. The electrodes were prepared at least 24 hours before use. For the high-temperature series (60° to 95° C), the cells were provided with extra hydrogen saturators eonsistin.g of three chambers, as described by Bates and Pinching [21).
Two calibra ted poten tiometers were used. The standards of electromotive force were a pair of saturated Weston cells maintained at a temperature near 36° C in a th ermostated box of th e type described by Mueller and Stimson [22) . Three constant-temperature baths were employed ; water baths were used from 0° to 60° C and an oil bath from 60° to 95° C. The temperature was regulated to 'the desired even temperature wi thin the limits of ± 0.02 deg C from 25° to SO° C and ± 0.03 deg C from 0° to 20° C and above SO° C. T emperature measurements wer e made with a platinum r esistance thermometer. The difference of temperature between th e oil bath and the solu tion in a cell immersed in the bath was found to be less th an 0.1 deg C at 90° C.
The cells from which the data for th e range 0° to 60° C were obtained were measured init ially at 25° C. The constant-temperature water th ermostat was lowered to near 0° C overnigh t , and the measurements from 0° to 30° C were made on th e second day , followed on th e third day by th e measurements from 30° to 60° C. A final check of 34 of the cells was made at 25° C. The average differen.ce between init ial and final values was O.IS mv. The final value was almost alwavs lower than th e initial value, and there was some" indication th at a considerable t ime was required for equilibrium to be est ablish ed after the rapid drop from the higher temperature. Seven of th e cells were measured only in th e range 25° to 60° C . The data for th e high range, 60° to 95° C, were obtained from a separate group of cells immersed in an oil bath. The initial measurements of th ese cells were made at 25° C or at 60° C, and the other temperatures were studied in ascending order. A final check at 60° C was sometimes but not always made .
The electromo tive-force values were corrected to a par tial pressure of hydrogen of 1 a tm. Inasmuch as the ionic strength did no t exceed 0.ll 3 , the vapor pressure of each solution from 0° to 70° C was taken to be tha t of pure water [23). The error in troduced by this approximation appears to be less than 0.02 mv at 70° C for the most concentrated solut ion studied . At SOO, 9Go, and 95° C, the pressure correction was made wi th sufficien t accuracy by assuming that the relative vapor-pressure lowering due to the presence of hydrochloric acid is the same as at 25° C [24).
Hills and Ives [25) have iden tified an excess pressure effect due to the dep th of the jet through which th e hydrogen en ters the solution. From their results, it is eviden t that the effective par t ial pressure of hydrogen a t an electrode located just below the surfa ce is greater than tha t in the gas phase b.v (0.4 h/13.6) mm, wh ere h is the dep th in millimeters of the hydrogen jet below the surface_ In the cells
used in this work, h was about 40 mm. The cor rection therefore amounts to 0 .02 m v at 25° C, 0.03 mv a t 6Co C, 0.( S mv at 90° C, and 0 .] 6 mv at 95° C. Never theless, the corrections were not applied to the electromo tive-force da ta and standard po ten tials reported here, in order that these results could be used directly in other studies where the average jet dep th is about the same (namely, 4 em) as in this inves tigation. The th ermodynamic constants for hydrochloric acid solutions are unaffected , as they depend upon the difference E - E O and i ts change with temperature.
3 . Standard Potential of the Cell
From the equation for the electromo tive force, E , of cell A one can write
where E O is the standard po ten tial of th e cell , 'Y± is the stoichiometric mean ionic molal act ivi ty coeffi cien t of hydrochlori c acid, and the other symbols h ave their usual significance. H arned and Owen [1, chap. ll) have shown tha t experimen tal activity coefficien ts of uni-univalent strong electrolytes up to 1 m can be expressed wi th high accuracy by an equation of the form
log 'Y± _ - _A_·V,-,'c_r;: +Cc+ (e xt.)-lOg (1 + 0.03604 m), I + Ba*, c
(2)
where c is the molar concentration, A and B are constan ts of the D ebye-Hiickel theory , C is an adj us table parameter , and a * is the ion-size param eter , and (ext.) represents the total con tribu tion of the extended terms in the D ebye-Hiickel theory .
' 'V'hen m do E'S no t exceed 0. 1, c d iffers from J mdo, wh ere dO is the density of pure water, b.\' less than 1 par t in 1,000 . Subs titu tion of mdo for c in eq (2) an d combination with eq (1 ) gives
E 0l! = E o- (3m = E+ 4 .6051SRT [100' m A " im F to 1 + B la*-f/ii
+ (e xt. )-log (1 + 0.03604 m)} (3)
where (3 is a constan t for a particular tempera ture and value of a *. The values of A I and B I from 0° to 100° C h ave been tabulated elsewhere [26), and (ext. ) from 0° to 60° C for a* = 4.3 is given by H arned and Ehlers [9) . The la tter is only - 0 .00075 at 0° and - 0.00094 at GO° for the highest concentration studied in this investigation ; h ence, its value for 70°, SOo, 90°, and 95° C was obtained by !ineal ' extrapolation. These values of (ext. ) were used in the calculations at all th e temperatures studied. The exten ded terms correc tion becomes 0 at m= O, but is a function of a*. The differences,
284
-------- --------------
ext. (4.3 A )-ext. (6.0 A ), at 60 ° C (wh ere the best fit was obtain ed with a* = 6.0 ) were not quite lmear with m . Nevertheless, the mean departure from a straight line was less than ± 0.03 mv , or abou t one-third the probable error at this temperature. The values of 2.30259RT/F in absolute volts were computed from R = 8.31439 j deg- l mole- l and F = 96493 .1 coulombs equi,Talellt- l [27], and the absolute temperature, T , was taken to be to C + 273.160.
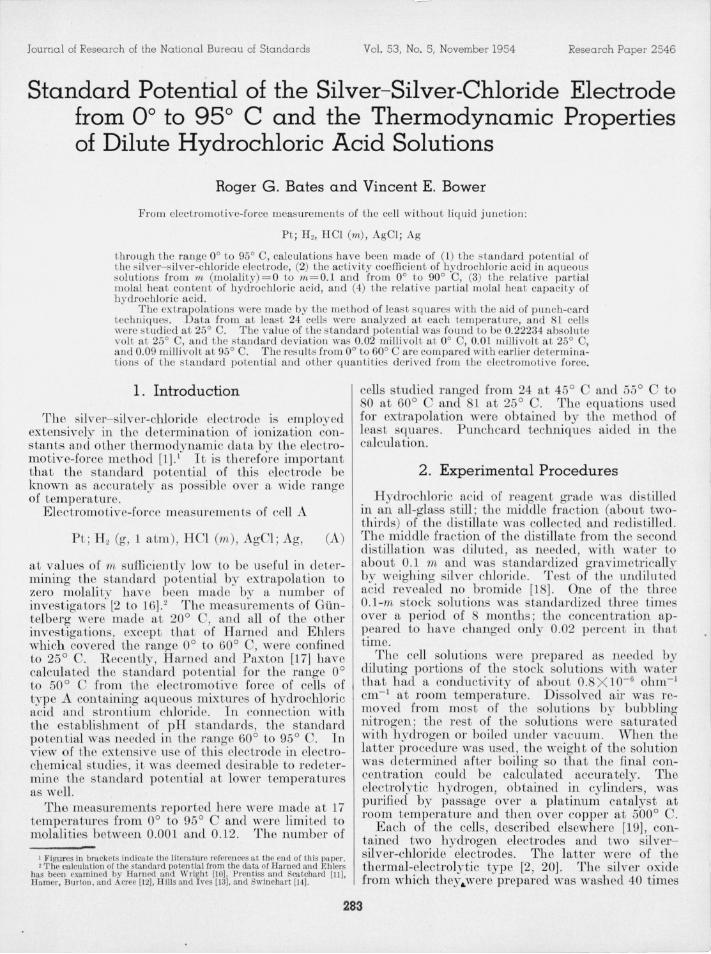
The number of solutions studied was sufficiently large to justify the use of statistical procedures in analyzing the data. vVith the proper choice of a *, a plot of E O", eq (3), should be a straight line with intercept E O and slope - {3. The best value of a* is presumably tbe one that makes E O" most nearly a Imear fun ction of 1n. To ascertain thi s best value, E O" was calculated for tln-ee values of a * at 0°, 25°, and 60° C and fitted to a linear equation by the method of least squares. The standard deviation, ([ , of an expenmental poin t from th e leastsquare lin e IS plotted as a function of a * ill figure l. The curve arc believod to justify the select ion of 4.3 A for a* at 0° and 25° C and 6.0 A at 60° C. The \Talues of a * for temperature between 25° and 60° and from 70° to 95° C woro determined by inspection of th e plots of E O" a a function of m for two or more values of a*.
If an incorrect value of the ion- ize parameter is used, the plots of EO" with respect to m become curved, and the intercep t of th e straight lin e established by least squares is no longer the true valu e of EO. The influence of a change in a * is cl emonstrnted by tho data for 25° C:
a* I EO u
I A v 11W
2. 0 O. 22222 O. 19 4. 3 . 22234 . 07 6. 0 .22246 . 13
Table 1 conLams a summary of the least-square calculations at the 17 temperat,ures. The standard potential of cell A is given in the fifth column. Th e standard doviation, ([ 1, in millivolts, of the in tercept is given in the sixth column. The value of E O from 0° to 90 ° C is given by the equation
EO = 0.23659-(4.8564 X 10- 4) t -(3 .4205X 10- 6) t 2
+(5.869 X 10- 9) t 3 , (4)
where t is in degrees Celsius. The standard potential of the silver- silver-chloride elec trod e is either equal to E O (cell A) 01' - E O, depending on which of the two common conventions for single electrode po-tontials is adopted. .
The "observed" values of E O are compared in table 1 with those calculated by eq (4) . The last column gives Ll, the diffm'ence in millivolts, between the calculated and observed value at each tempera-
20
18
on 16 2 2~oC x
14 (J)
>--oJ 12 0 > -b
10
8
6
FIGU RE 1. Standard deviation of B Oil from the least-squa?'e line as a function of a* at 0°, 25°, and 60° C.
T JI B LE 1. T he Standard potential of the cell: 112; IlCI (m ), AgCI; Ag fr om 0° to 95° C
Summary of least-square calculations, and values of E O from 0° to 90° C calculated from eq (4) .
~um-t ber of a' {1 E O <1, EO (Cq 4) t;
cells ---- -----------
°C abs v l1W abs v mv 0 31 4.3 1. 74 X l0 2 0.23655 0.02 0.23659 + 0.04 5 31 4.3 1. 80 . 23413 .02 . 23408 -. 05
10 32 4.3 1. 79 . 23l42 .01 .23140 -.02 15 32 4.3 1. 79 .22 57 .01 .22856 - .01 20 32 4.3 1. 82 .22557 .02 .22557 .00
25 81 4.3 1. 75 . 2223-1 . 01 .22240 + . 06 30 44 4.3 1. i5 .21904 .02 .21910 +.06 35 37 5.0 1.1 5 .21565 .02 . 21566 +.01 40 37 5.0 1. 23 .21208 .03 . 21 207 -.01 45 24 5.0 1.14 .20835 . 03 .20334 -. 01
50 32 5 0 1. 09 . 20449 .03 .20449 .00 55 24 5.0 1.1 2 .20056 . 04 .20051 - .05 60 80 6.0 0.16 . 19649 . 03 . 19641 - .08 70 43 6. 0 - 0.14 . 18782 . f4 . 18785 +.03 80 49 6.0 - .37 . 17873 . 07 . 17885 +. 12
90 44 6.0 - .37 . 16952 . 00 .16946 - .06 95 37 6.0 - .32 . 16511 . 09 - --- - ----- -- - - ---- -.
ture. The average value of Ll at the 16 temperatures is 0.04 mv.
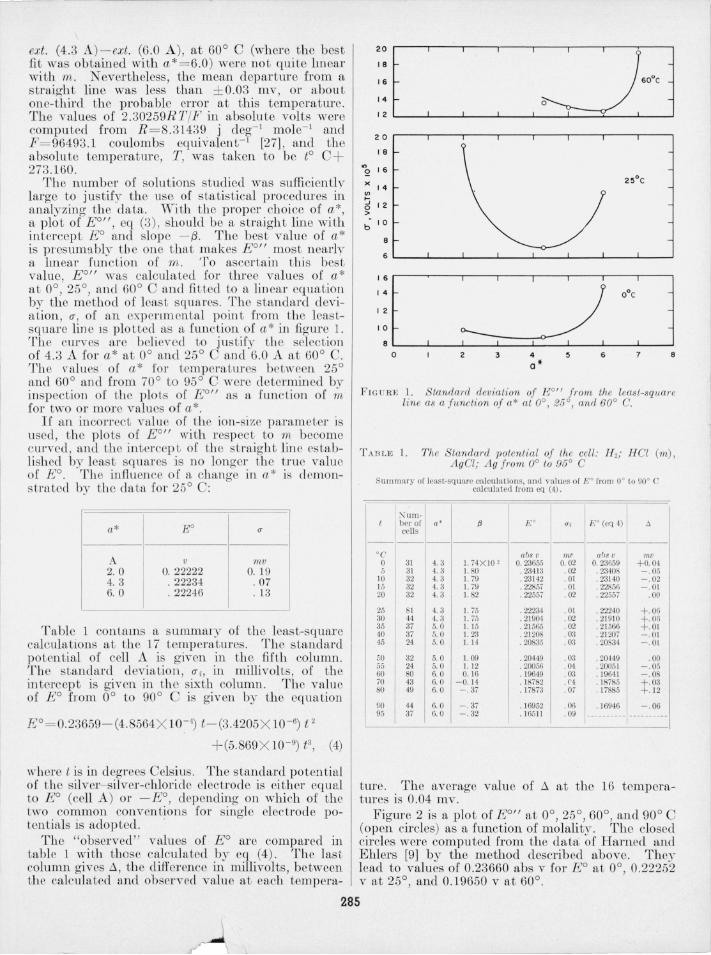
Figure 2 is a plot of E O" at 0°, 25 °,60°, and 90° C (open circles) as a function of molality. Tho closed circles were computed from the data of Harned and Ehlers [9] by the method described above. The~lead to values of 0.23660 abs v for E O at 0°, 0.22252 vat 25°, and 0.19650 v at 60°.
285
0.237
o°c 0.236
0 .2 35
0 .234
0.223
(j) 0.222 ~ 0 > . 0 .221 w
0.220
OJ97
0 .196
0 . 17 1
90° C 0 .
_ . '"
. 0. 170
.0 0 _ . o 0 o 0
0-
u o.
f '" 0
O. 169 I I I I I I I I 0.00 0 .01 0 .02 0 .03 0 .0 4 0.05 0.06 0 .07 0.08 0.09 0.1
MOLALITY OF HCI
FIGURE 2. Plots of E OIl at 0°,25°, 60°, ana 90° Cas a function of molali ty. Dots indicate the measurements of Harned and E hlers.
TABLE 2. Smoothed values oj the electromotive force of cell A in absolute volts from 0° to 90° C
m E o E 10 E 20 E.~25 Eao E40 E 50 E60 E iO I
E 50 E oo
0.001 0.56330 0.57019 0.57631 0.57909 0.58 178 0.58683 0.59125 0.59525 O. 59860 0. 6015 0. 6043 .002 . 53131 . 5370 1 .54 198 . 54418 . 54628 . 55018 .55-344 . 55628 .55848 .5602 .5619 .005 .48931 . 49351 . 49695 .49840 . 49977 .50211 . 50388 . 50517 . 50589 . 5062 .506,3 . 01 . 45787 . 46091 . 46323 .46412 .46493 . 46613 .46678 .46694 . 46655 . 4657 . 4648
. 02 . 42669 . 42853 .42985 . 43019 . 43044 .43049 . 43006 . 42909 . 42764 . 4258 . 4238
. 05 . 38588 . 38636 . 38613 . 38579 . 38533 .38391 . 38211 . 37969 .37691 .3737 . 3703
.07 . 37094 .37089 .37016 .36957 .36885 .36691 . 36461 .36174 .35848 .3548 .3509
. 1 . 35505 .35444 .35316 .35233 .35134 . 34888 . 34608 . 31275 .33904 . 3349 .3304
TABLE 3. Act-i.oity coefficient of hydrochloric acid from 0° to 90° C
__ m __ I __ o_. _ 10· 20· I 25° 30° ~I~I~I~ 80· 90· ------
0.001 0. 9670 0.9660 0.9654 0. 9650 0.9648 0. 9642 0. 9635 0.9631 0. 962 0. 962 0.961 . 002 . 9540 . 9533 .9524 . 9520 . 9518 . 9507 . 9499 . 9493 . 948 . 947 . 946 . 005 . 9313 . 9299 .9289 . 9283 . 9274 . 9268 .9252 _ 9249 _ 923 .921 . 920 .01 . 9081 . 9069 . 9054 . 9045 . 9034 .9026 .9006 .9000 . 898 .895 .893
. 02 . 8805 .8786 . 8766 .8753 .8741 .8735 .8707 .8700 .867 .863 . 860
. 05 .8381 . 8357 .833 1 . 8308 . 8291 .828.3 .8239 .8227 . 817 . 813 . 810
. 07 .8223 . 8196 . 8163 . 8137 .8U9 .8107 .8058 .8033 .797 . 792 . 788
. 1 . 8067 .8038 . 8000 . 7967 .7946 . 7927 . 7867 . • 328 . 775 . 769 . 765
286
4. Activity Coefficient of Hydrochloric Acid
The electromotive forces given in table 2 werc com}}uted from the smoothed values of E O" at round valu cs of the molality . This E O" was computed, in turn, from the intercepts and slopes of the least-quare lines listed in table 1. The mean activity
coefficients calculated by eq (1) from these smoothed values of E and the values of EO given in table 1 are ummarized in table 3.
N either the electromo tive force nor the activity <:oefficient was smoothed with respect to temperature. H ence, for a calculation of the thermodynamic quant ities derived from the temperature coefficients of electromo tive force, the values of - log 'Y ± at 25 0 C s nd at intervals of 10 deg C from 00 to 90 0 were fitted by the method of least squares to a power series in t, the temperature on the Celsius scale:
(5)
The values of log 'Y± were given cqual weigh t at cach temperature. The constan ts of this equation for Bight valucs of the molality are listed in table 4.
TABLE 4. Constants of the equation: -log 'Y±=A + B t+ Ct2
for the temperature range t = O° to t = 90° C
.!l = mcan difference between ca lculated and observed values, in pcrccnt or - log 'Y ± at 25° C.
In .It n C '" Percent
0. 001 0.01470 0. 273 X lO ' 0. 27 X IQ' 0. 39 . 003 .02051 . 288 1. 30 . 23 . 005 .03 105 . 443 1. 49 . 34 . 01 . 04201 . 510 3. 13 . 34 . 02 . 05555 .557 4.63 . 49 . 05 .07594 1. 058 6. 73 . 42 .07 . 08515 1. 299 8. 37 . 38 . 1 . 09334 1. 620 11. 21 . 44
The last column gives the mean difference beLwecn the calculated and observed log 'Y± at the 11 temperatures, expressed as percen tage of - log 'Y ± at 25 0 C. 'When the values of log 'Y ± were weighted according to the reciprocal of the probablc crror of E O" at the appropria te temperature, the fit to eq (5) was no t as complete as when equal weight was given to each value. The relat ive partial molal heat content computed from the two sets of constants differed on the average by 15 j mole- 1 aL 00 C, 7 j mole- I at 25 ° C, and 42 j mole- 1 at 90 0 C. Thc relative partial molal heat capacity was changed about 0.4 j deg- 1
mole- 1 at 00 C, 0.5 j cl eg- 1 mole- 1 at 25 0 C, and 1.2 j deg- 1 mole- 1 at 90 0 C.
5 . Relative Partial Mola l Heat Content and Heat Capacity
The temperature variation of log 'Y ± can be used to calculate the partial molal heat content, k , and partial molal hcat capacity, J2, of hydrochloric acid relative to i ts valuc in tbe infini tely dilu te solu tion.
The former is given by
a (-log 'Y±) aT
(6)
where T is the temperature on the K elviJl scale. Inasmuch as aT= at, we obtain, by combination of eq (5) and (6),
L2= 4.6052RT2(B + 2Ct) ( 7) and
The values of L2 and J 2, in absolute joules, calcula ted from these two equations are listed in tables 5 and 6.
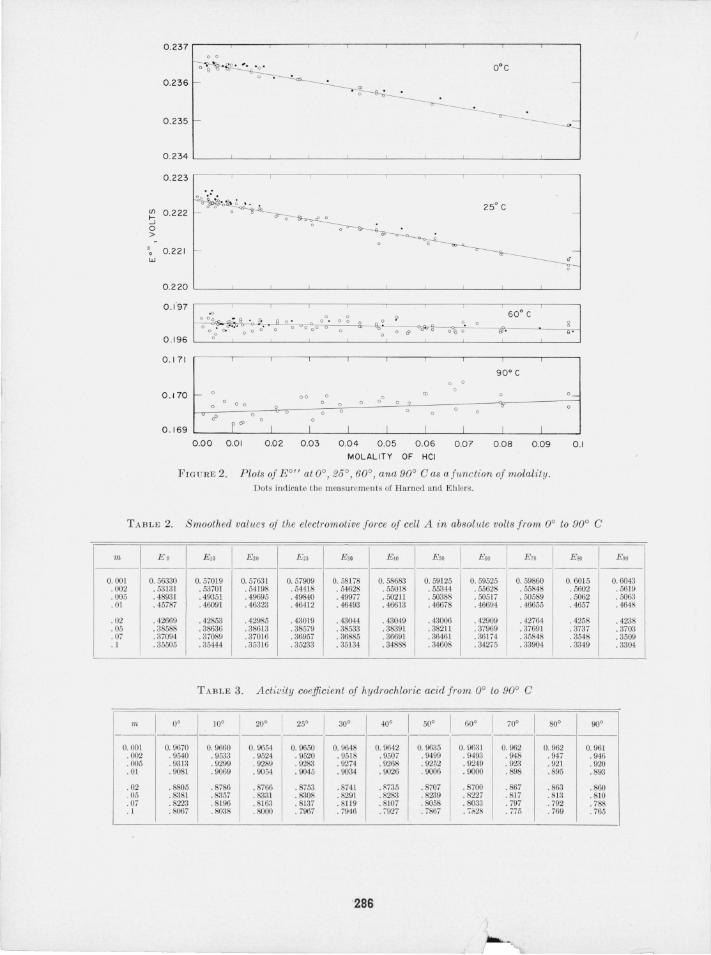
The relative partial molal heat content at 00 ,
25 0 , 60 0 , and 90 0 C is plotted as a function of m1/ 2
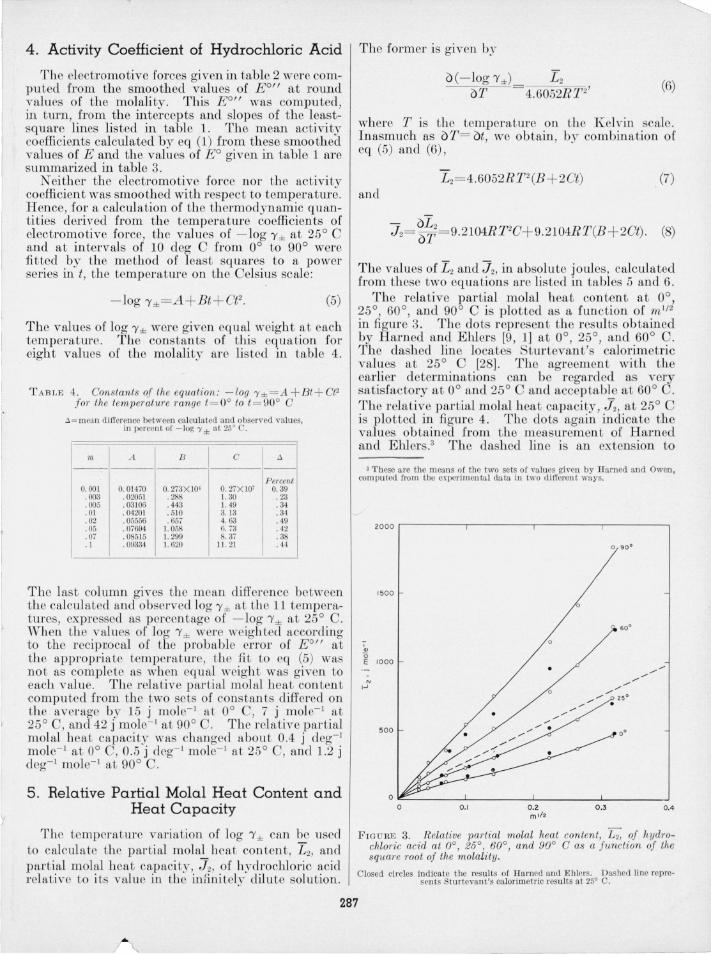
in figure 3. The dots represen t the results obtained by Harned and Ehlers [9 , 1] at 00 , 25 0 , and 60 0 C. The dashed line locates Stur tevan t's calorimetric values at 25 0 C [28]. The agreemen t with the earlier determinations can be regarded as very sa tisfactory at 00 and 25 0 C and acceptable at 600 C. The relative par tial molal heat capacity, ~, at 25 0 C is plotted in figure 4. The dot again indicate the values obtained from the measurem ent of Harned and Ehlers.3 The dashed l ine is an extension to
3 These a re the means or the two sets or values given by Ham ed and Owen, computecl from tbe experimental da ta in tll"O different ways.
I '" '0 E
-N ,..J
2000
o 90°
1500
° 60°
1000
°
500 0°
O ~ ______ ~ ________ -L ________ -L ______ ~
o 0.1 0 .2 ml12
0.3 0.4
FIGURE 3. Relat1:ve paTtial molal heat content, L 2, of hydTochloric acid at 0°, 25°, 60°, and 90° C as a junction oj the squaTe 1'00t of the molality.
Closed circles indicate the results of Harned and Eblers. Dashed line represents Sturtevant 's calorimetric resul ts at 25° .
287
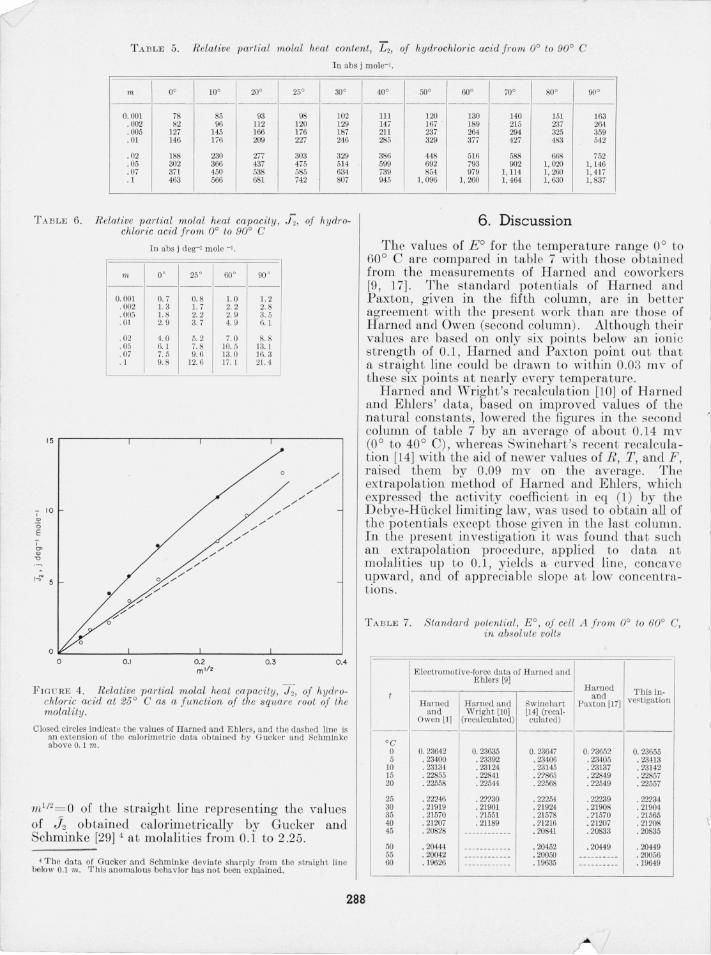
T ABLE 5. Relative partial molal heat content, L2, of hych'ochloric acid f rom 0° to 90° C
I n abs j mole-I.
T ABL E 6.
m 0° 10° 20° 25° 30° ------- --- - ----- - --
0. 001 78 85 93 98 102 .002 82 96 112 120 129 . 005 127 145 166 176 187 .01 146 176 209 227 246
. 02 188 230 277 303 329
. 05 302 366 437 475 514
. 07 371 450 538 585 634
. 1 463 566 681 742 807
R elative partial molal heat capaci ty , J~, of hydl'ochloric acid fr om 0° to 90° C
In abs j deg- I mole -1.
m 0 ' 25 ° 60' 90 ' -------- - - -
0.001 0.7 0. 8 1.0 1. 2 . 002 1.3 1.7 2. 2 2.8 . 005 1. 8 2.2 2. 9 3. 5 . 01 2.9 3. 7 4. 9 6.1
.02 4.0 5.2 7.0
I
8. 8 . 05 6. 1 7. 8 10.5 13.1 . 07 7 5 9 6 13.0 16.3 . 1 9. 8 12 6 17. 1 21. 4
15 r------,-----,------,------,
- 10 I ., o E ., '" ., "
0.1 0.2 m '/z
0.3 0.4
F IGU RE 4. R elative partial m olal heat capacity, -:t;, of hydrochloric acid at 25 ° C as a function of the sq1wre "oot of the molali ty.
Closed circles indicate t be values of Harned and Ehlers, and tbe dashed line is an extension of the calorimetric data ob tained by Gucker and Schminke above 0. 1 m.
m1/ 2= 0 of the straight line representing the values of 32 obtained calorimetrically by Gucker and Schminke [29] 4 at molalities from 0.1 to 2.25 .
• The data of Gucker and Schmlnke deviate sharply from the straight line below 0.1 m. T his anomalous beha viol' has n ot been expla ined.
40° 50° 60° 70° 80° 00° - - - - --- ------------
111 120 130 140 151 163 147 167 . 189 215 237 264 211 237 264 294 325 359 285 329 377 427 483 542
386 448 516 588 668 752 599 692 793 902 1,020 1, 146 739 854 979 1, 114 1, 260 1, 417 945 1, 096 1, 260 1, 464 1,630 1,837
6 . Discussion
The values of E O for the temperature range 0° to 60° C are compared in table 7 with those obtained from the measurements of Harned and coworkers [9 , 17]. The standard potentials of Harned and Paxton, given in the fifth column, are in better agreement with the present work than are those of Harned and Owen (second column) . Although their values are based on only six points below an ioni.c strength of 0.1, Harned and Paxton point out that a s traight line could be drawn to within 0.03 mv of these six points at n early every temperature.
Harned and Wright 's recalculation [10] of Harned and Ehlers ' data, based on improved values of the natural constants, lowered the figures in the second column of table 7 by an average of about 0.14 mv (0 ° t o 40 ° C), whereas Swinehar t's r ecen t r ecalculat ion [14] with the aid of newer values of R, T , and F , raised them by 0.09 mv on the average. The extrapolation method of Harned and Ehlers, which expressed the activity coefficient in eq (1) by th e D ebye-Huckellimiting law, was used to obtain all of the potentials except those given in the last column . In the present inves tiga tion it was found that such an extrapolation procedure, applied to data a t molalities up to 0.1 , yields a curved line, concave upward, and of appreciable slope at low concentrations.
T ABL E 7. S tandard potential, E O, of cell A fr om 0° to 60° C, in absolute volts
Electromotive-force data of Harned and Ehlers [9)
Harned 'fh is in~ t and H arned H arn ed and Swinehart P axton [17) vestigation
and Wright llO) l14) (recal-Owen III (recalculated) culated)
°C 0 0. 23642 0.23635 0. 23647 O. ?36.52 0. 23655 5 . 23400 . 23392 . 23406 . 23405 . 23413
10 . 23134 . 23124 . 23145 . 23137 . 23142 15 .22855 . 22841 . ??865 · 22849 • 22857 20 _ 22558 · 22544 · 22568 • 22549 · 22557
25 • 22246 . 27230 • 22254 · 22239 • 22234 30 · 21919 · 21901 · 21924 · 21908 · 21904 35 · 21570 .?l551 · 21578 . ?l570 · 21565 40 · 21207 · 21189 .?l216 • 21207 · 21208 45 · 20828 -- - --------- . 20841 . 20833 . 20835
50 . 20444 - - - -------- - . 20452 . 20449 . 20449 55 .20042 - -- -- - ---- -- . 20050 - - ------ - . . 20056 60 .19626 - -- - -- - ----- . 19635 - -- --- .. -- . 19649
288
t I
"1, ( ,
Evidently Lhe consistency of th e different sets of data can only be judged if both sets are treated in th e same manner. As may be seen in figure 2, the elecLromotive-force data and stand ard potential reported ]l ere are in acceptable agreement with those of Harned and Ehlers at 00 and 60 0 C, but appear to be a-bout O.lS mv lower at 25 0 C. A difference of this m~gnitude at 25 0 C , where th e results are tatistically t.he most precise, is difficult to explain,
l)articularly because the silver- silver-chloride electrodes an d the hydrochloric acid were prepared by similar procedures in the two investigations. A critical examination of the electromotive-force data obtained by other workers is therefore of particular in terest.
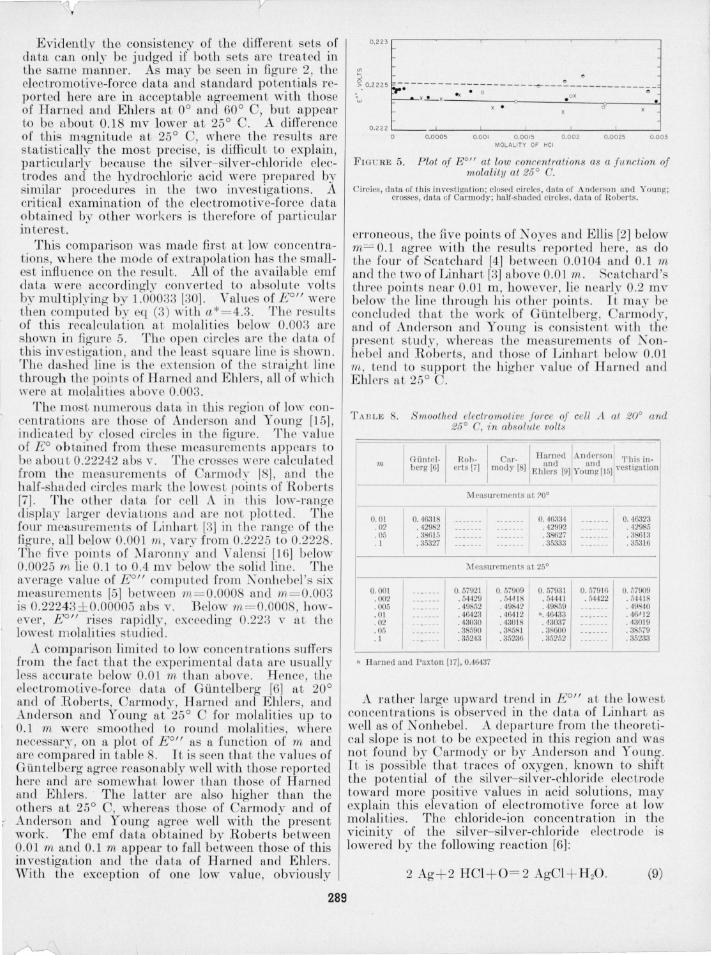
This comparison was made first at low concentrat ions, where the mode of extrapolation ]las the smalle t influence on the r esult. All of the available emf data were accordingly converted to absolute volts by multiplying by ] .00033 [30]. Values of EO/! were then comp uted by eq (3 ) with a* = 4.3. The r esults of this recalculation at molalities b elow 0.003 arc shown in flgure 5. The open circles arc th e data of this inves tigation , and Lhe least square line is shown. The dashed lin e i th e extension of the straiF;ht line through th e po in ts of Harned and Ehler , all of wl l ieh were at molalities above 0 .003.
The most numerou data in this region of low concentrations arc those of Anderson and Youn g [15], indicated by do ed circle in the fi gure. Th e valu e of EO obtain ed from these measurements appears to be about 0.22242 abs v. Th e crosses were calculated from th e measurem ents of CarmodY IS], anel th e half-shaded circles mark the lowest points of Roberts [7] . The other da ta fol' cell A in. this low-range display larger deviatIOns and arc no t ploLted . The fom measmements of Linhart [3] in the range of Lhe figure, all below 0.001 m, vary from 0.2225 Lo 0.222S. The five points of 11a1'onn:I' and Valensi [16] below 0.0025 m lie 0.1 to 0.4 mv below Llle solid line. Th e average value of E O/! compuLed from N"onhebel's six measurements [5] beLween m = O.OOOS and m = 0.003 is 0.22243 ± 0.00005 abs v. Below m = O.OOOS , however, E O/! rises rapidly , exceeding 0.223 v at Lh e lowest molalities studied.
A comparison limiLed to low concentrations suffers from the fact that the experim en tal data ar c usually less accurate below 0.01 m than above. Hence, the electromotive-force data of Guntelberg [6] at 20 0
and of Roberts, Carmody, Harned and Ehlers, and Anderson and Young at 25 0 C for molalities up to 0.1 m were smoothed to round molalities, where necessary, on a plot of E ol! as a function of m and arc compared in table S. It is seen that the values of Giin telberg agree r eason ably well with those reported here and are somewhat lower than those of Harned and Ehlers. The latter arc also higher than the others at 25 0 C , whereas those of Carmodv and of
t Anderson and Young agree well with the present work. The emf data obtained bv Roberts between 0.01 m and 0.1 m appear to fall between those of this investigation and the data of Harned and Ehlers. vVith the exception of one low value, obviously
289
0 .223 .--------,---~--~---,....--~
<J> ~ 0
g. 0.2225 ~.----- ----:- ~---------o----::.------------o-ZOI.lJ t-------x ~x -x: • ox •
x • d"
0. 222 L---L __ ---'-___ '--__ -'--__ --'---__ --.J o 0.00 05 0.001 0.0015 0.002 0.0025 0.003
MOLALITY OF Hel
FIG U RE 5. Plot of E O" at low concentrations as a function of molality at 25° C.
Circics , data of th is invC'stiga tion ; closed circles , data of A ndCl'son and Young; crosses, data of Ca rmody; half-s haded Ci rcles. data of Roberts.
erroneous, the five points of Noyes and Ellis [2] below m= 0.1 agree with the r esults reported h ere, as do the four of Scatchard [4] beLween 0.0104 and 0.1 m and the two of Linhar t [3] above 0.01 m. Scatchard's three points n car 0.01 m , howeve r, lie n early 0.2 mv below th e line Lhrough hi s oLher points. IL may be concluded Lhat tbe work of Guntc1berg, Carmody, and of Anderson and Young is consistenL with th e present study, whereas the measurements of J.\Tonh ebel ancl Roberts, and those of Linhart below 0 .01 m, Lend Lo upport Lbe high er valu e of Harned and. Ehlers at 25 0 C.
T AB LE . Smoothed eleclTomolive force of cell A at 20° and 25° C, in absolute vall s
rn
1
Oilntrl- I Roh-1 C" 1 "g:;;" IA"2",W"I·''' ;' I berg [6] erls [,] mod y [8] Ehlers [9] Young [15] vestlgatlon
----J\ [easurcmcnts at ?oO
0. 01 0.
463 181
------- ... -- . 0. 46334 -- -- --I 0. 46323 . 02 . 42982 - - - --. - __ _ 0· . 42992 . ---- .42985 . 05 .3861 5 -- - ---- ---- - I . 38627 . 386 1 ~ . 1 .35327 -- - -.-- .- . -- . ::15333 -- . ---- .35316
~ reasurl? m (' nts at 25°
0. 001 -- . ---- 0.57921 0.57909 0. 57931 0.57916 O. 57909 . 002 -- ------ .5-1429 .54418 .54441 .54422 . 544 18 . 005 ." . --.- . 49852 .498'12 . 49~59 - - - -- - - . 49840 .01 -- . 4542:1 . 46412 ". 46433 - -. ---- . 46'12 . 02 -- . ---- . 43030 . 4::101 8 . 4::1037 - - . ---- . 43019 . 05 .- . --- .38590 . 3 5R I . 38000 .- . --- . . 385, 9 . 1 -- - ---- . 35243 . 35236 . 35252 -- ._--- .35233
• Harned and Paxton [17] , 0.46437
A rather large upward trend in E O/! at the lowest concen traLions is observed in the data of Linhart as well as of N onhebel. A departure from th e theoretical slope is not to be expected in this region and was not fOllOcl by Carmody or by Anderson and Young. It is possible that traces of oxygen, known to shift the potential of the silver- silver-chloride electrode toward more positive values in acid solutions, may explain this elevation of electromotive force at low molalities. The chloride~ion concentration in th e vicinity of the silver-silver-chloride electrod e is lowered by the following reaction [6]:

l
The resulting change of emf may be appreciable in dilute solu tions, for dE/dnCl , where nCl is a number of equivalents of chloride ion, is much larger than in solutions of moderate or high concentration.
Nevertheless, dissolved air cannot explain the difference between the results of the present investigation and those of Harned and Ehlers because an air-free technique was used in both investigations. The potentials of silver- silver-chloride electrodes are known to be altered likewise by traces of bromide 118, 31] and by aging during the first 30 hours after preparation [32] . A lowering of the electromotive force of the cell by 0.18 mv would require about 0.02 mole percent of bromide impurity in the hydrochloric acid used in this study; this quantity could hardly have gone undetected in the test that was performed. The effect due to aging causes th e emf of the cell containing a freshly prepared silversilver-chloride electrode to be too high. The agreement among measurements at 25° C made at different points in the temperature series would seem to rule out a pronounced effect due to aging. No simple reasonable explanation for the differences between emf values at 25° C reported here and those of Harned and Ehlers has been found .
The activity coefficients and other thermodynamic properties of hydrochloric acid are . dependent not upon the value of E O but on the difference E - EO. Inasmuch as the extrapolation lines are nearly parallel (see fig. 2)/ the activity coefficients at 25° C reported here agree very well with those computed from Harned and Ehlers's measurements with a standard potential of 0.22252 abs v (the value obtained from the emf data of Harned and Ehlers by the extrapolation procedure used in the present work) . The activity coefficients from these two sources are compared in table 9 with those obtained
TABLE 9. Activity coefficient of hydrochloric acid at 25° C
I Harned I Shedlo v- Hills and I 'fhis in ves-m and : Ehlers [9) sky l33] Ives [13] tigation
I
0. 001 0. 9546 0. 9553 0.9050 0.9550 . 002 .9515 . 9525 . 9519 . 9520 . 005 . 928.5 . 9287 . 9280 . 9283 . 01 . 9044 . 9049 . 9040 . 904 5
. 02 . 8755 . 8757 .8747 . 8753
. 05 .8303 .8301 .8295 . 8308
. 07 -------- - - ---- - . 8129 .8137
I .1 . 7969 . 7938 .7958 . 7957
by . Hills and I ves [13] in a careful study of the hydrogen-calomel cell without liquid junction and with those computed by Shecllovsky [33] 6 from transference numbers and the electromotive force of cells with transference. The agreement with the determination of Hills and Ives is very satisfactory, and the only notable difference from the values of Shed-
, Prentiss and Scatehard [U] have noted that the slopes of the Jines plotted from the data of Carmody, Roherts, a nd Harned and Ehlers are n early the same.
• A simila r comparison has been made by K ing l34] .
lovsky appears to be at m = O.l, where the departure corresponds to 0.19 mv in the electromotive force.
Grateful acknowledgment is made to vV. J. Youden for advice and assistance in the statistical treatment of the data, and to G. Valensi for furnishing numerical data not given in his paper. The authors are also indebted to T. F. Young for helpful discussions during the course of the work.
7. References
[1] H. S. Harned and B. B. Owen, The phys ical chemistry of electroly tic solutions, 2d eel. (Reinhold Publishing Corp. , New York, N . Y. , 1950).
[2] A. A. Noyes and J. H . E llis, J. Am_ Chem. Soc. 39, 2532 (1917).
[3] G. A. Linhart, J. Am. Chem. Soc . U, 1175 (1919). [4] G. Scatchard, J . Am. Chem. Soc. 4,7, 641 (1925) . [5] G. Nonhebel , Phil. Mag. [7] 2,1085 (1926) . [6] E. Guntelberg, Z. physik. Chem. 123, 199 (1926) . [71 E. J. Roberts , J . Am. Chem. Soc. 52, 3877 (1930) . [8] W. R. Carmody, J. Am. Chenl. Soc . 54, 188 (1932). [9] H. S. Harned and R. W. Ehlers, J . Am. Chem . Soc. 54,
1350, 2179 (1932). [10] H. S. Harned and D . D . Wright, J. Am. Chem. Soc. 55,
4849 (1933) . [11] S. S. Prentiss and G. Scatchard, Chem. Rev. 13, 139
(1933) . [12] W. J. Hamer, J . O. Burton, and S. F . Acree, J . Research
NBS 24, 269 (1940) RP1284. [13] G. J. Hills and D . J. G. Ives, J. Chem. Soc. 318 (1951) . [14] D. F. Swinehart, J . Am. Chem. Soc . 74, 1100 (1952) . [15] N. J . Anderson (Disser tation , Univers ity of Chicago,
1934) ; T . F. Young (private communication) . [16] G. Maronny and G. Valensi, J. chim. phys. 49, C91
(1952) . [17] H . S. Harned and T. R. Paxton, J. Phys. Chem. 57, 531
(1 953) . [18] G. D. Pinching and R. G. Bates, J. Research NBS 37,
311 (1946) RP1749. [19] R. G. Bates and 3. F. Acree, J. Resea rch NBS 30, 129
(1943) RP1524. [20] H. S. Harned, J. Am. Chem. Soc. 51, 416 (1929). [21] R. G. Bates and G. D . Pinching, J. Research NBS 402,
419 (1949) RP1982. [22] E. F. Mueller and H. F. Stimson, J . Research NBS 13,
699 (1934) RP739. [23] N. F. Osborne, H. F . Stimson, and D . C. Ginnings, J .
Research NBS 23, 261 (1939) RP1229. [24] International Cri t ical Tables, III, p. 293. [25] G. J. Hills and D . J . G . Ives, Nature 163, 997 (1949). [26] G. G. Manov, R. G. Bates, W. J . Hamer, and S. F. Acree,
J . Am. Chem. Soc. 65 , 1765 (1943) . [27] J. 'W. M. DuMond and E. R. Cohen, R eport to t he
Nat ional Research Co uncIL Comm ittee on Constants and Gon version Factors of Phys ics, D ecember 1950; Phys. R ev. 82, 555 (1951) .
[28] J. M. Sturtevant, J . Am. Chem . Soc. 62, 584 (1940) . [29] F. T. Gucker, Jr. , a nd K. H . Schmink e, J. Am. C hem .
Soc. 54, 1358 (1932) . [30] Announcement of changes in electrical and photometric
units , NBS Circula r 459 (May 15, 1947). [31] E. Guntelberg, Studier over Elektrolyt-Aktiviteter, G .
E. C. Gads POI·lag, 90penhagen (Dissertation;, 1938) . [32] D . A. MacInnes and h. . Parker, J . Am. Chem . tioc. 37 ,
1445 (1915) ; E . R. Smit,l and J . K. Taylor, J. Research NBS 20, 837 (1938) RP1108.
[33] T. Shedlovsky, J. Am. Chem. Soc. 72, 3680 (1950) ; T . Shed lovsky and D. A. MacInnes, J . Am. Chem . Soc. 58, 1970 (1936).
[34] E. J. King, J. Am. Chem. Soc. 75, 2204 (1953).
WASHINGTON , February 25 , ] 954 .
290