standard retraction form - file.scirp.orgfile.scirp.org/pdf/jtst_2018011815002863.pdf · author(s):...
TRANSCRIPT

1
Retraction Notice Title of retracted article: Natural Dyes Extract from Chinese Tallow (Triadica sebifera) Tree Leaves Extraction in Alkaline Medium and Their Application on Silk Fabrics Author(s): Md. Hasan-Al Mamun, Md. Anwar Hossain, Monir Khan, Asheke Mostofa, Md. Zakaria, Most Sabina Yeasmin * Corresponding author. Email: [email protected] Journal: Journal of Textile Science and Technology (JTST) Year: 2018 Volume: 4 Number: 1 Pages (from - to): 1 - 17 DOI (to PDF): http://dx.doi.org/10.4236/jtst.2018.41001 Paper ID at SCIRP: 2160071 Article page: http://www.scirp.org/journal/PaperInformation.aspx?PaperID=81847 Retraction date: 2018-02-23 Retraction initiative (multiple responses allowed; mark with X): XAll authors
Some of the authors: Editor with hints from Journal owner (publisher) Institution: Reader: Other: Date initiative is launched: 2018-02-23 Retraction type (multiple responses allowed):
Unreliable findings Lab error Inconsistent data Analytical error Biased interpretation Other: Irreproducible results Failure to disclose a major competing interest likely to influence interpretations or recommendations Unethical research
Fraud Data fabrication Fake publication Other: Plagiarism Self plagiarism Overlap Redundant publication * Copyright infringement Other legal concern: Editorial reasons Handling error Unreliable review(s) Decision error Other: X Other: The first author (Md. Hasan-Al Mamun) didn’t get permission to publish this paper from her supervisor.
Results of publication (only one response allowed):Xare still valid.
were found to be overall invalid. Author's conduct (only one response allowed):Xhonest error
academic misconduct none (not applicable in this case – e.g. in case of editorial reasons)
* Also called duplicate or repetitive publication. Definition: "Publishing or attempting to publish substantially the same
work more than once."

2
History
Expression of Concern: yes, date: yyyy-mm-dd Xno
Correction: yes, date: yyyy-mm-dd Xno
Comment:
The first author (Md. Hasan-Al Mamun) didn’t get permission to publish this paper from her supervisor. This article has been retracted to straighten the academic record. In making this decision the Editorial Board follows COPE's Retraction Guidelines. Aim is to promote the circulation of scientific research by offering an ideal research publication platform with due consideration of internationally accepted standards on publication ethics. The Editorial Board would like to extend its sincere apologies for any inconvenience this retraction may have caused.
Journal of Textile Science and Technology, 2018, 4, 1-17 http://www.scirp.org/journal/jtst
ISSN Online: 2379-1551 ISSN Print: 2379-1543
DOI: 10.4236/jtst.2018.41001 Jan. 19, 2018 1 Journal of Textile Science and Technology
Natural Dyes Extract from Chinese Tallow (Triadica sebifera) Tree Leaves Extraction in Alkaline Medium and Their Application on Silk Fabrics
Md. Hasan-Al Mamun1*, Md. Anwar Hossain1, Monir Khan2, Asheke Mostofa2, Md. Zakaria1, Most Sabina Yeasmin3
1College of Chemistry and Chemical Engineering, Wuhan Textile University, Wuhan, China 2College of Textile Engineering, Wuhan Textile University, Wuhan, China 3Department of Chemistry, National University, Gazipur, Bangladesh
Abstract In this research work, natural dye was extracted from tallow plant in alkaline medium of extraction and was applied on silk fabric on exhaust dyeing process. Three mordanting techniques (pre-mordanting, meta-mordanting, and post-mordanting) were employed using aluminum potassium sulfate, ferrous sulfate, and zinc sulfate as mordants. The dyeing was conducted with and without metallic salt mordants. The color of dyed silk was investigated in terms of the CIELAB (L*, a*, b*, C*, and H*) and color strength (K/S) values. The color fastness to washing, light, and crocking of the dyed samples were measured according to ISO 105 C06, ISO 105-B02: 1994, and AATCC Test Method 8-2007, respectively. Optimum results were achieved when dyeing at 90˚C for 60 min and at pH 4. Silk fabric dyed without mordant had a shade of reddish-brown, while those mordanted with aluminum potassium sulfate, and zinc sulfate produced a variety of pale to dark reddish color shades. However, ferrous sulfate mordant gives duller and darker shade. The color fastness to washing was fair to good, whereas the color fastness to light was poor to fair, and colorfastness to crocking was good to excellent. The SEM analysis showed a very little damage to dyed silk samples at temperature near to boiling. The UV protection and antimicrobial property of the silk dyed with plant extract was studied. The results showed that the fabric samples treated with extract have excellent UV protection properties and are very effective in blocking UVA and UVB radiations. The fabric dyed with natural extract has tremend-
How to cite this paper: Mamun, Md.H.-A., Hossain, Md.A., Khan, M., Mostofa, A., Zakaria, Md. and Yeasmin, M.S. (2018) Natural Dyes Extract from Chinese Tallow (Triadica sebifera) Tree Leaves Extraction in Alkaline Medium and Their Application on Silk Fabrics. Journal of Textile Science and Technology, 4, 1-17. https://doi.org/10.4236/jtst.2018.41001 Received: November 16, 2017 Accepted: January 16, 2018 Published: January 19, 2018 Copyright © 2018 by authors and Scientific Research Publishing Inc. This work is licensed under the Creative Commons Attribution International License (CC BY 4.0). http://creativecommons.org/licenses/by/4.0/
Open AccessRETRACTED
Md. H.-A. Mamun et al.
DOI: 10.4236/jtst.2018.41001 2 Journal of Textile Science and Technology
ous antimicrobial activity which was proved by bacterial reduction in quantit-ative tests whereas the antibacterial activity of the control fabric was negligi-ble.
Keywords Natural Dyes, Extraction, Tallow Tree Leaf, Ultraviolet Protection, Colorfastness, Silk
1. Introduction
Most of the natural dyes are non-substantive and must be applied on textiles by the help of mordants, usually a metallic salt, having an affinity for both the co-loring matter and the fiber. Transition metal ions usually have strong coordi-nating power and capable of forming week to medium attraction/interaction forces and thus can act as bridging material to create substantivity of natural dyes/colorants when a textile material being impregnated with such metallic salt (i.e. mordant) is subjected to dyeing with different natural dyes, usually having some mordantable groups facilitating fixation of such colorants. These metallic mordants after combining with dye in the fiber, it forms an insoluble precipitate or lake and thus both the dye and mordant get fixed to become wash fast to a reasonable level [1].
Natural dyes are less toxic, biodegradable, and anti-allergic than synthetic dyes, and considered environmentally friendly. The global demand for natural dyes per year is 10,000 tonnes which is equal to 1% of the total world synthetic dyes consumption [2] [3]. Natural dyes are known for their use in dyeing of food substrate, leather, wood as well as natural fibers like wool, silk, cotton and flax as major areas of application since ancient times. Although this ancient art of dye-ing with natural dyes withstood the ravages of time, a rapid decline in natural dyeing continued due to the easy availability of synthetic dyes at an economical price. However, even after a century, the use of natural dyes never erodes com-pletely and they are still being used in textile industry and functional textile ap-plication. Thus, natural dyeing of different textiles and leathers has been contin-ued mainly in the decentralized sector for specialty products along with the use of synthetic dyes in the large scale sector for general textiles owing to the specific advantages and limitations of both natural dyes and synthetic dyes. The use of non-toxic and ecofriendly natural dyes on textiles has become a matter of signif-icant importance because of the increased environmental awareness in order to avoid some hazardous synthetic dyes. The production of synthetic dyes is de-pendent on petrochemical source, and some of these dyes contain carcinogenic amines [4]. The application of such dyes causes serious health hazards and in-fluences negatively the eco-balance of nature. Moreover, many countries already imposed stringent environment standards over these dyes. For instance, Ger-many has banned the Azo dyes production [5]. However, worldwide the use of
RETRACTED
Md. H.-A. Mamun et al.
DOI: 10.4236/jtst.2018.41001 3 Journal of Textile Science and Technology
natural dyes for the coloration of textiles has mainly been confined to craftsman, small scale dyers and printers as well as small scale exporters and producers dealing with high valued ecofriendly textile production and sales and production of functional textiles [6]. Natural dyes have a wide range of shades which can be obtained from various parts of plants, like roots, bark, leaves, flowers and fruits [7]. It is reported in the literature that some of the natural dyes not only dye with elegant colors, but also provide antibacterial, deodorizing, and Ultraviolet (UV) protection functions to textile substrates. It is also reported that some natural dyes not only dye with unique and elegant colors, but also provide antimicrobial, deodorizing and Ultraviolet (UV) protective functions to fabrics. At the present time, the use of natural dyes in textile application is witnessing very rapid growth. This is mainly attributed to strict environmental standards set by many countries to avoid the health hazards associated with synthetic dyes used in tex-tiles. The recent ban on the use of Azo dyes by the European Union has also in-creased the scope for the use of natural dyes. Eucalyptus is one of the most im-portant sources of natural dye that gives yellowish-brown colorants. The color-ing substance of eucalyptus has ample natural tannins and polyphenols, varying from 10% to 12%. The major coloring component of eucalyptus bark is querce-tin tin, which is also an antioxidant. It is used as a food dye with high antioxi-dant properties. Eucalyptus leaves contain up to 11% of the major component, as well as tannin (gallic acid and ellagic acid) and flavonoids (quercetin, rutin etc.) as minor substances. Tannins and flavonoids are considered to be very useful substances during the dyeing process because of their ability to fix dyes within fabrics [7].
Silk
It can be obtained from the cocoons of several types of caterpillar or silkworm, but it is the Chinese silk moth (mulberry silkworm Bombyx mori) reared in cap-tivity that is now mainly cultivated. Natural silk is one of the strongest textile fi-bres, and this can be accounted for by the stretched-out molecular form. Silk (78% protein) is much stiffer than wool in spite of both being proteins made from amino acids chains. Silk fibres have fine draping qualities and are naturally crease-resistant and bring about a warm feel to the skin. Silk emitted by the silkworm consists of two main proteins, sericin and fibroin, fibroin being the structural center of the silk, and serecin being the sticky material surrounding it. Fibroin is largely made up of the amino acids Gly-Ser-Gly-Ala-Gly-Ala and forms beta pleated sheets, β-keratin given in Figure 1 for silk fibroin composi-tion.
Hydrogen bonds form between chains, and side chains form above and below the plane of the hydrogen bond network.
Silk is one of the strongest natural fibers but loses up to 20% of its strength when wet. It has a good moisture regain of 11%. Its elasticity is moderate to poor: if elongated even a small amount, it remains stretched. It can be weakened
RETRACTED

Md. H.-A. Mamun et al.
DOI: 10.4236/jtst.2018.41001 4 Journal of Textile Science and Technology
Figure 1. Fibroin Composition.
if exposed to too much sunlight. It can be attacked by insects, especially if left dirty.
Silk is a poor conductor of electricity and thus susceptible to static cling. It is resistant to most mineral acids, except for sulfuric acid, which dissolves it. It is yellowed by perspiration
2. Experimental 2.1. Material and Equipment
1) Caustic soda(NaOH). 2) Acetic Acid (CH3COOH). 3) Aluminum Potassium Sulfate (AlK(SO4)2∙12H2O). 4) Ferrous sulfate (FeSO4∙7H2O). 5) Zinc Sulfate (ZnSO4∙7H2O). 6) Sodium Chloride (NaCl). 7) Sodium Carbonate (Na2CO3). 8) Detergents (Alconox). 9) Plain fabric 120 gsm (100% Wool). 10) Knitted fabric 120 gsm (100% silk). 11) Electric heater for heating of mixture. 12) Electric grinder for grinding of leaves. 13) Electric oven for drying. 14) Rotary evaporator for evaporation. 15) Spray drying machine for separation of solid from liquid. 16) Tester for determine the resistance to bacteria. 17) Washing fastness tester to determine resistance to washing.
2.2. Extraction of Dyes
The dye extraction was achieved by tallow solutions and 6% NaOH solution in purified water in the weight ratio of 1:20 and steaming for 1.5 hr. After that, the consequential solution was filtered to remove the residue and the dye solution. To achieve a standard standardization curve, the crude dye extract was later ground and diluted with purified water. Temperature, dyeing time, pH and dye concentration are the four different dyeing conditions were taken.
( )1 oExtraction Ratio *100 oER W W W= = −
Wo = Weight of before extraction,
RETRACTED

Md. H.-A. Mamun et al.
DOI: 10.4236/jtst.2018.41001 5 Journal of Textile Science and Technology
W1 = Weight of after extraction, ( )20 14.5 20 100 27.5%.ER = − ∗ =
2.3. Dyeing Procedures
To consider the effect of dyeing temperature, silk fabrics were dyed at four changed temperatures, i.e. 60˚C, 70˚C, 80˚C, 90˚C using diluted solution of ex-tract. The extract was diluted with water, extract to water ratio of 50:50. The liquor to goods ratio of 1:20, and pH = 4, time 60 min. The pH was maintained by using CH3COOH and pH meter. To consider the effect of dyeing time, silk fabrics were dyed in four changed time intervals (40, 50, 60, 70, min) at 90˚C temperature, using the ratio of liquor 1:25 at pH = 4. The extract to water ratio of 50:50 was used. To consider the result of dyeing liquor ratio, at four different liquor ratios silk fabric was with the tallow plant extract dye solution in dye bath as 1:15, 1:20, 1:25, 1:30, at 90˚C and pH = 4, for 60 min. To consider the influ-ence of dyeing pH, silk fabric was dyed with the tallow extract dye solution in dye bath at five different pH values of 5, 6, 7, 8, and 9 at a liquor ratio of 1:25, at 90˚C for 60 min.
2.4. Mordanting
To consider the consequence of mordanting, three altered mordanting procedures were used, i.e. pre-mordanting, simultaneous mordanting, and post-mordanting. Zinc sulfate mordants were employed. In instance of pre-mordanting method, silk fabric was impregnated in a 35 g L−1 of mordanting key at a liquid ratio of 1:20, at 60˚C for 20 min before dying. For the post-mordanting procedure, the dyed illustrations were cooled washed after dyeing with cold water, and soaped with 5 g L−1 detergent (Alconox) for 10 min at 70˚C at liquor ratio of 1:20, and finally bathed with cold water and dried in oven.
2.5. Fastness Testing
Light fastness was tested according to ISO 105-B02: 1994. Rubbing fastness was tested according to AATCC test Method 8-2005. Wash fatness was carried out according to ISO 105 C06. The samples were washed at standard solution at 60˚C for 30 min and dried at 60˚C to check the wash fastness [5].
2.5.1. Ultraviolet Protection Test (UPF) The fabric samples were then conditioned and tested for their UPF on Spec-tronic Camspec M550 double beam scanning spectrophotometer with integrated sphere according to AATCC 183 standard testing method. The spectropho-tometer was known to have photometric range of 0% - 200% transmittance and photometric accuracy greater than 0.5% at 0.5A, 1A and 2A. This test method allows determining the UPF of a fabric by taking the ratio of irradiance (at a de-tector) of erythmally weighted UV without a specimen and with specimen. Moreover, it determines the percent bloking in UV-A and UV-B region using Equations ((1) and (2)).
RETRACTED

Md. H.-A. Mamun et al.
DOI: 10.4236/jtst.2018.41001 6 Journal of Textile Science and Technology
2.5.2. Antimicrobial Testing 1) Bacterial Strains The antibacterial activity of silk fabrics dyed with natural colorant from cam-
phor plant leaves was investigated using AATCC 100-2004 test method. The evaluation was carried out with Staphylococcus aureus a Gram-positive bacte-rium, Escherichia coli a Gram negative bacterium, and Candida albicans a gram positive fungus. These three organisms are reference strains used for antimi-crobial susceptibility testing. The reference strains were cultured on nutrient agar (Wuhan, Hubei, China) and incubated aerobically at 37˚C overnight.
2) Percentage Reduction Test (AATCC 100-2004) The bacterial suspension of a known concentration and the specimens of the
test material were shaken, and the reduction in bacterial activity in standard test time (18 hours) was measured. The efficiency of the antimicrobial treatment was measured by calculating the reduction in bacterial concentration of the treated sample with that of control sample expressed as a percentage reduction in stan-dard test time.
( )% Reduction 100A B A= − × (3)
where A and B are the surviving bacterial cells (CFU/ml) for the flasks contain-ing the control (blank silk fabric) and test samples (natural dye treated silk fa-bric), respectively.
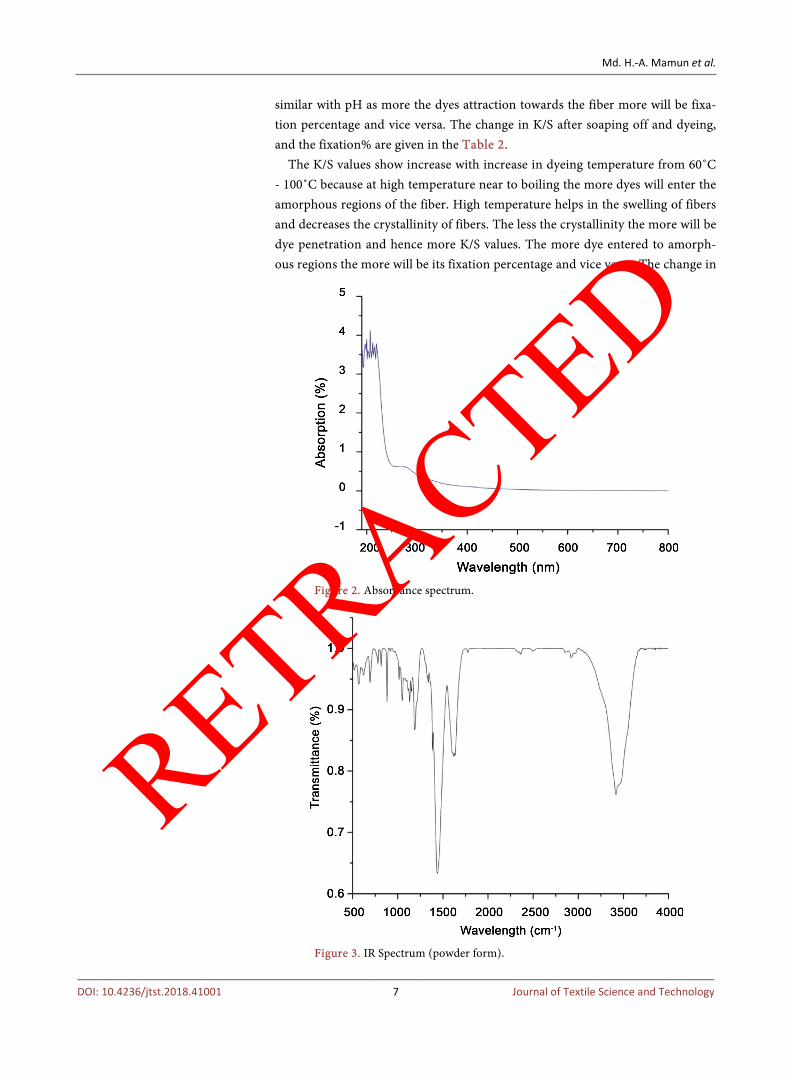
3. Results and Discussion 3.1. Tallow Extracts Analysis: Absorbance Spectrum
UV radiations depends on the absorb ability of plant. The absorption percentage is maximum at wavelength of 200 - 220 nm and goes down to 0 as the wavelength increases. Given below the spectrum of wavelength vs absorption in Figure 2.
3.2. FTIR Analysis
The IR spectrum of tallow plant leaf extract is shown in Figure 3. The possible functional groups present in tallow leaf extract are presented in Table 1.
3.3. Silk Testing 3.3.1. Silk Fabric K/S and Fixation Values The K/S values show significant increase with decrease in pH values. Fixation% age is minimum at neutral pH and increases as the pH goes down neutral. The fibers having amide or amine groups will be dyed in deep shades at pH values below neutral and will give more K/S values. The case for fixation percentage is
RETRACTED
Md. H.-A. Mamun et al.
DOI: 10.4236/jtst.2018.41001 7 Journal of Textile Science and Technology
similar with pH as more the dyes attraction towards the fiber more will be fixa-tion percentage and vice versa. The change in K/S after soaping off and dyeing, and the fixation% are given in the Table 2.
The K/S values show increase with increase in dyeing temperature from 60˚C - 100˚C because at high temperature near to boiling the more dyes will enter the amorphous regions of the fiber. High temperature helps in the swelling of fibers and decreases the crystallinity of fibers. The less the crystallinity the more will be dye penetration and hence more K/S values. The more dye entered to amorph-ous regions the more will be its fixation percentage and vice versa. The change in
Figure 2. Absorbance spectrum.
Figure 3. IR Spectrum (powder form).
RETRACTED

Md. H.-A. Mamun et al.
DOI: 10.4236/jtst.2018.41001 8 Journal of Textile Science and Technology
Table 1. Possible purposeful groups present in the tallow extract.
Region (cm−1) Group Possible Compounds Present (or Absent)
3700 - 3100
-OH Alcohol, aldehyde, carboxylic acids
-NH Amides, amines
≡C-H Alkynes
3100 - 3000 =C-H Aromatic compounds
-CH2 or –CH=CH- Alkenes or unsaturated rings
3000 - 2800 -CH, -CH2-, -CH3 Aliphatic groups
-SH Mercaptans and thiols
-PH Phosphine
2400 - 2000
-C≡N Nitriles
-N=N+=N- Azides
-C≡C- Alkynes
1870 - 1650 C=O Acid halides, aldehydes, amides, amino acids, anhydrides, carboxylic acids, esters, ketones,
1650 - 1550 C=C, C=N, NH Unsaturated
1550 - 1300 NO2 Nitro compound
CH3 and CH2 Alkanes, alkenes, etc
1300 - 1000 C-O-C and C-OH Ethers, alcohols, sugars
S=O, P=O, C-F Sulphur, phosphorus, and fluorine compounds
1100 - 800 Si-O and P-O Organosilicon and phosphorus compounds
1000 - 650 =C-H Alkenes and aromatic compounds
-NH Aliphatic amines
800 - 400 C-halogen Halogen compounds
Aromatic rings Aromatic compounds
Table 2. Effect of pH on K/S and Fixation% age.
Dyeing pH K/S after Washing K/S after Dyeing Fixation% age
pH = 8 0.9496 0.98 95.89796
pH = 7 1.6229 1.78 91.17416
pH = 6 3.1961 3.34 96.68563
pH = 5 3.3551 3.81 98.55906
pH = 4 3.6269 3.75 97.28997
pH = 3 3.6579 3.68 99.15325
K/S after soaping off and dyeing, and the fixation% are given in the Table 3.
The K/S values increases with increase in liquor to goods ratio. The concen-tration of the solution remains constant for each set of dyeing. The color strength is directly proportional to the increase in liquor ratio up to certain limit. Fixation percentage also increases with liquor ratio. The change in K/S after
RETRACTED

Md. H.-A. Mamun et al.
DOI: 10.4236/jtst.2018.41001 9 Journal of Textile Science and Technology
soaping off and dyeing, and the fixation% are given in the Table 4. The K/S values show increase with increase in dyeing time because when
more time is available for dyes to enter the fiber amorphous regions the more will be the K/S value. The contact time have direct relationship in case of dyeing with camphor tree leaf extract. The fixation percentage also increases with in-crease in dyeing time. The change in K/S after soaping off and dyeing, and the fixation% are given in the Table 5.
The mordanting technique is very good to get deeper shades and different hues. Each mordant will give different hue with different shade depth. FeSO4. 7H2O mordant used in this research work gives the highest K/S value for the natural dye extracted from camphor plant leaves. The hues given by each mor-dant is also different. The FeSO4∙7H2O mordant gives browner shades, AlK(SO4)2∙12H2O gives greener shades, and ZnSO4∙7H2O gives redder shades.
Table 3. Effect of Dyeing Temperature on K/S and Fixation% age.
Dyeing Temperature (C) K/S after Washing K/S after Dyeing Fixation% age
50 1.15 1.41 86.56738
60 1.2206 1.81 91.22652
70 2.512 2.35 99.10053
80 3.173 2.98 96.75909
90 3.987 3.81 97.74086
100 3.942 3.87 99.07889
Table 4. Effect of liquor to goods ratio on K/S and Fixation% age.
Dyeing L:R K/S after Washing K/S after Dyeing Fixation% age
1:10 1.2976 1.40 92.68571649
1:15 1.6495 1.81 91.13259737
1:20 1.9762 2.08 95.00961464
1:25 2.8099 2.91 96.56013902
1:30 3.3908 3.48 97.43678159
1:35 4.1040 4.18 98.18182037
Table 5. Effect of Dyeing time on K/S and Fixation% age.
Dyeing Time (min) K/S after Washing K/S after Dyeing Fixation% age
30 4.1135 4.30 95.66279345
40 4.2845 4.45 96.28090162
50 5.2163 5.35 97.50093478
60 5.1344 5.23 98.17208204
70 5.5076 5.65 97.47964302
80 5.5622 5.78 96.23183511
RETRACTED

Md. H.-A. Mamun et al.
DOI: 10.4236/jtst.2018.41001 10 Journal of Textile Science and Technology
Table 6. Effect of Mordanting on K/S and Fixation% age.
Mordanting Type of mordant K/S after Washing K/S after Dyeing Fixation% age
Pre-M AlK(SO4)2∙12H2O 4.0554 4.15 97.72047939
Pre-M ZnSO4∙7H2O 3.7984 3.95 96.16202342
Pre-M FeSO4∙7H2O 4.3753 4.41 99.21315035
Meta-M AlK(SO4)2∙12H2O 4.2394 4.31 98.36194687
Meta-M ZnSO4∙7H2O 5.3919 5.45 98.9339461
Meta-M FeSO4∙7H2O 5.3919 5.48 98.39233691
Post-M AlK(SO4)2∙12H2O 1.8703 1.91 97.92146882
Post-M ZnSO4∙7H2O 1.8759 1.95 96.20000155
Post-M FeSO4∙7H2O 2.5146 2.61 96.34482906
The change in K/S after soaping off and dyeing, and the fixation% are given in the Table 6.
Meta-mordanting or simultaneous mordanting method was found to give deeper and darker shades. The post-mordanting gives very light golden colors while pre-mordanting gives deeper shades than post-mordanting.
3.3.2. Silk Fabric CIE L* a* b* and C* H* Values The lightness L* values decreases with decrease in pH, as K/S increases the L* decreases and vice versa. When a* is towards extreme minimum it shows green tone and when towards extreme maximum shows red tone. The a* values are towards positive side shows that samples are in redder side. As pH decreases the sample goes from redder to redder. When b* is towards extreme minimum it shows blue tone and when towards extreme maximum is shows yellow tone. The b* value shows that the dyed samples are towards yellow side. The Chroma C* and Hue H* values show that the color falls in the range of red green. The CIE measurement values are given in Table 7.
The lightness L* values decreases with increase in dyeing time, as K/S increas-es the L* decreases and vice versa. When a* is towards extreme minimum it shows green tone and when towards extreme maximum shows red tone. The a* values are towards positive side shows that samples are in redder side. As pH decreases the sample goes from redder to redder. When b* is towards extreme minimum it shows blue tone and when towards extreme maximum is shows yellow tone. The b* value shows that the dyed samples are towards yellow side. The Chroma C* and Hue H* values show that the color falls in the range of red green. The CIE measurement values are given in Table 8.
The lightness L* values decreases with decrease in pH, as K/S increases the L* decreases and vice versa. When a* is towards extreme minimum it shows green tone and when towards extreme maximum shows red tone. The a* values are towards positive side shows that samples are in redder side. As pH decreases the sample goes from redder to redder. When b* is towards extreme minimum it shows blue tone and when towards extreme maximum is shows yellow tone. The
RETRACTED

Md. H.-A. Mamun et al.
DOI: 10.4236/jtst.2018.41001 11 Journal of Textile Science and Technology
Table 7. Effect of Dyeing pH on CIE L* a* b* and C* H*.
Dyeing pH CIE L* CIE a* CIE b* CIE C* CIE H*
pH = 8 75.83 1.78 17.84 17.93 84.30
pH = 7 69.31 2.44 19.55 19.70 82.90
pH = 6 58.85 5.93 21.02 21.84 74.24
pH = 5 55.78 7.46 19.29 20.68 68.86
pH = 4 56.28 7.94 19.51 21.07 67.86
pH = 3 59.46 7.00 17.89 19.21 68.63
Table 8. Effect of Dyeing Temperature on CIE L* a* b* and C* H*.
Dyeing Temperature(C) CIE L* CIE a* CIE b* CIE C* CIE H*
50 74.89 1.29 18.10 18.01 89.86
60 73.02 1.35 18.59 18.64 85.84
70 69.14 4.20 21.14 21.55 78.77
80 67.33 4.71 21.40 21.91 77.60
90 65.94 4.55 22.03 22.49 78.34
100 61.24 4.92 22.34 22.88 77.57
Table 9. Effect of liquor to goods ratio on CIE L* a* b* and C* H*.
Dyeing L:R CIE L* CIE a* CIE b* CIE C* CIE H*
1:10 70.73 2.76 18.21 18.42 81.39
1:15 68.81 2.07 19.62 19.73 83.98
1:20 66.90 1.96 20.50 20.59 84.54
1:25 60.83 5.69 21.29 22.04 75.05
1:30 58.38 5.87 21.92 22.69 75.00
1:35 56.33 6.06 22.84 23.63 75.14
b* value shows that the dyed samples are towards yellow side. The Chroma C* and Hue H* values show that the color falls in the range of red green. The CIE measurement values are given in Table 9.
The lightness L* values decreases with decrease in pH, as K/S increases the L* decreases and vice versa. When a* is towards extreme minimum it shows green tone and when towards extreme maximum shows red tone. The a* values are towards positive side shows that samples are in redder side. As pH decreases the sample goes from redder to redder. When b* is towards extreme minimum it shows blue tone and when towards extreme maximum is shows yellow tone. The b* value shows that the dyed samples are towards yellow side. The Chroma C* and Hue H* values show that the color falls in the range of red green. The CIE measurement values are given in Table 10.
Different mordanting technique shows different L* a* b* C* H* values. The
RETRACTED

Md. H.-A. Mamun et al.
DOI: 10.4236/jtst.2018.41001 12 Journal of Textile Science and Technology
Table 10. Effect of Dyeing Time on CIE L* a* b* and C* H*.
Dyeing Time (min) CIE L* CIE a* CIE b* CIE C* CIE H*
30 55.97 6.48 20.80 21.78 72.70
40 56.20 6.66 22.03 23.02 73.18
50 53.63 6.91 22.65 23.69 73.03
60 54.23 6.92 23.12 24.13 73.33
70 52.36 7.27 22.26 23.42 71.90
80 53.00 7.13 23.16 24.23 72.89
Table 11. Effect of Mordanting Technique on CIE L* a* b* and C* H*.
Mordanting Type of mordant CIE L* CIE a* CIE b* CIE C* CIE H*
Pre-M AlK(SO4)2∙12H2O 55.56 7.56 20.71 22.04 69.95
Pre-M ZnSO4∙7H2O 56.25 6.34 20.45 21.41 72.78
Pre-M FeSO4∙7H2O 51.02 3.93 16.11 16.58 76.28
Meta-M AlK(SO4)2∙12H2O 57.27 6.18 22.68 23.50 74.76
Meta-M ZnSO4∙7H2O 51.92 6.69 22.77 23.73 73.61
Meta-M FeSO4∙7H2O 51.31 6.58 22.09 23.05 73.41
Post-M AlK(SO4)2∙12H2O 67.14 2.96 19.38 19.61 81.32
Post-M ZnSO4∙7H2O 66.02 2.36 18.97 19.11 82.92
Post-M FeSO4∙7H2O 62.83 2.38 19.65 19.80 83.10
FeSO4.7H2O mordant shows the maximum values for H*. AlK(SO4)2∙12H2O shows the light shade. The CIE measurement values are given in Table 11.
3.3.3. Silk UPF Test Results 1) Effect of dyeing time From the results obtained it was found that fabric samples treated with cam-
phor plant leaf extracts show excellent UV-blocking capabilities. Even at very low-application time, the treated fabrics showed tremendous UV-blocking properties. The UPF at dyeing time DT = 20 is considerably poor but as the dyeing time increases the UPF increase tremendously giving its maximum value at DT = 60. The UV blocking properties of extracts could be attributed to pres-ence of flavonoids and phenolic contents in it. Both these groups of compounds have been found to shield the plant tissues from damaging UV radiation during their growth. This is because of strong absorbance of UV radiations (particularly UVB radiations) by these compounds. The undyed samples show very little re-sistance to UVR in the range of UVA and UVB. The UVB resistance of undyed sample is satisfactory but the resistance to UVA is very low. The dyed samples shows tremendous increase in blocking UVA to excellent extent and UVB is im-proved from satisfactory to excellent. The UPF, UVA, and UVB values are given in Table 12.
RETRACTED

Md. H.-A. Mamun et al.
DOI: 10.4236/jtst.2018.41001 13 Journal of Textile Science and Technology
Table 12. Ultraviolet protection results of silk.
Sample No. of tests UPF UVA% age UVB% age
Standard silk 1 14.36 13.64 4.15
2 14.32 13.67 4.15
DT = 20
1 21.35 2.16 1.35
2 22.29 2.33 1.46
3 23.37 2.47 1.56
DT = 30
1 64.07 1.33 0.81
2 52.64 1.4 0.88
3 52.91 1.45 0.94
DT = 40
1 71.32 9.7 3.2
2 72.23 7.69 2.72
3 68.41 6.51 2.45
DT = 50
1 86.66 1.22 0.66
2 78.92 1.24 0.71
3 80.45 1.27 0.76
DT = 60
1 148.67 1.23 0.6
2 167.94 1.19 0.59
3 161.77 1.16 0.58
DT = 70
1 145.67 1.21 0.55
2 162.94 1.2 0.59
3 163.77 1.11 0.48
2) Effect of liquor ratio Although the UPF at liquor ratio of 1:10, and 1:15 was observed to be mod-
erate but as the liquor ratio is increased from 1:15 to 1:20 and so on, The UPF results are much higher than that provided by commonly used synthetic UV protective agents. So, Camphor plant leaf extracts may be used to get excellent UV protection from fabrics. The undyed samples show very little resistance to UVR in the range of UVA and UVB. The UVB resistance of undyed sample is satisfactory but the resistance to UVA is very low. The dyed samples shows tre-mendous increase in blocking UVA to excellent extent and UVB is improved from satisfactory to excellent. The UPF, UVA, and UVB are given in Table 13.
3.3.4. Antimicrobial Test Results for Silk Fabric Table 14 shows that increase in the dye liquor causes increase in the ability of the fabric to inhibit bacteria. Escherichia coli, Staphylococcus aureus, and Can-dida albicans are successfully reduced by camphor tree leaf extract dyes. The undyed sample can easily be decomposed by these bacteria in very short time. The dyed samples show tremendous performance against these bacteria. In the test against E. coli, S. aureus, and C albicans in AATCC bacteriostasis broth,
RETRACTED

Md. H.-A. Mamun et al.
DOI: 10.4236/jtst.2018.41001 14 Journal of Textile Science and Technology
Table 13. UPF values for change in liquor ratio.
Sample No. of tests UPF UVA% age UVB% age
Standard 1 14.36 13.64 4.15
2 14.32 13.67 4.15
L:R 1:10
1 29.26 2.57 1.61
2 27.51 2.67 1.66
3 28.45 2.75 1.71
L:R 1:15
1 30.58 1.64 1.05
2 28.95 1.81 1.14
3 28.7 1.96 1.22
L:R 1:20
1 82.46 1.46 0.95
2 79.56 1.47 0.96
3 81.27 1.47 0.97
L:R 1:25
1 123.31 1.51 0.58
2 108.2 1.55 0.64
3 94.33 1.66 0.69
L:R 1:30
1 161.7 1.47 0.65
2 138.2 1.37 0.64
3 194.45 1.27 0.61
L:R 1:35
1 159.7 1.42 0.62
2 139.2 1.27 0.63
3 185.45 1.24 0.59
Table 14. Antimicrobial test results.
Sample Dyeing conditions Escherichia coli Staphylococcus aureus Candida albicans
Standard Undyed 11.2 12.6 8.80
1 L:R 1:10 78.9 75.7 67.83
2 L:R 1:15 70.5 69.7 74.50
3 L:R 1:20 78.8 76 78.65
4 L:R 1:25 80.7 82.9 81.83
5 L:R 1:30 90.6 92.3 85.65
6 L:R 1:35 93.7 91.4 87.34
7 L:R 1:40 94 91 89.87
8 L:R 1:45 93.2 94.5 94.01
9 L:R 1:50 92.5 95 96.15
10 L:R 1:55 92.3 95.4 95.89
11 L:R 1:60 93 94.6 94.43
RETRACTED

Md. H.-A. Mamun et al.
DOI: 10.4236/jtst.2018.41001 15 Journal of Textile Science and Technology
inoculated control and inoculated test fabric was evaluated for percentage bac-terial reduction by cell counting.. The reduction percentage for E. coli, S. aureus, and C. albicans correspond to the bacterial numbers on the respective control test of per milliliter. The reduction percentage for undyed silk sample was found to be 11.2% for S. aureus, 12.6% for E. coli and 8.80% for C. albicans. The in-crease in liquor ratio gives more reduction in bacteria. The maximum value of reduction percentages for E. coli, S. aureus, C. albicans are 93.7% at L:R 1:35, 95.4% at L:R 1:55 and 96.15% at L:R 1:50 respectively as shown in Table 2. It was attributed by some researchers that bacterial inhibition is due to the slow release of active substances from the fabric surface. The fabric dyed with camphor plant leaf extract shows excellent reduction in bacteria may be attributed to the pres-ence of cineol, linalool, eugenol, limonene, safrole, α-pinene, β-pinene, β-myre- cene, α-humulene, p-cymene, nerolidol, borneol, and camphene found in its leaves. The antibacterial reduction percentage for bacteria is given in the Table 14.
3.3.5. Colorfastness Tests Results The colorfastness values are given in the Table 15. For change in pH, the wash fastness is excellent, light fastness is fair to good for 6 hours testing, wet rubbing fastness is good to excellent, and dry rubbing fastness is excellent. The overall color fastness is found to be very good.
For change in temperature, the wash fastness is excellent, light fastness is fair to good for 6 hours testing, wet rubbing fastness is good to excellent, and dry rubbing fastness is excellent. The overall color fastness is found to be very good. Table 16 shows The Effect of Dyeing Time on Colorfastness values.
Table 15. Effect of pH on colorfastness of silk fabric.
Dyeing pH Wash Fastness Light fastness Wet Rubbing fastness Dry Rubbing fastness
pH = 8 3-4 3-4 3 4-5
pH = 7 4-5 4-5 4 4-5
pH = 6 4-5 5 4-5 4-5
pH = 5 4-5 5 4-5 4-5
pH = 4 4-5 5 4-5 4-5
pH = 3 4-5 5 4-5 4-5
Table 16. Effect of dyeing temperature on colorfastness.
Dyeing Temperature (C) Wash
fastness Light
fastness Wet Rubbing
fastness Dry Rubbing
fastness
60 3 - 4 3 3 3 - 4
70 3 - 4 3 3 - 4 4 - 5
80 4 - 5 3 3 - 4 4 - 5
90 4 - 5 3 - 4 4 - 5 4 - 5
100 4 - 5 4 - 5 4 - 5 4 - 5
RETRACTED

Md. H.-A. Mamun et al.
DOI: 10.4236/jtst.2018.41001 16 Journal of Textile Science and Technology
For change in liquor ratio, the wash fastness is excellent, light fastness is fair to good for 6 hours testing, wet rubbing fastness is good to excellent, and dry rub-bing fastness is excellent. The overall color fastness is found to be very good. Ta-ble 17 shows The Effect of Dye liquor ratio on Colorfastness values.
For change in dyeing time, the wash fastness is excellent, light fastness is fair to good for 6 hours testing, wet rubbing fastness is good to excellent, and dry rubbing fastness is excellent. The overall color fastness is found to be very good. Table 18 shows The Effect of Dyeing time on colorfastness values.
For change in mordanting, the wash fastness is excellent, light fastness is fair to good for 6 hours testing, wet rubbing fastness is good to excellent, and dry rubbing fastness is excellent. The overall color fastness is found to be very good. Iron sulfate shows lowest results for color fastness. Table 19 shows The Effect of
Table 17. Effect of dyeing liquor ratio on colorfastness.
Dyeing L:R Wash fastness Light fastness Wet Rubbing fastness Dry Rubbing fastness
1:10 3 - 4 3 3 - 4 4 - 5
1:15 4 - 5 3 3 - 4 4 - 5
1:20 4 - 5 3 - 4 3 - 4 4 - 5
1:25 4 - 5 3 - 4 4 - 5 4 - 5
1:30 4 - 5 3 - 4 4 - 5 4 - 5
1:35 4 - 5 4 - 5 4 - 5 4 - 5
Table 18. Effect of dyeing time on colorfastness.
Dyeing Time (min) Wash fastness Light fastness Wet Rubbing fastness Dry Rubbing fastness
30 3 - 4 3 3 - 4 4 - 5
45 3 - 4 3 - 4 3 - 4 4 - 5
60 4 - 5 3 - 4 4 - 5 4 - 5
75 4 - 5 3 - 4 4 - 5 4 - 5
90 4 - 5 4 - 5 4 - 5 4 - 5
105 4 - 5 4 - 5 4 - 5 4 - 5
Table 19. Effect of mordanting on colorfastness.
Mordanting Type of mordant
Wash fastness
Light fastness
Wet Rubbing fastness
Dry Rubbing fastness
Pre-M AlK(SO4)2∙12H2O 4 - 5 3 - 4 4 4 - 5
Pre-M ZnSO4∙7H2O 4 - 5 4 - 5 4 4 - 5
Pre-M FeSO4∙7H2O 4 3 - 4 3 - 4 4
Meta-M AlK(SO4)2∙12H2O 4 - 5 3 - 4 4 4 - 5
Meta-M ZnSO4∙7H2O 4 - 5 4 - 5 4 4 - 5
Meta-M FeSO4∙7H2O 4 3 - 4 3 - 4 4
Post-M AlK(SO4)2∙12H2O 4 - 5 3 - 4 4 4 - 5
Post-M ZnSO4∙7H2O 4 - 5 3 - 4 4 4 - 5
Post-M FeSO4∙7H2O 4 3 - 4 3 - 4 4
RETRACTED

Md. H.-A. Mamun et al.
DOI: 10.4236/jtst.2018.41001 17 Journal of Textile Science and Technology
Mordanting on Colorfastness values.
3.3.6. Scanning Electron Microscopy Analysis of Dyed Silk The scanning electron microscope SEM shows that undyed silk fibre shows very little amount of impurities attached to it. The dyed silk fabric using different mordanting technique shows different behavior. White particles attached to the silk fiber definitely come from the dyeing liquor. These particles are expected to contribute to ultraviolet protection and antimicrobial performance of the fabric.
4. Conclusion
Tallow tree dry leaves extract dyed silk fabric displayed worthy to exceptional color fastness to crocking and reasonable to virtuous light fastness. However, the overall wash fastness was rated good. UV-blocking properties of silk fabrics treated with extracts from the tallow plant were considered in this work. Extracts showed excellent UVA and UVB blocking when applied on silk fabrics. The complexity of dye molecules hinders intimate understanding of the binding mechanism between dye and substrate or the precise role of the mordant in fix-ing the dye. Hence there is ongoing research in this area in terms of determining the optimum amount of mordant required and developing a theory that explains the precise role of the mordant. Finally, it is clear that this dyestuff can be used in exchange of reactive dyes.
References [1] Samanta, A.K. and Konar, A. (2011) Dyeing of Textiles with Natural Dyes, Natural
Dyes. In: Kumbasar, E.A., Ed.
[2] Punrattanasin, N., et al. (2013) Silk Fabric Dyeing with Natural Dye from Mangrove Bark (Rhizophora apiculata Blume) Extract. Industrial Crops and Products, 49, 122-129. https://doi.org/10.1016/j.indcrop.2013.04.041
[3] Mongkholrattanasit, R., Krystafek, J. and Wiener, J. (2010) Dyeing and Fastness Properties of Natural Dye Extracted from Eucalyptus Leaves Using Padding Tech-niques. Fibers and Polymers, 11, 346-350. https://doi.org/10.1007/s12221-010-0346-8
[4] Hunger, K. (2003) Industrial Dyes. Chemistry, Properties, Application.
[5] Almahy, H.A., Ali, M.A. and Band Ali, A.A. (2013) Extraction of Carotenoids as Natural Dyes from the Daucus carota Linn (Carrot) Using Ultrasound in Kingdom of Saudi Arabia. Research Journal of Chemical Sciences, 3, 63-66.
[6] Samantaa, A.K. and Agarwal, P. (2009) Application of Natural Dyes on Textiles. In-dian Journal of Fibre & Textile Research, 34, 384-399.
[7] Mongkholrattanasit, R., et al. (2011) Natural Dye from Eucalyptus Leaves and Ap-plication for Wool Fabric Dyeing by Using Padding Techniques. Intech Natural Dyes, 124. https://doi.org/10.5772/20738
RETRACTED