standardization requirements for clinical trialsc.ymcdn.com/sites/ requirements for clinical trials...
TRANSCRIPT

Standardization
Requirements
for
Clinical Trials
Virginia Litwin, Ph.D.
Principal Scientist, Hematology
Covance Central Laboratory Services
Founder and Co-Chair , AAPS Flow Cytometry Action Program Committee

Presentation Overview
2
Challenges of Using Flow Cytometry in Global Clinical Trials
Reducing Sources of Variability
Monitoring

Challenges of Using Flow Cytometry in Global
Clinical Trials
Limited Specimen Stability
Requires Regional Sample Processing
Advanced, High-complexity Technology
Requires Highly Skilled Staff
Global Standardization
Lead Time for Assay Development and Validation
3
4
Reducing Sources
of
Variability
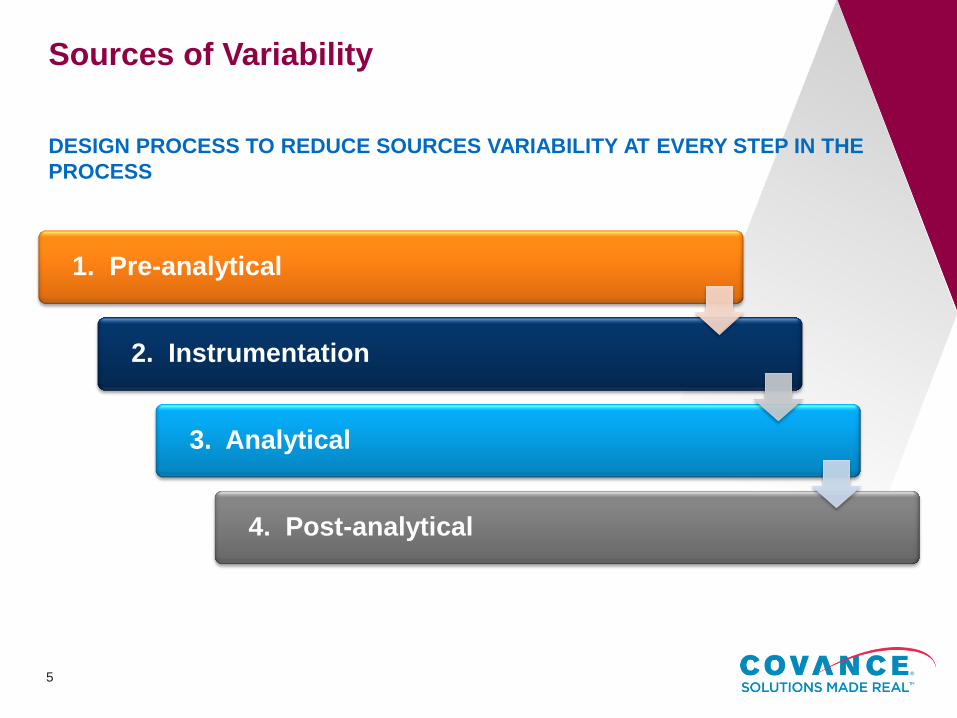
Sources of Variability
1. Pre-analytical
2. Instrumentation
3. Analytical
4. Post-analytical
DESIGN PROCESS TO REDUCE SOURCES VARIABILITY AT EVERY STEP IN THE
PROCESS
5
Take Home Message
6
Sweat the Small Stuff
• Its all small stuff
• The devil is truly in the details

Pre-Analytical
7
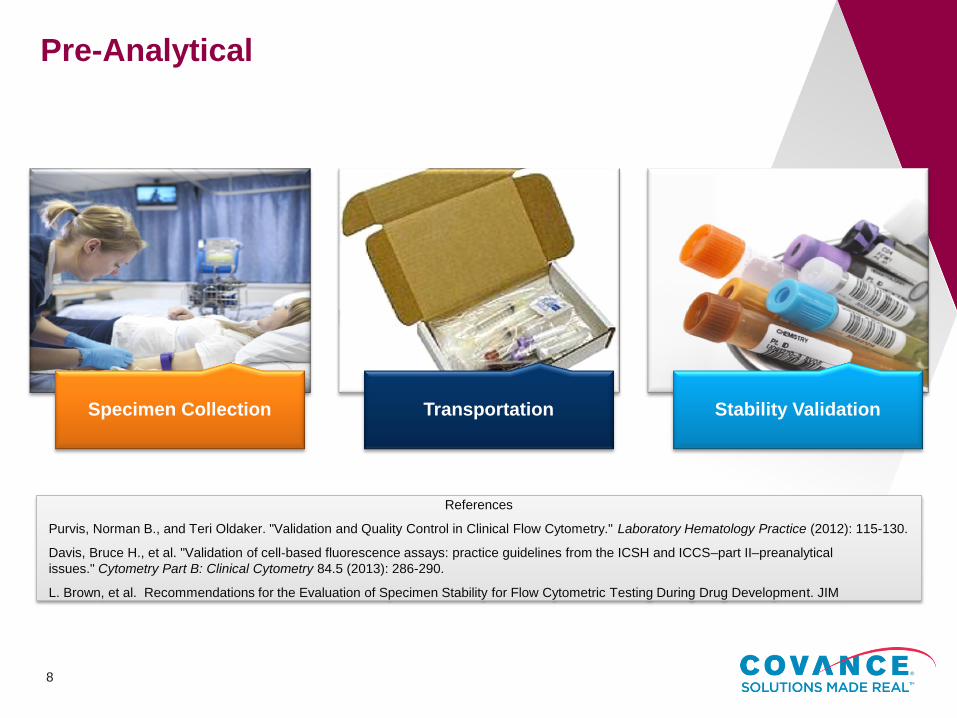
Pre-Analytical
8
Specimen Collection Transportation Stability Validation
References
Purvis, Norman B., and Teri Oldaker. "Validation and Quality Control in Clinical Flow Cytometry." Laboratory Hematology Practice (2012): 115-130.
Davis, Bruce H., et al. "Validation of cell‐based fluorescence assays: practice guidelines from the ICSH and ICCS–part II–preanalytical
issues." Cytometry Part B: Clinical Cytometry 84.5 (2013): 286-290.
L. Brown, et al. Recommendations for the Evaluation of Specimen Stability for Flow Cytometric Testing During Drug Development. JIM
Instrumentation
9
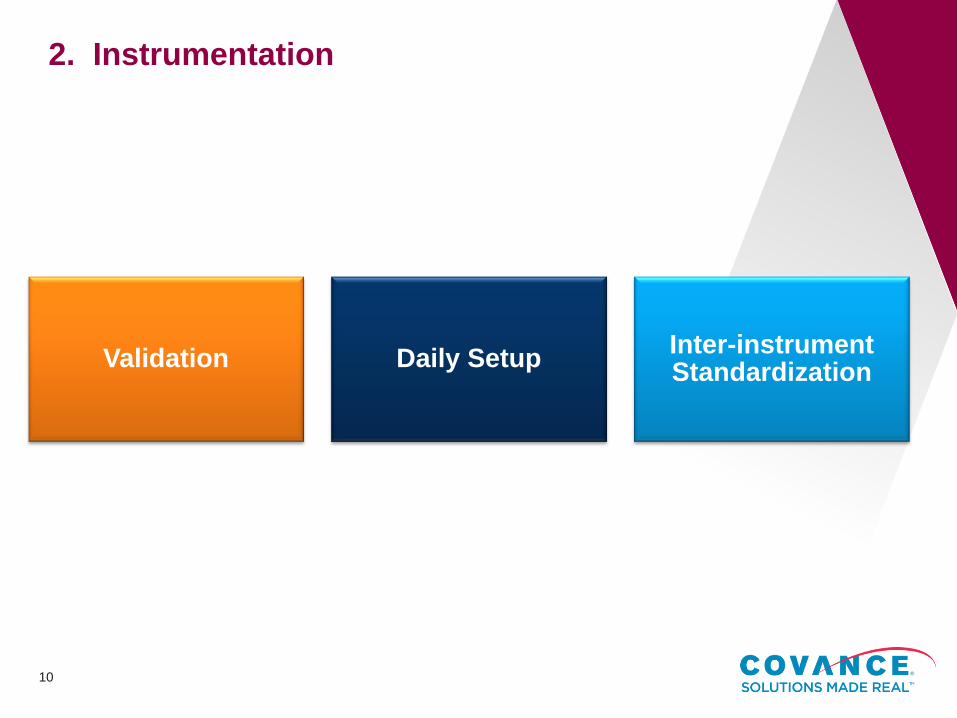
2. Instrumentation
10
Validation Daily Setup Inter-instrument Standardization
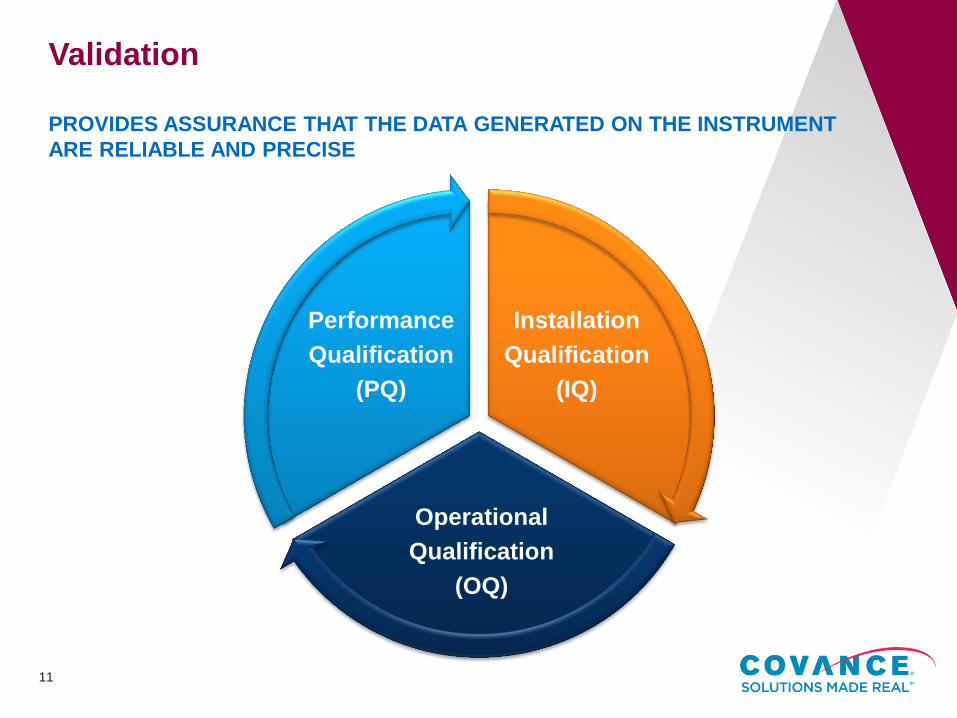
Validation
Installation
Qualification
(IQ)
Operational
Qualification
(OQ)
Performance
Qualification
(PQ)
PROVIDES ASSURANCE THAT THE DATA GENERATED ON THE INSTRUMENT
ARE RELIABLE AND PRECISE
11
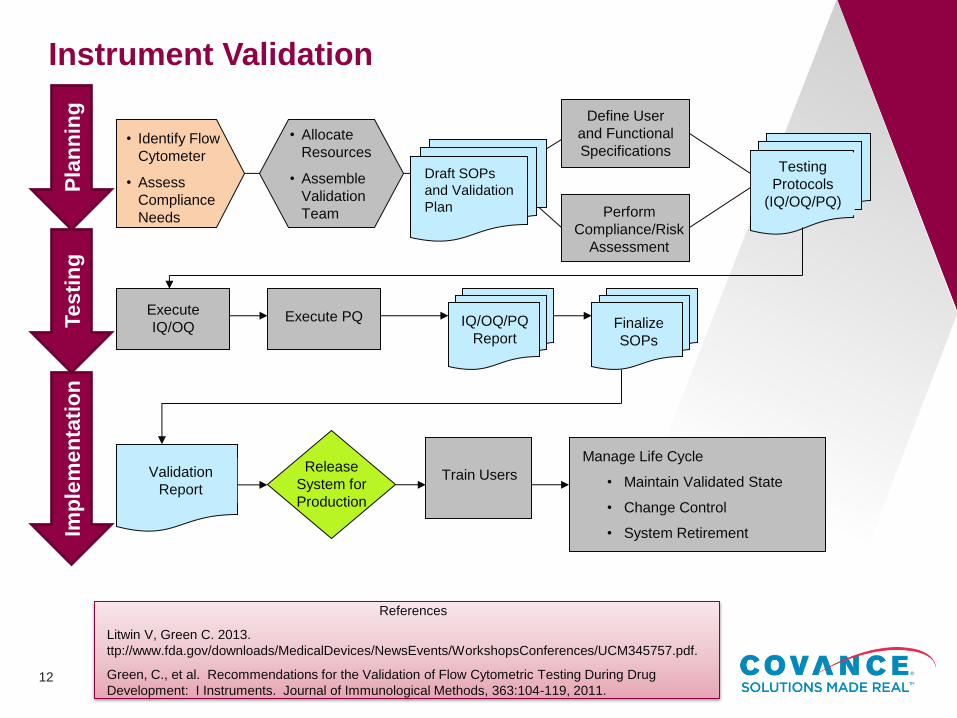
• Identify Flow
Cytometer
• Assess
Compliance
Needs
• Allocate
Resources
• Assemble
Validation
Team
Testing
Protocols
(IQ/OQ/PQ)
Execute
IQ/OQ Execute PQ
Finalize
SOPs
Validation
Report Train Users
Manage Life Cycle
• Maintain Validated State
• Change Control
• System Retirement
Perform
Compliance/Risk
Assessment
Define User
and Functional
Specifications
IQ/OQ/PQ
Report
Release
System for
Production
Draft SOPs
and Validation
Plan
Pla
nn
ing
Tes
tin
g
Imp
lem
en
tati
on
Instrument Validation
12
References
Litwin V, Green C. 2013.
ttp://www.fda.gov/downloads/MedicalDevices/NewsEvents/WorkshopsConferences/UCM345757.pdf.
Green, C., et al. Recommendations for the Validation of Flow Cytometric Testing During Drug
Development: I Instruments. Journal of Immunological Methods, 363:104-119, 2011.

Installation and Operational Qualification (IQ/OQ)
Instrument Vendor
• Provides instrument hardware and associated software manuals
• IQ/OQ packages
Validation Team
• Oversees the process
• Ensures the proper documentation to meet regulatory requirements
13
TO DEMONSTRATE THE INSTRUMENT AND THE ASSOCIATED SOFTWARE ARE
INSTALLED AND FUNCTIONING PER MANUFACTURER’S SPECIFICATION AND
USER’S REQUIREMENT

Testing Components of IQ and OQ
Typical IQ Parameters Include:
• Environment (e.g., space requirements)
• Utilities (temperature and electrical requirements, hardware and software)
Typical OQ Parameters Include:
• Software functionality
• Optical Precision
• Automated sample acquisition
• System alerts
TESTING CAN BE PERFORMED BY VENDOR, QUALIFIED INTERNAL STAFF, OR
CONTRACTED EXTERNAL CONSULTANTS
14
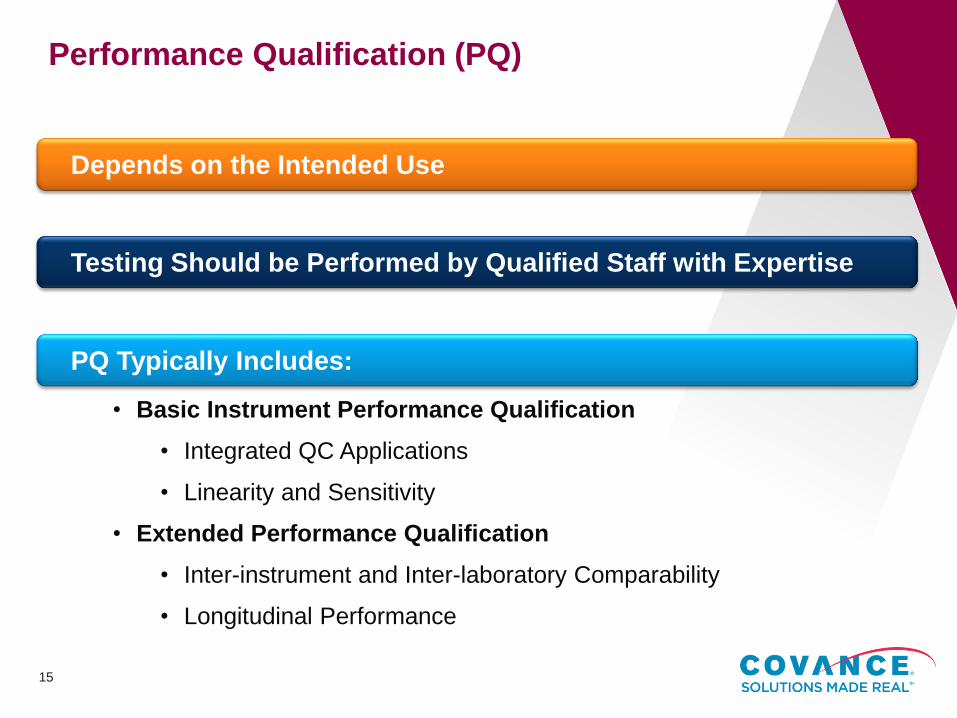
Performance Qualification (PQ)
Depends on the Intended Use
Testing Should be Performed by Qualified Staff with Expertise
PQ Typically Includes:
• Basic Instrument Performance Qualification
• Integrated QC Applications
• Linearity and Sensitivity
• Extended Performance Qualification
• Inter-instrument and Inter-laboratory Comparability
• Longitudinal Performance
15
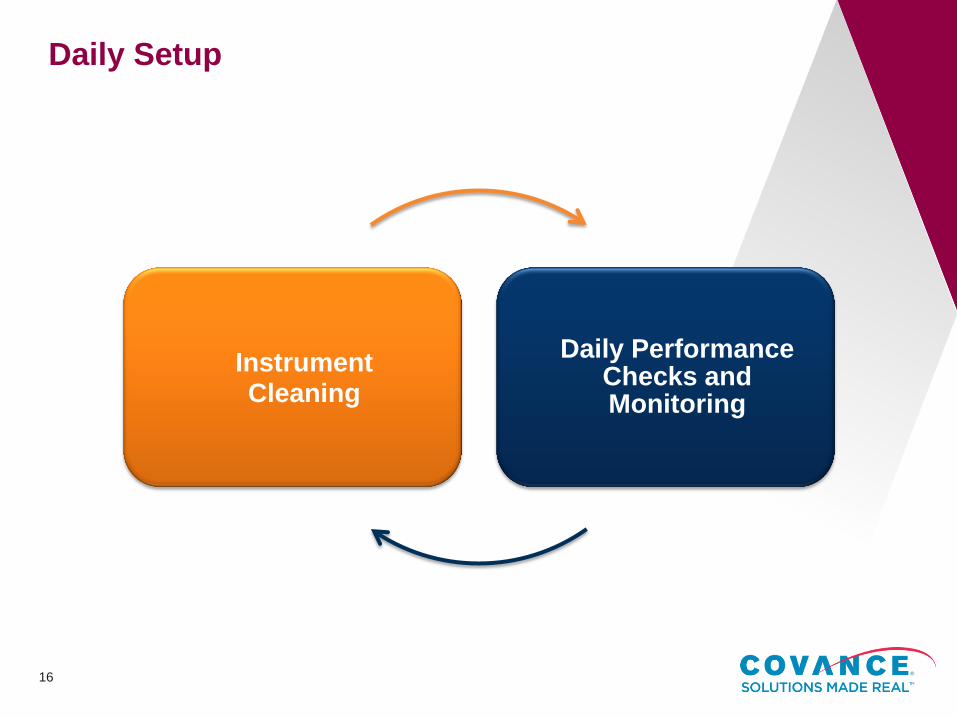
Daily Setup
16
Instrument Cleaning
Daily Performance Checks and Monitoring

Instrument Cleaning and PM
Make sure the instrument is clean and well maintained.
Make sure that all air is purged from the sheath filters, bubble filter, flow cell, and lines.
Follow the vendor recommendations and instrument user’s manual.
If you are not cleaning, you are setting yourself up for failure. You will not have a good clean baseline to monitor.
Nature Protocols
Volume:
1,
Pages:
1522–1530
Year published:
(2006)
DOI:
17
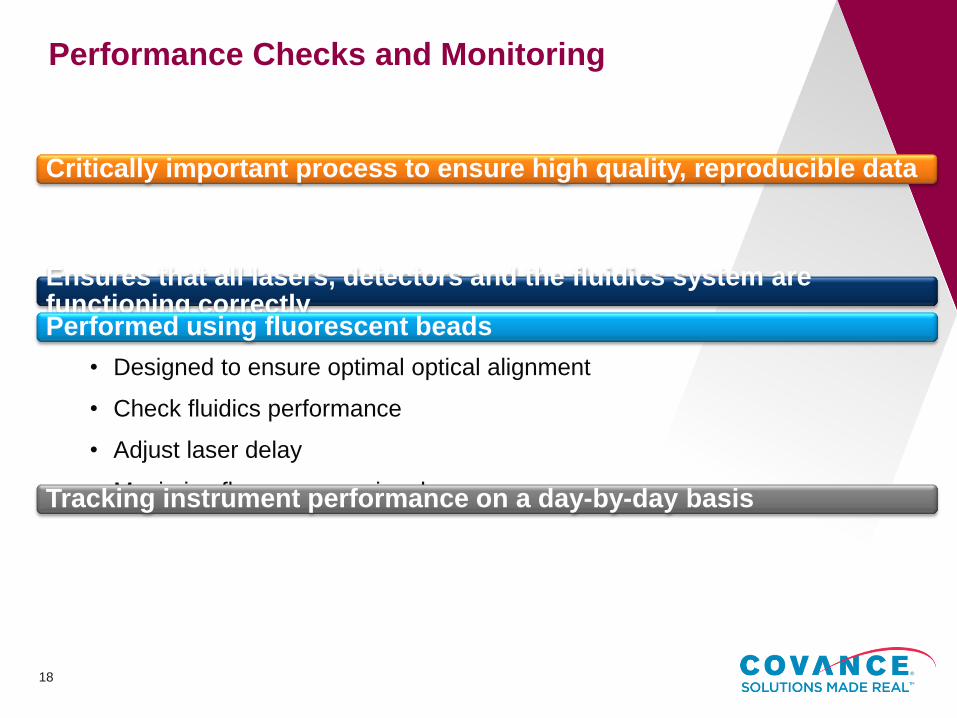
Performance Checks and Monitoring
Critically important process to ensure high quality, reproducible data
Ensures that all lasers, detectors and the fluidics system are functioning correctly
Performed using fluorescent beads
• Designed to ensure optimal optical alignment
• Check fluidics performance
• Adjust laser delay
• Maximize fluorescence signals
Tracking instrument performance on a day-by-day basis
Nature Protocols
Volume:
1,
Pages:
1522–1530
Year published:
(2006)
DOI:
18
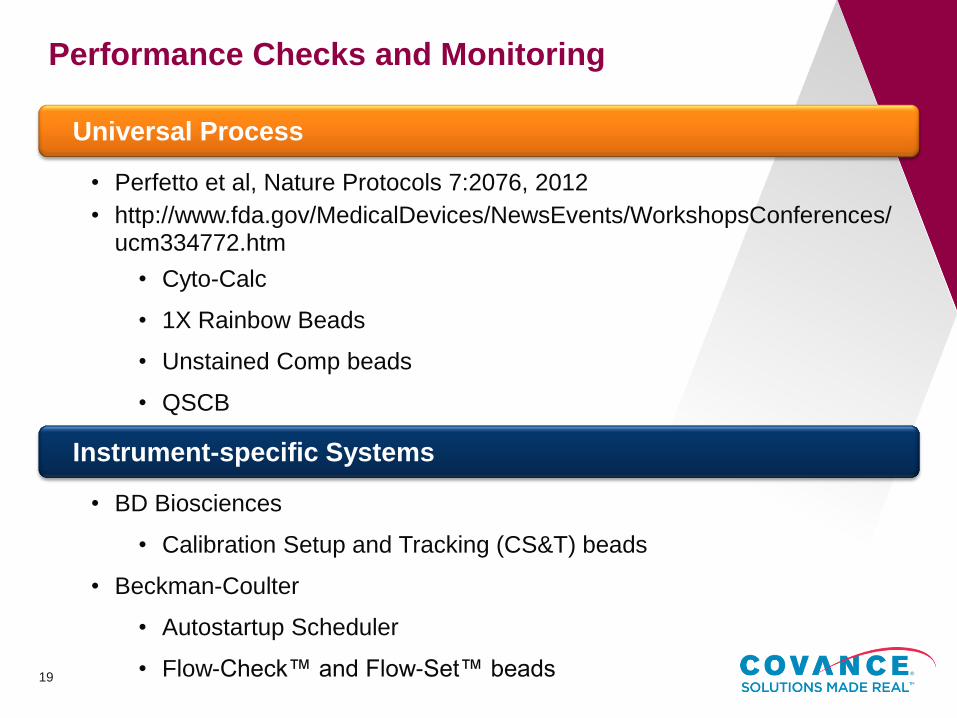
Performance Checks and Monitoring
Universal Process
• Perfetto et al, Nature Protocols 7:2076, 2012
• http://www.fda.gov/MedicalDevices/NewsEvents/WorkshopsConferences/ucm334772.htm
• Cyto-Calc
• 1X Rainbow Beads
• Unstained Comp beads
• QSCB
Instrument-specific Systems
• BD Biosciences
• Calibration Setup and Tracking (CS&T) beads
• Beckman-Coulter
• Autostartup Scheduler
• Flow-Check™ and Flow-Set™ beads
Nature Protocols
Volume:
1,
Pages:
1522–1530
Year published:
(2006)
DOI:
19

Integrated Quality Monitoring Program
20
Example of a baseline and daily performance report from BD FACSCanto II, which provide up to 30 metrics for analyzing
the performance of the cytometer.

Daily Setup
Best Practices
• Warm up the instrument for at least 30 minutes (or manufacturer’s recommend) before running beads
• Gage time for the laser that takes the longest
• Perform a bubble filter purge and degas before running the daily beads.
• Bubbles look like beads and cells
• So anything we can do to mitigate bubbles is a best practice
• Better to spend a little extra time on the front end and have everything pass versus hours of troubleshooting
21
Daily Setup
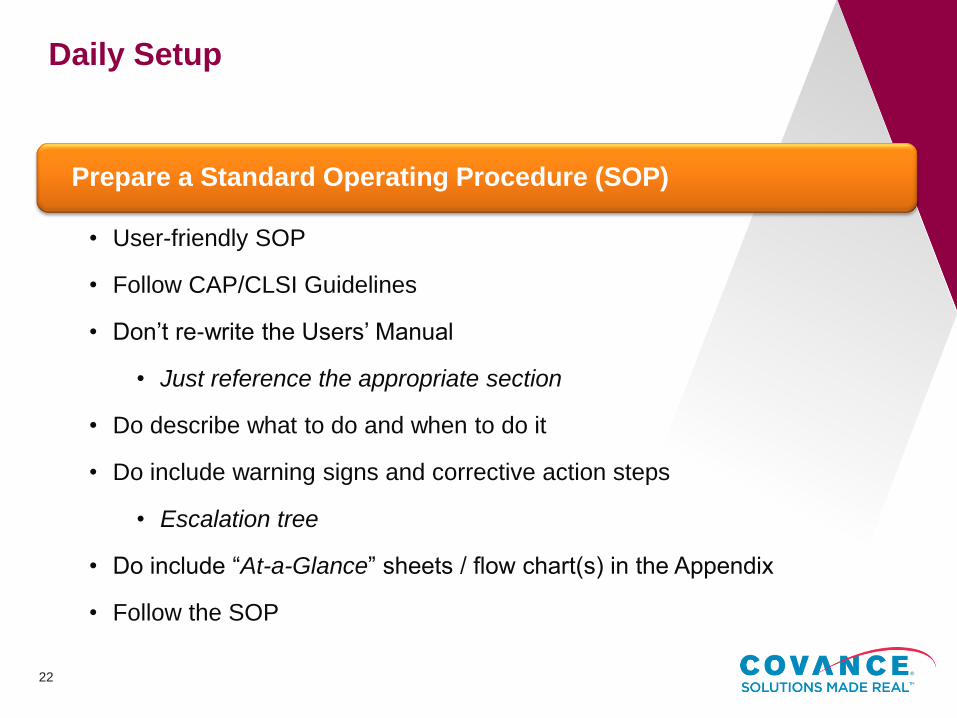
Prepare a Standard Operating Procedure (SOP)
• User-friendly SOP
• Follow CAP/CLSI Guidelines
• Don’t re-write the Users’ Manual
• Just reference the appropriate section
• Do describe what to do and when to do it
• Do include warning signs and corrective action steps
• Escalation tree
• Do include “At-a-Glance” sheets / flow chart(s) in the Appendix
• Follow the SOP
Nature Protocols
Volume:
1,
Pages:
1522–1530
Year published:
(2006)
DOI:
22
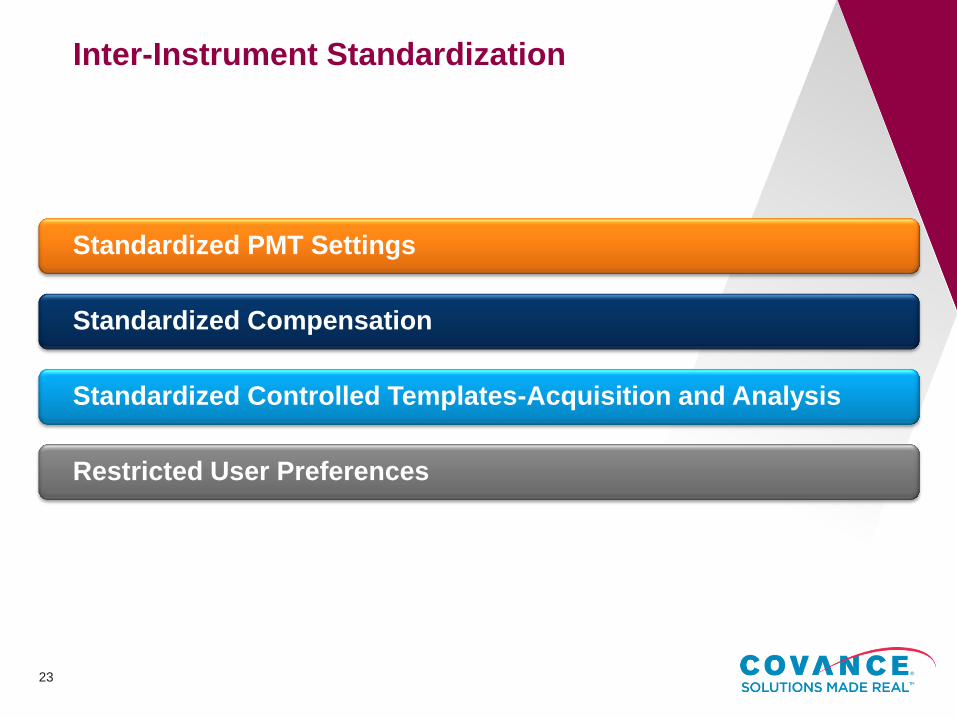
Inter-Instrument Standardization
23
Standardized PMT Settings
Standardized Compensation
Standardized Controlled Templates-Acquisition and Analysis
Restricted User Preferences
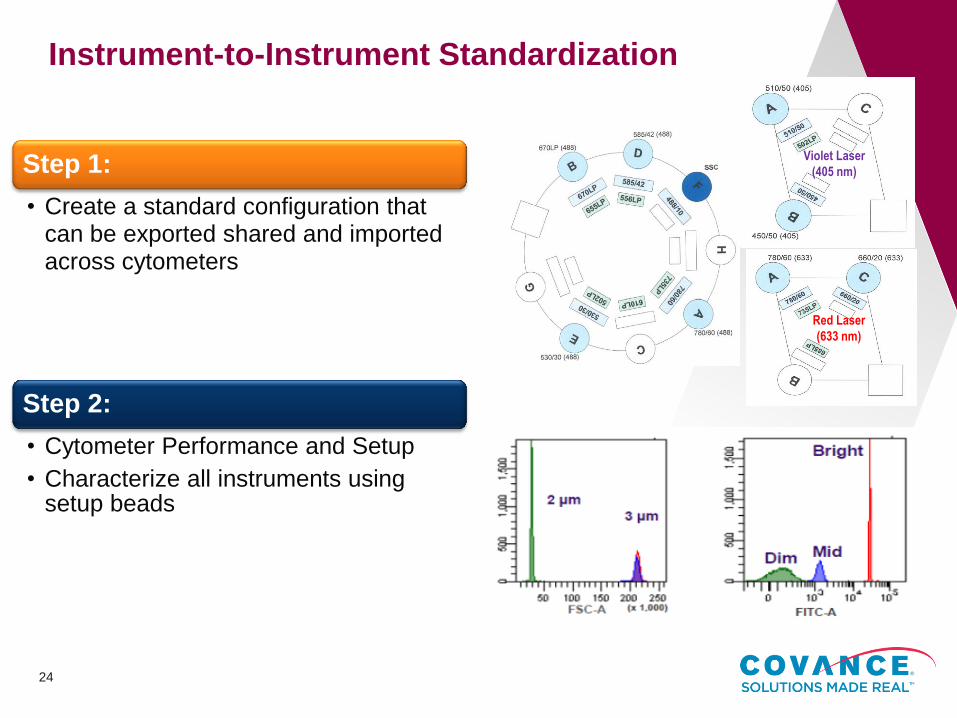
Instrument-to-Instrument Standardization
24
Step 1:
• Create a standard configuration that can be exported shared and imported across cytometers
Step 2:
• Cytometer Performance and Setup
• Characterize all instruments using setup beads
Red Laser
(633 nm)
Violet Laser
(405 nm)
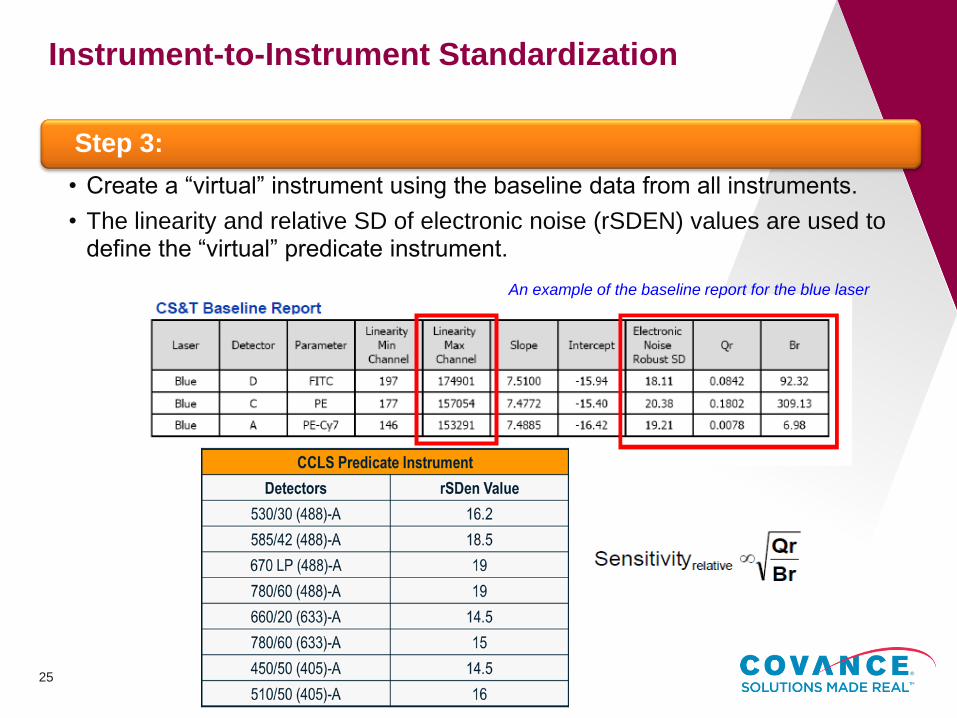
Instrument-to-Instrument Standardization
25
Step 3:
• Create a “virtual” instrument using the baseline data from all instruments.
• The linearity and relative SD of electronic noise (rSDEN) values are used to define the “virtual” predicate instrument.
An example of the baseline report for the blue laser
Instrument-to-Instrument Standardization
26
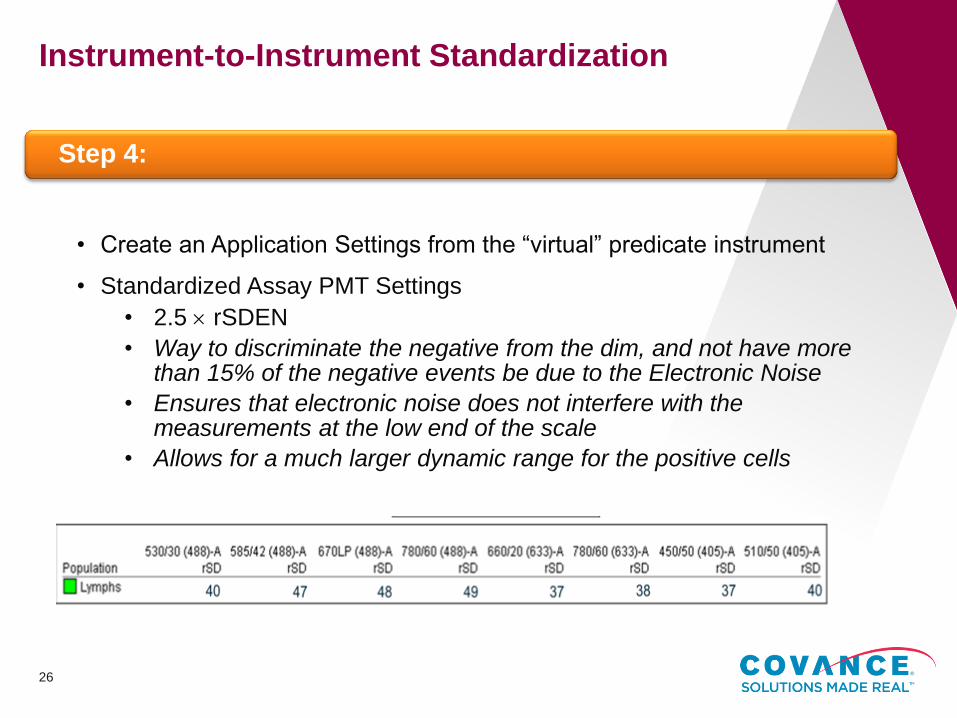
Step 4:
• Create an Application Settings from the “virtual” predicate instrument
• Standardized Assay PMT Settings
• 2.5 rSDEN
• Way to discriminate the negative from the dim, and not have more than 15% of the negative events be due to the Electronic Noise
• Ensures that electronic noise does not interfere with the measurements at the low end of the scale
• Allows for a much larger dynamic range for the positive cells
Instrument-to-Instrument Standardization
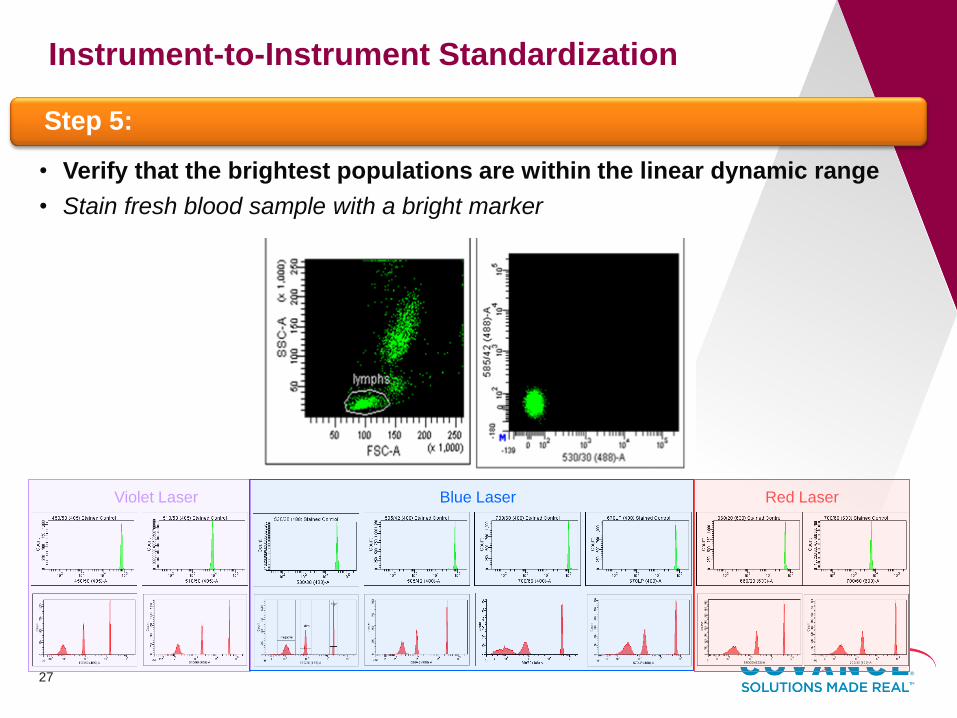
Step 5:
• Verify that the brightest populations are within the linear dynamic range
• Stain fresh blood sample with a bright marker
27
Violet Laser Blue Laser Red Laser

Instrument-to-Instrument Standardization
Step 6:
• Establish ASTV for fluorescence with CS&T beads
28
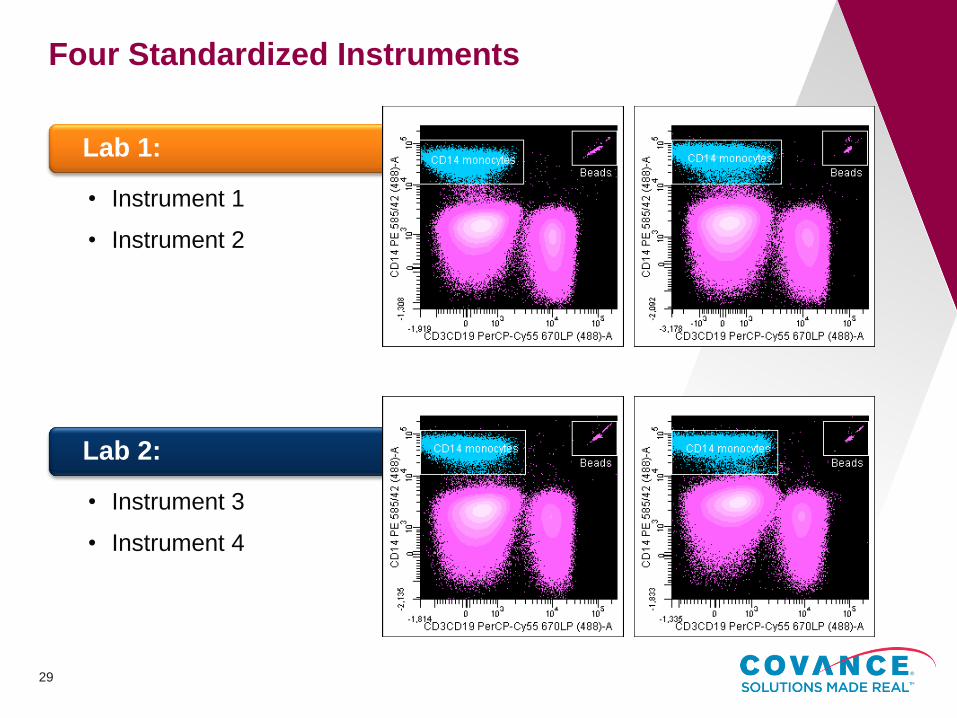
Four Standardized Instruments
29
Lab 1:
• Instrument 1
• Instrument 2
Lab 2:
• Instrument 3
• Instrument 4
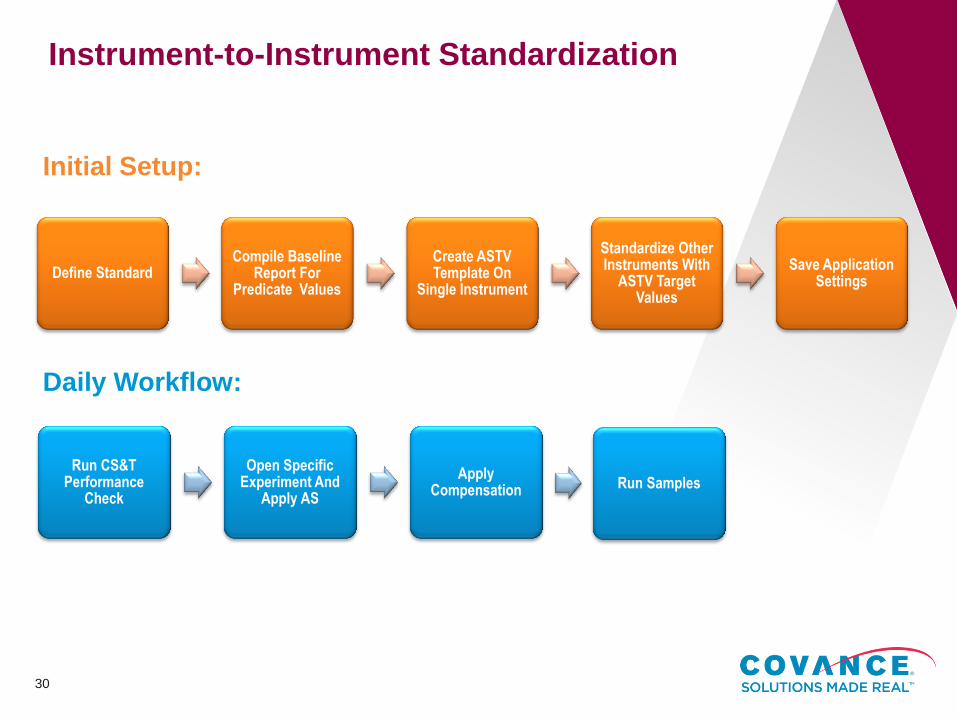
Instrument-to-Instrument Standardization
30
Define Standard Compile Baseline
Report For Predicate Values
Create ASTV Template On
Single Instrument
Standardize Other Instruments With
ASTV Target Values
Save Application Settings
Run CS&T Performance
Check
Open Specific Experiment And
Apply AS
Apply Compensation Run Samples
Daily Workflow:
Initial Setup:

Standardized Daily Workflow
31
Single Standard Configuration
Controlled Acquisition Templates
• Less manual intervention
• Time savings/Less error prone/Greater consistency
• Information within template
• Parameter labels (mAb-fluorochrome)/key words/Acquisition Criteria/Analysis Template/Threshold
• Updated Application Settings (PMT voltages) applied to the template
Restricted User Preferences
• Best option for labs with multiple techs, multiple instruments, numerous different panels performed daily, many locations
Application Settings
• Updated Application Settings (PMT voltages) applied to the template
• CST daily
• ASTV adjusted based on daily setup
• Compensation
References, Standardization
1. Perfetto, S., Ambrozak, D., Nguyen, R., Chattopadhyay, P., Roederer, R. Quality assurance for polychromatic
flow cytometry. Nature Protocols, 1:1522, 20
2. RA Hoffman: Standardization, calibration and control in flow cytometry. In: JP Robinson, Z Darzynkiewicz, P
Dean, L Dressler, H Tanke, P Rabinovich, C Stewart and L Wheeless, eds. Current Protocols in Cytometry. John
Wiley & Sons, Inc., New York. (2005) 1.3.1- 1.3.21.
3. RA Hoffman and JCS Wood: Characterization of Flow Cytometer Instrument Sensitivity. Current Protocols in
Cytometry. John Wiley & Sons. 1.20.1- 1.20.18 (2007)
4. Becton Dickinson Technical Note Standardizing Application Setup Across Multiple Flow Cytometers Using BD
FACSDiva™ Version 6 Software. Ellen Meinelt, Mervi Reunanen, Mark Edinger, Maria Jaimes, Alan Stall, Dennis
Sasaki, Joe Trotter
5. http://www.bdbiosciences.com/documents/BD_FACSDiva_Stndrd_App_Setup_TechBulletin.pdf
6. http://www.bdbiosciences.com/documents/BD_Webinar-CSandT_06_2012.pdf
7. http://www.ncbi.nlm.nih.gov/pubmed/22948490
8. http://www.fda.gov/downloads/MedicalDevices/NewsEvents/WorkshopsConferences/UCM345770.pdf
9. http://www.nature.com/nprot/journal/v7/n12/full/nprot.2012.126.html
10. http://onlinelibrary.wiley.com/doi/10.1002/cyto.a.20333/pdf
32

Analytical
33
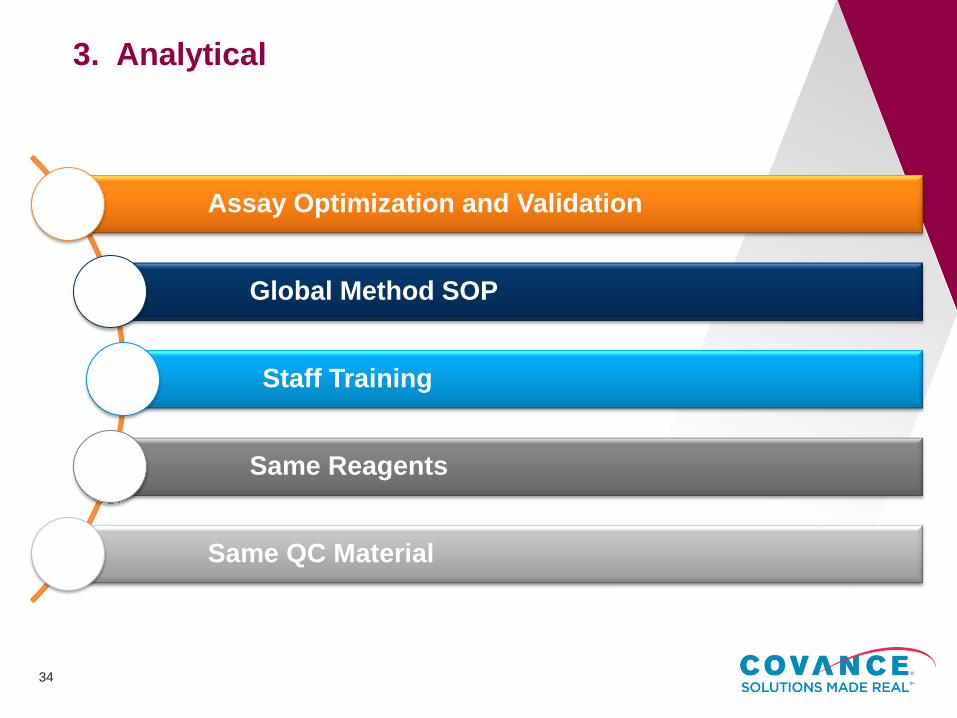
3. Analytical
34
Assay Optimization and Validation
Global Method SOP
Staff Training
Same Reagents
Same QC Material
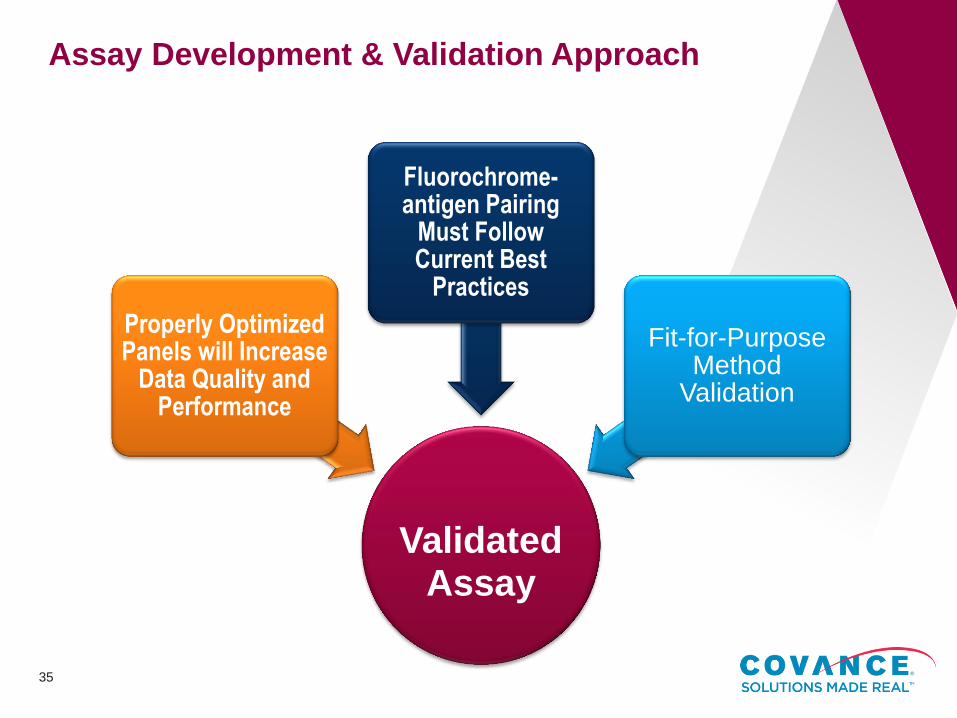
Assay Development & Validation Approach
Validated Assay
Properly Optimized Panels will Increase
Data Quality and Performance
Fluorochrome-antigen Pairing
Must Follow Current Best
Practices
Fit-for-Purpose Method
Validation
35
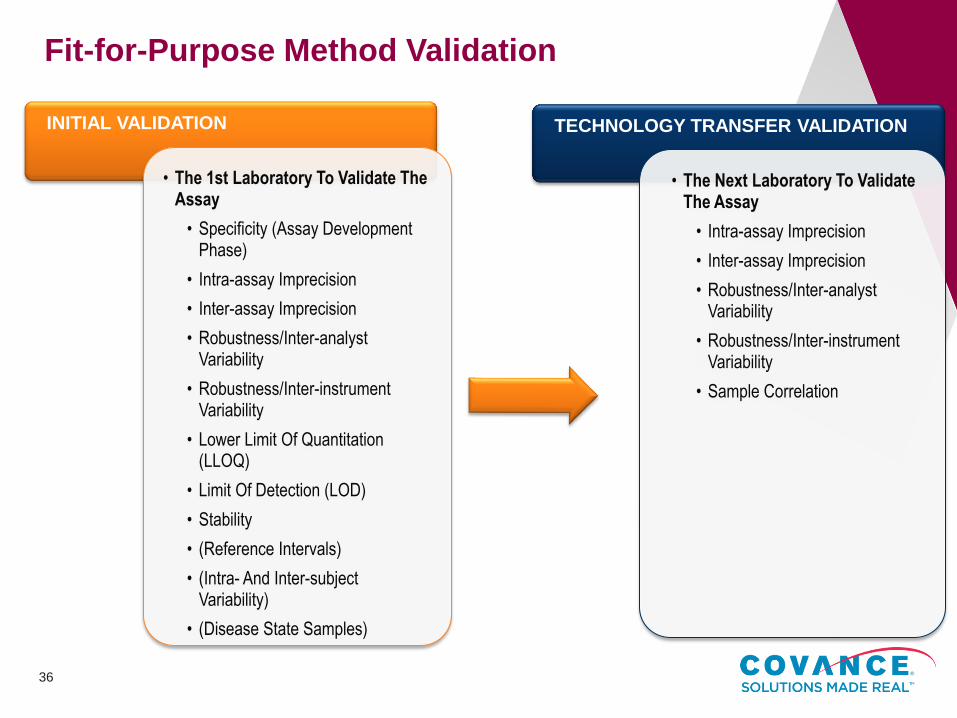
INITIAL VALIDATION
• The 1st Laboratory To Validate The Assay
• Specificity (Assay Development Phase)
• Intra-assay Imprecision
• Inter-assay Imprecision
• Robustness/Inter-analyst Variability
• Robustness/Inter-instrument Variability
• Lower Limit Of Quantitation (LLOQ)
• Limit Of Detection (LOD)
• Stability
• (Reference Intervals)
• (Intra- And Inter-subject Variability)
• (Disease State Samples)
TECHNOLOGY TRANSFER VALIDATION
• The Next Laboratory To Validate The Assay
• Intra-assay Imprecision
• Inter-assay Imprecision
• Robustness/Inter-analyst Variability
• Robustness/Inter-instrument Variability
• Sample Correlation
Fit-for-Purpose Method Validation
36
References, Assay Development and Validation
1. Wood B. 9-Color and 10-Color Flow Cytometry in the Clinical Laboratory. Arch Pathol Lab Med Vol 130: 680-690 (May
2006)
2. Maecker HT and Trotter J; Flow Cytometry Controls, Instrument Setup, and the Determination of Positivity. Cytometry
Part A 69A:1037–1042 (2006)
3. Maecker HT, Frey T, Laurel E. Nomura LE and Trotter J; Selecting Fluorochrome Conjugates for Maximum Sensitivity.
Cytometry Part A 62A:169–173 (2004)
4. Bigos M, Baumgarth N, Jager GC, Herman OH, Nozaki T, Stovel RT, Parks DR, and Herzenberg LA; Nine Color Eleven
Parameter Immunophenotyping Using Three Laser Flow Cytometry. Cytometry 36:36–45 (1999)
5. McLaughlin BE, Baumgarth N, Bigos M, Roederer M, De Rosa SC, Altman JD, Nixon DF, Ottinger J, Oxford C, Evans TG
and Asmuth DM; Nine-Color Flow Cytometry for Accurate Measurement of T Cell Subsets and Cytokine Responses. Part
I: Panel Design by an Empiric Approach. Cytometry Part A 73A: 400-410 (2008)
6. McLaughlin BE, Baumgarth N, Bigos M, Roederer M, De Rosa SC, Altman JD, Nixon DF, Ottinger J, Li J, Beckett L,
Shacklett BL, Evans TG and Asmuth DM; Nine-Color Flow Cytometry for Accurate Measurement of T Cell Subsets and
Cytokine Responses. Part II: Panel Performance Across Different Instrument Platforms. Cytometry Part A 73A: 411-420
(2008)
7. O'Hara DM, et al.. Recommendations for the validation of flow cytometric testing during drug development: II assays. J
Immunol Methods 2011;363:120-34.
8. Wood B, J et al. Group IIW. Validation of cell-based fluorescence assays: practice guidelines from the ICSH and ICCS -
part V - assay performance criteria. Cytometry B Clin Cytom 2013;84:315-23.
9. Litwin V. “Understanding Method Validation as Applied to Flow Cytometry” CYTO 2014. Scientific Tutorial. http://isac-
net.org
37
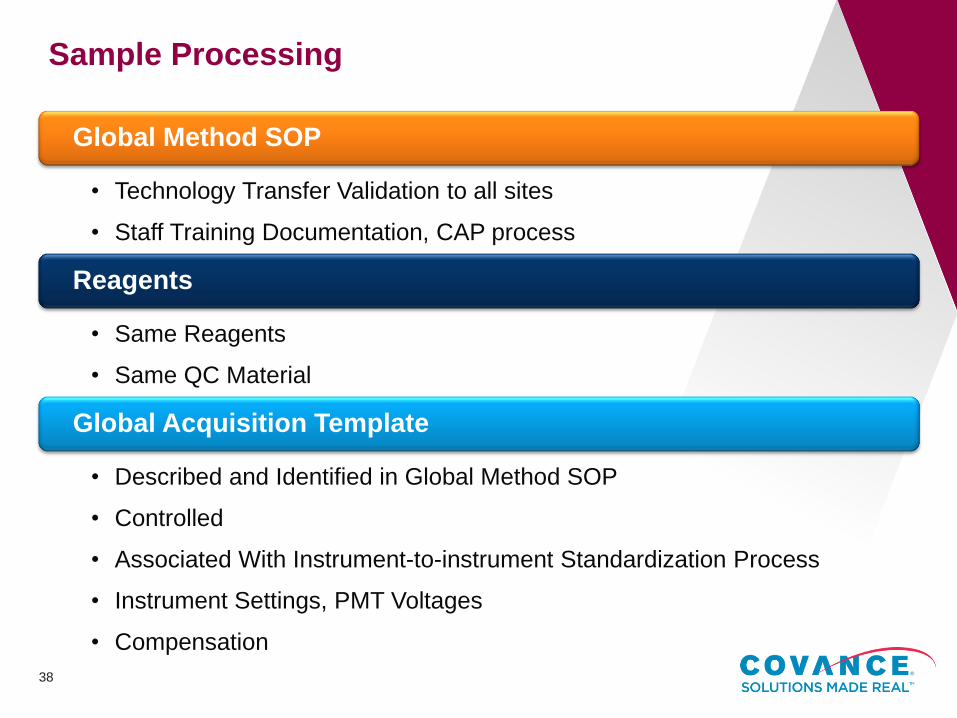
Sample Processing
38
Global Method SOP
• Technology Transfer Validation to all sites
• Staff Training Documentation, CAP process
Reagents
• Same Reagents
• Same QC Material
Global Acquisition Template
• Described and Identified in Global Method SOP
• Controlled
• Associated With Instrument-to-instrument Standardization Process
• Instrument Settings, PMT Voltages
• Compensation

Post-Analytical
39

Data Analysis
40
Global Analysis Templates
• Described and Identified in Global Method SOP
• Controlled
Centralized Gating
• For high complexity panels
• A primary gater and a backup
• Ph.D./Delegate review of all gated data
Specimen Receipt
At Lab
Processed And
Acquired
Same Day
Data Storage On
Internal Secured
Server
Data Analysis
At Expert Site Ph.D. Review
And Approval
Data
Reporting
From Initial
Lab
41
Monitoring

Instrument Performance
42
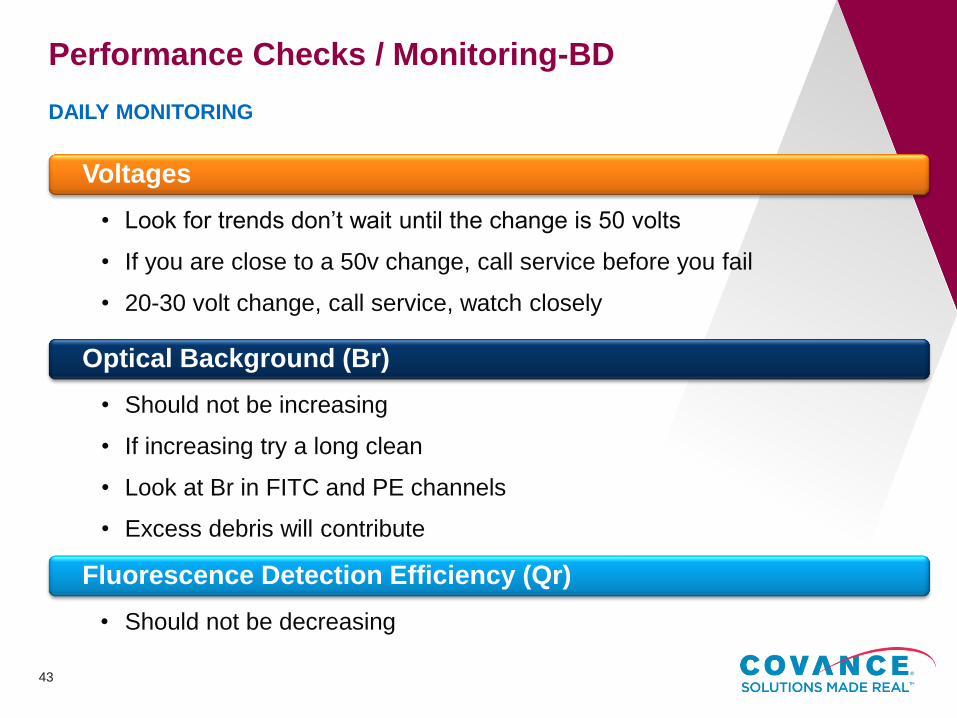
Performance Checks / Monitoring-BD
Voltages
• Look for trends don’t wait until the change is 50 volts
• If you are close to a 50v change, call service before you fail
• 20-30 volt change, call service, watch closely
Optical Background (Br)
• Should not be increasing
• If increasing try a long clean
• Look at Br in FITC and PE channels
• Excess debris will contribute
Fluorescence Detection Efficiency (Qr)
• Should not be decreasing
DAILY MONITORING
43
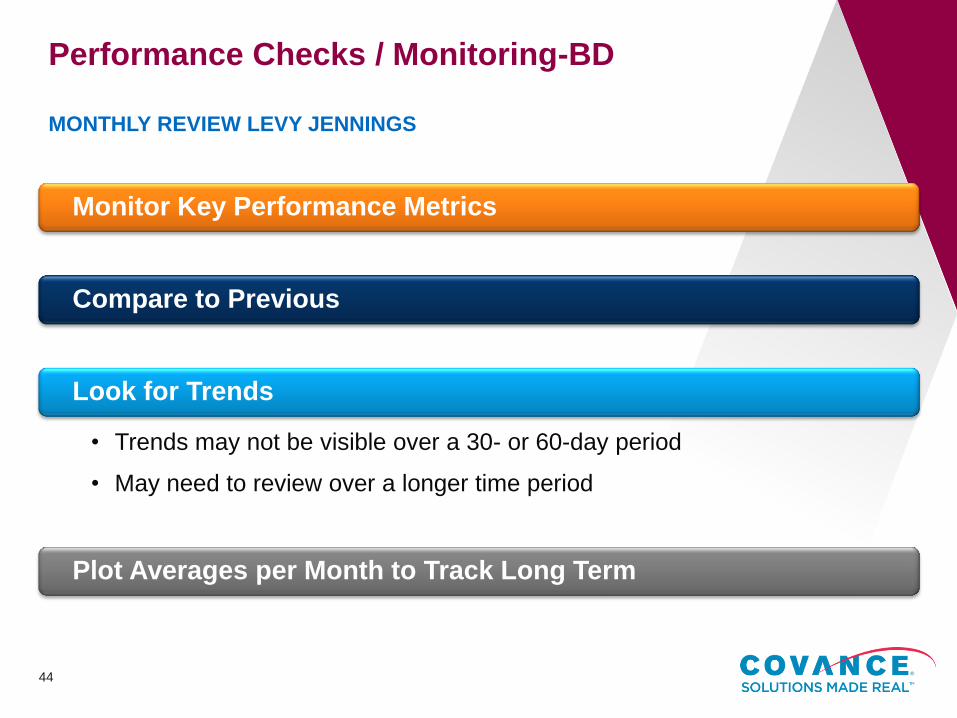
Performance Checks / Monitoring-BD
Monitor Key Performance Metrics
Compare to Previous
Look for Trends
• Trends may not be visible over a 30- or 60-day period
• May need to review over a longer time period
Plot Averages per Month to Track Long Term
MONTHLY REVIEW LEVY JENNINGS
44

Monthly Review Levy Jennings
45
Voltages
• Increase
• More voltage is required to achieve CST targets
• Usually requires a service call
• Trending up
• Laser may need re-alignment
• Where is the trending?
• Look at all the channels
• Is the trending on one laser or all?
• Blue laser all channels—
• Thresholding and laser delays off the blue laser
• One detector only
• Likely a PMT or filter
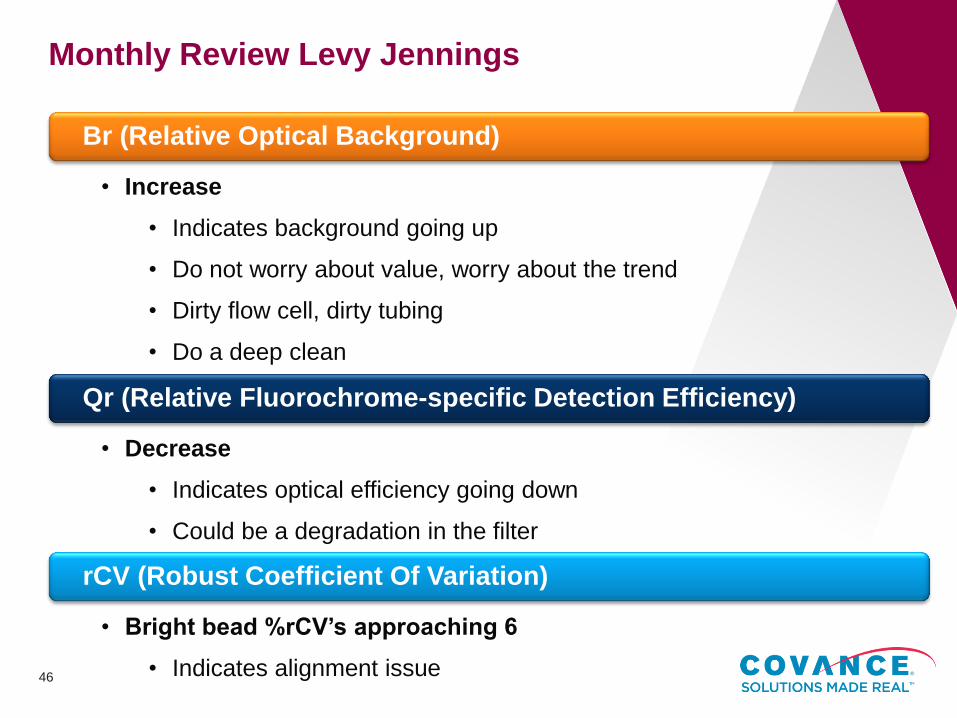
Monthly Review Levy Jennings
Br (Relative Optical Background)
• Increase
• Indicates background going up
• Do not worry about value, worry about the trend
• Dirty flow cell, dirty tubing
• Do a deep clean
Qr (Relative Fluorochrome-specific Detection Efficiency)
• Decrease
• Indicates optical efficiency going down
• Could be a degradation in the filter
rCV (Robust Coefficient Of Variation)
• Bright bead %rCV’s approaching 6
• Indicates alignment issue 46
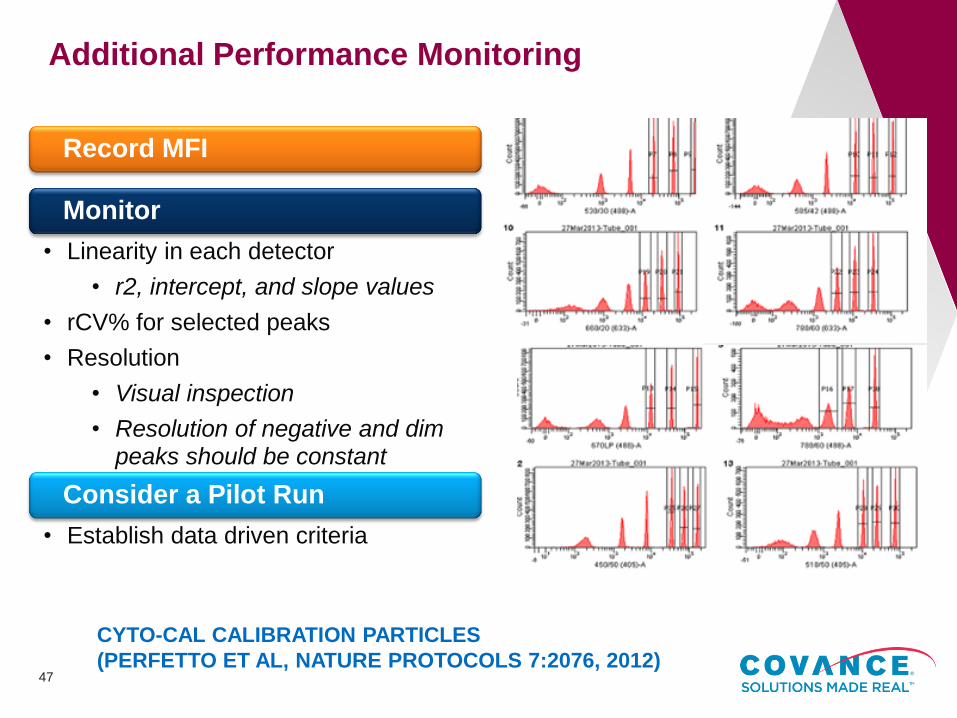
Additional Performance Monitoring
Record MFI
Monitor
• Linearity in each detector
• r2, intercept, and slope values
• rCV% for selected peaks
• Resolution
• Visual inspection
• Resolution of negative and dim peaks should be constant
Consider a Pilot Run
• Establish data driven criteria
CYTO-CAL CALIBRATION PARTICLES
(PERFETTO ET AL, NATURE PROTOCOLS 7:2076, 2012)
47
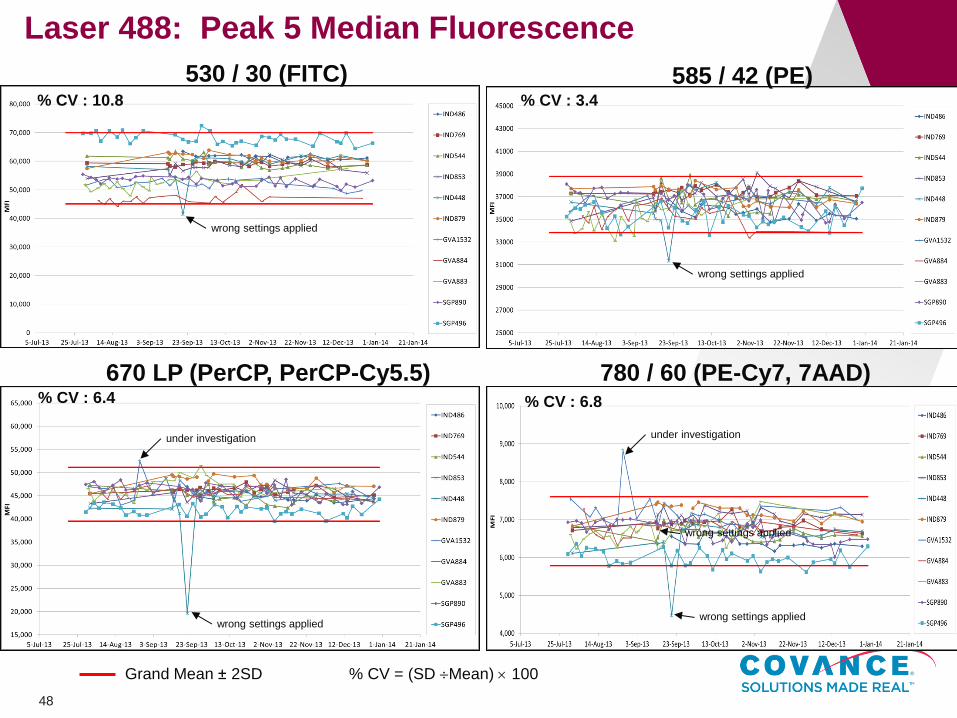
Laser 488: Peak 5 Median Fluorescence
48
% CV : 10.8 % CV : 3.4
% CV : 6.4 % CV : 6.8
Grand Mean ± 2SD % CV = (SD Mean) 100
530 / 30 (FITC) 585 / 42 (PE)
670 LP (PerCP, PerCP-Cy5.5) 780 / 60 (PE-Cy7, 7AAD)
wrong settings applied
wrong settings applied
wrong settings applied wrong settings applied
wrong settings applied
under investigation under investigation

Assay Performance
49
Data Monitoring
50
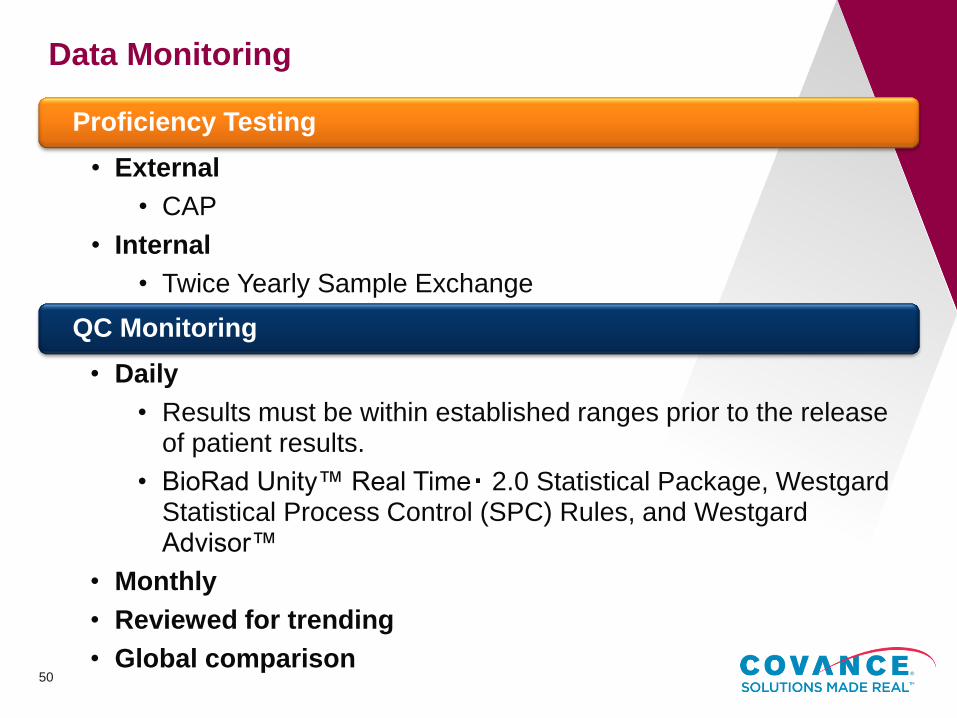
Proficiency Testing
• External
• CAP
• Internal
• Twice Yearly Sample Exchange
QC Monitoring
• Daily
• Results must be within established ranges prior to the release of patient results.
• BioRad Unity™ Real Time 2.0 Statistical Package, Westgard Statistical Process Control (SPC) Rules, and Westgard Advisor™
• Monthly
• Reviewed for trending
• Global comparison
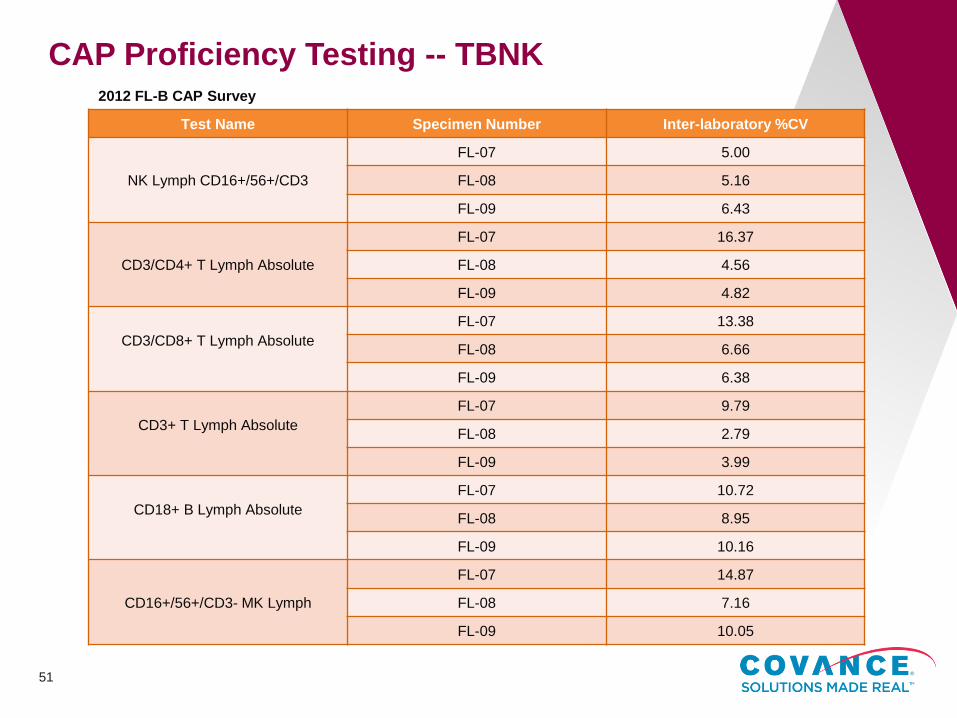
CAP Proficiency Testing -- TBNK
51
2012 FL-B CAP Survey
Test Name Specimen Number Inter-laboratory %CV
NK Lymph CD16+/56+/CD3
FL-07 5.00
FL-08 5.16
FL-09 6.43
CD3/CD4+ T Lymph Absolute
FL-07 16.37
FL-08 4.56
FL-09 4.82
CD3/CD8+ T Lymph Absolute
FL-07 13.38
FL-08 6.66
FL-09 6.38
CD3+ T Lymph Absolute
FL-07 9.79
FL-08 2.79
FL-09 3.99
CD18+ B Lymph Absolute
FL-07 10.72
FL-08 8.95
FL-09 10.16
CD16+/56+/CD3- MK Lymph
FL-07 14.87
FL-08 7.16
FL-09 10.05

Global Cross Correlation -- MRB
52
CD19+ Global Split Testing – Absolute Count (cells/μL)
Sample ID Indy Geneva % Diff Mean SD %CV
S1 157.500 208.200 32.190 182.850 35.850 19.606
S2 336.200 356.200 5.949 346.200 14.142 4.085
S3 180.100 196.600 9.162 188.350 11.667 6.194
S4 92.000 63.700 30.761 77.850 20.011 25.705
S5 263.500 244.700 7.135 254.100 13.294 5.232
Grand Mean 17.039 209.870 18.993 12.164
CD20+ Global Split Testing – Absolute Count (cells/μL)
Sample ID Indy Geneva % Diff Mean SD %CV
S1 155.500 207.700 33.569 181.600 36.911 20.325
S2 334.900 354.500 5.852 344.700 13.859 4.021
S3 177.600 193.000 8.671 185.300 10.889 5.877
S4 89.100 62.400 29.966 75.750 18.880 24.924
S5 261.200 246.800 5.513 254.000 10.182 4.009
Grand Mean 16.714 208.270 18.144 11.831

Global QC Performance
53
Population Level 1 QC Level 2 QC
Global Mean %CV N Global Mean %CV N
CD3+ % 2.46
(1.48 to 2.82) 346
1.56 (1.00 to 1.79)
346
CD3+,CD4+ % 5.55
(4.13 to 6.43) 346
2.20 (1.33 to 2.35)
346
CD3+,CD8+ % 3.03
(2.54 to 3.60) 346
3.91 (2.86 to 4.57)
346
CD19+ % 4.10
(3.48 to 4.47) 346
5.10 (4.27 to 5.73)
346
CD3-, CD16+/CD56+ % 4.97
(4.04 to 6.51) 347
6.04 (4.24 to 7.80)
347
Population Level 1 QC Level 2 QC
Global Mean %CV N Global Mean %CV N
CD3+ abs 3.97
(3.15 to 4.38) 344
4.18 (3.35 to 5.08)
344
CD3+,CD4+ abs 6.27
(5.23 to 7.25) 344
4.32 (3.06 to 5.21)
344
CD3+,CD8+ abs 4.98
(3.87 to 5.10) 344
5.43 (4.71 to 6.21)
344
CD19+ abs 5.38
(4.48 to 5.96) 346
7.12 (5.30 to 9.02)
346
CD3-, CD16+/CD56+ abs 6.98
(4.62 to 8.61) 347
7.80 (3.45 to 10.72)
347
TBNK Assay
October 2011
Streck CD-Chex Plus QC
► (same lot #)
Nine different Instruments
► 2 in Geneva
► 4 in Indianapolis
► 1 in Shanghai
► 2 in Singapore

Summary of Standardization Requirements for
Clinical Trials
54
The same as for any quality lab but with a greater emphasis on longitudinal aspects
Instrument validation, standardization, and monitoring
Assay optimization, validation, and monitoring