standardized electrical tests for electrical equipment in
TRANSCRIPT

Lappeenranta University of TechnologyLUT School of Energy SystemsDegree Program in Electrical Engineering
Master’s Thesis
Kimmo Tirri
STANDARDIZED ELECTRICAL TESTS FOR ELECTRICALEQUIPMENT IN ROAD VEHICLES CASE: VISEDO OYPOWERMASTER M-FRAME
Examiners: Professor Pertti SilventoinenTero Järveläinen M.Sc. (Tech.)
Supervisor: Tero Järveläinen M.Sc. (Tech.)
ABSTRACT
Lappeenranta University of TechnologyLUT School of Energy SystemsDegree Program in Electrical Engineering
Kimmo Tirri
Standardized electrical tests for electrical equipment in road vehicles Case: VisedoOy PowerMASTER M-frame
Master’s Thesis
2016
59 pages, 25 figures, 6 tables, and 1 appendice.
Examiners: Professor Pertti SilventoinenTero Järveläinen M.Sc. (Tech.)
Keywords: automotive, power electronics, standard, ISO 16750
Electrical road vehicles were common at the begin of the 20th century but internal com-bustion engines took a victory from electrical motors in road vehicles. The acknowledge-ment of the environment, and the price and the availability of the crude oil are reasonsfor the comeback of the electrical vehicles. Advancement in industrial technology andpolitical atmosphere in EU as the directive 20–20–20, which consists of reducing fossilemission, increasing renewable energy and increasing the energy efficiency, have madethe electrification popular again.
In this thesis tests based on standard ISO 16750–2 electrical loads for electrical equipmentin road vehicles are made for Visedo Oy’s PowerMASTER M-frame power electronicsdevice. This device is designed for mainly drive trains in mobile work machines andmarine vessels but can be used in other application in its power range which also includesroad vehicles. The functionality of the device is tested with preliminary tests which act asa framework for the tests based on standards.

TIIVISTELMÄ
Lappeenrannan teknillinen yliopistoLUT School of Energy SystemsSähkötekniikan koulutusohjelma
Kimmo Tirri
Standardien mukaiset sähköiset testit ajoneuvoihin sijoitetuille sähkölaitteille Case:Visedo Oy PowerMASTER M-frame
Diplomityö
2016
59 sivua, 25 kuvaa, 6 taulukkoa ja 1 liite.
Tarkastajat: Professori Pertti SilventoinenDI Tero Järveläinen
Hakusanat: ajoneuvo, tehoelektroniikka, standardi, ISO 16750Keywords: automotive, power electronics, standard, ISO 16750
Sähköautot olivat vielä 1900-luvun alussa yleisiä, kunnes polttomoottorin kehitys vei voi-ton sähkömoottoreista. Huoli ympäristöstä sekä raaka-aineiden saatavuudesta ja hinnastaovat olleet syitä, joiden takia ajoneuvojen sähköistäminen on alkanut uudestaan. Tämänovat myös mahdollistaneet teollinen kehitys ja poliittinen ilmapiiri, johon kuuluu muunmuassa EU:n 20–20–20 päätös alentaa päästöjä, panostaa uusiutuviin energialähteisiin japarantaa energiatehokkuutta.
Työssä valmisteltiin standardin, ISO 16750–2 sähköiset kuormat ajoneuvoihin tarkoite-tuille sähkölaitteille, mukaisesti testit Visedo Oy:n PowerMASTER M-frame tehoelekt-roniikan laitteelle. Kyseinen laite on suunniteltu työkoneiden ja laivojen voimansiirtoavarten, mutta sitä voidaan käyttää myös muissa sen teholuokan laitteissa, kuten ajoneu-voissa. Työssä myös varmistetaan laitteen toiminnallisuus standardin mukaisia testejä var-ten preliminaarisilla testeillä, jotka toimivat kehyksenä standardoituja testejä varten.

ACKNOWLEDGEMENT
This thesis was done for Visedo Oy and I would like to thank the company for the oppor-tunity. I want to thank for M.Sc. (Tech.) Tero Järveläinen for being the supervisor andan examiner of the thesis and for giving guidance and advices. Thanks to D.Sc. (Tech.)Risto Tiainen for ideas and help in preliminary tests. Also thanks to all in Visedo Oywhom I have worked with.
I want to give special thank for professor Pertti Silventoinen for being an examiner of thethesis, and giving ideas to the thesis and keeping the thesis on track.
Thanks for my parents Oili and Kalervo for supporting me through the studies. Specialthanks to all my friends and for the countless sauna evenings. Hell yeah!
Last but not leasts I want to thank Silva for the support and being part of my life.
Lappeenranta, May 16, 2016
Kimmo Tirri

5
CONTENTS
1 INTRODUCTION 91.1 The big picture . . . . . . . . . . . . . . . . . . . . . . . . . . . . . . . 91.2 Electrically operated vehicles . . . . . . . . . . . . . . . . . . . . . . . . 10
2 CONVERTERS AND INVERTERS 122.1 Converters . . . . . . . . . . . . . . . . . . . . . . . . . . . . . . . . . . 132.2 Inverters . . . . . . . . . . . . . . . . . . . . . . . . . . . . . . . . . . . 142.3 PowerMASTER M-frame . . . . . . . . . . . . . . . . . . . . . . . . . . 14
2.3.1 Industrial applications . . . . . . . . . . . . . . . . . . . . . . . 152.3.2 Automotive applications . . . . . . . . . . . . . . . . . . . . . . 16
3 ISO 16750 173.1 ISO 16750–2 Electrical loads . . . . . . . . . . . . . . . . . . . . . . . . 173.2 Direct current supply voltage . . . . . . . . . . . . . . . . . . . . . . . . 193.3 Overvoltage . . . . . . . . . . . . . . . . . . . . . . . . . . . . . . . . . 193.4 Superimposed alternating voltage . . . . . . . . . . . . . . . . . . . . . . 203.5 Slow decrease and increase of supply voltage . . . . . . . . . . . . . . . 203.6 Momentary drop in supply voltage . . . . . . . . . . . . . . . . . . . . . 203.7 Reset behaviour at voltage drop . . . . . . . . . . . . . . . . . . . . . . . 213.8 Starting profile (Cranking impulse) . . . . . . . . . . . . . . . . . . . . . 213.9 Load dump . . . . . . . . . . . . . . . . . . . . . . . . . . . . . . . . . 223.10 Reversed voltage . . . . . . . . . . . . . . . . . . . . . . . . . . . . . . 233.11 Ground reference and supply offset . . . . . . . . . . . . . . . . . . . . . 243.12 Open circuit test . . . . . . . . . . . . . . . . . . . . . . . . . . . . . . . 243.13 Signal circuits . . . . . . . . . . . . . . . . . . . . . . . . . . . . . . . . 243.14 Load circuits . . . . . . . . . . . . . . . . . . . . . . . . . . . . . . . . 253.15 Damp heat cyclic test . . . . . . . . . . . . . . . . . . . . . . . . . . . . 253.16 Withstand voltage . . . . . . . . . . . . . . . . . . . . . . . . . . . . . . 263.17 Insulation resistance . . . . . . . . . . . . . . . . . . . . . . . . . . . . . 27
4 PRELIMINARY TESTS FOR POWERMASTER M-FRAME 284.1 Power on and stop test . . . . . . . . . . . . . . . . . . . . . . . . . . . 284.2 Current measurements and overcurrent trigger test . . . . . . . . . . . . . 294.3 The DC-link voltage measurement and overvoltage trigger tests . . . . . . 294.4 The enclosure voltage measurement test . . . . . . . . . . . . . . . . . . 304.5 The short circuit trigger event . . . . . . . . . . . . . . . . . . . . . . . . 304.6 IGBT and external PT100 temperature measurement test . . . . . . . . . 30

6
4.7 Auxiliary voltage output tests . . . . . . . . . . . . . . . . . . . . . . . . 314.8 The communication tests . . . . . . . . . . . . . . . . . . . . . . . . . . 314.9 The resolver test . . . . . . . . . . . . . . . . . . . . . . . . . . . . . . . 32
5 PRELIMINARY TEST RESULTS 335.1 Power up and stop test . . . . . . . . . . . . . . . . . . . . . . . . . . . 335.2 Current measurements and overcurrent trigger test . . . . . . . . . . . . . 345.3 The voltage measurements and overvoltage trigger tests . . . . . . . . . . 355.4 The short circuit trigger event . . . . . . . . . . . . . . . . . . . . . . . . 365.5 Stop signals test . . . . . . . . . . . . . . . . . . . . . . . . . . . . . . . 365.6 IGBT and external PT100 temperature measurement tests . . . . . . . . . 36
5.6.1 Temperature test in RT . . . . . . . . . . . . . . . . . . . . . . . 375.6.2 Temperature test in low temperature . . . . . . . . . . . . . . . . 385.6.3 Temperature test in high temperature . . . . . . . . . . . . . . . 40
5.7 Auxiliary voltage output tests . . . . . . . . . . . . . . . . . . . . . . . . 415.8 The user IO test . . . . . . . . . . . . . . . . . . . . . . . . . . . . . . . 425.9 The CAN communication test . . . . . . . . . . . . . . . . . . . . . . . 425.10 The resolver test . . . . . . . . . . . . . . . . . . . . . . . . . . . . . . . 43
5.10.1 Motor resolver speed measurements with load of 10 Nm . . . . . 435.10.2 Torque measurements with load of 10 Nm . . . . . . . . . . . . . 455.10.3 Motor resolver speed measurements with load of 461 Nm . . . . . 475.10.4 Torque measurements with load of 461 Nm . . . . . . . . . . . . 49
6 DISCUSSION 516.1 The preliminary tests . . . . . . . . . . . . . . . . . . . . . . . . . . . . 516.2 Future Work . . . . . . . . . . . . . . . . . . . . . . . . . . . . . . . . . 52
7 CONCLUSIONS 53
REFERENCES 54
APPENDICESAppendix 1: Resolver test script

7
NOMENCLARUTE
Roman symbolsC CapacitorI CurrentL Phasen IntegerR ResistanceS Switcht TimeU Voltage
AbbreviationsA,B,C Voltage, phases of grid sideAC Alternating currentAFE Active front endASIC Application-specific integrated circuitCAN Controller area network, communicationCEN European general standards organizationCENELEC European electric standards organizationCPU Central processing unitCSI Current source inverterDC Direct currentDIN German general standards organizationPM Device under the testEMC Electro magnetic compatiblyEMI Electro magnetic interferenceEU European UnionEV Electrical vehicleFPGA Field-programmable gate arrayGTO Gate turn-off thyristorHEV Hybrid electrical vehicleICE Internal combustion engineIEC International electric standards organizationIGBT Insulated-gate bipolar transistorIGCT Integrated gate-commutated thyristor

8
IO Input/output, communicationISO International general standards organizationHVDC High voltage direct currentLVDS Low voltage differential signallingMOSFET Metal-oxide-semiconductor field-effect transistorPCB Printed circuit boardPM PowerMASTER M-framePT100 Platinium thermometer, 100 Ω at 0CPWM Pulse width modulationRMS Root mean squareRS-485 Recommended standard 485, communicationRT Room temperatureSFS Finnish general standards organizationU,V,W Phases of motor sideVSD Variable-speed driveVSI Voltage source inverter
Subscripts1,2,3 Phases1,2,3,4,5,6 Number of switchact ActualDC+ DC-link voltage, plus sidef Fall timei Internal resistanceLL RMS value of line to line AC-voltagemin Minimumnom NominalP Primary side of a VSDr Rise timeS Secondary side of a VSDS Supply voltage

9
1 INTRODUCTION
Testing is an important part of the product development. As developing a product basedon standards does not only make it safe to use but also it allows the customer know thatthe product meets certain requirements. If the product is part of a larger system, it meansthat customer can use the product and not to worry about compatibility issues [1, 2, 3].That is, if the customer has designed its own system within the standards.
Standards are guidelines, not mandatory unless a standard is made to a law [1, 2]. Stan-dards were introduced in an effective way at the 19th century when the industrializationbegun which meant mass production. This production needed subcontracting and special-ization over borders and that meant every part of the same design needed to be exactly thesame. [3]
The standards are divided in three levels: international, regional and national. For exam-ple national standards, DIN and SFS use 15 % and 8 % of their own standards. Rest oftheir standards are based on European standards CEN or CENELEC, or international ISOor IEC standards. [3, 4]
In this thesis the second part of the standard ISO 16750 is presented for testing VisedoOy’s PowerMASTER M-frame. That standard describes electrical tests for electricalequipment for road vehicles. Before the tests based on any standard can be done, thefunctionality of the PM must be tested first.
This functionality is tested with preliminary tests. These tests are for ensuring that thePM operates as designed. The preliminary test results are used to compare results of thetest based on standards.
1.1 The big picture
A hundred years ago, in the early 20th century, electrical vehicles (EV) were more com-mon than the vehicles that used internal combustion engines (ICE) [5, 6, 7]. The intro-duction of the electrical ignition and cheaper price of ICE vehicles turned the tide to thedecline of EV for a century [5, 6, 7]. Now, the EVs are making a comeback along the sidewith hybrid electrical vehicles (HEV), and there are couple of reasons to that.
In the year 2008 the price of the crude oil peaked after it had risen in a year to more

10
than double of its price from the year 2007 [8, 9]. A year after the oil consumption de-creased but then the consumption begun to increase again, as the price of the crude oildecreased [8, 9, 10]. In the year 2014 Asia consumed little less than half of the world’soil and the whole world had increased its oil consumption, with Europe being an excep-tion [10].
The European Union proposed the famous 20–20–20 in the year 2007 which came realityin the form of a directive in the year 2009 in the EU countries. This 20–20–20 stands forthree targets: the amount of greenhouse gasses is decreased by 20 % to the level of it wasin 1990, energy efficiency is increased by 20 % and 20 % of the energy production mustbe on based renewable energy sources. In addition to this, the vehicle fuel consumptionshould be based on 10 % of biofuels. All of these targets meant to be achieved at the latestin the year 2020. [11]
There will come a day when the last drop of oil will be drilled. This is done by eitherexhausting the last oil source or when the expenses of drilling the oil losses to the moneygetting out of it. People has already waken to the fact that environment suffers from theactions that we cause by polluting it. Although completely transferring to using EV orHEV vehicles will not solve every problem caused to environment, it is a step forward tochange it back to being healthy again.
1.2 Electrically operated vehicles
An EVs can be operated purely with electricity or it can also use an ICE along side withelectrical motor. In the latter case the vehicle is called an HEV.
An EV has an energy storage system which is recharged from the grid network or whenbraking. The stored energy is then used by an electrical motor or motors to create torqueto move the vehicle forward. There is more than this, a converter to produce a DC-voltagefor the energy system from the grid, an inverter to produce an AC-voltage to a electricalmotor and a control to use correct value of the current and the frequency to be fed to theelectrical motor. The electrical drive train also acts as a generator when braking or goingdownhill.
An HEV means that there is an ICE and an electrical motor in the vehicle propulsion.There are three types of HEVs and these are called a series hybrid, a parallel hybrid anda combination of both. In the series hybrid, the ICE is connected to a generator which
11
creates energy for the electrical motor or motors [7, 12]. In this case, the ICE operatesindependently ideally at its nominal operation point. The parallel hybrid means that theICE is connected to the wheels through an electrical motor that can act as a generatorwhen braking or moving downhill, and when accelerating the electrical motor helps theICE [7, 12]. When a series and a parallel hybrid are combined, it means that the ICE isconnected to a generator and to an electrical motor [7, 12]. This allows to operate thevehicle in both ways as series or parallel hybrid. Like in EV, the same power electronicsexist with their control and energy storage system with exception that not all HEVs havethe capability to connect to grid to load their energy storage systems.
The energy storage systems are constantly shaping to have a better energy in a volume[13,14]. That means decreasing the size, increasing the energy capacity or doing both. This al-lows a larger operational range for the EVs which enables to drive further without recharg-ing the energy storage system.
The electrical motors are more efficient compared to ICEs [15]. When the efficiency ofthe whole energy chain is investigated, the efficiency is not so black and white. We arenot living in ideal world nor in a world where the electricity magically just comes outfrom the plug in the wall. For example burning coal in plant does not have efficiencyof 100 %, electricity transfers in the grid with losses and semiconductor devices do nothave ideal switches. But even so, EVs are more energy efficient compared to ICE inthe urban environment, mainly because the EV takes an advantage of storing the energyduring braking [15].
The power electronics are evolving and the usage of those are more and more in commoneveryday life [16]. Not only in the shape of the EVs and the HEVs but also in an industrialapplications for example a pump that uses a throttle to control the fluid speed. This meansthat the pump system is running at the full speed for whole time. If the pump system isreplaced with a controlled pump, then energy is saved. The reason to that is due the factthat the pump is not needed to run at the full speed for the whole time but the speed canbe controlled.
12
2 CONVERTERS AND INVERTERS
Electrical motors do not just operate in steady grid voltage of 230 V and grid frequencyof 50 Hz. Electrical motors need different voltages and frequencies in order to achievedifferent torques and speeds. To operate an electrical motor a voltage conversion is neededwhich means first conversion from AC to DC and then to DC to AC [17, 18, 19].
For an active voltage conversion in converters and in inverters switches are needed. Theseswitches are semiconductor devices that generally nowadays are either power metal-oxide-semiconductor field-effect transistors (MOSFET) or insulated-gate bipolar tran-sistors (IGBT), diodes, thyristors, integrated gate-commutated thyristors (IGCT) or gateturn-off thyristor (GTO) [17, 18, 19]. Although diodes and thyristors are not switches butthose can be used in passive converters.
For two of inverter types current source inverter (CSI) and voltage source inverter (VSI),the latter is more popular of these two in low and medium voltage inverters. One reasonis that a large inductor is needed in CSI for storing the energy. [19, 20, 21]
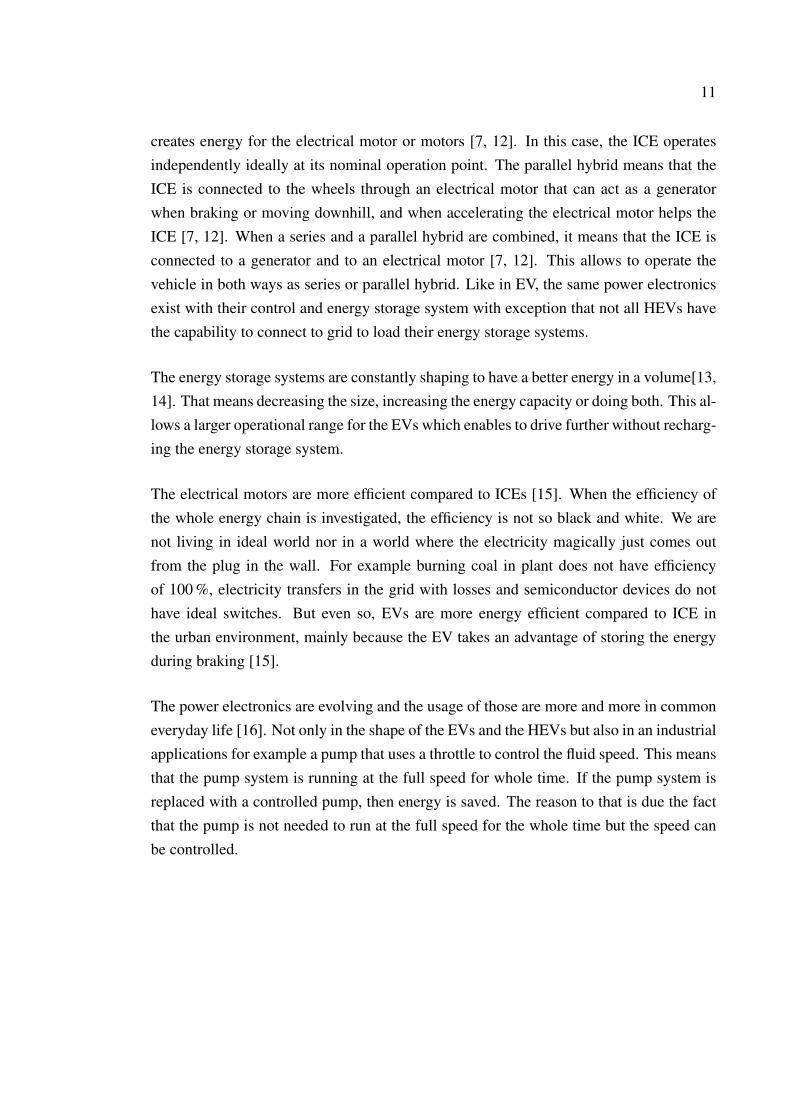
When a converter and an inverter are combined, the result is a variable speed drive (VSD).Picture of an ideal variable-speed drive is presented in Figure 1.
SP1 SP3 SP5
Grid
UA
UB
UCCDC
UU
UV
UWMotor
SP2 SP4 SP6
SS1 SS3 SS5
SS2 SS4 SS6
Figure 1. Figure of a VSD where is an AFE and an inverter with VSI topology. VSI which meansthat there is a capacitor in the DC-link. [19, 22]
13
2.1 Converters
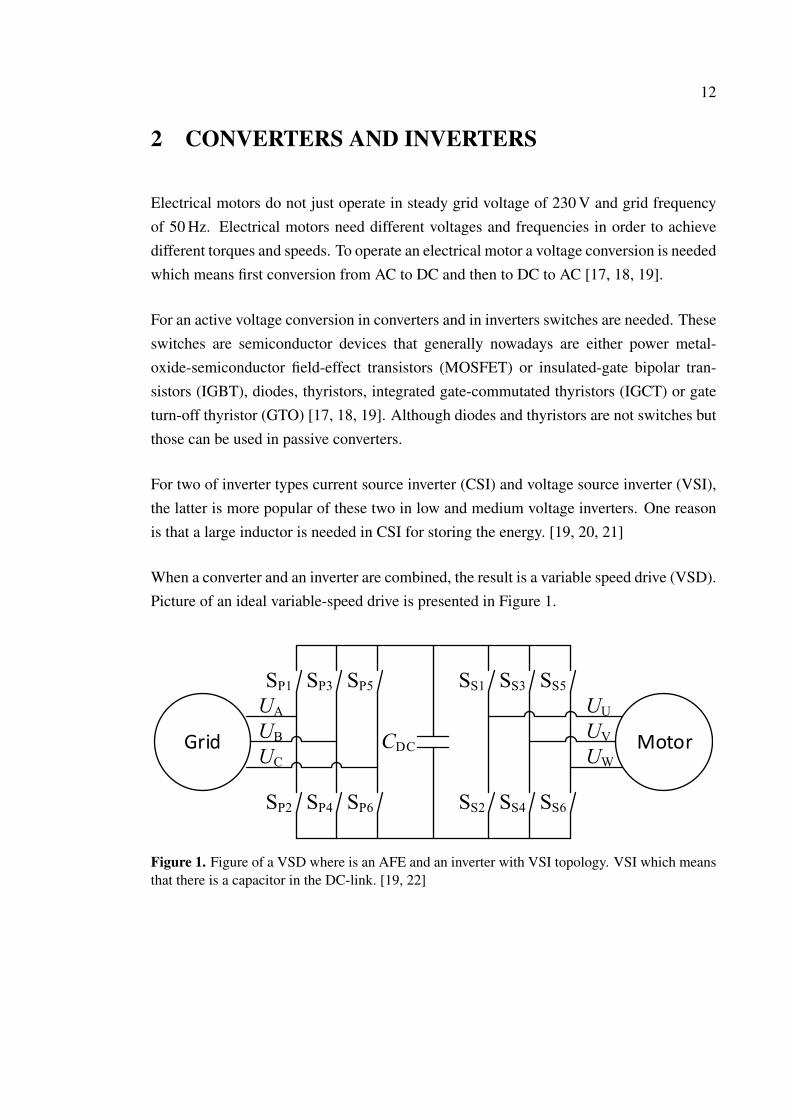
Converters change AC-voltage to DC-voltage with an amplitude depending, on the topol-ogy, switch control and if the DC-voltage is boosted or lowered. An ideal VSI converteris presented in Figure 2.
SP1 SP3 SP5
UA
UB
UC
CDC
SP2 SP4 SP6
UDC+
UDC-
Figure 2. Three phase ideal converter with six ideal switches [19, 22]. The converter changesAC-voltage to DC-voltage.
The simplest way to construct a converter is to use semiconductor devices called diodeswhich are passive components. When using diodes or thyristors the converter is called arectifier as the power can only flow to one direction. Other semiconductor devices need asome form of a control which generally done with a pulse width modulation (PWM) [17,18]. The main purpose of the converter is to produce a correct DC-link voltage to be usedfor an inverter in the motor side. This is done either using the voltage from the grid orfrom a generator.
Converter that uses switches is also known as an active front end (AFE) which is a devicethat acts as a bidirectional power conversion. That enables power flow back to the grid ina situation when the electrical motor is braking. Other purpose of the AFE is to work asan active filter to improve power quality since it is controlled. [22, 23, 24, 25]

14
2.2 Inverters
Inverters are for motor control. The purpose of inverters is to generate voltage and fre-quency to drive the electrical motor from the DC-link voltage. The frequency of thevoltage impacts on the speed of the motor and current to the torque the motor is produc-ing. The basic concept of VSI inverters is presented in Figure 3 which includes a DC-linkcapacitor and six switches.
CDC
UU
UV
UW
SS1 SS3 SS5
SS2 SS4 SS6
UDC+
UDC-
Figure 3. Three phase ideal VSI with six ideal switches [19, 22]. Inverter does the opposite toconverter and that is DC-voltage to AC-voltage.
Inverter has to always use active switches to create AC-voltage. If controlled correctly,inverter can act as a converter when the motor is braking, feeding energy to the DC-link.
2.3 PowerMASTER M-frame
The PM is a power electronics device that can operate as an inverter, a converter or anAFE. The device is water cooled medium-voltage semiconductor device, single devicedesigned for powers up to 300 kW and mainly for drive drains in work machines andmarine vessels, but can be used in any application its power range [26]. The PM has owncontrol program called PowerUSER where references and parameters can be changedaccording to the application and the operation of the PM. A picture of the PM is presentedin Figure 4.

15
Figure 4. Visedo Oy’s PowerMASTER M-frame. The device has connections for DC-link, threephase AC-voltage connection, cooling liquid connections, AMPSEAL 35-pin connector and amaintenance port.
The PM can be used in other application than mentioned early, only limit is the power. Thedifferent environments presents different challenges to the design of the device. Whereasin industrial applications the device is placed in a rather steady environment, compared tothe changing environment in automotive applications.
The cooling of a power electronic device must be done right because in higher powersthe device also produces more heat than in lower powers. The compactness also effectsto the ability of the device to dissipate heat because there is less room for free and forcedconvection. The compactness and the amount of electrical power are the reasons thatthe PM is liquid cooled. The PM can operate with coolant temperature of 75 C and thecoolant flow of minimum of ten litres per minute [26].
2.3.1 Industrial applications
Industrial environments are mechanically steadier than automotive because the device isplaced for example in racks or cabinets which might be bolted to the ground. The ambienttemperature is steady if the device is placed inside a building. The exposure to differentchemicals is narrower compared to the automotive since devices are placed in closed

16
environments.
The electrical stress can be constant but in large industrial complexes that might producea problem. That is because multiple devices with multiple switches exists, and so thegrid harmonics may also exists. That cause problems to other electrical devices that areconnected to the grid of the industrial complex. Filtering prevents and minimizes thisphenomena which is done in passive filtering, active filtering or combination of both.
2.3.2 Automotive applications
An applications for automotive industry faces a constantly changing environment. Thecause for this is that road vehicles are used in and kept at the mercy of the nature. Drivingin cold and dry climate or hot and moist have a different effect to all equipment on boardthe vehicle, which also means to the electrical equipment.
The condition of the road causes mechanical stress to the parts of the vehicle. It can beconstant vibration due the road or from the ruggedness of the tires. Also bumps and holeson the road causes sudden forces to devices on board.
The location of the device might vary but generally the power electronics are not placedinside the passenger compartment. This effects to chemicals and compounds that thedevice might encounter.
The EMC and the EMI problems are effecting only to the vehicle and its devices duringthe drive. The vehicle itself acts like a Faraday cage, preventing problems with EMI butcausing possible EMC inside the vehicle. The EMC problems might be conducted to thegrid when an EV or an HEV is connected to the grid for a battery recharge.

17
3 ISO 16750
The ISO 16750 is aimed for electrical equipment in vehicles that operate on the roads.The purpose of the ISO 16750 is to simulate situations and conditions of which the deviceunder the test (DUT) might encounter during its life cycle. These includes: where thevehicle is driven, in what climate it is driven, type of the vehicle, operation modes of thevehicle, life cycle of the device and the supply voltage. [27]
The standard ISO 16750 consists of five parts. These parts are: part one - General, parttwo - Electrical loads, part three - Mechanical loads, part four - Climatic loads and partfive - Chemical loads. [27]
In the part one, the general test conditions are given, which are room temperature (RT) of(23± 5) C and relative humidity between 25 % and 75 %. These also includes mountinglocation for example engine compartment or passenger compartment. How the device isconnected, the supply voltage of the device and the functionality mode of the device aredescribed in the part one. As are functionality statuses which are presented in Table 2. [27]
Table 2. Functionality statuses for the DUT during the tests [27].
Class DescriptionA The DUT performs as designed during and after the test.
BThe DUT performs as designed during but one or more functions can
exceed the tolerance limit. The DUT returns to normal operation after thetest. The memory functions must remain in class A.
COne or more functions of the DUT can be out of operation but return
automatically to normal operation after the test.
DOne or more functions of the DUT can be out of operation and The DUTdoes not return automatically to normal operation after the test. The DUT
needs a reset to return normal operation.
EOne or more functions of the DUT can be out of operation and the DUT
needs repairing or the whole DUT needs to be replaced.
3.1 ISO 16750–2 Electrical loads
In this thesis the focus is on the part two - electrical loads of the standard ISO 16750excluding the EMC test. The tests are described in this section. These tests include two

18
tests from ISO 16750-4 Climatic loads, as last two tests needs to be done after damp heatcyclic test described ISO 16750-4.
Unless otherwise specified, the general conditions are applied which are RT of (23± 5) Cand relative humidity between 25 % and 75 %. The maximum temperature tmax is de-fined as 105 C [28]. The tolerances for the tests are, for voltages ± 0.2 V, for resistances±10 %, and for the frequency and the time ± 5 %, unless stated otherwise. The generaltest setups for DC-voltage and AC-voltage are presented in Figures 5 and 6.
DUT-
+
+
-V
PC +HVDC
DC supply Voltmeter
UU
UV
UW
-HVDC
L3
L2
L1
Figure 5. The general test setup with DC-voltage supply.
DUTL1
L2
L3
-
+PC +HVDC
UU
UV
UW
-HVDC
Function
generatorOscilloscope
Figure 6. The general test setup for AC-voltage as supply voltage.
The tests are to simulate a real vehicle events and failures that can occur during the vehicleoperation. These are for example start up of the vehicle, failure in battery connectionwhile it is recharged or wrongly connected battery.
Devices that are part of the vehicle’s voltage supply system are alternator, regulator and
19
battery. The alternator is a generator that is connected to the battery via voltage regulation.The regulator is a device that makes a voltage transfer from the alternator’s AC-voltage toDC-voltage for the battery and devices of the vehicle.
3.2 Direct current supply voltage
The PM is tested with minimum and maximum supply voltages. The minimum US being10 V and the maximum 32 V [29]. The PM is run as in normal operation and class A mustbe attained [29]. The test uses the general test setup for DC-voltage presented in Figure 5.
3.3 Overvoltage
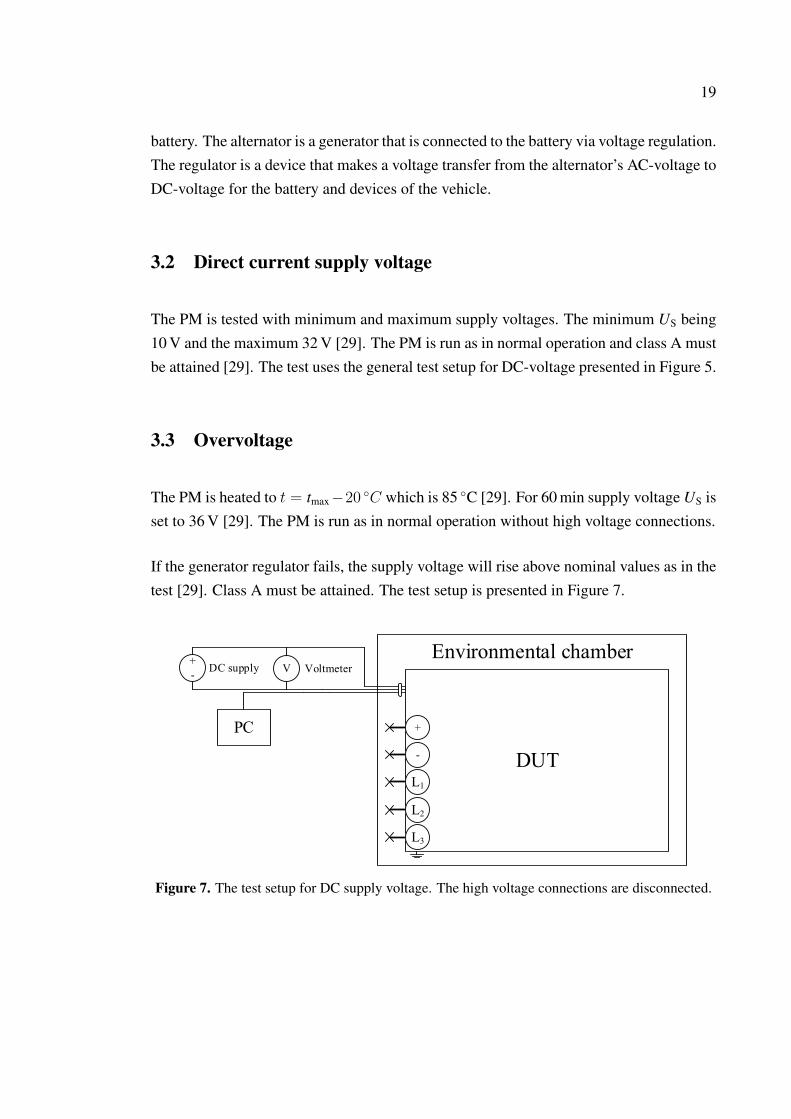
The PM is heated to t = tmax−20 C which is 85 C [29]. For 60 min supply voltage US isset to 36 V [29]. The PM is run as in normal operation without high voltage connections.
If the generator regulator fails, the supply voltage will rise above nominal values as in thetest [29]. Class A must be attained. The test setup is presented in Figure 7.
DUT-
+
+
-V
PC
DC supply Voltmeter
L3
L2
L1
Environmental chamber
Figure 7. The test setup for DC supply voltage. The high voltage connections are disconnected.

20
3.4 Superimposed alternating voltage
The PM is supplied with AC-voltage of 10 V AC-component with DC offset of 27 V,maximum voltage being 32 V. The AC-component is set to start from 50 Hz and is risento 25 kHz in 60 s, and back down to 50 Hz in 60 s. The total time of one sweep is 120 s andthe total amount of sweeps done in this test is five. The internal resistance of the powersupply must be within the range of 50 mΩ-100 mΩ. [29]
The purpose of the test is to test the PM’s ability to withstand residual AC-voltage in theDC-supply [29]. Class A must be attained. The test setup is the general test setup forAC-voltage presented in Figure 5.
The AC-voltage in the supply voltage is caused by the regulator not working as designed.That means the regulator does not correctly regulate the voltage to DC-voltage.
3.5 Slow decrease and increase of supply voltage
The US is set to 10 V. Then the voltage is decreased to 0 V with linear rate of (0.5±0.1)V/min or steps size of 25 mV or less.
If an electronic device is left on in the vehicle while engine is not running, the battery willexhaust. The battery starts from the state where it is not much of the charge to start from.Class A must be attained at 10 V and class D for lower values. A stricter functionalityclass C can be used instead of class D. The test setup is general test setup for DC-voltagewhich is presented in Figure 5.
3.6 Momentary drop in supply voltage
The test voltage of 10 V US is set to US. The voltage is dropped to 9 V in 10 ms or lessand back up in same 10 ms or less. The total dwell time is 100 ms. [29]
When a conventional fuse is melted in another circuit which the power supply supplies,it causes a voltage drop for the rest of the systems. This test is for simulating this situa-tion [29]. Class B must be attained. The test setup is presented in Figure 8.

21
DUTL1
L2
L3
-
+PC +HVDC
UU
UV
UW
-HVDC
Oscilloscope+
-DC supply
Figure 8. The test setup for DC supply voltage. The PM is operated as in normal operation.
3.7 Reset behaviour at voltage drop
The test is done starting from US,min of 10 V and the voltage is lowered according to
US = (20 − n)×0.05×US,min (1)
In the equation (1), n starts from 1 and goes up to 20 with steps of one. The voltage isheld down for five seconds and it is brought back to US,min for at least ten seconds [29].During that time functionality of the PM is checked.
This tests the behaviour if the PM during a different voltage drops [29]. Class C mustbe attained during the test. The test setup is general test setup for DC-voltage which aspresented in Figure 5.
3.8 Starting profile (Cranking impulse)
Cranking is term for ICE start up operation where the start motor is turned on withsolenoid. Cranking impulse is what is seen in the supply voltage during that time. Thestarting profile voltage waveform is presented in Figure 9.

22
U [V]
t [ms]
10
10
6
28
50 50 1000 40
2
Figure 9. The supply voltage profile for starting profile test. The frequency during the voltage of28 V is 2 Hz. This test is run ten times with a pause of 1–2 s in between. [29]
This test presents a situation what happens during cranking and after it. Pause of 1–2 sis recommended in the total of ten cycles. The frequency during the voltage of 28 V is2 Hz. Class B must be attained during the test. The test setup is the general test setup forAC-voltage presented in Figure 6. [29]
3.9 Load dump
The internal resistance Ri of load dump has to be 1–8 Ω [29]. The internal resistance canbe calculated with the equation
Ri =10 × Unom ×Nact
0.8 × Irated × 12000 min−1(2)
In the equation (2) Unom is the voltage of alternator, Irated is the current of the alternator atspeed of 6000 min-1 and Nact is actual alternator speed per minute. [29]
The test waveform and the parameters are presented in Figure 10.

23
U [V]
t [ms]
28±0.2
a
b
151-202
100-350
65
139-185
40-45
5-10
Figure 10. Test pulse for load dump test. The curve a is with non-centralized load dump and curveb is with the centralized load dump. [29]
The rise time, at the time of 5–10 ms, voltages are defined by equation
Urise = pct ∗ (Umax − Us) + Us (3)
Where in the equation (3), pct is 10 % for lower value or 90 % for upper value, Umax is151 V or 202 V, and Us is 28 V.
Class B must be attained during the test [29]. The test setup is the general test setup forAC-voltage presented in Figure 6 [29].
This test simulates a phenomena when battery is disconnected from the alternator. Thiscauses a voltage spike to the rest of the systems that are connected to battery and alterna-tor.
3.10 Reversed voltage
Test is done with US of 28 V with reversed polarity. The reversed polarity is kept for(60±6) s. Class A must be attained after fuses have been replaced. The test setup uses thegeneral test setup for AC-voltage presented in Figure 5. [29]
The test ensures that the PM is still operational if the supply voltage is accidentally con-nected in opposite polarity.
24
3.11 Ground reference and supply offset
Every output and input are connected to their right loads and networks. The supply volt-age US is set to 28 V. An offset voltage of (1.0±0.1) V is set to every ground/supply lineseparately in sequence. The PM must also be tested with reversed offset voltage. [29]
This test mimics a situation where multiple power supplies are present, like signal groundand supply voltage ground [29]. The functionality of the PM is tested after every offsetvoltage is applied. Class A must be attained during the test, and there cannot be anymalfunctions or latch ups. The test setup is the general test setup for DC-voltage presentedin Figure 5.
3.12 Open circuit test
The PM is connected as in normal operation and a contact is opened for (10±1) s. Theopen circuit resistance must be at least 10 MΩ. The functionality is observed during theinterruption. Every relevant connection must be tested. [29]
Test simulates a situation when there is an interruption in the signal circuit [29]. ClassC must be attained during the test [29]. The test setup is the general test setup for DC-voltage presented in Figure 5. The 10 MΩ ensures that a connection is disconnected sincecarrying even 1 mA current over 10 MΩ would need a voltage of 10 kV. Because U = R×I.Even a higher voltage is needed to carry more current.
3.13 Signal circuits
Every relevant input and output is connected to voltage of 32 V for (60±6) s. Other con-nections can be open. This test is done to connected supply voltage and ground terminalswith outputs active and inactive, to disconnected supply voltage, and to disconnectedground terminals. [29]
This test’s purpose is to ensure the case when supply voltage is accidentally connectedto wrong input or output. Class C must be attained during the test. The test setup is thegeneral test setup for DC-voltage presented in Figure 5.

25
3.14 Load circuits
The PM is supplied with US of 28 V and load circuits must be in operation. If fuses areused the test duration can be found in ISO 8820 (operating time rating) with the uppertolerance 10 %. If other than fuses are used, the test duration will be agreed betweenmanufacturer and user. The load circuits must be operational. [29]
Every electronically protected outputs must withstand the currents by corresponding pro-tection and attain the class C. With fuses class E is acceptable and fuses can be replaced.Every unprotected outputs must attain class E and the device must meet the requirementsflammability of UL94-V0. [29]
The test uses the general test setup for DC-voltage presented in Figure 5.
3.15 Damp heat cyclic test
This test is done prior to tests withstand voltage and insulation resistance. The tempera-ture and humidity curves are presented in Figures 11 and 12.
45 120 45 90
30 30
55±3
25±3
T[°C]
t [min]
300
Figure 11. The temperature curve used in damp heat cyclic test. The test is performed before thetests withstand voltage and insulation resistance. One cycle lasts 300 minutes. [28]

26
3030
RH [%]
t [min]135 90
300
9895
55
100
50
80
45
Figure 12. The humidity curve used in damp heat cyclic test. The test is performed before thetests withstand voltage and insulation resistance. One cycle lasts 300 minutes. [28]
One cycle lasts 300 minutes and the cycle performed to the PM in total of six times. Atthe maximum temperature (55±3) C the supply voltage US is set to (28±0.2) V and thePM is run as in normal operation. [28]
3.16 Withstand voltage
This test is performed after the damp heat cyclic test. The PM is kept in RT for 30 minafter the damp heat cyclic test. [29]
A test AC-voltage of 500 V RMS and frequency of (55±5) Hz is applied for 60 s to be-tween terminals with galvanic isolation, terminals and housing with conductive surfacewith galvanic isolation, and terminals and an electrode wrapped around the housing incase of plastic housing. [29]
The test verifies the PM’s ability to withstand the dielectric voltage capability with gal-vanic isolation. This test is done to systems and equipment that contain inductive elementsor is connected to inductive load. Class C must be attained during the test and no dielectricbreakdown nor a flashover can occur. [29]
Dielectric breakdown means that the insulating material has become conductive. Flash-

27
over on the other hand stands for insulating material becomes temporarily conductive thatan arc of electricity passes through the insulator.
3.17 Insulation resistance
This test is performed after the damp heat cyclic test. The PM is kept in RT for 30 minafter the damp heat cyclic test. [29]
An DC-voltage of 500 V is applied for 60 s to between terminals with galvanic isolation,terminals and housing with conductive surface with galvanic isolation, and terminals andan electrode wrapped around the housing in case of plastic housing. [29]
The test verifies that the minimum ohmic resistance is met to avoid current between gal-vanic isolated circuits and conductive parts in the PM [29]. The insulation resistance mustbe greater than 10 MΩ.
The test checks that galvanically isolated circuits are still isolated from each other. As theDC-current should not be transferred between galvanically isolated circuits.

28
4 PRELIMINARY TESTS FOR POWERMASTER M-FRAME
The control of the PM can be done with two Controller area networks (CAN), five userIOs or encoder. Other connections of the PM are three external PT100, two syncs for mas-ter/slave, power on, two stops signals, 5 V output, HV loop, two RS485, LVDS, resolver,ground connections and supply voltage connection.
The general functionality needs to be tested first. This is done to verify that the PMis working as intended. These tests shows parameters and signal values which can beobserved and compared during the tests based on standards.
4.1 Power on and stop test
The first thing to test is that the PM powers up and that it operates in the supply voltagearea as specified. The testing that software is correctly downloaded to the PM must alsobe done. This also includes that the voltage limits for the power on and the stop signalsare correct. Testing with a supply voltage higher than 5.5 V and lower than 36.7 V asthose are the overvoltage and undervoltage limits specified in hardware.
The overvoltages and undervoltages are checked in surge protector. The surge protectoruses threshold voltages for overvoltages and undervoltages where the voltage is checkedwith voltage divider from the supply voltage.
The stop signals are for manually stopping the PM. These acts as an emergency switchesin a case when the user needs to shutdown the PM.
The power on has to be connected to the supply voltage. This signal is for a surge protectorto open the supply voltage line to the rest of the device. A voltage from CPU power onis connected to power on comparator. The reason for this is that the CPU would do its ongoing calculations before it is shutdown.
In order to get the PM to working condition it needs a bootloader downloaded to the flash.After that the software can be downloaded to the FPGA.

29
4.2 Current measurements and overcurrent trigger test
When a current travels in a conductor it creates a circulating magnetic field accordingto ampère’s law. The strength of the circulating magnetic field is a proportion to thecurrent. This magnetic field changes the path of the charge carries in hall effect sensor,creating a voltage difference in it [30, 31]. This voltage can be measured through voltagecomparators to analog to digital converter to microprocessor, field-programmable gatearray (FPGA) or application-specific integrated circuit (ASIC).
The current measurement is tested by supplying current through a hall sensor called LEMwhich is a device that measures current from a wire that is pulled through the LEM loop.To get higher current measurement than the supply voltage can provide, the wire be pulledthrough the LEM multiple times. The current passed through the LEM is multiple to thecurrent that passed in the wire. That way there is no need for HV connection for this test.The LEM uses hall effect to measure the current.
A conformation that the PM triggers at the event of overcurrent if a current that is highenough is passed through the LEM. This and the measurements are tested in every phase.The currents and triggers points are also measured to both direction of the current. It ispossible to simulate the overcurrent by providing a voltage directly to the measurementin the printed circuit board (PCB).
4.3 The DC-link voltage measurement and overvoltage trigger tests
A voltage is measured from the DC-link. The voltage measurement and overvoltage trig-ger levels are investigated. This is done by either providing high voltage to the DC-link.If this is not possible a voltage can be applied directly to the PCB where the voltagemeasurement is done.
The DC-link voltage is monitored via serie resistors through an operation amplifier to aanalog to digital transform. The corresponding voltage at 1182 V is 3.3 V at input of theoperation amplifier. The DC-link overvoltage is dimensioned to trigger above 1067 V anduntrigger below 1037 with a push-pull output comparator.

30
4.4 The enclosure voltage measurement test
An enclosure is a shield that covers the electronics and the connections inside the PM.The purpose of the enclosure is to protect inner parts from dust, water, tools or humanparts, and to shield from the EMI and protected emitting the EMI.
In case of a high voltage is somehow connected to the enclosure, meaning that the enclo-sure is not shielding from electricity as it designed to. Then this measurement indicatesthat and triggers the PM to shutdown the switching process. The enclosure voltage mea-surement is tested by supplying voltage to DC-link or directly to measurement on thePCB. The enclosure voltage is a voltage from DC-link through 12 Mω of resistance to theenclosure of the PM.
The enclosure voltage is monitored through an operation amplifier to an analog to digitaltransform. The corresponding enclosure voltage at 1203 V is 3.3 V at input of the opera-tion amplifier. The enclosure voltage does not have a hardware trigger as phase currentsand the DC-link voltage do.
4.5 The short circuit trigger event
The short circuit means that a non-intended connection is added in parallel which adds anew path for a current to flow. The total resistance of the circuit after it is shorted is atmaximum the smaller resistance of the two. The higher current caused by short circuitcan destroy components and connections before the point of the shorted circuit. Thecomponents before the surge stopper current measurement are dimensioned to withstanda current of 5 A.
The short circuit is tested with connecting a load from the surge stopper current measure-ment to the ground. In this case the load is Aim-TTi LD300 DC electric load. The shortcircuit current should be at 5 A.
4.6 IGBT and external PT100 temperature measurement test
The initial temperature test is done in RT, checking that measurements show correct valuein that temperature. This is done by placing the PM inside an environmental chamber

31
near the RT. Also the thermal resistance is calculated from the results.
The external PT100s and the PM is heated and cooled in a environmental chamber tocheck that IGBT temperature and external PT100 measurements are correct. The IGBTshave their own PT100 for the temperature measurement.
4.7 Auxiliary voltage output tests
The PM has 5 V output for auxiliary devices. These are tested in a way that they pro-duce the correct voltage and that those are protected from overloads. The current limit isdesigned to be in the range of 200–400 mA.
The test is performed with 5 V output is connected to a load via a current measurement.For 5 V, the 200 mA is reached when the load is 25 Ω and 400 mA with load of 12.5 Ω.
4.8 The communication tests
The sync link is for operation when two or more same type devices are connected inparallel. In that way those can provide an additive to the power to one device can produce.By syncing the devices means that they are run with same control that their voltages andcurrents are in same phase enabling the parallel drive.
All the five user IO channels are tested as digital inputs and outputs. Every channel withexception to the fifth channel, is tested and analog inputs. The fifth channel does not havehardware support for the analog measurement.
The test is done so that every operation mode of the specific user IO pin is tested. This isdone by setting one of user IO pins as an input and one as an output.
The CAN communication is tested with baud rates of 100 kbit/s, 250 kbit/s, 500 kbit/s and1000 kbit/s. The test is performed with J1939 V2 protocol. The PM is started and stoppedwith the CAN by switching a bit in P-CAN view program. The correct value is observedwith different communication port, in this case PDP with PowerUSER. Bus errors areobserved with P-CAN view.

32
4.9 The resolver test
The purpose of the test is to verify that the PM is capable to run an electrical motorand to test that the PM can run it in a closed loop with a resolver. The motor used isPowerDRUM XXSE synchronous reluctance assisted permanent magnet electric drivewith nominal values: 500 V, 190 Hz, 1900 RPM, 110 A, 89 kW and cos φ of 0.99. Thetest script is presented in Appendix 1.
The resolver is tested with the voltage ramp test starting from 0 RPM with 10 Nm as aload or from 60 RPM with 461 Nm as a load with step of 5 RPM. One step lasts for 15 sand the test ended at 1900 RPM. The sample time is set to 10 Hz.
As the load increases the higher the current is that the PM provides to the motor. Duringthe test, the IGBT and motor temperatures are observed, especially with torque of 461 Nmas higher the torque the more does the system heat up. The load side values are alsomeasured to have a reference to the values of the PM.
The PM can measure the angle of rotor in the electrical motor or generator with a resolver.The resolver operates in pairs and those are referred as a sine and a cosine since those arein an angle of π
2apart from each other. The reason why resolver uses a pair is that one
part gets same value of the angle twice per rotation. For example at zero and π the sinegets the value of zero but the cosine gets values of one and minus one.

33
5 PRELIMINARY TEST RESULTS
The results of the preliminary tests to the PM are presented in this section. These testsindicates that the PM is ready for tests based on standards and to become a device thatcan be mass produced. The voltage source for supply or other connection was providedby Aim TTi CPX400DP unless otherwise stated.
5.1 Power up and stop test
The power on was observed in schematics and couple of changes must be made in orderto make power on operational. The power on is presented in Figure 13.
0603
0603
0603
GND
Vs
-
+
1.242V
TLV3011AIDBVT
0603
1206 0603
0603SMAJ24
24V
BZX84-B5V1
5V1
BZX84-B5V1
5V1
0603
1206
POWER_ON
R5 39K
R72K2
TP13
TP19
R17 10KVOUT_3V3
VOUT_3V3
SHDN
POWER_ON_ST
POWER_ON_ST
3
1
2
6
4
5
U4
C251
100N
8K2
R3
220K
R34
C386
1N
D7
13
D22
13
D94
82K
R72
R4
3K3
ON @ 5.74V OFF @ 5.16V
2K22K2
PDTC123ET
T122
2
3
1
BAV99
1 2
3
D97
POWER_ON_CPU
Figure 13. Power on circuit with voltage comparator.
The comparator output should be connected to comparator’s supply voltage with largerpull-up resistor than 2.2 kΩ. During the power on the transistor’s T122 pin three is con-nected to ground via pin two. This also means that SHDN signal is also connected tothe ground. As the shutdown signal is also connected to surge protector, the voltage ofthat pin goes under 2.2 V, the surge protector shuts down. In order to prevent that fromhappening, the transistor T122 is removed and pins one and three are connected. Also theresistor R17 is removed due limiting the voltage provided for SHDN.
The bootloader was successfully downloaded with CAN to the flash after a modificationto the PCB. The inverted CAN enable signal was connected to flash inverted write protect.It means that when the flash were tried to be updated with CAN, it also prevented down-loading software to the flash. The flash inverted write protect was disconnected from the
34
inverted CAN enable and connected to 3.3 V voltage.
In the temporarily fixed version the CPU shuts down when the voltage supply is discon-nected. In order that not to happen a new version of the power on has to be designed.In this version the power on and shutdown are measured with Agilent U1242B and thoseevent occurs for power on at around 6.00 V and shutdown at around 5.85 V. The shutdownat high voltage happens at 32.6 V. Inspection of the schematic revealed that the overvolt-age of the surge protector is 36.7 V but it is then limited to 33.1 V later in the supplyvoltage circuit.
For the updated version a totally different power on schematic is proposed. This has tobe tested again with the fixed power on. The overvoltage needs to be set higher after thesurge protector circuit.
5.2 Current measurements and overcurrent trigger test
Currents were measured by supplying a current through LEMs with a voltage supply AimTTi QPX600DP. A wire with cross section of 0.75 mm2 was pulled through LEMs by 20times.
The initial observation with the current measurements in PowerUSER showed a thirdlower current as it should have been. This is due the change from 400 LEMs to 600LEMs. This gain was corrected in software before the test was proceeded.
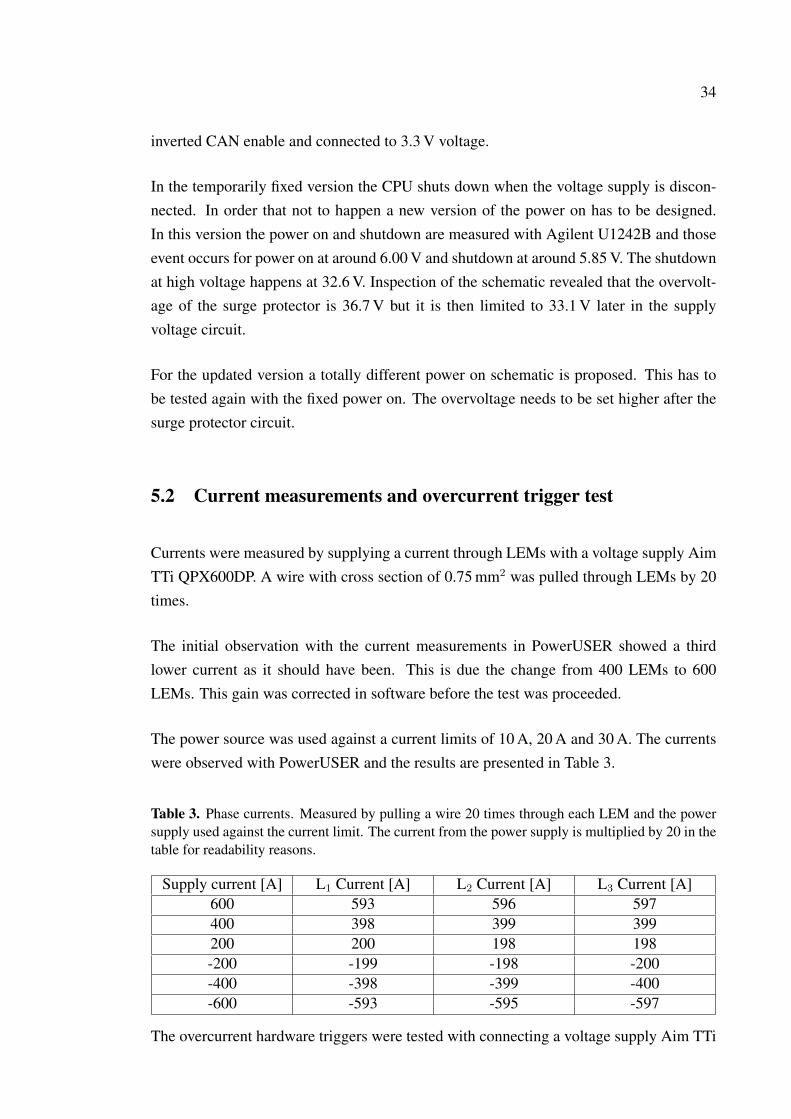
The power source was used against a current limits of 10 A, 20 A and 30 A. The currentswere observed with PowerUSER and the results are presented in Table 3.
Table 3. Phase currents. Measured by pulling a wire 20 times through each LEM and the powersupply used against the current limit. The current from the power supply is multiplied by 20 in thetable for readability reasons.
Supply current [A] L1 Current [A] L2 Current [A] L3 Current [A]600 593 596 597400 398 399 399200 200 198 198-200 -199 -198 -200-400 -398 -399 -400-600 -593 -595 -597
The overcurrent hardware triggers were tested with connecting a voltage supply Aim TTi
35
CPX400DP to comparators inputs. The voltages presented were observed from the supplyvoltage. In the overcurrent measurement, another comparator observes a voltage higherthan 3.176 V and another lower than 0.167 V as these voltage limits stand for currents of750 A and -750 A. The hardware triggers occured at 0.19 V and 3.20 V. Also noted thatwhen a LEM is disconnected from the PCB the current measurement shows 811 A whichalso causes overcurrent trigger event. These trigger events also stopped the modulation.
5.3 The voltage measurements and overvoltage trigger tests
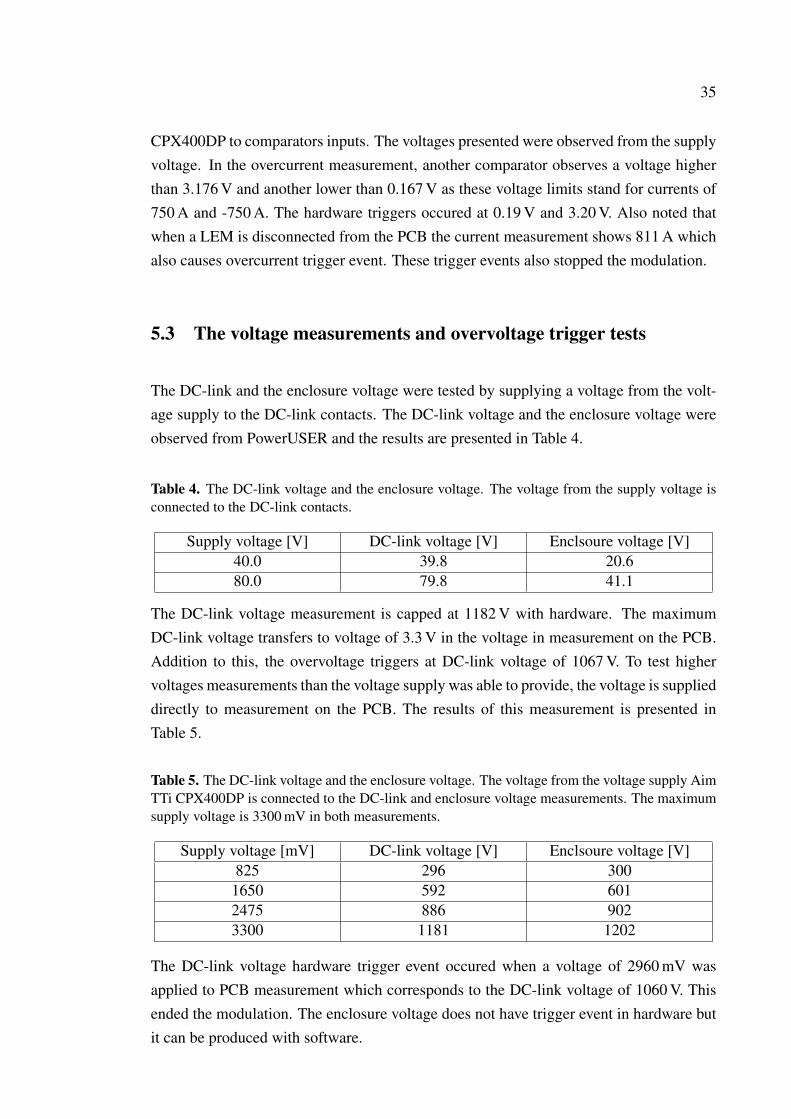
The DC-link and the enclosure voltage were tested by supplying a voltage from the volt-age supply to the DC-link contacts. The DC-link voltage and the enclosure voltage wereobserved from PowerUSER and the results are presented in Table 4.
Table 4. The DC-link voltage and the enclosure voltage. The voltage from the supply voltage isconnected to the DC-link contacts.
Supply voltage [V] DC-link voltage [V] Enclsoure voltage [V]40.0 39.8 20.680.0 79.8 41.1
The DC-link voltage measurement is capped at 1182 V with hardware. The maximumDC-link voltage transfers to voltage of 3.3 V in the voltage in measurement on the PCB.Addition to this, the overvoltage triggers at DC-link voltage of 1067 V. To test highervoltages measurements than the voltage supply was able to provide, the voltage is supplieddirectly to measurement on the PCB. The results of this measurement is presented inTable 5.
Table 5. The DC-link voltage and the enclosure voltage. The voltage from the voltage supply AimTTi CPX400DP is connected to the DC-link and enclosure voltage measurements. The maximumsupply voltage is 3300 mV in both measurements.
Supply voltage [mV] DC-link voltage [V] Enclsoure voltage [V]825 296 300
1650 592 6012475 886 9023300 1181 1202
The DC-link voltage hardware trigger event occured when a voltage of 2960 mV wasapplied to PCB measurement which corresponds to the DC-link voltage of 1060 V. Thisended the modulation. The enclosure voltage does not have trigger event in hardware butit can be produced with software.
36
5.4 The short circuit trigger event
The DC load Aim-TTi LD300 was connected from output of current sensing resistor inthe power surge stopper and to the ground. The current of the DC load was increased untilthe hardware trigger event occurred.
The measured current in the DC load was 3.91 A at the event of the trigger. Adding thecurrent consumed without the DC load, 0.35 A, the short circuit current is 4.26 A. Theshort circuit protection current falls short from the designed current which is 5 A.
5.5 Stop signals test
The stop signals were tested in RT. With both signals the shutdown occurred at 2.22 Vand start was prevented until stop signals at least had a voltage of 3.45 V.
Both signals were tested separately, meaning that other signal was connected to supplyvoltage. Also the test yielded the same results when both signals were together connectedto the test voltage.
5.6 IGBT and external PT100 temperature measurement tests
The test is proceeded by first setting the PM in RT and measuring the temperature pro-duced by the PM itself without high voltage or cooling connections. RT, high and lowtemperatures are used to test PT100 measurements in the IGBTs and external temperaturemeasurements. Also the DC-link voltage, the enclosure voltage and the phase currentsare observed. The start and the stop are tested with different voltages in high and lowtemperature. Stop signal voltage levels are also checked at high and low temperatures.The values were observed and saved to a file from PowerUSER.
The environment chamber used was Climats 1192H40/3. It could provide the minimumtemperature of -27.5C and the high temperature used was 105C. The PM is placed onthe bottom of the environmental chamber, next to its own temperature measurement. Theexternal PT100 measurements are placed on the top of the PM.
During the tests IGBT and external temperatures, DC-link voltage, enclosure voltage and
37
phase currents are measured. The reason for other than temperature measurements areobserved is that there might be effects to measurements by the temperature change. Tem-peratures are observed as those should show the value close to the environmental chambertemperature.
5.6.1 Temperature test in RT
The PM was placed in the 20 C for a time until the temperature was stabilized in thetemperature measurements of the PM. There was no supply voltage during the stabilizingperiod except when the temperatures were checked. This was done by applying supplyvoltage to the PM and checking the temperatures. The supply voltage was shutdown rightafter the temperatures were measured.
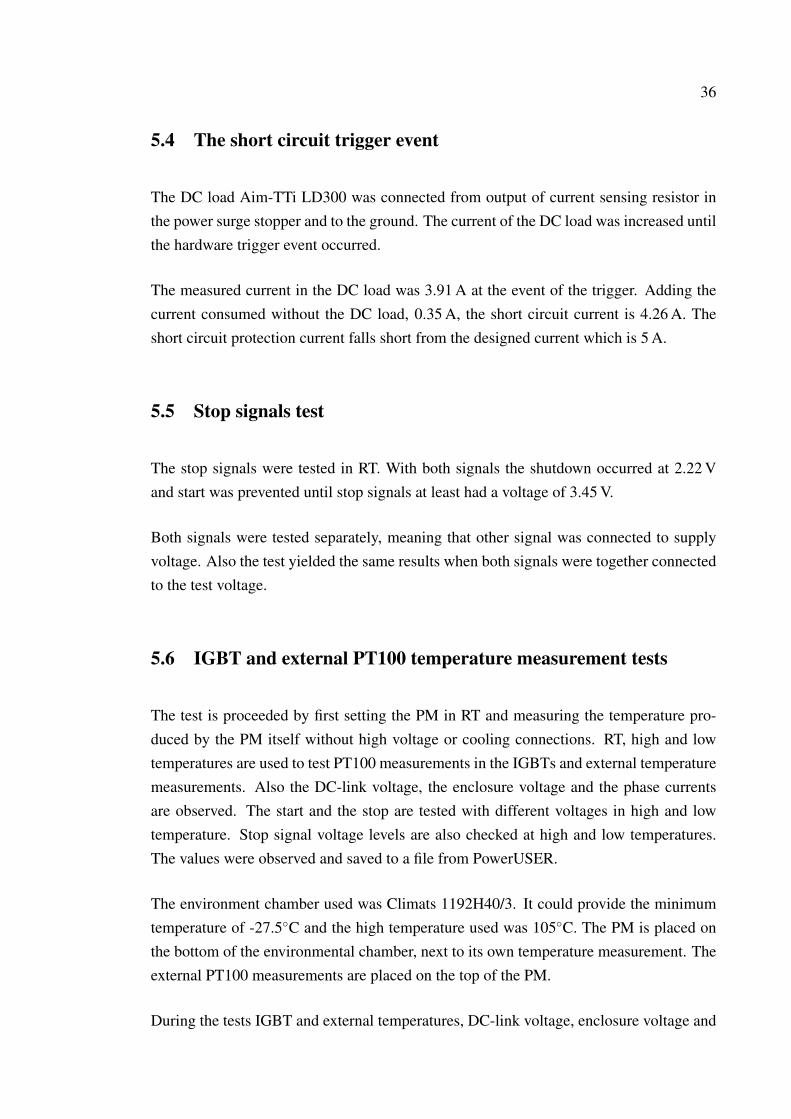
The temperature was checked once in a 15 minutes. If there was no temperature changelarger than ±0.1 C, the PM was ready for the test. When the temperature was stabilizedthe voltage supply was connected with voltage of 24 V and the modulation was turned on.The results of this test is presented in Figure 14.
38
-3-2.5
-2-1.5
-1-0.5
00.5
11.5
0 10 20 30 40 50 60 70
Cur
rent
[A]
Time [min]
2468
10121416
0 10 20 30 40 50 60 70
Volta
ge[V
]
Time [min]
1920212223242526
0 10 20 30 40 50 60 70
Tem
pera
ture
[C
]
Time [min]
Figure 14. The results of power on in 20 C. In the uppermost figure three phase currents areshown. In the middle figure is seen DC-voltage as red trace and enclosure voltage as blue trace.In the lowest figure the temperature measurements are presented. The IGBTs temperatures are theblue traces and external PT100 measurements are shown as red traces.
The DC-link offset decreases by 0.5 V. Also in enclosure voltage a decreasement of 0.2 Vis seen. A difference of 4.5 is visible in between of IGBT temperetures and externalPT100 measurements at the begin of the test. The IGBTs heat up during idle state ap-proximately 1.8C.
The fluctuation of the external measurement is a result of the environmental chambertrying to keep its temperature at the 20 C. The device consumes at idle run state withmodulation on a current of 450 mA. The voltage used was 24 V, this leads to power of10.8 W which is turned to heat of 1.8C. This gives the thermal resistance of the PM0.167 C/W without liquid cooling.
5.6.2 Temperature test in low temperature
The PM was placed in the environmental chamber with the supply voltage of 24 V and thetemperature is set to -40 C for getting as low as possible. The environmental chambercould reach the minimum temperature of -27.5 C. the PM is operated as in idle state

39
but modulating during the whole test. The results of this test are presented in Figure 15with the start temperature of 12.8 C measured at the environmental chamber temperaturemeasurement with Agilent U1242A.
When the temperature has been stabilized, the stop signal voltage levels are investigates.Also the PM is started at stopped ten times in each voltage level of 10 V, 24 V and 32 V.
-2.5-2
-1.5-1
-0.50
0.51
1.52
0 50 100 150 200 250
Cur
rent
[A]
Time [min]
3456789
0 50 100 150 200 250
Volta
ge[V
]
Time [min]
-30-20-10
01020
0 50 100 150 200 250
Tem
pera
ture
[C
]
Time [min]
Figure 15. The results of low temperature test. In the uppermost figure three phase currents areshown. In the middle figure is seen DC-voltage as red trace and enclosure voltage as blue trace.In the lowest figure the temperature measurements are presented. The IGBTs temperatures are theblue traces and external PT100 measurements are shown as red traces.
The end temperatures for IGBTs are -27.6 C and for external PT100 -24.2 C. The DC-link voltage measurement increases by 0.2 V. Also every phase current measurement in-creases by 1 A compared to the begin of the test.
The start and stop test done on the voltage levels as described before. The PM started andstopped without any issues. For stop signals are the PM does not start under 3.55 V andshut downs for stop 1 2.18 V and stop 2 2.22 V. Stops were tested supply voltage being24 V.

40
5.6.3 Temperature test in high temperature
This test was conducted in succession to the RT test, the supply voltage being 24 V. Thetemperature was set to 105 C. The modulation was kept on during the test except for thetime during the DC-link voltage was 15 V and enclosure voltage 8 V. During that timethe PM was triggered to high temperature. The IGBT temperature trigger level was setto 120 C. The limit was risen as soon as it was noticed. The test results are presentedFigure 16.
The same voltage levels tests were done as in low temperature test which start and stopten times with voltage levels of 10 V, 24 V and 32 V. The stop signal voltage levels werealso tested.
-5-4-3-2-101
0 30 60 90 120 150
Cur
rent
[A]
Time [min]
02468
10121416
0 30 60 90 120 150
Volta
ge[V
]
Time [min]
20406080
100120
0 30 60 90 120 150
Tem
pera
ture
[C
]
Time [min]
Figure 16. The results of high temperature test. In the uppermost figure three phase currents areshown. In the middle figure is seen DC-voltage as red trace and enclosure voltage as blue trace.In the lowest figure the temperature measurements are presented. The IGBTs temperatures are theblue traces and external PT100 measurements are shown as red traces.
The end temperatures for IGBTs are 122.2 C and for external PT100 114.1 C. Bothvoltage measurements experience a fluctuation at the begin of the test. The current andvoltage measurements shifted to opposite direction when comparing to the low tempera-ture test. The DC-link voltage settles at 6 V, 2 V lower than in RT. The enclosure voltagelowers by 1 V from RT test voltage level. The phase current measurements decreases by

41
1.25 A from the initial value, except for the one which decreases by 2 A. Also noted thatthe PM used more current than in RT. This current increased from 450 mA to 500 mA.
The start and stop test done on the voltage levels as described before. The PM started andstopped without any issues. For stop signal 1 the PM does not start under 3.50 V and forstop signal 2 the PM does not start under 3.45 V. The shutdown voltage for stop 1 2.29 Vand stop 2 2.25 V. Stops were tested supply voltage being 24 V.
5.7 Auxiliary voltage output tests
The test was performed with metal film resistors, connected from 5 V output to the ground.The Agilent U1242B was connected in series with the resistor. Voltage over the resistorwas also measured with the same multimeter. The results of auxiliary voltage output testis presented in Figure 17. The voltage measured from the output to the ground was 4.97 V.
150
200
250
300
350
400
450
500
5 10 15 20
Cur
rent
[mA
]
Resistance [Ω]
0
1
2
3
4
5
5 10 15 20
Volta
ge[V
]
Resistance [Ω]
Figure 17. The upper figure shows the measured current. In the lower figure is presented thevoltage over the load. The current is limited to 450 mA.
The voltage begins to be limited after the current reaches 400 mA. The current limit isseen as the constant current at 450 mA. The voltage keeps dropping in respect to the loadbut the current stays the same.

42
5.8 The user IO test
For analog input test, every input was connected to a test voltage, except for IO5 as itdoes not have an analog input capabilities. The test voltages and user IO read values arepresented in the Table 6. The difference between the user IOs voltages were insignificantto the results. This is the reason why only one user IO voltage is presented in the Table 6.The digital values were switched and observed in PowerUSER as was the analog input.
Table 6. Analog input IO test results. Only one IO voltage is presented. The reason for this is thatthe IO measurement were similiar to each other to make an impact to the results.
Supply voltage [V] IO voltage [V]0.00 0.000.10 0.100.50 0.511.00 1.015.00 5.0010.0 10.015.0 15.020.0 20.025.0 25.030.0 30.032.0 32.0
Digital inputs and outputs were tested by connecting IO1 and IO2 together, and IO3 andIO4 together. After IO3 and IO4 test was concluded, IO4 was disconnected and, IO3and IO5 were connected together. Test was proceeded by switching other of the user IOsto write and other to read state. The write was switched to boolean TRUE and resultswere observed in the other IO if the state was switched to TRUE. It was also tested thatthe boolean FALSE was correctly switched by switching the write IO to boolean FALSE.This was done after it had been switched to TRUE as the initial state of the user IO isFALSE. These procedures were repeated until every user IO combination was tested. Thedigital user IOs correctly changed values and read them.
5.9 The CAN communication test
The test was done by switching the enable signal with P-CAN view to boolean TRUE andthen back to FALSE. The enable signals was observed in PowerUSER software. Also thebus errors were observed during the test. The test was done with baud rates of 100 kbits/s,250 kbits/s, 500 kbits/s and 1000 kbits/s with both CAN channels.

43
The enable signal switched TRUE and FALSE correctly with every baud rate and withboth channels, and without bus errors. Terminator of 120Ω was used in between the CANhigh and low signals.
5.10 The resolver test
The resolver test was done as described in previous section. The ramp size of 5 RPM isused and the maximum speed is 1900 RPM. There are in total of four tests with loadsof -10 Nm, 10 Nm, -461 Nm and 461 Nm. The resolver speed measurements and torquesfrom the load and the motor are saved to a file with a script done with Ruby presented inAppendix 1. The motor speed direction is the opposite to the load torque direction.
The important part of the test is to observe the ripple of the speed from the motor resolverspeed. It is presented by reducing motor resolver speed from the motor reference speed.The spiking in the resolver speed measurement is not result of the switching the speedreference.
5.10.1 Motor resolver speed measurements with load of 10 Nm
The motor and load resolver speed measurements with the load of 10 Nm are presented inFigures 18 and 19. The speed ramp begins at 5 RPM and it is opposed to the sign of theload torque.

44
-40
-30
-20
-10
0
10
20
30
40
1000 2000 3000 4000 5000
Rev
olut
ions
perm
inut
e[R
PM]
Time [s]
-40
-30
-20
-10
0
10
20
30
40
1000 2000 3000 4000 5000
Rev
olut
ions
perm
inut
e[R
PM]
Time [s]
Figure 18. The motor and load speed with respect to motor reference speed for positive motorspeed with -10 Nm load. Upper figure is for the motor side and lower figure for load side resolverspeed measurement. The motor has speed reference of 5 RPM at the time of 0 s. Ramp time is 15 swith ramp of 5 RPM.
The resolver speed ripple rises as the speed increases and has the highest value of almost±40 RPM during the time of 3900–4400 s. At this time zone the time stands for motorreference speed of 1300–1470 RPM. After that the motor speed ripple settles to ±25 RPM.At the highest point of motor speed ripple, the ripple is 3 % of the motor resolver speed.
45
-40
-30
-20
-10
0
10
20
30
40
1000 2000 3000 4000 5000
Rev
olut
ions
perm
inut
e[R
PM]
Time [s]
-40
-30
-20
-10
0
10
20
30
40
1000 2000 3000 4000 5000
Rev
olut
ions
perm
inut
e[R
PM]
Time [s]
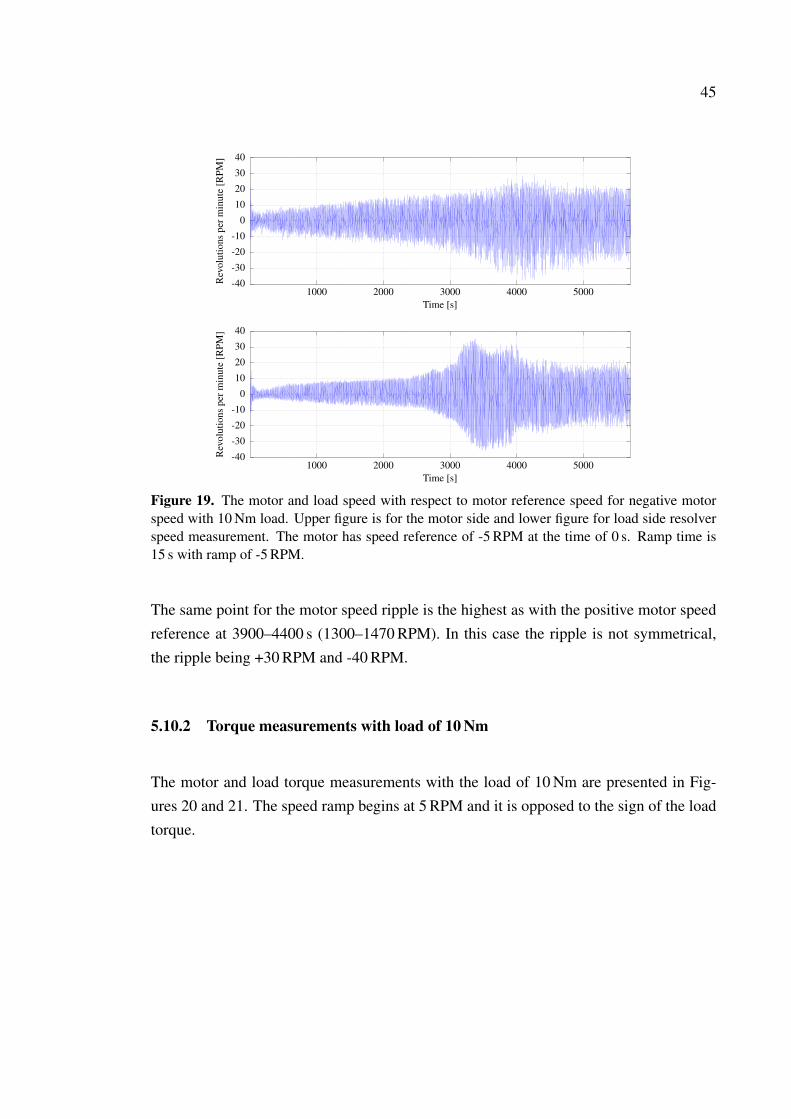
Figure 19. The motor and load speed with respect to motor reference speed for negative motorspeed with 10 Nm load. Upper figure is for the motor side and lower figure for load side resolverspeed measurement. The motor has speed reference of -5 RPM at the time of 0 s. Ramp time is15 s with ramp of -5 RPM.
The same point for the motor speed ripple is the highest as with the positive motor speedreference at 3900–4400 s (1300–1470 RPM). In this case the ripple is not symmetrical,the ripple being +30 RPM and -40 RPM.
5.10.2 Torque measurements with load of 10 Nm
The motor and load torque measurements with the load of 10 Nm are presented in Fig-ures 20 and 21. The speed ramp begins at 5 RPM and it is opposed to the sign of the loadtorque.

46
-20
-10
0
10
20
30
1000 2000 3000 4000 5000
Torq
ue[N
m]
Time [s]
-13
-12
-11
-10
-9
-8
-7
1000 2000 3000 4000 5000
Torq
ue[N
m]
Time [s]
Figure 20. The motor and load torques for positive motor speed with -10 Nm load. Upper figureis for the motor side and lower figure for load side torque measurement. The motor has speedreference of 5 RPM at the time of 0 s. Ramp time is 15 s with ramp of 5 RPM.
The motor torque rises steadily after 800 s which is at the motor reference speed of270 RPM if the local maximum at 3500 s is not taken to account. That local maximum isat motor reference speed 1170 RPM. At the begin of the test, 0–120 s, the motor torque isnot steady. This is due the fact that motor has too slow speed reference. The speed refer-ence at that time is 40 RPM. Also the motor torque the control uses is same sign torque asthe load until 520 s which is at motor reference speed of 175 RPM.

47
-30
-20
-10
0
10
20
1000 2000 3000 4000 5000
Torq
ue[N
m]
Time [s]
7
8
9
10
11
12
13
1000 2000 3000 4000 5000
Torq
ue[N
m]
Time [s]
Figure 21. The motor and load torques for negative motor speed with 10 Nm load. Upper figureis for the motor side and lower figure for load side torque measurement. The motor has speedreference of -5 RPM at the time of 0 s. Ramp time is 15 s with ramp of -5 RPM.
The motor torque is almost identical to the motor torque in positive motor speed refer-ence if the figure is mirrored in respect to x-axis. The same local maximum at 3500 s(1170 RPM) but sign of motor and load torques being the same until at 300 s (100 RPM).The torque ripple stabilizes at the same time as in positive motor resolver speed at 120 s(40 RPM).
5.10.3 Motor resolver speed measurements with load of 461 Nm
The motor and load resolver speed measurements with the load of 461 Nm are presentedin Figures 22 and 23. The speed ramp begins at 60 RPM and it is opposed to the sign ofthe load torque.

48
-40
-30
-20
-10
0
10
20
30
40
1000 2000 3000 4000 5000
Rev
olut
ions
perm
inut
e[R
PM]
Time [s]
-40
-30
-20
-10
0
10
20
30
40
1000 2000 3000 4000 5000
Rev
olut
ions
perm
inut
e[R
PM]
Time [s]
Figure 22. The motor and load speed with respect to motor reference speed for positive motorspeed with -461 Nm load. Upper figure is for the motor side and lower figure for load side resolverspeed measurement. The motor has speed reference of 60 RPM at the time of 0 s. Ramp time is15 s with ramp of 5 RPM.
The motor resolver speed ripple is at the highest during 3600–4400 s (1200–1470 RPM)which is almost ±40 RPM. At 1200 RPM the ripple is 3.3 % of the motor resolver speed.

49
-40
-30
-20
-10
0
10
20
30
40
1000 2000 3000 4000 5000
Rev
olut
ions
perm
inut
e[R
PM]
Time [s]
-60
-40
-20
0
20
40
1000 2000 3000 4000 5000
Rev
olut
ions
perm
inut
e[R
PM]
Time [s]
Figure 23. The motor and load speed with respect to motor reference speed for negative motorspeed with 461 Nm load. Upper figure is for the motor side and lower figure for load side resolverspeed measurement. The motor has speed reference of -60 RPM at the time of 0 s. Ramp time is15 s with ramp of -5 RPM.
The motor resolver speed measurement ripple with positive load is more stable and linearthan in the previous tests. At the near 4000 s (1330 RPM) there is no ±40 ripple but only±25 RPM ripple. But still that ripple is at 3500 s (1170 RPM) is 2.1 % of the motor speedreference.
5.10.4 Torque measurements with load of 461 Nm
The motor and load torque measurements with the load of 461 Nm are presented in Fig-ures 24 and 25. The speed ramp begins at 60 RPM and it is opposed to the sign of the loadtorque.
If an absolute value of the negative torque is taken, the waveform would look identi-cal to test with the positive torque. In that case there would be a slight offset approxi-mately 5 Nm to each other and larger jump in the value of the torque at the time of 900 s(300 RPM).

50
370375380385390395400405410
1000 2000 3000 4000 5000
Torq
ue[N
m]
Time [s]
-465
-464
-463
-462
-461
-460
-459
-458
1000 2000 3000 4000 5000
Torq
ue[N
m]
Time [s]
Figure 24. The motor and load torques for positive motor speed with -461 Nm load. Upper figureis for the motor side and lower figure for load side torque measurement. The motor has speedreference of 60 RPM at the time of 0 s. Ramp time is 15 s with ramp of 5 RPM.
-420-415-410-405-400-395-390-385-380-375
1000 2000 3000 4000 5000
Torq
ue[N
m]
Time [s]
458
459
460
461
462
463
464
465
1000 2000 3000 4000 5000
Torq
ue[N
m]
Time [s]
Figure 25. The motor and load torques for negative motor speed with 461 Nm load. Upper figureis for the motor side and lower figure for load side torque measurement. The motor has speedreference of -60 RPM at the time of 0 s. Ramp time is 15 s with ramp of -5 RPM.

51
6 DISCUSSION
The tests based on standard ISO 16750–2 are not presented. This is because there werechanges in the hardware, and it is not efficient to do the tests based on standards with thisversion. Reason for this is, as those tests would be needed to done again with the fixedversion.
6.1 The preliminary tests
The power on circuit had its problems. It needed multiple fixes in order to get it in workingorder and to start up and shutdown at 6 V. A new and more simpler circuit is done for thefixed version. The new circuit lessens the amount of the components and it allows theCPU do its calculations before a shutdown, as the circuit used in the testing did not.
The stop signals behaviour were correct in the RT. There was insignificant difference inlow and high temperatures to stop signal voltage levels.
The measurements for the phase currents, and for DC-link and the enclosure voltage weredone. For the phase currents a software change was needed as the LEMs that detect aphase current were changed. The hardware triggers operated as designed in phase over-currents and DC-link overvoltage, and these triggers ended the modulation. Although thereal phase overcurrents and DC-link overvoltage was not used, the trigger events weresimulated by providing a voltage directly to the measurements in the PCB.
The short circuit current trigger is slightly lower than initially designed. The initial de-signed value was 5 A but in the measurements revealed it to be 4.26 A. However, this doesnot effect to the operation of the PM as it does not require that much current in normaloperation.
The IGBT temperatures showed the correct temperature in RT and in low temperatures.The external PT100 measurements showed an offset of 5 C higher than the IGBT temper-atures or the environmental chamber temperature. At the high temperature test the IGBTtemperatures are higher than the external PT100 measurements even though the softwarewas not changed in between the tests. The excess of the supply current does not aloneexplain the behaviour of the IGBT temperature in this case. As the power only increasedby 1.2 W. The effect of the high temperature needs to be investigated further. It is not

52
efficient that the PM is shutdown as there is still room to heat up. The errors in voltageand current measurements due low or high temperatures are visible but not a reason to doa change in software or hardware.
The user IO analog inputs were tested in its whole measurement range from 0 V to 32 V.The difference at the maximum from supplied to measured voltage is 0.01 V. The differ-ence is insignificant at voltages higher than 1 V as it is less than 1 % of the measured andsupplied voltage. This error might also be from the supply voltage as it was not confirmedwith a multimeter. The digital read and write for every user IO was tested. One of theuser IOs was writing a digital value successfully while other was reading the digital valuecorrectly.
The CAN bus with J1939 V2 protocol was tested by switching the enable signal TRUEand FALSE. This was done with CAN bus baud rate speeds of 100 kbits/s, 250 kbits/s,500 kbits/s and 1000 kbits/s. There were no bus errors nor did the enable signal fail toswitch states.
The resolver needs a better algorithm based to resolver tests. The ripple of the resolver isat the highest 3.3 % of the reference speed.
The sync link needs to be tested as soon as the software support for it has been accom-plished.
6.2 Future Work
After the new version of the PM is manufactured, and the power on and flash bootloaderare tested. After that the tests based on standard ISO 16750–2 can be done. Second thingto do is to perform the rests of the tests described in the standard ISO 16750. These testsinclude chemical, mechanical and climatic tests. There also exist other standards that thePM needs to fulfil. These standards are for example IEC 61800 which includes tests forsafety and for EMC in adjustable speed electrical power drive systems.

53
7 CONCLUSIONS
The goal of the thesis was met in describing preliminary tests and performing the tests asthese were to ensure the functionality of the PM. These tests produced data to be comparewhen tests based on standards are done. The tests based on standard ISO 16750–2 weredescribed but not conducted in the time frame of the thesis.
The preliminary tests were done to ensure that the PM can do what it is designed to do.With exception the sync link test as the software support was not ready in time of thisthesis. The preliminary tests produced data for fixing two hardware problems: power oncircuitry and disconnecting CAN enable from the flash write. The hardware fixes of thePM has to be done before standardized tests.
The tests based on standard ISO 16750–2 were prepared but due the time limits of thethesis, these tests were not performed. These tests will be done as the whole ISO 16750which are chemical, mechanical and climatic tests for electrical equipment in road vehi-cles. Other standards that the PM needs to pass are for example tests described in IEC61800, tests for adjustable speed electrical power drive systems.
The standards confirm that the PM can be operated safely and it meets the requirementsthat are set by today’s industry. The PM can be used any application that is in its powerrange but it is mainly designed for drive drains for mobile work machines and marinevessels. These applications are today mostly still operated with fossil fuels but the elec-trification of these is inevitable.
Fossil fuels will some day be depleted, an alternative way to produce a force to propelroad vehicles, work machines and marine vessels has to done. This has already begun duepolitical shift to the cleaner environment. Technological advancement in power electron-ics and in energy storage have made the electrification possible and cost-effective. Thereis still a long way until the mankind is able to end the usage of fossil fuels, but that day isahead of us.
54
REFERENCES
[1] International Electrotechnical Commissionn. You & The IEC - Your perspective,2016. [online]. Available: http://www.iec.ch/perspectives/. [Accessed: January 8,2016].
[2] The International Organization for Standardization. Standards, 2016. [online].Available: http://www.iso.org/iso/home/standards.htm. [Accessed: January 8,2016].
[3] Suomen standarditoimistoliitto SFS RY. Standardit ja standardisointi. 8th edition,2013. ISBN 978-952-242-166-1.
[4] Deutsches Institut für Normung. DIN and our partners, 2016. [online]. Available:http://www.din.de/en/din-and-our-partners. [Accessed: January 8, 2016].
[5] S. D’Agostino. The electric car. IEEE Potentials.
[6] M. Guarnieri. Looking Back to Electric Cars. HISTory of ELectro-technology CON-
ference (HISTELCON), 2012 Third IEEE.
[7] E. Hesla. Electric Propulsion [History]. IEEE Industry applications magazine, July
2009.
[8] SignalTrend Inc. Historical Oil Prices, 2015. [online]. Available: http://www.forecast-chart.com/chart-crude-oil.html. [Accessed: February 25, 2016].
[9] Nasdaq. Nasdaq, price of crude oil, 2016. [online]. Available: http://www.nasdaq.com/markets/crude-oil.aspx?timeframe=10y. [Accessed: February 24, 2016].
[10] Enerdata. Global energy statistical yearbook 2015, 2015. [online]. Available: https://yearbook.enerdata.net/. [Accessed: February 24, 2016].
[11] European Parliament. Directive 2009/28/EC of the European Parliament and of theCouncil of 23 April 2009 on the promotion of the use of energy from renewablesources. Official Journal of the European Union.
[12] P. Mindl Z. Cerovskr. Hybrid Electric Cars, Combustion Engine driven cars andtheir Impact on Environment. Power Electronics, Electrical Drives, Automation
and Motion, 2008.
[13] M. S. Whittingham. History, Evolution, and Future Status of Energy Storage. Pro-
ceedings of the IEEE, vol. 100, May 13th, 2012.

55
[14] J. Dixon. Energy storage for electric vehicles. Industrial Technology (ICIT), 2010
IEEE International Conference on 14-17 March 2010.
[15] F.G. Rieck H.C. Righolt. Energy chain and efficiency in urban traffic for ICE andEV. EVS27 International Battery, Hybrid and Fuel Cell Electric Vehicle Symposium.
[16] B. K. Bose. Global Energy Scenario and Impact of Power Electronics in 21st Cen-tury. IEEE Transactions on industrial electronics, vol. 60 no. 7, July 2013.
[17] B. K. Bose. Power Electronics and Motor Drives Recent Progress and Perspective.IEEE Transactions on Industrial Electronics, vol. 56, no. 2, February 2009.
[18] B. K. Bose. Power Electronics - Historical Perspective and My Experience. IEEE
Industry Applications magazine, Mar | Apr 2014.
[19] N. Mohan, T. M. Underland, and W. P. Robbins. Power Electronics - Converters,
Applications and Design. John Wiley & Sons, Inc, 3rd edition, 2003. ISBN 0-471-42908-2.
[20] W. Wu, J. Ji, F. Blaabjerg. Aalborg Inverter-A New Type of ”Buck in Buck, Boostin Boost” Grid-Tied Inverter. IEEE Transactions on power electronics, vol. 30, no.
9, September 2015.
[21] M. Salo, H. Tuusa. A Vector-Controlled PWM Current-Source-Inverter-Fed Induc-tion Motor Drive With a New Stator Current Control Method. IEEE Transactions
on industrial electronics, vol. 52, no. 2, April 2005.
[22] M. Chomat, L. Schreier, J. Bendl. Control of active front-end rectifier under un-balanced voltage supply and dc-link pulsations. 2011 IEEE International Electric
Machines & Drives Conference (IEMDC).
[23] A. Ndokaj, A. Di Napoli. Active Front End in Precence of Voltage Notches. Clean
Electrical Power (ICCEP), 2015 International Conference.
[24] C.-C. Hou, P.-T Cheng. Experimental Verification of the Active Front-End Convert-ers Dynamic Model and Control Designs. IEEE Transactions on power electronics,
vol. 26, no. 4, April 2011.
[25] S. Leng, I.-Y. Chung, W. Liu, D. Carters. Reconfigurable Active Front-End of Ad-justable Speed Drives for Power Quality Improvement. Power & Energy Society
General Meeting, 2009. PES ’09. IEEE.
[26] Visedo Oy. PowerMASTER M-frame Liquid cooled heavy duty inverter, 2016.[online]. Available: http://www.visedo.com/sites/default/files/downloads/visedo_powermaster_m-frame_datasheet_r1215.pdf. [Accessed: January 12, 2016].

56
[27] The International Organization for Standardization. ISO 16750-1 Road vehicles -Environmental conditions and testing for electrical equipment and electronic equip-ment - General, 2006.
[28] The International Organization for Standardization. ISO 16750-4 Road vehicles -Environmental conditions and testing for electrical equipment and electronic equip-ment - Climatic loads, 2010.
[29] The International Organization for Standardization. ISO 16750-2 Road vehicles -Environmental conditions and testing for electrical equipment and electronic equip-ment - Electrical loads, 2010.
[30] R. Murayama W. Sriratana. Application of Hall Effect Sensor: A Study on the Influ-ences of Sensor Placement. Industrial Electronics (ISIE), 2013 IEEE International
Symposium.
[31] LEM. Isolated current and voltage transducers. [online]. Available: http://www.lem.com/images/stories/files/Products/1-3_applications/CH24101.pdf. [Ac-cessed: March 21, 2016].

Appendix 1. Resolver test script
Resolver script main
1 require ’rubygems’
2 require ’vise_script’
3 require ’vise_script_utils’
4 require ’date’
5 require ’./Resolver-speed-ramp-test-methods.rb’
6 include ViseScript
78 begin
9 ramp_time = 15; # Ramp time in seconds
10 meas_step = 10; # Sample speed in hertz
11 n_max = 1.0; # Maximum speed, can be negative
12 step_size = n_max/380; # The size of the step
13 load_ref_T = 461 # Load torque, automatically changes the according to sign of
→ n_max
1415 client = ClientFactory.build;
16 pdp_drive = client.get_device_by_name("Visedo Generic PDP Serial R");
17 pdp_drive.connect.wait;
18 pdp_drive_load = client.get_device_by_name("Visedo Generic PDP Serial M");
19 pdp_drive_load.connect.wait;
2021 speed_measure_resolver(ramp_time, meas_step, step_size, n_max, pdp_drive,
→ pdp_drive_load, load_ref_T)
2223 # If something interrupts the script, this is performed
24 ensure
25 pdp_drive.set_dataobject([10100, 1], false).wait; # Run command off, motor
26 pdp_drive_load.set_dataobject([2000, 3], false).wait; # Enable off, load
27 pdp_drive_load.set_dataobject([2000, 1], false).wait; # Run command off, load
28 end # Script end
Resolver script methods
1 # Speed ramp and save file based on the date and time
2 def speed_measure_resolver(ramp_time, meas_step, step_size, n_max, pdp_drive,
→ pdp_drive_load, load_ref_T)
3 n, n_ref, schedule, scheduler, file, start_time = speed_measure_resolver_init(
→ step_size, n_max, load_ref_T, pdp_drive, pdp_drive_load);
45 n.times do |time|
6 schedule.append(time*ramp_time) do
7 pdp_drive.set_dataobject([10100, 4], n_ref).wait; # speed reference
8 puts "###################################################";
9 puts "Running with speed reference #1900*pdp_drive.get_dataobject([10100, 4])
→ RPM. Encoder speed #(1900*pdp_drive.get_dataobject([7001, 1005])).round(0)
→ RPM."
10 puts "Motor temperatures: R side #pdp_drive.get_dataobject([8001, 1]).round(1)
→ and M side #pdp_drive_load.get_dataobject([8001, 1]).round(1).";
11 puts "Inverters junction temperature: R side #pdp_drive.get_dataobject([8002,
→ 10071]).round(1), #pdp_drive.get_dataobject([8002, 10072]).round(1) and
→ #pdp_drive.get_dataobject([8002, 10073]).round(1), and M side #
→ pdp_drive_load.get_dataobject([2000, 130]).round(1).\n";
12 n_ref = n_ref + n_max/n;
13 end
14 end
15 (n*meas_step*ramp_time).times do |time| # number of measurements
(continues)

Appendix 1. (continued)
16 schedule.append(time/meas_step.to_f) do # time between measurements
17 file.write "#pdp_drive.get_dataobject([10100, 4]), #pdp_drive.get_dataobject
→ ([10002, 13]), #pdp_drive.get_dataobject([10002, 16]), #pdp_drive_load.
→ get_dataobject([10002, 16]), #pdp_drive_load.get_dataobject([10002, 13])
→ , #(Time.now.to_f - start_time).round(2)\n";
18 end
19 end
2021 schedule.sort!;
22 scheduler.schedule = schedule;
23 scheduler.start;
24 file.close;
2526 #Load turn off
27 pdp_drive_load.set_dataobject([2000, 3], false).wait; # Enable off
28 pdp_drive_load.set_dataobject([2000, 1], false).wait; # Run command off
29 puts "Load stop.";
3031 # Motor turn off;
32 pdp_drive.set_dataobject([10100, 1], false).wait; # Run command off
33 puts "Motor stop after #(((Time.now.to_f - start_time).round(1))/60.0).round(2)
→ minutes";
34 end
35 # Initialization for the test parameters and save file
36 def speed_measure_resolver_init(step_size, n_max, load_ref_T, pdp_drive, pdp_drive_load)
37 n_ref = step_size;
38 n = (n_max/n_ref).to_i;
3940 # Automatically changes the direction of torque
41 if n_ref > 0
42 load_ref_T = -load_ref_T;
43 end
4445 # for load_ref_T larger than 10Nm, step start from 60 RPM
46 if load_ref_T > 10 || load_ref_T < -10
47 n = n-58/2;
48 if n_ref < 0
49 n_ref = -60/1900.0;
50 else
51 n_ref = 60/1900.0;
52 end
53 end
5455 pdp_drive.set_dataobject([10100, 4], n_ref).wait; # speed reference
56 pdp_drive_load.set_dataobject([2000, 6], load_ref_T).wait; # Torque reference for
→ load
5758 pdp_drive.set_dataobject([10100, 1], true).wait; # Run command on, motor
5960 pdp_drive_load.set_dataobject([2000, 1], true).wait; # Run command on, load
61 pdp_drive_load.set_dataobject([2000, 3], true).wait; # Enable command on, load
62 puts "Load torque: #pdp_drive_load.get_dataobject([2000, 6]), n_ref: #n_ref*1900,
→ n_max: #n_max\n"
6364 sleep(5);
6566 file_name = "#load_ref_T-#Time.now.strftime(’%Y-%m-%d-%H-%M-%S’).txt"; # Saved
→ file name
(continues)

Appendix 1. (continued)
67 file = File.open("#file_name", "w");
68 file.puts "Motor speed reference, Motor speed encoder, Torque, Torque load, Load side
→ speed encoder 2000 rpm, Time"
69 start_time = Time.now.to_f;
7071 schedule = Utils::Schedule.new;
72 scheduler = Utils::Scheduler.new;
7374 return n, n_ref, schedule, scheduler, file, start_time;
75 end