standards and quality in education in hillingdon …
TRANSCRIPT

Classification: PublicResidents, Education and Environmental Services Policy Overview Committee – 22 January 2019
STANDARDS AND QUALITY IN EDUCATION IN HILLINGDON 2017/2018
Committee name Residents, Education and Environmental Services Policy
Overview Committee
Officer reporting Dan Kennedy and Laurie Baker, Residents Services
Papers with report None
Ward All
HEADLINES
This report provides the Committee with an overview of the standard and quality of education across Hillingdon schools and settings for Hillingdon’s children, young people and adults. The report focuses primarily on attainment, progress and achievement for the academic year 2017/18 but also references wider measures of educational success. To support further improvement of standards in Hillingdon the report identifies specific areas for action with schools, settings and partners.
RECOMMENDATIONS That the Committee: 1. Note the key findings set out in the report.
SUPPORTING INFORMATION
The main findings from the review of education performance in Hillingdon for the academic year 2017/18 are that:
● Within the Early Years including private, voluntary and independent nursery settings and child-minder provision overall attainment has risen once again.
● Within the primary phases, improved outcomes at both Key Stages mean that borough averages are now above the national level for all key measures. Positive Key Stage 2 progress scores in Reading, Writing and Maths mean that, collectively, Hillingdon’s primary schools are adding more value to children’s learning than primary schools nationally, on average.
● Within the secondary phase, Key Stage 4 outcomes continue to improve and now comfortably outperform national averages. Progress measures in the secondary phase are stable and positive.

Classification: PublicResidents, Education and Environmental Services Policy Overview Committee – 22 January 2019
● At post-16 level, Hillingdon continues to underperform with significantly lower academic outcomes than national averages for this phase.
● Hillingdon's Ofsted inspection data demonstrates an overall improvement in 2017/18 when compared with previous years with 91.3% of schools overall now judged good or better by the end of the 2017/18 academic year, compared to 84% of schools judged good or better 2015/16.
● The underperformance of some key groups of learners in Hillingdon continues to provide challenge to some settings in the Borough. Effectively addressing the progress and outcomes for these vulnerable groups should remain an educational priority for the Council and all local education providers in 2018/19.
The remainder of the report provides further information about the outcomes achieved at the different education stages, for different groups and relating to Council services which support educational outcomes. The report contains additional appendices and data.
Putting Our Residents First - Raising Standards in Education
● Putting residents first is central to the work of the Council. This includes fulfilling its duty to ensure that its statutory education functions are discharged with a view to promoting high standards; ensuring fair access to opportunity for education and learning, and promoting the fulfilment of learning potential for all learners.
● Within a landscape of significant national change in education the Council continues to recognise that access to the very best education opportunities in high-quality schools and settings will ensure that Hillingdon remains a popular and desirable place of choice for families.
● The Council continues to invest in education capacity and quality through the provision of school support and monitoring and the expansion of schools where needed to meet demand for school places across the primary and secondary sectors. The Council’s investment in new and modern education buildings and facilities continues to provide the high quality learning environment that children need in Hillingdon.
● The mixed economy of Council maintained and academy/free schools in the Borough mean that the Council acknowledges its dynamic but central role in securing the best outcomes for children and young people educated in the Borough. Working in partnership with autonomous school leaders, multi-academy trusts and other relevant responsible authorities, the Council continues to promotes high standards for all learners and to challenge underperformance where this occurs, no matter where learners are educated.
● The Council accepts that it has an important role to play in promoting high standards for all learners and, in particular, those children, young people and adults vulnerable to underachievement, including those with special educational needs and/or disabilities and those from disadvantaged backgrounds. In order to undertake this role effectively, the Council uses its resources to monitor, support, challenge, and intervene in schools where concerns arise.

Classification: PublicResidents, Education and Environmental Services Policy Overview Committee – 22 January 2019
It does this by:
● Collating and analysing the performance of all publicly funded schools in Hillingdon to identify those at risk and those in need of additional support or intervention.
● Monitoring and challenging the performance of individual schools for all pupils, specific groups of pupils and individual pupils. This includes reviewing and challenging school improvement plans, providing services to support the positive progress of children and young people, developing and securing expertise in schools and settings, monitoring personal educational plans for children looked after and intervening where schools or settings require improvement.
● Working effectively with services for vulnerable children both within the Council and beyond to access support swiftly where concerns are noted or where opportunities for learners are not good enough.
● Undertaking a strategic brokerage role to allow schools in need to access appropriate support from other schools and national organisations.
● Where necessary, exercising formal powers of intervention against maintained schools or notifying the Regional Schools Commissioner of concerns in Academy schools in order to drive up standards in academy schools for which the Council is not the responsible body with regard to standards and quality.
● Working in partnership with Teaching Schools and multi-academy trusts in order to build capacity within the schools-led improvement community in Hillingdon.
Ofsted Inspections of Schools
● During the academic year 2017/18 (ending on 31st August 2018), 32 schools in Hillingdon were inspected. Of these schools inspected, 4 of 32 demonstrated an improvement in final inspection judgements and moved from ‘Requiring Improvement’ to ‘Good’, whilst 27 of 32 retained their previous inspection judgements. 1 of 32 schools inspected during this period received a downgraded judgement. This school is currently subject to intensive intervention by the Council's School Improvement Team.
● Overall inspection data for 2017/18 shows another year of improvement in school judgements in Hillingdon with a further reduction in the percentage of schools Requiring Improvement, no schools currently in Special Measures and, in total, 91.3% of all schools judged 'good' or better at the close of the academic year.
● The positive conversion of four schools from ‘Requiring Improvement’ to ‘Good’ in 2017/18 was largely responsible for the improvement in borough-wide Ofsted outcomes standards. As a consequence, Hillingdon ended the academic year with the overall percentages of schools in each category more closely in line with the England average inspection outcomes than in previous years and with the percentage of schools judged ‘Good or Better’ above the national percentage at the end of the 2017/18 academic year.

Classification: PublicResidents, Education and Environmental Services Policy Overview Committee – 22 January 2019
Summary of Schools in Hillingdon by Ofsted Judgement
Table 1 - Inspections LBH breakdown
Please note that schools without a current judgement are recorded as ‘good’ in comparative Local Authority statistics
Table 1: Final inspection overview 2017/18 (by 31st August 2018)Type of School
Number % Outstanding
No. Outstanding
%Good
No.Good
%Requiring Improvement
No.Requiring Improvement
% Inadequate
No. Inadequate
Primary 71 (2*) 18 13 75 53 7 5 0 0
Secondary 22 (2*) 27 6 50 12 23 4 0 0
Special 10 30 3 70 7 0 0 0 0
All Schools in Hillingdon
103 * 4 schools awaiting first inspection
21 22 70 72 9 9 0 0
Table 2: Inspection LBH verses England2017-18 2016-17 2015-16
Judgement Hillingdon England Hillingdon England Hillingdon England
Schools Good or Better 91% 86% 87% 86% 84% 86%
Source: Ofsted inspection statistics November 2018 as of 31.08.18
Monitoring and Challenging the Performance of Individual Schools
● It is noted that the schools landscape in Hillingdon consists of 103 state-funded settings which include a mixture of Council maintained schools and other settings which have an alternative status - these settings including academies, non-maintained special schools and University Technical Colleges (UTCs)/studio colleges. For information, approximately 30% of all primaries in Hillingdon are academies, with 70% remaining as maintained schools. In the secondary sector, 90% of all schools are academies with only 10% remaining as maintained settings. In the special school sector, 80% of schools are academies whilst 20% are maintained by the Council.
● Legal duties and powers regarding school improvement intervention in underperforming schools where the Council is not the responsible body for standards or leadership (eg academies or other non-maintained schools etc) lie with the Regional Schools Commissioner, acting on behalf of the Secretary of State. Councils retain responsibility for intervention in maintained settings where standards decline and all local authorities retain the overarching statutory duty regarding the promotion of high standards of education which includes regular interface with all stakeholders in a local area and the sharing of intelligence with national partners including Ofsted and the full range of Department for Education teams.

Classification: PublicResidents, Education and Environmental Services Policy Overview Committee – 22 January 2019
● 2017/18 was the third full academic year of implementation of the Hillingdon School Improvement Plan (currently in its fourth year and undergoing a review by the Hillingdon Schools’ Strategic Partnership Board). This strategic plan, which was developed in partnership with the key education executive groups across the Borough, underwent formal consultation with all schools and was endorsed by Cabinet in December 2015. The plan includes six central elements of monitoring, intervention and challenge within a broader framework of school-led improvement activity. This collaborative and school-driven approach ensures that school improvement activity in Hillingdon continues to mirror the national direction for school support and intervention, with a clear emphasis on the brokerage of support for underperforming schools from good and outstanding settings.
● The strategic plan includes specific guidance for schools around the responsibilities of the Council with regard to monitoring and intervening where schools are, or may be, at risk of underperformance. This includes processes for the risk assessment of schools who are not securely good or where standards are declining and associated intervention by officers to accelerate the use of the Council's formal powers if required. The plan outlines the role that the Council has in liaising with and supporting where necessary the bodies responsible for intervention in academy/free schools/UTCs and maintained schools which are judged to be Inadequate by Ofsted.
● During the academic year 2017/18, the Council’s Schools At Risk Register identified 15 schools at risk of underperformance in Hillingdon. Of this number, 9 of the schools were maintained by the Council and, accordingly, were already in receipt of intensive monitoring, challenge and support by officers including the brokerage of support from within the local school improvement community to facilitate improvement. (It is noted that a higher proportion of maintained schools compared to academies are likely to feature on a Council Schools At Risk register since the level of intelligence that the Council has access to and which is used to assess risk tends to be greater where a school is a maintained setting. However, where the schools identified as being at risk were academies/free schools for whom the Local Authority is not the legally responsible body in terms of school improvement, the Council acted swiftly to highlight concerns to the Regional Schools Commissioner and other relevant authorities).
● During 2017/18 it was necessary for the Council to maintain or commence formal intervention action in four maintained schools where education standards were not considered to be improving rapidly enough. In one case, the Council successfully applied to the Secretary of State for permission to remove a governing body. This approach resulted in meetings between senior officers and school leaders, intensive brokering of support from within the wider education community and the use of pre-warning and formal Warning Notices where required. In these cases, the impact of challenge and support resulted in significant changes to leadership, management and governance in these schools.
● It should be noted that the Council’s School Improvement Team monitors the standards and quality of all schools in Hillingdon through termly analysis of published data, information gathered from Council services supporting children and families, Ofsted liaison, feedback from Hillingdon’s Regional Schools’ Commissioner’s office and DfE and, in the case of maintained schools only, through the provision of both annual Healthchecks and Pre-Inspection visits. The early identification of schools facing challenge in Hillingdon allows the Council to broker support for school leaders and governors from across the

Classification: PublicResidents, Education and Environmental Services Policy Overview Committee – 22 January 2019
wider schools community and aims to prevent, halt and reverse a decline in standards for Hillingdon’s children and young people.
● In 2017/18 officers continued to work closely with the school-led Schools’ Strategic Partnership Board including the National and Local Leaders of Education and Teaching Schools in Hillingdon, to deliver a number of school improvement events and regular briefings to Head Teachers throughout the year. This approach ensured that the Council continued to fulfil its statutory duty with regard to acting as a champion of high standards of education for all young people in Hillingdon, whilst supporting the local education sector’s systems leaders by promoting access to their local school leadership improvement offer and highlighting expertise available from both Teaching Schools and central government.
● The main conference ‘Hillingdon Schools Thriving in Partnership’ started the year with a clear message to schools that continued improvement in education standards in Hillingdon requires a landscape which values strong partnerships between schools, local authorities and systems-leaders from across the mixed economy of education in and beyond the borough. Looking ahead and given the detailed knowledge and continued interface that local authorities have with all schools in their area it has been increasingly acknowledged that Councils play a key role as a principle link between schools of all types, the Department for Education and Regional Schools’ Commissioner, Ofsted and Teaching Schools. It is, therefore, anticipated that the further development of robust and effective formal education improvement partnerships within which the Council plays a critical role as a primary convener of area-specific improvement, will be a key feature of education improvement at both a local and national level in 2018/19.
An Overview of Educational Performance in Hillingdon 2017/18
Please note that, along with London and national comparisons, information about rankings refers to Hillingdon's performance against 10 DfE-identified statistical neighbours and, wherever possible, indicates either an upward or downward trend compared with the previous academic year. These neighbours are Coventry, Milton Keynes, Merton, Slough, Hounslow, Redbridge, Ealing, Barnet, Sutton and Reading. It is noted that Ofsted uses comparison with statistical neighbours to compare outcomes across local authorities.
Please note that final (validated) results for the different key stages will be published by the end of January 2019. The report flags those metrics that are provisional and those that are either provisional or from a source other than final statistical releases (from DfE). Any provisional figures may be subject to change. For instance in last year’s report data on KS4 saw an increase of 0.7 percent in pupils obtaining a 9 to 4 pass in English and Maths between the unvalidated release in December 2017 and the final validated release in January 2018. The reason for this is the opportunity schools have to appeal results or data quality checks.
Updates to the figures in this report and the accompanying narrative will be made as final figures are released. This will ensure that the final version of this report to Cabinet in March 2019 will include all validated figures.

Classification: PublicResidents, Education and Environmental Services Policy Overview Committee – 22 January 2019
Section 1: Early Years & Foundation Stage Education
Private, Voluntary and Independent (PVI) Childcare Providers - Ofsted Outcomes
● The focus for 2017/18 in the Private, Voluntary and Independent (PVI) sector was to ensure that settings are demonstrating effective quality outcomes on a newly revised Early Years Quality Team (EYQT) Quality Framework for the provision of effective teaching and learning in Mathematics and Literacy. All PVI settings received the quality framework observation and a tailor made support programme based upon the individual needs of each setting.
● The Early Years Team in Hillingdon uses a RAG (red, amber, green) rating system to prioritise support for settings. The focus for 2017/18 was to support each ‘Amber’ and ‘Red’ rated setting in improving three central themes: Assessment and Planning, the Learning Environment and Adult and Child Interactions and Teaching, to ensure children are being supported to achieve the Early Learning Goals in Literacy and Mathematics as these remain the lowest scoring Goals both nationally and within Hillingdon.
● In addition, the team has continued to provide the Continuous Quality Development Group for ‘Green’ rated settings, which meets at least half termly. Settings in this group will be visited by their linked Early Years Advisory Teacher to verify their self-evaluation and completion of the Quality Framework.
The following table demonstrates the percentage of Hillingdon's PVI Ofsted outcomes over the past three years in relation to national Ofsted data (published in Oct 2018).
Table 3: Ofsted 2017/18
Summary
(Good or better)
Outstanding Good Requires Improvement
Inadequate
National LBH National LBH National LBH National LBH National LBH
2015/2016 86% 96% 17% 18% 69% 78% 12% 3% 1% 0%
2016/2017 96% 100% 21% 16% 75% 84% 4% 0% 1% 0%
2017/2018 91% 100% 28% 20.7% 63% 79.3% 6% 0 3% 0
Source - latest Ofsted report 2018 statistics
Hillingdon has 94 registered day care providers. 82 have a current Ofsted outcome and 12 are still awaiting their first inspection. The support provided to these settings has ensured that,

Classification: PublicResidents, Education and Environmental Services Policy Overview Committee – 22 January 2019
within the PVI sector, Ofsted outcomes are significantly above those achieved nationally and are all demonstrating quality improvement.
● The support delivered to PVI settings in Hillingdon ensures that children are school ready
when they move into statutory education and are best placed to achieve the Good Level of Development at the end of the Early Years Foundation Stage.
● The focus on assessment and planning and the specific tracking of cohort data has highlighted the need for PVIs to be supported to identify trends to ensure that disadvantage and gender gaps do not widen in this sector and therefore establish an inequality pattern for entry to Reception Year in school.
● Our aim to ensure that every child in Hillingdon has provision that is at least ‘good’ has
now been met. Next steps include our aim to increase the number of settings achieving the ‘outstanding’ rating. A significant improvement in this percentage was evident in 2017/18 and further improvement is expected, given the number of settings awaiting next inspection in 2018/19.
Ofsted Childminder Outcomes
● Overall in Hillingdon there are 282 registered childminders. Of these, 180 are registered childminders with EYFS-aged children with a current Ofsted grade and 38 are newly registered childminders awaiting their first inspection. 64 childminders are registered but do not provide care or education to children within the EYFS
● The percentages of childminders in Hillingdon judged ‘good’ or better by Ofsted was slightly below the national average in 2015/16. In order to bring Hillingdon in line with national expectations for the quality of child-minding, in 2016/17 the Early Years Quality Team developed and implemented a targeted programme of quality improvement for childminders, led by an Early Years Advisory Teacher from the Council team. Measurable impact resulting from this quality improvement work was evident in both 2016/17 and 2017/18. It is positive to note that overall Hillingdon’s children now have access to an overall quality of early education provision that is better than the national average.
● However, it is noted that 2017/18 saw a small increase in the percentage of child-minders judged ‘inadequate’ and this will require close monitoring to ensure that standards of child-minding provision remain strong across the borough in 2018/19.

Classification: PublicResidents, Education and Environmental Services Policy Overview Committee – 22 January 2019
Table 4: Ofsted Outcomes from Childminder Inspections 2017/18
Summary (Good or better)
Outstanding Good Requires Improvement
Inadequate
National , LBH National LBH National LBH National LBH National LBH
2015/2016 84% 83% 13% 12% 71% 71% 15% 10% 1% 2%
2016/2017 93% 97% 15% 13% 78% 84% 6% 3% 1% 0%
2017/2018 94% 97.4% 16% 14.4% 78% 83% 5% 0.5% 1% 1.1%
Source - latest Ofsted report 2018 statistics Early Years Good Level of Development (GLD) 2017/18
● In 2017/18, 73.6% of Hillingdon Reception Year pupils achieved a Good Level of Development; this was above the national average of 71.5%.
● Hillingdon ranked 3rd of 11 statistical neighbours which is slightly below 2016/17 rankings. (2nd)
● Hillingdon ranked 18th (out of 33) London local authorities, which is down on 2016/17 (14th)
● Hillingdon ranked 40th out of 152 national authorities, which is down on 2016/17 (34th)
Table 5: EYFSP (Early Years Foundation Stage Profile)
LBH National London all London Outer
2016 69.7% 69.3% 71.2% 71.5%
2017 73% 71% 73% 73%
2018 73.6% 71.5% 73.8% 73.8%
Difference +0.6 +0.5 +0.8% +0.8%
Source – EYFSP 2018 Main Tables (DfE)

Classification: PublicResidents, Education and Environmental Services Policy Overview Committee – 22 January 2019
Source – EYFSP 2018 Main Tables (DfE)
Early Years Key Subjects Outcomes 2017/18
● Overall, Hillingdon’s performance for the seven key Early Years subjects shows an improvement across all areas (except Physical Development which shows a small decrease for the 2017/18 cohort)
● Hillingdon is now above national outcomes in all of the Early Years areas of learning and development and is also broadly in line with the All London outcomes.
● In 2017/18 children in Hillingdon outperform their peers across London in all areas other than Literacy, Mathematics and Physical Development, where results are only slightly lower.
● In response to 2016/17 data, targeted support from the Council's Early Years Quality
Improvement Team was directed at improving children's attainment within the Communication and Language, Mathematics and Literacy areas of the Early Years curriculum. It is very positive to note the improvement in these key areas in 2017/18, particularly with regard to Communication and Language where an overall increase of 1.5% can be seen.
● Analysis of specific Early Learning Goals (ELGs) in 2017/18 show that Hillingdon has seen
an increase in attainment in each ELG. Notably strong performance was seen in three ELGs - Listening, Understanding and Speaking within Communication and Language. These Early Learning Goals demonstrate outcomes which are now well above the national and London averages. Performance in the areas of Communication and Language were targeted areas for improvement this year. In 2017/18 the three ELGs for this area of learning saw an overall increase of 1.5% in Hillingdon which brings them above both national and London outcomes.

Classification: PublicResidents, Education and Environmental Services Policy Overview Committee – 22 January 2019
● With regard to the ELG for Numbers (within Mathematics), Hillingdon is now above National outcomes. Hillingdon saw an increase of attainment in Numbers of 1.3% now bringing Hillingdon to within 0.1% of attainment in London.
● When comparing gender outcomes within Hillingdon’s Early Years education outcomes in 2017/18, it is clear that girls in Hillingdon outperform boys in all areas of learning with a widening gender gap in favour of girls evident this year. However, boys in Hillingdon are now significantly above boys nationally and also above boys in London in some key areas of the curriculum and, most notably, in Communication and Language and Personal, Social and Emotional development. Literacy for boys in the Early Years remains a key area of focus for 2018/19.
● Girls in Hillingdon are above girls nationally and within London in all of the prime areas of
Learning and within both Mathematics and Literacy. Most notably girls in Hillingdon outperform all girls nationally and across London in Communication and Language and in Literacy.
● In 2017/18 for the Good Level of Development (GLD) which is generally accepted as the
foundation for positive learning and progress in Key Stage 1, boys in Hillingdon are performing above national averages but have dipped slightly compared to last year whilst boys nationally have continued to increase. By comparison, Hillingdon's girls have seen another 2.3% increase in attainment of the GLD and are above girls nationally and in London. The impact of this can be seen in the widened gender gap for GLD attainment in 2017/18 which now stands at 14.3%. The national gender attainment gap is 13.5% and in London it is 12.7%. Supporting and challenging schools to address any further widening of this gender gap will be a focus of the Council’s Early Years Quality Improvement Team in 2018/19.
● For children with English as an Additional Language (EAL) the attainment gap has widened
slightly from 2% to 2.8% difference between Non-EAL and EAL children. However this attainment difference compares positively with the emerging 8.3% national gap and continues to highlight the good progress and outcomes for children with EAL that schools in Hillingdon secure.
● Positively, for children who are in receipt of Free School Meals (FSM) and classed as
disadvantaged, the attainment gap between them and non-disadvantaged children has narrowed by 1% in Hillingdon, whilst widening by 1% both Nationally and in London. In 2017/18 the gap in attainment in Hillingdon was 14% compared to 18% nationally. However, it should be noted that the gap in London between disadvantaged children and their peers is 12% and, therefore, narrowing the gap between disadvantaged children in the Early Years and their non-disadvantaged peers will be a continued focus for support and development in 2018/19.
The following table summarises the performance across the seven key Early Years subjects. The figures in brackets denote the progress made from the year 2016 to 2018.
Hillingdon National LondonTable 6: EYFSPSubject
2016 2017 2018 2016 2017 2018 2016 2017 2018

Classification: PublicResidents, Education and Environmental Services Policy Overview Committee – 22 January 2019
Communication & Language
82
84 (+2)
85.5 (+1.5)
81.5 82.1 (+0.6)
82.4 (+1.3)
82 82.6 (+0.6)
83 (+0.4)
Physical Development
87
88.4 (+1.4)
88(-0.4)
87.5 87.5 (-)
87.4 (-0.1)
88 88.2 (+0.2)
88.3 (+0.1)
Personal Social & Emotional Development
85
86.7 (+1.7)
87.3 (+0.6)
85 85.2 (+0.2)
85.2 (+0.2)
85 85.7 (+0.7)
85.7 (0)
Literacy 73.5
75.2 (+1.7)
75.6(+0.4)
72 72.8 73.3 (+0.5)
74.5 75.3 (+0.8)
75.7 (+0.4)
Mathematics
76.5
79.2 (+2.7)
80 (+0.8) 77.5 77.9 (+2.4)
78.3 (-1.6)
79 79.7 (+0.7)
80.1 (+0.4)
Understanding the World
82.5
84.2 (+1.7)
86.3 (+2.1)
83 83.6 (+0.6)
84 (+0.4)
83.5 83.8 (+0.3)
84.2 (+0.4)
Arts/Design & Making
87.5
88.9 (+1.4)
89.2 (+0.3)
86.5 (+1.5)
86.7 (+0.2)
87.2 (+0.5)
87.5 (+0.5)
87.8 (+0.3)
88.1 (+0.3)
Source - EYFSP 2018 Main Tables (DfE) - reissue 11/2018 Priorities for Early Years Education 2018/19:
● To maintain and build on improvements made during the past three years, targeting resources from within the Early Years Quality Improvement Team.
● To continue to support teachers in making secure and consistent judgments against national standards through rigorous moderation, targeted support, networking opportunities and centralised training.
● To focus support and challenge for schools on Physical Development, Literacy and
Mathematics particularly in order to match All London outcomes and to support the continued rise in attainment of the Good Level of Development.
● To continue to support all Early Years settings including PVIs, childminders and schools in
providing effective and appropriate interventions based on learning needs for children eligible for the Early Years Pupil Premium in order to continue to narrow the disadvantage gap.
● To support teachers in being responsive to the learning needs of boys to ensure that all
children are making progress and that the gender attainment gap narrows across Hillingdon.
● To provide detailed advice, support and training on the teaching of Mathematics, Literacy
and Physical Development to ensure that presented learning environments are reflective of the learning needs of children both indoors and in using the outdoor learning spaces.

Classification: PublicResidents, Education and Environmental Services Policy Overview Committee – 22 January 2019
● To ensure that PVI settings are up-skilled in effective teaching of the Prime Areas of
Learning and the core subjects of Maths and Literacy so that children who access their 30 hours in day-care make appropriate progress to begin their Reception Year at the level needed to attain their GLD and support their future learning.
● To support settings that have reached a 'Good' Ofsted judgement to work towards ‘Outstanding’ to raise the percentage of outstanding provision in Hillingdon to securely above national levels.
● To continue to provide Reception Year teachers with moderation events to ensure the
consistency and accuracy of final judgments of the EYFS areas of learning and development and to support Reception year teachers in changes to School Readiness Baseline tests and the proposed revision of the Early Learning Goals.
● To continue to support the Council in developing sufficient places to provide funded two
year places in order to ensure all children in Hillingdon have the best start and are school ready.
● To continue to support the local authority in developing sufficient extended 15 hour places
for eligible families within the 30 hour offer.
Section 2: Primary Phase Education
Key Stage 1
Phonics Outcomes in Hillingdon - Percentage of pupils achieving expected standard
Achievement of the national Phonics standard by the end of Key Stage 1 indicates that a child has the phonetic skills to support wider literacy progress and provides a crucial foundation for attainment and progress later in primary school.
● In Year 1 Phonics in 2017/18, once again a greater proportion of Hillingdon's children achieved the expected standard than their peers nationally and the borough is now level with the All London Year 1 Phonics attainment average. Overall Phonics achievement by the end of Year 2 remains in line with national averages but slightly behind that of All London.
● In 2017/18, in relation to our statistical neighbours Hillingdon's Year 1 Phonics percentage is now ranked 5th of 11, which is an improvement on 2016/17 (6th)
● For Year 1 Phonics, Hillingdon ranked 16th out of 33 London local authorities, which is an improvement on 2016/17 (21st).
● Overall, Hillingdon’s Phonics outcomes at Year 1 ranked 26th out of 153 national authorities, which is an improvement on 2016/17 (33rd)
● In terms of gaps in attainment for Year 1 Phonics, data shows that 77% of pupils eligible for Free School Meals attain the pass mark in comparison to 86% for all other pupils
● In terms of gender, 82% of boys attain the pass mark in comparison to 87% of girls.

Classification: PublicResidents, Education and Environmental Services Policy Overview Committee – 22 January 2019
● In terms of SEN 90% of ‘NOTSEN’ pupils attain the pass mark in comparison to 22% of EHCP pupils and 61% of SEN Support pupils.
● The highest performing groups of children in terms of Phonics attainment in Hillingdon are Asian (90%) and Black pupils (87%) and Pupils with English as an Additional Language (EAL) (87%), whilst White pupils tend to attain less well in comparison to the borough average (83%).
Table 7: Phonics % Achieved Standard Region 2016 2017
2018
Hillingdon 83 (+3) 83 (-) 85 (+2)
National 81 (+4) 81 (-) 82 (+1)Year 1
London 83 (+3) 84 (+1) 85 (+1)
Hillingdon 91 (-) 93 (+2) 92 (-1)
National 91 (+1) 92 (+1) 92 (-)Cumulative by the end of Year 2
London 92 (+1) 92 (-) 93 (+1)
Source – Phonics 2018 Tables (DfE)Note - the difference in annual performance is shown in brackets. Figures shown are percentages.
Source - Phonics 2018 Tables (DfE) Note - Figures shown are percentages.

Classification: PublicResidents, Education and Environmental Services Policy Overview Committee – 22 January 2019
Key Stage 1 Outcomes in Hillingdon:
In 2017/18 and as in previous years, by the end of Key Stage 1 pupils are expected to reach the national expected standard in Reading, Writing and Maths and to achieve the expected standard in Phonics.
● Overall outcomes at Key Stage 1 for 2017/18 show that more children in Hillingdon achieved the expected standard for each key area and for the combined result than the national average. Whilst attainment in Key Stage 1 in Hillingdon, therefore, remains satisfactory overall, it should be noted that this measure has improved less strongly than national and London and that is particularly the case in Literacy.
● Outcomes at the higher standard for Reading, Writing and Maths are now securely above the national average for each individual area and this is also the case for the overall combined result which demonstrates that Key Stage 1 provision in Hillingdon continues to provide appropriate stretch and challenge for more able pupils.
● Beyond attainment only, detailed analysis of Key Stage 1 outcomes in 2017/18 shows that overall children in Hillingdon make better progress than their peers nationally. This is particularly highlighted for those learners with English as an Additional Language who make progress that is significantly better than most children nationally and in many other local authorities. However, some groups of learners make significantly less positive progress from their starting points. These groups include children from disadvantaged backgrounds and those with SEND - and most particularly those without an Education Health and Care Plan. With regard to ethnicity, children from White first language English and Black Caribbean backgrounds made less progress than their peers from Early Years to Key Stage 1 in Hillingdon’s schools in 2017/18. Improving the rates of progress for these groups, with a particular focus on literacy, should be key areas of focus for schools across the borough in 2018/19 and beyond.
● With regard to gaps between key groups of pupils, whilst the attainment gap between disadvantaged and non-disadvantaged children in Hillingdon has remained broadly consistent for the past three years, 2017/18 demonstrated a widening of the progress gap between these groups. This was most notably the case for children from White backgrounds with prior middle attainment.
● For 2017/18, Hillingdon's KS1 Reading attainment at the Expected Standard is ranked 7th of 11 in relation to statistical neighbours. This ranking is down from 6th place in 2016/17. Against National the ranking is 57th (45th in 2016/17). Against London 26th (21st in 2017)
● For 2017/18, Hillingdon's KS1 Writing attainment at the Expected Standard is ranked 7th of 11 statistical neighbours. This ranking is down from 6th place in 2016/17. Against National the ranking is 72nd of 153 (52nd in 2016/17). Against London, 28th of 33 (24th in 2017)
● For 2017/18, Hillingdon's KS1 Maths attainment at the Expected Standard is ranked 5th of 11 statistical neighbours which remains in line with the previous year. Against National the ranking is 32nd of 153 (26th in 2016/17). Against London 18th of 33 (17th in 2017)

Classification: PublicResidents, Education and Environmental Services Policy Overview Committee – 22 January 2019
Table 8: Key Stage 1 Hillingdon National London
Subject Level 2016 2017 2018 2016 2017 2018 2016 2017 2018
Expected 75 77 (+2) 76 (-1)
74 76 (+2)
75 (-1)
77 78 (+1) 78 (-)
ReadingHigher 23 27 (+4) 27 (-) 24 25
(+1)26
(+1)26 27 (+1) 29
(+1)
Expected 66 70 (+4) 70 (-) 65 68 (+3)
70 (+2)
70 72 (+2) 73 (+1)
WritingHigher 13 18 (+5) 17 (-
1)13 16
(+3)16 (-
)17 18 (+1) 19
(+1)
Expected 75 78 (+3) 78 (-) 73 75 (+2)
76 (+1)
77 78 (+1) 79 (+1)
Maths
Higher 19 24 (+5) 25 (+1) 18 21 (+3)
22 (+1)
22 24 (+2) 25 (+1)
Expected 61.8 65.1(+3.3)
66.2 (+1.1)
60.3 63.7 (+3.4)
65.3 (+1.6)
65.4 67.7 (+2.3)
69.5 (+1.8)
RWM*Higher 8.4 12.4
(+4)12.8
(+0.4)8.9 11
(+2.1)11.7
(+0.7)Not
availableNot
availableNot
available
Source – KS1_2018_LATables (nb does not cover RWM combined - provisional figures are from KEYPAS) *Reading, Writing and Maths. Pupils must pass all three subjects to attain this pass

Classification: PublicResidents, Education and Environmental Services Policy Overview Committee – 22 January 2019
Source - KS1_2018_LATables
Key Stage 2
Key Stage 2 Outcomes and Progress in Hillingdon:
Outcomes data at Key Stage 2 is published with reference to both attainment and progress. In broad terms, attainment measures the quantitative outcome of testing or teacher assessment, whilst progress indicates the value that a school has added to learners from their starting points. In recent years, progress data has become as significant as attainment data in terms of measuring school effectiveness.
When considering published 2017/18 data for Key Stage 2 in Hillingdon it should be noted that overall attainment and progress data in Maths and the combined Reading, Writing and Maths measure was adversely affected by the suppression of one school’s final data, following investigation into test maladministration by the Standards and Testing Agency.
● Overall results for Hillingdon's children at Key Stage 2 at the end of 2017/18 were positive with the borough performing strongly against national averages for all key measures and for the combined Reading, Writing and Maths outcome.
● Particularly pleasing improvement is noted in Reading attainment in 2017/18 given the fact that the previous year’s results demonstrated a disappointing plateauing of outcomes against national averages. This improvement shows the impact of 2017/18’s targeted Reading and literacy improvement work across a group of identified schools who worked closely with the Council’s School Improvement Team following the publication of 2016/17 results.

Classification: PublicResidents, Education and Environmental Services Policy Overview Committee – 22 January 2019
● Positive improvement is also noted once again in Writing which had been a previous area of concern at Key Stage 2. Hillingdon’s outcomes in this area are now securely above the national average and are closing the gap against the aspirational All London average, further demonstrating increased teacher confidence in the use of the relatively new primary assessment system and the impact of the Council's primary assessment and moderation improvement focus over the past three years.
● The achievement of children at the Higher Standard in 2017/18 is more consistent than in previous years with most areas now in line with national averages. However, in order for the most able young learners in Hillingdon to attain as highly as their peers across London, the focus on consistently strong rates of progress and attainment should remain a key focus for schools across the borough.
● Last academic year, progress data showed that Hillingdon's overall progress measures from Key Stage 1 to Key Stage 2 in 2016/17 were positive in both Writing and Maths but fell slightly below the national average in Reading. In 2017/18, progress measures in Hillingdon showed improvement across all three measures and are now positive. This underlines the sector’s successful reversal of decline in Reading progress.
● Detailed analysis of Key Stage 2 outcomes and progress show that children with English as an Additional Language continue to achieve and progress particularly well in Hillingdon but that those children whose first language is English and those of Black Caribbean heritage perform less strongly and make less positive progress, as do those disadvantaged or vulnerable including those with SEND. These groups of children should remain a key area of focus for primary schools in Hillingdon during 2018/19 and beyond.
● In addition and overall, it is noted that boys tended to make more progress than girls at Key Stage 2.
● For 2017/18, Hillingdon's KS2 Reading attainment at the Expected Standard is ranked 5th of 11 in relation to statistical neighbours which reflects the improvements in targeted schools last year (8th 2016/17).
● For 2017/18, Hillingdon's KS2 Writing attainment at the Expected Standard is ranked 6th of 11 statistical neighbours which remains in line with the 2016/17 result.
● For 2017/18, Hillingdon's KS2 Maths attainment at the Expected Standard is ranked 8th of 11 statistical neighbours which compares to 7th in 2016/17.
● For 2017/18, Hillingdon's KS2 Grammar, Punctuation and Spelling (GPS) attainment at the Expected Standard is ranked 7th of 11 statistical neighbours which remains in line with the previous year.
● For 2017/18, Hillingdon's combined Reading, Writing and Maths at the Expected Standard is ranked 8th of 11 against our statistical neighbours (7th 2016/17).
● In relation to London boroughs, Key Stage 2 combined RWM attainment is ranked 29th of 33 (26th 2016/17).
● With reference to national rankings, Hillingdon’s Key Stage 2 RWM attainment is now 59th of 153 local authorities. (46th 2016/17).

Classification: PublicResidents, Education and Environmental Services Policy Overview Committee – 22 January 2019
● In terms of Progress Scores, Hillingdon ranked as follows in 2017/18 (with previous 2016/17 positions in brackets for comparison purposes):
Reading - statistical neighbours 6th of 11 (8th previously), London boroughs 26th of 33 (31st previously) and National 61st of 153 (101st previously).
Writing - statistical neighbours 8th of 11 (in line with previous year), London boroughs 28th of 33 (in line with previous year) and National 70th of 153 (67th previously)
Maths - statistical neighbours 6th of 11 (7th previously), London boroughs 22nd of 33 (28th previously) and National 31st of 153 (38th previously).
Key Stage 1 to 2 Progress Scores 2016 - 2018
Reading Writing Maths
2016 2017 2018 2016 2017 2018 2016 2017 2018
Key Stage 1
to 2 Progress levels
+0.3 -0.3 +0.2 +0.1 +0.2 +0.2 +1.3 +1 +1.1
Source - Key Stage 2 Local Authority tables (published 13/12/2018) NB National progress is 0
Table 9: Key Stage 2 Hillingdon National London
Subject Level 2016 2017 2018 2016 2017 2018 2016 2017 2018
Expected 70 72 (+2)
78 (+6) 66 72 (+6)
76 (+4) 69 75 (+6)
79 (+4)
Higher 19 24 (+5)
29 (+5) 19 25 (+6)
28 (+3) 21 27 (+6)
31 (+4)Reading
Average Scaled Score
103 104 (+1)
105 (+1)
103 104 (+1)
105 (+1)
103 105 (+2)
106 (+1)
Writing (TA)
Expected 72 78 (+6)
81 (+3) 74 77 (+3)
79 (+2) 76 81 (+5)
82 (+1)

Classification: PublicResidents, Education and Environmental Services Policy Overview Committee – 22 January 2019
Higher 16 18 (+2)
21 (+3) 15 18 (+3)
20 (+2) 17 21 (+4)
24 (+3)
Expected 76 80 (+4)
78 (-2) 70 75 (+5)
76 (+1) 77 81 (+4)
81 (-)
Higher 24 29 (+5)
31 (+3) 17 23 (+6)
24 (+1) 23 30 (+7)
31 (+1)Maths
Average Scaled Score
105 106 (+1)
106 (-) 103 104 (+1)
104 (-) 104 106 (+2)
106 (-)
Expected 80 83 (+3)
83 (-) 73 78 (+5)
78 (-) 79 83 (+4)
83 (-)
Higher 31 40 (+9)
45 (+5) 23 31 (+8)
35 (+4) 29 40 (+11)
44 (+4)GPS
Average Scaled Score
106 108 (+2)
108 (-) 104 106 (+2)
106 (-) 105 108 (+3)
108 (-)
Expected 55 64 (+9)
66 (+2) 53
62 (+9)
65 (+3) 57 67 (+10)
70 (+3)RWM
(Combined Result)
Higher 7 10 (+3)
12 (+2) 5 9 (+4)
10 (+1) 7 11 (+4)
13 (+2)
Source - Key Stage 2 Local Authority tables (published 13/12/2018)Apart from Scaled Scores the figures shown are percentages.

Classification: PublicResidents, Education and Environmental Services Policy Overview Committee – 22 January 2019
Source - Key Stage 2 Local Authority tables (published 13/12/2018). NB figures for statistical neighbours are provisional.
Priorities for Primary Phase Key Stages 1 & 2 Education 2018/19
● Continue to work with the sector to promote the acceleration of progress and outcomes for underachieving groups in Hillingdon. This will include using a formal partnership approach to raise the awareness of all schools with regard to potential barriers to progress for these groups and signposting school leaders to sources of good practice, funding or support.
● Focus on closing gender gaps in literacy achievement overall through enhanced links with providers of local literacy improvement support, including Teaching Schools and national organisations.
● Allocating School Improvement Team resource to work actively with maintained schools to ensure that the percentages of children attaining the higher standard is consistent across the key areas in Hillingdon and matches London averages.
● Use the primary progress measures alongside attainment data to target school improvement resources, challenging the performance of schools whose progress scores are not yet in line with national averages for each key area and ensuring that governing bodies understand the significance of progress data for whole cohorts and individual groups.
● Facilitate access to effective literacy intervention and support for maintained schools whose Key Stage 1 literacy outcomes were less positive this year.
● Work closely with local Teaching Schools and other national and local providers to develop a strong partnership support and development offer for schools to access in order to ensure that overall standards of education in Hillingdon continue to rise and that improved outcomes over the past three years are maintained in the landscape of local and national school improvement change. Use emerging partnership structures to challenge schools

Classification: PublicResidents, Education and Environmental Services Policy Overview Committee – 22 January 2019
within and beyond the maintained sector to further raise expectations and aspirations for children and young people in Hillingdon.
Section 3: KS4 Secondary and Post-16 Education 2017/18
Key Stage 4 Outcomes in Hillingdon: Percentage of overall results including performance measures for progress and attainment
● For 2017/18, secondary schools reported against the national Progress 8 measure for all schools which is calculated using the Attainment 8 scores of individual pupils; the standard and strong pass system within the new 9 - 1 grades system for core subjects and the English Baccalaureate (Ebacc) measure.
● Overall results at Key Stage 4 in Hillingdon’s secondary settings continued to rise in 2017/18 with each of the main performance measures outperforming national data for this sector.
● It is positive to note that Hillingdon’s secondary schools have made particular progress in securing a greater proportion of strong passes at 9 - 5 English and Maths and are now within approx 1% of the aspirational All London average.
● Overall Ebacc outcomes in Hillingdon's secondary schools continue to compare positively with the national average for this measure although this measure remains significantly below the London average and, as is the case nationally and across London, has declined at the strong pass standard.
● The Progress 8 score for the secondary sector, which is the key measure for evaluating the overall value that secondary schools add to learners from primary school to the end of Key Stage 4, is positive again this year and compares well to the national average. This score demonstrates that, collectively, Hillingdon secondary schools add more value to their pupils’ learning than secondary schools nationally.
● Attainment 8 scores per pupil show that young people in Hillingdon attained results in 2017/18 that were better than their peers nationally at Key Stage 4.
● Detailed analysis of Key Stage 4 outcomes shows that children with English as an Additional Language continue to achieve particularly well in Hillingdon and that girls also achieve well but that boys in general, those children whose first language is English and those of Black Caribbean heritage perform less strongly as do those disadvantaged or vulnerable including young people with SEND. Improving outcomes and progress for these groups should remain as a priority focus for secondary schools in Hillingdon during 2018/19.
● In addition, it is noted that overall progress in some subjects taken by significant numbers of learners in 2017/18 should be areas of development across secondary schools in Hillingdon. These include Spanish, Art and Design, Geography and DT Resistant Materials.
● With regard to young people facing disadvantage in Hillingdon, it continues to be the case that White, male boys especially have poorer outcomes and make less progress overall and that this is additionally affected by SEND status.

Classification: PublicResidents, Education and Environmental Services Policy Overview Committee – 22 January 2019
(NB the following rankings for 2017/18 are extracted from the Provisional Statistical Release from the DfE - final results should be available in late January 2019).
● In relation to our statistical neighbours Hillingdon is ranked 8th of 11 statistical neighbours for standard passes in English and Maths (9 to 4), unchanged from 2016/17. Also 7th of 11 for strong passes in English and Maths (9 to 5 - strong) up from 9th in 2016/17. In terms of the Progress 8 measure, Hillingdon was ranked 8th against statistical neighbours, which is unchanged from 2016/17.
● In 2017/18, for the standard pass measure Hillingdon ranked 21st out of 33 London local authorities, the ranking in 2016/17 was 20th. For strong passes Hillingdon now ranks 17th which is an improvement on 21st in 2016/17. In terms of the Progress 8 measure, Hillingdon is ranked 21st within 33 London boroughs compared to 20th the previous year.
● Within all local authorities nationally, Hillingdon’s standard pass outcomes for English and Maths now rank 35th of 153 national authorities, a major improvement on 48th in 2016/17. For strong passes Hillingdon is now 50th of 153, compared to 49th the previous year. In terms of the Progress 8 measure, Hillingdon is ranked now 32nd of 153 national authorities in 2017/18, this compares to 26th in 2016/17.

Classification: PublicResidents, Education and Environmental Services Policy Overview Committee – 22 January 2019
Table 10: Key Stage 4
Hillingdon National London
Subject 2016 2017 2018 2016 2017 2018 2016 2017 2018
New from 2017: 9 to 4 pass in English and Maths*
65.3 66.8 (+1.5)
66.7 (-0.1)
63.3 64.2 (+0.9)
64.2 (-) 66.4 67.9 (+1.5)
67.7 (-0.2)
NEW from 2017: 9 to 5 (strong) pass in English and Maths
- 45.3 47.4 (+2.1)
- 42.9 43.2 (+0.3)
- 48.2 48.5 (+0.3)
New from 2017 = % EBacc 9-4 PASS
25.9 27.2 (+1.3)
27.4 (+0.2)
24.6 23.9
(-0.7)
24.1 (+0.2)
31.6 32 (+0.4)
32.6 (+0.5)
NEW from 2017 % EBacc 9-5 Strong pass
- 24 18.6 (-5.4)
- 21.4 16.7 (-4.7)
- 28.8 23.2 (-5.6)
Average Progress 8 score
0.07 0.14 (+0.07)
0.13 (-0.01)
-0.03 -0.03
(-)
-0.03 (-) 0.16 0.22 (+0.06)
0.22 (-)
Average attainment 8 score per pupil
51.1 47.1
(-4)
47.5 (+0.04)
49.9 46.4
(-3.5)
46.5 (+0.01)
51.7 48.9
(-2.8)
49.2 (+0.03)
*Prior to 2017 this was the equivalent of GCSE A*-C in English and Maths. Ebacc 9 -4 includes passes in English and MathsSource – Source – 2018 LA Tables KS4 Provisional (from DfE) and NCER (EBacc scores)

Classification: PublicResidents, Education and Environmental Services Policy Overview Committee – 22 January 2019
Source – 2018 LA Tables KS4 Provisional (from DfE) and NCER (EBacc scores)
Priorities for Secondary Education Key Stage 4 2018/19
● Supporting the two remaining LA Secondary Schools for which the LA retains responsibility for educational standards with a particular focus on progress scores for vulnerable or disadvantaged groups.
● Working with the wider secondary school sector, via established and emerging partnership groups, to address variations in progress scores, for all young people and, particularly, for those most at risk of underachievement including young people with SEND and their disadvantaged peers. This will include utilising appropriate challenge and support mechanisms and escalating concerns of unacceptable underperformance, where necessary, to the relevant responsible bodies. This includes the Regional Schools Commissioner and / or the Secretary of State for Education where improvements are not being expedited in academy settings.
Key Stage 5
Key Stage 5 Outcomes in Hillingdon
● In 2017/18, Hillingdon schools showed improved performance in APS (Average Point Score) per entry at Level 3 and for overall percentages at the higher grades at A Level when compared to 2016/17 but remained below the national and London average attainment levels. However, provisional data for 2017/18, shows a reduction in performance in APS per level 3 entry (this was also the case for London overall but the reduction for Hillingdon was significantly higher).

Classification: PublicResidents, Education and Environmental Services Policy Overview Committee – 22 January 2019
● In relation to the percentage of A level students achieving higher grades (AAB or better), in 2017/18 this decreased nationally, in London and in Hillingdon. However, performance in Hillingdon decreased more significantly than elsewhere. In addition, the proportion of Hillingdon students achieving the highest grades in 'facilitating' subjects (i.e. those subjects recommended by Russell Group universities as most likely to lead to the widest range of options for degree level study) declined. Provisional data for for 2017/18 shows a decline nationally and London-wide in the percentage of students achieving the highest grades at A level but this decline was more marked in Hillingdon.
Level 3 Students*
APS** Per Entry
Table 11: Key Stage 5 -
covers state funded school
students.
2016 2017 2018
England – state sector
32.1 33.23 (1.13) 32.02 (-1.21)
London 32.53 33.62 (1.09) 32.48 (-1.14)
Hillingdon 29.9 31.04 (1.14) 28.84 (-2.2)
A Level Students
APS** Per EntryPercentage of Students achieving Grades AAB or better at A Level
Percentage of students achieving Grades AAB or better at A Level, of which at least 2 are in facilitating subjects.
Table 11a: Key Stage 5
2016 2017 2018 2016 2017 2018 2016 2017 2018
England – state sector
30.84 32.39 (1.55)
32.15 (-0.22))
19.9 20.7 (0.8)
19.2(-1.5)
15.6 16 (+0.4) 15.1(-0.9)
London 31.42 32.39 (0.97)
32.76 (0.37)
20.2 22.2 (2)
20.5(-1.7)
16.4 17.6 (1.2) 16.2(-1.4)
Hillingdon 28.33 29.34 (1.01)
29(-0.34)
13.5 15.9 (2.4)
11.9(-4)
10.4 9.9(-0.5)
8(-1.9)
Source - 2018 Provisional LA Tables KS5 (DfE) Table 9B - Mainstream Schools only - does not cover Colleges.

Classification: PublicResidents, Education and Environmental Services Policy Overview Committee – 22 January 2019
* Level 3 is for students studying applied general and technical level qualifications**APS - Average Points Score
Table 11b: Key Stage 5 - covers state funded school
students.
Level 3 Technical Level Students***
APS** Per Entry
2016 2017 2018
England – state sector 36.89 38.47 29.01
London 36.89 38.18 30.43
Hillingdon 37.22 39.46 30.08
Table 11c: Key Stage 5 - covers state funded school
students.
Level 2 Students Vocational Qualifications****
APS** Per Entry
2016 2017 2018
England – state sector N/A 5.69 5.72
London N/A 5.49 5.57
Hillingdon N/A 5.6 5.7
*** Students at the end of Advanced level study who were entered for at least one Tech level Qualification during 16 to 18 study.
**** Students at the end of 16 to 18 study who were entered for at least one Level 2 Vocational Qualification of size equivalent to at least 2 GCSE's.
NB 2018 results in the tables are provisional and may change - 2016 & 2017 figures are final.

Classification: PublicResidents, Education and Environmental Services Policy Overview Committee – 22 January 2019
Priorities for Secondary Key Stage 5 Education 2018/19
● To work with secondary Head Teachers to address the underlying reasons for sustained borough-wide underperformance at Key Stage 5 A Level
● To challenge the leaders responsible for the quality of outcomes at this phase to work together effectively to improve outcomes for young people taking A Levels in Hillingdon
● To monitor the impact of the work of the sector’s Hillingdon Key Stage 5 Development Group in improving outcomes at Key Stage 5, including outcomes for previous high attainers.
Section 4: Outcomes for vulnerable children
Children Looked After (CLA)
Since the Ofsted single inspection in November 2013, the Virtual School has been through a significant transformation in order to implement the recommendations from the report. The changes to the staffing structure, policies, procedures and practice of the Virtual School have resulted in improved attainment and progress for Hillingdon Children Looked After, higher quality Personal Education Plans, which are completed to statutory timeframes and timely access to appropriate high quality education provision for our young people. This is evidenced through the Virtual School self assessment framework and acknowledged in the ILAC OFSTED inspection report published on 30th May 2018 which reported:
“The virtual school provides effective support for the progress and attainment of children in care. Children in care and care leavers talk positively about the virtual school, which is staffed by an experienced, well-qualified and enthusiastic team. Since the previous inspection, leaders have invested well in the virtual school to improve the quality of help that children in care receive. Staff have a very good knowledge of children and young people’s needs and they track and monitor the progress of children in care effectively. When children fall behind, staff act quickly to improve the support available. All personal education plans are of a good quality. The majority of children and young people attend school regularly and make good progress relative to their starting points. The achievements of children and young people are regularly celebrated through the annual Kids in Care Awards, and there is an excellent range of regular enrichment activities in place, funded by the pupil premium plus. Local data indicates that currently 74% of care leavers are in education, employment and training. A panel is in place where education providers come together to explore options for young people who are not in education, employment or training (NEET). While this is early in development, it is showing encouraging signs of success. The virtual school has good programmes that promote young people’s aspirations and attendance at university. Personal advisers strongly advocate for young people’s rights and entitlements and the virtual school provides appropriate information, advice and guidance to staff for care leavers over 18 years old. Investment in the education of children in care is a priority for leaders. Children recognise this and they benefit from good quality personal education plans and effective use of the pupil premium. Senior leaders and the corporate parenting board have regular contact and meetings with children, including representatives of the children in care council. Children report positively on changes that happen because of their feedback ”

Classification: PublicResidents, Education and Environmental Services Policy Overview Committee – 22 January 2019
This contributed to Hillingdon Children's Services overall judgement of good, with outstanding leadership.
Children Looked After Attainment and Progress Summary 2017/18
In respect of the reported statistics for Hillingdon, CLA nationally and the London region by the DfE in the SFR, it is important to recognise that these are based on the ability of NCER to match SSD903 CLA data and NPD attainment data. Due to issues with this matching, which often omits CLA with complex SEND, who consequently do not sit end of KS examinations, those who move to locations which do not follow the English education system and independent setting who have different reporting mechanisms, there may be differences in the statistics reported nationally and by the Virtual School in this report.
● The eligible Year 6 cohort that contributes to the national indicators for attainment at the end of KS2 consisted of 8 CLA. The attainment of the cohort in relation to those who obtained age related expectation or above in reading, writing, spelling, punctuation and grammar and maths at the end of KS2 was 50%, 50%, 62% and 50% Targets were set strictly based on the KS1 results the young people entered KS2 with at 62% in reading, writing, spelling, punctuation and grammar and maths. This 62% target was met for spelling, punctuation and grammar but not for reading, writing or maths.
● 50% of the cohort achieved expected attainment in reading, writing and maths with none achieving at a higher standard across the 3 subjects. Although it is worth noting that 2 young people met the higher standard in 2 of the 3 subjects and a further young person met the higher standard in 1 of the 3 subjects.. In relation to progress the VS school recorded reading progress of +3.7, writing progress of -1.5 and maths progress of -0.17 based on the mean average of its KS2 CLA progress scores in the respective subject.
● The national/London comparisons for CLA for 2018 are yet to be released, but to provide a benchmark, 32% of CLA reached the new expected standard or above in the headline measure reading, writing and mathematics in 2017.
CLA Key Stage 2 Reading Writing GPS Maths RWM*
Hillingdon VS 2017 43 57 29 43 43Hillingdon SFR 50 62.5 37.5 50 50Outer London SFR 58 60 61 58 44National SFR 45 48 50 46 32Hillingdon VS 2018 50 50 62 50 50
Source - Hillingdon Virtual School CLA Key Stage 2 data 2017/2018 and SFR 20/2018 28 March 2018 Outcomes for children looked after by local authorities in England, 31 March 2017Figures shown are percentages.*Reading, Writing & Maths Combined (pupils must achieve all 3 elements)
● Attainment at the end of Key Stage 4 showed Hillingdon's eligible CLA (23) exceeding our Attainment 8 target of 21.8 and our Progress 8 target of -2. These results are a considerable achievement and success when you consider the characteristics of the cohort. It is also worth noting a further 7 young people (30.4%) achieved grade 4 or above in either English or Maths.

Classification: PublicResidents, Education and Environmental Services Policy Overview Committee – 22 January 2019
● The cohort totalled 23 young people, of which only 16 sat one or more GCSEs. Of the seven who did not sit GCSEs, two were entered for Scottish Nationals, four were considered inappropriate for GCSE due to their SEN and 1 was considered inappropriate for GCSE because of EAL needs. Consequently none of these seven young people were able to contribute positively to our statistics, despite having to be included within them.
● In terms of CLA context, 9 (39%) are UASC and have English as an additional language and 9 (39%) have an EHCP. 52% of the cohort were living in residential placements or semi independent living. 14 (61%) had placement changes in KS4, with 9 resulting in a change of school. In addition to this, it is worth noting that of the 23 young people in this cohort, only 9 hold Key Stage 2 data from which accurate progress can be measured.
The information below outlines KS4 achievement in 2018 against the new headline measure for this cohort of 23 CLA as reported by the Hillingdon Virtual School, these are benchmarked against available NCER 2017 national CLA statistics and the statistics reported by the Virtual School in 2017.
Hillingdon VS (25 CLA)
Hillingdon VS (23 CLA)
Children Looked After- Key Stage 4
National 2017SFR
2017 2018Average Attainment 8 score
19.3 28.53 22.71Average Progress 8 score
-1.18 -1.48 -0.947NEW from 2018: 9 to 5 (strong) pass in English and Maths not available 12 9Percentage of pupils entered for EBacc 8.6 8 17New from 2018: Average EBacc point score not available not available 0Percentage of students staying in education or employment after Key Stage 4
not available 88 91
Source - Hillingdon Virtual School CLA Key Stage 2 data 2017/2018 and SFR 20/2018 28 March 2018 Outcomes for children looked after by local authorities in England, 31 March 2017
● In Hillingdon, school attendance for our children of statutory school age continues to be high on our agenda due to the attendance falling to a figure of 90.58% across the 2017/18 academic year. Absence rates for Children Looked After nationally were 3.9% in 2016 and 4.3% in 2017. However, this figure is computed on CLA in England for at least 12 months as at 31st March 2017, whereas the Hillingdon figure (9.42%) is for all our Children Looked After of statutory school age, no matter how long they have been in care.
● A high proportion of the persistent absentees are in KS4, where attendance continues to be impacted by a variety of other factors namely school type, SEN and school/placement changes. Significant work continues to be undertaken by the team to address these issues in conjunction with social care colleagues and schools.

Classification: PublicResidents, Education and Environmental Services Policy Overview Committee – 22 January 2019
Priorities for Children Looked After in Hillingdon 2018/19
● To continue to maximise progress and close the attainment gap for Children Looked After and Care Leavers by informed use of data, PP+ funding and targeted support, particularly at KS1, KS2, KS4 and KS5.
● To ensure young people’s voice informs PEP processes and service offer/support.
● To improve baseline assessments and reporting for UASC in order to better gauge progress from point of school entry.
● To improve the average attendance of Hillingdon statutory school age CLA, reduce unauthorised absence and persistent absenteeism through closer working with foster carers, social care colleagues and schools and with early help services to impact on support received prior to entering care.
● To reduce the number of fixed term exclusions and school days lost as a result of exclusion.
● To use data analysis and learning from PP+ evaluations to inform PEP targets and PP+ allocation, holding schools to greater account for funding received in order to improve outcomes for specific cohorts including UASC/SEN support.
● To further strengthen the relationship and collaborative working with colleagues in SEND, inclusion and multi sensory teams and seek out further opportunities to support CLA with SEND and build up the resources to help them engage with learning.
● To further strengthen the collaborative working with social care to reduce school changes, particularly as a result of care placement breakdown and to work with the placements team to inform appropriate high cost provision matching for CLA, and those entering care.
● To continue to ensure that the transition of Hillingdon CLA from year 6 to 7 is well supported, so that young people continue to make steady progress across educational settings and reduce any potential negative impact on attainment.
● To further promote the understanding of school staff and foster carers/key workers on attachment difficulties and the impact of trauma on learning for CLA, through dissemination of training and observational work.
● To strengthen transition from KS5 to leaving care and to develop a better understanding of educational needs post 18 in order to support HE access and provide appropriate IAG.
● To reduce NEET figures for 16-18 Hillingdon CLA through strengthening transition from KS4 to KS5, usage of the newly developed PEP NEET support plan and the continued development of the NEET working group to share good practice and provide focused support.
Special Education Needs and/or Disabilities (SEND)
● Since 2013/14, Hillingdon, along with all Local Authorities across the country, has been working with schools to manage the transition to the new SEN Code of Practice. A key element of this work has been focused on the replacement of the SEN Statement with the

Classification: PublicResidents, Education and Environmental Services Policy Overview Committee – 22 January 2019
Education, Health and Care Plan (EHCP) and the categorisation of all other children and young people with SEND as SEN Support. When interpreting data for children and young people with SEND it should be noted that progress from year to year will always depend on the specific needs of individual children and the marked variations in cohort profile.
● Pleasingly, Hillingdon successfully transfered nearly all SEN Statements to Education Health and Care Plans (EHCPs) by March 2018. All cases were transferred by April 2018.
● For children and young people with SEND, there are now only two recognised levels of support; SEN Support and EHCPs.
● The Council's early intervention, prevention and special educational needs services (which includes the Early Support Team, the Inclusion Team, the Sensory Intervention Team, the SEND information and Support Service, the SEND Team, the Educational Psychology Team) are the council teams that work most closely with schools and the council's School Improvement Team to address concerns regarding the progress and outcomes of children and young people with SEND in Hillingdon's schools.
● Closing the gaps in outcomes and progress for vulnerable children and young people is key to ensuring high standards of education in Hillingdon's schools and the Council recognises that outcomes for children and young people with SEND are not yet consistently strong in all schools or across all phases.
● 2017/18 data for SEND students within Hillingdon at KS1 indicates that at SEN support, performance is down in Reading and the gap with non SEND children has widened by 4%. In Maths, there has been no change in performance for this cohort but the gap has slightly widened between these students and their non SEND peers. In Writing performance is up and the gap between non SEND students has pleasingly narrowed. For children with EHCPs in KS1, performance is down in all 3 areas and the gap with non SEND peers has widened to a greater extent than the national average.
● At KS2 there have been positive improvements within both SEN Support and EHCP cohorts. All pupils at SEN Support have performed better than in 2016/17 and for children with EHCPs performance has improved by 4% and the gap with non SEND peers has narrowed by 2%.
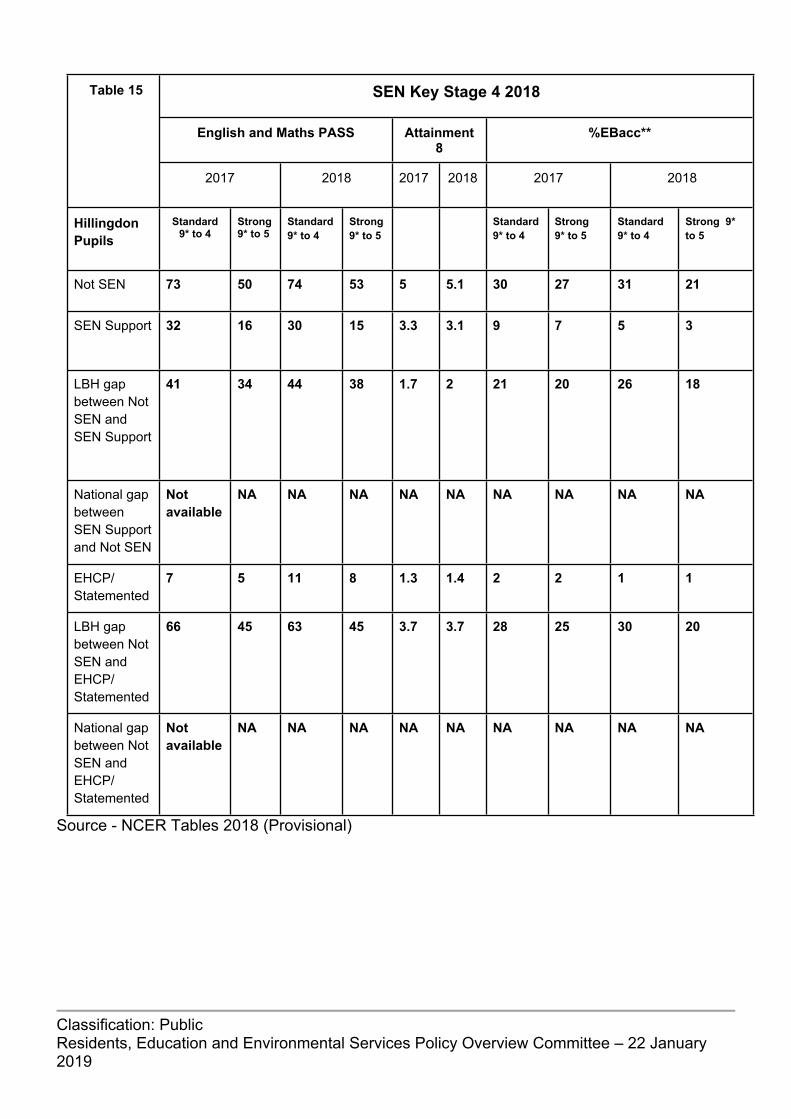
● At KS4 performance for children at SEN Support overall has declined. At Key Stage 4 it is not yet possible to compare Hillingdon's gaps with national gaps for 2017-18 as this information is not yet available.
● Analysis of SEND needs in Hillingdon in 2017/18 shows that Communication and Interaction needs including autism and speech and language difficulties continue to be the most prevalent areas of need across the Borough with a higher proportion of young people with SEND displaying needs within the Social, Emotional and Mental Health area of need as they move into secondary education.

Classification: PublicResidents, Education and Environmental Services Policy Overview Committee – 22 January 2019
Percentages of attainment for children with SEND
Table 13: SEN Key Stage 1 2018
Individual Scores for Reading, Writing and Maths
Actual results for expected standard
Reading Writing Maths
Hillingdon Pupils
2016 2017 2018 2016 2017 2018 2016 2017 2018
Not SEN (3472) 82 85 84 74 78 79 82 86 87
SEN Support (532)
35 42 37 25 25 28 41 43 43
LBH gap between Not SEN and SEN Support
47 43 47 49 53 51 41 43 44
National gap between Not SEN and SEN Support
50 50 52 52 54 54 47 48 48
EHCP & Statemented (133)
18 14 11 12 9 7 18 12 12
LBH gap between Not SEN and EHCP & Statemented
64 71 73 62 69 72 64 74 75
National gap between Not SEN and EHCP & Statemented
68 70 72 65 68 70 66 69 71
Source – KS1 Tables 2018 (DfE)

Classification: PublicResidents, Education and Environmental Services Policy Overview Committee – 22 January 2019
Table 14: SEN Key Stage 2 2018Combined Scores for Reading, Writing and Maths
Actual results for Expected StandardHillingdon Pupils
2016 2017 2018
Not SEN (3090) 66 72 75
SEN SUPPORT (437) 19 24 26
LBH gap between Not SEN and SEN Support
47 48 49
National gap between Not SEN and SEN Support
46 50 50
EHCP & Statemented (162) 10 6 10
LBH gap between Not SEN and EHCP & Statemented
56 66 65
National gap between Not SEN and EHCP & Statemented
55 63 65
Source - Key Stage 2 Local Authority Tables - issued 13/12/2018
Classification: PublicResidents, Education and Environmental Services Policy Overview Committee – 22 January 2019
SEN Key Stage 4 2018
English and Maths PASS Attainment 8
%EBacc**
Table 15
2017 2018 2017 2018 2017 2018
Hillingdon Pupils
Standard 9* to 4
Strong 9* to 5
Standard 9* to 4
Strong 9* to 5
Standard 9* to 4
Strong 9* to 5
Standard 9* to 4
Strong 9* to 5
Not SEN 73 50 74 53 5 5.1 30 27 31 21
SEN Support 32 16 30 15 3.3 3.1 9 7 5 3
LBH gap between Not SEN and SEN Support
41 34 44 38 1.7 2 21 20 26 18
National gap between SEN Support and Not SEN
Not available
NA NA NA NA NA NA NA NA NA
EHCP/ Statemented
7 5 11 8 1.3 1.4 2 2 1 1
LBH gap between Not SEN and EHCP/ Statemented
66 45 63 45 3.7 3.7 28 25 30 20
National gap between Not SEN and EHCP/ Statemented
Not available
NA NA NA NA NA NA NA NA NA
Source - NCER Tables 2018 (Provisional)

Classification: PublicResidents, Education and Environmental Services Policy Overview Committee – 22 January 2019
Priorities for Children with SEND in Hillingdon
● Delivery of actions and outcomes as detailed in the SEND Strategy and Delivery Plan.● Work is ongoing to improve outcomes for children and young people with SEND, both at
SEN Support and for those with Education Health and Care Plans. Particular attention will continue to be given to this cohort by schools, to ensure they achieve in line with mainstream peers as closely as possible where appropriate.
● Performance at Key Stage 1 for all children with SEND is an area of focus for the next academic year, following a deterioration in attainment across the board. Whilst work will be driven by schools, the Council’s facilitation of SCERTS training will greatly support a number of schools in improving outcomes for children with SEND, especially in mainstream primary schools.
● SCERTS Training is being provided to 35 schools as a result of a successful bid for funding from the Department for Education submitted by the Council’s Inclusion Team. SCERTS directly relates to supporting children with their social communication, emotional regulation and transactions to enable them to become active and engaged learners. The training sessions will begin in January 2019.
● SEND Services across the Council are actively promoting the use of the ‘My Support Plan’ within Hillingdon schools, as a vehicle to ensure co-produced outcome focussed planning is taking place for all children and young people with SEND. This tool should enable settings and families to jointly plan and monitor the support that is in place for children with SEND, keeping their progress under constant review.
● Whilst Key Stage 5 data is not provided, promoting and improving longer term outcomes for young people with SEND is a priority. The Council currently support a number of successful supported internship programmes for young people with SEND but are seeking to expand this offer to ensure as many young people move into employment or training as possible upon conclusion of their educational career.
Closing the Gap between Disadvantaged Pupils and their Peers
● In 2017/18, all schools continued to receive additional funding from the Department of Education (DfE) to raise the attainment and improve the progress of children and young people from disadvantaged backgrounds. This funding, known as the Pupil Premium grant, can be used by schools in any way that they choose but must show an impact on outcomes for children from the poorest backgrounds. Schools are held to account for the use of Pupil Premium grant funding by Ofsted through the new inspection framework and also through strong governance at individual school and Local Authority level.
● At Key Stage 1, the gap between children eligible for pupil premium funding and their non disadvantaged peers narrowed slightly in 2017/18 and is smaller than the gap nationally. This represents a positive improvement from last year.
● At Key Stage 2 the gap between children eligible for pupil premium funding and their non disadvantaged peers has also reduced for 2017/18. Data for comparison with national gaps 2017/18 is not yet available.
● At Key Stage 4 and in terms of attainment of the English and Maths standard pass the gap between the young people eligible for pupil premium funding and their non disadvantaged peers narrowed in 2017/18. Data for comparison with national gaps 2017/18 is not yet available.

Classification: PublicResidents, Education and Environmental Services Policy Overview Committee – 22 January 2019
● The national focus on the reduction of inequality through improved educational outcomes for children and young people facing disadvantage continues to be a key focus for schools in Hillingdon. The Council’s School Improvement Team uses the outcomes and progress of disadvantaged learners as a key element in the risk assessment of maintained schools and continues to highlight the importance of local solutions to raise standards for this cohort of young people in the borough.
● Schools whose outcomes for disadvantaged learners are consistently significantly poorer than for non-disadvantaged learners and where these gaps are not closing are encouraged to identify and work closely with schools whose outcomes for these cohorts have improved.
Key stage 1 Attainment for children eligible for Pupil Premium funding 2016 to 18
Table 16: Pupil Premium Key Stage 1 2016 to 2018Individual Scores for Reading, Writing and Maths
Actual results for Expected Standard
Reading Writing Maths Hillingdon Pupils
2016 2017 2018 2016 2017 2018 2016 2017 2018
Not FSM in last 6 years (3463)
77 80 79 68 72 73 78 81 81
FSM in last 6 years (685)
63 63 64 54 51 55 62 60 63
LBH Gap between No FSM & FSM
14 17 15 14 19 18 16 21 18
National gap between No FSM & FSM
17 17 16.5 18 19 19 17 18 17
Source - NCER 2018

Classification: PublicResidents, Education and Environmental Services Policy Overview Committee – 22 January 2019
Key Stage 2 Attainment for children eligible for Pupil Premium funding 2016 to 2018
Table 17:Pupil Premium Key Stage 2 2016 to 2018
% for Reading, Writing and Maths Combined
Hillingdon Pupils Actual results for Expected Standard*
2016 2017 2018
Not FSM in last 6 years (3167) 63 70 71
FSM in last 6 years (522) 45 48 54
LBH Gap between No FSM and FSM 18 22 17
National gap between No FSM and FSM 22 20 NA
Source - NCER Tables 2018 (Provisional)

Classification: PublicResidents, Education and Environmental Services Policy Overview Committee – 22 January 2019
Key Stage 4 Attainment for children eligible for Pupil Premium funding 2016 to 2018
Table 18:Pupil Premium Key Stage 4 2016 to 2018
Level 9 to 4: % English
and Maths
Progress 8 scores
% Ebacc**
Hillingdon Pupils
2016 2017 2018 2016 2017 2018 2016 2017 2018
Not FSM in last 6 years (2217)
73 73 74 0.21 0.27 0.32 31 31 33
FSM in last 6 years (856)
45 50 53 -0.28 -0.19 -0.18 14 17 17
LBH Gap between No FSM and FSM
28 23 21 -0.49 -0.46 -0.5 17 14 16
National gap between No FSM and FSM
28 NA NA -0.48 N/A NA 18 N/A NA
Source - NCER Tables 2018 (Provisional) - SFR does not yet have pupil characteristics*Average Point Scores are the total points achieved by pupils in their best 8 GCSEs (or equivalents).**English BaccalaureateAll are based on "New First Entry"
Young People Not in Education, Employment or Training (NEET)
The Council’s Participation Team undertake a number of functions concerned with ensuring children and young people access their education entitlement and benefit from sustained participation in education, employment and training (EET). This work includes the ongoing tracking of young people’s participation so that targeted support may be provided for those who may have disengaged from EET.
The service leads on the assuring the ‘September Guarantee’, a process whereby 16 and 17 year olds are enabled to find and secure education and training provision so that they may remain in learning. Work continues between September and January with a view to ensuring that young people have found suitable education and training provision and sustained their participation in identified placements. Participation data will fluctuate at points in the year, particularly in during the summer, which is a key transition point where destinations change post Y1 and Y12.
The very latest available data is tabled below. The first part of the table includes the latest nationally released statistics which take us to end of 2016. The second part of the table contains

Classification: PublicResidents, Education and Environmental Services Policy Overview Committee – 22 January 2019
more up to date statistics (to the end of August 2018) produced in collaboration with the West London Partnership.
* Source - LA_NEET_and_Not_Known_Figures_2016_FINAL (DfE October 2018) ** latest GLA figures** Source 2 - West London Partnership Figures August 2018
● The latest national comparator data is not currently available but as can be seen from the 2016 data, Hillingdon’s performance against key participation indicators were below national averages. As a consequence of this, the Participation Team has given focused attention to strengthening the Council’s approach to identifying and tracking participation and providing targeted support to the disengaged.
● The Participation Team has increased capacity to the NEET tracking process, since November 2017. This resource has aided the process of reducing the number of young people whose employment, education or training status is ‘not known’. The reduction in ‘not known’ levels has had an associated impact on NEET levels as the increase in status verification included an increase in the number of young people known to be NEET.
● When considering the most recent key performance data, it may be noted that significant progress has been made, whereby Hillingdon’s performance is above regional levels in respect of ‘not known’ more in line with ‘in learning’ percentages and more closely aligned to the most recently published DfE data. Robust efforts are made to contact, engage and support young people identified as NEET including communications by telephone, emails, home visits, letters. NEET young people are invited to quarterly events arranged by the Participation Key Work Team where employers, education and training providers are brought together to create a marketplace of options for NEET young Hillingdon residents. Further work is required to ensure all young people identified as being NEET are supported to access and sustain their engagement in employment, education and training.
● Where appropriate NEET young people are referred to specialist agencies including P3, The Skills Training, BUILD, Innov8, JGA group, Asphaleia to receive additional support. The Participation Team also work with Special Educational Needs and Disabilities (SEND) Services to track and offer support to young people with additional needs in order to ensure

Classification: PublicResidents, Education and Environmental Services Policy Overview Committee – 22 January 2019
they are enabled to access and sustain participation in employment, education and training.
● In 2017/18, the work of the Participation Team resulted in overall improvements to service delivery for young people at risk of or known as NEET. These improvements include an improved tracking process, the building of good relationships with the majority of schools and colleagues which are used to support effective information sharing and positive joint-working across Council teams to identify and support vulnerable young people who are disengaged from EET.
Priorities for Young People Not in Education, Employment or Training (NEET) 2018/19
● Continuing to reduce NEET and Not Known levels through dedicated tracking and joint work with relevant council officer and external agencies
● Developing relationships with employers, education establishments and training providers with a view to supporting young people whom may have significant barriers hindering their participation in EET to access the right opportunities to meet their needs.
Absence and Exclusions
Absence and exclusion issues are managed collaboratively by the the Participation Team, Access and Admissions and School Improvement Services with a view to ensuring all young people access their full educational entitlement. This work constitutes a combination of activities ranging from seeking to monitor attendance, absence and exclusion rates to providing due support and challenge to schools and families to ensure optimum levels of participation.
Comparison of the most recent Absence figures.The table below compares absence rates in state funded schools for 2015/16 and 2016/17 (most recent available). A definition is provided for persistent absenteeism.
Hillingdon National
2015/16 2016/17 2015/16 2016/17
State funded schools absence -Primary
4.1 4.1 4 4
State funded schools absence - Secondary
5.4 5.5 5.2 5.4
State funded schools absence -overall
4.6 4.8 4.5 4.7
Persistent absentees* - Primary
9.3 8.5 8.7 8.3
Persistent absentees* - Secondary
13.6 14 12.8 13.5

Classification: PublicResidents, Education and Environmental Services Policy Overview Committee – 22 January 2019
Persistent absentees* -overall
11.1 11.1 10.4 10.8
Source - SFR 18_2018_Absence_Tables (DfE) - covers up to end of school year 2016-2017NB figures shown are percentages* The definition of persistent absence changed from the 2015/16 academic year. Pupil enrolments missing 10 percent or more of their own possible sessions (due to the sum of both authorised and unauthorised absence) are classified as persistent absentees.
● Hillingdon is broadly in line with national averages in terms of absence levels across primary and schools, although overall the cumulative percentage average differential against the national percentage is an issue for ongoing attention.
● Schools are responsible for reporting all persistent absentees, children removed from roll, children on part time timetables and children absent for 20+ consecutive sessions on a monthly basis to the local authority. They are also responsible for referring pupils with concerning attendance to the Participation Team so that Participation Officer may undertake targeted case-work with the young people and families in question. Schools may also refer cases of unauthorised absence to the Local Authority where school attendance policies have been breached. These referrals may lead to the issuing of penalty notices to families in accordance with duties relating to ensuring parents exercise their responsibilities with regard to school attendance of their children.
● Of the 20,129 penalty notices issued to parents for unauthorised absence across London in 2016/17, Hillingdon was responsible for 301. In 2017-18 the number of Penalty Notices issued rose to 648. A high proportion, 507, were issued in instances of leave unauthorised by school for holidays and visits to family. Currently data has not been published to compare this with the rest of the region or country.
● In order to support school improvement regarding attendance, two attendance events are provided for all school-based attendance leads per year and include local and national updates, the sharing of best practice and networking opportunities.
● In terms of rankings for attendance in 2016/17 Hillingdon is 95th in the National rankings (compared to 92nd the previous year), 28th in comparison to all London authorities (27th the previous year) and 11th in comparison to our Statistical Neighbours (10th the previous year).
Exclusions Data for Schools in Hillingdon
● It is noted that the latest nationally comparable data available for school exclusions is for the period 2016/17.
● The Participation Team continues to deliver services and consultancy to schools when a pupil at risk of permanent exclusion is highlighted by a school and sufficient time to intervene is provided.
● Rates of fixed term and permanent exclusion remain broadly in line compared to national averages, although 2015/16 fixed term exclusion data showed a spike in Special School fixed term exclusion in secondary schools. It is positive to note that most recent data

Classification: PublicResidents, Education and Environmental Services Policy Overview Committee – 22 January 2019
indicates that these exclusion levels have now reduced to below London and England averages..
Permanent exclusions - Percentage of overall results
Table 21:Permanent exclusions 2016-17
Phase State funded primary State funded secondary Specials
Region 2014-15 2015-16 2016/17 2014-15 2015-16 2016/17 2014-15 2015-16 2016/17
Hillingdon 0 0 0.02 0.16 0.20 0.20 0 0 X (see below)
England 0.02 0.02 0.03 0.15 0.09 0.24 0.09 0.08 0.07
London 0.01 0.01 0.01 0.17 0.176 0.19 0.11 0.10 0.05
Source - LATables_Exc_16/17 (NB - X figure in Specials denotes anonymised due to low numbers)NB – exclusions figures are always reported one year behind
● In terms of rankings Hillingdon is 79th in the National rankings, 26th in comparison to all London Authorities and 8th in comparison to our Statistical Neighbours. It isn’t possible to give a comparison to the previous year due to changes in the way the DfE reports the data.
Fixed term exclusions - Percentage of overall results
Table 22:Fixed Term Exclusions 2016-17
Phase State funded primary State funded secondary Specials
Region 2014-15 2015-16 2016/17 2014-15 2015-16 2016/17 2014-15 2015-16 2016/17
Hillingdon 0.42 0.44 0.58 7 7.44 7.75 3.3 13.1 0.90
England 1.1 1.21 1.37 7.5 8.46 9.4 13.54 12.53 13.03
London 0.81 0.84 0.83 6.71 6.87 7.5 13.49 13.34 15.51
Classification: PublicResidents, Education and Environmental Services Policy Overview Committee – 22 January 2019
Source - LATables_Exc_16/17
● In terms of rankings Hillingdon is 29th in the National rankings, 15th in comparison to all London Authorities and 7th in comparison to our Statistical Neighbours. It isn’t possible to give a comparison to the previous year due to changes in the way the DfE reports the data (only 2016-17 data available).
Permanent Exclusions patterns
2016/17 - 71 permanent exclusions from in Borough schools upheld2017/18 - 66 permanent exclusions from in Borough schools upheld2018/19 - 16 permanent exclusions from in Borough schools upheld end of first term
From the data above, it is clear that the number of permanent exclusions appear to be reducing over time.
● The work of the Participation Team includes the provision of statutory work and also provides a Service Level Agreement which schools may purchase to support their management of potential exclusion. This SLA offers a range of strategies and advice to prevent exclusion wherever possible. In addition, the team aims to provide effective collaborative work with schools to identify and address absence issues; effective cross service working to address the underlying causes informing absence and targeted work with schools to promote and support inclusion so that, where possible exclusion is avoided.
● The Participation Team works with 93 schools in Hillingdon to provide case-work on matters of school attendance and exclusions advice. A small number of schools have opted not purchase this service but we remain in contact and are aware of their attendance patterns through the monthly returns data provided by those schools.
Priorities to reduce school exclusion and improve school attendance 2018/19
● On-going work to with schools to meet social and emotional needs of children and young people who have difficulty in regulating their behaviour to the point at which exclusion is a consideration
● Working to address issues in relation to unauthorised absence.
● Agreeing ways of working with schools to allow more time to be spent on addressing longitudinal issues of irregular attendance.
● ICT assistance to help reduce current necessary use of multiple databases for recording data and actions that impacts on time available to support schools directly.
Section 5: Standards and Quality of Education for Adult Learners
Hillingdon Adult and Community Learning Service
Hillingdon Adult and Community Learning (HACL) provides opportunities for adult residents aged 19+ to learn new skills designed to lead to work, enhance life chances, improve wellbeing and encourage greater social cohesion. All programmes align to LB Hillingdon’s priorities and needs

Classification: PublicResidents, Education and Environmental Services Policy Overview Committee – 22 January 2019
and the Skills for Londoners Strategy. The service was last inspected by Ofsted in January 2016 and was graded as ‘good’. The next Ofsted inspection is due in January 2019.
Key data 15-16 16-17 17-18
LearnersIndividual residents
2848 2507 2672
EnrolmentsPeople can enrol for more than one class
5005 4663 5051
RetentionProportion of those enrolled who stay until end of course
94.2% 94.7% 93.0%
AttendanceImportant because they can’t learn if they don’t attend
84.4% 85.6% 87.9%
PassOf those retained, what proportion passed their course?
93.3% 94.7% 95.5%
AchievementOf those who started, what proportion passed the course?
87.9% 89.7% 88.9%
● In 2017-18 the service had 2672 learners making up 5051 enrolments, an increase of 165 learners from last year. 91% of our learners live in the borough, with 97% in London. HACL learners are predominantly women (4,134 women and 917 men in 17-18) though the number of enrolments by men increased by 26% in year.
● Qualification courses include British Sign Language, Community Interpreting, Caring for Children, Counselling, English, ESOL, Floristry, Horticulture, Hospitality and Catering, Independent Living, IT, Maths and Supporting Teaching and Learning. These courses accounted for 1,795 enrolments (35.54%) this year, 65% of which were at entry level (beginners). Provision above entry level is mainly at level 1 and level 2 (GCSE level) with a small number of level 3 enrolments (A level equivalent). There were 470 enrolments by adults with learning difficulties and disabilities in 2017-18.
● There were 2538 enrolments on community learning courses this year (50.25%), and an increasing proportion of these enrolments were from deprived wards following a strategic decision to target learners from disadvantaged groups in the community. Consequently, the proportion of black and minority ethnic (BAME) learners within HACL is 59%, 11% above the borough profile.
● HACL participated in a national mental health research pilot from 2015-17 and the Local Authority supported the continuation of this work locally by providing an additional £29k to enable us to continue it. This resulted in 275 enrolments and allowed us to embed the provision in the wider curriculum for 2018-19.
● HACL continue to provide a good quality adult learning offer to residents by ensuring that strong strategic leadership and management structures promote a culture of collaboration that drives sustainable improvement for the benefit of all. The overall quality of teaching, learning and assessment across the service is good with increasingly outstanding

Classification: PublicResidents, Education and Environmental Services Policy Overview Committee – 22 January 2019
elements. HACL provides support for learners to develop independence and achieve their learning aims and the quality of this learning support is outstanding. The service is particularly proud of the quality of its information, advice and guidance which is very effective in supporting adult learners to achieve their goals and aspirations.
Priorities for Hillingdon’s Adult and Community Learning Service in 2018/19
● The new Governing Body is in its infancy and will be more equipped to drive improvement when it is fully established.
● Targeted specific interventions in teaching, learning and assessment will ensure consistently outstanding learning opportunities for every learner.
● Further refining the analysis and use of data will better inform all decision making and underpin targeted improvements in real time, increasing achievement rates.

Classification: PublicResidents, Education and Environmental Services Policy Overview Committee – 22 January 2019
Section 6: School Placements & Admissions
Secondary School Places
● There has been a 4.4 per cent increase in applications across London - Hillingdon experienced a 0.7 per cent increase reflecting a growing population and a higher demand for school places. Despite the increase and a record high of 3,441 applications in total for secondary school places Hillingdon remain as the top borough in west London for families receiving an offer at one of their preferred secondary schools. To meet the challenge, over the past few years Hillingdon Council has invested £260 million into its school expansions programme, which is one of the largest in London.
● On National Offer Day Hillingdon offered 100 percent of our applicants a school place.
● 95.11 per cent of Hillingdon pupils received one of their preferred choices. This is above the London average of 93.02 per cent.
● 67.68 per cent of pupils were allocated their first choice of secondary school. Some parents choose to put a single school on their application form. Other parents, who are aware that all their preferences will be considered equally, may decide to use their first preference to rank a school which their child is less likely to be offered and put their more realistic options lower down the list. Therefore it is important to consider how well all preferences have been met, as these are likely to have been more than satisfactory to many parents.
● To meet the growing demand for school places in the borough, we have invested £9.7 million to rebuild and expand Oak Wood School in Hillingdon, formerly Abbotsfield School, which will provide 1,350 secondary school places in the borough.
● Hillingdon have also approved plans to offer an additional 300 secondary school places at Vyners School in Ickenham, and the expansion of Ruislip High School will create a further 174 extra places for future admissions.
● Swakeleys School has permanently expanded to offer an additional 60 places for each Year 7 intake group from September 2018 which continues to support choice for parents.
Primary School Places
● There has been a 2.3 per cent decrease in applications for primary places across London - Hillingdon experienced a 0.3 percent decrease. The Pan London Admissions Board are aware that lower birth rates in 2014 could affect the number of children starting primary school in London this year. It is also expected that a range of other factors, including property prices in some areas and welfare reform changes, have also contributed to this.
● On National Offer Day Hillingdon offered 100 percent of our applicants a school place.
● Despite Hillingdon still receiving high levels of demand for school places, 98.6 percent of applicants received an offer at one of their preferred primary schools, which is above the London average (97.6 per cent) and the highest across West London.

Classification: PublicResidents, Education and Environmental Services Policy Overview Committee – 22 January 2019
● Hillingdon Council received 3,909 applications and has offered 97.77 per cent of pupils one of their top three schools, with 89.05 per cent of primary school children receiving their first choice.
● Some parents choose to put a single school on their application form. Other parents, who are aware that all their preferences will be considered equally, may decide to use their first preference to rank a school which their child is less likely to be offered and put their more realistic options lower down the list. Therefore it is important to consider how well all preferences have been met, as these are likely to have been more than satisfactory to many parents.
● The council has continued to meet increasing demand for school places and has invested more than £153 million into primary schools as part of a wider £260 million school expansion programme, which is one of the largest programmes in London.
● Since 2011, the council has built three new state-of-the-art primary schools and permanently expanded 24 existing schools in Hillingdon to create 6,615 new primary school places. Work is underway to provide a further 420 places at Hillside Infant and Junior Schools in Northwood, and Warrender Primary in Ruislip.
Fair Access
● The purpose of Fair Access Protocols is to ensure that outside the normal admissions round unplaced children, especially the most vulnerable, are found and offered a place quickly, so that the amount of time any child is out of school is kept to the minimum. Every local authority is required to have in place a Fair Access Protocol, developed in partnership with local schools. Hillingdon has an ‘In Year Fair Access Panel’ (IYFAP) to consider these types of school admissions.
● Due to new ways of working and improved communication between the Local Authority and admissions officers based in schools there has been a considerable decrease in the number of primary referrals to the IYFAP. Below is a summary of the referrals made via the IYFAP.
Key Statistics
● 63% decrease in the total number of Primary placements by the IYFAP in comparison to academic year 2016-2017
● 10% increase in the total number of placements by the IYFAP in comparison to academic year 2016-2017
● 33 Year 11 aged children successfully placed in mainstream schools, the remaining 2 pupils remained in the Interim Provision as they were approaching the end of term.
● 11% increase in the total number of year 11 placements by the IYFAP into mainstream schools in comparison to academic year 2016-2017
These statistics include July’s placements however they did not start until the following academic year.

Classification: PublicResidents, Education and Environmental Services Policy Overview Committee – 22 January 2019
Placements for Year 11 students
This academic year the Local Authority (LA), IYFAP and Hillingdon Association of Secondary Headteachers (HASH) have been continuing to work together to integrate year 11s who have moved into the borough and are out of education, into a mainstream school instead of an alternative provision (such as colleges).
● For the academic year 2017-18, 33 Year 11 aged children were successfully integrated into schools and 12 year 10 pupils who will be Year 11 when they start. Due to the success of these placements, the IYFAP will continue to place all mainstream appropriate Year 11 aged children at Panel.
● The tables below show the Fair Access placements from September 2017- July 2018, it also indicates where in the borough the pupils were residing. For secondary schools the north of the borough is determined as above the A40, and south as below the A40, primary schools are determined by planning areas. These referrals reflect all pupils that were taken to the panel, some pupils were not placed but have been included in the referrals. As there were only 4 primary referrals and they were all from different year groups there is no specific observations.
Primary referralsSeptember 2017 - July 2018
Month/Year Group Reception Year 1 Year 2 Year 3 Year 4 Year 5 Year 6 North South
September 0 0 0 1 1 1 1 0 4
October 0 0 0 0 0 0 0 0 0
November 0 0 0 0 0 0 0 0 0
December 0 0 0 0 0 0 0 0 0
January 0 0 0 0 0 0 0 0 0
February 0 0 0 0 0 0 0 0 0
March 0 0 0 0 0 0 0 0 0
April 0 0 0 0 0 0 0 0 0
June 0 0 0 0 0 0 0 0 0
July 0 0 0 0 0 0 0 0 0
Total per year 0 0 0 1 1 1 1 0 4
Total 4

Classification: PublicResidents, Education and Environmental Services Policy Overview Committee – 22 January 2019
Secondary referralsSeptember 2017 - July 2018
Month/Year Group Year 7 Year 8 Year 9 Year 10 Year 11 North South
September 0 0 0 1 15 1 15
October 0 0 0 2 6 1 7
November 0 0 2 0 1 1 2
December 0 0 0 0 5 0 5
January 0 0 0 5 1 0 6
February 0 0 1 0 2 2 1
March 0 0 0 2 3 0 5
April 0 0 0 0 4 1 3
June 0 0 1 4 0 0 5
July 0 0 1 8 0 1 8
Total per year 0 0 5 22 37 7 57
Total 64
The month of May will not appear in any statistics as no IYFAP meetings were held in May.
Referral reason
Below is a breakdown of the reasons each referral was made to the IYFAP. If a criterion is not listed below but recognised in the IYFAP Protocol, it is because no referrals were made under that criterion.
The highest numbers of referrals in Secondary were made for year 11 pupils as they cannot be easily assimilated into appropriate courses. All of the primary aged pupils referrals were due to the restriction of access to a school within a reasonable walking distance (2 miles for children under 8 years old and 3 miles for children over 8 years old) as a result of a large cohort in year 4.

Classification: PublicResidents, Education and Environmental Services Policy Overview Committee – 22 January 2019
Criterion Met
Month
Children on roll at a school that is deemed
an unreasonable distance
Unable to offer a school within a
reasonable walking distance
Known to have challenging behaviour
Out of education for 2 or more
months Year 11'sEHE that has
failed Other Total
September 4 1 15 20
October 2 6 8
November 1 1 1 3
December 5 5
January 5 1 6
February 1 1 1 3
March 3 2 5
April 4 4
June 4 1 5
July 1 8 9
Total 1 4 2 9 48 2 2 68
The placements allocated in June and July’s meeting were for current year 10 pupils however as they are due to start year 11 in September they were considered under the ‘Year 11 pupils seeking admission to a Hillingdon school, Federation or Academy who cannot be easily assimilated into appropriate courses’ category.
Primary Place planning areas
For the 4 primary referrals made the following table provides a breakdown of the planning areas where these children live. Please see map attached at the end of this paper that shows the areas and schools covered in the specific place planning areas.
Primary allocations - Place planning area1 2 3 4 5 6 7 8 9 10 11 12 13 14
Reception Year 1 Year 2 Year 3 1 Year 4 1 Year 5 2Year 6 Total 0 0 0 0 0 0 0 0 0 0 0 0 1 3
4

Classification: PublicResidents, Education and Environmental Services Policy Overview Committee – 22 January 2019
The place planning table shows that almost all of the referrals were made for pupils living in place planning area 14 which is West Drayton. The schools in this area are Laurel Lane Primary School, West Drayton Primary School, Cherry Lane Primary School and St Martin's CofE Primary School. Please note St Martin’s Primary School only went up to year 3 in 2017-18.
Place planning areas 1- 5 are in the North of the borough and 6- 13 are situated in the South of the borough.
Below is a comparison of the number of In Year Fair Access Panel placements made this year in comparison to the last two academic years.
2015-2016 2016-2017 2017-2018
Month Primary Secondary Total Primary Secondary Total Primary Secondary Total
September 13 3 16 6 22 28 4 16 20
October 3 2 5 0 4 4 0 8 8
November 1 5 6 3 5 8 0 3 3
December 0 7 7 1 5 6 0 5 5
January 2 5 7 0 3 3 0 6 6
February 1 3 4 0 2 2 0 3 3
March 0 1 1 0 2 2 0 5 5
April 2 0 2 0 2 2 0 4 4
June 0 0 0 0 2 2 0 5 5
July 3 0 3 1 4 5 0 9 9
Total 25 26 51 11 51 62 4 64 68
There has been a 33% increase in the total number of FA placement in comparison to 2015-2016.
There has been a 63% decrease in primary referrals in comparison to 2016-2017.
There has been an 10% increase in the total number of FA placement in comparison to 2016-2017, this is due to the increase in year 11 placements.
The statistics confirm that both efficient place planning and an improved working relationship between the Primary Schools and the School Placement and Admissions team has enabled us to reduce the number of FA referrals. Applications are being processed more efficiently by schools and the School Placements and Admissions Team. We are being updated on places available and recent offers made more frequently which is ultimately reducing pupils without a school place and the requirement for them to been taken to FA.
Secondary pupil placements have shown as a small increase as Year 11 pupils are now being placed into mainstream schools.

Classification: PublicResidents, Education and Environmental Services Policy Overview Committee – 22 January 2019
Elective Home Education
Registered as electively home educated for any one period between 1 September 2017 - 31 August 2018
Total Number of children registered between the above dates - 415
Primary Secondary
165 250
Female Male
215 200
Fair Access Arrangements for Electively Home Educated Children
Children who are electively home educated where home education is judged to have failed in the view of the Local Authority; within 6 months of coming off a school's roll will be placed back at previous school. This is will be reviewed by the panel on a case by case basis and will apply where deemed reasonable.
This was applied over the academic year of 2017-2018 with great success and headteachers have agreed to keep it within the Fair Access Protocol for the coming academic year.
Implications on related Council policies
A role of the Policy Overview Committees is to make recommendations on service changes and improvements to the Cabinet who are responsible for the Council’s policy and direction.
How this report benefits Hillingdon residents
This report ensures that every child in Hillingdon has access to a high quality school place. It is central to putting residents first and is supported by the principles of the Hillingdon School Improvement Plan.
Financial Implications
There are no direct financial implications arising from this report.
Legal Implications
Under the Education Act 1996 (Sections 13,13A and 14) the Council has statutory obligations to: ensure that efficient primary, secondary and further education is available to meet the needs of the local population; ensure that its education functions are discharged with a view to promoting high standards; ensure fair access to opportunity for education and learning, and promote the fulfilment of learning potential; and secure that sufficient schools, for providing primary and secondary education, are available for its area.
Classification: PublicResidents, Education and Environmental Services Policy Overview Committee – 22 January 2019
Whilst there are no specific legal implications arising from the report, Cabinet is advised that the Council's school improvement function is subject to inspection from Ofsted under powers set out in Section136(1)(b) of the Education and Inspections Act 2006. Specifically, Her Majesty's Chief Inspector may use these powers under the Education and Inspections Act 2006 to inspect compliance of the duties of a local authority as set out the Education Act 1996. Reports of the findings of inspections under S136 of the Education and Inspections Act 2006 may be of assistance to the Council and/or the Secretary of State in the use of powers under Part 4 of the Education and Inspections Act 2006.
BACKGROUND PAPERS
Nil.