standards in london schools. impressive improvement at gcse… but a hill to climb on english and...
TRANSCRIPT

STANDARDS IN LONDON SCHOOLS

Impressive improvement at GCSE… but a hill to climb on English and Maths
Percentage of pupils gaining 5 A*-C 1997-2006*(*provisional unamended data)
0
10
20
30
40
50
60
70
1997 1998 1999 2000 2001 2002 2003 2004 2005 2006*
Year
Per
cent
age
Inner London Outer London Greater London ENGLAND Inner London - E&M
Outer London - E&M Greater London - E&M ENGLAND - E&M

Improvement across the range of London schools…
Numbers of London Secondary schools by percentage 5+A*-C
band 2001
103
159
83
59
Number of London secondary schools by percentage 5A*-C band
2006*(*provisional unamended data)
18
174
92
124
<30% >=30% & <55% >=55% & <70% >=70%

KS3 also good…Percentage of pupils achieving L5 at KS3 - London v National 1997 - 2006*
(*provisional unamended data)
0
10
20
30
40
50
60
70
80
90
1997 1998 1999 2000 2001 2002 2003 2004 2005 2006*
Year
Per
cen
tag
e
LONDON - English NATIONAL - English LONDON - Maths NATIONAL - Maths LONDON - Science NATIONAL - Science
Improvement in London Schools
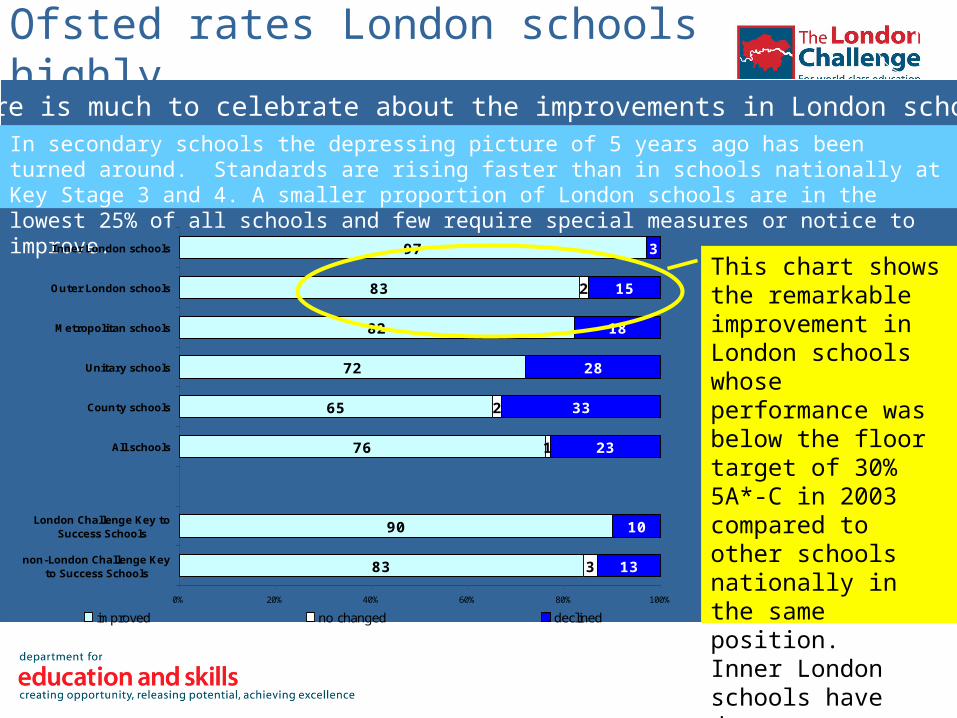
There is much to celebrate about the improvements in London schoolsIn secondary schools the depressing picture of 5 years ago has been turned around. Standards are rising faster than in schools nationally at Key Stage 3 and 4. A smaller proportion of London schools are in the lowest 25% of all schools and few require special measures or notice to improve.
This chart shows the remarkable improvement in London schools whose performance was below the floor target of 30% 5A*-C in 2003 compared to other schools nationally in the same position. Inner London schools have done particularly well.
1
83
90
76
65
72
82
83
97
3
1
2
2
13
10
23
33
28
18
15
3
0% 20% 40% 60% 80% 100%
non-London Challenge Keyto Success Schools
London Challenge Key toSuccess Schools
All schools
County schools
Unitary schools
Metropolitan schools
Outer London schools
Inner London schools
improved no changed declined
Ofsted rates London schools highly…

Inspection evidence confirms this trend of improvement in secondary schools. The proportion of schools graded as good or better is significantly higher than nationally. Leadership, management and the quality of teaching have improved significantly.These charts show the percentages of inspection judgements that are good or better, over time. Since September 2005 the ‘bar’ has been raised, explaining the decline in the number of schools achieving the ‘good’ or ‘outstanding’ grades.
1
A higher proportion of London schools achieved ‘good or better’ grades for overall effectiveness in 2005/6.
Judgements on the quality of teaching, leadership and management reflect the same picture.
71
68
49
67
71
59
0 20 40 60 80 100
Section 10 data from inspections in 2003/05
Section 10 data from inspections in 2000/03
Section 5 data from inspections in 2005/06
London
All schools
London
All schools
London
All schools 79
74
51
70
71
57
0 20 40 60 80 100
All schools London
London
All schools
London
All schools
London
All schools
Section 10 data from inspections in 2003/05
Section 10 data from inspections in 2000/03
Section 5 data from inspections in 2005/06
81
75
58
85
80
73
0 20 40 60 80 100
Section 10 data from inspections in 2003/05
Section 10 data from inspections in 2000/03
Section 5 data from inspections in 2005/06
London
All schools
London
All schools
London
All schools
Percentage of secondary schools judged good or better for overall effectiveness
Percentage of secondary schools judged good or better for quality of teaching
Percentage of secondary schools judged good or better for leadership and management
…their inspections recognise significant improvement
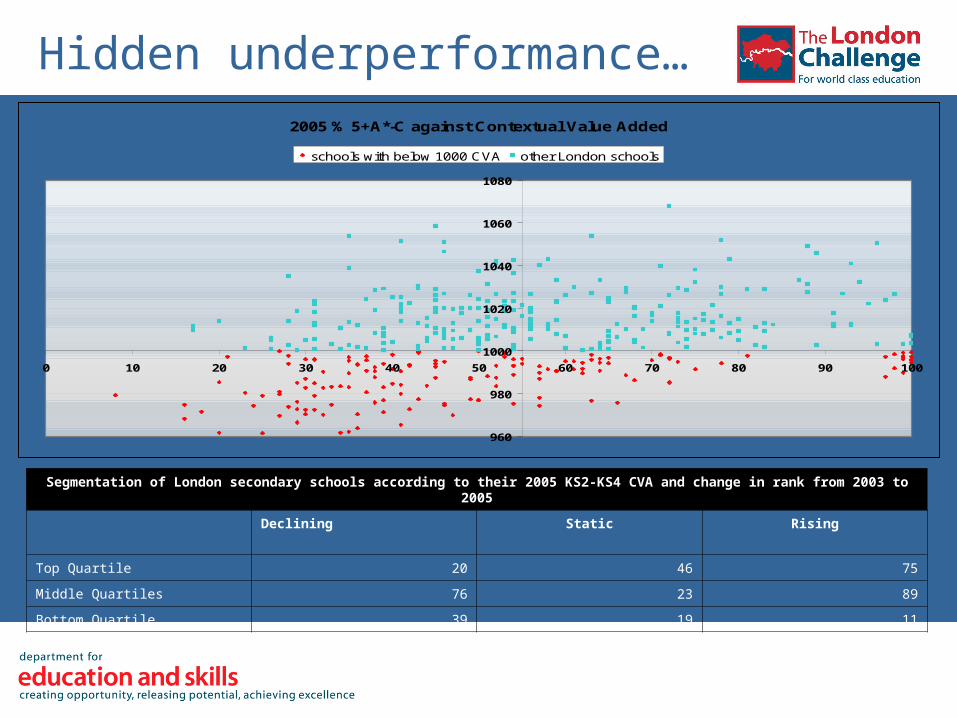
Hidden underperformance…2005 % 5+A*-C against Contextual Value Added
960
980
1000
1020
1040
1060
1080
0 10 20 30 40 50 60 70 80 90 100
schools with below 1000 CVA other London schools
Segmentation of London secondary schools according to their 2005 KS2-KS4 CVA and change in rank from 2003 to 2005
Declining Static Rising
Top Quartile 20 46 75
Middle Quartiles 76 23 89
Bottom Quartile 39 19 11

…and much in-school variation
Variation between core subjects within each family of London schools
20
37
30
3538
33
44
3538
62
42
3133
47
3532 31
40
30
41
35
24
60 60 60
0
10
20
30
40
50
60
70
1 2 3 4 5 6 7 8 910 11 12 13 14 15 16 17 18 19 20 21 22 23
EAL
Mob
ility
Family

Attainment gaps remain the burning issue…
Percentage of 15 year old pupils achieving 5+A*-C by ethnicity: Pupils whose average level at Key Stage 3 was level 5 or above
50%55%60%65%70%75%80%85%90%95%
100%
London Average

…and a bigger issue in some parts of London
Gap in attainment: difference between non FSM pupils and FSM pupils
0.0
5.0
10.0
15.0
20.0
25.0
30.0
35.0
40.0
45.0
% g
aini
ng 5
+A*-
C g
rade
s at
end
of K
S4
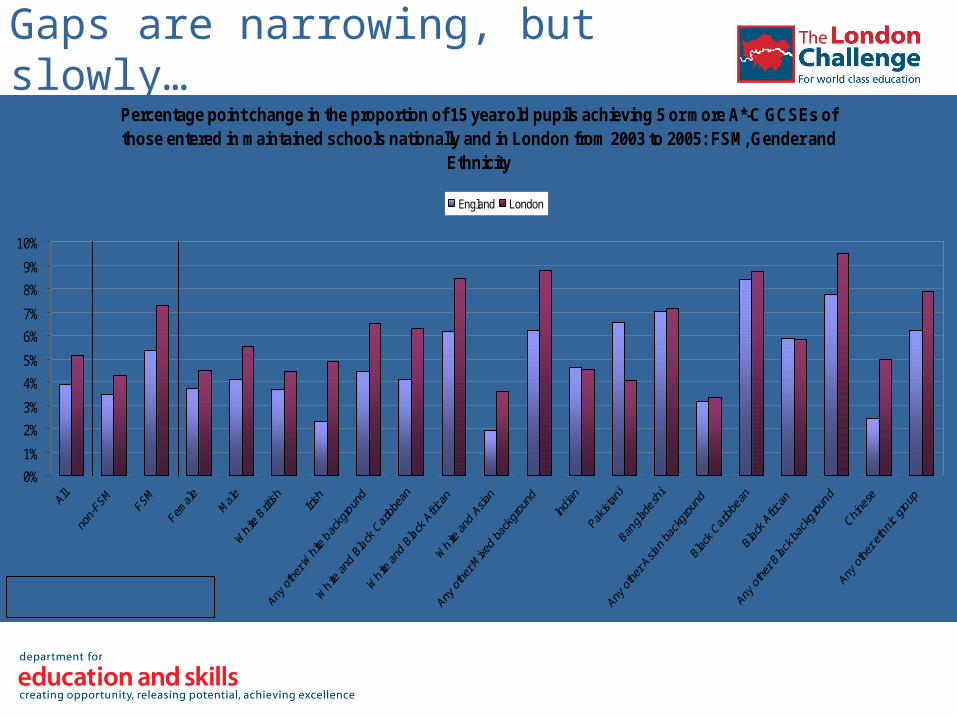
Gaps are narrowing, but slowly…Percentage point change in the proportion of 15 year old pupils achieving 5 or more A*-C GCSEs of those entered in maintained schools nationally and in London from 2003 to 2005: FSM, Gender and
Ethnicity
0%
1%
2%
3%
4%
5%
6%
7%
8%
9%
10%
England London
Source:SFR 04/2004 and 2005 f inal KS4 NPD.

Whatever the issue, some London schools have cracked it…

London primary schools not yet ahead…
Percentage of pupils gaining L4 at KS2 - London v National 1997-2006*(*provisional unamended data)
0
10
20
30
40
50
60
70
80
90
100
1997 1998 1999 2000 2001 2002 2003 2001 2005 2006
Year
London - English National - English London - Maths
National - Maths London - Science National - Science

Improvement in London Schools
The main focus of London Challenge has been on secondary schools. Nevertheless primary schools have benefited from the some of the interventions particularly in relation to ensuring a suitable workforce is available. Recent improvements a beginning to show in inspection evidence but not enough has been done in primary schools to ensure that improvements are sustained and that the gap between the best and the worst performing schools is narrowed.
67
66
59
66
64
64
0 20 40 60 80 100
All schools London
London
All schools
London
All schools
London
All schools
Section 10 data from inspections in 2003/05
Section 10 data from inspections in 2000/03
Section 5 data from inspections in 2005/06
76
73
60
71
70
64
0 20 40 60 80 100
All schools London
London
All schools
London
All schools
London
All schools
Section 10 data from inspections in 2003/05
Section 10 data from inspections in 2000/03
Section 5 data from inspections in 2005/06
76
71
62
75
70
69
0 20 40 60 80 100
All schools London
London
All schools
London
All schools
London
All schools
Section 10 data from inspections in 2003/05
Section 10 data from inspections in 2000/03
Section 5 data from inspections in 2005/06
Percentage of primary schools judged good or better for overall
effectiveness
Percentage of primary schools judged good or better for quality
of teaching
Percentage of primary schools judged good or better for leadership and
management
Ofsted’s recent inspections show London primary schools in a good light, but can it be sustained?
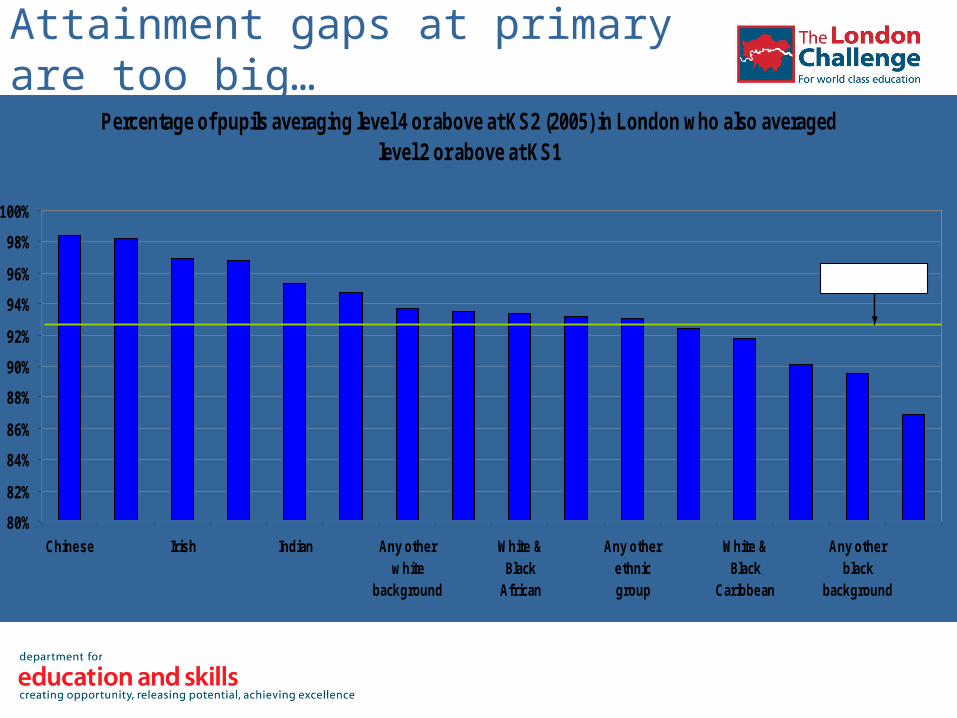
Attainment gaps at primary are too big…
Percentage of pupils averaging level 4 or above at KS2 (2005) in London who also averaged level 2 or above at KS1
80%
82%
84%
86%
88%
90%
92%
94%
96%
98%
100%
Chinese Irish Indian Any otherwhite
background
White &Black
African
Any otherethnicgroup
White &Black
Caribbean
Any otherblack
background
London Average

…and are closing too slowly
Percentage point change in the percentage of pupils achieving level 4 or above in English KS2 tests of those entered in maintained schools nationally
and in London from 2003 to 2005: FSM, Gender and Ethnicity
0
1
2
3
4
5
6
7
8
England London
Source:SFR 04/2004 and 2005 amended KS2 NPD.

Underperformance in primary schools
2005 KS2 APS against Contextual Value Added
96
97
98
99
100
101
102
103
104
105
21 23 25 27 29 31 33
schools with below 100 CVA other London schools

Families of schools a new tool for primary schools
One headteacher told Ofsted:“The data we receive in the families of schools book is
particularly useful. We can see the schools we are being
compared with and talk to them about what they do that is more
effective than our own practice.” Ofsted report that this
is a commonly held view.
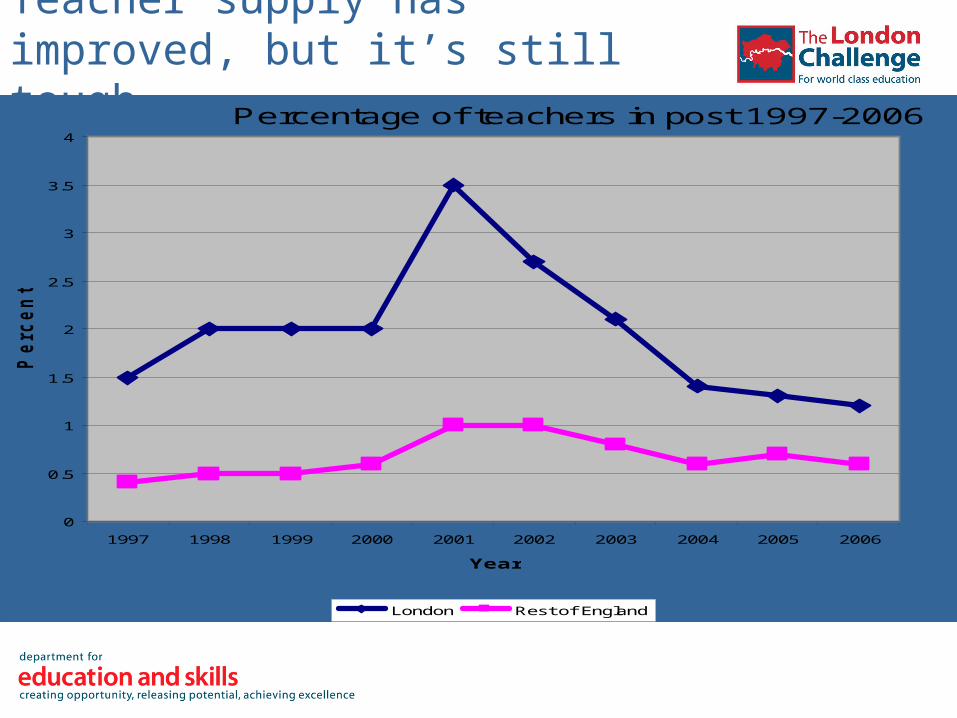
Teacher supply has improved, but it’s still tough
Percentage of teachers in post 1997-2006
0
0.5
1
1.5
2
2.5
3
3.5
4
1997 1998 1999 2000 2001 2002 2003 2004 2005 2006
Year
Percen
tag
e
London Rest of England
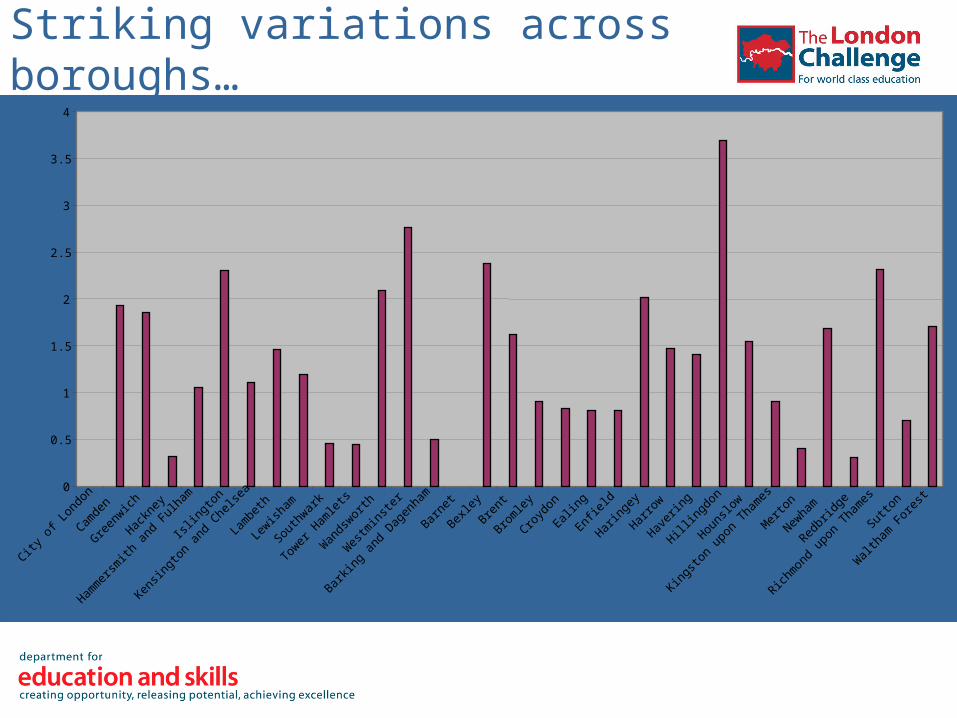
Striking variations across boroughs…
0
0.5
1
1.5
2
2.5
3
3.5
4
City o
f Lon
don
Camde
n
Green
wich
Hackn
ey
Hamm
ersm
ith a
nd F
ulham
Isling
ton
Kensin
gton
and
Che
lsea
Lam
beth
Lewish
am
South
wark
Tower
Ham
lets
Wan
dswor
th
Wes
tmins
ter
Barkin
g an
d Dag
enha
m
Barne
t
Bexley
Brent
Brom
ley
Croyd
on
Ealing
Enfiel
d
Haring
ey
Harro
w
Haver
ing
Hilling
don
Houns
low
Kingsto
n up
on T
ham
es
Mer
ton
Newha
m
Redbr
idge
Richm
ond
upon
Tha
mes
Sutto
n
Walt
ham
For
est

The next priorities on standards
• Continuity and progression of individual children
• Closing attainment gaps – especially early on
• Variability of Departments and classes
• Capacity building for a sustained culture of learning
• Keeping the best teachers and using them across the system
• Collaboration with a purpose – especially 14-19
