standing fine root mass and production in four chinese subtropical forests along a succession and...
TRANSCRIPT

REGULAR ARTICLE
Standing fine root mass and production in four Chinesesubtropical forests along a succession and species diversitygradient
Cong Liu & Wenhua Xiang & Pifeng Lei & Xiangwen Deng &
Dalun Tian & Xi Fang & Changhui Peng
Received: 19 September 2013 /Accepted: 27 November 2013 /Published online: 14 December 2013# Springer Science+Business Media Dordrecht 2013
AbstractBackground and aims The influences of succession andspecies diversity on fine root production are notwell knownin forests. This study aimed to investigate: (i) whether fineroot biomass and production increased with successionalstage and increasing tree species diversity; (ii) how foresttype affected seasonal variation and regrowth of fine roots.Methods Sequential coring and ingrowth core methodswere used to measure fine root production in fourChinese subtropical forests differing in successionalstages and species diversity.Results Fine root biomass increased from 262 g·m−2
to 626 g·m−2 with increasing successional stage andspecies diversity. A similar trend was also found forfine root production, which increased from 86 to114 g·m−2 yr −1 for Cunninghamia lanceolata plantationto 211–240 g·m−2 yr −1 for Choerospondias axillariesforest when estimated with sequential coring data.Fine root production calculated using the ingrowthcore data ranged from 186 g·m−2 yr −1 for C. lanceolataplantation to 513 g·m−2 yr −1 for Lithocarpus glaber –Cyclobalanopsis glauca forest.
Conclusions Fine root biomass and production in-creased along a successional gradient and increasingtree species diversity in subtropical forests. Fine rootsin forests with higher species diversity exhibited higherseasonal variation and regrowth rate.
Keywords Fine root biomass . Fine root production .
Seasonal variation . Successional gradient . Tree speciesdiversity
Introduction
Fine root (diameter up to 2 mm) production is an im-portant component of ecosystem functions in forests(Hendrick and Pregitzer 1996; Jackson et al. 1997). Ithas been estimated that fine root production representsabout 30 % to 50 % of annual net primary production inforest ecosystems (Vogt et al. 1996; Jackson et al. 1997;Xiao et al. 2003), although much lower contributions offine roots, less than 15 % in spruce and beech forest hasbeen reported recently (Konôpka et al. 2013). Fine rootsare physiologically the most active parts of the rootsystem of trees and have a much shorter lifespan thancoarse roots (Wells and Eissenstat 2001). As a result,fast growth and turnover rates make fine root systemscontribute a great deal to soil nutrient and carbon (C)cycle (Matamala et al. 2003; Silver et al. 2005).Accurate estimates of fine root biomass and productionare therefore essential for understanding ecosystemfunctions (such as C budget and nutrient cycle) in forests(Børja et al. 2008).
Plant Soil (2014) 376:445–459DOI 10.1007/s11104-013-1998-0
Responsible Editor: Alain Pierret.
C. Liu :W. Xiang (*) : P. Lei :X. Deng :D. Tian :X. FangFaculty of Life Science and Technology, Central SouthUniversity of Forestry and Technology,Changsha 410004, Chinae-mail: [email protected]
C. PengInstitute of Environment Sciences, Department of BiologicalSciences, University of Quebec at Montreal,Montreal, QC H3C 3P8, Canada

Fine root biomass (live fine root dry weight),necromass (dead fine root dry weight) and produc-tion vary with forest types and fluctuate consider-ably throughout a growing season or even betweenyears. In addition to abiotic factors (such as soilphysical properties, nutrient, temperature, humidity,and light) (Gill and Jackson 2000; Janssens et al.2002), biotic factors, e.g. different species-specifictraits (early- or late-successional species, needle orbroadleaved species) and their interactions (e.g.species diversity) affect fine root biomass and pro-duction (Yuan and Chen 2010; Vogt et al. 1996).In boreal and temperate forests, for example, fineroot biomass was similar between stands dominat-ed by early- and late-successional species, but fineroot production was higher in early successionalstands than in late successsional ones (Yuan andChen 2010). In contrast, some reports indicatedthat late successional species stands produced morefine roots than those at earlier successional stages(Yang et al. 2010). In addition, needle and broad-leaved species stands showed different patterns offine root biomass and production (Yuan and Chen2010).
Recently, the relationship between biodiversityand productivity has attracted a great deal of in-terest and some experimental results showed that aplant community consisting of more species hadhigh production and recovery rate after disturbance(Chapin et al. 2000; Elmqvist et al. 2003).However, only a few studies have been carriedout to investigate the impact of plant diversityand silvicultural treatments on belowground pro-cesses such as fine root dynamics and production.While some investigations found a higher fine rootbiomass in polycultures than in monocultures(Hendriks and Bianchi 1995; Schmid 2002;Schmid and Kazda 2002), other studies found nodifferences or even a decrease in fine root biomassin polyculture stands (Bauhus et al. 2000;Leuschner et al. 2001; Bolte and Villanueva2006). Most of these studies that referenced onlytwo forest types (mixed species stands and singlespecies stands) found that annual fine root produc-tion was higher in mixed than in single speciesstands (Brassard et al. 2011). The increased pro-duction in mixed forests is mainly attributed tobelowground facilitation or niche segregation(Pretzsch 2005; Knoke et al. 2008).
Chinese subtropical area is a typical ecological tran-sitional zone that is sensitive to global change. In thisarea, the climax vegetation is evergreen broadleavedforest (Feng et al. 1999), which has a high stand biomassand production and plays an important contribution tothe global terrestrial ecosystem C storage. Due to an-thropogenic disturbances, however, different foresttypes such as the Cunninghamia lanceolata plantationand secondary forests consisting of various tree specieshave become the dominant forest landscapes found inthe region. The successional processes of secondaryforests in Chinese subtropical area are quite common.On the sites of destroyed natural forests or abandonedclearcut of plantations, pioneer tree species (such asconiferous Pinus massoniana and deciduousLinquidambar forsama and Choerospondias axillaris)colonise and grow rapidly at early stage. As successionproceeds, some shade tolerant evergreen broadleavedspecies (e.g. Lithocarpus glaber and Cyclobalanopsisglauca) invade gradually and become the dominant treespecies. During the succesional process, tree speciesdiversity increases at early stage and then decreases orlevels off at late stage. To our knowledge, no research hasbeen carried out in relation to fine root biomass andproduction for these forest types found in southernChina, in particular, the influence of succession and treespecies diversity on belowground fine root dynamics.Understanding variations in fine root production for for-ests along succession and tree species richness gradientsis critical when examining the effects of biodiversity onforest ecosystem function. This is also true when scalingup fine root production for the purposes of establishing Cgains of forests as well as whole terrestrial ecosystems.For these reasons, a combination of comparative studieson fine root biomass of forest types alongside a succes-sion and tree species richness gradient was carried out.
Four subtropical forests, comprising of coniferoustree species monoculture, early successional speciesdominated mixed forest stand, deciduous broadleavedspecies dominated mixed forest stand and late succes-sional evergreen broadleaved species dominated foreststand, were selected for this study to investigate dynam-ics of fine root biomass and necromass as well as toquantify fine root production. The objectives of ourstudy were to test two hypotheses: (i) standing fine rootmass and production increase with tree species diversi-ty; (ii) seasonal variation of fine root biomass and fineroot regrowth rate after disturbance in species-rich for-ests are higher in comparison with species-poor forests.
446 Plant Soil (2014) 376:445–459

Materials and methods
Study site description
This study was carried out in Dashanchong ProvincialForest Park (28°23′58″–28°24′58″ N, 113°17′46″–113°19′08″ E) situated in eastern Changsha County,Hunan Province, China. The area is a typical exampleof the low hilly landscape endemic to the region with analtitude ranging from 55 m to 217.4 m above sea level.Soil type is well-drained clay loam red soil developedfrom slate and shale parent rock. The region experiencesa monsoonal climate of mid-subtropical regions. Basedon climate data obtained from 1954 to 2010, the annualmean air temperature in the area is 17.3 °C, andmaximum and minimum temperatures are 39.8 °Cand −10.3 °C, respectively. Annual precipitation rangesfrom 936.4 mm to 1954.2 mm, and annual averageprecipitation is 1416.4 mm.
Precipitation and air temperature for the years 2010to 2012 were recorded at an ecological research stationlocated at a distance of 45 km from the study sites.Although seasonal air temperature patterns were similarfor the 2 years, precipitation patterns differed. The meanannual air temperature in 2010 (18.2 °C) was higherthan the average value in the historical records for thearea (17.3 °C). Annual precipitation in 2011 was936.8 mm, which is very close to the lowest annual
precipitation value recorded (936.4 mm). Moreover,total precipitation measured from March 2010 toJanuary 2011 (1586.6 mm) was higher compared tothe corresponding period in 2012 (967.1 mm) (Fig. 1).
Four forest types were selected for this study along agradient of successional stages and differing in treespecies diversity that spanned from single tree speciesplantations to highly diverse tree species forest stands.The four forest types and their component tree speciesaccording to percentage of basal area at breast height(1.3 m) are: (1) a monoculture coniferous plantationcomposed ofC. lanceolata (CL); (2) a coniferous mixedforest composed of 60 % coniferous species(P. massoniana), 25 % evergreen broadleaved species(L. glaber), and 15 % other tree species (PM); (3) adeciduous mixed forest composed of 65 % deciduousspecies (C. axillaris), 6 %Loropetalum chinensis, 6 %Symplocos setchuensis, and 23 % other tree species(CA); and (4) an evergreen broadleaved forest com-posed of 53 % evergreen broadleaved species (37 %L. glaber and 16%C. glauca), 16% P. massoniana, and31 % other tree species (LG). The monoculture,C. lanceolata plantation, was established in 1966 andthe other three secondary forests were stands orig-inated from secondary succession in regions wherefirewood collection has been outlawed since thelate 1950s. The canopy of the four forest types was fullyclosed.
0
5
10
15
20
25
30
35
40
1 2 3 4 5 6 7 8 9 10 11 12 1 2 3 4 5 6 7 8 9 10 11 12 1
Month/Year
Tem
pear
ture
(ºC
)
0
50
100
150
200
250
300
350
400
4502010 2011 2012
Pre
cipi
tati
on (
mm
)
Temperature(ºC ) Precipitation(mm)
Fig. 1 Monthly precipitation (mm) and mean temperature (°C) from January 2010 to January 2012 recorded at our ecological researchstation in Changsha, Hunan Province
Plant Soil (2014) 376:445–459 447

In 2009, a permanent study plot was establishedwithin each forest type with an area of 50 m×50 m forCL, 100 m×100 m for PM, 100 m×100 m for CA, and100 m×100 m for LG. Each plot was subdivided intosubplots (10 m×10 m) for investigating floristic com-ponents and tree spatial patterns of the forests. All treestems with a DBH ≥ 1 cm were recorded for the diam-eter at breast height (1.3 m, DBH), total height (H), andspecies name. Because sequential soil coring and in-growth cores were conducted within a quarter(0.25 ha) of each plot for the three secondary forests,the parameters of stand characteristics were esti-mated using the data of individual stems withDBH larger than 4 cm in the 0.25 ha area of plotfor each forest type. Tree species diversity index(DI) of each forest type was determined by usingShannon-Wiener index formula:
DI ¼ −X
i¼1
n
RIV i � log10 RIV ið Þ ð1Þ
where RIVi is the relative importance value of treespecies i, and n is the total number of tree speciesin a forest. The relative importance value (RIV)for each tree species in the four forest types wascalculated as the function of average of relative density,relative basal area, and relative frequency on a percent-age basis. Detailed stand characteristics of the fourforests are described in Table 1.
Sequential coring
Sequential coring is a commonly used method fromwhich to determine standing fine root biomass and thedata from this method can provide information relatingto seasonal variation in standing fine root biomass(Majdi et al. 2005; Vogt and Persson 1991). In thisstudy, fine root soil samples were collected with a steelauger (10 cm in diameter) at 0–10 cm, 10–20 cm, and20–30 cm soil depths. Nine sampling locations werearranged as replicates for each forest type at a samplingoccasion, i.e. three replicates at upper, middle, and lowerslope positions, respectively. Soil coring was car-ried out bimonthly over 2-year period from March2010 to January 2012. Soil samples were removedfrom the auger and placed in plastic bags thatwere transported to a laboratory and were storedin refrigeration (4 °C) within 1 month before fineroot separation.
Root ingrowth cores
Since the ingrowth core method measures fine rootbiomass that accesses a root-free soil volume within anestablished period of time (Persson 1980; Powell andDay 1991; Majdi 1996), fine root regrowth data can beused to estimate fine root production and to determinethe recovery rate of the fine root system after a distur-bance takes place (Meinen et al. 2009b). The ingrowthcoremethodwas used tomeasure fine root production inthe four forest stands. Six subplots in the centre of0.25 ha plot were chosen for each forest to install 18root ingrowth cores (6 replicates×3 sampling occasions)in January, 2010. In a subplot of each forest type, 3 soilcores were obtained with a steel auger (10 cm diameter,30 cm length) and these extracted soils were sieved witha 3 mm mesh sieve to remove roots. To create ingrowthcores, the sieved root-free soils were placed into1.5 mm×1.5 mm mesh fiberglass cylindrical bags(10 cm diameter, 30 cm height) as used by Uselmanand his colleagues and compacted to approximate theoriginal soil density of each site (Uselman et al. 2007).The bags were inserted back into the soil cores andmarked with PVC stakes. After 7 months (August2010), 14 months (March 2011), and 19 months(August 2011) incubation period following initial instal-lation, 6 ingrowth cores, each from a subplot, weremanually retrieved from each forest stand using a spade.The ingrowth core bags were placed into plastic bagsand transported to the laboratory for refrigeration stor-age at 4 °C, and then processed within 1 month.
Fine root separation and weighting
The soil coring and ingrowth core samples were takenout from the plastic storage bags and placed in 0.25 mmmesh sieves to sort out intact fine roots (≤ 2 mm diam-eter). Soil samples were sieved above a plastic bucket,and roots were manually picked out from the soil. Anysoil residue affixed to the fine roots was manually re-moved with caution by using tweezers. After visibleintact fine roots were separated from soil, the remainedsoil and sieved soil were placed into a bucket and soakedwith tap water for several hours. Watered samples werepoured into 0.25 mm mesh sieves and gently washed tocollect fine root segments. The fine roots were thenseparated into live and dead roots according to morpho-logical criteria, such as resilience, elasticity, and color.Live roots were intact, tough and flexible, while dead
448 Plant Soil (2014) 376:445–459

Tab
le1
Stand
characteristicsandothersite
factorsforthe
Cunninghamialanceolataforest(CL),Pinus
massoniana-Lithocarpusglaber
forest(PM),Choerospondiasaxillarisforest(CA),
andL.
glaber-Cyclobalanopsisglauca
forest(LG)
Foresttype
Dom
inantspecies
Speciesnumber
Stand
density
(Tree.ha
−1)
Average
DBH(cm)
Average
tree
H(m
)To
talB
A(m
2.ha−
1)
DI
Elevatio
n(m
)Slope
aspect
Slope
CL
Cunninghamia
lanceolata
1625
23.5(4.0–35.0)
19.5(4.5–27.0)
27.09
0223–258
SE24°
PMWholestand
192492
11.5
(4.0–37.2)
10.0(0.3–26.5)
33.66
0.746
220–262
SW15°
Pinus
massoniana
816
17.1
13.5
20.23
Lithocarpusglaber
1340
8.0
8.0
8.40
Choerospondiasaxillaris
7621.1
12.3
2.90
Liquidam
barform
osana
4013.8
11.7
0.71
Diospyros
glaucifolia
408.6
8.1
0.27
CA
Wholestand
321696
8.8(4.0–53.5)
6.4(1.4–28.1)
18.79
1.104
245–321
W35°
Choerospondiasaxillaris
184
27.5
15.9
12.29
Loropetalumchinensis
568
5.1
4.8
1.19
Symplocos
setchuensis
308
6.3
5.1
1.08
Litsea
coreana
928.0
5.7
0.51
Vernicia
fordii
4411.5
9.3
0.58
LG
Wholestand
231340
12.7(4.0–37.6)
10.3(1.5–21.0)
23.10
1.001
225–254
NW
22°
Lithocarpusglaber
552
12.7
10.5
8.45
Cyclobalanopsisglauca
188
13.9
11.4
3.80
Pinus
massomiana
140
17.6
14.0
3.81
Sassafrastzum
u68
19.9
14.1
2.52
Choerospondiasaxillaris
3623.3
13.5
1.97
Valuesin
parenthesisaretherangeof
diam
eter
atbreastheight
(1.3
cm)(D
BH)or
totaltree
height
(H)of
treesmeasuredin
each
forest;BA
andDIarebasalarea
anddiversity
index,
respectiv
ely;
SW,W
,NW
andSE
standforthesouthw
est,west,northw
estand
southeastinaspectof
each
forest
Plant Soil (2014) 376:445–459 449

roots were indicated by a dark cortex or stele, or a white,but non-turgid stele and fractured easily (Brassard et al.2011). The sorted live and dead roots were over-dried at80 °C to constant weight and then weighted for fine rootbiomass and necromass determination, respectively.
Data processing and statistical analysis
The dry weights of both live and dead fine roots in eachsoil core were summed to determine the total fine rootbiomass and necromass (g.m−2) of each of the fourforests. Data from sequential coring and ingrowth coresampling were both used to estimate annual fine rootproduction (g.m−2.yr−1). In principle, only when signif-icant differences were observed between seasonal rootbiomass peaks and troughs could sequential coring databe considered into the estimation (Meinen et al. 2009b).Significant difference (p<0.05, t-test) between the max-imum and minimum total fine root mass was detectedfor sequential coring data measured in each forest within1 year period, except the data for CA in 2010 (p=0.083,t-test) and LG in 2011 (p=0.062, t-test). Thus, this studyused the sequential coring data to calculate annual fineroot production (Pa) for the first year (from March 2010to January 2011) and the second year (fromMarch 2011to January 2012) by using Maximum-Minimum formu-la (McClaugherty et al. 1982):
Pa ¼ Bmax−Bmin ð2Þ
where Bmax and Bmin are the maximum and minimumtotal fine root mass (including both live fine root bio-mass and necromass), respectively. With respect to theingrowth core data, annual fine root production wascalculated as a division of the total fine root biomassextracted during the three aforementioned intervals bythe period between ingrowth core installation andharvesting.
All data were tested for normal (Gaussian) distribu-tion using the Shapiro-Wilk test (p<0.05). Fine rootbiomass data from sequential coring and ingrowth coresexhibited a non- Gaussian distribution and could notsatisfactorily be transformed. Therefore, Kruskal-Wallis one-way analysis of variance (ANOVA) follow-ed by the Mann–Whitney non-parametric multiple com-parisons test were used to detect significant differencesin fine root biomass and production between the fourforest types for each specific sampling time. Duringstatistical analysis, forest type and sampling time were
treated as two experimental variables, and two-wayANOVAwas used to detect their influence and interac-tions on fine root biomass. Differences between meanswere evaluated by the Mann–Whitney U test or by theTukey’s HSD (Honestly Significant Difference) test. Toexamine how fine root biomass changed with tree spe-cies diversity in the four forests, linear regressions be-tween total fine root biomass and tree species diversityindex (DI) were performed using the average data foreach of the nine sequential coring places over 2 studyyears. All statistical analyses were carried out using JMPstatistical software (SAS Institute 1996).
Results
Variations in standing fine root mass among forest types
Fine root biomass and necromass fluctuated dramatical-ly among different sampling occasions throughout thestudy period between March 2010 and January 2012.These seasonal variations of total fine root biomass andnecromass differed among the four forest types, withfluctuation amplitude being the lowest for CL and thehighest for LG over the period of 2 years. The peaks andtroughs of fine root biomass occurred asynchronously inthe four forest types (Table 2). For example, in the firstsampling year from March 2010 to January 2011, totalfine root biomass reached peaks in May for CL, in Julyfor PM, in March for CA, and in December for LG,while minimum total fine root biomass was recorded inJuly for CL, in March for PM, and in January for CAand LG. In the second sampling year from March 2011to January 2012, the highest value of total fine rootbiomass occurred in January for CL, in July for PM, inSeptember for CA, and in May for LG., respectively.However, minimum total fine root biomass took placesimultaneously in March for the four forests. For fineroot necromass in the four forests, the highest valuesoccurred in March while the lowest values were ob-served in December in the first sampling year, exceptLG, which reached a relative peak compared to othersampling times. In the second sampling year, the highestfine root necromass tended to take place in winter for thefour forest types whilst the lowest value occurred inMarch for CL and LG, and in July for PM and CA(Table 2). Interactive effects between forest type andsampling time were significant for fine root necromassin the first sampling year and fine root biomass in the
450 Plant Soil (2014) 376:445–459
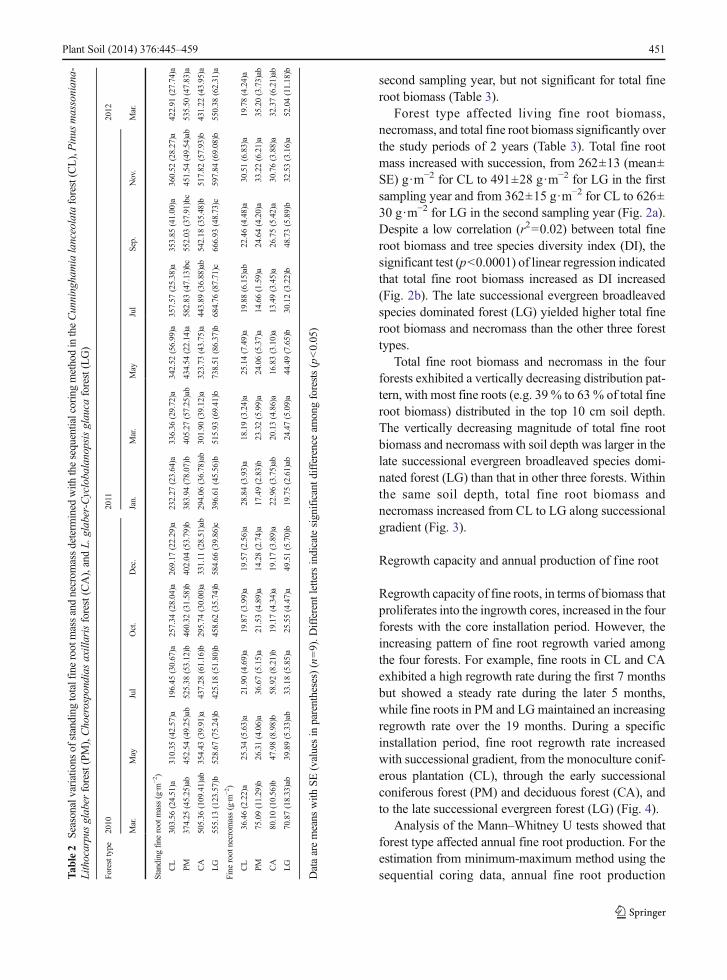
second sampling year, but not significant for total fineroot biomass (Table 3).
Forest type affected living fine root biomass,necromass, and total fine root biomass significantly overthe study periods of 2 years (Table 3). Total fine rootmass increased with succession, from 262±13 (mean±SE) g·m−2 for CL to 491±28 g·m−2 for LG in the firstsampling year and from 362±15 g·m−2 for CL to 626±30 g·m−2 for LG in the second sampling year (Fig. 2a).Despite a low correlation (r2=0.02) between total fineroot biomass and tree species diversity index (DI), thesignificant test (p<0.0001) of linear regression indicatedthat total fine root biomass increased as DI increased(Fig. 2b). The late successional evergreen broadleavedspecies dominated forest (LG) yielded higher total fineroot biomass and necromass than the other three foresttypes.
Total fine root biomass and necromass in the fourforests exhibited a vertically decreasing distribution pat-tern, with most fine roots (e.g. 39 % to 63% of total fineroot biomass) distributed in the top 10 cm soil depth.The vertically decreasing magnitude of total fine rootbiomass and necromass with soil depth was larger in thelate successional evergreen broadleaved species domi-nated forest (LG) than that in other three forests. Withinthe same soil depth, total fine root biomass andnecromass increased from CL to LG along successionalgradient (Fig. 3).
Regrowth capacity and annual production of fine root
Regrowth capacity of fine roots, in terms of biomass thatproliferates into the ingrowth cores, increased in the fourforests with the core installation period. However, theincreasing pattern of fine root regrowth varied amongthe four forests. For example, fine roots in CL and CAexhibited a high regrowth rate during the first 7 monthsbut showed a steady rate during the later 5 months,while fine roots in PM and LGmaintained an increasingregrowth rate over the 19 months. During a specificinstallation period, fine root regrowth rate increasedwith successional gradient, from the monoculture conif-erous plantation (CL), through the early successionalconiferous forest (PM) and deciduous forest (CA), andto the late successional evergreen forest (LG) (Fig. 4).
Analysis of the Mann–Whitney U tests showed thatforest type affected annual fine root production. For theestimation from minimum-maximum method using thesequential coring data, annual fine root productionT
able2
Seasonalvariations
ofstanding
totalfinerootmassandnecrom
assdeterm
ined
with
thesequentialcoringmethodintheCunninghamialanceolataforest(CL),Pinus
massoniana-
Lithocarpusglaber
forest(PM),Choerospondiasaxillarisforest(CA),andL.
glaber-Cyclobalanopsisglauca
forest(LG)
Foresttype
2010
2011
2012
Mar.
May
Jul
Oct.
Dec.
Jan.
Mar.
May
Jul
Sep.
Nov.
Mar.
Standing
fine
root
mass(g·m
−2)
CL
303.56
(24.51)a
310.35
(42.57)a
196.45
(30.67)a
257.34
(28.04)a
269.17
(22.29)a
232.27
(23.64)a
336.36
(29.72)a
342.52
(56.99)a
357.57
(25.38)a
353.85
(41.00)a
360.52
(28.27)a
422.91
(27.74)a
PM374.25
(45.25)ab
452.54
(49.25)ab
525.38
(53.12)b
460.32
(31.58)b
402.04
(53.79)b
383.94
(78.07)b
405.27
(57.25)ab
434.54
(22.14)a
582.83
(47.13)bc
552.03
(37.91)bc
451.54
(49.54)ab
535.50
(47.83)a
CA
505.36
(109.41)ab
354.43
(39.91)a
437.28
(61.16)b
295.74
(30.00)a
331.11
(28.51)ab
294.06
(36.78)ab
301.90
(39.12)a
323.73
(43.75)a
443.89
(36.88)ab
542.18
(35.48)b
517.82
(57.93)b
431.22
(43.95)a
LG
555.13
(123.57)b
528.67
(75.24)b
425.18
(51.80)b
458.62
(35.74)b
584.66
(39.86)c
396.61
(45.56)b
515.93
(69.41)b
738.51
(86.37)b
684.76
(87.71)c
666.93
(48.73)c
597.84
(69.08)b
550.38
(62.31)a
Fine
root
necrom
ass(g·m
−2)
CL
36.46(2.22)a
25.34(5.63)a
21.90(4.69)a
19.87(3.99)a
19.57(2.56)a
28.84(3.93)a
18.19(3.24)a
25.14(7.49)a
19.88(6.15)ab
22.46(4.48)a
30.51(6.83)a
19.78(4.24)a
PM75.09(11.29)b
26.31(4.06)a
36.67(5.15)a
21.53(4.89)a
14.28(2.74)a
17.49(2.83)b
23.32(5.99)a
24.06(5.37)a
14.66(1.59)a
24.64(4.20)a
33.22(6.21)a
35.20(3.73)ab
CA
80.10(10.56)b
47.98(8.98)b
58.92(8.21)b
19.17(4.34)a
19.17(3.89)a
22.96(3.75)ab
20.13(4.86)a
16.83(3.10)a
13.49(3.45)a
26.75(5.42)a
30.76(3.88)a
32.37(6.21)ab
LG
70.87(18.33)ab
39.89(5.33)ab
33.18(5.85)a
25.55(4.47)a
49.51(5.70)b
19.75(2.61)ab
24.47(5.09)a
44.49(7.65)b
30.12(3.22)b
48.73(5.89)b
32.53(3.16)a
52.04(11.18)b
Dataaremeans
with
SE(valuesin
parentheses)(n=9).D
ifferent
lettersindicatesignificantd
ifferenceam
ongforests(p<0.05)
Plant Soil (2014) 376:445–459 451

tended to increase along successional gradient and in-creasing tree species diversity (DI). Annual fine rootproduction increased from 114 g·m−2 yr −1 for CL to211 g·m−2 yr −1 for CA in the first sampling year andfrom 87 g·m−2 yr −1 for CL to 240 g·m−2 yr −1 for CA inthe second year, an increase of 85.5 % to 177.6 %(Fig. 5a). About 21.4 % to 75.6 % of annual fine rootproduction was observed at the 0–10 cm soil depth.Moreover, the proportion of annual fine root productiondistributed within the top 10 cm soil layer increased astree species diversity increased. For the estimation fromthe ingrowth core data, annual fine root production alsoincreased significantly with increasing tree species rich-ness, ranging from 186 g·m−2 yr −1 for CL to 513 g·m−2 yr −1 for LG, an increase of 175 % (Fig. 5b).
Discussion
Changes in fine root biomass and production with treespecies diversity
With succession and increasing tree species diversity,total standing fine root biomass and annual fine rootproduction showed an increase tendency from mono-culture plantation (CL) to late successional species
dominated forest (LG). This observation is consistentwith the findings in temperate forests, where fine rootbiomass and production increased significantly withsuccession (Yang et al. 2010; Uselman et al. 2007).With Minimum-Maximum formula, our results are alsoin agreement with the report by Brassard et al. (2011)who found that fine root biomass and annual productionwere higher in mixed than in single species stands ofsimilar age and site conditions, although there were alsosome studies conducted in three broadleaved temperateforests along tree species diversity gradient by Meinenet al. (2009b, c) revealed that higher fine root productionbut similar fine root biomass in species rich standscompared to species poor stands. Thereby, it is crucialthat which parameter was selected to use as indicator forfine root production. Besides, the calculating methoditself matters for fine root production estimation withsequential coring data (Meinen et al. 2009a). A recentstudy favored Decision matrix over Minimum-Maximum method due to more information is included,both living and dead fine roots. In this study, however,the results showed fine root production by calculatingwith Decision matrix was almost threefold higher thanthat with Minimum-Maximum method. It it likely theresult that the multiple sampling occasions (6 times ayear) might lead to overestimation of fine root
Table 3 F-value and P-value ofthe effects of forest type (FT) andsampling time (ST) on biomassand necromass, and total mass offine roots using a two-wayANOVA over 2 year study period
d.f. degree of freedom; NS nosignificant differences
*P<0.05, **P<0.01,***P<0.001
Year Items Factor d.f. F-values p -values
2010.3–2011.1 Live biomass (g·m−2) FT 3 18.483 6 <0.000 1***
ST 5 0.999 7 NS
FT × ST 15 1.245 2 NS
Necromass (g·m−2) FT 3 7.441 4 <0.000 1***
ST 5 24.638 9 <0.000 1***
FT × ST 15 3.189 8 0.000 1***
Total mass (g·m−2) FT 3 19.541 9 <0.000 1***
ST 5 1.885 7 NS
FT × ST 15 1.394 3 NS
2011.3–2012.1 Live biomass (g·m−2) FT 3 27.776 9 <0.000 1***
ST 5 3.846 8 0.002 4**
FT × ST 15 1.813 9 0.035 1*
Necromass (g·m−2) FT 3 11.309 8 <0.000 1***
ST 5 4.840 4 0.000 3***
FT × ST 15 1.298 0 NS
Total mass (g·m−2) FT 3 29.220 3 <0.000 1***
ST 5 3.768 1 0.002 8**
FT × ST 15 1.700 5 NS
452 Plant Soil (2014) 376:445–459

production as all the differences between two samplingperiod were summed up without considering the statis-tically significant differences (Brunner et al. 2013).
Whether forests composed of more diverse tree spe-cies lead to higher fine root biomass and productionmaydepend on the presence of belowground niche comple-mentarity or selection effects (Brassard et al. 2011;Loreau et al. 2001). Generally, belowground niche com-plementarity occurs when tree species with contrastingrooting traits shift their fine root distribution to the lowersoil profile (Schmid and Kazda 2002) or increase theirfine root density into the soil spaces that have not beenfilled by other tree species (Curt and Prevosto 2003;Meinen et al. 2009a, c). In this study, vertical
distribution patterns of total fine root biomass in thefour forests showed a decreasing trend in the soil profile.However, fine root biomass at a given soil depth wassignificantly higher and the vertical distribution de-creased more sharply in the species rich forests than inthe species poor forests. This vertical distribution patterncould result from different species-specific fine rootdistribution in the soil profile. Even though the specifictree species of fine roots were not identified in this study,vertical distribution patterns of fine roots showed greaterhorizontal soil exploitation by fine roots in the top richnutrient layer in species rich forests (Brassard et al.2011). Thus, behavior attributable to niche complemen-tarity of fine roots would appear to provide an
Fig. 2 Average total fine rootbiomass (a) and the fitted lineof total biomass against treespecies diversity (DI) (b) inthe four forests:Cunninghamia lanceolataforest (CL), Pinusmassoniana-Lithocarpusglaber forest (PM),Choerospondias axillarisforest (CA), and L. glaber-Cyclobalanopsis glauca for-est (LG). Error bars representstandard deviation (n=9)
Plant Soil (2014) 376:445–459 453

explanation to the phenomenon of high fine root bio-mass and production observed in species rich forests(Hodge 2004; Meinen et al. 2009a).
Total standing fine root biomass in this study fell intothe lower range reported in a meta-analysis study usingthe data from published literature in the world (Jacksonet al. 1997). For CL, total fine root biomass was similarto the value of 277 g·m−2 in C. lanceolata plantationsreported by Yang et al. (2004). Fine root biomass of PMwas very close to the result (437 g·m−2) obtained byBolte and Villanueva (2006). Compared to a study
of Meinen et al. (2009b) that fine root biomasswas 466 g·m−2 in three-species forest and 480 g·m−2 infive-species forest, deciduous forest in our study yieldeda lower fine root biomass, while evergreen broadleavedforest processed a higher fine root biomass. Moreover,total fine root biomass was higher in this studythan that in deciduous forest (Hölscher et al. 2002)and an oak-hornbeam forest (Rewald and Leuschner2009) in European temperate forests, but was similarto the value reported for Norway Spruce in America(Cronan 2003).
Fig. 3 Vertical distribution of living (left) and dead (right) fineroot mass at 0–30 cm soil depth in the Cunninghamia lanceolataforest (CL), Pinus massoniana-Lithocarpus glaber forest (PM),Choerospondias axillaris forest (CA), and L. glaber-Cyclobalanopsis glauca forest (LG). The values are means of 10
sampling occasions per plot (n=9). Different letters representsignificant differences among the forests in the same soil layer(Tukey’s test, p<0.05). Asterisks denote significant differenceamong soil layers within forest (p<0.05)
**
**
*
0
100
200
300
400
500
600
700
800
900
1000
0 2 4 6 8 10 12 14 16 18 20
Incubation time of ingrowth cores(month)
Fin
e ro
ot m
ass(
g.m
-2)
CL PM
CA LG
Fig. 4 Total fine root massmeasured with ingrowthcores method at three inter-vals (7, 14, and 19 months)under the Cunninghamialanceolata forest (CL), Pinusmassoniana-Lithocarpusglaber forest (PM),Choerospondias axillarisforest (CA), and L. glaber-Cyclobalanopsis glauca for-est (LG). Data are means ±SE (n=6). Asterisks denotesignificant difference amongforests (p<0.05): * p<0.05,** p<0.01
454 Plant Soil (2014) 376:445–459

Meinen et al. (2009a) pointed out that fine rootbiomass may be a poor indicator of fine root production.Therefore, we used fine root production to examine theeffects of increasing tree species diversity on below-ground production as well. It is difficult, however, toestimate annual fine root production accurately(Helmisaari et al. 2002), because annual fine root pro-duction may vary substantially within a year and be-tween years (Persson 1983; Hendrick and Pregitzer1993). Estimates of fine root production in forests alsostrongly depend on the method used (Gaul et al. 2009).Two independent methods were applied over a period oftwo years to determine fine root production in the fourforests. Fine root production estimated by minimum-maximum method with sequential coring data in thefour forests varied from 87 g·m−2 yr −1 in CL to240 g·m−2 yr −1 in CA, respectively. The values esti-mated by the ingrowth core method increased from
186 g·m−2 yr −1 in CL to 561 g·m−2 yr −1 in LG.These values estimated from two methods fell withinthe midrange of that for forests (25–820 g·m−2 yr −1)reported by Nadelhoffer and Raich (1992) and thehigher range (71–540 g·m−2 yr −1) reported by Lópezet al. (2001). The three secondary forests in this studyshowed higher fine root production than did mixedconiferous-broadleaved and evergreen broadleaved for-ests (242–265 g·m−2 yr −1) located on DinghushanMountain (Wen et al. 1999) and a lower valuethan broadleaved and coniferous forests (847–950 g ·m−2 yr −1) situated in southern China(Yang et al. 2004). Fine root production for CL in thisstudy were higher than that in C. lanceolata plantations(114 g·m−2 yr −1) measured in Huitong, southwesternHunan Province (Liao et al. 1995).
In this study, the ingrowth core method generatedmarkedly higher estimates of fine root production than
aa
a
b
bb
ab
b
CL PM CA LG CL PM CA LG
2010.3-2011.1 2011.3-2012.1
0
50
100
150
200
250
300
350
400
Forest type
Fin
e ro
ot p
rodu
ctio
n (g
.m-2 y
r−1)
Mineral soil(0-10cm)
Mineral soil(10-30cm)
aa
a
ababa
ab
b
abb
b
b
0
100
200
300
400
500
600
700
800
7-month 14-month 19-month
Incubation time of ingrowth cores(month)
Fin
e ro
ot p
rodu
ctio
n(g.
m-2
yr-1
)
CL PM CA LG
a
b
Fig. 5 Annual fine root pro-duction (means ± SE ing·m−2 yr −1) in theCunninghamia lanceolataforest (CL), Pinusmassoniana-Lithocarpusglaber forest (PM),Choerospondias axillarisforest (CA), and L. glaber-Cyclobalanopsis glauca for-est (LG). a Estimation of theupper (0–10 cm) and lower(10–30 cm) mineral soildepth from sequential coringmethod (n=9), b estimationfrom ingrowth core method(n=6). Bar with different let-ters indicate statistically sig-nificant differences betweenforests (Mann–WhitneyU test, p<0.05)
Plant Soil (2014) 376:445–459 455

did the sequential coring method. This result is in con-trast with findings from other studies in temperate for-ests (Hertel and Leuschner 2002; McClaugherty et al.1982; Meinen et al. 2009b), but in agreement withfindings in the study by Hendricks et al. (2006). Theassumptions and limitations of the two methods forestimating fine root production could be reasons forour result of higher fine root production estimated byingrowth core than sequential coring method. Fine rootproduction estimated by maximum-minimum methodwith sequential coring data is based on the assumptionsthat fine root production and mortality do not occursimultaneously during a sampling interval and no addi-tional peak or trough of fine root biomass takes placebetween the sampling occasions (Majdi et al. 2005).However, high seasonal fluctuation in fine root biomasswould take place in subtropical forests in response todrought stress, but fluctuations are possibly neglectedby the sequential coring method at intervals of twomonths. Hence, annual fine root production estimatedby sequential coring method in this study was net pro-duction that did not catch up gross production. At thesame time, application of ingrowth cores method toestimate fine root production suffers from several limi-tations such as root severing, soil disturbances, andreduced root competition in soil cores (Hendricks et al.2006; Hertel and Leuschner 2002). Severing root duringcore installation might result in adventitious roots, dis-turbed soil and lower competition in soil cores couldstimulate fine root regrowth (Hendricks et al. 2006),thus yielding high fine root production. In spite of thebiased estimates of annual fine root production, thecomparative results among the four forests provide ev-idence that fine root production tended to increase withsuccession and increasing tree species diversity.
Seasonal variations in fine root biomass and regrowthcapacity
As a very dynamic part of the root system, fine roots areusually responsive to environmental changes within aclear pattern of production that follows abovegroundphenological stages (Makkonen and Helmisaari 1998).Generally, fine root biomass increases in early spring,peaks from late spring to midsummer, and decreases inautumn (Brassard et al. 2009). In the forests with lowspecies diversity (e.g. CL and PM), total fine root bio-mass exhibited a relatively low fluctuation and more orless followed the phenological variation pattern
mentioned above. However, high seasonal fluctuationof total fine root biomass occurred in species rich forests(CA and LG). This is likely due to the responses of fineroot growth to changing environmental factors, such assoil moisture (Joslin et al. 2001) and temperature (Steeleet al. 1997). A negative relationship between root elon-gation and soil water potential was found in a matureoak stand (Joslin et al. 2001). We also observed that fineroot biomass was negatively related to precipitation(r2=0.010, p=0.036) but positively to air temperature(r2=0.012, p=0.024). Soil water deficiency due to hightemperatures and dry during summer caused more car-bon investment into fine roots to explore soil water(Ostonen et al. 2007) and generated high fine rootbiomass. High fluctuation and distinct seasonality offine root biomass in species rich forests reflected asynchronous response of different tree species to unfa-vorable environmental changes. This also suggests thatspecies rich forests retain a higher resistance capacityunder stress conditions (such as soil water deficiency).
In addition to differences of seasonal fluctuation am-plitude, total fine root biomass and necromass in the fourforests showed different seasonal variation patterns thatpeaks and troughs occurred at different time. The peaksand troughs of fine root biomass are the results of carbo-hydrate translocation to roots and root growth responsesto environmental conditions (Meinen et al. 2009b). Fineroot necromass in the four forests exhibited more distinctseasonal variations than did live fine root biomass, withhigh variation magnitude in the species rich forests. Thisresult may be attributed to simultaneously increasing fineroot mortality. Similar to findings of this study, Konôpkaet al. (2006) found that higher fine root necromass oc-curred at the beginning and end of the growing season.Other studies found that the highest values in fine rootnecromass occurred in June while the lowest value oc-curred in January (Xiao et al. 2008; Meinen et al. 2009b).However, endogenous rhythms of fine root growth andmortality as well as their response to environment of eachtree species in the forests need further investigations.
Fine root biomass that recolonised the root free soilof ingrowth cores increased more rapidly in the speciesrich forests than in the species poor forest over installa-tion period, supporting the hypothesis that high treediversity leads to high belowground regrowth rate.There are likely the results that more biomass is investedto fine roots when root grow into substrate containingmore “non-self” roots than “self” roots which are poten-tially encountered (de Kroon 2007). Thus, different
456 Plant Soil (2014) 376:445–459

phenologies of fine root growth for each component treespecies (Meinen et al. 2009b) and self-inhibition ofconspecific species on fine root growth (Schenk 2006)might be responsible for faster regrowth rate in morediverse tree root systems.
Conclusions
Results from this study showed that throughout thegrowing season a greater variation in fine root biomassoccurred in forests with advanced successional stageand richer tree species. Seasonal variations in fine rootbiomass could be interpreted by phenological carbonallocation to fine root and synchronous responses offine root growth of each tree species to environmentalfactors (i.e. precipitation and temperature). Total stand-ing fine root biomass and annual fine root productiontended to increase with succession and increasing treespecie diversity in the four forests. High fine root bio-mass found in the top rich nutrient soil layer that oc-curred in the species rich forests in this study suggeststhat highly diverse tree species could extensively exploitsoil space and nutrient resources to achieve high bio-mass and production. It will be necessary to applyadvanced methods (e.g. in situ root scanner) for accu-rately estimating fine root dynamics of each componenttree species as well as to investigate the morphologicaland physiological traits of fine roots to improve under-standing of relationship between tree species diversityand fine root production. Overall, our results can pro-vide detailed information on fine root production forprecisely scaling up fine root C cycling and forexplaining spatial and temporal variations in terrestrialecosystem C cycling.
Acknowledgments This study was financially supported by theNational Natural Science Foundation of China (31170426 and30771720); the New Century Excellent Talents program (NCET-06-0715); the Program for Science and Technology InnovativeResearch Team in Higher Educational Institutions and the FurongScholar Program of Hunan Province.
References
Bauhus J, Khanna PK, Menden N (2000) Aboveground andbelowground interactions in mixed plantations ofEucalyptus globulus and Acacia mearnsii. Can J For Res30:1886–1894
Bolte A, Villanueva I (2006) Interspecific competition impacts onthe morphology and distribution of fine roots in Europeanbeech (Fagus sylvatica L.) and Norway spruce (Picea abies(L.) Karst.). Eur J Fort Res 125:15–26
Børja I, De Wit HA, Steffenrem A, Majdi H (2008) Stand age andfine root biomass, distribution and morphology in a Norwayspruce chronosequence in southeast Norway. Tree Physiol28:773–784
Brassard BW, Chen HYH, Bergeron Y, Paré D (2011) Differencesin fine root productivity between mixed- and single-speciesstands. Funct Ecol 25:238–246
Brassard BW, Chen HYH, Bergeron Y (2009) Influence of envi-ronmental variability on root dynamics in northern forests.Crit Rev Plant Sci 28:179–197
Brunner I, BakkerMR, Bjoerk RG, HiranoY, LukacM, ArandaX,Borja I, Eldhuset TD, Helmisaari HS, Jourdan C, KonopkaB, Lopez BC, Miguel Perez C, Persson H, Ostonen I (2013)Fine-root turnover rates of European forests revisited: ananalysis of data from sequential coring and in growth cores.Plant Soil 362:357–372
Chapin FS, Zavaleta ES, Eviner VT, Naylor RL, Vitousek PM,Reynolds HL, Hooper DU, Lavorel S, Sala OE, Hobbie SE,Mack MC, Diaz S (2000) Consequences of changing biodi-versity. Nature 405:234–242
Cronan CS (2003) Belowground biomass, production and carboncycling in mature Norway spruce, Maine, USA. Can J ForRes 33:339–350
Curt T, Prevosto B (2003) Rooting strategy of naturally regener-ated beech in silver birch and Scots pine woodlands. PlantSoil 255:265–279
de Kroon H (2007) How do root interaction? Nature 38:1562–1563
Elmqvist T, Folke C, NystromM, PetersonG, Bengtsson J,WalkerB, Norberg J (2003) Response diversity, ecosystem change,and resilience. Front Ecol Environ 1:488–494
Feng ZW, Wang XK, Wu G (1999) The biomass and productivityof forest ecosystem in China. China Science Press, Beijing(in Chinese)
Gaul D, Hertel D, Leuschner C (2009) Estimating fine root lon-gevity in a temperate Norway spruce forest using three inde-pendent methods. Funct Plant Biol 36:1–9
Gill RA, Jackson RB (2000) Global patterns in root turnover forterrestrial ecosystems. New Phytol 147:13–31
Helmisaari HS,Makkonen K, Kellomäki S, Valtonen E,MälkönenE (2002) Below- and above-ground biomass, production andnitrogen use in Scots pine stands in eastern Finland. For EcolManag 165:317–326
Hendrick RL, Pregitzer KS (1993) Patterns of fine root mortality intwo sugar maple forests. Nature 361:59–61
Hendrick RL, Pregitzer KS (1996) Temporal and depth-relatedpatterns of fine root dynamics in northern hardwood forests. JEcol 84:167–176
Hendricks JJ, Hendrick RL, Wilson CA, Mitchell RJ, Pecot SD,GuoD (2006) Assessing the patterns and controls of fine rootdynamics: an empirical test and methodological review. JEcol 94:40–57
Hendriks CMA, Bianchi FJJA (1995) Root density and rootbiomass in pure and mixed forest stands of Douglas-fir andbeech. Neth J Agric Sci 43:321–331
Hertel D, Leuschner C (2002) A comparison of four different fineroot production estimates with ecosystem carbon balance
Plant Soil (2014) 376:445–459 457

data in a Fagus-Quercus mixed forest. Plant Soil 239:237–251
Hodge A (2004) The plastic plant: root responses to heterogeneoussupplies of nutrients. New Phytol 162:9–24
Hölscher D, Hertel D, Leuschner C, Hottkowitz M (2002) Treespecies diversity and soil patchiness in a temperate broad-leaved forest with limited rooting space. Flora 197:118–125
Jackson RB, Mooney HA, Schulze ED (1997) A global budget forfine root biomass, surface area and nutrient contents. ProcNatl Acad Sci U S A 94:7362–7366
Janssens IA, Sampson DA, Curiel-Yuste J, Carrara A, CeulemansR (2002) The carbon cost of fine root turnover in a Scots pineforest. For Ecol Manag 168:231–240
Joslin JD, Wolfe MH, Hanson PJ (2001) Factors controlling thetiming of root elongation intensity in a mature upland oakstand. Plant Soil 228:201–212
Knoke T, Ammer C, Stimm B, Mosandl R (2008) Admixingbroadleaved to coniferous tree species: a review on yield,ecological stability and economics. Eur J For Res 127:89–101
Konôpka B, Noguchi K, Sakata T, Takahashi M, Konôpkova Z(2006) Fine root dynamics in a Japanese cedar Cryptomeriajaponica plantation throughout the growing season. For EcolManag 225:278–86
Konôpka B, Pajtík J, Noguchi K, Lukac M (2013) ReplacingNorway spruce with European beech: a comparison of bio-mass and Net Primary Production patterns in young stands.For Ecol Manag 302:185–192
Leuschner C, Hertel D, Coners H, Büttner V (2001) Root compe-tition between beech and oak: a hypothesis. Oecologia 126:276–284
Liao LP, Chen CY, Zhang JW (1995) Turnover of fine roots in pureand mixed Cunninghamia lanceolata and Micheliamacclurei forests. Chin J Appl Ecol l6:7–10 (in Chinese withEnglish abstract)
López B, Sabaté S, Gracia CA (2001) Annual and seasonal chang-es in fine root biomass of a Quercus ilex L. forest. Plant Soil230:125–134
LoreauM,NaeemS, Inchausti P, Bengtsson J, Grime JP, Hector A,Hooper DU, Huston MA, Raffaetli D, Schmid B, Tilman D,Wardle DA (2001) Biodiversity and ecosystem functioning:current knowledge and future challenges. Science 294:804–808
Majdi H (1996) Root sampling methods-applications and limita-tions of the minirhizotron technique. Plant Soil 185:255–8
Majdi H, Pregitzer K, Morén A, Nylund J, Ågren GI (2005)Measuring fine root turnover in forest ecosytems. Plant Soil276:1–8
Makkonen K, Helmisaari HS (1998) Seasonal and yearly varia-tions of fine root biomass and necromass in a Scots pine(Pinus sylvestris L.) stand. For Ecol Manag 102:283–290
Matamala R, Gonzalez-Meler M, Jastrow J, Norby R, SchlesingerW (2003) Impacts of fine root turnover on forest NPP andsoil C sequestration potential. Science 302:1385–1387
McClaugherty CA, Aber JD, Melillo JM (1982) The role of fineroots in the organic matter and nitrogen budgets of twoforested ecosystems. Ecology 635:1481–1490
Meinen C, Hertel D, Leuschner C (2009a) Biomass and morphol-ogy of fine roots in temperate broad-leaved forests differingin tree species diversity: is there evidence of below-groundoveryielding? Oecologia 161:99–111
Meinen C, Hertel D, Leuschner C (2009b) Root growth andrecovery in temperate broad-leaved forest stands differingin tree species diversity. Ecosystems 12:1103–1116
Meinen C, Leuschner C, Ryan NT, Hertel D (2009c) No evidenceof spatial root system segregation and elevated fine rootbiomass in multi-species temperate broad-leaved forests.Trees 23:941–950
Nadelhoffer KJ, Raich JW (1992) Fine root production estimatesand belowground carbon allocation in forest ecosystems.Ecology 73:1139–1147
Ostonen I, Lõhmus K, Helmisaari HS, Truu J, Meel S (2007) Fineroot morphological adaptations in Scots pine, Norway spruceand silver birch along a latitudinal gradient in boreal forests.Tree Physiol 27:1627–1634
Persson H (1980) Fine-root production, mortality and decomposi-tion in forest ecosystems. Vegetatio 41:101–109
Persson HA (1983) The distribution and productivity of fine-rootsin boreal forests. Plant Soil 17:87–101
Powell SW, Day FP (1991) Root production in four communitiesin the Great Dismal Swamp. AM J Bot 78:288–297
Pretzsch H (2005) Diversity and productivity in forests: evidencefrom long-term experimental plots. In: Scherer-Lorenzen M,Körner C, Schulze ED (eds) Forest diversity and function:temperate and boreal systems. ecological studies, vol 176.Springer, Berlin, pp 41–64
Rewald B, Leuschner C (2009) Belowground competition in abroad-leaved temperate mixed forest-pattern analysis and ex-periments in a four-species stand. Eur J For Res 128:387–398
SAS Institute (1996) JMP start statistics—a guide to statistics anddata analysis using JMP and JMP IN software. DuxburyPress, Belmont
Schenk HJ (2006) Root competition: beyond resource depletion. JEcol 94:725–739
Schmid I, Kazda M (2002) Root distribution of Norway spruce inmonospecific and mixed stands on different soils. For EcolManag 159:37–47
Schmid I (2002) The influence of soil type and interspecificcompetition on the fine root system of Norway spruce andEuropean beech. Basic Appl Ecol 3:339–346
Silver WL, Thompson AW, McGroddy ME, Varner RK, Dias JD,Silva H, Crill PM, Kellers M (2005) Fine root dynamics andtrace gas fluxes in two lowland tropical forest soils. GlobChange Biol 11:290–360
Steele SJ, Gower ST, Vogel JG, Norman JM (1997) Root mass, netprimary production and turnover in aspen, jack pine andblack spruce forests in Saskatchewan and Manitoba,Canada. Tree Physiol 17:577–587
Uselman SM, Qualls RG, Lilienfein J (2007) Fine root productionacross a primary successional ecosystem chronosequence atMt. Shasta, California. Ecosystems 10:703–717
Vogt K, Persson H (1991) Measuring growth and development ofroots. In: Lassoie P, Hinckley T (eds) Techniques, approachesin forest tree ecophysiology. CRS Presss Inc., Florida, pp477–501
Vogt KA, Vogt DJ, Palmiotto PA, Boon P, O’Hara J, Asbjornsen H(1996) Review of root dynamics in forest ecosystemsgrouped by climate, climatic forest type and species. PlantSoil 187:159–219
Wells CE, Eissenstat DM (2001) Marked differences in survivor-ship among apple roots of different diameters. Ecology 82:882–892
458 Plant Soil (2014) 376:445–459

Wen DZ, Wei P, Kong GH (1999) The productivity and turnoverof fine roots of southern subtropical forest in DinghuMountains. Acta Bot Sin 23:361–369 (in Chinese withEnglish abstract)
Xiao CW, Sang WG, Wang RZ (2008) Fine root dynamics andturnover rate in an Asia white birch forest of DonglingshanMountain, China. For Ecol Manag 255:765–773
Xiao CW, Yuste JC, Janssens IA, Roskams P, Nachtergale L,Carrara A, Sanchez BY, Ceulemans R (2003) Above-and belowground biomass and net primary productionin a 73-year-old Scots pine forest. Tree Physiol 23:505–516
Yang YS, Chen GS, Lin P, Xie JS, Guo JF (2004) Fine rootdistribution, seasonal pattern and production in four planta-tions compared with a natural forest in subtropical China.Ann For Sci 61:617–627
Yang LY, Wu ST, Zhang LB (2010) Fine root biomass dynamicsand carbon storage along a successional gradient in ChangbaiMountains, China. Forestry 83:379–387
Yuan ZY, Chen HYH (2010) Fine root biomass, production,turnover rates, and nutrient contents in boreal forest ecosys-tems in relation to species, climate, fertility, and stand age:literature review and meta-analyses. Crit Rev Plant Sci 29:204–221
Plant Soil (2014) 376:445–459 459