stands to see asp upside from the new iphones in 2h16...
TRANSCRIPT
See important disclosures, including any required research certifications, beginning on page 5
Taiwan Information Technology
What's new: Largan’s share price has rallied by a strong 40% YTD, which we believe has been driven by the market starting to realise it is well-positioned for the coming spec upgrade trend for the new iPhones, as discussed in 12MP+12MP likely for iPhone 7 Plus, published on 21 January 2016. We believe the rally is not over and see further upside on strong operating-profit growth for 2H16-17E. We view the weak 2Q16 revenue as a good opportunity for investors to accumulate the stock. What's the impact: A major beneficiary of spec upgrades for the new iPhones. As discussed in Eyeing spec upgrade trends, we view the enhanced camera function as a key selling-point for the upcoming new iPhone 7 models and see Largan as a major beneficiary. Our recent market research indicates Apple plans to adopt a 12MP single cam with a 6P lens design (from 5P) for the iPhone 7 (4.7”), which should see Largan enjoy a 10-15% ASP increase, if not more. For the iPhone 7 Plus (5.5”), Apple plans to adopt a 12MP+12MP dual-cam with a 6P+5P lens design, implying that Largan should see a 100% ASP premium over the current model (iPhone 6S Plus). We now expect the dual-cam model to account for 35% of all the new iPhones in 2H16, higher than our earlier estimate of 25%. For the iPhone 7, we expect Largan to no longer provide VCM/OIS assembly service for all models, due to the change in camera structure. We estimate this change would reduce Largan’s revenue by 7-9% for 2016-18E but have only a 1-2% earnings impact, which we have factored into our revised forecasts. Weak 2Q16E should provide window to buy ahead of strong 2H16-17. Due to iPhone 6S ongoing inventory adjustments, we forecast 2Q16 revenue of TWD9.4bn, up 14% QoQ but down 31% YoY. But we look for Largan to deliver strong HoH revenue growth in 2H16E with operating profit resuming 18% YoY growth (vs. a 27% YoY decline in 1H16), on the back of ASP increases and the ramp-up in shipments for new iPhones (page 2) as well as the spec upgrades from Chinese brands. We forecast Largan to deliver strong operating profit growth of 28% YoY for 2017 due to the increasing penetration of dual-cam and ongoing favourable spec upgrades. Moreover, we see a rising possibility that Apple will adopt dual cams for the 4.7” iPhone model in 2H17, which could provide 6-13% upside to our 2017-18 earnings, which we have not yet built into our forecasts. What we recommend: Factoring in the above factors, we trim our 2016E EPS by 2% but raise our 2017-18E EPS by 2-4%. We reaffirm our Buy (1) rating, and lift our 12-month target price to TWD3,200 (from TWD3,050), based on an unchanged target PER of 16x, the mid-point of the stock’s historical range of 8-24x, applied to our revised 1-year-forward EPS. Key risk to our call would be weaker-than-expected smartphone sell-through. How we differ: We are the first foreign firm in Taiwan to highlight the possibility of 12M+12MP adoption for new iPhones to be released in 2H16.
30 May 2016
Benefits from spec upgrades to kick-in from 2H16
Stands to see ASP upside from the new iPhones in 2H16
Operating profit should resume 18-28% YoY growth for 2H16-17E
Reiterate Buy (1) with target price raised to TWD3,200
Source: Daiwa forecasts
Source: FactSet, Daiwa forecasts
Largan Precision (3008 TT)
Target price: TWD3,200 (from TWD3,050)
Share price (30 May): TWD2,755 | Up/downside: +16.1%
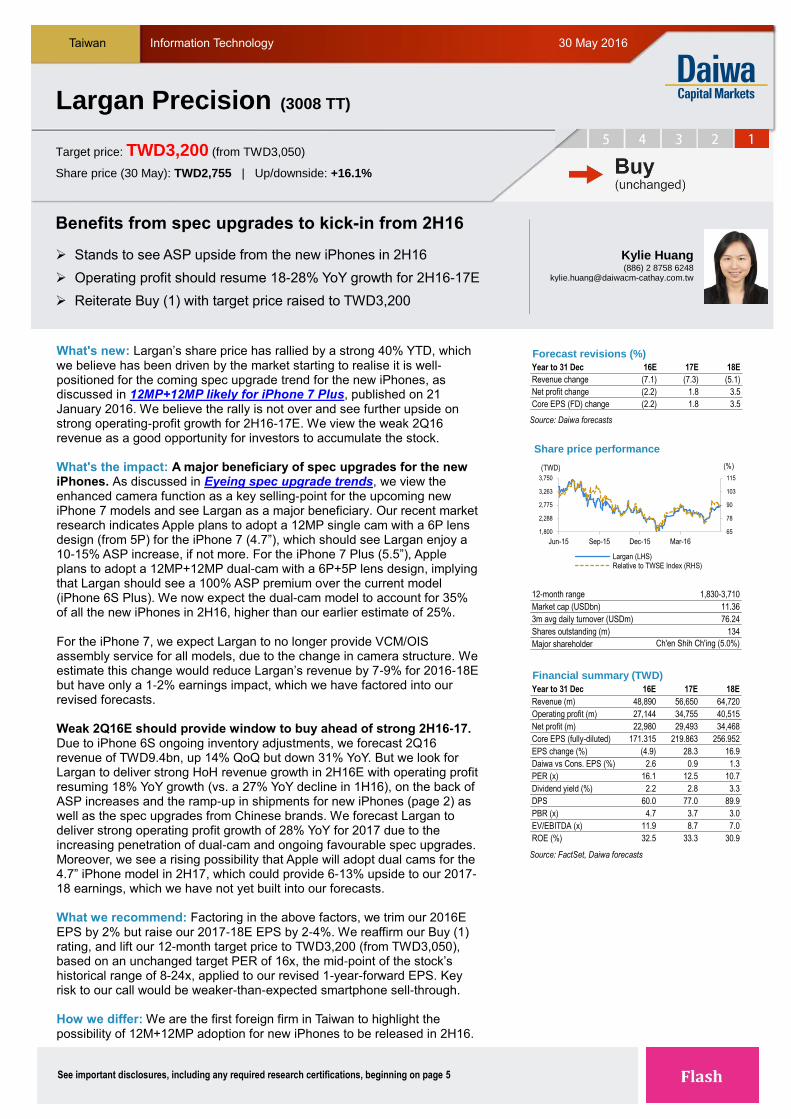
Kylie Huang(886) 2 8758 6248
Forecast revisions (%)
Year to 31 Dec 16E 17E 18E
Revenue change (7.1) (7.3) (5.1)
Net profit change (2.2) 1.8 3.5
Core EPS (FD) change (2.2) 1.8 3.5
65
78
90
103
115
1,800
2,288
2,775
3,263
3,750
Jun-15 Sep-15 Dec-15 Mar-16
Share price performance
Largan (LHS)Relative to TWSE Index (RHS)
(TWD) (%)
12-month range 1,830-3,710
Market cap (USDbn) 11.36
3m avg daily turnover (USDm) 76.24
Shares outstanding (m) 134
Major shareholder Ch'en Shih Ch'ing (5.0%)
Financial summary (TWD)
Year to 31 Dec 16E 17E 18E
Revenue (m) 48,890 56,650 64,720
Operating profit (m) 27,144 34,755 40,515
Net profit (m) 22,980 29,493 34,468
Core EPS (fully-diluted) 171.315 219.863 256.952
EPS change (%) (4.9) 28.3 16.9
Daiwa vs Cons. EPS (%) 2.6 0.9 1.3
PER (x) 16.1 12.5 10.7
Dividend yield (%) 2.2 2.8 3.3
DPS 60.0 77.0 89.9
PBR (x) 4.7 3.7 3.0
EV/EBITDA (x) 11.9 8.7 7.0
ROE (%) 32.5 33.3 30.9

2
Largan Precision (3008 TT): 30 May 2016
iPhone: production volume by model
(m units) 1Q14 2Q14 3Q14 4Q14 1Q15 2Q15 3Q15 4Q15 1Q16 2Q16E 3Q16E 4Q16E 2014 2015 2016E
iPhone 4 & 4S 7.5 7.5 5.0 2.0 2.0 0.5 0.0 0.0 0.0 0.0 0.0 0.0 22.0 2.5 0.0
iPhone 5C 6.5 5.0 4.0 3.0 2.5 1.0 0.5 0.0 0.0 0.0 0.0 0.0 18.5 4.0 0.0
iPhone 5S/6 SE 26.5 24.0 13.0 6.0 8.0 4.5 4.0 2.5 4.0 6.0 6.0 6.5 69.5 19.0 22.5
iPhone 6 & 6 Plus 0.0 0.0 17.0 63.0 45.5 47.0 19.5 13.5 7.5 5.0 4.0 4.5 80.0 125.5 21.0
iPhone 6S & 6S Plus 0.0 0.0 0.0 0.0 0.0 0.0 22.0 60.0 35.5 32.0 14.0 8.0 0.0 82.0 89.5
iPhone 7 series 0.0 0.0 0.0 0.0 0.0 0.0 0.0 0.0 0.0 0.0 23.5 55.5 0.0 0.0 79.0
Total 40.5 36.5 39.0 74.0 58.0 53.0 46.0 76.0 47.0 43.0 47.5 74.5 190.0 233.0 212.0
Source: Daiwa forecasts
Largan: revisions to revenue and earnings forecasts
Revised forecasts Previous forecasts Change
TWDm 2016E 2017E 2018E 2016E 2017E 2018E 2016E 2017E 2018E
Revenues 48,890 56,650 64,720
52,620 61,120 68,200
-7.1% -7.3% -5.1%
Gross profit 31,534 39,315 45,369
31,993 38,836 44,221
-1.4% 1.2% 2.6%
Operating profit 27,144 34,755 40,515
27,626 34,068 39,106
-1.7% 2.0% 3.6%
Net profit 22,980 29,493 34,468
23,503 28,965 33,297
-2.2% 1.8% 3.5%
EPS (TWD) 171 220 257
175 216 248
-2.2% 1.8% 3.5%
Margins (%)
Gross margin 64.5% 69.4% 70.1%
60.8% 63.5% 64.8%
Operating margin 55.5% 61.4% 62.6%
52.5% 55.7% 57.3%
Net margin 47.0% 52.1% 53.3% 44.7% 47.4% 48.8%
Source: Daiwa forecasts
Largan: quarterly and annual P&L statement
2016E 2017E
2016E 2017E 2018E
(TWDm) 1Q 2QE 3QE 4QE 1QE 2QE 3QE 4QE
Net sales 8,271 9,438 14,204 16,977 10,742 11,441 15,713 18,755 48,890 56,650 64,720
COGS 3,335 3,775 5,255 4,990 3,459 3,488 5,315 5,073 17,356 17,335 19,351
Gross profit 4,936 5,663 8,948 11,987 7,283 7,952 10,397 13,682 31,534 39,315 45,369
Operating costs 751 812 1,282 1,545 912 903 1,231 1,514 4,390 4,560 4,854
Operating profit 4,185 4,851 7,666 10,442 6,371 7,050 9,166 12,168 27,144 34,755 40,515
Pre-tax income 4,219 4,981 7,866 10,688 6,587 7,266 9,382 12,384 27,754 35,619 41,627
Net income 3,623 3,486 6,686 9,185 5,599 5,231 8,069 10,594 22,980 29,493 34,468
Net EPS (TWD) 27.01 25.99 49.85 68.47 41.74 39.00 60.15 78.97 171.31 219.86 256.95
Operating ratios
Gross margin 59.7% 60.0% 63.0% 70.6% 67.8% 69.5% 66.2% 73.0% 64.5% 69.4% 70.1%
Operating margin 50.6% 51.4% 54.0% 61.5% 59.3% 61.6% 58.3% 64.9% 55.5% 61.4% 62.6%
Pre-tax margin 51.0% 52.8% 55.4% 63.0% 61.3% 63.5% 59.7% 66.0% 56.8% 62.9% 64.3%
Net margin 43.8% 36.9% 47.1% 54.1% 52.1% 45.7% 51.4% 56.5% 47.0% 52.1% 53.3%
YoY (%)
Net revenue -22% -31% -12% 10% 30% 21% 11% 10% -12% 16% 14%
Gross profit -18% -29% 1% 30% 48% 40% 16% 14% -2% 25% 15%
Operating income -19% -32% 3% 31% 52% 45% 20% 17% -2% 28% 17%
Pre-tax income -17% -29% -15% 36% 56% 46% 19% 16% -5% 28% 17%
Net income -18% -28% -19% 37% 55% 50% 21% 15% -5% 28% 17%
QoQ (%)
Net revenue -46% 14% 50% 20% -37% 7% 37% 19%
Gross profit -47% 15% 58% 34% -39% 9% 31% 32%
Operating income -47% 16% 58% 36% -39% 11% 30% 33%
Pre-tax income -47% 18% 58% 36% -38% 10% 29% 32%
Net income -46% -4% 92% 37% -39% -7% 54% 31%
Source: Company, Daiwa forecasts
Largan: 1-year-forward PER Largan: 1-year-forward PBR
Source: Company, Daiwa forecasts Source: Company, Daiwa forecasts
0
500
1,000
1,500
2,000
2,500
3,000
3,500
4,000
4,500
5,000
Jan-
05
Jul-0
5
Jan-
06
Jul-0
6
Jan-
07
Jul-0
7
Jan-
08
Jul-0
8
Jan-
09
Jul-0
9
Jan-
10
Jul-1
0
Jan-
11
Jul-1
1
Jan-
12
Jul-1
2
Jan-
13
Jul-1
3
Jan-
14
Jul-1
4
Jan-
15
Jul-1
5
Jan-
16
(TWD)
Largan 6x 12x 18x 24x
0
500
1,000
1,500
2,000
2,500
3,000
3,500
4,000
4,500
5,000
Jan-
05
Jul-0
5
Jan-
06
Jul-0
6
Jan-
07
Jul-0
7
Jan-
08
Jul-0
8
Jan-
09
Jul-0
9
Jan-
10
Jul-1
0
Jan-
11
Jul-1
1
Jan-
12
Jul-1
2
Jan-
13
Jul-1
3
Jan-
14
Jul-1
4
Jan-
15
Jul-1
5
Jan-
16
(TWD)
Largan 2x 4x 6x 8x

3
Largan Precision (3008 TT): 30 May 2016
Financial summary
Key assumptions
Profit and loss (TWDm)
Cash flow (TWDm)
Source: FactSet, Daiwa forecasts
Year to 31 Dec 2011 2012 2013 2014 2015 2016E 2017E 2018E
Mobile phone lens shipment ('000 units) 286,554 344,730 539,156 869,054 998,771 887,579 1,014,939 1,134,011
Blended ASP of handset lens (USD) 1.33 1.34 1.35 1.47 1.47 1.56 1.71 1.77
Gross margin of VCM assembly (%) 6.8 5.3 6.0 7.4 8.4 7.5 7.5 7.5
Year to 31 Dec 2011 2012 2013 2014 2015 2016E 2017E 2018E
Mobile Phone Lens Revenues 11,300 13,647 21,615 38,140 45,970 44,325 55,459 64,349
VCM Aseembly Revenue 3,943 5,543 5,268 7,370 9,781 4,479 1,089 281
Other Revenue 742 882 550 301 118 86 103 89
Total Revenue 15,984 20,072 27,433 45,810 55,869 48,890 56,650 64,720
Other income 0 0 0 0 0 0 0 0
COGS (9,043) (11,710) (14,472) (21,291) (23,812) (17,356) (17,335) (19,351)
SG&A (506) (530) (887) (1,349) (1,817) (1,812) (1,882) (2,003)
Other op.expenses (963) (1,034) (1,293) (2,103) (2,585) (2,578) (2,678) (2,851)
Operating profit 5,472 6,798 10,781 21,067 27,655 27,144 34,755 40,515
Net-interest inc./(exp.) 50 84 122 250 349 455 458 656
Assoc/forex/extraord./others 314 (71) 598 1,646 1,156 155 406 457
Pre-tax profit 5,837 6,811 11,501 22,963 29,160 27,754 35,619 41,627
Tax (638) (1,234) (1,891) (3,525) (5,003) (4,774) (6,126) (7,160)
Min. int./pref. div./others 0 0 0 0 0 0 0 0
Net profit (reported) 5,199 5,578 9,610 19,438 24,157 22,980 29,493 34,468
Net profit (adjusted) 5,199 5,578 9,610 19,438 24,157 22,980 29,493 34,468
EPS (reported)(TWD) 38.755 41.581 71.640 144.909 180.084 171.315 219.863 256.952
EPS (adjusted)(TWD) 38.755 41.581 71.640 144.909 180.084 171.315 219.863 256.952
EPS (adjusted fully-diluted)(TWD) 38.755 41.581 71.640 144.909 180.084 171.315 219.863 256.952
DPS (TWD) 17.000 17.000 28.500 51.000 63.030 59.960 76.952 89.933
EBIT 5,472 6,798 10,781 21,067 27,655 27,144 34,755 40,515
EBITDA 6,372 8,005 12,229 22,728 29,495 27,144 34,755 40,515
Year to 31 Dec 2011 2012 2013 2014 2015 2016E 2017E 2018E
Profit before tax 5,837 6,811 11,501 22,963 29,160 27,754 35,619 41,627
Depreciation and amortisation 900 1,208 1,448 1,661 1,841 2,056 2,529 3,001
Tax paid (638) (1,234) (1,891) (3,525) (5,003) (4,774) (6,126) (7,160)
Change in working capital 1,202 (783) (363) (920) 7,411 (12,007) 315 (1,024)
Other operational CF items 18 (2) 51 (32) 6 (5) (6) (7)
Cash flow from operations 7,318 6,000 10,746 20,147 33,414 13,024 32,330 36,438
Capex (3,149) (2,865) (1,504) (5,568) (8,213) (4,500) (4,500) (4,000)
Net (acquisitions)/disposals (2) (101) 9 194 (0) (10) (10) (10)
Other investing CF items (23) (19) (1,593) (695) 125 266 0 0
Cash flow from investing (3,173) (2,985) (3,088) (6,069) (8,089) (4,244) (4,510) (4,010)
Change in debt 319 (356) 12 108 (32) (80) 0 0
Net share issues/(repurchases) 0 0 0 0 0 0 0 0
Dividends paid (1,811) (2,280) (2,280) (3,823) (6,841) (8,455) (8,043) (10,322)
Other financing CF items 37 (43) 51 138 (127) 0 0 0
Cash flow from financing (1,456) (2,679) (2,217) (3,577) (7,000) (8,535) (8,043) (10,322)
Forex effect/others 0 0 0 0 0 0 0 0
Change in cash 2,690 336 5,440 10,501 18,325 245 19,777 22,106
Free cash flow 4,169 3,136 9,242 14,579 25,201 8,524 27,830 32,438
4
Largan Precision (3008 TT): 30 May 2016
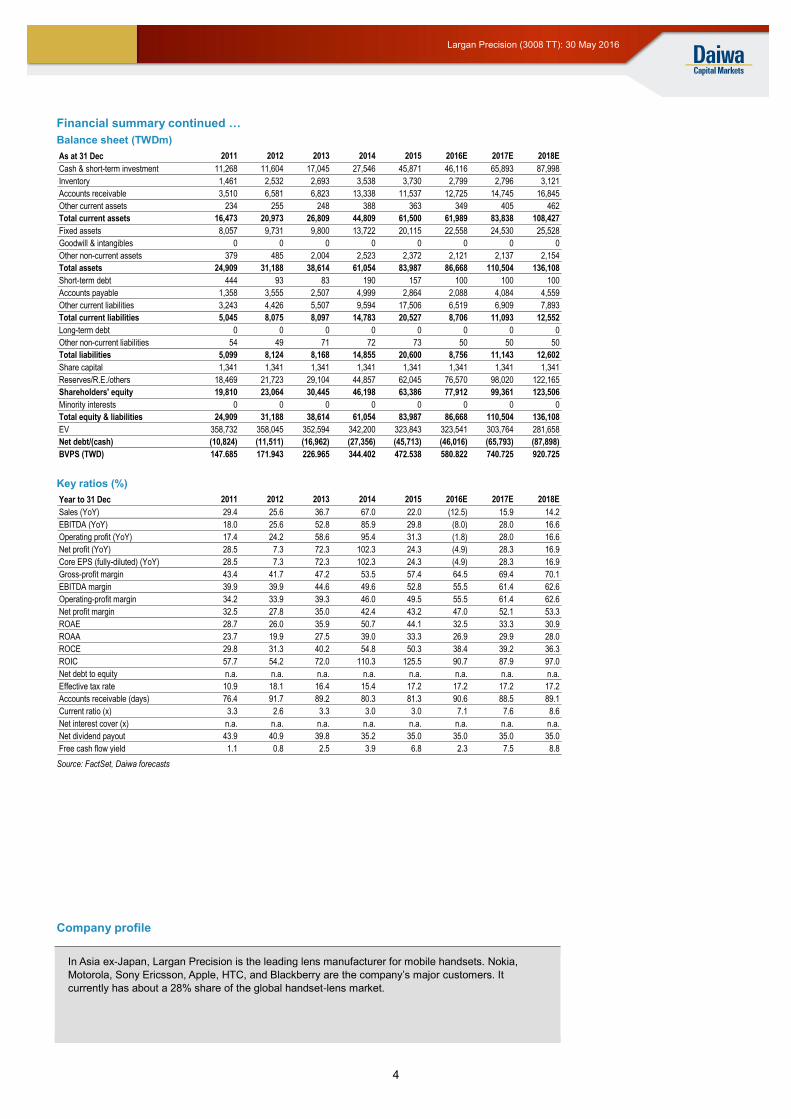
Financial summary continued …
Balance sheet (TWDm)
Key ratios (%)
Source: FactSet, Daiwa forecasts
As at 31 Dec 2011 2012 2013 2014 2015 2016E 2017E 2018E
Cash & short-term investment 11,268 11,604 17,045 27,546 45,871 46,116 65,893 87,998
Inventory 1,461 2,532 2,693 3,538 3,730 2,799 2,796 3,121
Accounts receivable 3,510 6,581 6,823 13,338 11,537 12,725 14,745 16,845
Other current assets 234 255 248 388 363 349 405 462
Total current assets 16,473 20,973 26,809 44,809 61,500 61,989 83,838 108,427
Fixed assets 8,057 9,731 9,800 13,722 20,115 22,558 24,530 25,528
Goodwill & intangibles 0 0 0 0 0 0 0 0
Other non-current assets 379 485 2,004 2,523 2,372 2,121 2,137 2,154
Total assets 24,909 31,188 38,614 61,054 83,987 86,668 110,504 136,108
Short-term debt 444 93 83 190 157 100 100 100
Accounts payable 1,358 3,555 2,507 4,999 2,864 2,088 4,084 4,559
Other current liabilities 3,243 4,426 5,507 9,594 17,506 6,519 6,909 7,893
Total current liabilities 5,045 8,075 8,097 14,783 20,527 8,706 11,093 12,552
Long-term debt 0 0 0 0 0 0 0 0
Other non-current liabilities 54 49 71 72 73 50 50 50
Total liabilities 5,099 8,124 8,168 14,855 20,600 8,756 11,143 12,602
Share capital 1,341 1,341 1,341 1,341 1,341 1,341 1,341 1,341
Reserves/R.E./others 18,469 21,723 29,104 44,857 62,045 76,570 98,020 122,165
Shareholders' equity 19,810 23,064 30,445 46,198 63,386 77,912 99,361 123,506
Minority interests 0 0 0 0 0 0 0 0
Total equity & liabilities 24,909 31,188 38,614 61,054 83,987 86,668 110,504 136,108
EV 358,732 358,045 352,594 342,200 323,843 323,541 303,764 281,658
Net debt/(cash) (10,824) (11,511) (16,962) (27,356) (45,713) (46,016) (65,793) (87,898)
BVPS (TWD) 147.685 171.943 226.965 344.402 472.538 580.822 740.725 920.725
Year to 31 Dec 2011 2012 2013 2014 2015 2016E 2017E 2018E
Sales (YoY) 29.4 25.6 36.7 67.0 22.0 (12.5) 15.9 14.2
EBITDA (YoY) 18.0 25.6 52.8 85.9 29.8 (8.0) 28.0 16.6
Operating profit (YoY) 17.4 24.2 58.6 95.4 31.3 (1.8) 28.0 16.6
Net profit (YoY) 28.5 7.3 72.3 102.3 24.3 (4.9) 28.3 16.9
Core EPS (fully-diluted) (YoY) 28.5 7.3 72.3 102.3 24.3 (4.9) 28.3 16.9
Gross-profit margin 43.4 41.7 47.2 53.5 57.4 64.5 69.4 70.1
EBITDA margin 39.9 39.9 44.6 49.6 52.8 55.5 61.4 62.6
Operating-profit margin 34.2 33.9 39.3 46.0 49.5 55.5 61.4 62.6
Net profit margin 32.5 27.8 35.0 42.4 43.2 47.0 52.1 53.3
ROAE 28.7 26.0 35.9 50.7 44.1 32.5 33.3 30.9
ROAA 23.7 19.9 27.5 39.0 33.3 26.9 29.9 28.0
ROCE 29.8 31.3 40.2 54.8 50.3 38.4 39.2 36.3
ROIC 57.7 54.2 72.0 110.3 125.5 90.7 87.9 97.0
Net debt to equity n.a. n.a. n.a. n.a. n.a. n.a. n.a. n.a.
Effective tax rate 10.9 18.1 16.4 15.4 17.2 17.2 17.2 17.2
Accounts receivable (days) 76.4 91.7 89.2 80.3 81.3 90.6 88.5 89.1
Current ratio (x) 3.3 2.6 3.3 3.0 3.0 7.1 7.6 8.6
Net interest cover (x) n.a. n.a. n.a. n.a. n.a. n.a. n.a. n.a.
Net dividend payout 43.9 40.9 39.8 35.2 35.0 35.0 35.0 35.0
Free cash flow yield 1.1 0.8 2.5 3.9 6.8 2.3 7.5 8.8
Company profile
In Asia ex-Japan, Largan Precision is the leading lens manufacturer for mobile handsets. Nokia,
Motorola, Sony Ericsson, Apple, HTC, and Blackberry are the company’s major customers. It
currently has about a 28% share of the global handset-lens market.

5
Largan Precision (3008 TT): 30 May 2016
Important Disclosures and Disclaimer
This publication is produced by Daiwa Securities Group Inc. and/or its non-U.S. affiliates, and distributed by Daiwa Securities Group Inc. and/or its non-U.S. affiliates, except to the extent expressly provided herein. This publication and the contents hereof are intended for information purposes only, and may be subject to change without further notice. Any use, disclosure, distribution, dissemination, copying, printing or reliance on this publication for any other purpose without our prior consent or approval is strictly prohibited. Neither Daiwa Securities Group Inc. nor any of its respective parent, holding, subsidiaries or affiliates, nor any of its respective directors, officers, servants and employees, represent nor warrant the accuracy or completeness of the information contained herein or as to the existence of other facts which might be significant, and will not accept any responsibility or liability whatsoever for any use of or reliance upon this publication or any of the contents hereof. Neither this publication, nor any content hereof, constitute, or are to be construed as, an offer or solicitation of an offer to buy or sell any of the securities or investments mentioned herein in any country or jurisdiction nor, unless expressly provided, any recommendation or investment opinion or advice. Any view, recommendation, opinion or advice expressed in this publication may not necessarily reflect those of Daiwa Securities Group Inc., and/or its affiliates nor any of its respective directors, officers, servants and employees except where the publication states otherwise. This research report is not to be relied upon by any person in making any investment decision or otherwise advising with respect to, or dealing in, the securities mentioned, as it does not take into account the specific investment objectives, financial situation and particular needs of any person. Daiwa Securities Group Inc., its subsidiaries or affiliates, or its or their respective directors, officers and employees from time to time have trades as principals, or have positions in, or have other interests in the securities of the company under research including market making activities, derivatives in respect of such securities or may have also performed investment banking and other services for the issuer of such securities. The following are additional disclosures.
Ownership of Securities
For “Ownership of Securities” information, please visit BlueMatrix disclosure link at https://daiwa3.bluematrix.com/sellside/Disclosures.action.
Investment Banking Relationship
For “Investment Banking Relationship”, please visit BlueMatrix disclosure link at https://daiwa3.bluematrix.com/sellside/Disclosures.action.
Japan
Daiwa Securities Co. Ltd. and Daiwa Securities Group Inc.
Daiwa Securities Co. Ltd. is a subsidiary of Daiwa Securities Group Inc.
Investment Banking Relationship
Within the preceding 12 months, the subsidiaries and/or affiliates of Daiwa Securities Group Inc. * has lead-managed public offerings and/or secondary offerings (excluding straight bonds) of the securities of the following companies: econtext Asia Ltd (1390 HK); Mirae Asset Life Insurance Co Ltd (085620 KS); China Reinsurance Group Corporation (1508 HK).
*Subsidiaries of Daiwa Securities Group Inc. for the purposes of this section shall mean any one or more of: Daiwa Capital Markets Hong Kong Limited (大和資本市場香港有限公司), Daiwa
Capital Markets Singapore Limited, Daiwa Capital Markets Australia Limited, Daiwa Capital Markets India Private Limited, Daiwa-Cathay Capital Markets Co., Ltd., Daiwa Securities Capital Markets Korea Co., Ltd.
Hong Kong
This research is distributed in Hong Kong by Daiwa Capital Markets Hong Kong Limited (大和資本市場香港有限公司) (“DHK”) which is regulated by the Hong Kong Securities and Futures
Commission. Recipients of this research in Hong Kong may contact DHK in respect of any matter arising from or in connection with this research. Relevant Relationship (DHK)
DHK may from time to time have an individual employed by or associated with it serves as an officer of any of the companies under its research coverage.
Singapore
This research is distributed in Singapore by Daiwa Capital Markets Singapore Limited and it may only be distributed in Singapore to accredited investors, expert investors and institutional investors as defined in the Financial Advisers Regulations and the Securities and Futures Act (Chapter 289), as amended from time to time. By virtue of distribution to these category of investors, Daiwa Capital Markets Singapore Limited and its representatives are not required to comply with Section 36 of the Financial Advisers Act (Chapter 110) (Section 36 relates to disclosure of Daiwa Capital Markets Singapore Limited’s interest and/or its representative’s interest in securities). Recipients of this research in Singapore may contact Daiwa Capital Markets Singapore Limited in respect of any matter arising from or in connection with the research.
Australia
This research is distributed in Australia by Daiwa Capital Markets Australia Limited and it may only be distributed in Australia to wholesale investors within the meaning of the Corporations Act. Recipients of this research in Australia may contact Daiwa Capital Markets Stockbroking Limited in respect of any matter arising from or in connection with the research.
India
This research is distributed in India to Institutional Clients only by Daiwa Capital Markets India Private Limited (Daiwa India) which is an intermediary registered with Securities & Exchange Board of India as a Stock Broker, Merchant Bank and Research Analyst. Daiwa India, its Research Analyst and their family members and its associates do not have any financial interest save as disclosed or other undisclosed material conflict of interest in the securities or derivatives of any companies under coverage. Daiwa India and its associates may have received compensation for any products other than Investment Banking (as disclosed) or brokerage services from the subject company in this report during the past 12 months. Unless otherwise stated in BlueMatrix disclosure link at https://daiwa3.bluematrix.com/sellside/Disclosures.action, Daiwa India and its associates do not hold more than 1% of any companies covered in this research report. There is no material disciplinary action against Daiwa India by any regulatory authority impacting equity research analysis activities as of the date of this report.
Taiwan
This research is distributed in Taiwan by Daiwa-Cathay Capital Markets Co., Ltd and it may only be distributed in Taiwan to institutional investors or specific investors who have signed recommendation contracts with Daiwa-Cathay Capital Markets Co., Ltd in accordance with the Operational Regulations Governing Securities Firms Recommending Trades in Securities to Customers. Recipients of this research in Taiwan may contact Daiwa-Cathay Capital Markets Co., Ltd in respect of any matter arising from or in connection with the research.
Philippines
This research is distributed in the Philippines by DBP-Daiwa Capital Markets Philippines, Inc. which is regulated by the Philippines Securities and Exchange Commission and the Philippines Stock Exchange, Inc. Recipients of this research in the Philippines may contact DBP-Daiwa Capital Markets Philippines, Inc. in respect of any matter arising from or in connection with the research. DBP-Daiwa Capital Markets Philippines, Inc. recommends that investors independently assess, with a professional advisor, the specific financial risks as well as the legal, regulatory, tax, accounting, and other consequences of a proposed transaction. DBP-Daiwa Capital Markets Philippines, Inc. may have positions or may be materially interested in the securities in any of the markets mentioned in the publication or may have performed other services for the issuers of such securities.
For relevant securities and trading rules please visit SEC and PSE links at http://www.sec.gov.ph/irr/AmendedIRRfinalversion.pdf and http://www.pse.com.ph/ respectively.
Thailand
This research is distributed to only institutional investors in Thailand primarily by Thanachart Securities Public Company Limited (“TNS”).
This report is prepared by analysts who are employed by Daiwa Securities Group Inc. and/or its non-U.S. affiliates. This report is provided to you for informational purposes only and it is not, and is not to be construed as, an offer or an invitation to make an offer to sell or buy any securities. Neither Thanachart Securities Public Company Limited, Daiwa Securities Group Inc. nor any of their respective parent, holding, subsidiaries or affiliates, nor any of their respective directors, officers, servants and employees accept any liability whatsoever for any direct or consequential loss arising from any use of this research or its contents.
The information and opinions contained herein have been compiled or arrived at from sources believed to be reliable. However, Thanachart Securities Public Company Limited, Daiwa Securities Group Inc. nor any of their respective parent, holding, subsidiaries or affiliates, nor any of their respective directors, officers, servants and employees make no representation or warranty, express or implied, as to their accuracy or completeness. Expressions of opinion herein are subject to change without notice. The use of any information, forecasts and opinions contained in this report shall be at the sole discretion and risk of the user.
Daiwa Securities Group Inc. and/or its non-U.S. affiliates perform and seek to perform business with companies covered in this research. Thanachart Securities Public Company Limited, Daiwa Securities Group Inc., their respective parent, holding, subsidiaries or affiliates, their respective directors, officers, servants and employees may have positions and financial interest in securities mentioned in this research. Thanachart Securities Public Company Limited, Daiwa Securities Group Inc., their respective parent, holding, subsidiaries or affiliates may from time to time perform investment banking or other services for, or solicit investment banking or other business from, any entity mentioned in this research. Therefore, investors should be aware of conflict of interest that may affect the objectivity of this research.
United Kingdom
This research report is produced by Daiwa Securities Co. Ltd. and/or its affiliates and is distributed in the European Union, Iceland, Liechtenstein, Norway and Switzerland. Daiwa Capital Markets Europe Limited is authorised and regulated by The Financial Conduct Authority (“FCA”) and is a member of the London Stock Exchange and Eurex. This publication is intended for investors who are not Retail Clients in the United Kingdom within the meaning of the Rules of the FCA and should not therefore be distributed to such Retail Clients in the United Kingdom. Should you enter into investment business with Daiwa Capital Markets Europe’s affiliates outside the United Kingdom, we are obliged to advise that the protection afforded by the United Kingdom regulatory system may not apply; in particular, the benefits of the Financial Services Compensation Scheme may not be available. Daiwa Capital Markets Europe Limited has in place organisational arrangements for the prevention and avoidance of conflicts of interest. Our conflict management policy is available at

6
Largan Precision (3008 TT): 30 May 2016
http://www.uk.daiwacm.com/about-us/corporate-governance-regulatory.
Germany
This document is distributed in Germany by Daiwa Capital Markets Europe Limited, Niederlassung Frankfurt which is regulated by BaFin (Bundesanstalt fuer Finanzdienstleistungsaufsicht) for the conduct of business in Germany.
Bahrain
This research material is distributed in Bahrain by Daiwa Capital Markets Europe Limited, Bahrain Branch, regulated by The Central Bank of Bahrain and holds Investment Business Firm – Category 2 license and having its official place of business at the Bahrain World Trade Centre, South Tower, 7th floor, P.O. Box 30069, Manama, Kingdom of Bahrain. Tel No. +973 17534452 Fax No. +973 535113
United States
This report is distributed in the U.S. by Daiwa Capital Markets America Inc. (DCMA). It may not be accurate or complete and should not be relied upon as such. It reflects the preparer’s views at the time of its preparation, but may not reflect events occurring after its preparation; nor does it reflect DCMA’s views at any time. Neither DCMA nor the preparer has any obligation to update this report or to continue to prepare research on this subject. This report is not an offer to sell or the solicitation of any offer to buy securities. Unless this report says otherwise, any recommendation it makes is risky and appropriate only for sophisticated speculative investors able to incur significant losses. Readers should consult their financial advisors to determine whether any such recommendation is consistent with their own investment objectives, financial situation and needs. This report does not recommend to U.S. recipients the use of any of DCMA’s non-U.S. affiliates to effect trades in any security and is not supplied with any understanding that U.S. recipients of this report will direct commission business to such non-U.S. entities. Unless applicable law permits otherwise, non-U.S. customers wishing to effect a transaction in any securities referenced in this material should contact a Daiwa entity in their local jurisdiction. Most countries throughout the world have their own laws regulating the types of securities and other investment products which may be offered to their residents, as well as a process for doing so. As a result, the securities discussed in this report may not be eligible for sales in some jurisdictions. Customers wishing to obtain further information about this report should contact DCMA: Daiwa Capital Markets America Inc., Financial Square, 32 Old Slip, New York, New York 10005 (Tel no. 212-612-7000).
Ownership of Securities
For “Ownership of Securities” information please visit BlueMatrix disclosure link at https://daiwa3.bluematrix.com/sellside/Disclosures.action.
Investment Banking Relationships
For “Investment Banking Relationships” please visit BlueMatrix disclosure link at https://daiwa3.bluematrix.com/sellside/Disclosures.action. DCMA Market Making
For “DCMA Market Making” please visit BlueMatrix disclosure link at https://daiwa3.bluematrix.com/sellside/Disclosures.action.
Research Analyst Conflicts
For updates on “Research Analyst Conflicts” please visit BlueMatrix disclosure link at https://daiwa3.bluematrix.com/sellside/Disclosures.action. The principal research analysts who prepared this report have no financial interest in securities of the issuers covered in the report, are not (nor are any members of their household) an officer, director or advisory board member of the issuer(s) covered in the report, and are not aware of any material relevant conflict of interest involving the analyst or DCMA, and did not receive any compensation from the issuer during the past 12 months except as noted: no exceptions.
Research Analyst Certification
For updates on “Research Analyst Certification” and “Rating System” please visit BlueMatrix disclosure link at https://daiwa3.bluematrix.com/sellside/Disclosures.action. The views about any and all of the subject securities and issuers expressed in this Research Report accurately reflect the personal views of the research analyst(s) primarily responsible for this report (or the views of the firm producing the report if no individual analysts[s] is named on the report); and no part of the compensation of such analyst(s) (or no part of the compensation of the firm if no individual analyst[s)] is named on the report) was, is, or will be directly or indirectly related to the specific recommendations or views contained in this Research Report.
The following explains the rating system in the report as compared to relevant local indices, unless otherwise stated, based on the beliefs of the author of the report.
"1": the security could outperform the local index by more than 15% over the next 12 months. "2": the security is expected to outperform the local index by 5-15% over the next 12 months. "3": the security is expected to perform within 5% of the local index (better or worse) over the next 12 months. "4": the security is expected to underperform the local index by 5-15% over the next 12 months. "5": the security could underperform the local index by more than 15% over the next 12 months. Disclosure of investment ratings
Rating Percentage of total
Buy* 66.9%
Hold** 19.7%
Sell*** 13.5%
Source: Daiwa
Notes: data is for single-branded Daiwa research in Asia (ex Japan) and correct as of 31 March 2016. * comprised of Daiwa’s Buy and Outperform ratings. ** comprised of Daiwa’s Hold ratings. *** comprised of Daiwa’s Underperform and Sell ratings. Additional information may be available upon request.
Japan - additional notification items pursuant to Article 37 of the Financial Instruments and Exchange Law (This Notification is only applicable where report is distributed by Daiwa Securities Co. Ltd.)
If you decide to enter into a business arrangement with us based on the information described in materials presented along with this document, we ask you to pay close attention to the following items.
In addition to the purchase price of a financial instrument, we will collect a trading commission* for each transaction as agreed beforehand with you. Since commissions may be included in the purchase price or may not be charged for certain transactions, we recommend that you confirm the commission for each transaction.
In some cases, we may also charge a maximum of ¥ 2 million (including tax) per year as a standing proxy fee for our deposit of your securities, if you are a non-resident of Japan.
For derivative and margin transactions etc., we may require collateral or margin requirements in accordance with an agreement made beforehand with you. Ordinarily in such cases, the amount of the transaction will be in excess of the required collateral or margin requirements.
There is a risk that you will incur losses on your transactions due to changes in the market price of financial instruments based on fluctuations in interest rates, exchange rates, stock prices, real estate prices, commodity prices, and others. In addition, depending on the content of the transaction, the loss could exceed the amount of the collateral or margin requirements.
There may be a difference between bid price etc. and ask price etc. of OTC derivatives handled by us.
Before engaging in any trading, please thoroughly confirm accounting and tax treatments regarding your trading in financial instruments with such experts as certified public accountants. *The amount of the trading commission cannot be stated here in advance because it will be determined between our company and you based on current market conditions and the content of each transaction etc.
When making an actual transaction, please be sure to carefully read the materials presented to you prior to the execution of agreement, and to take responsibility for your own decisions regarding the signing of the agreement with us.
Corporate Name: Daiwa Securities Co. Ltd. Financial instruments firm: chief of Kanto Local Finance Bureau (Kin-sho) No.108 Memberships: Japan Securities Dealers Association, The Financial Futures Association of Japan Japan Securities Investment Advisers Association Type II Financial Instruments Firms Association