stanford university server/telecom rooms design guide · stanford university server/telecom rooms...
TRANSCRIPT
Stanford University Server/Telecom Rooms Design Guide ‐ January, 2011 page 1
Stanford University Server/Telecom Rooms Design Guide
CONTENTS
1.0 How to Use this Guide...........................................................................................3 1.1 Document Organization.............................................................................3 2.0 Summary Form and Sample Options Matrix.........................................................3 3.0 Options Matrix.......................................................................................................7 4.0 Recommended Cooling Systems and Room Layouts by Space Type....................8 5.0 Types of Rooms Environmental, Reliability, and Availability Requirements......10 5.1 2008 ASHRAE Guidelines and IT‐Reliability...............................................10 5.2 Humidity Control, Air Recirculation, and Outside Air Economizers..........12 5.3 Types of Rooms.........................................................................................12
Research Computing/High Performance Computing……...........................12 Administrative servers/Low density racks.................................................12 Mixed use (Research computing/administrative) .....................................13 Telecommunications Rooms.....................................................................13 6.0 Air Management and Air Distribution...................................................................13 6.1 Air Management........................................................................................13 6.2 Air Distribution...........................................................................................16 7.0 Cooling Systems......................................................................................................17 7.1 House air....................................................................................................17 7.2 Chilled water air handling unit(s) with outside air economization............17 7.3 Chilled water computer room air handling units (CRAH)..........................18 7.4 Chilled water In‐rack cooling.....................................................................18 7.5 Chilled water In‐row cooling.....................................................................19 7.6 Passive rear door cooling coil....................................................................19 7.7 Direct expansion (DX) computer room air conditioning units...................19 7.8 Split AC systems.........................................................................................20 7.9 Chilled water fan coil unit..........................................................................20 7.10 Exhaust fan with undercut door................................................................20 7.11 Consider an alternate location with chilled water access.........................21
Stanford University Server/Telecom Rooms Design Guide ‐ January, 2011 page 2
8.0 Controls.................................................................................................................21 8.1 Interfacing with Stanford’s Energy Management Control System ..........21 8.2 Air Temperature.......................................................................................21 8.3 Variable Speed Drives...............................................................................22 8.4 Humidification Systems and Controls.......................................................22 9.0 Monitoring and Sub‐Metering..............................................................................23 9.1 On‐Site Monitoring and Continuous Performance Measurement............23 9.2 IT Load.......................................................................................................23 9.3 Electrical....................................................................................................24 9.4 Chilled Water.............................................................................................24 10.0 Electrical Equipment..............................................................................................25 10.1 Electrical Systems......................................................................................25 10.2 Power Distribution Units (PDU).................................................................25 10.3 Uninterruptible Power Supplies (UPS).......................................................25 10.4 Generators.................................................................................................27 11.0 Power Usage Effectiveness (PUE)..........................................................................27
Stanford University Server/Telecom Rooms Design Guide ‐ January, 2011 page 3
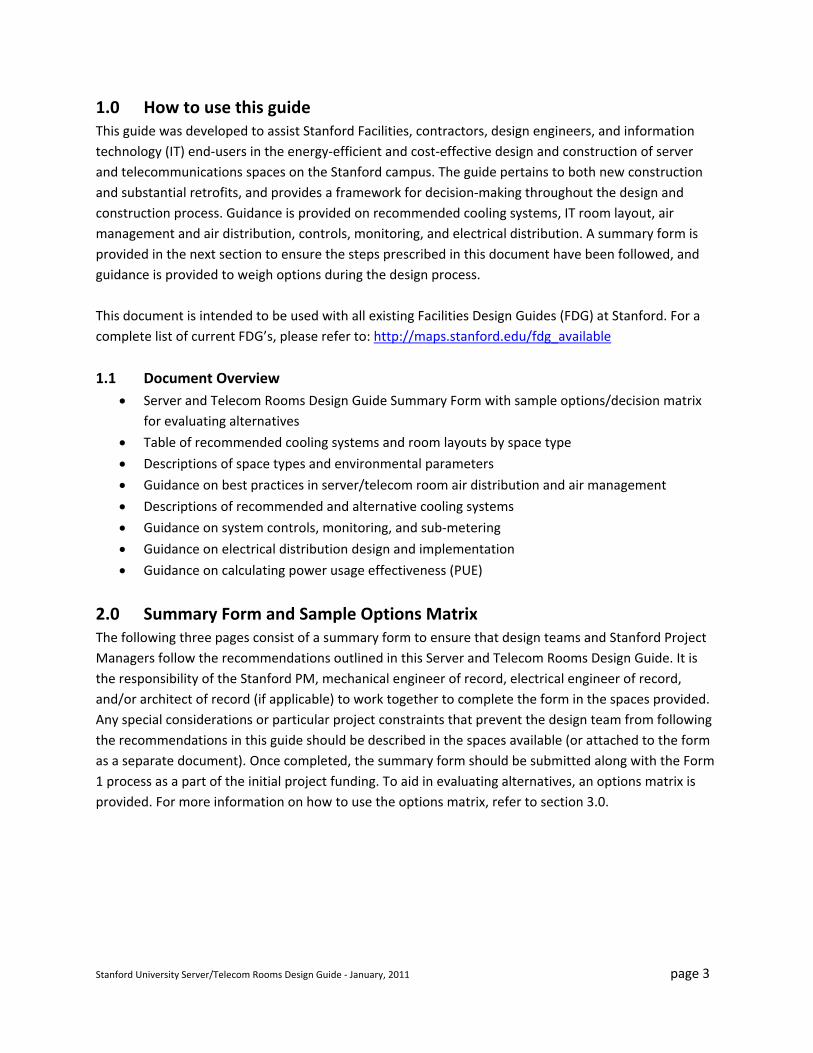
1.0 How to use this guide This guide was developed to assist Stanford Facilities, contractors, design engineers, and information technology (IT) end‐users in the energy‐efficient and cost‐effective design and construction of server and telecommunications spaces on the Stanford campus. The guide pertains to both new construction and substantial retrofits, and provides a framework for decision‐making throughout the design and construction process. Guidance is provided on recommended cooling systems, IT room layout, air management and air distribution, controls, monitoring, and electrical distribution. A summary form is provided in the next section to ensure the steps prescribed in this document have been followed, and guidance is provided to weigh options during the design process. This document is intended to be used with all existing Facilities Design Guides (FDG) at Stanford. For a complete list of current FDG’s, please refer to: http://maps.stanford.edu/fdg_available
1.1 Document Overview • Server and Telecom Rooms Design Guide Summary Form with sample options/decision matrix
for evaluating alternatives
• Table of recommended cooling systems and room layouts by space type
• Descriptions of space types and environmental parameters
• Guidance on best practices in server/telecom room air distribution and air management
• Descriptions of recommended and alternative cooling systems
• Guidance on system controls, monitoring, and sub‐metering
• Guidance on electrical distribution design and implementation
• Guidance on calculating power usage effectiveness (PUE)
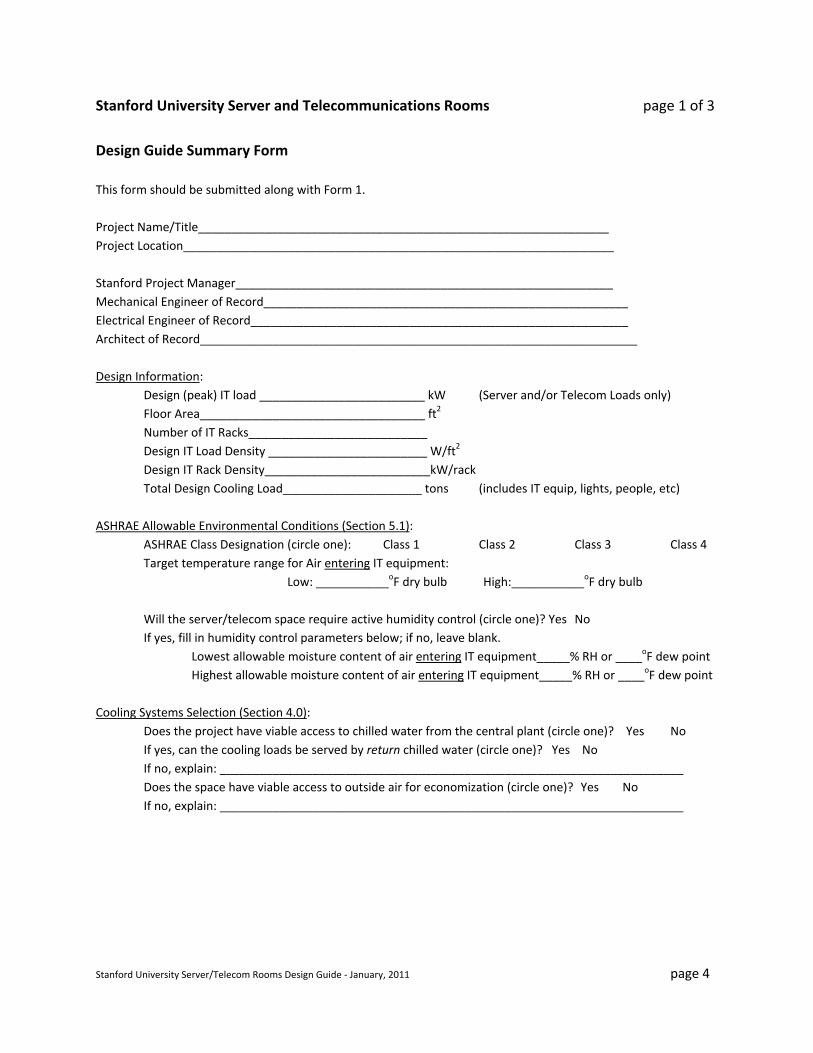
2.0 Summary Form and Sample Options Matrix The following three pages consist of a summary form to ensure that design teams and Stanford Project Managers follow the recommendations outlined in this Server and Telecom Rooms Design Guide. It is the responsibility of the Stanford PM, mechanical engineer of record, electrical engineer of record, and/or architect of record (if applicable) to work together to complete the form in the spaces provided. Any special considerations or particular project constraints that prevent the design team from following the recommendations in this guide should be described in the spaces available (or attached to the form as a separate document). Once completed, the summary form should be submitted along with the Form 1 process as a part of the initial project funding. To aid in evaluating alternatives, an options matrix is provided. For more information on how to use the options matrix, refer to section 3.0.
Stanford University Server/Telecom Rooms Design Guide ‐ January, 2011 page 4
Stanford University Server and Telecommunications Rooms page 1 of 3 Design Guide Summary Form This form should be submitted along with Form 1. Project Name/Title______________________________________________________________ Project Location_________________________________________________________________ Stanford Project Manager_________________________________________________________ Mechanical Engineer of Record_______________________________________________________ Electrical Engineer of Record_________________________________________________________ Architect of Record__________________________________________________________________ Design Information: Design (peak) IT load _________________________ kW (Server and/or Telecom Loads only) Floor Area__________________________________ ft2 Number of IT Racks___________________________ Design IT Load Density ________________________ W/ft2
Design IT Rack Density_________________________kW/rack Total Design Cooling Load_____________________ tons (includes IT equip, lights, people, etc) ASHRAE Allowable Environmental Conditions (Section 5.1): ASHRAE Class Designation (circle one): Class 1 Class 2 Class 3 Class 4 Target temperature range for Air entering IT equipment:
Low: ___________oF dry bulb High:___________oF dry bulb
Will the server/telecom space require active humidity control (circle one)? Yes No If yes, fill in humidity control parameters below; if no, leave blank.
Lowest allowable moisture content of air entering IT equipment_____% RH or ____oF dew point Highest allowable moisture content of air entering IT equipment_____% RH or ____oF dew point
Cooling Systems Selection (Section 4.0): Does the project have viable access to chilled water from the central plant (circle one)? Yes No If yes, can the cooling loads be served by return chilled water (circle one)? Yes No If no, explain: ______________________________________________________________________ Does the space have viable access to outside air for economization (circle one)? Yes No If no, explain: ______________________________________________________________________

Stanford University Server/Telecom Rooms Design Guide ‐ January, 2011 page 5
Selected Cooling Systems: page 2 of 3 A.___________________________ Options Matrix Score: _____________ Circle Ranking: 1 2 3 B.___________________________ Options Matrix Score: _____________ Circle Ranking: 1 2 3 C.___________________________Options Matrix Score: _____________ Circle Ranking: 1 2 3 Room/equipment/air distribution layout (Section 6.0): Check all that apply: Hot aisle/cold aisle Air Supply: Air Return: Sealed Raised Floor Ceiling Plenum Unsealed Ducted Overhead Ducted Overhead No hot/cold aisle Free (unducted, no plenum
In‐rack or in‐row cooling system layout
Room/equipment/air distribution layout determined not to be a factor
Other (describe)__________________________________________________________________ Electrical Systems Selection (Section 10.0): UPS System Type: UPS Redundancy: _________________________
Standby Number of Units: __________________________
Line Interactive Capacity per Unit: __________________________
Double Conversion
Rotary/Flywheel
Other (describe)___________________________________________ Expected UPS load factor: At project completion (day one operation): ___________% per module At peak electrical loading (full design capacity): ___________% per module Power Distribution Units (PDU): PDUs contain internal transformers (circle one)? Yes No Total number of PDUs: __________________ Anticipated load factor: ______________________% Controls, Monitoring, and Sub‐Metering (Sections 8.0 and 9.0):
Will the cooling systems be connected to the Stanford Campus EMCS? Yes No Describe any required sub‐metering for measurement/verification of performance/PUE:___________ ___________________________________________________________________________________ ___________________________________________________________________________________
Stanford University Server/Telecom Rooms Design Guide ‐ January, 2011 page 6
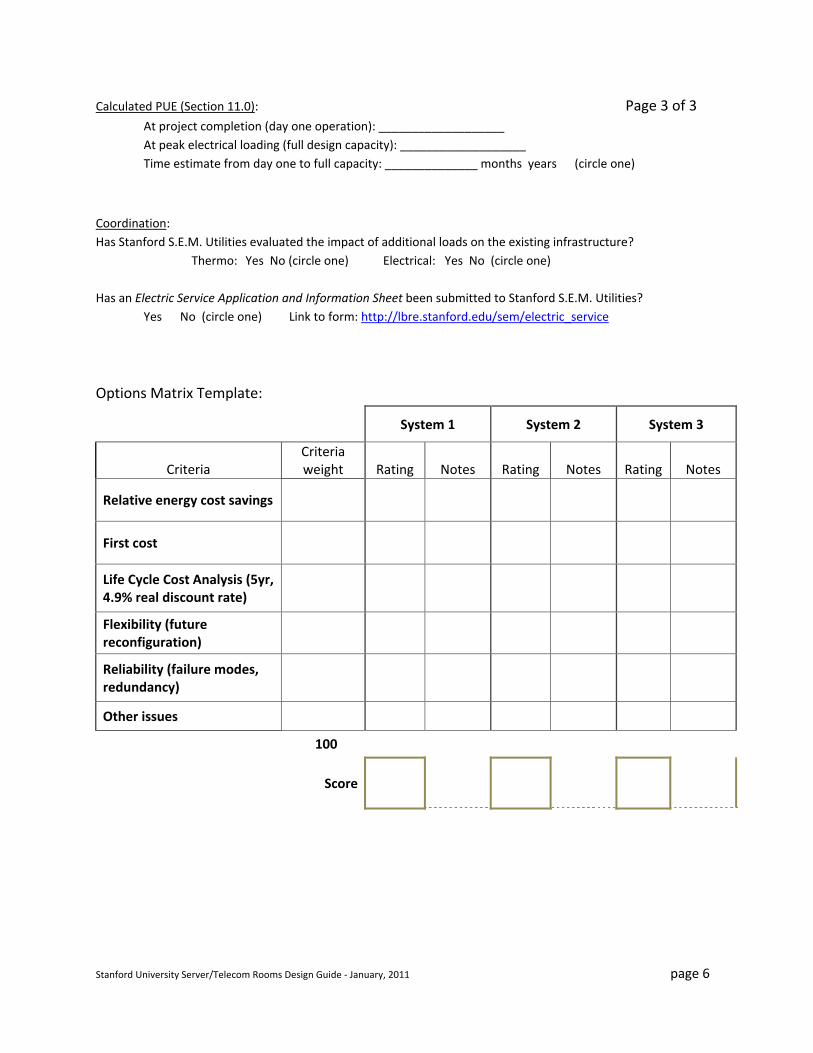
Calculated PUE (Section 11.0): Page 3 of 3 At project completion (day one operation): ___________________ At peak electrical loading (full design capacity): ___________________ Time estimate from day one to full capacity: ______________ months years (circle one)
Coordination: Has Stanford S.E.M. Utilities evaluated the impact of additional loads on the existing infrastructure? Thermo: Yes No (circle one) Electrical: Yes No (circle one) Has an Electric Service Application and Information Sheet been submitted to Stanford S.E.M. Utilities? Yes No (circle one) Link to form: http://lbre.stanford.edu/sem/electric_service
Options Matrix Template:
System 1 System 2 System 3
Criteria Criteria weight Rating Notes Rating Notes Rating Notes
Relative energy cost savings
First cost
Life Cycle Cost Analysis (5yr, 4.9% real discount rate) Flexibility (future reconfiguration)
Reliability (failure modes, redundancy)
Other issues
100
Score

Stanford University Server/Telecom Rooms Design Guide ‐ January, 2011 page 7
3.0 Options Matrix When consulting Table 2 to determine recommended cooling systems, there are generally three choices for any given loading level/space type. The options are presented in order of most to least energy‐efficient, but often there are other factors besides energy performance to consider. Stanford recommends that designers and contractors weigh the various options based upon the following criteria: energy cost savings, first cost, life cycle cost, flexibility, reliability, and other (to capture any unique constraints of a particular project). To this end, an example Options Matrix has been filled out, and is shown in Table 1 below (note: each ‘Rating’ will vary by project, and “Criteria Weight” are recommendations for Stanford, but can vary).
System 1 System 2 System 3
Criteria Criteria weight Rating Notes Rating Notes Rating Notes
Relative energy cost savings 15 6 5 6 First cost 10 7 7 6 Life Cycle Cost Analysis (5yr, 4.9% real discount rate)
25 0 0 0 Flexibility (future reconfiguration)
15 9 6 8
Reliability (failure modes, redundancy)
25 9 6 9
Other issues 10 8 7 10
100
Score 600
455
595
Table 1: Example options matrix for evaluating alternatives
To use the Options Matrix, coordinate with all project stakeholders to develop the criteria weighting factors for each of the criteria in the left‐most column. For the example in Table 1, Stanford’s recommended weighting criteria is provided, but these will ultimately depend on the consensus reached by all stakeholders on which of the criteria are most important to the individual project. Once the weighting of the individual criteria is determined, the next step is to rate each proposed system (with calculations and backup documentation) on a scale of 1 to 10 (1 being the worst and 10 being the best). Once the ratings are all determined, they are multiplied by the corresponding weighting factor and summed to provide a total score. The system with the highest total score is then the system of choice. In the example in Table 1, System 1 has the highest score with 600, but System 3 is a very close second

Stanford University Server/Telecom Rooms Design Guide ‐ January, 2011 page 8
with 595. In this case the matrix has helped narrow‐down the choices from three to two, and further refined analysis should help narrow those two remaining choices down to the one, final choice. Note: the Options Matrix can be extended to other systems aside from cooling systems, such as UPS units, transformers, light fixtures, IT equipment, and anything else in which several options are to be considered.
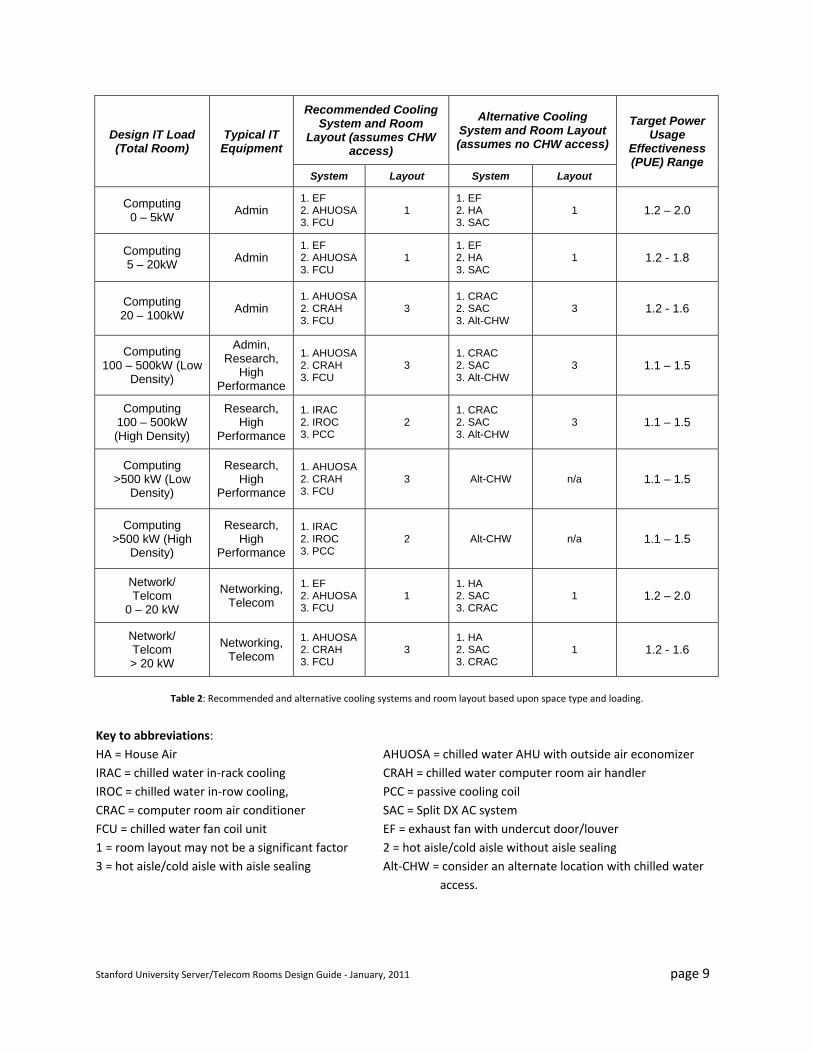
4.0 Recommended Cooling Systems and Room Layouts by Space Type Table 2 below is intended to provide design guidance for Stanford IT facilities. To use the table, first find the space type and loading that most represents the project. The breakdown is based upon total room load, with research/high performance broken into high density and low density. “High density” can be taken roughly to mean any spaces with a design load of approximately 100 Watts per square foot (W/sf) or higher. When consulting the table, first determine the load/space type, and then determine if the location has access to chilled water. Approximately 60% of the buildings on the Stanford campus have access to chilled water from the central plant, and (from an energy efficiency perspective) chilled water cooling is much more efficient than air‐cooled systems such as DX computer room air conditioning (CRAC) units, or DX split AC systems. Yet another efficiency gain can come from the use of return chilled water, as opposed to supply chilled water. Designing a chilled water‐based cooling system to rely on an elevated chilled water temperature from the return line back to the central plant (approximately 55 – 60oF) can take advantage of available chilled water that has already done some useful cooling, enhance heat recovery systems at the central plant, and the higher design supply air temperatures allow for more hours of the year of outside air economization. If there is chilled water service, refer to the “recommended” column, and if there is no chilled water available, refer to the “alternative” column. All recommended systems employ chilled water, and alternative systems assume there is no chilled water access (and it is not cost‐effective to provide it). There are a few cases, namely computing loads greater than 500 kW, in which chilled water cooling systems are highly recommended, and if there is no chilled water access it is advised that an alternative location be explored that can use chilled water. Alternatively, these computing resources may be able to be located at Forsythe Hall, which already uses highly efficient chilled water‐based cooling systems. Within each cell, you will find one to three cooling systems, ranked in order of energy performance. Each space/load type is also provided with a recommended room layout. Refer to sections 6.0 and 7.0 for further information on cooling systems and room layout. The final column in Table 2 gives a target range for power usage effectiveness (PUE). For more information on calculating PUE, refer to section 11.0.
Stanford University Server/Telecom Rooms Design Guide ‐ January, 2011 page 9
Design IT Load (Total Room)
Typical IT Equipment
Recommended Cooling System and Room
Layout (assumes CHW access)
Alternative Cooling System and Room Layout (assumes no CHW access)
Target Power Usage
Effectiveness (PUE) Range
System Layout System Layout
Computing 0 – 5kW
Admin 1. EF 2. AHUOSA 3. FCU
1 1. EF 2. HA 3. SAC
1 1.2 – 2.0
Computing 5 – 20kW
Admin 1. EF 2. AHUOSA 3. FCU
1 1. EF 2. HA 3. SAC
1 1.2 - 1.8
Computing 20 – 100kW
Admin 1. AHUOSA 2. CRAH 3. FCU
3 1. CRAC 2. SAC 3. Alt-CHW
3 1.2 - 1.6
Computing 100 – 500kW (Low
Density)
Admin, Research,
High Performance
1. AHUOSA 2. CRAH 3. FCU
3 1. CRAC 2. SAC 3. Alt-CHW
3 1.1 – 1.5
Computing 100 – 500kW (High Density)
Research, High
Performance
1. IRAC 2. IROC 3. PCC
2 1. CRAC 2. SAC 3. Alt-CHW
3 1.1 – 1.5
Computing >500 kW (Low
Density)
Research, High
Performance
1. AHUOSA 2. CRAH 3. FCU
3 Alt-CHW n/a 1.1 – 1.5
Computing >500 kW (High
Density)
Research, High
Performance
1. IRAC 2. IROC 3. PCC
2 Alt-CHW n/a 1.1 – 1.5
Network/ Telcom
0 – 20 kW
Networking, Telecom
1. EF 2. AHUOSA 3. FCU
1 1. HA 2. SAC 3. CRAC
1 1.2 – 2.0
Network/ Telcom > 20 kW
Networking, Telecom
1. AHUOSA 2. CRAH 3. FCU
3 1. HA 2. SAC 3. CRAC
1 1.2 - 1.6
Table 2: Recommended and alternative cooling systems and room layout based upon space type and loading.
Key to abbreviations: HA = House Air AHUOSA = chilled water AHU with outside air economizer IRAC = chilled water in‐rack cooling CRAH = chilled water computer room air handler IROC = chilled water in‐row cooling, PCC = passive cooling coil CRAC = computer room air conditioner SAC = Split DX AC system FCU = chilled water fan coil unit EF = exhaust fan with undercut door/louver 1 = room layout may not be a significant factor 2 = hot aisle/cold aisle without aisle sealing 3 = hot aisle/cold aisle with aisle sealing Alt‐CHW = consider an alternate location with chilled water access.
Stanford University Server/Telecom Rooms Design Guide ‐ January, 2011 page 10
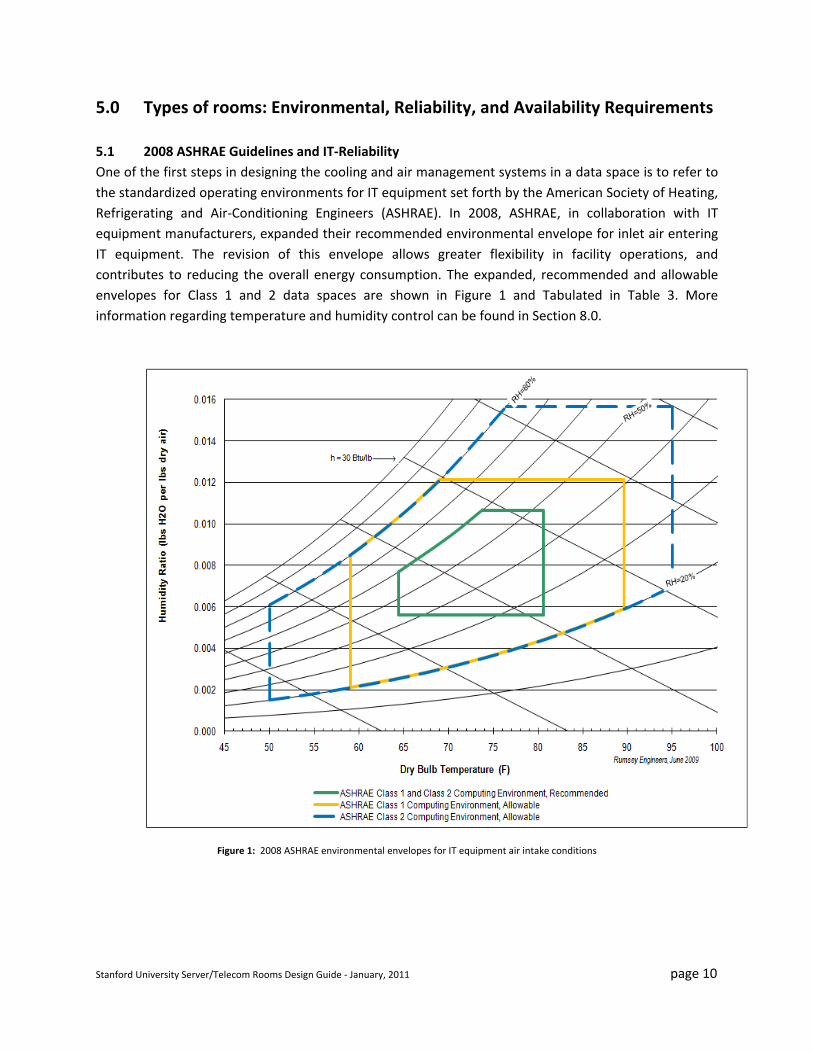
5.0 Types of rooms: Environmental, Reliability, and Availability Requirements 5.1 2008 ASHRAE Guidelines and IT‐Reliability One of the first steps in designing the cooling and air management systems in a data space is to refer to the standardized operating environments for IT equipment set forth by the American Society of Heating, Refrigerating and Air‐Conditioning Engineers (ASHRAE). In 2008, ASHRAE, in collaboration with IT equipment manufacturers, expanded their recommended environmental envelope for inlet air entering IT equipment. The revision of this envelope allows greater flexibility in facility operations, and contributes to reducing the overall energy consumption. The expanded, recommended and allowable envelopes for Class 1 and 2 data spaces are shown in Figure 1 and Tabulated in Table 3. More information regarding temperature and humidity control can be found in Section 8.0.
Figure 1: 2008 ASHRAE environmental envelopes for IT equipment air intake conditions

Stanford University Server/Telecom Rooms Design Guide ‐ January, 2011 page 11
Table 3: ASHRAE Recommended and Allowable Inlet Air Conditions for Class 1 and 2 Data Spaces
ASHRAE’s class definitions are as follows: Class 1: Typically a data space with tightly controlled environmental parameters (dew point, temperature, and relative humidity) and mission/research critical operations; types of products typically designed for this environment are enterprise servers and storage products. Class 2: Typically an information technology space or office or lab environment with some control of environmental parameters (dew point, temperature, and relative humidity); types of products typically designed for these environments are small servers, storage products, personal computers, and workstations. Class 3: Typically an office, home, or transportable environment with little control of environmental parameters (temperature only); types of products typically designed for this environment are personal computers, workstations, laptops, and printers. Class 4: Typically a point‐of‐sale or light industrial or factory environment with weather protection, sufficient winter heating, and ventilation; types of products typically designed for this environment are point‐of‐sale equipment, ruggedized controllers, or computers and PDAs. The vast majority of data spaces at Stanford addressed in this guide will fall under either class 1 or class 2 designations, and thus are the focus of this guide.
Class 1 and Class 2 Recommended
Range
Class 1 Allowable Range
Class 2 Allowable Range
Low Temperature Limit 64.4°F DB 59°F DB 50°F DB
High Temperature Limit
80.6°F DB 89.6°F DB 95°F DB
Low Moisture Limit 41.9°F DP 20% RH 20% RH
High Moisture Limit 60% RH & 59°F DP 80% RH & 62.6°F DP 80% RH & 69.8°F DP

Stanford University Server/Telecom Rooms Design Guide ‐ January, 2011 page 12
Stanford Recommendations:
5.2 Humidity Control, Air Recirculation, and Outside Air Economizers Humidification and dehumidification are very energy‐intensive processes. For dehumidification, often very low chilled water temperatures (42oF to 45oF) are required to lower the air to its dew point temperature, sacrificing energy performance at the chiller plant. For humidification, many technologies employ electric resistance heaters to boil water, an energy‐intensive process that actually adds heat to a room that is in cooling. Adiabatic humidifiers employing ultrasonic or evaporative processes are a better choice from an energy‐efficiency perspective. But in the relatively mild climate at Stanford, in which even the outside air (let alone interior spaces) rarely has a relative humidity outside of the allowable range prescribed by ASHRAE, humidity doesn’t need to be tightly controlled. For systems that recirculate the majority of the cooling air (i.e. no outside air economization), there is very little moisture added or removed during the recirculation (except in the case of low temperature chilled water causing unwanted dehumidification), and the notion that humidity should be controlled at all should be challenged. For spaces requiring tight humidity control, and for control of outside air economizers during humidity extremes, centralizing the control and employing adiabatic humidification are highly recommended for optimum energy performance. For more on humidity and temperature control, refer to Section 8.0 of this guide. 5.3 Types of Rooms Research Computing/High Performance Computing Generally requiring relatively tight environmental controls, research and high performance computing facilities typically fall into the category of a Class 1 data space. These types of rooms have the highest load densities, with the highest densities reaching 1,000 Watts per square foot, or 40 KW/rack. These spaces are generally most efficiently cooled with close‐coupled, chilled water‐based cooling. Direct expansion (DX) cooling systems are generally not recommended for these spaces due to their relatively poor energy performance, and proper air management techniques (see subsequent Air Management section of this guide) are important to ensure efficient delivery of cooling air and extraction of heat. Administrative servers/Low density racks Administrative servers and low density racks generally consist of storage devices, small servers and workstations. These spaces generally fall into the Class 2 category, with less strict environmental controls and reliability requirements. The overall load, and load density are usually lower than Class 1
To maximize energy efficiency performance, it is strongly recommended that server/telecom room cooling systems be designed to meet the ASHRAE allowable temperature range, and that humidity not be controlled at all (see next section). Designing cooling systems for higher supply air temperatures also allows for many more hours in a typical year in which air side economization is viable, and allows for the use of higher‐temperature return chilled water from the Stanford central utility plant (if available).
Stanford University Server/Telecom Rooms Design Guide ‐ January, 2011 page 13
spaces. These spaces can be efficiently cooled using more common and established air‐based cooling systems, and for optimum energy efficiency chilled water and outside air‐based systems should be considered whenever possible to maximize energy performance. Mixed use (Research computing/administrative) A combination of both of the above mentioned room types in one space should follow the class designation of the most critical loads. In order to effectively cool these spaces it is important to implement zone containment methods (e.g. barriers, strip curtains) to separate areas of high and low density, and direct a proportional amount of cooling air to these spaces based upon the loads being served. Another option is to implement more than one cooling system in the space. For example, chilled water computer room air handling units (or an air handling unit with outside air economization) can be used to serve the lower‐density portions of the space, while in‐rack, in‐row, and other close‐coupled cooling strategies can be employed in the higher density locations. Telecommunications Rooms Telecom rooms will typically fall under Class 2, but in some cases may be required to be Class 1. A typical telecom room will contain 1‐5 equipment racks with up to 10 kW per rack. The equipment may have different airflow patterns which will need to be taken into account when designing the cooling system. Due to the relatively small size of these spaces (when compared to large server rooms), it may not be necessary to arrange equipment racks in a hot aisle/cold aisle configuration for the cooling air flow and in most cases a simple exhaust fan (thermostatically controlled to prevent continuous operation) can generally suffice to remove the heat from the room. As telecom rooms become larger and more densely‐packed with heat‐generating equipment, they should be treated as small server rooms with proper air management and air distribution (described in the next section).
6.0 Air Management and Air Distribution 6.1 Air Management Air management for server and larger telecom rooms entails all the design and configuration details that go into minimizing or eliminating the bypass of cooling air around rack intakes and the recirculation of heat exhaust back into rack intakes. When designed correctly, an air management system can reduce operating costs, reduce first cost equipment investment, increase power density (Watts/square foot), and reduce heat related processing interruptions or failures. A few key design issues include the configuration of equipment’s air intake and heat exhaust ports, the location of supply and returns, the large scale airflow patterns in the room, and the temperature set points of the airflow. Implement Cable Management For raised floor applications, a server/telecom room should have a cable management strategy to minimize air flow obstructions caused by cables and wiring. Instituting a cable mining program (i.e. a program to remove abandoned or inoperable cables) as part of an ongoing cable management plan will help optimize the air delivery performance of the cooling systems. This strategy should target the entire
Stanford University Server/Telecom Rooms Design Guide ‐ January, 2011 page 14
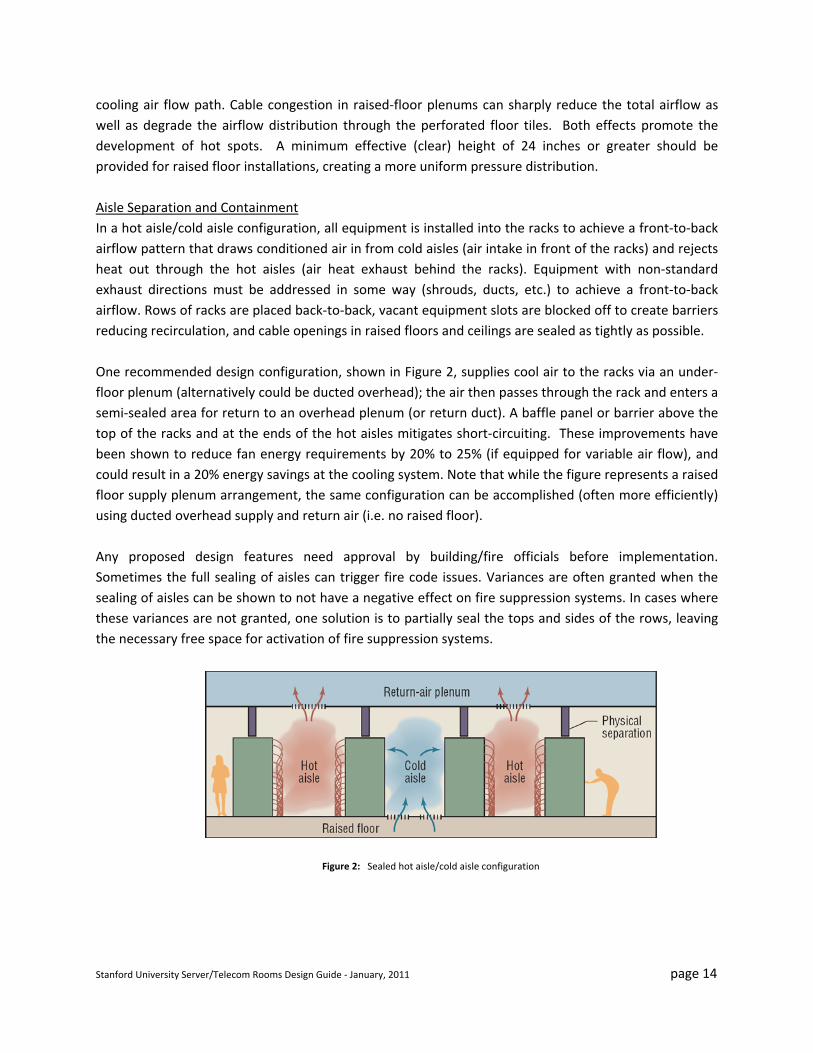
cooling air flow path. Cable congestion in raised‐floor plenums can sharply reduce the total airflow as well as degrade the airflow distribution through the perforated floor tiles. Both effects promote the development of hot spots. A minimum effective (clear) height of 24 inches or greater should be provided for raised floor installations, creating a more uniform pressure distribution. Aisle Separation and Containment In a hot aisle/cold aisle configuration, all equipment is installed into the racks to achieve a front‐to‐back airflow pattern that draws conditioned air in from cold aisles (air intake in front of the racks) and rejects heat out through the hot aisles (air heat exhaust behind the racks). Equipment with non‐standard exhaust directions must be addressed in some way (shrouds, ducts, etc.) to achieve a front‐to‐back airflow. Rows of racks are placed back‐to‐back, vacant equipment slots are blocked off to create barriers reducing recirculation, and cable openings in raised floors and ceilings are sealed as tightly as possible. One recommended design configuration, shown in Figure 2, supplies cool air to the racks via an under‐floor plenum (alternatively could be ducted overhead); the air then passes through the rack and enters a semi‐sealed area for return to an overhead plenum (or return duct). A baffle panel or barrier above the top of the racks and at the ends of the hot aisles mitigates short‐circuiting. These improvements have been shown to reduce fan energy requirements by 20% to 25% (if equipped for variable air flow), and could result in a 20% energy savings at the cooling system. Note that while the figure represents a raised floor supply plenum arrangement, the same configuration can be accomplished (often more efficiently) using ducted overhead supply and return air (i.e. no raised floor). Any proposed design features need approval by building/fire officials before implementation. Sometimes the full sealing of aisles can trigger fire code issues. Variances are often granted when the sealing of aisles can be shown to not have a negative effect on fire suppression systems. In cases where these variances are not granted, one solution is to partially seal the tops and sides of the rows, leaving the necessary free space for activation of fire suppression systems.
Figure 2: Sealed hot aisle/cold aisle configuration
Stanford University Server/Telecom Rooms Design Guide ‐ January, 2011 page 15
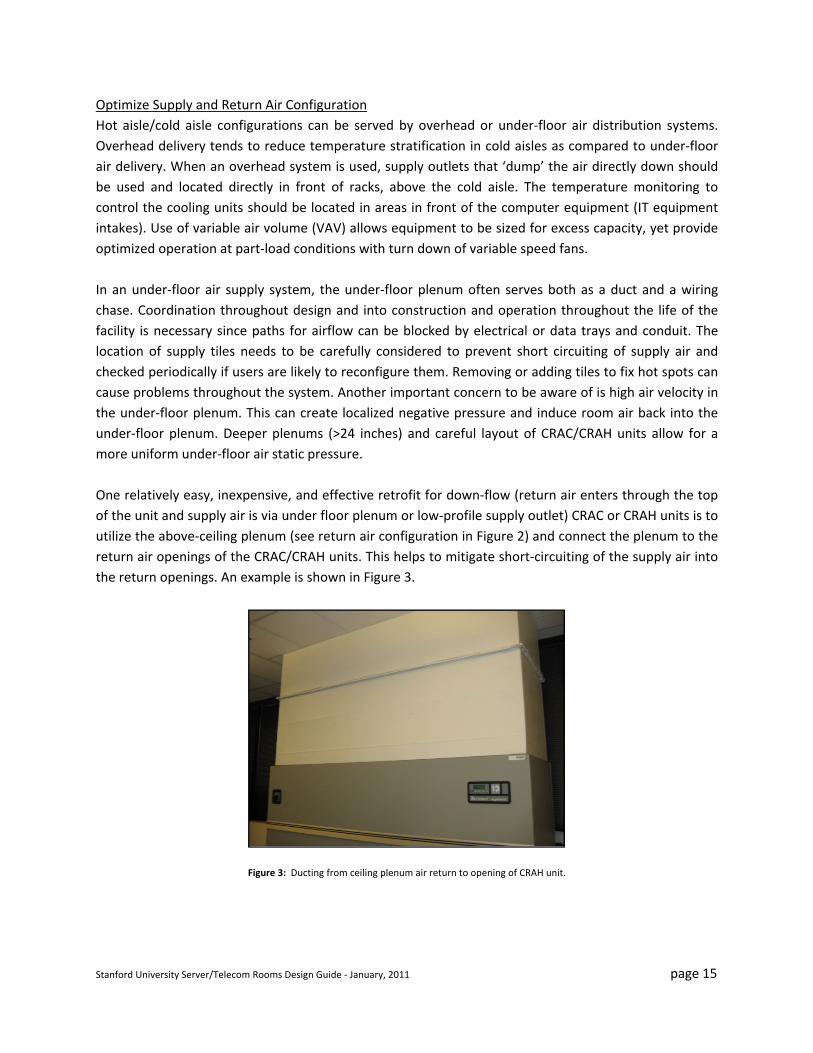
Optimize Supply and Return Air Configuration Hot aisle/cold aisle configurations can be served by overhead or under‐floor air distribution systems. Overhead delivery tends to reduce temperature stratification in cold aisles as compared to under‐floor air delivery. When an overhead system is used, supply outlets that ‘dump’ the air directly down should be used and located directly in front of racks, above the cold aisle. The temperature monitoring to control the cooling units should be located in areas in front of the computer equipment (IT equipment intakes). Use of variable air volume (VAV) allows equipment to be sized for excess capacity, yet provide optimized operation at part‐load conditions with turn down of variable speed fans. In an under‐floor air supply system, the under‐floor plenum often serves both as a duct and a wiring chase. Coordination throughout design and into construction and operation throughout the life of the facility is necessary since paths for airflow can be blocked by electrical or data trays and conduit. The location of supply tiles needs to be carefully considered to prevent short circuiting of supply air and checked periodically if users are likely to reconfigure them. Removing or adding tiles to fix hot spots can cause problems throughout the system. Another important concern to be aware of is high air velocity in the under‐floor plenum. This can create localized negative pressure and induce room air back into the under‐floor plenum. Deeper plenums (>24 inches) and careful layout of CRAC/CRAH units allow for a more uniform under‐floor air static pressure. One relatively easy, inexpensive, and effective retrofit for down‐flow (return air enters through the top of the unit and supply air is via under floor plenum or low‐profile supply outlet) CRAC or CRAH units is to utilize the above‐ceiling plenum (see return air configuration in Figure 2) and connect the plenum to the return air openings of the CRAC/CRAH units. This helps to mitigate short‐circuiting of the supply air into the return openings. An example is shown in Figure 3.
Figure 3: Ducting from ceiling plenum air return to opening of CRAH unit.
Stanford University Server/Telecom Rooms Design Guide ‐ January, 2011 page 16
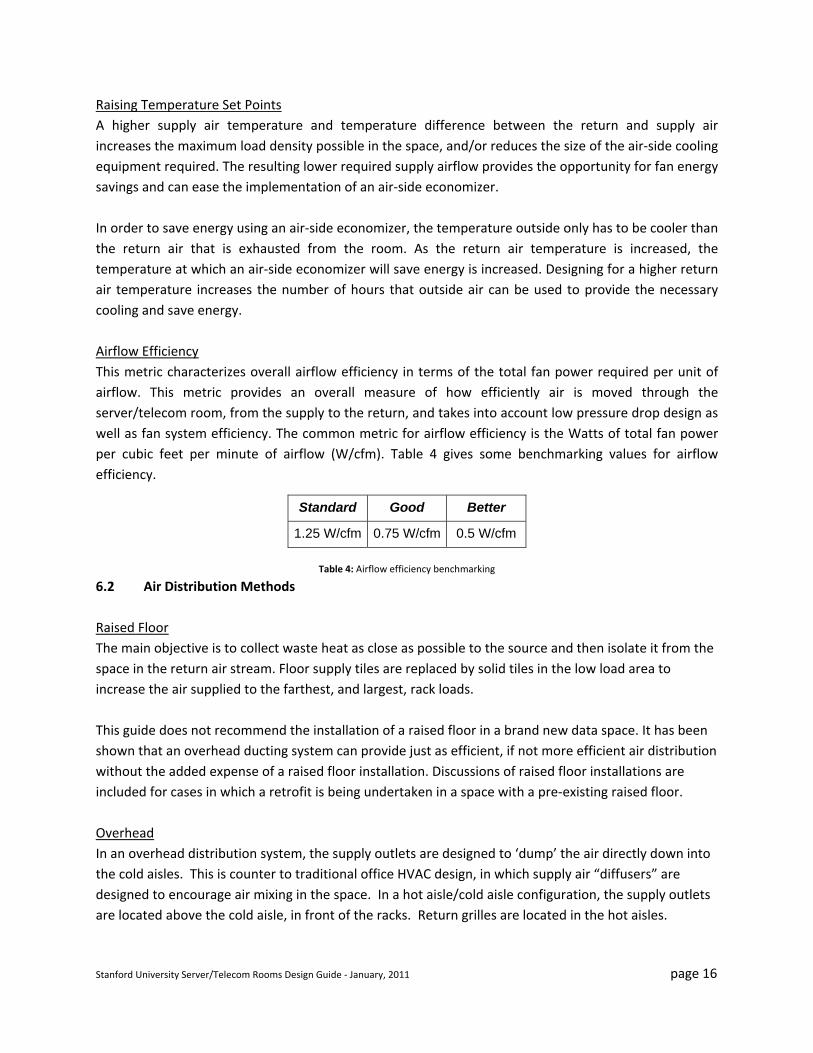
Raising Temperature Set Points A higher supply air temperature and temperature difference between the return and supply air increases the maximum load density possible in the space, and/or reduces the size of the air‐side cooling equipment required. The resulting lower required supply airflow provides the opportunity for fan energy savings and can ease the implementation of an air‐side economizer. In order to save energy using an air‐side economizer, the temperature outside only has to be cooler than the return air that is exhausted from the room. As the return air temperature is increased, the temperature at which an air‐side economizer will save energy is increased. Designing for a higher return air temperature increases the number of hours that outside air can be used to provide the necessary cooling and save energy. Airflow Efficiency This metric characterizes overall airflow efficiency in terms of the total fan power required per unit of airflow. This metric provides an overall measure of how efficiently air is moved through the server/telecom room, from the supply to the return, and takes into account low pressure drop design as well as fan system efficiency. The common metric for airflow efficiency is the Watts of total fan power per cubic feet per minute of airflow (W/cfm). Table 4 gives some benchmarking values for airflow efficiency.
Table 4: Airflow efficiency benchmarking
6.2 Air Distribution Methods Raised Floor The main objective is to collect waste heat as close as possible to the source and then isolate it from the space in the return air stream. Floor supply tiles are replaced by solid tiles in the low load area to increase the air supplied to the farthest, and largest, rack loads. This guide does not recommend the installation of a raised floor in a brand new data space. It has been shown that an overhead ducting system can provide just as efficient, if not more efficient air distribution without the added expense of a raised floor installation. Discussions of raised floor installations are included for cases in which a retrofit is being undertaken in a space with a pre‐existing raised floor. Overhead In an overhead distribution system, the supply outlets are designed to ‘dump’ the air directly down into the cold aisles. This is counter to traditional office HVAC design, in which supply air “diffusers” are designed to encourage air mixing in the space. In a hot aisle/cold aisle configuration, the supply outlets are located above the cold aisle, in front of the racks. Return grilles are located in the hot aisles.
Standard Good Better
1.25 W/cfm 0.75 W/cfm 0.5 W/cfm
Stanford University Server/Telecom Rooms Design Guide ‐ January, 2011 page 17
Overhead delivery tends to reduce temperature stratification in cold aisles as compared to under‐floor air delivery. In‐Rack/In‐Row Systems The air distribution methods employed by in‐rack/in‐row cooling systems vary widely by manufacturer and model. Consult with the specific manufacturer’s representative for recommendations on the optimal air distribution/room layout for a particular in‐rack/in‐row system.
7.0 Cooling Systems The following describes the recommended and alternative cooling systems outlined in Table 2, and the abbreviations in parentheses correspond to the abbreviations used in the table. 7.1 House air (HA) When small server or telecom rooms are added to existing building spaces (and sometimes even in new construction), a relatively easy method of providing the necessary cooling is to “tap into” an existing, often centralized HVAC system. This solution generally consists of ducting to the main supply and return ducts and placing supply outlets and return grilles in the server/telecom space. While this cooling solution may seem like a beneficial one from a first cost and constructability perspective, what often happens is that an entire centralized building HVAC system ends up being required to run continuously just to serve a few small spaces with continuous cooling loads. In facilities that require continuous operation of the central HVAC systems, this is generally not a problem. But if the main building HVAC system is able to run on a regular occupancy schedule (e.g. Monday through Friday, 7am – 7pm), requiring the system to run continuously just to serve a few small spaces turns out to be an energy waste. One hybrid option entails the use of this “house air” during regularly‐occupied hours, which then switches over to a dedicated cooling system during unoccupied hours. The concept is that while the central system is running, it is more efficient to serve the continuous cooling loads with the central system, but when the central system can be turned‐off during unoccupied times, the dedicated server/telecom room cooling system is commanded to run. This dedicated system will generally be less efficient than the central system, but much more efficient than running the central system only to serve a few small spaces. 7.2 Chilled water air handling unit(s) with outside air economization (AHUOSA) In the typical Stanford climate, there are many hours in a given year when the outside temperature is conducive to “free cooling” of server and telecommunications cooling loads. While there are many custom‐designed methods to duct outside air into an existing CRAC/CRAH or even a direct expansion (DX) or chilled water fan coil, the easiest way to achieve this in a new or substantially redesigned server or telecom room is to install air handling units (AHU) with outside air economizers. The economizer will
Stanford University Server/Telecom Rooms Design Guide ‐ January, 2011 page 18
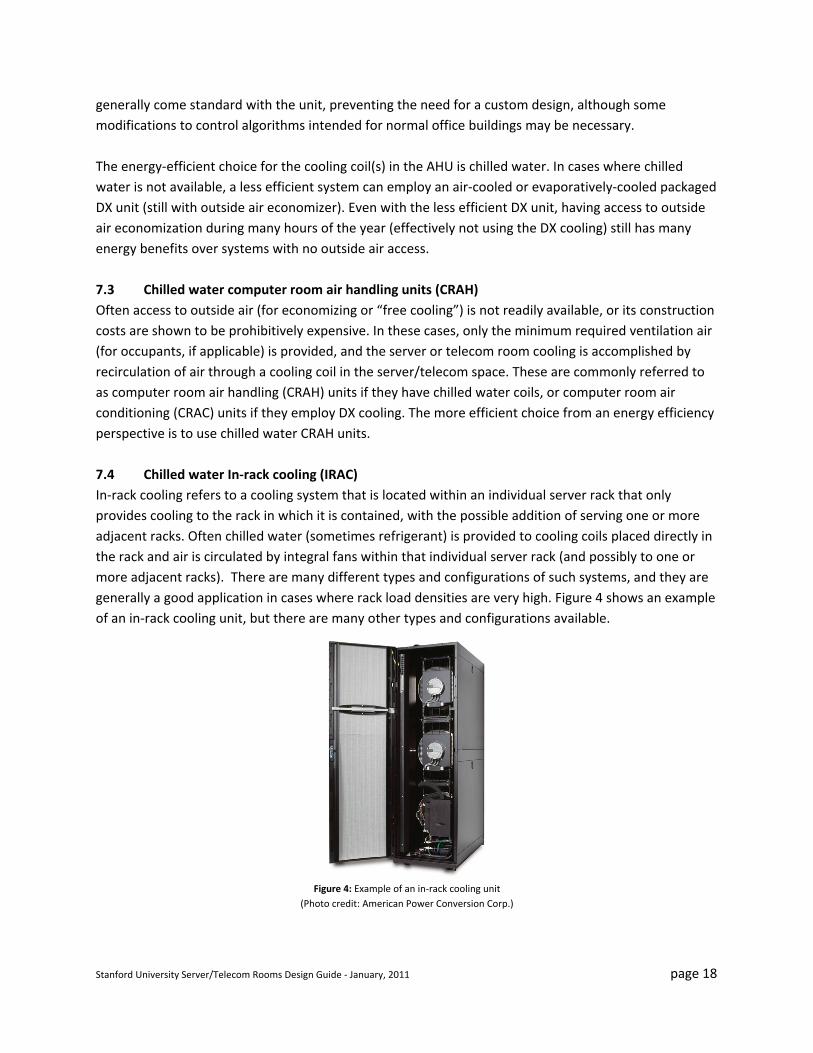
generally come standard with the unit, preventing the need for a custom design, although some modifications to control algorithms intended for normal office buildings may be necessary. The energy‐efficient choice for the cooling coil(s) in the AHU is chilled water. In cases where chilled water is not available, a less efficient system can employ an air‐cooled or evaporatively‐cooled packaged DX unit (still with outside air economizer). Even with the less efficient DX unit, having access to outside air economization during many hours of the year (effectively not using the DX cooling) still has many energy benefits over systems with no outside air access. 7.3 Chilled water computer room air handling units (CRAH) Often access to outside air (for economizing or “free cooling”) is not readily available, or its construction costs are shown to be prohibitively expensive. In these cases, only the minimum required ventilation air (for occupants, if applicable) is provided, and the server or telecom room cooling is accomplished by recirculation of air through a cooling coil in the server/telecom space. These are commonly referred to as computer room air handling (CRAH) units if they have chilled water coils, or computer room air conditioning (CRAC) units if they employ DX cooling. The more efficient choice from an energy efficiency perspective is to use chilled water CRAH units. 7.4 Chilled water In‐rack cooling (IRAC) In‐rack cooling refers to a cooling system that is located within an individual server rack that only provides cooling to the rack in which it is contained, with the possible addition of serving one or more adjacent racks. Often chilled water (sometimes refrigerant) is provided to cooling coils placed directly in the rack and air is circulated by integral fans within that individual server rack (and possibly to one or more adjacent racks). There are many different types and configurations of such systems, and they are generally a good application in cases where rack load densities are very high. Figure 4 shows an example of an in‐rack cooling unit, but there are many other types and configurations available.
Figure 4: Example of an in‐rack cooling unit
(Photo credit: American Power Conversion Corp.)
Stanford University Server/Telecom Rooms Design Guide ‐ January, 2011 page 19
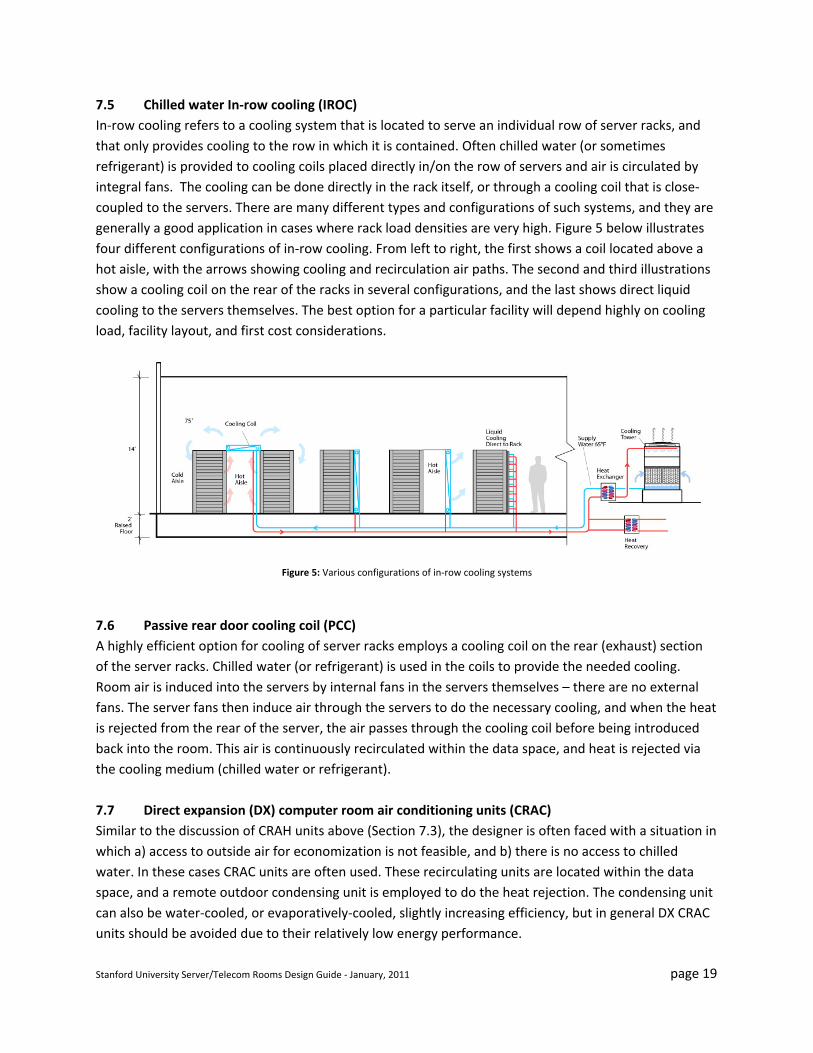
7.5 Chilled water In‐row cooling (IROC) In‐row cooling refers to a cooling system that is located to serve an individual row of server racks, and that only provides cooling to the row in which it is contained. Often chilled water (or sometimes refrigerant) is provided to cooling coils placed directly in/on the row of servers and air is circulated by integral fans. The cooling can be done directly in the rack itself, or through a cooling coil that is close‐coupled to the servers. There are many different types and configurations of such systems, and they are generally a good application in cases where rack load densities are very high. Figure 5 below illustrates four different configurations of in‐row cooling. From left to right, the first shows a coil located above a hot aisle, with the arrows showing cooling and recirculation air paths. The second and third illustrations show a cooling coil on the rear of the racks in several configurations, and the last shows direct liquid cooling to the servers themselves. The best option for a particular facility will depend highly on cooling load, facility layout, and first cost considerations.
Figure 5: Various configurations of in‐row cooling systems
7.6 Passive rear door cooling coil (PCC) A highly efficient option for cooling of server racks employs a cooling coil on the rear (exhaust) section of the server racks. Chilled water (or refrigerant) is used in the coils to provide the needed cooling. Room air is induced into the servers by internal fans in the servers themselves – there are no external fans. The server fans then induce air through the servers to do the necessary cooling, and when the heat is rejected from the rear of the server, the air passes through the cooling coil before being introduced back into the room. This air is continuously recirculated within the data space, and heat is rejected via the cooling medium (chilled water or refrigerant). 7.7 Direct expansion (DX) computer room air conditioning units (CRAC) Similar to the discussion of CRAH units above (Section 7.3), the designer is often faced with a situation in which a) access to outside air for economization is not feasible, and b) there is no access to chilled water. In these cases CRAC units are often used. These recirculating units are located within the data space, and a remote outdoor condensing unit is employed to do the heat rejection. The condensing unit can also be water‐cooled, or evaporatively‐cooled, slightly increasing efficiency, but in general DX CRAC units should be avoided due to their relatively low energy performance.

Stanford University Server/Telecom Rooms Design Guide ‐ January, 2011 page 20
7.8 Split AC systems (SAC) Split AC systems refer to a class of DX cooling units where the evaporator is located within the server/telecom space, and a remote condensing unit is located outdoors to reject the heat. These systems are generally used to serve relatively low cooling loads (1 – 10 tons), but do not have the cooling efficiency benefits of chilled water units, or larger, centralized DX cooling units. Split systems also generally do not come equipped with an outside air economizer, although custom solutions can be built. Efficiencies of split AC systems can vary widely, and are usually expressed as an energy efficiency ratio (EER). EER is defined as the rated cooling output in thousands of British thermal units per hour (kBtuh) divided by the rated electrical input in kilowatts (kW). Split systems should generally be specified to have an EER of 14 or higher (depending upon system size). If there are several small server/telecom rooms located within a reasonable distance from one another, it is possible to have all of the evaporators connected to a common condensing unit. Using variable refrigerant flow (VRF, or alternatively, variable refrigerant volume, or VRV) technology, multiple units can be served at varying individual cooling loads, and some systems even allow transfer of heat from one space to another. This is a potential form of heat recovery in which heat can be removed from a server/telecom room, and be used to heat for instance, a nearby office space. Figure 6 shows an example of a split AC system.
Figure 6: Example of a split DX AC system (indoor and outdoor units connected by refrigerant lines)
(Photo credit: Mitsubishi Electric Corp.)
7.9 Chilled water fan coil unit (FCU) For smaller cooling loads and heat densities, for instance a telecom room or small server room, chilled water fan coil units can be a viable cooling solution. These units may or may not be ducted to the outdoors to employ air‐side economizing, and within the server/telecom space the air to and from the unit also may or may not be ducted. An advantage to installing chilled water fan coils is that they are more energy efficient than DX split systems or DX fan coils. 7.10 Exhaust fan with undercut door (EF) In a mild climate such as that experienced at Stanford, often the most efficient, and least expensive cooling option for small telecom rooms is a simple exhaust fan to remove the heat and reject it to the outdoors. To provide sufficient make up air, often a portion of the bottom of the door is cut (to allow for
Stanford University Server/Telecom Rooms Design Guide ‐ January, 2011 page 21
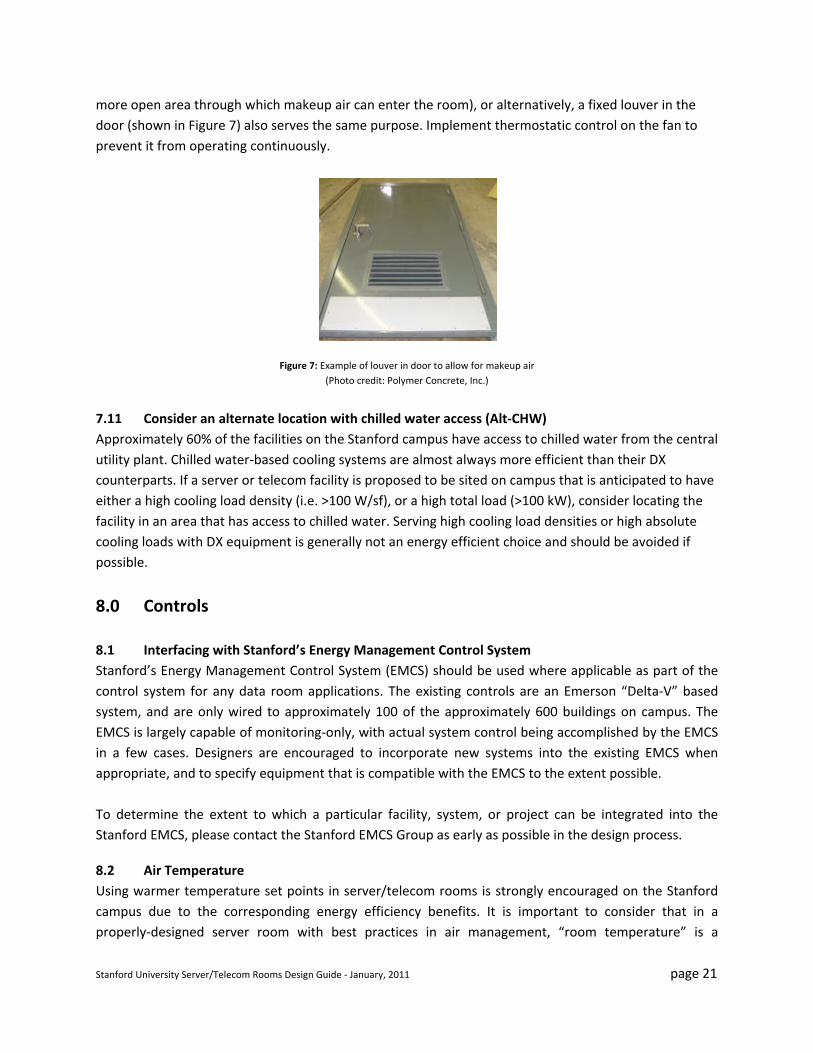
more open area through which makeup air can enter the room), or alternatively, a fixed louver in the door (shown in Figure 7) also serves the same purpose. Implement thermostatic control on the fan to prevent it from operating continuously.
Figure 7: Example of louver in door to allow for makeup air (Photo credit: Polymer Concrete, Inc.)
7.11 Consider an alternate location with chilled water access (Alt‐CHW) Approximately 60% of the facilities on the Stanford campus have access to chilled water from the central utility plant. Chilled water‐based cooling systems are almost always more efficient than their DX counterparts. If a server or telecom facility is proposed to be sited on campus that is anticipated to have either a high cooling load density (i.e. >100 W/sf), or a high total load (>100 kW), consider locating the facility in an area that has access to chilled water. Serving high cooling load densities or high absolute cooling loads with DX equipment is generally not an energy efficient choice and should be avoided if possible.
8.0 Controls 8.1 Interfacing with Stanford’s Energy Management Control System Stanford’s Energy Management Control System (EMCS) should be used where applicable as part of the control system for any data room applications. The existing controls are an Emerson “Delta‐V” based system, and are only wired to approximately 100 of the approximately 600 buildings on campus. The EMCS is largely capable of monitoring‐only, with actual system control being accomplished by the EMCS in a few cases. Designers are encouraged to incorporate new systems into the existing EMCS when appropriate, and to specify equipment that is compatible with the EMCS to the extent possible. To determine the extent to which a particular facility, system, or project can be integrated into the Stanford EMCS, please contact the Stanford EMCS Group as early as possible in the design process.
8.2 Air Temperature Using warmer temperature set points in server/telecom rooms is strongly encouraged on the Stanford campus due to the corresponding energy efficiency benefits. It is important to consider that in a properly‐designed server room with best practices in air management, “room temperature” is a

Stanford University Server/Telecom Rooms Design Guide ‐ January, 2011 page 22
meaningless concept. Cold aisle temperatures can be on the order of 65oF – 85oF, and corresponding hot aisle temperatures can be on the order of 90oF – 110oF. Given these parameters, a typical “comfort cooling” temperature set point of 72oF – 78oF is not in any way appropriate for a server/telecom room. Thermostats and other sensors that control cooling systems should be located at the inlets to the IT equipment (cold aisles), as this is the only region of the room in which temperature needs to be controlled.
Variable speed fans in the servers are sometimes controlled to the internal server temperature. Internal fans may operate at higher speeds, consuming more power, if the server inlet air conditions are operated above the allowable range. An increase in inlet air temperature results in higher server fan power by applying the fan affinity law where fan power increases with the cube of fan speed. Thus, the effect of increasing server inlet air temperature on server fan power should be carefully weighed against the potential cooling system energy savings.
8.3 Variable Speed Drives To allow for varying airflow as the cooling load fluctuates, and to minimize the airflow for a given cooling load, variable speed drives should be used on cooling air supply fans (not to be confused with server fans described in the last section). Variable air volume systems provide consistent cooling when and where it is needed and are able to respond to changes in load. The fan speed should be controlled to maintain an under‐floor pressure set point in a raised floor application, or a supply duct static pressure set point for ducted systems. Supply air and supply chilled water temperatures should be set as high as possible while maintaining the necessary cooling capacity.
8.4 Humidification Systems and Controls With the exception of specific needs such as tape storage libraries, active humidification controls are not implemented as a matter of course in Stanford campus server or telecom rooms. For spaces which recirculate the majority of the cooling air, there is no appreciable source of moisture that would require dehumidification. Barring high infiltration, most cooling systems will automatically control the maximum humidity to about 60% to 70% RH due to the fundamental nature of their operation. Supply air at 60°F saturated with as much moisture as it can possibly carry has a relative humidity of only 66% RH at 72°F. Humidity sensors are possibly the least stable sensor technologies in common HVAC use. Without regular calibration, attempts to control to a tight humidity band (1% ‐ 2%) are not meaningful. The problem with expending large amounts of energy to maintain a 50% RH +/‐1% when the humidity sensor is off by at least 5% is clear. Even with an appropriate control band such as 20‐80% RH, humidity sensors should be regularly calibrated. Humidity control consumes a large amount of energy and requires costly equipment to achieve; if the first cost was justified, then calibrating the humidity sensors should be considered as much an operating cost as the electric bill in order to ensure the first‐cost investment is actually providing the desired space condition.
Stanford University Server/Telecom Rooms Design Guide ‐ January, 2011 page 23
9.0 Monitoring and Sub‐Metering 9.1 On‐Site Monitoring and Continuous Performance Measurement Sufficient metering needs to be in place for ongoing energy‐usage management to be effective. Energy‐efficiency benchmarking goals need to be established to determine which measured values need to be obtained for measuring efficiency.
The accuracy of the monitoring equipment should be specified, including calibration status, to support the level of desired accuracy expected from the monitoring. The measurement range should be carefully considered when determining the minimum sensor accuracy. Electromagnetic flow meters and “strap‐on” ultrasonic flow meters are among the most accurate water flow meters available. Three phase power meters should be selected to measure true root mean square (RMS) power.
Ideally, the use of Stanford’s Energy Management Control System (EMCS) provides all of the sensors and calculations required to determine real‐time efficiency measurements. All measured values should be continuously trended and data archived for a minimum of one year to obtain annual energy totals. If an open protocol control system is installed, more sensors may be added after initial installation. If the IT equipment includes on‐board temperature sensors, it may be possible to integrate them with the campus EMCS. Measurement should include temperature and humidity sensors at the air inlet of IT equipment and at heights prescribed by ASHRAE’s Thermal Guidelines for Data Processing Environments, 2008.
9.2 IT Load To get average rack power, count the number of racks in the server/telecom room, and assign a percentage full for each rack. The percentage full may appear to be somewhat arbitrary, but it can be very useful when used to estimate future loads. If desired, a complete inventory of the IT equipment could be obtained, or a partial inventory of typical equipment. This inventory can be useful in tracking load growth trends and planning for future expansions.
There are several types of racks that may be of interest. Selecting a typical rack allows for projections of total rack load and load density, while selecting a peak load rack offers guidance as to the airflow distribution required for cooling. At a minimum, measure a rack with a typical mixture of equipment to get a sense of the variability of the power requirement. The rack needs to have its own electrical circuit and preferably just one electrical circuit feeding it. If different types of servers are used, select a rack with the most common type of server. Stanford Recommendations:
Unless there are built‐in meters on the rack‐feed circuit, install a portable kW logger at the feed to the racks. If using a built‐in meter, start a trend log in the monitoring software. A significant length of trend time (usually a week) is required to capture data if there are any processing task load impacts on the overall power usage.
Stanford University Server/Telecom Rooms Design Guide ‐ January, 2011 page 24
9.3 Electrical To determine electrical power losses in the distribution system, measure the input and output power at the same time. Some distribution systems are equipped with internal meters to allow this, though they should be checked with portable meters to assess their accuracy. Note that kVA is not a reliable substitute for kW. Design data can be substituted if there is no easy access for power measurements. Specifically for UPS, determine and record the input power and the rated maximum for the system and calculate the percent load factor by dividing the input load by the rated maximum. The load factor has a significant impact on the measured UPS efficiency. Losses in standby generators include jacket heaters and battery chargers. Measure and log these electrical power loads and the ambient temperature at the generator(s). Also note the jacket water temperature setpoint and measure the temperature (one reading is adequate).
In order to reduce the number of points required to determine the total IT equipment electrical load, use the most upstream feeders available and feasible to access, serving only IT equipment. Typically, a single meter can be used to capture the power usage of many racks or even a whole (small) server/telecom room.
9.4 Chilled Water Sometimes it is easiest to monitor the entire motor control feeding the chiller plant as one kW point, and any other loads on it can be monitored for subtraction. Pumps without VFDs can be spot checked or trended for a short time and assumed to be constant power devices. The chiller and cooling tower systems tend to have high variations in load over time and should be trended. Variable speed pumps should also be trended.
In order to optimize the chiller plant, each component should be logged separately, as well as chilled water and condenser water supply and return temperatures and chilled water flow to allow for the determination of tons of cooling supplied. An accurate tonnage measurement requires highly accurate temperature and flow sensors. The difference between the supply and return temperatures is often 5‐10 degrees or less. Use of non‐matched, typical temperature sensors that are only accurate to ±1oF could introduce an uncertainty of almost 50% into the temperature delta measurement, rendering it useless. Water flow can be determined by a clamp‐on ultrasonic or by a permanently‐ installed meter, which would allow for continuous monitoring. Care should be taken when selecting a flow meter for an installation with a minimal chance of fouling and calibration drift. For chilled water from the Stanford central utility plant, there may already be sufficient sub‐metering of temperatures and flow rates for a given building or room. Be sure to investigate any already‐available chilled water monitoring systems and data before specifying sub‐metering for chilled water use for a particular project. This data may also be helpful in determining the facility PUE.

Stanford University Server/Telecom Rooms Design Guide ‐ January, 2011 page 25
10.0 Electrical Equipment
10.1 Electrical Systems Similar to cooling systems, it is important to always consider initial and future loads, in particular part‐ and low‐load conditions, when designing and selecting equipment for a server/telecom room electrical system. In a typical server/telecom room with a highly efficient cooling system, IT equipment loads can account for over half of the entire facility’s energy use. Use of efficient IT equipment will significantly reduce these loads, which consequently will downsize the equipment needed to cool them. Purchasing servers equipped with energy‐efficient processors, fans, and power supplies, high‐efficiency network equipment, consolidating storage devices, consolidating power supplies, and implementing virtualization are the most advantageous ways to reduce IT equipment loads.
10.2 Power Distribution Units (PDU) Specialty PDU’s that convert higher voltage (208V AC or 480V AC) into lower voltage (120V AC) via a built‐in step‐down transformer for low voltage equipment are commonly used. Transformers lose power in the form of heat when voltage is being converted. The parameters of the transformer in this type of PDU can be specified such that the energy efficiency is optimized. A dry‐type transformer with a 176°F temperature rise uses 13% to 21% less energy than a 302°F rise unit. The higher efficiency 176°F temperature rise unit has a first‐cost premium; however, the cost is usually recovered in the energy cost savings. In addition, transformers operate most efficiently when they are loaded in the 20% to 50% range. Selecting a PDU with a transformer loaded in that range will reduce the loss of power through the transformer. Energy can also be saved by reducing the number of installed PDU’s with built‐in transformers.
10.3 Uninterruptible Power Supplies (UPS) A portion of all the power supplied to the UPS to operate the server/telecom equipment is lost to inefficiencies in the system. The first step to minimize these losses is to evaluate which equipment, if not the entire server/telecom room, requires a UPS system. Increasing the UPS system efficiency offers direct, 24‐hour‐a‐day energy savings, within the UPS itself and indirectly through lower heat loads and even reduced building transformer losses. Among double conversion systems, UPS efficiency ranges from 86% to 95%. When a full IT equipment load is served through a UPS system, even a small improvement in the efficiency of the system can yield a large annual cost savings. For example, a 15,000 square foot server room with IT equipment operating at 100 W/sf requires 13,140 MWh of energy annually for the IT equipment. If the UPS system supplying that power has its efficiency improved from 90% to 95%, the annual energy bill will be reduced by 768,421 kWh or about $90,000 at $0.12/kWh, plus significant additional cooling system energy savings from the reduced cooling load. For battery‐based UPS systems, use a design approach that keeps the UPS load factor as high as possible. This usually requires using multiple smaller units.

Stanford University Server/Telecom Rooms Design Guide ‐ January, 2011 page 26
One strategy for improving UPS energy efficiency is to reduce the heat loads due to power conversion. Power conversion from AC to DC and back to AC occurs with battery UPS systems, resulting in large energy losses, which are then compounded by the energy for cooling needed to remove the heat generated by the loss. The efficiency of the power conversion drops off steeply when the UPS systems are lightly loaded.
Consider a UPS system sized for two UPS units with n+1 redundancy, with both units operating at 30% load factor. If the same load is served by three smaller units (also sized for n+1 redundancy), then these units will operate at 40% load factor. This 10% increase in load factor can result in a 1.2% efficiency increase (see Figure 8). For a 100 kW load, this efficiency increase can result in savings of approximately 13,000 kWh annually.
Figure 8: Typical double‐conversion UPS efficiency curve for 100 kVA capacity and greater
Evaluate the need for power conditioning. Line interactive systems often provide enough power conditioning for servers at a higher efficiency than typical double conversion UPS systems. Some traditional double conversion UPS systems (which offer the highest degree of power conditioning) have the ability to operate in the more efficient line conditioning mode, usually advertised as ‘economy’ or ‘eco’ mode. In some cases a more efficient alternative to traditional, battery‐based UPS systems is the use of a rotary (flywheel) UPS. These systems are generally implemented in tandem with a backup Diesel engine generator. During normal operation, the flywheel spins continuously. In the event of a utility power loss, the rotational inertia of the high‐mass rotary element will provide 10 – 60 seconds of “ride‐through” power as the backup generator is started and run. The transfer from utility power to the flywheel, and finally to the generator is such that there is no power interruption to critical equipment. Multiple flywheels operated in parallel can increase reserve run‐time and backup power capacity. These systems
Stanford University Server/Telecom Rooms Design Guide ‐ January, 2011 page 27
have an appreciably longer life‐cycle than battery‐based UPS systems (on the order of 20 – 30 years), but require regular downtime for maintenance such as bearing replacements. Newer systems employing magnetic bearings require fewer replacements and result in lower standby losses. Rotary UPS systems also eliminate battery replacement and disposal concerns, and don’t require tight temperature control to ensure the longevity of the battery banks.
10.4 Generators In the event of a power failure, many server rooms have engine‐driven generators to back up the system. Such generators have relatively small but significant and easily addressed standby losses, the biggest being the engine heater. The engine heater typically uses more energy than the generator will ever produce over the life of the facility. Reducing heater temperature setpoints from the typical 120°F to 70°F has shown savings of 79% with no reduction in reliability; delaying the transfer switch transition to the generator greatly reduces engine wear during the warm‐up period. Adding thermostatic control of the heater (as opposed to continuous ‘on’ operation) can also provide for significant energy savings. For more information on the use of Diesel engine generators at Stanford, please refer to Stanford University Facilities Design Guide (FDG) # 16230.
11.0 Power Usage Effectiveness (PUE) One common data center/server/telecom room efficiency metric is the Power Usage Effectiveness (PUE). This metric was developed by the Green Grid, a global consortium of IT companies and professionals seeking to improve energy efficiency of server/telecom/IT facilities. PUE is a useful metric for comparing similar facilities in similar climates, or to track the progress of a given facility over time. But while PUE will show facility operators how efficiently they are serving a given server/telecom load, it does not evaluate whether or not that server/telecom load could be reduced (i.e. through virtualization, server power management, storage consolidation, etc.). PUE is defined as:
PUE = Total Facility Power Power for IT equipment only
Total facility power includes all electrical uses in the server/telecom room, including the actual server/telecom equipment, lights, fans, pumps, cooling systems (including any outdoor condensing units), humidifiers, and “losses” in the electrical distribution system (UPS, transformers, power supplies, etc). Power for IT equipment only (the denominator) does not include the electrical distribution losses from UPS, PDU, etc – only the power provided directly to the IT equipment. With PUE, lower is more efficient. The theoretical lower limit of PUE is 1.0, but this would not be physically possible since it would mean that no power is required for support equipment (cooling, lighting, electrical distribution, etc). A typical PUE is on the order of 1.5 – 2.0. Best practices PUE’s are now approaching 1.1 (meaning only 100 W of power for support equipment is required for each kW of server/telecom load). But any analysis of PUE should take into account that it is a dynamic, ever‐changing metric for a given facility. Variable server/telecom loads, ambient weather conditions and the
Stanford University Server/Telecom Rooms Design Guide ‐ January, 2011 page 28
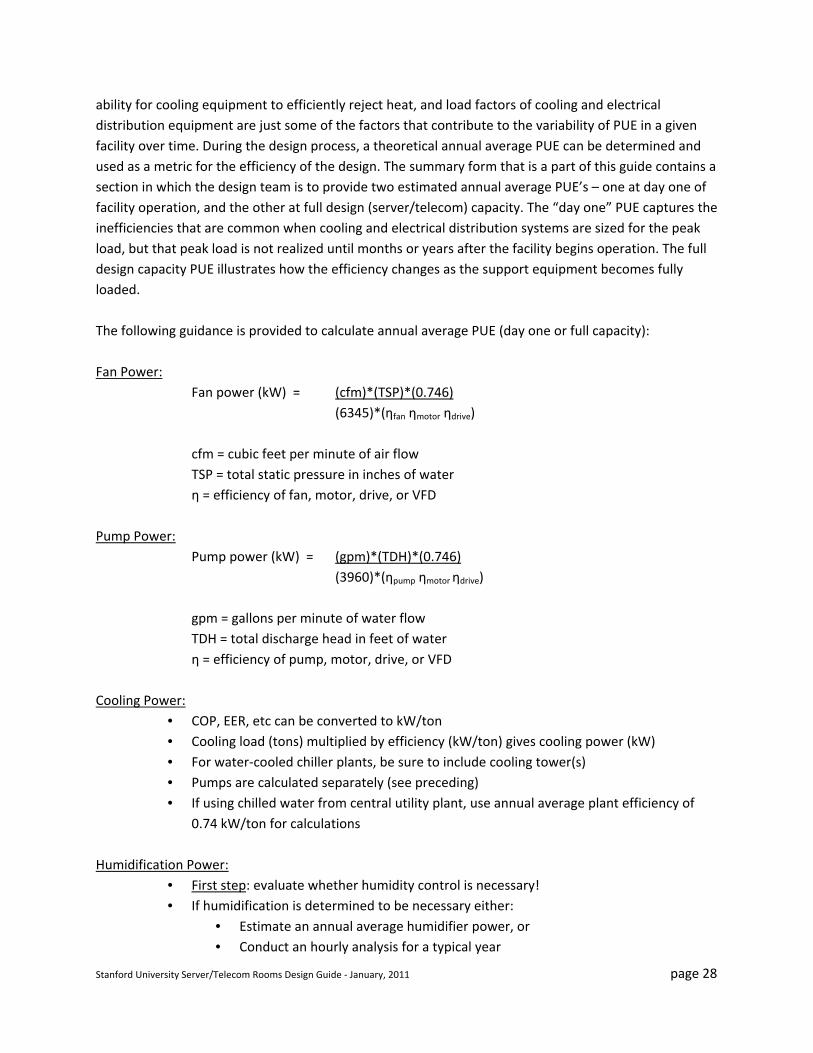
ability for cooling equipment to efficiently reject heat, and load factors of cooling and electrical distribution equipment are just some of the factors that contribute to the variability of PUE in a given facility over time. During the design process, a theoretical annual average PUE can be determined and used as a metric for the efficiency of the design. The summary form that is a part of this guide contains a section in which the design team is to provide two estimated annual average PUE’s – one at day one of facility operation, and the other at full design (server/telecom) capacity. The “day one” PUE captures the inefficiencies that are common when cooling and electrical distribution systems are sized for the peak load, but that peak load is not realized until months or years after the facility begins operation. The full design capacity PUE illustrates how the efficiency changes as the support equipment becomes fully loaded. The following guidance is provided to calculate annual average PUE (day one or full capacity): Fan Power:
Fan power (kW) = (cfm)*(TSP)*(0.746) (6345)*(ηfan ηmotor ηdrive) cfm = cubic feet per minute of air flow TSP = total static pressure in inches of water η = efficiency of fan, motor, drive, or VFD
Pump Power: Pump power (kW) = (gpm)*(TDH)*(0.746) (3960)*(ηpump ηmotor ηdrive) gpm = gallons per minute of water flow TDH = total discharge head in feet of water η = efficiency of pump, motor, drive, or VFD
Cooling Power:
• COP, EER, etc can be converted to kW/ton • Cooling load (tons) multiplied by efficiency (kW/ton) gives cooling power (kW) • For water‐cooled chiller plants, be sure to include cooling tower(s) • Pumps are calculated separately (see preceding) • If using chilled water from central utility plant, use annual average plant efficiency of
0.74 kW/ton for calculations Humidification Power:
• First step: evaluate whether humidity control is necessary! • If humidification is determined to be necessary either:
• Estimate an annual average humidifier power, or • Conduct an hourly analysis for a typical year
Stanford University Server/Telecom Rooms Design Guide ‐ January, 2011 page 29
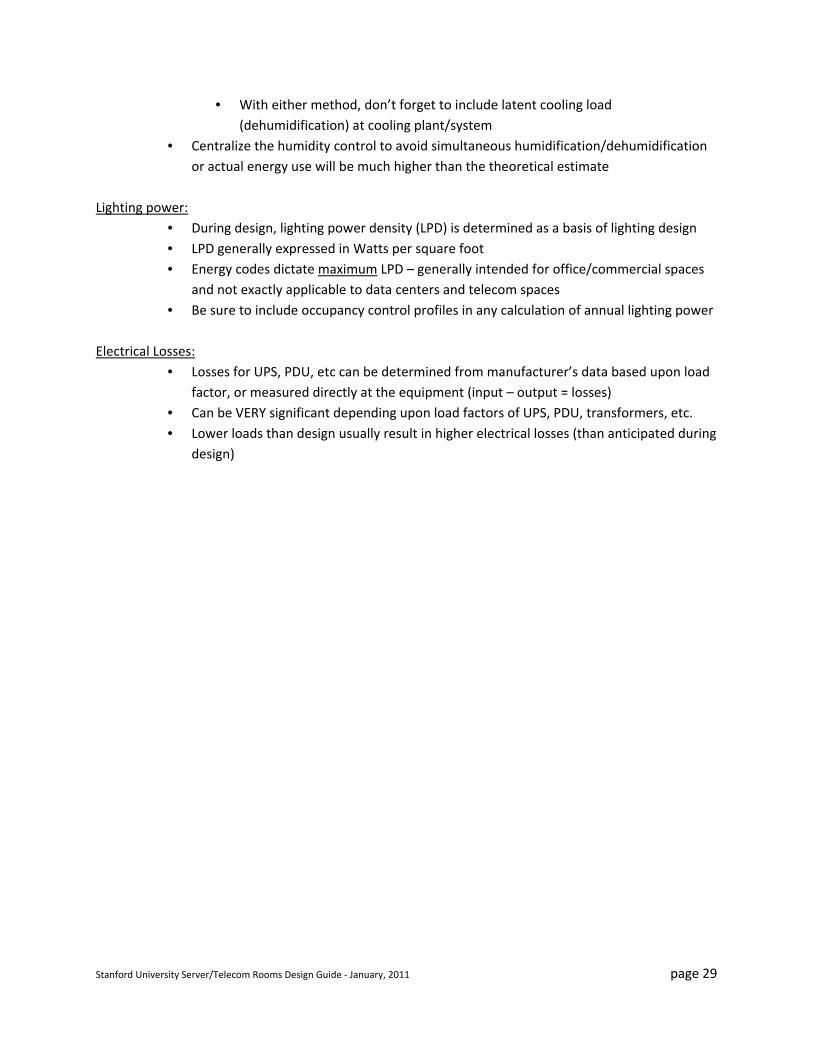
• With either method, don’t forget to include latent cooling load (dehumidification) at cooling plant/system
• Centralize the humidity control to avoid simultaneous humidification/dehumidification or actual energy use will be much higher than the theoretical estimate
Lighting power:
• During design, lighting power density (LPD) is determined as a basis of lighting design • LPD generally expressed in Watts per square foot • Energy codes dictate maximum LPD – generally intended for office/commercial spaces
and not exactly applicable to data centers and telecom spaces • Be sure to include occupancy control profiles in any calculation of annual lighting power
Electrical Losses:
• Losses for UPS, PDU, etc can be determined from manufacturer’s data based upon load factor, or measured directly at the equipment (input – output = losses)
• Can be VERY significant depending upon load factors of UPS, PDU, transformers, etc. • Lower loads than design usually result in higher electrical losses (than anticipated during
design)