star petroleum refining pcl - osk188.co.th petroleum refining pcl thailand initiating coverage 20...
TRANSCRIPT

Thailand Initiating Coverage
See important disclosures at the end of this report 1
Powered by the EFA Platform
20 November 2016 Energy | Energy
Star Petroleum Refining PCL Buy
Target Price: THB15.30
Price: THB12.70
Small Is Beautiful Market Cap: USD1,550m
Bloomberg Ticker: SPRC TB We initiate coverage on SPRC with a BUY and TP of THB15.30 (20% upside), based on 2017 P/BV of 1.8x. Its refinery is the second smallest in Thailand but it is well run and financially robust. We believe this company deserves to trade at a premium to peers given its low gearing and strong cash flows. 2017F core net profit is expected at THB6.4bn and, with a dividend payout of 50%, SPRC offers an attractive dividend yield of 5.8%. SPRC is in the top quartile amongst regional peers for ROCE, ROE and ROA, while it trades at much lower EV/EBITDA, P/BV and P/E valuations.
Share Data
Avg Daily Turnover (THB/USD) 273m/7.81m
52-wk Price low/high (THB) 8.00 - 13.5
Free Float (%) 34
Shares outstanding (m) 4,300
Estimated Return 20%
Shareholders (%)
Chevron South Asia Holdings 60.6
Thai NVDR 12.1
PTT 5.4
Share Performance (%)
YTD 1m 3m 6m 12m
Absolute 40.3 (5.9) 21.0 22.1 N/A
Relative 25.9 (5.6) 25.7 16.9 N/A
Source: Bloomberg
Source: Bloomberg
Table Of Contents Financial Exhibits 2 Our Valuation 3 Financial Analysis 5 Commodities Outlook 7 Company Background 8 SWOT Analysis 10
Attractive dividend play. We value Star Petroleum Refining (SPRC) at
THB15.30/share, based on 2017F P/BV of 1.8x. We use a much higher P/BV multiple than other listed refineries in Thailand as we believe it deserves to trade at a premium – SPRC has minimal debt, no major CAPEX plans, and no major turnaround until 2019. As such, the company has strong cash flows, and the ability to offer high and attractive dividend yields at current levels. Even if SPRC’s share price reaches our TP, its dividend yield would only fall to 4.9% – still attractive for any investor looking for good dividend play, in our view.
Markets set to tighten. Next year, refining margins look set to improve as
demand outpaces supply. Net additional refining capacity of 672,000bpd compared to additional demand of 1,200,000bpd. Gasoline, diesel, and fuel oil demand are all expected to outpace supply. We have assumed market GRM of USD7.0/bbl for SPRC over the forecasted period, which is slightly lower than its 2016F average GRM of USD7.5/bbl.
Volatility in SPRC’s reported net profit is derived mainly from stock
gains/losses. Stripping this out, recurring net profit has improved to a peak of THB12.4bn in 2015 from THB3.4bn in 2013. This large positive swing in earnings was a result of market GRM increasing to a high of USD10.4/bbl in 2015, although there was a stock loss of USD2.3/bbl. We are expecting more normalised market GRM going forward, at USD7.0/bbl. As such, we are projecting more normalised recurring net profits of THB6.0-6.5bn and more normalised dividends of c.THB3bn for the forecasted period.
One-year lock up period will end on 8 Dec 2016, after which both Chevron
South Asia Holdings (Chevron SAH) and PTT (PTT TB, NR) are able to sell their respective stakes in the market, should they wish to do so. Chevron’s (CVX US, NR) strategy is to maximise earnings from its downstream refineries, as its upstream business is not expected to perform over the next couple of years. As such, we do not believe Chevron SAH would divest its shares in SPRC. We also do not believe PTT would sell its stake in SPRC as it currently holds only a minority stake and does not have any control over SPRC. In addition, we believe PTT does not require cash at the moment. However, should PTT decide to sell its stake, this may put pressure on SPRC’s share price – at which point, investors should take the opportunity to accumulate for its attractive dividend yields.
Source: Company data, RHB
Forecasts and Valuations Dec-14 Dec-15 Dec-16F Dec-17F Dec-18F
Total turnover (THBm) 229,325 178,877 158,093 224,414 224,414
Reported net profit (THBm) (6,367) 8,227 7,370 6,384 6,449
Recurring net profit (THBm) 4,776 12,442 6,061 6,384 6,449
Recurring net profit growth (%) 38.3 160.5 (51.3) 5.3 1.0
Recurring EPS (THB) 1.16 3.03 1.44 1.48 1.50
DPS (THB) 0.45 2.31 2.52 0.74 0.75
Recurring P/E (x) 10.9 4.2 8.8 8.6 8.5
P/B (x) 1.06 1.39 1.61 1.47 1.35
P/CF (x) 15.9 2.9 5.4 5.5 5.9
Dividend Yield (%) 3.6 18.2 19.9 5.8 5.9
EV/EBITDA (x) na 4.05 4.50 4.58 4.07
Return on average equity (%) (11.9) 19.0 20.6 17.9 16.6
Net debt to equity (%) net cash 0.1 4.8 net cash net cash
Our vs consensus EPS (adjusted)
91
111
131
151
7
9
11
13
Star Petroleum Refining PCL (SPRC TB)Price Close Relative to Stock Exchange of Thailand Index (RHS)
50
100
150
200
250
De
c-1
5
Fe
b-1
6
Ap
r-1
6
Ju
n-1
6
Ju
l-1
6
Se
p-1
6
Vo
l m
Analyst
Kannika Siamwalla, CFA
+66 2862 9744
Star Petroleum Refining PCL Thailand Initiating Coverage
20 November 2016 Energy | Energy
See important disclosures at the end of this report 2
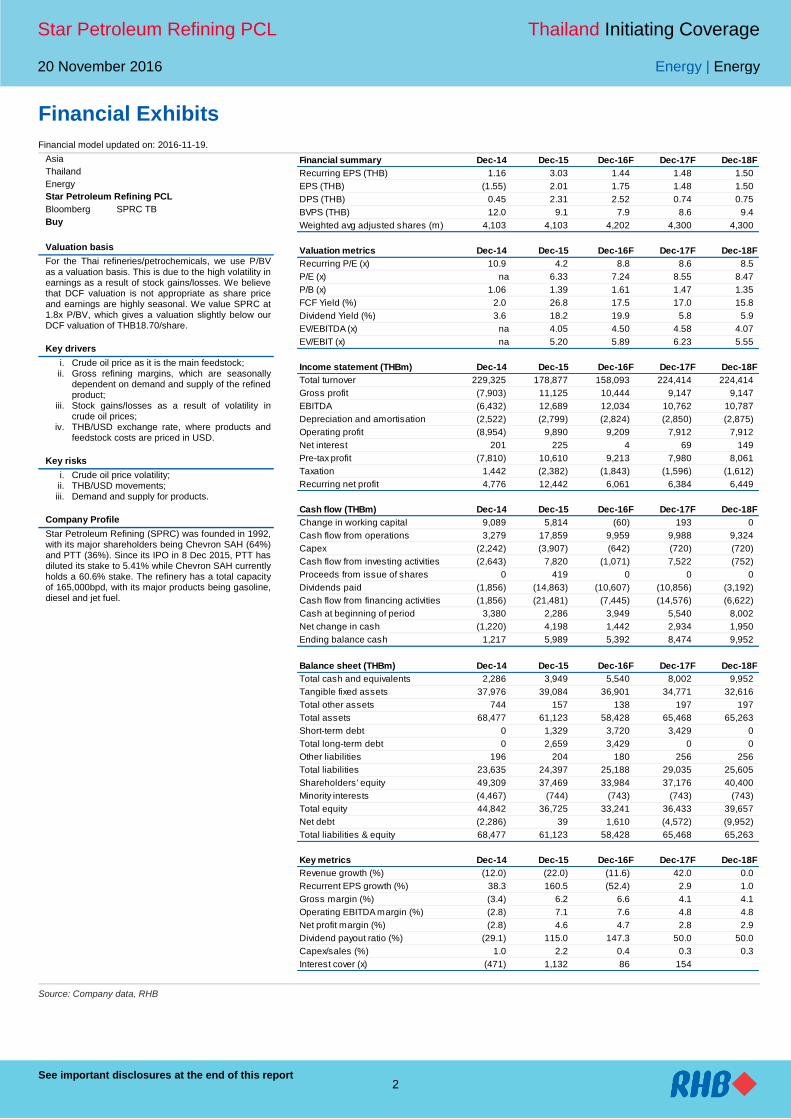
Financial Exhibits
Financial model updated on: 2016-11-19.
Asia
Thailand
Energy
Star Petroleum Refining PCL
Bloomberg SPRC TB
Buy
Valuation basis
For the Thai refineries/petrochemicals, we use P/BV as a valuation basis. This is due to the high volatility in earnings as a result of stock gains/losses. We believe that DCF valuation is not appropriate as share price and earnings are highly seasonal. We value SPRC at 1.8x P/BV, which gives a valuation slightly below our DCF valuation of THB18.70/share.
Key drivers
i. Crude oil price as it is the main feedstock; ii. Gross refining margins, which are seasonally
dependent on demand and supply of the refined product;
iii. Stock gains/losses as a result of volatility in crude oil prices;
iv. THB/USD exchange rate, where products and feedstock costs are priced in USD.
Key risks
i. Crude oil price volatility; ii. THB/USD movements; iii. Demand and supply for products.
Company Profile
Star Petroleum Refining (SPRC) was founded in 1992, with its major shareholders being Chevron SAH (64%) and PTT (36%). Since its IPO in 8 Dec 2015, PTT has diluted its stake to 5.41% while Chevron SAH currently holds a 60.6% stake. The refinery has a total capacity of 165,000bpd, with its major products being gasoline, diesel and jet fuel.
Source: Company data, RHB
Financial summary Dec-14 Dec-15 Dec-16F Dec-17F Dec-18F
Recurring EPS (THB) 1.16 3.03 1.44 1.48 1.50
EPS (THB) (1.55) 2.01 1.75 1.48 1.50
DPS (THB) 0.45 2.31 2.52 0.74 0.75
BVPS (THB) 12.0 9.1 7.9 8.6 9.4
Weighted avg adjusted shares (m) 4,103 4,103 4,202 4,300 4,300
Valuation metrics Dec-14 Dec-15 Dec-16F Dec-17F Dec-18F
Recurring P/E (x) 10.9 4.2 8.8 8.6 8.5
P/E (x) na 6.33 7.24 8.55 8.47
P/B (x) 1.06 1.39 1.61 1.47 1.35
FCF Yield (%) 2.0 26.8 17.5 17.0 15.8
Dividend Yield (%) 3.6 18.2 19.9 5.8 5.9
EV/EBITDA (x) na 4.05 4.50 4.58 4.07
EV/EBIT (x) na 5.20 5.89 6.23 5.55
Income statement (THBm) Dec-14 Dec-15 Dec-16F Dec-17F Dec-18F
Total turnover 229,325 178,877 158,093 224,414 224,414
Gross profit (7,903) 11,125 10,444 9,147 9,147
EBITDA (6,432) 12,689 12,034 10,762 10,787
Depreciation and amortisation (2,522) (2,799) (2,824) (2,850) (2,875)
Operating profit (8,954) 9,890 9,209 7,912 7,912
Net interest 201 225 4 69 149
Pre-tax profit (7,810) 10,610 9,213 7,980 8,061
Taxation 1,442 (2,382) (1,843) (1,596) (1,612)
Recurring net profit 4,776 12,442 6,061 6,384 6,449
Cash flow (THBm) Dec-14 Dec-15 Dec-16F Dec-17F Dec-18F
Change in working capital 9,089 5,814 (60) 193 0
Cash flow from operations 3,279 17,859 9,959 9,988 9,324
Capex (2,242) (3,907) (642) (720) (720)
Cash flow from investing activities (2,643) 7,820 (1,071) 7,522 (752)
Proceeds from issue of shares 0 419 0 0 0
Dividends paid (1,856) (14,863) (10,607) (10,856) (3,192)
Cash flow from financing activities (1,856) (21,481) (7,445) (14,576) (6,622)
Cash at beginning of period 3,380 2,286 3,949 5,540 8,002
Net change in cash (1,220) 4,198 1,442 2,934 1,950
Ending balance cash 1,217 5,989 5,392 8,474 9,952
Balance sheet (THBm) Dec-14 Dec-15 Dec-16F Dec-17F Dec-18F
Total cash and equivalents 2,286 3,949 5,540 8,002 9,952
Tangible fixed assets 37,976 39,084 36,901 34,771 32,616
Total other assets 744 157 138 197 197
Total assets 68,477 61,123 58,428 65,468 65,263
Short-term debt 0 1,329 3,720 3,429 0
Total long-term debt 0 2,659 3,429 0 0
Other liabilities 196 204 180 256 256
Total liabilities 23,635 24,397 25,188 29,035 25,605
Shareholders' equity 49,309 37,469 33,984 37,176 40,400
Minority interests (4,467) (744) (743) (743) (743)
Total equity 44,842 36,725 33,241 36,433 39,657
Net debt (2,286) 39 1,610 (4,572) (9,952)
Total liabilities & equity 68,477 61,123 58,428 65,468 65,263
Key metrics Dec-14 Dec-15 Dec-16F Dec-17F Dec-18F
Revenue growth (%) (12.0) (22.0) (11.6) 42.0 0.0
Recurrent EPS growth (%) 38.3 160.5 (52.4) 2.9 1.0
Gross margin (%) (3.4) 6.2 6.6 4.1 4.1
Operating EBITDA margin (%) (2.8) 7.1 7.6 4.8 4.8
Net profit margin (%) (2.8) 4.6 4.7 2.8 2.9
Dividend payout ratio (%) (29.1) 115.0 147.3 50.0 50.0
Capex/sales (%) 1.0 2.2 0.4 0.3 0.3
Interest cover (x) (471) 1,132 86 154

Star Petroleum Refining PCL Thailand Initiating Coverage
20 November 2016 Energy | Energy
See important disclosures at the end of this report 3
Figure 1: SPRC – Fuelling the future of Thailand
Source: Company
Our Valuation We value SPRC at THB15.30 per share, based on 2017F P/BV of 1.8x. We apply a much higher P/BV multiple for this stock relative to peers, as we believe it deserves to trade at a premium given that the company has minimal debt, strong cash flow generating capacity as well as high dividend yields (at a high of 5.8%). Even if SPRC’s share price reaches our TP of THB15.30, dividend yields would remain attractive at 4.8%, a good stock to own for investors looking for good dividend plays, in our opinion.
In terms of valuation comparison, using regional peer multiples for P/E and EV/EBITDA, we derive implied valuations of THB14.80 per share and THB19.00 per share respectively for SPRC. We also derive a much higher valuation of THB18.70 per share when using DCF valuation (WACC of 8.2%).
For regional valuation comparison purposes, SPRC is in the top quartile for ROCE, ROE and ROA at 19.4%, 20.2% and 12.7% respectively. It is also trading at lower EV/EBITDA, P/BV and P/E valuations relative to its peers.

Star Petroleum Refining PCL Thailand Initiating Coverage
20 November 2016 Energy | Energy
See important disclosures at the end of this report 4
Figure 2: SPRC valuation comparison
2017F P/E 2017F P/BV EV/EBITDA *DCF method
SET multiples (x) 22.0 1.9
Regional peer multiples (x) 11.2 1.4 7.2
Fair multiple (x) 10.0 1.8 7.2
DCF valuation, WACC used 8.2%
EPS/PBVS (THB/share) 1.5 8.5
Implied SPRC valuation (THB/share) 14.80 15.30 19.00 18.70
Source: RHB
Figure 3: Sensitivity – SPRC’s implied valuation to market GRM
USD/bbl Implied SPRC valuation (THB/share)
Market GRM P/E 2017 P/BV 2017 EV/EBITDA **DCF method
5.0 7.00 14.50 12.00 14.00
6.0 10.90 14.90 16.00 16.40
7.0 14.80 15.30 19.00 18.70
8.0 18.80 15.60 23.60 20.90
9.0 22.70 16.00 27.50 23.20
Source: RHB
Figure 4: Sensitivity – Net profit and dividend vs GRM
2017F
GRM (USD/bbl) Net profit (THBm) % NP vs GRM DPS (THB/share) Dividend yield
5.0 3,025 (0.53) 0.35 2.8%
6.0 4,705 (0.26) 0.55 4.3%
7.0 6,384 - 0.74 5.8%
8.0 8,064 0.26 0.94 7.4%
9.0 9,743 0.53 1.13 8.9%
Note: * For long-term GRM (2019 onwards) we have used USD5.5/bbl Note 2: ** For DCF sensitivity to GRM, sensitivity is on the 2017/18, while we keep 2019 GRM constant at USD5.5/bbl. Source: RHB
Figure 5: Regional peer comparison
Company Market Cap
(USD) P/E (x)
P/BV (x)
EV/EBITDA (x)
ROCE (%)
ROE (%)
ROA (%)
Esso (Thailand) PCL 1,209.6 10.3 1.9 8.9 24.1 29.9 8.1 BANGCHAK PETROLEUM PCL/THE 1,241.9 8.4 1.1 5.3 7.5 10.3 4.0 Star Petroleum Refining PCL 1,552.1 8.6 1.3 5.6 19.4 20.2 12.7 PETRON CORP 1,784.0 11.3 1.2 7.1 N/A N/A N/A IRPC PCL 2,718.6 9.0 1.1 7.8 8.6 10.8 5.1 Thai Oil PLC 4,111.3 9.8 1.3 6.0 14.5 20.2 9.8 Indorama Ventures PCL 4,444.1 16.0 1.7 9.0 11.1 13.4 5.8 PTT Global Chemicals PCL 7,543.2 9.8 1.0 6.4 8.5 9.0 5.4 S-Oil Corp 7,985.4 8.2 1.3 7.1 N/A 18.2 9.1 Sinopec Shanghai Petrochemicals Co.Ltd 8,145.6 9.5 1.5 7.9 29.7 23.7 15.0 Indian Oil Corporation 20,611.3 8.4 1.4 6.2 11.5 14.3 4.7 Formosa Petrochemical Corp 29,917.3 18.0 3.2 11.9 22.7 24.9 15.8 RELIANCE INDUSTRIES LTD 46,963.6 10.2 1.1 8.0 12.7 10.9 5.0 China Petroleum & Chemical Corp 86,388.4 12.1 0.8 4.6 N/A 5.8 2.5 PetroChina Co.Ltd 188,267.0 18.1 0.7 6.3 0.5 -2.3 0.3 Average
11.2 1.4 7.2 14.2 14.9 7.4
Note: Share price related data as of 18 Nov 2016.
Source: Bloomberg, RHB

Star Petroleum Refining PCL Thailand Initiating Coverage
20 November 2016 Energy | Energy
See important disclosures at the end of this report 5
Financial Analysis
Our assumptions
We have assumed the refinery runs at 99% utilisation rate, with 2019F utilisation rate falling to 85% as it performs a major turnaround. We expect 2017F/2018F market GRM to be at USD7.0 per bbl. This is on the projection that additional demand would outpace refining capacity over the forecasted years. We have not assumed any stock gains or losses for the forecasted years.
Figure 6: SPRC’s major operating variable assumptions
2013 2014 2015 2016F 2017F 2018F
Utilisation rate 100% 86% 100% 99% 99% 99%
Throughput 161 141 165 163 163 163
Market GRM 5.2 6.2 10.4 6.6 7.0 7.0
Stock gains/losses 0.1 (7.6) (2.3) 0.8 - -
Accounting GRM 5.3 (1.5) 8.1 7.4 7.0 7.0
Source: Company data, RHB
Earnings can be quite volatile
SPRC’s reported net profit can be rather volatile. This is mainly due to stock gains/losses. Stripping this out, recurring net profits have in fact improved to a peak of THB12.4bn in 2015 from THB3.4bn in 2013. This large positive swing in earnings was a result of market GRM increasing to a high of USD10.4 per bbl in 2015, although there was a stock loss of USD2.3 per bbl in that year.
We are expecting a more normalised market GRM going forward, at USD7.0 per bbl. As such, we are projecting more normalised recurring net profits of THB6.0-6.5bn for the forecasted period.
Figure 7: More stability as crude oil price moves in a tighter range
Source: Company data, RHB
2013 2014 2015 2016 2017 2018
Recurring net profit 3,453 4,776 12,442 6,061 6,384 6,449
Net profit 3,977 (6,367) 8,227 7,370 6,384 6,449
Stock g/l 144 (12,086) (4,710) 1,309 - -
(15,000)
(10,000)
(5,000)
-
5,000
10,000
15,000
TH
B m
n

Star Petroleum Refining PCL Thailand Initiating Coverage
20 November 2016 Energy | Energy
See important disclosures at the end of this report 6
Financially strong: Low gearing, strong cash flows
SPRC is financially strong, with minimal debt on its balance sheet. It has in total an estimated THB7.1bn in debt for 2016F which by 2017F would be reduced to THB3.4bn, before being fully repaid by 2018F, based on our estimates. Its net debt to equity ratio is expected to be at 0.05x in 2016F, before turning to a net cash position by 2017F.
We anticipate SPRC’s cash flows to remain strong throughout the forecasted period, with cash flow from operations in the range of THB9-10bn. The company has no plans for any major investments during the forecasted period. Its maintenance CAPEX are projected to be around USD20m pa. If it decides on any CAPEX plans, it could possibly occur in 2019, when the refinery is scheduled for a major turnaround. We have not assumed any CAPEX in our forecasts, except for the annual CAPEX of USD20m.
The company’s policy is for a dividend payout ratio of 50%, based on its reported net profit. We expect dividends to normalise at around THB3bn over the forecasted period.
Figure 8: SPRC’s strong cash flows
Source: Company data, RHB
Figure 9: SPRC’s dividend payments for the period 2013-present
Year Period for dividend Declared Payment Declared amount
2013 2012 Jun-13 Jul-13 4,462
2014 2013 Sep-14 Oct-14 1,856
2015 Remaining 2013 Jun-15 Jul-15 1,923
2015 2nd tranche of dividend May-12 Jul-15 5,400
2015 Net effect from change in accounting standard Jul-15 Aug-15 509
2015 1H15 net profit Aug-15 Sep-15 7,031
2016 2H15 net profit Apr-16 May-16 1,144
2016 3rd tranche of dividend May-12 Apr-16 6,027
2016 1H16 Aug-16 Sep-16 2,332
Source: Company data, RHB
(10,000)
(5,000)
-
5,000
10,000
15,000
20,000
25,000
2013 2014 2015 2016 2017 2018
Cashflowsfromopera ons Freecashflow Netchangeincash

Star Petroleum Refining PCL Thailand Initiating Coverage
20 November 2016 Energy | Energy
See important disclosures at the end of this report 7
Commodities Outlook Oil to trade at wider range of USD40-60/bbl in 2017. As sentiment for Organisation of
Petroleum Exporting Countries’ (OPEC) action ebb and flows, we expect crude oil prices to trade in a wider range of USD40-60 per bbl for the rest of 2016 and most of 2017.
OPEC’s decision for an oil production cut or freeze strategy is a double-edged sword in our view, as it would entice more production from higher cost producers. As such, although we are projecting a higher crude oil price average of USD60 per bbl, it would not be a smooth upward trajectory. We are projecting further volatility in 2017.
For our view on crude oil markets, please refer: Regional Oil & Gas: Glimmer Of Hope
Figure 10: Crude oil price expected to average at USD60/bbl in 2017
1Q16 2Q16 3Q16 4Q16F 2016F 2017F 2018F
onwards
RHB (Brent ave) - May 2016 34.5 47.5 50.0 50.0 45.5 60.0 60.0
Bloomberg, QTD/YTD actual 34.5 46.0 45.8 48.3 43.5
Bloomberg - cons Oct 2016 34.0 41.3 44.0 49.6 44.8 54.6 59.8
Bloomberg - cons May 2016 38.9 43.0 46.5 40.6 54.0 61.0
Source: Bloomberg, US Energy Information Administration (EIA), RHB
2017 outlook seems much brighter
Refinery: Markets set to tighten, with tighter supply and robust demand. Next year,
refining margins look set to improve, with net additional refining capacity at 672,000bpd compared to additional demand of 1,200,000bpd. In terms of products (on a global basis):
i. Gasoline demand is expected to outpace supply, with a deficit of 148,000bpd, with additional demand and supply at 479,000bpd and 331,000bpd respectively;
ii. Diesel demand is expected to be in supply deficit of 193,000bpd, with additional demand and supply at 424,000bpd and 231,000bpd respectively;
iii. Jet and kerosene are expected to be in supply deficit of 116,000bpd, with additional demand and supply at 229,000bpd and 113,000bpd respectively;
iv. Fuel oil is demand is expected to outpace supply by 144,000bpd.
We have assumed market GRM of USD7.0 per bbl for 2017, down from our 2016
expectations of c.USD7.5 per bbl. We expect further volatility ahead for the oil markets, with OPEC trying to rebalance the market and US President-elect, Donald Trump’s energy policies – both of which could provide upside and downside for oil markets, in our opinion.
Figure 11: Additional demand set to outpace net additional supply
Source: TOP,FACT, Reuters

Star Petroleum Refining PCL Thailand Initiating Coverage
20 November 2016 Energy | Energy
See important disclosures at the end of this report 8
Figure 12: Products market set to tighten in 2017F
Source: TOP, FACT, JBC
Company Background SPRC was founded in 1992 and is the fifth largest refinery in Thailand. It was listed on the Stock Exchange of Thailand (SET) on 8 Dec 2015, at an IPO price of THB9.00 per share. Pre-IPO, Chevron SAH held a 64% stake, with PTT holding 36% stake. The current major shareholders are Chevron SAH holding 60.56% and PTT holding 5.41%.
With Chevron being its major shareholder, SPRC is able to access the global crude trading organisation with bargaining power for crude purchases, tap into a well-established network of crude oil sources, benefit from proprietary technology and research as well as refinery optimisation expertise.
SPRC’s primary products are gasoline, jet fuel and diesel. It has a total capacity of 165,000bpd and supplies 13% of the refining capacity in Thailand. SPRC aspires to be the guiding star for the ASEAN energy sector, through best practises in all areas via maximising value from available resources, uncompromising approach to safety and to take into consideration the interests of all stakeholders and the environment.
Chevron SAH and PTT’s one-year lock up period will end on 8 Dec 2016, after which both companies would be able to sell their respective stakes in the market, should they wish to do so. Chevron’s strategy is to maximise earnings from its downstream refineries as much as possible, as its upstream business is not expected to perform over the next couple of years. As such, we do not believe Chevron SAH would divest its shares in this refinery.
We also do not believe PTT would sell out its stake in SPRC as:
i. It currently holds only a minority stake in SPRC, given that the directive from the Government was for PTT to divest out of refineries, so that it would not be viewed as a monopoly;
ii. We believe PTT does not need cash at the moment.
However, should PTT decide to sell its stake, this may put pressure on SPRC’s share price – at which point, we believe investors should take the opportunity to accumulate this stock for its attractive dividend yields.

Star Petroleum Refining PCL Thailand Initiating Coverage
20 November 2016 Energy | Energy
See important disclosures at the end of this report 9
Figure 13: SPRC’s major shareholders Figure 14: Second smallest refinery in Thailand
Source: SET,RHB Source: PTT, RHB
The refinery
SPRC sources 63% of its crude from the Middle East, with domestic crude accounting for 24% of its total intake with the rest coming from the Far East.
In terms of product yield, SPRC produces around 24% gasoline, with diesel accounting for 35% of its product slate. It attempts to minimise LPG and fuel oil production as spreads for these two products are still not attractive. A portion of its fuel oil is upgraded into gasoline through its residue fluidised catalytic cracking unit (RFCCU).
SPRC’s refinery is expected to run at utilisation rates of 98-100% each year, except during a turnaround. The turnaround occurs every five years and lowers utilisation, with maintenance costs varying depending on the type of maintenance required. The last turnaround was in 2014, hence the next turnaround would be in 2019.
Figure 15: SPRC’s crude intake mostly from Middle East Figure 16: SPRC’s refinery product yield
Source: SPRC,RHB Source: SPRC, RHB
61%
5%
1%
33%
Chevron South Asia Holdings Ptd Ltd PTT Pcl ESOP Free float
280 275
215
177 165
120
0
50
100
150
200
250
300
PTTGC Pcl Thai Oil Pcl IRPC Pcl Esso Pcl SPRC Pcl BCP Pcl
kbpd
63%
24%
12%
1%
66%
1%
19% 14%
Middle East Domestic Far East Others
SPRC Industry
24%
4% 7%
35%
12%
18% 20% 21%
12%
43%
4% 0%
Gasoline LPG Jet Diesel Fuel oil Others
SPRC Domestic demand

Star Petroleum Refining PCL Thailand Initiating Coverage
20 November 2016 Energy | Energy
See important disclosures at the end of this report 10
SWOT Analysis
With Chevron as its major shareholder, SPRC is able to access a global network in areas such as crude oil procurement as well as proprietary research and technology
Changes in the landscape of the oil and gas industry could have huge implications on the company’s earnings
Opportunities would be for internal efficiency improvements and possible access to the burgeoning neighbouring countries
The company is in a commodity-based business, which can imply highly volatile earnings
As part of a multinational, SPRC’s need for growth is quite limited
Recommendation Chart
Source: RHB, Bloomberg
Source: RHB, Bloomberg
7.9
8.9
9.9
10.9
11.9
12.9
13.9
Dec-15 Mar-16 Jun-16 Sep-16
Price CloseDate Recommendation Target Price Price
2016-11-19

Star Petroleum Refining PCL Thailand Initiating Coverage
Energy | Energy
11
RHB Guide to Investment Ratings Buy: Share price may exceed 10% over the next 12 months Trading Buy: Share price may exceed 15% over the next 3 months, however longer-term outlook remains uncertain Neutral: Share price may fall within the range of +/- 10% over the next 12 months Take Profit: Target price has been attained. Look to accumulate at lower levels Sell: Share price may fall by more than 10% over the next 12 months Not Rated: Stock is not within regular research coverage
Investment Research Disclaimers
RHB has issued this report for information purposes only. This report is intended for circulation amongst RHB and its affiliates’ clients generally or such
persons as may be deemed eligible by RHB to receive this report and does not have regard to the specific investment objectives, financial situation and
the particular needs of any specific person who may receive this report. This report is not intended, and should not under any circumstances be construed
as, an offer or a solicitation of an offer to buy or sell the securities referred to herein or any related financial instruments.
This report may further consist of, whether in whole or in part, summaries, research, compilations, extracts or analysis that has been prepared by RHB’s
strategic, joint venture and/or business partners. No representation or warranty (express or implied) is given as to the accuracy or completeness of such
information and accordingly investors should make their own informed decisions before relying on the same.
This report is not directed to, or intended for distribution to or use by, any person or entity who is a citizen or resident of or located in any locality, state,
country or other jurisdiction where such distribution, publication, availability or use would be contrary to the applicable laws or regulations. By accepting
this report, the recipient hereof (i) represents and warrants that it is lawfully able to receive this document under the laws and regulations of the jurisdiction
in which it is located or other applicable laws and (ii) acknowledges and agrees to be bound by the limitations contained herein. Any failure to comply with
these limitations may constitute a violation of applicable laws.
All the information contained herein is based upon publicly available information and has been obtained from sources that RHB believes to be reliable and
correct at the time of issue of this report. However, such sources have not been independently verified by RHB and/or its affiliates and this report does not
purport to contain all information that a prospective investor may require. The opinions expressed herein are RHB’s present opinions only and are subject
to change without prior notice. RHB is not under any obligation to update or keep current the information and opinions expressed herein or to provide the
recipient with access to any additional information. Consequently, RHB does not guarantee, represent or warrant, expressly or impliedly, as to the
adequacy, accuracy, reliability, fairness or completeness of the information and opinion contained in this report. Neither RHB (including its officers,
directors, associates, connected parties, and/or employees) nor does any of its agents accept any liability for any direct, indirect or consequential losses,
loss of profits and/or damages that may arise from the use or reliance of this research report and/or further communications given in relation to this report.
Any such responsibility or liability is hereby expressly disclaimed.
Whilst every effort is made to ensure that statement of facts made in this report are accurate, all estimates, projections, forecasts, expressions of opinion
and other subjective judgments contained in this report are based on assumptions considered to be reasonable and must not be construed as a
representation that the matters referred to therein will occur. Different assumptions by RHB or any other source may yield substantially different results
and recommendations contained on one type of research product may differ from recommendations contained in other types of research. The
performance of currencies may affect the value of, or income from, the securities or any other financial instruments referenced in this report. Holders of
depositary receipts backed by the securities discussed in this report assume currency risk. Past performance is not a guide to future performance. Income
from investments may fluctuate. The price or value of the investments to which this report relates, either directly or indirectly, may fall or rise against the
interest of investors.
This report does not purport to be comprehensive or to contain all the information that a prospective investor may need in order to make an investment
decision. The recipient of this report is making its own independent assessment and decisions regarding any securities or financial instruments referenced
herein. Any investment discussed or recommended in this report may be unsuitable for an investor depending on the investor’s specific investment
objectives and financial position. The material in this report is general information intended for recipients who understand the risks of investing in financial
instruments. This report does not take into account whether an investment or course of action and any associated risks are suitable for the recipient. Any
recommendations contained in this report must therefore not be relied upon as investment advice based on the recipient's personal circumstances.
Investors should make their own independent evaluation of the information contained herein, consider their own investment objective, financial situation
and particular needs and seek their own financial, business, legal, tax and other advice regarding the appropriateness of investing in any securities or the
investment strategies discussed or recommended in this report.
This report may contain forward-looking statements which are often but not always identified by the use of words such as “believe”, “estimate”, “intend”
and “expect” and statements that an event or result “may”, “will” or “might” occur or be achieved and other similar expressions. Such forward-looking
statements are based on assumptions made and information currently available to RHB and are subject to known and unknown risks, uncertainties and
other factors which may cause the actual results, performance or achievement to be materially different from any future results, performance or
achievement, expressed or implied by such forward-looking statements. Caution should be taken with respect to such statements and recipients of this

Star Petroleum Refining PCL Thailand Initiating Coverage
Energy | Energy
12
report should not place undue reliance on any such forward-looking statements. RHB expressly disclaims any obligation to update or revise any forward-
looking statements, whether as a result of new information, future events or circumstances after the date of this publication or to reflect the occurrence of
unanticipated events.
The use of any website to access this report electronically is done at the recipient’s own risk, and it is the recipient’s sole responsibility to take precautions
to ensure that it is free from viruses or other items of a destructive nature. This report may also provide the addresses of, or contain hyperlinks to,
websites. RHB takes no responsibility for the content contained therein. Such addresses or hyperlinks (including addresses or hyperlinks to RHB own
website material) are provided solely for the recipient’s convenience. The information and the content of the linked site do not in any way form part of this
report. Accessing such website or following such link through the report or RHB website shall be at the recipient’s own risk.
This report may contain information obtained from third parties. Third party content providers do not guarantee the accuracy, completeness, timeliness or
availability of any information and are not responsible for any errors or omissions (negligent or otherwise), regardless of the cause, or for the results
obtained from the use of such content. Third party content providers give no express or implied warranties, including, but not limited to, any warranties of
merchantability or fitness for a particular purpose or use. Third party content providers shall not be liable for any direct, indirect, incidental, exemplary,
compensatory, punitive, special or consequential damages, costs, expenses, legal fees, or losses (including lost income or profits and opportunity costs) in
connection with any use of their content.
The research analysts responsible for the production of this report hereby certifies that the views expressed herein accurately and exclusively reflect his or
her personal views and opinions about any and all of the issuers or securities analysed in this report and were prepared independently and autonomously.
The research analysts that authored this report are precluded by RHB in all circumstances from trading in the securities or other financial instruments
referenced in the report, or from having an interest in the company(ies) that they cover.
RHB and/or its affiliates and/or their directors, officers, associates, connected parties and/or employees, may have, or have had, interests in the securities
or qualified holdings, in subject company(ies) mentioned in this report or any securities related thereto and may from time to time add to or dispose of, or
may be materially interested in, any such securities. Further, RHB and/or its affiliates may have, or have had, business relationships with the subject
company(ies) mentioned in this report and may from time to time seek to provide investment banking or other services to the subject company(ies)
referred to in this research report. As a result, investors should be aware that a conflict of interest may exist.
The contents of this report is strictly confidential and may not be copied, reproduced, published, distributed, transmitted or passed, in whole or in part, to
any other person without the prior express written consent of RHB and/or its affiliates. This report has been delivered to RHB and its affiliates’ clients for
information purposes only and upon the express understanding that such parties will use it only for the purposes set forth above. By electing to view or
accepting a copy of this report, the recipients have agreed that they will not print, copy, videotape, record, hyperlink, download, or otherwise attempt to
reproduce or re-transmit (in any form including hard copy or electronic distribution format) the contents of this report. RHB and/or its affiliates accepts no
liability whatsoever for the actions of third parties in this respect.
The contents of this report are subject to copyright. Please refer to Restrictions on Distribution below for information regarding the distributors of this
report. Recipients must not reproduce or disseminate any content or findings of this report without the express permission of RHB and the distributors.
The securities mentioned in this publication may not be eligible for sale in some states or countries or certain categories of investors. The recipient of this
report should have regard to the laws of the recipient’s place of domicile when contemplating transactions in the securities or other financial instruments
referred to herein. The securities discussed in this report may not have been registered in such jurisdiction. Without prejudice to the foregoing, the
recipient is to note that additional disclaimers, warnings or qualifications may apply based on geographical location of the person or entity receiving this
report.
RESTRICTIONS ON DISTRIBUTION
Malaysia
This report is issued and distributed in Malaysia by RHB Research Institute Sdn Bhd. The views and opinions in this report are our own as of the date
hereof and is subject to change. If the Financial Services and Markets Act of the United Kingdom or the rules of the Financial Conduct Authority apply to a
recipient, our obligations owed to such recipient therein are unaffected. RHB Research Institute Sdn Bhd has no obligation to update its opinion or the
information in this report.
Thailand
This report is issued and distributed in the Kingdom of Thailand by RHB Securities (Thailand) PCL, a licensed securities company that is authorised by the
Ministry of Finance, regulated by the Securities and Exchange Commission of Thailand and is a member of the Stock Exchange of Thailand. The Thai
Institute of Directors Association has disclosed the Corporate Governance Report of Thai Listed Companies made pursuant to the policy of the Securities
and Exchange Commission of Thailand. RHB Securities (Thailand) PCL does not endorse, confirm nor certify the result of the Corporate Governance
Report of Thai Listed Companies.

Star Petroleum Refining PCL Thailand Initiating Coverage
Energy | Energy
13
Indonesia
This report is issued and distributed in Indonesia by PT RHB Securities Indonesia. This research does not constitute an offering document and it should
not be construed as an offer of securities in Indonesia. Any securities offered or sold, directly or indirectly, in Indonesia or to any Indonesian citizen or
corporation (wherever located) or to any Indonesian resident in a manner which constitutes a public offering under Indonesian laws and regulations must
comply with the prevailing Indonesian laws and regulations.
Singapore
This report is issued and distributed in Singapore by RHB Research Institute Singapore Pte Ltd and it may only be distributed in Singapore to accredited
investors, expert investors and institutional investors as defined in the Financial Advisers Regulations and the Securities and Futures Act (Chapter 289), as
amended from time to time. By virtue of distribution to these categories of investors, RHB Research Institute Singapore Pte Ltd and its representatives are
not required to comply with Section 36 of the Financial Advisers Act (Chapter 110) (Section 36 relates to disclosure of RHB Research Institute Singapore
Pte Ltd ’s interest and/or its representative's interest in securities). Recipients of this report in Singapore may contact RHB Research Institute Singapore
Pte Ltd in respect of any matter arising from or in connection with the report.
Hong Kong
This report is issued and distributed in Hong Kong by RHB Securities Hong Kong Limited (興業金融證券有限公司) (CE No.: ADU220) (“RHBSHK”) which is
licensed in Hong Kong by the Securities and Futures Commission for Type 1 (dealing in securities) and Type 4 (advising on securities) regulated activities.
Any investors wishing to purchase or otherwise deal in the securities covered in this report should contact RHB Securities Hong Kong Limited.
United States
This report was prepared by RHB and is being distributed solely and directly to “major” U.S. institutional investors as defined under, and pursuant to, the
requirements of Rule 15a-6 under the U.S. Securities and Exchange Act of 1934, as amended (the “Exchange Act”). RHB is not registered as a broker-
dealer in the United States and does not offer brokerage services to U.S. persons. Any order for the purchase or sale of the securities discussed herein
that are listed on Bursa Malaysia Securities Berhad must be placed with and through Auerbach Grayson (“AG”). Any order for the purchase or sale of all
other securities discussed herein must be placed with and through such other registered U.S. broker-dealer as appointed by RHB from time to time as
required by the Exchange Act Rule 15a-6.
This report is confidential and not intended for distribution to, or use by, persons other than the recipient and its employees, agents and advisors, as
applicable.
Additionally, where research is distributed via Electronic Service Provider, the analysts whose names appear in this report are not registered or qualified
as research analysts in the United States and are not associated persons of Auerbach Grayson AG or such other registered U.S. broker-dealer as
appointed by RHB from time to time and therefore may not be subject to any applicable restrictions under Financial Industry Regulatory Authority
(“FINRA”) rules on communications with a subject company, public appearances and personal trading.
Investing in any non-U.S. securities or related financial instruments discussed in this research report may present certain risks. The securities of non-U.S.
issuers may not be registered with, or be subject to the regulations of, the U.S. Securities and Exchange Commission. Information on non-U.S. securities
or related financial instruments may be limited. Foreign companies may not be subject to audit and reporting standards and regulatory requirements
comparable to those in the United States.
The financial instruments discussed in this report may not be suitable for all investors.
Transactions in foreign markets may be subject to regulations that differ from or offer less protection than those in the United States.
OWNERSHIP AND MATERIAL CONFLICTS OF INTEREST
Malaysia
RHB does not have qualified shareholding (1% or more) in the subject company (ies) covered in this report except for:
a) -
RHB and/or its subsidiaries are not liquidity providers or market makers for the subject company (ies) covered in this report except for:
a) -
RHB and/or its subsidiaries have not participated as a syndicate member in share offerings and/or bond issues in securities covered in this report in the
last 12 months except for:
a) -
RHB has not provided investment banking services to the company/companies covered in this report in the last 12 months except for:
a) -

Star Petroleum Refining PCL Thailand Initiating Coverage
Energy | Energy
14
Thailand
RHB Securities (Thailand) PCL and/or its directors, officers, associates, connected parties and/or employees, may have, or have had, interests and/or
commitments in the securities in subject company(ies) mentioned in this report or any securities related thereto. Further, RHB Securities (Thailand) PCL
may have, or have had, business relationships with the subject company(ies) mentioned in this report. As a result, investors should exercise their own
judgment carefully before making any investment decisions.
Indonesia
PT RHB Securities Indonesia is not affiliated with the subject company(ies) covered in this report both directly or indirectly as per the definitions of
affiliation above.
Pursuant to the Capital Market Law (Law Number 8 Year 1995) and the supporting regulations thereof, what constitutes as affiliated parties are as follows:
1. Familial relationship due to marriage or blood up to the second degree, both horizontally or vertically;
2. Affiliation between parties to the employees, Directors or Commissioners of the parties concerned;
3. Affiliation between 2 companies whereby one or more member of the Board of Directors or the Commissioners are the same;
4. Affiliation between the Company and the parties, both directly or indirectly, controlling or being controlled by the Company;
5. Affiliation between 2 companies which are controlled, directly or indirectly, by the same party; or
6. Affiliation between the Company and the main Shareholders.
PT RHB Securities Indonesia is not an insider as defined in the Capital Market Law and the information contained in this report is not considered as insider
information prohibited by law.
Insider means:
a. a commissioner, director or employee of an Issuer or Public Company;
b. a substantial shareholder of an Issuer or Public Company;
c. an individual, who because of his position or profession, or because of a business relationship with an Issuer or Public Company, has access to
inside information; and
d. an individual who within the last six months was a Person defined in letters a, b or c, above.
Singapore
RHB Research Institute Singapore Pte Ltd and/or its subsidiaries and/or associated companies do not make a market in any securities covered in this
report, except for:
(a) -
The staff of RHB Research Institute Singapore Pte Ltd and its subsidiaries and/or its associated companies do not serve on any board or trustee positions
of any issuer whose securities are covered in this report, except for:
(a) -
RHB Research Institute Singapore Pte Ltd and/or its subsidiaries and/or its associated companies do not have and have not within the last 12 months had
any corporate finance advisory relationship with the issuer of the securities covered in this report or any other relationship (including a shareholding of 1%
or more in the securities covered in this report) that may create a potential conflict of interest, except for:
(a) -
Hong Kong
RHBSHK or any of its group companies may have financial interests in in relation to an issuer or a new listing applicant (as the case may be) the securities
in respect of which are reviewed in the report, and such interests aggregate to an amount equal to or more than (a) 1% of the subject company’s market
capitalization (in the case of an issuer as defined under paragraph 16 of the Code of Conduct for Persons Licensed by or Registered with the Securities
and Futures Commission (the “Code of Conduct”); and/or (b) an amount equal to or more than 1% of the subject company’s issued share capital, or issued
units, as applicable (in the case of a new listing applicant as defined in the Code of Conduct). Further, the analysts named in this report or their associates
may have financial interests in relation to an issuer or a new listing applicant (as the case may be) in the securities which are reviewed in the report.

Star Petroleum Refining PCL Thailand Initiating Coverage
Energy | Energy
15
RHBSHK or any of its group companies may make a market in the securities covered by this report.
RHBSHK or any of its group companies may have analysts or their associates, individual(s) employed by or associated with RHBSHK or any of its group
companies serving as an officer of the company or any of the companies covered by this report.
RHBSHK or any of its group companies may have received compensation or a mandate for investment banking services to the company or any of the
companies covered by this report within the past 12 months.
Note: The reference to “group companies” above refers to a group company of RHBSHK that carries on a business in Hong Kong in (a) investment
banking; (b) proprietary trading or market making; or (c) agency broking, in relation to securities listed or traded on The Stock Exchange of Hong Kong
Limited.
Kuala Lumpur Hong Kong Singapore
RHB Research Institute Sdn Bhd Level 3A, Tower One, RHB Centre
Jalan Tun Razak Kuala Lumpur 50400
Malaysia Tel : +(60) 3 9280 8888 Fax : +(60) 3 9200 2216
RHB Securities Hong Kong Ltd.
12th Floor
World-Wide House 19 Des Voeux Road Central, Hong Kong
Tel : +(852) 2525 1118 Fax : +(852) 2810 0908
RHB Research Institute Singapore
Pte Ltd. 10 Collyer Quay
#09-08 Ocean Financial Centre Singapore 049315
Tel : +(65) 6533 1818 Fax : +(65) 6532 6211
Jakarta Shanghai Bangkok
PT RHB Securities Indonesia
Wisma Mulia, 20th Floor Jl. Jenderal Gatot Subroto No. 42
Jakarta 12710, Indonesia Tel : +(6221) 2783 0888 Fax : +(6221) 2783 0777
RHB (China) Investment Advisory Co. Ltd.
Suite 4005, CITIC Square 1168 Nanjing West Road
Shanghai 20041 China
Tel : +(8621) 6288 9611 Fax : +(8621) 6288 9633
RHB Securities (Thailand) PCL
10th Floor, Sathorn Square Office Tower 98, North Sathorn Road, Silom
Bangrak, Bangkok 10500 Thailand
Tel: +(66) 2 862 9999 Fax : +(66) 2 862 9799
Thai Institute of Directors Association (IOD) – Corporate Governance Report Rating 2015
Excellent ADVANC CPN GRAMMY KBANK MCOT PS RATCH SCB THCOM WACOAL BAFS DRT HANA KCE MINT PSL ROBINS SCC TISCO BCP DTAC HMPRO KKP MONO PTT SAMART SE-ED TKT BIGC DTC INTUCH KTB NKI PTTEP SAMTEL SIM TMB BTS EASTW IRPC LHBANK PHOL PTTGC SAT SNC TOP CK EGCO IVL LPN PPS QTC SC SPALI VGI
Very Good AAV BBL COL HEMRAJ MC PG SCG SST THIP TPC TWS ACAP BDMS CPF HOTPOT MEGA PJW SEAFCO STA THRE TPCORP UAC AGE BECL CPI HYDRO MFEC PM SFP STEC THREL TRC UT AHC BKI CSL ICC NBC PPP SIAM SVI TICON TRU UV AKP BLA DCC ICHI NCH PR SINGER SWC TIP TRUE VNT AMATA BMCL DELTA INET NINE PRANDA SIS SYMC TIPCO TSC WAVE ANAN BOL DEMCO IRC NSI PREB SITHAI SYNTEC TK TSTE WINNER AOT BROOK ECF KSL NTV PT SMK TASCO TKS TSTH YUASA APCS BWG EE KTC OCC PTG SMPC TBSP TMI TTA ZMICO ARIP CENTEL ERW LANNA OGC Q-CON SMT TCAP TMILL TTCL ASIMAR CFRESH GBX LH OISHI QH SNP TF TMT TTW ASK CHO GC LOXLEY OTO RS SPI TGCI TNDT TU ASP CIMBT GFPT LRH PAP S&J SSF THAI TNITY TVD BANPU CM GLOBAL MACO PDI SABINA SSI THANA TNL TVO BAY CNT GUNKUL MBK PE SAMCO SSSC THANI TOG TWFP* * On Oct 1,2015 TWFP TWFP merged with TWS resulting in a new company, TWPC
Good 2S AS CBG DNA GCAP ITD LHK MK PATO PTL SEAOIL STPI AEC ASIA CGD EARTH GENCO JSP LIT MODERN PB PYLON SIRI SUC AEONTS AUCT CHG EASON GL JTS LIVE MOONG PCA QLT SKR SUSCO AF AYUD CHOW ECL GLAND JUBILE LST MPG PCSGH RCL SMG SUTHA AH BA CI EFORL GLOW KASET M MSC PDG RICHY SOLAR SYNTEC AIRA BEAUTY CITY ESSO GOLD KBS MAJOR MTI PF RML SORKON TAE AIT BEC CKP FE GYT KCAR MAKRO MTLS PICO RPC SPA TAKUNI AJ BFIT CNS FIRE HTC KGI MATCH NC PL S SPC TCC AKR BH CPALL FOCUS HTECH KKC MATI NOK PLANB SALEE SPCG TCCC AMANAH BIG CPL FORTH IEC KTIS MBKET NUSA PLAT SAPPE SPPT TCJ AMARIN BJC CSC FPI IFEC KWC M-CHAI NWR PPM SAWAD SPVI TEAM AP BJCHI CSP FSMART IFS KYE MFC NYT PRG SCCC SRICHA TFD APCO BKD CSS FSS IHL L&E MILL OCEAN PRIN SCN SSC TFI AQUA BTNC CTW FVC IRCP LALIN MJD PACE PSTC SCP STANLY TIC TIW TPIPL UPF VPO TLUXE TRT UPOIC WHA TMC TSE UREKA WIN TMD TSR UWC XO TOPP UMI VIBHA TPCH UP VIH
IOD (IOD Disclaimer)
การเปิดเผลผลการสํารวจของสมาคมสง่เสริมสถาบนักรรมการบริษัทไทย (IOD) ในเร่ืองการกํากบัดแูลกิจการ (Corporate Governance) นีเ้ป็นการ
ดําเนินการตามนโยบายของสํานกังานคณะกรรมการกํากบัหลกัทรัพย์และตลาดหลกัทรัพย์ โดยการสํารวจของ IOD เป็นการสํารวจและประเมินจากข้อมลูของบรษัทจด
ทะเบียนในตลาดหลกัทรัพย์แหง่ประเทศไทยและตลาดหลกัทรัพย์เอ็มเอไอ ที่มีการเปิดเผยตอ่สาธารณะและเป็นข้อมลูที่ผู้ลงทนุทัว่ไปสามารถเข้าถงึได้ ดงันัน้ผลสํารวจ
ดงักลา่วจงึเป็นการนําเสนอในมมุมองของบคุคลภายนอกโดยไมไ่ด้เป็นการประเมินการปฏิบตัิและมิได้มีการใช้ข้อมลูภายในในการประเมิน
อนึ่ง ผลการสาํรวจดงักลา่ว เป็นผลการสํารวจ ณ วนัที่ปรากฎในรายงานการกํากบัดแูละกิจการบริษัทจดทะเบียนไทยเทา่นัน้ ดงันัน้ผลการสํารวจจงึอาจ
เปลี่ยนแปลงได้ภายหลงัวนัดงักลา่ว ทัง้นีบ้ริษัทหลกัทรัพย์ อาร์เอชบี จํากดั (มหาชน) มิได้ยืนยนัหรือรับรองถึงความถกูต้องของผลการสํารวจดงักลา่วแตอ่ยา่งใด

ขอมูล Anti-Corruption Progress Indicator ของบริษัทจดทะเบียน
ระดบั 1
ACD BAT-3K CCN DTCI HFT LST
NEP PRIN SCN SPPT TCJ TRUBB UPA
AEONTS BIG
CGD
E HTECH
MAJOR
NNCL PSTC
SEAFCO SPVI
TCOAT
TSE UPOIC
AFC BJC
CMR
EMC IHL
MATCH
NWR PYLON
SF STA
TH
TTA UTP
AIRA BLISS
CPH
ESSO ILINK
MAX
OHTL RAM
SHANG STAR
TKS
TTI UVAN
AJ BMCL
CSC
FOCUS ITD
M-CHAI
PICO RICH
SIRI SVH
TNH
TTL VARO
ALUCON BOL
CSP
FSMART JSP
MDX
PK RS
SMART SVOA
TNPC
TTTM VI
AMC BRR
CTW
GIFT KDH
MIDA
PL SANKO
SMM SWC
TPA
TWP VIBHA
AQUA BSBM
DCON
GLAND KTIS
ML
PPM SAUCE
SOLAR TAPAC
TPAC
TWZ VIH
ARIP CBG
DRACO
GRAND KTP
MPIC
PRAKIT SAWAD
SPACK TC
TPOLY
U VTE
AUCT CCET
DSGT
GUNKUL LEE
NC
PRECHA SAWANG
SPG TCCC
TRC
UMS WG
ระดบั 2 2S
ABICO
AF
AKP
AMARIN
AMATA
AOT
APCO
AYUD
BEAUTY
BFIT BH BKD BLAND BTNC CCP CI CSR CSS EFORL
EPCO FE FNS FVC GEL GLOBAL HEMRAJ IEC IFS INET
JUTHA KASET KCAR KKC KSL L&E LALIN LTX M MALEE MBK MBKET MEGA MK MPG MTLS NCH NCL NPP OCC
OCEAN PB PCA PRINC QH ROCK RPC S & J SGP SIAM
SIS SKR SMG SMIT SORKON SUSCO TAKUNI TEAM TF TIC TIP TIPCO TMC TMI TPP TRT TRU TRUE TSC TSI
TTW TVD TVO UKEM UNIQ UWC VNG WIIK WIN XO
ระดบั 3A ABC
ACAP
ADVANC
AEC
AGE
AH
AIE
AMANAH
ANAN
AP
APCS APURE AS ASIA ASIAN ASIMAR BIGC BROOK BTS BWG
CEN CENTEL CFRESH CHARAN CHO CHOTI CM CNT COL CPALL CPF CPI CPL DELTA DEMCO DIMET DNA DTAC EA ECF
EE EVER FPI GBX GC GFPT GLOW HMPRO HOTPOT ICC
ICHI IFEC INOX INSURE IRC JAS JTS JUBILE KC KTC KYE LHK LPN LRH MAKRO MC MCOT MFC MFEC MINT
MJD MONO MOONG NBC NDR NINE NMG NSI NTV OGC
PACE PCSGH PDI PG PHOL PLAT PPS PR PRANDA PREB PS QLT RATCH RML ROBINS ROJNA RWI SAMCO SCCC SCG
SEAOIL SE-ED SENA SINGER SITHAI SMK SMPC SPALI SPC SPCG
SPI SRICHA SSI STANLY SUPER SVI SYMC SYNEX SYNTEC TASCO TCMC TFI THAI THRE THREL TICON TKT TLUXE TMILL TMT TNL VNT
TPCORP WACOAL
TSTE WHA
TSTH ZMICO
TTCL TU TVI UOBKH UREKA VGI

ระดบั 3B AAV
AHC
AI
AIT
AKR
ARROW
ASK
BA
BDMS
BEC
BECL BJCHI BUI CGH CHG CHOW CIG CITY CK CKP
COLOR CWT EARTH EASON EPG F&D FANCY FIRE FMT FORTH GENCO GL GOLD GPSC GRAMMY HYDRO IRPC IT JCT KCM
KWC LH LIT LOXLEY MACO MANRIN MATI MODERN MSC NOBLE
NOK NPK NUSA OISHI OTO PAF PAP PATO PF PJW PLANB PLE POLAR PRG PTL Q-CON QTC RCI S11 SALEE
SAM SAMART SAMTEL SAPPE SC SCP SFP SIM SLP SMT
SPA SPORT SSC SST STEC STPI SUC SUTHA T TAE TBSP TCC TFD TGCI TGPRO THANA THIP TIW TK TMW
TNDT TOPP TPC TPCH TPIPL TSR TT TYCN UAC UBIS
UEC UMI UP UPF UT UV VPO WAVE WINNER YUASA
ระดบั 4 ASP
BAFS
BANPU
BAY
BBL
BKI
BLA
CIMBT
CNS
CSL
DCC DRT DTC EASTW ECL EGCO ERW FSS GCAP HANA
HTC INTUCH IRPC IVL KBANK KCE KGI KKP KTB LANNA LHBANK MTI NKI PSL PTG PTTEP SABINA SCB SNC SNP
SSF SSSC TCAP THCOM TISCO TMB TMD TNITY TOG
ระดบั 5 BCP
CPN
GYT
PE
PM
PPP
PT
PTT
PTTGC
SAT
SCC THANI TOP
ไมเปดเผยหรือไมมีนโยบาย
A ACC AJD AQ BCH BGT BROCK BSM BTC CHUO
CPR CRANE EIC FER JMART JMT KAMART KBS KIAT LDC
MBAX MCS METCO NEW NEWS NYT PAE PDG PERM PMTA POST RCL RICHY ROH S SIMAT TCB TR TSF TVT
WORK
หมายเหต ุ
ระดับ 1: มีนโยบาย ระดับ 2: ประกาศเจตนารมณ ระดับ 3: มีมาตรการปองกัน ซ่ึงทั้ง 2 กรณี ถือเปนผลการประเมินในระดับเดียวกัน 3A: บริษัทมีการประกาศเจตนารมณเขารวมโครงการ CAC หรือภาค 3B: บริษัทมีคํามั่นและนโยบายของบริษัท แตมิไดประกาศเจตนารมณเขารวมโครงการ CAC หรือภาค ระดับ 4: ไดรับการรับรอง ระดับ 5: ขยายผลสูผูที่เกี่ยวของ