star viirs sdr calval overview · star viirs sdr calval overview quanhua (mark) liu, slawomir...
TRANSCRIPT

STAR VIIRS SDR CalVal Overview
Quanhua (Mark) Liu, Slawomir Blonski, and Changyong Cao
with contributions from Fuzhong Weng, Sirish Uprety, Scott Hu,
Dave Pogorzala, Sean Shao, and Yan Bai
April 5, 2012
2
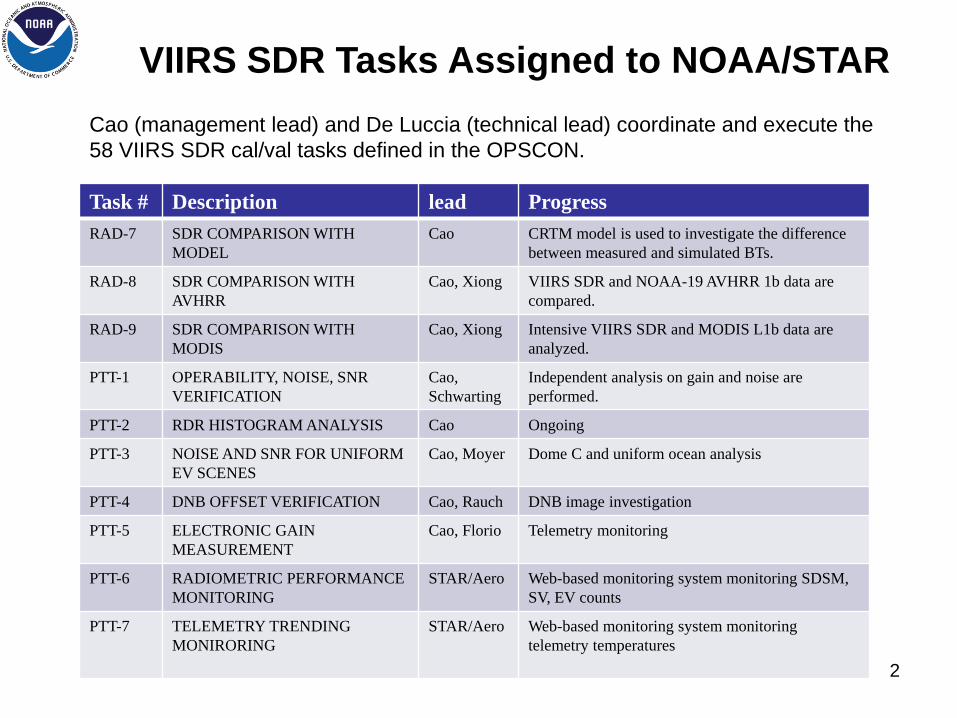
VIIRS SDR Tasks Assigned to NOAA/STAR
Task # Description lead Progress
RAD-7 SDR COMPARISON WITH
MODEL
Cao CRTM model is used to investigate the difference
between measured and simulated BTs.
RAD-8 SDR COMPARISON WITH
AVHRR
Cao, Xiong VIIRS SDR and NOAA-19 AVHRR 1b data are
compared.
RAD-9 SDR COMPARISON WITH
MODIS
Cao, Xiong Intensive VIIRS SDR and MODIS L1b data are
analyzed.
PTT-1 OPERABILITY, NOISE, SNR
VERIFICATION
Cao,
Schwarting
Independent analysis on gain and noise are
performed.
PTT-2 RDR HISTOGRAM ANALYSIS Cao Ongoing
PTT-3 NOISE AND SNR FOR UNIFORM
EV SCENES
Cao, Moyer Dome C and uniform ocean analysis
PTT-4 DNB OFFSET VERIFICATION Cao, Rauch DNB image investigation
PTT-5 ELECTRONIC GAIN
MEASUREMENT
Cao, Florio Telemetry monitoring
PTT-6 RADIOMETRIC PERFORMANCE
MONITORING
STAR/Aero Web-based monitoring system monitoring SDSM,
SV, EV counts
PTT-7 TELEMETRY TRENDING
MONIRORING
STAR/Aero Web-based monitoring system monitoring
telemetry temperatures
Cao (management lead) and De Luccia (technical lead) coordinate and execute the
58 VIIRS SDR cal/val tasks defined in the OPSCON.
RAD-7: SDR Comparison with Model
Objective:
To perform a qualitative evaluation of top-of-atmosphere (TOA)
radiances from select scenes.
Methods and Tools: Use VIIRS SDR, ECMWF inputs and CRTM
Results and Recommendations:
Measurements and CRTM simulations for the VIIRS thermal bands
agree well. CRTM is powerful for determining the root cause of
M12 striping during daytime.
The VIIRS measurements and the CRTM simulations on M6 and M7
are needed.

4
VIIRS and CRTM Modeling for M12 Striping
Investigation (RAD-7)
The STAR team applied the CRTM to simulate the VIIRS SDR data.
It is found that the M12 striping reported by the SST EDR team is
caused by the difference in VIIRS azimuth angles among detectors.
M1, M4, and M11 measured
(R-Rm)/Rm *100

Detector # BRDF A B R
Brightness temperature
1 0.73685 80.368 0.04253 0.51055 0.10590 0.61645 302.666
2 0.73649 80.543 0.04309 0.50923 0.10717 0.61641 302.648
3 0.73700 80.717 0.04365 0.51022 0.10873 0.61894 302.738
4 0.73645 80.892 0.04422 0.50964 0.10999 0.61962 302.769
5 0.73705 81.066 0.04479 0.51114 0.11159 0.62273 302.871
6 0.73628 81.241 0.04537 0.51147 0.11280 0.62427 302.931
7 0.73701 81.415 0.04596 0.51164 0.11448 0.62612 302.987
8 0.73596 81.589 0.04656 0.51074 0.11566 0.62640 303.020
9 0.73673 81.764 0.04715 0.51175 0.11739 0.62914 303.115
10 0.73557 81.938 0.04776 0.51124 0.11855 0.62978 303.153
11 0.73641 82.113 0.04837 0.51120 0.12036 0.63157 303.230
12 0.73509 82.287 0.04901 0.51134 0.12155 0.63289 303.316
13 0.73562 82.461 0.04962 0.51180 0.12325 0.63505 303.396
14 0.73486 82.636 0.05026 0.51057 0.12461 0.63518 303.417
15 0.73526 82.810 0.05089 0.50993 0.12629 0.63622 303.439
16 0.73565 82.985 0.05154 0.50998 0.12812 0.63810 303.560
)(),,()()cos(])1()()[( 0__ satsatsunsatsunsunsunuatmdatmssat BRDFFRRTBR
sat)( sat
A B
Detailed CRTM Calculation for the striping
(RAD-7)
5

RAD-8: SDR Comparison with AVHRR
Objective:
To compare VIIRS retrieved TOA radiance with AVHRR retrieved
TOA radiance.
Methods and Tools:
Use SNO orbit prediction, VIIRS SDR, and AVHRR 1b readers and data, statistical tools.
Results and Recommendations:
VIIRS and AVHRR TEBs agree (~ 0.3 K). VIIRS and AVHRR RSB agree with the slope. Large bias in RSB needs to be further investigated.

VIIRS and AVHRR SNO Comparison (RAD-8)
M5 (0.64 µm)
Total ROI :
161
Bias: 18.6% +/- 1.2%
Y= 1.1458 * X + 0.028
Res. Stdev.: 0.0058
Y= 1.324 * X + 0.028
Res. Stdev.: 0.011
Total ROI :
145
Bias: 28.9% +/- 1.7%
M7 (0.86 µm)
• Bias=(VIIRS-AVHRR)*100%/VIIRS
• Spectrally Induced Bias at Libya Ch1: 9.69% +/- 0.306% Ch2: 15.14% +/- 2.37%
• The actual bias for AVHRR Ch1 is 8.9% and for Ch2 is 13.7%.
• Large bias for channel 1 could be due to calibration issue whereas for channel 2, it could be due to water vapor absorption.
Note: the spectrally induced bias for channel 2 (given above) was calculated at NOAA-Libya site whereas this SNOx comparison is performed at different location in Africa. Thus water vapor variability might be much different.
7

RAD-9: SDR Comparison with MODIS
Objective:
To compare VIIRS retrieved TOA radiance with MODIS retrieved
TOA radiance.
Methods and Tools: Use SNO orbit prediction, VIIRS SDR, and MODIS readers, and
analysis tools.
Results and Recommendations:
VIIRS and MODIS TEBs agree well by considering the difference in
spectral response between VIIRS and MODIS. VIIRS and MODIS RSB
agree, too.
Further comparisons are necessary for monitoring the VIIRS RSB
degradation.

SNO Prediction and Analysis
NPP and Aqua SNO Example
Index Date (AQUA) Time (AQUA) AQUA Lat,Lon Date (NPP) Time (NPP) NPP Lat,Lon Distance(km) Time Diff (sec)
1 02/12/2012 14:07:39 68.18,-167.05 02/12/2012 14:06:26 68.31,-168.01 42.15 73
2 02/12/2012 14:54:19 -76.97, 18.64 02/12/2012 14:54:19 -76.97, 18.68 1.08 0
3 02/12/2012 15:41:09 81.79,-126.79 02/12/2012 15:42:22 81.33,-126.43 50.45 73
4 02/15/2012 06:21:38 76.25, -35.59 02/15/2012 06:20:45 76.25, -35.60 0.21 53
5 02/15/2012 07:10:43 -77.31, 135.83 02/15/2012 07:11:07 -77.32, 135.89 1.70 24
6 02/17/2012 22:37:58 76.73, 81.90 02/17/2012 22:37:29 76.73, 81.94 1.10 29
7 02/17/2012 23:27:13 -77.31,-108.29 02/17/2012 23:28:02 -77.30,-108.40 2.89 49
8 02/20/2012 14:54:28 76.76,-162.13 02/20/2012 14:54:24 76.75,-162.23 2.77 4
9 02/20/2012 15:43:35 -77.71, 9.21 02/20/2012 15:44:48 -77.70, 9.18 0.76 73
10 02/23/2012 06:21:41 -76.37, 144.76 02/23/2012 06:20:44 -76.37, 144.78 0.54 57
Table of predicted SNOs for the next 14.0 days since TLE Epoch: 2/11/2012
10 E 20 E 30 E 40
E 50
E
60 N
70 N
80 N 180
W 150
W
120 W
9
0 W
6
0 W
30 W
0
30
E
60
E
90
E
120
E
150 E
180 E
90 S
80 S
70 S
60 S
NPP and Terra SNO Example
• Based on information from the NOAA/STAR/NCC SNO
(simultaneous nadir overpass) prediction website,
https://cs.star.nesdis.noaa.gov/NCC/SNOPredictions, included
all SNO datasets acquired by NPP VIIRS and by MODIS from
both Aqua and Terra between February 14 and March 20, 2012
• For each SNO, averaged valid VIIRS and MODIS pixels from a
12-km by 12-km area selected at the intersection of the satellite
ground tracks (16×16 750-m pixels for VIIRS and 12×12 1-km
pixels for MODIS): typically provides closer spatial coincidence
than temporal one (still within ~1-2 min.)
• The NPP – Aqua SNOs occurred over snow-covered Antarctica
(some at the Dome C site), providing bright surfaces in the
VisNIR bands, while the NPP – Terra SNOs occurred over
northern Siberia, Scandinavia, and ocean (both dark and bright
scenes)
MODIS VIIRS

VIIRS vs. MODIS SNO Comparisons (RAD 9)
380 400 420 440 460 480 500 520 540 560 5800
0.2
0.4
0.6
0.8
1
Rela
tive S
pectr
al R
esponse
M1
M2
M3
M4
B8
B9
B3
B10
B11
B12
B4
600 650 700 750 800 850 900 950 10000
0.2
0.4
0.6
0.8
1
Rela
tive S
pectr
al R
esponse
I1
I2
M5
M6
M7
B1
B13
B14
B15
B2
B16B17B18
B19
1000 1500 2000 25000
0.2
0.4
0.6
0.8
1
Wavelength (nm)
Rela
tive S
pectr
al R
esponse
I3
M8
M9
M10
M11
B5
B26
B6
B7
MODIS VIIRS
Spectral
Response
• Compared TOA (top-of-atmosphere) reflectance
measured by VIIRS and MODIS at the SNO sites
(accounts for solar zenith angle differences)
• Because of differences between spectral
responses of VIIRS and MODIS bands,
reflectance data do not match exactly (1:1 line)
• The effect of the spectral response difference on
the measured reflectance (spectral bias) was
recently estimated using satellite hyperspectral
data collected over the Antarctic Dome C site (Cao
et al., submitted for publication)
• Ratios of the VIIRS band M7 and MODIS band 2
data agree very well with the prediction from that
study (Spectral Bias line)
• This comparison confirms accuracy of the current
radiometric calibration for VIIRS band M7, which is
the band the most affected by the mirror
degradation anomaly
• Other VIIRS bands also display high correlation
with MODIS counterparts (next slide): estimates of
spectral biases for these bands are ongoing
• While Terra provides so far most of the low
reflectance data, a small bias between Aqua and
Terra data can be seen (will investigate)
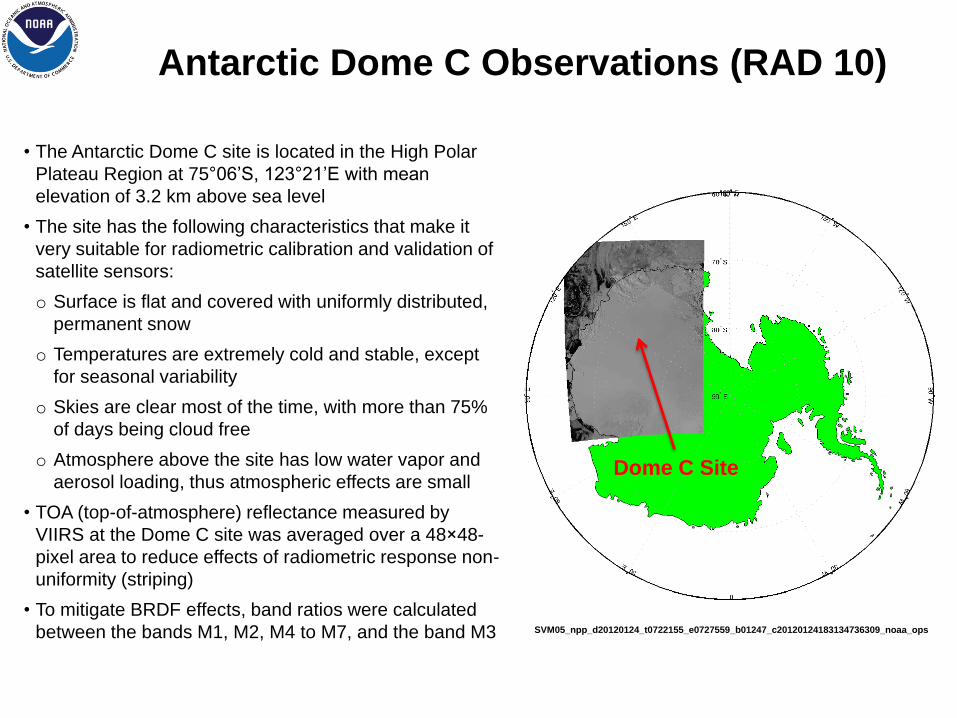
Antarctic Dome C Observations (RAD 10)
• The Antarctic Dome C site is located in the High Polar
Plateau Region at 75°06’S, 123°21’E with mean
elevation of 3.2 km above sea level
• The site has the following characteristics that make it
very suitable for radiometric calibration and validation of
satellite sensors:
o Surface is flat and covered with uniformly distributed,
permanent snow
o Temperatures are extremely cold and stable, except
for seasonal variability
o Skies are clear most of the time, with more than 75%
of days being cloud free
o Atmosphere above the site has low water vapor and
aerosol loading, thus atmospheric effects are small
• TOA (top-of-atmosphere) reflectance measured by
VIIRS at the Dome C site was averaged over a 48×48-
pixel area to reduce effects of radiometric response non-
uniformity (striping)
• To mitigate BRDF effects, band ratios were calculated
between the bands M1, M2, M4 to M7, and the band M3
Dome C Site
SVM05_npp_d20120124_t0722155_e0727559_b01247_c20120124183134736309_noaa_ops

Dome C Solar and NPP VIIRS Geometries
Data points with
solar zenith angle
larger than 75° or
satellite zenith angle
larger than 15° were
excluded from the
analysis

VIIRS vs. MODIS SNO Comparisons (cont.)

• Procedure: – Used both Antarctic and ocean scenes
• Antarctic scenes are usually bright, but near terminator they
may be as dark as ocean scenes
– Selected the most uniform area from each scene • Typically 160×200 pixels
– Averaged radiance values for each row over all
columns in the selected area
– Points for each detector were plotted with different
color
– Periodicity of image profiles tests scene uniformity
– Presented results are only for bands M1 and M2 • More uncertainty in striping analysis for the other VisNIR bands
Image Quality Analysis: Striping (IMG 2)
2011-12-14 8:31 UTC
2012-02-28 6:21 UTC
0 20 40 60 80 100 120 140 160
50.6
50.8
51
51.2
51.4
51.6
51.8
M01
Row#
Radia
nce
[ W
/ (
m2 s
r µ
m )
]
SVM0x_npp_d20120228_t0621411
0 20 40 60 80 100 120 140 16055.4
55.6
55.8
56
56.2
56.4
56.6
56.8
M02
Row#
Radia
nce
[ W
/ (
m2 s
r µ
m )
]
SVM0x_npp_d20120228_t0621411
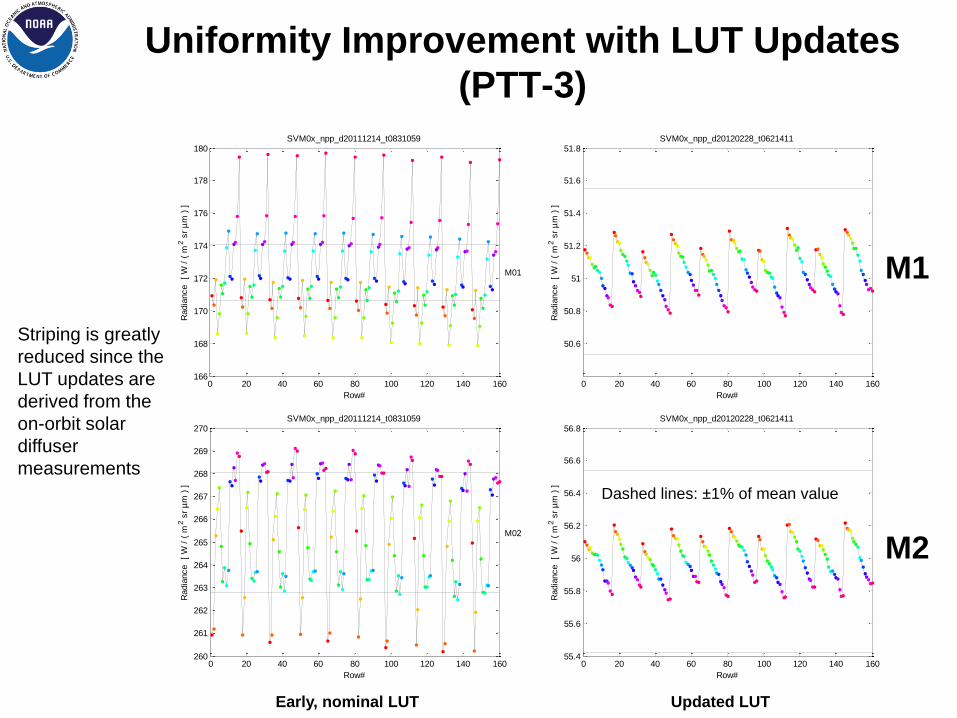
Uniformity Improvement with LUT Updates
(PTT-3)
0 20 40 60 80 100 120 140 160166
168
170
172
174
176
178
180
M01
Row#
Radia
nce
[ W
/ (
m2 s
r µ
m )
]
SVM0x_npp_d20111214_t0831059
0 20 40 60 80 100 120 140 160260
261
262
263
264
265
266
267
268
269
270
M02
Row#
Radia
nce
[ W
/ (
m2 s
r µ
m )
]
SVM0x_npp_d20111214_t0831059
M1
M2
Dashed lines: ±1% of mean value
Early, nominal LUT Updated LUT
Striping is greatly
reduced since the
LUT updates are
derived from the
on-orbit solar
diffuser
measurements

0 20 40 60 80 100 120 14065.2
65.3
65.4
65.5
65.6
65.7
65.8
65.9
66
66.1
66.2
M01
Row#
Radia
nce
[ W
/ (
m2 s
r µ
m )
]
SVM0x_npp_d20120317_t0556524
0 20 40 60 80 100 120 14068.1
68.2
68.3
68.4
68.5
68.6
68.7
68.8
68.9
69
69.1
M01
Row#
Radia
nce
[ W
/ (
m2 s
r µ
m )
]
SVM0x_npp_d20120312_t1300051
0 20 40 60 80 100 120 140 160 18061.8
61.9
62
62.1
62.2
62.3
62.4
62.5
62.6
62.7
62.8
M01
Row#
Radia
nce
[ W
/ (
m2 s
r µ
m )
]
SVM0x_npp_d20120312_t1054548
Striping Dependence on Solar Geometry
(PTT-3)
Northern Hemisphere
0 10 20 30 40 50 60 70 80 90 10058.4
58.5
58.6
58.7
58.8
58.9
59
59.1
59.2
M01
Row#
Radia
nce
[ W
/ (
m2 s
r µ
m )
]
SVM0x_npp_d20120227_t1727511
Southern Hemisphere
Dashed lines: ±0.5% of mean value
• Reversal in detector sensitivity suggests that striping is not caused by imperfect radiometric calibration
• Striping may be due to differences in polarization sensitivity
• If flat-fielding correction is applied, it should be adjusted for each scene
M1
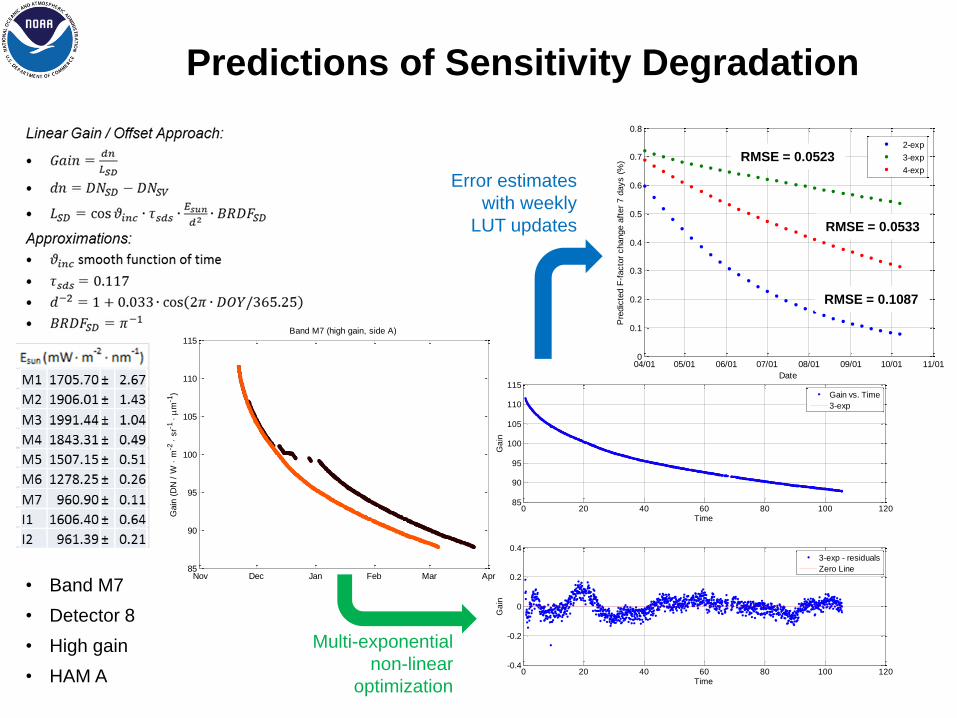
Predictions of Sensitivity Degradation
• Band M7
• Detector 8
• High gain
• HAM A
Nov Dec Jan Feb Mar Apr85
90
95
100
105
110
115
Gain
(D
N /
W
m-2
s
r-1
m-1
)
Band M7 (high gain, side A)
04/01 05/01 06/01 07/01 08/01 09/01 10/01 11/010
0.1
0.2
0.3
0.4
0.5
0.6
0.7
0.8
Date
Pre
dic
ted F
-facto
r change a
fter
7 d
ays (
%)
2-exp
3-exp
4-exp
0 20 40 60 80 100 12085
90
95
100
105
110
115
Time
Ga
in
Gain vs. Time
3-exp
0 20 40 60 80 100 120-0.4
-0.2
0
0.2
0.4
Time
Ga
in
3-exp - residuals
Zero Line
Multi-exponential
non-linear
optimization
Error estimates
with weekly
LUT updates
RMSE = 0.0523
RMSE = 0.0533
RMSE = 0.1087

Monitoring VIIRS Sensitivity Degradation
• Antarctic Dome C data have
shown that VIIRS Earth View
(EV) measurements changed
with time similarly to the onboard
solar diffuser observations
• Changes of radiometric response
are similar both in spectral
dependence and in magnitude:
o The “blue” band M2 is almost
stable
o The “red” band M5 is
moderately affected (~10%
change over 3-4 months)
o The largest decline occurs for
the NIR band M7 (~20%)
• Scaling of earlier measurements
according to calibration
coefficient lookup table (LUT)
changes shows continuity of
radiometric responses
• Weekly LUT updates have
stabilized radiometric responses
starting with LUT 4 (unfortunately
the ending of austral summer
increased uncertainty of recent
Dome C measurements)
PTT-1: Operability, Noise, SNR Verification
Objective:
To verify detector operability, noise, and SNR of all detectors in all
bands and gain states; to verify the absence of artifacts in calibration
view data. Task repeated through the life of the sensor to monitor
performance.
Methods and Tools: Use OBC-IP data, analysis tools for verifying detector operability and
calculating gain, SNR, and noise.
Results and Recommendations:
VIIRS TEBs are stable and preliminary results indicate the
performance better than specification.
There still have margins for RSB.
Monitoring the VIIRS RSB degradation continues.
20
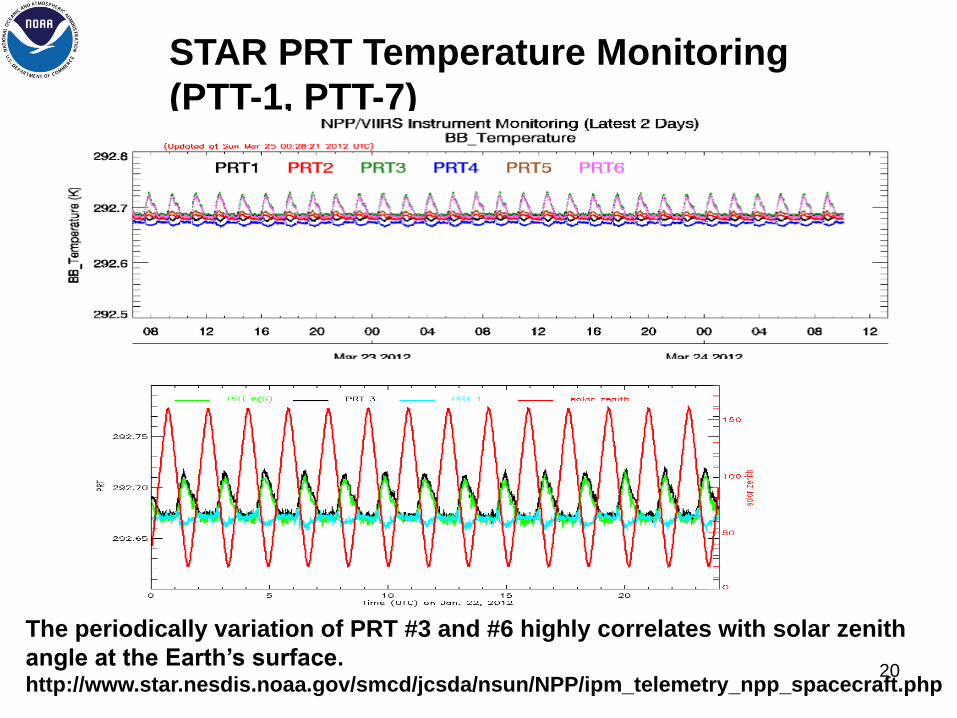
STAR PRT Temperature Monitoring
(PTT-1, PTT-7)
The periodically variation of PRT #3 and #6 highly correlates with solar zenith
angle at the Earth’s surface. http://www.star.nesdis.noaa.gov/smcd/jcsda/nsun/NPP/ipm_telemetry_npp_spacecraft.php

PTT-2: RDR Histogram Analysis
Objective:
To verify normal digitization performance.
Methods and Tools: RDR, SDR extractor, RDR EV Visualization and Analysis,
Accumulate data over multiple orbits to generate histograms in raw
count (digital number; DN) space and then look for under filled and
overfilled DN bins. Results and Recommendations:
Sync scan data loss are identified.
Works on RDR EV visualization are needed.

PTT-3: Noise and SNR for Uniform EV Scene
Objective:
To calculate signal standard deviation from uniform Earth view (EV)
scenes; to evaluate the signal-to-noise ratio (SNR); and to calculate
noise/SNR for calibrator views and at various radiance levels.
Methods and Tools: Use VIIRS, CrIS SDRs, MODIS data, SNO orbit prediction, analysis tools
Results and Recommendations:
Results from Dome-C and uniform ocean scenes show that VIIRS TEBs
have good performance within 0.3 K. The correlation between VIIRS
and MODIS RSB is larger than 0.9.
Double difference (using CRTM) may be useful to remove natural
variation for determining noise and SNR over uniform EV scenes.

23
Radiometric and Geospatial Differences
between VIIRS and MODIS (PTT-3)
After pixel by pixel remapping using
fast GSM, the difference image can
be analyzed for both radiometric
and geospatial differences between
VIIRS and MODIS Differencing image not only shows cloud
movement (within ~10mins), but also
geolocation discrepancies for land features

VIIRS and MODIS Comparison After
Geolocation Error Fixed
cloud movement (within ~10mins), new possibility to derive wind vectors.
18:00, February 25 2012

25
VIIRS and MODIS Comparison (Feb. 25)
(PTT-3)
Bias = MODIS - VIIRS

PTT-4: DNB Offset Verification
Objective:
Verify that DNB offset Algorithm
Support Function (ASF) performs
properly.
Methods and Tools: DNB image and analysis tools
Results and Recommendations:
DNB image quality was investigated and a high quality DNB image was sent to JPSS program office per request.

PTT-5: Electronic Gain Measurement
Objective:
To determine the sensitivity of the electronic gain to variations in
sensor electronic and thermal state.
Methods and Tools: RDR extractor, Calibrator View Visualization and Analysis
Results and Recommendations:
VIIRS 3D visualization model is generated.

PTT-6: Radiometric Performance Monitoring Objective:
To calculate and monitor NedT, S/N, and Gains.
Methods and Tools: OBC-IP reader, VIIRS LUTs, NOAA calibration tools,
long-term monitoring system Results and Recommendations:
NEdT, NEdN, and Gain for VIIRS TEBs are stable. Our RSB gain
parameter also predicted the RSB degradations.
STAR monitoring system provided visualized figures for VIIRS
calibration teams.

PTT-7: Telemetry Trending and Monitoring
Objective:
To monitor telemetry parameters.
Methods and Tools:
OBC-IP reader, VIIRS LUTs, long-term monitoring system Results and Recommendations:
STAR monitoring system provided visualized figures for VIIRS
telemetry parameters.
Black solid and dashed lines are for measured values at HAM A
and B sides. Lines in red are predicted based on single
operational BB temperature (see green triangle).

30
Interactions with Users, SDR and EDR
Teams
•Worked closely with EDR teams (e.g. SST, Ocean Color, fire and
vegetation, etc EDR teams), NCEP, and JCSDA.
•Established and maintained the SDR/EDR web blog on CasaNosa.
•Got help from EDR teams and users, e.g., JCSDA (CRTM model), SST
EDR team (VIIRS BT anomaly during BB WUCD), which led to the finding
of errors in the VIIRS parameter file.
•Supported the EDR teams and our users, for example, we helped JCSDA
correct the error in using VIIRS RSR.

31
RSR-TEB

32
VIIRS and CrIS Brightness Temperature
Comparison CrIS convolved with VIIRS M15 RSR
Golden day Feb. 25, 2012

33
VIIRS and CrIS Comparison
2/25/12
3/18/12
Hong Kong
Macau
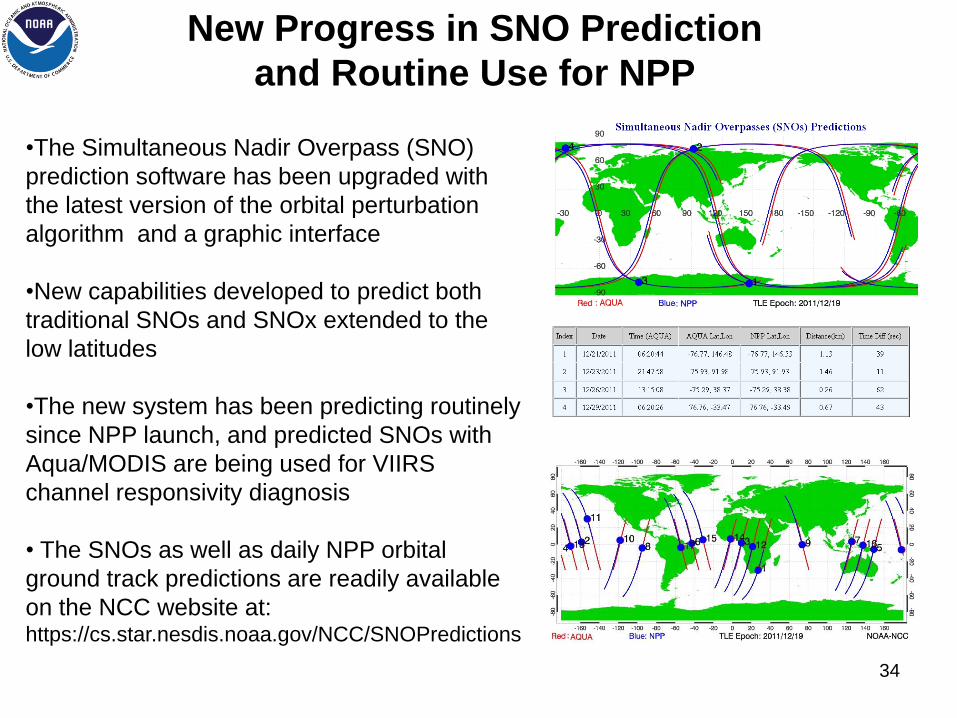
New Progress in SNO Prediction
and Routine Use for NPP
Hong Kong
•The Simultaneous Nadir Overpass (SNO)
prediction software has been upgraded with
the latest version of the orbital perturbation
algorithm and a graphic interface
•New capabilities developed to predict both
traditional SNOs and SNOx extended to the
low latitudes
•The new system has been predicting routinely
since NPP launch, and predicted SNOs with
Aqua/MODIS are being used for VIIRS
channel responsivity diagnosis
• The SNOs as well as daily NPP orbital
ground track predictions are readily available
on the NCC website at: https://cs.star.nesdis.noaa.gov/NCC/SNOPredictions
Seoul
Taiwan
Shanghai
34

35
Summary
• VIIRS Thermal Emissive Bands are stable and preliminary results showed TEB
performance exceed the specification.
• VIIRS M12 striping at daytime is mainly caused by the difference in VIIRS
azimuth angles among detectors. CRTM can simulate the striping effect.
• VIIRS, MODIS and AVHRR agree well over the SNO scenes.
• VIIRS and CrIS cross check can be performed at any time and any location.
Both sensors for TEB agree well.
• Updates of the radiometric lookup tables for VIIRS Reflective Solar Bands have
improved calibration and uniformity of radiometric response
• With the LUT updates, radiometric calibration is stable and agrees well with
MODIS measurements (barring small spectral biases)
• LUT updates should be applied more frequently than on the weekly basis: the
planned scan-by-scan update should be implemented as soon as possible

Backup Slides
36

VIIRS Spectral, Spatial, and Radiometric Characteristics Table is adapted from VIIRS user guide and the measured values (last two columns) are revised with RSB data calculated from
the updated Murphy results by Aerospace and STAR TEB values (March 8, 2012) which agree with NASA’s results.
37
Onboard
performance

https://cs.star.nesdis.noaa.gov/NCC/VIIRSImageGallery 38

Histogram for VIIRS and CrIS Comparison

Monitoring Sensitivity Degradation (cont.)

VIIRS vs. MODIS SNO Comparisons (cont.)