stardust hypervelocity entry observing campaign … airborne observation...spectral region covered...
TRANSCRIPT

NASA Engineering and Safety Center Report
Document #:
RP-06-80 Version:
1.0
Title:
Stardust Airborne Observation Campaign Support Page #:
1 of 43
NESC Request No.: 05-042-I
Stardust Hypervelocity Entry Observing Campaign Support
Stardust Observation Campaign Team
August 31, 2006
NASA Engineering and Safety Center Report
Document #:
RP-06-80 Version:
1.0
Title:
Stardust Airborne Observation Campaign Support Page #:
2 of 43
NESC Request No.: 05-042-I
Table of Contents Volume I: Technical Report 1.0 Authorization and Notification..................................................................................................... 4 2.0 Signature Page................................................................................................................................ 5 3.0 Team List ........................................................................................................................................ 6 4.0 Executive Summary ....................................................................................................................... 8 5.0 Investigation Plan .......................................................................................................................... 8 6.0 Problem Description, Proposed Solutions, and Risk Assessment............................................ 10
6.1 Entry Heating.................................................................................................................... 10 6.2 Anticipated Optical Phenomenon ..................................................................................... 11 6.3 Emission Variation ........................................................................................................... 15 6.4 Instrument Suite................................................................................................................ 17 6.5 Flight Plan......................................................................................................................... 20
7.0 Data Analysis................................................................................................................................ 24 8.0 Findings, Observations, and Recommendations ....................................................................... 35 9.0 Lessons Learned........................................................................................................................... 35 10.0 Definition of Terms...................................................................................................................... 35 11.0 Alternate Viewpoint..................................................................................................................... 36 12.0 List of Acronyms.......................................................................................................................... 36 13.0 References..................................................................................................................................... 37 Volume II: Appendices Appendix A. NESC Request Form ......................................................................................................... 39
List of Figures
Figure 6.2-1. Characteristic Spectroscopic Lines of Air Constituents and Blackbody Curves from Solid State Emitters for Various Temperatures........................................................ 12

NASA Engineering and Safety Center Report
Document #:
RP-06-80 Version:
1.0
Title:
Stardust Airborne Observation Campaign Support Page #:
3 of 43
NESC Request No.: 05-042-I
Figure 6.2-2. Stardust Sample Return Capsule Geometry...................................................................... 13 Figure 6.2-3. Predicted Forebody Surface Temperature Distribution, Neglecting Ablation.................. 14 Figure 6.2-4. Predicted Spectrum at Peak Heating on Nominal Entry Trajectory ................................. 15 Figure 6.2-5. Predicted Spectrum along Nominal Trajectory................................................................. 15 Figure 6.3-1. Predicted 1-σ Variation of Spectrum at Peak Heating due to Modeling Uncertainties
(Aerothermal and Material Response) .............................................................................. 16 Figure 6.3-2. Predicted Variation of Spectrum at Peak Heating due to 3-σ Trajectory
Dispersion ......................................................................................................................... 17 Figure 6.4-1. SOC Instrument Suite Spectral Coverage and Resolution................................................ 18 Figure 6.5-1. Nominal SRC Entry Ground Track Locations and Observation Locations...................... 22 Figure 6.5-2. Predicted Path of SRC across Port Window from Primary View Location for Nominal,
Minimum Down-Range, and Maximum Down-Range Trajectories................................. 23 Figure 7.0-1. Video Frame from NIRSPEC-c IR Spotting Camera at UTC 9:57:?................................ 28 Figure 7.0-2. Evolution of Flux Density from Imaged SRC .................................................................. 30 Figure 7.0-3. Uncalibrated Spectrum from NIRSPEC-a at 9:57:30.813; Gray Zone shows the
Spectral Region covered by NIRSPEC-b ......................................................................... 31 Figure 7.0-4. Calibrated Spectrum from Echelle at 9:57:25.632............................................................ 32 Figure 7.0-5. Calibrated Spectrum from Echelle at 9:57:25.632............................................................ 32 Figure 7.0-6. Calibrated spectrum from Echelle at 9:57:17.027 ............................................................ 33 Figure 7.0-7. Calibrated Flux Density of CN Band Emission from SLIT.............................................. 33 Figure 7.0-8. Temporal Evolution of a Unique Section of Wake: Red Arrow Points to Same
Star in Each Image. ........................................................................................................... 34
List of Tables Table 6.4-1. SOC Instrument Suite ....................................................................................................... 19 Table 6.5-1. Planned Aircraft Time-On-Target Locations for UTC Jan 15 2006 9:56:39.0................. 21 Table 7.0-1. Individual Instrument Data ............................................................................................... 26

NASA Engineering and Safety Center Report
Document #:
RP-06-80 Version:
1.0
Title:
Stardust Airborne Observation Campaign Support Page #:
4 of 43
NESC Request No.: 05-042-I
Volume I: Technical Report
1.0 Authorization and Notification The request to conduct an Initial Evaluation was submitted to the NASA Engineering and Safety Center (NESC) Systems Engineering Office (SEO) on July 13, 2005. The initial NESC request form is provided in Appendix A of this report. Mr. Steve Labbe, NESC’s Discipline Expert (NDE) at Johnson Space Center (JSC), performed the initial evaluation and conveyed the results to the NESC Review Board (NRB) on July 28, 2005. The authorization to develop a Technical Assessment Report was given by the NRB on September 1, 2005. Dr. Dean Kontinos, NESC Chief Engineer (NCE) at Ames Research Center (ARC), was assigned as the Lead for the assessment effort.
NASA Engineering and Safety Center Report
Document #:
RP-06-80 Version:
1.0
Title:
Stardust Airborne Observation Campaign Support Page #:
5 of 43
NESC Request No.: 05-042-I
2.0 Signature Page
Assessment Team Members
Dr. Dean A. Kontinos Date Mr. David E. Jordan Date NESC ARC Dr. Peter Jenniskens Date SETI Institute
NASA Engineering and Safety Center Report
Document #:
RP-06-80 Version:
1.0
Title:
Stardust Airborne Observation Campaign Support Page #:
6 of 43
NESC Request No.: 05-042-I
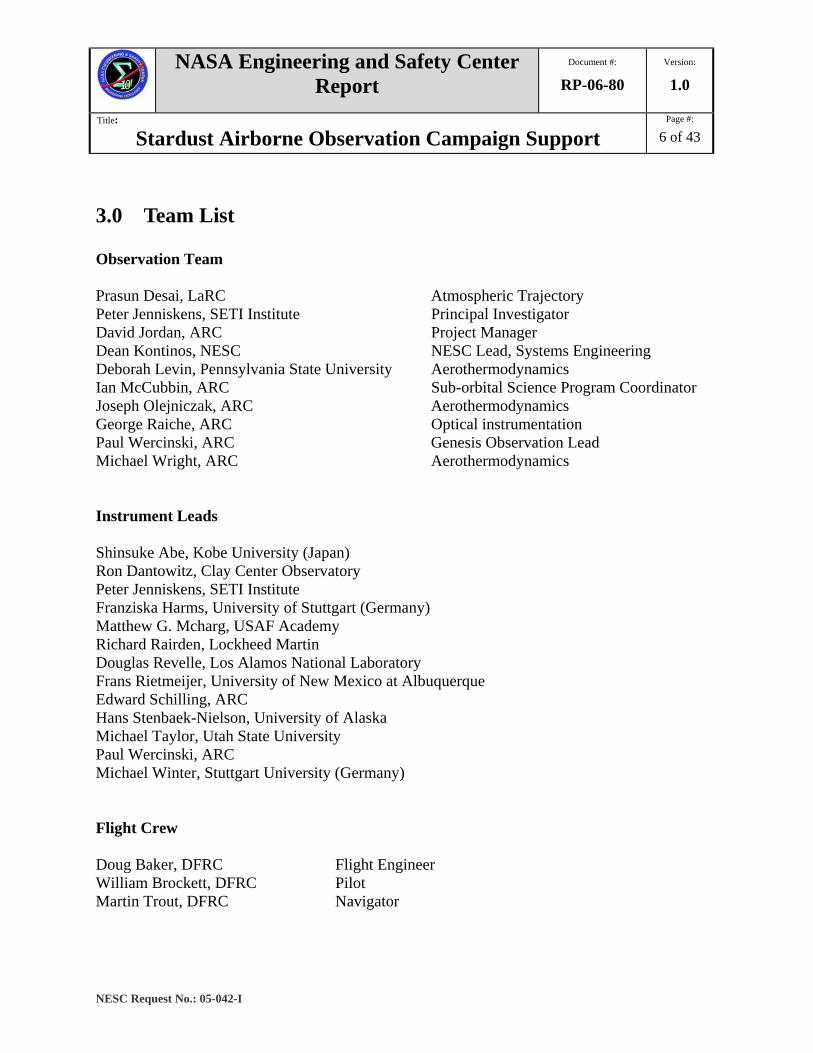
3.0 Team List Observation Team Prasun Desai, LaRC Atmospheric Trajectory Peter Jenniskens, SETI Institute Principal Investigator David Jordan, ARC Project Manager Dean Kontinos, NESC NESC Lead, Systems Engineering Deborah Levin, Pennsylvania State University Aerothermodynamics Ian McCubbin, ARC Sub-orbital Science Program Coordinator Joseph Olejniczak, ARC Aerothermodynamics George Raiche, ARC Optical instrumentation Paul Wercinski, ARC Genesis Observation Lead Michael Wright, ARC Aerothermodynamics Instrument Leads Shinsuke Abe, Kobe University (Japan) Ron Dantowitz, Clay Center Observatory Peter Jenniskens, SETI Institute Franziska Harms, University of Stuttgart (Germany) Matthew G. Mcharg, USAF Academy Richard Rairden, Lockheed Martin Douglas Revelle, Los Alamos National Laboratory Frans Rietmeijer, University of New Mexico at Albuquerque Edward Schilling, ARC Hans Stenbaek-Nielson, University of Alaska Michael Taylor, Utah State University Paul Wercinski, ARC Michael Winter, Stuttgart University (Germany) Flight Crew Doug Baker, DFRC Flight Engineer William Brockett, DFRC Pilot Martin Trout, DFRC Navigator

NASA Engineering and Safety Center Report
Document #:
RP-06-80 Version:
1.0
Title:
Stardust Airborne Observation Campaign Support Page #:
7 of 43
NESC Request No.: 05-042-I
Airplane Operations Mike Cropper, Wallops Engineer Steve Davis, University of North Dakota DC-8 Crew Chief Dave Eastmunt, Wallops DC-8 Program Manager Brenda Mulac, Wallops DC-8 Test Director Rick Shetter, University of North Dakota DC-8 Program Director Review Committee Steven Labbe, JSC Chair, Flight Sciences NDE George Lewis, JPL Stardust Navigation Team Tina Panontin, ARC Center Chief Engineer Dinesh Prabhu, ARC Aerothermodynamics James Reuther, ARC CEV TPS Project Manager James Stewart, NESC DFRC NCE Erin Moran, NESC/Swales Technical Writer
NASA Engineering and Safety Center Report
Document #:
RP-06-80 Version:
1.0
Title:
Stardust Airborne Observation Campaign Support Page #:
8 of 43
NESC Request No.: 05-042-I
4.0 Executive Summary In the early morning of January 15, 2006, the Stardust Sample Return Capsule (SRC) successfully delivered its precious cargo of cometary particles to the awaiting recovery team at the Utah Test and Training Range (UTTR). As the SRC entered at 12.8 km/s, the fastest man-made object to traverse the atmosphere, a team of researchers imaged the event aboard the NASA DC-8 airborne observatory. At SRC entry, the airplane was at an altitude of 11.9 km positioned within 6.4 km of the prescribed, preferred target view location. The incoming SRC was first acquired approximately 18 seconds (s) after atmospheric interface and tracked for approximately 60 s, an observation period that is roughly centered in time around predicted peak heating. The radiative signal from the SRC and surrounding shock layer gasses were measured by 15 of 18 instruments that had various combinations of spectral range, spectral resolution, and temporal resolution (note that there is no spatial resolution of the SRC; it appears to the cameras as a point source). The data were assessed to be of good quality and sufficient to address all observation objectives: absolute radiance, spectral resolution of shock layer emission, and wake train evolution. Detected emissions were similar in character to pre-flight estimates that were used to set the parameters of the observation. Initial assessment of the data revealed interesting features of the emission including signatures of potassium and zinc believed to be from the paint burning off during entry, and a cyanogen (CN) intensity profile consistent with expected forebody heatshield ablation rate evolution.
5.0 Investigation Plan A request for funding of the Stardust Observation Campaign (SOC) was presented to the NASA Engineering and Safety Center (NESC) Review Board (NRB) on July 28, 2005. Although supportive of the proposal, the NRB requested the Exploration Systems Mission Directorate (ESMD) be solicited for financial support since the Crew Exploration Vehicle (CEV) Program would be a primary beneficiary of the acquired data. At the time, the CEV Thermal Protection System (TPS) Advanced Development Project (ADP) was being formed. Working with the CEV-TPS-ADP, a joint funding agreement was formulated for both the SOC and subsequent post-flight analysis. This plan was brought to the NRB and accepted on September 1, 2005. The primary objectives of the campaign were the following:
1. Obtain total radiated power emitted from the SRC and shock layer along the entry trajectory.
2. Obtain spectrally-resolved radiated power from the SRC and shock layer along the trajectory.
3. Obtain evolution of structure in the near wake and entry trail.

NASA Engineering and Safety Center Report
Document #:
RP-06-80 Version:
1.0
Title:
Stardust Airborne Observation Campaign Support Page #:
9 of 43
NESC Request No.: 05-042-I
The SOC plan was an enhancement of the Genesis Observation Campaign (GOC) Plan (NESC 04-061-E). The approach was to employ the science team from the Leonid Multi-Aircraft Campaign whose researchers had flown on the NASA DC-8 to observe the Leonid meteor shower in 2002. Furthermore, this team also flew the GOC from the Air Force Flying Infrared Signature Technology Aircraft (FISTA). This team was experienced in integrating their instruments and taking data aboard the DC-8. A NESC review was incorporated into the schedule to assess sufficiency in the instrument suite, planning and procedures. Following post-flight recommendations of the GOC, programmatic connections were established with the Stardust Mission at the Jet Propulsion Laboratory (JPL). Members of the SOC team were granted access to the Stardust data repository and a team member was on-site at JPL during the SRC return operations to transmit trajectory information to the DC-8. The aircraft was operated from Moffett Field at ARC. During the preparation for the observation flight, the DC-8 aircraft operations were being transferred from Dryden Flight Research Center (DFRC) to the University of North Dakota (UND) under a cooperative agreement managed by Wallops Flight Facility (WFF). The SOC was to be the first mission of the DC-8 operated by the UND-WFF team. Several factors conspired to jeopardize the mission: the operations transfer was behind schedule, there was an earth science mission to occur in March 2006 that required preparation, and the SOC was expanding its requirements. As a result, the SOC was cancelled by WFF in early November 2005. This crisis was resolved by Cheryl Yuhas, NASA Headquarters Sub-orbital Science Manager. The agreement was that the instrument set would only be those that had flown on the Leonid Multi-Aircraft Campaign, most of which had existing mounting hardware. The operations would need to satisfy both WFF and DFRC flight rules. Per agreement with CEV-TPS-ADP, the NESC deliverable was the acquisition of the data and an assessment of its quality and utility. Post-flight analysis was a responsibility of the CEV-TPS-ADP. The objectives of this report are to document the observation campaign pre-entry analysis activities, list the acquired data sets, and assess the quality and utility of the acquired data. This report does not present analysis of the observation data to determine entry performance of the SRC. This analysis is beyond the scope of the SOC.
NASA Engineering and Safety Center Report
Document #:
RP-06-80 Version:
1.0
Title:
Stardust Airborne Observation Campaign Support Page #:
10 of 43
NESC Request No.: 05-042-I
6.0 Problem Description, Proposed Solutions, and Risk Assessment This section describes the analysis and operational decisions that were made prior to the observation. First the entry heating problem is briefly reviewed. Next, the expected emission from the Stardust entry is described. The instrument detection ranges are then related to these emissions. Next, the choice of viewing location is described along with sensitivity to expected SRC trajectory dispersion. Finally, the aircraft flight pattern is described. 6.1 Entry Heating When an aircraft flies through the atmosphere, the frictional forces between the gas and the surface of the craft generate heat. The classical Reynolds analogy holds that skin friction and heat transfer are proportional. At increasing flight speed, the heat transfer to the vehicle increases, ultimately resulting in temperatures that exceed the failure limit of the material. To enable entry from orbit, the blunt body concept1 was innovated to minimize the heating to a spacecraft. With a blunt body, much of the work energy is consumed in compressing the gas in the shock layer that stands detached from the body, thereby reducing the heating due to friction. However, there is no cheating nature. As the entry speeds become higher, like the super-orbital velocity of the Stardust sample return capsule, and the spacecraft bodies become bigger, like the CEV, the pressure and temperature of the gas in the shock layer increase. For air, peak temperatures in the shock layer reach into the range of 20,000 K. At these high temperatures, the atmospheric molecules break into atoms that have electrons excited into higher energy states. These electrons emit photons as they cascade down in energy levels. The gas begins to glow and radiate heat to the surface of the vehicle. In effect, there is a heat lamp in the shock layer in front of the entering spacecraft transmitting energy to the surface. The amount of radiative heating produced is directly proportional to the diameter of the entry vehicle, and is also a strong function (nearly exponential) of velocity. For Stardust, pre-flight predictions estimated the radiative heating component to be roughly 10 percent of the total at the time of peak heating. For a vehicle the size of the CEV entry capsule, however, the fraction of peak heating due to radiation is roughly 50 percent even though the entry velocity is substantially lower (approximately 11 km/s). Entry heating is predicted using modern computational methods. A computational fluid dynamic (CFD) code is used to simulate the fluid motion and the non-equilibrium thermo-chemical state of the gas in the shock layer. These results are input into a separate code that models both the population of electrons in the higher energetic states of the gas (emission) and the resultant transmission of the radiant energy through the gas medium. The data gathered from the Stardust observation contributes to the validation of these codes.

NASA Engineering and Safety Center Report
Document #:
RP-06-80 Version:
1.0
Title:
Stardust Airborne Observation Campaign Support Page #:
11 of 43
NESC Request No.: 05-042-I
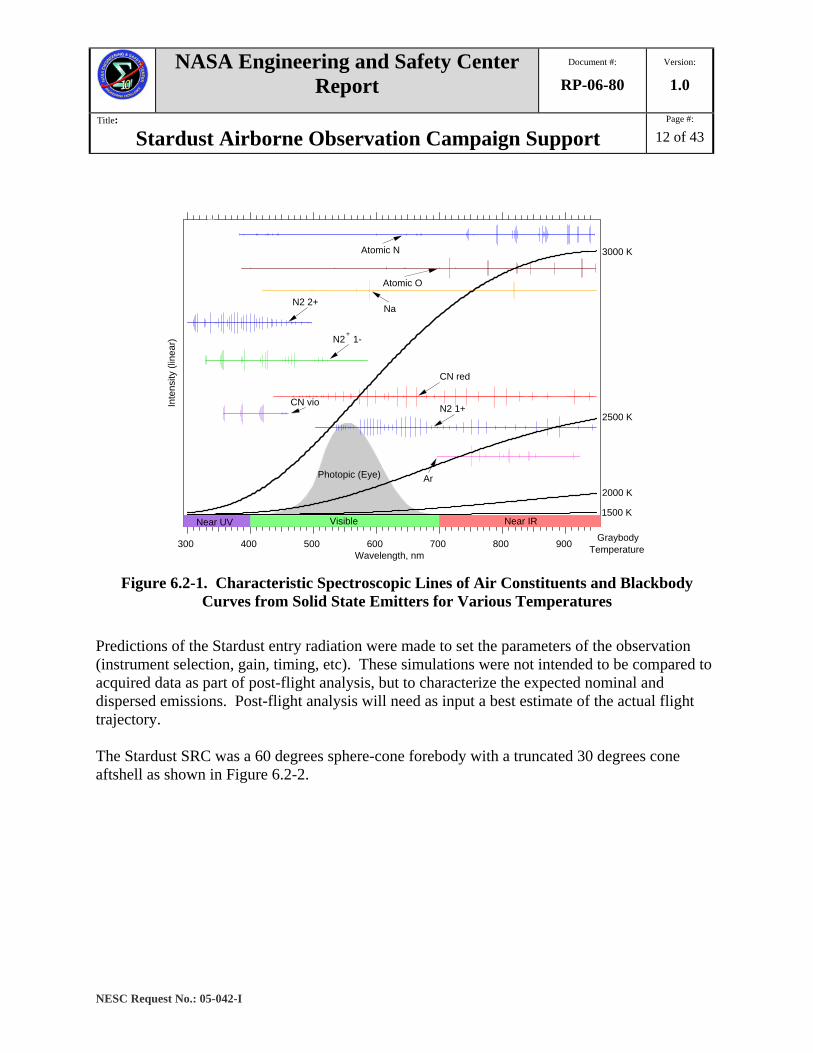
6.2 Anticipated Optical Phenomenon The following discussion is based on the concept of an optical “spectrum”, i.e., a plot of radiation intensity as a function of wavelength. The total or wavelength-integrated power of the spectrum comprises the radiative heating to the SRC surface. In addition, the pattern of the spectrum serves as a “fingerprint” to identify the origin of the observed radiation. Quantitative measurement of both the total power emitted and the intensity patterns is the technical objective of the SOC. There are primarily two types of phenomena that produce optical signals from the SRC: the blackbody radiation of the heatshield surface, and the shock-induced emission of excited gas species. These signals, which are of fundamentally different character, are shown schematically in Figure 6.2-1. The first is the broadband blackbody signal. The wavelength distribution function of a blackbody is defined uniquely and completely by its temperature (called the "Planck curve" or "blackbody curve").2 Examples of this distribution are shown for 1,500, 2,000, 2,500, and 3,000 K. As the temperature increases, the intensity of the radiation increases and the power shifts to the ultraviolet (UV). Note that there is no discrete structure in the blackbody spectrum. As will be shown later in this section, the blackbody signal dominates the radiation from the SRC as it heats during re-entry. Therefore, analysis of the blackbody component informs the determination of surface temperature. The second type of signal is radiant energy emitted at discrete wavelengths. Due to the quantum storage of energy, atoms and molecules emit radiation at specific wavelengths characteristic of their atomic structure. Additionally, the intensity of a discrete peak is proportional to the density of the corresponding emitter. Examples of several species are also shown in Figure 6.1-1. The vertical hash marks indicate the characteristic wavelengths of the denoted species. The signal from air will be dominated by nitrogen (N2) and oxygen (O2) species. The heatshield of Stardust is made of Phenolic Impregnated Carbon Ablator (PICA) − a carbon fiber matrix impregnated with phenolic resin. Its ablation will result in carbon bearing species being injected into the shock layer. These species will react with the nitrogen in the air to form CN, which is a strong radiator in the near-violet portion of the visible spectrum. Detecting these characteristic signals informs the knowledge of the temperature and concentration of the individual species. These are the very quantities calculated using computational simulation. Unfortunately from an observation standpoint, much of the radiant energy emitted by the shock layer is reabsorbed by the atmosphere, particularly by water vapor, in the intervening distance between the observer and the entering spacecraft. This absorption occurs at known and discret oxygen and water vapor bands and a small amount of continuum extinction. Nevertheless, energy in the near UV through near infrared (IR) will transmit without appreciable quenching. Matching this portion of the simulated spectrum with observations bolsters confidence that the state-to-state energy models describing the total emission are valid.
NASA Engineering and Safety Center Report
Document #:
RP-06-80 Version:
1.0
Title:
Stardust Airborne Observation Campaign Support Page #:
12 of 43
NESC Request No.: 05-042-I
900800700600500400300Wavelength, nm
Inte
nsity
(lin
ear)
Ar
N2 1+
N2+ 1-
N2 2+
Atomic O
Atomic N
CN vio
Photopic (Eye)
Na
CN red
Near UV Visible Near IR
3000 K
2500 K
2000 K
1500 K
GraybodyTemperature
Figure 6.2-1. Characteristic Spectroscopic Lines of Air Constituents and Blackbody
Curves from Solid State Emitters for Various Temperatures Predictions of the Stardust entry radiation were made to set the parameters of the observation (instrument selection, gain, timing, etc). These simulations were not intended to be compared to acquired data as part of post-flight analysis, but to characterize the expected nominal and dispersed emissions. Post-flight analysis will need as input a best estimate of the actual flight trajectory. The Stardust SRC was a 60 degrees sphere-cone forebody with a truncated 30 degrees cone aftshell as shown in Figure 6.2-2.

NASA Engineering and Safety Center Report
Document #:
RP-06-80 Version:
1.0
Title:
Stardust Airborne Observation Campaign Support Page #:
13 of 43
NESC Request No.: 05-042-I
Figure 6.2-2. Stardust Sample Return Capsule Geometry
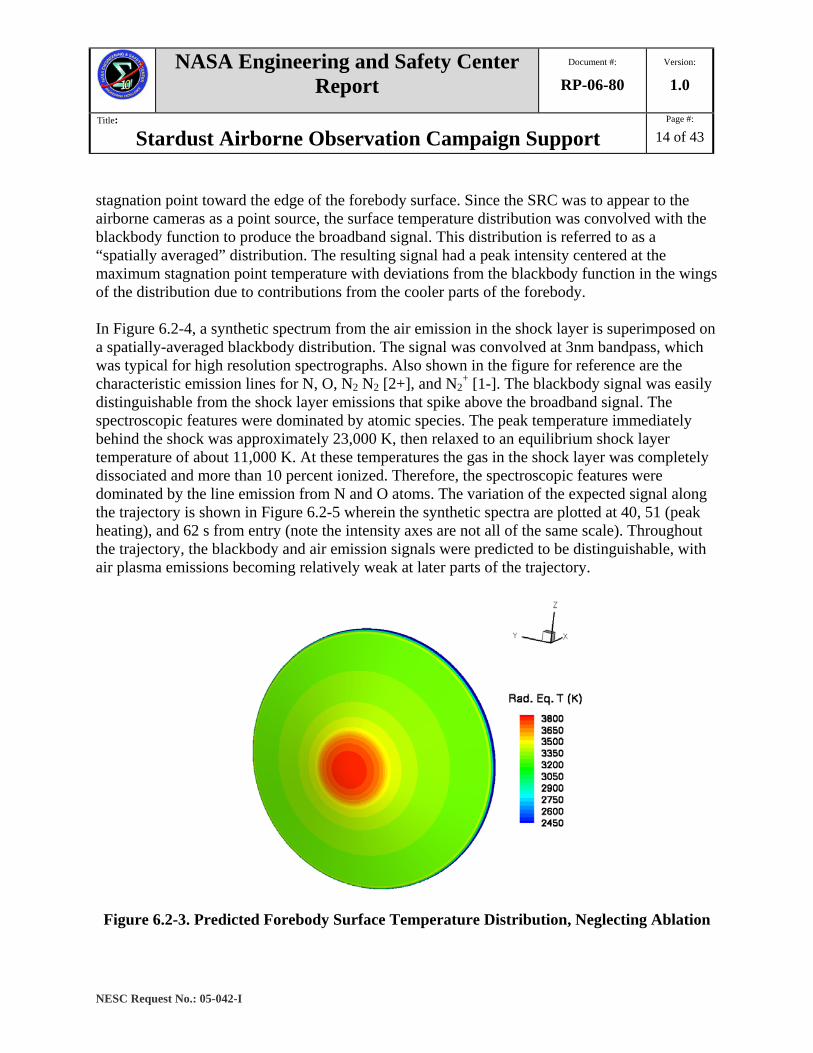
The maximum diameter was 0.827 m. The entry trajectory was designed to be purely ballistic (non-lifting) and, therefore, the nominal angle of attack was 0 degrees. Flowfield simulations were made using the Data Parallel Line Relaxation3 (DPLR) CFD code and Non-Equilibrium Air4 Radiation (NEQAIR) transport code. The air was modeled as a mixture of 11 species (including atoms and ions formed through shock layer chemistry) in thermochemical nonequilbrium. The body surface was assumed to be in radiative equilibrium and fully catalytic to the recombination of atoms and ions. The radiative equilibrium assumption, which equated the heat transfer to the body to the surface re-radiation, did not account for in-depth heat conduction and thus surface temperatures were likely over estimated. Moreover, the fully catalytic assumption maximized the potential heat transfer and was likely overly conservative. An accurate assessment of surface temperature, which accounted for ablation of the thermal protection system (TPS) material, was also performed at selected points along the trajectory. Post-flight analysis of the data will hopefully provide insight to the actual surface properties. These assumptions were sufficient to estimate the magnitude and qualities of the expected signal. The internal energy state transitions for air were approximated using the Quasi-Steady-State (QSS) model of Park4, which was developed and calibrated using on-board spectrometer data from the FIRE-II5 flight experiment that entered the Earth’s atmosphere ballistically at 11.4 km/s in 1965. Predictions were made along the so-called nominal trajectory dated December 9, 2005. This trajectory was the baseline trajectory assuming nominal values of aerodynamics and atmospheric conditions (seasonal and location based). The entry state was the predicted conditions using the latest navigation and maneuver execution accuracies. Flooded contours of radiative equilibrium surface temperature on the forebody are shown in Figure 6.2-3 for the conditions of peak heating along the nominal trajectory. The stagnation point radiative equilibrium surface temperature was calculated to be 3,775 K. When the cooling effects of surface ablation were taken into account the peak predicted temperature dropped to about 3,000 K (not shown). The predicted surface temperature dropped rapidly moving out from the
NASA Engineering and Safety Center Report
Document #:
RP-06-80 Version:
1.0
Title:
Stardust Airborne Observation Campaign Support Page #:
14 of 43
NESC Request No.: 05-042-I
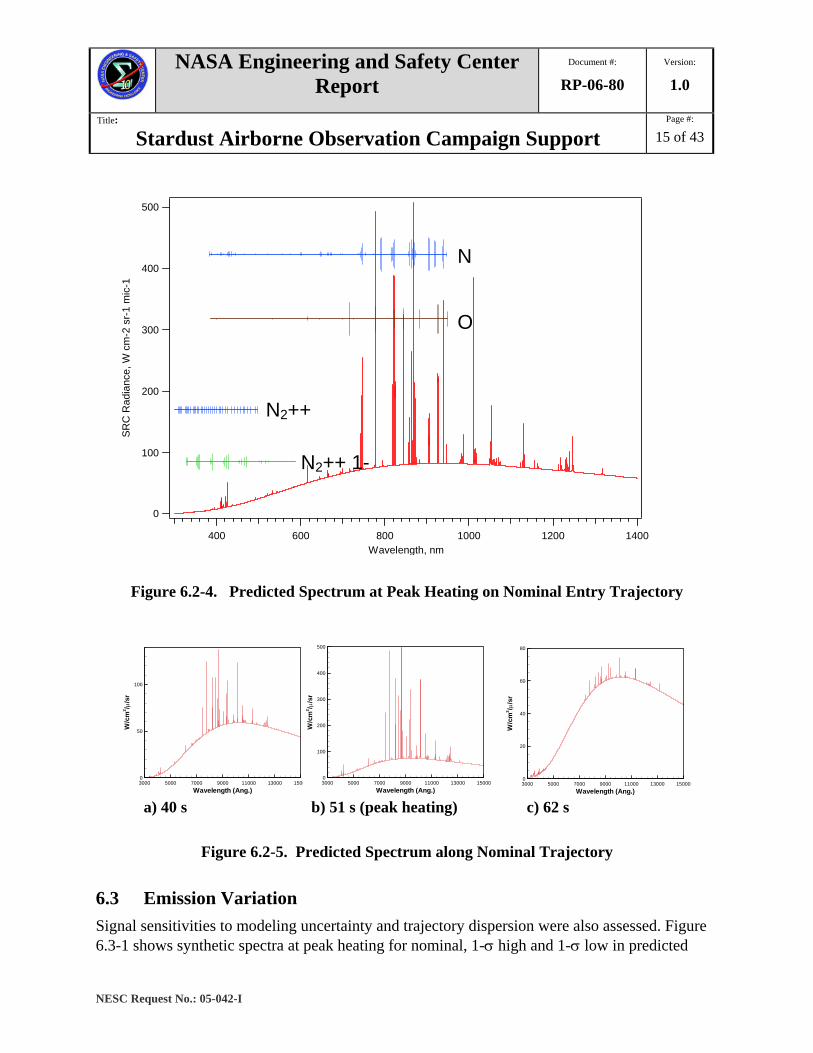
stagnation point toward the edge of the forebody surface. Since the SRC was to appear to the airborne cameras as a point source, the surface temperature distribution was convolved with the blackbody function to produce the broadband signal. This distribution is referred to as a “spatially averaged” distribution. The resulting signal had a peak intensity centered at the maximum stagnation point temperature with deviations from the blackbody function in the wings of the distribution due to contributions from the cooler parts of the forebody. In Figure 6.2-4, a synthetic spectrum from the air emission in the shock layer is superimposed on a spatially-averaged blackbody distribution. The signal was convolved at 3nm bandpass, which was typical for high resolution spectrographs. Also shown in the figure for reference are the characteristic emission lines for N, O, N2 N2 [2+], and N2
+ [1-]. The blackbody signal was easily distinguishable from the shock layer emissions that spike above the broadband signal. The spectroscopic features were dominated by atomic species. The peak temperature immediately behind the shock was approximately 23,000 K, then relaxed to an equilibrium shock layer temperature of about 11,000 K. At these temperatures the gas in the shock layer was completely dissociated and more than 10 percent ionized. Therefore, the spectroscopic features were dominated by the line emission from N and O atoms. The variation of the expected signal along the trajectory is shown in Figure 6.2-5 wherein the synthetic spectra are plotted at 40, 51 (peak heating), and 62 s from entry (note the intensity axes are not all of the same scale). Throughout the trajectory, the blackbody and air emission signals were predicted to be distinguishable, with air plasma emissions becoming relatively weak at later parts of the trajectory.
Figure 6.2-3. Predicted Forebody Surface Temperature Distribution, Neglecting Ablation
NASA Engineering and Safety Center Report
Document #:
RP-06-80 Version:
1.0
Title:
Stardust Airborne Observation Campaign Support Page #:
15 of 43
NESC Request No.: 05-042-I
500
400
300
200
100
0
SRC
Rad
ianc
e, W
cm
-2 s
r-1
mic
-1
140012001000800600400Wavelength, nm
N
O
N2++ 1-
N2++
Figure 6.2-4. Predicted Spectrum at Peak Heating on Nominal Entry Trajectory
Wavelength (Ang.)
W/c
m2 /μ
/sr
3000 5000 7000 9000 11000 13000 150000
50
100
Wavelength (Ang.)
W/c
m2 /μ
/sr
3000 5000 7000 9000 11000 13000 150000
100
200
300
400
500
Wavelength (Ang.)
W/c
m2 /μ
/sr
3000 5000 7000 9000 11000 13000 150000
20
40
60
80
a) 40 s b) 51 s (peak heating) c) 62 s
Figure 6.2-5. Predicted Spectrum along Nominal Trajectory 6.3 Emission Variation Signal sensitivities to modeling uncertainty and trajectory dispersion were also assessed. Figure 6.3-1 shows synthetic spectra at peak heating for nominal, 1-σ high and 1-σ low in predicted
NASA Engineering and Safety Center Report
Document #:
RP-06-80 Version:
1.0
Title:
Stardust Airborne Observation Campaign Support Page #:
16 of 43
NESC Request No.: 05-042-I
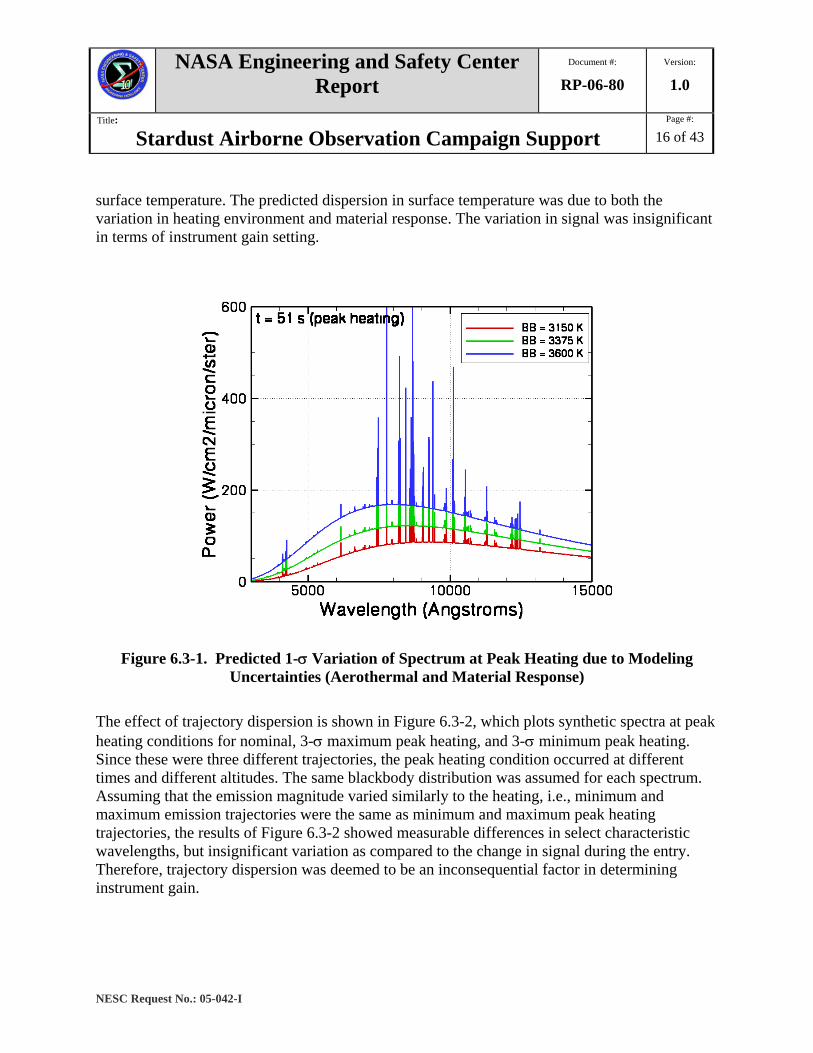
surface temperature. The predicted dispersion in surface temperature was due to both the variation in heating environment and material response. The variation in signal was insignificant in terms of instrument gain setting.
Figure 6.3-1. Predicted 1-σ Variation of Spectrum at Peak Heating due to Modeling Uncertainties (Aerothermal and Material Response)
The effect of trajectory dispersion is shown in Figure 6.3-2, which plots synthetic spectra at peak heating conditions for nominal, 3-σ maximum peak heating, and 3-σ minimum peak heating. Since these were three different trajectories, the peak heating condition occurred at different times and different altitudes. The same blackbody distribution was assumed for each spectrum. Assuming that the emission magnitude varied similarly to the heating, i.e., minimum and maximum emission trajectories were the same as minimum and maximum peak heating trajectories, the results of Figure 6.3-2 showed measurable differences in select characteristic wavelengths, but insignificant variation as compared to the change in signal during the entry. Therefore, trajectory dispersion was deemed to be an inconsequential factor in determining instrument gain.

NASA Engineering and Safety Center Report
Document #:
RP-06-80 Version:
1.0
Title:
Stardust Airborne Observation Campaign Support Page #:
17 of 43
NESC Request No.: 05-042-I
Figure 6.3-2. Predicted Variation of Spectrum at Peak Heating due to 3-σ Trajectory Dispersion
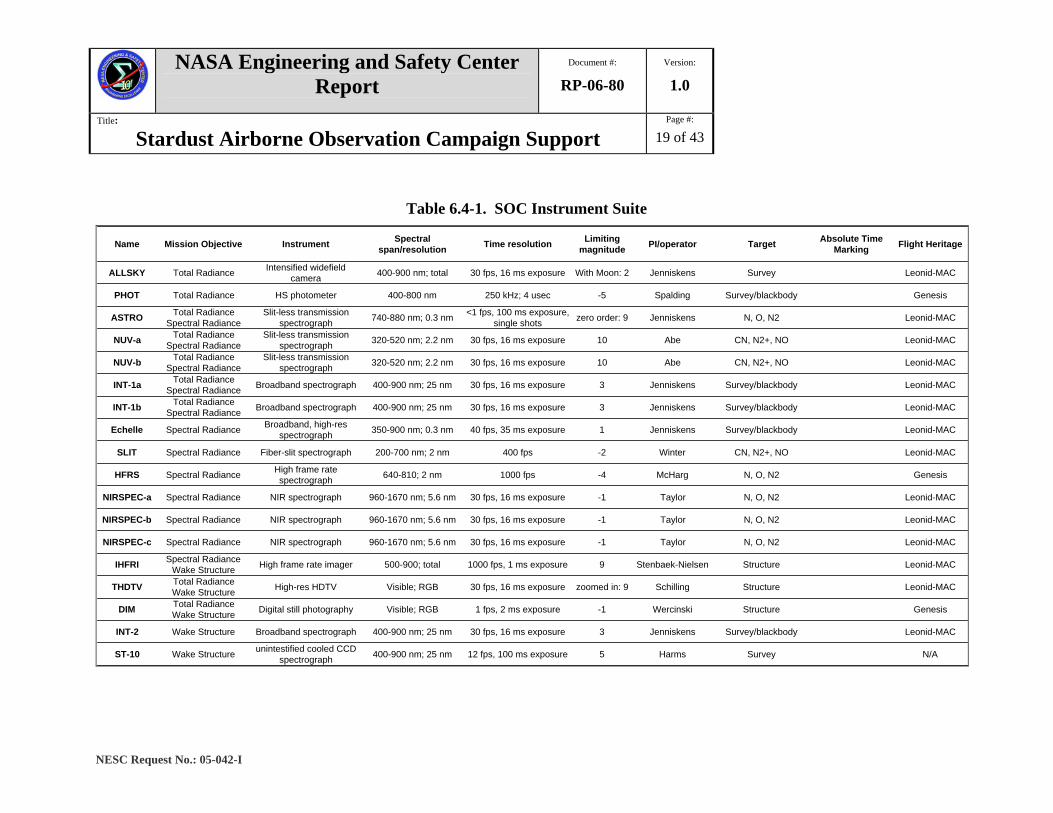
6.4 Instrument Suite The suite of instruments to record the entry event was selected primarily on the basis of flight heritage and experience of the operators. The instruments along with their performance characteristics and target objective are listed in Table 6.4-1. The spectral range of the instruments is plotted in Figure 6.4-1. The approach was to have overlap in spectral coverage to provide reliability in signal acquisition.

NASA Engineering and Safety Center Report
Document #:
RP-06-80 Version:
1.0
Title:
Stardust Airborne Observation Campaign Support Page #:
18 of 43
NESC Request No.: 05-042-I
Figure 6.4-1. SOC Instrument Suite Spectral Coverage and Resolution
Two of the findings of the NESC Readiness Review were to add the NIRSPEC-b camera to the suite to provide redundancy in the near IR, and to add spectroscopic capability (capability beyond the staring wide-angle cameras) at very low resolution to that would detect the re-entry even if pointing of other cameras failed. The spectroscopically overlapped instruments were not completely identical since they had a variety of wavelength and temporal resolution. Taken as a whole, the instruments provided overlapping views of the entry signature that could be compared for consistency. Thus, outlying data (e.g. a calibration error) could be identified. Any single camera had a unique view in terms of temporal and spectral resolution; however, the entire suite was intended to be robust to any one or two cameras failing to acquire data. All instruments were equipped with a calibrated time datum based on the IRIG-B (GPS-based) signal provided by the aircraft. Various ground-based efforts were also deployed to mitigate mission failure, to image the entry from a side perspective at high spatial resolution, to measure trajectory from a different perspective for triangulation, and to measure infrasound signals. To calibrate the instruments, the predicted intensity over the measured range for each instrument was convolved with the appropriate (square) slit function to produce synthetic spectra. Instrument gains were chosen to capture the expected signal at the time around peak heating, except for the NIRSPEC-c spotting camera whose gain was set high for early detection of the incoming SRC. Apparent magnitude (“V”-bandpass) of the point source, as viewed from the DC-8, was predicted to be -6 at peak heating, approximately 100 times brighter than the planet Venus.
NASA Engineering and Safety Center Report
Document #:
RP-06-80 Version:
1.0
Title:
Stardust Airborne Observation Campaign Support Page #:
19 of 43
NESC Request No.: 05-042-I
Table 6.4-1. SOC Instrument Suite
Name Mission Objective Instrument Spectral span/resolution Time resolution Limiting
magnitude PI/operator Target Absolute Time Marking Flight Heritage
ALLSKY Total Radiance Intensified widefield camera 400-900 nm; total 30 fps, 16 ms exposure With Moon: 2 Jenniskens Survey Leonid-MAC
PHOT Total Radiance HS photometer 400-800 nm 250 kHz; 4 usec -5 Spalding Survey/blackbody Genesis
ASTRO Total Radiance Spectral Radiance
Slit-less transmission spectrograph 740-880 nm; 0.3 nm <1 fps, 100 ms exposure,
single shots zero order: 9 Jenniskens N, O, N2 Leonid-MAC
NUV-a Total Radiance Spectral Radiance
Slit-less transmission spectrograph 320-520 nm; 2.2 nm 30 fps, 16 ms exposure 10 Abe CN, N2+, NO Leonid-MAC
NUV-b Total Radiance Spectral Radiance
Slit-less transmission spectrograph 320-520 nm; 2.2 nm 30 fps, 16 ms exposure 10 Abe CN, N2+, NO Leonid-MAC
INT-1a Total Radiance Spectral Radiance Broadband spectrograph 400-900 nm; 25 nm 30 fps, 16 ms exposure 3 Jenniskens Survey/blackbody Leonid-MAC
INT-1b Total Radiance Spectral Radiance Broadband spectrograph 400-900 nm; 25 nm 30 fps, 16 ms exposure 3 Jenniskens Survey/blackbody Leonid-MAC
Echelle Spectral Radiance Broadband, high-res spectrograph 350-900 nm; 0.3 nm 40 fps, 35 ms exposure 1 Jenniskens Survey/blackbody Leonid-MAC
SLIT Spectral Radiance Fiber-slit spectrograph 200-700 nm; 2 nm 400 fps -2 Winter CN, N2+, NO Leonid-MAC
HFRS Spectral Radiance High frame rate spectrograph 640-810; 2 nm 1000 fps -4 McHarg N, O, N2 Genesis
NIRSPEC-a Spectral Radiance NIR spectrograph 960-1670 nm; 5.6 nm 30 fps, 16 ms exposure -1 Taylor N, O, N2 Leonid-MAC
NIRSPEC-b Spectral Radiance NIR spectrograph 960-1670 nm; 5.6 nm 30 fps, 16 ms exposure -1 Taylor N, O, N2 Leonid-MAC
NIRSPEC-c Spectral Radiance NIR spectrograph 960-1670 nm; 5.6 nm 30 fps, 16 ms exposure -1 Taylor N, O, N2 Leonid-MAC
IHFRI Spectral Radiance Wake Structure High frame rate imager 500-900; total 1000 fps, 1 ms exposure 9 Stenbaek-Nielsen Structure Leonid-MAC
THDTV Total Radiance Wake Structure High-res HDTV Visible; RGB 30 fps, 16 ms exposure zoomed in: 9 Schilling Structure Leonid-MAC
DIM Total Radiance Wake Structure Digital still photography Visible; RGB 1 fps, 2 ms exposure -1 Wercinski Structure Genesis
INT-2 Wake Structure Broadband spectrograph 400-900 nm; 25 nm 30 fps, 16 ms exposure 3 Jenniskens Survey/blackbody Leonid-MAC
ST-10 Wake Structure unintestified cooled CCD spectrograph 400-900 nm; 25 nm 12 fps, 100 ms exposure 5 Harms Survey N/A
NASA Engineering and Safety Center Report
Document #:
Version:
1.0
Title:
Stardust Airborne Observation Campaign Support Page #:
20 of 43
NESC Request No.: 05-042-I
6.5 Flight Plan The flight path of the DC-8 was designed for optimal viewing from estimated time of first detection through peak heating. The flight path had several competing constraints and objectives: Constraints:
1) Do not fly under ground track.
2) Do not fly in restricted airspace.
3) Fly at level altitude, nominally 11.9 km.
4) Fly at constant speed, nominally 778 km/hr. Objectives:
1) View of SRC at start of entry for early acquisition.
2) View of SRC through estimated peak heating.
3) Perspective angle to forebody of SRC < 30 degrees at time of peak heating.
4) Apparent boresight elevation angle through observation window in the range 12 to 16 degrees at peak heating.
The flight constraints were set by the aircraft team. Although somewhat obvious, Constraint 2 acknowledges that this mission did not seek any special waivers when filing its flight plan. Objective 1 was prescribed to maximize the opportunity to acquire and track the SRC prior to the time of peak heating. Objectives 2 and 3 are set by the scientific goals of the observation. Since it was estimated that the majority of the radiation in the shock layer is produced in the spherical nose cap region of the incoming SRC, it was imperative to have the nose region in view. The perspective angle to the SRC was defined as the angle between the aircraft-to-SRC line of sight and the SRC geometric axis of symmetry (which for a ballistic flight should be aligned with the velocity). A perspective angle of 0 degrees was a head-on view to the forebody and 90 degrees was a side view. The SRC being a 60 degrees sphere-cone, a 30 degrees view angle presented a view normal to the flank. Views beyond 30 degrees would obscure the nose region and were deemed undesirable. Objective 4 originated from astrometric requirements to have the position of the aircraft defined sufficiently during integration periods of 1/30th s. To achieve the flight objectives, three time-on-target locations were specified. One had the optimal view (designated Primary), and two others were specified in the event of a high cirrus cloud layer at the Primary view location. These alternate view locations were designated Alternate-North and Alternate-South to indicate their relative position from Primary. The decision to proceed to an alternate view location was to be made real time aboard the aircraft by the project manager in consultation with the flight crew. The view locations and heading are
NASA Engineering and Safety Center Report
Document #:
RP-06-80 Version:
1.0
Title:
Stardust Airborne Observation Campaign Support Page #:
21 of 43
NESC Request No.: 05-042-I
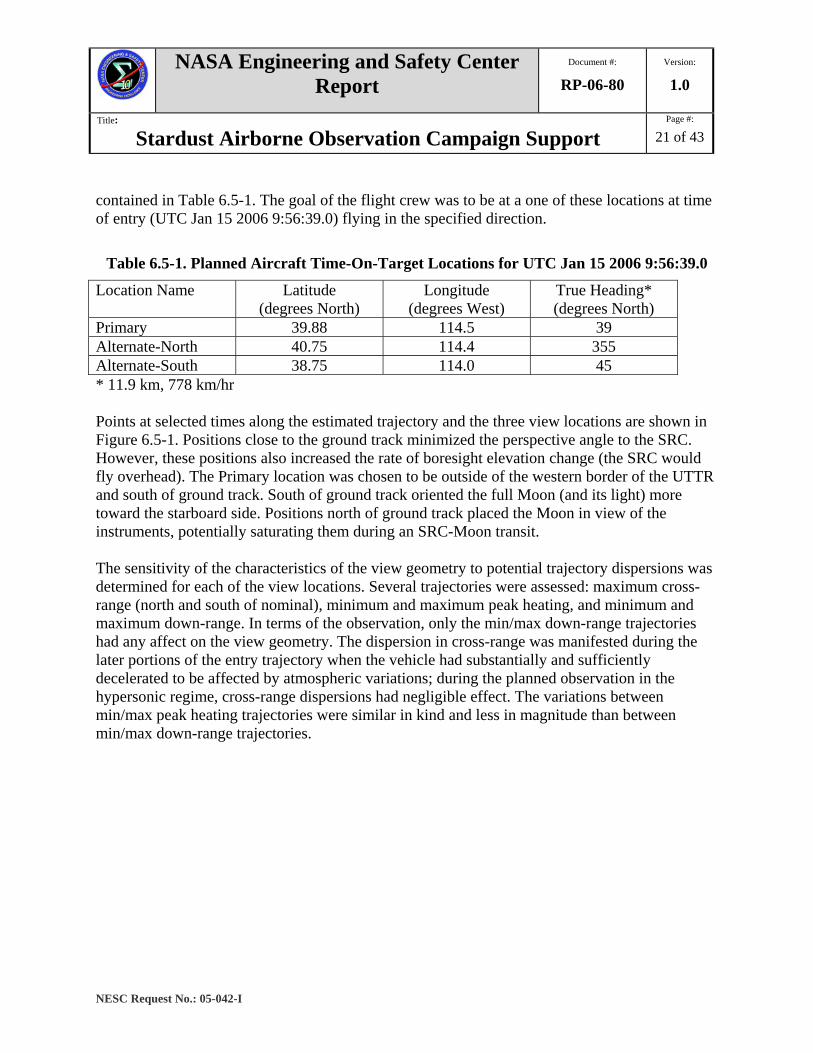
contained in Table 6.5-1. The goal of the flight crew was to be at a one of these locations at time of entry (UTC Jan 15 2006 9:56:39.0) flying in the specified direction.
Table 6.5-1. Planned Aircraft Time-On-Target Locations for UTC Jan 15 2006 9:56:39.0
Location Name Latitude (degrees North)
Longitude (degrees West)
True Heading* (degrees North)
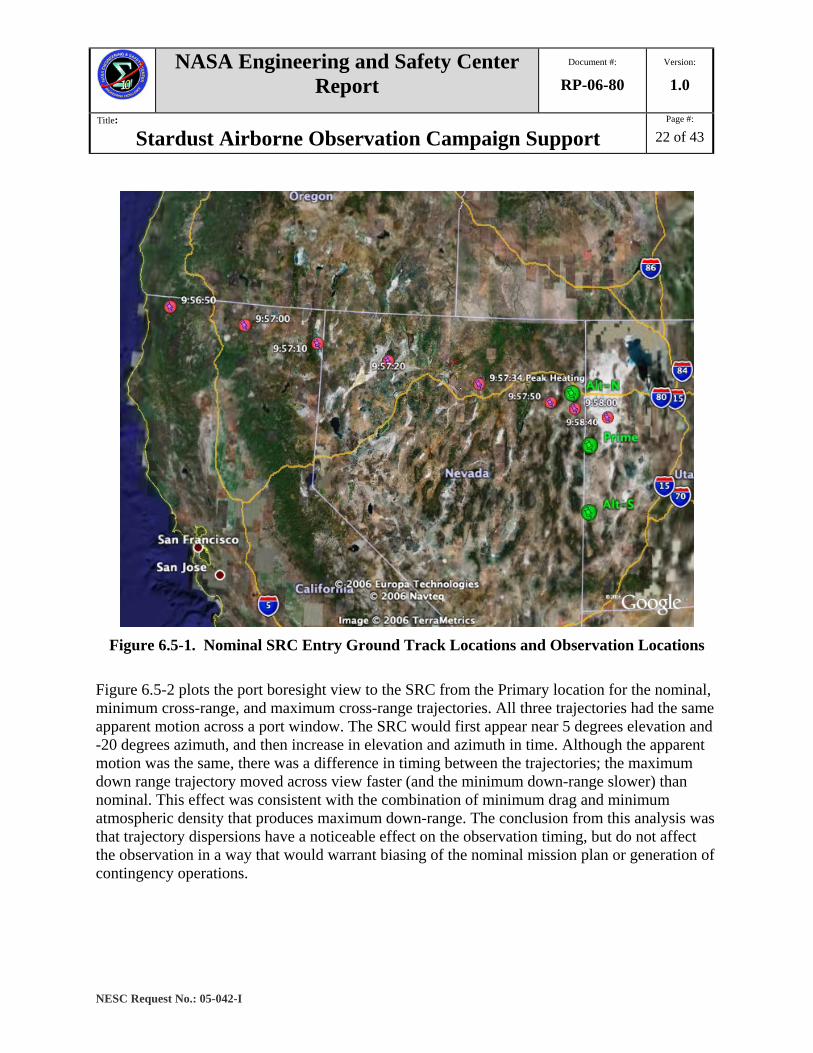
Primary 39.88 114.5 39 Alternate-North 40.75 114.4 355 Alternate-South 38.75 114.0 45 * 11.9 km, 778 km/hr Points at selected times along the estimated trajectory and the three view locations are shown in Figure 6.5-1. Positions close to the ground track minimized the perspective angle to the SRC. However, these positions also increased the rate of boresight elevation change (the SRC would fly overhead). The Primary location was chosen to be outside of the western border of the UTTR and south of ground track. South of ground track oriented the full Moon (and its light) more toward the starboard side. Positions north of ground track placed the Moon in view of the instruments, potentially saturating them during an SRC-Moon transit. The sensitivity of the characteristics of the view geometry to potential trajectory dispersions was determined for each of the view locations. Several trajectories were assessed: maximum cross-range (north and south of nominal), minimum and maximum peak heating, and minimum and maximum down-range. In terms of the observation, only the min/max down-range trajectories had any affect on the view geometry. The dispersion in cross-range was manifested during the later portions of the entry trajectory when the vehicle had substantially and sufficiently decelerated to be affected by atmospheric variations; during the planned observation in the hypersonic regime, cross-range dispersions had negligible effect. The variations between min/max peak heating trajectories were similar in kind and less in magnitude than between min/max down-range trajectories.
NASA Engineering and Safety Center Report
Document #:
RP-06-80 Version:
1.0
Title:
Stardust Airborne Observation Campaign Support Page #:
22 of 43
NESC Request No.: 05-042-I
Figure 6.5-1. Nominal SRC Entry Ground Track Locations and Observation Locations
Figure 6.5-2 plots the port boresight view to the SRC from the Primary location for the nominal, minimum cross-range, and maximum cross-range trajectories. All three trajectories had the same apparent motion across a port window. The SRC would first appear near 5 degrees elevation and -20 degrees azimuth, and then increase in elevation and azimuth in time. Although the apparent motion was the same, there was a difference in timing between the trajectories; the maximum down range trajectory moved across view faster (and the minimum down-range slower) than nominal. This effect was consistent with the combination of minimum drag and minimum atmospheric density that produces maximum down-range. The conclusion from this analysis was that trajectory dispersions have a noticeable effect on the observation timing, but do not affect the observation in a way that would warrant biasing of the nominal mission plan or generation of contingency operations.

NASA Engineering and Safety Center Report
Document #:
RP-06-80 Version:
1.0
Title:
Stardust Airborne Observation Campaign Support Page #:
23 of 43
NESC Request No.: 05-042-I
40
35
30
25
20
15
10
5
0
-5
-10
Bor
esig
ht E
leva
tion
-60 -40 -20 0 20 40 60
Boresight Azimuth
nom PH: E+52 s
nominal min downrange max downrange
min downrange PH: E+51 s
entry: 9:56:42.3
s06014c7am 1/14/05
View from Prime
Lat 39.88°Long -114.5°
39kft AltHeading 39° Absolute
max downrange PH: E+55 s
nom: E+70 s
min DR: E+70 s
max DR: E+70 s
Figure 6.5-2. Predicted Path of SRC across Port Window from Primary View Location for Nominal, Minimum Down-Range, and Maximum Down-Range Trajectories
It was calculated that the view from the Primary location, including the effects of trajectory dispersion, would yield a perspective angle to the SRC between 17 to 20 degrees at peak heating at a range of ~200 km. There would be 7 to 13 s of viewing beyond peak heating with perspective angles less than 30 degrees and ~100 km range. There would be ~8 s of viewing, with elevation angles between 12 to 16 degrees, the center of which shifts ~4 s around the time of peak heating. The SRC was predicted to move out of view to the right side of the window (60 degrees azimuth) ~70 to100 s from entry. The view from the Alternate-North location was estimated to have similar characteristics as the Primary. However, the SRC would track right to left across the port window. To avoid controlled airspace near Wendover, Nevada, the Alternate-North location was closer to the ground track as compared to the Primary. Therefore, perspective angles were smaller (14 to18 degrees at peak heating) and the duration of view with perspective angle less than 30 degrees was ~ 10 s longer. The major drawback of the Alternate-North position was that the Moon would be in view of the instruments. The Alternate-South position was the least desirable. The objective of the alternate positions was to be sufficiently far away from Primary to have a chance for a cleared cirrus layer. Moving perpendicular to the ground track increased perspective angles beyond 30 degrees. Thus, the only alternative was to maintain the same angle between the view direction and ground track at peak heating location, but move farther away. Thus the range to target from Alternate-South was ~120 km greater than Primary at peak heating. Elevation angles remained below 10 degrees at all times, and the entire SRC entry would be in view.
NASA Engineering and Safety Center Report
Document #:
RP-06-80 Version:
1.0
Title:
Stardust Airborne Observation Campaign Support Page #:
24 of 43
NESC Request No.: 05-042-I
The observation flight plan was to fly a counter-clockwise ‘racetrack’ pattern comprised of a 4 minutes viewing leg, a 4 minutes return leg, and two 3 minutes reverse legs. With viewing out of the port side, the movement of the aircraft during the observation leg was toward the SRC ground track. The time-on-target was to be initiated at the beginning of the view leg.
7.0 Data Analysis The DC-8 arrived at ARC on January 4, 2006. The next several days were spent attending to the details of installing instrument mounts, cabling, and the instruments themselves. A Final Installation Inspection Review was held on January 11th to certify all installations were performed according to requirements for safe operation and to clear the aircraft for two project check-flights. The first check-flight was flown on January 12th, departing ARC at 23:45 Pacific Standard Time (PST). The objectives for this flight were to gain experience in in-flight instrument set up, check for effective operation of the optical window anti-fog and ice systems, and set up curtains to block cabin light from reflecting on the optical windows. Astronomical targets were the Moon and the flare of an Iridium satellite. Several instruments acquired the Iridium flare. Some window fog and ice problems were observed and were corrected. The second check-flight was flown in the early morning of January 13th centered around 1:15 PST., at which time the Moon conditions were the same as that during the Stardust observing mission. The objectives for this second test flight were to gain experience in in-flight instrument set up, confirm that changes made to the optical window anti-fog and ice systems were effective, characterize the Moon's luminescent contribution to the acquired signal, and practice the race track flight patterns that would be flown during the mission. Astronomical target was the planet Mars. The flight path was towards the staging area at the Utah/Nevada border, following the same path as to be flown during the actual mission. There were lingering frost and ice problems that were addressed through in-flight modification. The weather conditions worsened in the days leading up to the mission. A cold front caused heavy rain at the Moffett Air Field on the day of January 14th. It cleared in the early evening, the front moving East towards the staging area in Nevada. Most ground-based observers in Nevada would be clouded out that night, with the exception of observers in some clearings near the Utah/Nevada border. The observation mission activity began on January 14th with the aircraft door opening at 18:00 PST. Upon opening, it was found that the cold air had condensed water on the windows inside the cabin, which was now dripping on the instrument panels. Fortunately, the air quickly dried once at altitude and there were no condensation problems during the mission. A safety briefing was held at 21:00 PST with a pre-flight briefing following at 22:30 PST. Everyone boarded the aircraft and the door was closed at 23:28 PST. Communication checks between the aircraft and the observation representative stationed at JPL were conducted as were communication checks between the on-board investigators and mission manager. The aircraft taxied into position at the end of the runway and waited for departure time. The aircraft took off at 00:08 PST January 15th.

NASA Engineering and Safety Center Report
Document #:
RP-06-80 Version:
1.0
Title:
Stardust Airborne Observation Campaign Support Page #:
25 of 43
NESC Request No.: 05-042-I
The aircraft arrived at the primary view location at UTC 8:59:32. There were clouds below the aircraft but no high cirrus layer. Therefore, the aircraft remained at the primary view location for the observation. A series of three practice racetrack patterns were performed. The racetrack patterns were composed of two 3-minute turns and two 4-minute straight legs. There was no significant turbulence. At UTC 15 January 2006 9:56:42, the DC-8 was at 39.8475N and 114.5442W, approximately 6.4 km from the designated location, flying at 11.9 km and 778 km/hr. At the start of the observation leg, the aircraft heading was 36.5 degrees N, which is slightly more northward than desired (see Table 7.0-1) to account for a cross wind. By the end of the observation, the aircraft heading was 38.4 degrees, very near the planned heading. After completion of the observation leg of the pattern at UTC 9:59:12, the aircraft completed two more racetrack patterns to observe any lingering luminescent trail. The aircraft returned to ARC at approximately 3:56 PST. The SRC entered as predicted from the latest trajectory update. It was acquired by the NIRSPEC-C IR spotting camera as early as UTC 9:57:01. The NIRSPEC-c video can by downloaded at http://reentry.arc.nasa.gov. In terms of data acquisition, the observation was highly successful. Fifteen of eighteen instruments obtained data. Of those that did not record data, the ALLSKY camera was aimed for contingency off-nominal entry and not expected to obtain data for nominal flight. Another, INT-2 was mounted in a starboard view port to potentially observe a lingering wake train when the aircraft turned; as it turned out, the train had faded by that time. Therefore, in terms of potential data acquisition for nominal flight, there was only one instrument that, due to error or failure, did not obtain data. A description of the data obtained by each instrument is contained in Table 7.0-1. Due to the bad weather in Nevada, the ground-based observations were only partially successful. High quality infrasound signals were obtained that measures the strength of the acoustic shock wave. The trajectory was imaged (digital imaging and hand-held video camcorder data) from only a handful of sites, results of which can be used in the trajectory reconstructions.

NASA Engineering and Safety Center Report
Document #:
RP-06-80 Version:
1.0
Title:
Stardust Airborne Observation Campaign Support Page #:
26 of 43
NESC Request No.: 05-042-I
Table 7.0-1. Individual Instrument Data Instrument Instrument PI Period of
Observation (UTC 15 Jan 2006)
Utility of Data Comment
ALLSKY Peter Jenniskens
No data. Contingency instrument for deviant trajectory. Nominal trajectory not in view.
PHOT Hans Stenbeak-Nielsen (SPALDING?)
No data. Instrument shut-off during aircraft reverse-legs to shield from ground illumination. Erroneously left off during observation leg.
ASTRO Peter Jenniskens
9:57:32.9 – 9:57:36.7
Detection of ablation product signatures 406-490 nm, blackbody signature 812-920 nm. Objectives 1 and 2.
Most direct calibration to anchor other instrument observations. Period of observation spans predicted peak heating.
NUV-a Shinsuke Abe
9:57:10 – 9:57:54
High signal-to-noise record of shock emissions 300-550 nm. Objectives 1 and 2.
S/N comes at expense of spectral resolution. Visible portion saturated between 9:57:30-9:57:45. Near UV unsaturated throughout.
NUV-b Rick Rairden
9:57:11 – 9:57:46
High signal-to-noise record of shock emissions 300-430 nm. Objectives 1 and 2.
S/N comes at expense of spectral resolution, unsaturated throughout.
INT-1a Peter Jenniskens
9:57:04- 9:57:48
Total radiance obtained. Low resolution spectroscopy across spectral range. Objectives 1 and 2.
Image saturated beyond 9:57:37 fouling direct radiance measurement, however spectral information persists.
INT-1b Peter Jenniskens
9:57:31- 9:57:57
Total radiance obtained. Low resolution spectroscopy across spectral range. Objectives 1 and 2.
Instrument settings complimentary to INT-1a. Unsaturated data obtained during later part of trajectory.
Echelle Peter Jenniskens
9:57:16.1 – 9:57:26.0
Shock layer emission in the bands 360-880 nm, blackbody signature. Objectives 1 and 2.
Two detection epochs programmed, no data obtained during second epoch that spanned peak heating. Detection of trace species early in entry suspected to be the forebody paint.

NASA Engineering and Safety Center Report
Document #:
RP-06-80 Version:
1.0
Title:
Stardust Airborne Observation Campaign Support Page #:
27 of 43
NESC Request No.: 05-042-I
Instrument Instrument PI Period of Observation (UTC 15 Jan 2006)
Utility of Data Comment
SLIT Michael Winter
9:57:20- 9:57:40
Shock layer emission in the bands 320-470 nm. Objectives 1 and 2.
Fixed wavelength scale resolves uncertainties in band assignments for this and other instruments.
HFRS Geoff McHarg
9:57:20- 9:57:57
High frame rate, low resolution spectroscopy. Objective 2.
Potential to assess temporal fluctuations in signature.
NIRSPEC–a Mike Taylor
9:57:10 – 9:57:57
Narrow band shock layer emission in the near IR 938-1050 nm which also spans carbon emission. Objective 2.
Long duration, unsaturated coverage of entry.
NIRSPEC–b Mike Taylor
9:57:10 – 9:57:57
Broad band blackbody emission 650-1600 nm. Objective 1.
Long duration, unsaturated coverage of entry.
NIRSPEC–c Mike Taylor
9:57:01 – 9:57:57
SRC against star background can be used to determine trajectory in hypersonic regime.
Spotting camera. Source of entry video sequence posted on website. Saturated beyond 9:57:10, which destroys emission measurement but still useful for trajectory reconstruction.
IHFRI Hans Stenbeak-Nielsen
9:57:47- 9:57:57
High frame rate spectroscopy. Objective 2.
Observation period during peak deceleration.
THDTV Ed Schilling
9:57:10- 9:57:54
Broadband photometry. Objective 1.
Long duration observation.
DIM Paul Wercinski
?
INT-2 Peter Jenniskens
No data. Mounted on starboard viewport for observation of train, which had faded before the aircraft turn.
ST-10 Franziska Harms
9:57:20- 9:58:40
Low resolution spectra of wake train. Objective 3.
Series of images shows development of wake train morphology.
NASA Engineering and Safety Center Report
Document #:
RP-06-80 Version:
1.0
Title:
Stardust Airborne Observation Campaign Support Page #:
28 of 43
NESC Request No.: 05-042-I
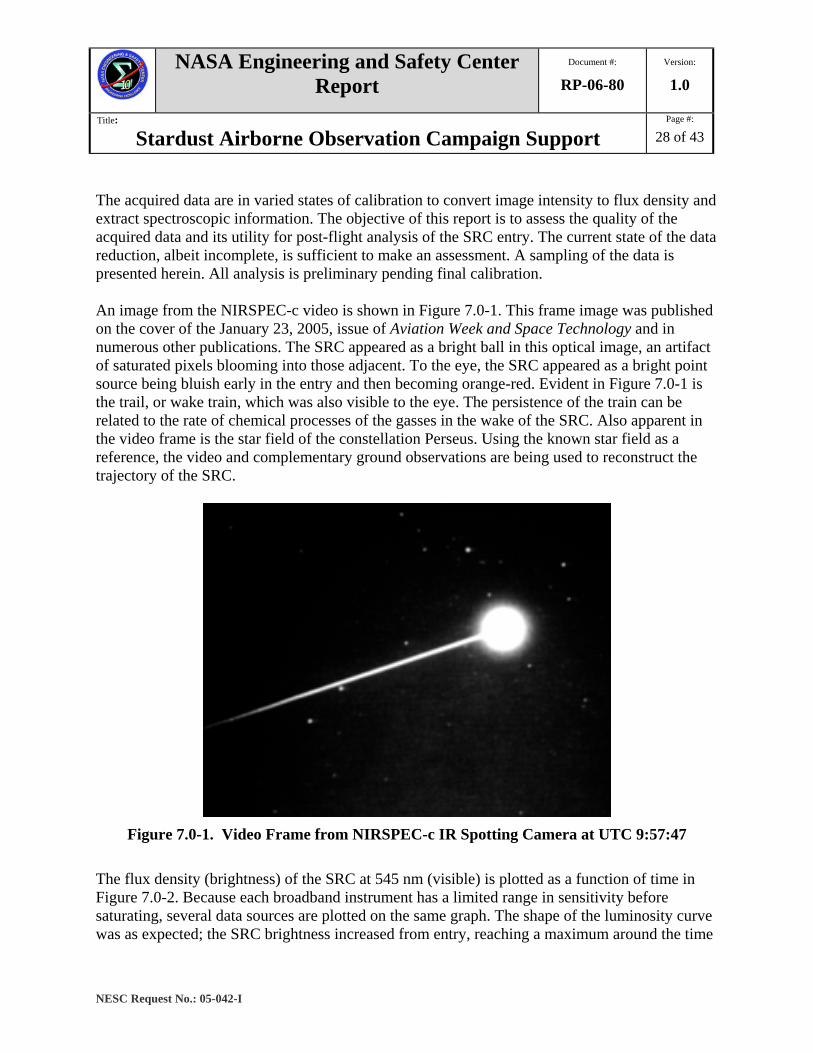
The acquired data are in varied states of calibration to convert image intensity to flux density and extract spectroscopic information. The objective of this report is to assess the quality of the acquired data and its utility for post-flight analysis of the SRC entry. The current state of the data reduction, albeit incomplete, is sufficient to make an assessment. A sampling of the data is presented herein. All analysis is preliminary pending final calibration. An image from the NIRSPEC-c video is shown in Figure 7.0-1. This frame image was published on the cover of the January 23, 2005, issue of Aviation Week and Space Technology and in numerous other publications. The SRC appeared as a bright ball in this optical image, an artifact of saturated pixels blooming into those adjacent. To the eye, the SRC appeared as a bright point source being bluish early in the entry and then becoming orange-red. Evident in Figure 7.0-1 is the trail, or wake train, which was also visible to the eye. The persistence of the train can be related to the rate of chemical processes of the gasses in the wake of the SRC. Also apparent in the video frame is the star field of the constellation Perseus. Using the known star field as a reference, the video and complementary ground observations are being used to reconstruct the trajectory of the SRC.
Figure 7.0-1. Video Frame from NIRSPEC-c IR Spotting Camera at UTC 9:57:47
The flux density (brightness) of the SRC at 545 nm (visible) is plotted as a function of time in Figure 7.0-2. Because each broadband instrument has a limited range in sensitivity before saturating, several data sources are plotted on the same graph. The shape of the luminosity curve was as expected; the SRC brightness increased from entry, reaching a maximum around the time
NASA Engineering and Safety Center Report
Document #:
RP-06-80 Version:
1.0
Title:
Stardust Airborne Observation Campaign Support Page #:
29 of 43
NESC Request No.: 05-042-I
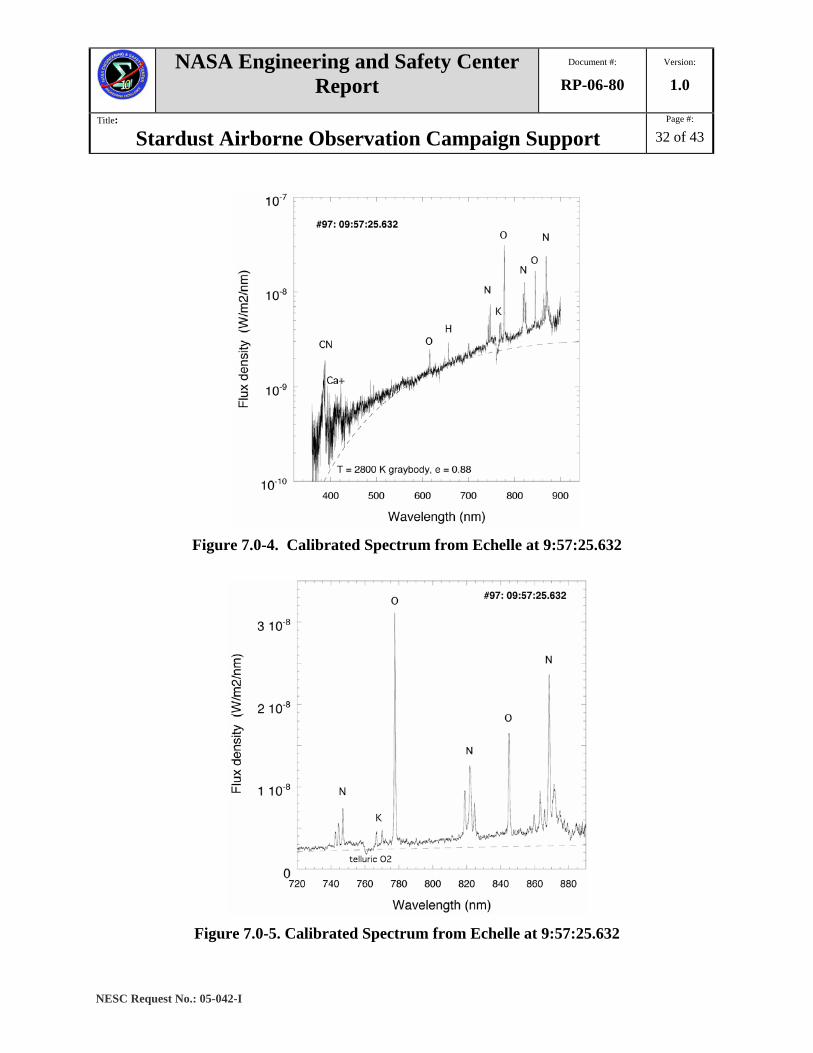
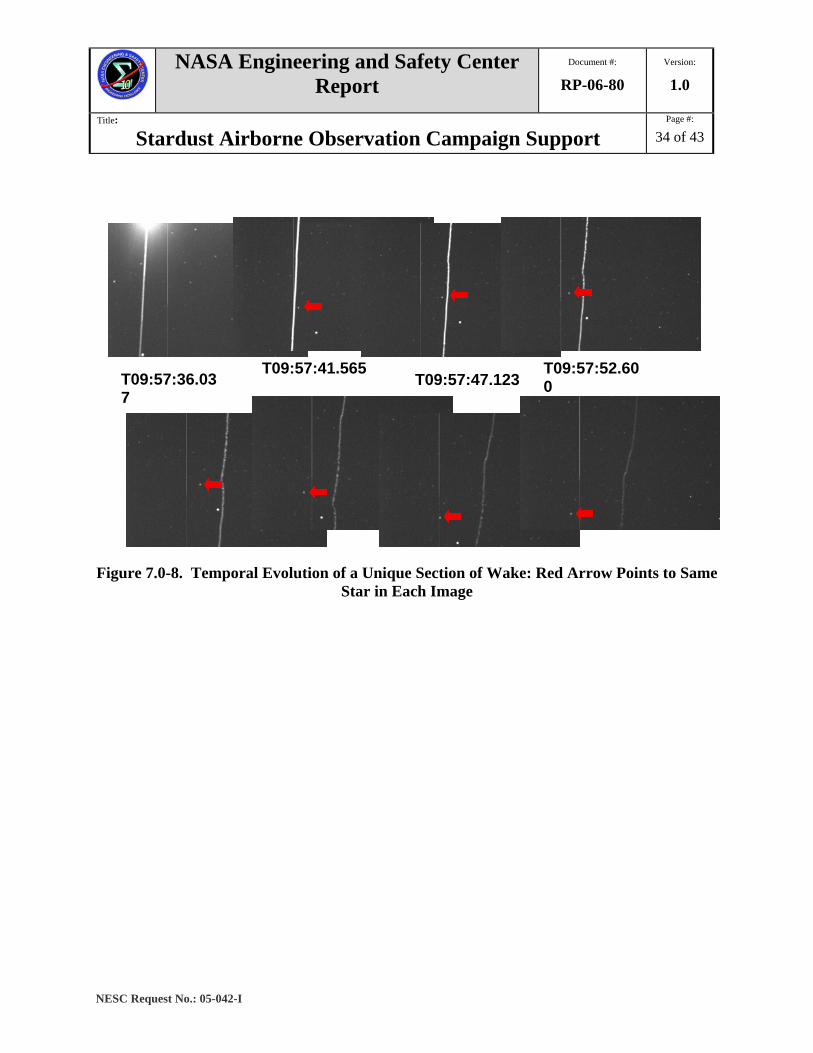
of predicted peak heating (9:57:33), then decayed as the SRC continued to decelerate and the perspective angle increased (thus reducing the view of the forebody). Note the consistency in quantitative measurements from the data sources to date. Figure 7.0-3 shows the uncalibrated spectrum obtained by NIRSPEC-a at approximately 9:57:31. The spectral signal was of the same character as predicted by pre-flight simulation: a broadband intensity distribution overlayed with atomic emissions peaking above bulk signal. Signal peaks were typical of atomic features of air emission. Calibrated signals from Echelle are shown in Figures 7.0-4 through 7.0-6. A portion of the broadband curve at approximately 9:57:26 is shown in Figure 7.0-4. The portion of the spectrum is narrower as compared to the NIRSPEC-a data of Figure 7.0-3; however, the spectral resolution is greater. These data can be used in combination to assess the average blackbody temperature of the SRC. A higher resolution view of the signal is shown in Figure 7.0-5. Emission peaks occurred in bands typical of atomic species of air. Notice the emission peaks near 770 nm coincident with potassium signature. This apparent potassium emission was also evident earlier in the trajectory as shown in Figure 7.0-6 taken at 9:57:17. Also evident were emission lines characteristic of zinc. The forebody heatshield of the SRC was covered with potassium silicate thermal control coating (paint) containing a zinc oxide pigment. The apparent potassium and zinc signatures appeared early in the trajectory and then diminished. It is believed that the spectrometers witnessed the paint burning off the heatshield. Emission from carbon-containing species was also detected. Figure 7.0-7 shows flux density attributed to CN as a function of time as recorded by SLIT. A strong radiator, CN was a sensitive marker to the amount of constituent carbon in the shock layer. There were two sources of carbon: trace carbon-dioxide that existed in the atmosphere and outgassing from the heatshield. It is expected that the carbon products from ablation was the dominant source. Past computational simulations of the flowfield and arcjet studies in the absence of CO2 showed that CN rapidly forms in the shock layer as carbonaceous gasses pyrolyize from the ablative heatshield. The amount of CN radiation was a function of the ablation rate (amount of carbon injected into the shock layer) and the rate of chemical reactions in shock layer. The CN intensity curve had a profile similar to the flux density of Figure 7.0-2: an increase in intensity to a maximum about the time of predicted peak heating, and then a decrease as the SRC decelerated. Interestingly, the profile of Figure 7.0-7 is suggestive of a constant level of intensity from 9:57:29-9:57:42, which may correspond to a steady-state ablation mode typical of high heat flux bearing ablators. Capturing sequential images of a single star field, through which the SRC transited, yielded the temporal evolution of a unique section of the wake (Figure 7.0-8). A single (approximately) star field was observed by the ST-10 imager for approximately 40 s following passage of the SRC. Eight images of the wake and surrounding star field were acquired with high spatial and temporal resolution; identifiable stars are captured in every frame, and the frames were time-stamped using IRIG-B to an absolute precision of +/- 0.5 s. These images are not compensated for the relative motion of the aircraft. The wake images show two broad trends. First, the wake kinks substantially within a few seconds of formation; the kinking increased with time as the

NASA Engineering and Safety Center Report
Document #:
RP-06-80 Version:
1.0
Title:
Stardust Airborne Observation Campaign Support Page #:
30 of 43
NESC Request No.: 05-042-I
wake dissipates. This kinking may be the result of high-altitude winds or vortical effects. Second, the optical intensity of the wake decreases with time. The persistence of luminous wakes has been attributed to the chemiluminescent formation of excited NO2 molecules from bow shock species (N, O, and NO); the collisional formation and quenching processes are slow at the low densities of the wake. Analysis of the intensity as a function of time should allow comparison with simplified kinetic models of wake emission.
Figure 7.0-2. Evolution of Flux Density from Imaged SRC

NASA Engineering and Safety Center Report
Document #:
RP-06-80 Version:
1.0
Title:
Stardust Airborne Observation Campaign Support Page #:
31 of 43
NESC Request No.: 05-042-I
Figure 7.0-3. Uncalibrated Spectrum from NIRSPEC-a at 9:57:30.813; Gray Zone shows
the Spectral Region covered by NIRSPEC-b
NASA Engineering and Safety Center Report
Document #:
RP-06-80 Version:
1.0
Title:
Stardust Airborne Observation Campaign Support Page #:
32 of 43
NESC Request No.: 05-042-I
Figure 7.0-4. Calibrated Spectrum from Echelle at 9:57:25.632
Figure 7.0-5. Calibrated Spectrum from Echelle at 9:57:25.632

NASA Engineering and Safety Center Report
Document #:
RP-06-80 Version:
1.0
Title:
Stardust Airborne Observation Campaign Support Page #:
33 of 43
NESC Request No.: 05-042-I
Figure 7.0-6. Calibrated spectrum from Echelle at 9:57:17.027
0
1 10 -10
2 10 -10
3 10 -10
4 10 -10
5 10 -10
6 10 -10
7 10 -10
8 10 -10
10 15 20 25 30 35 40 45 50
CN
pea
k flu
x de
nsity
(W/m
2/nm
)
Time (UTC - 09:57)
Figure 7.0-7. Calibrated Flux Density of CN Band Emission from SLIT
NASA Engineering and Safety Center Report
Document #:
RP-06-80 Version:
1.0
Title:
Stardust Airborne Observation Campaign Support Page #:
34 of 43
NESC Request No.: 05-042-I
Figure 7.0-8. Temporal Evolution of a Unique Section of Wake: Red Arrow Points to Same Star in Each Image
T09:57:36.037
T09:57:41.565 T09:57:47.123
T09:57:52.600
NASA Engineering and Safety Center Report
Document #:
RP-06-80 Version:
1.0
Title:
Stardust Airborne Observation Campaign Support Page #:
35 of 43
NESC Request No.: 05-042-I
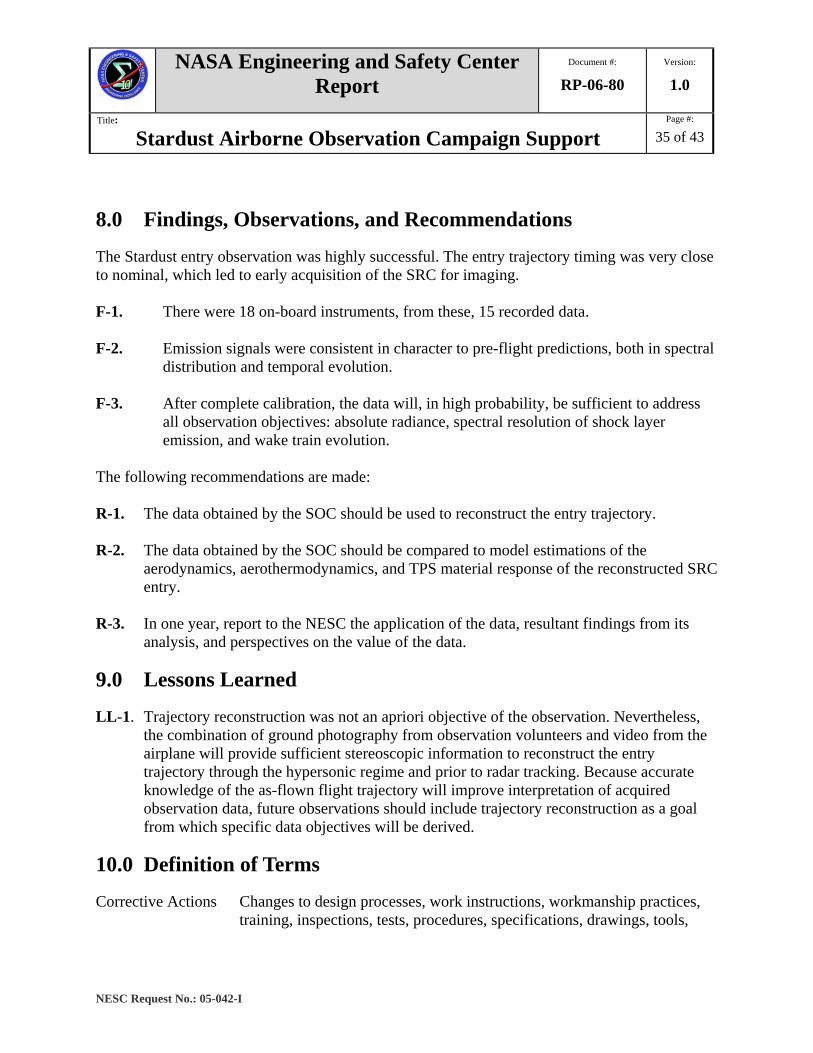
8.0 Findings, Observations, and Recommendations
The Stardust entry observation was highly successful. The entry trajectory timing was very close to nominal, which led to early acquisition of the SRC for imaging. F-1. There were 18 on-board instruments, from these, 15 recorded data.
F-2. Emission signals were consistent in character to pre-flight predictions, both in spectral
distribution and temporal evolution.
F-3. After complete calibration, the data will, in high probability, be sufficient to address all observation objectives: absolute radiance, spectral resolution of shock layer emission, and wake train evolution.
The following recommendations are made: R-1. The data obtained by the SOC should be used to reconstruct the entry trajectory. R-2. The data obtained by the SOC should be compared to model estimations of the
aerodynamics, aerothermodynamics, and TPS material response of the reconstructed SRC entry.
R-3. In one year, report to the NESC the application of the data, resultant findings from its
analysis, and perspectives on the value of the data.
9.0 Lessons Learned
LL-1. Trajectory reconstruction was not an apriori objective of the observation. Nevertheless, the combination of ground photography from observation volunteers and video from the airplane will provide sufficient stereoscopic information to reconstruct the entry trajectory through the hypersonic regime and prior to radar tracking. Because accurate knowledge of the as-flown flight trajectory will improve interpretation of acquired observation data, future observations should include trajectory reconstruction as a goal from which specific data objectives will be derived.
10.0 Definition of Terms
Corrective Actions Changes to design processes, work instructions, workmanship practices, training, inspections, tests, procedures, specifications, drawings, tools,
NASA Engineering and Safety Center Report
Document #:
RP-06-80 Version:
1.0
Title:
Stardust Airborne Observation Campaign Support Page #:
36 of 43
NESC Request No.: 05-042-I
equipment, facilities, resources, or material that result in preventing, minimizing, or limiting the potential for recurrence of a problem.
Finding A conclusion based on facts established during the assessment/inspection
by the investigating authority. Lessons Learned Knowledge or understanding gained by experience. The experience may
be positive, as in a successful test or mission, or negative, as in a mishap or failure. A lesson must be significant in that it has real or assumed impact on operations; valid in that it is factually and technically correct; and applicable in that it identifies a specific design, process, or decision that reduces or limits the potential for failures and mishaps, or reinforces a positive result.
Observation A factor, event, or circumstance identified during the
assessment/inspection that did not contribute to the problem, but if left uncorrected has the potential to cause a mishap, injury, or increase the severity should a mishap occur.
Problem The subject of the independent technical assessment/inspection. Recommendation An action identified by the assessment/inspection team to correct a root
cause or deficiency identified during the investigation. The recommendations may be used by the responsible C/P/P/O in the preparation of a corrective action plan.
Root Cause Along a chain of events leading to a mishap or close call, the first causal
action or failure to act that could have been controlled systemically either by policy/practice/procedure or individual adherence to policy/practice/procedure.
11.0 Alternate Viewpoint
There were no alternate viewpoints.
12.0 List of Acronyms
ADP Advanced Development Project ARC Ames Research Center CEV Crew Exploration Vehicle CFD Computational Fluid Dynamic

NASA Engineering and Safety Center Report
Document #:
RP-06-80 Version:
1.0
Title:
Stardust Airborne Observation Campaign Support Page #:
37 of 43
NESC Request No.: 05-042-I
CN Cyanogen CO2 Carbon Dioxide DFRC Dryden Flight Research Center DPLR Data Parallel Line Relaxation ESMD Exploration Systems Mission Directorate GOC Genesis Observation Campaign IR Infrared JPL Jet Propulsion Laboratory JSC Johnson Space Center K Kilo kft Kilo-feet kts Knots LaRC Langley Research Center N2 Nitrogen NCE NESC Chief Engineer NDE NESC’s Discipline Expert NEQAIR Non-Equilibrium Air Radiation NESC NASA Engineering and Safety Center NRB NESC Review Board PICA Phenolic Impregnated Carbon Ablator PST Pacific Standard Time QSS Quasi-Steady-State SEO Systems Engineering Office SOC Stardust Observation Campaign SRC Stardust Sample Return Capsule TPS Thermal Protection System UND University of North Dakota UTC Universal Time Coordinated UTTR Utah Test and Training Range UV Ultraviolet WFF Wallops Flight Facility
13.0 References
1. Allen, H. Julian, and Eggers, Alfred J., Jr. "A Study of the Motion and Aerodynamic Heating of Ballistic Missiles Entering the Earth's Atmosphere at High Supersonic Speeds." NACA Technical Report 1381, Forty-Fourth Annual Report of the NACA—1958. Washington, D.C.: 1959, 1125-1140.
2. Radiative Heat Transfer, Modest, Michael, McGraw-Hill, Inc, NY, 1993.

NASA Engineering and Safety Center Report
Document #:
RP-06-80 Version:
1.0
Title:
Stardust Airborne Observation Campaign Support Page #:
38 of 43
NESC Request No.: 05-042-I
3. Wright, M.J., Candler, G.V., and Bose, D., “Data-Parallel Line Relaxation Method for the Navier-Stokes Equations,” AIAA Journal, Vol. 36, No. 9, 1998, pp. 1603-1609.
4. Whiting, E.E., Yen, L., Arnold, J.O., and Paterson, J.A., “NEQAIR96: Nonequilibrium and Equilibrium Radiative Transport and Spectra Program User’s Manual,” NASA RP-1389, December 1996.
5. Cauchon, D.L., “Radiative Heating Results from the Fire II Flight Experiment at Reentry Velocity of 11.4 km/s,” NASA TM X-1402, July 1967.
Volume II: Appendices
A. NESC Request Form (NESC-FM-03-002)
NASA Engineering and Safety Center Report
Document #:
RP-06-80 Version:
1.0
Title:
Stardust Airborne Observation Campaign Support Page #:
39 of 43
NESC Request No.: 05-042-I
Appendix A. NESC Request Form
NASA Engineering and Safety Center Report
Document #:
RP-06-80 Version:
1.0
Title:
Stardust Airborne Observation Campaign Support Page #:
40 of 43
NESC Request No.: 05-042-I
NASA Engineering and Safety Center Report
Document #:
RP-06-80 Version:
1.0
Title:
Stardust Airborne Observation Campaign Support Page #:
41 of 43
NESC Request No.: 05-042-I

NASA Engineering and Safety Center Report
Document #:
RP-06-80 Version:
1.0
Title:
Stardust Airborne Observation Campaign Support Page #:
42 of 43
NESC Request No.: 05-042-I
NASA Engineering and Safety Center Report
Document #:
RP-06-80 Version:
1.0
Title:
Stardust Airborne Observation Campaign Support Page #:
43 of 43
NESC Request No.: 05-042-I
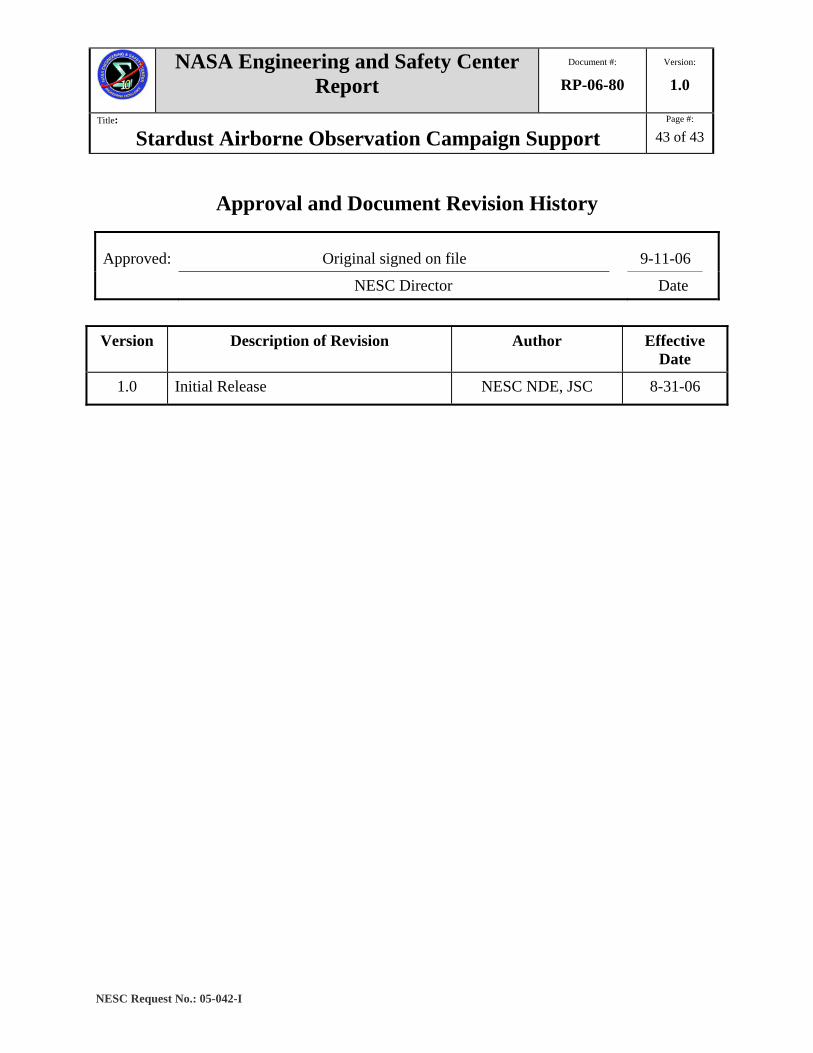
Approval and Document Revision History
Approved: Original signed on file 9-11-06
NESC Director Date
Version Description of Revision Author Effective Date
1.0 Initial Release NESC NDE, JSC 8-31-06