stark-tuscarawas-wayne recycling district packets/2017/9-1...stark-tuscarawas-wayne recycling...
TRANSCRIPT

SEPTEMBER 1, 2017
BOARD OF DIRECTORS
MEETING
Stark-Tuscarawas-Wayne
Recycling District

ROLL CALL

APPROVE SEPTEMBER 1,
2017 BOARD OF DIRECTORS
MEETING AGENDA


APPROVE JULY 14, 2017
BOARD OF DIRECTORS
MEETING MINUTES

PUBLIC SPEAKS

POLICY COMMITTEE REPORT

Executive Summaries (General Public as Audience)
▪ Chapter 1 – Introduction
▪ Chapter 2 – District Profile
▪ Chapter 3 – Waste Generation
▪ Chapter 4 – Waste Management
▪ Chapter 5 – Waste Reduction
▪ Chapter 6 – Budget
Analyses (Ohio EPA as Audience)
22 Appendices (A-V):
▪ Appendix H – Strategic Analysis (~100 pages)
▪ Appendix I – Conclusions, Priorities, Programs (~30 pages)
▪ Appendix L – Outreach/Education Analysis
▪ Appendix O – Budget
2019 SOLID WASTE MANAGEMENT
DISTRICT PLAN UPDATE(~300-PAGE DOCUMENT)
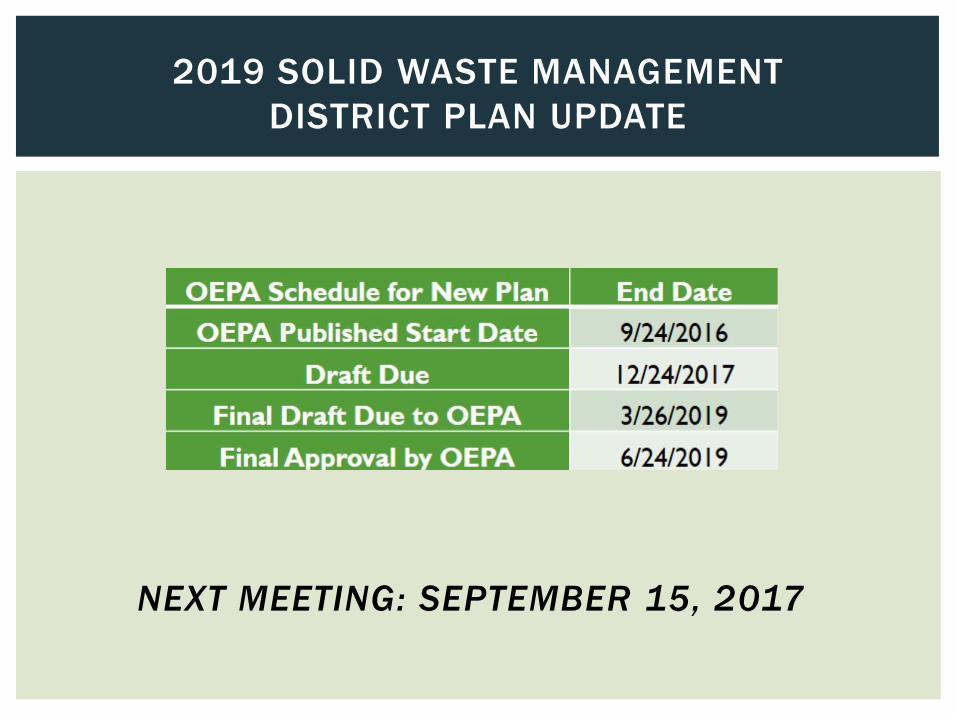
2019 SOLID WASTE MANAGEMENT
DISTRICT PLAN UPDATE
NEXT MEETING: SEPTEMBER 15, 2017
FINANCE DIRECTOR’S REPORT
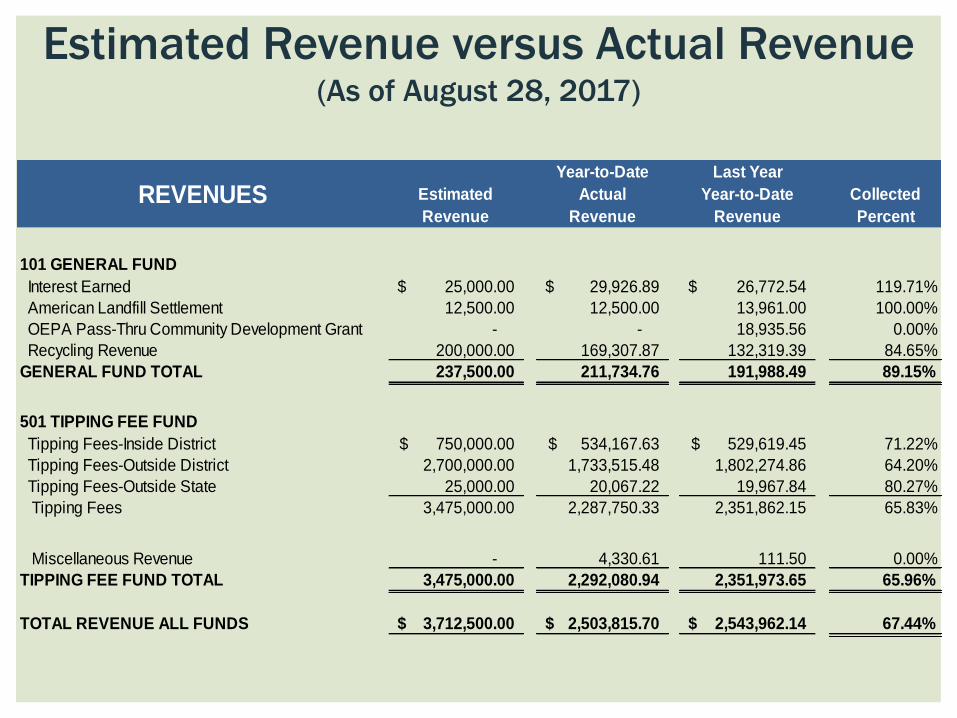
Estimated Revenue versus Actual Revenue(As of August 28, 2017)
REVENUES Estimated
Revenue
Year-to-Date
Actual
Revenue
Last Year
Year-to-Date
Revenue
Collected
Percent
101 GENERAL FUND
Interest Earned 25,000.00$ 29,926.89$ 26,772.54$ 119.71%
American Landfill Settlement 12,500.00 12,500.00 13,961.00 100.00%
OEPA Pass-Thru Community Development Grant - - 18,935.56 0.00%
Recycling Revenue 200,000.00 169,307.87 132,319.39 84.65%
GENERAL FUND TOTAL 237,500.00 211,734.76 191,988.49 89.15%
501 TIPPING FEE FUND
Tipping Fees-Inside District 750,000.00$ 534,167.63$ 529,619.45$ 71.22%
Tipping Fees-Outside District 2,700,000.00 1,733,515.48 1,802,274.86 64.20%
Tipping Fees-Outside State 25,000.00 20,067.22 19,967.84 80.27%
Tipping Fees 3,475,000.00 2,287,750.33 2,351,862.15 65.83%
Miscellaneous Revenue - 4,330.61 111.50 0.00%
TIPPING FEE FUND TOTAL 3,475,000.00 2,292,080.94 2,351,973.65 65.96%
TOTAL REVENUE ALL FUNDS 3,712,500.00$ 2,503,815.70$ 2,543,962.14$ 67.44%
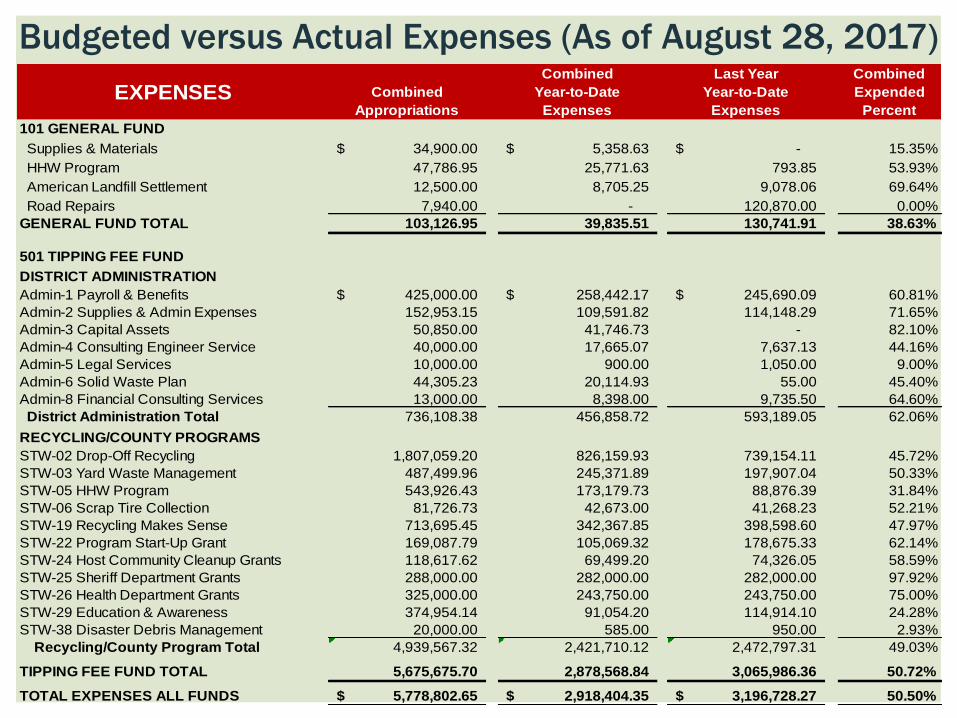
Budgeted versus Actual Expenses (As of August 28, 2017)
EXPENSES Combined
Appropriations
Combined
Year-to-Date
Expenses
Last Year
Year-to-Date
Expenses
Combined
Expended
Percent
101 GENERAL FUND
Supplies & Materials 34,900.00$ 5,358.63$ -$ 15.35%
HHW Program 47,786.95 25,771.63 793.85 53.93%
American Landfill Settlement 12,500.00 8,705.25 9,078.06 69.64%
Road Repairs 7,940.00 - 120,870.00 0.00%
GENERAL FUND TOTAL 103,126.95 39,835.51 130,741.91 38.63%
501 TIPPING FEE FUND
DISTRICT ADMINISTRATION
Admin-1 Payroll & Benefits 425,000.00$ 258,442.17$ 245,690.09$ 60.81%
Admin-2 Supplies & Admin Expenses 152,953.15 109,591.82 114,148.29 71.65%
Admin-3 Capital Assets 50,850.00 41,746.73 - 82.10%
Admin-4 Consulting Engineer Service 40,000.00 17,665.07 7,637.13 44.16%
Admin-5 Legal Services 10,000.00 900.00 1,050.00 9.00%
Admin-6 Solid Waste Plan 44,305.23 20,114.93 55.00 45.40%
Admin-8 Financial Consulting Services 13,000.00 8,398.00 9,735.50 64.60%
District Administration Total 736,108.38 456,858.72 593,189.05 62.06%
RECYCLING/COUNTY PROGRAMS
STW-02 Drop-Off Recycling 1,807,059.20 826,159.93 739,154.11 45.72%
STW-03 Yard Waste Management 487,499.96 245,371.89 197,907.04 50.33%
STW-05 HHW Program 543,926.43 173,179.73 88,876.39 31.84%
STW-06 Scrap Tire Collection 81,726.73 42,673.00 41,268.23 52.21%
STW-19 Recycling Makes Sense 713,695.45 342,367.85 398,598.60 47.97%
STW-22 Program Start-Up Grant 169,087.79 105,069.32 178,675.33 62.14%
STW-24 Host Community Cleanup Grants 118,617.62 69,499.20 74,326.05 58.59%
STW-25 Sheriff Department Grants 288,000.00 282,000.00 282,000.00 97.92%
STW-26 Health Department Grants 325,000.00 243,750.00 243,750.00 75.00%
STW-29 Education & Awareness 374,954.14 91,054.20 114,914.10 24.28%
STW-38 Disaster Debris Management 20,000.00 585.00 950.00 2.93%
Recycling/County Program Total 4,939,567.32 2,421,710.12 2,472,797.31 49.03%
TIPPING FEE FUND TOTAL 5,675,675.70 2,878,568.84 3,065,986.36 50.72%
TOTAL EXPENSES ALL FUNDS 5,778,802.65$ 2,918,404.35$ 3,196,728.27$ 50.50%
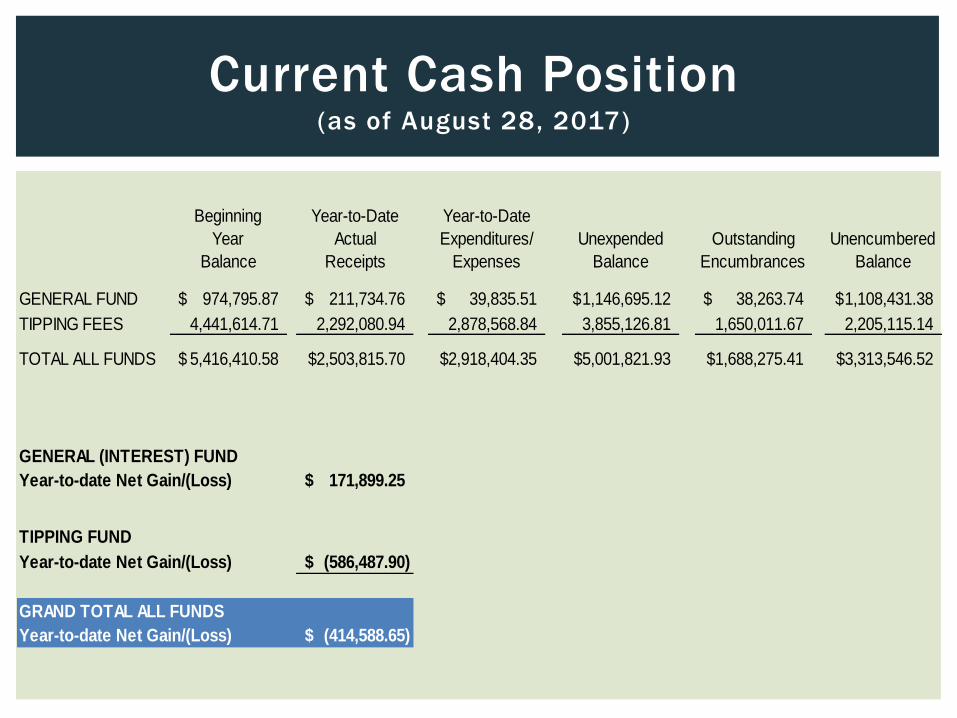
Current Cash Position (as of August 28, 2017)
Beginning
Year
Balance
Year-to-Date
Actual
Receipts
Year-to-Date
Expenditures/
Expenses
Unexpended
Balance
Outstanding
Encumbrances
Unencumbered
Balance
GENERAL FUND 974,795.87$ 211,734.76$ 39,835.51$ 1,146,695.12$ 38,263.74$ 1,108,431.38$
TIPPING FEES 4,441,614.71 2,292,080.94 2,878,568.84 3,855,126.81 1,650,011.67 2,205,115.14
TOTAL ALL FUNDS 5,416,410.58$ 2,503,815.70$ 2,918,404.35$ 5,001,821.93$ 1,688,275.41$ 3,313,546.52$
GENERAL (INTEREST) FUND
Year-to-date Net Gain/(Loss) 171,899.25$
TIPPING FUND
Year-to-date Net Gain/(Loss) (586,487.90)$
GRAND TOTAL ALL FUNDS
Year-to-date Net Gain/(Loss) (414,588.65)$

➢ Tipping fee revenue is up 15.81% in 2017 from 2016 through the first half of the year.
➢ Using the first six months of revenue, we can project an annual tipping fee revenue total of
approximately $3,801,608 based on 48.80% of actual annual revenue was collected during this
time period over the last two years.
Tipping Fee Revenue Update
District Landfills 2016 2017 % Change
American Landfill 557,666.57 685,479.61 22.92%
Countywide RDF 343,035.11 380,846.72 11.02%
Kimble Landfill & Disposal 734,171.95 826,950.68 12.64%
Totals $1,634,873.63 $1,893,277.01 15.81%
Annual Revenue $3,558,775.40 $3,475,000.00 -2.35%
(Actual) (Budgeted)
January - June
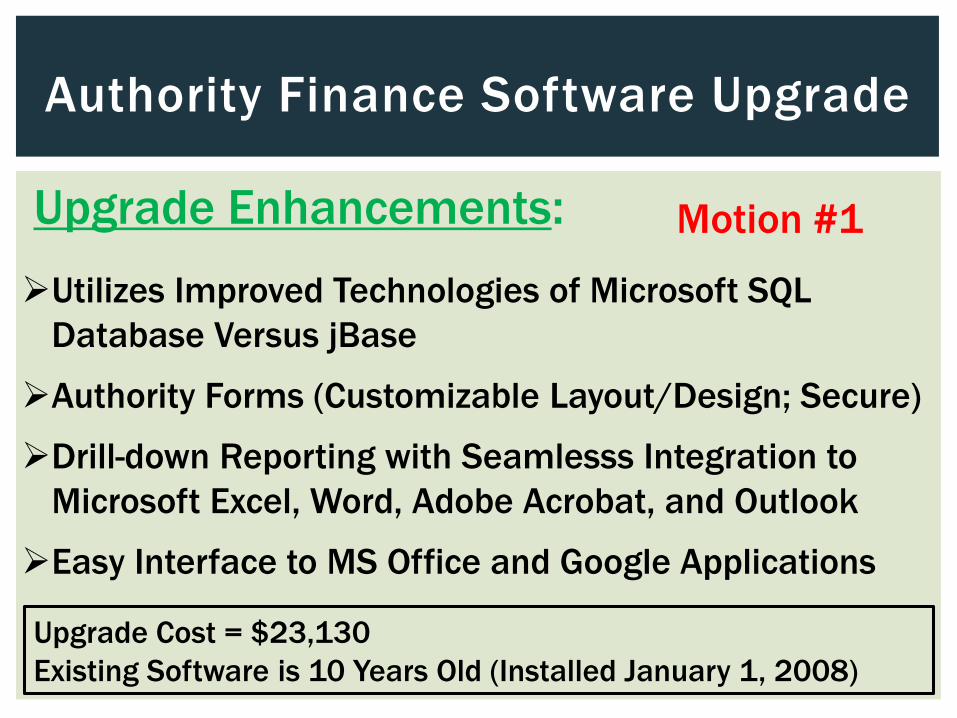
Authority Finance Software Upgrade
Upgrade Enhancements:
➢Utilizes Improved Technologies of Microsoft SQL
Database Versus jBase
➢Authority Forms (Customizable Layout/Design; Secure)
➢Drill-down Reporting with Seamlesss Integration to
Microsoft Excel, Word, Adobe Acrobat, and Outlook
➢Easy Interface to MS Office and Google Applications
Upgrade Cost = $23,130
Existing Software is 10 Years Old (Installed January 1, 2008)
Motion #1

EXECUTIVE DIRECTOR’S REPORT
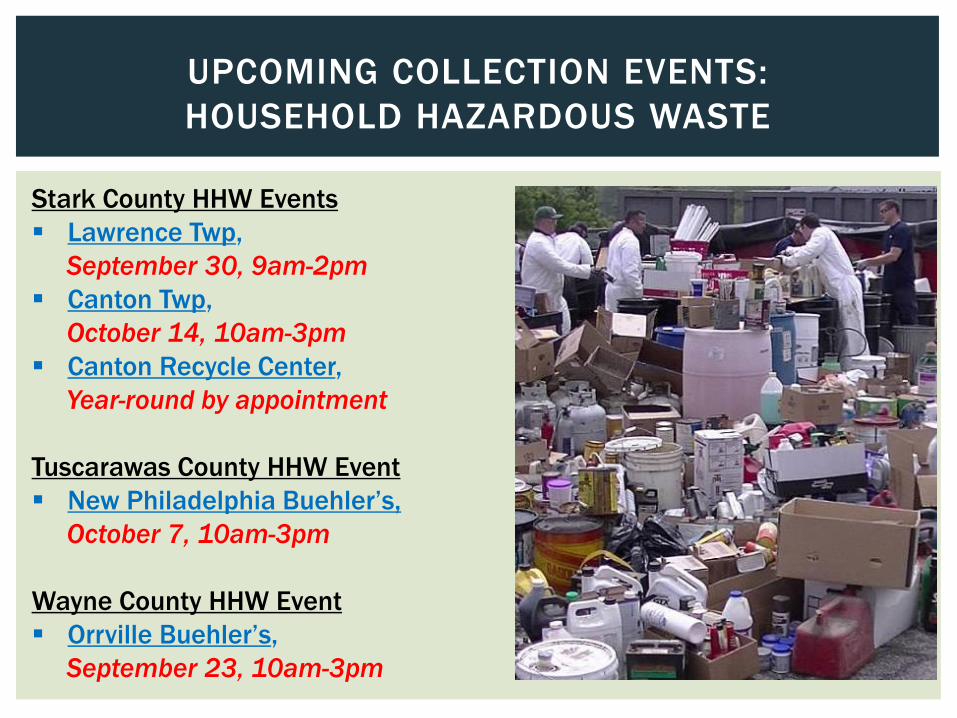
UPCOMING COLLECTION EVENTS:
HOUSEHOLD HAZARDOUS WASTE
Stark County HHW Events
▪ Lawrence Twp,
September 30, 9am-2pm
▪ Canton Twp,
October 14, 10am-3pm
▪ Canton Recycle Center,
Year-round by appointment
Tuscarawas County HHW Event
▪ New Philadelphia Buehler’s,
October 7, 10am-3pm
Wayne County HHW Event
▪ Orrville Buehler’s,
September 23, 10am-3pm

UPCOMING COLLECTION EVENTS:
ANNUAL DRUG TAKEBACK DAY
Stark County Drug Takeback Day
▪ September 23, 10am-2pm
14 locations
Tuscarawas County Drug Takeback Day
▪ October 28, 10am-2pm
3 locations
Wayne County Drug Takeback Day
▪ October 28, 10am-2pm
2 locations

DROP-OFF RECYCLING SITE SURVEILLANCE
80 District Public Recycling Drop-
off Sites
▪ 12 Permanent Surveillance
Systems
▪ High Volume Sites
▪ ~$4,000 2-camera system
Benefits
▪ Daily identification and citation
of illegal dumpers
▪ Cleaner/safer sites
▪ Reduces clean-up cost
▪ Significant reduction in illegal
dumpingExample: 23 warnings/citations
issued at New Philadelphia Buehler’s
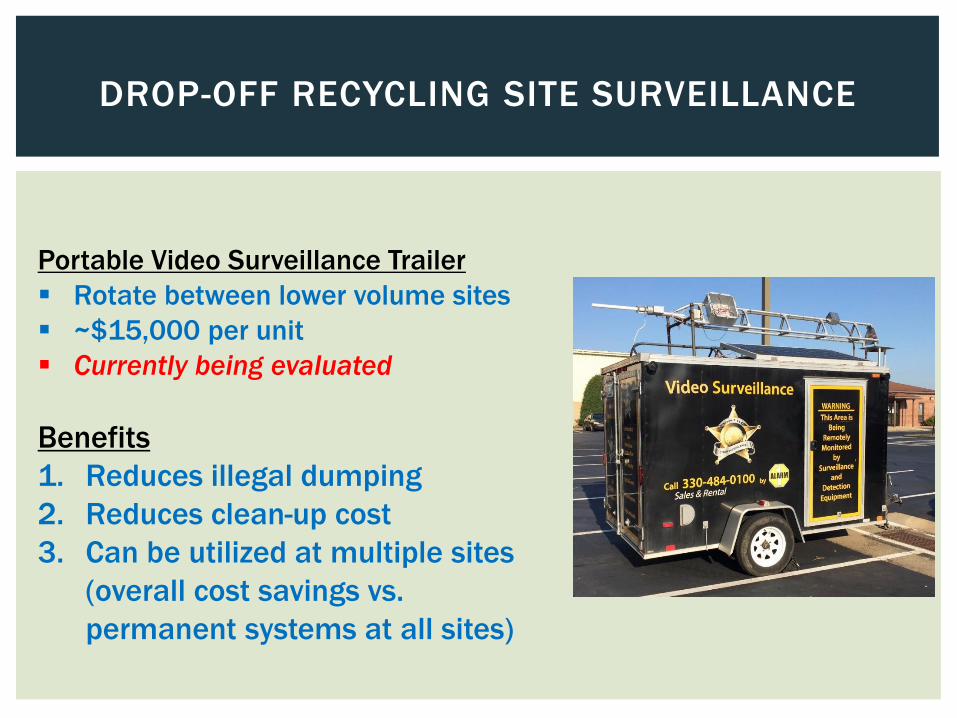
DROP-OFF RECYCLING SITE SURVEILLANCE
Portable Video Surveillance Trailer
▪ Rotate between lower volume sites
▪ ~$15,000 per unit
▪ Currently being evaluated
Benefits
1. Reduces illegal dumping
2. Reduces clean-up cost
3. Can be utilized at multiple sites
(overall cost savings vs.
permanent systems at all sites)

CURBSIDE PROGRAM ASSESSMENTS
CITIES OF CANTON AND NEW PHILADELPHIA
Container Size
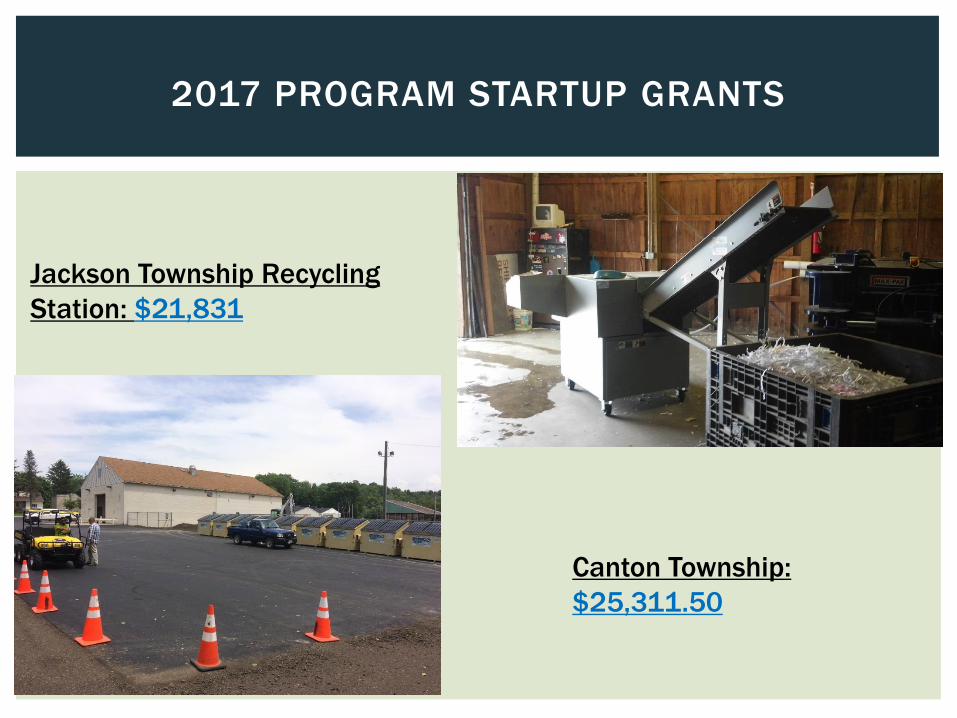
2017 PROGRAM STARTUP GRANTS
Jackson Township Recycling
Station: $21,831
Canton Township:
$25,311.50
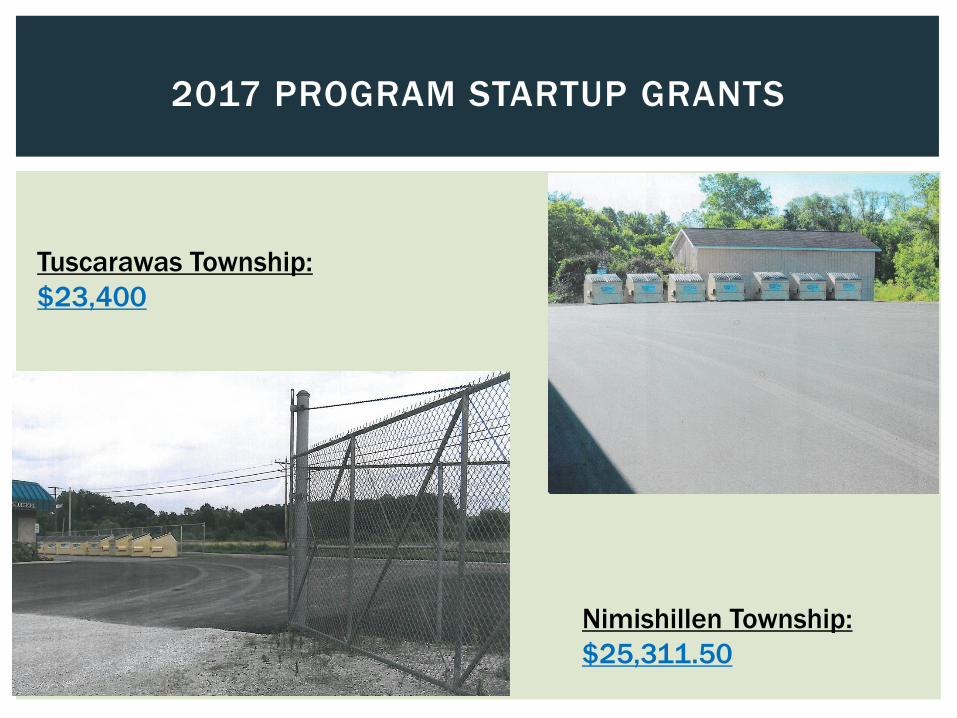
2017 PROGRAM STARTUP GRANTS
Tuscarawas Township:
$23,400
Nimishillen Township:
$25,311.50

YARD WASTE
COLLECTION UPDATE

TOTAL DISTRICT YARD WASTE EXPENSES
(2008-2018 PROJECTION)
PROJECTED
2017 District Yard Waste RateStark $112.36/load (40-yd) &
$224.72/load (80-yd)Tuscarawas $195/load (30-yd)
2018 Projected District Yard Waste RateStark $225/load (40-yd) &
$400/load (80-yd)Tuscarawas $195/load (30-yd)
PROJECTED
2008-2009 District Yard Waste Rates RangeStark $21.75-$26.50/ton Tuscarawas $27.85-$31.85/ton Wayne $6.75-$14.00/yard

TOTAL DISTRICT DROP-OFF TONNAGE 2007-2016
(RECYCLING AND YARD WASTE)
16,43218,642
23,55020,905 21,219 21,517 21,292 23,317 23,388 23,970
27,794
30,330
32,783 37,189 37,37834,070
30,112
35,189 34,599 34,714
0
10,000
20,000
30,000
40,000
50,000
60,000
70,000
2007 2008 2009 2010 2011 2012 2013 2014 2015 2016
TON
S
Recyclables Yard/Food Waste

YARD WASTE COLLECTION OBJECTIVE FOR 2018:
REDUCE $400,000 PROGRAM TO $250,000
1. Reduction of program scope:
-reduce number of sites
-restrict volume at sites (gates/limit hours/grind material)
-redirect residents to private sector
2. Block grant program for collection sites
-District allocates available funding per site
-Sites fund shortfall
3. Residential permit/fee for usage
-annual or per drop fee
4. Identify additional private sector alternatives
-hauling/grinding/processing
5. Explore composting alternatives
-anaerobic and aerobic digestion
*BUDGET COMMITTEE
FOR EVALUATION

EXECUTIVE SESSION TO
DISCUSS COLLECTIVE
BARGAINING AGREEMENT
(ATTORNEY LESLIE IAMS KUNTZ)

OTHER BUSINESS

ADJOURNMENT
Next Board of Directors Meeting:
November 03, 2017 @ 9:30am