state aid to schools a primer - new york state education ... · state aid to schools . a primer ....
TRANSCRIPT

State Aid to Schools
A Primer
Pursuant to Laws of 2013
The University of the State of New York THE STATE EDUCATION DEPARTMENT
Fiscal Analysis and Research Unit July 2013
0

Introduction
The “Primer” is an annual publication highlighting key school aid concepts, including the impact of this year’s legislation. With the goal of locating some basic facts in one place, data and tables for this publication have been excerpted from several State Education Department reports or databases. The report is presented in two parts: • Section I provides an overview of school finance in New York State; • Section II highlights basic concepts and facts about State Aid to schools.
1

Section I School Finance in New York State
Overview
In New York State, estimated 2011-12 public education funding comes from three sources: approximately five percent from federal sources, 40 percent from State formula aids and grants, and 55 percent from revenues raised locally.1 Local property taxes constitute about 89 percent of local revenues. The State assumed a significant portion of this local tax burden through the implementation of the School Tax Relief (STAR) program in 1998. For the 2011-12 fiscal year, STAR is estimated to account for about 14 percent of State revenues, other State aid for the public schools comes primarily from the State General Fund (approximately 74 percent) wherein the major revenue source is State taxes (e.g., income and sales) and the balance (approximately 12 percent) comes from a Special Revenue Fund account supported by lottery receipts. All net revenues from the State lottery are statutorily earmarked for school aid. In addition, the General Fund guarantees the level of lottery funds appropriated for education, making up any shortfall in lottery revenues.2
The major source of local revenue for education in all communities is the tax levied by boards of education (or municipal governments for the Big Five city school districts) on residential and commercial properties within the boundaries of each school district. Only the Big Five cities have constitutional tax limits, which apply to the total municipal budget. Small city school districts (those with a population of less than 125,000 inhabitants) had their constitutional tax limit repealed in 1985. The State's sales tax laws reserve four percent for the State and permit localities to levy up to an additional four percent, which many do. A number of counties impose an additional sales tax of three-eighths of a percent for the benefit of the Metropolitan Commuter Transportation District. Eight counties share a portion of their sales tax with school districts, and are legally permitted to share certain other taxes. The non-property tax revenues derived from distribution of some portion of the local county sales tax are prorated based on the number of public school pupils residing in the county and enrolled in the various school districts partly or wholly located within the county. In 2011-12, $269 million in non-property tax revenues helped support approximately 158 school districts. 1 Estimated data for 2011-12 from "Analysis of School Finances 2010-11.” New York State Education Department. January 2013. p. 7. 2 “Description of 2012-13 New York State School Aid Programs.” New York State Division of the Budget. October 30, 2012. p. 25.
2

Small city school districts can impose a utility tax; about one quarter of the 57 small city districts do so. In addition, State law requires that payments in lieu of taxes (PILOTS) be distributed proportionally among the taxing jurisdictions (including school districts) affected by tax exemptions granted by Industrial Development Agencies (IDAs).3 New York City imposes a modified local income tax on residents, a business and financial tax, and a tax on commercial rent, revenues from which are raised to support the City’s budget including schools.4 The City of Yonkers also imposes an income tax on non-resident commuters.
The Big Five city school districts’ fiscal dependency means that the school system does not levy taxes, but is dependent upon citywide taxes for support. State aid for education enters the city treasury, not the school district treasury. The fiscal dependence of these school districts is fraught with problems related to the level and stability of funding and the effective use of resources.
In past years, the Board of Regents has recommended fiscal independence for the Big Five city school districts and, alternatively, maintenance of local tax effort in relation to prior spending for city districts in a fiscally dependent status. Categorical funding programs with prescriptive funding requirements have traditionally been used to ensure funds were spent for specific purposes, although this is a somewhat fragmented approach with a tendency to be administratively burdensome and, over time, numerous adjustments can result in a complex and disjointed aid system. Legislation enacted in 2007 extended maintenance of effort provisions to the remaining Big Five (Buffalo, Rochester, Syracuse and Yonkers); a maintenance of effort statute already applied to New York City. Disparities in Fiscal Resources
Despite New York’s equalizing State aid system, there remain tremendous disparities between New York State school districts in the fiscal resources
3 "An Industrial Development Agency is an independent public benefit corporation created through state legislation at the request of one or more sponsoring municipalities…IDAs serve as financing conduits for local government to attract businesses to New York State, retain existing firms and enhance the state's competitive position…All property titled to an IDA is exempt from real property, sales and mortgage taxes, however, an IDA often negotiates payments in lieu of taxes (PILOTS) with the private developers participating in IDA projects." (School Law 1994), New York State School Boards Association, Albany, New York, p. 433). 4 Local Government Handbook, p. 171.
3

available to support education. In 2010-11, operating expense per pupil5 ranged from $9,494 for the district at the 10th percentile to $18,164 for the district at the 90th percentile, a difference of 91 percent.6
Since about half of school revenues come from local property taxes, it follows that differences in spending are closely associated with disparities in property wealth. Higher expenditures per pupil are associated with higher actual property value per pupil. In 2010-11, the average actual value of property per pupil among the lowest spending ten percent of districts was $287,431, while the average actual value per pupil among the highest spending ten percent of districts was $1,900,331, a difference of 561 percent.7
Because the highest spending districts are also those with the highest property values, they exert the least tax effort: the following table shows that the average tax rate per $1,000 of actual value for the highest spending, wealthiest districts was only $10.53, yet the average tax revenue per pupil for those districts was $20,423. The average tax rate in the lowest spending, property-poorest districts was higher at $14.25, but the tax revenue per pupil was only $4,077 per pupil. Communities that desire a high level of educational services, but do not have a large tax base, must bear a disproportionately heavy tax burden in order to provide those services. In addition, school districts serving concentrations of children from poverty backgrounds have a greater educational burden to bear, resulting in a greater need to fund programs that provide extra time and help to educate students, thus increasing educational costs.
The table shows that the wealthiest group of districts received an average of only $1,750 per pupil in State revenue other than STAR, while the poorest districts received $6,586. However, the STAR program that was intended to reduce the property tax burden on local taxpayers, particularly the elderly, has provided significantly more revenue per pupil to wealthier districts. The poorest decile received on average $851 per pupil, while those in the tenth decile received tax relief equivalent to $1,490 per pupil. Further, the heavy reliance on property taxes to support education has created a situation in which, even with State revenue (other than STAR) per pupil exceeding that of the wealthiest group of districts by 276 percent, the poorest group of districts does not begin to approach the overall spending level of the wealthiest districts.
5 Approved operating expenditures per weighted pupil are the operating expenditures for the day-to-day operation of the school as defined in Education Law. Not included are expenditures for building construction, transportation of pupils and some other expenditures. Money received as Federal aid revenue, proceeds of borrowing and State aid for special programs are first deducted from total annual expenditures when approved operating expenditures are computed. 6 “Analysis of School Finances in New York State School Districts: 2010-11.” New York State Education Department, Albany, New York, January 2013, p. 16. 7 See table on page 6.
4

5
The disparities in fiscal resources are due primarily to the varying ability and willingness of school districts to generate local property tax revenue. As in most states, property values of residences and businesses vary dramatically from school district to school district, as do local assessment practices, and the level of education services desired by the community. In short, a student’s access to educational resources depends in large part on where he or she lives, raising serious concerns about the equity of student opportunities. Legislation enacted in 2011 created a property tax cap for school districts effective starting in 2012-13. For districts other than the Big Five, tax levy growth, with certain exemptions, is limited to the lesser of two percent or the annual increase in the consumer price index (CPI). A district may exceed the cap, with the approval of 60 percent of the voters.

2010-11 WEALTH, EXPENDITURE, REVENUE AND AID DATARANKED BY OPERATING EXPENSE PER PUPIL
DECILES FOR ALL MAJOR DISTRICTS EXCLUDING NEW YORK CITY
Other Tax RateOperating Actual Total STAR Revenue Tax Revenue (excl. STAR)
Operating Expense Expense Valuation Expense** Revenue from State*** (excl. STAR) per $1,000 2010-11Per Pupil Deciles per Pupil per Pupil per Pupil per Pupil per Pupil per Pupil Full Value Enrollment(upper limit shown)
1= $9,494 $8,812 $287,431 $12,861 $851 $6,586 $4,077 $14.25 165,3352= 10,143 9,887 343,281 13,892 1,052 6,172 5,386 15.76 150,8413= 10,563 10,334 365,761 14,402 984 6,570 5,464 14.98 149,0094= 11,045 10,758 286,936 14,947 767 7,784 4,531 15.84 190,7405= 11,689 11,368 374,206 16,032 933 7,622 5,553 14.87 192,4886= 12,592 12,139 462,342 16,425 1,079 6,730 6,921 14.72 166,2567= 13,942 13,105 576,628 16,702 1,244 5,418 8,677 14.91 185,6378= 15,555 14,817 682,367 18,731 1,576 4,779 10,759 15.87 232,6689= 18,164 16,664 864,718 20,202 1,694 3,482 13,617 15.78 185,075
10= 168,808 20,437 1,900,331 25,505 1,490 1,750 20,423 10.53 104,334
All Major DistrictsAvg. (excluding NYC) 12,691 576,064 16,783 1,173 5,810 8,226 14.35 1,722,383
New York City 11,731 537,666 16,512 529 5,920 7,197 13.52 1,064,088
All Major DistrictsAvg.(including NYC) $12,350 $560,900 $16,676 $918 $5,853 $7,819 $14.03 2,786,471 Decile Rank 6 7 6 4 5 6 5
* Values shown are the weighted averages for all 67 or 68 districts with an AOE/TAPU for Exp. less than or equal to the upper limit for the decile. ** Total Expenditure includes Debt Service and Special Aid Fund. *** Other State Revenue does not include STAR.
Source: Analysis of School Finances in New York State School Districts: 2010-11. New York State Education Department, Albany, New York. P.16.www.oms.nysed.gov/faru/
DECILE AVERAGE*
6

Section II
This section includes selected State Aid concepts and facts including: • Purposes of State Aid to Schools • Key Concepts • State Support for 2013-14 • Local Support • Components of School Finance • Foundation Aid • Selected Expense-Based Aids
7

Purposes of State Aid to Schools • Assist school districts in the funding of educational programs which offer
an effective education to all pupils in grades prekindergarten through grade 12.
• Maintain a State and local partnership in public education. (To this end,
a flat grant, or minimum foundation aid, is provided to even the wealthiest school districts.)
• Equalize school revenues by providing State Aid in inverse proportion to
each school district's ability to raise local revenues for education. • Encourage the development of model programs to address the needs of
school districts such as community schools and the use of technology in the classroom.
• Provide support to districts to help educate all students to higher
standards, including students with disabilities and those that require extra time and help.
8

Key Concepts Concerning School Aid • Wealth Equalization: To distribute State Aid in inverse proportion to
fiscal capacity in order to offset dramatic differences in the ability of school districts to raise local revenues. This is different from the equalization of local property assessments, which is done by the State to make property values comparable from district to district.
• Determination of Fiscal Capacity: District income and actual value per
pupil are compared to the State average (known as the Combined Wealth Ratio).
• School District's State Sharing Ratio or Aid Ratio: The percent,
based on the relative fiscal capacity of the district, which is multiplied by an amount of money to determine the district's State Aid.
• Aid Distribution Systems: There are different ways of distributing State
Aid, including:
4Flat Grant Per Pupil. This distributes the same amount of State aid per pupil to every district (e.g., Textbook Aid and Flat Grant Foundation Aid). This aid is not equalized.
4Wealth-equalized State Aid Per Pupil. This distributes aid based
on an amount per pupil equalized in relation to district fiscal capacity by multiplying the amount by the district's Sharing Ratio (e.g., Foundation Aid).
4Effort or Expense-based Aid. This aid equals the State Share, a
wealth equalized percentage, of actual approved spending (e.g., Transportation, Building and BOCES Aids).
• Pupil Counts Used for State Aid: These are based on pupil
attendance, membership or enrollment, often with additional weightings for certain categories of students such as pupils with special educational needs, secondary school pupils and pupils in summer school.
9

State Support to Public School Districts 2013-14
• History - Revenue from State sources as a percent of total expenditures
for public schools
4 Low point - 1944-45 - 31.5 percent 4 High point – 2001-02 - 48.2 percent 4 2012-13 – 40.3 percent (estimated, including STAR)
• Revenue Sources
4 88 percent from the General Fund; including STAR, State income and sales taxes
4 12 percent from lottery receipts
• Payments
4 The school year is funded from two State fiscal years with 70 percent (plus $378.2 million) paid by March 31 (the end of the first State fiscal year).
• Aid Programs
4 Numerous programs but Foundation Aid alone accounts for about 72 percent.
Legislative History
4 1990 - Payments to the Teachers Retirement System for 1989-90 amortized over 15 years, reducing State Aid by $684 million.
4 1990 - Unprecedented mid-year deficit reduction legislation cut 1990-
91 State Aid payments by $190 million.
4 1991-92 - A State budget was adopted more than two months late with $925 million in deficit reductions.
4 1992-93 - Deficit reductions continued for $1,039 million.
10

4 1993-94 - State Aid reforms were introduced, deficit reductions
eliminated and an estimated increase of $330 million provided. 4 1994-95 through 1997-98 - A State budget was adopted several
months late each year; with estimated increases of:
• 1994-95 - $435 million (June) • 1995-96 - $ 67 million (June) • 1996-97 - $177 million (July) • 1997-98 - $661 million (August)
4 1998-99 - Legislation was passed in mid-April. After vetoes, the
estimated increase was $967 million.
4 1999-00 - Legislation was passed in August with an estimated increase of $922 million.
4 2000-01 - Legislation was passed in mid-May with an estimated
increase of $1.094 billion.
4 2001-02 - Legislation was passed in August to institute a baseline budget and supplemented in October with additional funds, for an estimated total increase of $680 million.
4 2002-03 - Legislation was passed in mid-May with an estimated
increase was $420 million.
4 2003-04 - Legislation was passed in May with an estimated decrease of $207 million.
4 2004-05 - Legislation was passed in August with an estimated
increase of $740 million.
4 2005-06 - Legislation was passed on March 31 with an estimated increase of $830 million.
4 2006-07 - Legislation was passed on March 31 with an estimated
increase of $1.1 billion.
4 2007-08 - Legislation was passed on April 1 with an estimated increase of $1.7 billion, including major reform of State Aid.
4 2008-09 - Legislation was passed in April with an estimated increase
of $1.7 billion, including continued phase-in of foundation aid.
4 2009-10 - Legislation was passed in April with an estimated increase of $405 million, foundation aid held to the base year amount and a $1
11

billion deficit reduction assessment (DRA) which was restored with federal fiscal stabilization funds. In December, a $391 million supplemental DRA was enacted and restored with similar federal funding.
4 2010-11 - Legislation was passed in June, vetoed in July and
revisited in August with an estimated decrease of $522 million, foundation aid held to 2008-09, a -$2.1 billion gap elimination adjustment (which was partially restored with $726 million in remaining federal ARRA funds), and $607 million in federal education jobs program funding. Chapter 313 later provided for an additional $131.5 million reduction in aid (FMAP).
4 2011-12 - Legislation was passed in April with an estimated decrease of $675 million including a -$2.6 billion gap elimination adjustment (GEA) and a cap on future year-to-year increases in General Support for Public Schools. In June a property tax cap was enacted.
4 2012-13 - Legislation was passed in March with an estimated increase
of $805 million including a $400 million restoration to the Gap Elimination Adjustment (GEA), resulting in a 2012-13 GEA of -$2.2 billion.
4 2013-14 - Legislation was passed in March with an estimated increase
of $944 million including a $517 million restoration to the Gap Elimination Adjustment (GEA), resulting in a 2013-14 GEA of -$1.6 billion.
12

Estimated 2013-14 ($ in millions)
Foundation Aid $15,177 Building including Reorganization Incentive 2,780 Transportation Aid 1,722 BOCES and Special Services Aids 933 Special Education Aids 877 Universal Pre-Kindergarten Grant 385 Gap Elimination Adjustment -1,639 Subtotal: $20,235 Other 893 --------- General Support for Public Schools (GSPS)* Total: $21,128 * Excludes Expanding our Children’s Education and Learning (EXCEL) debt service and $75 million in competitive grants which are funded outside of GSPS.
13

Local Support for Public School Districts • School District Types
4 652 K-12 districts and 24 non-K-12 districts employ eight or more teachers and are eligible for regular State Aid funding.
4 All are fiscally independent (have independent taxing and borrowing
authority) except the school districts in the State's five largest cities, the Big Five.
4 37 Boards of Cooperative Educational Services (BOCES) provide a
range of programs and services to groups of school districts other than the Big Five.
• Property Tax
4 The principal source of school district revenues. 4 Property tax levies are established after voter approval of school
district budgets or school board adoption of a limited "contingency" budget after voter defeat.
4 The Big Five cities include education in their municipal budget.
4 Although STAR does not represent additional funds for education, it
provides broader-based State funds for education, reducing the property tax funded portion of educational costs.
14

15
• Tax Limits
4 Only the Big Five city school districts are subject to constitutional tax limits, and the limits apply to the total municipal budget.
4 Small city school districts had their constitutional tax limit repealed in
1985 and first voted on budgets in 1997.
4 For the 2012-13 school year, the State Legislature and the Governor enacted legislation which created a tax levy limit. This legislation states that property tax levy growth cannot exceed two percent or the rate of inflation, whichever is less, with some exceptions. The tax levy limit can be exceeded if 60 percent of school district voters approve the increase.
• Other Local Revenue Sources
4 The State's sales tax laws reserve four percent for the State and permit localities to levy up to an additional four percent, which many do. A number of counties impose an additional sales tax of three-eighths of a percent for the benefit of the Metropolitan Commuter Transportation District. A few localities distribute a portion of the local sales tax to school districts.
4 Small city school districts may also impose a utility tax, not to exceed
3 percent. • Education - A $59.0 Billion Enterprise - 2012-13 estimated
Total Revenue from State sources (incl. STAR) $23.8 billion
which represents 40.3 % of Total General and Special Aid Fund Expenditures $59.0 billion
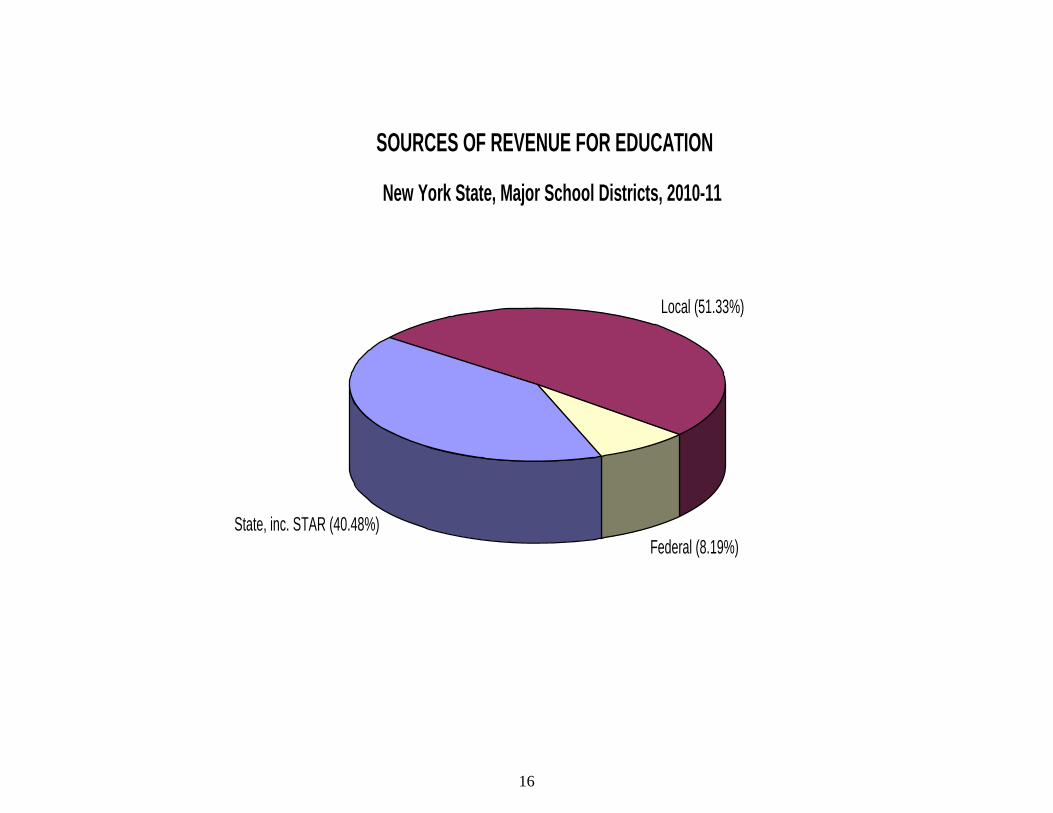
State, inc. STAR (40.48%)
Local (51.33%)
Federal (8.19%)
SOURCES OF REVENUE FOR EDUCATION
New York State, Major School Districts, 2010-11
16

Other (2.7%)
Transportation (5.5%)
Debt Service (4.9%)
Operation & Maintenance (8.4%)
Board of Education & Central Adm(2.3%)
Fringe Benefits (19.4%)
Instruction(exc. Fringe Benefits)
(56.9%)
New York State, Major School Districts, 1984-85WHERE THE EDUCATION DOLLAR IS GOING
17

18
Board of Education & Central
Administration (1.9%)
Fringe Benefits (22.4%)
Operation & Maintenance (6.3%)
Transportation (5.0%)
Instruction (excl. Fringe
Benefits) (56.5%)
Other (2.2%)
Debt Service (5.7%)
New York State, Major School Districts, 2010-11WHERE THE EDUCATION DOLLAR IS GOING

Components of School Finance A Comparison of School Districts by Property Wealth Per Student8
• Districts vary dramatically in their wealth per pupil. The average property
wealth per pupil in the lowest wealth districts is $165,969, about one-fifteenth of the actual valuation per pupil in the highest wealth districts ($2,397,660).
• For this reason, State Aid (State revenue other than STAR) is wealth
equalizing. Low-wealth districts receive six times more aid per pupil than the highest wealth districts ($10,334 versus $1,690).9
• In spite of this, the spending per pupil in lowest wealth districts is about two-
thirds of the spending per pupil in the highest wealth districts ($15,682 versus $24,874).
• This is due, in large part, to the fact that the lowest wealth districts raise
almost one-tenth of the local revenue per pupil that the highest wealth districts do ($2,379 versus $20,249).
• As a result of these major differences in local wealth, the highest wealth
districts tax themselves far less heavily to raise these much greater revenues. While the lowest wealth districts tax at a rate of $14.35 per $1,000 of full value to generate $2,379 per pupil, the highest wealth districts tax at a rate of only $8.48 per $1,000 to generate $20,249 per pupil.
8 Conclusions relate to Table 10 of the Analysis of School Finances in New York State School Districts 2010-11 (January 2013), The University of the State of New York, The State Education Department, Albany, New York, page 17, which is reproduced on the following page. 9 This does not include STAR, which tends to be dis-equalizing as it favors higher property wealth districts.
19

2010-11 WEALTH, EXPENDITURE, REVENUE AND AID DATARANKED BY ACTUAL VALUATION PER TWPU
DECILES FOR ALL MAJOR DISTRICTS EXCLUDING NEW YORK CITY
Actual Total STAR Other Revenue Tax Rev. Tax RateValuation AOE Exp.** Revenue from State*** Income Income (excl. STAR) (excl. STAR)
Actual Valuation/TWPU per per TAPU per TAPU per TAPU per TAPU per per per TAPU per $1,000 2010-11Deciles TWPU for Exp. for Exp. for Exp. for Exp. TWPU Return for Exp. Full Value Enrollment(upper limit shown)
1= $221,800 $165,969 $10,391 $15,682 $613 $10,334 $71,192 $33,583 $2,379 $14.35 231,2162= 259,259 240,949 10,145 14,782 991 8,435 92,643 39,247 3,775 15.75 91,5693= 306,666 281,458 10,723 14,908 969 7,871 98,198 40,275 4,685 16.66 143,3514= 355,881 330,116 11,052 15,064 1,077 6,953 110,985 43,961 5,484 16.64 166,2475= 435,143 395,611 11,089 14,806 1,049 5,670 131,572 50,162 6,634 16.86 166,2866= 530,544 481,005 12,246 15,739 1,261 5,065 145,076 57,989 8,034 16.91 225,3097= 623,091 561,407 13,087 16,727 1,365 5,166 142,272 58,424 8,854 15.65 234,8408= 848,109 739,333 14,450 18,248 1,571 3,454 190,676 75,354 11,687 15.93 234,4819= 1,329,064 1,059,785 16,664 20,520 1,526 2,375 260,863 104,730 15,282 14.52 144,583
10= 45,212,956 2,397,660 19,709 24,874 1,143 1,690 475,291 173,365 20,249 8.48 84,501
All Major DistrictsAvg. (excluding NYC) 576,064 12,691 16,783 1,173 5,810 155,974 63,429 8,226 14.35 1,722,383
New York City 537,666 11,731 16,512 529 5,920 189,327 68,253 7,197 13.52 1,064,088
All Major DistrictsAvg.(including NYC) $560,900 $12,350 $16,676 $918 $5,853 $169,100 $65,500 $7,819 $14.03 2,786,471 Decile Rank 7 6 6 4 5 8 8 6 5
* Values shown are the weighted averages for all 67 or 68 districts with AV/TWPU less than or equal to the upper limit for the decile. ** Total Expenditure includes Debt Service and Special Aid Fund. *** Other State Revenue does not include STAR.
Source: Analysis of School Finances in New York State School Districts: 2010-11. New York State Education Department, Albany, New York. P.17.
DECILE AVERAGE*
20

COMPONENTS OF TOTAL EXPENSE PER PUPIL BY WEALTH GROUPS (DECILES)
0
5,000
10,000
15,000
20,000
25,000
1 2 3 4 5 6 7 8 9 10
Actual Value per Pupil Wealth Groups (Deciles)
$ A
mou
nt p
er P
upil
STAR REV/PUPIL OTHER REVENUE FROM STATE/PUPIL LOCAL + OTHER/PUPIL
Based on Table 10, Analysis of School Finances
Low Wealth High Wealth
21

Foundation Aid The Laws of 2007 reformed the State’s method of allocating resources to school districts by consolidating some thirty existing aid programs into a Foundation Aid formula that distributes funds to school districts based on the cost of providing an adequate education, adjusted to reflect regional costs and concentrations of pupils who need extra time and help in each district. The 2007-08 Enacted Budget also included a four-year phase-in of Foundation Aid. The 2009-10 Enacted Budget extended the phase-in to 2013-14 and froze 2009-10 and 2010-11 payable Foundation Aid to 2008-09 Foundation Aid. The 2011-12 Enacted Budget extended the phase-in to 2016-17 and froze 2011-12 payable Foundation Aid to 2008-09 Foundation Aid. The 2012-13 Enacted Budget phased in 2012-13 aid at 1.7 percent while the 2013-14 Enacted Budget provided no phase-in of 2013-14 aid except for the New York City school district at 5.23 percent. District Foundation Aid per Pupil = [Foundation Amount X Pupil Need Index X Regional Cost Index] – Expected Minimum Local Contribution.
• The Foundation Amount is the cost of providing general education services. It is measured by determining instructional costs of districts that are performing well. It is adjusted annually to reflect the percentage increase in the consumer price index. For 2007-08 aid, it was $5,258. It is further adjusted by the phase-in foundation percent (1.0768 for 2007-08). For 2010-11, the adjusted amount is: $5,708 x 0.996 x 1.0768, or $6,122. For 2013-14, the adjusted amount is: $5,926 x 1.021 x 1.0768, or $6,515.
• The Pupil Needs Index (PNI) recognizes the added costs of providing extra
time and help for students to succeed. It is 1 + the Extraordinary Needs (EN) percent and ranges from 1 to 2. The EN% is based on:
Lunch count X .65 Uses a 3-year average Free and Reduced-Price Lunch
percent Census count X .65 Uses 2000 census percent of persons age 5-17 in
poverty Limited English Profi-ciency count X .50
Uses base year pupils
Sparsity count Provides a factor ((25 – enrollment/square mile)/50.9) for districts with fewer than 25 pupils per square mile
22

• The Regional Cost Index (RCI) recognizes regional variations in purchasing
power around the State, based on wages of non-school professionals. The regional cost indices for the nine labor force regions are:
Capital District 1.124 Southern Tier 1.045 Western New York 1.091 Hudson Valley 1.314 Long Island/NYC 1.425 Finger Lakes 1.141 Central New York 1.103 Mohawk Valley 1.000 North Country 1.000
• The Expected Minimum Local Contribution is an amount districts are expected to spend as their fair share of the total cost of general education. It is the lesser of two calculations:
Selected Actual Value/pupil X Tax Factor of .0137 X Income/pupil relative to the State average (which is capped between 0 and 2.0), OR (Foundation Amount X PNI X RCI) X (1 – Foundation Aid State Sharing Ratio).
Total Foundation Aid = Selected Foundation Aid X Selected Total Aidable Foundation Pupil Units (TAFPU). Selected Foundation Aid is the district’s Foundation Aid per pupil, but no less than $500. TAFPU is described below. Total Foundation Aid is phased-in over ten years. For the 2013-14 phase-in, Foundation Aid is: a) for the New York City school district: 2012-13 Foundation Aid + [ .0523 * (Total Foundation Aid – 2012-13 Foundation Aid)]; and, b) for all other school districts: 2012-13 Foundation Aid (i.e., no phase-in).
23

In 2013-14, payable Foundation Aid is increased by: 1.176 percent over 2012-13 Foundation Aid for the Big 4 City school districts; and, 0.3 percent over 2012-13 Foundation Aid for non-Big 5 City school districts. • District wealth is measured by:
4 Selected Actual Valuation of Taxable Real Property Per Pupil = Lesser of 2010 AV or the average of 2010 AV and 2009 AV.
4 Selected Adjusted Gross Income Per Pupil = Lesser of 2010 Income or the average of 2010 and 2009 Income.
• Annual Computations:
4 Actual Value Selected actual valuation of all districts divided by resident pupils of
New York State to obtain State average selected AV/pupil.
For 2013-14 Aid: $560,600
4 Adjusted Gross Income Selected adjusted gross personal income of all taxpayers, as reported
on New York State income tax returns and including results of the statewide computerized income verification process, divided by resident pupils of State to obtain State average selected income/pupil.
For 2013-14 Aid: $164,000
24

Foundation Aid State Sharing Ratio • State Sharing Ratio Calculation (1):
4 Compare District Wealth Measures to State Average Wealth Measures 4 Compute:
District Actual Value/Pupil
$560,600
District Income/Pupil
$164,000
4 Weight Income and Actual Value Equally (50:50):
.50
Dist AV/Pupil $560,600
+ .50
Dist Inc./Pupil $164,000
This is the district's Combined Wealth Ratio (CWR), a measure of district fiscal capacity based on income and actual value. For Example: Average Wealth District CWR = 1.00 1.00 Below Average Wealth CWR = Less than 1.00 .20 Above Average Wealth CWR = Greater than 1.00 1.60
25

26
Foundation Aid State Sharing Ratio • State Sharing Ratio Calculation (2): Basic Principle: The poorer a district is compared to the State average, the greater the State sharing ratio. For high need/resource-capacity districts, the State Sharing Ratio is multiplied by 1.05.
If the district's CWR is:
Then the State sharing ratio is computed as follows:
.627 or less 1.37 - (1.23 * CWR) with a maximum ratio of .90 Range .599 to .900
.627 - .800 1.00 - (.64 * CWR) Range .488 to .599
.800 - 1.336 .80 - (.39 * CWR) Range .279 to .488
Greater than 1.336 .51 - (.173 * CWR) with a minimum ratio of zero Range 0 to .279

State Sharing Ratio for Foundation Aid as a Function of a District's Combined Wealth Ratio (CWR)
1.0 Maximum SSR
0.9
0.0
0.1
0.2
0.3
0.4
0.5
0.6
0.8
0.0 0.1 0.2 0.3 0.4 0.5 0.6 0.7 0.8 0.9 1.0 1.1 1.2 1.3 1.4 1.5 1.6 1.7 1.8 1.9 2.0 2.1 2.2 2.3 2.4 2.5
Combined Wealth Ratio (CWR)
Stat
e Sh
arin
g R
atio
(SSR
)
1.00 - (0.64 * CWR)
.51 - (0.173 * CWR)
.80 - (0.39 * CWR)
1.37 - (1.23 * CWR)
0.7
27

28
Foundation Aid Pupil Count Basic Principle: Foundation Aid = Aid Per Pupil x No. of Pupils (Ability) (Need) Average Daily Membership Weighting 1.00 (Full Day K-12) Plus Average Daily Membership Weighting .50 of 1/2 Day Kindergarten
Plus Pupils with Disabilities Weighting 1.41 Plus Pupils Declassified from Weighting .50 Special Education Plus Pupils in Summer School Weighting .12 Sum = Total Aidable Foundation Pupil Units (TAFPU)

29
2006-07 Foundation Aid Base
For phasing-in Foundation Aid for 2007-08 and 2008-09, the 2006-07 Foundation Aid Base (FAB) is the sum of these aids and grants: Flex Aid Public Excess Cost Aid (excluding High Cost Aid) Limited English Proficiency Aid Sound Basic Education Aid Enrollment Adjustment Aid Supplemental Extraordinary Needs Aid Growth Aid Operating Reorganization Incentive Aid High Tax Aid Tax Limitation Aid Early Grade Class Size Reduction Grants Small Cities Aid Teacher Support Aid Improving Pupil Performance Grants Categorical Reading and Math Grants Magnet School Grants (including additional amounts) Fort Drum Grants Tuition Adjustment Aid These Aids and Grants are also eliminated: Comprehensive Operating Aid Formula Operating Aid Educationally Related Support Services Aid Extraordinary Needs Aid Gifted and Talented Aid Minor Maintenance and Repair Aid Operating Standards Aid Summer School Aid Tax Effort Aid Tax Equalization Aid Transition Adjustment Factor Shared Services Savings Incentive

SELECTED EXPENSE-BASED AIDS
30
Aid ($ and # for major districts) Formula/Calculation10 Building Aid $2,753.2 million 673 districts aided 676 districts eligible
Building Aid = Approved Expenses x Building Aid Ratio. Approved Expenses = assumed amortization of approved project costs or current year lease expenses. Aid Ratio = a) for projects with voter approval dates (VAD) before July 1, 2000, the highest of the Actual Value/RWADA aid ratios from 1981-82 through 2013-14. AV/RWADA Aid Ratio = 1 – (.51 x RWADA wealth ratio), min 0. b) for projects with VAD on or after July 1, 2000, generally the higher of the current AV/RWADA aid ratio or the aid ratio selected for 1999-00 building aid. c) Other adjustments: up to 10 percent of additional aid is provided for projects with VAD on or after July 1, 1998; additional aid ratio option for certain low income wealth districts and up to 5 percent additional aid for high need/resource-capacity districts; aid provided for security devices, capital outlays that merit exception and, for 2010-11 and 2011-12 for building condition surveys. Maximum aid ratio is 95 percent (98 percent in certain cases).
10 “2012-13 State Aid Handbook, State Formula Aids and Entitlements for Schools in New York State as Amended by Chapters of the Laws of 2012.” New York State Education Department. September 2012.

SELECTED EXPENSE-BASED AIDS
31
Building Reorganization Incentive Aid $26.6 million 79 districts aided 91 districts potentially eligible
Aid = Additional apportionment (incentive factor) of building aid for eligible building projects. Incentive Factor = .25 for districts that reorganized prior to July 1, 1983; .30 for districts reorganized since then. Maximum aid = the sum of building aid and reorganization building aid cannot exceed 95 percent of the approved building reorganization expense (98 percent in certain cases).
Transportation Aid $1,717.4 million 676 districts aided 676 districts eligible
Aid = Approved Capital and Non-capital Expenses x Selected Aid Ratio. Non-capital expenses = approved transportation operating expenses and account for about 96 percent of approved expenses. Capital expenses = assumed amortization of purchase, lease and equipment costs over five years, at a statewide average interest rate. Aid Ratio = highest of 3 aid ratios plus a sparsity adjustment; .065 minimum; .90 maximum. 3 aid ratio choices = a) 1.263 x State Sharing Ratio; b) 1.01 – (.46 x RWADA wealth ratio); c) 1.01 – (.46 x enrollment wealth ratio).
Summer Transportation Aid $5.0 million maximum 174 districts aided
Aid = Approved non-capital expenses x Selected Aid Ratio. Non-capital expenses = for transporting pupils to and from district-

SELECTED EXPENSE-BASED AIDS
32
676 districts eligible operated approved summer school programs. Capital expenses are included with the above Transportation Aid formula. Aid Ratio = same as for Transportation Aid. If State total of districts’ aid exceeds $5.0 million, each district’s aid is prorated to remain within a $5.0 million statewide appropriation.
BOCES Aid $728.5 million 667 districts aided 667 eligible districts (4 districts have elected not to join a BOCES and the Big 5 city school districts are not eligible to join a BOCES) Note: aid is calculated by district but is paid to the BOCES.
Operating Aid = Approved Expenses x Selected Aid Ratio. Expenses = an allocation of the BOCES base year administrative and shared services expenses to the school districts that are components of the respective BOCES. About 92 percent of aidable expenses. Selected Aid Ratio = higher of: a) 1 – (.51 x AV/RWADA wealth ratio); or, b) 1 – (.008 / district tax rate); minimum = .36; maximum = .90. Rent and Capital Aid = Approved Expenses x Aid Ratio. Expenses = an allocation of the BOCES current year rent and capital expenses to the school districts that are components of the BOCES. Aid Ratio = 1 – (.51 x AV/RWADA wealth ratio), minimum = .00; maximum = .90.

SELECTED EXPENSE-BASED AIDS
33
Public Excess Cost High Cost Aid $516.7 million 648 districts aided 676 districts eligible Note: estimated expenses are based on district averages but actual expense is computed on a per pupil basis.
Aid = (Approved Program Cost – Deduct) x Aid Ratio. Approved Program Cost = To be aidable, cost per student must exceed the lesser of: $10,000 or (4 x base year Approved Operating Expense/Pupil). Deduct = 3 x base year AOE/pupil. Aid Ratio = 1 – (.51 x Combined Wealth Ratio); minimum = .25. Aid is in addition to Foundation Aid. Costs are for students with disabilities educated in district or BOCES programs.
Private Excess Cost Aid $356.2 million 558 districts aided 676 districts eligible Note: estimated expenses are based on district averages but actual expense is computed on a per pupil basis.
Aid = (Approved Program Cost – Deduct) x Aid Ratio. Approved Program Cost = Base year private school tuition per pupil for district pupils placed in private school programs for the disabled. Included are expenses at the State-operated schools: Batavia school for the blind and Rome school for the deaf. Deduct = base year tax levy per public school enrollment of resident pupils (including charter school enrollment). Aid Ratio = 1 – (.15 x Combined Wealth Ratio); minimum = .50.

34
APPENDIX A
Description of 2013-14 Formula Aids to School Districts Foundation Unrestricted aid to school districts for school operation and maintenance. It replaces
30 aids and grants from 2006-07. Based on an adjusted foundation amount less an expected minimum local contribution. Formula recognizes regional cost, district need factors and fiscal capacity and is phased-in over ten years (2007-08 – 2016-17).
Full Day K Conversion One year unrestricted aid on a current year basis for approved programs in districts that agree to convert to full day kindergarten programs. Equal to selected foundation aid per pupil.
Universal Pre-Kindergarten Targeted per-pupil grant for approved programs. All districts are eligible but the amounts are phased-in over several years. Equalized by use of selected foundation aid per pupil.
Charter School Transitional Targets aid to the 19 districts most impacted by a concentration of charter schools, either on the district’s enrollment or budget. Aid is based on a partial reimbursement of the per-pupil basic tuition paid by the district to the charter school.
High Tax Eligible districts receive a flat grant per enrolled pupil. Eligibility determined by residential levy exceeding a specified percent of adjusted gross income.
Textbook Unequalized reimbursement of expenses up to a flat grant per pupil maximum.
Computer Software Unequalized reimbursement of expenses up to a flat grant per pupil maximum.
Library Materials Unequalized reimbursement of expenses up to a flat grant per pupil maximum.
Hardware and Technology Expense-based reimbursement up to an equalized ceiling amount per pupil for instructional computer hardware and educational technology equipment. Uses the district’s current year building aid ratio which reflects its relative property wealth. Local share not required.
BOCES Expense-based aid for districts that are components of BOCES to obtain services. Equalized by either the district’s tax rate or relative property wealth per pupil.
Special Services— Computer Administration
Expense-based aid up to a maximum per pupil for computer expenses. Equalized for district fiscal capacity. Big 5 Cities and other non-component districts of a BOCES are eligible.
Special Services— Career Education; Academic Improvement
Expense-based aid up to a maximum per pupil for career education expenses. Equalized for district fiscal capacity. Big 5 Cities and other non-component districts of a BOCES are eligible.
Reorganization Incentive-Operating Additional unrestricted operating aid for districts that reorganize after July 1, 2007. Depending on the year of reorganization, up to an additional 40 percent of 2006-07 formula operating aid is provided (the percent is scaled down after 5 years by 4% per year).
Excess Cost—Public High Cost Additional wealth-equalized, per-pupil aid for students with disabilities in public school- or BOCES-run very high cost programs. Costs exceeding a threshold are reimbursed using an aid ratio based on district property and income wealth.

35
Supplemental Public Excess Cost Amount
Aid for eligible districts to accommodate changes in the way aid is provided for public excess cost pupils. Aid is frozen to the 2008-09 amount.
Excess Cost--Private Wealth-equalized, per-pupil aid for students with disabilities that the public school places in private school settings or State-operated schools for the deaf or blind.
Transportation Expense-based aid for approved operating expenses for transportation of pupils. Property wealth equalized with a choice of aid ratios and sparsity adjusted. Starting in 2005-06, debt service expenses are aided on an assumed amortization schedule.
Summer Transportation Transportation aid was expanded to cover summer school programs to help students meet higher learning standards. Districts with approved programs are eligible for aid up to a maximum State total of $5 million.
Building Expense-based aid for construction and financing of approved building projects. Choice of property wealth equalized aid ratios back to 1981-82, depending on date of voter approval. Up to an additional 10 percent incentive was provided for projects approved on or after July 1, 1998. Allowable construction cost adjusted for regional cost differences starting in 1998. Starting in 2002-03, debt service expenses are aided on an assumed amortization schedule.
Reorganization Incentive- Building An additional amount of building aid (25 or 30 percent, depending on year of reorganization) is provided for eligible building projects. A maximum of 95 percent of approved building expenses can be aided in total by Building and Reorganization Building aid (98 percent for high needs districts for projects approved after 7/1/05). The district’s selected building aid ratio applies.
Supplemental Education Improve-ment Plan
A $17.5 million grant for the Yonkers school district.
Academic Achievement A $1.2 million grant for the New York City school district.
Academic Enhancement If continuously identified as a district in need of improvement for at least 5 years, the increase in 2008-09 Foundation Aid is enhanced to the lesser of $15 million or 10 percent of the base year. Aid is frozen to the 2008-09 amount.
Expanding our Children's Education and Learning (EXCEL)
Starting with 2006-07, a total of $2.6 billion is available over multiple years for capital construction. The maximum allocations are: $1.8 billion for the New York City school district; $400 million for non-NYC high Need/Resource-Capacity districts, based on a flat grant per pupil; and $400 million for average and low Need/Resource-Capacity districts, based on a smaller flat grant per pupil