state and trends of carbon pricing 2017 - ecofys … the growing momentum for carbon pricing...
TRANSCRIPT

State and Trends of Carbon Pricing
2017Washington DC November 2017

This report was prepared jointly by the World Bank, Ecofys and Vivid Economics.
The World Bank team included Richard Zechter, Alexandre Kossoy, Klaus Oppermann, and Céline Ramstein.
The Ecofys team included Long Lam, Noémie Klein, Lindee Wong, Jialiang Zhang, Maurice Quant, Maarten Neelis, and Sam Nierop.
The Vivid Economics team included John Ward, Thomas Kansy, Stuart Evans, and Alex Child.
State and Trends of Carbon Pricing 2017Washington DC November 2017

© 2017 International Bank for Reconstruction and Development / The World Bank
1818 H Street NW, Washington DC 20433Telephone: 202-473-1000; Internet: www.worldbank.orgSome rights reserved1 2 3 4 20 19 18 17
This work is a product of the staff of The World Bank with external contributions. The findings, interpretations, and conclusions expressed in this work do not necessarily reflect the views of The World Bank, its Board of Executive Directors, or the governments they represent. The World Bank does not guarantee the accuracy of the data included in this work. The boundaries, colors, denominations, and other information shown on any map in this work do not imply any judgment on the part of The World Bank concerning the legal status of any territory or the endorsement or acceptance of such boundaries.
Nothing herein shall constitute or be considered to be a limitation upon or waiver of the privileges and immunities of The World Bank, all of which are specifically reserved.
Rights and Permissions
This work is available under the Creative Commons Attribution 3.0 IGO license (CC BY 3.0 IGO) http://creativecommons.org/licenses/by/3.0/igo. Under the Creative Commons Attribution license, you are free to copy, distribute, transmit, and adapt this work, including for commercial purposes, under the following conditions:
Attribution—Please cite the work as follows: World Bank, Ecofys and Vivid Economics. 2017. State and Trends of Carbon Pricing 2017 (November), by World Bank, Washington, DC. Doi: 10.1596/978-1-4648-1218-7 License: Creative Commons Attribution CC BY 3.0 IGO
Translations—If you create a translation of this work, please add the following disclaimer along with the attribution: This translation was not created by The World Bank and should not be considered an official World Bank translation. The World Bank shall not be liable for any content or error in this translation.
Adaptations—If you create an adaptation of this work, please add the following disclaimer along with the attribution: This is an adaptation of an original work by The World Bank. Responsibility for the views and opinions expressed in the adaptation rests solely with the author or authors of the adaptation and are not endorsed by The World Bank.
Third-party content—The World Bank does not necessarily own each component of the content contained within the work. The World Bank therefore does not warrant that the use of any third-party-owned individual component or part contained in the work will not infringe on the rights of those third parties. The risk of claims resulting from such infringement rests solely with you. If you wish to re-use a component of the work, it is your responsibility to determine whether permission is needed for that re-use and to obtain permission from the copyright owner. Examples of components can include, but are not limited to, tables, figures, or images.
All queries on rights and licenses should be addressed to the Publishing and Knowledge Division, The World Bank, 1818 H Street NW, Washington, DC 20433, USA; fax: 202-522-2625; e-mail: [email protected] (electronic): 978-1-4648-1218-7DOI: 10.1596/ 978-1-4648-1218-7
Picture credits: title: n_eri / fotolia.com; page 17: marvellousworld / thinkstock.com; page 21: eskaylim / thinkstock.com; page 59: hxdbzxy / thinkstock.com
Cover and interior design: Meike Naumann Visuelle Kommunikation

Reflecting the growing momentum for carbon pricing worldwide, the 2017 edition of the State and Trends of Carbon Pricing targets the wide audience of public and private stakeholders engaged in carbon pricing design and implementation. This report also provides critical input for negotiators involved in the implementation of the Paris Agreement, particularly for the meeting of the Conference of the Parties (COP) 23 to be held in Bonn in November 2017.
As in the previous editions, the report provides an up-to-date overview of existing and emerging carbon pricing initiatives around the world, including national and subnational initiatives. Furthermore, it gives an overview of current corporate carbon pricing initiatives.
Another key focus of the report is on the importance of an integrated approach to climate finance and climate markets, together with domestic policies. The analysis shows how such an integrated approach can be used to mobilize the scale of low-carbon investments needed to achieve the below 2°C temperature target and outlines a transition scenario and the possible role of results-based climate financing to catalyze climate markets.
In May 2017, the World Bank launched the Carbon Pricing Dashboard website, adding an interactive dimension to the annual State and Trends of Carbon Pricing reports. This resource provides an up-to-date overview of carbon pricing initiatives and allows users to navigate through the visuals and data of the report. Please visit: http://carbonpricingdashboard.worldbank.org/.
The task team responsible for this report intends to select new relevant topics to be explored in future editions or as part of the World Bank’s expanded Carbon Pricing Intelligence program. For example, work is currently underway on an analysis of the interaction of carbon taxes and fiscal policy.
The report benefited greatly from the valuable contributions and perspectives of our colleagues in the climate and carbon finance community, ensuring the quality and clarity of this report: Joaquim Barris, Conor Barry, Nicolette Bartlett, Carter Brandon, Karan Capoor, Marcos Castro Rodrigues, Climatic Change Division of the Ministry of Environment and Sustainable Development of Colombia, David Coney, Hannah Cushing, Angelique dePlaa, Nathan Engle, Eduardo Ferreira, Greenhouse Gas Inventory and Research Center of Korea, Government of Alberta, Phillip Hannam, Kelley Hamrick, Huang Xiaochen, Dirk Heine, Sharlin Hemraj, Junki Kawamura, Thomas Kerr, Lai Han, Lisa Lang, Alan Lee, Paige Leuschner, Liu Ying, Frank Melum, Aya Naito, Norwegian Ministry of Finance, Kiyoshi Okumura, Qian Guoqiang, Ulrika Raab, Isabel Saldarriaga Arango, Rajinder Sahota, Herman Sips, William Space, Thailand Greenhouse Gas Management Organization, Massamba Thioye, Michael Toman, Johannes Trueby, Xiaodong Wang, Tom Witt, and Peter Zapfel.
Oversight and guidance on drafting was provided respectively by Alexandre Kossoy for Section 2 on carbon pricing initiatives around the world and Klaus Oppermann for Section 3 on climate finance and climate markets, and by Richard Zechter and Céline Ramstein for the whole report.
We also acknowledge the support from the Partnership for Market Readiness for the preparation of this report, and from the Carbon Pricing Leadership Coalition for the preparation of the Carbon Pricing Dashboard.

List of abbreviations and acronyms
°C Degrees Celsius
C CAR Clean Air RuleCCER Chinese Certified Emission
ReductionCPP Clean Power PlanCDM Clean Development Mechanism CER Certified Emission ReductionCi-Dev Carbon Initiative for DevelopmentCMA Conference of the Parties serving
as the Meeting of the Parties to the Paris Agreement
CO2 Carbon dioxideCO2e Carbon dioxide equivalent COP Conference of the PartiesCORSIA Carbon Offset and Reduction
Scheme for International AviationCP1 First Commitment Period under
the Kyoto Protocol
E EIB European Investment BankERPA Emissions Reduction Purchase
Agreement ERU Emission Reduction Unit ETS Emissions Trading SystemEU European Union EU ETS European Union Emissions
Trading System
F FSB Financial Stability Board
G GCF Green Climate FundGDP Gross Domestic ProductGGIRCA Greenhouse Gas Industrial
Reporting and Control ActGHG Greenhouse gasGtCO2e Gigaton of carbon dioxide
equivalent
I ICAO International Civil Aviation Organization
IEA International Energy Agency IFC International Finance CorporationIMO International Maritime
OrganizationINDC Intended Nationally Determined
ContributionIPCC Intergovernmental Panel on
Climate ChangeITMO Internationally Transferred
Mitigation Outcome
J JCM Joint Crediting Mechanism
K ktCO2e Kiloton of carbon dioxide equivalent
4

M MRV Monitoring, Reporting and Verification
Mt MegatonMtCO2e Megaton of carbon dioxide
equivalent
N NDC Nationally Determined Contribution
NDRC China’s National Development and Reform Commission
O ODA Official Development AssistanceOECD Organisation for Economic
Co-operation and Development
P PAF Pilot Auction Facility for Methane and Climate Change Mitigation
PMR Partnership for Market Readiness ppm Parts per million
R RBCF Results-Based Climate FinanceREDD Reducing Emissions from
Deforestation and Forest Degradation
REDD+ Extends REDD by including sustainable forest management, conservation of forests, and enhancement of carbon sinks
RGGI Regional Greenhouse Gas Initiative
S SBSTA Subsidiary Body for Scientific and Technological Advice
T t Ton (note that, unless specified otherwise, ton in this report refers to a metric ton = 1,000 kg)
TCAF Transformative Carbon Asset Facility
TCFD Task Force on Climate-related Financial Disclosures
tce tons of standard coal equivalenttCO2 Ton of carbon dioxidetCO2e Ton of carbon dioxide equivalent
U UK United KingdomUNFCCC United Nations Framework
Convention on Climate Change US United States
Y y Year
5

List of abbreviations and acronyms
Executive summary
1. Introduction
4
10
17
2. Existing and emerging carbon pricing initiatives around the world
2.1. Overview, recent developments, and emerging trends2.1.1 Global overview of carbon pricing initiatives 2.1.2 Recent developments and emerging trends
2.2. International carbon pricing initiatives2.3. Regional, national, and subnational carbon pricing initiatives
2.4. Internal carbon pricing initiatives
21
22
22
31
36
43
55
Table of contents
6

3. Climate finance and climate markets: toward an integrated approach
3.1. An integrated approach to climate finance and international climate markets3.1.1 Roles for climate finance3.1.2 Roles for international climate markets3.1.3 Combining climate finance and international climate markets
3.2. Results-Based Climate Finance to support the creation of climate markets and transition to an inter- national carbon market3.2.1 Transitioning from climate finance to climate markets3.2.2 Defining RBCF3.2.3 How RBCF can support building climate markets and help the transition to an international carbon market3.2.4 RBCF and resource mobilization
3.3. Illustration - An integrated approach to accelerating the transition to clean energy
59
62
626464
68
68
7072
75
77
82
83
89
91
91919293
94
Annex I Conversion rates
Annex II Analysis of NDCs
Annex III Summary of Parties’ views on the operationalization of Articles 6.2 and 6.4 of the Paris Agreement
Annex IV Cost and investment concepts Concepts Incremental investment required Gross investment required The economic cost of climate change impacts
Glossary
7

Summary map of regional, national and subnational carbon pricing initiatives implemented, scheduled for implementation and under consideration (ETS and carbon tax)Regional, national and subnational carbon pricing initiatives: share of global annual GHG emissions coveredPrices in implemented carbon pricing initiativesSummary map of regional, national and subnational carbon pricing initiatives implemented, scheduled for implementation and under consideration (ETS and carbon tax)Regional, national and subnational carbon pricing initiatives: share of global annual GHG emissions coveredPrices in implemented carbon pricing initiativesCarbon price and emissions coverage of implemented carbon pricing initiativesCarbon price, share of emissions covered and carbon pricing revenues of implemented carbon pricing initiativesStatus of NDC submissionsCarbon pricing initiatives implemented or scheduled for implementation, with sectoral coverage and GHG emissions coveredInternal carbon prices of utilities publicly disclosed to CDP compared to Paris-compatibleAn integrated policy approachChannels through which RBCF supports prerequisites for climate marketsAbsolute and relative crediting of CERs in the first commitment period of the Kyoto Protocol (CP1)Estimated disbursements from the 12 largest RBCF fundsA policy mix consistent with the reduction of coal-fired power generation
12
13
1426
27
282930
3744
576172757778
Figures
1
2
34
5
678
910
111213141516
8

Market update of mechanisms under the Kyoto ProtocolKey carbon pricing developments in the Canadian provinces and territoriesKey developments in the Chinese pilot ETSsCurrency conversion rates, as of August 1, 2017Unconditional and conditional targets and intended use of carbon pricing and/or market instruments stated in NDCsSummary of Parties‘ views on the operationalization of Articles 6.2 and 6.4 of the Paris Agreement
Carbon pricing in numbersSummary of selected changes in regional, national and subnational carbon pricing initiativesUse of internal carbon pricing by multilateral banks in project evaluationsElements for integrating climate finance and international climate marketsThe maturing of technology markets enables a shift to market-based financeA stylized RBCF program to reduce emissions by increasing the uptake of residential solar power systemsRBCF to support the development of regional climate markets
4046488283
89
255458656971
80
Tables
12345
6
Boxes
123456
7
9Table of contents

here has been continued progress on carbon pricing initiatives over the last year at the regional, national and subnational levels. Despite these important positive steps, further action is necessary for carbon pricing to make a substantial contribution to the Paris Agreement pledge, which aims to keep the global average temperature increase to well below 2°C and pursue efforts to hold the increase to 1.5°C.
The key priorities for action are: − Expanding coverage through the development of
new initiatives and the broadening of greenhouse gas (GHG) emissions coverage in existing initiatives;
− Deepening impact by raising carbon prices, which will send a stronger price signal, triggering more investments in low-carbon technologies;
− Aligning carbon pricing with complementary and enabling policies at the domestic level to ensure coherence with the broader policy framework;
− Progressing the guidelines of the Paris Agreement to pave the way towards linking domestic pricing schemes and enabling usage of international market mechanisms; and
− Using climate finance in a more strategic and integrated way to catalyze climate markets that support transformative climate change mitigation policies and investments.
Accelerating the pace of action on these priorities in the coming years will be important for achieving a reduction in GHG emissions in line with the 2°C objective.
The Paris Agreement entered into force on November 4, 2016, less than one year after it was adopted. Negotiations are now underway to develop the Paris Agreement guidelines. Country-level pledges to reduce GHG emissions under the Paris Agreement are formalized through Nationally Determined Contributions (NDCs). Carbon pricing plays a prominent role in many of these NDCs, with 81 Parties planning or considering its use to drive GHG mitigation. Among other functions, the Paris Agreement guidelines will provide operational guidance on cooperative approaches to emissions mitigation under Article 6, thereby shaping the way forward for international market mechanisms and the linking of domestic carbon pricing initiatives under the new international climate accord. However, negotiations to date have yielded little progress; there is substantial pressure to move rapidly toward consensus, given that the provisions of the Paris Agreement are scheduled to finalize at the end of 2018.
In parallel to these international developments, regional, national and subnational jurisdictions continue to implement new initiatives. Since 2016, eight new initiatives have been launched and two more initiatives are scheduled for implementation in 2018. This brings the total number of carbon pricing initiatives implemented or scheduled for implementation to 47. Overall, 67 jurisdictions—representing about half of the global economy and more than a quarter of global GHG emissions—are putting a price on carbon, as shown in Figure 1. Carbon pricing initiatives cover about half of these jurisdictions’ GHG emissions on average, which translates to about 8 gigatons of carbon dioxide
T
Executive summary
10

equivalent (GtCO2e) or 15 percent of global GHG emissions as shown in Figure 2. Once the Chinese national ETS is implemented—it is currently planned to launch at the end of 2017—this will expand the emissions covered by carbon pricing to between 20 to 25 percent of global GHG emissions.
Developments in the Americas have been particularly notable. In Canada, the government put forward a pan-Canadian approach to carbon pricing in 2016, requiring all provinces and territories to have a carbon price initiative in place by 2018 that meets a set of federal criteria. British Columbia had already launched a baseline-and-credit emissions trading system (ETS) in 2016, in addition to its pre-existing carbon tax. Alberta and Ontario followed a year later, implementing a carbon tax and an ETS, respectively. Jurisdictions that do not already have existing carbon pricing initiatives have taken steps to implement the national carbon pricing requirement. A national carbon pricing system—currently under development—will apply to provinces and territories that do not meet the federal criteria. Furthermore, Mexico will start an ETS simulation in preparation for its pilot ETS launch in 2018, while Colombia and Chile are both investigating the introduction of ETSs. These ETS developments follow the carbon taxes that were implemented in these jurisdictions over the past three years.
While climate action in the United States (US) at the federal level has been set back, there have been positive developments at the subnational level. The intended withdrawal of the US from the Paris Agreement and its review of energy- and climate-related policies, including the Climate Action Plan and the Clean Power Plan, dampens the ambition of the federal government’s policies on climate change mitigation. In response to these national developments, the America’s Pledge initiative is bringing together states, cities, companies, universities and other actors to highlight the continued support of the Paris Agreement goals by compiling and quantifying their efforts to reduce GHG emissions. These actions are reinforced by state
level actions, including Washington State’s launch of a baseline-and-credit ETS in 2017 and the extension of the California ETS until 2030. In addition, RGGI is looking to strengthen its ETS after 2020, Massachusetts is scheduled to launch its own state-level ETS which will operate alongside RGGI in 2018, and Oregon and Virginia are working to introduce carbon pricing.
Companies are also taking climate action by setting internal carbon prices. The number of companies that have reported that they are doing so has grown by 11 percent since 2016. Further adoption of internal carbon pricing is anticipated following the recommendations of the Financial Stability Board’s Task Force on Climate-related Financial Disclosures. These recommendations advise companies and investors to disclose climate-related financial risks and opportunities, and report the internal carbon prices used.
While these developments highlight the growth of carbon pricing in recent years, several indicators demonstrate that significant strides are needed to align these initiatives with the ambition of the Paris Agreement. As shown in Figure 3, the observed carbon prices range from less than US$1 up to US$140/tCO2e. About three quarters of emissions covered by carbon pricing are priced at less than US$10/tCO2e. This is substantially lower than the price levels that are consistent with achieving the temperature goal of the Paris Agreement, in the range of US$40–80/tCO2e in 2020.1 Currently, only 1 percent of emissions covered by a carbon pricing initiative are priced within that range. Additionally, the vast majority of emissions are not covered by carbon pricing. Coverage is still far from the global target identified by the High-Level Panel on Carbon Pricing2 of 50 percent within the next decade. While it is clear that very low carbon prices have little immediate impact, it is encouraging to see that even moderate price levels can have a significant impact; the United Kingdom’s consumption of coal for electricity generation decreased by 76 percent in 2016 compared to 2013, when the Carbon Price Floor was introduced—the lowest level since 1934.
1 Source: High-Level Commission on Carbon Prices, Report of the High-Level Commission on Carbon Prices, 2017, Washington, DC: World Bank.2 Source: World Bank, Leaders Set Landmark Global Goals for Pricing Carbon Pollution, April 21, 2016, http://www.worldbank.org/en/news/press-
release/2016/04/21/leaders-set-landmark-global-goals-for-pricing-carbon-pollution.
11

Figure 1 / Summary map of regional, national and subnational carbon pricing initiatives implemented, scheduled for implementation and under consideration (ETS and carbon tax)
ETS implemented or scheduled for implementation
Carbon tax implemented or scheduled for implementation
ETS or carbon tax under consideration
ETS and carbon tax implemented or scheduled
Carbon tax implemented or scheduled, ETS under consideration
The circles represent subnational jurisdictions. The circles are not representative of the size of the carbon pricing instrument, but show the subnational regions (large circles) and cities (small circles).
Note: Carbon pricing initiatives are considered “scheduled for implementation” once they have been formally adopted through legislation and have an official, planned start date. Carbon pricing initiatives are considered “under consideration” if the government has announced its intention to work towards the implementation of a carbon pricing initiative and this has been formally confirmed by official government sources. The carbon pricing initiatives have been classified in ETSs and carbon taxes according to how they operate technically. ETS does not only refer to cap-and-trade systems, but also baseline-and-credit systems such as in British Columbia and baseline-and-offset systems such as in Australia. The authors recognize that other classifications are possible. Due to the dynamic approach to continuously improve data quality, changes to the map do not only reflect new developments, but also corrections following new information from official government sources, resulting in changes for Liechtenstein, Ukraine and Kyoto.
Tally of carbon pricing initiatives implemented or scheduled for implementation
National level
21
15
642
Subnational level
25
2
23
NORWAY
UK
PORTUGAL
FRANCE
SWITZERLAND
SLOVENIA
POLAND
LATVIAESTONIA
FINLAND
SWEDEN
DENMARK
IRELAND
LIECHTENSTEIN
SHANGHAI
SHENZHEN
SINGAPORE
TAIWAN
FUJIAN
BEIJING
TIANJIN
HUBEI
CHONGQING
GUANGDONG
TOKYOSAITAMA
CHILE
SãO PAULO
NEWFOUND-LAND AND LABRADOR
NEW BRUNSWICK
PRINCE EDWARD ISLAND
NOVA SCOTIA TURKEY
UKRAINE
CHINA
NORTHWEST TERRITORIES
CANADABRITISH
COLUMBIA
WASHINGTONOREGON
CALIFORNIA
MEXICO
MANITOBA
ONTARIO
QUéBEC
MASSACHUSETTS
BRAZIL
RIO DE JANEIRO
SOUTH AFRICA AUSTRALIANEW ZEALAND
THAILAND
EU KAZAKHSTAN REPUBLIC OF KOREA
JAPAN
ICELAND
COLOMBIA
VIETNAM
ALBERTA
RGGI
VIRGINIA
12

Figure 2 / Regional, national and subnational carbon pricing initiatives: share of global annual GHG emissions covered
Note: Only the introduction or removal of an ETS or carbon tax is shown. Emissions are presented as a share of global GHG emissions in 2012. Annual changes in global, regional, national, and subnational GHG emissions are not shown in the graph. Due to the dynamic approach to continuously improve data quality using official government sources, the carbon pricing initiatives in Liechtenstein and Ukraine were added, the city-level Kyoto ETS was removed, and the start date of the Latvia carbon tax was corrected. The information on the Chinese national ETS represents early unofficial estimates based on the Chinese President’s announcement in September 2015. The National Treasury of South Africa will submit a revised carbon tax bill to Parliament later this year and the new implementation date of the carbon tax will be determined by the Minister of Finance.
Finland carbon tax (1990 ) Poland carbon tax (1990 ) Norway carbon tax (1991 ) Sweden carbon tax (1991 ) Denmark carbon tax (1992 ) Slovenia carbon tax (1996 ) Estonia carbon tax (2000 ) Latvia carbon tax (2004 ) EU ETS (2005 ) Alberta SGER (2007 ) Switzerland ETS (2008 ) New Zealand ETS (2008 ) Switzerland carbon tax (2008 ) Liechtenstein carbon tax (2008 ) BC carbon tax (2008 ) RGGI (2009 )
Iceland carbon tax (2010 ) Tokyo CaT (2010 ) Ireland carbon tax (2010 ) Ukraine carbon tax (2011 ) Saitama ETS (2011 ) California CaT (2012 ) Japan carbon tax (2012 ) Australia CPM (2012 - 2014) Québec CaT (2013 ) Kazakhstan ETS (2013 ) UK carbon price floor (2013 ) Shenzhen pilot ETS (2013 ) Shanghai pilot ETS (2013 ) Beijing pilot ETS (2013 ) Guangdong pilot ETS (2013 ) Tianjin pilot ETS (2013 )
France carbon tax (2014 ) Mexico carbon tax (2014 ) Hubei pilot ETS (2014 ) Chongqing pilot ETS (2014 ) Korea ETS (2015 ) Portugal carbon tax (2015 ) BC GGIRCA (2016 ) Australia ERF Safeguard Mechanism (2016 ) Fujian pilot ETS (2016 ) Washington CAR (2017 ) Ontario CaT (2017 ) Alberta carbon tax (2017 ) Chile carbon tax (2017 ) Colombia carbon tax (2017 ) Massachusetts ETS (2018 ) South Africa carbon tax (2018 ) China national ETS (2017 )
Shar
e of
glo
bal a
nnua
l GH
G e
mis
sion
s 25%
20%
15%
10%
5%
0%
1990
1992
1995
2000
1998
2003
2004
2005
1991
1994
1997
2002
1993
1996
2001
1999
2006
2007
2008
2009
2010
2011
2012
2013
2014
2015
2016
2018
2017
4 5 6 7 8
9 10 15 16 1921
24
32
3637
40
2
Number of implemented initiatives
4547
13Executive summary

Figure 3 / Prices in implemented carbon pricing initiatives
US$ 0/ tCO2e
US$ 10/ tCO2e
US$ 20/ tCO2e
US$ 30/ tCO2e
US$ 40/ tCO2e
US$ 50/ tCO2e
US$ 60/ tCO2e
US$ 70/ tCO2e
US$ 80/ tCO2e
US$ 90/ tCO2e
US$ 140/ tCO2e
US$ 130/ tCO2e
US$ 120/ tCO2e
US$ 110/ tCO2e
US$ 100/ tCO2e
US$/tCO2e
140 Sweden carbon tax
73 Finland carbon tax (Liquid transport fuels)
69 Finland carbon tax (Other fossil fuels)
56 Norway carbon tax (upper)
36 France carbon tax
27 Denmark carbon tax
87 Switzerland carbon tax, Liechtenstein carbon tax
16 Alberta carbon tax
20 Slovenia carbon tax
14 Saitama ETS, Tokyo CaT
7 Switzerland ETS
Latvia carbon tax, Fujian pilot ETS, 5 Colombia carbon tax, Chile carbon tax, Shanghai pilot ETS
12 Iceland carbon tax
1 Tianjin pilot ETS
6 EU ETS, Shenzhen pilot ETS
2
Estonia carbon tax,Guangdong pilot ETS,
Hubei pilot ETS
4 RGGI, Norway carbon tax (lower)
13New Zealand ETS
18Korea ETS
<1 Mexico carbon tax (lower),
Chongqing pilot ETS,Poland carbon tax, Ukraine carbon tax
15Québec CaT, California CaT, Ontario CaT
24Alberta SGER, BC carbon tax,
UK carbon price floor, Ireland carbon tax
8Portugal carbon tax, Beijing pilot ETS
Mexico carbon tax (upper), 3 Japan carbon tax
Note: Nominal prices on August 1, 2017, shown for illustrative purpose only. The Australia ERF Safeguard Mechanism, British Columbia GGIRCA, Kazakhstan ETS and Washington CAR are not shown in this graph as price information is not available for those initiatives. Prices are not necessarily comparable between carbon pricing initiatives because of differences in the sectors covered and allocation methods applied, specific exemptions, and different compensation methods.
14

Several common issues need to be overcome to expand, deepen and accelerate carbon pricing initiatives.
− Domestically, one key concern is the potential impact of carbon pricing on the international competitiveness of some domestic industrial sectors, as discussed in the 2015 edition of the State and Trends of Carbon Pricing.3 Related to this issue is the persisting focus on costs to regulated companies and consumers in the carbon pricing discourse. Equal consideration of the potential benefits of carbon pricing, such as the identification of investments that could benefit from the low-carbon transition and the number of jobs that could be created, would yield a more balanced debate.4
− Carbon pricing is also held back by the uncertain standing of climate policy and carbon pricing initiatives in the long term, due to policy changes such as those witnessed in the US. More broadly, carbon pricing can be most effective and acceptable to the public when it is well aligned with the broader context in a country.5 This challenges policymakers to balance multiple objectives, of which GHG emissions mitigation is just one. This issue is examined in the 2016 edition of the State and Trends of Carbon Pricing.6
− At the international level, cooperation through international market mechanisms and linking of domestic carbon pricing initiatives will require the development of trust between parties.7 Accordingly, accounting rules (such as avoidance of “double counting”) will need to ensure that the generated mitigation outcomes correspond to mitigation actions.8 In the absence of such trust, trading and crediting would likely stall.
Overcoming the issues that impede the implementation of carbon pricing is important to achieve a low-carbon development path that delivers the mitigation targets of the
Paris Agreement together with substantial economic benefits. This “win-win” development path is possible when well-designed domestic policies are supported by international cooperation. It is important that an integrated policy response be developed that combines domestic carbon prices, other domestic policies, climate finance and international market approaches.
To reach this low-carbon development path, an annual level of incremental low-carbon investments on the order of US$700 billion will be required by 2030. These incremental investments will have to be mobilized through a combination of policy reforms, climate markets and climate finance. In addition, planned investment will need to be shifted from high-carbon technologies to a range of low-carbon alternatives.
This amount is substantially lower than the long-run environmental and economic benefits that can be achieved; however, mobilizing these resources is a major challenge. Domestic resource mobilization will need to make the largest contribution. This can be enabled by domestic policies and measures, including carbon pricing, to catalyze private sector investment. Revenues from carbon pricing could also generate significant fiscal benefits.
These domestic actions must be complemented by effective and efficient international cooperation. Following the analysis provided in the 2016 edition of the State and Trends of Carbon Pricing, an international carbon market implemented by 2030 has the potential to mobilize annual resource flows of US$220 billion, corresponding to about one third of the incremental investment needs of US$700 billion. International cooperation will also reduce the costs of achieving emission reduction targets.
3 Source: World Bank and Ecofys, State and Trends of Carbon Pricing 2015, September 2015.4 Source: WRI, Putting a Price on Carbon: A Handbook for U.S. Policymakers, April 2015.5 Source: Baranzini et al., Carbon pricing in climate policy: seven reasons, complementary instruments, and political economy considerations, March 31, 2017.6 Source: World Bank, Ecofys and Vivid Economics, State and Trends of Carbon Pricing 2016, October 2016.7 Source: Fuessler et al., Market Mechanisms: Incentives and Integration in the Post-2020 World, November 2015.8 Source: World Bank, Networking Carbon Markets— Key Elements of the Process, July 2016.
15Executive summary

Climate finance can play a crucial role in global resource mobilization to achieve a low-carbon development path by complementing and catalyzing domestic policies and climate markets. In order to do so climate finance needs to be seen in a broader context of policy support, market building and leveraging private sector engagement.
This calls for an integrated approach to climate finance and climate markets, in which climate finance helps catalyze the development of climate markets, and as climate markets develop they play a larger role in the mobilization of resources for low-carbon investments. Policy makers can optimize the use of climate finance in this transition by ensuring 1) that climate finance is provided on concessional terms only to the extent required to deliver the intervention; 2) that climate finance and climate markets become compatible through the use of common standards and definitions; 3) that climate markets are efficient and environmentally robust; and 4) as climate markets become more developed, they are utilized ahead of climate finance to mobilize low-carbon investments, so that public resources are used efficiently.
Results-based climate finance (RBCF) can support such an integrated approach to climate finance and markets. RBCF is a form of climate finance where funds are disbursed by the provider of climate finance to the recipient upon achievement of a pre-agreed set of climate results. These results are typically defined as an output—for example, per unit of installed renewable capacity—or as an outcome—for example, per unit of emission reduction. RBCF can support building climate markets and help the transition to an international carbon market by: facilitating a private sector response to carbon pricing, including encouraging the ecosystem of business services required for climate markets, supporting domestic policy processes and building targeted implementation capacity; developing monitoring, reporting and verification systems that are needed in both RBCF and market designs; and piloting programs based on the principles of Article 6 of the Paris Agreement. While RBCF is already delivered through various facilities, it would have to be deployed at a larger scale than at present to enable transformative impacts in a broad range of economic sectors.
16

1 Introduction
171 / Introduction

nstead of pitting the environment versus the economy, let’s consider market principles and economic growth. … We believe that by changing the way we think and talk about climate change, we can lower the temperature of the debate—and accomplish a whole lot more,” asserted Michael Bloomberg and Carl Pope.9 Carbon pricing plays an important role in such response to tackling climate change as it requires the cost of greenhouse gas (GHG) emissions to be considered in financial decisions. This levels the playing field between emission-intensive and low-carbon economic activities, triggering more investments in low-carbon technologies. Carbon pricing is therefore key to mobilizing the US$700 billion of incremental investments needed annually by 2030 to transition to a low-carbon economy.10
Carbon pricing initiatives continue to spread, despite the headwinds hampering more ambitious climate action in some jurisdictions. Substantial progress has been made over the past two years, including the entry into force of the Paris
Agreement and the eight new carbon pricing initiatives that have been implemented in national and subnational jurisdictions. Developments in the Americas have been particularly prominent; of the eight new carbon pricing initiatives launched since the beginning of 2016, six came from this region. These advances in the region represent a significant achievement, especially given the political opposition to carbon pricing initiatives at the national level in some of these jurisdictions.
Despite these carbon pricing developments, substantial progress is needed on three key dimensions to reach the goal of the Paris Agreement: the coverage of GHG emissions must expand, deeper impacts on emission reductions need to be triggered by raising carbon prices, and the speed of these actions should accelerate in line with Paris Agreement compatible pathways. The current level of carbon prices is substantially lower than the level that the High-Level Commission on Carbon Prices found to be consistent with the temperature goal of the Paris Agreement. In
“I
9 Source: Bloomberg M. and Pope C., Climate of Hope: How Cities, Businesses, and Citizens Can Save the Planet, St. Martin’s Press, April 18, 2017, 10 See Section 3 of this report.
1 Introduction
18

addition, while 15 percent of global GHG emissions are covered by an emissions trading system (ETS) or carbon tax, a much higher coverage combined with international cooperation on climate markets is essential to mobilizing the large volume of resources required to finance the transition to a decarbonized economy and bring down the costs of low-carbon technology through economies of scale. Issues that may be holding back further progress include concerns about the impact of carbon pricing on international competitiveness, and costs to regulated companies and consumers. Uncertainty surrounding climate policy and the challenge of aligning carbon pricing with a country’s broader policy objectives are other possible constraints to more accelerated action.
The report takes stock of the latest trends and developments in carbon pricing initiatives. It covers initiatives that explicitly apply a price on a unit of GHG emission, including ETSs—both cap-and-trade and baseline-and-credit systems, carbon taxes, offset mechanisms and results-based climate finance
(RBCF). These initiatives are examined in Section 2 of this report on subnational, national, regional and international levels, the latter of which includes the existing Kyoto mechanisms and new approaches under Article 6 of the Paris Agreement, as well as initiatives outside of the United Nations Framework Convention on Climate Change (UNFCCC). In addition, this section reports on the internal carbon prices set by public and private organizations to price carbon for decision making purposes.
Section 3 of this report explores how the two main modalities of international cooperation – climate finance and climate markets – can be used in an integrated approach to enable, support and complement domestic policies to mobilize the flow of resources needed to meet the temperature goal of the Paris Agreement. The section further discusses what role RBCF can play in transitioning towards such an integrated approach. The integrated approach and the role of RBCF will then be illustrated in using the example of accelerating the transition to clean energy.
19

» More and more politicians, policy makers and business actors are calling for a carbon price as the green economy’s missing link. Putting a price on carbon at a global scale could unleash innovation and provide the incentives that industries and consumers need to make sustainable choices. «António Guterres, Secretary-General of the United Nations
» Carbon pricing reinforces the full realization of the nationally determined contributions and is an essential key for a strong, real, useful implementation of the Paris Agreement. «Patricia Espinosa, Executive Secretary of the United Nations Framework Convention on Climate Change
20

2 Existing and emerging
carbon pricing initiatives around the world
212 / Existing and emerging carbon pricing initiatives around the world

2.1 Overview, recent developments, and emerging trends
2.1.1Global overview of carbon pricing initiatives
At the international level, 81 of the 155 Parties that have submitted their Nationally Determined Contributions (NDCs) to date have stated that they are planning or considering the use of carbon pricing as a tool to meet their commitments,11 as shown in Box 1 and detailed further in Section 2.2. These Parties account for 55 percent of global GHG emissions. Among the Parties planning or considering the use of carbon pricing are three of the world’s five largest economies: China, Japan and India.12
The International Civil Aviation Organization’s (ICAO) adoption of the Carbon Offsetting and Reduction Scheme for International Aviation (CORSIA) in 2016 marked the first instance of a global sectoral carbon pricing initiative. CORSIA will cap GHG emissions from international aviation at 2020 levels. The pilot phase is planned to start in 2021. Efforts are now also being made to develop a GHG reduction strategy for the international shipping sector through the International Maritime Organization (IMO). At the national and subnational levels, new initiatives can build on substantial progress and experience with carbon pricing over the last 25 years.13 As of 2017, 42 national and 25 subnational jurisdictions14 are putting a price on carbon, as shown in Figure 4. Over the past decade, the number of jurisdictions with carbon pricing initiatives has doubled. These jurisdictions account for about half of the global economy15 and more than a quarter of global GHG emissions. On average, carbon
11 For the purpose of this report, carbon pricing includes all market mechanisms. The authors recognize that different interpretations are possible since references to market mechanisms in NDCs are not always presented in a clear and consistent manner. These are different from the 101 INDCs planning or considering the use of carbon pricing reported in the 2016 edition of the State and Trends of Carbon Pricing as an INDC only becomes their first NDC upon ratification of the Paris Agreement, unless the Party decides to revise it. As of September 1, 2017, five Parties which have ratified the Paris Agreement indicated that they do not want their INDC to become their NDC and still have to submit their first NDC.
12 The other two Parties, the United States (US) and the EU, did not state the use of carbon pricing in their NDCs, despite carbon pricing initiatives already being implemented in those jurisdictions at a regional, national and/or subnational level. The number of Parties planning or considering the use of carbon pricing in their NDCs is therefore not comparable with the jurisdictions with carbon pricing initiatives implemented, scheduled or under consideration.
13 The authors have kept the format of presenting this information consistent with the previous editions of the State and Trends of Carbon Pricing for comparison purposes.
14 Cities, states, and subnational regions.15 Authors’ calculations based on the 2014 gross domestic product of the national and subnational jurisdictions putting a price on carbon.
2 Existing and emerging carbon pricing initiatives around the world
22

pricing initiatives implemented and scheduled for implementation cover about half of the emissions in these jurisdictions. These numbers translate to a total coverage of about 8 gigatons of carbon dioxide equivalent (GtCO2e) or about 15 percent of global GHG emissions, as displayed in Figure 5. As a result of the growth in the number of initiatives as well as expanded coverage of existing initiatives, the emissions covered by carbon pricing have increased almost fourfold over the past decade. Figure 5 shows that the number of carbon pricing initiatives implemented or scheduled for implementation has quadrupled in the past decade and almost doubled over the last five years, reaching 47 in 2017.16 Half of the new initiatives implemented or scheduled for implementation in the last five years were in upper-middle-income economies, while prior to 2013, carbon pricing initiatives were implemented almost exclusively in high-income economies.17 In the past two years, the Americas have been the main contributor to growth in the number of carbon pricing initiatives implemented or scheduled for implementation, with three quarters of the newly implemented initiatives—six out of eight—coming from this region. The number of carbon pricing initiatives in the Americas has doubled to 12 initiatives over 2016–2017, and this number will double again if all initiatives scheduled for implementation and under consideration are implemented.
In addition, once the Chinese national ETS is launched—currently planned for the end of 2017— it will be the largest carbon pricing initiative in the world, surpassing the European Union ETS (EU ETS). Already, the eight Chinese ETS pilots collectively cover 1.3 GtCO2e. While this coverage represents only about ten percent of the country’s annual GHG emissions, it nonetheless constitutes a substantial volume of GHG emissions; for example, this coverage is greater than the total GHG emissions from Canada. Following the launch of the Chinese national ETS, the emissions coverage of the world’s largest GHG emitter could increase fourfold.18 While the Chinese government has stepped up on the world stage to become a climate leader, Chinese companies continue to drive the expansion of coal-fired power plants both domestically and abroad. Realization of their expansion plans would see the world’s coal power capacity increase by 43 percent.19 These developments emphasize the need to level the playing field between emission-intensive and low-carbon technology. Carbon pricing can help to achieve this by making emission-intensive investments more expensive. Carbon pricing revenues can be used to finance low-carbon technology and lower their costs through developing economies of scale.
In 2016, governments raised about US$22 billion in carbon pricing revenues from allowance auctions, direct payments to meet compliance obligations and carbon tax receipts, a decrease compared to the US$26 billion raised in 2015. This drop is largely due to the lower carbon prices in the EU ETS and Regional Greenhouse Gas Initiative (RGGI) and a large amount of unsold allowances in California and Québec. The decline in revenues can also be partially attributed to a reduction in revenues from some carbon taxes, in particular
» As of 2017, 42 national and 25 subnational jurisdictions are putting a price on carbon. These jurisdictions account for about half of the global economy. «
16 In 2007, 10 carbon pricing initiatives were implemented or scheduled for implementation, increasing to 24 in 2012 and 47 in 2017.17 Since 2013, 12 of the 24 new carbon pricing initiatives were implemented or scheduled for implementation in upper-middle-income economies.
Source: Authors’ calculations based on the World Bank Country and Lending Groups Country Classifications as of September 1, 2017.18 The emissions to be covered under the Chinese national ETS are estimated to be about half of China’s national GHG emissions, based on the sector scope,
as stated in the “US-China Joint Presidential Statement on Climate Change”, and public emissions data from the International Energy Agency. This estimate has not been validated by Chinese authorities. Informed researchers have judged that the GHG emissions coverage could potentially be about 40 percent of China’s total GHG emissions.
19 Source: Coalswarm, Sierra Club and Greenpeace, Boom and Bust 2017, March 2017.
23

the United Kingdom (UK) Carbon Price Floor, which was lower than in the previous years due to large GHG emission reductions in the power sector. The UK’s consumption of coal for electricity generation decreased by 76 percent in 2016 compared to 2013 when the Carbon Price Floor was introduced—the lowest level since 1934.20 Thus, despite a decrease in total revenues, this trend highlights the positive contribution of carbon pricing in changing the energy mix, especially when supported by appropriate complementary policies. The EU ETS remains the largest source of carbon pricing revenues due to its size, followed by the carbon taxes in France, Sweden and Japan as illustrated in Figure 8. This figure also shows that many initiatives could increase their revenues by raising carbon prices or expanding their coverage.
The total value of ETSs and carbon taxes in 2017 is US$52 billion,21 an increase of seven percent compared to the 2016 value of US$49 billion. This growth is primarily due to the launch of several carbon pricing initiatives at the end of 2016 and in 2017. Part of the increase is offset by lower carbon prices and declining caps in some ETSs.
The observed carbon prices span a wide range, from less than US$1 to up to US$140/tCO2e, as shown in Figure 7. Price levels have increased in some newer initiatives such as in the France carbon
tax, which has risen from €22/tCO2e (US$26/tCO2e) to €31/tCO2e (US$37/tCO2e) over 2016-2017, and in the Republic of Korea ETS, where allowance prices have increased from KRW17,000/tCO2e (US$15/tCO2e) to KRW20,350/tCO2e (US$18/tCO2e) over the same period.
Momentum is also building for carbon pricing in the private sector, where an increasing number of companies are using internal carbon pricing to actively manage climate-related risks. The number of companies that reported to CDP that they are currently using an internal price on carbon in 2017 or planning to do so within two years has increased by 11 percent compared to 2016.22
The number of carbon pricing initiatives and their global coverage has grown significantly over the past few years, with increasing support from both the public and private sector. However, the pace of these developments needs to accelerate. To help meet the temperature goal of the Paris Agreement, the High-Level Commission on Carbon Prices identified that prices will have to be in the range of US$40–80/tCO2e in 2020 and US$50–100/tCO2e by 2030.23 In the same context, the High-Level Panel on Carbon Pricing24 set a global target to achieve 50 percent coverage of emissions under carbon pricing initiatives within the next decade, which entails a much higher coverage than today’s level.
20 Source: UK government, Energy Trends: solid fuels and derived gases – Coal consumption and coal stocks, accessed March 15, 2017.21 The total value of ETS markets was estimated by multiplying each ETS’ annual allowance or credit volume for 2017, or the most recent yearly volume data,
with the price of the emission unit on April 1, 2017. The total value for carbon taxes was derived from official government budgets for 2017. Where the allowance or credit volume (for an ETS) or budget information (for a carbon tax) was unavailable, the value of the carbon pricing initiative was calculated by multiplying the GHG emissions covered with the nominal carbon price on April 1, 2017. No information was available on the amount of emission reduction credits which could be generated by facilities under the Washington State Clean Air Rule or offsets under the Australian safeguard mechanism. Also, the Chinese national ETS is yet to be implemented. Therefore, these were not included in the value calculation: The values presented in the Carbon Pricing Watch 2017 were not updated to August 1, 2017, because no other new carbon pricing initiatives were implemented nor have any changes occurred in the existing initiatives since the release of that brief in May 2017. Moreover, daily changes in prices and exchange rates over a 5-month period cannot be used as an indicator of the evolution of global carbon pricing initiatives.
22 Source: CDP, Putting a price on carbon - Integrating climate risk into business, October 2017.23 The Commission recognizes that the target carbon price may differ across countries. It considers that achieving the Paris objectives will require all
countries to implement climate policy packages. These policy packages include complementary policies to carbon pricing to tackle other market failures beyond the GHG externality that take into account: knowledge spillovers (and research & development), network effects, imperfect capital markets and unpriced co-benefits such as reduced pollution.
24 Source: World Bank, Leaders Set Landmark Global Goals for Pricing Carbon Pollution, April 21, 2016, http://www.worldbank.org/en/news/press-release/2016/04/21/leaders-set-landmark-global-goals-for-pricing-carbon-pollution.
24

Box 1 / Carbon pricing in numbers
INTERNATIONAL CARBON PRICING INITIATIVES
81 NDCS include carbon pricing
(domestic and/or international)
55%of global GHG emissions
are covered by these NDCs
REGIONAL, NATIONAL AND SUBNATIONAL CARBON PRICING INITIATIVES
42NATIONAL
25SUBNATIONAL
47CARBON PRICING INITIATIVES
jurisdictions with carbon pricing initiatives implemented or scheduled for implementation
COVERING ANNUAL GLOBAL GHG EMISSIONS OF
8 GtCO2e = 15% PRICES IN THE IMPLEMENTED INITIATIVES
US$1-140/tCO2eThree quarters of the emissions covered are priced <US$10/tCO2e
Carbon pricing revenues raised by governments in 2016 were
US$22 billionLower compared
to US$26 billion in 2015
Annual value of carbon pricing initiatives in 2017 is
US$52 billionHigher compared
to the value of US$49 billion for 2016
INTERNAL CARBON PRICING INITIATIVES
OVER 1,300 COMPANIESare using or planning to use
internal carbon pricing in the coming two years
83%of these companies are located in
jurisdictions with carbon pricing initiatives implemented or scheduled for implementation
INTERNAL CORPORATE CARBON PRICES ARE IN THE RANGE OF
US$0.01-909/tCO2e
252 / Existing and emerging carbon pricing initiatives around the world

Figure 4 / Summary map of regional, national and subnational carbon pricing initiatives implemented, scheduled for implementation and under consideration (ETS and carbon tax)
The circles represent subnational jurisdictions: subnational regions are shown in large circles and cities are shown in small circles. The circles are not representative of the size of the carbon pricing initiative.
Note: RGGI = Regional Greenhouse Gas Initiative. Carbon pricing initiatives care considered “scheduled for implementation” once they have been formally adopted through legislation and have an official, planned start date. Carbon pricing initiatives are considered “under consideration” if the government has announced its intention to work towards the implementation of a carbon pricing initiative and this has been formally confirmed by official government sources. The carbon pricing initiatives have been classified in ETSs and carbon taxes according to how they operate technically. ETS does not only refer to cap-and-trade systems, but also baseline-and-credit systems such as in British Columbia and baseline-and-offset systems such as in Australia. The authors recognize that other classifications are possible. Due to the dynamic approach to continuously improve data quality, changes to the map do not only reflect new developments, but also corrections following new information from official government sources, resulting in changes for Liechtenstein, Ukraine and Kyoto.
Initiatives implemented or scheduled for implementation: National ETSs: Australia, Austria, Belgium, Bulgaria, Croatia, Cyprus, Czech Republic, Germany, Greece, Hungary, Italy, Kazakhstan, Lithuania, Luxembourg, Malta, the Netherlands, New Zealand, the Republic of Korea, Romania, Slovakia, and Spain. National carbon taxes: Chile, Colombia, Japan, Mexico, South Africa, and Ukraine. Both national ETSs and carbon taxes: Denmark, Estonia, Finland, France, Iceland, Ireland, Latvia, Liechtenstein, Norway, Poland, Portugal, Slovenia, Sweden, Switzerland, and the United Kingdom. Subnational ETSs: Beijing, California, Chongqing, Connecticut, Delaware, Fujian, Guangdong, Hubei, Maine, Maryland, Massachusetts, New Hampshire, New York, Ontario, Québec, Rhode Island, Saitama, Shanghai, Shenzhen, Tianjin, Tokyo, Vermont, and Washington State. Both subnational ETSs and carbon taxes: Alberta and British Columbia. Initiatives under consideration: National ETS or carbon tax: Brazil, Canada, Chile (ETS), China, Colombia (ETS), Japan (ETS), Mexico (ETS), Singapore, Thailand, Turkey, Ukraine (ETS), and Vietnam. Subnational ETS or carbon tax: Manitoba, New Brunswick, Newfoundland and Labrador, Northwest Territories, Nova Scotia, Oregon, Prince Edward Island, Rio de Janeiro, São Paolo, Taiwan, China, and Virginia.
ETS implemented or scheduled for implementation
Carbon tax implemented or scheduled for implementation ETS or carbon tax under consideration
ETS and carbon tax implemented or scheduled Carbon tax implemented or scheduled,
ETS under consideration
NORWAY
UK
PORTUGAL
FRANCE
SWITZERLAND
SLOVENIA
POLAND
LATVIAESTONIA
FINLAND
SWEDEN
DENMARK
IRELAND
LIECHTENSTEIN
SHANGHAI
SHENZHEN
SINGAPORE
TAIWAN
FUJIAN
BEIJING
TIANJIN
HUBEI
CHONGQING
GUANGDONG
TOKYOSAITAMA
CHILE
SãO PAULO
NEWFOUND-LAND AND LABRADOR
NEW BRUNSWICK
PRINCE EDWARD ISLAND
NOVA SCOTIA TURKEY
UKRAINE
CHINA
NORTHWEST TERRITORIES
CANADABRITISH
COLUMBIA
WASHINGTONOREGON
CALIFORNIA
MEXICO
MANITOBA
ONTARIO
QUéBEC
MASSACHUSETTS
BRAZIL
RIO DE JANEIRO
SOUTH AFRICA AUSTRALIANEW ZEALAND
THAILAND
EU KAZAKHSTAN REPUBLIC OF KOREA
JAPAN
ICELAND
COLOMBIA
VIETNAM
ALBERTA
RGGI
VIRGINIA
26

Figure 5 / Regional, national and subnational carbon pricing initiatives: share of global annual GHG emissions covered
Note: Only the introduction or removal of an ETS or carbon tax is shown. Emissions are presented as a share of global GHG emissions in 2012. Annual changes in global, regional, national, and subnational GHG emissions are not shown in the graph. Due to the dynamic approach to continuously improve data quality using official government sources, the carbon pricing initiatives in Liechtenstein and Ukraine were added, the city-level Kyoto ETS was removed, and the start date of the Latvia carbon tax was corrected. The information on the Chinese national ETS represents early unofficial estimates based on the Chinese President’s announcement in September 2015. The National Treasury of South Africa will submit a revised carbon tax bill to Parliament later this year and the new implementation date of the carbon tax will be determined by the Minister of Finance.
Finland carbon tax (1990 ) Poland carbon tax (1990 ) Norway carbon tax (1991 ) Sweden carbon tax (1991 ) Denmark carbon tax (1992 ) Slovenia carbon tax (1996 ) Estonia carbon tax (2000 ) Latvia carbon tax (2004 ) EU ETS (2005 ) Alberta SGER (2007 ) Switzerland ETS (2008 ) New Zealand ETS (2008 ) Switzerland carbon tax (2008 ) Liechtenstein carbon tax (2008 ) BC carbon tax (2008 ) RGGI (2009 )
Iceland carbon tax (2010 ) Tokyo CaT (2010 ) Ireland carbon tax (2010 ) Ukraine carbon tax (2011 ) Saitama ETS (2011 ) California CaT (2012 ) Japan carbon tax (2012 ) Australia CPM (2012 - 2014) Québec CaT (2013 ) Kazakhstan ETS (2013 ) UK carbon price floor (2013 ) Shenzhen pilot ETS (2013 ) Shanghai pilot ETS (2013 ) Beijing pilot ETS (2013 ) Guangdong pilot ETS (2013 ) Tianjin pilot ETS (2013 )
France carbon tax (2014 ) Mexico carbon tax (2014 ) Hubei pilot ETS (2014 ) Chongqing pilot ETS (2014 ) Korea ETS (2015 ) Portugal carbon tax (2015 ) BC GGIRCA (2016 ) Australia ERF Safeguard Mechanism (2016 ) Fujian pilot ETS (2016 ) Washington CAR (2017 ) Ontario CaT (2017 ) Alberta carbon tax (2017 ) Chile carbon tax (2017 ) Colombia carbon tax (2017 ) Massachusetts ETS (2018 ) South Africa carbon tax (2018 ) China national ETS (2017 )
Shar
e of
glo
bal a
nnua
l GH
G e
mis
sion
s 25%
20%
15%
10%
5%
0%
1990
1992
1995
2000
1998
2003
2004
2005
1991
1994
1997
2002
1993
1996
2001
1999
2006
2007
2008
2009
2010
2011
2012
2013
2014
2015
2016
2018
2017
4 5 6 7 8
9 10 15 16 1921
24
32
3637
40
2
Number of implemented initiatives
4547
272 / Existing and emerging carbon pricing initiatives around the world

Figure 6 / Prices in implemented carbon pricing initiatives
US$ 0/ tCO2e
US$ 10/ tCO2e
US$ 20/ tCO2e
US$ 30/ tCO2e
US$ 40/ tCO2e
US$ 50/ tCO2e
US$ 60/ tCO2e
US$ 70/ tCO2e
US$ 80/ tCO2e
US$ 90/ tCO2e
US$ 140/ tCO2e
US$ 130/ tCO2e
US$ 120/ tCO2e
US$ 110/ tCO2e
US$ 100/ tCO2e
US$/tCO2e
140 Sweden carbon tax
73 Finland carbon tax (Liquid transport fuels)
69 Finland carbon tax (Other fossil fuels)
56 Norway carbon tax (upper)
36 France carbon tax
27 Denmark carbon tax
87 Switzerland carbon tax, Liechtenstein carbon tax
16 Alberta carbon tax
20 Slovenia carbon tax
14 Saitama ETS, Tokyo CaT
7 Switzerland ETS
Latvia carbon tax, Fujian pilot ETS, 5 Colombia carbon tax, Chile carbon tax, Shanghai pilot ETS
12 Iceland carbon tax
1 Tianjin pilot ETS
6 EU ETS, Shenzhen pilot ETS
2
Estonia carbon tax,Guangdong pilot ETS,
Hubei pilot ETS
4 RGGI, Norway carbon tax (lower)
13New Zealand ETS
18Korea ETS
<1 Mexico carbon tax (lower),
Chongqing pilot ETS,Poland carbon tax, Ukraine carbon tax
15Québec CaT, California CaT, Ontario CaT
24Alberta SGER, BC carbon tax,
UK carbon price floor, Ireland carbon tax
8Portugal carbon tax, Beijing pilot ETS
Mexico carbon tax (upper), 3 Japan carbon tax
Note: Nominal prices on August 1, 2017, shown for illustrative purpose only. The Australia ERF Safeguard Mechanism, British Columbia GGIRCA, Kazakhstan ETS and Washington CAR are not shown in this graph as price information is not available for those initiatives. Prices are not necessarily comparable between carbon pricing initiatives because of differences in the sectors covered and allocation methods applied, specific exemptions, and different compensation methods.
28

Figure 7 / Carbon price and emissions coverage of implemented carbon pricing initiatives
Note: The Australia ERF Safeguard Mechanism, British Columbia GGIRCA and Kazakhstan ETS and Washington CAR are not shown in this graph as price information is not available for those initiatives. The carbon tax rate applied in Mexico, Finland, and Norway varies with the fossil fuel type and use. The graph shows the average carbon tax rate weighted by the amount of emissions covered at the different tax rates in those jurisdictions.
Sweden carbon tax
Switzerland carbon taxLiechtenstein carbon tax
Finland carbon taxFrance carbon tax
Denmark carbon taxBC carbon tax
Alberta SGERUK carbon price floor
Ireland carbon taxSlovenia carbon tax
Korea ETS
Alberta carbon taxQuébec CaT
California CaTNorway carbon tax
Ontario CaTTokyo CaT
Saitama ETSNew Zealand ETS
Iceland carbon taxPortugal carbon tax
Beijing pilot ETSSwitzerland ETS
EU ETSShenzhen pilot ETS
Latvia carbon taxFujian pilot ETS
Colombia carbon taxChile carbon tax
Shanghai pilot ETSRGGI
Japan carbon taxEstonia carbon tax
Mexico carbon taxGuangdong pilot ETS
Hubei pilot ETSTianjin pilot ETS
Chongqing pilot ETSPoland carbon tax
Ukraine carbon tax
Carb
on p
rice
(US$
/tCO
2e)
Emissions covered (MtCO2e)7,0006,5006,0005,5004,5003,5002,5001,500 5,0004,0003,0002,0001,0005000 7,500
80
140
130
120
110
100
90
70
60
50
40
30
20
10
0
Carbon tax ETSCarbon price range needed in 2020 to stay consistent with achieving the temperature goal of the Paris Agreement as identified by the High-Level Commission on Carbon Prices.
292 / Existing and emerging carbon pricing initiatives around the world

25 This report covers developments and trends in the period from January 1, 2016 to September 1, 2017.26 The Pacific Alliance consists of Chile, Colombia, Mexico and Peru.27 For natural gas, the carbon tax only covers natural gas consumption in the petrochemical and refinery sectors. 28 As of September 1, 2017, Manitoba has not signed the Pan-Canadian Framework on Clean Growth and Climate Change, of which the carbon pricing
approach is a central component.
Figure 8 / Carbon price, share of emissions covered and carbon pricing revenues of implemented carbon pricing initiatives
Note: The size of the circles is proportional to the amount of government revenues except for initiatives with government revenues below US$100 million in 2016; the circles of these initiatives have an equal size. For illustrative purposes only, the nominal prices on August 1, 2017 and the coverages in 2017 are shown. The carbon tax rate applied in Mexico, Finland, and Norway varies with the fossil fuel type and use. The graph shows the average carbon tax rate weighted by the amount of emissions covered at the different tax rates in those jurisdictions. The middle point of each circle corresponds to the price and coverage of that initiative.
0% 10% 20% 30% 40% 50% 60% 70% 80% 90% 100%
Share of GHG emissions covered in the jurisdiction
US$ 150/ tCO2e
US$ 125/ tCO2e
US$ 100/ tCO2e
US$ 75/ tCO2e
US$ 50/ tCO2e
US$ 25/ tCO2e
US$ 0/ tCO2e
Poland carbon tax
Switzerland carbon tax
Finland carbon tax
Norway carbon tax
UK carbon price floor
Ukraine carbon tax
France carbon tax
Japan carbon tax
EU ETS
Mexico carbon tax
Denmark carbon tax
Fujian pilot ETS
Alberta SGER
Portugal carbon tax
BC carbon tax
Québec CaT
California CaT
Ireland carbon tax
Liechtenstein carbon tax
Switzerland ETS
RGGI
Estonia carbon tax
Iceland carbon tax
Latvia carbon tax Slovenia
carbon tax
Sweden carbon tax
Guangdong pilot ETS
Carbon price (US$/tCO2e)
30

2.1.2 Recent developments and emerging trends
2016–201725 has witnessed an increasing number of governments using or actively considering carbon pricing as an instrument to drive the transition to a low-carbon economy. In addition, a growing number of companies are pricing GHG emissions to identify climate-related risks and opportunities. This section provides an overview of these recent developments and the main observed trends in carbon pricing.
Carbon pricing continues to spread
Over the past two years, the Americas have been at the forefront of carbon pricing developments, particularly in Canada and the Pacific Alliance countries.26 Notably, six of the eight new carbon pricing initiatives have been implemented in the Americas.
In 2016: − The Greenhouse Gas Industrial Reporting
and Control Act (GGIRCA) in British Columbia, establishing a baseline-and-credit system in addition to the province’s revenue neutral carbon tax. The GGIRCA applies to industrial facilities exceeding a specific GHG emissions limit as set in regulation.
− The Emissions Reduction Fund (ERF) Safeguard Mechanism in Australia, launching a baseline- and-offset system.
− A pilot ETS in Fujian which covers GHG emissions in 2016, in preparation for the introduction of the Chinese national ETS later in 2017.
In 2017: − A carbon tax in Alberta, covering all GHG emissions
from combustion that are not covered by its existing carbon pricing initiative for large emitters.
− A carbon tax in Chile, which applies to CO2 emissions from large emitters from the power and industrial sector.
− An economy-wide carbon tax in Colombia on all liquid and gaseous fossil fuels27 used for combustion.
− An ETS in Ontario, covering GHG emissions from industry, electricity generators and importers, natural gas distributors and fuel suppliers.
− The Clean Air Rule in Washington State, establishing a baseline-and-credit system which initially covers fuel distributors and industrial companies that are not considered to be energy intensive nor trade exposed.
In 2018, a new ETS for power plants is scheduled for implementation in Massachusetts. Power plants in the state will continue to be subject to RGGI, and will have to meet compliance obligations in both systems.
In addition, the Canadian federal government put forward a pan-Canadian approach to carbon pricing in 2016, requiring all provinces and territories to have a carbon pricing initiative in place by 2018 that meets a set of federal criteria. A federal carbon pricing system—currently under development—will apply to provinces and territories that do not meet the federal criteria. Subnational jurisdictions that do not already have existing carbon pricing initiatives have taken steps to implement the pan-Canadian carbon pricing requirement. Nova Scotia announced plans to implement a cap-and-trade system, the Northwest Territories is considering possible approaches for a carbon tax, and Yukon indicated that it intends to apply the federal carbon pricing initiative. Manitoba,28 New Brunswick, Newfoundland and Labrador, Nunavut, and Prince Edward Island are considering different carbon pricing options.
Furthermore, Mexico will start a one-year ETS simulation to create awareness on carbon pricing and prepare for the launch of a pilot ETS in 2018, while Colombia and Chile continue to consider the establishment of an ETS following the introduction of their carbon taxes. These efforts will be supported by moves to intensity monitoring, reporting and
25 This report covers developments and trends in the period from January 1, 2016 to September 1, 2017.26 The Pacific Alliance consists of Chile, Colombia, Mexico and Peru.27 For natural gas, the carbon tax only covers natural gas consumption in the petrochemical and refinery sectors. 28 As of September 1, 2017, Manitoba has not signed the Pan-Canadian Framework on Clean Growth and Climate Change, of which the carbon pricing
approach is a central component.
312 / Existing and emerging carbon pricing initiatives around the world

verification (MRV) of GHG emissions, with a view to identify possible voluntary markets in the Pacific Alliance countries.29 In Asia, China is gearing up for the commencement of its national ETS, which is planned for the end of 2017. In addition, Kazakhstan is intending to relaunch its ETS in 2018, following a two-year suspension. Also, Vietnam announced plans to develop a carbon market by 2018 and Singapore stated that it intends to implement a carbon pricing initiative in 2019.
Despite these positive developments, prospects for climate action and carbon pricing in other jurisdictions have slowed or remain uncertain. The launch of the carbon tax in South Africa has been delayed again; a new start date will be announced by the Minister of Finance. In addition, the United States (US) federal government announced its intention to withdraw from the Paris Agreement and is moving to rescind or review several federal energy- and climate-related policies such as the Clean Power Plan. Nonetheless, 13 states30 and Puerto Rico have indicated that they aim to uphold the US NDC pledge under the Paris Agreement and meet or exceed the Clean Power Plan targets under the US Climate Alliance. This includes Oregon and Virginia, which are working to introduce carbon pricing in their state. These state level efforts are complemented by the Climate Leadership Council—an international policy institute founded by businesses and environmental leaders—advocating for the introduction of a revenue-neutral carbon tax in the US, with all carbon pricing revenues to be returned to the general public.31
Negotiations must advance toward a consensus to enable international carbon pricing to deliver on its potential for cost-effective implementation of the Paris Agreement
Article 6 of the Paris Agreement recognizes that Parties can voluntarily cooperate on the implementation of their NDCs to facilitate higher ambition in mitigation and adaptation actions. Carbon pricing is one possible mechanism for
such international cooperation, enabling parties to achieve lower cost emission reductions. The EU ETS is an example of such cross-border cooperation—established in 2005, it is a regional carbon market that already links 31 countries, with a further link to the Switzerland ETS scheduled. California and Québec also established a cooperative carbon market by linking their ETSs; this market will also grow, with Ontario planning to join in 2018. Modeling32 demonstrates that an international carbon market could deliver a 30 percent reduction in global mitigation costs by 2030 and more than 50 percent reduction by the middle of the century. The potential of carbon pricing to facilitate cost-effective decarbonization is well recognized; 81 Parties that have ratified the Paris Agreement, responsible for 55 percent of the global GHG emissions, have indicated that they are considering the use of carbon pricing as an instrument to reduce GHG emissions. However, there is a need for consensus on the operationalization of cooperative approaches under Article 6.2 and the Article 6.4 mechanism, including the modalities that enable the development of a fully efficient, comprehensive international carbon market. There is substantial pressure to move rapidly toward consensus, given that the Paris Agreement guidelines, including the modalities for operationalizing cooperative approaches to reduce emissions under Article 6, are scheduled to be finalized by December 2018.
Credits from existing international carbon market mechanisms are finding new sources of demand, but the outlook remains uncertain
The overall demand for international credits remains low and future demand is uncertain. Contributing to this uncertainty is the lack of clarity on the relationship between the existing international mechanisms such as the Clean Development Mechanism (CDM), Joint Implementation (JI) and the voluntary market with new approaches and mechanisms under the Paris Agreement. The rules under the Paris Agreement must ensure that the generated mitigation outcomes correspond to
29 Source: Pacific Alliance, DECLARACIÓN DE CALI, June 30, 2017.30 As of September 1, 2017. The 13 states are California, Colorado, Connecticut, Delaware, Hawaii, Massachusetts, Minnesota, New York, Oregon, Rhode
Island, Vermont, Virginia and Washington State.31 Source: Climate Leadership Council, Mission, accessed June 22, 2017, https://www.clcouncil.org/mission/. 32 For further details on the modeling analysis, please refer to World Bank, Ecofys and Vivid Economics, State and Trends of Carbon Pricing 2016, October 2016.
32

mitigation actions to avoid double counting. CORSIA could be a new source of demand for Certified Emission Reductions (CERs) from the CDM as well as voluntary credits—around 2.5 GtCO2e between 2021 and 2035 according to researchers and analysts—but the rules on eligible credits are not yet known. Despite the difficult market conditions for international credits, certain types of credits—particularly CERs—have been able to find buyers, and the breadth of uses of CERs and voluntary credits has been diversifying. For example, due to the limited market liquidity and high price of compliance units in the Korea ETS, CERs generated in the Republic of Korea that meet the eligibility conditions for compliance in the domestic ETS have been in high demand. In other countries, developers of projects that generate CERs are increasingly looking at the voluntary market as a source of demand. The number of CERs used in the voluntary market grew to 4.8 megatons of carbon dioxide equivalent (MtCO2e) in 2016 compared to 0.8 MtCO2e in 2015. Other sources of demand include innovative RBCF programs to purchase CERs generated from certain project types and a new initiative of the International Finance Corporation (IFC) to pay the interest of a green bond with carbon credits. The annual demand from these initiatives is estimated to be under 50 million CERs, which is substantially below the potential issuance of the existing CDM portfolio.
An increasing number of jurisdictions are exploring modalities for cooperation and knowledge sharing on carbon pricing through bilateral and multilateral discussions
Such discussions could lead to further regional carbon pricing convergence, alignment and linking. California, Mexico, Ontario and Québec have signed memorandums of understanding (MOUs) to explore options to cooperate on carbon markets. In addition, dialogues to explore regional carbon pricing have been taking place in the context of the Pacific Alliance with a view to identify possible voluntary
market mechanisms in the region,33 and China, Japan and Korea inaugurated an annual conference to exchange experiences on carbon pricing and explore areas for cooperation.34 Japan also continues to work with other countries to reduce GHG emissions through its Joint Crediting Mechanism (JCM). Furthermore, New Zealand has started discussions on a potential collaboration on carbon markets with China and Korea. Jurisdictions are supported in their discussions to strengthen cooperation on carbon pricing by initiatives including the World Bank’s Networked Carbon Markets initiative, the Carbon Pricing Leadership Coalition, the International Carbon Action Partnership and the Asia Society Policy Institute’s Toward a Northeast Asia Carbon Market initiative.35 The Partnership for Market Readiness, the German Development Cooperation (GIZ) and the Asian Development Bank also provide policymakers and stakeholders with technical support that allows them to make informed decisions on the modalities for cooperation on carbon pricing.
Existing carbon pricing initiatives continue to be reviewed and revised to ramp up their impacts
Several ETSs are undergoing review, leading to the introduction of measures to enhance operational effectiveness. Revisions to the EU ETS are currently being considered for Phase 4 (2021–2030); these include increasing the annual cap reduction rate to 2.2 percent from 2021 onward, further strengthening of the carbon market, and creating low-carbon funding mechanisms such as the multi-billion Euro Innovation Fund. The Fund will extend financial support for the demonstration of innovative technologies, currently only available to the energy sector, to the industry sector in Phase 4. New Zealand is phasing out its measure to allow non-forestry ETS facilities to surrender one allowance for every two tons of CO2e emitted and is proposing amendments to its allowance supply modalities to ensure it is aligned with its NDC target. In the US,
33 The Pacific Alliance consists of Chile, Colombia, Mexico and Peru.34 Source: Tsinghua University, 1st Forum of Carbon Pricing Mechanism in China, Japan and Korea, September 8, 2016, http://mp.weixin.qq.com/s?__
biz=MzIwODU1NDUyNQ==&mid=2247483676&idx=1&sn=32a45adc83f30b8b930ce59709cff062&scene=5&srcid=0908bAGQ19b2bMjArIU8tbRb.35 Source: Asia Society Policy Institute, Toward a Northeast Asia Carbon Market, accessed June 22, 2017, http://asiasociety.org/policy-institute/toward-
northeast-asia-carbon-market.
332 / Existing and emerging carbon pricing initiatives around the world
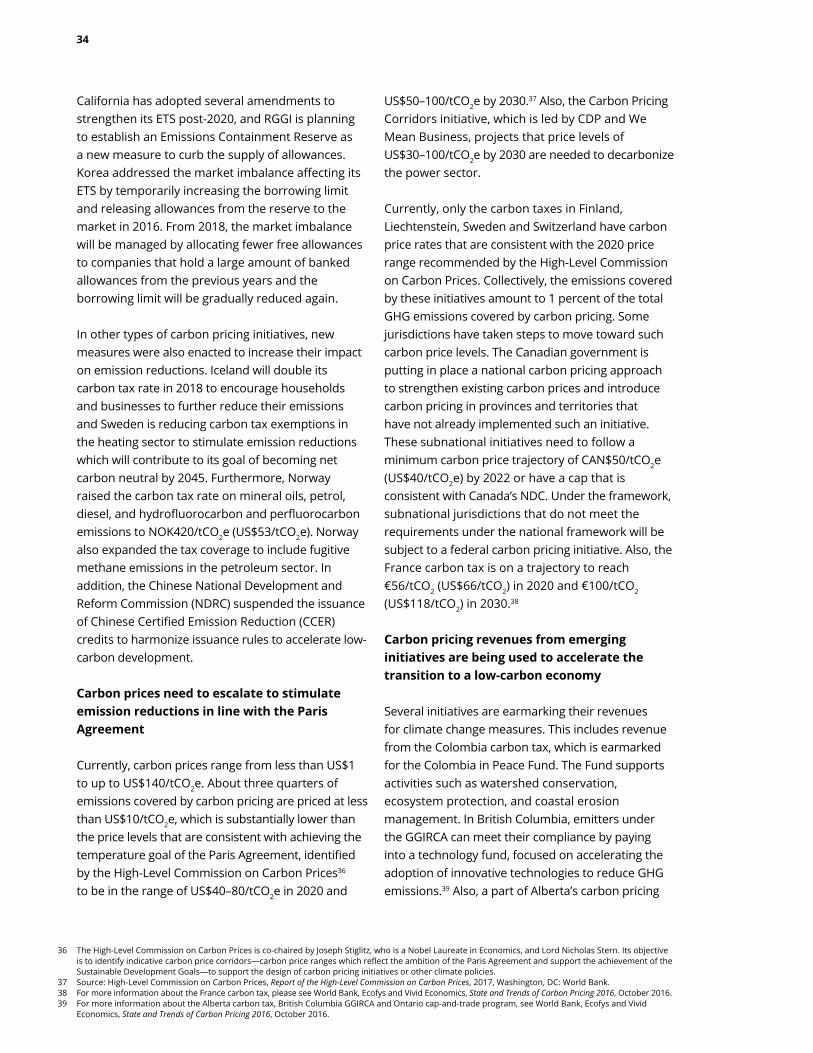
California has adopted several amendments to strengthen its ETS post-2020, and RGGI is planning to establish an Emissions Containment Reserve as a new measure to curb the supply of allowances. Korea addressed the market imbalance affecting its ETS by temporarily increasing the borrowing limit and releasing allowances from the reserve to the market in 2016. From 2018, the market imbalance will be managed by allocating fewer free allowances to companies that hold a large amount of banked allowances from the previous years and the borrowing limit will be gradually reduced again.
In other types of carbon pricing initiatives, new measures were also enacted to increase their impact on emission reductions. Iceland will double its carbon tax rate in 2018 to encourage households and businesses to further reduce their emissions and Sweden is reducing carbon tax exemptions in the heating sector to stimulate emission reductions which will contribute to its goal of becoming net carbon neutral by 2045. Furthermore, Norway raised the carbon tax rate on mineral oils, petrol, diesel, and hydrofluorocarbon and perfluorocarbon emissions to NOK420/tCO2e (US$53/tCO2e). Norway also expanded the tax coverage to include fugitive methane emissions in the petroleum sector. In addition, the Chinese National Development and Reform Commission (NDRC) suspended the issuance of Chinese Certified Emission Reduction (CCER) credits to harmonize issuance rules to accelerate low-carbon development.
Carbon prices need to escalate to stimulate emission reductions in line with the Paris Agreement
Currently, carbon prices range from less than US$1 to up to US$140/tCO2e. About three quarters of emissions covered by carbon pricing are priced at less than US$10/tCO2e, which is substantially lower than the price levels that are consistent with achieving the temperature goal of the Paris Agreement, identified by the High-Level Commission on Carbon Prices36 to be in the range of US$40–80/tCO2e in 2020 and
US$50–100/tCO2e by 2030.37 Also, the Carbon Pricing Corridors initiative, which is led by CDP and We Mean Business, projects that price levels of US$30–100/tCO2e by 2030 are needed to decarbonize the power sector.
Currently, only the carbon taxes in Finland, Liechtenstein, Sweden and Switzerland have carbon price rates that are consistent with the 2020 price range recommended by the High-Level Commission on Carbon Prices. Collectively, the emissions covered by these initiatives amount to 1 percent of the total GHG emissions covered by carbon pricing. Some jurisdictions have taken steps to move toward such carbon price levels. The Canadian government is putting in place a national carbon pricing approach to strengthen existing carbon prices and introduce carbon pricing in provinces and territories that have not already implemented such an initiative. These subnational initiatives need to follow a minimum carbon price trajectory of CAN$50/tCO2e (US$40/tCO2e) by 2022 or have a cap that is consistent with Canada’s NDC. Under the framework, subnational jurisdictions that do not meet the requirements under the national framework will be subject to a federal carbon pricing initiative. Also, the France carbon tax is on a trajectory to reach €56/tCO2 (US$66/tCO2) in 2020 and €100/tCO2 (US$118/tCO2) in 2030.38
Carbon pricing revenues from emerging initiatives are being used to accelerate the transition to a low-carbon economy
Several initiatives are earmarking their revenues for climate change measures. This includes revenue from the Colombia carbon tax, which is earmarked for the Colombia in Peace Fund. The Fund supports activities such as watershed conservation, ecosystem protection, and coastal erosion management. In British Columbia, emitters under the GGIRCA can meet their compliance by paying into a technology fund, focused on accelerating the adoption of innovative technologies to reduce GHG emissions.39 Also, a part of Alberta’s carbon pricing
36 The High-Level Commission on Carbon Prices is co-chaired by Joseph Stiglitz, who is a Nobel Laureate in Economics, and Lord Nicholas Stern. Its objective is to identify indicative carbon price corridors—carbon price ranges which reflect the ambition of the Paris Agreement and support the achievement of the Sustainable Development Goals—to support the design of carbon pricing initiatives or other climate policies.
37 Source: High-Level Commission on Carbon Prices, Report of the High-Level Commission on Carbon Prices, 2017, Washington, DC: World Bank.38 For more information about the France carbon tax, please see World Bank, Ecofys and Vivid Economics, State and Trends of Carbon Pricing 2016, October 2016.39 For more information about the Alberta carbon tax, British Columbia GGIRCA and Ontario cap-and-trade program, see World Bank, Ecofys and Vivid
Economics, State and Trends of Carbon Pricing 2016, October 2016.
34

revenues is being used to finance mitigation activities, and Ontario will invest revenues from allowance auctions in GHG emission reduction programs. The revenue raised from the planned Singapore carbon tax will help fund industrial emission reduction measures.
Figure 8 shows that more than US$100 billion in government revenues per year would be raised if all existing carbon pricing initiatives adopted carbon prices that are in line with the temperature goal of the Paris Agreement.40 This figure could grow further as jurisdictions expand the coverage of their carbon pricing initiatives and new jurisdictions adopt carbon pricing.
Internal carbon pricing is expected to expand, driven by climate-related financial disclosure recommendations
The number of companies using an internal price on carbon has quadrupled since 2014. Furthermore, an additional 782 companies stated that they are planning to implement internal carbon pricing over the course of 2018-2019. There has also been growth in the number of companies indicating that they are using internal carbon pricing as a tool to align their
business with the transition to a low-carbon economy by using it to drive emission reductions, incentivize low-carbon activities and reveal future opportunities. Companies also use internal carbon pricing as a risk management tool. Such companies have stated that mandatory carbon prices need to increase in a predictable policy environment for internal carbon pricing to have a material impact on business decisions. Further adoption of internal carbon pricing is anticipated following the recommendations of the Financial Stability Board’s41 (FSB) Task Force on Climate-related Financial Disclosures (TCFD). These recommendations advise companies and investors to disclose climate-related financial risks and opportunities and report the internal carbon prices used.
Various issues still need to be overcome to expand, deepen and accelerate carbon pricing
Negotiations on the modalities of the Paris Agreement at the international level and consideration of new regional, national and subnational carbon pricing initiatives have renewed the debate on common issues that hold back the implementation speed of carbon pricing, constrain further expansion and limit its impact.
The global scope of the Paris Agreement, which requires both developing and developed countries to reduce GHG emissions, increases the opportunities for international cooperation, but also brings to the fore practical issues on such modalities. The issue of trust between Parties that mitigation outcomes are linked to mitigation actions is one of the key discussion points in the negotiations on the Paris Agreement guidelines, as explained further in Section 2.2. The accounting and verification of these mitigation outcomes under a clear framework that prevents double counting will be important to overcoming this concern. At the national level, rules that foster trust between regulators and emitters are also important.
40 Authors’ estimation based on extrapolation of the 2016 carbon pricing revenues under the carbon prices in 2016 to US$40/tCO2e for implemented initiatives that had prices below this level. For initiatives implemented in 2017, the estimated revenues under carbon prices in 2017 were used for the extrapolation. US$40/tCO2e is the lower range of the carbon prices for 2020 as recommended by the High-Level Commission on Carbon Prices to be consistent with achieving the temperature goals of the Paris Agreement. The estimation assumes that the proportion of free allocation and carbon tax exemptions remain unchanged.
41 The FSB is an international organization composed of senior policy makers from ministries of finance, central banks, and supervisory and regulatory authorities in the G20 and four other key financial centres—Hong Kong, Singapore, Spain and Switzerland. It also includes international financial institutions and standard-setting bodies. The FSB promotes global financial stability by coordinating the development of regulatory, supervisory and other financial sector policies.
» More than US$100 billion in government revenues per year would be raised if all existing carbon pricing initiatives adopted carbon prices that are in line with the temperature goal of the Paris Agreement. «
352 / Existing and emerging carbon pricing initiatives around the world

At the domestic level, a key concern has been the impact of carbon pricing on international competitiveness, particularly in the context of fragmented carbon pricing initiatives around the world, as discussed in the 2015 edition of the State and Trends of Carbon Pricing. This issue has partly contributed to the delay in the development of carbon pricing approaches in some Canadian provinces. In addition, the alignment of carbon pricing with the broader policy context is another challenge faced by policymakers, as examined in the 2016 edition of the State and Trends of Carbon Pricing. For example, one of the main reasons behind Manitoba’s refusal to sign the Pan-Canadian Framework on Clean Growth and Climate Change is its desire to develop a carbon pricing initiative that takes into account its economic circumstances and its high levels of renewable electricity generation; Manitoba states that the national carbon pricing approach does not sufficiently recognize these concerns.42
These issues are compounded by the uncertain standing of climate policies and carbon pricing initiatives in the long term. Due to the lack of clarity on the operating parameters of the EU ETS post-2020, the allowance price was around €5/tCO2e (US$6/tCO2e) for the majority of 2016–2017. Similarly, uncertainties surrounding the operation of the California ETS and RGGI in the post-2020 period contributed to record low allowance prices in both initiatives, and resulted in undersubscribed allowance auctions in California. However, carbon prices in both jurisdictions are now gradually recovering in response to the greater certainty about the future of California’s carbon market—reassurance of which was provided by the extension of the California ETS to 2030—and better clarity on RGGI’s design post-2020.
Finally, as with any policy debate, it is important that the underlying narrative framing the consideration of a carbon pricing initiative accounts for potential costs and gains. Currently, the primary focus of the carbon pricing discourse has been on costs to regulated companies and consumers. Equal consideration of the potential benefits of carbon
pricing, such as the identification of investments that could profit from the low-carbon transition and the number of jobs that could be created, would yield a more balanced debate.
2.2 International carbon pricing initiatives
Toward the implementation of the Paris Agreement
On October 5, 2016, the threshold for entry into force of the Paris Agreement was reached43 and the Agreement entered into force on November 4, 2016.44 As of September 1, 2017, 195 Parties have signed the Agreement and 160—representing 84 percent of global GHG emissions—have deposited their instruments of ratification, as shown in Figure 9.
In the lead up to the 24th Conference of the Parties (COP) to the UNFCCC, which will be held in December 2018, the first set of decisions is being prepared. These decisions will be made by the Conference of the Parties serving as the Meeting of the Parties to the Paris Agreement (CMA) to provide operational guidance to the provisions of the Paris Agreement. Decisions such as the features of NDCs, the transparency framework, and the global stocktake are being considered by the Ad Hoc Working Group on the Paris Agreement.
The Paris Agreement requires all ratifying Parties of the Agreement to communicate an NDC in accordance with guidelines that will be determined by the CMA. These guidelines will provide Parties and other stakeholders with clarity on how the provisions of the Paris Agreement will be operationalized. Decision 1/CP.21 of the Paris Agreement states that the Intended Nationally Determined Contribution (INDC) communicated under the UNFCCC will become the NDC unless
42 Source: Manitoba, Manitoba’s response to the Proposed Federal Benchmark and Backstop for Carbon Pricing, June 29, 2017.43 The Paris Agreement entered into force thirty days after the date on which at least 55 Parties to the UNFCCC accounting in total for at least 55 percent
of the global GHG emissions deposited their instruments of ratification, acceptance, approval or accession.44 Source: UNFCCC, Paris Agreement - Status of Ratification, November 4, 2016, http://unfccc.int/paris_agreement/items/9444.php.
36

45 Sources: UNFCCC, NDC Registry, accessed September 1, 2017; UNFCCC, Personal communication, August 2017.
the Party indicates otherwise when submitting its instrument of ratification. Most Parties’ first NDC are their originally submitted INDC, as shown in Figure 9, with only nine Parties having an NDC which differs from the INDC. While for most cases the modifications were minor, some countries including Morocco and Argentina increased the ambition of their emission reduction pledges. Morocco plans to unconditionally reduce 13 percent of its GHG emissions compared to a business-as-usual (BAU) baseline in 2030, representing an additional four
percent emission reduction compared to its INDC, while Argentina unconditionally pledged to reduce its GHG emissions by 18 percent in 2030 compared to BAU, which is an additional three percent reduction compared to its INDC. Both countries also increased their conditional emission reduction pledges. Furthermore, four Parties that did not submit an INDC under the Convention, submitted an NDC following ratification of the Paris Agreement.45 For a detailed analysis of NDCs please refer to Annex II.
Figure 9 / Status of NDC submissions
Note: Status as of September 1, 2017. 5 Parties which ratified the Paris Agreement indicated that they do not want their INDC to be their NDC, in accordance with Decision 1/CP.21. These Parties are still subject to the requirement of the Agreement under Articles 3 and 4 to communicate an NDC. Revised NDCs from these Parties are expected in the coming months. As the modalities and procedures for the NDC registry are not yet in place, there is currently no basis to enforce a timeline on the submission of NDCs. The EU, a Party to the UNFCCC and included as a separate Party in the tally above, submitted one INDC for all 28 EU Member States. Each Member State is also a Party to the UNFCCC and all Member States have signed the Paris Agreement, which explains how 162 INDC submissions have come from 190 Parties. Out of the EU Member States, only the Czech Republic has not yet ratified the Paris Agreement and is therefore not counted in the 155 Parties that have collectively submitted 128 NDCs.
Parties that signed the Paris Agreement
Parties that submitted an INDC
190which represent 162 submissions
5Parties that did not submit an INDC
Parties that have signed but not ratified the Paris Agreement
35
Parties that have submitted an NDC
155which represent 128 submissions
Parties that have ratified the Paris Agreement
5 Parties that have not submitted an NDC yet
Parties whose NDCs are the same as
their original INDC
142
94
Parties whose NDC differs from their original INDC
Parties who submitted an NDC without prior submission of an INDC
372 / Existing and emerging carbon pricing initiatives around the world
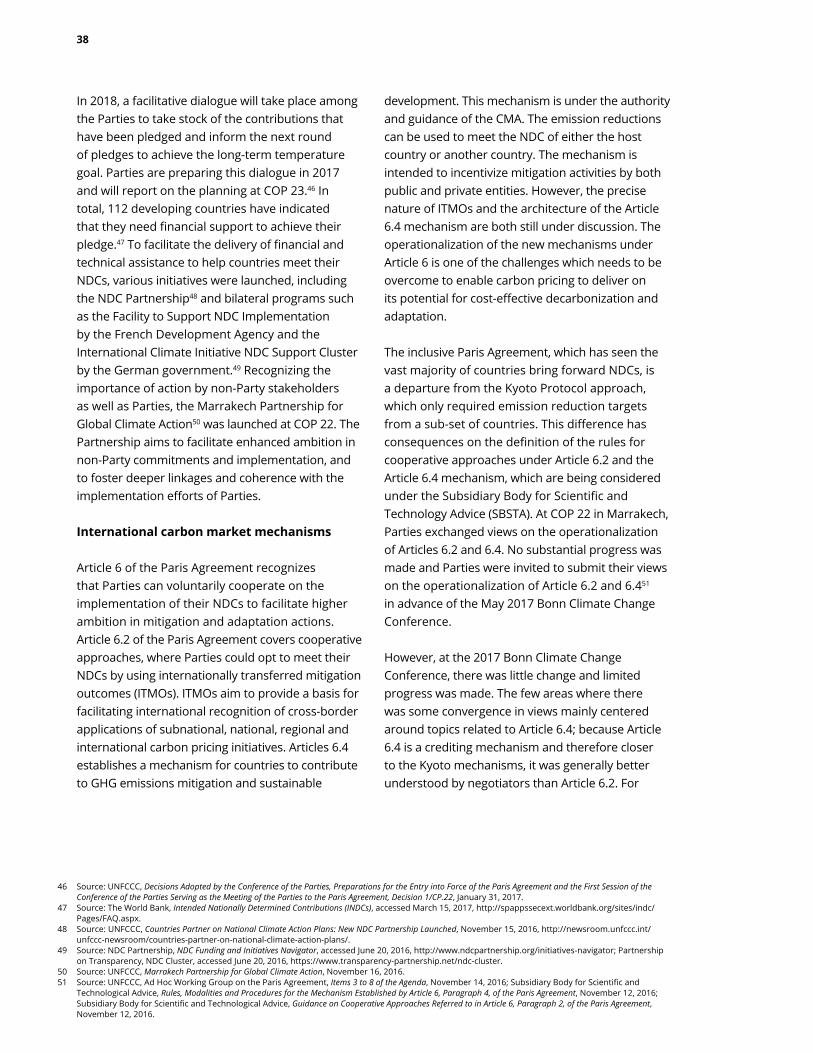
In 2018, a facilitative dialogue will take place among the Parties to take stock of the contributions that have been pledged and inform the next round of pledges to achieve the long-term temperature goal. Parties are preparing this dialogue in 2017 and will report on the planning at COP 23.46 In total, 112 developing countries have indicated that they need financial support to achieve their pledge.47 To facilitate the delivery of financial and technical assistance to help countries meet their NDCs, various initiatives were launched, including the NDC Partnership48 and bilateral programs such as the Facility to Support NDC Implementation by the French Development Agency and the International Climate Initiative NDC Support Cluster by the German government.49 Recognizing the importance of action by non-Party stakeholders as well as Parties, the Marrakech Partnership for Global Climate Action50 was launched at COP 22. The Partnership aims to facilitate enhanced ambition in non-Party commitments and implementation, and to foster deeper linkages and coherence with the implementation efforts of Parties.
International carbon market mechanisms
Article 6 of the Paris Agreement recognizes that Parties can voluntarily cooperate on the implementation of their NDCs to facilitate higher ambition in mitigation and adaptation actions. Article 6.2 of the Paris Agreement covers cooperative approaches, where Parties could opt to meet their NDCs by using internationally transferred mitigation outcomes (ITMOs). ITMOs aim to provide a basis for facilitating international recognition of cross-border applications of subnational, national, regional and international carbon pricing initiatives. Articles 6.4 establishes a mechanism for countries to contribute to GHG emissions mitigation and sustainable
development. This mechanism is under the authority and guidance of the CMA. The emission reductions can be used to meet the NDC of either the host country or another country. The mechanism is intended to incentivize mitigation activities by both public and private entities. However, the precise nature of ITMOs and the architecture of the Article 6.4 mechanism are both still under discussion. The operationalization of the new mechanisms under Article 6 is one of the challenges which needs to be overcome to enable carbon pricing to deliver on its potential for cost-effective decarbonization and adaptation.
The inclusive Paris Agreement, which has seen the vast majority of countries bring forward NDCs, is a departure from the Kyoto Protocol approach, which only required emission reduction targets from a sub-set of countries. This difference has consequences on the definition of the rules for cooperative approaches under Article 6.2 and the Article 6.4 mechanism, which are being considered under the Subsidiary Body for Scientific and Technology Advice (SBSTA). At COP 22 in Marrakech, Parties exchanged views on the operationalization of Articles 6.2 and 6.4. No substantial progress was made and Parties were invited to submit their views on the operationalization of Article 6.2 and 6.451 in advance of the May 2017 Bonn Climate Change Conference.
However, at the 2017 Bonn Climate Change Conference, there was little change and limited progress was made. The few areas where there was some convergence in views mainly centered around topics related to Article 6.4; because Article 6.4 is a crediting mechanism and therefore closer to the Kyoto mechanisms, it was generally better understood by negotiators than Article 6.2. For
46 Source: UNFCCC, Decisions Adopted by the Conference of the Parties, Preparations for the Entry into Force of the Paris Agreement and the First Session of the Conference of the Parties Serving as the Meeting of the Parties to the Paris Agreement, Decision 1/CP.22, January 31, 2017.
47 Source: The World Bank, Intended Nationally Determined Contributions (INDCs), accessed March 15, 2017, http://spappssecext.worldbank.org/sites/indc/Pages/FAQ.aspx.
48 Source: UNFCCC, Countries Partner on National Climate Action Plans: New NDC Partnership Launched, November 15, 2016, http://newsroom.unfccc.int/unfccc-newsroom/countries-partner-on-national-climate-action-plans/.
49 Source: NDC Partnership, NDC Funding and Initiatives Navigator, accessed June 20, 2016, http://www.ndcpartnership.org/initiatives-navigator; Partnership on Transparency, NDC Cluster, accessed June 20, 2016, https://www.transparency-partnership.net/ndc-cluster.
50 Source: UNFCCC, Marrakech Partnership for Global Climate Action, November 16, 2016.51 Source: UNFCCC, Ad Hoc Working Group on the Paris Agreement, Items 3 to 8 of the Agenda, November 14, 2016; Subsidiary Body for Scientific and
Technological Advice, Rules, Modalities and Procedures for the Mechanism Established by Article 6, Paragraph 4, of the Paris Agreement, November 12, 2016; Subsidiary Body for Scientific and Technological Advice, Guidance on Cooperative Approaches Referred to in Article 6, Paragraph 2, of the Paris Agreement, November 12, 2016.
38

example, Parties agreed that Article 6.4 establishes a centralized mechanism. They also agreed that when units under this mechanism are transferred internationally and used against NDCs, the units should be considered as ITMOs and be subject to the guidance of Article 6.2.52
A number of topics pertaining mainly to the scope and governance of Article 6.2 and 6.4 attracted especially strong divergent views from the Parties (see Annex III for a summary of Parties’ views on the operationalization of Articles 6.2 and 6.4 of the Paris Agreement).53 Amongst these were views on the scope of the mitigation activities under Article 6.4, guidance by the UNFCCC on Article 6.2 activities, and the eligibility of Parties to participate in the mechanisms of the two Articles. Specifically:
− Many countries saw the scope of the Article 6.4 mechanism as including not only project-based and programmatic activities, but also sectoral approaches. However, this view was not unanimous with some Parties pushing for a project centric approach very similar to the CDM. Similarly, there were divergent views on if the scope of the mechanism should include Reducing Emissions from Deforestation and Forest Degradation, and sustainable forest management, conservation of forests and enhancement of carbon sinks (REDD+) activities.
− On the topic of the scope of the guidance by the UNFCCC on Article 6.2, some Parties took the view that UNFCCC guidance should be restricted to e.g. the use of ITMOs and avoidance of double counting. Yet many other Parties—including the Small Island Developing States—advocated that all aspects of environmental integrity, transparency, sustainable development and accounting contained in Article 6.2 should be addressed at the level of the UNFCCC.
− Submissions by Parties included many proposals for restrictions on participation in cooperative approaches under Article 6.2 based upon the properties of a Party’s NDC. Proposals for these restrictions vary from the need for quantifying NDCs to the need for the NDCs to be economy-wide. Other Parties strongly opposed placing any type of restrictions to the participation in cooperative approaches and to the use of ITMOs, regardless of the type of NDCs.
The conference concluded with a call for additional views, which will be discussed at a roundtable meeting at the 47th session of SBSTA, to be held in at COP 23 in November 2017. There is substantial pressure to move rapidly toward consensus, given that the Paris Agreement guidelines, including the modalities for operationalizing cooperative approaches to reduce emissions under Article 6, are scheduled to be finalized by December 2018.
The modalities for using existing mechanisms, namely the CDM and JI, to support mitigation have evolved over the past few years. Decreasing demand for CERs has led to the identification of additional sources of demand for CERs and the CDM’s reputation as a robust standard to ensure quality emission reductions has also put the CDM in a good position to be used outside the UNFCCC context. The lower CER prices resulting from the lack of demand have attracted new buyers, such as those in the voluntary market, as described below. CERs are also being used in an increasing number of domestic carbon pricing initiatives such as in Colombia, Korea, Mexico and South Africa. Of the approximately 22 million CERs that have been voluntarily canceled in the CDM registry, as of August 15, 2017, 14 million were CERs originating from Korea, which are likely to be reissued as credits in the Korea ETS.54 The upcoming CORSIA could also represent a significant new source of demand for CERs. In addition, several
52 Source: World Bank, Post-2020 Ci-Dev Portfolio Transition Report, 16 June 2017.53 Source: UNFCCC, Submissions and Statements at SBSTA 46, accessed August 10, 2017, http://www4.unfccc.int/submissions/SitePages/sessions.
aspx?showOnlyCurrentCalls=1&populateData=1&expectedsubmissionfrom=Parties&focalBodies=SBSTA.54 Source: UNFCCC, CDM Registry: CERs Cancelled to Date in the CDM Registry, accessed August 15, 2017, https://cdm.unfccc.int/Registry/vc_attest/index.html.
392 / Existing and emerging carbon pricing initiatives around the world
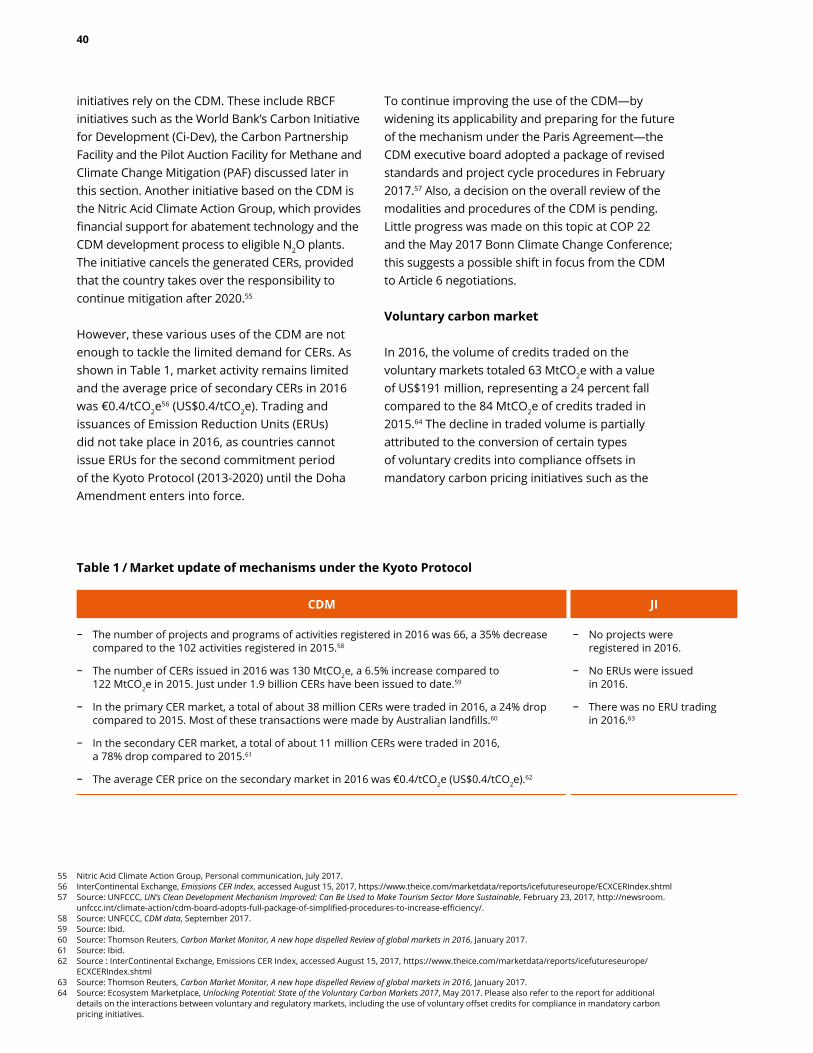
initiatives rely on the CDM. These include RBCF initiatives such as the World Bank’s Carbon Initiative for Development (Ci-Dev), the Carbon Partnership Facility and the Pilot Auction Facility for Methane and Climate Change Mitigation (PAF) discussed later in this section. Another initiative based on the CDM is the Nitric Acid Climate Action Group, which provides financial support for abatement technology and the CDM development process to eligible N2O plants. The initiative cancels the generated CERs, provided that the country takes over the responsibility to continue mitigation after 2020.55
However, these various uses of the CDM are not enough to tackle the limited demand for CERs. As shown in Table 1, market activity remains limited and the average price of secondary CERs in 2016 was €0.4/tCO2e
56 (US$0.4/tCO2e). Trading and issuances of Emission Reduction Units (ERUs) did not take place in 2016, as countries cannot issue ERUs for the second commitment period of the Kyoto Protocol (2013-2020) until the Doha Amendment enters into force.
To continue improving the use of the CDM—by widening its applicability and preparing for the future of the mechanism under the Paris Agreement—the CDM executive board adopted a package of revised standards and project cycle procedures in February 2017.57 Also, a decision on the overall review of the modalities and procedures of the CDM is pending. Little progress was made on this topic at COP 22 and the May 2017 Bonn Climate Change Conference; this suggests a possible shift in focus from the CDM to Article 6 negotiations.
Voluntary carbon market
In 2016, the volume of credits traded on the voluntary markets totaled 63 MtCO2e with a value of US$191 million, representing a 24 percent fall compared to the 84 MtCO2e of credits traded in 2015.64 The decline in traded volume is partially attributed to the conversion of certain types of voluntary credits into compliance offsets in mandatory carbon pricing initiatives such as the
55 Nitric Acid Climate Action Group, Personal communication, July 2017.56 InterContinental Exchange, Emissions CER Index, accessed August 15, 2017, https://www.theice.com/marketdata/reports/icefutureseurope/ECXCERIndex.shtml57 Source: UNFCCC, UN’s Clean Development Mechanism Improved: Can Be Used to Make Tourism Sector More Sustainable, February 23, 2017, http://newsroom.
unfccc.int/climate-action/cdm-board-adopts-full-package-of-simplified-procedures-to-increase-efficiency/.58 Source: UNFCCC, CDM data, September 2017.59 Source: Ibid.60 Source: Thomson Reuters, Carbon Market Monitor, A new hope dispelled Review of global markets in 2016, January 2017.61 Source: Ibid.62 Source : InterContinental Exchange, Emissions CER Index, accessed August 15, 2017, https://www.theice.com/marketdata/reports/icefutureseurope/
ECXCERIndex.shtml63 Source: Thomson Reuters, Carbon Market Monitor, A new hope dispelled Review of global markets in 2016, January 2017.64 Source: Ecosystem Marketplace, Unlocking Potential: State of the Voluntary Carbon Markets 2017, May 2017. Please also refer to the report for additional
details on the interactions between voluntary and regulatory markets, including the use of voluntary offset credits for compliance in mandatory carbon pricing initiatives.
Table 1 / Market update of mechanisms under the Kyoto Protocol
CDM JI
− The number of projects and programs of activities registered in 2016 was 66, a 35% decrease compared to the 102 activities registered in 2015.58
− The number of CERs issued in 2016 was 130 MtCO2e, a 6.5% increase compared to 122 MtCO2e in 2015. Just under 1.9 billion CERs have been issued to date.59
− In the primary CER market, a total of about 38 million CERs were traded in 2016, a 24% drop compared to 2015. Most of these transactions were made by Australian landfills.60
− In the secondary CER market, a total of about 11 million CERs were traded in 2016, a 78% drop compared to 2015.61
− The average CER price on the secondary market in 2016 was €0.4/tCO2e (US$0.4/tCO2e).62
− No projects were registered in 2016.
− No ERUs were issued in 2016.
− There was no ERU trading in 2016.63
40

California Cap-and-Trade program.65 Voluntary credit prices in 2016 were on average US$3/tCO2e. The modest average credit price is linked to the substantial oversupply that persists in the voluntary market. At least 56 MtCO2e of emission reductions remain unsold, consisting of voluntary credits and emission reductions that have been verified but not issued.66 Credits generated under voluntary offset standards are facing increased competition from the growing number of CERs being used for voluntary offsetting purposes, which increased to 4.8 MtCO2e in 2016 compared 0.8 MtCO2e in 2015.67
The role of credits that have historically been generated for voluntary offsetting purposes might shift to compliance under some of the emerging initiatives. Similar to CERs, CORSIA could be a major source of demand for voluntary credits, depending on the eligibility rules for credits being used for compliance.
There is considerable uncertainty on the role of the voluntary market under the Paris Agreement regime. The definition of accounting rules for voluntary credits under the Paris Agreement will likely be complicated by the requirement that all countries undertake mitigation actions, meaning that double counting is a major concern.68 To address this issue, the government of the project host country is expected to play a larger role in shaping the future voluntary market. The voluntary market could exist outside the scope of emissions covered by NDCs, with likely project types for voluntary mitigation actions including land use, forestry, waste management, residential building efficiency and REDD+.69
Reducing Emissions from Deforestation, Forest Degradation, and the role of conservation, sustainable management of forests, and enhancement of forest carbon stocks
Over the past year, efforts to operationalize REDD+ programs for the compliance market have increased. The Green Climate Fund (GCF)—the financing arm of the UNFCCC—convened a workshop in April 2017 to work toward enabling payments for REDD+ results and operationalize the forestry component of the Paris Agreement.70 A key challenge faced during the workshop was the issue of aligning the REDD+ safeguards.71 In October 2016, the GCF Board decided that countries may access funds under the GCF’s Readiness and Preparatory Support Program to assist the implementation of national REDD+ strategies or action plans. More recently in July 2017, the GCF secretariat was also tasked with the finalization of a draft request for proposals for the pilot program for REDD+ results-based payments.72
In the voluntary market, REDD+ was the most transacted project type in 2016, with 9.7 MtCO2e traded or 15 percent of the total traded volume.73 To support demand for such credits, the IFC issued an innovative bond in 2016 that gives investors the option of receiving interest in cash or in the form of carbon credits. The IFC will purchase 2.3 MtCO2e of REDD+ credits from a project in Kenya to pay investors.74 IFC partnered with the mining company BHP, which will offtake any carbon credits that remain.
65 Source: Ibid.66 Source: Ibid.67 Source: Ecosystem Marketplace, Raising Ambition: State of the Voluntary Carbon Markets 2016, May 2016.68 Source: ICROA, Workshop report: Scaling Voluntary Action Within the Framework of the Paris Agreement, June 2017.69 Source: Ibid.70 Source: Green Climate Fund, GCF scopes forest funding path after workshop, accessed June 8, 2017, http://www.greenclimate.fund/-/gcf-scopes-forest-
funding-path-after-workshop?inheritRedirect=true&redirect=%2Fnewsroom%2Fnews. 71 Source: Swan, S. and Walcott, J., ‘Everything should be made as simple as possible, but not simpler’ - safeguards for results-based payments, May 23 2017,
http://www.un-redd.org/single-post/2017/05/29/%E2%80%98Everything-should-be-made-as-simple-as-possible-but-not-simpler%E2%80%A6%E2%80%99-Albert-Einstein%E2%80%A6and-safeguards-for-REDD-results-based-payments-are-no-exception%E2%80%A6.
72 Source: Green Climate Fund, Decisions of the Board –seventeenth meeting of the Board, July 2017.73 Source: Ecosystem Marketplace, Raising Ambition: State of the Voluntary Carbon Markets 2016, June 9, 2016.74 Source: IFC, IFC Issues Innovative $152 Million Bond to Protect Forests and Deepen Carbon-Credit Markets, October 2016, https://ifcextapps.ifc.org/ifcext/
pressroom/ifcpressroom.nsf/0/594A016A78A7B14E8525805D00461397.
412 / Existing and emerging carbon pricing initiatives around the world

Results-based climate finance
RBCF is a form of climate finance where funds are disbursed by the provider of climate finance to the recipient upon achievement of a pre-agreed set of climate-related results. These results are typically defined at the output or outcome level, which means that RBCF can support the development of specific low-emission technologies or the underlying climate outcomes, such as emission reductions.75
Various RBCF initiatives build on existing carbon market mechanisms and prepare for new instruments. On January 10, 2017, the PAF held its third auction, targeting nitrous oxide abatement projects at nitric acid facilities (excluding adipic acid production). This auction marked the close of the first phase of the PAF.76 Options to replicate and scale-up climate auctions beyond the PAF’s pilot phase by targeting other sectors, such as green buildings, are being explored.77
Announced at COP 21, the Transformative Carbon Asset Facility (TCAF) became operational in March 2017, with an initial capitalization of US$210 million and a target capitalization of US$500 million. TCAF will use RBCF to pilot programs that will assist countries in the implementation of market-based carbon pricing initiatives and sectoral mitigation measures. It will work within the frameworks of countries’ NDCs with the intention of helping them increase their ambition. TCAF will also include innovative programs that support countries in implementing policies where GHG emission reductions are achieved as a result of changes in investment and consumption choices due to policy interventions. TCAF’s efforts are intended to inform the international process established by the Paris Agreement to develop standards and agreements for future carbon crediting instruments and the transfer of mitigation assets.
Ci-Dev supports low-carbon investments in least developed countries through purchases of CERs from projects that improve and increase access to clean energy. Since signing its first emissions reduction purchase agreement (ERPA) on January 29, 2016, nine ERPAs have been signed for a total firm commitment of over 7 MtCO2e in eight different African countries and covering six different technology sectors.78 These projects are expected to deliver strong development benefits at scale by providing new or improved energy connections to 19.2 million people in 3.1 million households by the end of 2025. Ci-Dev portfolio will provide continuity beyond 2020 and valuable lessons to the international community for the Kyoto/Paris transition.
The role of RBCF in building domestic carbon markets and an international carbon market is discussed in Section 3.
Joint Crediting Mechanism
As of August 1, 2017, 19 JCM projects have been registered, and 10 projects are requesting registration.79 Since the first issuance of credits took place in May 2016, five projects have collectively issued a total of 493 tCO2e credits. The number of partner countries in the JCM stands at 17. Japan intends to utilize Article 6 of the Paris Agreement to count the credits acquired under the JCM toward the achievement of its NDC.80
International aviation
At the 39th Assembly of ICAO which concluded on October 7, 2016, Member States adopted CORSIA. CORSIA is a global carbon offsetting initiative that aims to stabilize net emissions from international aviation at 2020 levels; any additional emissions above 2020 levels must be offset.81, 82 CORSIA will
75 Source: World Bank Group, Results-Based Climate Finance in Practice : Delivering Climate Finance for Low-Carbon Development, May 2017.76 This phase allocated a total of US$54 million through the auction of put option contracts, which provide a price guarantee for future emission reductions.
On November 30, 2016, five investors chose to exercise their rights to redeem their put options, which were issued after the first auction, receiving a total payment of US$3.1 million in exchange for the equivalent of 1.3 MtCO2e of emission reductions. The emission reductions came from four projects: the Jeram landfill gas recovery project in Malaysia, the Kamphaeng Saen West and East: landfill gas to electricity projects in Thailand, and the Central de Resíduos do Recreio landfill gas project in Brazil; Source: The World Bank, 13 Private Companies Compete in $13 Million World Bank Climate Auction, January 11, 2017, http://www.worldbank.org/en/news/feature/2017/01/11/13-private-companies-compete-in-13-million-world-bank-climate-auction.
77 Source: Climate Focus and Ecofys, Pilot Auction Facility: Opportunities Beyond the Piloting Phase, November 2016.78 Source: Ci-Dev, Projects, accessed June 20, 2017, https://www.ci-dev.org/Projects.79 Source: Joint Credit Mechanism, Project Database, accessed June 20, 2017, https://www.jcm.go.jp/projects/all.80 Source: Government of Japan, Recent Development of The Joint Crediting Mechanism (JCM), May 2017.81 Source: International Civil Aviation Organization, Carbon Offsetting and Reduction Scheme for International Aviation (CORSIA), accessed March 14, 2017,
http://www.icao.int/environmental-protection/Pages/market-based-measures.aspx.82 Taking into account special circumstances and respective capabilities of Member States.
42
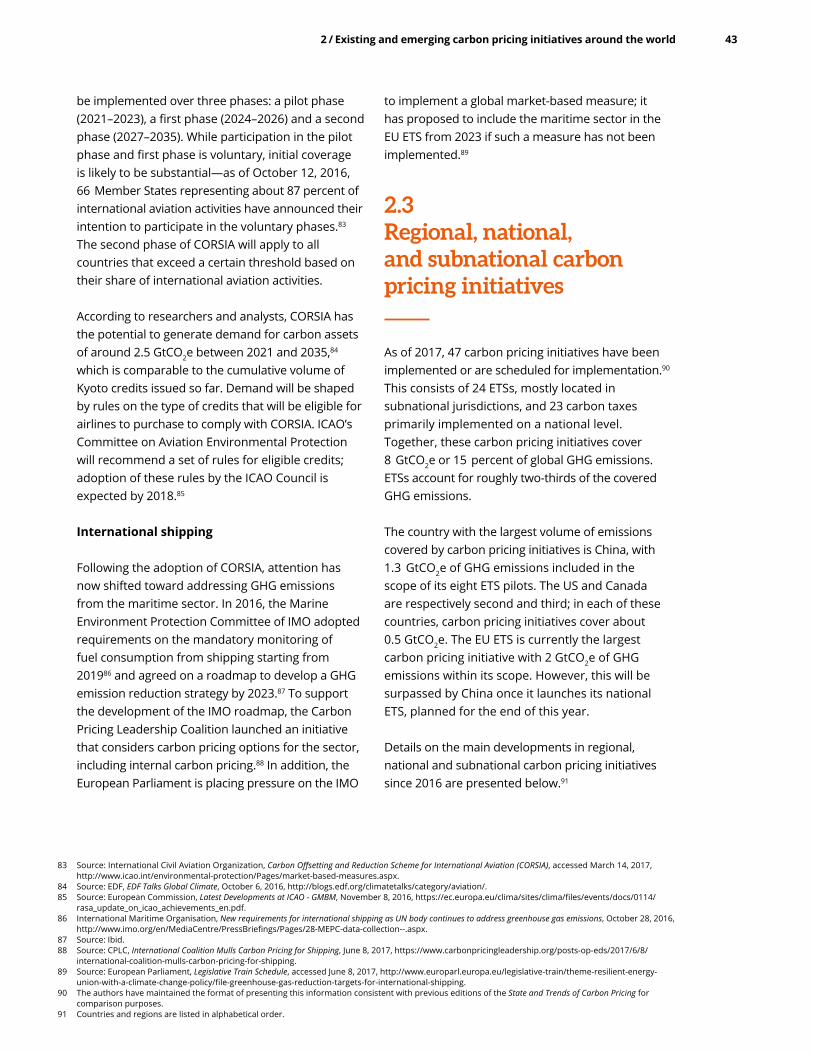
be implemented over three phases: a pilot phase (2021–2023), a first phase (2024–2026) and a second phase (2027–2035). While participation in the pilot phase and first phase is voluntary, initial coverage is likely to be substantial—as of October 12, 2016, 66 Member States representing about 87 percent of international aviation activities have announced their intention to participate in the voluntary phases.83 The second phase of CORSIA will apply to all countries that exceed a certain threshold based on their share of international aviation activities.
According to researchers and analysts, CORSIA has the potential to generate demand for carbon assets of around 2.5 GtCO2e between 2021 and 2035,84 which is comparable to the cumulative volume of Kyoto credits issued so far. Demand will be shaped by rules on the type of credits that will be eligible for airlines to purchase to comply with CORSIA. ICAO’s Committee on Aviation Environmental Protection will recommend a set of rules for eligible credits; adoption of these rules by the ICAO Council is expected by 2018.85
International shipping
Following the adoption of CORSIA, attention has now shifted toward addressing GHG emissions from the maritime sector. In 2016, the Marine Environment Protection Committee of IMO adopted requirements on the mandatory monitoring of fuel consumption from shipping starting from 201986 and agreed on a roadmap to develop a GHG emission reduction strategy by 2023.87 To support the development of the IMO roadmap, the Carbon Pricing Leadership Coalition launched an initiative that considers carbon pricing options for the sector, including internal carbon pricing.88 In addition, the European Parliament is placing pressure on the IMO
to implement a global market-based measure; it has proposed to include the maritime sector in the EU ETS from 2023 if such a measure has not been implemented.89
2.3 Regional, national, and subnational carbon pricing initiatives
As of 2017, 47 carbon pricing initiatives have been implemented or are scheduled for implementation.90 This consists of 24 ETSs, mostly located in subnational jurisdictions, and 23 carbon taxes primarily implemented on a national level. Together, these carbon pricing initiatives cover 8 GtCO2e or 15 percent of global GHG emissions. ETSs account for roughly two-thirds of the covered GHG emissions.
The country with the largest volume of emissions covered by carbon pricing initiatives is China, with 1.3 GtCO2e of GHG emissions included in the scope of its eight ETS pilots. The US and Canada are respectively second and third; in each of these countries, carbon pricing initiatives cover about 0.5 GtCO2e. The EU ETS is currently the largest carbon pricing initiative with 2 GtCO2e of GHG emissions within its scope. However, this will be surpassed by China once it launches its national ETS, planned for the end of this year.
Details on the main developments in regional, national and subnational carbon pricing initiatives since 2016 are presented below.91
83 Source: International Civil Aviation Organization, Carbon Offsetting and Reduction Scheme for International Aviation (CORSIA), accessed March 14, 2017, http://www.icao.int/environmental-protection/Pages/market-based-measures.aspx.
84 Source: EDF, EDF Talks Global Climate, October 6, 2016, http://blogs.edf.org/climatetalks/category/aviation/.85 Source: European Commission, Latest Developments at ICAO - GMBM, November 8, 2016, https://ec.europa.eu/clima/sites/clima/files/events/docs/0114/
rasa_update_on_icao_achievements_en.pdf.86 International Maritime Organisation, New requirements for international shipping as UN body continues to address greenhouse gas emissions, October 28, 2016,
http://www.imo.org/en/MediaCentre/PressBriefings/Pages/28-MEPC-data-collection--.aspx. 87 Source: Ibid.88 Source: CPLC, International Coalition Mulls Carbon Pricing for Shipping, June 8, 2017, https://www.carbonpricingleadership.org/posts-op-eds/2017/6/8/
international-coalition-mulls-carbon-pricing-for-shipping.89 Source: European Parliament, Legislative Train Schedule, accessed June 8, 2017, http://www.europarl.europa.eu/legislative-train/theme-resilient-energy-
union-with-a-climate-change-policy/file-greenhouse-gas-reduction-targets-for-international-shipping.90 The authors have maintained the format of presenting this information consistent with previous editions of the State and Trends of Carbon Pricing for
comparison purposes.91 Countries and regions are listed in alphabetical order.
432 / Existing and emerging carbon pricing initiatives around the world
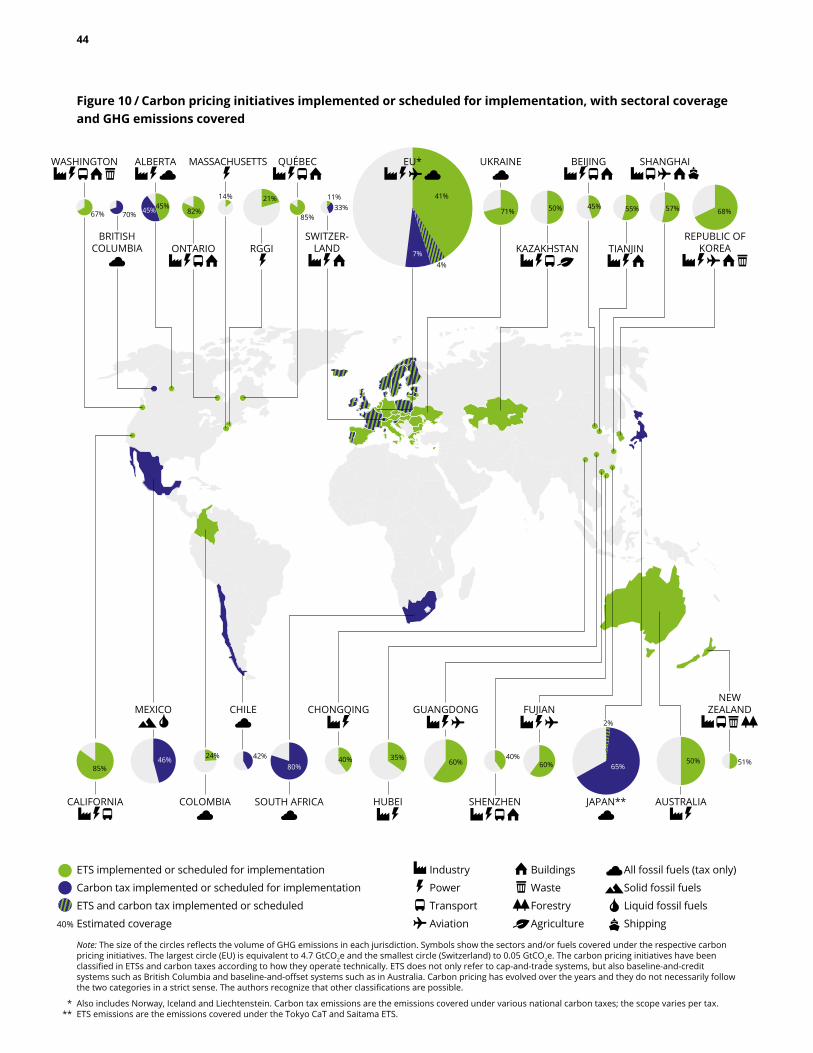
Figure 10 / Carbon pricing initiatives implemented or scheduled for implementation, with sectoral coverage and GHG emissions covered
ETS implemented or scheduled for implementation
Carbon tax implemented or scheduled for implementation
ETS and carbon tax implemented or scheduled
Estimated coverage40%
Industry
Power
Transport
Aviation
Buildings
Waste
Forestry
Agriculture
All fossil fuels (tax only)
Solid fossil fuels
Liquid fossil fuels
Shipping
***
Note: The size of the circles reflects the volume of GHG emissions in each jurisdiction. Symbols show the sectors and/or fuels covered under the respective carbon pricing initiatives. The largest circle (EU) is equivalent to 4.7 GtCO2e and the smallest circle (Switzerland) to 0.05 GtCO2e. The carbon pricing initiatives have been classified in ETSs and carbon taxes according to how they operate technically. ETS does not only refer to cap-and-trade systems, but also baseline-and-credit systems such as British Columbia and baseline-and-offset systems such as in Australia. Carbon pricing has evolved over the years and they do not necessarily follow the two categories in a strict sense. The authors recognize that other classifications are possible.
Also includes Norway, Iceland and Liechtenstein. Carbon tax emissions are the emissions covered under various national carbon taxes; the scope varies per tax.ETS emissions are the emissions covered under the Tokyo CaT and Saitama ETS.
35%
HUBEI
GUANGDONG
60%
CHONGQING
40%
CALIFORNIA
85%46%
MEXICO
JAPAN**
65%
2%
40%
SHENZHEN
AUSTRALIA
50% 51%
NEW ZEALAND
CHILE
42%
COLOMBIA
24%80%
SOUTH AFRICA
FUJIAN
60%
57%
SHANGHAI
82%
ONTARIO
85%
QUéBEC
50%
KAZAKHSTAN
68%
REPUBLIC OF KOREA
55%
TIANJIN 4%
41%
7%
EU*
70%
BRITISH COLUMBIA
45%
ALBERTA
45% 33%11%
SWITZER- LAND
BEIJING
45%
UKRAINE
71%
WASHINGTON
67%
MASSACHUSETTS
14%
RGGI
21%
44

Australia
The ERF Safeguard Mechanism came into effect on July 1, 2016, establishing a baseline-and-offset initiative covering around half of Australia’s GHG emissions.92 The Safeguard Mechanism is intended to ensure that the emission reductions purchased through the ERF are not offset elsewhere in the economy.93 The development of further carbon pricing initiatives has been debated in Australia. In its review of Australia’s climate goals and policies, the Australian Climate Change Authority, an independent body established to provide expert advice to the government, recommended the introduction of an emission intensity based carbon pricing initiative in the electricity sector in 2018 and the enhancement of the Safeguard Mechanism in other sectors in the near term.94 However, an emission intensity scheme for the electricity sector was ruled out by the Australian government.95
The Australian government is currently reviewing its climate change policies to ensure that they can achieve its NDC under the Paris Agreement. This includes investigating the potential role of international credits.96 The review will conclude by the end of 2017.
Canada
On October 3, 2016, the Canadian government announced the pan-Canadian approach to carbon pricing, which is a central component of the Pan-Canadian Framework on Clean Growth and Climate Change. The approach aims to ensure that carbon pricing will apply to a broad set of emission sources throughout Canada in 2018, with increasing stringency over time. Jurisdictions can implement their own carbon pricing initiative—either a fixed price or cap-and-trade system. For jurisdictions electing to adopt a carbon pricing initiative with a fixed price such as a carbon tax, the carbon price
needs to start at a minimum of CAN$10/tCO2e (US$8/tCO2e) in 2018 and increase annually by CAN$10/tCO2e (US$8/tCO2e) to reach CAN$50/tCO2e (US$40/tCO2e) in 2022. Provinces and territories that choose to implement a cap-and-trade system need to have a reduction target equal to or greater than Canada’s NDC target to reduce GHG emissions by 30 percent below 2005 levels by 2030. The cap should decline annually until at least 2022 at a rate that is equivalent to the projected emission reductions that would have occurred under the minimum carbon prices trajectory for fixed price initiatives described above. Under the pan-Canadian approach, jurisdictions are required to provide regular, transparent and verifiable reports on the impacts of the implemented carbon pricing initiative. The Canadian government is also developing a federal carbon pricing “backstop” system that will apply in any province or territory that does not have a carbon pricing system in place in 2018 that aligns with the federal criteria.97 The proposed backstop would see a carbon tax coming into effect in 2018, applying the minimum federal carbon price, as noted above, to emitters in these jurisdictions. Industrial facilities emitting over 50 ktCO2e per year would switch to the ETS component of the backstop—a federal baseline-and-credit system—when this comes into effect instead of paying the carbon tax. This is not expected before January 1, 2019. Under the ETS, facilities that have an emission intensity exceeding their limit would be required to surrender compliance credits, which include credits from other facilities, offsets, or make payments at the minimum federal carbon price; facilities with an emission intensity lower than their benchmark level would receive credits. The proposal allows smaller industrial emitters to opt to participate in this ETS component instead of facing the carbon tax. Revenues raised remain in the jurisdiction of origin. The proposed federal backstop system is expected to ready for implementation in 2018.98
92 Source: Australian Government, The Safeguard Mechanism - Overview, 2016, http://www.environment.gov.au/climate-change/emissions-reduction-fund/publications/factsheet-erf-safeguard-mechanism.
93 Each facility covered under the Safeguard Mechanism needs to surrender one offset unit for every ton of CO2 emitted above their baseline as part of their annual compliance. Facilities do not receive credits for emission reductions below their baseline. For further details on the ERF Safeguard Mechanism, please refer to World Bank, Ecofys and Vivid Economics, State and Trends of Carbon Pricing 2016, October 2016.
94 Source: Australian Climate Change Authority, Towards a Climate Policy Toolkit: Special Review on Australia’s Climate Goals and Policies, August 2016.95 Source: Josh Frydenberg, Questions Without Notice (16 February 2017), February 16, 2017, http://www.joshfrydenberg.com.au/guest/SpeechesDetails.
aspx?id=409.96 Source: Australian Government, Review of Climate Change Policies, March 2017.97 Source: Government of Canada, Technical Paper: Federal Carbon Pricing Backstop, accessed June 18, 2017, https://www.canada.ca/en/services/environment/
weather/climatechange/technical-paper-federal-carbon-pricing-backstop.html.98 Source: Government of Canada, Forward Regulatory Plan 2017 to 2019 – Air Emissions and Greenhouse Gases, accessed August 17, 2017,
https://www.ec.gc.ca/default.asp?lang=En&n=DF9C1A4C-1&offset=1&toc=show#X-2017022815060985.
452 / Existing and emerging carbon pricing initiatives around the world

To inform future policy design, a review of the pan-Canadian carbon pricing approach will be completed by early 2022, with an interim report scheduled to be completed in 2020. The review will include an assessment of the stringency of the approach and the effectiveness of carbon pricing initiatives across Canada.99
On the subnational level, Alberta, British Columbia, Ontario and Québec collectively have six carbon pricing initiatives in place—four ETSs and two carbon taxes. Signatories of the framework100 that have not yet implemented a carbon pricing initiative are taking steps to meet the requirements of the framework. The key developments in Canadian provinces and territories are listed in Table 2.
99 Source: Government of Canada, Annex II: Provincial and Territorial Key Actions and Collaboration Opportunities with the Government of Canada, accessed March 16, 2017, https://www.canada.ca/en/services/environment/weather/climatechange/pan-canadian-framework/annex-key-actions-collaboration.html.
100 All jurisdictions except Manitoba and Saskatchewan have signed the framework.101 For further details on the British Columbia GGIRCA, the Alberta carbon tax and the Ontario cap-and-trade program, please refer to World Bank, Ecofys and
Vivid Economics, State and Trends of Carbon Pricing 2016, October 2016.102 Alberta, Output-based Allocation System Engagement, accessed June 18, 2017, https://www.alberta.ca/output-based-allocation-engagement.aspx.
Table 2 / Key carbon pricing developments in the Canadian provinces and territories101
Jurisdiction Type and status Key developments
Alberta ETS and carbon tax implemented
− Launched a carbon tax in 2017. − Facilities regulated under the existing Specified Gas Emitters Regulation will
transition to a new regulatory system in January 2018 that sets sector-specific performance benchmarks.102
British Columbia ETS and carbon tax implemented
− Implemented the GGIRCA in 2016 for regulated industrial facilities or sectors exceeding a GHG emission limit. Facilities and sectors included in the GGIRCA also participate in the province’s revenue neutral carbon tax.
− Planning to increase the rate of its carbon tax—which currently stands at CAN$30/tCO2e (US$24/tCO2e)—by CAN$5/tCO2e (US$4/tCO2e) per year from April 1, 2018.103
− Planning to expand coverage to include fugitive emissions and emissions from the burning of certain forestry residues is also planned.104
Manitoba Undecided initiative under consideration
− Planning to introduce a carbon price in 2018 despite not being a signatory to the national framework.105 The carbon price will take into account the renewable electricity that Manitoba already produces and local economic circumstances.
New Brunswick Undecided initiative under consideration
− Evaluating different forms of carbon pricing. The government has indicated that revenues raised will be earmarked for a dedicated climate change fund.106
Newfoundland and Labrador
Undecided initiative under consideration
− Introduced a bill in June 2016 that would launch a carbon pricing initiative covering industry after a GHG emissions monitoring period of at least two years.107
Northwest Territories
Carbon tax under consideration
− Considering possible approaches for a carbon tax to reduce carbon-based fuel use while also minimizing the impact on cost of living and economic development.108
− Evaluating carbon pricing initiatives in conjunction with the federal government.109
Nova Scotia ETS under consideration
− Announced in November 2016 that it intends to implement a cap-and-trade system.110 Following this announcement, it has proposed design options for its initiative and is consulting stakeholders.111
Nunavut Undecided initiative under consideration − Evaluating carbon pricing initiatives in conjunction with the federal government.112
Ontario ETS implemented − Launched a cap-and-trade system in 2017, covering GHG emissions from industry, electricity generators and importers, natural gas distributors and fuel suppliers.
Prince Edward Island
Undecided initiative under consideration − Considering a fiscally neutral carbon pricing initiative.113
Québec ETS implemented − Starting its third compliance period, which will cover 2018-2020.
Yukon Undecided initiative under consideration
− Intending to apply the federal backstop system.114 − Evaluating carbon pricing initiatives in conjunction with the federal government.115
46

Chile
The Chile carbon tax came into effect on January 1, 2017.116 The tax applies to all stationary sources with a thermal capacity greater than 50 megawatts.117 The level of this tax is the local currency equivalent of US$5/tCO2e, which means that tax liabilities in the local currency will depend on the prevailing exchange rate on the day of payment.118
China
China is preparing for the launch of its national ETS, which is likely to be by the end of 2017.119 The NDRC has submitted a draft ETS regulation to the State Council and Legislative Affairs Office. It is anticipated that the regulation will be approved in the course of 2017, subject to official confirmation on dates and scope. In addition, the NDRC is developing several technical rules on issues including GHG emission reporting and verification, accreditation of third party verifiers, trading rules, and rules for offsetting. The NDRC is also working on draft allocation plans for the sectors that will be covered under the national ETS, following completion of data collection of historical GHG emissions from the sectors. Benchmarking will be the main approach. It is anticipated that the coverage of GHG emissions and sectors included from the start of the national ETS will be clarified once the draft allocation plans have been finalized. To prepare for the national ETS, the administrators of the pilot ETSs have established capacity building centers to promote knowledge sharing and peer-
to-peer learning with stakeholders in jurisdictions without a pilot ETS. In addition to the pilot ETS jurisdictions, a capacity building center was also established in Chengdu.120
China is also looking for opportunities to cooperate with other countries on carbon pricing. In September 2016, government officials from China, Japan and the Republic of Korea held the first annual conference on the exchange of carbon pricing experiences.121 The conference aims to enable sharing of technical expertise and exploring opportunities for further cooperation and potential linking between the ETSs in these countries.
Since the end of 2016, the NDRC has slowed down the issuance of CCER credits and on March 14, 2017, it announced the temporary suspension of the approval of CCER projects and issuance of CCERs.122 This will allow the NDRC to improve and harmonize rules on the issuance of CCERs to accelerate low-carbon development.
In parallel to the development of the national ETS, the pilot ETSs in Beijing, Chongqing, Guangdong, Hubei, Shanghai, Shenzhen and Tianjin have continued to evolve and some have expanded over the past year. Also, the rules for credit usage for compliance in pilot ETSs became more stringent in the past year. Furthermore, Fujian launched China’s eighth regional ETS in preparation for the introduction of the Chinese national ETS later in 2017. Key developments in the pilot ETSs are listed in Table 3.
103 Source: Premier of British Columbia, Minister of Environment and Climate Change Strategy’s Mandate Letter, July 18, 2017.104 Source: Ibid.105 Source: Manitoba, Manitoba’s response to the Proposed Federal Benchmark and Backstop for Carbon Pricing, June 29, 2017. 106 Source: New Brunswick, Transitioning to a Low-Carbon Economy, n.d.107 Source: Newfoundland and Labrador, Management of Greenhouse Gas Act, accessed August 7, 2016, http://www.assembly.nl.ca/legislation/sr/statutes/m01-001.htm. 108 Source: Northwest Territories, Implementing Pan-Canadian Carbon Pricing in the Northwest Territories, July 2017. 109 Source: Government of Canada, Annex II: Provincial and Territorial Key Actions and Collaboration Opportunities with the Government of Canada, accessed
March 16, 2017, https://www.canada.ca/en/services/environment/weather/climatechange/pan-canadian-framework/annex-key-actions-collaboration.html.110 Source: Government of Canada, The Government of Canada Announces Plan with Nova Scotia to Price Carbon Pollution and Negotiate Coal Phase-out Agreement,
November 21, 2016, http://news.gc.ca/web/article-en.do?nid=1158199.111 Source: Ibid.112 Source: Government of Canada, Annex II: Provincial and Territorial Key Actions and Collaboration Opportunities with the Government of Canada, accessed
March 16, 2017, https://www.canada.ca/en/services/environment/weather/climatechange/pan-canadian-framework/annex-key-actions-collaboration.html.113 Source: Prince Edward Island, Pre-Budget Consultations, accessed March 10, 2017, https://www.princeedwardisland.ca/en/service/pre-budget-consultations.114 Source: Government of Yukon, Government of Yukon wants your input on carbon price rebate, August 16, 2017, http://www.gov.yk.ca/news/17-166.html. 115 Source: Government of Canada, Annex II: Provincial and Territorial Key Actions and Collaboration Opportunities with the Government of Canada, accessed
March 16, 2017, https://www.canada.ca/en/services/environment/weather/climatechange/pan-canadian-framework/annex-key-actions-collaboration.html.116 Tax payments for the 2017 calendar year will be due in April 2018. 117 Ministry of Finance, Chile, Ley Nº 20780, accessed August 7, 2017, http://www.leychile.cl/Navegar?idNorma=1067194. 118 Ministry of Finance, Chile, 2014, Tax reform to amend the system of income taxation and introduce various adjustments in the tax system, http://www.leychile.cl/
Navegar?idNorma=1067194.119 Source: NDRC, 13th five year control of GHG emissions program division, June 21, 2017, http://www.ndrc.gov.cn/gzdt/201706/t20170621_851905.html.120 Source: Sichuan News Network (Chengdu), Carbon Market Gong Open City of Sichuan Officially Entered the Ranks of the National Carbon Emissions Trading,
December 16, 2016, http://news.163.com/16/1216/11/C8DEOFUB000187VE.html.121 Source: Tsinghua University, 1st Forum of Carbon Pricing Mechanism in China, Japan and Korea, August 9, 2016, http://mp.weixin.qq.com/s?__
biz=MzIwODU1NDUyNQ==&mid=2247483676&idx=1&sn=32a45adc83f30b8b930ce59709cff062&scene=5&srcid=0908bAGQ19b2bMjArIU8tbRb.122 Source: National Development and Reform Commission, Announcement of the National Development and Reform Commission of the People ’S Republic of China,
2017, http://www.ndrc.gov.cn/zcfb/zcfbgg/201703/t20170317_841211.html.
472 / Existing and emerging carbon pricing initiatives around the world

123 Source: Beijing Municipal Commission of Development and Reform, Beijing, Inner Mongolia, Hohhot and Ordos Conduct Inter-Regional Cooperation in the Trade of Carbon Emissions, March 24, 2016, http://www.bjpc.gov.cn/zwxx/tztg/201603/t10058058.htm.
124 Source: Municipality of Chongqing, Chongqing Municipal Development and Reform Commission on the Issuance of Chongqing City 2016 Carbon Emissions Quota Notice, January 18, 2017, http://www.cqdpc.gov.cn/article-1-23797.aspx.
125 Source: Fujian Development and Reform Commission, Notice on Printing and Distributing the Measures for the Administration of Carbon Emission from Fujian Province (Trial Implementation), December 5, 2016, http://www.fjdpc.gov.cn/show.aspx?ctlgid=738877&id=112809.
126 Source: Fujian Development and Reform Commission, Fujian Provincial Development and Reform Commission Fujian Provincial Department of Finance on the Issuance of “Fujian Carbon Emissions Trading Market Regulation Implementation Details (Trial)” notice, December 5, 2016, http://www.fjdpc.gov.cn/show.aspx?ctlgid=738877&id=112813.
127 Source: Guangdong provincial Development and Reform Commission, Guangdong Provincial Development and Reform Commission on the Issuance of Guangdong Province Civil Aviation, Paper Industry 2016 Annual Carbon Emission Quota Allocation Program and White Cement Enterprises in 2016 Quota Allocation Method Notice, January 6, 2017, http://www.gddrc.gov.cn/zwgk/tzgg/zxtz/201701/t20170106_382101.html.
128 Source: Ibid.129 Source: Guangdong provincial Development and Reform Commission, Notice of the Guangdong Provincial Development and Reform Commission on Printing
and Distributing the Guidance on the Use of National Certification Voluntary Emission Reductions (CCER) to Eliminate the Actual Carbon Work in 2016 in Guangdong Province, January 9, 2017, http://www.gddrc.gov.cn/zwgk/tzgg/zxtz/201701/t20170109_382327.html.
130 Source: Hubei provincial Development and Reform Commission, Notice of the Provincial Development and Reform Commission on the Issuance Plan for the Distribution of Carbon Emissions in Hubei Province in 2016, January 3, 2017, http://www.hbfgw.gov.cn/xw/tzgg_3465/gg/tpwj/201701/t20170103_109021.shtml.
131 Source: Ibid. 132 Source: Ibid.133 Source: Hubei provincial Development and Reform Commission, [Notice] Provincial Development and Reform Commission on the 2016 Hubei Province
Carbon Emission Rights Cancellation Mechanism of the Relevant Matters Notice, July 8, 2016, http://www.hbfgw.gov.cn/xw/tzgg_3465/gg/tpwj/201607/t20160708_105942.shtml.
Table 3 / Key developments in the Chinese pilot ETSs
ETS pilots Key developments
Beijing − Expanded to cover the transport sector as well as power and cement companies from Chengde in Hebei, and Erdos and Hohhot in Inner Mongolia in 2016.122
Chongqing − Reduced the cap from 106 MtCO2e in 2015 to 100 MtCO2e in 2016.124
Fujian
− Launched an ETS on December 15, 2016, which will retrospectively apply to 2016 emissions. − Covers about 60 percent of its GHG emissions, applying to 277 entities in the power, industry and aviation
sectors with an energy consumption of over 10,000 tons of standard coal equivalent (tce) in any year from 2013 to 2015.
− Distributes the majority of allowances through free allocation. Entities are permitted to use offsets generated in Fujian to meet up to 10 percent of their compliance obligation; these offsets are subject to qualitative restrictions on the project type.125
− Introduced a market stability mechanism where authorities can sell additional allowances or repurchase allowances from the market.126
Guangdong
− Expanded scope to cover the domestic aviation sector and paper making in 2016.127 − Introduced benchmarking to determine free allocation levels to the white cement, domestic aviation and
paper making sectors from 2016.128 − Adjusted the rules for CCER use. From 2017 onward, all credits used for compliance must originate from the
province, up from 70 percent in 2016.129
Hubei
− Reduced the cap from 281 MtCO2e in 2015 to 253 MtCO2e in 2016, in line with their mitigation ambition.130 − Lowered the inclusion threshold for the power sector and several large industrial sectors in 2016 from an
annual energy consumption level of 60,000 tce to 10,000 tce.131 Also, shifted the baseline period on which inclusion in the ETS is determined from 2009-2014 to 2013-2015.
− Introduced a historical emission intensity approach for free allocation for ceramics, glass and other building material producers from 2016.132
− Limited offset usage for compliance in 2016 to CCER credits generated from rural biogas and forestry projects in poor areas in the province.133
Shanghai
− Expanded the scope to cover the shipping sector in 2016.134 − Introduced a historical emission intensity approach for free allocation for aviation, shipping, port and tap
water production from 2016.135 − Applied the benchmark approach to heat supply and vehicle glass manufacturing from 2016.136 − Lowered the quantitative limit for CCER usage for compliance in 2017 from 5 percent of annual emissions
to 1 percent.137
Shenzhen − Covered 246 new entities after they met the inclusion threshold in 2016, increasing the total number of entities covered to 824.138
Tianjin − Extended the legal provisions to govern its pilot ETS to June 30, 2018.139
48

Taiwan, China has continued working toward the implementation of an ETS. In February 2017, plans were published to meet a target of halving its GHG emissions by 2050 compared to the 2005 baseline level through the implementation of an ETS, among other policy measures.140
Colombia
In Colombia, a carbon tax came into effect on January 1, 2017, applying a tax rate of COP15,000/tCO2 (US$5/tCO2) on liquid and gaseous fossil fuels used for combustion.141 The carbon tax covers about 24 percent of the country’s GHG emissions.142 Tax exemptions apply to natural gas consumers that are not in the petrochemical and refinery sectors, and fossil fuel consumers that are certified to be carbon neutral. Emitters can achieve carbon neutrality through the use of offset credits generated from projects in Colombia.143 Credits have to be verified by auditors accredited by the UNFCCC, Colombia’s national accreditation body or a member of the International Accreditation Forum. Until the end of 2017, credits generated by non-CDM projects outside of Colombia are also eligible. The carbon tax is expected to raise COP660 billion (US$229 million) in government revenue per year.144 The revenue is earmarked for the Colombia in Peace Fund, which will support activities such as watershed conservation, ecosystem protection, and coastal erosion management.
European Union
In February 2017, the EU co-legislators, European Parliament145 and European Council146 separately voted on amendments to the European Commission’s
proposal for revisions to the EU ETS for the post-2020 period. In particular, both the Parliament and the Council amendments include an increase in the annual cap reduction from 1.74 percent to 2.2 percent to meet the 2030 GHG emission reduction targets, and a temporary doubling of the yearly withholding rate of surplus allowances into the market stability reserve to 24 percent. Discussions are ongoing to agree on the modalities to ensure more targeted allocation of free allowances, as well as the size and sourcing of low-carbon funding mechanisms. “Trilogue” meetings are currently taking place between the European Parliament, European Council and European Commission to achieve consensus on the EU ETS revisions.
The proposed Effort Sharing Regulation, which sets binding emission reduction targets for sectors not covered by the EU ETS post-2020, is also under consideration. One of the flexibility mechanisms introduced in this proposal would permit certain Member States to use a limited number of EUAs to contribute to meeting their non-ETS target. The proposal would allow up to 100 million EUAs across all Member States—or less than 1 percent of the EU ETS 2021–2030 allowances—to be used in this manner.
The European Commission has also proposed to extend the “Stop the clock” provision for intercontinental flights for at least four more years until 2021, when CORSIA will come into force.147 This provision was implemented in 2013 to exclude international aviation from participation in the EU ETS to allow ICAO to develop a global market-based measure for international aviation. The European Commission aims to have the proposal adopted by the end of 2017.148
134 Source: Shanghai Municipal Development and Reform Commission, On the Issuance of the Shanghai Carbon Emissions Units, February 22, 2016, http://www.shdrc.gov.cn/gk/xxgkml/zcwj/zgjjl/23039.htm.
135 Source: Shanghai Municipal Development and Reform Commission, Notice of the Shanghai Municipal Development and Reform Commission on Printing and Distributing the “2016 Carbon Emission Quota Distribution Plan in Shanghai”, November 11, 2016, http://www.shdrc.gov.cn/fzgggz/nyglhjnjb/zcwj/24839.htm.
136 Source: Ibid.137 Source: Shanghai Municipal Development and Reform Commission, Notice of the Shanghai Municipal Development and Reform Commission on Printing and
Distributing the “2016 Carbon Emission Quota Distribution Plan in Shanghai,” November 16, 2016, http://www.shdrc.gov.cn/fzgggz/nyglhjnjb/zcwj/24839.htm.138 Source: Shenzhen Development and Reform Commission, Shenzhen Municipal Development and Reform Commission on the 2016 Annual Carbon Emissions
Trading Notice, September 18, 2016, http://www.sz.gov.cn/szfgw/xxgk/qt/tzgg/201609/t20160918_4938028.htm.139 Source: Tianjin Municipal Development and Reform Commission, Notice on Interim Measures for the Administration of Carbon Emissions Trading, March 21,
2016, http://www.tjzb.gov.cn/2016/system/2016/03/30/010001088.shtml. 140 Source: Environmental Protection Administration of Taiwan, China, National Climate Change Action Guidelines, February 23, 2017.141 Source: Dirección de Impuestos y Aduanas Nacionales, Concepto General Impuesto Nacional Al Carbono, February 10, 2017.142 Source: Input from the Colombia Ministry of Finance dated August 14, 2017.143 Source: Republic of Colombia, Decreto 926, June 1, 2017, http://es.presidencia.gov.co/normativa/normativa/DECRETO%20926%20DEL%2001%20DE%20
JUNIO%20DE%202017.pdf.144 Source: Input from the Colombia Ministry of Finance dated August 14, 2017.145 Source: European Parliament, Procedure : 2015/0148(COD), February 15, 2017, http://www.europarl.europa.eu/sides/getDoc.do?type=TA&language=EN&ref
erence=P8-TA-2017-0035.146 Source: Council of the European Union, Interinstitutional File: 2015/0148 (COD), March 1, 2017.147 Source: European Commission, The EU Tackles Growing Aviation Emissions, February 3, 2017, http://europa.eu/rapid/press-release_IP-17-189_en.htm.148 Source: European Commission, Proposal for a regulation of the European Parliament and of the Council amending Directive 2003/87/EC to continue current
limitations of scope for aviation activities and to prepare to implement a global market-based measure from 2021, February 3, 2017.
492 / Existing and emerging carbon pricing initiatives around the world

Following the agreement between the EU and Switzerland to link their ETSs in January 2016, the European Commission put forward a proposal for signature and ratification of the linking agreement on August 16, 2017.149 The agreement will enter into force at the start of the year that follows ratification, which is not expected before 2019.
Iceland Iceland announced that the carbon tax rate, currently at about ISK1190/tCO2 (US$12/tCO2), will double at the beginning of 2018.150 The main goal of this increase is to further encourage households and businesses to reduce CO2 emissions. This escalated tax rate will generate more than ISK4 billion (US$39 million) in additional revenue.
Kazakhstan
Kazakhstan suspended its ETS for two years starting from April 8, 2016. During this suspension period, Kazakhstan has amended the allocation method, the MRV system, GHG emission regulation, trading procedures, and the operating rules of its ETS.151 The Kazakhstan ETS is expected to be relaunched in January 2018.152
Korea, Republic of
To address the limited liquidity of the Korea ETS market in its first phase (2015–2017), the Korean government made reforms in 2016 that doubled the share of allowances that companies can borrow for compliance in the first phase. It also took measures to release additional allowances from the reserve onto the market through auctions.153 Furthermore, an additional 17 MtCO2e of allowances were created and freely allocated to companies for 2017 due to
an amendment to the national emission reduction target.154 Additionally, the use of certain international credits for compliance will be permitted starting from the second phase of the ETS (2018–2020) onwards, instead of the third phase (2021–2025). Only international CERs generated by Korean businesses are eligible for compliance. In April 2017, the Korean government announced additional measures to deal with the market imbalance for the second phase of the ETS.155 Under the new measures, fewer free allowances will be distributed in 2018 to companies that have banked allowances from the first phase exceeding a certain amount, and the amount of emission allowances that companies can borrow will be gradually reduced again. The second phase will see the start of allowance auctions as planned, with the auction share in 2018 set to be three percent, increasing to at least ten percent in 2021.156 Latvia
The Latvia carbon tax increased from €3.5/tCO2 (US$4/tCO2) in 2016 to €4.5/tCO2(US$5/tCO2) in 2017.157 The carbon pricing revenue has to be used for environmental protection, which include climate change measures.158
Mexico
Mexico will launch a year-long ETS simulation exercise in Fall 2017, with a view to strengthen national capacities in the public and private sectors regarding the design, organization and operation of an ETS.159 The simulation exercise will include webinars, in-person technical trainings, and the use of a web-based platform capable of simulating market conditions based on fictitious companies profiles. The simulation does not involve any real-life transactions. More than 90 companies from
149 Source: European Commission, EU and Switzerland join forces on emissions trading, August 16, 2017, https://ec.europa.eu/clima/news/eu-and-switzerland-join-forces-emissions-trading_en.
150 Source: Ministry of Finance and Economic Affairs of Iceland, Proposal for a Parliamentary Resolution: On the Financial Plan for the Years 2018-2022, 2017.151 Source: Adilet, Minister of Energy of the Republic of Kazakhstan and the Ministry of Environment Protection of the Republic of Kazakhstan on Amendments and
Additions to Some Orders, December 20, 2016, http://adilet.zan.kz/kaz/docs/V1600014537#z62.152 Source: Parliament of the Republic of Kazakhstan, Issues on legislative support for the development of the carbon market, May 4, 2017,
http://www.parlam.kz/ru/mazhilis/news-details/id33635/1/1. 153 Source: International Carbon Action Partnership, Emissions Trading Worldwide: International Carbon Action Partnership (ICAP) Status Report 2017, 2017.154 Source: Republic of Korea, Press Releases, January 24, 2017, http://mosf.go.kr/nw/nes/detailNesDtaView.do;jsessionid=4vReRjY22ZrkmwEEUy7jLgGQ.
node20?searchBbsId=MOSFBBS_000000000028&searchNttId=MOSF_000000000007379&menuNo=4010100.155 Source: Republic of Korea, The 6th Ministerial Meeting on Economic Relations in 2017, April 5, 2017, http://www.mosf.go.kr/nw/nes/detailNesDtaView.
do?searchBbsId1=MOSFBBS_000000000028&searchNttId1=MOSF_000000000008670&menuNo=4010100.156 Source: Ministry of Environment of the Republic of Korea, Greenhouse Gas Emissions Trading Scheme, March 16, 2017, http://eng.me.go.kr/eng/web/index.
do?menuId=450.157 Source: Likumi, Natural Resources Tax Law, January 1, 2017, https://m.likumi.lv/doc.php?id=124707.158 Source: Republic of Latvia, Amendments to the Natural Resources Tax Law, accessed March 17, 2017, http://titania.saeima.lv/LIVS12/SaeimaLIVS12.nsf/0/
C8E463DEA344CA99C225804A00345876?OpenDocument.159 Source: based on correspondence with the Government of Mexico, October 25, 2017.
50

the transport, power and industry sectors have voluntarily signed up to participate. The simulation exercise together with a government-private sector working group launched in 2017 will provide the fora for the design and regulation of Mexico’s ETS, which is planned to start as a pilot in late 2018. The simulation is scheduled to end in Fall 2018, before the launch of Mexico’s pilot ETS.
In 2014, Mexico and California signed an MOU on international collaboration on climate change mitigation.160 In addition to technical cooperation and assistance with designing and operating a carbon pricing mechanism in Mexico, the MOU refers to the potential for Mexico to link its carbon market with the California Cap-and-Trade program.161 In January 2017, an additional MOU was signed with a non-governmental organization to support the Mexico Secretariat of the Environment and Natural Resources and the California Air Resources Board in implementing the action plan established by the first MOU.
New Zealand
A two-stage review of the New Zealand ETS (NZ ETS) took place over 2016–2017.162 The first stage concluded in May 2016 with a decision to phase out the one-for-two transitional measure, which allowed non-forestry ETS facilities to surrender one emission allowance for every two tons of CO2e.163 The second stage concluded in July 2017; the New Zealand government proposed setting the allowance supply over a rolling five-year period to align with its NDC target, as well as introducing auctioning.164 The proposal also limits participants’ use of international carbon credits when the NZ ETS reopens to international carbon markets. In addition, the review
has led to the investigation of options for a new price ceiling; currently entities can purchase an unlimited number of allowances for NZ$25/tCO2e (US$19/tCO2e).165 The government is currently developing the implementation details of these measures and recommendations on concrete changes to the NZ ETS will be worked out by the end of 2018.166
Furthermore, New Zealand and China signed a bilateral climate change action plan to cooperate on carbon markets.167 The plan includes identifying opportunities for collaboration with other countries in the Asia-Pacific region to discuss potential linking. Also, New Zealand started discussions with Korea on developing carbon markets in the Asia-Pacific region.168
Norway The carbon tax rates on mineral oils, petrol and diesel and the tax on hydrofluorocarbon and perfluorocarbon emissions were increased to NOK450/tCO2e (US$60/tCO2e) from January 1, 2017.169 In addition, a new carbon tax rate was introduced for natural gas from petroleum activities that is emitted directly into the atmosphere; the effective tax rate for this category is comparable with the NOK444/tCO2e (US$56/tCO2e) tax rate that applies to CO2 emissions resulting from natural gas combustion.
Singapore
The Singaporean government intends to introduce a carbon tax in 2019.170 A carbon tax of between S$10–20/tCO2e (US$7–15/tCO2e) will apply to direct emitters and the revenue raised will help fund industrial emission reduction measures. Singapore has indicated that it would consider linking its proposed carbon tax framework to other carbon pricing initiatives.171
160 Source: State of California, Ministry of Environment and Natural Resources of the United Mexican States, and National Forestry Commission of the United Mexican States, Memorandum of Understanding to Enhance Cooperation on Climate Change and the Environment between the State of California of the United States of America and the Ministry of Environment and Natural Resources and the National Forestry Commission of the United Mexican States, July 2014.
161 In October 2015, Mexico and Quebec signed a specific MoU to strengthen collaboration in carbon markets development and linkage. In August 2016, California, Mexico and Ontario signed a declaration committing to work together on carbon markets.
162 Source: Ministry of the Environment of New Zealand, About the NZ ETS review 2015/16, accessed August 7, 2017, http://www.mfe.govt.nz/nzets/about-nz-ets-review.163 Source: Ministry for the Environment of New Zealand, Phase out of the One‐for‐two Transitional Measure from the New Zealand Emissions Trading Scheme, May
25, 2016, http://www.mfe.govt.nz/climate-change/reducing-greenhouse-gas-emissions/new-zealand-emissions-trading-scheme/legislative.164 Source: Ministry of the Environment of New Zealand, Outcomes from stage two of the NZ ETS Review 2015/16, accessed August 7, 2017, http://www.mfe.govt.nz/
nzets/2015-16-review-outcomes.165 Source: Ibid.166 Source, Ministry of the Environment of New Zealand, In-principle decisions: further information, http://www.mfe.govt.nz/climate-change/reducing-greenhouse-
gas-emissions/new-zealand-emissions-trading-scheme/in-principle-decisions.167 Source: New Zealand Foreign Affairs & Trade, Fact Sheet: New Zealand-China Climate Change Action Plan, March 27, 2017.168 Source: New Zealand Government, Korea and New Zealand discuss carbon markets, April 13, 2017, https://www.beehive.govt.nz/release/korea-and-new-
zealand-discuss-carbon-markets.169 Source: Des Kongelige Finansdepartement, Proposisjon Til Stortinget (Forslag Til Lovvedtak Og Stortingsvedtak), 2016.170 Source: Singapore Budget, Budget 2017: Moving Forward Together, February 20, 2017.171 Source: Government of Singapore, Climate Change Strategy and Carbon Pricing, March 20, 2017.
512 / Existing and emerging carbon pricing initiatives around the world

South Africa The implementation of the South Africa carbon tax has experienced a further delay and did not launch at the planned start date of January 1, 2017. A revised carbon tax bill will be submitted to Parliament later this year and a new implementation date will be determined by the Minister of Finance.172 In addition, it is anticipated that the South African government will publish a revised carbon offset regulation and a trade exposure allowance regulation later this year.173
Sweden
Sweden has made a commitment to become net carbon neutral by 2045. The carbon tax, which is currently SEK1130/tCO2e (USD 140/tCO2e), is a key policy instrument and there is a step-by-step process to reduce carbon tax exemptions. The reduced tax rate for industry outside EU ETS will be fully abolished on January 1, 2018.174 Furthermore, the government has proposed to reintroduce the carbon tax for combined heat and power plants that are also covered by the EU ETS from January 1, 2018 at 11 percent of the full tax rate; these plants are currently exempted from the carbon tax.175
Switzerland
The Switzerland carbon tax will increase on January 1, 2018 from CHF84/tCO2e (US$87/tCO2e) to CHF96/tCO2e (US$99/tCO2e), after a government review found that Switzerland’s GHG emissions were higher than the targeted levels for 2016.176 Like the existing carbon tax revenue, the additional revenue from the tax increase will be redistributed to the public or funneled into low-carbon funds; it does not feed into the federal budget.
Thailand
The Thai government is assessing various types of carbon pricing initiatives. As part of this process, Thailand started a voluntary ETS consisting of two phases. The first phase, which is being held over 2015–2017, is testing the MRV system. The second phase, which will run from 2018–2020, will be an ETS simulation covering various industrial sectors, designed to test the registry and allocation systems.
Turkey
The Turkish government is investigating the implementation of a carbon pricing initiative. Turkey introduced a mandatory MRV system for a number of large industrial emitters in 2016 and is conducting several studies to evaluate its carbon pricing options.177 The studies are expected to be completed by June 2018.
United Kingdom
Following the UK referendum outcome in June 2016 to leave the EU, the government indicated that it remains committed to using carbon pricing as an instrument to help decarbonize the power sector. Currently, the UK participates in the EU ETS and additionally, the Carbon Price Floor applies to the power sector. From 2021, the government will target a “total carbon price rate” that will apply to businesses; the format of this rate is yet to be defined.178 Further details on carbon pricing in the UK post-Brexit are expected by Fall 2017.
United States
On June 1, 2017, the US federal government announced its intention to withdraw from the Paris Agreement as soon as it is eligible to do so;179 it submitted a communication formalizing this
172 Source: based on correspondence with the Government of South Africa, August 24, 2017.173 Source: Ibid.174 Source: Government of Sweden, Budgetpropositionen för 2016, September 2016.175 Source: Government of Sweden, Vissa punktskattefrågor inför budgetpropositionen för 2018, June 1, 2017.176 Source: Swiss Federal Office for the Environment, Imposition of the CO2 levy on heating and process fuels, August 1, 2017, https://www.bafu.admin.ch/bafu/
en/home/topics/climate/info-specialists/climate-policy/co2-levy/imposition-of-the-co2-levy-on-thermal-fuels.html. 177 Source: Republic of Turkey, PMR Project Implementation Status Report (ISR), February 28, 2017.178 Source: UK Government, Spring Budget 2017, March 8, 2017, https://www.gov.uk/government/publications/spring-budget-2017-documents/spring-budget-2017.179 Source: The White House, Statement by President Trump on the Paris Climate Accord, June 1, 2017, https://www.whitehouse.gov/the-press-office/2017/06/01/
statement-president-trump-paris-climate-accord.
52

intention to the UNFCCC on August 4, 2017.180 It is also reviewing several energy- and climate-related policies of the previous government on a national level,181 including the Climate Action Plan and the Clean Power Plan, which aims to reduce CO2 emissions in the power sector. In response to these developments at the national level, the America’s Pledge initiative is bringing together US states, cities, companies, universities and other actors to highlight the continued support of the Paris Agreement goals by compiling and quantifying their efforts to reduce GHG emissions.182 This includes the United States Climate Alliance, which aims to uphold the US NDC pledge under the Paris Agreement and meet or exceed the Clean Power Plan targets. As of September 1, 2017, 13 states183 and Puerto Rico have joined the Alliance.184
Additional developments on a subnational level include Washington State launching the Clean Air Rule (CAR)—a baseline-and-credit ETS—on January 1, 2017. CAR covers two-thirds of Washington’s emissions. It initially covers installations with baseline GHG emissions greater than 100 ktCO2e that are not considered to be energy intensive nor trade exposed.
On July 17, 2017, the California state legislature passed Assembly Bill 398 to extend the state’s ETS from 2020 to 2030.185 Since then, the California Air Resources Board has adopted amendments to update certain allocation provisions for 2018-2020, continue the link with the Québec ETS, enable linking with the Ontario ETS from January 2018, and introduce new forms of linking.186 The amendments also include post-2020 modifications to the emissions cap, allowance price containment reserve and free allocation. However, the adopted amendments do not fully reflect all the requirements
of Assembly Bill 398. The California Air Resources Board plans to develop additional amendments in Fall 2017 to meet those requirements.
On August 23, 2017, the US states participating in RGGI reached an agreement on the draft design elements of RGGI for the period after 2020.187 The proposed changes include a linear reduction of the cap from 2021 onwards to reach a 30 percent reduction in 2030 compared to 2020 levels, additional cap reductions over 2021–2025 to account for banking of allowances at the end of 2020, and modifications to the auction reserve price and the Cost Containment Reserve.188 In addition, the RGGI states proposed setting up an Emissions Containment Reserve to curb the oversupply of allowances, which will be implemented from 2021 in all RGGI states except Maine and New Hampshire.189 These proposed changes will undergo stakeholder consultations and economic analyses before being formally adopted by each participating state.
In 2018, Massachusetts will launch an ETS covering power plants.190 This development aims to ensure that covered power plants will contribute to the state’s target of reducing GHG emissions by 80 percent below 1990 levels by 2050. While emission allowances in the Massachusetts ETS will be allocated for free in 2018, they will be auctioned from 2019 onward. Power plants in the state will continue to be subject to RGGI, and will have to meet compliance obligations in both systems.
Several other states are working to introduce carbon pricing. In Virginia, the governor issued an executive directive for the Department of Environmental Quality to develop a regulation to reduce CO2 emissions from power plants.191 The regulation will include provisions
180 Source: US Department of State, Communication Regarding Intent To Withdraw From Paris Agreement, August 4, 2017, https://www.state.gov/r/pa/prs/ps/2017/08/273050.htm.
181 Source: The White House, Presidential Executive Order on Promoting Energy Independence and Economic Growth, March 28, 2017, https://www.whitehouse.gov/the-press-office/2017/03/28/presidential-executive-order-promoting-energy-independence-and-economi-1.
182 Source: America’s Pledge, California Governor Jerry Brown and Michael Bloomberg Launch “America’s Pledge”, July 12, 2017, https://www.americaspledgeonclimate.com/.
183 California, Colorado, Connecticut, Delaware, Hawaii, Massachusetts, Minnesota, New York, Oregon, Rhode Island, Vermont, Virginia and Washington State.184 Source: US Climate Alliance, United States Climate Alliance - States United for Climate Action, August 31, 2017, accessed https://www.usclimatealliance.org/.185 Source: State of California, AB-398 California Global Warming Solutions Act of 2006: market-based compliance mechanisms: fire prevention fees: sales and use tax
manufacturing exemption, July 25, 2017. 186 Source: California Air Resource Board, Cap-and-Trade 2016, accessed August 7, 2017, https://www.arb.ca.gov/regact/2016/capandtrade16/capandtrade16.htm.187 Source: RGGI, RGGI States Announce Proposed Program Changes: Additional 30% Emissions Cap Decline by 2030, accessed August 23, 2017.188 Source: RGGI, RGGI 2016 Program Review, November 21, 2016.189 Source: RGGI, RGGI Program Review: June 27, 2017 Stakeholder Meeting, June 27, 2017.190 Source: Massachusetts Executive Office of Energy and Environmental Affairs, 310 CMR 7.74: Reducing CO2 Emissions from Electricity Generating Facilities,
August 11, 2017.191 Source: Governor of Virginia, Executive Directive 11 (2017), May 16, 2017.
532 / Existing and emerging carbon pricing initiatives around the world

to allow the use of market-based mechanisms and trading of emission allowances through a multi-state trading program. In Oregon, the Department of Environmental Quality provided recommendations on the design of a cap-and-trade system, including potential linking to the California and Québec ETSs.192 In addition, the Oregon legislature launched several new bills and draft proposals193 in 2017 that seek to introduce a carbon pricing initiative.194
Vietnam
The Vietnamese government plans to develop a carbon market by 2018 as part of its commitment to the Paris Agreement.195
Selected changes in regional, national and subnational carbon pricing initiatives are summarized in Box 2.
192 Source: Oregon Department of Environmental Quality, Considerations for Designing a Cap-and-Trade Program in Oregon, February 14, 2017.193 In 2017, bills to introduce carbon pricing were drafted (LC 1242) or proposed to both the House (HB 2135 and HB 2468) and the Senate
(SB 557 and SB 748) of Oregon.194 Source: Oregon State Legislature, 2017 Regular Session, n.d., https://olis.leg.state.or.us/liz/2017R1/Committees/HEE/2017-03-01-15-00/Agenda.195 Source: Government of Vietnam, Plan for Implementation of the Paris Agreement, August 2016.
Box 2 / Summary of selected changes in regional, national and subnational carbon pricing initiatives
Initiatives implemented in 2016: Australia (Safeguard Mechanism), British Columbia (GGIRCA) and Fujian (pilot ETS).Initiatives implemented in 2017: Alberta (carbon tax), Chile (carbon tax), Colombia (carbon tax), Ontario (ETS) and Washington State (CAR).New initiatives scheduled for implementation in 2018: Massachusetts (US).New initiatives under consideration: New Brunswick (Canada), Northwest Territories (Canada), Nova Scotia (Canada), Prince Edward Island (Canada), Singapore, Virginia (US) and Vietnam.Initiatives under consideration with new developments: Canada, China, Manitoba (Canada), Mexico, Newfoundland and Labrador (Canada), Thailand, Turkey and Oregon (US).
Scope expansion: 2016/2017: Beijing ETS expanded to cover the transport sector, as well as some power and cement companies; Guangdong ETS included domestic aviation sector and paper making; Hubei ETS lowered the inclusion threshold for the power sector and several large industrial; Shanghai ETS expanded to cover the shipping sector; Norway introduced a new carbon tax rate for natural gas from petroleum activities where emissions are released directly into the atmosphere.Future developments: British Columbia is planning to include fugitive emissions and intends to include emissions from the burning of forestry residues.
Price rate changes (carbon tax only):2016/2017: Norway carbon tax increased to NOK450/tCO2e (US$60/tCO2e) in 2017 for mineral oils, petrol, diesel, hydrofluorocarbon and perfluorocarbon emissions; Latvia carbon tax increased from €3.5/tCO2 (US$4/tCO2) in 2016 to €4.5/tCO2(US$5/tCO2) in 2017. Future developments: British Columbia is planning to increase the rate of its carbon tax—which currently stands at CAN$30/tCO2e (US$24/tCO2e)—by CAN$5/tCO2e (US$4/tCO2e) per year from April 1, 2018; Iceland carbon tax rate, currently at about ISK1190/tCO2 (US$12/tCO2), will double at the beginning of 2018; Switzerland carbon tax will increase on January 1, 2018 from CHF84/tCO2e (US$87/tCO2e) to CHF96/tCO2e (US$99/tCO2e).
54

2.4 Internal carbon pricing initiatives
Internal carbon pricing continues to grow and evolve as businesses and governments use it as a tool to inform their decision making on climate-related risks and opportunities. Over 1,300 companies—including more than 100 Fortune Global 500 companies with collective annual revenues of about US$7 trillion—
disclosed to CDP in 2017 that they are currently using an internal price on carbon, or plan to do so within the next two years.196 This represents an 11 percent increase compared to 2016. Of these companies, 607 reported to CDP that they are currently using an internal price on carbon while 782 stated that they are planning to implement it over the course of 2018–2019. About two thirds of the companies currently use internal carbon pricing as a risk management tool. The current coverage and expected growth of mandatory carbon pricing initiatives have contributed to these developments:
196 Source: CDP, Embedding a carbon price into business strategy, September 2016.
Price/market stabilization mechanisms (ETS only):2016/2017: Fujian ETS included a market stability mechanism with the launch of its pilot ETS; Republic of Korea undertook several measures to deal with the market imbalance in its ETS.
Offsets:2016/2017: Colombia allows emitters to achieve carbon neutrality through the use of offset credits, and from 2018, these credits have to come from domestic projects; Fujian ETS allows entities to use offsets generated in Fujian to meet up to 10 percent of their compliance obligation; Shanghai, Hubei, and Guangdong made the use of CCER stricter; the Chinese NDRC temporarily suspended the approval of CCER projects and issuance of CCERs.Future developments: The Republic of Korea will authorize certain international credits for compliance from 2018; a review of Australia’s climate change policies includes investigating the potential use of international credits to meet its emission reduction targets.
Linking and/or cooperation:2016/2017: New Zealand and China signed a bilateral climate change action plan to cooperate on carbon markets; New Zealand started discussions with Korea on developing carbon markets in the Asia-Pacific region; China, Japan and the Republic of Korea held the first annual conference on the exchange of carbon pricing experiences.Future developments: the EU has started the legislative process to link the EU ETS with the Switzerland ETS, which is not expected to be completed before 2019; California adopted amendments confirming their 2018 link with Ontario and introducing new forms of linking.
Initiatives under review 2016/2017: the EU ETS review for post-2020 is reaching its conclusion; California extended its ETS to 2030, updated certain allocation provisions for 2018–2020 and adopted amendments to its design for post-2020; an agreement on the proposed changes to RGGI for the period after 2020 was reached; the NZ ETS was under review in 2016–2017, resulting various measures to strengthen its ETS.
552 / Existing and emerging carbon pricing initiatives around the world

of the companies that have publicly disclosed that they are using an internal price on carbon or plan to do so within the next two years, 83 percent are headquartered in countries where mandatory carbon pricing is in place or scheduled for implementation at a national or subnational level.
The reported corporate carbon prices in use are diverse, ranging from US$0.01/tCO2e to US$909/tCO2e. Some companies adopt a range of carbon prices to take into account different pricesacross jurisdictions and/or to factor in future increases in mandatory carbon prices. All regions have witnessed growth in the number of companies disclosing implemented or planned internal carbon pricing.
An increase in the adoption of internal carbon pricing is anticipated following the final recommendations of the FSB TCFD published on June 29, 2017. The TCFD considers climate-related risks to be material and advises businesses to disclose their climate-related financial risks and opportunities under existing financial disclosure obligations, including in a scenario that limits global warming to 2°C or below.197 As part of this disclosure, the TCFD recommends companies and investors to report the internal carbon prices that are used to manage these risks and opportunities. In particular, organizations are encouraged to disclose the parameters used for scenario analysis of climate-related risks and opportunities and explain their assumptions, including the internal carbon price scenarios used.198 Such recommendations are also being driven by investors such as Blackrock,199 which has called on all investors to assess the
potential impact of higher carbon prices on their portfolio.200 Financial institutions have also begun using internal carbon pricing to assess their project portfolio, including multilateral banks such as the World Bank and the European Investment Bank as detailed in Box 3.
Investors and businesses are supported in their response to the TCFD recommendations through the Carbon Pricing Corridor Initiative.201 The initiative aims to identify the carbon prices needed to achieve the ambitions of the Paris Agreement from a private sector perspective.202 For the power sector, the initiative found that carbon prices in the range of US$24–39/tCO2e by 2020 and US$30–100/tCO2e by 2030 are needed to decarbonize the sector by 2050. However, Figure 11 shows that of the utilities that have disclosed their internal carbon prices, more than half of these use prices below the initiative’s range for 2020. To be consistent with the TCFD’s recommendation to include a 2°C or below global warming scenario in their climate-related risk assessment, these utilities need to include a higher internal price within the range recommended by the Carbon Pricing Corridor Initiative in their analysis. The initiative will expand its scope over the course of 2017 to cover other high emitting sectors. To support further adoption of internal carbon pricing, Ecofys, The Generation Foundation and CDP have developed a guide on best practice approaches to internal carbon pricing in businesses.203 Using a new four-dimensional framework, the guide explains how a best-practice internal carbon pricing approach can be established to optimize decarbonization in a company’s value chain.204
197 Source: Task Force on Climate-Related Financial Disclosures, Recommendations of the Task Force on Climate-Related Financial Disclosures, December 14, 2016.198 Source: Task Force on Climate-Related Financial Disclosures, The Use of Scenario Analysis in Disclosure of Climate-Related Risks and Opportunities, June 15, 2017.199 Blackrock is the world’s largest asset manager with US$5.4 trillion under management.200 Source: BlackRock, Adapting Portfolios to Climate Change, August 2016.201 The Carbon Pricing Corridor Initiative is facilitated by CDP on behalf of We Mean Business and consists of a panel of utilities and investment leaders from
across the G20. 202 Source: CDP, Press Release: Industry Leads New Initiative to Revolutionize Carbon Pricing for Investors, January 16, 2017, https://www.cdp.net/en/articles/media/
industry-leads-new-initiative-to-revolutionize-carbon-pricing-for-investors.203 Ecofys, The Generation Foundation and CDP, How-to guide to corporate internal carbon pricing – Four dimensions to best practice approaches, Consultation
Draft, September 2017. 204 Other guides include: WBCSD, Emerging Practices in Internal Carbon Prices: A Practical Guide, December 2015; I4CE & EPE, internal carbon pricing: A growing
corporate practice, November 2016; UNGC, Executive Guide to Carbon Pricing Leadership: A Caring for Climate Report, January 2015; Microsoft Corporation, The Microsoft carbon fee: theory & practice, December 2013.
56

Figure 11 / Internal carbon prices of utilities publicly disclosed to CDP compared to Paris-compatible carbon prices for 2020 from a private sector perspective
Dis
clos
ed p
rice
(US$
/tCO
2e) 90
80
70
60
50
40
30
20
10
0
US$39/tCO2e by 2020
US$24/tCO2e by 2020
Utilities that have publicly disclosed their internal carbon prices
Note: The colored line on each gray bar represents the internal carbon price of a company publicly disclosed to CDP. Some utilities reported several internal carbon prices or a carbon price range. The reported range of internal carbon prices is represented by the colored bars. Source: CDP, Putting a price on carbon - Integrating climate risk into business planning, October 2017 for internal carbon prices.
Carbon price range needed by 2020 to decarbonize the power sector by 2050 and meet the ambitions of the Paris Agreement from a private sector perspective as identified through the Carbon Pricing Corridor Initiative.
572 / Existing and emerging carbon pricing initiatives around the world

205 European Investment Bank, The Economic Appraisal of Investment Projects at the EIB, March 2013. 206 European Investment Bank, EIB Climate Strategy, September 22, 2015.207 World Bank, Integrating Climate Concerns into World Bank Group Actions, March 31, 2015, http://www.worldbank.org/en/topic/climatechange/brief/
integrating-climate-change-world-bank.
Financial institutions increasingly use internal carbon pricing as a tool to evaluate their investments by including the cost of carbon in economic analyses of new projects. Examples of these financial institutions include multilateral development banks: the European Investment Bank (EIB) and the World Bank Group.
The EIB was the first international financial institution to systematically integrate the negative externality of CO2 emissions into its project appraisal, as part of its commitment to support low-carbon solutions through its lending portfolio. In 1997, it started valuing the avoided cost of environmental externalities, including CO2 emissions and local air pollutants. The costs of environmental externalities were progressively incorporated into the economic analyses of energy and transport projects, and these costs are now applied across all sectors financed by the EIB.205 The EIB currently uses a shadow price of GHG emissions and other externalities to assess the costs or benefits to society from a particular project. The shadow price of carbon is determined by a literature review on the social cost of carbon and the marginal cost of reaching climate targets, including a target that is in line with keeping the global temperature rise below 2°C. Project appraisal results are usually presented using the carbon price from the reference scenario, with low and high price scenarios used for sensitivity testing. In 2017, these are €37/tCO2e (US$44/tCO2e), €16/tCO2e (US$19/tCO2e), and €62/tCO2e (US$73/tCO2e), respectively.206 These price levels increase over time to reflect the increased marginal damage of GHG emissions in the future, and are regularly reviewed to stay aligned with climate modelling literature.
The World Bank Group started including a carbon price in its economic analyses of new projects in the 2015 fiscal year to better understand and measure its carbon footprint. It bases its assessment on an estimate of the social cost of carbon, beginning at US$30/tCO2e in 2015 and increasing to US$80/tCO2e by 2050. Internal carbon pricing forms part of the World Bank Group’s strategy to promote sustainability and manage risks and volatility in a globally interconnected world.207
Box 3 / Use of internal carbon pricing by multilateral banks in project evaluations
58

3 Climate finance and
climate markets: toward an integrated approach
593 / Climate finance and climate markets: toward an integrated approach

Sustaining progress toward the objectives of the Paris Agreement can drive innovation, jobs and economic growth. Recent analysis shows that in the G20 countries, a policy package compatible with the Paris Agreement can increase long-run gross domestic product (GDP) by up to 2.8 percent in 2050 relative to a continuation of current policies—largely by increasing overall infrastructure investment. If the positive impacts of avoiding climate damage are also taken into account, the net effect on GDP in 2050 rises to nearly 5 percent across the G20.208
Similar benefits might be possible outside the G20, where infrastructure needs are also substantial.209 However, the realization of these benefits will require immediate mobilization of significant investments and the implementation of enabling policies.
Incremental investments of US$700 billion per year may be needed by 2030 to limit the global temperature rise to less than 2°C.210 In addition to these incremental investments, much of the planned investments in high-carbon technologies and infrastructure will need to be shifted to a range of low-carbon alternatives (see Annex IV).
The need to leverage incremental investments of US$700 billion per year for a low-carbon future, combined with the need to transition from high-carbon to low-carbon investment, is a huge policy challenge. An integrated approach to policymaking recognizes that different measures are effective at addressing certain barriers and market failures, and that each measure can make others more effective if designed together. To succeed in mobilizing the required investments, an integrated policy response that combines domestic carbon prices, other domestic policies, climate finance and international market approaches is needed. This is illustrated in Figure 12.
208 Source: OECD, “Executive summary”, in Investing in Climate, Investing in Growth, (2017). Retrieved from http://dx.doi.org/10.1787/9789264273528-2-en.209 It is however important to take into account differences in the macroeconomic parameters limiting the degree to which results of the quoted study can
be generalized.210 Incremental investment provides an indication of the scale of additional capital flows needed in a low-carbon scenario relative to a higher carbon
business-as-usual case. It does not consider the societal benefits and costs of different investment mixes. The estimated incremental investment needs of US$700 billion per year draws on multiple studies, discussed in more detail in Annex IV.
3 Climate finance and climate markets: toward an integrated approach
60

Domestic policies will be a central driver for the transition to a low-carbon economy. Consistent carbon pricing, which ensures that a similar economic signal exists for all sources of emissions,211 can play an important role in providing the incentives needed to drive resource deployment. At the same time, it will need to be complemented by other policies that make it more effective, tackle barriers that carbon pricing cannot, and help mobilize finance.212 The 2016 edition of the State and Trends of Carbon Pricing discussed how domestic carbon prices and other domestic policies can act synergistically to promote emission reductions; this interaction is shown on left side of Figure 12.
However, domestic policy alone will not be capable of delivering the low-carbon investments needed in developing countries; international cooperation is also required.213 Two main modalities of international cooperation can help emerging and developing countries overcome these challenges and support their domestic policy efforts:
− Climate finance: Public and private sources of finance, with varying degrees of concessionality (measured by grant element or subsidy), for investments, support for policy reform, and technical assistance intended to advance low-carbon, climate-resilient development.214
211 Without a consistent price signal, it is possible to generate perverse results. For instance, if there is a high carbon price on a less emission intensive fuel (such as gas) and a lower carbon price on a more emission intensive fuel (such as coal), there may be an incentive to switch towards the more emission intensive energy source.
212 Source: World Bank, Reconciling Carbon Pricing and Energy Policies in Developing Countries, forthcoming.213 Simply financing infrastructure under business-as-usual will present a significant challenge for many developing countries; our analysis, however, focuses
on the additional effort required to provide low-carbon infrastructure investment. 214 This discussion focuses on concessional finance provided by public institutions in developed countries. Concessional climate finance may also be provided
by public institutions from developing countries, philanthropies and, sometimes, the private sector. In other contexts, private sector investment on commercial terms in both developed and developing countries is also termed as climate finance. This analysis proceeds with the narrower definition outlined above without prejudice to any discussions of this term within the context of the international negotiations. This chapter aligns with concurrent work within the World Bank Group on a “Concessional Finance Strategy for Climate Change”. This will produce a framework to target concessionality and maximize its impact, which is expected to be available to the public in early 2018.
Figure 12 / An integrated policy approach
Low-carbon economy
DOMESTIC CARBON PRICEApplies a consistent carbon price across different sources of GHG emissions within a jurisdiction
INTERNATIONAL CLIMATE MARKETS
Enable the trade of mitigation
outcomes, either through linked
domestic markets, between governments,
and/or between private actors
CLIMATE FINANCEDelivery of
concessional financial flows that support
mitigation (and adaption) action
DOMESTIC POLICIESPlay a host of roles including delivering mitigation, reducing costs, stimulating investment, mobilizing finance and altering incentives to improve the functioning of carbon prices
61

− Climate markets: markets established by policies that generate tradable units representing quantified climate-outputs or outcomes, often for the purpose of meeting compliance obligations established in a jurisdiction.215 Examples of these markets include carbon markets for GHG emission reductions, white certificate markets for energy efficiency savings and green certificate markets for renewable energy generation. Such markets may start at the domestic level before extending to a regional focus, and could potentially become global. The 2016 edition of the State and Trends of Carbon Pricing216 outlined how a global carbon market could reduce the annual cost of moving toward the 2°C temperature target by up to 50 percent compared to countries acting alone by 2050.
This chapter builds on the 2016 report and focuses on the interaction between these two modalities of cooperation, as shown on the right side of Figure 12, as well as how these modalities can best enable domestic policies. Mobilizing investments at the speed and scale required—and hence delivering low-carbon growth, jobs and innovation—will occur only if these modalities are designed to work together. This requires a fundamental change to the approach taken to date, including under the Kyoto Protocol, where rules paid insufficient consideration to their interactions.
Section 3.1 explores the integration of international climate markets and international climate finance. This is guided by optimal concessionality in climate finance, compatibility of climate finance and climate markets using common standards and definitions, efficiency and environmental robustness of climate markets, and longer-term subsidiarity of climate finance to climate markets.
Section 3.2 describes how the transition toward an integrated approach can be realized, particularly through the increasingly important role of RBCF. RBCF is a form of climate finance where funds are disbursed by the provider of climate finance to the
recipient upon achievement of a pre-agreed set of climate-related results. RBCF can become a stepping stone toward the greater use of climate markets, and the emergence of an international carbon market. It can encourage a private sector response to price signals, trigger the development of market-friendly domestic policies, establish MRV infrastructure, and form the basis of pilot initiatives that pave the way to an international carbon market.
Finally, Section 3.3 illustrates how the integrated approach can be applied to support the transition to clean energy—an essential challenge that needs to be addressed as part of the pathway to limiting warming to less than 2°C.
3.1 An integrated approach to climate finance and international climate markets
While domestic actions will play the key role in driving the low-carbon transition in all countries, in developing countries it will need to be supported by flows of climate finance and investments mobilized by international climate markets. This section outlines the roles of climate finance (Section 3.1.1) and international climate markets (Section 3.1.2), and then identifies four elements that can be taken into account to help guide their use and interactions (Section 3.1.3).
3.1.1 Roles for climate finance
Climate finance plays an essential role in supporting the low-carbon transition, and flows of climate finance will need to increase as mitigation actions gain pace. Under an integrated vision of climate finance and markets, climate finance would ideally be targeted where it is most effective at supporting the low-carbon
215 This chapter focuses on climate markets (and climate finance) for mitigation. While climate finance clearly targets adaptation as well, there are currently no examples of markets for transferrable adaptation outcomes. More research, which goes beyond the scope of this chapter, would be needed to explore the potential for market solutions in this area. However, all mitigation outcomes should be resilient to climate change and disaster risks, or else these risks reduce an action’s mitigation value (for example, hydropower and afforestation projects may fail without accounting for future changes in rainfall patterns). As such, adaptation outcomes can be considered as integral to mitigation outcomes.
216 Source: World Bank, Ecofys, & Vivid Economics, State and Trends of Carbon Pricing 2016, (2016).
62

transition. Three roles are particularly prominent for climate finance, with their respective importance varying significantly between countries:
− Buying down the cost of advanced technologies that are still too expensive for broad market uptake.
− Developing the enabling environment needed for low-carbon development.
− Tackling financing barriers to technology deployment to support investment.
While there has been significant focus on the declining costs of renewable technologies, many low carbon technologies remain expensive relative to conventional alternatives. For instance, the low-carbon transition will require technologies to integrate high levels of variable renewables into the electricity grid, and may require the deployment of technologies like carbon capture and storage (CCS) for energy and industrial applications. These technologies can come at a significant cost: for example, while some applications of CCS for industry may cost as little as US$20/tCO2, others may cost as high as US$120/tCO2 in 2050.217 Much of the technology required for CCS is already mature, with the key barrier to its deployment being the current lack of strong business models.218
Using market mechanisms to support these higher-cost technologies is difficult as directing investor attention toward these technologies could require very high carbon prices. This could result in excessive windfall profits for low-carbon technologies and unpalatable social consequences if not compensated by other policies, especially in developing countries. Instead, climate finance, in the form of grants or highly concessional loans, can be used to reduce the costs that investors need to recover from consumers. As climate finance increases the deployment rate of these technologies, firms across the whole supply chain can learn new and better ways to deliver these products through a process of experimentation, and trial and error. By accelerating the uptake of these new technologies, climate finance can help bring down their costs, potentially accelerating deployment by decades.219, 220
Climate finance is also well placed to support a range of enabling factors that are required for delivering mitigation and low-carbon development. For instance, climate finance can provide direct technical policy assistance to develop emission reduction policies such as energy efficiency standards, or the resources to create effective local institutions with well-trained staff. Similarly, funding to develop regulations on financial transparency can encourage low-carbon investment by clarifying the long-run financial risks of business strategy.221 Climate finance can also fund collaboration to increase capacity across jurisdictions, for instance through the World Bank’s Partnership for Market Readiness, and ensure climate markets are compatible, thereby reducing barriers to their expansion. By supporting better policy and other enabling factors, climate finance can improve the general investment climate and lower the cost of investments in low-carbon assets and technologies.
In addition, international climate finance can also play an important role when there are financing barriers to technology deployment, rather than economic or cost-competitiveness challenges. Some low-carbon technologies may be cost-competitive but are still unfamiliar to local investors and therefore perceived to be riskier. Furthermore, financial providers may be faced with substantial costs related to developing the expertise to accurately assess risks and structure appropriate financial instruments. Climate finance can help address these barriers through risk sharing, joint financing, and building expertise.222 In other cases, project developers need concessional resources for upfront investments, whereas the revenues from market mechanisms are received later in the project cycle after emission reductions are achieved. For instance, one of the issues faced by project developers in the CDM market was the challenge of finding an approach to leverage the prospective revenues from selling CERs to finance the initial investment. The judicious use of climate finance can help address such timing issues.
217 Source: IEA & IRENA, Perspectives for the Energy Transition, Investment Needs for a Low-Carbon Energy System, 2017.218 Source: IEA, Technology Roadmap: Carbon capture and storage, (2013).219 Source: IEA & IRENA, Perspectives for the Energy Transition, Investment Needs for a Low-Carbon Energy System, 2017.220 It may be possible to achieve some of this cost reduction through domestic action in developed countries, with the low-cost technology then transferred
to developing countries, but there are often geographic specific costs that can only be reduced through increased deployment in each country or market. 221 Source: Stiglitz & Stern, Report of the High-Level Commission on Carbon Prices, (2017).222 Source: Vivid Economics & McKinsey and Company, The economics of the Green Investment Bank: costs and benefits, rationale and value for money, October 2011.
633 / Climate finance and climate markets: toward an integrated approach
3.1.2Roles for international climate markets
While climate finance plays an important role, there are two main reasons for expecting international climate markets to play a central role in the transition to a decarbonized economy over the longer term. In this analysis, it is assumed that international climate markets will develop in a way that will generate additional price signals and/or commercial incentives for private sector actors to undertake abatement activities, as many foresee emerging from the negotiations relating to Article 6 of the Paris Agreement.
First, the competitive dynamics stimulated through international climate markets can substantially reduce the cost of global efforts to reduce emissions. As shown in the 2016 edition of the State and Trends of Carbon Pricing, a global carbon market might reduce the annual economic costs of mitigation by around 30 percent in 2030, rising to around 50 percent in 2050. These cost savings can help policy makers increase their emission reduction ambitions. Reducing the cost burden in a jurisdiction can limit the impact of the carbon price on the poorest for whom energy expenses might be high relative to their income.
Second, incremental investments of US$700 billion are needed to transition to a low-carbon economy, almost all of which is required in low- and middle- income countries.223 International market mechanisms can play a key role in leveraging such investments. The 2016 edition of the State and Trends of Carbon Pricing showed that an integrated global market would result in flows from primary market emission reduction sales of around US$220 billion per year, rising tenfold to about US$2.2 trillion by 2050.224 Resource flows of this scale can be
a powerful lever for triggering investments. For example, over the period 2009–2011, it is estimated that the price signal provided by the CDM leveraged investments worth two to four times the expected value of emission reductions.225
3.1.3Combining climate finance and international climate markets
Climate finance and international climate markets both have important roles to play, and must work together to deliver the low-carbon transition. However, international climate markets do not yet exist at scale because the potential market mechanisms under the Paris Agreement have not yet been established and the usage of the flexible mechanisms of the Kyoto Protocol has declined. In this phase, climate finance can play a substantial role in supporting the development of climate markets as discussed in more detail in Section 3.2 below.
The natural starting point in this transition to well-functioning climate markets is the optimization of the already existing modality of international cooperation—climate finance. Compatibility of standards and definitions is important for climate finance to facilitate market solutions. Robust and inclusive design of efficient market mechanisms can then enable the integration of climate markets and climate finance, allowing climate finance to focus on those areas that cannot be reached by market solutions.
Box 4 summarizes this evolution into four elements that can help guide the integration of climate finance and international climate markets. Together, these elements seek to support the development of an efficient and robust policy mix for delivering a low-carbon economy.
223 For instance, under the high investment scenario in McCollum et al (2013) all incremental investment flows are required in developing countries, whereas industrialised countries have negative incremental investments. Approximately two-thirds of total energy sector investments will be required in the developed world. Source: McCollum et al., “Energy Investments Under Climate Policy: a Comparison of Global Models”, Climate Change Economics, 4(4), (2013) https://doi.org/10.1142/s2010007813400101.
224 Prices updated to US$2015. Source: World Bank et al., State and Trends of Carbon Pricing 2016, (2016). These estimates are based on a perfectly functioning global market involving all countries. A less fully developed market would likely generate lower financial flows.
225 Authors’ calculations using a 10 percent interest rate and assuming investor expectations of constant real CER prices, drawing on Fenhann, “CDM pipeline overview”, (2017), retrieved from http://cdmpipeline.org; Intercontinental Exchange, Emissions CER Index, (2016); OECD, Monthly Monetary and Financial Statistics: Exchange rates (USD monthly averages), (2016).
64

Recognizing the new reality created by the Paris Agreement and building on existing best practice,226 the World Bank has developed four elements that guide an integrated approach to climate finance and climate markets: 1. Optimal concessionality in climate
finance: this element suggests that climate finance should only provide concessionality to the extent necessary for delivering the intervention. This ensures that climate finance is used efficiently, and minimizes market distortions.
2. Compatibility: Compatibility helps market mechanisms work alongside climate finance through the use of common standards and definitions. This allows for efficient blending of climate finance and market mechanisms.
3. Efficiency and environmental robustness: this element stresses that international climate markets should be designed to deliver measurable outcomes and provide confidence in the integrity of climate policy. At the same time, transaction costs should be minimized to enable a much wider range of stakeholders to participate in these markets than has previously been the case.
4. Subsidiarity: The essence of subsidiarity is that as climate markets become more developed, they should be utilized ahead of climate finance to mobilize low-carbon investments, so that public resources are used efficiently.
226 See, for instance, EBRD, Multilateral Development Bank Principles to Support Sustainable Private Sector Operations, (2012); G20 – IFA WG, Principles of MDBs’ strategy for crowding-in Private Sector Finance for growth and sustainable development, (2017); IFC, Blended Finance at IFC, (2017).
227 Source: Ibid.228 Source: World Bank, Concessional Finance Strategy for Climate Change, forthcoming.
Box 4 / Elements for integrating climate finance and international climate markets
Optimal concessionality
This element suggests that the quantity of concessional finance, and the extent of concessionality, should be targeted to achieve climate action that might not otherwise be implemented, such as system-level changes that facilitate a country’s transition towards a low-carbon economy. This helps to ensure that the finance is allocated efficiently and is less likely to distort markets within the host country.
The concessional element within any finance package should therefore be carefully calibrated to address market failures and catalyze the intended investment. This is often most effectively achieved if the concessional finance is time-bound and linked with a clear exit strategy, including resources to encourage and support desirable policy changes. This enables a given quantity of climate finance to deliver greater levels of investment, and signals a future shift to market-based funding. It should also allow limited concessional finance to be used elsewhere. This is consistent with the existing practice of many international development partners, both in relation to their support for climate action and other areas.227
Climate finance has an indispensable and growing role in supporting investments that maximize transformational impacts by prioritizing sectors, policies, technologies and solutions that put countries on pathways for system-level changes that are needed to transition toward a low-carbon economy. While transformational interventions may require more concessional support than those that produce only marginal changes, in the medium term, they can act to move sectors toward fully commercial solutions for the scale-up of investments.228
653 / Climate finance and climate markets: toward an integrated approach

Compatibility
Compatibility seeks to ensure that policies and mechanisms that target similar outcomes measure these outcomes in a consistent way.
Compatibility can assist in the evolution of the roles of climate finance and climate markets over time, as discussed further in Section 3.2. If climate markets and climate finance share a common set of rules and standards, investors can easily shift from reliance on climate finance toward markets, as the latter develop. Likewise, as jurisdictions move to establish trade in mitigation outcomes under the Paris Agreement, cooperation in the development of standards may substantially simplify the process of linking disparate markets.
Compatibility can be advanced by applying accurate and comparable standards to the measurement and reporting of outputs and outcomes, such as emission reductions or the generation of renewable electricity. The same standards can then also be applied to the generation of offset credits or the calculation of liabilities in market mechanisms, and in accounting at a jurisdictional level.
A further important component of compatibility is the coordination of standards, especially given the inherent complexity of some climate market outputs and outcomes such as how to aggregate emissions from different GHGs into a common unit such as tCO2e. In this context, the proliferation of different standards could increase costs and barriers to trade. Compatibility can be strengthened by the development of standards for supporting infrastructure, for instance, standardizing the design and operation of registry systems used to trade emission reduction units.
Compatibility can also help make both climate finance and markets more effective. For example, compatibility can improve coordination between different sources of climate finance flows, and reduce the transaction costs associated with managing, delivering and receiving such finance. Similarly, comparability of metrics and approaches
supports the identification of financing gaps across and within sectors and jurisdictions, which allows climate finance to be better targeted over time.
Efficiency and environmental robustness
Efficient and environmentally robust climate markets will encourage participation and ensure strong price incentives.
To help support inclusive participation by a wide range of countries, covering a wide range of mitigation opportunities, a number of lessons can be drawn from previous experience with international climate markets. In the past, high transaction costs and delays limited the participation of certain countries and abatement sources in international market mechanisms. This reduced participation meant that low-cost mitigation opportunities were not pursued in some cases, reducing the overall efficiency of the system. For example, the CDM suffered from high transaction costs for project developers and host countries seeking to access international markets. Studies suggest that the upfront costs of creating a CDM project were between US$70,000–$110,000 per project.229 These problems were compounded by delays in processing project applications. At the same time, assessing additionality remained controversial, particularly as there was more scope for idiosyncratic factors to influence the additionality assessment at the project level. While these problems persisted through much of the CDM, incremental reforms—such as the introduction of programmatic crediting and streamlined additionality assessments—sought to overcome some of these issues and provide a platform from which future market designs can build on.
In the future, there is greater opportunity to use domestic policy action as the basis for international climate markets. This can substantially enhance country ownership by allowing different countries to develop nationally appropriate policies, project cycles and MRV regimes. This cooperation will be supported if countries have assurance that traded mitigation outcomes represent additional emissions reductions. One way to ensure additionality is to
229 Source: Aldrich & Koerner, Unveiling Assigned Amount Unit (AAU) Trades: Current Market Impacts and Prospects for the Future, Atmosphere, 3(1), (2012), 229–245, https://doi.org/10.3390/atmos3010229.
66

account for credited emissions reductions against targets at the jurisdictional level. This makes jurisdictions responsible for additionality risk, rather than requiring the assessment of additionality at the project or mechanism level. If a jurisdiction applies lenient standards in crediting emission reductions that are then exported and used elsewhere, it will have to strengthen other policies to make up for shortfalls in its emission reductions to achieve its NDC target. However, for this mechanism to be effective, it is essential that the crediting jurisdiction’s target is below its business-as-usual emissions. Targets that are set above business-as-usual emissions can result in gaming of international carbon markets, as exported mitigation outcomes may not reflect real emission reductions. This is another area where there are lessons to be learned from the Kyoto Protocol: one study suggests that around three-quarters of the ERUs credited under JI were unlikely to have been associated with genuine emission reductions.230
Maintaining a stable and robust price is required for private sector confidence in the business case for investments in abatement options. This may require the management of price volatility across international climate markets. On the one hand, price fluctuations demonstrate that markets are working efficiently, sending signals to market participants of relative scarcity and abundance. On the other hand, with international market mechanisms, shocks in one system can be transmitted to other linked systems, undermining investment incentives. The oversupply of CERs, which flowed through to both the EU ETS and the NZ ETS, is an example of such an impact. As international climate markets proliferate and the complexity of links between them grow, these risks will also escalate and become increasingly important to manage. Therefore, exploration of the potential roles for market stability mechanisms such as international reserves will be needed. While these stability mechanisms are becoming common practice in domestic climate markets, their use in international markets will require strong cooperation.
Subsidiarity
Subsidiarity in international climate markets and climate finance implies that as climate markets become more developed, they should be utilized ahead of climate finance to mobilize low-carbon investments, so that public resources are used efficiently. Climate finance should be scaled up when the absence of markets leaves gaps in resource mobilization, and scaled down when market mechanisms work well. During the transition period from climate finance to climate markets, climate finance can be used to improve the operation of climate markets, and support areas that do not attract the necessary level of investments via climate markets.
A promising climate finance mechanism could be RBCF, which links concessional finance with market discipline and delivery. Following this are concessional risk-reduction mechanisms such as credit enhancements, risk insurance and guarantees, which can often be some of the most effective public climate finance instruments for leveraging private investments. Direct concessional finance or grants should only be considered to support the deployment of these other instruments, or when these other instruments cannot be used.
The relationship between international climate markets and concessional finance would ideally be different to that seen in the first generation of international carbon markets. Under the CDM, for instance, many mitigation investments that benefited from concessional support were considered ineligible due to concerns over additionality. However, in some cases this limited projects to receiving either concessional finance or revenues from market mechanisms, and mitigation options were not able to transition from receiving concessional finance to being supported via market mechanisms. This compartmentalization, in turn, stopped climate finance from shifting toward higher-cost mitigation options that market mechanisms could not support. In the future, an approach that is more cognizant of the long-term relationship between market mechanisms and concessional finance, and therefore more flexible in combining both, will be more effective in providing support to mitigation actions.
230 Source: Kollmuss, Schneider, & Zhezherin, Has Joint Implementation reduced GHG emissions? Lessons learned for the design of carbon market mechanisms, Stockholm Environmental Institute, (2015), 2015–7.
673 / Climate finance and climate markets: toward an integrated approach

3.2 Results-Based Climate Finance to support the creation of climate markets and transition to an inter-national carbon market
3.2.1 Transitioning from climate finance to climate markets
At present, the use of climate finance and international climate markets is very different from the vision described in Section 3.1. International carbon markets will need to grow significantly, both in coverage and trade, if they are to achieve the potential benefits set out in the 2016 edition of State and Trends of Carbon Pricing.231 There are currently no links between buyers and sellers in developed and developing countries, nor are there any other examples of significant international climate markets. Moreover, climate finance almost exclusively focuses on support for one or a series of specific low-carbon technologies or assets, rather than only specifying the desired underlying climate outcome such as emission reductions, which is the typical outcome traded in climate markets. While RBCF is an exception to this, because it directly targets such climate outcomes, its use is marginal in the current climate finance landscape.
Climate finance plays an important role in reducing costs and building confidence among market practitioners. This is crucial, especially as international climate markets are currently under-developed. However, over time, increased emphasis on international climate markets—with an associated switch in focus toward underlying climate outcomes, rather than specific assets or technologies—can be expected. This should be accompanied by a relative movement from concessional loans and grants to
other forms of climate finance that are more closely aligned to market-based approaches, such as risk sharing and RBCF. Box 5 provides an illustrative example drawing from the evolution of domestic policies for supporting renewable power generation.
To achieve this evolution toward greater use of climate markets, changes are required internationally and in national policy frameworks, and in terms of the instruments through which climate finance is disbursed.
Internationally, negotiators must first agree on the rules governing Article 6 of the Paris Agreement to provide a pathway for ITMOs to be utilized for compliance with NDC targets and traded in future international carbon markets. Over time, this will need to be accompanied by increasingly ambitious NDC targets to drive higher domestic carbon prices in purchasing countries and therefore greater demand for international mitigation outcomes. According to the analysis in the 2016 edition of State and Trends of Carbon Pricing, achieving the best outcomes from an international carbon market by 2030 would require a carbon price of US$88/tCO2—a figure which is consistent with the range of carbon prices identified by the High-Level Commission on Carbon Prices as compatible with the temperature goal of the Paris Agreement.232
At a jurisdiction level, focus is needed to develop demand for and confidence in using and financing low-carbon technologies such as renewable electricity generation and electric vehicles. This requires a coherent mix of domestic price and non-price signals, provided by domestic carbon pricing and other policies as represented in Figure 12. A well-designed mix will create strong demand for return-generating low-carbon investments. Broader structural reforms also play a role in making economies more responsive to the price signals that international climate markets provide. An increased liberalization of energy markets is often particularly important, as such markets can transmit price incentives to energy suppliers and
231 Source: World Bank, Ecofys, & Vivid Economics, State and Trends of Carbon Pricing 2016, (2016).232 Carbon price has been updated to US$2015. The High-Level Commission on Carbon Pricing report found that explicit carbon prices of US$40–$80/tCO2e
by 2020, and US$50–$100/tCO2e by 2030, were consistent with achieving the Paris Agreement temperature target. Source: Stiglitz & Stern, Report of the High-Level Commission on Carbon Prices, (2017).
68
consumers, and ensure that market participants are responsive to changes in market conditions such as changing technology costs. Fiscal reforms, such as the removal of fossil fuel subsidies, can improve the
business case for these investments. This package of domestic policy instruments was discussed in depth in the 2016 edition of State and Trends of Carbon Pricing.233
233 Source: World Bank, Ecofys, & Vivid Economics, State and Trends of Carbon Pricing 2016, (2016).234 Source: IRENA & Global Wind Energy Council, 30 Years of Policies for Wind Energy: Lessons from 12 Wind Energy Markets, (2013). Retrieved from www.irena.org.235 There are a range of mechanisms to support renewables that differ in the degree of market discipline imposed on investors. For instance, both feed-in
tariffs and auctions can support the deployment of renewable generation, but feed-in tariffs remove the price risk borne by investor and imply very little competition between generators. By contrast, the use of auctions creates a market to determine the necessary level of subsidy for renewable energy deployment, imposing more market discipline. Both mechanisms can be contrasted with, for example, an ETS which does not subsidise investment in particular forms of abatement, but rather penalises emissions and therefore encourages competition across all abatement options that are relevant to covered emissions.
236 These wind farms are to be commissioned by 2024. Source: Andresen, “Offshore Wind Farms Offer Subsidy-Free Power for First Time”, (2017).237 Source: IEA & IRENA, Global Renewable Energy Policies and Measures Database, (2017). Retrieved May 31, 2017, from https://www.iea.org/
policiesandmeasures/renewableenergy/.238 Source: Dezem, Solar Sold in Chile at Lowest Ever, Half Price of Coal, (2016). Retrieved May 2, 2017, from https://www.bloomberg.com/news/
articles/2016-08-19/solar-sells-in-chile-for-cheapest-ever-at-half-the-price-of-coal.
The development of domestic climate policies on renewable energy shows how the relationship between concessional finance and market-based mechanisms can evolve.
Initially, many countries supported renewable energy through direct public investment, including support for research and development (R&D). For instance, the early development of Germany’s wind power industry relied heavily on government R&D support—between 1977 and 1989, about 40 R&D projects were granted to businesses and research institutes to develop or test wind turbines. This was followed by a period of market development and concentration supported by feed-in tariffs through the 1991 Electricity Feed-In Act and the 2000 Renewable Energy Sources Act, combined with concessional finance where the degree of concessionality decreased over time.234
In the last decade, as technology costs declined, there has been a shift toward more market-based approaches in many countries.235 This has occurred in two ways:
− Greater use of markets for incentivizing renewable energy capacity expansions. In particular, competitive auctions have been used to incentivize renewable energy capacity expansions, taking into account declining technology costs. For instance, in April 2017, an auction for offshore wind farms in Germany settled with the required premium above the competitive wholesale market prices for electricity of just €4.4 (US$5.2) per megawatt hour.236
− In many countries where the need for additional financial support for renewable energy remains, this support has been provided through domestic climate markets in the form of tradable green certificates. This provides financial support for the underlying climate output/outcomes—renewable energy—and creates an independent market for these outputs, separate from the market for electricity. For instance, renewable energy obligations backed by green certificates are in operation in Australia, Mexico, Norway, and the Republic of Korea.237
Moving forward, in many parts of the world, the transition to fully market-based mechanisms to deliver renewable energy is likely to arrive quickly. For example, an auction for electricity capacity in Chile in August 2016 saw renewables outcompete fossil fuels, with renewable energy developers winning more than half of the contracts.238
Box 5 / The maturing of technology markets enables a shift to market-based finance
693 / Climate finance and climate markets: toward an integrated approach

Climate finance can also be delivered to transition toward greater use of climate markets:
− Private sector responsiveness to price signals introduced by climate markets can be increased through the development of markets in low-carbon technologies. Here, concessional lending plays an important role in building confidence in financial markets and bringing down costs. For example, the support provided by the Clean Technology Fund of the Climate Investment Funds is expected to play this role in relation to concentrated solar power technology.239
− The effective functioning of climate markets requires both private sector and government capacity building which can be supported by climate finance. This includes support on the design of carbon pricing mechanisms that are compatible with international climate markets, and the development of MRV systems and emission registries. This, for instance, is consistent with much of the climate finance provided by the Partnership for Market Readiness.
− As identified under the subsidiarity element, risk mitigation instruments can play a significant role in cost-effectively catalyzing private sector delivery of climate outputs and outcomes. In doing so, they can help establish an ecosystem of private sector providers and support the competition needed for climate markets to work effectively. For instance, to reduce the risks facing investors and subsequently their required rate of return, providers of climate finance may take on the first-loss risk in case of under-delivery from a mitigation project.240
Within this context, the remainder of this section focuses on RBCF as a further way in which climate finance can help support the development of climate markets within a broader package of financing modalities. While it is not the only climate finance
instrument that can help catalyze the private sector participation needed for successful climate markets, as the discussion above makes clear, RBCF can play an important role. It provides a clear price signal similar to that provided by climate markets, it is an instrument that can help catalyze both private sector and policymaker action, and it can allow for experimentation in the piloting of new designs and approaches to climate markets. This analysis builds on the initial discussion on RBCF in the 2016 edition of State and Trends of Carbon Pricing.
3.2.2 Defining RBCF
RBCF is a form of climate finance where funds are disbursed by the provider of climate finance to the recipient upon achievement of a pre-agreed set of climate-related results. These results are typically defined at the output or outcome level, which means the RBCF can either support the development of specific low-carbon technologies (outputs), or underlying climate outcomes such as emission reductions or renewable electricity generation (outcomes). The latter are the dominant currency units of climate markets. This is further discussed in Box 6. Results-based finance is a well-established approach that has been used successfully in other fields, particularly in the delivery of healthcare and education.
By rewarding outputs and outcomes, RBCF can align the goals of the finance provider with those of the recipient, enhancing the incentive of the recipient to deliver results.241 In addition, by not specifying the inputs or activities that deliver climate outputs or outcomes, RBCF provides flexibility to those receiving the funds to make their own decisions on how to best achieve results, which can help drive structural change by developing new collaborations, processes and innovations.242
239 Source: The World Bank & The African Development Bank, CTF Trust Fund Committee Submission Document, Morocco: Noor-Midelt Phase 1 Concentrated Solar Power Project (May), (2017).
240 Source: Frankfurt School FS-UNEP Collaborating Centre for Climate & Sustainable Energy Finance & World Bank Ci-Dev team, A New Approach for Pre-Financing Emission Reduciton Purchase Agreements for Household Energy Access Programs, (2016).
241 Source: Birdsall & Savedoff, Ca$h on Delivery : A New Approach to Foreign Aid, Centre for Global Development, (2010).; and Clist & Verschoor, The Conceptual Basis of Payment by Results, (2014).
242 This rationale applies regardless of the type of recipient—for example, private sector, non-governmental organization, government. Source: Mumssen, Johannes, & Kumar, Output-Based Aid Lessons Learned and Best Practices, (2010).; and Oxman & Fretheim, “An overview of research on the effects of results-based financing”, Systematic Review, (2008).
70

RBCF can be complemented by other financing approaches, including technical assistance and upfront financing. For instance, the Guyana REDD+ Investment Fund paired payments for reductions of deforestation rates and forest degradation with technical assistance for implementing REDD+ activities, including a governance development
plan and the MRV roadmap. RBCF may also be paired with upfront concessional finance to support investments where high upfront costs create barriers to accessing finance. Indeed, most RBCF programs to date have included upfront financing to deliver either loans or grants.243
243 Source: World Bank & Frankfurt School of Finance and Management, Results-Based Climate Finance in Practice: Delivering Climate Finance for Low-Carbon Development, (2017).
Box 6 / A stylized RBCF program to reduce emissions by increasing the uptake of residential solar power systems
An RBCF program could be designed to reduce GHG emissions by installing household solar power systems. RBCF recipients could pursue a range of projects including awareness-raising, installation and other related services. Once these projects have been implemented, a certain number of systems will have been installed (the outputs), which will reduce GHG emissions by a certain volume (the outcome). The RBCF support could be attached to either of these, depending on the objectives of those setting up the scheme. In either case, in the long term, this program should contribute to combating climate change by providing access to clean energy (the impacts). This is illustrated below.
RBCF is sufficiently flexible to support individual projects that deliver climate outcomes typically delivered by the private sector, or can be structured to provide results-based payments against policy reforms or implementation milestones achieved by the public sector.
RESULTS
RBCF INDICATORS
INPUTSconcessional
finance
ACTIVITIESsolar panel installation
OUTPUTSnew installed
capacity
OUTCOMESreduction in
CO2 emissions
IMPACTSreduced
climate impacts
Source: adapted from World Bank & Frankfurt School of Finance and Management, Results-Based Climate Finance in Practice: Delivering Climate Finance for Low-Carbon Development, (2017).
713 / Climate finance and climate markets: toward an integrated approach

3.2.3 How RBCF can support building climate markets and help the transition to an international carbon market
RBCF is a flexible instrument that can be applied in a variety of contexts. Often it can be used to support the development of specific low-carbon assets or technologies. For instance, the World Bank’s Hebei Air Pollution Program provides finance tied to a range of indicators, including the number of clean cooking stoves installed and the number of clean energy buses replacing diesel buses.244 This role for RBCF is important, given the need to build confidence in particular low-carbon technologies as described above. However, RBCF can also be used to provide payments for the delivery of underlying climate outcomes, such as emission reductions, with fewer or no constraints on the technologies used to deliver these outcomes. The remainder of this section focuses on the latter role of RBCF, and considers how RBCF can support the development of climate markets that also focus on these underlying climate outcomes, reflecting the long-term importance of such markets.
Climate markets can take a number of forms, including both traditional carbon markets and markets that focus on other climate outcomes, such as utilizing additional renewable energy resources or incentivizing energy efficiency. Indeed, some of the most successful climate markets to date have been those focused on achieving non-emissions outcomes
at a subnational or national level. These markets deliver mitigation results, build government capacity to use markets, and create a supportive supply chain that assists firms with obligations or interests in climate markets.245 In this way, such markets can support an evolution to market-based approaches that directly target GHG emissions, like emissions trading, and operate at the regional or global scale.
This section outlines how RBCF helps to develop both the private sector capacities needed for a climate market to operate efficiently, and the regulatory capability and policy design needed for these markets to meet minimum standards for environmental integrity. In the context of the diverse range of climate markets, there are four channels through which RBCF may help address barriers to the development of both climate markets and, over time, an international carbon market:
− Facilitating a private sector response to environmental pricing, including building up the ecosystem of business services required for climate markets.
− Supporting domestic policy processes and building targeted implementation capacity.
− Developing MRV systems that are needed in both RBCF and climate markets.
− Piloting programs based on the principles of Article 6 of the Paris Agreement.
These roles are illustrated in Figure 13.
244 Source: The World Bank, Program Appraisal Document on a Proposed Loan in the Amount US$500 Million to the People’s Republic of China for a Hebei Air Pollution Prevention and Control Program(105757), (2016).
245 To the extent that climate markets prefer certain sectors or technologies, there is a risk to create a barrier to broaden such markets as established market players might seek to protect their privileged positions.
Figure 13 / Channels through which RBCF supports prerequisites for climate markets
CLIMATE MARKETS
PILOTING MARKET
MECHANISMSe.g. TCAF
IMPROVING MRV SySTEMS
e.g. REDD+
SUPPORTING DOMESTIC POLICy
PROCESSESe.g. Feed-in tariffs
FACILITATING PRIVATE SECTOR
RESPONSE TO EINVIRONMENTAL
PRICINGe.g. PAF
72

Facilitating the private sector response to environmental pricing
A key barrier to the development of climate markets is inexperience with pricing for climate outcomes. RBCF has an important role in providing a price signal to markets where multiple firms compete. This competition reduces costs, increases output and potentially leads to the development of innovative approaches. It also helps cultivate a deep supply chain of firms with an interest in climate markets, including project developers to identify opportunities, auditors and verifiers to ensure that standards are met, lawyers to develop contractual arrangements, and financiers and professional service providers to develop and fund the business models needed to deliver projects. In this way, RBCF can act as a stepping stone for the private sector to understand the effectiveness of price signals in identifying the value proposition from mitigation activity. Moreover, it can do this while offering a fixed price for the climate outcome, helping participants to trial new business models and strategies without having to contend with the risks associated with potentially volatile prices.
These benefits can be reaped in areas of strategic interest where markets may otherwise not exist. For instance, the PAF targeted reduced methane emissions by providing price certainty for investors through the use of option contracts. As of January 2017, PAF had allocated US$54 million in options contracts for carbon credits representing over 20 MtCO2e of emissions reductions.246
Over time, the private sector response to RBCF incentives can support participation in an international carbon market, so long as compatibility is respected, as discussed in Section 3.1.3. Mitigation activities initially prepared in response to RBCF incentives can be scaled up, and RBCF incentives can be increasingly replaced by an international carbon price.
Supporting domestic policy processes
Governments can also use RBCF mechanisms to learn about the effectiveness of price signals and hence improve policy processes in a way that supports the development of climate markets. Placing a value on the delivery of environmental outcomes can introduce governments to environmental pricing and increase their willingness to adopt market-based approaches. A strong example of this dynamic is in China: many have argued that the success of the CDM in driving investments in low-emissions technology was pivotal in generating interest in the development of ETSs, first in a number of provinces and cities, which will evolve into a national ETS that is currently planned to be launched by the end of 2017.247
In the context of developing an international carbon market, RBCF can also be designed to target sector-specific policies which could in the longer term be developed into sectoral crediting mechanisms. For instance, the Forest Carbon Partnership Facility has invested significant funds in building readiness that will soon allow its Carbon Fund to start remunerating countries for reducing emissions below their reference scenario.248 Similarly, RBCF may be used to support domestic, sector-specific reforms, such as providing policy support for the introduction of renewable energy standards supported by trade in renewable energy certificates.
RBCF can also be used to support market-based reforms that increase the effectiveness of existing climate policies, such as reforms of energy or financial markets. In addition, RBCF can support reforms of fiscal policy, for example by facilitating the transition toward less distortionary tax mixes.
246 The three auctions to date used different designs and had different eligibility requirements. The reported value of option contracts is calculated using the strike price.
247 Source: CDM Policy Dialogue, Climate Change, Carbon Markets and the CDM: A Call to Action. Report of the High-level Panel on the CDM Policy Dialogue, (2012) https://doi.org/10.1097/DCC.0000000000000020.
248 Source: World Bank & Frankfurt School of Finance and Management, Results-Based Climate Finance in Practice: Delivering Climate Finance for Low-Carbon Development, (2017).
733 / Climate finance and climate markets: toward an integrated approach

Improving MRV systems
One of the most concrete ways in which RBCF can help support the development of climate market mechanisms is through the development of robust MRV infrastructure. Both RBCF schemes and climate markets need robust MRV systems to demonstrate that climate results have been delivered. Indeed, designing this infrastructure has been an integral element of RBCF schemes supporting REDD+. RBCF has been effective at leveraging existing systems—often supported by technical assistance—to deliver robust and credible MRV systems for REDD+ that are appropriate for local circumstances.249 Once established for RBCF, this infrastructure can be more generally applied to help ensure the credibility of results delivered through climate markets.
RBCF’s emphasis on supporting MRV infrastructure is particularly valuable given that assurance of the environmental integrity of emission reductions is needed to enhance participation in international carbon markets, as discussed above.
Piloting market mechanisms
With a new flexible, international climate policy architecture, a range of policy designs and innovations is likely to proliferate to reflect jurisdictions’ specific circumstances and goals. RBCF can be used as a laboratory, to design, test and improve international market mechanisms, and enable later replication and expansion. The Carbon Partnership Facility and the Transformative Carbon Asset Facility, both managed by the World Bank, are preparing pilot programs with this objective in mind. When pilot programs are successful, RBCF has the advantage that scaling up can be relatively simple—if more results are delivered, financing flows can expand to the extent that finance is available. RBCF provides the flexibility to pilot programs based on the principles of Article 6, in a pre-compliance
environment. This process of experimentation, adaption and iteration can help develop replicable and scalable pricing mechanisms and support the bottom up development of international climate markets.
Limitations of RBCF
Despite these many attractions, RBCF has its limitations. There are various situations where it may not be well placed to deliver climate results. Results-based payments do not address difficulties in accessing upfront finance, which is often cited as a key challenge to investment in emission reduction activities; however, this issue can be dealt with by including RBCF within a broader package of climate finance. Other challenges can include the difficulty in calibrating results payments when there are multiple results of interest to policymakers in addition to emission reductions, such as increased energy access.250 This can make it difficult to develop a payment structure that reflects the relative value of different results. In addition, as with other subsidy programs, RBCF risks that interest groups that benefit from the program may seek to extend it rather than moving to carbon pricing. Ensuring a clear plan and criteria for transitioning to policies such as carbon pricing or to market mechanisms can assist in transitioning away from RBCF as readiness increases.
RBCF will become more expensive where the delivery of results is highly uncertain, or where the policy context is unpredictable, as this will lead providers to demand higher payment to reflect higher risks and high private discount rates. Like other policies, generating broad political support for the continuation of RBCF and the longer-term transition to climate markets will be crucial to providing investors with a predictable regulatory regime that is capable of supporting long-term investments in mitigation activities.
249 Source: World Bank & Frankfurt School of Finance and Management, Results-Based Climate Finance in Practice: Delivering Climate Finance for Low-Carbon Development, (2017).
250 Besides multiple results of interest, there can be multiple sources of finance supporting the same mitigation activity. In the latter case, attribution of outcomes to financing sources might add the technical complexity of climate finance reporting, depending on the standards used. From a market-building perspective and transitioning to market solutions following the principles listed in Box 4, there is a rationale for full attribution of climate outcomes to results-based payments or climate market mechanisms.
74

3.2.4RBCF and resource mobilization
While relatively new, RBCF has demonstrated that it is an effective tool for incentivizing and mobilizing private sector finance and delivering market change. Hints of the potential power of RBCF approaches can be seen from the impacts of the CDM, which effected substantial market change, and mobilized significant amounts of emission reduction and investment,251 before the fall in CER prices resulted in a sharp decrease in new project activities. While the CDM was a market mechanism, it provides a number of lessons that are relevant for RBCF, particularly as it credited verified outcomes in a manner similar to some forms of RBCF.
Over the course of the first commitment period of the Kyoto Protocol between 2008–2012, the CDM credited almost 1.5 GtCO2e of emission reductions—equivalent to reducing global GHG emissions by about 0.7 percent over the period, or 1.1 percent of emissions from non-Annex 1 countries.252 Figure 14 shows that these emission reductions were concentrated in a small number of countries, where the proportionate impact on domestic emissions typically exceeded 1.5 percent of national emissions. This included China, India, Republic of Korea, Brazil and Chile.
251 Source: CDM Policy Dialogue, Climate Change, Carbon Markets and the CDM: A Call to Action. Report of the High-level Panel on the CDM Policy Dialogue, (2012) https://doi.org/10.1097/DCC.0000000000000020; Fenhann, “CDM pipeline overview”, (2017).
252 Authors’ calculation using data from Source: Fenhann, “CDM pipeline overview”, (2017) Retrieved April 29, 2017, from http://www.cdmpipeline.org/publications/CDMPipeline.xlsm; World Resources Institute, “CAIT Climate Data Explorer”, (2017) Retrieved June 12, 2017, from http://cait.wri.org.
Figure 14 / Absolute and relative crediting of CERs in the first commitment period of the Kyoto Protocol (CP1)
Chin
a
Sout
h Af
rica
Egyp
t
Viet
nam
Indo
nesi
a
Arge
ntin
a
Chile
Mex
ico
Braz
il
Repu
blic
of K
orea
Indi
a
CP1
cred
its a
s pr
opor
tion
of e
mis
sion
s5%
4%
3%
2%
1%
0%
Mill
ion
CERs
cre
dite
d in
CP1
1,000
600
400
800
200
0
CP1 CER as a proportion of total emissions
CP1 CERs Note: Emissions exclude land use, land-use change and forestry (LULUCF)Source: UNEP DTU CDM pipeline and WRI CAIT Climate Data Explorer (excluding LULUCF)
753 / Climate finance and climate markets: toward an integrated approach

This suggests that there may have been certain countries in which the CDM was able to reach a tipping point, where the price signal helped cultivate a critical mass of project developers, verifiers and financiers required for the market to reach a minimum scale. Notably, in three countries—the Republic of Korea, China, and Chile—plans for developing a domestic carbon price have been executed, while Brazil is also actively exploring carbon pricing policies. This is consistent with evidence that shows that in the countries where the CDM was successful, some of its most important benefits were the engagement of the local private sector in climate change mitigation and laying the foundation for domestic climate change policy.253
The observation that mitigation in the range of 1.5 percent of a country’s total GHG emissions is potentially associated with developing interests and capacities around which greater climate action can coalesce is a potentially helpful, albeit imprecise metric. An ambitious approach to RBCF may seek to mitigate the equivalent of 1.5 percent of developing country emissions to support mitigation projects and movement to greater use of climate markets. Assuming that this could be delivered at a similar cost to that of the first commitment period of the Kyoto Protocol, this would imply that RBCF financing of around US$2.6 billion per year would be necessary.254
Mobilizing resources on this scale is ambitious and represents a substantial challenge in the current global context. However, this scale need not be reached immediately. Initial focus could be on deploying a range of pilot RBCF initiatives—most likely packaged within broader interventions to
overcome upfront capital constraints. This can allow testing of different designs and build an understanding of which RBCF approaches work best in different contexts. Within the context of subsidiarity, targeting these pilots could take into account a range of factors including:
− Mitigation potential, with preference for RBCF to support sources of mitigation with a higher potential to deliver significant levels of emission reductions.
− Private sector support, targeting sources and sectors with a greater willingness or capability to respond to results-based incentives.
− Ease of expansion, with preference for approaches that are scalable in other sectors or regions.
− Variety and novelty, to support a portfolio of project-, policy- and sector-based approaches to maximize the knowledge gained from policy experimentation.
These factors seek to maximize the reach, variety and growth of RBCF mechanisms, and thereby effectively support the transition to a greater use of climate markets in line with the facilitative roles of RBCF discussed above.
There is precedent to move towards this goal. Annual RBCF disbursements are already forecast to reach almost US$500 million in 2018—around 20 percent of this indicative goal. At the same time the projected rapid decline in RBCF disbursements beyond 2020 due to exhaustion of existing capitalization of RBCF facilities, as shown in Figure 15 below, would need to be reversed.
253 Source: Spalding-Fecher et al., Assessing the impact of the Clean Development Mechanism, (2012).254 For much of the first commitment period, the price of CERs ranged from US$1-20/tCO2e; for the purposes of this calculation, US$10/tCO2e was adopted as
a reasonable, representative price. Developing countries are defined as non-OECD countries excluding China.
76

3.3 Illustration - An integrated approach to accelerating the transition to clean energy
This section draws together the concepts discussed in Sections 3.1 and 3.2 to illustrate how domestic policies, regional and international market mechanisms, and climate finance can be integrated to mobilize resources to accelerate a transition to clean energy, in particular to reduce coal-fired power generation.256 The energy sector, and coal-fired power generation in particular, is one of the
largest sources of GHG emissions, at a global level and for many countries including middle-income countries. Notwithstanding recent progress and future ambitions, total coal-fired power capacity is increasing globally, driven especially by countries in East and South Asia. To meet the Paris Agreement’s long-term objectives, and countries’ first NDCs, rapid improvements in energy efficiency and decarbonization of the energy supply will be critical. Figure 16 illustrates the policies that can be used to deliver low-carbon investments, using the framework developed in Figure 12. Each aspect is discussed below, with a particular focus on the role of international climate markets and climate finance.
255 World Bank & Frankfurt School of Finance and Management, Results-Based Climate Finance in Practice: Delivering Climate Finance for Low-Carbon Development, 2017.256 This section focuses on reducing coal consumption in power generation. Reducing coal consumption in the industrial sector is equally important but is
outside the scope of this chapter.
Figure 15 / Estimated disbursements from the 12 largest RBCF funds
2010 2015 2020 2025 2030
Annu
al d
isbu
rsem
ents
(US$
mill
ion)
600
400
300
500
200
100
0
Others Energy sector Forestry and land-use sector Source: World Bank & Frankfurt School of Finance and Management255
773 / Climate finance and climate markets: toward an integrated approach

Domestic policy environment
The first step for reducing coal-fired power generation is an effective domestic policy mix that addresses barriers to low-carbon investment and provides the incentives needed to drive resource deployment. Subsidies for fossil fuels reached US$493 billion in 2014, US$117 billion of which subsidized electricity consumption.257 A number of rapidly growing developing countries in Asia, including India, Malaysia and Indonesia, have recently reduced fossil fuel subsidies. Eliminating remaining subsidies would alter the competitiveness of generation technologies by placing low-carbon technologies on a more even
playing field and reducing the overconsumption of carbon-intensive fuels. It would also free up financial resources that can be reallocated to low-carbon investments.
A range of other policy mechanisms, such as feed-in tariffs and renewable energy standards, can be used to support renewable power generation. These policy mechanisms have been used around the world to increase the relative competitiveness of renewable generation compared with fossil fuels; feed-in tariffs operate in many countries including China, Ecuador, India, Indonesia, Nigeria, Malaysia, Uganda, Thailand and Vietnam.258 As markets mature, subsidiarity suggests that this should be accompanied by a
257 Source: IEA, “Fossil Fuel Subsidy Database”, World Energy Outlook 2015, (2015) Retrieved October 8, 2017, from http://www.worldenergyoutlook.org/resources/energysubsidies/fossilfuelsubsidydatabase/.
258 Source: IEA & IRENA, “Global Renewable Energy Policies and Measures Database”, (2017) Retrieved October 9, 2017, from https://www.iea.org/policiesandmeasures/renewableenergy/.
Figure 16 / A policy mix consistent with the reduction of coal-fired power generation
Note: Domestic policies include policies specific to the energy sector (discussed below), as well as broader policies including market-based reforms and support for technology research, development and deployment (RD&D)
Reduction of coal-fired power
production
DOMESTIC CARBON PRICE – Energy sector carbon tax or emissions trading
REGIONAL MARKET MECHANISMS– Policy, sectoral
and/or project crediting
– Emergence of regional emissions
trading
CLIMATE FINANCE– RBCF
– Risk sharing
– Concessional finance
– Technical and analytical support
DOMESTIC POLICIES – Phase-out of fossil fuel subsidies
– Energy efficiency and renewable energy support
– Generator minimum standards
– Power sector and financial market reforms
– Technology RD&D
78

transition to instruments that require greater levels of market discipline, such as tradable renewable energy certificates. This transition needs to be carefully managed, as firms benefitting from subsidies may seek to delay movement to systems that impose more market discipline.
In the short term, direct regulation through pollution standards can also be used to prohibit the construction of emission-intensive coal-fired generation and reduce the use of the existing coal-fired power plants. Complementary energy efficiency measures such as standards and labeling can reduce the need for new electricity generation capacity. Addressing non-price barriers to negative- and low cost emission reductions opportunities through energy efficiency can help mobilize this investment and improve the effectiveness of other policies.
As discussed in the 2016 edition of the State and Trends of Carbon Pricing, policies that change the competitiveness of generation technologies, including carbon markets, are more effective when operating within a supportive market structure. Adding a carbon price or other incentive for renewable electricity generation should further increase the competitiveness of dispatchable renewables relative to thermal plants. However, in uncompetitive markets there may be less pressure to reflect relative differences in competitiveness in dispatch decisions. For countries that meet the enabling conditions for introducing a competitive power market, including adequate system size, a sufficiently competitive market structure, and a financially creditworthy distribution sector, carbon pricing and other domestic policy instruments may become more effective. At the same time, energy systems operate in a broader social and economic context, which means they are not perfectly responsive to financial incentives. In particular, there may be concerns regarding the local economic impacts from energy systems changes. Pairing reforms with interventions to manage the distributional and social effects of economic change, particularly in coal-dependent regions, is important for managing these changes and ensuring the sustainability of reforms.
Domestic carbon pricing
In addition to getting the broad policy mix right, adjusting the price of GHG emissions associated with coal-fired power generation is necessary to change the incentives facing investors and increase the competitiveness of cleaner sources of energy. Applying a carbon tax or ETS to the power sector would go a long way to encouraging a shift away from investments in coal-fired power generation to less polluting alternatives, while also reducing the emission intensity of residual coal use by shifting generation to more efficient existing producers.
Domestic carbon pricing may occur in different jurisdictions and sectors at different times, and there is likely to be a degree of variance in the progress that countries make toward introducing carbon pricing by 2030. Nonetheless, the introduction of national ETSs in China (planned) and the Republic of Korea, South Africa’s planned carbon tax, and the Pacific Alliance collaboration on carbon pricing in Latin America suggest that further expansion of carbon pricing in low- and middle-income countries is realistic under a more ambitious climate policy regime. Carbon pricing could also be implemented by introducing, strengthening, adjusting or expanding the use of existing taxes on inputs—for instance, India’s Clean Environment Cess (tax), which imposes a tax on the use of coal, lignite and peat. Utilizing existing policies in such a manner can be a way of transitioning to carbon pricing in situations where immediate movement to explicit pricing may be challenging.259
Climate finance
Many countries may not yet be in a position to introduce market mechanisms, either because of the complexity of market design and limited firm capacity and/or because of an unfavorable political economy context. There is therefore an important role for climate finance, both to mobilize investment and to lay the groundwork to support climate markets. In line with the discussion in Section 3.2, RBCF is a type of climate finance that can play an increasingly prominent role in accelerating the transition to clean energy. Box 7 discusses this role in more detail.
259 Further discussion on alignment of energy and carbon policies can be found in Source: OECD, Aligning Policies for a Low-carbon Economy, Aligning Policies for a Low-Carbon Economy, (2015) https://doi.org/10.1787/9789264233294-en.
793 / Climate finance and climate markets: toward an integrated approach

Beyond RBCF, climate finance delivered through risk reduction and risk-sharing instruments may be used where barriers to finance stifle investments. These instruments can help to reduce the cost of capital associated with investments and make them more appealing to commercial financiers. They can also
open new sources of commercial climate finance by supporting the introduction of new products and increasing the capacity of local financiers. For instance, using a risk-sharing mechanism, the IFC has partnered with the Bank of the Philippine Islands to introduce a sustainable energy financing program
260 Source: Wooders et al., Supporting Energy Pricing Reform and Carbon Pricing Policies Through Crediting (May), (2016).
Box 7 / RBCF to support the development of regional climate markets
The flexibility of RBCF means that it can adapt to local circumstances and play a powerful role in developing regional climate markets. Given this flexibility, there are a wide range of options available to support the transition away from coal and the development of climate markets.
Domestic resources might be used to develop an RBCF mechanism as part of an integrated policy approach to support the deployment of renewable electricity generation, thereby reducing demand for coal (other things being equal). RBCF could be used to pay for the delivery of power from renewable sources to the grid, thereby providing a flow of revenue to cover the cost of financing and future investments. As the market matures and expands, the need for concessional finance and RBCF will decline. These mechanisms may be replaced by climate markets, which could take the form of carbon markets or tradable renewable energy certificates that are tied to portfolio standards for renewable electricity generation. Applying the elements of an integrated approach might see direct concessional finance supporting investments in electricity networks, which is needed to support distributed renewable generation.
At the same time, international resources might be used to develop an RBCF mechanism focused on policy crediting—the crediting of the emission reductions resulting from the implementation of a policy action or components of it—as a stepping stone to regional carbon markets.260 For instance, RBCF might provide financial incentives to support energy market reform as a first step to building the capacity of firms to operate in climate markets. The movement from regulated energy prices to energy prices determined by market forces would enable the incentives from climate markets to flow through the economy, helping to identify low-cost mitigation options and improving overall efficiency. This could simplify the transition to domestic carbon markets by developing firm capacity and an ecosystem of firms supporting them. Simultaneously, RBCF could alert policymakers to the idea that policy action that supports emission reductions could be driven by international incentives and be subjected to independent verification of the resulting emission reductions. This could facilitate trade in mitigation outcomes delivered by domestic policy action. In this case, RBCF could be provided alongside technical assistance to support the development of market infrastructure such as registries and formalized accounting, which are needed to track the trade and use of mitigation outcomes.
One modality for delivering RBCF could be TCAF. TCAF aims to help developing countries cut emissions by creating new classes of carbon assets associated with emission reductions, including those achieved through policy actions. Over time, these assets could be credited as mitigation outcomes with potential to be transferred internationally.
80
in the Philippines. To date, this partnership has supported a loan portfolio of over US$700 million and has helped to mainstream finance for energy efficiency and renewable energy projects in the market.261
Concessional finance to cover up-front investment costs may also be appropriate. In India, for example, evidence suggests that policies to lower financing costs, such as concessional long-term debt, can be more cost-effective than other approaches due to the high capital intensity of these projects.262 In many cases, in line with subsidiarity, this support might be temporary as capital market sophistication and knowledge of low-carbon technologies grow. In other cases, market-based mechanisms may be less effective and there may be a longer-term need for concessional finance. One such area may be investments in electricity networks, which may be needed to unlock geographically dispersed renewable energy resources.
Concessional finance can also be used to subsidize the cost of mitigation by supporting technological developments that have high mitigation potential but remain expensive or difficult to finance or implement without new disruptive business models. For example, international climate finance is likely to be needed to ensure that in the period beyond 2030, CCS is available for use. Finally, direct provision of finance can help deliver vital enabling factors for mitigation that improve decision-making, for example, by supporting the public provision of GHG statistics at a disaggregated level.
Regional market mechanisms
While climate finance has a role to play, over time, the transition to international climate markets can play a crucial role in accelerating the reduction of coal-fired power generation. This development will likely occur over several stages. At present, there are no international markets generating significant flows of finance to support mitigation in developing countries. However, there are a number of climate markets developing, such as India’s
Perform Achieve Trade scheme to support energy efficiency. One pathway to the development of regional climate markets might see such initiatives adopt an increasingly regional focus. This would help to respond to the concern that the scope of these initiatives needs to increase to ensure a competitive market for price discovery and trading.263 Over time, the current focus of these initiatives on energy efficiency measures might broaden to a wider range of emission reduction opportunities. At the same time, policy crediting, as described in Box 7, can help both build international relationships and create a more conducive business environment in which climate markets can thrive. Benefits from project and policy crediting could begin to be felt in the near term, with the development of CORSIA creating potential new opportunities for investors in mitigation projects.
The movement towards interlinked markets brings significant benefits, but can also bring costs. These can relate to greater exposure to external economic and policy shocks, and uneven distribution of costs and benefits within an economy. Domestic mitigation action may also be desired for its economic as well as its climate impacts, which may be reflected in a preference for greater domestic policy efforts. These potential costs and benefits underline the need for governance of international climate markets that both ensures their credibility, and provides appropriate flexibility to enable jurisdictions to respond to their specific domestic circumstances.
In summary, if the world is to achieve its objective of limiting warming to below 2°C, there is a clear need for international climate markets to support the energy transition. The recent expansion of carbon pricing in the Americas and moves toward its further use in Asia and beyond presents a significant opportunity for collaboration to develop climate markets in the long term to mobilize the investments required. In the short term, the effective utilization of climate finance, including significant expansion of RBCF, can be the first steps toward realizing this vision.
261 Source: IFC, Investing in Sustainable Energy to Meet Growing Energy Demand, (2016). 262 Source: Shrimali, Goel, Srinivasan, & Nelson, Solving India’s Renewable Energy Financing Challenge: Which Federal Policies can be Most Effective?, (2014).263 Source: TATA Strategic Management Group, “Energy Efficiency in India: PAT Scheme - The Way Ahead”, Energy Management and Excellence Summit, (2014).
Retrieved from http://www.tsmg.com/download/reports/EE_in_India_PAT_The_Way_Ahead.pdf.
813 / Climate finance and climate markets: toward an integrated approach

Currency conversion rates, as of August 1, 2017 Symbol US$ equivalent
Australian Dollar A$ 0.8011
British Pound £ 1.3213
Canadian Dollar CAN$ 0.7991
Chilean Peso CLP 0.0015
Chinese Yuan CNY 0.1488
Colombian Peso COP 0.0003
Danish Krona DKR 0.1588
Euro € 1.1812
Icelandic Krona ISK 0.0097
Japanese Yen JPY 0.0091
Kazakhstan Tenge KZT 0.0030
Korean Won KRW 0.0009
Mexican Peso MXN 0.0561
New Zealand Dollar NZD 0.7518
Norwegian Krone NOK 0.1265
Polish Zloty PLZ 0.2778
Singaporean Dollar S$ 1.0351
South African Rand R 0.0754
Swedish Krona SEK 0.1238
Swiss Franc CHF 1.0351
Ukrainian Hryvnia UAH 0.0387
Table 4 / Currency conversion rates, as of August 1, 2017264
Annex I Conversion rates
264 Source: IMF, Exchange Rate Archives by Month, accessed August 2, 2017, https://www.imf.org/external/np/fin/data/param_rms_mth.aspx.
82
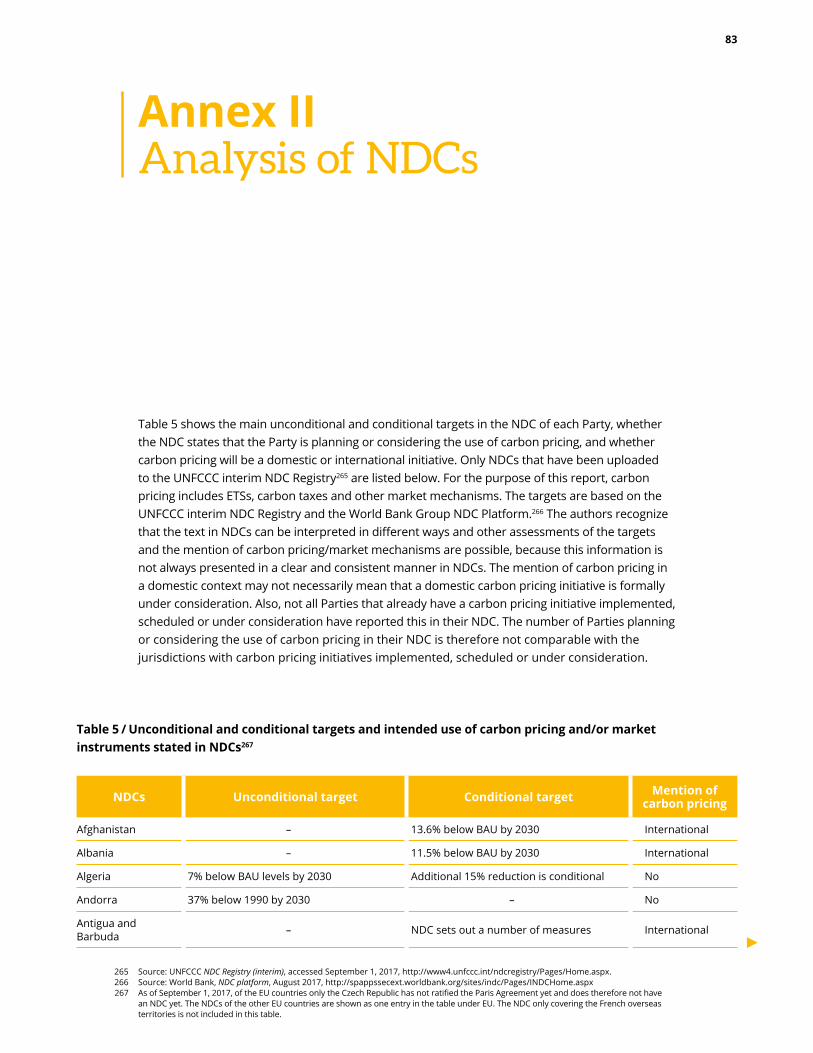
Table 5 / Unconditional and conditional targets and intended use of carbon pricing and/or market instruments stated in NDCs267
Table 5 shows the main unconditional and conditional targets in the NDC of each Party, whether the NDC states that the Party is planning or considering the use of carbon pricing, and whether carbon pricing will be a domestic or international initiative. Only NDCs that have been uploaded to the UNFCCC interim NDC Registry265 are listed below. For the purpose of this report, carbon pricing includes ETSs, carbon taxes and other market mechanisms. The targets are based on the UNFCCC interim NDC Registry and the World Bank Group NDC Platform.266 The authors recognize that the text in NDCs can be interpreted in different ways and other assessments of the targets and the mention of carbon pricing/market mechanisms are possible, because this information is not always presented in a clear and consistent manner in NDCs. The mention of carbon pricing in a domestic context may not necessarily mean that a domestic carbon pricing initiative is formally under consideration. Also, not all Parties that already have a carbon pricing initiative implemented, scheduled or under consideration have reported this in their NDC. The number of Parties planning or considering the use of carbon pricing in their NDC is therefore not comparable with the jurisdictions with carbon pricing initiatives implemented, scheduled or under consideration.
Annex II Analysis of NDCs
NDCs Unconditional target Conditional target Mention of carbon pricing
Afghanistan – 13.6% below BAU by 2030 International
Albania – 11.5% below BAU by 2030 International
Algeria 7% below BAU levels by 2030 Additional 15% reduction is conditional No
Andorra 37% below 1990 by 2030 – No
Antigua and Barbuda – NDC sets out a number of measures International
265 Source: UNFCCC NDC Registry (interim), accessed September 1, 2017, http://www4.unfccc.int/ndcregistry/Pages/Home.aspx.266 Source: World Bank, NDC platform, August 2017, http://spappssecext.worldbank.org/sites/indc/Pages/INDCHome.aspx 267 As of September 1, 2017, of the EU countries only the Czech Republic has not ratified the Paris Agreement yet and does therefore not have
an NDC yet. The NDCs of the other EU countries are shown as one entry in the table under EU. The NDC only covering the French overseas territories is not included in this table.
83

Argentina 18% below BAU levels by 2030 Additional 19% reduction is conditional International
Armenia –Ensure total emissions of Armenia do not exceed 663 MtCO2 and 189 tCO2 per person by 2030
International
Australia 26-28% below 2005 levels by 2030 – No
Azerbaijan 35% below 1990 levels by 2030 – No
Bahamas, The 30% compared to BAU levels – International
Bahrain NDC sets out a number of sectoral measures, without setting targets – No
Bangladesh 5% unconditional reduction below BAU by 2030 Additional 15% is conditional International
Barbados – 37% below BAU levels by 2025, and 44% below BAU levels by 2030 International
Belarus 28% below 1990 levels by 2030 – No
Belize NDC sets out a number of sectoral measures
NDC sets out a number of sectoral measures International
Bolivia NDC sets out development goals – No
Bosnia and Herzegowina
2% below BAU (corresponding to +18% over 1990 levels) unconditional target Additional 21% is conditional International
Botswana 15% reduction below 2010 levels by 2030 – International
Brazil 37% below 2005 by 2025, 43% by 2030 (indicative) – International
Burkina Faso Unconditional target of 6.6% below BAU by 2030 Additional 5% is conditional International
Cambodia – 27% below 2010 levels by 2030 International
Cameroon 32% below 2010 levels by 2035 – International
Canada 30% below 2005 levels by 2030 none International and domestic
Central African Republic 5% below BAU by 2030 – International
Chad Unconditional target of 18.2% below 2010 levels Additional 52.8% is conditional International
Chile 30% unconditional emission intensity reduction by 2030 Additional 35-45% is conditional International
China 60-65% carbon intensity reduction by 2030 – Domestic
Comores 84% below BAU by 2030 – No
Congo, Rep. – 48% below BAU levels by 2025, 55% by 2030 No
Cook IslandsUnconditional target of 38% below 2006 levels by 2020 in the electricity generation sector
Conditional 81% reduction below 2006 by 2030 in the electricity generation sector
No
Costa Rica
44% reduction compared to BAU levels by 2030, and a 25% reduction compared to 2012 levels. Costa Rica is committed to becoming a carbon neutral country by 2021.
– International and domestic
NDCs Unconditional target Conditional target Mention of carbon pricing
84

Côte d’Ivoire 28% below BAU by 2030 – International
Cuba NDC sets out a number of sectoral actions – No
Djibouti 40% below 2010 levels by 2030 Additional 20% is conditional No
Dominica – 39.2% below BAU levels by 2025, and 44.7% below BAU levels by 2030 International
Egypt, Arab Rep. – NDC sets out a number of sectoral measures
International and domestic
El Salvador – NDC sets out a number of sectoral measures No
Ethiopia – 64% by 2030 compared to BAU projections International
European Union 40% below 1990 levels by 2030 – No
Fiji Reduction of emissions from the energy sector by 30% below BAU by 2030 – International
Gabon At least 50% by 2025 compared to reference scenario – Domestic
Gambia, The 44.4% in 2025 and 45.4% in 2030-both below 2010 levels – International
Georgia 15% unconditional emissions reduction below BAU by 2030 Additional 10% is conditional No
Ghana 15% unconditional reduction below BAU by 2030 Additional 30% is conditional International
Grenada – 30% reduction by 2025, with an indicative reduction of 40% by 2030 International
Guatemala 11.2% unconditional below BAU by 2030 Additional 11.4% is conditional International
Guinea – 13% reduction below BAU by 2030 International
Guyana 52 MtCO2e reduction by 2025 – International
Haiti Unconditional target of 5% below BAU levels by 2030 Additional 21% is conditional International
Honduras 15% below BAU by 2030 – No
Iceland 40% below 1990 levels by 2030 – Domestic
India 33 to 35% carbon intensity reduction over 2005 levels by 2030 – International
Indonesia 29% below BAU by 2030 Additional 12% is conditional International
Israel 26% below 2005 levels by 2030 – No
Jamaica 7.8% unconditional reduction below BAU by 2030 Additional 2.2% is conditional No
Japan 26% by 2030 (equivalent to 25.4% reduction compared to 2005) – International
Jordan 1.5% below BAU by 2030 Additional 12.5% is conditional International
Kazakhstan Conditional target of a 15% reduction below 1990 levels by 2030 Additional 10% is conditional International
Kenya – 30% below BAU by 2030 International
Kiribati 12.8% by 2030 below BAU Additional 49% is conditional International
NDCs Unconditional target Conditional target Mention of carbon pricing
85Annex II / Analysis of NDCs

Korea, Dem. People's Rep.
Unconditional 8% reduction below BAU by 2030 Additional 32.25% is conditional No
Korea, Rep. 37% below BAU by 2030 – International and domestic
Lao PDR NDC sets out a number of sectoral measures – International
Lesotho Unconditional target of 10% compared to BAU levels by 2030 Additional 25% is conditional International
Madagascar – 14% below BAU by 2030 reduction is conditional No
Malawi NDC sets out a number of sectoral measures
NDC sets out a number of sectoral measures No
Malaysia Reduce GDP emission intensity by 35% by 2030 compared to 2005 levels Additional 10% is conditional No
Maldives Unconditional target of 10% below BAU by 2030 Additional 14% is conditional No
Mali –29% reduction below BAU for agriculture, 31% for energy and 21% for forests and changes in land use
International
Marshall Islands32% reduction by 2025 below 2010 levels. It also has an indicative target of 45% by 2030
– No
Mauritania 22.3% below BAU by 2030 Additional 65.7% is conditional No
Mauritius – 30% below BAU by 2030 No
Mexico 25% below BAU by 2030 (22% of GHG and a reduction of 51% of black carbon)
Additional 15% is subject to a global agreement addressing important topics such as carbon pricing, technical cooperation and access to financial resources and technology
International
Micronesia,Fed. Sts
Unconditional reduction of 28% below 2000 levels by 2025 Additional 7% is conditional No
Moldova 64-67% reduction below 1990 levels by 2030 Additional 11-14% is conditional International
Monaco 50% below 1990 levels by 2030 – International
Mongolia – 14% below BAU by 2030 International
Morocco
17 % reduction by 2030 compared to BAU, with 4% coming from AFOLU actions. Without AFOLU actions, the reduction target is 13%
Additional 25% reduction (21% without AFOLU) is conditional International
Namibia 79% reduction compared to BAU levels by 2030 Additional 10% is conditional International
Nauru NDC sets out a number of measures in the energy sector – No
Nepal – NDC sets out sectoral targets International
New Zealand 30% below 2005 levels by 2030 – International
NigerUnconditional target of 2.5% below 2020 BAU levels by 2020 and 3.5% below 2030 levels by 2030
Additional 22.5 by 2020 and 31.1% by 2030 is conditional International
NDCs Unconditional target Conditional target Mention of carbon pricing
86

Nigeria 20% unconditional reduction below BAU by 2030 Additional 25% is conditional International
Niue NDC sets out a number of measures in the energy sector – No
Norway At least 40% below 1990 levels by 2030 – Domestic
Pakistan NDC does not set out any specific target – No
Palau 22% energy sector emissions reductions below 2005 levels by 2025 – No
Panama 10% increase of absorption capacity of forests by 2050 compared to 2015
Additional 70% absorption capacity is conditional
International and domestic
Papua New Guinea Carbon neutrality by 2030 – No
Paraguay 10% unconditional reduction below BAU by 2030 Additional 10% is conditional International
Peru Unconditional target of 20% below BAU by 2030 Additional 10% is conditional International
Qatar NDC sets out a number of sectoral measures, without setting targets – No
Rwanda Estimation of emissions reduction is underway – International
SamoaCommitted to 100% renewable energy generation by 2017 and maintaining this to 2025.
Economy-wide emission reduction target with international assistance International
São Tomé and Príncipe – 24% reduction below 2005 levels
by 2030 International
Saudi ArabiaNDC seeks to achieve mitigation ambitions of up to 130 million tons of CO2e avoided by 2030 annually
– No
Serbia 9.8% below 1990 levels by 2030 – No
Seychelles – 21.4% in 2025 and 29% in 2030 below BAU No
Sierra Leone – Emissions will not exceed 7.58 MtCO2e in 2035 and carbon neutrality by 2050 International
Singapore 36% carbon intensity reduction by 2030 – International
Solomon IslandsUnconditional targets of 12% below 2015 levels by 2025 and 30% below 2015 levels by 2030
Additional 15% by 2030 is conditional International
Somalia NDC sets out a number of sectoral measures – No
South Africa
SA’s emissions will peak between 2020 and 2025, plateau for approximately adecade and decline in absolute terms thereafter
_ Domestic
Sri Lanka4% unconditional reduction below BAU in energy sector, 3% unconditional reduction in other sectors
Additional 16% conditional reductions in energy sector and 7% conditional in other sectors
No
St. Kitts and Nevis – 35% GHG reduction below BAU by 2030 International
NDCs Unconditional target Conditional target Mention of carbon pricing
87Annex II / Analysis of NDCs
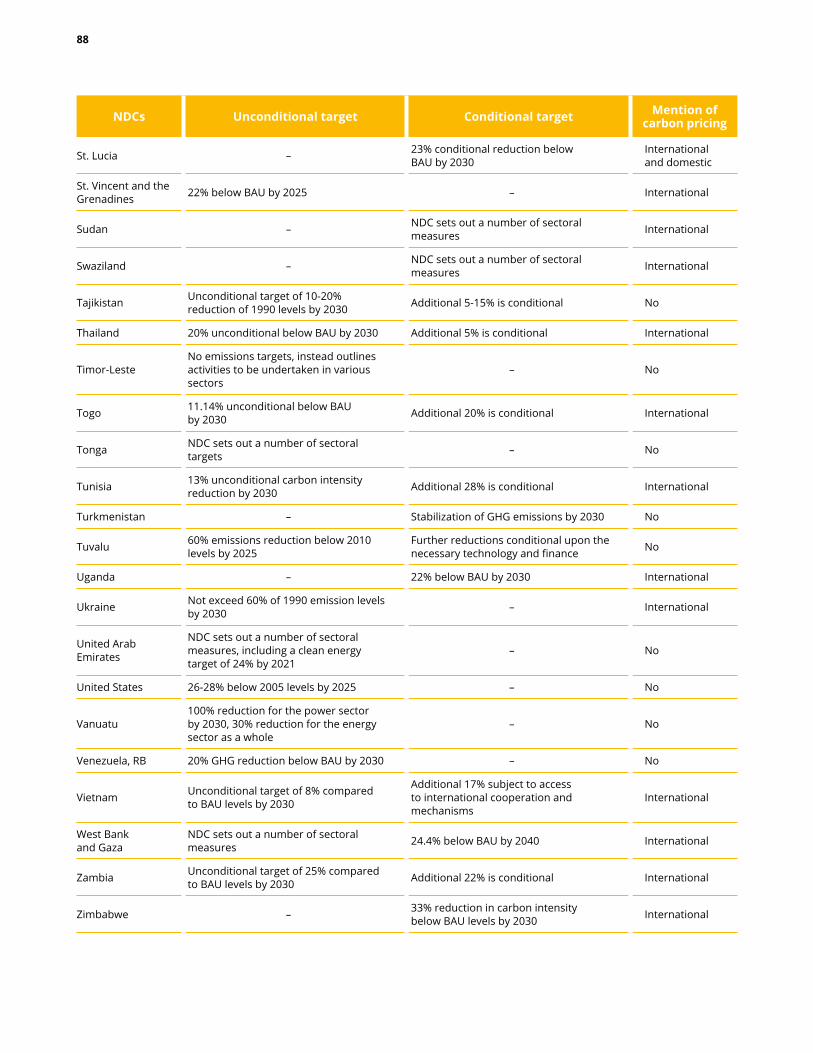
St. Lucia – 23% conditional reduction below BAU by 2030
International and domestic
St. Vincent and the Grenadines 22% below BAU by 2025 – International
Sudan – NDC sets out a number of sectoral measures International
Swaziland – NDC sets out a number of sectoral measures International
Tajikistan Unconditional target of 10-20% reduction of 1990 levels by 2030 Additional 5-15% is conditional No
Thailand 20% unconditional below BAU by 2030 Additional 5% is conditional International
Timor-LesteNo emissions targets, instead outlines activities to be undertaken in various sectors
– No
Togo 11.14% unconditional below BAU by 2030 Additional 20% is conditional International
Tonga NDC sets out a number of sectoral targets – No
Tunisia 13% unconditional carbon intensity reduction by 2030 Additional 28% is conditional International
Turkmenistan – Stabilization of GHG emissions by 2030 No
Tuvalu 60% emissions reduction below 2010 levels by 2025
Further reductions conditional upon the necessary technology and finance No
Uganda – 22% below BAU by 2030 International
Ukraine Not exceed 60% of 1990 emission levels by 2030 – International
United Arab Emirates
NDC sets out a number of sectoral measures, including a clean energy target of 24% by 2021
– No
United States 26-28% below 2005 levels by 2025 – No
Vanuatu100% reduction for the power sector by 2030, 30% reduction for the energy sector as a whole
– No
Venezuela, RB 20% GHG reduction below BAU by 2030 – No
Vietnam Unconditional target of 8% compared to BAU levels by 2030
Additional 17% subject to access to international cooperation and mechanisms
International
West Bank and Gaza
NDC sets out a number of sectoral measures 24.4% below BAU by 2040 International
Zambia Unconditional target of 25% compared to BAU levels by 2030 Additional 22% is conditional International
Zimbabwe – 33% reduction in carbon intensity below BAU levels by 2030 International
NDCs Unconditional target Conditional target Mention of carbon pricing
88

Annex III Summary of Parties’ views on the operationalization of Articles 6.2 and 6.4 of the Paris Agreement
Table 6 shows a summary of the UNFCCC Parties’ views where there is a general consensus or divergence on the operationalization of Articles 6.2 and 6.4 of the Paris Agreement. The summary is based on the authors’ interpretation of the SBSTA 46 submissions by the Parties and the authors recognize that different interpretations are possible. Note that consensus on a topic does not necessarily mean that all Parties have agreed, as Parties can change their views throughout the negotiations of the guidelines to operationalize Articles 6.2 and 6.4. The topics are listed in order of frequency of mention, with the topics listed first mentioned in most of the submissions and the bottom ones in about three quarter of the submissions.
Topic Article Consensus/divergence
Robust accounting (avoidance of double counting, registries)
6.2
− Common accounting standards and transaction procedures. − National and/or international registries. − Importance of quantifying Internationally Transferred Mitigation Outcomes (ITMOs) (several
submissions specify the use of a tCO2e as the standard unit). − Permitting secondary trading of ITMOs.
6.4
− Same as 6.2. − Rules for making corresponding adjustments. Some countries only mentioned procedures to ensure
the selling party properly debits its emissions credits when transferring to the acquiring party to avoid double counting. Other countries suggested a mandatory or voluntary system of automatically canceling a portion of emissions credits when transferring from one party to another, to further promote ambition.
Ensure environmental integrity
6.2 − Preserving environmental integrity. − Common procedures for corresponding adjustments and dealing with different NDC types.
6.4 − Same as 6.2.
Use of ITMOs 6.2
− Need to restrict ITMO use to ensure countries primarily rely on domestic mitigation measures. However, there is no specific agreed upon quantitative or percentage cap.
− Prioritizing the definition of the scope of 6.2 and ITMOs, as there is currently substantial uncertainty. − Bottom-up flexibility to accommodate different approaches and facilitate the participation of as many
countries as possible. − Eligibility criteria for countries to participate in an ITMO market. Some submissions stated that all
parties to the Paris Agreement and all NDC types should be eligible. Others suggested additional eligibility criteria, for instance, that parties have established national registries and national accrediting institutions for activities of cooperative approaches, or that they have established a domestic accounting system.
Table 6 / Summary of Parties‘ views on the operationalization of Articles 6.2 and 6.4 of the Paris Agreement
89
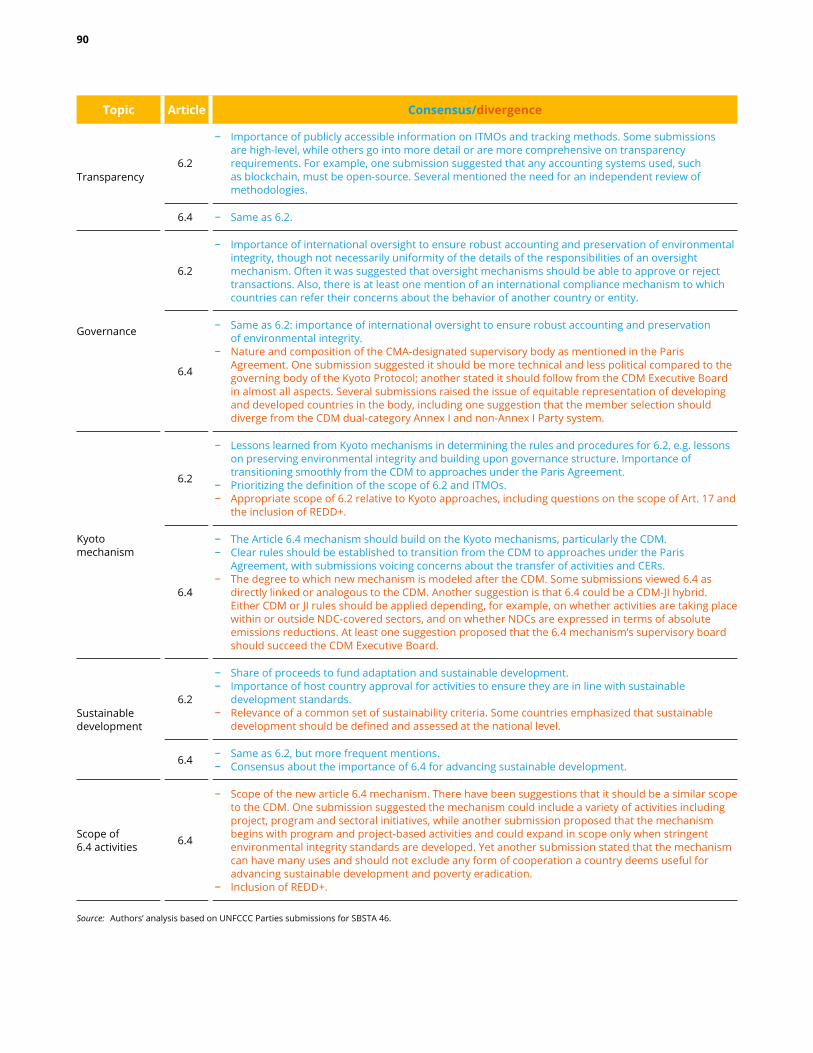
Transparency6.2
− Importance of publicly accessible information on ITMOs and tracking methods. Some submissions are high-level, while others go into more detail or are more comprehensive on transparency requirements. For example, one submission suggested that any accounting systems used, such as blockchain, must be open-source. Several mentioned the need for an independent review of methodologies.
6.4 − Same as 6.2.
Governance
6.2
− Importance of international oversight to ensure robust accounting and preservation of environmental integrity, though not necessarily uniformity of the details of the responsibilities of an oversight mechanism. Often it was suggested that oversight mechanisms should be able to approve or reject transactions. Also, there is at least one mention of an international compliance mechanism to which countries can refer their concerns about the behavior of another country or entity.
6.4
− Same as 6.2: importance of international oversight to ensure robust accounting and preservation of environmental integrity.
− Nature and composition of the CMA-designated supervisory body as mentioned in the Paris Agreement. One submission suggested it should be more technical and less political compared to the governing body of the Kyoto Protocol; another stated it should follow from the CDM Executive Board in almost all aspects. Several submissions raised the issue of equitable representation of developing and developed countries in the body, including one suggestion that the member selection should diverge from the CDM dual-category Annex I and non-Annex I Party system.
Kyoto mechanism
6.2
− Lessons learned from Kyoto mechanisms in determining the rules and procedures for 6.2, e.g. lessons on preserving environmental integrity and building upon governance structure. Importance of transitioning smoothly from the CDM to approaches under the Paris Agreement.
− Prioritizing the definition of the scope of 6.2 and ITMOs. − Appropriate scope of 6.2 relative to Kyoto approaches, including questions on the scope of Art. 17 and
the inclusion of REDD+.
6.4
− The Article 6.4 mechanism should build on the Kyoto mechanisms, particularly the CDM. − Clear rules should be established to transition from the CDM to approaches under the Paris
Agreement, with submissions voicing concerns about the transfer of activities and CERs. − The degree to which new mechanism is modeled after the CDM. Some submissions viewed 6.4 as
directly linked or analogous to the CDM. Another suggestion is that 6.4 could be a CDM-JI hybrid. Either CDM or JI rules should be applied depending, for example, on whether activities are taking place within or outside NDC-covered sectors, and on whether NDCs are expressed in terms of absolute emissions reductions. At least one suggestion proposed that the 6.4 mechanism’s supervisory board should succeed the CDM Executive Board.
Sustainable development
6.2
− Share of proceeds to fund adaptation and sustainable development. − Importance of host country approval for activities to ensure they are in line with sustainable
development standards. − Relevance of a common set of sustainability criteria. Some countries emphasized that sustainable
development should be defined and assessed at the national level.
6.4 − Same as 6.2, but more frequent mentions. − Consensus about the importance of 6.4 for advancing sustainable development.
Scope of 6.4 activities 6.4
− Scope of the new article 6.4 mechanism. There have been suggestions that it should be a similar scope to the CDM. One submission suggested the mechanism could include a variety of activities including project, program and sectoral initiatives, while another submission proposed that the mechanism begins with program and project-based activities and could expand in scope only when stringent environmental integrity standards are developed. Yet another submission stated that the mechanism can have many uses and should not exclude any form of cooperation a country deems useful for advancing sustainable development and poverty eradication.
− Inclusion of REDD+.
Topic Article Consensus/divergence
Source: Authors’ analysis based on UNFCCC Parties submissions for SBSTA 46.
90

Annex IV Cost and investment concepts
Concepts
This section explains three key concepts regarding the flows of finance required to support the transition to low-carbon economies, and the costs of climate impacts:
− Incremental investment required: the additional capital expenditure required in the transition to a low-carbon economy compared to the investment needed in a higher-carbon, business-as-usual scenario. For example, this measure balances the additional upfront costs of building new renewable generation assets in a low-carbon economy, against the reduction in investment associated with fossil fuel exploration and production. Most of these estimates focus on the energy sector.
− Gross investment required: the total capital expenditure that needs to be mobilized within key sectors in the transition to a low carbon economy. This includes investments in mitigation activities, technologies and assets, for example, the upfront cost of building new renewable generation assets. Most of these estimates also focus on the energy sector.
− The economic costs of climate change impacts: a measure of the impacts of climate change on global welfare over time. In practice, this is assessed as the expected change in the value of traded goods and services resulting from climate change, and may also include some consideration of society’s valuation of non-traded goods and services (such as direct impacts on the environment and human health) and how these are affected by climate change. This is typically expressed as the discounted value of future climate costs, or sometimes as a percentage of income or consumption in the year in which these costs arise.
Incremental investment required
A key measure of the resource mobilization challenge is the incremental investments required. This measure reveals the additional investments that need to be mobilized in the transition to a low-carbon economy, after reallocating capital that would otherwise be used for high-carbon investments, such as much fossil fuel extraction, which will no longer be required in a low-carbon world. It provides an indication of the scale of additional finance needed for investments only, it does not consider the societal benefits and costs of different investment mixes.
91

268 Prices updated to US$2015. Source: IEA & IRENA, Perspectives for the Energy Transition, Investment Needs for a Low-Carbon Energy System, (2017).269 Prices updated to US$2015. We include investment only in the energy, building and industrial and transport sectors. Source: World
Economic Forum, The Green Investment Report: The ways and means to unlock private finance for green growth, (2013).270 Prices updated to US$2015. Source: McCollum et al., “Energy Investments Under Climate Policy: a Comparison of Global Models”, Climate
Change Economics, 4(4), (2013) https://doi.org/10.1142/s2010007813400101.271 Source: Bhattacharya, Meltzer, Oppenheim, Qureshi, & Stern, Delivering on Sustainable Infrastructure for Better Development and Better
Climate, (2016); The Global Commission on the Economy and Climate, The Sustainable Infrastructure Imperative, (2016).272 The $3.3 trillion mean estimate is a simple average of the gross energy sector investment adjusted to US$2015, based on the following
studies, and taking a midpoint of the high and low cases for McCollum et al. These studies concern different timeframes and utilize different assumptions, so this represents an indicative estimate only. Source: IEA & IRENA, Perspectives for the Energy Transition, Investment Needs for a Low-Carbon Energy System, (2017); McCollum et al., “Energy Investments Under Climate Policy: a Comparison of Global Models”, Climate Change Economics, 4(4), (2013) https://doi.org/10.1142/s2010007813400101; World Economic Forum, The Green Investment Report: The ways and means to unlock private finance for green growth, (2013).
273 Source: IEA & IRENA, “Perspectives for the Energy Transition, Investment Needs for a Low-Carbon Energy System”, (2017).274 Source: Prices updated to US$2015. A midpoint of the high and low investment range is used as a central estimate for all regions.
Source: McCollum et al., “Energy Investments Under Climate Policy: a Comparison of Global Models”, Climate Change Economics, 4(4), (2013) https://doi.org/10.1142/s2010007813400101.
The IEA estimates that the incremental investment needs consistent with a 2°C trajectory in the energy sector reaches about US$670 billion per year between 2016 and 2050.268 This is heavily focused on demand-side technologies, with analysis suggesting that the annual incremental investment needs would ramp up steadily over the period. This is in line with the World Economic Forum’s estimate that annual incremental investment needs of about US$710 billion would be required over the period 2010–2030, of which half is estimated to be spent in the building and industrial sectors.269 Other estimates of incremental investments provide similar findings, for instance, McCollum et al. find that incremental investments of about US$590 billion per year is required over 2010–2050.270 Drawing on these studies suggests incremental investment needs of US$700 billion per year. As these studies concern different timeframes and utilize different assumptions, this represents an indicative estimate only.
In addition to the studies above, the Global Commission on the Economy and Environment report finds that moving from a business-as-usual scenario to a 2°C pathway would require increasing incremental investments across all infrastructure by about US$300 billion per year from 2015 to 2030. However, this also includes differences in adaptation costs between the 2°C pathway and the business-as-usual pathway, which are not captured in the other estimates above.271
Gross investment required
While significant, the incremental investments associated with the transition to a low-carbon energy system are modest compared to the total magnitude of energy sector investments. Gross investment reveals the total investment needed in key sectors in the transition to a low-carbon economy. The estimates below focus on the energy sector, broadly defined to include energy extraction, electricity generation, buildings, industry, and transport.
Gross investment of US$2.4–3.8 trillion per year by 2030 is likely to be required to finance the energy transition needed to limit global warming to less than 2°C, with a mean across different estimates of US$3.3 trillion.272 The IEA estimates that US$123 trillion in investments is needed between 2016 and 2050, of which more than half (US$65 trillion) will be used to reduce energy demand, with the remainder (US$57 trillion) used to change sources of energy supply.273 McCollum et al. (2013) disaggregate the required investments by region, and using the midpoint of their reported range suggest that about two-thirds of this investment is required in the developing world.274 China is due to be the largest destination for investment, requiring about US$480 billion per year, with India and Latin America requiring around US$310 billion and US$220 billion per year respectively.
92

275 Buchner et al., Global Landscape of Climate Finance 2015, (2015). Buchner et al., Global Landscape of Climate Finance 2015, (2015).276 The lower end of the range includes market impacts only, while the higher end includes non-market impacts. Source: N. Stern, The
Economics of Climate Change: The Stern Review, (2007).277 Source: Tol, “Correction and Update: The Economic Correction and Update: The Economic Effects of Climate Change”, The Journal of
Economic Perspectives, 28(2), (2014), 221–226. Studies reviewed span the period 1994–2013. These studies have a wide range of estimates, with some early studies showing net benefits from climate change, and one 2011 study suggests significantly higher costs, with a 3.2°C change in temperature linked to damages equivalent to 11.5 percent of GDP.
278 For instance, Dietz & Stern (2015) show that by adopting a probabilistic approach and applying a damage function similar to that of Weitzman (2012), such that it impacts productivity growth, climate change could result in a halving of per capita incomes compared with more standard models. Source: Wagner & Weitzman, Climate shock: the economic consequences of a hotter planet, (2016).
279 Temperature changes to 2100 across the sample countries range from 2.7 to 5.8°C. 280 Source: Burke, Hsiang, & Miguel, “Global non-linear effect of temperature on economic production”, Nature, 527, (2015), 235–250,
https://doi.org/10.1038/nature15725.
These significant gross investment needs outstrip current low-carbon investments. As of 2014, about US$361 billion was invested globally in mitigation activities across private and public sources—in comparison to the required US$2.4–3.8 trillion.275 However, some important gaps remain in the tracking of low-carbon mitigation investments, especially regarding investments in energy efficiency.
With incremental investments required on the order of US$700 billion by 2030, and gross investment required of US$3.3 trillion, much of the US$2.6 trillion planned annual investment would have to be reallocated from planned high-carbon investments to low-carbon alternatives to achieve the 2°C temperature target.
The economic cost of climate change impacts
Mobilizing these significant flows of funds is motivated by the large costs associated with unmitigated climate change. One of the most well-known estimates of the economic costs of climate change is presented in The Stern Review on the Economics of Climate Change.276 This states that the impact of unmitigated climate change, resulting in a temperature rise of 7.4°C, could be equivalent to a 5.3–11.3 percent reduction in GDP per capita by 2200. Costs from climate change are lower for lower temperature increases; a review of 18 studies suggests damages equivalent to 0–4.8 percent of GDP for temperature increases in the range of 2.5–3°C over different timeframes.277
The complexity of the impacts of climate change means that the models typically used to estimate the costs of climate change are substantially simplified. Recent studies indicate that taking into account a wider array of potential costs, such as the potential impact of climate change on economic growth, and deploying more sophisticated techniques to address uncertainty, generate much higher costs.278 An alternative approach to estimating costs, using statistical methods to estimate the costs associated with temperature changes in the past, suggests that compared with a world without climate change, a high-emission scenario could lead to global GDP being reduced by 23 percent by 2100.279
These global outcomes mask regional variations, with developing countries facing disproportionate costs from climate impacts. One study using worldwide data for 1950–2003 found that a 1°C increase in temperature in a given year was associated with a reduction of annual economic growth for lower-income countries of 1.3 percentage points; however, temperature shocks of this size had no discernible effect on growth in higher-income countries.280
93Annex IV / Cost and investment concepts

Glossary
Additionality A project activity is additional if anthropogenic GHG emissions are lower than those that would have occurred in the absence of the project activity.
Annex I (Parties) The industrialized countries listed in Annex I to the UNFCCC committed to return their GHG emissions to 1990 levels by 2000. They currently include Australia, Austria, Belarus, Belgium, Bulgaria, Canada, Croatia, Cyprus, Czech Republic, Denmark, Estonia, Finland, France, Germany, Greece, Hungary, Iceland, Ireland, Italy, Japan, Latvia, Liechtenstein, Lithuania, Luxembourg, Malta, Monaco, the Netherlands, New Zealand, Norway, Poland, Portugal, Romania, Russian Federation, Slovakia, Slovenia, Spain, Sweden, Switzerland, Turkey, Ukraine, the United Kingdom, and the United States, as well as the European Union.
Article 6 of the Paris Agreement
Article 6 recognizes that Parties can voluntarily cooperate in the implementation of their NDCs to allow for higher ambition in mitigation and adaptation actions.
Article 6.2-6.3 of the Paris Agreement
Articles 6.2–6.3 cover cooperative approaches where Parties could opt to meet their NDCs by using ITMOs. ITMOs aim to provide a basis for facilitating international recognition of cross-border applications of subnational, national, regional and international carbon pricing initiatives.
Article 6.4 of the Paris Agreement
Articles 6.4 establishes a mechanism for countries to contribute to GHG emissions mitigation and sustainable development. This mechanism is under the authority and guidance of the CMA. It is open to all countries and the emission reductions can be used to meet the NDC of either the host country or another country.
Banking or Carry-over The carry-over of compliance units under the various schemes to manage GHG emissions from one commitment or compliance period to the next. Banking may encourage early action by mandated entities depending on their current situation and their anticipations of future carbon constraints. In addition, banking brings market continuity.
94

Baseline A system where baseline emissions levels are defined for individual installations and credits are issued to installations that have reduced their emissions below this level; these credits can be sold to other installations exceeding their baseline emission levels.
Baseline-and-credit A system where baseline emissions levels are defined for individual installations and credits are issued to installations that have reduced their emissions below this level; these credits can be sold to other installations exceeding their baseline emission levels.
Baseline-and-offset A system where targets or baseline emission levels are defined for individual emitters or groups of emitters and emitters that exceed their baseline emissions can purchase offsets to meet their compliance obligations. In contrast to a baseline-and-credit system, emitters do not automatically receive credits for the emissions they have reduced below their baseline level.
Benchmarking Benchmarking is used to compare operations of a company with those of others, to industry average, or to best practice, to determine whether they have opportunities to improve energy efficiency or reduce GHG emissions. In the EU ETS, for example, free allocation is carried out on the basis of ambitious benchmarks of GHG emissions performance. These benchmarks reward best practice in low-emission production.
Cap-and-trade Cap-and-trade schemes set a desired maximum ceiling for emissions (or cap) and let the market determine the price for keeping emissions within that cap. To comply with their emission targets at least cost, regulated entities can either opt for internal abatement measures or acquire allowances or emission reductions in the carbon market, depending on the relative costs of these options.
Carbon capture and storage (CCS)
The class of technologies and processes that capture carbon dioxide and stores it over the long-term, to isolate it from the atmosphere and negate its impacts on the climate.
Carbon Dioxide Equivalent (CO2e)
The universal unit of measurement used to indicate the global warming potential of each of the six GHG regulated under the Kyoto Protocol. Carbon dioxide—a naturally occurring gas that is a by-product of burning fossil fuels and biomass, land-use changes, and other industrial processes—is the reference gas against which the other GHG are measured, using their global warming potential.
Carbon Leakage Shift in CO2 emissions due to GHG mitigation policies from countries taking stringent actions to countries taking less stringent mitigation actions.
Carbon Offset and Reduction Scheme for International Aviation
(CORSIA)
The global offsetting scheme for the aviation sector which is set to start in 2021 with a voluntary period, becoming mandatory in 2027.
Carbon Pricing Initiative An initiative that explicitly puts a price on a unit of CO2e, including ETSs—both cap-and-trade and baseline-and-credit systems, carbon taxes, offset mechanisms and RBCF.
Carbon Pricing Revenue The revenue governments raise from carbon pricing initiatives, through the auctioning of allowances and taxation. The carbon pricing revenues are determined from auction revenue reports of the different ETSs and the annual budget of governments with carbon taxes in place.
95

Carbon Pricing Value The value of emission units in an ETS and emissions that are subject to a carbon tax. The total carbon pricing value of ETS markets is estimated by multiplying each ETS’s annual allowance volume for the most recent year with the allowance price. The total value for carbon taxes is derived from official government budgets. Where the emission unit volume (for an ETS) or budget information (for a carbon tax) was unavailable, the value of the carbon pricing initiative was calculated by multiplying the GHG emissions covered with the nominal carbon price.
Carbon Tax A tax that explicitly states a price on carbon or that uses a metric directly based on carbon (that is, price per tCO2e).
Certified Emission Reduction (CER)
A unit of GHG emission reductions issued pursuant to the Clean Development Mechanism of the Kyoto Protocol and measured in metric tons of carbon dioxide equivalent. One CER represents a reduction in GHG emissions of one metric ton of carbon dioxide equivalent.
Chinese Certified Emission Reduction
(CCER)
Voluntary emission reduction credits from projects based in China. The NDRC issued rules to regulate the CCER market in China in June 2012. CCER are issued in unit of tCO2e, and include CO2, CH4, N2O, HFCs, PFCs, and SF6.
Clean Development Mechanism (CDM)
The mechanism provided by Article 12 of the Kyoto Protocol, designed to assist developing countries in achieving sustainable development by allowing entities from Annex I Parties to participate in low-carbon projects and obtain CERs in return.
Clean Power Plan (CPP) A set of standards set out by the US Environmental Protection Agency aimed at reducing carbon emissions from the power sector.
Climate finance Public and private sources of finance with varying degrees of concessionality (measured by grant element or subsidy) which is contributed to investments intended to advance low-carbon, climate-resilient development.
Climate markets Markets established by policies that generate tradable units representing quantified climate outputs or outcomes, often for the purpose of meeting compliance obligations established in a jurisdiction.
Compatibility (policy) Refers to ensuring that policies and mechanisms that target similar outcomes measure these outcomes in a consistent way.
Concessionality Refers to the discount compared to normal market rates provided by sources of climate finance. Higher levels of concessionality provide a greater benefit to the borrower compared to a loan at market rate.
Conference of the Parties (COP)
The supreme body of the UNFCCC. It currently meets once a year to review the UNFCCC’s progress. The word “conference” is not used here in the sense of “meeting” but rather of “association”.
Conference of the Parties Serving as the Meeting of
the Parties to the Paris Agreement (CMA)
The COP serves as the meeting of the Parties to the Paris Agreement. Parties to the Convention that are not Parties to the Paris Agreement are able to participate in the CMA as observers, but without the right to take decisions.
96

Consumer surplus The difference between the amount consumers pay and the price that they would be willing to pay for goods and services.
Economic costs of climate change impacts
A measure of the impacts of climate change on global welfare over time. This is assessed as the expected change in the value of traded goods and services resulting from climate change, and may also include some consideration of society’s valuation of non-traded goods and services (such as direct impacts on the environment and human health) and how these are affected by climate change.
Emission Reduction The measurable reduction of release of GHG into the atmosphere from a specified activity, and a specified period.
Emission Reduction Unit (ERU)
A unit of emission reductions issued pursuant to Joint Implementation. One ERU represents the right to emit one metric ton of carbon dioxide equivalent.
Emissions Trading Scheme (ETS)
A system where emitters can trade their emission units to meet their compliance obligations. The two main types of ETSs are cap-and-trade and baseline-and-credit.
European Union Allowance (EUA)
The allowances in use under the EU ETS. An EUA unit is equal to one metric ton of carbon dioxide equivalent.
Feed-in tariff A policy mechanism designed to incentivize renewable electricity by providing long-term, typically fixed price payments to producers per unit of renewable electricity supplied to the grid.
First Commitment Period under the Kyoto
Protocol (CP1)
The five-year period, from 2008 to 2012, during which industrialized countries committed to collectively reduce their GHG emissions by an average of 5.2% compared with 1990 emissions under the Kyoto Protocol.
G20 The Group of 20 is a group of nineteen countries and the European Union representing roughly 85% of global GDP. They are Argentina, Australia, Brazil, Canada, China, France, Germany, India, Indonesia, Italy, Japan, Republic of Korea, Mexico, Russia, Saudi Arabia, South Africa, Turkey, the United Kingdom, the United States and the European Union.
Greenhouse Gas (GHG) Both natural and anthropogenic, GHGs trap heat in the Earth’s atmosphere, causing the greenhouse effect. Water vapor (H2O), carbon dioxide (CO2), nitrous oxide (N2O), methane (CH4), and ozone (O3) are the primary GHGs. The emission of GHG through human activities (such as fossil fuel combustion or deforestation) and their accumulation in the atmosphere is responsible for an additional forcing, contributing to climate change.
Greenhouse Gas Industrial Reporting and
Control Act (GGIRCA)
The legislation from the British Columbia government that enables performance standards to be set for industrial facilities or sectors, including GHG benchmarks for LNG facilities. Facilities that do not meet the performance standards have to purchase compliance units.
Gross investment The total capital expenditure that needs to be mobilized within key sectors in the transition to a low carbon economy. This includes investments in mitigation activities, technologies and assets, for example, the upfront cost of building new renewablegeneration assets.
97Glossary
Implied (implicit) carbon price
A measure of the value of subsidies or the additional costs imposed by policies indirectly putting a price on carbon, expressed per ton of CO2e.
Incremental investment The additional capital expenditure required to invest in mitigation activities, technologies and assets, compared with business-as-usual investments.
Intended Nationally Determined
Contribution (INDC)
The COP, by its decisions 1/CP.19 and 1/CP.20, invited all Parties to communicate to the UNFCCC secretariat their INDCs in advance of COP 21 as part of the groundwork for the adoption of the Paris Agreement. An INDC set the climate actions (mitigation and/or adaptation) that a country intended to take under the international agreement under the UNFCCC that was to be agreed in Paris in December 2015. For Parties ratifying the Agreement that have already submitted an INDC, their INDC will be considered their first NDC, unless the Party decides to revise it.
Intergovernmental Panel on Climate Change
(IPCC)
The intergovernmental body established by the World Meteorological Organization and the United Nations Environment Program to prepare, based on available scientific information, assessments on all aspects of climate change and its impacts, with a view of formulating realistic response strategies.
Internal carbon price A price on GHG emissions that an organization uses internally to guide its decision-making process.
Internationally Transferred Mitigation
Outcomes (ITMOs)
Parties to the Paris Agreement can use ITMOs, established by Article 6.2 of the Paris Agreement, to achieve NDCs. ITMOs aim to provide a basis for facilitating international recognition of cross-border applications of subnational, national, regional and international carbon pricing initiatives. However, the precise nature of ITMOs has not yet been defined. ITMOs might cover outcomes from various existing and future approaches.
Joint Implementation (JI) Mechanism provided by Article 6 of the Kyoto Protocol whereby entities from Annex I Parties may participate in low-carbon projects hosted in Annex I countries and obtain Emission Reduction Units (ERUs) in return.
Kyoto GHGs The Kyoto Protocol regulates six GHGs: carbon dioxide (CO2), methane (CH4), and nitrous oxide (N2O), hydrofluorocarbons (HFCs), perfluorocarbons (PFCs), and sulphur hexafluoride (SF6).
Kyoto Mechanisms The three flexibility mechanisms that may be used by Annex I Parties to the Kyoto Protocol to fulfil their commitments. These are the Joint Implementation (JI, Article 6), Clean Development Mechanism (CDM, Article 12), and International Emissions Trading (Article 17).
Kyoto Protocol Adopted at the third Conference of the Parties to the UNFCCC held in Kyoto, Japan, in December 1997, the Kyoto Protocol commits industrialized country signatories to collectively reduce their GHG emissions by at least 5.2% below 1990 levels on average over 2008–2012 while developing countries can take no-regret actions and participate voluntarily in emission reductions and removal activities through the CDM. The Kyoto Protocol entered into force in February 2005.
98

Macroeconomic costs of mitigation action
A measure of the impact that action to address climate change has on consumer welfare. Generally calculated using macroeconomic models to estimate the reduction in consumption that would result from the implementation of a global carbon price to meet a particular emissions constraint.
Marginal abatement cost
The additional costs incurred in reducing a defined increment of emission reduction from a particular source.
Measuring, reporting and verification (MRV)
The collection of systems, processes and infrastructure that are used to measure, report and verify the accuracy of results, usually relating to emissions of GHGs.
Nationally Determined Contribution (NDC)
The contribution that a Party intends to achieve under the Paris Agreement, covering mitigation and adaptation. Each Party shall communicate an NDC every five years. For Parties ratifying the Agreement that have already submitted an INDC, their INDC will be considered their first NDC, unless the Party decides to revise it. NDCs are governed by Article 4 of the Agreement. Each Party to the UNFCCC that wishes to become a Party to the Agreement will have an obligation to communicate an NDC. The level of prescription attached to these will be determined by the negotiations on the operative elements of Article 4, which mainly take place under the Ad Hoc Working Group on the Paris Agreement (APA).
Offset An offset designates the emission reductions from project-based activities that can be used to meet compliance or corporate citizenship objectives vis-à-vis GHG mitigation.
Paris Agreement The Paris Agreement was adopted at the 21st Conference of the Parties to the UNFCCC held in Paris, France, in December 2015. The Paris Agreement brings all nations together for the first time to undertake ambitious efforts to combat climate change and adapt to its effects. Its central aim is to “strengthen the global response to the threat of climate change by keeping a global temperature rise this century well below 2 degrees Celsius above pre-industrial levels and to pursue efforts to limit the temperature increase even further to 1.5 degrees Celsius. Additionally, the agreement aims to strengthen the ability of countries to deal with the impacts of climate change. The Paris Agreement requires all Parties to put forward their best efforts through NDCs and to strengthen these efforts in the years ahead. This includes requirements that all Parties report regularly on their emissions and on their implementation efforts.”
REDD Plus (REDD+) All activities that reduce emissions from deforestation and forest degradation and contribute to conservation, sustainable management of forests, and enhancement of forest carbon stocks.
Registration The formal acceptance by the CDM Executive Board of a validated project as a CDM project activity.
Results-Based Climate Finance (RBCF)
Funding approach where payments are made after pre-defined outputs or outcomes related to managing climate change, such as emission reductions, are delivered and verified.
99Glossary

Second Commitment Period under the Kyoto
Protocol (CP2)
The eight-year period, from 2013 to 2020, in which Annex I Parties to the Kyoto Protocol committed to reduce GHG emissions by at least 18% percent below 1990 levels. The composition of Parties in the second commitment period is different from that in the first.
Secondary Market A market where the seller of the asset is not the original owner (or issuer).
United Nations Framework Convention
on Climate Change (UNFCCC)
The international legal framework adopted in June 1992 at the Rio Earth Summit to address climate change. It commits the Parties to the UNFCCC to stabilize human-induced GHG emissions at levels that would prevent dangerous manmade interference with the climate system, following “common but differentiated responsibilities” based on “respective capabilities”.
Validation The process of independent evaluation of a project activity by a Designated Operational Entity against the requirements of the CDM. The CDM requirements include the CDM modalities and procedures, subsequent decisions by the CMP and documents released by the CDM Executive Board.
Verification Verification is the review and ex-post determination by an independent third party of the monitored results, typically referring to reductions in emissions generated by a registered CDM project or a determined JI project (or a project approved under another standard) during the verification period in this report.
Voluntary Carbon Market
The voluntary carbon market caters to the needs of those entities that voluntarily decide to reduce their carbon footprint using offsets.
100


1818 H Street, NWWashington, DC 20433 USAwww.worldbank.org/climatechange