state development monitor - phd chamber of commerce …phdcci.in/image/data/research...
TRANSCRIPT

1
State Development Monitor A monthly newsletter for all Indian states
PHD RESEARCH BUREAU PHD CHAMBER OF COMMERCE AND INDUSTRY
PHD House, 4/2 Siri Institutional Area, August Kranti Marg New Delhi 110016
Phone: 91-11-49545454, Fax: 91-11-26855450, 26863135 Email: [email protected] Website: www.phdcci.in
January 2017

2
Index
Heading Page No.
Executive Summary 3
Business Reform Action Plan Implementation Scorecard
4
Developments in Economic Scenario 5
Infrastructure Developments 6-9
Developments in Health sector 10-14
Rural Economy & Agri Business Developments
14-17
Tourism Developments 18-19
Special Feature- Haryana Developments at a glance
20-22
Summary of economic indicators of Indian States.
23-27

3
State Development Monitor Newsletter- Executive Summary
The December edition of the State Development Monitor brings forward a special feature of developments in the State of Haryana at a glance. Further it aims to focus at developments made in all Indian states with respect to;
Economic Scenario Infrastructure Developments Health sector Rural Economy & Agri Business Developments Tourism Developments
The rankings for all states for the implementation of business reforms produced by the Department of Industrial Policy & Promotion has been mentioned to analyse the growth performance of states so far.
Despite Demonetization the economic scenario among states has been scripted a steady growth scenario. Economic growth, as defined by the growth in Gross Domestic Product at constant (2011-12) market prices stood at 7.2 per cent during the first half of 2016-17.
Significant Infrastructure and Agri Business Developments have been witnessed in states in the month of December.
The Health sector the Government of India is implementing various schemes all across the country for reducing infant mortality on account of malnutrition and a Joint Initiative “Swachh Swasth Sarvatra’ of Health Ministry and Ministry of Drinking Water & Sanitation was launched achieve better health outcomes through improved sanitation and increased awareness and healthy lifestyles. At the tourism front, post demonetization the Government has taken a number of steps to ensure that no hardship is faced by the tourists and the industry is not affected. Government efforts have paid dividend as there has been a notable growth in the comparative figures of Foreign Tourists Arrival (FTA), Foreign Exchange Earnings (FEEs) and online sale of e – tickets after demonetization.
As a special feature the development scenario in the state of Haryana has been highlighted it has been observed that the child sex ratio at birth (SRB) in Haryana for the first time has touched 900-mark in two decades. SRB in December 2016 in Haryana was 914. Further the government of Haryana on 25 December 2016 connected 100 villages in the state with WiFi services. It also decided to rename all common service centres (CSC), which have been opened in urban and rural areas, and E-disha centres as ‘Atal Seva Kendras’ at district headquarters.

4
Business Reform Action Plan Implementation Scorecard
Improving India’s regulatory framework for business is a key prerequisite for increasing
investment in India and thereby creating jobs. The Government of India has already embarked on
an ambitious agenda to improve India’s Doing Business rank to 50 by 2017; however, this effort
will only address a small subset of the regulatory burden on investors. Doing Business reforms will
only address central regulations, and regulations in Mumbai and Delhi; the rest of the country must
also improve simultaneously if we are to convert our reforms into results. It is with this objective
that, in December 2014, States agreed to a 98-point action plan to suggest potential reforms that
should be undertaken to improve the regulatory framework for business nationwide. More
importantly, this assessment allows us to generate a wide base of knowledge on how States have
been addressing the task of reducing the regulatory burden on business, and identifies a series of
good practices already underway in each State.
STATE WISE RANKING- Business Implementation Reform
S.No. State Rank Score (%) 1. ANDHRA PRADESH 1 98.78
2. TELANGANA 2 98.78
3. GUJARAT 3 98.21
4. CHHATTISGARH 6 97.32
5. MADHYA PRADESH 7 97.01
6. HARYANA 5 96.95
7. JHARKHAND 8 96.57
8. RAJASTHAN 4 96.43
9 UTTARAKHAND 9 96.13
10. MAHARASHTRA 11 92.86
11. ODISHA 10 92.73
12. PUNJAB 12 91.07
13. KARNATAKA 13 88.39
15. UTTAR PRADESH 15 84.52
14. WEST BENGAL 14 84.23
16. BIHAR 16 75.82
17. HIMACHAL PRADESH 17 65.48
18. TAMIL NADU 18 62.80
19. DELHI 19 47.62
20. KERALA 20 26.97
21 GOA 21 18.15
22. TRIPURA 22 16.67
24. DAMAN & DIU 24 14.58
23. ASSAM 23 14.29
25. DADRA & NAGAR HAVELI 25 1.79
26. PUDUCHERRY 26 1.49
27. NAGALAND 27 1.49
28. MANIPUR 28 1.19
29. MIZORAM 29 0.89
30. SIKKIM 30 0.60
31. ARUNACHAL PRADESH 31 0.30
32. JAMMU & KASHMIR 32 0.30
33. CHANDIGARH 33 0.30
34. MEGHALAYA 34 0.30
35. ANDAMAN& NICOBAR ISLANDS 35 0.30
36. LAKSHADWEEP 36 0.30 Source: The rankings have been obtained from the Department of Industrial Policy and Promotion Website as on 16h January 2017
5
Growth of Various Sectors The growth in Gross Value Added (GVA) at constant (2011-12) basic prices of various sectors during the last three years is given in the following table:
Growth of GVA at Constant Basic Prices (Per cent) Sectors 2013-14 (2nd RE) 2014-15 (1st RE) 2015-16 (PE)
Agriculture, forestry & fishing
4.2 -0.2 1.2
Industry 5.0 5.9 7.4 Services 7.8 10.3 8.9
GVA at basic prices 6.3 7.1 7.2 Source: Central Statistics Office (CSO)
Economic growth, as defined by the growth in Gross Domestic Product at constant (2011-12) market prices stood at 7.2 per cent during the first half of 2016-17. According to the Index of Industrial Production (IIP) released by the Central Statistics Office, the production of capital goods sector contracted by 22.1 per cent during April-October 2016. Government’s industry-oriented initiatives like the Make-in-India and the accompanying measures to facilitate investment and business are likely to boost the industrial sector, including the capital goods sector. Government’s focus on improving the quality of public spending, coupled with the implementation of scheme for Enhancement of Competitiveness in the Indian Capital Goods Sector that aims to make Indian capital goods industry globally competitive will help reviving the capital goods sector. The National Policy on Capital Goods Sector, approved by the Cabinet in May 2016, that envisages making India one of the top capital goods producing nations of the world by increasing production, raising exports and improving technology to advanced levels is also likely to strengthen the capital goods sector.
I. Developments in Economic Scenario
State of Telangana
In keeping with its commitments to support the development of backward areas of Telangana, the Central Government has provided a further “Special Assistance” of Rs. 450 crore to the state for 2016-17. Andhra Pradesh Reorganisation Act, 2014 entrusts the Central Government to support the programmes for the development of backward areas in the successor States, including expansion of physical and social infrastructure. The Central Government had accordingly released Rs. 450 crore during 2015-16 for the development of 9 backward districts of Telangana. The backward districts which are being supported with this development fund are Adilabad, Nizamabad, Karimnagar, Warangal, Medak, Mahbubnagar, Rangareddy, Nalgoda and Khammam. Cumulatively, the Central Government has so far released Rs. 900 crore to the State for this purpose. These additional resources from the Central Government would enable the State to devise and implement schemes best suited for mitigation of backwardness and alleviation of poverty. The developmental activities would improve the physical and social infrastructure bringing these districts at par with the more developed districts of the state.

6
The Ministry of Road Transport & Highways today reviewed the work progress of the National Highways in Odisha. In a meeting with the Odisha Government’s representative, the state of the existing highways totalling 4,847 kms was reviewed. Besides the review of above stretch, Highways totalling 1,789 kms for which DPR is under preparation, and also includes Bharatmala component of 500 kms, was also reviewed and the status of its implementation was discussed. The Ministry has also reviewed and discussed the various proposals received from public representatives to declare 2,506 kms of stretches of State Roads as National Highways and it was decided to forward the proposal details for this to the Government of Odisha.
Prime Minister Shri Narendra Modi will lay the foundation stone of the ambitious Chardham Mahamarg Vikas Pariyojna’on 27th December, 2016 at Parade Ground in Dehradun. The project aims at improving the connectivity to the Char Dham pilgrimage centres in the Himalayas, making journey to these centres safer, faster and more convenient.
The Chardham project includes developing 900 km of national highways in Uttarakhand at a total cost of Rs. 12000 crores. Work for 17 projects worth Rs 3000 crores have already been sanctioned and tendered. The entire length of the highways will be two-laned with paved shoulder and with a minimum width of 10 metres. There will be tunnels, bypasses, bridges, subways and viaducts to prevent traffic bottlenecks. A team of experts have been engaged to identify zones prone to landslides, and environment friendly techniques are being incorporated in the design to make these zones safer.
Wayside amenities and public facilities will be constructed all along the Chardham route, including parking spaces and helipad for emergency evacuation.
The Vijayawada-Ranchi corridor project was approved by Cabinet Committee on Infrastructure (CCI) covering a length of 600 kms in Odisha State. Ministry of Road Transport and Highways has sanctioned estimates to the tune of Rs. 1348 crore. covering a length of 594 kms. So far a length of 310 kms has been completed incurring an expenditure of Rs. 683 crore under the scheme. The balance works are scheduled to be completed by March, 2018. Designs of Roads and structures have been adopted keeping in view Indian Road Congress (IRC) standards and safety aspects.
II. Infrastructure Developments
2.1 Progress of National Highways in Odisha
Reviewed
2.2 PM to Lay Foundation Stone of ‘Chardham Mahamarg Vikas Pariyojna’
2.3 Ranchi-Vijayawada Corridor Project

7
The Ministry of Road Transport & Highways is considering a programme to replace old polluting
medium and heavy vehicles with fuel efficient vehicles. A concept note on ‘Vehicle Fleet
Modernization Programme’ was placed on 26th May, 2016 for stakeholders comments. In this it
was inter-alia proposed that old vehicles would get following financial benefits:
• The scrap value of the vehicle.
• Incentives from Original Equipment Manufacturers (OEMs) and incentives from government.
It has now been decided to place the matter for consideration of Committee of Secretaries (CoS).
This programme will ensure phasing out of older polluting vehicles and enable their replacement
with fuel efficient and environment friendly vehicles. According to a study instituted by MoRTH and
carried out by M\s AT Kearney, MHCVs (trucks and buses) account for just 2.5% of total fleet
however they contribute over 60% of pollution. The vehicle emission standards were introduced
for the first time in India in 2000. Over a period these norms have been tightened. The resultant
effect is that the older vehicles emit higher degree of harmful pollutants as compared to newer
vehicles. Older vehicles also have lower fuel efficiency as compared to new vehicles, leading to
significant loss in energy efficiency (one of the key focus areas currently being pushed through
multiple initiatives like Prakash Path, LED program of the government). Committee of Secretaries
for Energy Conservation constituted by the Hon’ble Prime Minister has identified replacement of
heavy duty vehicles as a key initiative. In light of above, it is proposed to launch a targeted vehicle
modernization program to provide a major thrust to the country’s green initiatives.
This information was given by Minister of State for Road Transport & Highways, Shri Pon.
Radhakrishnan in a written reply to a question in Lok Sabha today.
Japan has decided to be associated with the development of Chennai, Ahmedabad and Varanasi as smart cities. This was today conveyed by Japan’s Ambassador to India Mr.Kenji Hiramatsu during his meeting with Minister of Urban Development Shri M.Venkaiah Naidu. Mr.Hiramatsu further said that Japan is quite interested in urban development initiatives of the Government of India and decided to be a partner. Responding to Shri Naidu’ observation about the need for speedy action, Japan’s Envoy said “We would like to match the action oriented approach of the Government under Prime Minister Shri Modi”. Both of them discussed growing cooperation between the two countries further to the last meeting between the Prime Ministers of the two countries. High Commissioner of United Kingdom Mr.Dominic Asquith also met Shri Venkaiah Naidu and discussed converting into action the MoU signed between the two countries during the
2.4 Phasing out old Vehicles
2.5 Japan to assist in making Chennai, Ahmedabad and Varanasi Smart Cities
8
recent visit of British Prime Minister to India Ms.Teresa May, on cooperation in urban development sector. He said institutionalizing Government to Government cooperation for smart city development has huge potential. So far, leading countries have come forward to be associated with development of 15 smart cities. These include: United States Trade Development Agency (USTDA) –Visakhapatnam, Ajmer and Allahabad, UK-Pune, Amaravati(Andhra Pradesh) and Indore, France-Chandigarh, Puducherry and Nagpur and Germany –Bhubaneswar, Coimbattore and Kochi.
National Capital Region Planning Board (NCRPB) has begun to release funds for the Noida-Greater Noida Metro Project by disbursing the first loan installment of Rs.406 Cr, giving a fillip to speedy execution of this important metro project.
NCRPB had earlier sanctioned a loan of Rs.1,587 cr to Noida Metro Rail Corporation (NMRC) for the 29.70 km Noida-Greater Noida Metro Project that is estimated to cost Rs.5,533 cr. This 20 year loan, including a moratorium of five years for repayment of loan carries an interest rate of 7% per year and an incentive of 0.25% for timely repayment of installments. The targeted date of completion of this section is April, 2018.
Announcing the disbursement of the first installment of loan, Shri B.K.Tripathy, Member-Secretary, NCRPB said; “Noida-Greater Noida metro link is important for enabling a seamless travel in National Capital Region, which the Board is committed to promote. Further release of funds to this important section depends on physical and financial progress of the section. NCR Regional Plan-2021 emphasised the need for strengthening connectivity between NCR towns. Metro is emerging as the most efficient, fast, smooth and eco-friendly mode of public transport in the core of NCR.”
Further to launch of major new urban sector missions in June,2015, implementation of urban infrastructure projects got off a good start in 2016, the first year of execution. Brisk execution of urban infrastructure projects, approval of smart city plans for 60 cities, credit rating of cities for resource mobilization through municipal bonds, Swachh Bharat Mission picking up momentum in urban areas, enactment of Real Estate Act and notification of Real Estate Rules, large scale approval of construction of affordable houses for urban poor and
2.6 Noida-Greater Noida Metro gets Rs.406 cr boost from NCR Planning Board
2.7 115 cities launch water supply and sewerage projects under Atal Mission at a cost of Rs.6,346 cr
2.7.1 20 cities take up schemes worth more than Rs.100 cr each; another 20 more than Rs.50 cr
each
2.7.2 87 Smart City Projects worth Rs.5,768 cr in progress; 7 already completed

9
massive investment approval in urban areas have, modification of Building Bye-laws and simplification of approvals for building plans and construction permits made the year 2016 a new landmark in urban development.
Under Atal Mission for Rejuvenation and Urban Transformation (AMRUT), a total of 490 projects with an investment of Rs.6,571 cr have taken off the ground. These include 102 projects to ensure water supply connections to all households besides enabling water supply at the normative 135 litres per head per day in 76 cities at a total cost of Rs.3,474 cr and 41 sewerage and septage management projects and augmenting water supply in an-other 39 mission cities at a cost of Rs.2,878 cr. Another 319 projects with a cost of Rs.9,686 cr are close to being awarded for implementation. Development of open and green spaces is in progress in almost all the 500 mission cities. Investment of Rs.30,657 cr has been approved under Atal Mission during 2016 for improving infrastructure relating water supply, sewerage networks, storm water drains, urban transport with focus on non-motorised transport and open and green spaces.
Under Smart city Mission that involved the complex task of converting city-wise Smart City Plans into projects warranting elaborate technical planning, 87 projects in 19 cities worth Rs.5,768 cr are under execution with seven of them already completed, even though the first batch of 20 smart cities was announced in January, 2016. Another 80 projects with an investment of Rs.4,448 cr are close to being awarded for implementation. A total investment of Rs.1,32,197 cr has been approved under the Smart City Plans of 60 cities during January-December, 2016.
Some major water supply projects under implementation under AMRUT:
Karnataka: Bijapur-Rs.174 cr, Mandya-Rs.124 cr, Hassan-Rs.115 cr, Chitradurga-Rs.110 cr, Bellary-Rs.72 cr and Hospet-Rs.51 cr. Tamil Nadu: Thanjavur-Rs.53 cr. Madhya Pradesh: Bhopal-Rs.155 cr, Chattarpur- Rs.63 cr. Maharashtra: Vasai-Virar –Rs.136 cr, Amaravati – Rs.114 cr, Malegaon-Rs.78 cr, Osmanabad-Rs.68 cr, Panvel-Rs.51 cr. Gujarat: Morvi-Rs.150 cr, Chattisgarh: Korba-Rs.145 cr, Bhilai Nagar-Rs.104 cr Uttar Pradesh: Orai-Rs.121 cr Bihar: Chapra-Rs.62 cr Punjab: Ludhiana-Rs.68 cr West Bengal- Bardhman – Rs.59 cr Chandigarh : Rs.24 cr Odisha: Cuttack-Rs.34 cr
Some major sewerage projects under execution: Karnataka: Gulbarga-Rs.175 cr,
Gadag-Betigere-Rs.159 cr, Hubli-
Dharwar-Rs.157 cr, Bidar-Rs.125 cr,
Bengaluru- Rs.60 cr.
Telangana- Siddipet-Rs.18 cr
Madhya Pradesh : Sagar-Rs.299 cr,
Rewa-Rs.199 cr, Satna-Rs.192 cr,
Morena-Rs.128 cr, Neemuch –Rs.68 cr
Rajasthan : Bhiwadi-Rs.130 cr, Sikar-
Rs.110 cr, Alwar-Rs.86 cr
Gujarat: Vadodara-Rs.89 cr
Punjab: Abohar-Rs.83 cr
Uttar Pradesh: Muzaffarnagar- Rs.27 cr

10
Union Minister for Health & Family Welfare Shri J P Nadda and Union Minister of Human
Resource Development Shri Prakash Javadekar launched ‘Swachh Swasth Sarvatra’ to
commemorate Good Governance Day. Swachh Swasth Sarvatra is a joint initiative of the
Ministry of Health and Family Welfare and the Ministry of Drinking Water and Sanitation to
achieve better health outcomes through improved sanitation and increased awareness and
healthy lifestyles.
Addressing the participants, Shri Javadekar said that the Prime Minister has successfully
amplified the need for clean India and today this is the most popular programme that
resonates with citizens across India. Advancing from Swachh Bharat to Swastha Bharat is a
natural step. Open Defecation Free (ODF) should not be limited to creation of infrastructure
alone but it should also bring the positive change in the habits and mindset of
people.“Swachh Swastha Sarvatra” is a much needed programme to achieve open
defecation-free India by 2019. This should become people's movement and that is our
endeavor,” ShriJavadekar said. Terming children as change agents he stated, “I believe that
millions of students can become the change agents in driving ODF message in their homes,
villages and districts.”
To complement and leverage the efforts and achievements made so far, the MDWS and the
MOHFW have launched a joint initiative today- Swachh Swasth Sarvatra. The three key
components of Swachh Swasth Sarvatra are:
· Community Health Centres (CHCs) in ODF blocks supported to achieve Kayakalp certification
· Gram Panchayat of Kayakalp Primary Health Centres (PHCs) prioritized to become ODF
· Training in WASH (Water, Sanitation and Hygiene ) of CHC/PHC nominees
The total number of people affected with mosquito borne diseases (Malaria, Dengue, Chikungunya
& JE) in last three year is given below: The number of people affected with mosquito borne diseases (Cases) in the Country since 2013:
III. Developments in Health Sector
3.1 ‘SwachhSwasthSarvatra’- Joint Initiative of Health
Ministry and Ministry of Drinking Water & Sanitation
launched
3.2 Task force against Spread of Mosquito Borne Diseases

11
The number of people affected with Chikungunya
(Cases) in the Country since 2013:
The number of people affected with Dengue
(Cases) in the Country since 2013:
12
As per the Rapid Survey of Children (2013-14), 29.4 per cent children below five years are
underweight, 38.7 per cent are stunted and 15.1 per cent are wasted. Malnutrition is not a
direct cause of death among children but can increase morbidity and mortality by reducing
the resistance to infections. However, it is estimated that malnutrition is a contributing
factor in about one-third of all deaths in under- five children in India, as per CHERG (2010)
Report. The Government of India is implementing various schemes all across the country for reducing infant mortality on account of malnutrition:
i. Provision of Supplementary food to children aged 6-36 months under Integrated Child Development Project (ICDS).
ii. Promotion of Institutional deliveries through cash incentive under Janani Suraksha Yojana (JSY) and Janani Shishu Suraksha Karyakaram (JSSK) which entitles all pregnant women delivering in public health institutions to absolutely free and no expense ante-natal check-ups, delivery including Caesarean section, post-natal care and treatment of sick infants till one year of age.
iii. Strengthening of delivery points for providing comprehensive and quality Reproductive, Maternal, Newborn, Child and Adolescent Health (RMNCH+A) Services, ensuring essential newborn care at all delivery points, establishment of Special Newborn Care Units (SNCU), Newborn Stabilization Units (NBSU) and Kangaroo Mother Care (KMC) units for care of sick and small babies. Home Based Newborn Care (HBNC) is being provided by ASHAs to improve child rearing practices.
iv. Early initiation and exclusive breastfeeding for first six months and appropriate Infant and Young Child Feeding (IYCF) practices are promoted in convergence with Ministry of Women and Child Development. Village Health and Nutrition Days (VHNDs) are observed for provision of maternal and child health services and creating awareness on maternal and child care including health and nutrition education. Government has recently launched “MAA” programme in order to increase awareness on breastfeeding and build capacities of the health workers on IYCF practices.
v. Universal Immunization Programme (UIP) is being supported to provide vaccination to children against many life threatening diseases such as Diphtheria, Pertussis, Tetanus, Poliomyelitis, Tuberculosis, Measles, Hepatitis B, Meningitis and Pneumonia due to Haemophilus Influenzae type B.
vi. Rashtriya Bal Swasthya Karyakram (RBSK) for health screening, early detection of birth defects, diseases, deficiencies, development delays including disability and early intervention services has been operationalized to provide comprehensive care to all the children in the age group of 0-18 years in the community.
3.3 Malnutrition in India

13
vii. Some other important interventions are Iron and folic acid (IFA) supplementation for the prevention of anaemia among the vulnerable age groups, Vitamin-A Supplementation for children 6 -59 months, home visits by ASHAs to promote exclusive breast feeding and promote use of ORS and Zinc for management of diarrhoea in children,
viii. Nutrition Rehabilitation Centres are established at Government Health facilities to manage severe acute malnutrition.
The details of enrolled families and the total number of beneficiaries covered under RSBY during FY 2016-17 (up to 31.10.2016) are given below:
3.4 Rashtriya Swasthya Bima Yojana

14
The details of empanelled hospitals for FY 2016-17 (upto 31.10.2016) are given below:
As per preliminary reports received from the States, the total area sown under Rabi crops
as on 13th January 2017 stands at 616.21 lakh hectares as compared to 581.95 lakh hectare
this time in 2016.
Wheat has been sown/transplanted in 309.60 lakh hectares, rice in 14.92 lakh hectares,
pulses in 155.35 lakh hectares, coarse cereals in 54.87 lakh hectares and area sown under
oilseeds is 81.47 lakh hectares.
The area sown so far and that sown during last year this time is as follows:
IV. Rural Economy & Agri Business Developments
4.1 Rabi Crops Sowing Crosess 616 Lakh Hactare

15
Union Agriculture and Farmers Welfare Minister, Shri Radha Mohan Singh today met Israeli delegation led by the Agriculture and Rural Development Minister of Israel, Shri Uri Ariel to discuss issues relating to bilateral cooperation in agriculture between India and Israel. Both sides expressed satisfaction over the progress made in cooperation in the agriculture and allied sectors between the two countries.
Both sides expressed their commitment to further strengthen bilateral relations in the field of Agriculture which is manifested by the fact that the third phase of Action Plan for 2015-18 in the field of Horticulture has recently been finalized by the two countries. Under this program, as many as 27 Centres of Excellence (CoEs) in the cultivation of various fruits and vegetables, in 21 states, are being set up, out of which 15 CoEs are complete.
Further, both sides expressed the hope that while continuing the two countries could embark upon newer areas of cooperation at the Government to Government and Business to Business levels between the two countries so as to further enhance the relationship.
The Union Cabinet, chaired by the Prime Minister Shri Narendra Modihas given its approval for
signing of an Agreement for cooperation in the field of Agriculture and allied sectors between
India and Portugal.
4.2 India and Israel committed to strengthen bilateral relations in the field of Agriculture
4.3 Cabinet approves signing of MoU between India and Portugal in the field of agriculture and allied
sectors

16
The Agreement covers various activities in these fields which include exchange of scientific and
technical information, trade in plants and plant products, exchange of information in
phytosanitary issues, training programmes, seminars and visits of experts and consultants.
The Agreement provides constitution of a Joint Working Group comprising of representatives
from both countries, the task of which would be to monitor the implementation of the present
MoU and making concrete proposals for agriculture cooperation and develop guidelines and
priorities for future cooperation in the field of agriculture and allied sectors.
The Agreement shall enter into force on the date of its signing and shall remain in force for a
period of five years and shall be automatically extended for a subsequent period of five years
unless either Party gives written notice through diplomatic channels to the other Party of its
intention to terminate the Agreement at least six months before its expiration.
Union Minister of Agriculture and Farmers Welfare, Shri Radha Mohan Singh held a press conference to brief achievements and initiatives taken by his ministry during the last 30 months here today. On this occasion Shri Singh said that there is no adverse effect of demonetization and stated the examples of followings: 1. MILK SALE Union Minister of Agriculture and Farmers Welfare, Shri Radha Mohan Singh said that if study the data of sale of milk, we will find that there is no adverse effect of demonetization on this rather, it has increased. (a) AMUL: Before demonetization the average sale of milk per day was Rs. 64.55 crore. After demonetization it has increased to Rs. 74.25 crore per day in November-December. (b) MOTHER DAIRY: Similarly, before demonetization the average sale of Mother Dairy milk was 28.06 lakh litre, the average cost was Rs. 11.42 crore. After demonetization it has increased to 29.61 lakh litre per day. In November-December the average cost is Rs. 12.05 crore per day. (c) DELHI MILK SCHEME: Under Delhi Milk Scheme average sale was 2.70 lakh litre per day and average cost was Rs. 1.05 crore per day. After demonetization it has increased to 2.76 lakh litre in November-December, the average cost has become Rs. 1.07 crore per day. 2. SEED Shri Radha Mohan Singh said that if compare the data of 2016 with the data of sale of seed of Rabi 2015, we will find that in most of the states either the data has increased or it is equivalent. For example Madhya Pradesh State Seed Corporation sold 10.42 lakh quintal for sowing of Rabi 2015, it has increased to 11.93 lakh quintal this year. Similarly, Maharashtra State Seed Corporation sold 2.64 lakh quintal seeds during last year, this year
4.4 No adverse effect of demonetization: Shri Radha Mohan Singh

17
it is 2.7 lakh quintal. Karnataka State Seed Corporation sold 1.36 lakh quintal seeds during previous year, this year it is 1.49 lakh quintal. If study the data of National Seed Corporation then we will find that till 23rd December, 2015 5.51 lakh quintal seeds was sold by it. There is a slight decrease, it is 5.20 quintal this year. Similarly, in Telangana State the sale of seed was 1.55 lakh quintal in Rabi 2015 there is a slight decrease in it and it is 1.48 lakh quintal. In Uttarakhand also there is a slight decrease in it. It was 3.8 thousand quintal. In the year 2016 it is 3.7 thousand quintal. 3. NAFED Shri Singh further, said that similarly, it is clear from the study of data of NAFED before demonetization on 8th November 2016, the average sale of NAFED was Rs. 2 lakh per day which has increased 1 and half times after demonetization and it has become Rs. 3.70 lakh per day. The main reason of this was the continuation of circulation of old Rs. 500 and 1000 notes on the cooperative shops. In December 2016 this income has stabilized at Rs. 2.31 lakh per day which is more than the data of sale before demonetization.
The Union Cabinet, chaired by the Prime Minister, Shri Narendra Modi has approved the
proposal of the Ministry of Agriculture and Farmers Welfare for Signing of an Agreement
between India and Kyrgyzstan on cooperation in the field of agriculture and food related
industry. The proposed agreement between India and Kyrgyzstan covers various activities in the
field of agriculture and allied sector including but not restricted to areas such as exchange of
information and experience in the field of research; animal breeding, Avian Influenza and Food
& Mouth Disease (FMD); veterinary medicine; plant growing, production of seeds based on
modern technology, certification of seed; introduction of different types of irrigation, &
establishing Indian Pilot Project; information technology on efficient use of food processing and
packaging technology.
Apart from exchange of information, the MOU also provided for cooperation in the field of
protection of plant variety rights; agricultural, food trade and horticulture; agricultural research
& education, horticultural research & education and food safety and standards; aquaculture and
fisheries, etc.
The Agreement provides for constitution of a Joint Working Group comprising of representatives
from both countries which shall prepare plans of cooperation, provide solutions to the problems
arising during the implementation of this Agreement and implementation of tasks determined by
the Parties.
The Agreement shall enter into force on the date of its signing and shall remain in force for a
period of five years and shall be automatically extended for a subsequent period of five years
unless either Party gives written notice through diplomatic channels to the other Party of its
intention to terminate the Agreement at least six months before its expiration.
4.4 Cabinet approves signing of an Agreement between India and Kyrgyzstan on cooperation in the
field of agriculture and food related industry
Cabinet approves signing of an Agreement between India and Kyrgyzstan on
cooperation in the field of agriculture and food related industry
Cabinet approves signing of an Agreement between India and Kyrgyzstan on
cooperation in the field of agriculture and food related industry

18
A total of 1,62,250 foreign tourists arrived in December 2016 on e-Tourist Visa as compared to
1,03,617 during the month of December 2015 registering a growth of 56.6%. UK (22.4%)
continues to occupy top slot followed by USA (16.4%) and Russian Fed (7.7%) amongst
countries availing e-tourist visa facility During December 2016.
The facility of e-Visa has been made available by the Government of India to the citizens of 161
countries, arriving at 16 International Airports in India. The number of e-Tourist Visa availed by
foreign tourists visiting India during the month of December, 2016 has registered a substantial
growth rate over the corresponding month of 2015. The salient highlights of e-Tourist Visa for
and upto the month of December, 2016 are as follows:-
(i) During the month of December 2016 a total of 1,62,250 foreign tourists arrived on e-Tourist
Visa as compared to 1,03,617 during the month of December, 2015 registering a growth of
56.6%.
(ii) During January- December 2016, a total of 10,79,696 tourist arrived on e-Tourist Visa as
compared to 4,45,300 during January-December 2015, registering a growth of 142.5% .
(iii) This high growth may be attributed to introduction of e-Tourist Visa for 161 countries as
against the earlier coverage of 113 countries.
(iv) The percentage shares of top 10 source countries availing e-Tourist Visa facilities
during December, 2016 were as follows:
UK (22.4%), USA (16.4%), Russian Fed (7.7%), China (5.3%), Australia (4.6%), France (4.1%),
Germany (4.0%), South Africa (3.7%), Canada (3.7%) and Republic of Korea (2.0%).
(v) The percentage shares of top 10 ports in tourist arrivals on e-Tourist Visa during
December, 2016 were as follows:-
V. Tourism Developments
5.1 56.6% Growth in Foreign Tourists Arrival on E-Tourist Visa in December 2016 over the
same period in 2015
19
New Delhi Airport (36.6%), Mumbai Airport (23.1%), Dabolim (Goa) Airport (13.6%), Chennai
Airport (6.0%), Bengaluru Airport (5.1%),Kochi Airport (4.7%), Kolkata Airport (2.5%),
Hyderabad Airport (2.4%), Trivandrum Airport (1.9%) and Ahmadabad Airport (1.7%).
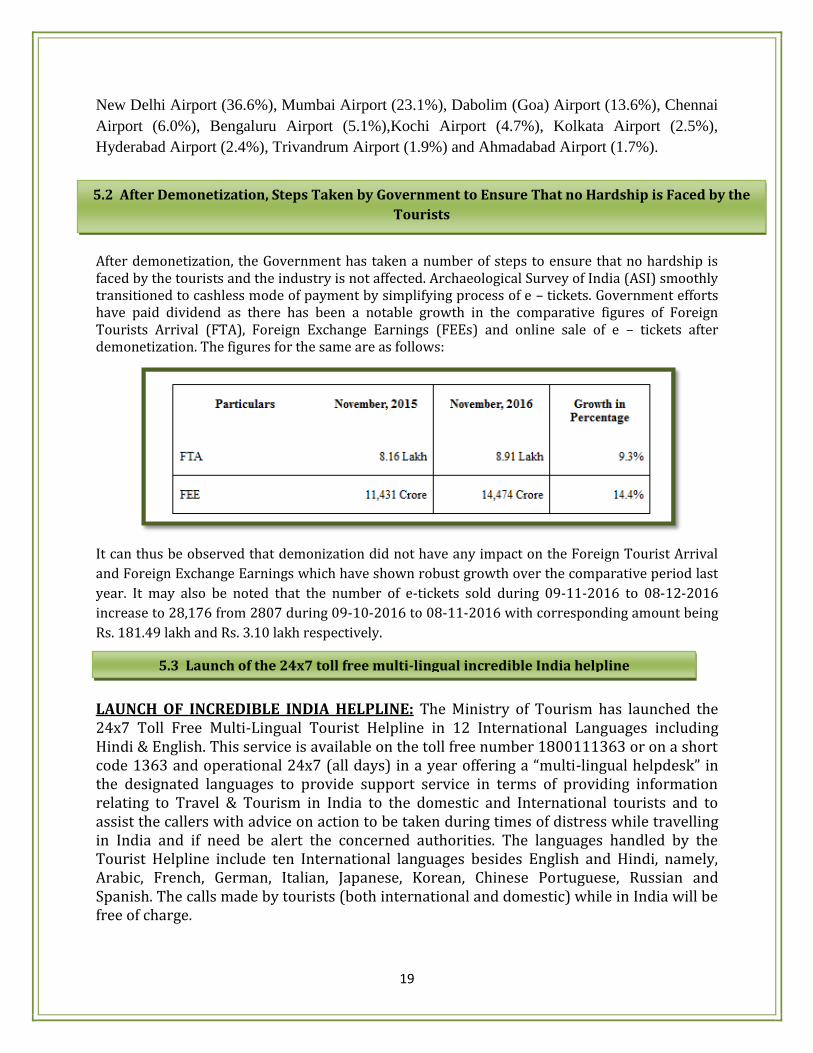
After demonetization, the Government has taken a number of steps to ensure that no hardship is faced by the tourists and the industry is not affected. Archaeological Survey of India (ASI) smoothly transitioned to cashless mode of payment by simplifying process of e – tickets. Government efforts have paid dividend as there has been a notable growth in the comparative figures of Foreign Tourists Arrival (FTA), Foreign Exchange Earnings (FEEs) and online sale of e – tickets after demonetization. The figures for the same are as follows:
It can thus be observed that demonization did not have any impact on the Foreign Tourist Arrival
and Foreign Exchange Earnings which have shown robust growth over the comparative period last
year. It may also be noted that the number of e-tickets sold during 09-11-2016 to 08-12-2016
increase to 28,176 from 2807 during 09-10-2016 to 08-11-2016 with corresponding amount being
Rs. 181.49 lakh and Rs. 3.10 lakh respectively.
LAUNCH OF INCREDIBLE INDIA HELPLINE: The Ministry of Tourism has launched the 24x7 Toll Free Multi-Lingual Tourist Helpline in 12 International Languages including Hindi & English. This service is available on the toll free number 1800111363 or on a short code 1363 and operational 24x7 (all days) in a year offering a “multi-lingual helpdesk” in the designated languages to provide support service in terms of providing information relating to Travel & Tourism in India to the domestic and International tourists and to assist the callers with advice on action to be taken during times of distress while travelling in India and if need be alert the concerned authorities. The languages handled by the Tourist Helpline include ten International languages besides English and Hindi, namely, Arabic, French, German, Italian, Japanese, Korean, Chinese Portuguese, Russian and Spanish. The calls made by tourists (both international and domestic) while in India will be free of charge.
5.2 After Demonetization, Steps Taken by Government to Ensure That no Hardship is Faced by the
Tourists
5.3 Launch of the 24x7 toll free multi-lingual incredible India helpline

20
Haryana – State Developments at a Glance
The economy of Haryana, with a population size of 25 million has grown at an average rate of about 7% during FY2013 to FY2015 and contributes approximately 4% to India’s overall GSDP1. The state is mainly an agrarian economy and a significant contributor to country’s agricultural output. The state possesses huge potential in agro exports owing to its rich agricultural base. Hence, there is a lot of scope for the development of agro based and food processing industry in the state. The industrial sector has also emerged as a significant contributor in the economic and social development of the state. The state offers favorable environment for attracting industrial investments through user friendly policies and better infrastructural support. The industrial infrastructure is being strengthened in the state through development of new industrial model townships, industrial parks and expansion of the existing industrial estates. Haryana’s natural resources, policy incentives and infrastructure support attract investments in sectors such as automobiles and auto components, IT/ITeS, financial services, textiles, agro-based industries and tourism development.
Summary of socio-economic indicators
State Capital Chandigarh
Hon'ble Chief Minister of Haryana Shri Manohar Lal
Area (Sq. km) 44,212
Population ( 2011) 25351 (in thousands)
Population Density (persons per sq km) 2011
573
Number of Districts 21 GSDP at Current Prices (FY2015) Rs.441864 Crore
Growth of GSDP at Current Prices (FY2015)
12%
GSDP at Constant prices(FY2015) Rs.366584 Crore
Growth of GSDP at Constant Prices(FY2015)
8%
Per capita Income (FY2015) Rs. 150260
Poverty rate(2011-12) 11.16%
CPI inflation(2015-16) 3.81%
Infant Mortality Rate(2013) 41 per 1000 live births
Literacy Rate (2011) 75.6%
Implementation of Reforms(ranking)* 5th
Key Industries Automotive, Agro-based industry, IT and ITeS, Textiles, Oil refining, Biotechnology, Petrochemicals, Tourism
Source: PHD Research Bureau, compiled from various official documents of the state Government of Haryana, Economic Survey 2015-16,Governmnet of India, India Brand Equity Foundation (IBEF), Ministry of Statistics and Programme Implementation (MOSPI), Niti Aayog, Press Note on Poverty Estimates, 2011-12; Government of India, Planning Commission July 2013, Census 2011, Government of India, *The ranking have been taken by Department of Industrial Policy and Promotion, Government of India on State implementation of reforms which are taken as on 13th September 2016. Note: Per Capita Income is Per Capita NSDP at Current Prices. Poverty rate represents percentage of population below poverty line. Administrative Districts are given in the table.
1 Combined GSDP of all the States

21
Haryana
S. No. Focus Area Suggestive Measures
1. Agri- agro Reforms Since the state has a diverse agro-ecology and cropping pattern it should increase agricultural productivity by implementing reforms in land settlement rules for the development of industrial and agro- infrastructure. The state should increase its share in the overall food grain production of India.
2. Infrastructure Development State infrastructure facilities should be improved by catering to the needs of industry for e.g. need based development such as focus on solid waste management, affordable clean water etc should be focused.
3. Transportation Reforms A good transport system is a major strength of any economy in order to move fast. Reforms in railways, roadways and airways are required for the long term growth perspective of the state. Improved transportation and logistics infrastructure would go a long way to enhance the competiveness of the state with special reference to its export scenario.
4.. Labour Reforms Labour is a major ingredient of the four factors of production. Labour reforms are needed in the state to help the industry to fasten and deepen the process of Industrialisation. The State should focus upon specific issues related to labour laws, it should create an agenda to solve issues annually and then monitor improvements.
5. Developing skill sets to enhance social infrastructure
The state should focus on development of core skills – including literacy, numeracy, communication skills, teamwork and problem-solving and other relevant skills – and learning abilities.
6. Obtaining Electricity Connections Creating an online application process with a facility to upload relevant supporting document can help in making the current process more efficient and productive.
7. Simplification of Environmental Procedures
The state should simplify the environmental/ pollution control procedures in order to fast track pollution control process. This will help the state to attract domestic as well as international investments.
8. Creation of more opportunities for setting up of Businesses
In order to promote business activities, the state will need to create a “comparative advantage“ when compared to other states for e.g. it might have to lower its existing taxes, charges etc.
Source: PHD Research Bureau compiled from various inputs received from Industry.

22
Sex ratio in Haryana touches 900-mark for first time in 20 years
The child sex ratio at birth (SRB) in Haryana for the first time has touched 900-mark
in two decades. SRB in December 2016 in Haryana was 914. From January to
December 2016 out of 5,25,278 children were born in Haryana, 2,76,414 were boys
and 2,48,864 were girl.
Wi-fi in 100 Haryana villages
The government of Haryana on 25 December 2016 connected 100 villages in the state with Wi-Fi
services. It also decided to rename all common service centres (CSC), which have been opened in
urban and rural areas, and E-disha centres as ‘Atal Seva Kendras’ at district headquarters.
This decision was announced by the state’s Chief Minister Manohar Lal Khattar during the launch of
53 new IT services concerning six departments on the occasion of ‘Good Governance Day’, which is
celebrated every year to mark the birthday of former Prime Minister Atal Bihari Vajpayee.
The minister also conducted a lucky draw of the digital transaction award scheme, which was. aimed
at promoting cashless transactions in the state. A total of 65 people were declared winners with five
winning a cash prize of Rs 10000 each, 10 winning a prize of Rs 5000 each and 50 winning a cash
prize of Rs 1000 each. All were rewarded for actively using cashless transactions.
Key Highlights
With the introduction of the new IT services, the residents of the villages would be able to access
170 e-services through the ‘Atal Seva Kendras’.
All the CSCs in rural areas would be shifted to Gram Sachivalyas so that all facilities are made
available to the people under one roof.
With this, facilities available at CSCs will also be made available at E-disha centres.
Apart from this, the state’s Chief Minister also stated that from now on, students passing class 10
and 12 from Haryana School Education Board would be getting their certificates through digital
locker.
Manohar Lal Khattar also launched a set up called ‘Knowledge Warehouse’ through video
conference in Gurgaon. The warehouse, which is a result of joint efforts put in by Nasscom and
Hartron, aims to serve as a platform that can help promote start-ups. Initially, only 40 start-ups
would be able to avail its services but later the number will be increased to 80.
Latest Developments in the State
23
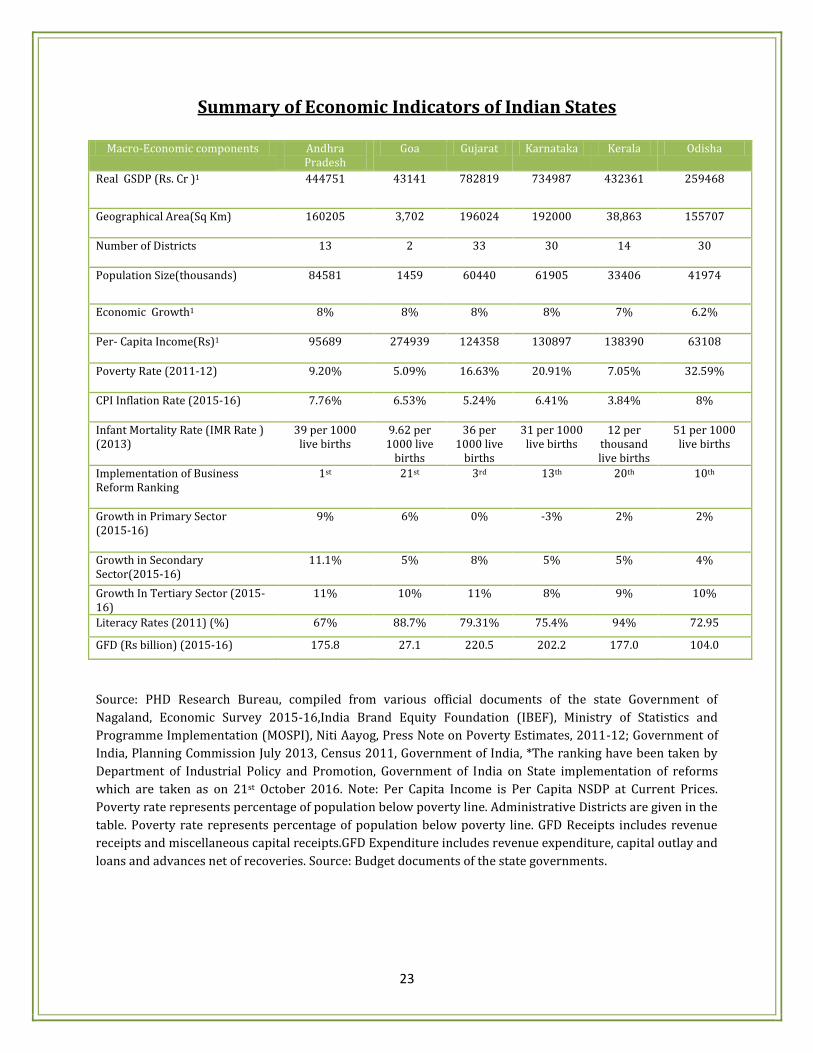
Summary of Economic Indicators of Indian States
Source: PHD Research Bureau, compiled from various official documents of the state Government of
Nagaland, Economic Survey 2015-16,India Brand Equity Foundation (IBEF), Ministry of Statistics and
Programme Implementation (MOSPI), Niti Aayog, Press Note on Poverty Estimates, 2011-12; Government of
India, Planning Commission July 2013, Census 2011, Government of India, *The ranking have been taken by
Department of Industrial Policy and Promotion, Government of India on State implementation of reforms
which are taken as on 21st October 2016. Note: Per Capita Income is Per Capita NSDP at Current Prices.
Poverty rate represents percentage of population below poverty line. Administrative Districts are given in the
table. Poverty rate represents percentage of population below poverty line. GFD Receipts includes revenue
receipts and miscellaneous capital receipts.GFD Expenditure includes revenue expenditure, capital outlay and
loans and advances net of recoveries. Source: Budget documents of the state governments.
Macro-Economic components Andhra Pradesh
Goa Gujarat Karnataka Kerala Odisha
Real GSDP (Rs. Cr )1 444751 43141 782819 734987 432361 259468
Geographical Area(Sq Km) 160205 3,702 196024 192000 38,863 155707
Number of Districts 13 2 33 30 14 30
Population Size(thousands) 84581 1459 60440 61905 33406 41974
Economic Growth1 8% 8% 8% 8% 7% 6.2%
Per- Capita Income(Rs)1 95689 274939 124358 130897 138390 63108
Poverty Rate (2011-12) 9.20% 5.09% 16.63% 20.91% 7.05% 32.59%
CPI Inflation Rate (2015-16) 7.76% 6.53% 5.24% 6.41% 3.84% 8%
Infant Mortality Rate (IMR Rate ) (2013)
39 per 1000 live births
9.62 per 1000 live
births
36 per 1000 live
births
31 per 1000 live births
12 per thousand live births
51 per 1000 live births
Implementation of Business Reform Ranking
1st 21st 3rd 13th 20th 10th
Growth in Primary Sector (2015-16)
9% 6% 0% -3% 2% 2%
Growth in Secondary Sector(2015-16)
11.1% 5% 8% 5% 5% 4%
Growth In Tertiary Sector (2015-16)
11% 10% 11% 8% 9% 10%
Literacy Rates (2011) (%) 67% 88.7% 79.31% 75.4% 94% 72.95
GFD (Rs billion) (2015-16) 175.8 27.1 220.5 202.2 177.0 104.0

24
Source: PHD Research Bureau, compiled from various official documents of the state Government of
Nagaland, Economic Survey 2015-16,India Brand Equity Foundation (IBEF), Ministry of Statistics and
Programme Implementation (MOSPI), Niti Aayog, Press Note on Poverty Estimates, 2011-12; Government of
India, Planning Commission July 2013, Census 2011, Government of India, *The ranking have been taken by
Department of Industrial Policy and Promotion, Government of India on State implementation of reforms
which are taken as on 21st October 2016. Note: Per Capita Income is Per Capita NSDP at Current Prices.
Poverty rate represents percentage of population below poverty line. Administrative Districts are given in the
table. Poverty rate represents percentage of population below poverty line. GFD Receipts includes revenue
receipts and miscellaneous capital receipts.GFD Expenditure includes revenue expenditure, capital outlay and
loans and advances net of recoveries. Source: Budget documents of the state governments.
Macro-Economic components
Maharashtra Tamil Nadu
Telangana Arunachal Pradesh
UP** West Bengal
Real GSDP (Rs. Cr )1 1524845 942735 429000 13275 833159
725801
Geographical Area(Sq Km) 307714 130058 114840 83,743 2,40,928
88752
Number of Districts 35 32 10 17 75 20
Population Size(thousands) 112374 72147 35194 1384 199812
91276
Economic Growth1 65 9% 9% 6% 6.2% 11%
Per- Capita Income(Rs)1 134081 135806 129182 101033 44197 78903
Poverty Rate (2011-12) 17.35% 11.28% NA 34.7% 29.43%
19.98%
CPI Inflation Rate (2015-16) 3.89% 5.22% 5.7% NA 4.77% 5.2%
Infant Mortality Rate (IMR Rate ) (2013)
24 per 1000 live births
21 per 1000 live
births
28 per 1000 live
births
32 per 1000 live births
50 per 1000 live
births
31 per 1000 live births
Implementation of Business Reform Ranking
11th 18th 2nd 31st 15th 14th
Growth in Primary Sector (2015-16)
-7% -2% -2% 3% 6% NA
Growth in Secondary Sector(2015-16)
5% 7% 9% 11% 5% NA
Growth In Tertiary Sector (2015-16)
10% 10% 11% 16% 8% NA
Literacy Rates (2011) (%) 82.3% 80.15 66.5% 65.4% 67.7% 76.3%
GFD (Rs billion) (2015-16) 307.3 318.3 169.7 5.1 315.6 159.8

25
Source: PHD Research Bureau, compiled from various official documents of the state Government of
Nagaland, Economic Survey 2015-16,India Brand Equity Foundation (IBEF), Ministry of Statistics and
Programme Implementation (MOSPI), Niti Aayog, Press Note on Poverty Estimates, 2011-12; Government of
India, Planning Commission July 2013, Census 2011, Government of India, *The ranking have been taken by
Department of Industrial Policy and Promotion, Government of India on State implementation of reforms
which are taken as on 21st October 2016. Note: Per Capita Income is Per Capita NSDP at Current Prices.
Poverty rate represents percentage of population below poverty line. Administrative Districts are given in the
table. Poverty rate represents percentage of population below poverty line. GFD Receipts includes revenue
receipts and miscellaneous capital receipts.GFD Expenditure includes revenue expenditure, capital outlay and
loans and advances net of recoveries. Source: Budget documents of the state governments.
Macro-Economic components
Haryana Chhattisgarh
MP Jharkhand
Punjab Uttarakhand*
Real GSDP (Rs. Cr )1 366584 188829 367827 190353 313275 143639
Geographical Area(Sq Km) 44,212 135194 308000 79,714 50,362 53,483
Number of Districts 21 27 51 24 22 13
Population Size(thousands) 25351 25545 72627 32988 27743 10086
Economic Growth1 8% 8% 7% 11% 5% 7%
Per- Capita Income(Rs)1 150260 73758 51371 58344 114561 139184
Poverty Rate (2011-12) 11.16% 39.93% 31.65% 36.96% 8.26% 11.26%
CPI Inflation Rate (2015-16)
3.81% 6.11% 3.65% 6.29% 2.61% 2.91%
Infant Mortality Rate (IMR Rate ) (2013)
41 per 1000 live births
46 per 1000 live
births
54 per 1000 live
births
37 per 1000 per live births
26 per 1000 live
births
32 per 1000 live births
Implementation of Business Reform Ranking
5th 6th 7th 8th 12th 9th
Growth in Primary Sector (2015-16)
-1% 2% 7% 10% -3% 9%
Growth in Secondary Sector(2015-16)
6% 8% 7% 12% 4% 11%
Growth In Tertiary Sector (2015-16)
11% 9% 9% 16% 9% 17%
Literacy Rates (2011) (%) 75.6% 70.3% 69.3% 66.4% 75.8% 78.8%
GFD (Rs billion) (2015-16) 164.2 68.4 167.5 51.6 119.0 41.0

26
Source: PHD Research Bureau, compiled from various official documents of the state Government of Nagaland, Economic Survey 2015-16,India Brand Equity Foundation (IBEF), Ministry of Statistics and Programme Implementation (MOSPI), Niti Aayog, Press Note on Poverty Estimates, 2011-12; Government of India, Planning Commission July 2013, Census 2011, Government of India, *The ranking have been taken by Department of Industrial Policy and Promotion, Government of India on State implementation of reforms which are taken as on 21st October 2016. Note: Per Capita Income is Per Capita NSDP at Current Prices. Poverty rate represents percentage of population below poverty line. Administrative Districts are given in the table. Poverty rate represents percentage of population below poverty line. GFD Receipts includes revenue receipts and miscellaneous capital receipts.GFD Expenditure includes revenue expenditure, capital outlay and loans and advances net of recoveries. Source: Budget documents of the state governments, CAG for 2013-14 in respect of Jammu & Kashmir.
Macro-Economic components
Bihar HP Delhi Assam Jammu& Kashmir
Meghalaya
Real GSDP (Rs. Cr )1 317015 89049 420901
156895 85168 21660
Geographical Area(Sq Km)
94,163 55,673 1483 78,483 222,236 22429
Number of Districts 38 12 11 34 22 7 Population Size(thousands)
104099 6865 16788 31206 12541 2967
Economic Growth1 16% 7.5% 8% 3.3% -1% 2.3%
Per- Capita Income(Rs)1 34856 119720 252011
53618 65598 71101
Poverty Rate (2011-12) 33.74% 8.06% 9.91% 31.98% 10.35% 11.87%
CPI Inflation Rate (2015-16)
5.47% 2.63% 4.09% 5.23% 3.74% 7.18%
Infant Mortality Rate (IMR Rate ) (2013)
42 per 1000 live
births
35 per 1000 live
births
24 per 1000 live
births
54 per 1000 live
births
37 per 1000 live
births
47 per 1000 live
births
Implementation of Business Reform Ranking
16th 17th 19th 23rd 32nd 34th
Growth in Primary Sector (2015-16)
-1% -5% 1% 1% -12% 9%
Growth in Secondary Sector(2015-16)
13% 8% 20% 7% 1% 27%
Growth In Tertiary Sector (2015-16)
7% 12% 7% 12% 1% 3%
Literacy Rates (2011) (%)
61.8% 82.8% 86.2% 73.18% 67.2% 74.4%
GFD (Rs billion) (2015-16)
135.8 32.8 4.2 46.8 66.3 8.2

27
Source: PHD Research Bureau, compiled from various official documents of the state Government of
Nagaland, Economic Survey 2015-16,India Brand Equity Foundation (IBEF), Ministry of Statistics and
Programme Implementation (MOSPI), Niti Aayog, Press Note on Poverty Estimates, 2011-12; Government of
India, Planning Commission July 2013, Census 2011, Government of India, *The ranking have been taken by
Department of Industrial Policy and Promotion, Government of India on State implementation of reforms
which are taken as on 21st October 2016. Note: Per Capita Income is Per Capita NSDP at Current Prices.
Poverty rate represents percentage of population below poverty line. Administrative Districts are given in the
table. Poverty rate represents percentage of population below poverty line. GFD Receipts includes revenue
receipts and miscellaneous capital receipts.GFD Expenditure includes revenue expenditure, capital outlay and
loans and advances net of recoveries. Source: Budget documents of the state governments.
Macro-Economic components Manipur Mizoram Nagaland
Real GSDP (Rs. Cr )1 13711 9428 14647
Geographical Area(Sq Km) 22327 21087 16579
Number of Districts 9 8 11
Population Size(thousands) 2856 1097 1979
Economic Growth1 10.2% 9% 7.3%
Per- Capita Income(Rs)1 46740 85359 76679
Poverty Rate (2011-12) 36.89% 20.40% 18.88%
CPI Inflation Rate (2015-16) 2% 5.37% 5.99%
Infant Mortality Rate (IMR Rate ) (2013)
10 per 1000 live births
35.83 per 1000 live births
18 per 1000 live births
Implementation of Business Reform Ranking
28th 29th 27th
Growth in Primary Sector (2015-16)
-2% 11% 2%
Growth in Secondary Sector(2015-16)
4% 5% 15%
Growth In Tertiary Sector (2015-16)
11% 8% 0%
Literacy Rates (2011) (%) 76.9% 91.3% 79.6%
GFD (Rs billion) (2015-16) 5.8 1.1 11.6

28
Study/Project Team

29
Study/Project Team
Dr. S P Sharma Chief Economist and Director of Research
Ms. Mahima Kaushal Research Associate
Disclaimer
“State Development Monitor” is prepared by PHD Chamber of Commerce and Industry to provide a broad view of developments in Indian states. This newsletter may not be reproduced, wholly or partly in any material form, or modified, without prior approval from the Chamber. It may be noted that this book is for guidance and information purposes only. Though due care has been taken to ensure accuracy of information to the best of the PHD Chamber’s knowledge and belief, it is strongly recommended that readers should seek specific professional advice before taking any decisions.
Please note that the PHD Chamber of Commerce and Industry does not take any responsibility for outcome of decisions taken as a result of relying on the content of this book. PHD Chamber of Commerce and Industry shall in no way, be liable for any direct or indirect damages that may arise due to any act or omission on the part of the Reader or User due to any reliance placed or guidance taken from any portion of this book. Copyright 2016 PHD Chamber of Commerce and Industry
ALL RIGHTS RESERVED. No part of this book including the cover, shall be reproduced, stored in a retrieval system, or transmitted by any means, electronic, mechanical, photocopying, recording or otherwise, without the prior written permission of, and acknowledgement of the publisher (PHD Chamber of Commerce and Industry).

30
PHD Research Bureau
PHD Research Bureau; the research arm of the PHD Chamber of Commerce and Industry was constituted in 2010 with the objective to review the economic situation and policy developments at sub-national, national and international levels and comment on them in order to update the members from time to time, to present suitable memoranda to the government as and when required, to prepare State Profiles and to conduct thematic research studies on various socio-economic and business developments.
The Research Bureau has been instrumental in forecasting various lead economic indicators national and sub-national. Many of its research reports have been widely covered by media and leading business newspapers.
Research Activities
Comments on Economic
Developments
Newsletters Consultancy
Research Studies Macro Economy Economic Affairs Newsletter (EAC)
Trade & Inv. Facilitation Services (TIFS)
State Profiles States Development Economic & Business Outlook (EBO)
Business Research Consultancy
Impact Assessments
Infrastructure Global Economic Monitor (GEM)
Forex Helpline
Thematic Research Reports
Foreign exchange market
Forex Newsletter Investment Advisory Services
Releases on Economic Developments
International Trade Trade & Inv. Facilitator (TIF)
Global Economy State Development Monitor (SDM)

31
Team, PHD Research Bureau
Dr. S P Sharma Chief Economist & Director of Research
Email id: [email protected]
Ms. Megha Kaul Associate Economist Economic reforms, Growth & Development
Ms. Rashmi Singh Associate Economist Global Economic Developments
Ms. Surbhi Sharma Sr. Research Officer Banking & Financial markets
Ms. Mahima Kaushal Research Associate Economic & Business Policy Environment
Mr. Rohit Singh Research Associate International Trade & Investments
Ms. Areesha Research Associate Infrastructure, Agriculture & Rural Development
Ms. Abha Chauhan Research Assistant Macro-Economic Developments (State)
Ms. Sunita Gosain Secretarial Assistant Secretarial & Administrative processes
32