state employee workforce, compensation, …sfc.virginia.gov/pdf/capital outlay and general...
TRANSCRIPT

S E N A T E F I N A N C E S U B C O M M I T T E E O N C A P I T A L O U T L A Y A N D G E N E R A L G O V E R N M E N T
STATE EMPLOYEEWORKFORCE, COMPENSATION,HEALTH BENEFITS, HR SYSTEMS
Pocahontas Building, Richmond, VirginiaJanuary 18, 2018
Department of Human Resource Management

January 18, 2018 DHRM 2
WORKFORCE

STATE WORKFORCEEMPLOYMENT LEVEL
16.7% of total employees statewide are wage
Majority of Executive Branch employees are in Education
January 18, 2018 DHRM 3
Source: DHRM EPR Reports FY17Source: DHRM EPR Reports FY17

CLASSIFIED STATE WORKFORCEDEMOGRAPHICS
January 18, 2018 DHRM 4
46.4%
53.6%
Gender
Male Female
34.8%65.2
%
Race
Minority Non-Minority
8.1%
91.9%
Veterans
Veterans Non-Veterans
Average Age
46.6
Average Years of Service
11.7
Average Age of
New Hires
35.3

January 18, 2018 5
STATE WORKFORCETOP TEN AGENCIES & JOB ROLES
2/3 of workforce in ten agencies
Agency # Employees
1. University of Virginia System 14,188
2. Dept. of Corrections 11,258
3. Dept. of Transportation 7,506
4. Va. Community College System 6,514
5. Dept. of Behavioral Health and Developmental Services 6,023
6. Virginia Commonwealth Univ. 5,946
7. Virginia Tech 5,259
8. George Mason Univ. 4,100
9. Virginia Dept. of Health 3,192
10. James Madison Univ. 3,026
40% of classified workforce in 10 roles
Job Role # Employees
1. Administrative & Office Spec III 6,371
2. Security Officer III 5,790
3. Transportation Operator II 2,344
4. Direct Service Associate II 1,907
5. Program Administrative Spec I 1,890
6. Administrative & Office Spec II 1,848
7. Program Administrative Spec II 1,546
8. Housekeeping/Apparel Worker I 1,403
9. Information Technology Spec II 1,339
10. Financial Services Specialist I 1,287
Source: DHRM – as of 12/31/2017

CLASSIFIED STATE WORKFORCERECRUITMENT & RETENTION
January 18, 2018 DHRM 6
Indicate Data Trend from FY16 to FY17Source: DHRM At A Glance Reports FY17

January 18, 2018 DHRM 7
Data Source: DHRM PMIS FY17 – Report Visualized in SAS Visual Analytics
CLASSIFIED STATE WORKFORCERESIGNATIONS

CLASSIFIED STATE WORKFORCERETIREMENTS
Data Source: DHRM PMIS FY17 – Report Visualized in SAS Visual Analytics

CLASSIFIED STATE WORKFORCEROLES WITH HIGHEST TURNOVER AND
BELOW MARKET COMPENSATIONPosition Role
Code Position Role with ≥ 25 employees Resignations
49052 Direct Service Associate II 22.03%
49011 Counselor I 20.11%
49111 Licensed Practical Nurse 19.08%
49211 Psych I/Psychology Associate I 18.18%
39071 Engineering Technician I 17.70%
49112 Registered Nurse I 17.17%
49053 Direct Service Associate III 16.39%
59073 Laboratory & Research Specialist I 16.34%
29092 PR & Marketing Specialist II 16.22%
59072 Laboratory and Research Tech 16.22%
49113 RN II/Nurse Practitioner I/Physician Assistant 15.37%
69113 Security Officer III 15.13%
January 18, 2018 DHRM 9
January 18, 2018 DHRM 10
COMPENSATION

CLASSIFIED COMPENSATION AS OF 12/31/17STATEWIDE SALARIES & PAY BANDS
January 18, 2018 DHRM 11
• Lowest Paid• $16,472 Annually• 20 Food Service Technician I and 10
Housekeeping - Apparel Worker I atVa. Center for Behavioral Rehabilitation & Piedmont Geriatric Hospital
• Highest Paid• $270,250 Annually• Physician Manager II in DBHDS
• Modal Band is Pay Band 3
• Federal minimum wage • $7.25 per hour • $15,080 annually
BandsRange Employees
Minimum SW Maximum
NOVA Maximum Number Percent
1 $16,472 $46,778 $58,773 1,935 3.07%
2 $21,521 $57,644 $72,899 6,990 11.10%
3 $25,718 $66,683 $84,651 19,675 31.25%
4 $33,598 $83,649 $106,705 17,205 27.32%
5 $43,892 $105,811 $135,516 12,362 19.63%
6 $57,342 $134,764 $173,156 4,086 6.49%
7 $74,913 $172,594 $205,755 491 0.78%
8 $97,863 $222,012 $265,055 205 0.33%
9 $127,852 MARKET MARKET 18 0.03%
STATE SALARIES12/31/2017 MEAN MEDIAN 1ST
QUARTILE3RD
QUARTILE LOWEST HIGHEST COUNT
Statewide $50,518 $44,661 $35,401 $60,020 $16,472 $270,250 62,967
NOVA $59,353 $54,031 $44,301 $67,584 $22,030 $245,068 5,624
Statewide (excluding NOVA) $49,652 $43,775 $35,061 $58,749 $16,472 $270,250 57,343

January 18, 2018 DHRM 12
DHRM 2017 Annual Report on the Discrepancies in Compensation between the Public and Private SectorsThe weighted average difference shown above is weighted by count of employees in each occupation.
CLASSIFIED STATE WORKFORCEAVERAGE STATE SALARY COMPARED TO
PRIVATE INDUSTRY IN CERTAIN JOBS

PRIVATE INDUSTRY AVERAGE PAY INCREASES IN 2017
January 18, 2018 DHRM 13
Private Industry Average 2017 Salary Increases
Private Industry Average 2017 Pay Structure
Adjustments
3.0% 2.0%Private Industry Average 2017 Salary Increase for
Above Average Performers
Private Industry Average 2017 Salary Increase for
AveragePerformers
Private Industry Average 2017 Salary Increase for
Below Average Performers
4.5% 2.6% ≤1.0%DHRM 2017 Annual Report on the Discrepancies in Compensation between the Public and Private Sectors

PROJECTED PRIVATE INDUSTRY AVERAGE PAY INCREASES IN 2018
January 18, 2018 DHRM 14

January 18, 2018 DHRM 15
JLARC 2017 STUDY ONTOTAL COMPENSATION FOR
STATE EMPLOYEES

JLARC STUDYBACKGROUND
• Recommended by General Assembly’s Commission on Employee Retirement Security & Pension Reform
• Compared value of total compensation to Virginia state employees to other employers
• Researched ways to improve recruitment and retention
January 18, 2018 DHRM 16
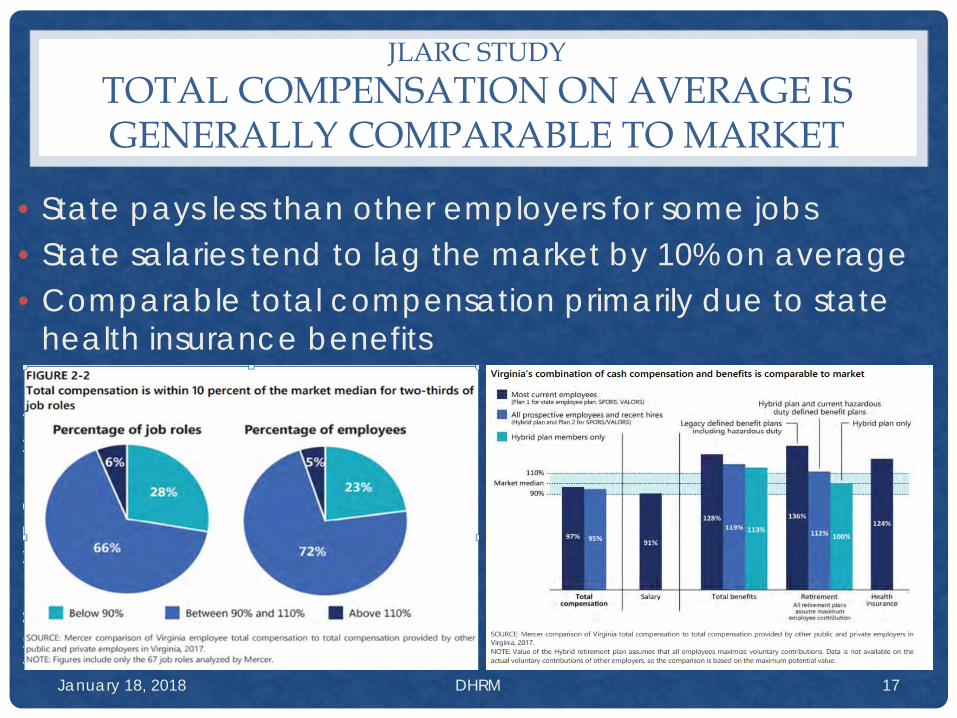
JLARC STUDYTOTAL COMPENSATION ON AVERAGE IS GENERALLY COMPARABLE TO MARKET
• State pays less than other employers for some jobs• State salaries tend to lag the market by 10% on average• Comparable total compensation primarily due to state
health insurance benefits
January 18, 2018 DHRM 17

JLARC STUDYSALARIES PLAY KEY ROLE IN MAINTAINING
QUALIFIED WORKFORCE
• Majority of agencies indicated difficulty:• Filling open positions
• Inability to perform above minimum expectations
• Attracting even minimally qualified applicants• Inability to pay competitive salaries
• Retaining qualified employees• Dissatisfaction with salary• Lack of career advancement
opportunities
January 18, 2018 DHRM 18

JLARC STUDYCENTRAL INVESTMENTS IN EMPLOYEE SALARIES
NOT MADE AT REGULAR INTERVALS
January 18, 2018 DHRM 19

JLARC STUDYSTATE LEVEL INVESTMENTS IN EMPLOYEE
SALARIES COULD BE MORE EFFECTIVE• Investments in employee salaries are costly
• 1% salary increase is ~ $45 million• Foundational to state government to operate effectively
• When salary increases not provided regularly, employees statistically more likely to leave state workforce
• Cost effectiveness of investment is limited• Lack of prioritization• Lack of consistency• Not directed to roles where salary increases needed most
• Manage salary increases more strategically• Provide at regular intervals• Prioritize for jobs with most pressing workforce challenges• Grant agencies greater authority and flexibility to differentiate salary
increases among their employees
January 18, 2018 DHRM 20

JLARC STUDYSTATE BUDGET PROCESS DEPRIORITIZES
NEEDED INVESTMENTS IN SALARY• Employee compensation competes with every other
discretionary item in state budget• Prone to be excluded based on other priorities• Without means to prioritize employee salaries in budget process, more
likely increases will not be consistently funded• Creates or exacerbates workforce challenges
• Prioritizing employee compensation at beginning of budget process is most effective approach for ensuring adequate funding
• General Assembly could consider requiring information be provided to Governor before budget process begins• Need for salary increase• Amount of salary increase
January 18, 2018 DHRM 21

JLARC STUDYSPECIFIC RECOMMENDATIONS
JLARC 2017 Total Compensation Recommendations1 Develop new or more effective career ladder programs.
2 Provide complete and accurate information in the Recruit Management System
3 Develop methodology to determine employee base salary increases
4Provide funding for a third party consultant to update total compensation periodically
5Report on job role salary increases and additional recruitment and retention information
6 Report on impact of previous salary increases on recruitment and retention
7 Provide an option for agencies to provide variable salary increases
8 Establish guidelines for performance-based pay models
9 Develop and offer mandatory training for agency human resource managers
January 18, 2018 DHRM 22
• DHRM agrees with the JLARC recommendations• Additional resources are needed to accomplish the objectives

January 18, 2018 DHRM 23
HEALTH BENEFITS

HEALTH INSURANCE PREMIUMS
• Plan design impacts health insurance premiums• Coverage
• Impacts members• Premium split – Employer and Employee
• Impacts pool• Out of pocket expenses – deductibles, co –pays, coinsurance
• Impacts users
January 18, 2018 DHRM 24

HEALTH BENEFITSJLARC OPTIONS TO REDUCE EMPLOYEE
HEALTH INSURANCE• JLARC recommendations to change employee cost
sharing• Change employee/employer premium split• Increase annual deductible• Increase annual out-of-pocket limits
• JLARC recommendations to incentivize employees to choose a different health plan• Provide incentive for employees to enroll in COVA HDHP• Provide incentive for employees to enroll in alternative
health insurance
January 18, 2018 DHRM 25

DHRM Plan Design Options Impact Amount
1 Increase Out-of-Pocket limits from $1500/$3000/$3000 to $2000/$4000/$4000 Save $19,643,630
2 Implement Shared Savings Incentive Program for savings shared between employee and employer Save $4,000,000 -
$6,700,000
3 Provide 1st month of generic drug free Save $1,500,000
4 Review appropriate clinical setting for specialty drug infusion with provider Save $1,080,000
5 Provide pharmacy home for certain members to mitigate use of drug abuse through pharmacy shopping Save $880,000
6 Provide behavior health intensive in-home services for members age 6 to 17 to prevent readmission Save $191,334
7 Increase FSA maximum contribution from $2600 to $2650, the new legal cap Save $4,775
8 Limit new scripts of short-acting opioid analgesics to 7 day supply per fill and 14 day supply for 30 days to curb drug abuse N/A N/A
9 Provide Online Psychiatry to increase access N/A N/A
10 Consider implementing FLEX Benefits TBD TBD
11 Consider implementing Waste Calculator recommendations TBD TBD
12 Provide free LiveHealth Online to increase utilization Cost $9,400
13 Include coverage for routine annual eye exam Cost $1,636,560January 18, 2018 DHRM 26
HEALTH BENEFITSDHRM OPTIONS FOR
EMPLOYEE HEALTH INSURANCE

January 18, 2018 DHRM 27
HUMAN RESOURCE SYSTEMSP E R S O N N E L M A N A G E M E N T I N F O R M A T I O N S Y S T E M S

INFORMATION TECHNOLOGY
PMIS MIGRATION PROJECT UPDATE• What: Migrated all DHRM’s systems running on the Unisys Mainframe to a
modern environment
• Why: Money and people• Cost avoidance - ~ $20 million in new charges annually for full cost of mainframe if
DHRM is sole user of the system
• Staffing issues – 80% of the Unisys mainframe systems eligible for retirement with dwindling pool of resources that could support the system
• Who: Procured vendor services to translate the system from its legacy technologies to modern ones, the only solution that could meet the state’s timeline
• When: Executed statement of work in February 2015 and transitioned to new environment in February 2017
• How Much: $2.72 million appropriated in FY15 and $2.72 million in FY16, with unused funds carried forward
• Status: Project completed within scope and on budgetJanuary 18, 2018 DHRM 28

INFORMATION TECHNOLOGY
STATUS OF MODERNIZED SYSTEM• Personnel Management Information System (PMIS)
• Implemented Emergency Response Contingency Plan day after Migration Go Live –High impact to customers, state payroll, and VRS for two months
• Ongoing dysfunction with daily transactions – High customer impact• Increased daily down time for maintenance – Moderate customer impact• Critical batch tools dysfunctional requiring manual entry of high volume transactions• Time required to implement statewide pay raise increased from 2 hours for 2 people in
past years to 11 days for 10 people
• Incentive & Performance Increase (IPP System)• Dysfunctional post-migration
• Enterprise Position Reporting (EPR)• Unstable post-migration• Requires excessive manual intervention to produce reports
• Benefits Eligibility System (BES)• Open Enrollment tool dysfunctional, requiring paper process for 2017 Open Enrollment• Premium Rewards delayed, requiring extensive manual intervention and data entry
January 18, 2018 DHRM 29

INFORMATION TECHNOLOGYREQUEST FOR INFORMATION ISSUED
• VITA issued RFI for an integrated modern HR system
January 18, 2018 DHRM 30
Talent Acquisition & Onboarding Talent ManagementCompensationBenefitsPerformance ManagementCareer & SuccessionWorkforce Planning & AnalyticsOrganization Management Learning Time, Attendance & LeaveAudit & ComplianceDigital Records Self-ServiceMobileOther

INFORMATION TECHNOLOGYAPPROPRIATIONS ACT LANGUAGE
• Appropriations Act - Item 475 Q• VITA to study and submit recommendations for
development, support and governance of personnel information system to replace PMIS by September 1, 2018
• Governor to select a state agency to develop and maintain personal information system considerations• Maximize efficiencies of enterprise system• Single source of personal information• Greater security of sensitive personally identifiable information
• Governor authorized working capital advance of up to $25 million
January 18, 2018 DHRM 31

January 18, 2018 DHRM 32
QUESTIONS ?