state finances - rbidocs.rbi.org.in
TRANSCRIPT


STATE FINANCESA STUDY OF BUDGETS OF
2019-20
RESERVE BANK OF INDIASeptember 2019

In India – `600 (Over the counter)
– `650 (Inclusive of Postal Charges)
Abroad – US $24 (Inclusive of Air Mail Courier Charges)
© Reserve Bank of India 2019All rights reserved. Reproduction is permitted provided an acknowledgement of the source is made.
Published by Sangita Misra for the Reserve Bank of India, Mumbai 400 001 and designed and printed by her at Jayant Printery LLP, 352/54, Girgaum Road, Murlidhar Compound, Near Thakurdwar Post Office, Mumbai - 400 002.

FOREWORD
The Reserve Bank of India (RBI) brings out an annual publication entitled “State Finances:
A Study of Budgets” which analyses the fiscal position of state governments on the basis
of primary state level data. With about a dozen states facing state elections this summer,
presentation of their final budgets was delayed till July-September 2019. In spite of this
unavoidable speed breaker, this year’s Report is based on the final budgets of all states.
It analyses the underlying dynamics of budget estimates (BE) for 2019-20 against the
backdrop of actual and revised (and provisional accounts) outcomes for 2017-18 and 2018-
19. This year’s Report also releases time series data published in State Finances Reports
since 1990-91.
The salient features that emerge from the analysis of state finances in the Report are:
• States’ gross fiscal deficit (GFD) has remained within the FRBM threshold of 3 per cent
of gross domestic product (GDP) during 2017-18 and 2018-19. This has, however, been
achieved by sharp retrenchment in expenditures, in particular, capital expenditure.
• For 2019-20, states have budgeted for a consolidated GFD of 2.6 per cent of GDP with
a marginal revenue surplus (as against revenue deficits in the previous three years).
• Outstanding debt of states have risen over the last five years to 25 per cent of GDP,
posing medium-term challenges to its sustainability.
• Revenue generation holds the key to prudent debt management and can act as a
circuit breaker in perverse debt spirals, highlighting the need to raise tax buoyancy and
capitalise on technology enabled efficiency gains, while exploiting the scope for raising
user charges wherever possible, with reduced reliance on borrowings.
• Incipient risks to debt sustainability emanate from losses of DISCOMs as well as
potential invocation of guarantees.
• A combination of consolidation, reissuances and maturity elongation can help in
improving liquidity, and in developing a secondary market with a diversified investor
base with differential pricing operating as market discipline among states.
In the spirit of cooperative and competitive federalism, this Report has tried to assimilate
state-wise facts on fiscal parameters that can perform the role of metrics of competition
and mutual learning. Above all else states must not compromise on their social and capital
expenditures: they have profound macroeconomic and social implications as evident in the

slowdown in economic activity in India which is leading and coincident with the cutback in
spending by states.
The Report has been prepared in the Division of State Finances (DSF) of the Department
of Economic and Policy Research (DEPR) by a team led by Smt. Sangita Misra, Director,
under the overall guidance and supervision of Dr. Rajiv Ranjan, Adviser and Officer-in-
Charge. Members of the team are Shri Bichitrananda Seth (Assistant Adviser), Shri
Khaijamang Mate, Shri Rahul Agarwal and Dr. Kirti Gupta (Research Officers). Officers from
the Division of Central Finances (DCF) i.e. Dr. Samir Ranjan Behera (Director), Shri Neeraj
Kumar (Assistant Adviser), Smt. Kaushiki Singh and Shri Saksham Sood (Research Officers)
also contributed to the Report. Data compilation support provided by Shri Nirmal Kumar,
Ms. Archana Verma and Shri G. Hamand is gratefully acknowledged.
For the benefit of valuable intellectual inputs and rich discussions, the team is grateful to
Shri Sitikantha Pattnaik, Shri T.K.Rajan, Shri Rajinder Kumar, Dr. Rajeev Jain, Dr. Brijesh,
Dr. Ramesh Golait, Shri Suraj S., Smt. Upasana Sharma and Shri Sourit Das.
Support was also received from the Internal Debt Management Department and the regional
offices of DEPR which is gratefully acknowledged. Discussions with and data inputs from the
finance departments of State Governments and Union Territories, the Ministry of Finance,
Government of India and the Office of the Comptroller and Auditor General (CAG) of India
have enriched the contents of this Report.
This Report is available on the RBI’s website (www.rbi.org.in). Feedback/comments
are solicited to help improve the analytical and informational content of the Report. They
may be sent to the Director, Division of State Finances, Department of Economic and
Policy Research, Amar Building (6th Floor), Reserve Bank of India, Shahid Bhagat
Singh Road, Mumbai- 400 001 or through email ([email protected]).
Michael Debabrata Patra
Executive Director
September 30, 2019
..

i
CONTENTSPage
No.
Foreword
List of Abbreviations
Chapter I: Overview 1
Chapter II: Fiscal Position of State Governments
1. Introduction ......................................................................................................... 3
2. Accounts: 2017-18 .............................................................................................. 3
3. Revised Estimates: 2018-19 ............................................................................... 5
4. Budget Estimates: 2019-20 ................................................................................. 10
5. Financing and Market Borrowing ........................................................................ 14
6. Outstanding Liabilities of State Governments ..................................................... 20
7. Concluding Observations .................................................................................... 22
Annex II.1: States’ Revenue: Variability and Predictability .................................. 23
Annex II.2: List of State Government Health Care Schemes .............................. 25
Chapter III: Debt: States’ Medium-Term Fiscal Challenge
1. Introduction ......................................................................................................... 27
2. States’ Revenue .................................................................................................. 28
2.1 Own Tax Revenue ....................................................................................... 29
2.2 States’ Non-Tax Revenue ........................................................................... 37
2.3 Central Transfers ......................................................................................... 39
3. States’ Liability Burden: Power Distribution ........................................................ 42
3.1 Power Distribution Utilities .......................................................................... 43
3.2 Impact of Power Distribution Restructuring ............................................... 44
4. Guarantees .......................................................................................................... 47

ii
5. Market Borrowings by States .............................................................................. 50
5.1 Liquidity of State Development Loans (SDLs) ............................................ 51
5.2 Pricing of SDLs ........................................................................................... 51
5.3 Maturity Profile of SDLs .............................................................................. 54
5.4 Ownership Pattern of SDLs ........................................................................ 55
6. Debt Sustainability .............................................................................................. 56
7. Concluding Observations .................................................................................... 63
Annex III.1: Evolving Institutional Mechanism for GST ..................................... 65
Annex III.2: Timeline of GST Council Meetings and Major Decisions ............... 67
Annex III.3: Power Distribution – a Short History of Reforms and Government
Programmes ................................................................................... 75
Chapter IV: Way Forward ................................................................................................... 77
References .......................................................................................................................... 79
Explanatory Note on Data Sources and Methodology .................................................... 82
e-STATES Database .......................................................................................................... 84
LIST OF BOXES
II.1 Farm Loan Waivers and Income Support Schemes ................................................. 7
II.2 Ayushman Bharat Programme ................................................................................. 15
III.1 Tax Buoyancy at the State Level .............................................................................. 32
III.2 Risks from Future Takeover of Losses under UDAY ................................................. 48
III.3 Reissuances of SDLs and Liquidity .......................................................................... 52
III.4 Elongation of Debt: Telangana Experience ............................................................... 54
III.5 Debt Sustainability of Indian States: An Empirical Assessment ............................... 60
Page No.

iii
LIST OF TABLES
II.1 Major Deficit Indicators: All States and Union Territories with Legislature ............... 3
II.2 Aggregate Receipts of State Governments and UTs ............................................... 5
II.3 Expenditure Pattern of State Governments and UTs ............................................... 6
II.4 Fiscal Position of States .......................................................................................... 10
II.5 Deficit Indicators of State Governments – State-wise ............................................. 11
II.6 Variation in Major Items ............................................................................................ 13
II.7 Composition of Expenditure on Social Services (Revenue and Capital Accounts) .. 14
II.8 Financing Pattern of Gross Fiscal Deficit ................................................................. 16
II.9 Market Borrowings of States .................................................................................... 17
II.10 Maturity Profile of Outstanding State Government Securities ................................. 19
II.11 Investments of Surplus Cash Balances of State Governments ............................... 19
II.12 Investments in CSF/GRF by States .......................................................................... 20
II.13 Outstanding Liabilities of State Governments and UTs ............................................ 20
II.14 Composition of Outstanding Liabilities of State Governments ................................ 21
III.1 States’ Own Tax Revenue - Composition ................................................................ 30
III.2 Stamp Duty Collections ............................................................................................ 36
III.3 Non-Tax Revenue Composition ................................................................................ 38
III.4 Trend in Central Transfers as a Ratio to Total Revenue and Expenditure of States . 40
III.5 Tax Devolution: Changing Pattern ............................................................................ 40
III.6 Trend in Special Levies (Cess and Surcharges) by the Central Government .......... 41
III.7 FPI in State Development Loans: Limits and Investment ......................................... 56
III.8 States’ Debt Sustainability - Indicator-based Analysis ............................................ 59
III.9 Key Assumption for States DSA Model .................................................................... 62
III.10 Debt Sustainability Analysis - Key Assumption and Results .................................... 62
LIST OF CHARTS
II.1 Major Deficit Indicators ............................................................................................ 4
II.2 Fiscal Position of States: 2017-18 vis-à-vis 2016-17 ............................................... 4
II.3 States’ Capital Outlay: Trends .................................................................................. 6
Page No.

iv
II.4 Committed Expenditure ........................................................................................... 9
II.5 Gross Fiscal Deficit: State Governments ................................................................. 9
II.6 States-wise GFD as per cent to GSDP in 2019-20 (BE) .......................................... 12
II.7 GST and Non-GST Collections ................................................................................ 12
II.8 Social Sector Expenditure ........................................................................................ 14
II.9 Quality of Expenditure .............................................................................................. 17
II.10 Movement of SDL Yields .......................................................................................... 18
II.11 Maturity Profile of SDLs ............................................................................................ 18
II.12 Negative Carry of State Government Investments ................................................... 18
II.13 States’ Outstanding Debt and Ratio of Interest Payments to Revenue Receipt ...... 21
III.1 States’ Total Revenues - Key Constituents (2019-20) .............................................. 29
III.2 States’ Total Revenue - Trend and Composition ...................................................... 29
III.3 States’ Own Tax Revenue and Central Transfers ..................................................... 30
III.4 State-wise Tax-GSDP Ratio ..................................................................................... 31
III.5 SGST Collections by States - Annual and Monthly .................................................. 33
III.6 Cross-Country Performance of Goods and Services Tax Post its Implementation . 34
III.7 Weighted Average (Effective) GST Rate ................................................................... 34
III.8 Compensation Cess for States in 2017-18 and 2018-19 RE ................................... 35
III.9 Distribution of States’ Share of Taxes on Petroleum and Alcohol
(as per cent of own tax revenue) .............................................................................. 35
III.10 Trends in Non-Tax Revenues ................................................................................... 37
III.11 Change in Non-tax Revenue, 2007-20 ..................................................................... 38
III.12 Composition of States’ Revenue – Own vis-à-vis Central Transfers ........................ 39
III.13 Total Transfers from Centre to States ....................................................................... 41
III.14 Composition of Central Transfers to States ............................................................. 42
III.15 Power Sector Contribution to State Finances .......................................................... 43
III.16 State Power Distribution Utilities Cost, Capital Employed and Revenue-
Stylised Evidence ..................................................................................................... 44
Page No.
v
III.17 Fiscal Impact of UDAY Programme .......................................................................... 45
III.18 Financial Performance of DISCOMs in Post-UDAY Period and
Contributing Factors ................................................................................................. 46
III.19 State-wise Performance of DISCOMs Post UDAY: ACS- ARR Gap and
AT & C Losses .......................................................................................................... 47
III.20 Expected Fiscal Impact on States from UDAY ......................................................... 47
III.21 Outstanding Dues of Power Utilities to Central Power Sector
Undertakings ............................................................................................................ 49
III.22 Outstanding Guarantees .......................................................................................... 49
III.23 Sectoral Distribution of Outstanding Guarantees ................................................... 49
III.24 State-wise Guarantees’ Growth and Guarantees Outstanding (per cent of GSDP) . 50
III.25 SDLs Liquidity Metrics Compared to GoI Securities ................................................ 51
III.26 SDLs Ownership Pattern and FPI Interest ................................................................ 55
III.27 Debt and Real GDP Growth ..................................................................................... 57
III.28 Debt Indicators: All states ........................................................................................ 57
III.29 Debt Dynamics of States .......................................................................................... 58
III.30 Cross-Country Subnational Government Debt (End-2018) ...................................... 58
III.31 Contribution to Changes in States Debt to GDP Ratio ............................................ 63
LIST OF APPENDIX TABLES FOR STATES’ BUDGETS 2019-20
1. Major Deficit Indicators of State Governments ........................................................ 87
2. Devolution and Transfer of Resources from the Centre ........................................... 88
3. Development and Non-Development Expenditure: Aggregate ................................ 90
4. Development Expenditure - Major Heads ................................................................ 91
5. Non-Development Expenditure - Major Heads ........................................................ 92
6. Development and Non-Development Expenditure ................................................... 93
7. Composition of Social Sector Expenditure .............................................................. 94
8. Decomposition of Gross Fiscal Deficit ..................................................................... 96
9. Financing of Gross Fiscal Deficit .............................................................................. 97
10. Financing of Gross Fiscal Deficit - As Per cent to Total ........................................... 98
Page No.

vi
11. Composition of Outstanding Liabilities of State Governments ................................ 99
12. Composition of Outstanding Liabilities of State Governments - As Proportion to Total ............................................................................................... 100
13. State Government Market Borrowings ..................................................................... 101
LIST OF STATEMENTS AND APPENDICES FOR STATES’ BUDGETS 2019-20
LIST OF STATEMENTS
1. Major Fiscal Indicators ............................................................................................. 107
2. Revenue Deficit/Surplus ........................................................................................... 109
3. Gross Fiscal Deficit/Surplus ..................................................................................... 110
4. Decomposition of Gross Fiscal Deficit ..................................................................... 111
5. Financing of Gross Fiscal Deficit – 2017-18 (Accounts) ........................................... 112
6. Financing of Gross Fiscal Deficit – As per cent to Total – 2017-18 (Accounts) ........ 113
7. Financing of Gross Fiscal Deficit – 2018-19 (RE) ..................................................... 114
8. Financing of Gross Fiscal Deficit – As per cent to Total – 2018-19 (RE) .................. 115
9. Financing of Gross Fiscal Deficit – 2019-20 (BE) ..................................................... 116
10. Financing of Gross Fiscal Deficit – As per cent to Total – 2019-20 (BE) .................. 117
11. Development Expenditure ........................................................................................ 118
12. Non-Development Expenditure ................................................................................ 119
13. Interest Payments ..................................................................................................... 120
14. Tax Revenue ............................................................................................................. 121
15. Non-Tax Revenue ..................................................................................................... 122
16. Loans from the Centre .............................................................................................. 123
17. Devolution and Transfer of Resources from the Centre ........................................... 124
18. Composition of Outstanding Liabilities .................................................................... 125
19. Total Outstanding Liabilities of State Governments ................................................. 129
20. Total Outstanding Liabilities - As percentage of GSDP ............................................ 130
21. Market Borrowings of State Governments ............................................................... 131
22. State Government Market Loans ............................................................................. 132
23. Maturity Profile of Outstanding State Government Securities ................................. 168
Page No.

vii
24. Maturity Profile of Outstanding State Government Securities -
As Percentage to Total ............................................................................................. 169
25. Investment Outstanding in Treasury Bills ................................................................. 170
26. Expenditure on Education - As Ratio to Aggregate Expenditure ............................. 171
27. Expenditure on Medical and Public Health and Family Welfare -
As Ratio to Aggregate Expenditure .......................................................................... 172
28. Outstanding Guarantees of State Governments ...................................................... 173
29. Expenditure on Wages and Salaries ......................................................................... 174
30. Expenditure on Operations and Maintenance .......................................................... 175
31. Social Sector Expenditure ........................................................................................ 176
32. Social Sector Expenditure to Total Disbursement .................................................... 177
33. Revenue Receipts of State Governments and UTs ................................................. 178
34. Revenue Expenditure of State Governments and UTs ............................................ 179
35. Development Expenditure: Select Indicators ........................................................... 180
APPENDICES
I. Revenue Receipts of States and Union Territories with Legislature ......................... 183
II. Revenue Expenditure of States and Union Territories with Legislature.................... 217
III. Capital Receipts of States and Union Territories with Legislature ........................... 251
IV. Capital Expenditure of States and Union Territories with Legislature ...................... 268
NOTES TO APPENDICES ................................................................................................... 319
Page No.

viii
AB-HWC Ayushman Bharat - Health and Wellness Centres
AB-PMJAY Ayushman Bharat - Pradhan Mantri Jan Arogya Yojana
ACS- ARR Average Cost of Supply - Average Realisable Revenue
ADM Automatic Debit Mechanism
APDP Accelerated Power Development Programme
APDRP Accelerated Power Development and Reforms Programme
AT & C Aggregate Technical and Commercial
ATBs Auction Treasury Bills
BE Budget Estimates
BPs Basis Points
BRICS Brazil Russia India China South Africa
CAG Comptroller and Auditor General
CERC Central Electricity Regulatory Commission
CFI Consolidated Fund of India
CGA Controller General Of Accounts
CGST Central Goods and Services Tax
CPI-IW Consumer Price Index for Industrial Workers
CSF Consolidated Sinking Fund
CSS Centrally Sponsored Schemes
DDUGJY Deen Dayal Upadhyaya Gram Jyoti Yojana
List of Abbreviations
DISCOMs Distribution Companies
DSA Debt Sustainability Analysis
EC Empowered Committee
ESA Electricity Supply Act 1948
FBIL Financial Benchmark of India Private Limited
FC Finance Commission
FC-I First Finance Commission
FC-IV Fourth Finance Commission
FC-VIII Eighth Finance Commission
FC-X Tenth Finance Commission
FC-XI Eleventh Finance Commission
FC-XII Twelfth Finance Commission
FC-XIII Thirteenth Finance Commission
FC-XIV Fourteenth Finance Commission
FGLS Feasible Generalised Least Squares
FRLs Fiscal Responsibility Legislations
FPIs Foreign Portfolio Investors
FRBM Fiscal Responsibility and Budget Management
FRP Financial Restructuring Plan
GDP Gross Domestic Product
GFC Global Financial Crisis
GFD Gross Fiscal Deficit
GFHIS Government Funded Health Insurance Schemes

ix
GoI Government of India
GRF Guarantee Redemption Fund
GSDP Gross State Domestic Product
G-Sec Government Securities
GSTAT Goods and Services Tax
Appellate Tribunal
GSTN Goods and Services Tax
Network
GTR Gross Tax Revenue
HTM Held to Maturity
IGST Integrated Goods and Services
Tax
IMF International Monetary Fund
IP Interest Payment
IPDS Integrated Power Development
Scheme
IT Information Technology
ITBs Intermediate Treasury Bills
ITC Input Tax Credit
KALIA Krushak Assistance for
Livelihood and Income
Augmentation
KwH Kilowatt Hour
LAF Liquidity Adjustment Facility
LIC Life Insurance Corporation of
India
MOU Memorandum of Understanding
MSME Micro Small and Medium
Enterprises
MSP Minimum Support Price
MTF Medium-Term Framework
MTFP Medium Term Fiscal Policy
MTM Mark to Market
NABARD National Bank for Agriculture
and Rural Development
NCDC National Cooperative
Development Corporation
NCT National Capital Territory
NICR Net Incurred Claims Ratio
NIPFP National Institute of Public
Finance and Policy
NSSF National Small Savings Fund
NTR Non-Tax Revenues
OD Overdraft
OECD Organisation for Economic Co-
operation and Development
OMO Open Market Operation
OOP Out of Pocket
OSEB Orissa State Electricity Board
OTR Own Tax Revenue
OTS One Time Settlement
PA Provisional Account
PB Primary Balance
PD Primary Deficit
PF Provident Fund
PFC Power Finance Corporation
PM-KISAN Pradhan Mantri Kisan Samman
Nidhi
PNT Percentage of No Trading Days

x
R-APDRP Restructured Accelerated Power
Development and Reforms
Programme
RBI Reserve Bank of India
RD Revenue Deficit
RE Revised Estimates
RGGVY Rajiv Gandhi Grameen
Vidyutikaran Yojana
RR Revenue Receipt
RSBY Rashtriya Swasthya Bima Yojana
SBI State Bank of India
SDF Special Drawing Facility
SDG Sustainable Development Goals
SDL State Development Loans
SEBI Securities and Exchange Board
of India
SEBs State Electricity Boards
SERC State Electricity Regulatory Commission
SGST State Goods and Services Tax
SLR Statutory Liquidity Ratio
SPSEs State Public Sector Enterprises
TCS Tax Collected at Source
TDS Tax Deducted at Source
UDAY Ujwal Discom Assurance Yojana
UT Union Territory
UTGST Union Territories Goods and Services Tax
VAT Value Added Tax
VRR Voluntary Retention Route
WAY Weighted Average Yield
WMA Ways and Means Advances
WTO World Trade Organisation
YTM Yield to Maturity

1
OverviewI
1.1 A noteworthy feature of public finances
of states during 2014-19 is the strong drive
towards consolidation, a trend continuing
from the preceding five-year period (2009-
14)1. Over the recent five-year period, the
combined gross fiscal deficit of the states
[excluding Ujwal DISCOM Assurance Yojna
(UDAY) in 2015-16 and 2016-17] averaged
2.5 per cent of GDP, i.e., in striking range of
the recommendation of the FRBM Review
Committee (Chairman: Shri N.K. Singh).
This has, however, been achieved by sharp
retrenchment in expenditure, mainly capital
expenditure, with potentially adverse
implications for the pace and quality of
economic development, given the large
welfare effects of a much wider interface
with the lives of people at the federal level.
Currently, states employ about five times
more people and spend around one and a half
times more than the Centre. Moreover, public
expenditure by states influences the quality of
physical and social capital infrastructure of the
economy, with higher multiplier effects on one
hand and on the other, a more medium-term
perspective to tap into India’s demographic
dividend (Government of India, 2019) and
achieve the United Nations’ Sustainable
Development Goals (SDGs) duly endorsed
by the G20. The above the line rectitude
achieved by states in recent years has been
accompanied by an increase in indebtedness
of states, but with no incentives for prudence
or better performance with inter-generational
consequences.
1.2 States have to balance aspirational
policy choices against two major operating
constraints: generating adequate revenue
within the Legislative Framework and
adhering to Fiscal Responsibility Legislations
(FRLs). Prudent fiscal housekeeping has to
be, therefore, balanced with developmental
and sustainability perspectives. Key to an
optimal mix is states’ own revenue generation
capacity coupled with adequate support
from federal transfers so that the states
can absorb exogenous fiscal shocks in the
form of schemes like farm loan waivers, the
UDAY, farmer income support schemes and
structural reforms such as the Goods and
Services Tax (GST), without sacrificing the
hard-earned gains of fiscal consolidation so
that their finances remain sustainable over
the medium-term. Given that annual
budgetary outcomes of states are essentially
a time-varying process of accumulation of
debt, it is the sustainability of debt that holds
the key.
1.3 Against this backdrop, this year’s
Report addresses the theme of “Debt:
States’ Medium-Term Fiscal Challenge”. The
1 Using gross fiscal deficit (GFD) to gross domestic product (GDP) ratio of 2.4 per cent based on provisional account (PA) for 2018-19, the average GFD/GDP ratio for the five years period 2014-15 to 2018-19 works out to 2.5 per cent (excluding UDAY), as compared to the GFD/GDP ratio of 2.3 per cent during the preceding five years (2009-10 to 2013-14).

State Finances : A Study of Budgets of 2019-20
2
slowdown in the economy can weaken their
revenue at a time when they are confronted
with the challenges related to the structural
issues of power sector, rising off-balance
sheet/guarantees of state governments and
the growing market borrowings of state
governments, all of which have implications
for debt sustainability, going forward.
1.4 In keeping with the practice instituted
from last year’s Report, budget estimates
(BE) for 2019-20 are analysed alongside
outcomes for 2018-19 and 2017-18 in Chapter
II. States have budgeted GFD-GDP ratio of
2.6 per cent for 2019-20 as against revised
estimate of 2.9 per cent in 2018-19 (2.4 per
cent as per provisional accounts) and 2.4 per
cent in 2017-18 (actuals). Drawing on this, the
financing counterpart is examined in terms
of market borrowings and debt liabilities of
states. Outstanding debt hovered around
25 per cent of GDP since end-March 2017.
The fiscal costs of schemes like farm loan
waivers, farmer income support schemes
and Ayushman Bharat have also been
analysed.
1.5 Chapter III focuses on the theme. It
conducts a debt sustainability analysis on
states’ debt and its likely path over the
next five years, keeping in view the FRBM
Review Committee’s implied debt target of
20 per cent by 2024-25. Recognising that
revenue can act as a circuit breaker in debt
analysis, this Chapter drills down into the
various sources of revenue – their own taxes,
non-tax revenue and transfers including
devolution and grants. The focus is on revenue
augmentation by improving tax buoyancy and
efficiency. The GST experience of states over
the past two years is captured in this Chapter.
The changing role of Central transfers in
mitigating vertical imbalances among Centre
and states has been touched upon. As 2019-
20 is the terminal year of UDAY, an analysis
of the same has been done. With large scale
financing of state budgets through market
borrowings, issues relating to maturity,
liquidity and pricing of State Development
Loans (SDLs) are also covered. Case
studies from the states’ experience with
regard to reissuances and elongation are
also featured in this Chapter. A time series on
sub-national guarantees, compiled for the
first time in India, is also presented in this
Chapter.
1.6 Chapter IV concludes the report by
setting out policy perspectives in the context
of debt sustainability. The important role
of states in promoting growth given their
large share in General Government capital
expenditure with high multiplier effects is
highlighted.
1.7 Data on fiscal indicators for all
states and union territories with legislature
for 2019-20, including various budgetary
components, are presented in appendices
and statements in the Report.
1.8 One of the main highlights of this
year’s report is the release of time series
data on all the components in the revenue
and capital account of state finances since
1990-91 (see page 84).

3
Fiscal Position of State Governments1II
1. Introductionww
2.1 This Chapter draws on the latest available information on the budgets to analyse outcomes of states for 2017-18 in terms of accounts and for 2018-19 in terms of revised estimates (RE) in Section 2 and Section 3, respectively. Considering that accounts data on key fiscal indicators for 2018-19 have been released by the Comptroller and Auditor General of India (CAG) for majority of states, a preliminary analysis for 2018-19 based on these data is also presented here. Section 4 examines various facets of the budget estimates (BE)
for 2019-20. Aspects of financing including market borrowings, management of cash balances and reserve funds are the subject matter of Section 5. Analysis of outstanding liabilities of states and their composition is set out in Section 6. Concluding observations are presented in Section 7.
2. Accounts: 2017-18
2.2 States recorded a combined fiscal deficit of 2.4 per cent of GDP in 2017-18, lower by 109 basis points (bps) from 3.5 per cent in 2016-17 (Table II.1).
1 The analysis of various fiscal indicators is in proportion to GDP at current market prices, unless stated otherwise. Moreover, the analysis pertains to Final Accounts for 2017-18, Revised Estimates (RE) for 2018-19 and Budget Estimates (BE) for 2019-20.
Table II.1: Major Deficit Indicators: All States and Union Territories with Legislature
(` lakh crore)
Item 2006-11(Average)
2011-2016(Average)
2015-16 2016-17 2017-18 2018-19(BE)
2018-19(RE)
2019-20(BE)
1 2 3 4 5 6 7 8 9
Gross Fiscal Deficit 1.30 2.74 4.20 5.36 4.10 4.90 5.55 5.52(Per cent to GDP) (2.2) (2.4) (3.0) (3.5) (2.4) (2.6) (2.9) (2.6)
Revenue Deficit -0.17 -0.02 -0.03 0.36 0.19 -0.34 0.13 -0.08(Per cent to GDP) (-0.4) (-0.0) (-0.0) (0.2) (0.1) (-0.2) (0.1) (-0.0)
Primary Deficit 0.20 0.98 2.02 2.81 1.17 1.71 2.36 1.98(Per cent to GDP) (0.3) (0.8) (1.5) (1.8) (0.7) (0.9) (1.2) (0.9)
BE: Budget Estimates. RE: Revised Estimates.Note: 1. Data include 31 states and union territories with legislature. 2. Negative (-) sign indicates surplus. 3. GDP at current market prices is based on the National Statistical Office’s National Accounts 2011-12 series.Source: Budget documents of state governments.
States consolidated their fiscal position in 2017-18 and reverted to the pre-UDAY path with fiscal deficit to GDP ratio well within the fiscal responsibility legislations targets. During 2018-19 also, fiscal deficit of states continued to remain below 3.0 per cent of GDP. Debt has risen persistently since 2015-16, led by restructuring of power sector through schemes like UDAY. As per budget estimates for 2019-20, states’ fiscal deficit is projected at 2.6 per cent of GDP. Effective use of expenditure along with enhancing tax generation capacity are key to support economic growth at this juncture.

State Finances : A Study of Budgets of 2019-20
4
2.3 Even after adjusting for the impact of UDAY (0.7 per cent of GDP) on the accounts for 2016-17, there was consolidation of the order of 38 bps in 2017-18 (Chart II.1). In relation to budget estimates of 2.7 per cent of GDP too, there was a reduction of 30 bps in states’ combined GFD which was strong enough to bring about a reduction in the primary deficit.
2.4 Underlying the improvement in 2017-18 was a sharp decline in states’ spending. An increase in revenue receipts of 0.45 per cent of GDP in the form of own taxes and 0.03 per cent under grants was completely offset by a decline in tax devolution and own non-tax revenue by 0.42 and 0.06 per cent, respectively (Chart II.2a). On the capital receipts side, recovery of loans and advances posted a rise (Table II.2).
2.5 States which account for two-thirds of capital expenditure for general government recorded a fall in 2017-18, both in growth terms as well as per cent to GDP, primarily to adhere to fiscal discipline targets. On the expenditure side, a reduction of 84 bps occurred under capital expenditure — 56 bps under loans and advances and 28 bps under capital outlay. Under loans and advances, power and food storage and warehousing mainly contributed to the decline (Chart II.2b). The reduction in capital outlay was observed for most of states and was prominent across developmental

5
Fiscal Position of State Governments
Table II.2: Aggregate Receipts of State Governments and UTs(` lakh crore)
Item 2015-16 2016-17 2017-18 2018-19 (RE) 2019-20 (BE)
1 2 3 4 5 6
Aggregate Receipts (1+2) 22.99 26.47 27.76 34.29 37.63(16.8) (17.3) (16.3) (18.1) (17.7)
1. Revenue Receipts (a+b) 18.73 20.86 23.21 28.62 31.54(13.6) (13.6) (13.6) (15.1) (14.9)
a. States' Own Revenue (i+ii) 10.35 11.18 13.10 14.92 16.55(7.5) (7.3) (7.7) (7.8) (7.8)
i. States' Own Tax 8.80 9.46 11.30 12.69 14.09(6.4) (6.2) (6.6) (6.7) (6.7)
ii. States' Own Non-Tax 1.55 1.71 1.80 2.23 2.45(1.1) (1.1) (1.1) (1.2) (1.2)
b. Central Transfers (i+ii) 8.38 9.69 10.11 13.70 15.00(6.1) (6.3) (5.9) (7.2) (7.1)
i. Tax Devolution 5.06 6.08 6.05 7.59 8.52(3.7) (4.0) (3.5) (4.0) (4.0)
ii. Grants-in Aid 3.32 3.61 4.06 6.11 6.48(2.4) (2.3) (2.4) (3.2) (3.1)
2. Net Capital Receipts (a+b) 4.26 5.61 4.55 5.67 5.99(3.2) (3.7) (2.6) (3.0) (2.8)
a. Non-Debt Capital Receipts 0.08 0.16 0.40 0.52 0.62(0.1) (0.1) (0.2) (0.3) (0.3)
i. Recovery of Loans and Advances 0.07 0.16 0.40 0.52 0.60(0.1) (0.1) (0.2) (0.3) (0.3)
ii. Miscellaneous Capital Receipts 0.01 0.00 0.00 0.00 0.02(0.0) (0.0) (0.0) (0.0) (0.0)
b. Debt Receipts 4.18 5.45 4.15 5.15 5.37(3.1) (3.6) (2.4) (2.8) (2.5)
i. Market Borrowings 2.59 3.52 3.45 4.09 4.86(1.9) (2.3) (2.0) (2.2) (2.3)
ii. Other Debt Receipts 1.59 1.93 0.70 1.06 0.51(1.2) (1.3) (0.4) (0.6) (0.2)
RE: Revised Estimates. BE: Budget Estimates. Note: 1. Figures in parentheses are percent of GDP. 2. Debt receipts are on net basis.Source: Budget documents of state governments.
spending like roads and bridges, irrigation, and energy for 2017-18 (Chart II.3 a and b).
2.6 The decline in revenue expenditure was largely driven by lower spending on education, power and relief on account of natural calamities, even as non-development expenditure increased due to higher interest and pension payments; states increased revenue spending on crop husbandry and different agricultural programmes (Table II.3).
2.7 Summing up, non-development expenditure rose sharply during 2017-18 in
a break from the past. On the other hand, development expenditure suffered erosion indicating that the quality of expenditure was compromised by a combination of higher revenue expenditure and lower capital expenditure.
3. Revised Estimates: 2018-19
2.8 As per the revised estimates for 2018-19, states’ fiscal deficit at 2.9 per cent of GDP was higher by 34 basis points than the budget estimates (BE). This was primarily due to lower than budgeted receipts and higher

State Finances : A Study of Budgets of 2019-20
6
expenditure, particularly in the revenue account accruing mainly from farm loan waiver, both new announcements and existing schemes and farmer income support schemes (Box II.1).
2.9 While developmental expenditure reversed the decline recorded in the preceding year, non-developmental expenditure rose in 2018-19 (RE) continuing the trend from 2017-18
Table II.3: Expenditure Pattern of State Governments and UTs(` lakh crore)
Item 2015-16 2016-17 2017-18 2018-19 (RE) 2019-20 (BE)
1 2 3 4 5 6
Aggregate Expenditure (1+2 = 3+4+5) 23.01 26.38 27.72 34.70 37.68
(16.7) (17.2) (16.2) (18.3) (17.9)
1. Revenue Expenditure 18.70 21.22 23.40 28.75 31.46
of which: (13.6) (13.8) (13.7) (15.1) (14.9)
Interest Payments 2.18 2.55 2.93 3.20 3.55
(1.6) (1.7) (1.7) (1.7) (1.7)
2. Capital Expenditure 4.31 5.17 4.31 5.95 6.22
of which: (3.1) (3.4) (2.5) (3.1) (2.9)
Capital Outlay 3.39 3.96 3.94 5.44 5.81
(2.5) (2.6) (2.3) (2.9) (2.8)
3. Development Expenditure 16.14 18.62 18.77 24.04 25.75
(11.7) (12.1) (11.0) (12.6) (12.2)
4. Non-Development Expenditure 6.38 7.20 8.26 9.84 10.98
(4.6) (4.7) (4.8) (5.2) (5.2)
5. Others* 0.49 0.56 0.68 0.82 0.95
(0.4) (0.4) (0.4) (0.4) (0.4)
RE: Revised Estimates. BE: Budget Estimates. *: Includes grants-in-aid and contributions (compensation and assignments to local bodies).Note: 1. Figures in parentheses are percent to GDP. 2. Capital expenditure includes capital outlay and loans and advances by state governments. Source: Budget documents of state governments.

7
Fiscal Position of State Governments
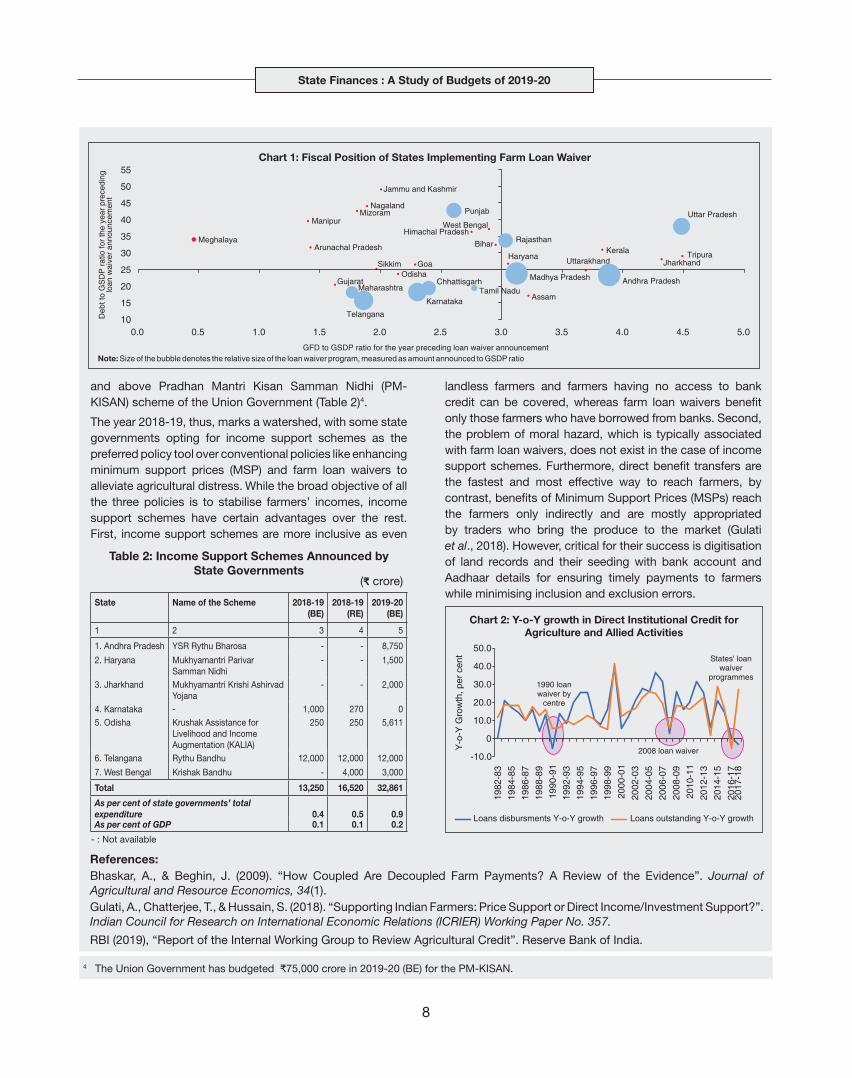
Since 2014-15, 10 states have announced loan waiver programmes of an aggregate amount of ₹2.3 lakh crore (1.4 per cent of GDP), significantly higher than the previous two nation-wide debt waiver programmes — ₹10,000 crore in 19902 and ₹52,500 crore in 2007-083. The economic rationale for loan waivers is to alleviate the debt overhang of beneficiaries to enable them to undertake productive investment and boost real economic activity (RBI, 2019). States like Rajasthan, Madhya Pradesh and Chhattisgarh announced new loan waiver programmes in 2018-19 to the tune of ₹18,000 crore (1.9 per cent of GSDP), ₹36,500 crore (4.5 per cent of GSDP) and ₹6,100 crore (1.7 per cent of state GSDP), respectively. Karnataka expanded its loan waiver programme from ₹18,000 crore announced in 2017-18 to ₹44,000 crore (3.4 per cent of GSDP) in 2018-19.
The impact of loan waivers on states’ budgets is typically staggered over three to five years, either due to phased rollouts or by clearing bank dues over multi-year pay-outs. This impact varies widely across states, ranging between 0.1 per cent of GSDP in Andhra Pradesh and Tamil Nadu to 1.8 per cent of GSDP in Chhattisgarh in 2018-19. In the 2019-20 (BE), states have allocated between 0.1 to 2.0 per cent of GSDP to farm loan waivers (Table 1).
Eight out of the ten states that announced loan waivers appear to have fiscal space to accommodate them in terms of debt levels relative to the average, though it might pose risks to the finances of some states (Chart 1). Sharp deceleration in growth of agricultural credit outstanding and declined agricultural credit disbursements has been observed in the years of loan waiver programmes, with growth bouncing back in subsequent years (Chart 2).
Farm loan waivers have also come under increasing scrutiny in the wake of their adverse impact on credit culture due to moral hazard among both beneficiaries and non-beneficiaries of the bail out (RBI, 2019). Thus, as an alternative, income support schemes for farmers were for the first time announced by some state governments in 2018-19. The defining feature of income support schemes is that they provide cash transfers to farmers which are not linked to volume of production, factor of production employed and prices. Accordingly, they are categorised as Green Box payments under the Agreement on Agriculture of the World Trade Organisation (WTO) (Bhaskar et al., 2009). Telangana was the first state to announce income support scheme for farmers. In 2019-20, six states have budgeted an allocation for income support schemes, which is over
Box II.1: Farm Loan Waivers and Income Support Schemes
Table 1: Fiscal Impact of States’ Farm Loan Waiver Programs(₹ crore)
State Year of Announcement
Amount Announced
Amount Provided in the Budget
2014-15 2015-16 2016-17 2017-18 2018-19 RE 2019-20 BE
1 2 3 4 5 6 7 8 9 1. Andhra Pradesh 2014-15 24,000 4,000
(0.9)742(0.1)
3,512(0.6)
3,602(0.6)
875(0.1)
2. Telangana 2014-15 17,000 4,250(1.0)
4,250(0.9)
2,957(0.6)
4,016(0.7)
6,000(0.9)
3. Tamil Nadu 2016-17 5,280 1,682(0.2)
1,870(0.2)
884(0.1)
807(0.1)
4. Maharashtra 2017-18 34,020 15,020(0.8)
6,500(0.3)
405(0.0)
5. Uttar Pradesh 2017-18 36,360 21,102(2.0)
5,500(0.5)
600(0.1)
6. Punjab 2017-18 10,000 348(0.1)
5,500(1.4)
3,000(0.7)
7. Karnataka 2018-19 44,000 3,917(0.4)
11,965(1.1)
12,650(1.0)
8. Rajasthan 2018-19 18,000 3,000(0.4)
3,240(0.4)
9. Madhya Pradesh 2018-19 36,500 5,000(0.9)
8,000(1.4)
10. Chhattisgarh 2018-19 6,100 4,223(1.8)
5,000(2.0)
Total 2,31,260 8,250 4,992 8,151 49,875 43,447 39,703
As per cent of state governments’ total expenditure 0.4 0.2 0.3 1.8 1.2 1.2As per cent to GDP 0.1 0.0 0.1 0.3 0.2 0.2
Note: Figures in parentheses indicate loan waiver as a per cent to respective states GSDP for the corresponding year.Sources: State governments, Budget documents of state governments.
2 ₹ 50,600 crore at 2016-17 prices using the GDP deflator.3 ₹ 81,200 crore at 2016-17 prices using the GDP deflator.
(Contd.)
State Finances : A Study of Budgets of 2019-20
8
and above Pradhan Mantri Kisan Samman Nidhi (PM-KISAN) scheme of the Union Government (Table 2)4.
The year 2018-19, thus, marks a watershed, with some state governments opting for income support schemes as the preferred policy tool over conventional policies like enhancing minimum support prices (MSP) and farm loan waivers to alleviate agricultural distress. While the broad objective of all the three policies is to stabilise farmers’ incomes, income support schemes have certain advantages over the rest. First, income support schemes are more inclusive as even
Table 2: Income Support Schemes Announced by State Governments
(₹ crore)
State Name of the Scheme 2018-19 (BE)
2018-19 (RE)
2019-20 (BE)
1 2 3 4 5
1. Andhra Pradesh YSR Rythu Bharosa - - 8,750
2. Haryana Mukhyamantri Parivar Samman Nidhi
- - 1,500
3. Jharkhand Mukhyamantri Krishi Ashirvad Yojana
- - 2,000
4. Karnataka - 1,000 270 05. Odisha Krushak Assistance for
Livelihood and Income Augmentation (KALIA)
250 250 5,611
6. Telangana Rythu Bandhu 12,000 12,000 12,000
7. West Bengal Krishak Bandhu - 4,000 3,000
Total 13,250 16,520 32,861
As per cent of state governments’ total expenditure 0.4 0.5 0.9As per cent of GDP 0.1 0.1 0.2
- : Not available
landless farmers and farmers having no access to bank credit can be covered, whereas farm loan waivers benefit only those farmers who have borrowed from banks. Second, the problem of moral hazard, which is typically associated with farm loan waivers, does not exist in the case of income support schemes. Furthermore, direct benefit transfers are the fastest and most effective way to reach farmers, by contrast, benefits of Minimum Support Prices (MSPs) reach the farmers only indirectly and are mostly appropriated by traders who bring the produce to the market (Gulati et al., 2018). However, critical for their success is digitisation of land records and their seeding with bank account and Aadhaar details for ensuring timely payments to farmers while minimising inclusion and exclusion errors.
4 The Union Government has budgeted ₹₹75,000 crore in 2019-20 (BE) for the PM-KISAN.
References:Bhaskar, A., & Beghin, J. (2009). “How Coupled Are Decoupled Farm Payments? A Review of the Evidence”. Journal of Agricultural and Resource Economics, 34(1).Gulati, A., Chatterjee, T., & Hussain, S. (2018). “Supporting Indian Farmers: Price Support or Direct Income/Investment Support?”. Indian Council for Research on International Economic Relations (ICRIER) Working Paper No. 357.
RBI (2019), “Report of the Internal Working Group to Review Agricultural Credit”. Reserve Bank of India.

9
Fiscal Position of State Governments
5 Data for 27 states are available with CAG; and RE for Assam and Goa are available in their budget documents. Provisional accounts (PA) data from CAG are available with lower granularity, so all the tables in Report include data on revised estimates (RE) for 2018-19 from the state budgets. Available details on PA are given in Table II.4.
primarily led by committed expenditures in the
form of pension payments and administrative
services (Chart II.4).
2.10 Revised Estimates usually get revised
downward when they crystallise into accounts
(Chart II.5). Accounts data, available with Comptroller and Auditor General of India (CAG), provide a close assessment of actual accounts, albeit with lower granularity.5
2.11 In terms of these provisional accounts (PA), the consolidated GFD at

State Finances : A Study of Budgets of 2019-20
10
2.4 per cent of GDP in 2018-19 remained almost the same (only 3 basis points higher) as in 2017-18, affirming that states have stayed on the course of fiscal consolidation (Table II.4).
4. Budget Estimates: 2019-20
2.12 States have budgeted a GFD-GDP ratio of 2.6 per cent in 2019-20, with 12 states expecting to remain above 3 per cent (Table II.5, Chart II.6). As in budget estimates of the previous few years, a combined revenue surplus is budgeted for 2019-20, with 19 states and UTs expecting surplus.
Receipts
2.13 Growth in Revenue receipts is expected to decelerate in 2019-20, due to lower tax devolution and grants (Table II.6). State Goods and Services Tax (SGST) collections have risen from 29 per cent of states’ own revenue receipts in 2016-17 to 35 per cent in 2019-20 (BE)6. As these revenues have proved inadequate relative to rising expenditure, states adapted by shifting towards other sources of taxes, viz., alcohol and stamp duties. Notwithstanding a decline in the excise duty on petroleum in 2018, it accounted for above 11 per cent of states’ own tax revenues (Chart II.7). GST
6 Though GST was not there in 2016-17, this share has been computed by adding the taxes that were subsumed under GST.
Table II.4: Fiscal Position of States (` lakh crore)
2017-18 2018-19 (RE) 2018-19 (PA) 2019-20 (BE)
1 2 3 4 5
I. Aggregate Receipts 23.61(13.8)
29.14(15.4)
26.68(14.0)
32.16(15.2)
A. Revenue Receipts 23.21(13.6)
28.62(15.1)
26.23(13.8)
31.54(14.9)
B. Capital Receipts 0.40(0.2)
0.52(0.3)
0.45(0.2)
0.62(0.3)
a. Recovery of Loans and Advances 0.40(0.2)
0.52(0.3)
0.45(0.2)
0.60(0.3)
b. Other Receipts 0.00(0.0)
0.00(0.0)
0.01(0.0)
0.02(0.0)
II. Aggregate Expenditure 27.71(16.2)
34.70(18.2)
31.31(16.5)
37.68(17.8)
A. Revenue Expenditure 23.40(13.7)
28.75(15.1)
26.36(13.9)
31.46(14.9)
B. Capital Expenditure 4.31(2.5)
5.95(3.1)
4.95(2.6)
6.22(2.9)
a. Capital Outlay 3.94(2.3)
5.44(2.9)
4.50(2.4)
5.81(2.8)
b. Loans and Advances by States 0.37(0.2)
0.51(0.2)
0.45(0.2)
0.41(0.1)
III. Fiscal Deficit/Surplus 4.10(2.4)
5.55(2.9)
4.62(2.4)
5.52(2.6)
IV. Revenue Deficit/surplus 0.19(0.1)
0.13(0.1)
0.13(0.1)
-0.08(0.0)
* : While data on 27 states for 2018-19 (provisional estimates) are taken from CAG, data for Goa and Assam are based on the revised estimates given in their budget documents. Data for all states for 2017-18 are from budget documents of respective states.Note: Figures in parentheses are per cent of GDP.

11
Fiscal Position of State Governments
Table II.5: Deficit Indicators of State Governments—State-wise(Per cent)
2016-17 2017-18 2018-19 (RE) 2019-20 (BE)
RD/GSDP
GFD/GSDP
PD/GSDP
RD/GSDP
GFD/GSDP
PD/GSDP
RD/GSDP
GFD/GSDP
PD/GSDP
RD/GSDP
GFD/GSDP
PD/GSDP
1 2 3 4 5 6 7 8 9 10 11 12 13
1. Andhra Pradesh 2.5 4.4 2.8 2.0 4.0 2.3 1.2 3.6 2.1 0.2 3.3 1.7
2. Arunachal Pradesh -12.2 -4.3 -6.3 -13.0 1.4 -0.7 -26.5 4.3 2.0 -29.1 2.0 -0.4
3. Assam 0.1 2.4 1.2 0.5 3.2 2.1 -2.4 3.0 1.7 -0.9 3.1 1.7
4. Bihar -2.6 3.9 2.0 -3.1 3.0 1.1 -1.7 4.6 2.6 -3.8 2.8 0.9
5. Chhattisgarh -2.2 1.6 0.5 -1.2 2.4 1.3 2.0 6.0 4.8 -0.3 3.2 1.8
6. Goa -1.1 1.5 -0.3 -0.7 2.3 0.5 -0.2 5.3 3.6 -0.5 5.2 3.4
7. Gujarat -0.5 1.4 -0.1 -0.4 1.6 0.2 -0.1 2.1 0.8 -0.2 1.8 0.6
8. Haryana 2.9 4.7 2.8 1.7 3.1 1.1 1.2 2.9 0.9 1.5 2.9 0.7
9. Himachal Pradesh -0.7 4.6 2.0 -0.2 2.8 0.1 1.4 5.1 2.4 1.4 4.4 1.7
10. Jammu and Kashmir -1.7 4.9 1.3 -5.5 2.0 -1.4 -5.1 11.2 7.6 -7.9 6.5 2.4
11. Jharkhand -0.8 4.3 2.5 -0.7 4.3 2.6 -2.3 2.4 0.7 -2.4 2.0 0.6
12. Karnataka -0.1 2.4 1.4 -0.3 2.3 1.3 0.0 2.9 1.7 0.0 2.5 1.4
13. Kerala 2.4 4.2 2.3 2.4 3.8 1.7 1.7 3.0 1.0 1.0 3.0 1.0
14. Madhya Pradesh -0.6 4.3 2.9 -0.6 3.1 1.6 0.0 3.5 2.0 -0.1 3.5 1.9
15. Maharashtra 0.4 1.8 0.5 -0.1 1.0 -0.4 0.6 2.1 0.8 0.7 2.0 0.8
16. Manipur -4.4 2.6 0.0 -4.5 1.4 -0.9 0.0 11.9 9.5 -1.3 6.6 4.3
17. Meghalaya -2.2 2.5 0.6 -2.8 0.5 -1.5 -1.5 3.5 1.5 -2.0 3.6 1.6
18. Mizoram -6.8 -1.5 -3.5 -9.6 1.8 -0.1 -2.4 7.6 5.8 -5.6 2.1 0.7
19. Nagaland -3.6 1.4 -1.6 -3.5 1.9 -1.0 -2.0 5.1 2.1 -1.8 3.0 -0.1
20. Odisha -2.4 2.4 1.4 -3.1 2.1 1.0 -2.2 2.9 1.7 -1.2 3.5 2.3
21. Punjab 1.7 12.4 9.6 2.0 2.6 -0.6 2.3 3.4 0.3 2.0 3.4 0.3
22. Rajasthan 2.4 6.1 3.8 2.2 3.0 0.7 2.7 3.4 1.0 2.6 3.2 0.9
23. Sikkim -4.0 -0.4 -2.0 -4.5 2.0 0.4 -3.3 3.4 1.7 -0.9 2.8 1.0
24. Tamil Nadu 1.0 4.3 2.7 1.5 2.7 0.9 1.2 2.7 1.0 0.8 2.4 0.6
25. Telangana -0.2 5.3 4.0 -0.5 3.5 2.1 0.0 3.3 2.0 -0.2 2.4 1.0
26. Tripura -2.3 6.1 4.1 0.6 4.5 2.6 -3.2 2.1 0.5 -1.6 2.8 1.2
27. Uttar Pradesh -1.6 4.5 2.3 -0.9 2.0 -0.1 -3.2 3.0 0.8 -1.8 3.0 0.7
28. Uttarakhand 0.2 2.8 0.9 0.9 3.7 1.8 0.0 2.3 0.2 0.0 2.6 0.6
29. West Bengal 1.8 2.9 0.0 1.0 2.9 0.1 0.6 2.8 0.3 0.0 2.0 -0.3
30. NCT Delhi -0.8 0.2 -0.3 -0.7 0.0 -0.4 -0.6 0.1 -0.3 -0.6 0.7 0.3
31. Puducherry 0.3 1.8 -0.2 -0.6 0.6 -1.5 -0.1 1.1 -0.8 0.0 1.3 -1.0
All States 0.2 3.5 1.8 0.1 2.4 0.7 0.1 2.9 1.2 0.0 2.6 0.9
RE: Revised Estimates. BE: Budget Estimates. RD: Revenue Deficit. GFD : Gross Fiscal Deficit.PD: Primary Deficit. GSDP: Gross State Domestic Product.Note: Negative (-) sign in deficit indicators indicates surplus.Source: Based on budget documents of state governments.

State Finances : A Study of Budgets of 2019-20
12
compensation provided by Centre has also
increased since the implementation of GST.
Furthermore, lower variability and enhanced
predictability of income through these sources
can play an important role in utilising these
revenues in an effective and timely manner
(Annex II.1).
Expenditure
2.14 Lower increase in revenue expenditure
is envisaged in 2019-20 (vis-à-vis 2018-19
RE) except on roads and bridges and other
agricultural programmes under developmental
expenditures and interest payments under
non-developmental expenditures (Table II.6).
Capital outlay is expected to slow to 6.9 per
cent from 38.1 per cent in the previous year.
Given high capital expenditure multiplier, it
is important that states meet the budgeted
target and front-load these expenditure.
However, capital outlay remained strong with
a growth of 30.6 per cent during 2019-20
when compared with provisional accounts
data of CAG for 2018-19 (Table II.4).
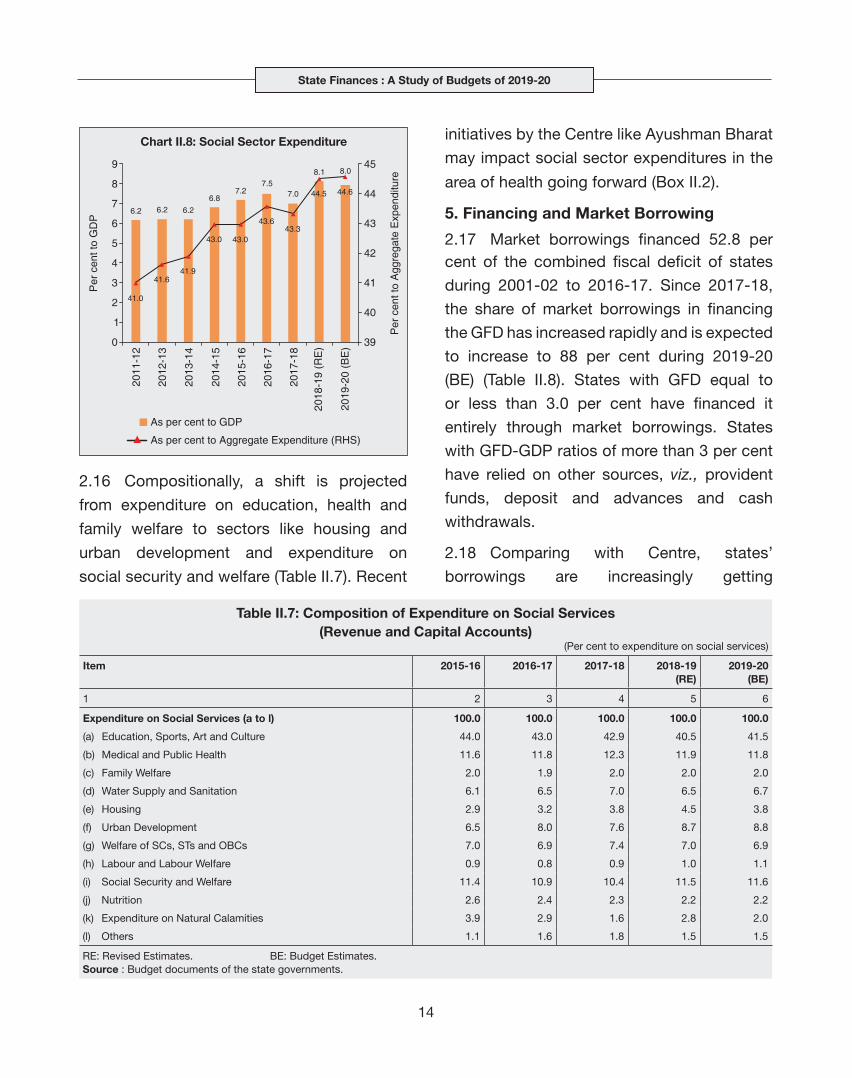
2.15 After witnessing a fall in 2017-18, social
sector expenditure recovered in 2018-19
and is budgeted to sustain this improvement
and reach to 8.0 per cent of GDP in 2019-20
(Chart II.8).

13
Fiscal Position of State Governments
Table II.6: Variation in Major Items(₹ lakh crore)
Item 2015-16 2016-17 2017-18 2018-19 (RE)
2019-20 (BE)
Per cent Variation
2018-19 RE over 2017-18
2019-20 BE over
2018-19RE
1 2 3 4 5 6 7 8
I. Revenue Receipts (i+ii) 18.73 20.86 23.21 28.62 31.54 23.3 10.2
(i) Tax Revenue (a+b) 13.86 15.54 17.36 20.28 22.61 16.8 11.5
(a) Own Tax Revenue 8.80 9.46 11.30 12.69 14.09 12.2 11.1
of which: Sales Tax 5.50 6.10 4.02 2.97 3.26 -26.1 10.0
(b) Share in Central Taxes 5.06 6.08 6.05 7.59 8.52 25.5 12.1
(ii) Non-Tax Revenue 4.87 5.32 5.86 8.34 8.93 42.4 7.1
(a) States’ Own Non-Tax Revenue 1.55 1.71 1.80 2.23 2.45 24.2 9.9
(b) Grants from Centre 3.32 3.61 4.06 6.11 6.48 50.5 6.1
II. Revenue Expenditure 18.70 21.22 23.40 28.75 31.46 22.9 9.4
of which:
(i) Development Expenditure 12.04 13.66 14.66 18.42 19.96 25.7 8.3
of which:
Education, Sports, Art and Culture 3.57 3.95 4.25 5.12 5.68 20.6 10.9
Transport and Communication 0.43 0.48 0.51 0.52 0.55 2.4 5.9
Power 1.12 1.33 1.16 1.32 1.47 13.1 11.9
Relief on account of Natural Calamities 0.33 0.28 0.16 0.37 0.29 132.8 -22.4
Rural Development 1.08 1.26 1.32 1.68 1.83 27.1 8.7
(ii) Non-Development Expenditure 6.17 6.99 8.06 9.50 10.55 17.9 11.0
of which:
Administrative Services 1.32 1.47 1.62 1.99 2.22 22.7 11.8
Pension 2.05 2.27 2.75 3.16 3.47 14.8 9.7
Interest Payments 2.18 2.55 2.93 3.20 3.55 9.0 11.0
III. Net Capital Receipts # 4.26 5.61 4.54 5.66 6.01 24.9 5.4
of which:
Non-Debt Capital Receipts 0.08 0.16 0.40 0.52 0.62 31.3 18.1
IV. Capital Expenditure $ 4.31 5.17 4.31 5.95 6.22 37.9 4.6
of which:
Capital Outlay 3.39 3.96 3.94 5.44 5.81 38.1 6.9
of which:
Capital Outlay on Irrigation and Flood Control 0.69 0.83 0.83 1.10 1.01 33.1 -7.7
Capital Outlay on Energy 0.47 0.53 0.46 0.54 0.55 15.3 3.0
Capital Outlay on Transport 0.81 0.96 0.93 1.23 1.22 32.2 -1.1
Memo Item:
Revenue Deficit -0.03 0.36 0.19 0.13 -0.08 -32.1 -163.4
Gross Fiscal Deficit 4.20 5.36 4.10 5.55 5.52 35.3 -0.5
Primary Deficit 2.02 2.81 1.17 2.36 1.98 101.0 -16.3
RE: Revised Estimates. BE: Budget Estimates.# : It includes following items on net basis: Internal Debt, Loans and Advances from the Centre, Inter-State Settlement, Contingency Fund, Small
Savings, Provident Funds, etc, Reserve Funds, Deposits and Advances, Suspense and Miscellaneous, Appropriation to Contingency Fund and Remittances.
$ : Capital Expenditure includes Capital Outlay and Loans and Advances by State Governments.Note: 1. Negative (-) sign in deficit indicators implies surplus. 2. Also see Notes to Appendices.Source: Budget documents of state governments.
State Finances : A Study of Budgets of 2019-20
14
2.16 Compositionally, a shift is projected
from expenditure on education, health and
family welfare to sectors like housing and
urban development and expenditure on
social security and welfare (Table II.7). Recent
initiatives by the Centre like Ayushman Bharat
may impact social sector expenditures in the
area of health going forward (Box II.2).
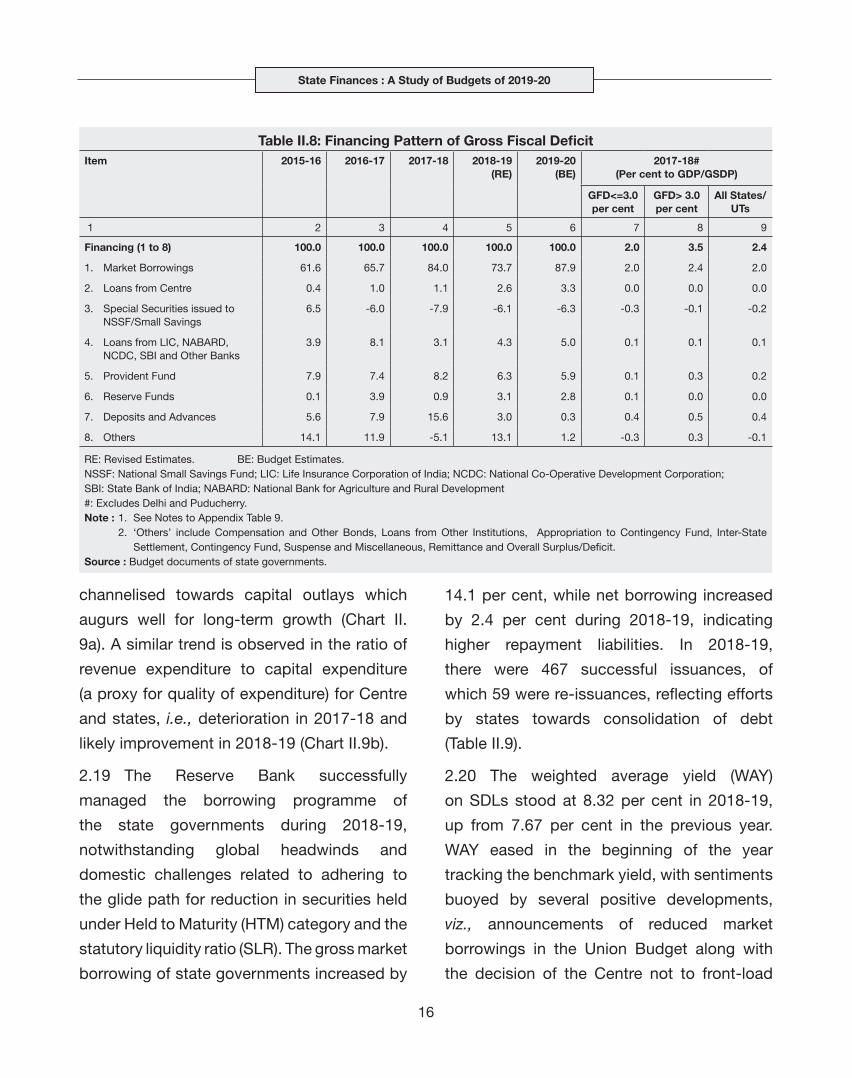
5. Financing and Market Borrowing
2.17 Market borrowings financed 52.8 per cent of the combined fiscal deficit of states
during 2001-02 to 2016-17. Since 2017-18,
the share of market borrowings in financing
the GFD has increased rapidly and is expected
to increase to 88 per cent during 2019-20
(BE) (Table II.8). States with GFD equal to
or less than 3.0 per cent have financed it
entirely through market borrowings. States
with GFD-GDP ratios of more than 3 per cent
have relied on other sources, viz., provident
funds, deposit and advances and cash
withdrawals.
2.18 Comparing with Centre, states’
borrowings are increasingly getting
Table II.7: Composition of Expenditure on Social Services (Revenue and Capital Accounts)
(Per cent to expenditure on social services)
Item 2015-16 2016-17 2017-18 2018-19(RE)
2019-20(BE)
1 2 3 4 5 6
Expenditure on Social Services (a to l) 100.0 100.0 100.0 100.0 100.0
(a) Education, Sports, Art and Culture 44.0 43.0 42.9 40.5 41.5
(b) Medical and Public Health 11.6 11.8 12.3 11.9 11.8
(c) Family Welfare 2.0 1.9 2.0 2.0 2.0
(d) Water Supply and Sanitation 6.1 6.5 7.0 6.5 6.7
(e) Housing 2.9 3.2 3.8 4.5 3.8
(f) Urban Development 6.5 8.0 7.6 8.7 8.8
(g) Welfare of SCs, STs and OBCs 7.0 6.9 7.4 7.0 6.9
(h) Labour and Labour Welfare 0.9 0.8 0.9 1.0 1.1
(i) Social Security and Welfare 11.4 10.9 10.4 11.5 11.6
(j) Nutrition 2.6 2.4 2.3 2.2 2.2
(k) Expenditure on Natural Calamities 3.9 2.9 1.6 2.8 2.0
(l) Others 1.1 1.6 1.8 1.5 1.5
RE: Revised Estimates. BE: Budget Estimates.Source : Budget documents of the state governments.

15
Fiscal Position of State Governments
With an aim to safeguard the poor from the catastrophic effects of high out of pocket (OOP) expenditure, which characterises health spending in India (Chart 1), the Ayushman Bharat programme was announced on February 1, 2018. Ayushman Bharat is an umbrella of two major health initiatives (i) Ayushman Bharat - Health and Wellness Centres (AB-HWC) which aims to transform nearly 1.5 lakh sub-centres and primary health centres into HWCs providing comprehensive and quality primary care; (ii) Ayushman Bharat - Pradhan Mantri Jan Arogya Yojana (AB-PMJAY), under which 10.74 crore poor and deprived rural families and identified occupational categories of urban workers’ families will be provided a cover of ₹5 lakh per family per year for in-patient secondary and tertiary treatment. It is a centrally sponsored scheme, which will be implemented on a 60:40 sharing basis with states7. With a few exceptions, most states have signed up for AB-PMJAY. The Union
Box II.2: Ayushman Bharat Programme
7 Except for special category states, for which the sharing pattern ratio will be 90:10.8 Net incurred claims ratio is defined as the ratio of net incurred claims to net earned premium.
References:GoI (2018, September 22). Ayushman Bharat –Pradhan Mantri Jan AarogyaYojana (AB-PMJAY). Retrieved September 23, 2019, from Press Information Bureau: https://pib.gov.in/Pressreleaseshare.aspx?PRID=1546948.Patnaik, I., Roy, S., & Shah, A. (2018). “The Rise of Government-funded Health Insurance in India”. National Institute of Public Finance and Policy (NIPFP) Working Paper No. 231.
Government has budgeted ₹2,400 crore and ₹6,400 crore in 2018-19 and 2019-20 respectively for the AB-PMJAY.
The current allocation for AB-PMJAY by various states seems modest at 0.02 per cent of GDP (Chart 2). Even before the Ayushman Bharat programme was launched, a plethora of government funded health insurance schemes (GFHIS) were operational in India, like the Rashtriya Swasthya Bima Yojana (RSBY) of the Central government, Rajiv Arogyasri scheme of Telangana government, Arogya Bhagya scheme of Karnataka government, among others (Annex II.2). An analysis of these pre-existing GFHISs suggests that their net incurred claims ratio (NICR)8, which is an indicator of sustainability, has crossed 100 per cent, which means that insurance pay-outs are higher than the premium collected (Patnaik et al., 2018). Thus, the true fiscal cost for states and the Centre could be higher if the insurance companies become insolvent and require bail-outs.
State Finances : A Study of Budgets of 2019-20
16
channelised towards capital outlays which
augurs well for long-term growth (Chart II.
9a). A similar trend is observed in the ratio of
revenue expenditure to capital expenditure
(a proxy for quality of expenditure) for Centre
and states, i.e., deterioration in 2017-18 and
likely improvement in 2018-19 (Chart II.9b).
2.19 The Reserve Bank successfully
managed the borrowing programme of
the state governments during 2018-19,
notwithstanding global headwinds and
domestic challenges related to adhering to
the glide path for reduction in securities held
under Held to Maturity (HTM) category and the
statutory liquidity ratio (SLR). The gross market
borrowing of state governments increased by
14.1 per cent, while net borrowing increased
by 2.4 per cent during 2018-19, indicating
higher repayment liabilities. In 2018-19,
there were 467 successful issuances, of
which 59 were re-issuances, reflecting efforts
by states towards consolidation of debt
(Table II.9).
2.20 The weighted average yield (WAY)
on SDLs stood at 8.32 per cent in 2018-19,
up from 7.67 per cent in the previous year.
WAY eased in the beginning of the year
tracking the benchmark yield, with sentiments
buoyed by several positive developments,
viz., announcements of reduced market
borrowings in the Union Budget along with
the decision of the Centre not to front-load
Table II.8: Financing Pattern of Gross Fiscal DeficitItem 2015-16 2016-17 2017-18 2018-19
(RE)2019-20
(BE)2017-18#
(Per cent to GDP/GSDP)
GFD<=3.0 per cent
GFD> 3.0 per cent
All States/UTs
1 2 3 4 5 6 7 8 9
Financing (1 to 8) 100.0 100.0 100.0 100.0 100.0 2.0 3.5 2.4
1. Market Borrowings 61.6 65.7 84.0 73.7 87.9 2.0 2.4 2.0
2. Loans from Centre 0.4 1.0 1.1 2.6 3.3 0.0 0.0 0.0
3. Special Securities issued to NSSF/Small Savings
6.5 -6.0 -7.9 -6.1 -6.3 -0.3 -0.1 -0.2
4. Loans from LIC, NABARD, NCDC, SBI and Other Banks
3.9 8.1 3.1 4.3 5.0 0.1 0.1 0.1
5. Provident Fund 7.9 7.4 8.2 6.3 5.9 0.1 0.3 0.2
6. Reserve Funds 0.1 3.9 0.9 3.1 2.8 0.1 0.0 0.0
7. Deposits and Advances 5.6 7.9 15.6 3.0 0.3 0.4 0.5 0.4
8. Others 14.1 11.9 -5.1 13.1 1.2 -0.3 0.3 -0.1
RE: Revised Estimates. BE: Budget Estimates.NSSF: National Small Savings Fund; LIC: Life Insurance Corporation of India; NCDC: National Co-Operative Development Corporation; SBI: State Bank of India; NABARD: National Bank for Agriculture and Rural Development#: Excludes Delhi and Puducherry.Note : 1. See Notes to Appendix Table 9. 2. ‘Others’ include Compensation and Other Bonds, Loans from Other Institutions, Appropriation to Contingency Fund, Inter-State
Settlement, Contingency Fund, Suspense and Miscellaneous, Remittance and Overall Surplus/Deficit.Source : Budget documents of state governments.

17
Fiscal Position of State Governments
the issuances in H1:2018-19; and the RBI
allowing banks to spread mark to market
losses (MTM) incurred during Q3:2017-18 and
Q4:2017-18. However, WAY rebounded with
a hardening bias at end-April 2018 with the
rise in international crude oil price, inflation
concerns due to the revised formula of MSP,
and rising trade protectionism. In H2:2018-19,
Table II.9: Market Borrowings of States ( ₹ lakh crore)
Item 2016-17 2017-18 2018-19 2019-20*
1 2 3 4 5
1. Maturities during the year 0.39 0.79 1.30 0.58
2. Gross sanction under article 293(3) 4.00 4.82 5.50 5.14
3. Gross amount raised during the year 3.80 4.19 4.78 2.05
4. Net amount raised during the year 3.43 3.40 3.49 0.40
5. Amount raised during the year to total Sanctions (per cent) 96.0 87.0 87.0 39.88
6. Weighted Average Yield of SDLs (cut-off) 7.48 7.67 8.32 7.42
7. Weighted Average Spread over corresponding G-Sec (bps) (cumulative) 59 59 65 52
8. Average Inter-State Yield Spread (bps) (for 10-year paper) 7 6 6 4
*: As on September 18, 2019. Source: RBI.
SDL yields traded with a softening bias,
supported by RBI announcements of multiple
open market operations (OMOs), fall in crude
oil prices, monetary policy easing through rate
cuts, improvement of liquidity conditions, the
announcements of voluntary retention route
(VRR)9 for foreign portfolio investment (FPI) in
debt, and benign inflation prints (Chart II.10).
9 Voluntary Retention Route (VRR) is a separate scheme to encourage FPIs to undertake long-term investments in Indian debt markets. Under this scheme, FPIs have been given greater operational flexibility in terms of instrument choices besides exemption from certain regulatory requirements.

State Finances : A Study of Budgets of 2019-20
18
unwarranted interest burden and the negative carry on surplus cash investments (Chart II.12).
2.24 States have been accumulating sizeable cash surpluses in recent years in the form of Intermediate Treasury Bills (ITBs) and Auction Treasury Bills (ATBs). Outstanding
investments in ITBs stood at ₹1.22 lakh
2.21 Despite this softening bias, the weighted average spread of SDL issuances over comparable Central Government Securities stood at 65 bps in 2018-19 as compared with 59 bps in 2017-18, reflecting liquidity premium.
Maturity Pattern of State Government Securities
2.22 The maturity profile of states’ debt indicates that near to medium-term redemption pressures are likely to rise and reach a peak in 2026-27 (Chart II.11). At end-March 2019, 66.2 per cent of the outstanding SDLs was in the residual maturity bucket of five years and above (Table II.10). As 17.9 per cent of outstanding SDLs will mature in the next three years, redemption pressure is expected to rise in the medium term.
Cash Management of State Governments
2.23 Developments highlighted so far suggest that the borrowing strategy of states should
be aligned with their cash positions to avoid

19
Fiscal Position of State Governments
Table II.10: Maturity Profile of Outstanding State Government Securities
(As at end-March 2019)State Per cent of Total Amount Outstanding
0-1 years
1-3 years
3-5 years
5-7 years
Above 7 years
1 2 3 4 5 6
1. Andhra Pradesh 7.6 15.8 20.8 17.7 38.1
2. Arunachal Pradesh 2.6 1.1 13.3 14.5 68.5
3. Assam 6.3 9.2 8.2 20.0 56.5
4. Bihar 3.4 7.8 16.1 23.0 49.6
5. Chhattisgarh 1.7 13.9 23.2 29.6 31.6
6. Goa 5.4 7.7 16.7 20.4 49.7
7. Gujarat 5.7 16.2 16.3 16.3 45.5
8. Haryana 2.8 10.1 22.5 25.6 39.0
9. Himachal Pradesh 8.0 16.4 15.3 19.1 41.1
10. Jammu & Kashmir 3.2 18.8 14.3 12.6 51.0
11. Jharkhand 4.3 5.4 18.0 26.7 45.6
12. Karnataka 3.8 9.2 15.8 24.5 46.6
13. Kerala 4.2 11.1 18.8 21.7 44.2
14. Madhya Pradesh 5.5 12.6 13.2 24.9 43.8
15. Maharashtra 6.0 18.3 18.1 22.5 35.1
16. Manipur 10.6 8.6 13.2 22.5 45.0
17. Meghalaya 4.5 8.2 12.3 20.5 54.4
18. Mizoram 7.1 25.9 20.3 19.6 27.1
19. Nagaland 8.0 11.9 16.5 21.5 42.0
20. Odisha 3.6 21.3 25.5 10.7 38.9
21. Punjab 7.1 18.3 19.1 16.1 39.4
22. Rajasthan 7.4 13.4 15.8 21.6 41.8
23. Sikkim 7.4 0.9 7.0 20.6 64.0
24. Tamil Nadu 4.6 9.4 16.3 21.4 48.4
25. Telangana 0.0 0.0 1.7 22.9 75.4
26. Tripura 5.4 9.0 18.3 11.1 56.2
27. Uttar Pradesh 5.9 12.8 9.2 19.7 52.4
28. Uttarakhand 1.9 7.5 13.3 19.7 57.6
29. West Bengal 6.5 12.7 16.6 18.4 45.8
30. Puducherry 9.0 20.5 18.1 16.6 35.7
All States and UT 5.3 12.6 16.0 20.8 45.4
Source: Reserve Bank records.
crore at end-March 2019, while outstanding investments in ATBs stood at ₹0.74 lakh crore.
A few states have been parking sizeable cash balances in the more durable segment such as ATBs (Table II.11). Weekly auctions were also introduced with a view to even out cash flow mismatches while keeping the bare minimum cash balances.
2.25 Ways and Means Advances (WMA) limits are being fixed by a committee-based approach10. Following the recommendations of the Sumit Bose Committee, the limit of WMA for states was reviewed in 2018 and it was decided to retain the existing limit of WMA until reviewed by the next committee (effective from 2020-21). During 2018-19, 14 states resorted to WMA while 10 states availed overdraft (OD) vis-à-vis 13 states resorting to WMA and 7 states availing OD in 2017-18.
Management of Reserve Funds of States
2.26 State governments maintain Consolidated Sinking Fund (CSF) and Guarantee Redemption Fund (GRF) with the Reserve Bank as buffer for repayment of their liabilities. States can avail of the Special Drawing Facility (SDF) at a discounted rate from the Reserve Bank against incremental funds invested in CSF and GRF as collateral. In order to incentivise adequate maintenance
Table II.11: Investments of Surplus Cash balances of State Governments
(₹ lakh crore)
Item Outstanding as on March 31
2015-16 2016-17 2017-18 2018-19 2019-20*
1 2 3 4 5 6
14-Day ITBs 1.21 1.56 1.51 1.22 0.85
ATBs 0.38 0.37 0.62 0.74 0.96
Total 1.59 1.93 2.13 1.96 1.81
*: As on September 17, 2019.Source: RBI.
10 The limits were last revised to ₹0.32 lakh crore in January 2016, based on the recommendation of the advisory committee on WMA of states (Chairman: Shri Sumit Bose)

State Finances : A Study of Budgets of 2019-20
20
of these funds by the state governments and to encourage them to increase the corpus of these funds, the rate of interest on SDF was lowered from 100 bps below the repo rate to 200 bps below the repo rate in June 2018. Currently, 24 states are members of the CSF scheme while 18 states are members of the GRF scheme. Outstanding investment by states in the CSF and GRF as at end-March 2019 stood at ₹1.15 lakh crore and ₹0.07 lakh crore, respectively, as against ₹0.99 lakh crore and ₹0.05 lakh crore at end-March 2018 (Table II.12).
6. Outstanding Liabilities of State Governments
2.27 Outstanding liabilities of states have been growing at double digit rate since 2015-16 (except 2018-19), resulting in a rise in the debt to GDP ratios (Table II.13). Budget estimates suggest that 16 states and UTs expect to record higher debt-GSDP ratio in 2019-20 (Statement 20).
2.28 States’ outstanding debt rose for about a decade prior to 2003-04, but underwent a significant consolidation in the second phase post the adoption of FRL legislations by states (Chart II.13). As a result, the ratio of interest payment to revenue receipts (IP/RR)declined sharply during the period 2003-04 to 2014-15. Post the implementation of UDAY, however, states’ debt witnessed a significant
rise in 2015-16 and 2016-17 and continued in
2017-18 albeit at a relatively lower rate despite
ceasing of UDAY. This led to an increase in the
Table II.12: Investments in CSF/GRF by States(₹ crore)
State/UT CSF GRF CSF as per cent of
Outstanding Liabilities
1 2 3 4
Andhra Pradesh 7,459 735 3.0
Arunachal Pradesh 1,027 1 13.4
Assam 3,732 47 5.6
Bihar 6,371 0 3.9
Chhattisgarh 3,743 0 5.9
Goa 539 270 2.8
Gujarat 12,346 428 4.3
Haryana 1,879 1,074 1.0
Karnataka 3,466 0 1.3
Kerala 1,942 0 0.8
Madhya Pradesh 0 832 0.0
Maharashtra 33,388 267 6.7
Manipur 339 90 3.3
Meghalaya 551 27 5.1
Mizoram 497 29 6.3
Nagaland 1,336 29 12.8
Odisha 12,053 1,301 12.0
Punjab 0 0 0.0
Rajasthan 0 0 0.0
Tamil Nadu 5,973 0 1.6
Telangana 4,831 828 2.6
Tripura 295 4 1.9
Uttar Pradesh 0 0 0.0
Uttarakhand 2,709 71 4.8
West Bengal 9,938 479 2.5
Puducherry 289 0 1.7
Total 1,14,701 6,514 2.6
Table II.13: Outstanding Liabilities of State Governments and UTs
Year Amount Annual Growth Debt /GDP
(End-March) (₹ lakh crore) (Per cent)
1 2 3 4
2013 22.45 10.6 22.6
2014 25.10 11.8 22.3
2015 27.43 9.3 22.0
2016 32.59 18.8 23.7
2017 38.59 18.4 25.1
2018 42.92 11.2 25.1
2019 (RE) 47.15 9.8 24.8
2020 (BE) 52.58 11.5 24.9
RE: Revised Estimates. BE: Budget Estimates.Source : 1. Budget documents of state governments. 2. Combined Finance and Revenue Accounts of the Union
and the State Governments in India, Comptroller and Auditor General of India.
3. Ministry of Finance, Government of India. 4. Reserve Bank records. 5. Finance Accounts of the Union Government,
Government of India.

21
Fiscal Position of State Governments
interest payments to revenue receipts (IP/RR) ratio as well. Outstanding debt is expected to remain around 25 per cent of GDP as per the revised estimates for 2018-19 and budget estimates for 2019-20.
Composition of Debt
2.29 States’ dependence on market borrowing to finance their debt has increased
significantly following the recommendation of the fourteenth Finance Commission (FC-XIV) to exclude states from the National Small Savings Fund (NSSF) financing facility (barring Delhi, Madhya Pradesh, Kerala and
Arunachal Pradesh). All other components
have witnessed a decline in the recent period
(Table II.14).
Table II.14: Composition of Outstanding Liabilities of State Governments(As at end-March)
(Per cent)
Item 2015 2016 2017 2018 2019 RE 2020 BE
1 2 3 4 5 6 7
Total Liabilities (1 to 4) 100.0 100.0 100.0 100.0 100.0 100.0
1. Internal Debt 70.0 72.1 73.3 72.7 73.3 74.8
of which:
(i) Market Loans 46.4 46.6 48.2 51.4 54.3 57.9
(ii) Special Securities Issued to NSSF 19.8 17.5 14.0 11.1 9.4 7.7
(iii) Loans from Banks and Financial Institutions 3.5 4.3 5.2 4.9 5.0 4.9
2. Loans and Advances from the Centre 5.5 4.7 4.1 3.8 3.7 3.7
3. Public Account (i to iii) 24.3 23.1 22.5 23.5 22.8 21.4
(i) State Provident Funds, etc. 11.7 10.8 10.5 10.3 10.1 9.7
(ii) Reserve Funds 3.6 4.3 3.2 4.1 4.1 4.0
(iii) Deposits and Advances 9.0 8.0 8.8 9.1 8.6 7.8
4. Contingency Fund 0.2 0.1 0.1 0.1 0.1 0.1
RE: Revised Estimate. BE: Budget Estimate.Source: Same as that for Table II.13.
State Finances : A Study of Budgets of 2019-20
22
7. Concluding Observations
2.30 To sum up, the GFD-GDP for states
recorded improvement in 2017-18 (Accounts)
vis-à-vis 2016-17 and remained well within
the threshold of 3 per cent during 2018-19.
A similar outcome is budgeted for 2019-20
(BE). There are, however, some important
features of these budget outcomes which
are noteworthy. First, fiscal improvement
has hinged on expenditure curtailment, and
in particular, capital expenditure, which
has negative output effects in the medium
term. Second, committed expenditures
are on a rising trend, driven by interest and
pension payments. Third, financing via
market borrowings is slated to rise. Fourth,
debt liabilities have been rising during 2016-19 and are likely to remain around 25 per cent of GDP in 2019-20, clearly making the sustainability of debt the main medium-term fiscal challenge for states.

23
Fiscal Position of State Governments
Predictability and credibility of budgeted
numbers is an important aspect while analysing
revenue positon of state governments. States
generally maintain a composition of tax
instruments which allows their revenue to grow
with the economy so that they do not face
any financing constraint. However, these tax
instruments respond differently to downturns
and upturns in the economy. While ‘taxes on
income and expenditure’ have been volatile,
their share has remained low. The volatility of
stamp duties and sales tax has gone up in the
recent decade, making it difficult to prepare
their forecasts for budgetary exercise (Table 1).
Reflecting this high variability, the revenue
side of state finances has posed credibility
issues for the budgetary process (RBI, 2015,
2018). The forecast errors are largely random,
i.e., influenced by unexpected factors with
less scope of correction – only the systematic
error in forecast can be avoided with use of
sophisticated forecasting methods. In general,
states have been over-estimating all source
of revenues (Table 2). While the extent of
overestimation is growing steadily in case of
states’ own tax revenue (7.2 per cent in 2013-14
to 11.1 per cent in 2016-17), the over-estimation
in total revenue is consistently dominated by
grants from the Centre, where the extent of
Annex II.1
States’ Revenue: Variability and Predictability
overestimation is about 40 per cent in same
years. The large differences between Budget
Estimate (BE) and Revised Estimate (RE) ratios
relative to BE to actual ratios implies that, even
by the end of the financial year, states remain
uncertain about the amount of grants they are
going to receive from the Central Government.
It is interesting to note that in the case of tax
devolution, the deviation of RE or Actual from
BE shifted gear from over-estimation to under-
estimation in the FC-XIV period. There is, thus,
a need for ensuring consistency in budgetary
forecasts of revenues, which provide an
important basis for expenditure forecasts and is
of particular benefit for the investors who need
certainty.
Table 1: States’ Own Tax Revenue - Coefficientof Variation
(per cent)1990-91
to 2018-19
2010-11 to
2018-19
1 2 3
Total own tax revenue 0.33 0.46
Taxes on Income and Expenditure 1.50 0.99
Taxes on Property and Capital Transaction
0.73 0.82
Of which:
Stamp Duties and Registration Fees 0.67 0.82
Taxes on Commodities and Services 0.31 0.42
Of which:
Sales Tax/VAT 1.04 3.48
Excise Duties 0.51 0.63
Taxes on Vehicle 0.39 0.41
Source: Staff estimates.

State Finances : A Study of Budgets of 2019-20
24
Table 2: Tax Revenue: Over Estimation or Under Estimation Ratio of BE to Accounts
2012-13 2013-14 2014-15 2015-16 2016-17
Ratio of BE to Accounts
TOTAL REVENUE 1.063 1.115 1.167 1.098 1.103
A. States’ Own Tax Revenue 0.986 1.072 1.078 1.100 1.111
a. Taxes on Income 1.045 1.025 1.045 1.156 1.143
b. Taxes on Property and Capital Transactions 0.960 1.134 1.120 1.120 1.234
c. Taxes on Commodities and Services 0.989 1.064 1.072 1.097 1.095
B. Share in Central Taxes 1.037 1.081 1.142 0.959 0.956
C. States’ Own Non-Tax Revenue 1.022 0.966 1.085 1.216 1.150
D. Grants from the Centre 1.398 1.408 1.436 1.250 1.312
Ratio of BE to RE
TOTAL REVENUE 0.992 1.018 1.028 1.027 1.025
A. States’ Own Tax Revenue 0.975 1.015 1.028 1.046 1.064
a. Taxes on Income 1.031 1.004 1.035 1.061 1.059
b. Taxes on Property and Capital Transactions 0.966 1.035 1.054 1.070 1.169
c. Taxes on Commodities and Services 0.976 1.012 1.024 1.043 1.051
B. Share in Central Taxes 1.020 1.036 1.053 0.940 0.969
C. States’ Own Non-Tax Revenue 1.002 0.957 0.969 1.143 1.056
D. Grants from the Centre 0.996 1.036 1.029 1.053 1.004
Source: Budget documents of state governments.
Over estimation Under estimation

25
Fiscal Position of State Governments
Annex II.2
List of State Government Health Care Schemes
State Health Care Schemes
Andhra Pradesh
Working Journalists Health Care Scheme
Arogya Raksha
Arunachal Pradesh Chief Minister Arogya Arunachal Yojana
Assam Atal Amrit Abhiyan
Assam Arogya Nidhi
Chhattisgarh Mukhyamantri Swasthya Bima Yojana
Delhi Mamta Scheme
Goa Deen Dayal Swasthya Seva Yojana
Gujarat Chiranjivi Yojana
Bal Sakha Scheme
Mukhyamantri Amrutam Yojana
Haryana Mukhyamantri Mufat Ilaj Yojana
Himachal Pradesh Rashtriya Swasthya Bima Plus
Mukhyamantri State Health Care Scheme
Karnataka Yeshasvini
Vajpayee Arogyashree Scheme
Rajiv Arogya Bhagya
Jyothi Sanjeevini
Thayi Bhagya Scheme
Kerala Comprehensive Health Insurance Scheme
Madhya Pradesh Deen Dayal Upchaar Yojana
Vijaya Raje Jananai Kalyan Bima Yojana
Maharashtra Rajiv Gandhi Jeevendayee Arogya Yojana
Meghalaya Megha Health Insurance Scheme
Mizoram Mizoram Health Care Scheme
Odisha Biju Krushak Kalyan Yojana
Biju Swasthya Kalyan Yojana
Rajasthan Bhamashah Swasthyta Bima Yojana

State Finances : A Study of Budgets of 2019-20
26
State Health Care Schemes
Tamil Nadu Chief Minister’s Comprehensive Health Insurance Scheme
New Health Insurance Scheme
Telangana Rajiv Arogyasri Scheme
Journalists Health Scheme
Tripura Tripura Health Assurance Scheme for Poor
Uttar Pradesh Saubhagyavati Surakshit Matritva Yojana
Uttarakhand U-Health Card
Mukhyamantri Swasthya Bima Yojana
West Bengal Swasthyasathi
Source: Patnaik, I., Roy, S., & Shah, A. (2018). “The Rise of Government-funded Health Insurance in India”. National Institute of Public Finance and Policy (NIPFP) Working paper number 231.

27
Debt: States’ Medium-Term Fiscal ChallengeIII
1. Introduction
3.1 Summarising the analysis of states’
budgetary outcomes during 2017-20, as set
out in the foregoing Chapter, it is observed
that shortfalls in revenue receipts vis-à-
vis budgeted targets triggered larger than
expected compression in expenditure. While
this anchored fiscal prudence as reflected
in the conventional indicator, i.e., the GFD-
GDP ratio, there have been unintended
consequences as well which may have
implications for debt sustainability in the
medium-term.
3.2 First, there has been a reduction in the
overall size of the state budget in 2017-19.
This retarding fiscal impulse — accounting
for 44 per cent of the general government
deficit — has coincided with a cyclical
downswing in domestic economic activity
and may have inadvertently deepened
it. The slowdown in the economy can
debilitate revenue raising capacity and force
an increase in borrowing/future liabilities,
given downward rigidities confronted by
states under various expenditure heads, still
underwhelming revenue performance of the
Goods and Services Tax (GST) regime and
the shrinking financial autonomy that states’
face. Second, the narrowing balance sheet of
states is paradoxically associated with a rise
in debt and guarantees of State Public Sector
Enterprises (SPSEs). The risk of crystallisation
of these contingent charges on states’
finances has direct adverse implications for
debt sustainability in the medium-term.
3.3 It is in this context that debt
sustainability selects itself as the theme of
this year’s report, as outlined in Chapter 1.
The organising principle driving the rest of this
chapter is as follows. States’ indebtedness
in the future (Dt+1) is a linear combination of
the current stock of debt (Dt) and additions
to this stock, both budgetary (∆Bt) and extra/
off-budgetary (∆Ot), i.e.,
D t+1 = Dt + ∆Bt + ∆Ot …………………(1)
The slowdown in the economy poses a challenging fiscal environment for states as lower revenue raising capacity and downward rigidities in various expenditure heads can force an increase in borrowing/future liabilities. The weak performance of State Public Sector Enterprises (SPSEs), particularly in power distribution, continues to be a source of fiscal risk going forward if the off-budget liabilities get crystallised. Further, the increased orientation of state government borrowings towards markets brings attendant challenges of pricing, liquidity, management of redemption cycle and diversification of investor base. The debt position of state governments has started showing incipient signs of unsustainability, particularly post UDAY. Recognising that debt sustainability is closely linked to revenue generation of states, they will have to improve their revenue raising capacity by capitalising on the efficiency gains under the GST and digitisation and improving compliance. Also, turnaround of power distribution sector is crucial to avoid fiscal surprises going forward.
State Finances : A Study of Budgets of 2019-20
28
3.4 Accordingly, the rest of the Chapter is organised into Sections 2 to 7. Recognising that the revenue generation holds the key to prudent debt management and can act as a circuit breaker to debt spirals, Section 2 drills into fundamental drivers and brakes in various sources of revenue – own taxes; states’ share in GST; and non-tax revenue - and the scope for and the nature of tax reforms that may be desirable and feasible. With states entrusted with higher responsibilities relative to their revenue generation capacity, transfer of resources from the Centre to the states in the form of tax devolution and grants remains important and its share has also seen a rise in overall receipts in recent years. Accordingly, trends in Central fiscal transfers have been analysed in this section recognising that they supplement own revenue and augment debt servicing capacity.
3.5 State budgets have to also adjust to exogenous fiscal shocks, with attendant implications for indebtedness. In particular, the structural weakness in state-owned power distribution utilities has necessitated three instances of financial restructuring over the thirteen-year period – One Time Settlement (2003); Financial Restructuring Plan (2012); and Ujwal DISCOM Assurance Yojana (UDAY) (2015). These interventions have a cascading effect on debt and off-budget liabilities. With UDAY reaching its terminal year (2019-20), Section 3 assesses the different facets of the UDAY scheme in terms of its impact on state finances and future liabilities.
3.6 While the focus so far was on exploring into ∆B
t in equation (1), Section 4 undertakes an analysis of state government guarantees
to assess the balance of risks around the ∆Ot term of equation (1). In recent years, the financing mix of states’ fiscal deficit has evolved in favour of market borrowings, which pose attendant fiscal challenges for debt management in terms of liquidity and roll-over risks, redemption pressures and pricing. These issues are dealt with in Section 5. All this leads into an evaluation of the debt profile of states, from the perspective of different scenarios for ∆Bt and ∆Ot in Section 6. Concluding observations are set out in Section 7.
2. States’ Revenue
3.7 States’ revenue comprises of (i) own tax revenue and non-tax revenue; and (ii) transfers received from the Centre in the form of devolution of Central taxes and grants (Chart III.1).
3.8 From the late 1990s, states’ total revenue has been increasing as a proportion to GDP, albeit with variations over time and space. Since 2010-11, states’ revenue has recovered from the slowdown in domestic economic activity imposed by the global financial crisis. From 2014-15, increased transfers as recommended by FC-XIV and more recently, GST compensation cess have provided tailwinds (Chart III.2).
3.9 There is a marked difference across states in revenue collections. For instance, average own tax revenue is highest for Andhra Pradesh for 2011-18 period. In the North-Eastern states, narrower tax bases operate as constraints and accordingly they receive the highest transfers from the Centre (Chart III.3).

Debt: States’ Medium-Term Fiscal Challenge
29
2.1 Own Tax Revenue
3.10 Own taxes constitute 45 per cent of the total revenue (Chart III.1) of states. They mainly comprise taxes on commodities and
services (sales tax/Value Added Tax (VAT)/
GST) and stamp duties. Sales tax/VAT, now
replaced by the GST, constitutes almost
half of the total own tax revenue of states.

State Finances : A Study of Budgets of 2019-20
30
On average, own tax revenues have grown at
a rate of 14.7 per cent over the last decade
(Table III.1).
3.11 States with high tax-GSDP ratios at
the beginning of the century have witnessed
a moderation in the ratio while those with
lower initial tax-GSDP ratios have
improved between 2001-02 to 2017-18
(Chart III.4).
3.12 Enhancing tax buoyancy in states is
crucial for meeting expenditure commitments
and addressing the medium-term objective of
Table III.1: States’ Own Tax Revenue - Composition(Per cent)
Share in OTR Growth Per cent of GDP
1990s 2000s 2010-20 1990s 2000s 2010-20 1990s 2000s 2010-20
I. Own tax Revenue (II+III) 100.0 100.0 100.0 14.8 13.5 14.7 5.3 5.8 6.3
II. Direct Taxes
1. Taxes on income and expenditure 1.5 1.4 0.7 15.4 9.9 5.3 0.1 0.1 0.0
2. Taxes on property and capital transaction 9.9 12.0 12.1 15.0 16.9 13.9 0.5 0.7 0.8
Of which:
Stamp duties and registration fees 8.2 10.6 10.7 17.1 16.9 14.0 0.4 0.6 0.7
III. Indirect Taxes
3. Taxes on commodities and services 88.5 86.6 87.3 14.8 13.2 14.9 4.7 5.0 5.5
Of which:
Sales tax/VAT 59.3 60.9 52.0 15.4 13.6 5.9 3.1 3.5 3.5
Excise duties 14.5 12.6 12.0 14.8 12.5 14.0 0.8 0.7 0.8
Taxes on vehicles 5.6 5.6 5.4 16.0 12.1 15.3 0.3 0.3 0.3
Source: Budget documents of state governments.
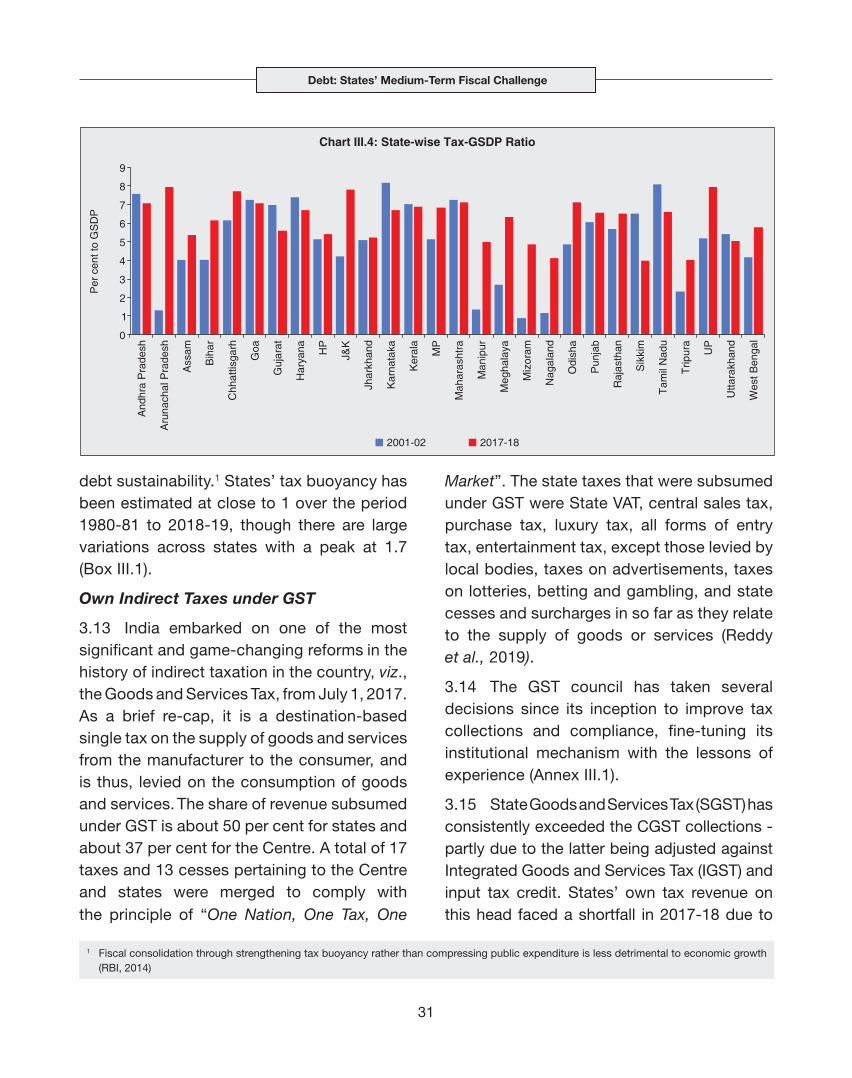
Debt: States’ Medium-Term Fiscal Challenge
31
debt sustainability.1 States’ tax buoyancy has been estimated at close to 1 over the period 1980-81 to 2018-19, though there are large variations across states with a peak at 1.7 (Box III.1).
Own Indirect Taxes under GST
3.13 India embarked on one of the most significant and game-changing reforms in the history of indirect taxation in the country, viz., the Goods and Services Tax, from July 1, 2017. As a brief re-cap, it is a destination-based single tax on the supply of goods and services from the manufacturer to the consumer, and is thus, levied on the consumption of goods and services. The share of revenue subsumed under GST is about 50 per cent for states and about 37 per cent for the Centre. A total of 17 taxes and 13 cesses pertaining to the Centre and states were merged to comply with the principle of “One Nation, One Tax, One
Market”. The state taxes that were subsumed under GST were State VAT, central sales tax, purchase tax, luxury tax, all forms of entry tax, entertainment tax, except those levied by local bodies, taxes on advertisements, taxes on lotteries, betting and gambling, and state cesses and surcharges in so far as they relate to the supply of goods or services (Reddy et al., 2019).
3.14 The GST council has taken several decisions since its inception to improve tax collections and compliance, fine-tuning its institutional mechanism with the lessons of experience (Annex III.1).
3.15 State Goods and Services Tax (SGST) has consistently exceeded the CGST collections - partly due to the latter being adjusted against Integrated Goods and Services Tax (IGST) and input tax credit. States’ own tax revenue on this head faced a shortfall in 2017-18 due to
1 Fiscal consolidation through strengthening tax buoyancy rather than compressing public expenditure is less detrimental to economic growth (RBI, 2014)

State Finances : A Study of Budgets of 2019-20
32
Box III.1: Tax Buoyancy at the State Level
States are largely dependent on tax devolution from the
Centre and their own tax revenue. In both cases, tax
buoyancy2 - the responsiveness of tax revenue to nominal
GDP changes – is key. For instance, the growth of own
tax revenue has not always been higher than nominal GDP
growth (Chart 1).
In this context, an operational distinction is often made
between short-run tax buoyancy, which helps to explain
the role of government in stabilising the economy over the
business/growth cycle, and long-run tax buoyancy, which
is the capacity of states to ensure fiscal sustainability in
the long-run (Belinga et al., 2014; Dudine and Jalles, 2017).
Tax buoyancy has been estimated at 1.30 for the period
2005-06 to 2010-11(Rajaraman et al., 2006), as against
the Twelfth Finance Commission’s estimate of 1.20. An
update of these estimates for the period 1980-81 to 2019-
20 establishes the existence of long-run cointegration3
between states’ taxes and their bases; given the long-
run coefficients, estimation of short-run coefficients is
attempted through error-correction models.4 Variables are
found to be integrated of order one. The coefficients of
log transformed variables provide direct estimates of tax
buoyancy (Table 1).
Short-run tax buoyancy of states’ own tax revenue is
estimated at 0.76, reflecting a weak automatic stabiliser.
Within own tax revenues, taxes on property and capital
transactions, and the SGST have short-run buoyancies
higher than unity, implying that they are effective automatic
stabilisers. Sales taxes and excise duties have low short-
run tax buoyancies, given the inelastic and nature of its
major components like petrol and alcohol.
Long-run buoyancy is estimated at 1.06, implying that
higher economic growth helps in containing fiscal deficits
and reduces debt through higher tax revenue. Long-run
tax buoyancy for all states’ taxes is greater than one.
Within these aggregate estimates are the large inter-state
variations, ranging from a low of 0.72 to a high of 1.66.
These estimates reflect successful efforts by some states
to improve buoyancy and the need for others to catch up
through reforms in tax architecture, widening the scope
and tax base, and rationalising rates under the GST and
efficiency in tax collection.
2 Buoyancy reflects the effect of both automatic stabilisers and discretionary policy changes; tax elasticity refers to the income effects of discretionary policy changes only.
3 Cointegration method establishes long-run relationship between variables, if they are integrated of order 1.4 If variables are cointegrated, error correction model estimates the short run coefficients and deviation from the long run path and how much
time does the system takes to revert to the equilibrium path.
(Contd.)

Debt: States’ Medium-Term Fiscal Challenge
33
Table 1: Tax Buoyancy
Item
Share in Total
Own Tax Revenue (2019-20)
Tax buoyancy
Period: 1980-81 to 2018-19
Long Run Short Run
Own Tax Revenue 100.0 1.063*** 0.764**
Of Which:
Taxes on Property & Capital Transactions
11.3 1.179*** 1.371**
Taxes on Commodities and Services
88.2 1.054*** 0.678**
Of Which:
Sales Tax 23.2 1.052*** Not significant
State Excise 12.5 1.005*** 0.628**
SGST 43.5 - 1.670**
*** and ** refers to statistical significance at 1 and 5 per cent level. GDP used as base.Notes: 1. SGST includes IGST. 2. Tax Buoyancy of SGST is estimated using panel regression
for period 2017-18 to 2019-20.Source: RBI Staff Estimates.
References
Belinga V., D. Benedek, R. A. de Mooij and J. Norregaard
(2014), “Tax Buoyancy in OECD Countries”, IMF Working
Paper 110.
Dudine, Paolo and Joao Tovar Jalles (2017), “How Buoyant
is Tax system? New Evidence from a Large Heterogeneous
Panel”, IMF Working Paper, January.
Rajaraman, Indira, Rajan Goyal and Jeevan Kumar
Khudrakpam (2006), “Tax Buoyancy Estimates for India
States” , EPW, Vol. 41, Issue 16.
initial teething challenges associated with rate
revisions and sharing pattern of IGST among
states but they seem to have gained traction
in 2018-19. On a monthly basis also, states’
GST revenue seems to be stabilising after
witnessing some initial volatility and is broadly
on an uptrend (Chart III.5).
3.16 A cross-country event-study reveals
that the GST tax to GDP ratio gained
most traction in the year following the
implementation (t+1) but the revenues
settled downwards after two years albeit
higher than pre-GST levels for most countries
(Chart III.6).

State Finances : A Study of Budgets of 2019-20
34
3.17 In the case of India, GST collections have varied across states. Though the rationalisation of rates by the GST Council has brought down the effective weighted average GST rate from 14.4 per cent at the time of inception to 11.6 per cent; enhanced buoyancy has been achieved by widening the tax base and removing distortions (Chart III.7).
3.18 Barring a few states, however, the desired GST targets have proved elusive so far warranting compensation cess in the first two years of implementation. State-wise analysis shows that though the compensation cess increased in absolute amount in 2018-19 RE vis-à-vis 2017-18; as per cent of taxes on commodities and services, it declined for most of the states (with quite a few states lying below the 45 degree line in Chart III.8) and few states not requiring any compensation in 2018-19. This cushion, whereby states’ revenue shortfall under GST remains protected for first five years, should be effectively utilised as the compensation cess is slated to be eliminated
by 2021-22 as per GST (Compensation
to States) Act. Concerted efforts towards
raising GST revenue by plugging loopholes
and mitigating IT glitches are important.
Other steps could include putting in place
an invoice-matching system to facilitate
system validated input tax credit; fixing the

Debt: States’ Medium-Term Fiscal Challenge
35
operational deficiencies in the payment module; alignment of system validations with the GST Acts and Rules; and alleviating system design deficiencies (CAG, 2019). The challenge for the GST Council is to
realise the full potential of GST for enhancing
tax-GDP ratio and work on other areas of
our economy to enhance its competitiveness
(Das, 2019).
3.19 Restructuring of the old administrative
set-up under VAT is the key to successful
tapping of the full potential under GST.
Accordingly, states may have to improve data
analytics, particularly by using the GSTN
network. Some states have started operating
and exploiting their own databases under the
GST regime to enhance revenue.
3.20 Currently, alcohol and petroleum
are still out of the purview of GST. For a
majority of the states, however, the sales tax
on petroleum forms about 15-20 per cent
of own tax revenue, while excise duty on
alcohol accounts for around 10-15 per cent5
(Chart III.9). Furthermore, the effective rates
5 This does not take into account fees for stamping, weights and measures applicable to liquor and VAT on alcohol, accordingly the actual collections might be higher than those reported here.

State Finances : A Study of Budgets of 2019-20
36
of taxes levied by states on petrol vary from
state to state – from 16 per cent in Goa to
39 per cent in Maharashtra for petrol, and
from 11 per cent in Mizoram to 28 per cent
in Andhra Pradesh for diesel. On average,
the effective tax rate levied by states is 28
per cent for petrol and 20 per cent for diesel.
The challenge is to subsume these two
major sources of revenue under GST while
maintaining revenue neutrality, keeping in view
its relevance to maintaining and rationalising
states’ debt.
Own Direct Taxes
3.21 Direct taxes applied by states include
taxes on income and taxes on property as
well as capital tax (mainly stamp duty and
registration fees). They constitute 11.7 per
cent of own tax revenue, with stamp duties
being the major component (10.5 per cent).
Over the years, the share of taxes on income
and expenditure has declined to low levels.
Under this head is also included the agricultural
income tax which currently is exempted from
income tax, irrespective of the size of income,
except those on plantations levied by states like Assam.6 While the share of taxes on income is declining, collections in respect of taxes on profession, trade and employment are rising but with large inter-state variations.7 The scope under tax base expansion for taxes on income and expenditure remains limited, thus, having minimal implications from the perspective of revenue mobilisation.
3.22 As regards stamp duties and registration fees, the reliance of state governments on revenue from these sources remains significant (more than 80 per cent of direct taxes and more than 10 per cent of own taxes), albeit with variation across states
(Table III.2). Revenue from this source is a
6 Not taxing agricultural income may encourage laundering of non-agricultural income as agricultural incomes for tax evasion (Kelkar, 2002; Niti Aayog 2017).
7 Many states are not levying this tax at all, and therefore, the contribution from tax on income and expenditure is almost negligible.
Table III.2: Stamp Duty Collections
As per cent of Direct Taxes
As per cent of Own Tax Revenue
States 2000-01 to
2009-10
2010-11 to
2018-19
2000-01 to
2009-10
2010-11 to
2018-19
Andhra Pradesh 78.3 86.5 8.7 8.2Arunachal Pradesh 28.0 38.7 1.4 0.8Assam 28.0 33.4 2.7 2.1Bihar 88.9 85.1 12.9 12.8Chhattisgarh 75.2 75.1 7.4 7.0Goa 88.8 89.3 5.8 11.6Gujarat 71.1 68.6 7.5 9.3Haryana 98.2 99.6 11.7 11.9Himachal Pradesh 87.9 94.0 4.8 3.4Jammu and Kashmir 90.6 89.2 2.6 3.3Jharkhand 85.1 72.1 4.5 4.7Karnataka 81.2 86.6 10.6 10.0Kerala 89.5 92.2 9.7 8.6Madhya Pradesh 75.6 75.8 10.3 10.6Maharashtra 74.2 84.8 14.6 16.4Manipur 15.5 24.2 2.7 1.5Meghalaya 67.5 63.7 2.1 1.2Mizoram 2.8 10.5 0.4 0.8Nagaland 8.7 6.0 1.8 0.5Orissa 52.2 55.4 4.9 4.6Punjab 98.7 97.5 13.6 10.4Rajasthan 85.5 88.9 9.4 8.6Sikkim 14.7 40.1 1.7 1.7Tamil Nadu 95.4 97.6 9.4 10.3Telangana - 88.5 - 8.1Tripura 36.2 43.6 4.6 3.2Uttar Pradesh 93.3 92.4 15.5 14.4Uttarakhand 94.7 93.1 14.3 8.9West Bengal 46.8 59.3 10.0 10.5NCT Delhi 100.0 99.7 7.8 11.0Puducherry 98.5 98.4 5.5 3.7
All States 82.8 83.7 10.6 10.5
Source: State Budget Documents.

Debt: States’ Medium-Term Fiscal Challenge
37
function of rates that broadly remain same
for stamp duties with limited differentiation
based on gender and size (GoI, 2015;
Alm et al., 2004). The variation in revenue
from this source across states primarily
comes from different registration fee rates
and the benchmark valuation of properties
on which these rates are applied. In most
states, the benchmark valuation of the
property is not market determined, providing
an opportunity for states to increase their
revenue by independent and market related
valuation of properties. Initiatives like
setting up of independent evaluation boards
for land property, and one-time settlement
scheme for settling pending undervaluation
cases are used by certain states and may be
considered by others so as to garner more
revenue from this source.
8 This excludes two outlier states which exhibited very high decline in non-tax revenue during this period. 2007-08 was the peak year of non-tax revenues prior to global financial crisis.
2.2. States’ Non-Tax Revenue
3.23 Non-tax revenue accounts for 8 percent of states’ own total revenue and includes user charges on general, social and economic services, followed by interest receipts and dividends and profits. Unlike the Centre, states’ non-tax revenue has remained volatile, dropping significantly over the last few decades (Chart III.10).
3.24 A majority of states have experienced a decline in non-tax revenue averaging 50 basis points of GSDP during 2007-20198 (Chart III.11).
3.25 The decline in non-tax revenue is mainly under general services, interest receipts and economic services. Economic services currently accounts for more than half of the non-tax revenue of states with a corresponding decline in the share of general

State Finances : A Study of Budgets of 2019-20
38
services. Within economic services, the decline is marked under forestry and wild life, power and irrigation. Industry is the main non-tax revenue generating economic service sector (Table III.3).
3.26 Going forward, with limited scope for states to enhance own tax revenue, the scope for raising revenue lies more on non-tax sources, particularly, user charges on some economic services like power and irrigation. This may not only promote optimal usage of these services, but also help improve the quality of services by endowing states with resources to cover the associated administrative costs. Improving user charges collection does not necessarily mean higher rates; improving the compliance and efficiency in collection and billing of these charges through extensive and improved meterisation could also help achieve the same goal. States can also explore other ways to allow the private sector to exploit states’ resources and put them into productive use after paying appropriate user
charges, thus presenting a win-win situation for both. Examples include utilisation of natural
Table III.3: Non-Tax Revenue Composition
Per cent to GDP Share (Per cent)
2007-08 2019-20 (BE)
2007-08 2019-20 (BE)
States’ Non-tax Revenue 1.60 1.16 100.0 100.0
1. Interest Receipts 0.26 0.12 16.4 10.4
2. Dividends and Profits 0.01 0.01 0.7 1.1
3. General Services 0.55 0.31 34.2 26.3
Of which: Lotteries 0.11 0.06 6.6 5.5
4. Social Services (i to ix) 0.16 0.13 10.2 11.4
Of which:
Education, Sports, Art and Culture
0.05 0.04 3.0 3.1
Medical and Public Health
0.02 0.02 1.1 1.8
Urban Development 0.07 0.04 4.1 3.7
5. Fiscal Services 0.00 0.00 0.0 0.0
6. Economic Services ( i to xvii )
0.61 0.59 38.5 50.9
Of which:
Forestry and Wildlife 0.05 0.03 3.3 2.8
Major and Medium Irrigation Projects
0.04 0.03 2.4 3.0
Power 0.10 0.08 6.1 7.0
Petroleum 0.03 0.05 2.0 3.9
Industries 0.27 0.32 16.9 27.8

Debt: States’ Medium-Term Fiscal Challenge
39
resources like sand, land and mining resources as is being done by few states.
2.3. Central Transfers
3.27 Encapsulating the narrative up to this juncture, states’ capacity to assume debt liabilities and service them in the future will increasingly hinge upon their revenue raising power in terms of indirect taxes including their share in GST and stamp duties. This medium-term budget constraint can certainly be relaxed by new sources of own-revenue more so on the non-tax front.
3.28 A supplemental source, outside states’ revenue raising effort, is the federal transfers, which also assume importance in the context of medium-term sustainability. Additionally, these transfers mitigate imbalances among states, and between states and the Centre, equating the tax base all around. The success of a federal system lies in proportional
revenue raising capacity with responsibility at different levels of the government. In India, however, vertical imbalance exists historically, with the Centre mobilising higher taxes and states invested with greater responsibilities. Rebalancing mechanisms take the form of transfers to states from the Centre which comprise (a) tax devolution (at present, 42 per cent of divisible pool as recommended by FC-XIV); (b) grants recommended by the Finance Commission; and (c) grants and loans from the Centre to states outside the recommendations of the Finance Commission in the form of support to Centrally Sponsored Schemes (CSS).9 Over the last three decades, the difference between the shares of states’ own revenue and Central transfers in total aggregate revenue narrowed from 7.1 per cent
and 4.2 per cent of GDP, respectively, during
2000-05 to 7.8 per cent and 7.2 per cent of
GDP, respectively, by 2018-19 (Chart III.12).
9 While grants from Centre to states are part of revenue receipts of states, loans from Centre to states are part of capital receipts.

State Finances : A Study of Budgets of 2019-20
40
3.29 Central transfers (tax devolution
plus grants) declined during the 1990s but
have gone up thereafter to constitute close
to half of states’ revenue during 2015-20
(Table III.4).
Tax Devolution
3.30 Within overall Central transfers, the
share of tax devolution is predominant at 27
per cent of total revenue of states. Following
the recommendations of the FC-XI, the
coverage of shareable taxes increased to all
taxes as against only income tax and excise
duties earlier.10 While the focus of FC-XII was
on finance commission grants, the FC-XIII
recommended an increase in states’ share in
tax devolution to 32 per cent from 30.5 per
cent. The FC-XIV further increased this share
to 42 per cent, subsuming some Plan grants
in tax devolution and discontinuing sector-specific grants11 (Table III.5).
10 FC-XI suggested an indicative ceiling of overall transfers to states at 37.5 per cent of the gross revenue receipts of the Centre for the first time.11 This was made under the presumption that tax devolution should be the primary channel of resource transfer to states as it is formula based
and conducive to sound fiscal federalism. It served the twin objectives of increasing unconditional transfers to states without affecting the fiscal space of the Union (Reddy et al., 2019).
Table III.4: Trend in Central Transfers as a Ratio to Total Revenue and Expenditure of States(Ratio in per cent)
Item (Average over the period) 2017-18 2018-19 RE
2019-20 BE1990-95 1995-2000 2000-05 2005-10 2010-15 2015-20
1 2 3 4 5 6 7 8 9 10
A. Central transfers to total revenue
40.1 36.9 37.0 40.2 39.3 46.0 43.6 47.9 47.5
of which
Tax Devolution 21.3 22.3 20.9 22.1 22.4 27.2 26.1 26.5 27.0
Grants 18.8 14.6 16.1 18.2 17.0 18.9 17.5 21.3 20.5
B. Central transfers to total expenditure
31.7 27.6 26.6 33.6 33.3 37.8 36.5 39.5 39.8
of which
Tax Devolution 16.9 16.7 15.0 18.5 18.9 22.3 21.8 21.9 22.6
Grants 14.9 10.9 11.6 15.2 14.3 15.5 14.6 17.6 17.2
Note: 1. Central transfers include tax devloution and grants to states. 2. Total revenue include own tax revenue, own non-tax revenue, tax devolution and grants from the centre. 3. Total expenditure include revenue expenditure, capital outlay and loans and advances of states.Source: Reserve Bank of India, ‘State Finances: A Study of Budgets.
Table III.5: Tax Devolution: Changing Pattern(Per cent)
Finance Commission Period
Income Tax
(per cent)
Basic Excise Duties
(per cent)
Number of Commodities
Covered
1 2 3 4
FC -I (1952-57) 55.0 40.0 3
FC-IV (1966-69) 75.0 20.0 All
FC-VIII (1984-89) 85.0 45.0 * All
FC-X (1995-2000) 77.5 47.5 # All
All Central Taxes**
FC-XI (2000-2005) 29.5
FC-XII (2005-2010) 30.5
FC-XIII (2010-2015) 32.0
FC-XIV (2015-2020) 42.0
*: 40 per cent of the net proceeds to be distributed while the remaining 5 per cent would be earmarked for the non-plan revenue deficit states.#: 40 per cent of the net proceeds to be distributed while the remaining 7.5 per cent would be earmarked for the non-plan revenue deficit states.**: share of states in net proceeds of all shareable union taxes and duties.Source: Finance Commission Reports.

Debt: States’ Medium-Term Fiscal Challenge
41
3.31 Although the FC-XIV increased tax devolution, it was essentially a compositional shift from tied to untied transfers12 (Reddy et al., 2019) (Chart III.13).
3.32 The levy of cesses and surcharges by the Union, which are outside the divisible pool, neutralises the increase in tax devolution
recommended by successive Finance
Commissions. The proceeds of cesses and
surcharges, which constituted only 2.3 per
cent of the gross tax revenue of the Centre
in 1980-81, has increased to 15 per cent in
recent years (Table III.6). The transition to GST
has seen the introduction of new cesses on
imports to make up for the cesses subsumed
under GST (Reddy et al., 2019). Although not
part of divisible pool, some part of this are
directed toward states’ welfare.
Grants and Loans
3.33 Grants constitute around 20 per
cent of the total revenue of states. Finance
Commission recommended grants account
for 18.7 per cent of total grants in 2018-19
(0.6 per cent of GDP). Notably, non-Finance
Commission grants, which constitute the
major portion at around 81.3 per cent of
total grants (2.6 per cent of GDP in 2018-19),
are routed through plan schemes and
12 Untied transfers are taken as tax devolution and portion of revenue deficit grant in FC grants, while tied transfers are FC grants excluding revenue deficit grants, non FC grants, and loans from the Centre.
Table III.6: Trend in Special Levies (Cess and Surcharges) by the Central Government (` crore)
Item 1980-81 1990-91 2000-01 2012-13 2013-14 2014-15 2015-16 2016-17 2017-18 2018-19 RE
2019-20 BE
1 2 3 4 5 6 7 8 9 10 11 12
1. Cess - - - 72,200 76,300 83,900 132,658 173,308 149,164 183,348 204,463
2. Surcharge - - - 19,500 28,000 31,900 39,053 44,537 54,151 142,672 164,648
3. Total Cess & Surcharge (1 + 2) 298 3,334 5,655 91,700 104,300 115,800 171,711 217,844 203,315 326,020 369,111
4. Centre’s Gross tax revenue (GTR) 13,149 57,576 188,603 1,036,200 1,138,700 1,244,900 1,455,648 1,715,822 1,919,009 2,248,175 2,461,195
5. Divisible pool 12,851 54,242 182,948 944,500 1,034,400 1,129,100 1,283,937 1,497,978 1,715,694 1,922,155 2,092,084
6. Share of Cess & Surcharge in Centre GTR (Per cent)
2.3 5.8 3.0 8.8 9.2 9.3 11.8 12.7 10.6 14.5 15.0
7. Devolution to States 3,790 14,241 50,737 291,500 318,200 337,800 506,193 608,000 673,006 761,454 809,133
8. States’ Share (Per cent) in Centre GTR
28.8 24.7 26.9 28.1 27.9 27.1 34.8 35.4 35.1 33.9 32.9
Note: ‘-’ NilSource: Report of the FC-XII and Union Budget, GoI, various issues.

State Finances : A Study of Budgets of 2019-20
42
Central Government Ministries for Centrally
Sponsored Schemes (CSS) and Central
sector schemes (Chart III.14).
3.34 Loans from the Centre to states, which is
the remaining component of transfers13, have
gradually come down with discontinuation
of Plan loans from the Centre since 2005-06
in line with the recommendations of FC-XII.
They constituted only 0.17 cent of GDP in
2018-19.
3.35 The current slowdown in the economy
is likely to have implications for tax devolution
to states. The corporate tax and GST rate cuts,
while are important to boost investment, may
result in revenue loss for states in 2019-20,
if not compensated by states’ own efforts
towards revenue mobilisation. As regards
grants, uncertainty with regard to the timing
and quantum of receiving the funds hinders
effective expenditure planning and utilisation
and is generally reflected in a tendency to over-
budget on the part of states14 (Refer Annex
in Chapter II). Adequate revenue to states
on this account and its productive usage is
crucial for achieving sustainable levels of debt
in the medium-term. It will help in reducing
their dependence on market borrowings and
address fiscal shocks on account of schemes
like UDAY or invocation of guarantees, if any,
as discussed in subsequent sections.
3. States’ Liability Burden: Power Distribution
3.36 State governments’ expenditure
on the power sector is largely in the form
of subsidies for agriculture and domestic
customer segments and loans and advances
13 Technically speaking, this component of transfers is a component of capital receipts of states, yet is covered under this section to complete the analysis of transfers.
14 As per states, along with uncertainty with regard to transfer dates, the criteria of transferring the funds to concerned departments within 15 days of receival prevents states from spending it effectively, with the actual expenditure remaining less than the budgeted expenditure.

Debt: States’ Medium-Term Fiscal Challenge
43
to distribution companies (DISCOMs). At the same time, they benefit from revenue receipts from taxes and duties on electricity. For all states taken together, expenditure on power has always exceeded receipts from the sector. In states like Uttarakhand, Odisha, West Bengal, Gujarat, Himachal Pradesh, Sikkim, Chhattisgarh and Goa, however, the sector is a net contributor to the state exchequer (receipts exceed expenditure). Total power
sector expenditure by all states have shown a significant rise in 2003-04, 2015-16 and 2016-17, with UDAY and like schemes altering the composition of states’ spending in favour of capital expenditure15 (Chart III.15).
3.1 Power Distribution Utilities
3.37 Despite wide ranging reforms (Annex III), power distribution remains the weakest link in the sector’s value chain, weighed down
15 In restructuring programs, debt of utilities is taken over by the state either in the form of grants (revenue expenditure) or long-term financing of debt or equity (capital expenditure). In case of UDAY, DISCOMs’ debt was taken over largely in the form of state government debt initially (refer Box III.2) resulting in higher capital expenditure.

State Finances : A Study of Budgets of 2019-20
44
by consistent revenue gaps, bourgeoning losses and unsustainable debt levels. This, in turn, is impacting the upstream power generation companies that suffer from delays in payment of dues.
3.38 Historically, the financial performance of state-level power distribution utilities16 has suffered due to escalating costs and insufficient revenue mobilisation. On the cost side, power purchase cost (that occupies a dominant share in total cost) has increased significantly over the years, while the burden of interest expenses and personnel costs has been consistently high (Chart III.16 a and b).
On the revenue side, pricing by utilities is set below the actual cost for agricultural power and domestic (household) sectors in order to make power affordable for them, with the gap met through a combination of direct subsidy transfers and cross-subsidy from higher tariffs applied to industry. Utilities are unable to monetise the entire power supplied by them. Technical and commercial losses are high due to lack of investment in metering technology, infrastructure and theft (Chart III.16 c and d).
3.2 Impact of Power Distribution Restructuring
3.39 Financial restructuring of state power distribution utilities has been a regular feature
16 State Electricity Boards (SEBs) in the pre-unbundling era and Distribution Companies (DISCOMs) after the SEBs were unbundled into separate generation, transmission and distribution companies.
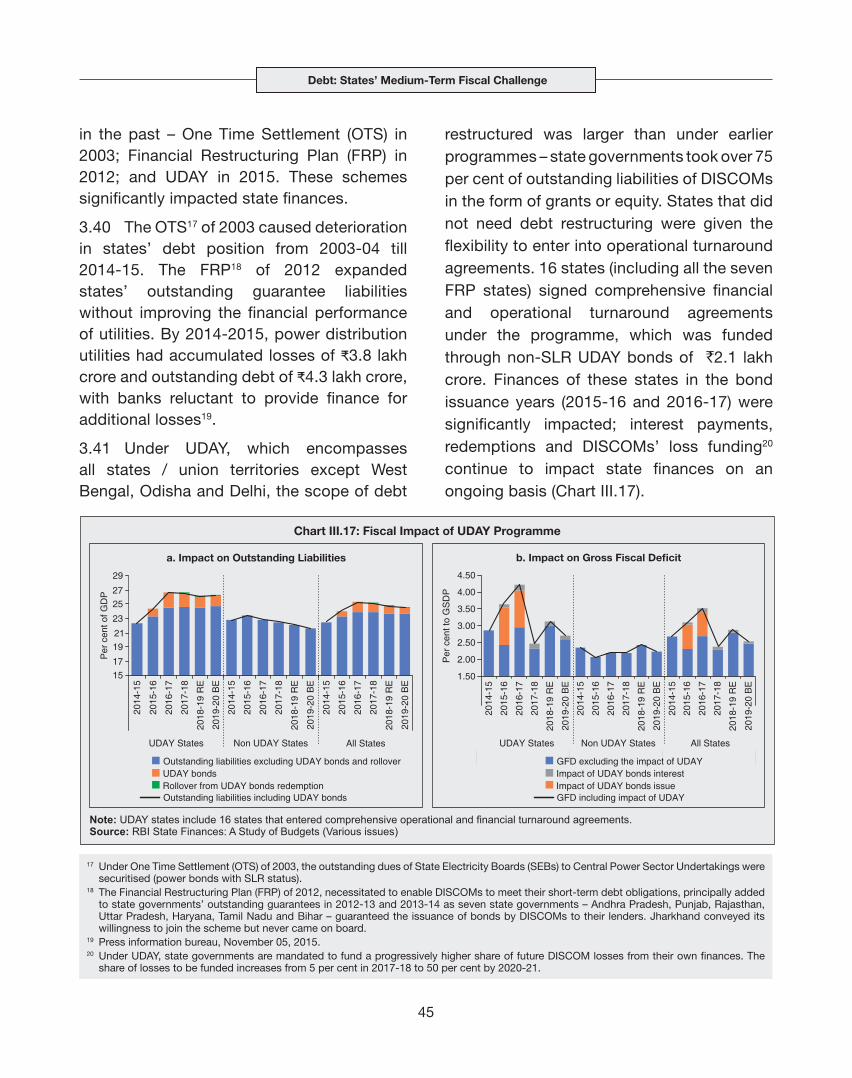
Debt: States’ Medium-Term Fiscal Challenge
45
17 Under One Time Settlement (OTS) of 2003, the outstanding dues of State Electricity Boards (SEBs) to Central Power Sector Undertakings were securitised (power bonds with SLR status).
18 The Financial Restructuring Plan (FRP) of 2012, necessitated to enable DISCOMs to meet their short-term debt obligations, principally added to state governments’ outstanding guarantees in 2012-13 and 2013-14 as seven state governments – Andhra Pradesh, Punjab, Rajasthan, Uttar Pradesh, Haryana, Tamil Nadu and Bihar – guaranteed the issuance of bonds by DISCOMs to their lenders. Jharkhand conveyed its willingness to join the scheme but never came on board.
19 Press information bureau, November 05, 2015.20 Under UDAY, state governments are mandated to fund a progressively higher share of future DISCOM losses from their own finances. The
share of losses to be funded increases from 5 per cent in 2017-18 to 50 per cent by 2020-21.
in the past – One Time Settlement (OTS) in 2003; Financial Restructuring Plan (FRP) in 2012; and UDAY in 2015. These schemes significantly impacted state finances.
3.40 The OTS17 of 2003 caused deterioration in states’ debt position from 2003-04 till 2014-15. The FRP18 of 2012 expanded states’ outstanding guarantee liabilities without improving the financial performance of utilities. By 2014-2015, power distribution utilities had accumulated losses of ₹3.8 lakh crore and outstanding debt of ₹4.3 lakh crore, with banks reluctant to provide finance for additional losses19.
3.41 Under UDAY, which encompasses all states / union territories except West Bengal, Odisha and Delhi, the scope of debt
restructured was larger than under earlier programmes – state governments took over 75 per cent of outstanding liabilities of DISCOMs in the form of grants or equity. States that did not need debt restructuring were given the flexibility to enter into operational turnaround agreements. 16 states (including all the seven FRP states) signed comprehensive financial and operational turnaround agreements under the programme, which was funded through non-SLR UDAY bonds of `2.1 lakh crore. Finances of these states in the bond issuance years (2015-16 and 2016-17) were significantly impacted; interest payments, redemptions and DISCOMs’ loss funding20 continue to impact state finances on an ongoing basis (Chart III.17).

State Finances : A Study of Budgets of 2019-20
46
3.42 The performance of state DISCOMs exhibited significant improvement in reduction of revenue gaps by 2017-18, though some of the gains were reversed in 2018-19 by a sharp increase in power purchase cost. Overall by 2018-19, revenue gaps have reduced by 54 per cent from savings in interest cost, reduction in Aggregate Technical and Commercial (AT&C) losses, tariff hikes and revenue from grants (refer Box III.3). All 16 states have carried out tariff hikes since the start of the program, though the momentum of hikes has reduced from the initial years (Chart III.18).
3.43 Almost all states have registered an improvement in reducing the Average cost of supply – average realisable revenue (ACS-ARR gap) and in bringing down AT & C losses. However, they lag behind in eliminating the ACS-ARR gap and bringing AT & C losses to below 15 per cent by 2018-19 / 2019-20 as prescribed by the UDAY agreements (Chart III.19).
3.44 With the coupon rate on UDAY bonds at
a premium over those on SDL bonds, the cost
of debt servicing has gone up for the UDAY
states (Chart IV.20a). The impact on state
finances is likely to continue much beyond
the terminal year due to interest payment on
UDAY bonds and redemption of these bonds
(Chart IV.20b).
3.45 Outstanding dues of DISCOMs
towards power purchases have risen sharply
in the recent period, after registering decline
immediately post UDAY (Chart III.21). This
could be an indication of financial stress in
some DISCOMs, entailing the risk of fiscal
surprise from their future bailouts. Another
potential impact from UDAY could materialise
from takeover of incremental losses of
DISCOMs as mandated in UDAY agreements,
particularly as the benefit of grants to
supplement revenues will not be available for
some states (Box III.2).

Debt: States’ Medium-Term Fiscal Challenge
47
4. Guarantees
3.46 State governments provide off-budget
support to State Public Sector Enterprises
(SPSEs) through guarantees21 on their
borrowings from financial institutions. While these guarantees help states undertake capital expenditure through the SPSEs, weak cost recovery mechanisms could render them a source of fiscal risk stemming from
21 Guarantees are different from off-budget liabilities that states undertake — where both interest and repayment are borne by the state government, though the borrowing is reflected in the books of SPSEs. There is limited information on these off-budget liabilities. Apart from guarantees issued to PSEs by state governments, these are also issued to municipal bodies, cooperative institutions, among others.

State Finances : A Study of Budgets of 2019-20
48
While the impact of UDAY on state finances from interest
payments and redemptions is predictable, the impact of future
losses takeover is inherently uncertain as it is dependent
upon the realised financial performance of DISCOMs. State
governments are mandated to fund a progressively greater
share of DISCOM future losses from their own finances and
prevent ballooning of losses on DISCOMs’ books. As per
this provision, states were supposed to provide funding of ₹
2,726 crore in 2018-19, though incomplete compliance with
this provision has resulted in less than half of this amount
being funded (Chart 1).
The impact of this provision on state finances could increase
significantly in 2019-20 and 2020-21 due to: i) higher share
of losses to be funded; and ii) reduction in revenue benefits
to DISCOMs from the conversion of state government debt
into grants on account of varied debt restructuring models
adopted by state governments.
Box III.2: Risks from Future Takeover of Losses under UDAY
The phased conversion of debt into equity or grant affects the
composition of state government expenditure and receipts
and impacts the revenue deficit (the gross fiscal deficit
and debt position are not impacted due to compensating
entries) (Chart 2a). The impact on DISCOMs’ financials is
also a factor as they will continue to hold a share of the debt
restructured till 2019-20, while generating revenue from
grants till 2020-21 (Chart 2b).
The reduction in revenue from grants for DISCOMs in
2018-19 to 2020-21 could potentially increase DISCOM
losses, particularly for states of Uttar Pradesh, Telangana,
Rajasthan, Jharkhand and Andhra Pradesh. This could
entail a significant fiscal outgo with a greater share of these
losses mandated to be funded by states. This makes it
incumbent upon states to take the necessary steps for the
turnaround of DISCOMs and to eliminate revenue gaps in a
time-bound manner.
Chart 1: DISCOMs’ Loss Takeover Schedule and Impact
Year Share of previous year’s DISCOM loss to be taken over by the state
2017-18 5 per cent
2018-19 10 per cent
2019-20 25 per cent
2020-21 50 per cent

Debt: States’ Medium-Term Fiscal Challenge
49
their invocation, since they impact states’ debt position through the ∆Ot component of equation (1) on page 27. There are significant discrepancies across states with regard to the quality and timeliness of guarantees data. Data obtained from the reports by the CAG22
and supplemented by data directly obtained from state government finance departments indicate that outstanding guarantees of states plummeted from 6.4 per cent of GDP at end-March 2005 to 2.0 per cent of GDP by end-March 2017. In 2017-18, however, guarantees rose to 2.5 per cent of GDP with a year-on-year growth of 37.7 per cent (Chart III.22).
3.47 In terms of the sectoral distribution of exposure, the power sector remains dominant – accounting for over 60 per cent of total outstanding guarantees, on average (Chart III.23). For a few states, it accounted for over 80 per cent – followed by the transport sector.
3.48 States like Rajasthan, Uttar Pradesh, Andhra Pradesh, Punjab, Tamil Nadu, Madhya Pradesh and Telangana have a relatively high guarantees to GSDP ratio. At the other end of the spectrum are states of Gujarat, Odisha and
22 Data on guarantees are not reported directly in the state budgets. States are required to report details on outstanding guarantees in their Medium-term Fiscal Policy (MTFP) statement. CAG data on guarantees are available with a lag of about two years, through state-wise report on Finance Accounts. Time series on gurantees is avaliable at Statement 28 on page 175.

State Finances : A Study of Budgets of 2019-20
50
Uttarakhand. For states like Maharashtra, Bihar and Karnataka, guarantees are expanding in the recent period from relatively small initial levels (Chart III.24).
3.49 Measures have been put in place to safeguard against excessive reliance of SPSEs on guarantees and to ring-fence the state budgets from possible invocations. First, a guarantee fee is imposed by the state governments, varying from 0.5 per cent to 2.0 per cent of guarantees; however, it is often waived. Second, caps/limits are imposed by most states on issue of additional guarantees in the State Government Guarantees Act/Fiscal Responsibility Legislations (FRLs). Thirdly, as indicated in Chapter II, a few states have set up Guarantee Redemption Fund (GRF) for meeting the payment obligations as per FC-XII recommendation.
3.50 Although the outstanding guarantees are at modest levels at the current juncture, fiscally-stressed state governments may not have enough fiscal space to bear the
additional financial burden of invoked guarantees. Financing them via borrowings such as UDAY bonds may also have credit and financial market implications. A comprehensive framework for guarantee management is warranted with key elements including adherence to caps/limits based on sustainability, maintenance of GRF based on portfolio risk assessment by all states, timely collection of guarantee fees and comprehensive information on loans extended against state government guarantees/letters of comfort as also guarantees invoked and settled/waived-off.
5. Market Borrowings by States
3.51 In recent years, states’ financing mix has changed. In line with the recommendation of the FC-XIV, most of the states and union territories have been excluded from the National Small Savings Fund (NSSF) financing facility from 2016-17, increasing their reliance on market borrowing. Consequently, State Development Loans (SDLs) issuances have
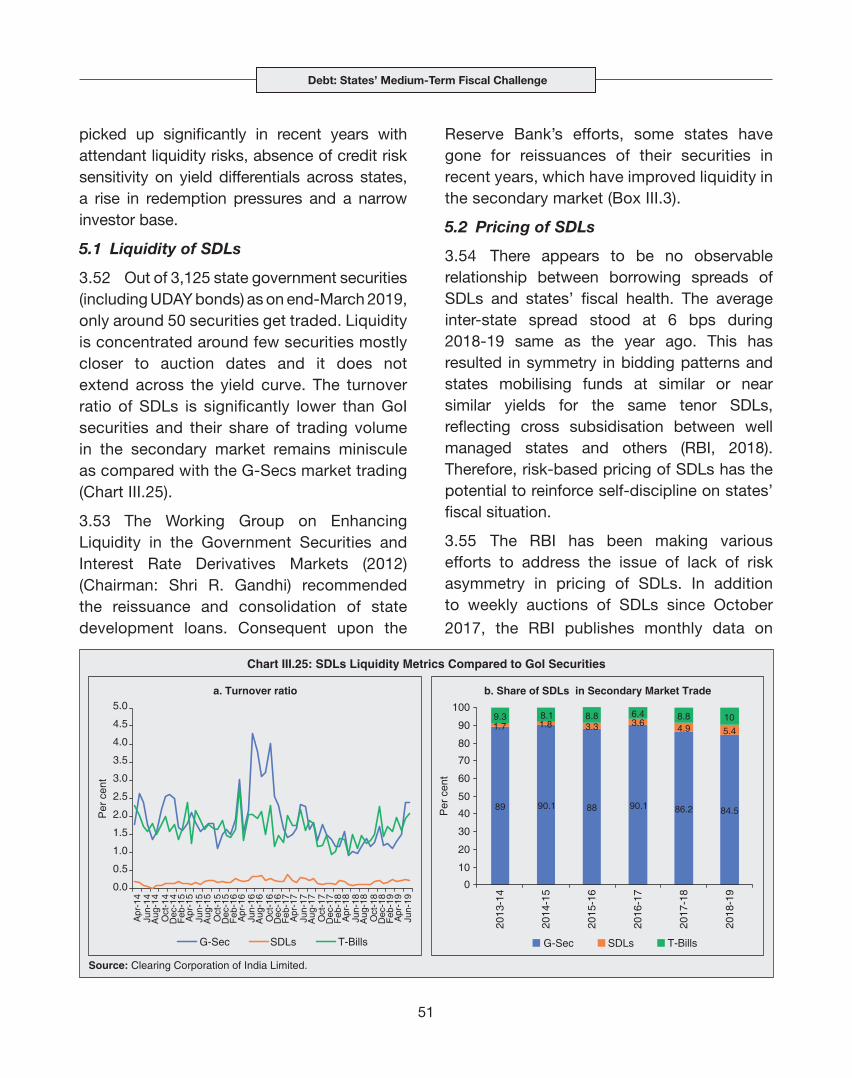
Debt: States’ Medium-Term Fiscal Challenge
51
picked up significantly in recent years with attendant liquidity risks, absence of credit risk sensitivity on yield differentials across states, a rise in redemption pressures and a narrow investor base.
5.1 Liquidity of SDLs
3.52 Out of 3,125 state government securities (including UDAY bonds) as on end-March 2019, only around 50 securities get traded. Liquidity is concentrated around few securities mostly closer to auction dates and it does not extend across the yield curve. The turnover ratio of SDLs is significantly lower than GoI securities and their share of trading volume in the secondary market remains miniscule as compared with the G-Secs market trading (Chart III.25).
3.53 The Working Group on Enhancing Liquidity in the Government Securities and Interest Rate Derivatives Markets (2012) (Chairman: Shri R. Gandhi) recommended the reissuance and consolidation of state development loans. Consequent upon the
Reserve Bank’s efforts, some states have gone for reissuances of their securities in recent years, which have improved liquidity in the secondary market (Box III.3).
5.2 Pricing of SDLs
3.54 There appears to be no observable relationship between borrowing spreads of SDLs and states’ fiscal health. The average inter-state spread stood at 6 bps during 2018-19 same as the year ago. This has resulted in symmetry in bidding patterns and states mobilising funds at similar or near similar yields for the same tenor SDLs, reflecting cross subsidisation between well managed states and others (RBI, 2018). Therefore, risk-based pricing of SDLs has the potential to reinforce self-discipline on states’ fiscal situation.
3.55 The RBI has been making various efforts to address the issue of lack of risk asymmetry in pricing of SDLs. In addition to weekly auctions of SDLs since October
2017, the RBI publishes monthly data on

State Finances : A Study of Budgets of 2019-20
52
Box III.3: Re-issuances of SDLs and Liquidity
Re-issuance of SDLs is a new phenomenon in the state
government security market, which may help in building
corpus for secondary market (volume) trading. It also
facilitates debt consolidation, albeit passive. Furthermore,
this may have a salutary impact on the yields in the
primary market and hence help in cost savings for the
government. During 2017-18 and 2018-19, seven states
undertook re-issuances. The volume of re-issued to total
issue of securities has gone up from 10.0 per cent in
2017-18 to 11.2 per cent in 2018-19. During 2017-18, the
average cut-off yield across all tenors of the re-issued
papers was 6.96 per cent as against average 7.15 per cent
of the non-reissued papers; likewise, the average cut-off
yield of re-issued papers across all tenors was 7.44 per
cent during 2018-19 as against 7.73 per cent for the non-
reissued securities.23
An ideal measure of the liquidity of the SDL market is the
bid-ask spread. However, due to low level of trading in
SDLs, other measures of illiquidity have been constructed,
viz., percentage of no trading days (PNT); Kyle Obizhaeva
(KO) and Amihud, following Amihud (2002) and Davis, et. al
(2018) (Table 1). The PNT is computed on the basis of the
number of non-trading days over the total trading days in a
month. The Kyle and Obizhaeva (KO) measure depicts the
variance of bond returns scaled by the volume traded. The
third measure of illiquidity, Amihud Illiquidity, takes into
account the return of the bond scaled by average volume
traded. The lower the value of these three measures of
illiquidity, better is the liquidity of a security.
PNTi,t = (Zero Volume Trading Daysi,t /Trading Days in
Montht)*100
Kyle Obizhaeva Illiquidityi,t = (Return Variance i,t /
Pricei,t*Volumei,t)1/3 * 106
Amihud Illiquidityi,t = (1/Di,t) * 106
where Di,t is the number of observations for security i during
time t
These measures of illiquidity indicate re-issued securities
are more liquid than non-reissued papers in respect of
5-year paper of Tamil Nadu and Maharashtra. However,
this relationship is not observed for shorter tenor securities.
(Contd.)
Table 1: Illiquidity Statistics of SDLs
2017-18 and 2018-19
Re-issued Non-reissued
State24 Tenor Volume (` Cr)
PNT KO Amihud Volume (` Cr)
PNT KO Amihud
Madhya Pradesh <1 1706 92.5 0.08 0.0000012 - - - -
Himachal Pradesh 3 97 95.49 1.67 0.006 - - - -
Maharashtra 3 602.03 91.8 1.52 0.001 1244.3 85.28 0.5326 0.0004
Maharashtra 5 3445.31 78.56 0.66 0.001 765.94 93.13 0.911 0.001
Tamil Nadu 5 2417.30 73.58 0.481 0.0005 635.51 90.06 1.27 0.00156
Maharashtra 10 10104.5 64.6 1.20 0.0103 2078.29 71.5 1.27 0.002
Tamil Nadu 10 8335.02 68.44 1.09 0.009 3314.81 70.76 1.25 0.009
Haryana 10 2642.42 71.19 1.21 0.003 1363.78 70.92 1.51 0.006
Punjab 10 5308.03 61.73 1.32 0.006 1450.39 75.01 2.07 0.026
Maharashtra 12 5832.37 67.93 1.7 0.016 - - - -
Punjab 12 2882.02 69.67 1.45 0.005 - - - -
Maharashtra 15 155 84.16 2.62 0.0035 - - - -
Punjab 15 2407.96 74.07 1.6 0.006 - - - -
Madhya Pradesh 15 939.71 81.69 2.23 0.0032 - - - -
-: not available.PNT- is calculated on an average.
23 Apart from re-issuance other factors such as tenor, macro economic conditions influence SDL yields.24 Odisha also re-issued a 19-year paper which is not considered for the analysis, due to unavailability of comparable paper.

Debt: States’ Medium-Term Fiscal Challenge
53
Re-issuance (especially of longer tenors) impacts the volume positively and could help in reducing the cost to the issuer. The spread of the re-issued paper in the
states’ market borrowing, data on financial accommodation through Special Drawing Facility, Ways and Means Advances, Overdrafts and investments by states in reserve funds, viz., Consolidated Sinking Fund (CSF) and Guarantee Redemption Fund (GRF.) This annual State Finances Report of RBI is released with a minimum lag with the support of state governments. Monthly data on states’ fiscal position released by the CAG are also consolidated and released on a half-yearly basis by the Reserve Bank in its monthly Bulletin.
3.56 As regards policy initiatives, it was decided in June 2018 that the initial margin requirement for rated SDLs in the LAF window (repo) shall be set at 1.0 per cent lower than that of other SDLs for the same maturity buckets, i.e., in the range of 1.5 per cent to 5.0 per cent with a view to incentivising states to get SDLs publicly rated. Also, SDLs held by banks in their investment portfolios are
now valued at observed prices, i.e., the actual traded price or, as per Financial Benchmark of India Private Limited (FBIL) valuation in case of non-traded securities. In its statement on Developmental and Regulatory Policies (August, 2019), Reserve Bank announced stripping/reconstitution facility for SDLs, to be implemented in consultation with the state governments.
3.57 Various jurisdictions, including emerging market economies, are moving towards sub-national credit ratings for issuances by state governments, provinces and municipalities. This may help the market to price risks appropriately, and in turn, enable efficient price discovery. In India, an Automatic Debit Mechanism (ADM) was introduced for state governments as a market development measure, to increase the confidence of investors. From a market perspective, credit rating and phasing out of ADM facility may help in better price discovery.
ReferencesAmihud, Y. (2002). “Illiquidity and Stock Returns: Cross-Section and Time-Series Effects”. Journal of Financial Markets, 5(1), 31-56.Amihud, Y., & Mendelson, H. (1991). “Liquidity, Asset Prices and Financial Policy”. Financial Analysts Journal, 47(6), 56-66.Davis, R., Maslar, D.A., & Roseman, B. (2018). “Secondary Market Trading and the Cost of new debt issuance”. Available at SSRN 2954857
primary market is relatively lower for Maharashtra, and similar is the experience of Tamil Nadu, except in 2018-19 (Chart 1).

State Finances : A Study of Budgets of 2019-20
54
5.3 Maturity Profile of SDLs
3.58 The maturity profile of borrowings by states is an important indicator of roll-over risks and debt servicing costs, which impinge on the efficacy of debt management strategies. In the aftermath of the global financial crisis (GFC), the market borrowing of states increased significantly, conditioned also by the cut-off of
access to NSSF funds. The bunching of the maturity profile of states borrowings around the ten-year bucket has also aggravated redemption pressures on states starting from 2018-19 and peaking in 2026-27 (as discussed in Chapter 2), warranting priority for strategies for elongation of maturities (Box III.4).
Box III.4: Elongation of Debt: Telangana ExperienceElongation of maturity of the portfolio is a preferred strategy in the cross-country experience to limit rollover risk in the debt structure, which has resulted in more resilient debt portfolios (OECD, 2019; Maravalle and Rawdanowicz, 2018; Chatterjee and Eyigungor, 2012). Long tenor bond issuance reduces refinancing risk, ‘locks in’ current yield levels in a rising interest rate scenario and creates benchmarks for valuation of long term corporate bonds, perpetual bonds and the present value of future income streams relating to long-term projects, especially in infrastructure. There are potential risks – uncertainty in pricing of long gilts; the possibility of locking in bonds at higher yields; and illiquidity of super-long gilts.
In India, the debt management has emphasised elongating the maturity profile of debt as a risk mitigation strategy. The maturity of Government of India’s outstanding borrowing has been steadily increasing, with the tenure of the longest
sovereign debt security being 40 years (GoI, 2018 and RBI, 2018). In contrast, market borrowing by state governments in India mainly relies mostly on issuance of ten-year bonds.
Since 2015-16, 15 state governments and the union territory of Puducherry have issued longer tenor securities. Among these states, the case of Telangana is instructive as the state has been issuing securities with longer tenors since 2016-17, with the longest tenor being 30 years (currently the longest tenor for state government securities). The effect of this strategy can be observed by comparing its actual redemption pattern vis-à-vis a hypothetical situation of issuance of standard 10-year securities only (Chart 1).
The maturity structure of Telangana debt profile has improved, with the weighted average maturity of market borrowings at 14.79 years at end-March 2019.
References:Chatterjee, S., & Eyigungor, B. (2012). “Maturity, Indebtedness, and Default Risk”. American Economic Review, 102(6), 2674-99.Government of India (2018). Status Paper on Government Debt for 2017-2018; Ministry of Finance, OECD. (2019). “Sovereign Borrowing Outlook for OECD Countries”. OECD Sovereign Borrowing Outlook 2019. OECD, Paris.Maravalle, A., & Rawdanowicz, L. (2018). “To shorten or to lengthen? Public Debt Management in the Low Interest Rate Environment”. OECD Economics Department Working Papers No 1483.Government of India (2018). Status Paper on Government Debt for 2017-18, Ministry of Finance. Reserve Bank of India (2018). Annual Report 2017-18.

Debt: States’ Medium-Term Fiscal Challenge
55
5.4 Ownership Pattern of SDLs
3.59 The Indian SDL market remains largely
wholesale, dominated by public sector
banks and insurance companies which
account for about one-third each of SDLs
as on March 31, 2019, while provident
funds (PFs) account for about 22 per cent
(Chart III.26a). Recently, investments by
banks in SDLs have been declining in
line with the progressive reduction of
SLR requirements.25 In accordance with
the Medium-Term Framework (MTF) for
investment by Foreign Portfolio Investors
(FPIs) in Government securities put in place
since October 2015, the FPI limit prescribed
for SDLs is to be 2 per cent of the outstanding
stock of securities by the end of 2019-20. Of
this limit, i.e., ₹56,800 crore for both General
category and Long-term (valid till end-
September 2019) only 2.6 per cent has been
utilised till September 23, 2019. Moreover,
foreign investors have exited from states
SDLs which face deteriorating fiscal positions
(Chart III.26b).
3.60 The exposure of long-term FPIs
(sovereign wealth funds, pension funds, and
the like) in SDLs is nil. By contrast, FPIs have
shown ample appetite for Central government
securities as about two-thirds of limits on
them for general category FPIs stands utilised
as on September 23, 2019 (though long-term
FPIs have used only 30.6 per cent of their
limit).26 Improving transparency on states
fiscal positions is increasingly seen as a pre-
requisite for enhancing FPI interest in SDLs
(Table III.7).
25 Going forward, with the likely phasing out of ADM facility and reduction in SLR may impact the cost of borrowing for state governments and the attraction to hold SDLs in banks’ books, for reason other than the Yield to Maturity (YTM) they offer.
26 In fact, at end-March 2018, over 90 per cent of the total FPI limits in central government securities had been exhausted.

State Finances : A Study of Budgets of 2019-20
56
Table III.7: FPI in State Development Loans: Limits and Investment
End-March General Category Long-term FPIs Total
Upper limit (₹ crore)
Total Investment
(₹ crore)
Per cent of limits utilised
Upper limit (₹ crore)
Total Investment
(₹ crore)
Per cent of limits utilised
Upper limit (₹ crore)
Total Investment
(₹ crore)
Per cent of limits utilised
2014 - - - - - - - - -
2015 - - - - - - - - -
2016 7,000 4477 64.0 - - - 7,000 4477 64.0
2017 21,000 1560 7.4 - - - 21,000 1560 7.4
2018 31,500 5535 17.6 13,600 0 0.0 45,100 5535 12.3
2019 38,100 2468 6.5 7,100 0 0.0 45,200 2468 5.5
As on Sept. 23, 2019
49,700 1476 3.0 7100 56,800 1476 2.6
Memo item: Central government securities
As on Sept. 23, 2019
2,34,700 1,77,958 75.8 1,03,700 31,766 30.6 3,38,400 2,09,724 62.0
Note: “-: NIL”
3.61 The Reserve Bank has also been taking
various measures to widen the investor
base for SDLs. The endeavour to increase
the retail participation in the Government
security market is a case in point. In addition
to scheduled commercial banks and primary
dealers, specified stock exchanges approved
by SEBI have been permitted to act as
Aggregators/Facilitators (through a web-
based application provided to their clientele)
to submit consolidated bids under the non-
competitive segment of primary auctions.
In June 2019, it was decided to extend this
facility to the non-competitive segment of the
primary auctions of SDLs. The withdrawal of
some exemptions on the minimum residual
maturity requirement of FPI may also
contribute to widening the investor base of
SDLs.
6. Debt Sustainability
3.62 This section undertakes a
comprehensive debt sustainability analysis
for Indian States, both backward-looking
by using the trends in existing outstanding
liabilities of the states, and forward looking by
outlining the balance of risks as highlighted
in Sections 2 to 5 and keeping in mind the
recent growth slowdown.
3.63 The build-up of sub-national debt,
in reflection of the growing developmental
requirements of state governments and
their limited revenue raising capabilities, has
been aggravated in recent years by
restructuring schemes like UDAY as
discussed earlier in Section 3, and rise in
guarantees in Section 4. At moderate levels,
debt enhances economic growth while high
levels can put a drag on growth (Reinhart and
Rogoff, 2008; Checherita and Rother, 2010;
Woo and Kumar, 2010; Cecchetti, Mohanty
and Zampolli, 2011). As observed, states
with average debt to GDP ratios of more than
40 per cent in 2011-12 clocked lower growth
in the following three years, i.e., 2012-13 to

Debt: States’ Medium-Term Fiscal Challenge
57
2014-15, while those with lower debt to GDP
ratio in 2011-12 witnessed higher growth over the same period (Chart III.27).
3.64 The evolving debt position of Indian states has witnessed several phases: a comfortable position prior to the Asian crisis of 1997, followed by a sharp deterioration till
2003-04. However, a significant improvement
occurred post the enactment of FRLs, only
to be derailed from 2015-16 by issuance
of UDAY bonds, farm loan waivers, and the
Seventh Pay Commission awards. The debt
to GDP ratio of states has risen to around 25
per cent, on an average, during the last three
years. Moving in tandem, the ratio of debt
to own revenue collections for states, was
edged to above 300 per cent since 2015-16.
(Chart III.28).
3.65 The FC-XIII, FC-XIV and the FRBM
Review Committee (Chairman: Shri N.K.
Singh) recommended debt targets for states.
In 2018-19 RE, while many states were below
the 3 per cent of GFD-GDP threshold, the
25 per cent debt to GDP threshold stands
breached by many states. A slightly stringent
criterion as prescribed by the FRBM Review
Committee and in line with the revised
FRBM implied debt target of 20 per cent will

State Finances : A Study of Budgets of 2019-20
58
put most of the states above the threshold
(Chart III.29).
3.66 India has the highest sub-national
debt vis-à-vis other BRICS countries
(Chart III.30). China stands at second highest,
mainly driven by rising local government
debt and the weak performance of public
corporations. If additional off-budget local government debt of 30 per cent to GDP is added for China, its sub-national debt would rise to over 50 per cent (IMF Fiscal Monitor, October 2018). The debt of other sub-nationals in countries like Colombia, Argentina and Indonesia, which borrow in the market by issuing state development bonds, remained subdued at less than 10 per cent of GDP.
3.67 Debt sustainability indicators assess the credit worthiness and the liquidity position of state governments by examining their ability to service interest payments and repay debt out of current and regular sources of revenue (excluding temporary or incidental revenue such as grants or capital receipts resulting from sale of assets). A declining ratio of interest payments to revenue receipts and a ratio less than 10 per cent (XIV-FC) is also regarded as indicative of debt being sustainable. An analysis on the indicators of

Debt: States’ Medium-Term Fiscal Challenge
59
debt sustainability of states at aggregate level in different phases during the period 1981-82 to 2018-19 reveals that the real rate of interest has been lower than growth rate of real GDP in all phases, thus, fulfilling the necessary condition of debt sustainability. However, primary balance has remained consistently negative through all phases (except Phase III (2004-05 to 2007-08)), violating the sufficient condition of debt sustainability (Table III.8). Moreover, during the last phase (2015-16 to 2018-19) which coincides with the issuance of UDAY bonds, the highest primary deficit in the post-FRBM period has been recorded. Notwithstanding a decline in interest receipts to revenue receipts ratio, it has remained higher than the tolerable limit of 10 per cent as prescribed by FC-XIV. These developments signal potential debt sustainability risks.
3.68 In the literature, the measurement of debt sustainability27 has preferred backward looking empirical approaches with historical
Table III.8: States’ Debt Sustainability - Indicator-based Analysis
Phase I Phase II Phase III Phase IV Phase V Phase VI
Indicators 1992-93 to 1996-97
1997-98 to 2003-04
2004-05 to 2007-08
2008-09 to 2011-12
2012-13 to 2014-15
2015-16 to 2018-19
1 2 3 4 5 6 7
r*-g<0 -6.1 -1.0 -5.1 -10.1 -7.6 -4.4
PB/GDP ≥ 0 -0.8 -1.6 0.0 -0.6 -0.7 -1.3
IP/RR 15.6 22.4 19.1 13.8 12.1 11.9
D-G<0 -1.7 7.6 -4.8 -5.0 -2.0 3.4
*: Nominal interest rate is calculated as a ratio of interest payment at t to debt at t-1. CPI (IW) is used to derive real interest rate from nominal interest rate.Note: r is Real rate of interest; g is real output growth; PB is primary balance; IP is interest payments; RR is revenue receipts; D stands for rate of growth of public debt and G pertains to rate of growth of nominal GDP. Source: Budget documents of state governments and MoSPI.
information to evaluate the current debt position (Hamilton and Glavin, 1986; Trehan and Walsh, 1988; Bohn, 1998). In this tradition, a panel estimation capturing the heterogeneity across states and the downside risk of guarantees being invoked shows that for all states taken together, debt remains broadly sustainable in the medium-term, but becomes unsustainable when outstanding guarantees are incorporated into the debt stock (Box III.5).
3.69 Since the 1980s, EMEs have suffered frequent visitations of debt crises even as they engaged in progressive integration into the global economy either to harness new engines of growth or under the influence of IMF-driven structural adjustment programs. Quite naturally, debt sustainability analysis has moved to centre stage in the conduct of fiscal policy in these countries.
3.70 In view of the incidence of debt crises, practitioner approaches started overtaking the literature in proposing forward looking
27 Debt sustainability is a situation in which a borrower is expected to be able to service its debt without an unrealistically large future correction in the balance of income and expenditure (IMF, 2002).

State Finances : A Study of Budgets of 2019-20
60
Box III.5: Debt Sustainability of Indian States: An Empirical Assessment
The empirical literature on debt sustainability of Indian
States offers mixed evidence – debt is sustainable (Kaur
et. al 2018; and Renjith and Shanmugam, 2018) versus the
view that it is unsustainable (Shastri and Sahrawat, 2015;
Tiwari, 2012; Misra and Khundrakpam, 2009). Most of these
studies use the conventional outstanding liabilities concept
of debt to analyse its sustainability. The analysis presented
in this box contributes to the literature: first, by covering
all states28 in an updated time series including the post-
UDAY period for the first time and second, by going beyond
the conventional debt sustainability analysis to include
contingent liabilities in the form of guarantees under what is
termed as augmented debt, as recommended by XIV-FC, to
take a holistic approach of states’ debt sustainability.
Debt sustainability is analysed in a panel framework by
using a standardised approach (Bohn, 1998) that uses
historical information from the post-FRBM period 2004-05
to 2017-18 for all states29; encapsulated in a fiscal policy
response function as follows:
P i,t = αi + β di,t-1 + γ` Xi,t + εi,t ……. (1)
where P is the primary balance-to-GDP in year t; d is debt
stock in t-1 and X denotes control variables viz. output gap
and revenue receipts in this analysis. ‘β’ is the principal
coefficient which measures the response of the primary
balance to variations in debt. If a rising debt-to-GDP ratio
leads to a rise in the primary deficit, then debt tends to be
unsustainable which is reflected in a negative β coefficient.
A positive coefficient on the output gap indicates that
primary balance improves when GSDP is above trend.
While the other control variable — revenue receipts (RR)
— allows for differential fiscal structures amongst states as
some states have higher revenue generating capacity than
others. In this way, revenue receipts is representative of
stronger debt servicing capacity. All the variables have been
taken as proportions to GSDP. The estimations are carried
out with Feasible General Least Squares (FGLS) (Adams
et al., 2010; Abiad and Ostry, 2005), given the presence of
heteroscedasticity across states.30
Although the β coefficient is negative in Model 1, it is
insignificant, thus rejecting the null of unsustainability of
Table 1: Dependent Variable: Primary Balance as a
proportion to GSDP
Model 1 Model 2
Lag debt -0.02 (0.12)
Lag augmented debt -0.040***(0.00)
Real GSDP Gap 0.04* (0.06) 0.047**(0.03)
Revenue Receipts (RR) 0.06***(0.00) 0.07***(0.00)
Constant -0.58 (0.6) -1.25 (0.51)
Wald chi-squared (26) 302***(0.00) 320***(0.00)
Notes: 1. Figures in parentheses are p-values; ***, **,* significant at 1 per cent, 5 per cent and 10 per cent levels, respectively.
2. Augmented debt is obtained after adding outstanding guarantees to the outstanding liabilities of state governments. One-year lag of debt and augmented debt is taken to surmount the problem of endogeneity.
3. Cross-section and time-effects are taken into account.Source: Staff calculations
28 This is in line with the XIV Finance Commission analysis which eliminated the distinction between special category states and non-special category states.
29 For the above analysis, two states, viz. Goa and Jharkhand, have not been included in the estimation due to unavailability of data on the variable outstanding guarantees as augmented debt could not be calculated.
30 Breusch-Pagan test was carried out to check for heteroscedasticity and the null hypothesis of homoscedasticity was rejected.
states’ debt. In Model 2, however, which considers the
unlikely scenario of invocation of all states’ guarantees
(augmented debt in Table 1), the β coefficient is negative and
significant at 1 per cent level, and debt clearly moves into
the unsustainable zone. The control variables are correctly
signed and are statistically significant. Robustness checks
have been conducted by using other control variables, viz.,
revenue receipt gap and primary expenditure gap and they
buttress the empirical results.
This analysis highlights the vulnerability of states’ debt to
guarantees, if invoked. On balance sheet accumulation
of debt, it does not pose imminent risks at this juncture,
although the quality of spending by states and improving
tax buoyancies are key to attaining the FRBM debt targets.
References
Abiad, A. d., & Ostry, J. D. (2005). “Primary Surpluses and
Sustainable Debt Levels in Emerging Market Countries”.
IMF Policy Discussion Papers, 05(6).
Bohn, H. (1998, Aug). “The Behavior of U.S. Public Debt and
Deficits”. Quarterly Journal of Economics, 113(3), 949-963.
Kaur, B., Mukherjee, A., & Ekka, A. P. (2018). “Debt
Sustainability of States in India: An Assessment”. Indian
Economic Review, 53(1), 93-129.

Debt: States’ Medium-Term Fiscal Challenge
61
approaches to debt sustainability, both external and fiscal. They provided more realistic assessments of the future rather than the past and the current, and this caught the attention of policy authorities across the world. Various country experiences with managing debt sustainably eventually crystallised into the Debt Sustainability Analysis (DSA) framework of the IMF (2002) and the World Bank (2005) with small variations by other multilateral agencies (OECD, 2013; ECB, 2011).
3.71 At the core of the DSA is the historical decomposition of debt dynamics and the baseline scenario projected over a minimum duration of five years. Standardised DSA templates, stress testing and risk scenarios around the baseline projection came to be recommended by the IMF- World Bank for wide country adoption (IMF 2008; World Bank 2006).31 Improvements were made in the template by streamlining the DSA with the use of simplified tables focusing on the baseline and the historical scenarios. Furthermore, considering that there is a tendency for policymakers to be optimistic in their projections, realism in formulating medium-term fiscal projections is envisaged in spelling out the assumptions and a periodic review of them is crucial (IMF, 2002).
3.72 In a conventional DSA, debt accumulation is driven by two main factors: i) the primary balance; ii) the differential between the interest rate and GDP growth rate. The path of debt can be expressed in an accounting-based approach linked to the inter-temporal
budget constraint as follows (Buiter, 1985;
Blanchard 1990):
dt = dt-1(1+rt)/(1+gt) - pbt ……. (1)
From equation (1), the dynamic debt
accumulation equation follows as:
dt = dt-1(rt - gt)/ (1+gt) - pbt ……. (2)
where dt is the ratio of debt to GDP, rt is the
nominal interest rate, gt is the nominal GDP
growth rate and pbt is the ratio of primary
balance to GDP at time t.
3.73 As per equation (2), a stable or declining
debt ratio (i.e. ∆dt ≤ 0) can be achieved even
with primary deficits if the same is offset by
a sufficiently large negative interest-growth
differential (rt - gt). This dynamic nature of debt
accumulation is encapsulated in the forward-
looking projection of the medium-term
debt-to-GDP ratio and the ratio of primary
balance-to-GDP that can stabilise the debt-
to-GDP ratio (IMF, 2003; IMF, 2013).
3.74 The IMF Article IV Consultations report
for India presents results of the DSA for the
general government. In this chapter, a DSA
is undertaken exclusively for states for the
first time. This analysis provides a likely time
path for debt till 2024-25, the terminal year
of achieving the revised FRBM debt target,
thus, providing forward guidance to States,
albeit in a consolidated format.
3.75 The key underlying assumptions for
the baseline projections for all states taken
together are set out in Table III.9.31 Beyond this, the template performs sensitivity tests to key parameters – interest rate, GDP growth, inflation, the exchange rate and the primary
balance.

State Finances : A Study of Budgets of 2019-20
62
Table III.10: Debt Sustainability Analysis- Key Assumption and Results Per cent
Variable Historical data Projections
2014-15
2015-16
2016-17
2017-18
2018-19
Last 5 years
average
2019-20
2020-21
2021-22
2022-23
2023-24
2024-25
Average for the
projection period
Key assumptions
1. Real GDP growth 7.4 8.0 8.2 7.2 6.8 7.5 6.9 7.5 7.7 7.7 7.7 7.7 7.5
2. Inflation / GDP deflator Y-o-Y change 3.3 2.3 3.1 3.8 4.1 3.3 3.8 4.0 4.0 4.0 4.0 4.0 4.0
3. States primary deficit excluding UDAY 1.3 1.0 1.3 0.8 0.7 1.0 0.7 0.6 0.6 0.5 0.5 0.5 0.6
4. Weighted average interest rate 7.8 8.0 7.9 7.7 7.4 7.8 7.4 7.0 7.0 7.1 7.1 7.1 7.1
Key results for the baseline scenario
Debt to GDP ratio in the baseline scenario 21.7 23.4 24.8 25.1 24.8 24.0 24.8 24.4 24.0 23.4 22.8 22.3 23.6
Gross Financing Needs 4.0 3.7 4.2 3.9 3.9 3.9 3.0 2.8 2.8 2.7 2.6 2.6 2.7
Guarantees invoked / future bailouts scenario 25.8 26.4 25.9 25.2 24.6 23.9 25.3
Gross Financing Needs 4.0 3.7 4.2 3.9 3.9 3.9 4.0 3.8 2.9 2.8 2.7 2.7 3.1
Assumed liability from guarantees / bailouts 1.0 1.0 0.0 0.0 0.0 0.0 0.3
Note: 1. Gross Financing Needs = Primary Deficit + Net Interest Payments + Amortisation Payments for Existing Debt. 2. Primary Deficit is calculated as per IMF DSA methodology, i.e. primary receipts exclude interest receipts.Source: Staff estimates.
3.76 In the forward-looking path for the debt-GDP ratio in the baseline scenario, it is projected to decline to 22.0 per cent by 2024-25. The key downside risk to the baseline projections is a lower than assumed GDP growth and/or crystallisation of potential off-budget liabilities in the form of guarantees. A scenario whereby the impact of the latter
is assumed to be 2 per cent of GDP (impact
from UDAY was 1.4 per cent of GDP), spread
across 2019-20 and 2020-21 causes the
debt-GDP ratio to go up to about 24 per cent
by 2024-25 (Table III.10, Chart III.31).
3.77 The decline in debt-to-GDP ratio is
driven by the interest-growth differential
Table III.9: Key Assumption for States DSA Model
Variable Assumptions
Primary Balance Primary receipts are assumed to move with nominal GDP growth with an average buoyancy of 1.1 during the projection period.
Primary expenditure growth has been assumed to grow at a constant rate, based on the average of 2014-15 and 2018-19 (adjusting for the one-time impact of UDAY).
Accordingly, there is a reduction in primary deficit from 0.7 per cent of GDP in 2018-19 to 0.5 per cent of GDP in 2024-25
GDP growth The RBI’s GDP growth projection is assumed for 2019-20 and the IMF’s projections for India are taken for the remaining period.
Inflation Assumed at 4 per cent, in line with the inflation target.
Weighted average interest rate Calculated as interest payments divided by debt stock (excluding guarantees) at the end of the previous year (new borrowings to be undertaken at the rate for 2018-19).
Source: Staff estimates; and World Economic Outlook, IMF, April 2019.

Debt: States’ Medium-Term Fiscal Challenge
63
which is partially offset by the primary deficits
being lower than the debt stabilising level
of 1.0 per cent of GDP. The interest-growth
differential has been negative in India for
the past 16 years, leaving space for running
primary deficits.
3.78 In both our baseline projection and
downside scenario of guarantees being
invoked, the level of debt-GDP ratio in
2024-25 is higher than the revised FRBM
target of 20 per cent but below the 25 per
cent debt ceiling imposed by the FC-XIV.
However, the invocation of guarantees
causes the states to breach the 25 per cent
ceiling in the years of 2019-20 to 2022-23.
For achievement of FRBM target of 20 per
cent debt-GDP ratio by 2024-25, states will
have to grow their receipts by about 14 per
cent year-on-year. This can only be achieved
through higher GDP growth and/or improved
tax buoyancy.
7. Concluding Observations
3.79 In the Indian fiscal landscape, states are entrusted with higher responsibilities but less than commensurate resources. On the revenue front, states might see a crunch because of the economic slowdown, though they remain protected against any own shortfall in GST collection by compensation cess.
3.80 On the expenditure front, schemes like farm loan waivers and UDAY, which are essentially in the nature of fiscal shocks, have kept spending pressures high. What is worrisome is that they are associated with spiralling states’ market borrowings with implications for states’ outstanding debt. Analysis in this chapter points to still pending medium-term risk in the form of higher losses of DISCOMs falling onto state budgets. In addition, rising state government guarantees also pose a medium-term fiscal challenge for states.
3.81 While market borrowings by state governments have risen significantly, a combination of consolidation, reissuances and maturity elongation can help in improving liquidity, and in developing a secondary market with a diversified investor base comprising institutional investors, multilateral financial institutions and foreign portfolio investors with considerable promise of throwing up the desired differential pricing and market disciplining among states.
3.82 The debt position of state governments has deteriorated post-UDAY though still remains sustainable, but vulnerable to potential risks with invocation of states’

State Finances : A Study of Budgets of 2019-20
64
guarantees. Going forward, fiscal readjustments to boost growth without accumulating public debt may warrant improvement in spending for infrastructure and the social sector, given the high capital expenditure multiplier. States will have to improve tax buoyancy by capitalising on the efficiency gains under the GST and digitisation,
and by exploiting the scope for raising user charges wherever possible so as to improve their revenue raising capacity and reduce reliance on borrowings. Addressing these issues give states the wherewithal to support growth by not curtailing desired expenditure and hence, maintaining sustainability in the long-run.

Debt: States’ Medium-Term Fiscal Challenge
65
Annex III.1Evolving Institutional Mechanism for GST
GST was enacted with the Constitution (One
Hundred and First Amendment) Act, 2016, giving
way to the Central Goods and Services Tax
(CGST), State Goods and Services Tax (SGST),
Integrated Goods and Services Tax (IGST) and
the Compensation Law. The Act amended the
articles 248, 249, 250, 268, 269, 270, 271, 286,
366 and 368 along with the Sixth and Seventh
Schedules of the Constitution. Also, Article 268A
was omitted while new articles 246A (Special
provision with respect to goods and services tax),
269A (Levy and collection of goods and services
tax in course of inter-State trade or commerce)
and 279A (Goods and Services Tax Council) were
inserted in the Indian Constitution.
The Goods and Services Tax Network (GSTN)
has been set up to provide IT infrastructure and
services to the Central and State Governments,
tax payers and other stakeholders for flawless
implementation and filing of GST. It is a
non-Government, private limited company
under Section 8 of the new companies Act
with authorised capital of `10 crore. It was
incorporated on March 28, 2013. The Government
of India holds 24.5 per cent equity in GSTN and
all states, including Delhi and Puducherry, along
with the Empowered Committee (EC) of State
Finance Ministers, together hold another 24.5
per cent. The balance 51 per cent equity is held
by non-Government financial institutions (Goods
and Services Tax Network).
The GST Council is responsible for the entire
architecture of GST as there is no exclusive tax
base for the Union or states. Being a credible
institution promoting cooperative federalism,
decision making in the GST Council also reflects
the wisdom of both the Centre and states (Reddy
et. al, 2019).
The four Acts that govern the GST architecture
are the CGST Act, SGST Act, IGST Act and the
GST (Compensation to States) Act. The Centre
levies and collects CGST (governed by the CGST
Act), the states would levy and collect SGST
on all transactions within their geographical
boundaries (governed by the SGST Act). Input
tax credits (ITC) under the CGST and the SGST
are available for discharging the liability on the
output at each stage without cross utilisation
of credit. The IGST (governed by the IGST Act)
is levied on all imports into the territory of India
as well as on the inter-state supply of goods or
services or both. It is collected by the Centre and
distributed between the Centre and states. The
states are entitled to receive a compensation to
the tune of the difference between the projected
revenue based on 14 per cent annual growth
over the base year 2015-16 and the actual
revenue. The compensation has to be provided
for a period of five years, viz., 2017-2022 (GST
(Compensation to States) Act).
These Acts have been amended from time to
time in order to deal with practical difficulties
thrown up by actual experience. One of the major
amendments has been with respect to the IGST
apportionment. As per the IGST Act, 2017, the
apportionment of the IGST collection was based
on the principle of first place of landing, viz.,
IGST would be apportioned to states where the
actual supply of goods takes place and to the
Centre where the supply takes place in a Union

State Finances : A Study of Budgets of 2019-20
66
Territory. The balance amount (which cannot
be apportioned clearly based on these criteria)
was parked in the Consolidated Fund of India
(CFI) and apportioned on the basis of the FC-XIV
devolution rule of 42 per cent to the states (done
in the months of February and July 2018 as per
data provided by the Office of the Controller
General Of Accounts), with the remaining
accruing to the Centre. In order to eliminate
discrepancies in apportionment to the States,
the IGST Act was amended with effect from
August 2018, whereby “…the balance amount,
for the time being, on the recommendations
of the GST Council, will be apportioned at the
rate of 50 per cent to the Central Government
(as part of CGST) and 50 per cent to the State
Governments or the Union territories, (as part of
SGST or UTGST, respectively) as the case may
be, on ad-hoc basis…..” (IGST (Amendment) Act,
2018).
Apart from amendments, measures undertaken
by the GST council have aimed at streamlining
input tax credits and e-way bill system (details in
Annex III.2).
References
Central Board of Indirect Taxes and Customs: www.cbic.gov.in
CGST Act, SGST Act, IGST Act and GST (Compensation to States) Act
Goods and Services Tax Network: www.gstn.org
IGST (Amendment) Act, 2018
Reddy, Y. V., & Reddy, G. R. (2019). “Indian Fiscal Federalism”. Oxford University Press.

Debt: States’ Medium-Term Fiscal Challenge
67
Date Event Major Decisions
September 15, 2016
Constitution of the GST Council
• Vide F. No. 31011/09/2015-SO (ST) dated 15th September, 2016, the President of India constituted the “GST Council”.
• GST Council can hold meetings and take decisions on various major issues such as Model law, rate of taxes, exemptions etc.
September 16, 2016
Enactment of GST Amendment Act.
• By Ministry of Finance’ vide Notification No. S.O. 2986(E) dated September 16, 2016, all sections of Constitution (One Hundred and First Amendment) Act, 2016 came into force.
GST Council Meeting
September 22, 2016
First • Threshold exemption limit decided at `10 Lakhs for North-Eastern states and `20 Lakhs for the rest of India.
• States will have sole jurisdiction over assessees having a turnover of `1.5 crores or less. The existing service tax assessees will continue to be under jurisdiction of Centre.
• The Centre will pay quarterly or bi-monthly compensation to states, in case of any revenue loss.
• Decided 2015-16 as the base year for calculating the compensation.
September 30, 2016
Second • The GST Council finalised five subordinate legislations relating to payment, returns, refunds, invoice and registration.
• Consensus on area-based exemption in accordance with those granted under the current excise regime.
• Taxes will have to be collected and it can be reimbursed from the annual budgets to the exempted categories.
• To compensate states for 5 years for loss of revenue due to implementation of GST, the base year for the revenue of the state would be 2015-16 and a fixed growth rate of 14 per cent will be applied to it.
October 19, 2016
Third • Proposed a four-tier rate structure comprising a lower rate of 6 per cent, two standard rates of 12 per cent and 18 per cent and a higher rate of 26 per cent with an additional cess for luxury and demerit goods.
• Cess was proposed to be used for payment of compensation to the states. However, consensus could not be reached.
Annex III.2 Timeline of GST Council Meetings and Major Decisions

State Finances : A Study of Budgets of 2019-20
68
November 3, 2016
Fourth • Decided a four-tier GST rate structure of 5 per cent, 12 per cent, 18 per cent and 28 per cent.
• Essential items including food will be taxed at zero rate.
• The lowest rate of 5 per cent would be for common use items.
• 12 per cent and 18 per cent would be the standard rates.
• The highest rate would apply to luxury and de-merit goods, which will also attract an additional cess.
• The collection from this cess as well as clean energy cess will be used for compensating states for any loss of revenue during the first five years of implementation of GST.
December 2-3, 2016
Fifth • Consensus could not be reached on the issue of sharing of administrative powers between the centre and the states.
December 11, 2016
Sixth • The Council discussed on the Model CGST and SGST legislation (Model GST Law) which was released in the public domain on November 26, 2017.
• Could not reach on consensus on issue of dual control of assesses.
December 22-23, 2016
Seventh • Draft CGST and SGST laws were cleared along with compensation law.
• No consensus was reached on issue of dual control.
January 3-4, 2017
Eighth • Issue of dual control remained unresolved.
• States raised a new issue of split in tax rate in ratio of 60:40 between states and Centre instead of equally dividing GST between Centre and states.
• States demanded taxation rights for sales made in the high seas within 12 nautical miles.
• States requested to increase the number of items on which this new Cess is to be levied.
January 16, 2017
Ninth • A broad consensus for GST to be rolled out from 1st July 2017, instead of 1st April 2017 was made.
• The issue of dual control was broadly resolved. States will have powers to assess and administer 90 per cent of the tax payers under `1.5 crores annual turnover while the remaining 10 per cent would be controlled by the Centre.
• Tax payers with turnover more than `1.5 crores will be controlled and administered in 50:50 ratio both by State and Centre.
• States can levy GST within 12 nautical miles.
• Any IGST disputes among states will be resolved by the Centre.

Debt: States’ Medium-Term Fiscal Challenge
69
February 18, 2017
Tenth • Formally approved Compensation law.
• Some of the issues in three crucial draft CGST/SGT/IGST laws were discussed.
March 4, 2017
Eleventh • Council cleared the two key draft laws of Central GST (CGST) and Integrated GST (IGST).
• Hotels with annual turnover of less than `50 lakhs, will pay the lowest tax rate of 5 per cent under the GST regime.
March 16, 2017
Twelfth • Cleared the remaining two supplementary legislations UTGST (Union Territory GST Law) and the SGST (State GST Law) needed for implementation of the goods and service tax (GST) regime.
• Approved the bound rate of 15 per cent as peak rate for the proposed Cess to be levied on certain demerit goods.
March 31, 2017
Thirteenth • Approved the Rules relating to Input Tax Credit, Valuation, Composition and Transition.
• Gave final approval for changes in rules for filing tax returns in the new regime, registration of entities, payment of GST, invoicing and refunds to make them compatible with GST laws.
May 18-19, 2017
Fourteenth • Fitment of rates were discussed. The council approved the GST rate of goods at nil, 5 per cent, 12 per cent, 18 per cent and 28 per cent levied on certain goods. It also approved the rates for GST compensation cess to be levied on certain goods.
• Constitution of eighteen sectoral groups to ensure smooth roll-out of GST.
June 03, 2017
Fifteenth • Clearance of pending Transition and Returns rules.
• Tax rates on gold, textiles, trademarked packaged items, solar panels, biscuits and footwears were decided.
June 11, 2017
Sixteenth • Approval of amendments to draft GST rules.
• Rates on 66 items reduced including movie tickets, packaged food and cashew nuts among others.
• Increase in turnover limit for composition scheme.
• Exemptions on few supply of services.
June 18, 2017
Seventeenth • Announcement of official roll out on July 01, 2017.
• For the first two months of implementation, tax would be payable based on a simple return (Form-GSTR-3B) containing summary of outward and inward supplies which will be submitted before 20th of the succeeding month.
• Regular GSTR-1 to be filed for July-August 2017.
• No late fees and penalties for the interim period.
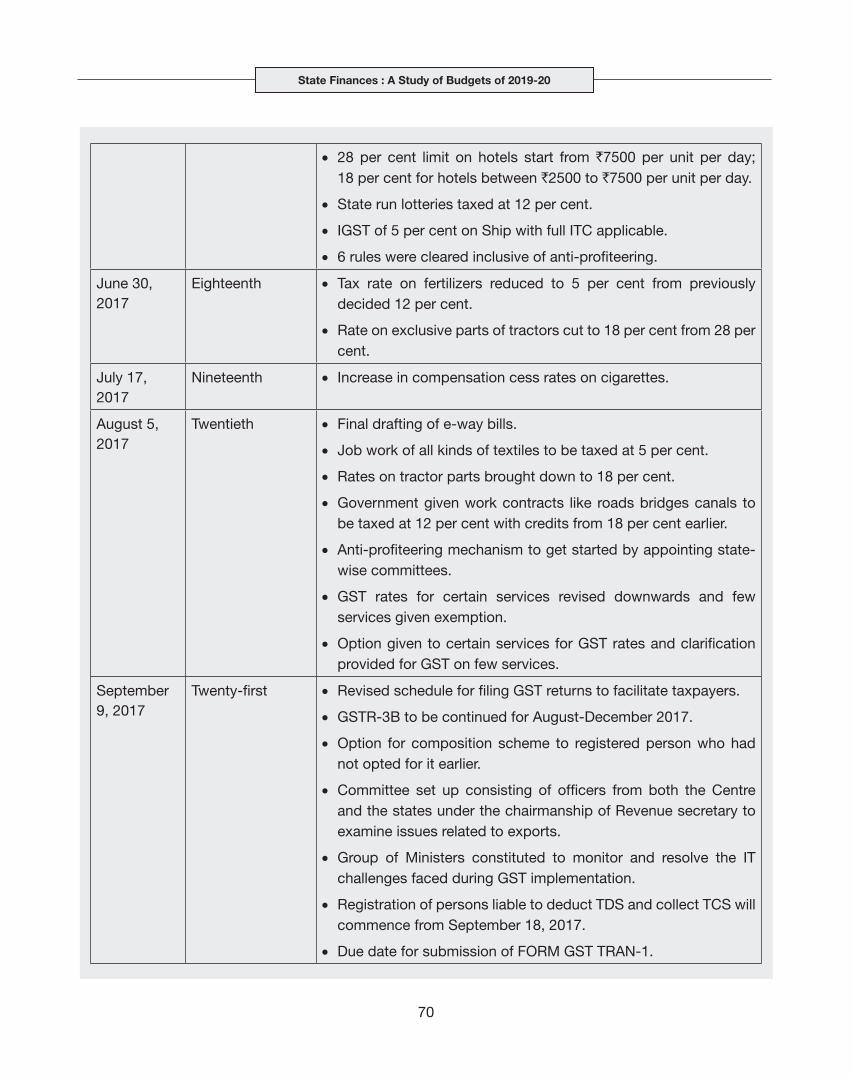
State Finances : A Study of Budgets of 2019-20
70
• 28 per cent limit on hotels start from `7500 per unit per day; 18 per cent for hotels between `2500 to `7500 per unit per day.
• State run lotteries taxed at 12 per cent.
• IGST of 5 per cent on Ship with full ITC applicable.
• 6 rules were cleared inclusive of anti-profiteering.
June 30, 2017
Eighteenth • Tax rate on fertilizers reduced to 5 per cent from previously decided 12 per cent.
• Rate on exclusive parts of tractors cut to 18 per cent from 28 per cent.
July 17, 2017
Nineteenth • Increase in compensation cess rates on cigarettes.
August 5, 2017
Twentieth • Final drafting of e-way bills.
• Job work of all kinds of textiles to be taxed at 5 per cent.
• Rates on tractor parts brought down to 18 per cent.
• Government given work contracts like roads bridges canals to be taxed at 12 per cent with credits from 18 per cent earlier.
• Anti-profiteering mechanism to get started by appointing state-wise committees.
• GST rates for certain services revised downwards and few services given exemption.
• Option given to certain services for GST rates and clarification provided for GST on few services.
September 9, 2017
Twenty-first • Revised schedule for filing GST returns to facilitate taxpayers.
• GSTR-3B to be continued for August-December 2017.
• Option for composition scheme to registered person who had not opted for it earlier.
• Committee set up consisting of officers from both the Centre and the states under the chairmanship of Revenue secretary to examine issues related to exports.
• Group of Ministers constituted to monitor and resolve the IT challenges faced during GST implementation.
• Registration of persons liable to deduct TDS and collect TCS will commence from September 18, 2017.
• Due date for submission of FORM GST TRAN-1.

Debt: States’ Medium-Term Fiscal Challenge
71
October 6, 2017
Twenty-second • Facilitative changes to ease the burden of compliance on small and medium businesses inclusive of the following major measures:
(i) changes in composition scheme
(ii) relief from registration for service providers with annual turnover of less than `20 lacs
(iii) ease of payment and return filing
(iv) relief from reverse charge mechanism till March 31, 2018
(v) e-way bill system to be introduced in a staggered manner from April 1, 2018
(vi) extension to filing of FORM GSTR-4 under composition scheme
(vii) modification of invoice rules
(viii) GST to be paid at the time of supply of goods and not earlier by taxpayers with aggregate turnover up to `1.5 crores.
November 10, 2017
Twenty-third • Major rationalisation of rates on certain goods and services across many sectors.
• Further simplification of return filing.
• Extension of dates for filing returns.
• Exporters exporting services to Nepal and Bhutan eligible for claiming input tax credit in respect of goods and services used for effecting such exempt supply of services to Nepal and Bhutan
• All service providers supplying intra-State, inter-State or through e-commerce operator exempt from obtaining GST registration if their aggregate turnover does not exceed `20 lakhs.
• Benefits for Diplomatic/UN Missions.
December 16, 2017
Twenty-fourth • Nationwide e-way bill system to be ready by January 16, 2018.
• Uniform system of e-way bill for inter-State and intra-State movement to be implemented by June 1, 2018.
January 18, 2018
Twenty-fifth • Second set of major relief measures regarding GST rates on goods and services covering many sectors and commodities.
• Issuance of certain clarifications on issues relating to GST rates and taxability of certain goods and services.
• Policy changes related to late fee, cancellation of registration, filing FORM GST REG-29, modification to e-way bill rules.

State Finances : A Study of Budgets of 2019-20
72
March 10, 2018
Twenty-sixth • Extension of tax exemption on imported goods to exporters availing various export promotion schemes for six months.
• Creation of E-Wallet Scheme.
• Review of progress made in grant of refunds to exports of both IGST and input tax credit.
• Liability to pay tax on reverse charge basis deferred till June 30, 2018.
• TDS/TCS suspended till June 30, 2018.
• Improvements in e-way bill rules.
• GST implementation committee tasked with grievance redressal to taxpayers regarding IT glitches.
• Recommendations regarding data analytics.
May 04, 2018
Twenty-seventh • Incentive to promote digital transactions.
• Imposition of sugar cess over and above 5 per cent GST and reduction in GST rate on ethanol.
• Approval of principles for filing of new return design based on recommendations of the Group of Ministers on IT simplification.
July 21, 2018
Twenty-eighth • Amendments to CGST Act, 2017, IGST Act, 2017, UTGST Act 2017 and GST (Compensation to states) Act, 2017.
• Approval of simplified GST return formats and associated changes in law.
• Major rationalisation of rates of several goods including specified handicraft items.
• Decisions relating to exemptions / changes in GST rates / ITC eligibility criteria, rationalisation of rates/ exemptions and clarification on levy of GST on services.
August 4, 2018
Twenty-ninth • Formation of Group of Ministers to examine MSME related issues.
• GST concessions on digital payments.
September 28, 2018
Thirtieth • Formation of Group of Ministers to look into imposition of cess under GST to provide relief to Kerala flood victims and a temporary tax under GST to help states in exigencies among few other issues relating to natural calamities.
• A panel of analysts to conduct research on all states pertaining to GST collection and recommend ways to bridge the gap between the current revenue and targeted revenue.
December 22, 2018
Thirty first • Major change in rates of goods and services across sectors.
• 7 member Group of Ministers formed to study the revenue trend, including analysing reasons for structural patterns affecting the revenue collection in some states.

Debt: States’ Medium-Term Fiscal Challenge
73
January 10, 2019
Thirty-second • Approval for changes made by CGST (Amendment) Act 2018, IGST (Amendment) Act, 2018, UTGST (Amendment) Act 2018 and GST (Compensation to States) Amendment Act, 2018 along with amendments in CGST Rules, notifications and circulars issued earlier and corresponding changes in SGST Acts to be notified with effect from January 02, 2019.
• Last date for passing the examination for GST practitioners (who have enrolled under rule 83(1)(b)) to be extended till December 31, 2019.
• Relief to MSME (including small traders).
February 24, 2019
Thirty-third • Several measures were announced to boost the residential segment of the real estate sector.
March 19, 2019
Thirty-fourth • Modalities for transition to lower effective GST rate of 1 per cent in case of affordable houses and 5 per cent on construction of houses other than affordable house (as recommended in 33rd meeting).
• Amendment to input tax credit rules.
June 21, 2019
Thirty-fifth • New return system to be introduced in a phased manner.
• Extension regarding furnishing returns under various Forms.
• Issues placed before Fitment committee regarding GST on electric vehicles and solar power generating systems and wind turbines.
• Report on Lottery submitted by Group of Ministers.
• Extension of tenure of National Anti-Profiteering committee by two years.
• Location of benches of the State and the Area Benches for the Goods and Services Tax Appellate Tribunal (GSTAT) for various states and Union Territories.
• Electronic invoicing system to be introduced ina phased manner.
July 27, 2019
Thirty-sixth • GST rate on all Electric Vehicles reduced from 12 per cent to 5 per cent and of charger or charging stations for EVs from 18 per cent to 5 per cent.
• Hiring of electric buses by local authorities exempted from GST.
• Date extended for filing of intimation in FORM GST CMP-02 for availing the option of payment of tax under notification No. 2/2019-Central Tax (Rate) dated 07.03.2019 (by exclusive supplier of services).
• Date extended for furnishing statement containing the details of the self-assessed tax in FORM GST CMP-08 for the quarter April, 2019 to June, 2019 (by taxpayers under composition scheme).

State Finances : A Study of Budgets of 2019-20
74
September 20, 2019
Thirty-seventh • Rationing of GST rates on hotel accomodations across various categories, outdoor catering services.
• Reduction in compensation cess on passenger vehicles.
• Simplification of forms for annual return and reconciliation statement to be examined.
• Introduction of new return system from April 2020.
• Linking of Aadhaar with registration of tax-payers and examining the possibility of making Aadhaar mandatory for claiming refunds.
Source: http://www.gstindiaonline.com/ ; https://gstindiaguide.com/gst-council-finalise-draft-rules-today/; http://www.cbic.gov.in/htdocs-cbec/gst/index; pib.nic.in

Debt: States’ Medium-Term Fiscal Challenge
75
Annex III.3 Power Distribution – the History of Reforms and Government Programmes
Historically, the growth in power sector in India which began in the private sector, underwent a major shift post the passage of the Industrial Policy Resolution of 1956, which reserved generation and distribution of electricity exclusively for the public sector. Power sector is a concurrent subject under Article 246 of the Indian Constitution, and states came to play the pivotal role following the passage of the Electricity Supply Act 1948 (ESA) that mandated the setting up of State Electricity Boards (SEBs). SEBs were constituted as vertically integrated entities covering generation, transmission and distribution of power. Power distribution was exclusively the domain of SEBs, while Central government played a role in generation and transmission of power.
The first attempt to liberalise the power sector was made with an amendment to the ESA in 1991 that allowed for private sector participation in power generation, though power distribution continued to remain the province of SEBs. Reforms in power distribution have their beginnings at state-level, with Odisha becoming the first state to restructure its SEB with the support of World Bank. The ‘Odisha Model’ for reforms as it came to be called involved restructuring of the SEB into separate generation, transmission and distribution entities. Specifically, the distribution segment of the Orissa State Electricity Board (OSEB) was divided into four regional utilities and later privatised. The ‘Odisha Model’ was adopted by states of Haryana (1997), Andhra Pradesh (1998), Uttar Pradesh (1999), Karnataka (1999), Rajasthan (1999), Delhi (2000), Madhya Pradesh (2000) and Gujarat (2003). Each of these states unbundled their SEBs into separate generation,
transmission and distribution. However, unlike Orissa and Delhi that went a step further and privatised their distribution companies, all other states retained ownership of the unbundled distribution company.
The period of 1998-2003 is characterised by wide ranging reforms in the power sector to address the financial problems of the distribution sector. A key reason identified for distress in the distribution sector was low electricity tariffs due to associated political economy and public utility pricing. With a view to establishing a robust mechanism to ensure that electricity tariffs are set according to economic principles, the Central government passed the Electricity Regulatory Commissions Act 1998 that paved the way for setting up of the Central Electricity Regulatory Commission (CERC) and State Electricity Regulatory Commissions (SERCs). Also, in 2003 the Central government passed the landmark Electricity Act 2003 that provided for the unbundling of vertically integrated SEBs into separate generation, transmission and distribution entities in a time bound manner. Further, the specific provisions of the Act such as de-licensing of generation, open access in distribution, liberalised definition of captive generation, allowing two or more distribution licensees in the same geographical area, power trading, etc. aimed at encouraging competition, private sector participation and improving efficiency in the sector. Regarding tariff policy, the Act made the constitution of SERCs mandatory and stipulated them to be guided by multi-year tariff principles to give a medium-term horizon of 3 to 5 years on the tariff to all stakeholders. Following the passage of the Electricity Regulatory Commissions Act
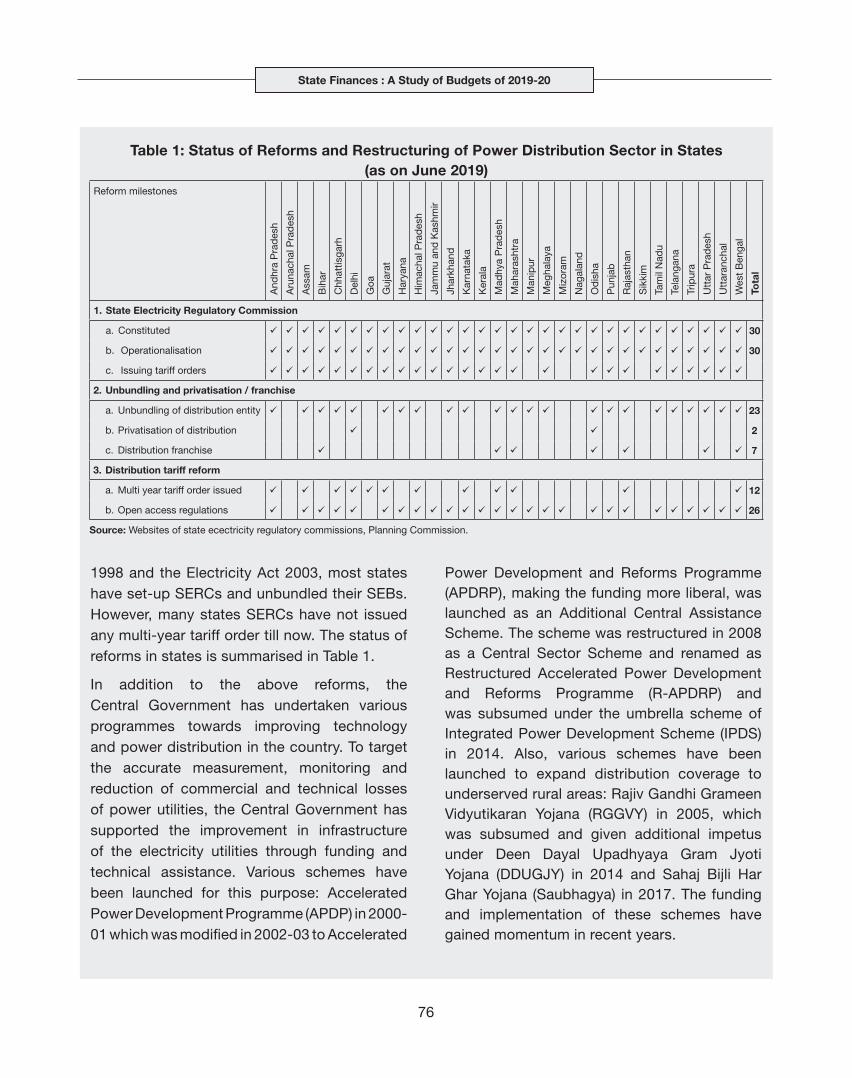
State Finances : A Study of Budgets of 2019-20
76
1998 and the Electricity Act 2003, most states have set-up SERCs and unbundled their SEBs. However, many states SERCs have not issued any multi-year tariff order till now. The status of reforms in states is summarised in Table 1.
In addition to the above reforms, the Central Government has undertaken various programmes towards improving technology and power distribution in the country. To target the accurate measurement, monitoring and reduction of commercial and technical losses of power utilities, the Central Government has supported the improvement in infrastructure of the electricity utilities through funding and technical assistance. Various schemes have been launched for this purpose: Accelerated Power Development Programme (APDP) in 2000-01 which was modified in 2002-03 to Accelerated
Power Development and Reforms Programme (APDRP), making the funding more liberal, was launched as an Additional Central Assistance Scheme. The scheme was restructured in 2008 as a Central Sector Scheme and renamed as Restructured Accelerated Power Development and Reforms Programme (R-APDRP) and was subsumed under the umbrella scheme of Integrated Power Development Scheme (IPDS) in 2014. Also, various schemes have been launched to expand distribution coverage to underserved rural areas: Rajiv Gandhi Grameen Vidyutikaran Yojana (RGGVY) in 2005, which was subsumed and given additional impetus under Deen Dayal Upadhyaya Gram Jyoti Yojana (DDUGJY) in 2014 and Sahaj Bijli Har Ghar Yojana (Saubhagya) in 2017. The funding and implementation of these schemes have gained momentum in recent years.
Table 1: Status of Reforms and Restructuring of Power Distribution Sector in States (as on June 2019)
Reform milestones
And
hra
Pra
des
h
Aru
nach
al P
rad
esh
Ass
am
Bih
ar
Chh
attis
garh
Del
hi
Goa
Guj
arat
Har
yana
Him
acha
l Pra
des
h
Jam
mu
and
Kas
hmir
Jhar
khan
d
Kar
nata
ka
Ker
ala
Mad
hya
Pra
des
h
Mah
aras
htra
Man
ipur
Meg
hala
ya
Miz
oram
Nag
alan
d
Od
isha
Pun
jab
Raj
asth
an
Sik
kim
Tam
il N
adu
Tela
ngan
a
Trip
ura
Utt
ar P
rad
esh
Utt
aran
chal
Wes
t B
enga
l
Tota
l
1. State Electricity Regulatory Commission
a. Constituted ü ü ü ü ü ü ü ü ü ü ü ü ü ü ü ü ü ü ü ü ü ü ü ü ü ü ü ü ü ü 30
b. Operationalisation ü ü ü ü ü ü ü ü ü ü ü ü ü ü ü ü ü ü ü ü ü ü ü ü ü ü ü ü ü ü 30
c. Issuing tariff orders ü ü ü ü ü ü ü ü ü ü ü ü ü ü ü ü ü ü ü ü ü ü ü ü ü ü
2. Unbundling and privatisation / franchise
a. Unbundling of distribution entity ü ü ü ü ü ü ü ü ü ü ü ü ü ü ü ü ü ü ü ü ü ü ü 23
b. Privatisation of distribution ü ü 2
c. Distribution franchise ü ü ü ü ü ü ü 7
3. Distribution tariff reform
a. Multi year tariff order issued ü ü ü ü ü ü ü ü ü ü ü ü 12
b. Open access regulations ü ü ü ü ü ü ü ü ü ü ü ü ü ü ü ü ü ü ü ü ü ü ü ü ü ü 26
Source: Websites of state ecectricity regulatory commissions, Planning Commission.

Way Forward
77
Way ForwardIV
4.1 States have budgeted prudently for 2019-20, but macroeconomic risks to their combined budget estimates appear to be slanted to the downside. The loss of momentum in economic activity needs to be reversed soon, otherwise it can have revenue implications for state budgets, if not complemented by extra efforts towards revenue mobilisation. If they do not materialise, cuts in expenditure to meet the fiscal targets may become inevitable. This can feed an ever-tightening vicious spiral of austerity deepening the economic downturn which, in turn, cramps fiscal revenues and forces further expenditure reductions and so on. In the case of states, there can be large macroeconomic spillovers from the spending retrenchments with states’ capital and developmental expenditure accounting for close to two-thirds of the combined expenditure. The negative output effects could exacerbate the medium-term challenge of debt sustainability, as highlighted in this Report.
4.2 States’ revenue prospects are confronted with low tax buoyancies, shrinking revenue autonomy under the GST framework and unpredictability associated with transfers of IGST and grants. Unrealistic revenue forecasts in budget estimates thereby leave no option for states than expenditure compression in even the most productive and employment-generating heads Going forward, sustained efforts towards
mobilising revenue need to be combined with strategies to maximise efficiency gains rather than increases in tax rates. In this context, the GST architecture has to be harnessed to achieve tax revenue growth target so as to gradually reduce the dependence on compensation cess. This involves expanding the tax base using IT infrastructure, data analytics and reduction in the cost of tax compliance.
4.3 The dedicated application of break-even user charges, with better cost recovery mechanisms offers scope for raising states’ revenue. In this vein, tariff policies relating to power and irrigation warrant a review. States need to learn from each other’s experience and develop indigenous strategies to enhance tax buoyancy and efficiency. As regards Central transfers, well-defined calendars; more effective expenditure planning and usage of funds; efficient cash management which reduces the negative carry; and marksmanship in budgetary forecasts assume importance. Re-prioritising Central transfers towards productive expenditures is essential in order to achieve equity with efficiency and sustainable levels of debt in the medium-term.
4.4 Off-budget liabilities in the form of guarantees a` la UDAY are mutating into a contingent risk to debt sustainability even as structural bottlenecks in power distribution continue to foster. Going forward, states

State Finances : A Study of Budgets of 2019-20
78
might have to take over higher losses of
DISCOMs if they do not show a turnaround
in their financial performance and this will
inevitably take its toll on debt sustainability
in the medium-term. Transparency in the
disclosure/reporting of these liabilities in
state budgets may be the first step towards
recognising these guarantees as a medium-
term fiscal risk, followed by conscious efforts
to keep them at prudent levels while ensuring
that they are not invoked.
4.5 Access to market financing via
borrowings requires a pragmatic approach to
ensure enduring sustainability. A combination
of SDL consolidation, reissuances, maturity
elongation and diversification of investor
base should improve liquidity and minimise
roll-over risk. Maintaining adequate Reserve
Funds could help minimise fiscal stress arising
from redemption pressures and unforeseen
liabilities.
4.6 To conclude, states’ role in promoting growth and overall social welfare is critical as public policy responsibilities devolving on them are large. Yet, fiscal consolidation and pressures to increase current spending have led to an overall decline in capital spending to the tune of about 0.3 to 0.5 per cent of GDP during 2017-19. Arresting this trend is crucial to avoid adverse effects on long-term growth and welfare. Going forward, it is important for states to pursue their capital expenditure plans as budgeted in 2019-20 by front-loading them. This is particularly important as it has strong multiplier and welfare enhancing effects. The states will have to simultaneously make efforts towards improving their revenue raising capacity to support their expenditure. In the ultimate analysis, borrowed resources that are used wisely on projects/programmes with revenue and employment-generating potential will free up fiscal space and secure an optimal balance between growth and sustainability.

References
79
References
Abiad, A. d., & Ostry, J. D. (2005). “Primary Surpluses and Sustainable Debt Levels in Emerging Market Countries”. IMF Policy Discussion Papers, 05(6).
Af-Mercados Energy Markets India Pvt. Ltd. (2014). “Power Sector Operations and Impact on State Finances”. Prepared for the Fourteenth Finance Commission. August.
Alm, J., Annez, P., & Modi, A. (2004). “Stamp Duties in Indian States A Case for Reform”. World Bank Policy Research Working Paper 3413.
Amihud, Y. (2002). “Illiquidity and Stock Returns: Cross-Section and Time-Series Effects”. Journal of Financial Markets, 5(1), 31-56.
Amihud, Y., & Mendelson, H. (1991). “Liquidity, Asset Prices and Financial Policy”. Financial Analysts Journal, 47(6), 56-66. Nov-Dec.
Belinga, V., Benedek, D., Mooij, R. d., & Norregaard, J. (2014). “Tax Buoyancy in OECD Countries”. IMF Working Papers No 14/110.
Bhaskar, A., & Beghin, J. (2009). “How Coupled Are Decoupled Farm Payments? A Review of the Evidence”. Journal of Agricultural and Resource Economics, 34(1).
Bohn, H. (1998, Aug). “The Behavior of U.S. Public Debt and Deficits”. The Quarterly Journal of Economics, 113(3), 949-963.
Buiter, W. (1985). “A Guide to Public Sector Debt and Deficit”. Center Discussion Paper, No. 493, Yale University, Economic Growth Center.
Cecchetti, S., Mohanty, M., & Zampolli, F. (2011). “The Real Effects of Debt”. BIS Working Paper No 352.
Chatterjee, S., & Eyigungor, B. (2012). “Maturity, Indebtedness, and Default Risk”. American Economic Review, 102(6), 2674-99.
Checherita-Westphal, C., & Rother, P. (2010). “The Impact of High and Growing Government Debt on Economic Growth: An Empirical Investigation for the Euro Area”. European Central Bank Working Paper No 1237.Comptroller and Auditor General (2019). ‘‘Report of the Comptroller and Auditor General of India on Indirect Taxes-Goods and Services Tax for the year ended March 2018’’, Report No. 11 of 2019, July.
Das, S. (2019). “Some Thoughts on Fiscal Federalism”. “Speech at the launch of the book ‘Indian Fiscal Federalism’, Mumbai”. March.
Dudine, P., & Jalles, J. (2017). “How Buoyant is the Tax System? New Evidence from a Large Heterogeneous Panel”. IMF Working Papers No 17/4.
ECB. (2011). “Ensuring Fiscal Sustainability in the Euro Area”. ECB Monthly Bulletin. April.
Finance Commission of India. (2004). “Report of the Twelfth Finance Commission”. Retrieved from https://fincomindia.nic.in/writereaddata/html_en_files/oldcommission_html/fcreport/Report_of_12th_Finance_Commission/12fcreng.pdf
Finance Commission of India. (2015). “Report of the Fourteenth Finance Commission”. Retrieved from https://fincomindia.nic.in/ShowPDFContent.aspx
Government of India. (2015). Gender Budgeting Handbook. Ministry of Women and Child Development.
Government of India. (2018). “Status Paper on Government Debt for 2017-2018”. Ministry of Finance, Government of India.

State Finances : A Study of Budgets of 2019-20
80
Government of India. (2018, September
22). Ayushman Bharat –Pradhan Mantri
Jan AarogyaYojana (AB-PMJAY). Retrieved
September 23, 2019, from Press Information Bureau: https://pib.gov.in/Pressreleaseshare.aspx?PRID=1546948
Gulati, A., Chatterjee, T., & Hussain, S. (2018). “Supporting Indian Farmers: Price Support or Direct Income/Investment Support?”. Indian Council for Research on International Economic Relations (ICRIER) Working Paper No. 357.
Hamilton, J., & Flavin, M. A. (1986). “On the Limitations of Government Borrowing: A Framework for Empirical Testing”. American Economic Review, 76(4), 808-19.
International Monetary Fund. (2002). “Assessing Sustainability”. May.
International Monetary Fund. (2003). “Debt Sustainability in Low-Income Countries—Towards a Forward-Looking Strategy”. May.
International Monetary Fund. (2008). “IMF Staff Guidance Note on Debt Sustainability Analysis for Market Access Countries”. July.
International Monetary Fund. (2013). “IMF Staff Guidance Note for Public Debt Sustainability Analysis in Market-Access Countries”. May.
International Monetary Fund. (2018). “Fiscal Monitor”. October.
Kaur, B., Mukherjee, A., & Ekka, A. P. (2018). “Debt Sustainability of States in India: An Assessment”. Indian Economic Review, 53(1), 93-129.
Kelkar, V. (2002). “Report of the Task Force on Direct Taxes” .
Maravalle, A., & Rawdanowicz, L. (2018). “To shorten or to lengthen? Public Debt Management
in the Low Interest Rate Environment”. OECD Economics Department Working Papers No
1483.
Misra, B., & Khundrakpam, J. K. (2009).
“Fiscal Consolidation by Central and State
Governments: The Medium Term Outlook”. RBI
Staff Studies. May.
NITI Aayog. (2017). “Three Year Action Agenda
(2017–18 to 2019–20)”. New Delhi: Government
of India.
OECD. (2013). “OECD Economic Survey: Greece
2013”. Paris: OECD Publishing. November.
OECD. (2019). “Agriculture Policy and
Monitoring Evaluation”. OECD Publishing,
Paris. doi:https://doi.org/10.1787/39bfe6f3-en
OECD. (2019). “Sovereign Borrowing Outlook for
OECD Countries”. OECD Sovereign Borrowing
Outlook 2019. OECD, Paris.
Patnaik, I., Roy, S., & Shah, A. (2018). “The Rise
of Government-funded Health Insurance in
India”. National Institute of Public Finance and
Policy (NIPFP) Working Paper No. 231.
R Core Team. (2019). “R: A Language and
Environment for Statistical Computing”. R
Foundation for Statistical Computing, Vienna, Austria.
Rajaraman, I., Goyal, R., & Khundrakpam, J. K. (2006). “Tax Buoyancy Estimates for Indian States”. Economic and Political Weekly, 41(16), 1570-1573.
Reddy, Y. V., & Reddy, G. R. (2019). “Indian Fiscal Federalism”. Oxford University Press.
Reinhart, C., & Rogoff, K. (2008, December). “Banking Crises: An Equal Opportunity Menace”. NBER Working Papers No. 14587.
References
81
Renjith, P., & Shanmugam, K. (2018). “Sustainable Debt Policies of Indian State Governments”. Margin: The Journal of Applied Economic Research, 12(2), 224-243.
Reserve Bank of India. (2004). Handbook of Statistics on State Government Finances.
Reserve Bank of India. (2010). Handbook of Statistics on State Government Finances.
Reserve Bank of India. (2012). “Working Group on Enhancing Liquidity in the Government Securities and Interest Rate Derivatives Markets. (Chairman: Shri R. Gandhi)”.
Reserve Bank of India. (2019). “Report of the Internal Working Group to Review Agricultural Credit”.
Reserve Bank of India. (Various issues). “State Finances: A Study of Budgets”.
SEBI consultation paper. (2017). “Consolidation and Re-issuance of Debt Securities Issued under the SEBI Regulation, 2008”. Securities and Exchange Board of India.
Shastri, S., & Sehrawat, M. (2015). “Fiscal Policy Sustainability in India: An Empirical Assessment”. Journal of Economic Policy and
Research, 97-112.
Singh, N. K. (2019). “Speech of N K Singh, Chairman, XVFC at the launch of the book, ‘Indian Fiscal Federalism’”. PIB, Government of India. March 28.
Tiwari, A. K. (2012). “Debt Sustainability in India: Empirical Evidence Estimating Time-
Varying Parameters”. Economics Bulletin, 32(2), 1133-1141.
Trehan, B., & Walsh, C. (1988). “Common Trends, the Government’s Budget Constraint, and Revenue Smoothing”. Journal of Economic Dynamics and Control, 12(2-3), 425-444.
Woo, J., & Kumar, M. S. (2015). “Public Debt and Growth”. Economica, 82(328), 705-739.
World Bank. (2005). “How to do a Debt Sustainability Analysis for Low-income Countries Debt Sustainability Analysis (DSA)”. May.
World Bank. (2006). “World Bank: A Guide to LIC Debt Sustainability Analysis”. October.
WebsitesCAG: https://www.cag.gov.in/
Central Board of Indirect Taxes and Customs: https://www.cbic.gov.in
CCIL: https://www.ccilindia.com/
Finance Commission India https://www. fincomindia.nic.in/
Goods and Services Tax Network: https://www.gstn.org
Ministry of Statistics and Programme Implementation: http://www.mospi.gov.in/
Union Budgets, Government of India: https://www.indiabudget.gov.in/
Power Finance Corporation Limited: https://www.pfcindia.com/
UDAY Website: https://www.uday.gov.in/
State Finances : A Study of Budgets of 2019-20
82
Explanatory Note on Data Sources and Methodology
Data Sources
This Report is based on the receipts and expenditure data presented in the budget documents of 31 state governments and union territories (UTs) with legislature1. For accounts data, this has also been supplemented with the data taken from Finance Accounts of the state published by Comptroller and Auditor General (CAG) of India, wherever required. Data from 2017-18 onwards includes UTs with legislature which were earlier provided separately as memo item in all Statements. The analysis conforms to the data presented in state budgets and the accounting classification thereof. The detailed Appendices are based on the classification of receipts and expenditure of individual states/UTs into revenue and capital accounts. Some supplementary information regarding outstanding guarantees (contingent liabilities), expenditure on ‘wages and salaries’ and ‘operations and maintenance’ are obtained from state governments. Data on outstanding guarantees from 2006-07 to 2016-17 were obtained from Comptroller and Auditor General of India (CAG).
Data on the outstanding state wise loans under the National Small Savings Fund have been obtained from the CAG. The outstanding state-wise central loans have been sourced from the Union Finance Accounts of Controller General of Accounts (CGA). Besides, several items of data including the, availment of ways and means
advances (WMA)/overdraft (OD), market borrowings, investment of state governments in central government treasury bills and the data on the state development loans (SDLs) have been taken from the Reserve Bank records. Data on Gross Domestic Product (GDP) and the state wise Gross State Domestic Product (GSDP) are at market (current) prices and have been sourced from the Central Statistics Office (CSO). This is supplemented by information received from the respective State Governments and GSDP estimates used in the budget documents of the State Governments. Wherever GSDP data are not available or not consistent with CSO’s data, the data are estimated based on the previous three years’ annual average growth rate. GDP/GSDP data prior to 2011-12 correspond to base 2004- 05 and data from 2011-12 onwards correspond to 2011-12 base, as published by CSO. GDP data for the year 2019-20 (BE) is taken from the Union Budget 2019-20.
Jammu & Kashmir has not provided account data for 2017-18 in its budget for 2019-20. This has been the practice in the past also. Therefore, the RBI has been using audited accounts data released by CAG each year. Awaiting confirmation, for 2017-18 may be considered as provisional.
As per Central Board direction, the unit of the data to be released will be either crore or lakh instead of million and billion.
1 The extant practice in consolidation of fiscal data is that only 29 states are added, while 2 union territories are given as memo items. While calculating ratio to GDP, the denominator GDP includes all states and Union Territories. Thus, the ratio is an underestimation. Therefore, inclusion of UTs in the consolidation figure will avoid this under estimation and will give the correct picture.
Explanatory Note on Data Sources and Methodology
83
Methodology
The analysis of the expenditure data is disaggregated into development and non-development expenditure. All expenditures relating to revenue account, capital outlay and loans and advances are categorised into social services, economic services and general services. While social and economic services constitute development expenditure, expenditure on general services is treated as non-development expenditure. Thus, development expenditure includes the development components of revenue expenditure, capital outlay and loans and advances by state governments. Social sector expenditure includes expenditure on social services, rural development, and food storage and warehousing (given under revenue expenditure, capital outlay and loans and advances by state governments).
The term ‘Aggregate Expenditure’ used in Chapter II is defined as summation of revenue expenditure, capital outlay and loans and advances. The term ‘Aggregate Disbursement’ used in Appendix Tables and Statements is summation of aggregate expenditure and debt repayments. The capital receipts provided in Appendix Tables (consolidated) and Statements (state-wise) and used in the analysis include public account items on a net basis while these are excluded from the respective capital expenditure. Percentage variation worked out in Appendix Tables and Statements may differ due to rounding-off of figures.
The data provided in Appendix III (capital receipts) and Appendix IV (capital
expenditure) are on a gross basis for all items, including public account items. Additionally, total capital receipts taking public account items on a net basis are also given in Appendix III to have comparable data with those of the previous years. Total capital expenditure given in Appendix IV is exclusive of public account items. The ‘overall deficit/surplus’ in the appendices is equal to the sum of cash deficit/ surplus (difference between the closing balance and opening balance), increase/decrease in cash balance investment account and the increase/ decrease in WMA/ ODs extended by the Reserve Bank.
Methodology for Debt Statistics
The Reserve Bank in its Report of 2005-06 budgets had compiled a data series on outstanding liabilities of state governments since 1990-91. In the 2006-07 Report, a revised series of outstanding liabilities was published by including data on reserve funds, deposits and advances and contingency funds of state governments. In the 2007-08 Report, a revised data series on outstanding liabilities of state governments was published from 2003-04 onwards based on the Combined Finance and Revenue Accounts of Union and state governments, Reserve Bank records, data received from the Ministry of Finance (Government of India), Union Finance Accounts (Controller General of Accounts) and the budget documents of state governments. The present Report follows the same methodology for compilation of outstanding liabilities as given in 2007-08 Report and uses the same data sources.

State Finances : A Study of Budgets of 2019-20
84
The outstanding liabilities of the state governments as at end-March 2017 and end March 2018 have been directly taken from CAG of India’s ‘Combined Finance and Revenue Accounts of the Union and State Governments in India’ (except for column nos. 2 to 4 and 15 in Statement 18.
The outstanding liabilities position for end-March 2019 and end-March 2020 have been derived by adding annual flows [2018-19 (RE) and 2019-20 (BE)], to the outstanding amounts for end-March 2018 and end-March 2019. This has been done in conformity with recommended methodology of ‘Report of the Working Group on Compilation of State Government Liabilities’, 2005. Based on the state wise market loans (Statement 22), the maturity profile of outstanding state government securities is provided in Statements 23 and 24. These Statements also incorporate the appropriation of liabilities of the four bifurcated states (Bihar, Madhya Pradesh, Uttar Pradesh and Andhra Pradesh) to their respective newly formed states (Jharkhand, Chhattisgarh, Uttarakhand and Telangana) on the basis of Government of India notifications.
e-StatES Database
State Finances: A Study of Budgets is the only database on consolidated fiscal position of States based on State budgets, providing data on budget estimates for the latest year and actuals and revised estimates for preceding two years respectively. The
Reserve Bank has been receiving demand for time series data on various fiscal indicators of states. With an objective to provide updated time series data, e-State database, an excel file of detailed budgetary items in the revenue and capital accounts from 1990-91 till 2019-20 has been provided in a single excel sheet. This database is a new addition to this report, for which updates on past data for budget and revised estimates are a work in progress.
Note: This database should be used alongside the State Finance Report. The names of budget items are kept the same as in the report. An additional alpha-numeric code preceding the item name (as given in the Report) is added to the budget item to avoid ambiguity. The alphabet codes are RR for Revenue Receipts, RE for Revenue Expenditure, CR for Capital Receipts and CE for Capital Expenditure. The numbers in the code denote the row number in which the item appear in the appendix for RE, RR, CE or CR. Including this code avoids ambiguity of an item since an item with the same name can be found in more than one appendix. For example, WMA from RBI can be seen both in Capital Receipts and Capital Expenditure as “6. WMA from RBI”. To avoid this confusion, “CR10: 6. WMA from RBI” means WMA from RBI that is in the appendix for Capital Receipts, while “CE053: 6. WMA from RBI” means WMA from RBI in the appendix for Capital Expenditure.

2019-20 Appendix Tables


Appendix Tables
87
Appendix Table 1: Major Deficit Indicators of State Governments (` Crore)
YearGross Fiscal
DeficitRevenue
DeficitPrimary
DeficitPrimary Revenue
DeficitNet RBI Credit
to States
1 2 3 4 5 6
2002-03 99,726.0 57,179.0 30,699.0 -11,848.2 -3,099.0(3.9) (2.3) (1.2) (-0.5) (-0.1)
2003-04 1,20,631.0 63,407.0 40,235.0 -16,989.4 293.0(4.2) (2.2) (1.4) (-0.6) (0.0)
2004-05 1,07,774.0 39,158.0 21,353.0 -47,262.9 -2,705.0(3.3) (1.2) (0.7) (-1.5) (-0.1)
2005-06 90,084.5 7,012.8 6,060.5 -77,011.1 -3,844.0(2.4) (0.2) (0.2) (-2.1) (-0.1)
2006-07 77,507.6 -24,857.2 -15,672.0 -1,18,036.7 -1,152.0(1.8) (-0.6) (-0.4) (-2.7) (0.0)
2007-08 75,454.7 -42,942.7 -24,375.9 -1,42,773.4 1,140.0(1.5) (-0.9) (-0.5) (-2.9) (0.0)
2008-09 1,34,589.3 -12,672.2 31,634.5 -1,15,627.0 -1,608.0(2.4) (-0.2) (0.6) (-2.1) (0.0)
2009-10 1,88,818.7 31,017.4 76,011.7 -81,789.6 186.0(2.9) (0.5) (1.2) (-1.3) (0.0)
2010-11 1,61,461.1 -3,050.6 36,640.7 -1,27,870.9 2,515.0(2.1) (0.0) (0.5) (-1.6) (0.0)
2011-12 1,68,353.4 -23,960.5 31,536.0 -1,60,777.9 -1,195.5(1.9) (-0.3) (0.4) (-1.8) (0.0)
2012-13 1,95,470.3 -20,322.1 44,998.1 -1,70,794.3 -1,245.8(2.0) (-0.2) (0.5) (-1.7) (0.0)
2013-14 2,47,852.2 10,563.2 78,954.7 -1,58,334.3 986.1(2.2) (0.1) (0.7) (-1.4) (0.0)
2014-15 3,27,190.8 45,704.4 1,36,775.5 -1,44,710.8 2,420.3(2.6) (0.4) (1.1) (-1.2) (0.0)
2015-16 4,20,670.4 5,381.7 2,06,423.6 -2,08,865.2 -3,052.0(3.1) (0.0) (1.5) (-1.5) (0.0)
2016-17 5,34,331.8 40,491.2 2,83,028.5 -2,10,812.1 787.0(3.5) (0.3) (1.9) (-1.4) (0.0)
2017-18 4,10,494.3 18,839.3 1,17,373.7 -2,74,281.2 458.0(2.4) (0.1) (0.7) (-1.6) (0.0)
2018-19 (BE) 4,90,355.4 -33,507.6 1,71,228.3 -3,52,634.7 -200.0(2.6) (-0.2) (0.9) (-1.9) (0.0)
2018-19 (RE) 5,55,480.9 12,797.2 2,35,979.4 -3,06,704.3 -200.0(2.9) (0.1) (1.2) (-1.6) (0.0)
2019-20 (BE) 5,52,429.1 -8,118.4 1,97,629.4 -3,62,918.1 -1,217.0#
(2.6) (-0.0) (0.9) (-1.7) (0.0)
RE: Revised Estimates. BE: Budget Estimates.#: upto August 23, 2019 over March 31, 2019Note: 1. Negative (-) sign indicates surplus in deficit indicators. 2. Revenue deficit is the difference between revenue expenditure and revenue receipts. 3. Gross fiscal deficit is aggregate expenditure (aggregate disbursement net of debt repayments) minus revenue receipts, non-debt capital receipts. 4. Primary deficit is gross fiscal deficit less of interest payments. 5. Primary revenue deficit is revenue deficit less of interest payments. 6. Figures in parentheses are as percentage to GDP. 7. The net RBI credit to State Governments refers to annual variations in loans and advances given to them by the RBI net of their incremental deposits
with the RBI. 8. Data from 2017-18 onwards include Delhi and Puducherry also.Source: Budget documents of the state governments, CAG for 2017-18 in respect of Jammu & Kashmir and Reserve Bank Records.

State Finances : A Study of Budgets of 2019-20
88
Ap
pen
dix
Tab
le 2
: Dev
olu
tio
n an
d T
rans
fer
of
Res
our
ces
fro
m t
he C
entr
e(`
Cro
re)
Item
2002
-03
2003
-04
2004
-05
2005
-06
2006
-07
2007
-08
2008
-09
2009
-10
2010
-11
2011
-12
12
34
56
78
910
11
I.S
tate
s’ S
hare
in C
entr
al T
axes
56,
655.
3 6
7,07
8.6
78,
549.
6 9
4,02
4.2
1,2
0,29
2.9
1,5
1,40
2.5
1,6
1,05
2.4
1,6
5,01
3.5
2,1
9,48
9.4
2,5
5,59
1.7
II.G
rant
s fr
om
the
Cen
tre
(1 t
o 5
) 4
5,17
0.4
50,
833.
6 5
6,32
1.8
76,
750.
2 9
4,45
1.1
1,0
8,62
1.8
1,2
9,92
3.4
1,5
0,97
2.3
1,6
3,49
6.7
1,8
6,41
6.5
1.
Sta
te P
lan
Sch
emes
19,
665.
5 2
5,44
6.6
29,
757.
3 2
8,74
7.7
40,
214.
9 4
9,54
7.6
63,
480.
2 7
0,85
3.2
77,
635.
5 8
7,66
8.8
2.
Cen
tral
Pla
n S
chem
es 1
,717
.9
1,3
52.1
1
,315
.5
2,2
16.1
2
,096
.8
2,2
73.6
2
,656
.9
6,4
54.4
3
,586
.6
2,7
43.2
3.
Cen
tral
ly S
pon
sore
d S
chem
es 8
,652
.4
9,8
41.9
1
0,39
0.3
13,
314.
4 1
7,42
7.3
21,
870.
8 2
5,88
9.2
25,
882.
4 3
2,82
9.1
43,
121.
8
4.
NE
C/S
pec
ial P
lan
Sch
emes
217
.3
289
.5
287
.2
338
.9
306
.0
621
.2
519
.6
695
.6
536
.4
683
.4
5.
Non
-Pla
n G
rant
s (a
to
c) 1
4,91
7.3
13,
903.
4 1
4,57
1.5
32,
133.
1 3
4,40
6.1
34,
308.
7 3
7,37
7.6
47,
086.
8 4
8,90
9.1
52,
199.
3
a)
S
tatu
tory
Gra
nts
8,2
01.3
7
,550
.3
7,6
37.7
1
8,04
9.0
17,
719.
0 1
9,79
1.7
20,
478.
3 2
4,99
4.8
27,
662.
4 3
3,48
3.8
b
) G
rant
s fo
r N
atur
al C
alam
ities
3,2
34.6
1
,774
.2
2,1
66.6
3
,271
.7
3,6
03.9
2
,639
.2
2,9
14.2
3
,495
.7
5,2
18.1
3
,213
.9
c)
N
on-P
lan
Non
-Sta
tuto
ry G
rant
s 3
,481
.4
4,5
78.9
4
,767
.3
10,
812.
4 1
3,08
3.3
11,
877.
8 1
3,98
5.1
18,
596.
2 1
6,02
8.6
15,
501.
6
III.
Gro
ss L
oan
s fr
om
the
Cen
tre
(i+ii)
26,
830.
8 2
5,87
0.9
25,
878.
5 8
,096
.8
5,7
17.5
7
,251
.5
7,0
04.7
8
,106
.9
9,4
77.9
9
,902
.1
i)
Pla
n Lo
ans
20,
357.
8 2
4,15
5.6
23,
468.
1 8
,062
.4
6,1
57.8
7
,234
.9
6,9
97.7
8
,212
.0
10,
499.
8 9
,821
.5
ii)
Non
-Pla
n Lo
ans*
6,4
73.1
1
,715
.4
2,4
10.4
3
4.4
-44
0.3
16.
6 7
.0
-105
.1-1
022.
0 8
0.6
IV.
Gro
ss T
rans
fer
(I+II+
III)
1,2
8,65
6.5
1,4
3,78
3.1
1,6
0,74
9.8
1,7
8,87
1.1
2,2
0,46
1.6
2,6
7,27
5.9
2,9
7,98
0.5
3,2
4,09
2.7
3,9
2,46
3.9
4,5
1,91
0.3
V.R
epay
men
t o
f Lo
ans
and
Inte
rest
Pay
men
ts L
iab
iliti
es (a
+b
) 5
6,94
4.9
40,
801.
3 5
9,71
5.9
21,
290.
5 2
7,78
5.8
19,
976.
7 1
8,85
6.3
21,
081.
3 1
8,65
7.9
19,
365.
9
a)
Rep
aym
ent
of L
oans
to
the
Cen
tre
27,
203.
3 1
1,93
0.8
35,
659.
7 8
,140
.7
14,
604.
8 8
,184
.7
7,7
66.0
9
,806
.5
8,7
66.5
9
,722
.2
b)
Inte
rest
Pay
men
ts o
n th
e Lo
ans
fr
om t
he C
entr
e 2
9,74
1.5
28,
870.
6 2
4,05
6.1
13,
149.
7 1
3,18
1.0
11,
791.
9 1
1,09
0.2
11,
274.
8 9
,891
.4
9,6
43.7
VI.
Net
Tra
nsfe
r o
f R
eso
urce
s fr
om
the
Cen
tre
(IV-V
) 7
1,71
1.7
1,0
2,98
1.8
1,0
1,03
4.0
1,5
7,58
0.6
1,9
2,67
5.7
2,4
7,29
9.2
2,7
9,12
4.2
3,0
3,01
1.4
3,7
3,80
6.1
4,3
2,54
4.4
(Con
td...
)

Appendix Tables
89
Ap
pen
dix
Tab
le 2
: Dev
olu
tio
n an
d T
rans
fer
of
Res
our
ces
fro
m t
he C
entr
e (C
oncl
d.)
(` C
rore
)
Item
2012
-13
2013
-14
2014
-15
2015
-16
2016
-17
2017
-18
(Acc
ount
s)20
18-1
9(B
udge
t E
stim
ates
)
2018
-19
(Rev
ised
Est
imat
es)
2019
-20
(Bud
get
Est
imat
es)
112
1314
1516
1718
1920
I.S
tate
s’ S
hare
in C
entr
al T
axes
2,9
1,53
0.1
3,1
8,27
3.5
3,3
7,83
5.3
5,0
6,19
1.3
6,0
7,86
1.4
6,0
5,18
6.0
7,4
7,06
8.2
7,5
9,33
5.7
8,5
1,52
1.0
II.G
rant
s fr
om
the
Cen
tre
(1 t
o 5
) 1
,88,
681.
8 2
,05,
952.
0 3
,30,
804.
7 3
,25,
895.
6 3
,56,
091.
3 4
,05,
957.
9 5
,88,
428.
5 6
,10,
915.
9 6
,48,
073.
2
1.
Sta
te P
lan
Sch
emes
91,
622.
4 8
9,96
5.6
2,0
2,06
5.6
1,4
1,99
2.9
1,6
4,12
0.0
30,
680.
3 5
5,25
1.4
46,
517.
1 1
7,55
4.9
2.
Cen
tral
Pla
n S
chem
es 2
,666
.0
3,4
25.1
6
,266
.0
14,
157.
2 5
,957
.2
1,0
66.0
5
,989
.6
2,4
34.3
1
24.5
3.
Cen
tral
ly S
pon
sore
d S
chem
es 4
5,47
5.7
45,
004.
3 5
0,67
2.2
55,
535.
2 5
0,23
3.5
2,1
8,32
9.7
3,2
7,04
2.2
3,3
8,00
7.9
3,8
1,43
9.6
4.
NE
C/S
pec
ial P
lan
Sch
emes
522
.3
424
.2
354
.2
537
.6
3,5
33.8
2
12.5
2
93.6
4
17.6
2
00.0
5.
Non
-Pla
n G
rant
s (a
to
c) 4
8,39
5.3
67,
132.
8 7
1,44
6.8
1,1
3,67
2.7
1,3
2,24
6.7
1,5
5,66
9.4
1,9
9,85
1.8
2,2
3,53
8.9
2,4
8,75
4.3
a)
S
tatu
tory
Gra
nts
31,
310.
9 4
4,18
6.6
43,
963.
5 6
2,39
8.6
84,
104.
6 8
1,08
3.8
96,
719.
3 1
,07,
651.
6 1
,21,
077.
1
b
) G
rant
s fo
r N
atur
al C
alam
ities
5,5
59.4
6
,159
.0
5,7
56.0
1
2,90
7.5
11,
055.
9 7
,789
.6
5,4
18.9
6
,570
.2
3,7
94.9
c)
N
on-P
lan
Non
-Sta
tuto
ry G
rant
s 1
1,52
5.0
16,
787.
2 2
1,72
7.2
38,
366.
5 3
7,08
6.3
66,
795.
9 9
7,71
3.6
1,0
9,31
7.1
1,2
3,88
2.4
III.
Gro
ss L
oan
s fr
om
the
Cen
tre
(i+ii)
11,
204.
5 1
0,87
0.4
11,
880.
6 1
2,51
4.2
17,
757.
1 1
9,50
9.7
31,
463.
4 3
2,72
4.8
37,
281.
3
i)
Pla
n Lo
ans
11,
198.
8 1
0,83
8.0
11,
326.
0 1
2,51
3.7
17,
607.
2 1
3,73
9.6
26,
493.
8 2
2,30
5.9
24,
874.
3
ii)
Non
-Pla
n Lo
ans*
5.7
3
2.4
554
.6
- 1
49.9
5
,770
.1
4,9
69.5
1
0,41
8.9
12,
407.
0
IV.
Gro
ss T
rans
fer
(I+II+
III)
4,9
1,41
6.3
5,3
5,09
5.9
6,8
0,52
0.6
8,4
4,60
1.1
9,8
1,70
9.8
10,
30,6
53.7
1
3,66
,960
.1
14,
02,9
76.4
1
5,36
,875
.5
V.R
epay
men
t o
f Lo
ans
and
Inte
rest
Pay
men
ts L
iab
iliti
es (a
+b
) 1
9,23
8.3
19,
130.
2 1
9,20
1.5
19,
683.
1 1
9,92
5.9
25,
119.
9 2
6,71
2.3
28,
662.
0 2
9,81
2.8
a)
Rep
aym
ent
of L
oans
to
the
Cen
tre
9,4
74.0
1
0,26
9.0
10,
917.
8 1
1,47
5.2
12,
528.
3 1
4,87
5.7
16,
149.
6 1
8,08
5.9
19,
175.
1
b)
Inte
rest
Pay
men
ts o
n th
e Lo
ans
fr
om t
he C
entr
e 9
,764
.2
8,8
61.1
8
,283
.7
8,2
07.9
7
,397
.6
10,
244.
1 1
0,56
2.7
10,
576.
1 1
0,63
7.7
VI.
Net
Tra
nsfe
r o
f R
eso
urce
s fr
om
the
Cen
tre
(IV-V
) 4
,72,
178.
0 5
,15,
965.
8 6
,61,
319.
1 8
,24,
918.
0 9
,61,
783.
9 1
0,05
,533
.8
13,
40,2
47.8
1
3,74
,314
.4
15,
07,0
62.7
*: In
clud
e W
ays
and
Mea
ns A
dva
nces
from
the
Cen
tre.
N
EC
: Nor
th E
aste
rn C
ounc
il.N
ote
: D
ata
from
201
7-18
onw
ard
s in
clud
e D
elhi
and
Pud
uche
rry
also
.S
our
ce: B
udge
t d
ocum
ents
of t
he s
tate
gov
ernm
ents
. Det
ails
in m
etho
dol
ogy.

State Finances : A Study of Budgets of 2019-20
90
Appendix Table 3: Development and Non-Development Expenditure: Aggregate (` Crore)
Year Development* Non-Development* Others** Total
1 2 3 4 5
2002-03 2,21,799.0 1,49,554.0 38,896.0 4,10,249.0
(54.1) (36.5) (9.5) (100.0)
2003-04 2,72,848.0 1,66,538.0 74,916.0 5,14,302.0
(53.1) (32.4) (14.6) (100.0)
2004-05 2,86,473.0 1,85,152.0 81,803.0 5,53,428.0
(51.8) (33.5) (14.8) (100.0)
2005-06 3,30,044.1 1,90,020.6 41,616.8 5,61,681.6
(58.8) (33.8) (7.4) (100.0)
2006-07 3,92,165.0 2,11,872.4 53,242.9 6,57,280.3
(59.7) (32.2) (8.1) (100.0)
2007-08 4,64,462.0 2,33,232.8 54,629.6 7,52,324.4
(61.7) (31.0) (7.3) (100.0)
2008-09 5,67,086.2 2,54,981.4 60,265.2 8,82,332.8
(64.3) (28.9) (6.8) (100.0)
2009-10 6,37,731.1 3,07,547.0 70,051.7 10,15,329.8
(62.8) (30.3) (6.9) (100.0)
2010-11 7,20,354.7 3,57,287.4 81,087.6 11,58,729.7
(62.2) (30.8) (7.0) (100.0)
2011-12 8,52,405.6 4,01,059.4 98,147.3 13,51,612.3
(63.1) (29.7) (7.3) (100.0)
2012-13 9,72,256.5 4,46,878.9 1,15,119.4 15,34,254.8
(63.4) (29.1) (7.5) (100.0)
2013-14 10,76,452.2 5,04,548.4 1,25,144.0 17,06,144.5
(63.1) (29.6) (7.3) (100.0)
2014-15 13,25,989.2 5,66,467.4 1,33,326.0 20,25,782.5
(65.5) (28.0) (6.6) (100.0)
2015-16 15,84,006.2 6,29,349.3 1,46,873.2 23,60,228.7
(67.1) (26.7) (6.2) (100.0)
2016-17 18,31,163.8 7,10,365.1 1,66,686.4 27,08,215.3
(67.6) (26.2) (6.2) (100.0)
2017-18 18,77,392.3 8,25,774.0 2,21,432.9 29,24,599.2
(64.2) (28.2) (7.6) (100.0)
2018-19 (BE) 23,35,557.8 9,98,524.1 2,86,392.4 36,20,474.3
(64.5) (27.6) (7.9) (100.0)
2018-19 (RE) 24,03,758.9 9,83,647.7 2,99,038.2 36,86,444.8
(65.2) (26.7) (8.1) (100.0)
2019-20 (BE) 25,75,243.6 10,97,748.6 3,31,683.9 40,04,676.1
(64.3) (27.4) (8.3) (100.0)
RE : Revised Estimates. BE : Budget Estimates.* : Includes expenditure on revenue and capital account and loans and advances extended by State Governments and UTs.** : Includes Grants-in-Aid and Contributions (Compensation and Assignments to Local Bodies), Discharge of Internal Debt and Repayment of Loans to the
Centre.Note : 1. Figures in parentheses are percentage to total. 2. Data from 2017-18 onwards include Delhi and Puducherry also.Source : Budget documents of the state governments. Details in methodology.

Appendix Tables
91
Appendix Table 4: Development Expenditure - Major Heads(` Crore)
Item 2016-17(Accounts)
2017-18(Accounts)
2018-19(Budget
Estimates)
2018-19(Revised
Estimates)
2019-20(Budget
Estimates)
1 2 3 4 5 6
I. Development Expenditure (Revenue and Capital) (A + B) 17,13,782.4 18,40,430.4 22,96,756.7 23,53,374.5 25,35,398.6
A. Social Services (1 to 11) 9,19,225.2 10,06,167.7 12,83,625.1 12,97,167.0 14,07,593.0 (50.2 ) (53.6) (55.0) (54.0) (54.7)
1. Education, Sports, Art and Culture 3,98,607.1 4,37,933.0 5,33,571.8 5,31,758.7 5,90,416.4 2. Medical and Public Health and Family Welfare 1,25,189.1 1,46,382.6 1,77,658.4 1,81,713.6 1,96,659.4 3. Water Supply and Sanitation 57,920.9 67,892.0 80,755.1 79,741.5 88,899.8 4. Housing 29,802.3 36,521.9 56,347.7 57,137.5 53,407.8 5. Welfare of Scheduled Caste, Scheduled Tribes and Other Backward Classes 65,440.5 75,997.5 1,04,170.1 91,906.3 98,764.7 6. Labour and Labour welfare 7,552.9 9,272.7 13,234.4 12,910.9 15,559.9 7. Social Security and Welfare 1,01,056.2 1,06,302.8 1,37,430.9 1,50,779.4 1,65,798.7 8. Nutrition 22,817.8 23,505.2 31,837.9 28,812.2 31,669.9 9. Relief on account of Natural Calamities 27,998.8 15,985.9 21,098.6 37,212.5 28,858.5 10. Urban development 73,627.6 78,140.9 1,15,361.3 1,13,836.5 1,25,685.5 11. Others* 9,212.0 8,233.2 12,158.9 11,357.9 11,872.4
B. Economic Services (1 to 9) 7,94,557.2 8,34,262.7 10,13,131.6 10,56,207.4 11,27,805.5 (43.4) (44.4) (43.4) (43.9) (43.8)
1. Agriculture and Allied Activities 1,38,731.5 1,88,123.7 2,17,157.7 2,42,953.7 2,62,966.4 2. Rural Development 1,50,147.0 1,58,418.8 2,05,408.1 2,08,566.4 2,31,480.1 3. Special Area Programmes 7,428.3 7,742.1 9,845.7 9,771.1 11,859.2 4. Irrigation and Flood Control 1,11,338.1 1,11,579.6 1,52,037.3 1,45,933.1 1,37,460.1 5. Energy 1,84,512.7 1,64,197.7 1,76,178.7 1,87,530.3 2,05,618.4 6. Industry and Minerals 24,884.1 25,165.4 37,045.2 37,815.6 39,276.2 7. Transport and Communications 1,39,953.5 1,44,196.0 1,65,005.9 1,76,241.6 1,77,112.2 8. Science, Technology and Environment 1,551.7 1,668.3 3,202.6 2,563.2 3,764.6 9. General Economic Services 36,010.1 33,171.0 47,250.4 44,832.4 58,268.3
II. Loans and Advances by State Governmentsfor Development Purposes (A+B) 1,17,381.5 36,961.9 38,801.1 50,384.4 39,845.0
A. Social Services (1 to 7) 9,642.2 16,460.1 15,607.9 18,023.6 18,390.9 (0.5) (0.9) (0.7) (0.7) (0.7)
1. Education, Sports, Art and Culture 47.8 379.3 94.8 657.0 909.2 2. Medical and Public Health 534.0 398.4 597.9 662.2 720.2 3. Family Welfare - - - - - 4. Water Supply and Sanitation 2,065.4 3,632.6 5,118.8 6,122.8 6,516.2 5. Housing 693.6 2,205.6 767.8 1,770.1 760.6 6. Government Servants (Housing) 1,593.1 1,116.2 1,574.5 1,607.2 1,420.9 7. Others @ 4,708.4 8,728.0 7,454.1 7,204.3 8,063.7
B. Economic Services (1 to 10) 1,07,739.2 20,501.8 23,193.2 32,360.8 21,454.1 (5.9) (1.1) (1.0 ) (1.3) (0.8)
1. Crop Husbandry 323.6 228.3 246.9 437.1 491.4 2. Soil and Water Conservation - -8.3 - - - 3. Food Storage and Warehousing 31,595.6 700.6 656.8 1,383.5 583.9 4. Co-operation 2,438.5 4,752.2 4,995.4 4,838.8 1,358.4 5. Major and Medium Irrigation, etc. 2.1 - 2,316.8 2,316.8 2,190.0 6. Power Projects 67,943.6 6,627.3 8,323.2 7,876.9 8,271.7 7. Village and Small Industries 625.3 279.0 164.5 158.8 203.2 8. Other Industries and Minerals 278.1 379.8 904.6 976.6 457.4 9. Rural Development 3.7 3.8 57.8 7.8 7.8 10. Others+ 4,528.7 7,539.1 5,527.3 14,364.4 7,890.4
III. Total Development Expenditure (I + II) 18,31,163.8 18,77,392.3 23,35,557.8 24,03,758.9 25,75,243.6 (100.0) (100.0) (100.0) (100.0) (100.0)
'–' : Nil/Negligible.* : Include expenditure on information and publicity.@ : Include urban development, social security and welfare, etc.+ : Include forest, fisheries, animal husbandry, road and water transport services, etc.Note : 1. Figures in parentheses are percentage to total development expenditure. 2. Data from 2017-18 onwards include Delhi and Puducherry also.Source : Budget documents of the state governments. Details in methodology.
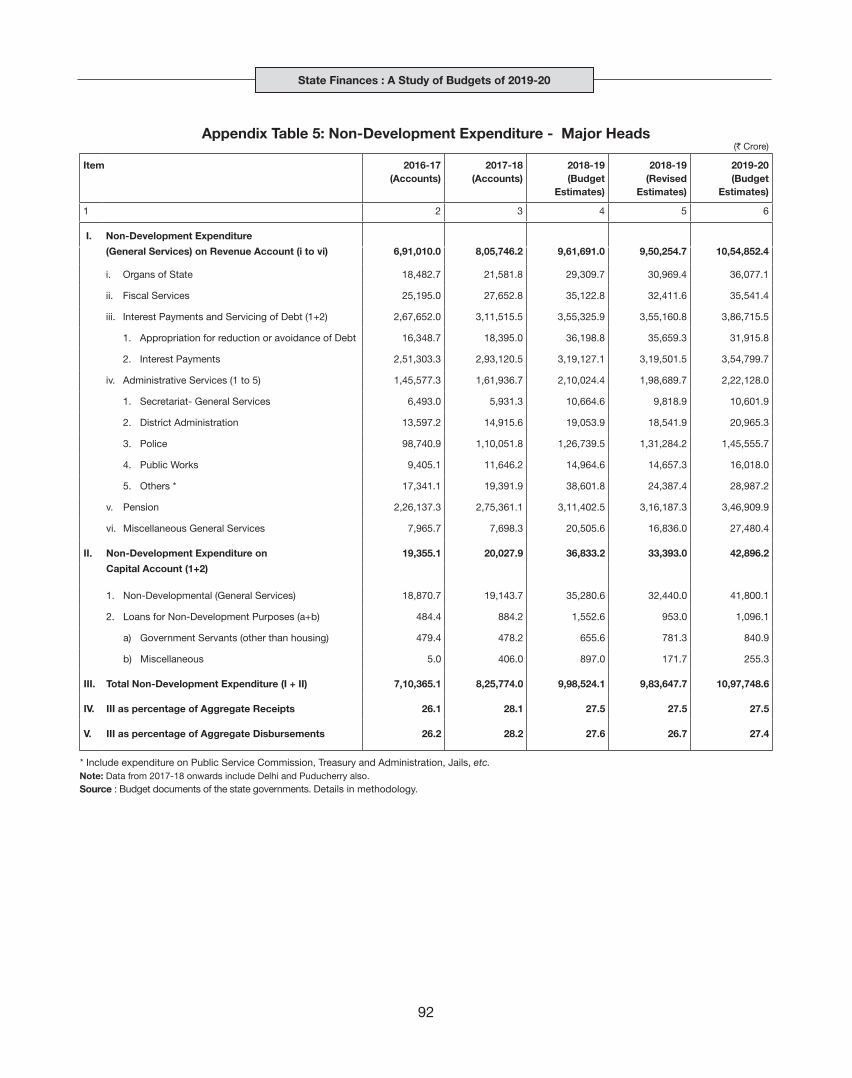
State Finances : A Study of Budgets of 2019-20
92
Appendix Table 5: Non-Development Expenditure - Major Heads(` Crore)
Item 2016-17(Accounts)
2017-18(Accounts)
2018-19(Budget
Estimates)
2018-19(Revised
Estimates)
2019-20(Budget
Estimates)
1 2 3 4 5 6
I. Non-Development Expenditure
(General Services) on Revenue Account (i to vi) 6,91,010.0 8,05,746.2 9,61,691.0 9,50,254.7 10,54,852.4
i. Organs of State 18,482.7 21,581.8 29,309.7 30,969.4 36,077.1
ii. Fiscal Services 25,195.0 27,652.8 35,122.8 32,411.6 35,541.4
iii. Interest Payments and Servicing of Debt (1+2) 2,67,652.0 3,11,515.5 3,55,325.9 3,55,160.8 3,86,715.5
1. Appropriation for reduction or avoidance of Debt 16,348.7 18,395.0 36,198.8 35,659.3 31,915.8
2. Interest Payments 2,51,303.3 2,93,120.5 3,19,127.1 3,19,501.5 3,54,799.7
iv. Administrative Services (1 to 5) 1,45,577.3 1,61,936.7 2,10,024.4 1,98,689.7 2,22,128.0
1. Secretariat- General Services 6,493.0 5,931.3 10,664.6 9,818.9 10,601.9
2. District Administration 13,597.2 14,915.6 19,053.9 18,541.9 20,965.3
3. Police 98,740.9 1,10,051.8 1,26,739.5 1,31,284.2 1,45,555.7
4. Public Works 9,405.1 11,646.2 14,964.6 14,657.3 16,018.0
5. Others * 17,341.1 19,391.9 38,601.8 24,387.4 28,987.2
v. Pension 2,26,137.3 2,75,361.1 3,11,402.5 3,16,187.3 3,46,909.9
vi. Miscellaneous General Services 7,965.7 7,698.3 20,505.6 16,836.0 27,480.4
II. Non-Development Expenditure on 19,355.1 20,027.9 36,833.2 33,393.0 42,896.2
Capital Account (1+2)
1. Non-Developmental (General Services) 18,870.7 19,143.7 35,280.6 32,440.0 41,800.1
2. Loans for Non-Development Purposes (a+b) 484.4 884.2 1,552.6 953.0 1,096.1
a) Government Servants (other than housing) 479.4 478.2 655.6 781.3 840.9
b) Miscellaneous 5.0 406.0 897.0 171.7 255.3
III. Total Non-Development Expenditure (I + II) 7,10,365.1 8,25,774.0 9,98,524.1 9,83,647.7 10,97,748.6
IV. III as percentage of Aggregate Receipts 26.1 28.1 27.5 27.5 27.5
V. III as percentage of Aggregate Disbursements 26.2 28.2 27.6 26.7 27.4
* Include expenditure on Public Service Commission, Treasury and Administration, Jails, etc.Note: Data from 2017-18 onwards include Delhi and Puducherry also.Source : Budget documents of the state governments. Details in methodology.

Appendix Tables
93
Appendix Table 6: Development and Non-Development Expenditure* (` Crore)
Item 2016-17(Accounts)
2017-18(Accounts)
2018-19(Budget
Estimates)
2018-19(Revised
Estimates)
2019-20(Budget
Estimates)
1 2 3 4 5 6
Aggregate Disbursements (1 to 3) 27,08,215.3 29,24,599.2 36,20,474.3 36,86,444.8 40,04,676.1
1. Development Expenditure (a + b) 18,31,163.8 18,77,392.3 23,35,557.8 24,03,758.9 25,75,243.6
a) Direct Development Expenditure (i + ii) 17,13,782.4 18,40,430.4 22,96,756.7 23,53,374.5 25,35,398.6
i) Economic Services 7,94,557.2 8,34,262.7 10,13,131.6 10,56,207.4 11,27,805.5
ii) Social Services 9,19,225.2 10,06,167.7 12,83,625.1 12,97,167.0 14,07,593.0
b) Loans and Advances for Development
Purposes (i + ii) 1,17,381.5 36,961.9 38,801.1 50,384.4 39,845.0
i) Economic Services 1,07,739.2 20,501.8 23,193.2 32,360.8 21,454.1
ii) Social Services 9,642.2 16,460.1 15,607.9 18,023.6 18,390.9
2. Non-Development Expenditure (a + b) 7,10,365.1 8,25,774.0 9,98,524.1 9,83,647.7 10,97,748.6
a) Direct Non-Development Expenditure 7,09,880.7 8,24,889.9 9,96,971.5 9,82,694.7 10,96,652.5
b) Loans and Advances for Non-Development Purposes 484.4 884.2 1,552.6 953.0 1,096.1
3. Others (a to c) 1,66,686.4 2,21,432.9 2,86,392.4 2,99,038.2 3,31,683.9
a) Repayment of Loans to the Centre 12,528.3 14,875.7 16,149.6 18,085.9 19,175.1
b) Discharge of Internal Debt 98,740.8 1,38,176.2 1,86,699.8 1,98,483.8 2,17,225.2
of which: Market Loans 41,523.8 77,255.8 1,19,379.5 1,27,715.8 1,37,401.6
c) Grants-in-Aid and Contributions 55,417.2 68,381.0 83,543.0 82,468.5 95,283.6
of which:
Compensation and Assignments to Local Bodies and Panchayati Raj Institutions 55,417.2 68,381.0 83,543.0 82,468.5 95,283.6
* : Include expenditure on both Revenue and Capital Account.Note: Data from 2017-18 onwards include Delhi and Puducherry also.Source : Budget documents of the state governments. Details in methodology.

State Finances : A Study of Budgets of 2019-20
94
Ap
pen
dix
Tab
le 7
: Co
mp
osi
tio
n o
f S
oci
al S
ecto
r E
xpen
dit
ure*
(`
Cro
re)
Item
2002
-03
2003
-04
2004
-05
2005
-06
2006
-07
2007
-08
2008
-09
2009
-10
2010
-11
2011
-12
12
34
56
78
910
11
1. R
even
ue E
xpen
dit
ure
(i +
ii)
1,21
,866
.1
1,32
,204
.1
1,46
,000
.6
1,67
,774
.6
1,95
,626
.4
2,28
,122
.4
2,85
,130
.1
3,48
,872
.1
4,02
,920
.0
4,67
,852
.0
(i)
S
oci
al S
ervi
ces
(a t
o l)
1,09
,074
.8
1,17
,516
.9
1,29
,035
.1
1,48
,551
.5
1,74
,555
.3
2,03
,765
.7
2,55
,268
.5
3,08
,550
.0
3,65
,711
.2
4,25
,643
.6
(a)
Ed
ucat
ion,
Sp
orts
, Art
and
Cul
ture
61,
253.
3 6
4,27
9.9
69,
371.
1 7
8,14
7.4
89,
578.
3 1,
00,7
75.3
1,
21,2
76.3
1,
51,6
70.3
1,
87,6
17.3
2
,16,
066.
6
(b)
Med
ical
and
Pub
lic H
ealth
13,
443.
3 1
4,12
1.1
15,
230.
5 1
7,54
2.1
19,
161.
8 2
1,89
4.8
26,
160.
8 3
2,61
1.5
38,
128.
2 4
3,94
5.2
(c)
Fam
ily W
elfa
re 2
,374
.8
2,4
73.4
2
,529
.8
2,7
63.4
3
,043
.3
3,5
57.0
4
,487
.9
5,6
89.7
6
,765
.4
7,5
83.7
(d)
Wat
er S
upp
ly a
nd S
anita
tion
5,5
02.2
6
,482
.4
6,9
22.9
8
,464
.9
8,7
74.6
9
,814
.1
10,
281.
3 1
0,51
7.6
11,
505.
9 1
2,70
4.3
(e)
Hou
sing
1,4
42.4
1
,739
.4
1,8
67.8
2
,001
.6
2,8
78.3
4
,016
.6
5,8
85.8
5
,739
.4
6,4
27.9
6
,676
.0
(f)
Urb
an D
evel
opm
ent
3,5
43.8
3
,921
.3
4,8
32.8
4
,686
.8
9,4
70.5
1
4,21
9.1
21,
771.
7 2
2,74
4.4
21,
653.
5 2
2,83
9.8
(g)
Wel
fare
of S
Cs,
STs
and
OB
Cs
7,1
05.3
7
,703
.9
9,1
89.1
1
0,45
6.6
11,
801.
9 1
4,63
0.1
18,
046.
5 2
0,93
6.3
25,
304.
8 3
0,89
9.4
(h)
Lab
our
and
Lab
our
Wel
fare
1,1
93.8
1
,380
.8
1,4
82.7
1
,656
.4
2,4
84.1
2
,351
.3
2,8
39.1
3
,404
.0
4,0
27.5
4
,382
.5
(i)
Soc
ial S
ecur
ity a
nd W
elfa
re 6
,123
.9
7,1
03.7
8
,005
.1
9,2
32.2
1
2,91
7.2
17,
611.
8 2
5,23
3.7
32,
848.
9 3
8,72
9.9
48,
506.
9
(j)
Nut
ritio
n 2
,254
.7
2,8
35.9
3
,226
.4
4,0
21.6
4
,844
.9
6,1
78.4
8
,475
.1
11,
234.
6 1
3,45
3.3
15,
691.
4
(k)
Exp
end
iture
on
Nat
ural
Cal
amiti
es 4
,153
.0
4,6
57.2
5
,566
.5
8,5
69.6
7
,859
.5
6,6
56.6
8
,325
.8
8,4
09.0
8
,761
.6
13,
691.
8
(l)
Oth
ers
684
.2
818
.0
810
.3
1,0
09.0
1
,741
.1
2,0
60.5
2
,484
.7
2,7
44.3
3
,335
.8
2,6
56.0
(ii
) E
cono
mic
Ser
vice
s (a
+ b
) 1
2,79
1.3
14,
687.
2 1
6,96
5.5
19,
223.
1 2
1,07
1.0
24,
356.
7 2
9,86
1.5
40,
322.
1 3
7,20
8.8
42,
208.
4
(a
) R
ural
Dev
elop
men
t 1
1,74
6.6
13,
546.
7 1
5,39
1.1
17,
587.
8 1
9,31
5.3
22,
203.
3 2
6,55
0.3
35,
630.
7 3
2,59
4.3
37,
222.
4
(b)
Food
Sto
rage
and
War
ehou
sing
1,0
44.7
1
,140
.5
1,5
74.5
1
,635
.3
1,7
55.8
2
,153
.4
3,3
11.2
4
,691
.5
4,6
14.5
4
,986
.0
2. C
apit
al O
utla
y (i
+ ii
) 9
,027
.6
11,
171.
1 1
5,57
3.3
18,
261.
2 2
2,61
5.3
29,
818.
9 3
8,48
5.3
43,
059.
8 4
0,74
8.5
45,
901.
7
(i)
So
cial
Ser
vice
s (a
to
i) 7
,202
.7
9,2
94.0
1
1,68
5.4
14,
137.
1 1
7,39
3.2
22,
989.
9 2
9,16
8.0
29,
374.
0 3
1,40
1.2
34,
336.
6
(a
) E
duc
atio
n, S
por
ts, A
rt a
nd C
ultu
re 4
92.0
6
47.6
9
83.8
1
,716
.0
2,3
78.6
3
,360
.4
4,5
94.9
4
,146
.4
5,0
55.2
4
,581
.5
(b)
Med
ical
and
Pub
lic H
ealth
622
.9
917
.0
1,0
08.1
1
,722
.0
3,1
34.8
3
,415
.4
3,6
31.9
3
,928
.7
4,2
36.9
5
,006
.8
(c)
Fam
ily W
elfa
re 1
0.3
18.
4 3
.2
3.7
3
4.9
40.
5 7
2.6
105
.2
8.8
7
3.3
(d)
Wat
er S
upp
ly a
nd S
anita
tion
3,5
53.3
3
,586
.4
5,1
79.6
5
,181
.4
6,6
46.5
9
,343
.9
11,
330.
8 1
0,15
8.2
8,8
10.5
8
,925
.7
(e)
Hou
sing
635
.1
598
.5
975
.7
744
.9
981
.5
1,0
09.2
1
,209
.3
1,0
48.9
3
,040
.6
3,1
65.3
(f)
Urb
an D
evel
opm
ent
467
.6
1,8
41.4
1
,774
.4
2,3
01.5
1
,766
.2
2,4
57.3
4
,149
.9
6,1
98.8
5
,196
.9
7,3
95.2
(g)
Wel
fare
of S
Cs,
STs
and
OB
Cs
618
.2
781
.3
928
.2
1,2
41.6
1
,715
.5
1,8
41.4
2
,441
.0
2,0
73.1
2
,859
.3
3,1
69.9
(h)
Soc
ial S
ecur
ity a
nd W
elfa
re 8
5.4
163
.1
157
.9
244
.0
271
.9
517
.4
793
.7
803
.5
1,1
70.7
1
,018
.7
(i)
Oth
ers
717
.9
740
.3
674
.5
982
.0
463
.4
1,0
04.3
9
43.7
9
11.0
1
,022
.4
1,0
00.2
(ii
) E
cono
mic
Ser
vice
s (a
+ b
) 1
,824
.9
1,8
77.1
3
,887
.9
4,1
24.2
5
,222
.1
6,8
29.0
9
,317
.4
13,
685.
8 9
,347
.2
11,
565.
0
(a
) R
ural
Dev
elop
men
t 2
,223
.4
2,3
18.1
3
,014
.5
3,9
50.8
5
,387
.9
5,7
28.4
5
,831
.5
7,0
25.1
9
,243
.7
9,9
71.9
(b)
Food
Sto
rage
and
War
ehou
sing
-398
.5-4
41.0
-873
.4
173
.4
-165
.8 1
,100
.6
3,4
85.9
6
,660
.6
103
.6
1,5
93.1
3. L
oan
s an
d A
dva
nces
by
Sta
te G
ove
rnm
ents
(i +
ii)
2,7
54.3
2
,789
.1
2,5
02.8
3
,394
.3
4,7
46.5
7
,525
.2
7,9
22.8
7
,805
.3
8,2
68.1
9
,815
.6
(i)
S
oci
al S
ervi
ces
(a t
o d
) 2
,736
.0
2,7
84.3
2
,185
.5
3,0
41.9
3
,629
.7
6,1
79.8
6
,394
.4
5,8
28.7
7
,295
.4
7,2
75.6
(a
) E
duc
atio
n 3
4.3
49.
1 1
28.2
5
2.6
15.
7 1
8.6
13.
9 8
.8
67.
4 7
6.1
(b)
Hou
sing
544
.4
809
.8
738
.7
750
.5
894
.4
3,2
82.0
3
,320
.0
779
.1
1,2
49.5
1
,885
.9
(c)
Hou
sing
(Gov
ernm
ent
serv
ants
) 7
86.1
5
60.5
3
20.3
3
59.8
4
29.3
4
54.6
5
88.4
5
73.6
6
85.7
8
10.2
(d)
Oth
ers
1,3
71.3
1
,365
.1
998
.4
1,8
79.0
2
,290
.3
2,4
24.6
2
,472
.1
4,4
67.3
5
,292
.8
4,5
03.3
(ii
) E
cono
mic
Ser
vice
s (a
+ b
) 1
8.3
4.8
3
17.3
3
52.4
1
,116
.8
1,3
45.4
1
,528
.4
1,9
76.6
9
72.7
2
,540
.0
(a)
Rur
al D
evel
opm
ent
-
-
6.9
6
.4
5.8
2
.9
4.2
3
.3
3.6
5
.6
(b)
Food
Sto
rage
and
War
ehou
sing
18.
3 4
.8
310
.4
346
.0
1,1
10.9
1
,342
.5
1,5
24.2
1
,973
.2
969
.1
2,5
34.4
Tota
l So
cial
Sec
tor
Exp
end
itur
e (1
+2+
3)1,
33,6
47.9
1,
46,1
64.3
1,
64,0
76.7
1,
89,4
30.2
2,
22,9
88.2
2,
65,4
66.4
3,
31,5
38.2
3,
99,7
37.2
4,
51,9
36.5
5,
23,5
69.3
(Con
td...
)

Appendix Tables
95
Ap
pen
dix
Tab
le 7
: Co
mp
osi
tio
n o
f S
oci
al S
ecto
r E
xpen
dit
ure*
(Con
cld
.)(`
Cro
re)
Item
2012
-13
2013
-14
2014
-15
2015
-16
2016
-17
2017
-18
2018
-19
(BE
)20
18-1
9(R
E)
2019
-20
(BE
)
112
1314
1516
1718
1920
1. R
even
ue E
xpen
dit
ure
(i +
ii)
5,3
6,67
6.1
6,1
0,29
3.8
7,4
0,02
0.3
8,6
1,45
1.9
9,7
3,06
2.7
10,5
8,64
2.8
13,1
9,05
9.8
13,4
7,37
5.6
14,
61,7
40.1
(i)
So
cial
Ser
vice
s (a
to
l) 4
,85,
363.
2 5
,50,
120.
8 6
,33,
141.
0 7
,40,
108.
3 8
,35,
442.
9 9,
13,3
48.7
11
,39,
770.
2 11
,62,
943.
6 1
2,60
,680
.0
(a)
Ed
ucat
ion,
Sp
orts
, Art
and
Cul
ture
2,4
5,40
1.5
2,7
3,53
4.9
3,1
5,42
5.7
3,4
9,49
4.1
3,8
6,92
6.0
4,2
4,79
8.0
5,1
1,97
8.9
5,1
2,20
6.7
5,6
8,19
9.4
(b)
Med
ical
and
Pub
lic H
ealth
50,
641.
0 5
6,38
9.1
70,
595.
4 8
1,00
8.9
93,
457.
5 1
,12,
193.
6 1
,31,
774.
3 1
,36,
681.
5 1
,46,
203.
9
(c
) Fa
mily
Wel
fare
9,5
26.0
1
0,13
9.8
15,
110.
3 1
6,46
1.9
18,
014.
0 2
0,52
8.4
24,
816.
1 2
5,22
6.2
28,
030.
8
(d
) W
ater
Sup
ply
and
San
itatio
n 1
2,42
8.5
14,
654.
4 2
0,57
5.6
27,
176.
9 3
5,17
0.0
39,
190.
4 4
4,97
0.3
45,
837.
4 4
6,09
6.2
(e)
Hou
sing
8,6
40.9
8
,707
.6
12,
510.
2 1
5,12
1.9
19,
769.
6 2
7,62
3.6
39,
199.
4 4
1,43
0.5
42,
133.
6
(f)
U
rban
Dev
elop
men
t 2
8,34
4.5
31,
530.
6 3
4,40
8.3
43,
003.
2 6
1,20
7.5
62,
677.
2 8
9,47
3.7
87,
604.
9 9
6,48
1.1
(g)
Wel
fare
of S
Cs,
STs
and
OB
Cs
38,
036.
8 4
2,69
1.1
42,
486.
5 5
1,99
6.3
59,
040.
7 6
7,75
6.7
91,
750.
1 8
1,34
3.9
89,
234.
3
(h
) La
bou
r an
d L
abou
r W
elfa
re 5
,916
.2
6,9
54.2
7
,506
.8
7,0
80.8
7
,552
.9
9,2
72.7
1
3,23
4.4
12,
910.
9 1
5,55
9.9
(i)
Soc
ial S
ecur
ity a
nd W
elfa
re 5
5,56
3.2
65,
543.
5 7
2,28
0.9
90,
270.
8 9
8,08
5.9
1,0
3,85
8.5
1,3
2,48
0.9
1,4
6,27
5.5
1,6
0,80
7.9
(j)
Nut
ritio
n 1
6,95
5.6
19,
570.
2 2
0,38
8.1
21,
564.
9 2
2,81
7.8
23,
505.
2 3
1,83
7.9
28,
812.
2 3
1,66
9.9
(k)
Exp
end
iture
on
Nat
ural
Cal
amiti
es 1
0,98
0.9
16,
936.
4 1
8,34
2.5
32,
738.
5 2
7,99
8.8
15,
985.
9 2
1,09
8.6
37,
212.
5 2
8,85
8.5
(l)
Oth
ers
2,9
28.1
3
,468
.9
3,5
10.6
4
,190
.1
5,4
02.3
5
,958
.6
7,1
55.6
7
,401
.2
7,4
04.3
(ii)
Eco
nom
ic S
ervi
ces
(a +
b)
51,
312.
9 6
0,17
3.0
1,0
6,87
9.4
1,2
1,34
3.6
1,3
7,61
9.8
1,4
5,29
4.1
1,7
9,28
9.6
1,8
4,43
2.0
2,0
1,06
0.2
(a)
Rur
al D
evel
opm
ent
44,
370.
4 4
8,77
3.5
95,
222.
5 1
,07,
971.
0 1
,26,
248.
3 1
,32,
244.
5 1
,62,
617.
6 1
,68,
040.
8 1
,82,
694.
1
(b
) Fo
od S
tora
ge a
nd W
areh
ousi
ng 6
,942
.5
11,
399.
4 1
1,65
6.9
13,
372.
6 1
1,37
1.5
13,
049.
6 1
6,67
2.0
16,
391.
2 1
8,36
6.1
2. C
apit
al O
utla
y (i
+ ii
) 5
6,45
8.1
60,
923.
6 8
3,86
0.0
98,
665.
9 1
,13,
884.
1 1
,25,
126.
8 1
,89,
826.
4 1
,78,
011.
3 1
,99,
219.
1
(i)
So
cial
Ser
vice
s (a
to
i) 4
3,29
1.4
50,
110.
3 6
3,07
0.0
69,
555.
3 8
3,78
2.4
92,
819.
0 1
,43,
855.
0 1
,34,
223.
5 1
,46,
913.
1
(a
) E
duc
atio
n, S
por
ts, A
rt a
nd C
ultu
re 5
,767
.7
7,3
30.0
8
,760
.0
10,
590.
4 1
1,68
1.1
13,
135.
0 2
1,59
3.0
19,
552.
0 2
2,21
6.9
(b)
Med
ical
and
Pub
lic H
ealth
6,0
73.0
7
,623
.5
10,
515.
1 1
2,32
5.7
13,
590.
2 1
3,27
4.0
20,
620.
6 1
9,21
1.9
21,
887.
1
(c
) Fa
mily
Wel
fare
61.
0 2
51.6
3
13.6
2
80.7
1
27.4
3
86.6
4
47.4
5
93.9
5
37.6
(d
) W
ater
Sup
ply
and
San
itatio
n 1
1,45
0.5
13,
582.
4 1
8,74
0.0
18,
756.
6 2
2,75
0.9
28,
701.
6 3
5,78
4.8
33,
904.
0 4
2,80
3.5
(e)
Hou
sing
4,3
61.6
5
,025
.8
7,5
11.8
6
,653
.7
10,
032.
7 8
,898
.3
17,
148.
3 1
5,70
7.0
11,
274.
2
(f)
U
rban
Dev
elop
men
t 9
,066
.2
7,5
16.9
7
,111
.6
9,5
92.1
1
2,42
0.2
15,
463.
7 2
5,88
7.6
26,
231.
6 2
9,20
4.4
(g)
Wel
fare
of S
Cs,
STs
and
OB
Cs
3,2
61.9
4
,138
.8
5,3
85.9
6
,198
.8
6,3
99.8
8
,240
.8
12,
420.
0 1
0,56
2.4
9,5
30.4
(h
) S
ocia
l Sec
urity
and
Wel
fare
1,5
17.2
2
,363
.9
2,4
22.1
3
,125
.5
2,9
70.4
2
,444
.3
4,9
50.1
4
,503
.9
4,9
90.8
(i)
O
ther
s 1
,732
.3
2,2
77.4
2
,303
.7
2,0
31.8
3
,809
.7
2,2
74.6
5
,003
.3
3,9
56.7
4
,468
.2
(ii
) E
cono
mic
Ser
vice
s (a
+ b
) 1
3,16
6.7
10,
813.
4 2
0,79
2.1
29,
110.
6 3
0,10
1.7
32,
307.
8 4
5,97
1.4
43,
787.
9 5
2,30
6.0
(a)
Rur
al D
evel
opm
ent
9,9
53.8
1
0,00
8.0
18,
365.
8 2
6,25
5.6
23,
898.
7 2
6,17
4.4
42,
790.
5 4
0,52
5.6
48,
785.
9
(b
) Fo
od S
tora
ge a
nd W
areh
ousi
ng 3
,212
.8
805
.3
2,4
26.3
2
,855
.0
6,2
03.0
6
,133
.4
3,1
80.9
3
,262
.3
3,5
20.1
3.
Lo
ans
and
Ad
vanc
es b
y S
tate
Go
vern
men
ts (i
+ ii
) 9
,808
.6
7,9
83.7
6
,177
.5
8,8
18.6
4
1,24
1.6
17,
164.
5 1
6,32
2.5
19,
414.
9 1
8,98
2.6
(i)
S
oci
al S
ervi
ces
(a t
o d
) 7
,509
.2
6,6
69.2
5
,916
.3
8,6
84.3
9
,642
.2
16,
460.
1 1
5,60
7.9
18,
023.
6 1
8,39
0.9
(a)
Ed
ucat
ion
42.
4 3
2.5
25.
4 1
25.8
4
7.8
379
.3
94.
8 6
57.0
9
09.2
(b
) H
ousi
ng 1
,715
.3
2,0
26.1
6
39.2
2
,267
.7
693
.6
2,2
05.6
7
67.8
1
,770
.1
760
.6
(c)
Hou
sing
(Gov
ernm
ent
serv
ants
) 9
46.1
1
,158
.3
1,1
63.9
1
,332
.1
1,5
93.1
1
,116
.2
1,5
74.5
1
,607
.2
1,4
20.9
(d
) O
ther
s 4
,805
.3
3,4
52.3
4
,087
.8
4,9
58.7
7
,307
.7
12,
759.
0 1
3,17
0.8
13,
989.
4 1
5,30
0.1
(ii
) E
cono
mic
Ser
vice
s (a
+ b
) 2
,299
.4
1,3
14.5
2
61.2
1
34.3
3
1,59
9.3
704
.5
714
.6
1,3
91.3
5
91.7
(a
) R
ural
Dev
elop
men
t 5
.3
6.1
4
.2
4.0
3
.7
3.8
5
7.8
7.8
7
.8
(b)
Food
Sto
rage
and
War
ehou
sing
2,2
94.1
1
,308
.4
256
.9
130
.3
31,
595.
6 7
00.6
6
56.8
1
,383
.5
583
.9
Tota
l So
cial
Sec
tor
Exp
end
itur
e (1
+2+
3) 6
,02,
942.
7 6
,79,
201.
1 8
,30,
060.
0 9
,68,
936.
4 11
,28,
188.
3 12
,00,
934.
1 15
,25,
208.
6 15
,44,
801.
8 1
6,79
,941
.8
RE
: Rev
ised
Est
imat
es.
B
E: B
udge
t E
stim
ates
. *
: In
clud
es e
xpen
ditu
re o
n so
cial
ser
vice
s, r
ural
dev
elop
men
t and
food
sto
rage
and
war
ehou
sing
und
er re
venu
e ex
pen
ditu
re, c
apita
l out
lay
and
loan
s an
d a
dva
nces
by
the
Sta
te G
over
nmen
ts.
No
te:
Dat
a fr
om 2
017-
18 o
nwar
ds
incl
ude
Del
hi a
nd P
uduc
herr
y al
so.
So
urce
: B
udge
t d
ocum
ents
of t
he s
tate
gov
ernm
ents
. Det
ails
in m
etho
dol
ogy.

State Finances : A Study of Budgets of 2019-20
96
Ap
pen
dix
Tab
le 8
: Dec
om
po
siti
on
of
Gro
ss F
isca
l Defi
cit
(` C
rore
)
Year
Rev
enue
Defi
cit
Cap
ital
Out
lay
Net
Lend
ing
No
n-d
ebt
Cap
ital
Rec
eip
ts
GFD
(2+
3+4-
5)P
er c
ent
to G
FD
Rev
enue
Defi
cit
Cap
ital
Out
lay
Net
Lend
ing
No
n-d
ebt
Cap
ital
R
ecei
pts
Tota
l(7
+8+
9-10
)
12
34
56
78
910
11
2002
-03
57,1
78.9
35,6
55.1
6,89
2.4
-99
,726
.457
.335
.86.
9-
100.
0
2003
-04
63,4
06.5
51,5
72.8
5,65
0.0
-1,
20,6
29.4
52.6
42.8
4.7
-10
0.0
2004
-05
39,1
57.8
60,1
33.1
8,48
3.1
-1,
07,7
74.0
36.3
55.8
7.9
-10
0.0
2000
-05
(Avg
.)55
,091
.441
,855
.75,
115.
5-
1,02
,062
.754
.640
.54.
9-
100.
0
2005
-06
7,01
2.8
77,5
59.5
5,52
0.9
8.7
90,0
84.5
7.8
86.1
6.1
-10
0.0
2006
-07
-24,
857.
298
,063
.26,
207.
31,
905.
777
,507
.6-3
2.1
126.
58.
02.
510
0.0
2007
-08
-42,
942.
71,
18,8
62.1
6,49
0.5
6,95
5.2
75,4
54.7
-56.
915
7.5
8.6
9.2
100.
0
2008
-09
-12,
672.
21,
42,6
27.7
4,89
9.4
265.
61,
34,5
89.3
-9.4
106.
03.
60.
210
0.0
2009
-10
31,0
17.4
1,49
,214
.69,
399.
281
2.4
1,88
,818
.716
.479
.05.
00.
410
0.0
2005
-201
0 (A
vg.)
-8,4
88.4
1,17
,265
.46,
503.
51,
989.
61,
13,2
91.0
-14.
811
1.0
6.3
2.5
100.
0
2010
-11
-3,0
50.6
1,51
,931
.513
,821
.41,
241.
31,
61,4
61.1
-1.9
94.1
8.6
0.8
100.
0
2011
-12
-23,
960.
51,
71,2
45.1
21,7
33.8
665.
11,
68,3
53.4
-14.
210
1.7
12.9
0.4
100.
0
2012
-13
-20,
322.
11,
93,1
81.4
22,7
11.9
100.
81,
95,4
70.3
-10.
498
.811
.60.
110
0.0
2013
-14
10,5
63.2
2,20
,552
.817
,096
.736
0.4
2,47
,852
.24.
389
.06.
90.
110
0.0
2014
-15
45,7
04.4
2,71
,909
.710
,722
.41,
145.
83,
27,1
90.8
14.0
83.1
3.3
0.4
100.
0
2010
-201
5 (A
vg.)
1,78
6.9
2,01
,764
.117
,217
.270
2.7
2,20
,065
.50.
891
.77.
80.
310
0.0
2015
-16
5,38
1.7
3,33
,383
.783
,039
.21,
134.
24,
20,6
70.4
1.3
79.3
19.7
0.3
100.
0
2016
-17
40,4
91.2
3,92
,188
.51,
02,0
31.3
379.
15,
34,3
31.8
7.6
73.4
19.1
0.1
100.
0
2017
-18
18,8
39.3
3,93
,620
.7-1
,791
.317
4.4
4,10
,494
.34.
695
.9-0
.4-
100.
0
2018
-19
(BE
)-3
3,50
7.6
5,43
,773
.1-1
8,71
6.9
1,19
3.1
4,90
,355
.4-6
.811
0.9
-3.8
0.2
100.
0
2018
-19
(RE
)12
,797
.25,
43,6
30.2
-708
.223
8.4
5,55
,480
.92.
397
.9-0
.1-
100.
0
2019
-20
(BE
)-8
,118
.45,
81,3
49.9
-18,
876.
61,
925.
85,
52,4
29.1
-1.5
105.
2-3
.40.
310
0.0
Avg
.: A
vera
ge.
'–'
: N
eglig
ible
/Nil.
RE
: Rev
ised
Est
imat
es.
BE
: Bud
get
Est
imat
es.
No
te :
1. N
egat
ive
(–) s
ign
ind
icat
es s
urp
lus
in d
efici
t in
dic
ator
s.
2. D
ata
from
201
7-18
onw
ard
s in
clud
e D
elhi
and
Pud
uche
rry
also
.S
our
ce :
Bud
get
doc
umen
ts o
f the
sta
te g
over
nmen
ts. D
etai
ls in
met
hod
olog
y.

Appendix Tables
97
Ap
pen
dix
Tab
le 9
: Fin
anci
ng o
f G
ross
Fis
cal D
efici
t(`
Cro
re)
Year
Mar
ket
Bor
row
ings
Loan
sfr
omC
entr
e
Spec
ial
Secu
ritie
sis
sued
toN
SSF
Loa
ns fr
om
LIC
, NA
BA
RD
, N
CD
C,
SBI a
ndO
ther
Ban
ks
Pro
vide
nt
Fund
s,et
c.
Res
erve
Fund
sD
epos
its and
Adv
ance
s
Susp
ense
and
Mis
cella
neou
s
Rem
ittan
ces
Oth
ers
Ove
rall
Surp
lus(
–)/
Defi
cit (
+)(1
3+14
+15)
Incr
ease
(-)/
Dec
reas
e (+)
in C
ash
Bal
ance
With
draw
al
from
(+)/
Add
ition
to
(-) C
ash
Bal
ance
In
vest
men
tA
ccou
nt
Incr
ease
(+)/
Dec
reas
e (-
)in
WM
A/O
Dfr
om R
BI
Gro
ssFi
scal
Defi
cit
(GFD
)
12
34
56
78
910
1112
1314
1516
2002
-03
28,4
84.0
-372
.148
,966
.44,
858.
09,
862.
94,
798.
871
1.4
1,21
1.9
93.3
5,40
2.7
-4,2
90.5
5,05
7.0
-2,7
62.0
-6,9
06.5
99,7
26.8
2003
-04
47,2
86.5
13,9
40.0
18,0
03.0
4,13
2.0
9,32
5.3
6,37
7.0
-374
.0-3
,651
.01,
850.
024
,268
.1-5
25.8
1,71
3.0
-1,7
77.9
-460
.91,
20,6
31.0
2004
-05
34,5
58.6
-9,7
81.0
64,1
92.4
26*
8,88
2.9
7,12
7.0
8,07
3.9
-2,6
22.7
1,23
9.5
6,33
5.1
-10,
231.
9-6
50.6
-8,0
26.3
-1,7
81.9
1,07
,773
.9
2000
-05
(Avg
.)28
,019
.44,
601.
239
,883
.23,
970.
210
,272
.75,
184.
64,
108.
7-1
,031
.875
7.6
9,07
8.7
-2,7
76.4
926.
6-2
,418
.2-1
,411
.61,
02,0
62.9
2005
-06
15,3
04.8
-44.
073
,815
.44,
055.
310
,463
.35,
228.
57,
262.
37,
911.
051
.5-1
6.8
-33,
946.
71,
826.
7-3
4,76
0.7
-1,0
12.7
90,0
84.5
2006
-07
13
,082
.7-8
,887
.456
,023
.23,
936.
610
,369
.77,
634.
212
,796
.04,
674.
9-3
05.0
-5,4
92.9
-16,
324.
44,
782.
6-2
1,27
5.1
168.
177
,507
.6
2007
-08
53,9
24.8
-933
.25,
853.
26,
300.
012
,338
.4-5
,922
.813
,581
.03,
738.
41,
253.
7-1
,268
.5-1
3,41
0.3
8,79
3.3
-22,
160.
1-4
3.5
75,4
54.7
2008
-09
1,04
,041
.4-7
61.3
1,47
9.0
5,69
7.8
15,6
40.8
7,54
1.9
4,59
4.4
8,79
9.9
-1,5
21.9
-1,9
64.0
-8,9
58.7
15,8
02.0
-24,
458.
3-3
02.5
1,34
,589
.3
2009
-10
1,12
,648
.0-1
,699
.624
,157
.68,
210.
023
,140
.4-1
,993
.212
,371
.45,
869.
52,
974.
7-4
,556
.87,
696.
638
5.5
7,24
1.6
69.5
1,88
,818
.7
2005
-10
(Avg
.)59
,800
.4-2
,465
.132
,265
.75,
639.
914
,390
.52,
497.
710
,121
.06,
198.
749
0.6
-2,6
59.8
-12,
988.
76,
318.
0-1
9,08
2.5
-224
.21,
13,2
91.0
2010
-11
88,7
75.9
711.
438
,626
.13,
196.
427
,807
.52,
614.
922
,860
.728
3.0
-892
.1-7
,677
.5-1
4,84
5.1
355.
6-1
6,12
9.9
929.
01,
61,4
61.1
2011
-12
1,35
,396
.117
9.9
-8,0
64.4
5,63
5.6
26,6
50.9
12,1
76.9
17,6
87.4
1,19
0.1
-476
.9-5
,717
.7-1
6,30
4.5
-9,6
30.9
-5,9
05.7
-767
.91,
68,3
53.4
2012
-13
1,46
,248
.71,
730.
4-1
73.3
5,27
9.6
25,7
76.6
9,15
2.3
30,9
60.5
4,13
5.6
149.
7-4
,706
.0-2
3,08
3.7
4,00
0.1
-27,
547.
746
3.9
1,95
,470
.3
2013
-14
1,63
,573
.060
1.4
2,55
7.1
4,73
9.8
26,4
33.4
11,5
07.9
28,2
08.2
-10,
337.
81,
438.
21,
033.
618
,097
.5-1
,994
.419
,243
.384
8.6
2,47
,852
.2
2014
-15
2,06
,441
.496
2.8
24,0
00.5
4,08
2.3
27,0
15.0
525.
729
,449
.04,
179.
03,
146.
49,
671.
217
,717
.33,
313.
111
,324
.03,
080.
23,
27,1
90.8
2010
-15
(Avg
.)1,
48,0
87.0
837.
211
,389
.24,
586.
826
,736
.77,
195.
525
,833
.2-1
10.0
673.
1-1
,479
.3-3
,683
.7-7
91.3
-3,8
03.2
910.
82,
20,0
65.5
2015
-16
2,58
,367
.01,
039.
127
,097
.016
,513
.333
,045
.830
9.1
23,2
29.8
-103
.2-6
15.3
92,4
04.0
-30,
616.
24,
349.
4-3
1,60
2.8
-3,3
62.8
4,20
,670
.4
2016
-17
3,51
,672
.05,
228.
8-3
1,98
5.3
43,6
41.3
39,5
13.9
20,7
36.0
42,6
25.0
-28,
804.
0-2
,826
.01,
08,0
98.4
-13,
568.
3-9
,833
.1-6
83.6
-3,0
51.6
5,34
,331
.8
2017
-18
3,44
,615
.84,
634.
0-3
2,44
4.1
12,8
50.7
33,8
47.5
3,88
0.0
63,9
62.9
1,49
7.4
-1,7
76.2
-4,0
07.5
-16,
566.
3-3
,940
.2-1
3,61
9.7
993.
64,
10,4
94.3
2018
-19
(BE)
4,41
,190
.215
,313
.8-3
3,58
0.7
23,5
15.6
33,2
33.4
16,8
57.3
20,9
07.2
-9,7
65.3
-6,3
62.3
-4,9
51.0
-6,0
02.7
6,98
2.9
-13,
285.
730
0.0
4,90
,355
.4
2018
-19
(RE)
4,09
,292
.014
,638
.9-3
3,70
5.2
23,6
84.9
35,0
40.7
17,2
04.5
16,6
31.9
-13,
554.
1-2
0,36
2.1
-4,8
76.8
1,11
,486
.240
,548
.671
,107
.8-1
70.2
5,55
,480
.9
2019
-20
(BE)
4,85
,585
.618
,104
.4-3
4,89
3.8
27,4
42.6
32,6
94.7
15,5
32.0
1,39
5.5
1,04
7.6
-2,0
17.0
-10,
018.
417
,555
.816
,312
.8-9
32.0
2,17
5.0
5,52
,429
.1
RE:
Rev
ised
Est
imat
es.
B
E: B
udge
t Est
imat
es.
NS
SF
: Nat
iona
l Sm
all S
avin
gs F
und.
Avg.
: Ave
rage
.
* :
Tam
il N
adu
has
show
n a
nega
tive
figur
e of
`13
76 c
rore
und
er L
oans
from
NC
DC
on
acco
unt o
f adj
ustm
ent o
f Tam
il N
adu
Indu
stria
l Dev
elop
men
t Cor
pora
tion
(TID
CO
) bon
ds.
Not
e :
1. ‘
Oth
ers’
is a
res
idua
l ite
m a
nd in
clud
es, i
nter
alia
, Con
tinge
ncy
Fund
s, a
pp
rop
riatio
n to
Con
tinge
ncy
Fund
s, In
ter-
Sta
te S
ettle
men
t, L
and
Com
pen
satio
n an
d O
ther
Bon
ds
and
Loa
ns fr
om F
inan
cial
In
stitu
tions
oth
er t
han
men
tione
d in
the
Tab
le.
2.
Due
to th
e ch
ange
in th
e ac
coun
ting
pro
ced
ure
from
199
9-20
00, L
oans
from
the
Cen
tre
excl
udes
Sta
tes’
sha
re in
sm
all s
avin
g co
llect
ions
whi
ch is
sho
wn
und
er S
ecur
ities
issu
ed to
the
NS
SF
und
er
Inte
rnal
Deb
t. A
ccor
din
gly,
rep
aym
ents
of
smal
l sav
ing
colle
ctio
ns in
clud
ed u
nder
rep
aym
ents
of
Loan
s to
Cen
tre
is n
ow s
how
n un
der
dis
char
ge o
f In
tern
al D
ebt
to h
ave
cons
iste
nt a
ccou
ntin
g fo
r re
ceip
ts a
nd e
xpen
ditu
re.
3.
All
figur
es a
re o
n a
net b
asis
.
4. A
s de
taile
d br
eak-
up o
f Dis
char
ge o
f Int
erna
l Deb
t for
Aru
nach
al P
rade
sh w
ere
not a
vaila
ble,
the
sam
e ha
s be
en in
clud
ed u
nder
‘Loa
ns fr
om O
ther
Inst
itutio
ns’.
5.
Dat
a fro
m 2
017-
18 o
nwar
ds in
clud
e D
elhi
and
Pud
uche
rry
also
.So
urce
:
Bud
get d
ocum
ents
of t
he s
tate
gov
ernm
ents
. Det
ails
in m
etho
dol
ogy.

State Finances : A Study of Budgets of 2019-20
98
Ap
pen
dix
Tab
le 1
0: F
inan
cing
of
Gro
ss F
isca
l Defi
cit
- A
s P
er c
ent
to T
ota
l(P
er c
ent)
Year
Mar
ket
Bor
row
ings
Loan
sfr
omC
entr
e
Spec
ial
Secu
ritie
sis
sued
toN
SSF
Loa
ns fr
om
LIC
, NA
BA
RD
, N
CD
C,
SBI a
ndO
ther
Ban
ks
Pro
vide
nt
Fund
s,et
c.
Res
erve
Fund
sD
epos
its and
Adv
ance
s
Susp
ense
and
Mis
cella
neou
s
Rem
ittan
ces
Oth
ers
Ove
rall
Surp
lus(
–)/
Defi
cit (
+)(1
3+14
+15)
Incr
ease
(-)/
Dec
reas
e (+)
in C
ash
Bal
ance
With
draw
al
from
(+)/
Add
ition
to
(-) C
ash
Bal
ance
In
vest
men
tA
ccou
nt
Incr
ease
(+)/
Dec
reas
e (-
)in
WM
A/O
Dfr
om R
BI
Gro
ssFi
scal
Defi
cit
(GFD
)
12
34
56
78
910
1112
1314
1516
2002
-03
28.6
-0.4
49.1
4.9
9.9
4.8
0.7
1.2
0.1
5.4
-4.3
5.1
-2.8
-6.9
100.
0
2003
-04
39.2
11.6
14.9
3.4
7.7
5.3
-0.3
-3.0
1.5
20.1
-0.4
1.4
-1.5
-0.4
100.
0
2004
-05
31.6
-10.
862
.2-*
7.2
6.5
7.4
-2.4
1.1
-12.
49.
60.
67.
31.
610
0.0
2000
-05
(Avg
.)26
.44.
340
.24.
010
.15.
04.
2-0
.80.
74.
71.
21.
10.
7-0
.710
0.0
2005
-06
17.0
-81
.94.
511
.65.
88.
18.
80.
1-
-37.
72.
0-3
8.6
-1.1
100.
0
2006
-07
16
.9-1
1.5
72.3
5.1
13.4
9.8
16.5
6.0
-0.4
-7.1
-21.
16.
2-2
7.4
0.2
100.
0
2007
-08
71.5
-1.2
7.8
8.3
16.4
-7.8
18.0
5.0
1.7
-1.7
-17.
811
.7-2
9.4
-0.1
100.
0
2008
-09
77.3
-0.6
1.1
4.2
11.6
5.6
3.4
6.5
-1.1
-1.5
-6.7
11.7
-18.
2-0
.210
0.0
2009
-10
59.7
-0.9
12.8
4.3
12.3
-1.1
6.6
3.1
1.6
-2.4
4.1
0.2
3.8
-10
0.0
2005
-10
(Avg
.)48
.5-2
.835
.25.
313
.02.
510
.55.
90.
4-2
.5-1
5.8
6.4
-21.
9-0
.210
0.0
2010
-11
55.0
0.4
23.9
2.0
17.2
1.6
14.2
0.2
-0.6
-4.8
-9.2
0.2
-10.
00.
610
0.0
2011
-12
80.4
0.1
-4.8
3.3
15.8
7.2
10.5
0.7
-0.3
-3.4
-9.7
-5.7
-3.5
-0.5
100.
0
2012
-13
74.8
0.9
-0.1
2.7
13.2
4.7
15.8
2.1
0.1
-2.4
-11.
82.
0-1
4.1
0.2
100.
0
2013
-14
66.0
0.2
1.0
1.9
10.7
4.6
11.4
-4.2
0.6
0.4
7.3
-0.8
7.8
0.3
100.
0
2014
-15
63.1
0.3
7.3
1.2
8.3
0.2
9.0
1.3
1.0
3.0
5.4
1.0
3.5
0.9
100.
0
2010
-15
(Avg
.)67
.9
0.4
5.5
2.2
13.0
3.7
12.2
-0.
2-1
.4-3
.6-0
.6-3
.30.
310
0.0
2015
-16
61.4
0.2
6.4
3.9
7.9
0.1
5.5
--0
.122
.0-7
.31.
0-7
.5-0
.810
0.0
2016
-17
65.8
1.0
-6.0
8.2
7.4
3.9
8.0
-5.4
-0.5
20.2
-2.5
-1.8
-0.1
-0.6
100.
0
2017
-18
84.0
1.1
-7.9
3.1
8.2
0.9
15.6
0.4
-0.4
-1.0
-4.0
-1.0
-3.3
0.2
100.
0
2018
-19
(BE)
90.0
3.1
-6.8
4.8
6.8
3.4
4.3
-2.0
-1.3
-1.0
-1.2
1.4
-2.7
0.1
100.
0
2018
-19
(RE)
73.7
2.6
-6.1
4.3
6.3
3.1
3.0
-2.4
-3.7
-0.9
20.1
7.3
12.8
-10
0.0
2019
-20
(BE)
87.9
3.3
-6.3
5.0
5.9
2.8
0.3
0.2
-0.4
-1.8
3.2
3.0
-0.2
0.4
100.
0
RE:
Rev
ised
Est
imat
es.
BE:
Bud
get E
stim
ates
.
N
SS
F : N
atio
nal S
mal
l Sav
ings
Fun
d.
Avg.
: Ave
rage
.
‘-
’ : N
il/N
eglig
ible
/Not
App
licab
le.
* :
Tam
il N
adu
has
show
n a
nega
tive
figur
e of
`13
76 c
rore
und
er L
oans
from
NC
DC
on
acco
unt o
f adj
ustm
ent o
f Tam
il N
adu
Indu
stria
l Dev
elop
men
t Cor
pora
tion
(TID
CO
) bon
ds.
Not
e :
1. S
ame
as in
App
endi
x Ta
ble
9.
2.
Dat
a fro
m 2
017-
18 o
nwar
ds in
clud
e D
elhi
and
Pud
uche
rry
also
.So
urce
: B
udge
t doc
umen
ts o
f the
sta
te g
over
nmen
ts. D
etai
ls in
met
hod
olog
y.

Appendix Tables
99
Ap
pen
dix
Tab
le 1
1: C
om
po
siti
on
of
Out
stan
din
g L
iab
iliti
es o
f S
tate
Go
vern
men
ts(A
s at
end
-Mar
ch)
(` C
rore
)
Year
Mar
ket
Loan
sPo
wer
Bon
dsU
DAY
Com
pen-
satio
nan
d O
ther
Bon
ds
NSS
FW
MA
from RB
I
Loan
sfr
om LIC
Loan
sfr
om GIC
Loan
sfr
omN
ABAR
D
Loan
sfr
om S
BI
and
Oth
er
bank
s
Loan
sfr
omN
CD
C
Loan
sfr
om
Oth
erIn
stitu
-tio
ns
Loan
s fr
omB
anks
and FI
s
Tota
lIn
tern
alD
ebt
Loan
s an
dAd
vanc
esfr
om
Cen
tre
Prov
iden
t Fu
nds,
etc.
Res
erve
Fund
Dep
osit
and
Adva
nces
(Net
Ba
lanc
es)
Con
ti -ge
ncy
Fund
Tota
lO
utst
and- ing
Liab
ilitie
s
12
34
56
78
910
1112
1314
= s
um
(8 to
13)
15 =
sum
(2
to 7
)+14
1617
1819
2021
= s
um
(15
to 2
0)
2002
1,04
,027
.0–
–59
.190
,226
.19,
419.
05,
085.
1-
8,96
9.4
7,13
9.4
1,62
1.7
18,0
78.5
40,8
94.0
2,44
,625
.22,
49,5
51.4
1,03
,815
.327
,389
.064
,324
.51,
041.
66,
90,7
47.1
2003
1,33
,066
.0–
–62
.71,
39,1
92.5
2,51
2.5
6,62
0.7
-11
,545
.87,
896.
01,
611.
223
,524
.451
,198
.23,
26,0
31.8
2,49
,179
.31,
13,6
78.1
32,1
87.8
65,0
36.0
313.
97,
86,4
26.9
2004
1,79
,916
.728
,983
.8–
82.1
1,98
,453
.93,
375.
48,
967.
01,
007.
911
,285
.58,
221.
63,
071.
033
,407
.565
,960
.44,
76,7
72.3
1,92
,981
.21,
21,8
41.1
42,2
17.0
69,1
16.0
246.
19,
03,1
73.7
2005
2,13
,479
.529
,882
.9–
83.2
2,82
,199
.71,
498.
011
,994
.399
0.3
8,22
6.2
9,48
6.1
1,57
6.7
35,6
47.6
67,9
21.3
5,95
,064
.51,
60,0
45.1
1,30
,828
.152
,311
.275
,290
.352
7.3
10,1
4,06
6.5
2006
2,28
,924
.831
,581
.3–
82.2
3,65
,932
.840
6.9
12,6
08.8
989.
511
,654
.09,
680.
11,
195.
435
,717
.671
,845
.46,
98,7
73.4
1,57
,003
.91,
40,8
06.2
63,1
19.8
86,6
91.4
1,32
1.8
11,4
7,71
6.6
2007
2,42
,777
.226
,050
.7–
81.8
4,25
,309
.029
9.0
12,1
97.3
970.
915
,622
.29,
176.
11,
117.
930
,253
.269
,337
.77,
63,8
55.4
1,46
,652
.61,
49,9
20.1
78,7
61.2
1,01
,067
.81,
319.
412
,41,
576.
4
2008
2,98
,507
.823
,143
.5–
80.5
4,30
,879
.125
4.6
11,5
33.8
927.
420
,866
.89,
295.
21,
175.
427
,639
.671
,438
.38,
24,3
03.7
1,45
,098
.21,
61,9
71.7
78,2
64.7
1,16
,591
.22,
072.
713
,28,
302.
2
2009
4,01
,923
.721
,690
.6–
79.5
4,31
,915
.437
2.3
10,8
41.7
905.
427
,429
.19,
099.
31,
189.
128
,315
.577
,780
.09,
33,7
61.5
1,43
,870
.21,
77,4
34.0
83,9
27.0
1,28
,349
.72,
852.
614
,70,
195.
1
2010
5,15
,785
.218
,783
.7–
78.5
4,55
,015
.448
1.3
9,70
0.5
882.
934
,809
.710
,163
.31,
323.
526
,602
.283
,482
.210
,73,
626.
31,
43,1
51.7
2,00
,560
.594
,350
.01,
34,5
26.6
2,43
3.3
16,4
8,64
8.5
2011
6,04
,094
.414
,423
.5–
78.2
4,94
,644
.41,
410.
49,
509.
177
7.6
40,8
09.8
5,94
1.7
1,56
5.0
23,1
15.1
81,7
18.2
11,9
6,36
9.1
1,44
,169
.92,
28,2
35.3
1,03
,172
.01,
53,6
55.9
3,37
4.3
18,2
8,97
6.5
2012
7,41
,147
.911
,535
.1–
75.0
4,86
,417
.860
9.9
8,65
2.5
709.
147
,529
.95,
477.
41,
631.
519
,082
.383
,082
.713
,22,
868.
41,
43,5
47.7
2,53
,445
.891
,936
.31,
78,9
76.6
3,14
1.5
19,9
3,91
6.3
2013
8,74
,602
.78,
665.
1–
75.0
4,86
,753
.655
3.7
7,90
8.5
640.
654
,172
.64,
983.
81,
526.
915
,952
.085
,184
.314
,55,
834.
51,
44,8
12.4
2,79
,365
.01,
31,5
58.0
1,95
,229
.53,
446.
222
,10,
245.
6
2014
10,5
0,36
9.1
7,23
0.2
–76
.74,
89,2
30.0
1,40
2.3
7,23
4.0
577.
760
,446
.63,
558.
31,
909.
015
,033
.588
,759
.016
,37,
067.
41,
45,8
09.4
3,05
,796
.51,
49,4
96.4
2,29
,994
.03,
099.
724
,71,
263.
5
2015
12,6
9,19
6.7
2,90
6.8
–14
3.8
5,13
,215
.34,
482.
55,
914.
948
4.8
61,5
67.3
1,14
2.6
1,73
8.0
23,9
06.7
94,7
54.3
18,8
4,69
9.4
1,47
,166
.83,
20,0
85.2
99,5
92.8
2,46
,094
.46,
121.
027
,03,
759.
6
2016
15,1
6,07
1.2
–98
,960
.020
,029
.55,
40,1
89.8
57.1
5,67
5.9
466.
385
,345
.181
2.3
1,81
7.9
46,0
97.0
1,40
,214
.623
,15,
522.
21,
48,2
17.4
3,52
,210
.71,
38,4
61.1
2,59
,541
.74,
172.
832
,18,
125.
9
2017
18,5
7,11
0.2
–2,
08,0
56.0
19,9
91.8
5,07
,833
.684
2.9
4,88
3.7
419.
21,
00,5
05.5
30,0
92.5
2,02
6.1
60,6
43.7
1,98
,570
.727
,92,
405.
21,
53,4
63.1
4,06
,154
.71,
22,6
53.5
3,30
,211
.84,
469.
138
,09,
357.
3
2018
22,0
6,10
6.6
–2,
03,9
05.8
19,8
95.4
4,75
,675
.91,
775.
34,
095.
936
5.2
1,14
,130
.329
,246
.02,
852.
561
,254
.32,
11,9
44.3
31,1
9,30
3.3
1,62
,011
.44,
40,4
84.2
1,76
,143
.33,
90,4
65.3
4,08
7.7
42,9
2,49
5.3
2019
RE
25,6
1,38
6.8
–1,
97,2
70.1
19,9
62.4
4,41
,970
.71,
605.
13,
344.
336
5.2
1,39
,496
.628
,345
.12,
823.
861
,468
.52,
35,8
43.4
34,5
8,03
8.4
1,76
,650
.34,
75,5
25.0
1,93
,347
.94,
07,0
97.2
4,33
8.3
47,1
4,99
7.0
2020
BE
30,4
6,97
2.4
–1,
97,2
70.1
19,9
62.4
4,07
,076
.93,
780.
12,
676.
936
5.2
1,68
,120
.427
,381
.53,
273.
556
,654
.12,
58,4
71.7
39,3
3,53
3.4
1,94
,754
.85,
08,2
19.7
2,08
,879
.94,
08,4
92.7
4,58
8.3
52,5
8,46
8.7
RE
: Rev
ised
Est
imat
es.
B
E : B
udge
t Est
imat
es.
'–
' : N
ot a
pplic
able
/Not
ava
ilabl
e/ne
glig
ible
.N
ote:
1.
From
199
7 to
200
3, ‘L
oans
from
Oth
er In
stitu
tions
’ als
o in
clud
es ‘O
ther
Loa
ns’ a
nd ‘L
oans
from
GIC
’. Fr
om 2
004,
‘Loa
ns fr
om O
ther
Inst
itutio
ns’ i
nclu
des
‘Oth
er L
oans
’.
2. A
s de
taile
d br
eak-
up o
f Dis
char
ge o
f Int
erna
l Deb
t for
Aru
nach
al P
rade
sh w
as n
ot a
vaila
ble,
the
sam
e ha
s be
en in
clud
ed u
nder
‘Loa
ns fr
om O
ther
Inst
itutio
ns’.
3.
Als
o se
e ‘E
xpla
nato
ry N
ote
on D
ata
Sou
rces
and
Met
hodo
logy
’.
4. D
ata
from
201
7-18
onw
ards
incl
ude
Del
hi a
nd P
uduc
herr
y al
so.
Sour
ce: B
udge
t doc
umen
ts o
f the
sta
te g
over
nmen
ts. D
etai
ls in
met
hodo
logy
.

State Finances : A Study of Budgets of 2019-20
100
Ap
pen
dix
Tab
le 1
2: C
om
po
siti
on
of
Out
stan
din
g L
iab
iliti
es o
f S
tate
Go
vern
men
ts -
As
Pro
po
rtio
n to
To
tal
(As
at e
nd-M
arch
)(P
er c
ent)
Year
Mar
ket
Loan
sPo
wer
Bon
dsU
DAY
Com
pen-
satio
nan
d O
ther
Bon
ds
NSS
FW
MA
from RB
I
Loan
sfr
om LIC
Loan
sfr
om GIC
Loan
sfr
omN
ABAR
D
Loan
sfr
om S
BI
and
Oth
er
bank
s
Loan
sfr
omN
CD
C
Loan
sfr
om
Oth
erIn
stitu
-tio
ns
Loan
s fr
omB
anks
and FI
s
Tota
lIn
tern
alD
ebt
Loan
s an
dAd
vanc
esfr
om
Cen
tre
Prov
iden
t Fu
nds,
etc.
Res
erve
Fund
Dep
osit
and
Adva
nces
(Net
Ba
lanc
es)
Con
ti -ge
ncy
Fund
Tota
lO
utst
and- ing
Liab
ilitie
s
12
34
56
78
910
1112
1314
= s
um
(8 to
13)
15 =
sum
(2
to 7
)+14
1617
1819
2021
= s
um
(15
to 2
0)
2002
15.
1 -
-
- 1
3.1
1.4
0
.7
-
1.3
1
.0
0.2
2
.6
5.9
3
5.4
36.
1 1
5.0
4.0
9
.3
0.2
1
00.0
2003
16.
9 -
-
- 1
7.7
0.3
0
.8
-
1.5
1
.0
0.2
3
.0
6.5
4
1.5
31.
7 1
4.5
4.1
8
.3
- 1
00.0
2004
19.
9 3
.2
--
22.
0 0
.4
1.0
0
.1
1.2
0
.9
0.3
3
.7
7.3
5
2.8
21.
4 1
3.5
4.7
7
.7
- 1
00.0
2005
21.
1 2
.9
--
27.
8 0
.1
1.2
0
.1
0.8
0
.9
0.2
3
.5
6.7
5
8.7
15.
8 1
2.9
5.2
7
.4
0.1
1
00.0
2006
19.
9 2
.8
--
31.
9 -
1.1
0
.1
1.0
0
.8
0.1
3
.1
6.3
6
0.9
13.
7 1
2.3
5.5
7
.6
0.1
1
00.0
2007
19.
6 2
.1
--
34.
3 -
1.0
0
.1
1.3
0
.7
0.1
2
.4
5.6
6
1.5
11.
8 1
2.1
6.3
8
.1
0.1
1
00.0
2008
22.
5 1
.7
--
32.
4 -
0.9
0
.1
1.6
0
.7
0.1
2
.1
5.4
6
2.1
10.
9 1
2.2
5.9
8
.8
0.2
1
00.0
2009
27.
3 1
.5
--
29.
4 -
0.7
0
.1
1.9
0
.6
0.1
1
.9
5.3
6
3.5
9.8
1
2.1
5.7
8
.7
0.2
1
00.0
2010
31.
3 1
.1
--
27.
6 -
0.6
0
.1
2.1
0
.6
0.1
1
.6
5.1
6
5.1
8.7
1
2.2
5.7
8
.2
0.1
1
00.0
2011
33.
0 0
.8
--
27.
0 0
.1
0.5
-
2.2
0
.3
0.1
1
.3
4.5
6
5.4
7.9
1
2.5
5.6
8
.4
0.2
1
00.0
2012
37.
2 0
.6
--
24.
4 -
0.4
-
2.4
0
.3
0.1
1
.0
4.2
6
6.3
7.2
1
2.7
4.6
9
.0
0.2
1
00.0
2013
39.
6 0
.4
--
22.
0 -
0.4
-
2.5
0
.2
0.1
0
.7
3.9
6
5.9
6.6
1
2.6
6.0
8
.8
0.2
1
00.0
2014
42.
5 0
.3
--
19.
8 0
.1
0.3
-
2.4
0
.1
0.1
0
.6
3.6
6
6.2
5.9
1
2.4
6.0
9
.3
0.1
1
00.0
2015
46.
9 0
.1
--
19.
0 0
.2
0.2
-
2.3
-
0.1
0
.9
3.5
6
9.7
5.4
1
1.8
3.7
9
.1
0.2
1
00.0
2016
47.
1 -
3
.1
0.6
1
6.8
- 0
.2
- 2
.7
- 0
.1
1.4
4
.4
72.
0 4
.6
10.
9 4
.3
8.1
0
.1
100
.0
2017
48.
8 -
5
.5
0.5
1
3.3
- 0
.1
- 2
.6
0.8
0
.1
1.6
5
.2
73.
3 4
.0
10.
7 3
.2
8.7
0
.1
100
.0
2018
51.
4 -
4
.8
0.5
1
1.1
- 0
.1
- 2
.7
0.7
0
.1
1.4
4
.9
72.
7 3
.8
10.
3 4
.1
9.1
0
.1
100
.0
2019
RE
54.
3 -
4
.2
0.4
9
.4
- 0
.1
- 3
.0
0.6
0
.1
1.3
5
.0
73.
3 3
.7
10.
1 4
.1
8.6
0
.1
100
.0
2020
BE
57.
9 -
3
.8
0.4
7
.7
0.1
0
.1
- 3
.2
0.5
0
.1
1.1
4
.9
74.
8 3
.7
9.7
4
.0
7.8
0
.1
100
.0
RE
: Rev
ised
Est
imat
es.
B
E : B
udge
t Est
imat
es.
'–
' : N
ot a
pplic
able
/Not
ava
ilabl
e/ne
glig
ible
.N
ote:
1. F
rom
199
7 to
200
3, ‘L
oans
from
Oth
er In
stitu
tions
’ als
o in
clud
es ‘O
ther
Loa
ns’ a
nd ‘L
oans
from
GIC
’. Fr
om 2
004,
‘Loa
ns fr
om O
ther
Inst
itutio
ns’ i
nclu
des
‘Oth
er L
oans
’.
2. A
s de
taile
d br
eak-
up o
f Dis
char
ge o
f Int
erna
l Deb
t for
Aru
nach
al P
rade
sh w
as n
ot a
vaila
ble,
the
sam
e ha
s be
en in
clud
ed u
nder
‘Loa
ns fr
om O
ther
Inst
itutio
ns’.
3.
Als
o se
e ‘E
xpla
nato
ry N
ote
on D
ata
Sou
rces
and
Met
hodo
logy
’.
4. D
ata
from
201
7-18
onw
ards
incl
ude
Del
hi a
nd P
uduc
herr
y al
so.
Sour
ce: B
udge
t doc
umen
ts o
f the
sta
te g
over
nmen
ts. D
etai
ls in
met
hodo
logy
.

Appendix Tables
101
Appendix Table 13: State Government Market Borrowings(` Crore)
Year Gross Allocation Repayments Net Allocation
1 2 3 4
1990-91 2,570.0 - 2,570.0
1991-92 3,360.0 - 3,360.0
1992-93 3,810.0 330.0 3,470.0
1993-94 4,150.0 510.0 3,640.0
1994-95 5,120.0 - 5,120.0
1995-96 6,270.0 340.0 5,930.0
1996-97 6,540.0 - 6,540.0
1997-98 7,750.0 560.0 7,190.0
1998-99 12,110.0 1,410.0 10,700.0
1999-00 13,710.0 1,300.0 12,410.0
2000-01 13,300.0 420.0 12,880.0
2001-02 18,710.0 1,450.0 17,260.0
2002-03* 30,850.0 1,790.0 29,060.0
2003-04* 50,520.0 4,150.0 46,380.0
2004-05* 39,100.0 5,120.0 33,980.0
2005-06 21,730.0 6,270.0 15,450.0
2006-07 26,600.0 6,550.0 20,050.0
2007-08 80,570.0 11560.0# 69,020.0
2008-09 1,29,080.0 14,370.0 1,14,710.0
2009-10 1,18,190.0 16,240.0 1,04,940.0
2010-11 1,57,200.0 15,640.0 1,42,160.0
2011-12 1,67,860.0 21,990.0 1,45,870.0
2012-13 2,18,710.0 30,630.0 1,88,080.0
2013-14 2,50,610.0 32,080.0 2,18,530.0
2014-15 2,69,840.0 33,380.0 2,36,460.0
2015-16 $ - 33,370.4 -
2016-17 - 39,290.0 -
2017-18 - 78,818.8 -
2018-19 - 1,29,680.3 -
'–' : Nil.* : Include additional market borrowings of ₹100 billion for 2002-03, ₹266 billion for 2003-04 and ₹169 billion for 2004-05 under the debt swap scheme.# : Excluding ₹1.5 billion of buy-back of securities by Government of Odisha.$ : Ministry of Finance, Government of India has discontinued to provide gross/net allocation figures.Note : 1. Data from 2007-08 onwards includes the Union Territory of Puducherry. 2. Gross and net allocation from 2008-09 onwards includes additional allocations.Source : Reserve Bank records.


2019-20 Statements and Appendices

2019-20 Statements

2019-20 Statements


Statements
107
Sta
tem
ent
1: M
ajo
r Fi
scal
Ind
icat
ors
(Per
cen
t)
Stat
e/U
TO
wn
Rev
enue
/Rev
enue
E
xpen
dit
ure
Dev
elo
pm
ent
Exp
end
itur
e/A
gg
reg
ate
Dis
bur
sem
ent*
No
n-D
evel
op
men
tal E
xpen
dit
ure/
Ag
gre
gat
e D
isb
urse
men
t*
Inte
rest
Pay
men
t/R
even
ue
Exp
end
itur
e
2017
-18
(Acc
ount
s)20
18-1
9(R
E)
2019
-20
(BE
)20
17-1
8(A
ccou
nts)
2018
-19
(RE
)20
19-2
0(B
E)
2017
-18
(Acc
ount
s)20
18-1
9(R
E)
2019
-20
(BE
)20
17-1
8(A
ccou
nts)
2018
-19
(RE
)20
19-2
0(B
E)
12
34
56
78
910
1112
13
1.
And
hra
Pra
des
h46
.449
.945
.966
.766
.872
.226
.824
.921
.911
.411
.39.
6
2.
Aru
nach
al P
rad
esh
19.4
15.0
18.6
68.4
74.6
60.3
27.4
22.3
36.2
4.3
3.9
4.7
3.
Ass
am35
.238
.633
.362
.570
.568
.434
.325
.627
.95.
85.
16.
0
4.
Bih
ar32
.425
.226
.470
.172
.771
.026
.523
.425
.38.
87.
26.
9
5.
Chh
attis
garh
50.4
38.6
41.4
77.0
80.4
77.8
19.5
17.2
19.4
5.5
4.8
6.0
6.
Goa
76.1
70.1
69.2
64.9
69.3
67.5
29.2
25.2
27.2
11.8
11.7
11.5
7.
Guj
arat
75.1
68.6
69.6
64.4
66.0
63.6
26.7
25.6
28.0
16.1
14.6
14.2
8.
Har
yana
69.5
70.7
65.0
66.7
65.9
63.4
30.0
28.5
31.2
16.3
16.2
17.6
9.
Him
acha
l Pra
des
h36
.827
.528
.758
.461
.659
.932
.630
.932
.814
.012
.312
.6
10.
Jam
mu
and
Kas
hmir
37.0
25.8
28.5
61.6
68.0
66.9
32.4
28.9
30.6
11.4
9.7
12.0
11.
Jhar
khan
d43
.849
.852
.370
.071
.472
.625
.724
.222
.99.
18.
87.
9
12.
Kar
nata
ka67
.962
.660
.573
.171
.370
.819
.020
.922
.09.
89.
410
.5
13.
Ker
ala
59.4
59.5
66.2
48.9
48.3
49.7
39.1
39.8
37.9
15.1
13.8
13.9
14.
Mad
hya
Pra
des
h45
.341
.344
.472
.969
.971
.219
.521
.020
.78.
58.
18.
1
15.
Mah
aras
htra
78.0
68.3
68.1
61.0
62.5
60.9
27.9
24.4
27.1
13.7
11.3
10.5
16.
Man
ipur
14.9
10.0
11.5
57.6
64.2
60.2
34.0
28.6
31.8
6.1
5.2
5.1
17.
Meg
hala
ya26
.820
.919
.667
.070
.970
.429
.626
.227
.07.
05.
45.
4
18.
Miz
oram
18.2
9.9
12.3
71.3
69.0
56.1
25.9
28.3
41.4
4.9
4.8
4.3
19.
Nag
alan
d13
.49.
28.
857
.354
.955
.538
.240
.339
.26.
76.
87.
0
20.
Od
isha
54.9
45.2
41.8
74.7
73.3
73.2
21.3
22.1
22.4
6.9
6.4
6.0
21.
Pun
jab
57.3
52.2
52.3
40.9
49.1
53.7
48.0
39.2
32.9
24.5
19.8
19.6
22.
Raj
asth
an48
.047
.348
.669
.065
.866
.424
.526
.225
.513
.512
.612
.1
23.
Sik
kim
38.4
22.4
23.7
65.4
67.0
60.8
27.9
27.4
33.3
8.7
7.9
7.5
24.
Tam
il N
adu
63.9
62.5
65.1
59.8
57.6
55.2
30.2
29.8
31.2
15.5
14.4
15.3
25.
Tela
ngan
a77
.361
.076
.769
.974
.870
.926
.221
.222
.812
.79.
813
.1
26.
Trip
ura
22.7
20.6
21.6
60.6
62.1
62.0
36.1
33.3
32.9
8.6
7.2
7.0
27.
Utt
ar P
rad
esh
48.6
50.2
48.1
58.5
61.0
58.5
34.0
31.7
33.0
10.9
9.6
9.7
28.
Utt
arak
hand
43.5
53.3
48.8
55.4
54.7
56.9
35.9
36.1
34.8
13.7
14.1
13.7
29.
Wes
t B
enga
l43
.141
.143
.359
.261
.659
.829
.728
.228
.419
.918
.219
.0
30.
NC
T D
elhi
108.
197
.996
.774
.270
.773
.719
.017
.314
.28.
57.
27.
1
31.
Pud
uche
rry
66.2
65.3
64.8
62.5
62.8
62.9
29.0
29.0
30.3
11.8
10.5
12.7
All
Sta
tes
and
UTs
56
.051
.952
.664
.265
.264
.328
.226
.727
.412
.511
.111
.3
(Con
td...
)

State Finances : A Study of Budgets of 2019-20
108
Sta
tem
ent
1: M
ajo
r Fi
scal
Ind
icat
ors
(Con
cld
.)(P
er c
ent)
Stat
e/U
T
Inte
rest
Pay
men
t/R
even
ue
Rec
eip
tsC
om
mit
ted
Exp
end
itur
e/
Rev
enue
Exp
end
itur
eP
ensi
on/
Rev
enue
E
xpen
dit
ure
Gro
ss T
rans
fers
/Ag
gre
gat
e D
isb
urse
men
t
2017
-18
(Acc
ount
s)20
18-1
9(R
E)
2019
-20
(BE
)20
17-1
8(A
ccou
nts)
2018
-19
(RE
)20
19-2
0(B
E)
2017
-18
(Acc
ount
s)20
18-1
9(R
E)
2019
-20
(BE
)20
17-1
8(A
ccou
nts)
2018
-19
(RE
)20
19-2
0(B
E)
114
1516
1718
1920
2122
2324
25
1.
And
hra
Pra
des
h13
.212
.59.
630
.429
.422
.413
.412
.18.
033
.933
.143
.2
2.
Aru
nach
al P
rad
esh
3.4
2.7
3.0
28.4
23.6
26.2
8.5
6.0
7.1
79.3
82.5
82.8
3.
Ass
am5.
94.
75.
831
.226
.028
.614
.99.
811
.353
.055
.157
.8
4.
Bih
ar7.
76.
86.
130
.325
.127
.013
.910
.611
.962
.864
.369
.1
5.
Chh
attis
garh
5.2
5.3
5.9
19.9
17.0
19.3
7.0
5.8
6.3
47.0
46.3
51.5
6.
Goa
11.3
11.5
11.1
30.9
27.6
29.2
11.0
9.3
10.5
23.1
22.0
24.0
7.
Guj
arat
15.4
14.5
13.9
33.4
31.4
29.1
11.8
11.3
10.2
21.8
25.0
25.4
8.
Har
yana
19.1
18.0
20.2
34.6
32.6
33.5
12.0
9.7
9.5
13.1
15.5
17.9
9.
Him
acha
l Pra
des
h13
.813
.113
.538
.536
.237
.717
.417
.318
.550
.852
.452
.8
10.
Jam
mu
and
Kas
hmir
9.6
8.6
9.8
39.7
37.2
39.7
13.2
10.0
11.1
61.2
57.8
63.2
11.
Jhar
khan
d8.
87.
97.
030
.627
.625
.411
.69.
08.
845
.348
.447
.4
12.
Kar
nata
ka9.
59.
410
.522
.524
.525
.68.
210
.610
.628
.029
.131
.4
13.
Ker
ala
18.2
15.6
14.9
40.5
35.8
34.1
19.9
17.0
15.2
20.6
25.5
23.4
14.
Mad
hya
Pra
des
h8.
28.
18.
021
.322
.421
.37.
18.
47.
846
.248
.646
.3
15.
Mah
aras
htra
13.6
11.8
11.2
29.2
25.8
28.0
7.7
6.9
8.3
19.4
21.8
21.7
16.
Man
ipur
5.4
5.2
5.0
36.2
32.4
34.9
14.3
12.4
13.0
80.9
69.7
74.3
17.
Meg
hala
ya6.
45.
25.
229
.525
.823
.98.
96.
56.
272
.071
.372
.9
18.
Miz
oram
4.0
4.5
3.6
29.6
30.7
33.2
12.2
11.1
12.7
80.0
73.8
82.8
19.
Nag
alan
d6.
26.
56.
738
.041
.239
.912
.415
.115
.980
.478
.281
.6
20.
Od
isha
5.9
5.7
5.6
26.2
25.2
25.4
12.1
12.3
12.3
47.8
51.5
51.2
21.
Pun
jab
28.9
23.2
22.5
52.3
41.9
41.1
16.3
12.5
12.1
24.4
30.0
25.8
22.
Raj
asth
an15
.514
.714
.127
.329
.228
.29.
511
.911
.832
.832
.532
.7
23.
Sik
kim
6.9
6.8
7.3
32.1
31.2
35.5
12.2
10.9
16.6
60.2
67.7
66.0
24.
Tam
il N
adu
17.8
15.9
16.4
34.0
33.9
35.7
13.3
14.1
15.3
20.5
23.6
23.8
25.
Tela
ngan
a12
.29.
812
.934
.525
.428
.414
.09.
89.
319
.529
.419
.6
26.
Trip
ura
8.8
6.3
6.6
39.6
38.7
37.8
15.2
16.3
16.3
62.0
73.3
68.8
27.
Utt
ar P
rad
esh
10.5
8.4
9.0
32.7
30.8
32.5
14.5
14.3
14.6
47.2
47.6
46.5
28.
Utt
arak
hand
14.7
14.1
13.7
40.0
38.7
37.2
17.3
16.1
15.3
39.6
38.8
42.4
29.
Wes
t B
enga
l21
.419
.119
.035
.533
.334
.610
.39.
69.
740
.342
.843
.8
30.
NC
T D
elhi
7.4
6.4
6.4
12.9
12.2
12.3
0.0
0.1
0.3
10.0
23.1
19.2
31.
Pud
uche
rry
11.4
10.4
12.7
30.4
31.0
32.6
12.8
14.0
12.7
32.9
30.4
30.6
All
Sta
tes
and
UTs
12
.611
.211
.231
.229
.029
.411
.811
.011
.035
.238
.138
.4
RE
: R
evis
ed E
stim
ates
.
BE
: B
udge
t E
stim
ates
.*:
Dev
elop
men
t an
d N
on d
evel
opm
ent
exp
end
iture
as
a ra
tio t
o ag
greg
ate
dis
bur
sem
ent
may
not
ad
d u
p t
o hu
ndre
d a
s ag
greg
ate
dis
bur
sem
ent
also
incl
udes
rep
aym
ents
.N
ote
: Neg
ativ
e (-
) sig
n in
dic
ates
sur
plu
s in
defi
cit
ind
icat
ors.
So
urce
: B
udge
t d
ocum
ents
of t
he s
tate
gov
ernm
ents
. Det
ails
in m
etho
dol
ogy.

Statements
109
Sta
tem
ent
2: R
even
ue D
efici
t/S
urp
lus
(` C
rore
)
Stat
e/U
T20
17-1
8
(Acc
ount
s)20
18-1
9
(R
evis
ed E
stim
ates
)20
19-2
0
(Bud
get
Est
imat
es)
Rev
enue
R
ecei
pts
Rev
enue
E
xpen
dit
ure
Rev
enue
S
urp
lus
(-)/
D
efici
t (+
)
Rev
enue
R
ecei
pts
Rev
enue
E
xpen
dit
ure
Rev
enue
S
urp
lus
(-)/
D
efici
t (+
)
Rev
enue
R
ecei
pts
Rev
enue
E
xpen
dit
ure
Rev
enue
S
urp
lus
(-)/
D
efici
t (+
)
12
34=
3-2
56
7=6-
58
910
=9-
8
1.
And
hra
Pra
des
h1,
05,0
62.1
1,21
,213
.816
,151
.71,
14,6
84.1
1,26
,339
.111
,654
.91,
78,6
97.4
1,80
,475
.91,
778.
5
2.
Aru
nach
al P
rad
esh
13,7
74.6
10,9
00.5
-2,8
74.1
19,7
49.0
13,4
83.5
-6,2
65.6
20,8
57.9
13,4
06.8
-7,4
51.1
3.
Ass
am54
,130
.955
,480
.91,
350.
089
,854
.382
,004
.8-7
,849
.583
,148
.079
,742
.3-3
,405
.7
4.
Bih
ar1,
17,4
46.7
1,02
,623
.7-1
4,82
3.0
1,58
,051
.41,
48,6
96.3
-9,3
55.1
1,76
,747
.61,
55,2
30.7
-21,
517.
0
5.
Chh
attis
garh
59,6
47.1
56,2
29.8
-3,4
17.3
74,0
28.5
80,3
70.0
6,34
1.6
79,7
46.0
78,5
94.5
-1,1
51.5
6.
Goa
11,0
53.5
10,5
42.9
-510
.611
,880
.711
,736
.0-1
44.6
13,5
93.8
13,1
38.7
-455
.1
7.
Guj
arat
1,23
,291
.31,
18,0
59.7
-5,2
31.6
1,40
,531
.71,
39,1
53.1
-1,3
78.7
1,54
,732
.01,
51,8
58.0
-2,8
74.0
8.
Har
yana
62,6
94.9
73,2
57.4
10,5
62.5
76,8
28.1
85,3
34.8
8,50
6.7
82,2
19.4
94,2
41.9
12,0
22.5
9.
Him
acha
l Pra
des
h27
,367
.127
,053
.2-3
13.9
31,1
89.4
33,4
08.2
2,21
8.8
33,7
46.9
36,0
89.0
2,34
2.1
10.
Jam
mu
and
Kas
hmir
48,5
11.7
40,9
16.5
-7,5
95.2
66,1
59.9
58,2
15.3
-7,9
44.6
71,1
42.6
57,6
88.9
-13,
453.
7
11.
Jhar
khan
d52
,756
.050
,950
.4-1
,805
.669
,578
.462
,513
.4-7
,065
.074
,358
.065
,803
.0-8
,555
.0
12.
Kar
nata
ka1,
46,9
99.6
1,42
,482
.3-4
,517
.31,
65,8
97.0
1,65
,702
.9-1
94.1
1,81
,863
.01,
81,6
05.0
-258
.0
13.
Ker
ala
83,0
20.1
99,9
48.4
16,9
28.2
1,00
,006
.61,
13,0
33.6
13,0
27.0
1,15
,354
.71,
24,1
25.0
8,77
0.3
14.
Mad
hya
Pra
des
h1,
34,8
75.4
1,30
,246
.1-4
,629
.31,
51,1
59.8
1,51
,022
.5-1
37.3
1,79
,353
.71,
78,6
21.1
-732
.6
15.
Mah
aras
htra
2,43
,653
.62,
41,5
71.1
-2,0
82.5
2,86
,499
.73,
01,4
59.7
14,9
60.0
3,14
,489
.03,
34,2
73.4
19,7
84.4
16.
Man
ipur
10,3
57.8
9,27
4.0
-1,0
83.8
12,1
98.4
12,1
90.0
-8.4
13,1
57.4
12,7
80.7
-376
.7
17.
Meg
hala
ya9,
273.
58,
422.
7-8
50.8
12,5
31.5
12,0
36.3
-495
.214
,438
.013
,699
.5-7
38.5
18.
Miz
oram
8,58
0.2
6,88
0.8
-1,6
99.4
8,67
3.9
8,14
2.5
-531
.49,
847.
08,
403.
5-1
,443
.5
19.
Nag
alan
d11
,019
.210
,191
.3-8
27.9
11,9
75.0
11,4
49.1
-525
.913
,173
.612
,666
.2-5
07.4
20.
Od
isha
85,2
04.3
71,8
37.3
-13,
367.
01,
01,8
82.8
91,3
27.9
-10,
554.
91,
15,2
66.0
1,08
,737
.9-6
,528
.1
21.
Pun
jab
53,0
09.6
62,4
64.9
9,45
5.3
70,3
98.9
82,3
18.0
11,9
19.1
78,5
09.7
90,1
97.0
11,6
87.3
22.
Raj
asth
an1,
27,3
07.2
1,45
,841
.518
,534
.31,
48,1
84.0
1,73
,008
.924
,824
.91,
64,0
04.6
1,91
,019
.627
,015
.0
23.
Sik
kim
5,21
2.8
4,15
1.8
-1,0
60.9
6,77
6.8
5,88
1.0
-895
.77,
397.
47,
129.
1-2
68.4
24.
Tam
il N
adu
1,46
,279
.71,
67,8
73.6
21,5
93.9
1,80
,618
.71,
99,9
37.7
19,3
19.0
1,97
,721
.22,
12,0
35.9
14,3
14.8
25.
Tela
ngan
a88
,824
.185
,364
.7-3
,459
.41,
19,0
99.1
1,19
,026
.9-7
2.2
1,13
,099
.91,
11,0
55.8
-2,0
44.1
26.
Trip
ura
10,0
68.0
10,3
57.2
289.
314
,641
.012
,801
.1-1
,839
.915
,098
.514
,061
.3-1
,037
.1
27.
Utt
ar P
rad
esh
2,78
,775
.52,
66,2
23.5
-12,
551.
93,
80,0
21.7
3,32
,774
.1-4
7,24
7.7
3,91
,734
.43,
63,9
57.0
-27,
777.
4
28.
Utt
arak
hand
27,1
04.6
29,0
82.7
1,97
8.1
34,7
53.9
34,7
26.6
-27.
238
,955
.538
,932
.7-2
2.8
29.
Wes
t B
enga
l1,
31,2
70.4
1,41
,077
.49,
807.
01,
52,6
25.5
1,60
,149
.67,
524.
11,
64,3
28.0
1,64
,328
.0-
30.
NC
T D
elhi
38,6
67.3
33,7
54.0
-4,9
13.2
44,8
24.5
39,8
93.9
-4,9
30.6
50,0
17.0
44,7
81.3
-5,2
35.7
31.
Pud
uche
rry
6,00
2.7
5,80
6.7
-196
.06,
806.
06,
770.
8-3
5.2
7,30
5.0
7,30
5.0
-
All
Sta
tes
and
UTs
23
,21,
241.
323
,40,
080.
618
,839
.328
,62,
110.
328
,74,
907.
512
,797
.231
,54,
103.
231
,45,
984.
8-8
,118
.4
So
urce
: B
udge
t d
ocum
ents
of t
he s
tate
gov
ernm
ents
. Det
ails
in m
etho
dol
ogy.
Details in methodology.

State Finances : A Study of Budgets of 2019-20
110
Sta
tem
ent
3: G
ross
Fis
cal D
efici
t/S
urp
lus
(` C
rore
)
Stat
e/U
T20
17-1
8
(Acc
ount
s)20
18-1
9
(R
evis
ed E
stim
ates
)20
19-2
0
(Bud
get
Est
imat
es)
Rec
eip
tsE
xpen
dit
ure
Sur
plu
s (-
)/
Defi
cit
(+)
Rec
eip
tsE
xpen
dit
ure
Sur
plu
s (-
)/
Defi
cit
(+)
Rec
eip
tsE
xpen
dit
ure
Sur
plu
s (-
)/
Defi
cit
(+)
12
34
56
78
910
1.
And
hra
Pra
des
h1,
05,0
62.1
1,37
,434
.732
,372
.61,
14,6
84.1
1,48
,303
.133
,619
.01,
78,6
97.4
2,13
,958
.035
,260
.6
2.
Aru
nach
al P
rad
esh
13,7
74.6
14,0
88.0
313.
419
,749
.020
,755
.81,
006.
720
,857
.921
,378
.952
1.0
3.
Ass
am54
,130
.963
,423
.19,
292.
289
,854
.399
,613
.39,
759.
083
,148
.094
,261
.511
,113
.5
4.
Bih
ar1,
17,4
46.7
1,31
,751
.614
,304
.81,
58,0
51.4
1,83
,183
.825
,132
.41,
76,7
47.6
1,92
,848
.716
,101
.1
5.
Chh
attis
garh
59,6
50.4
66,4
60.9
6,81
0.5
74,0
28.5
92,7
96.7
18,7
68.2
79,7
46.0
90,6
26.5
10,8
80.5
6.
Goa
11,0
53.5
12,6
63.7
1,61
0.2
11,8
80.7
15,9
94.6
4,11
3.9
13,5
93.8
18,0
63.5
4,46
9.7
7.
Guj
arat
1,23
,291
.31,
44,6
57.7
21,3
66.4
1,40
,596
.71,
72,3
83.7
31,7
87.0
1,54
,732
.01,
85,9
84.9
31,2
52.9
8.
Har
yana
62,7
34.7
81,8
49.2
19,1
14.5
76,8
68.1
97,4
00.8
20,5
32.7
83,9
97.4
1,06
,459
.422
,462
.0
9.
Him
acha
l Pra
des
h27
,401
.931
,271
.73,
869.
931
,189
.438
,975
.57,
786.
233
,746
.941
,099
.27,
352.
3
10.
Jam
mu
and
Kas
hmir
48,5
11.7
51,2
89.7
2,77
8.1
66,1
59.9
83,5
85.9
17,4
26.0
71,1
42.6
82,2
14.9
11,0
72.3
11.
Jhar
khan
d52
,781
.164
,712
.411
,931
.369
,578
.477
,072
.97,
494.
474
,358
.081
,513
.67,
155.
6
12.
Kar
nata
ka1,
47,0
03.4
1,78
,104
.431
,101
.01,
65,9
72.0
2,06
,139
.240
,167
.21,
81,9
43.0
2,23
,993
.942
,051
.0
13.
Ker
ala
83,0
49.4
1,09
,886
.826
,837
.41,
00,0
44.8
1,23
,731
.323
,686
.41,
15,3
97.5
1,41
,688
.126
,290
.6
14.
Mad
hya
Pra
des
h1,
34,8
94.7
1,57
,640
.022
,745
.21,
51,1
59.8
1,79
,771
.728
,612
.01,
79,3
53.7
2,11
,459
.432
,105
.7
15.
Mah
aras
htra
2,43
,653
.62,
67,6
14.5
23,9
61.0
2,86
,499
.73,
42,5
53.2
56,0
53.5
3,14
,489
.03,
74,7
23.5
60,2
34.5
16.
Man
ipur
10,3
57.8
10,6
97.7
339.
912
,198
.415
,277
.33,
078.
913
,157
.415
,046
.61,
889.
2
17.
Meg
hala
ya9,
273.
59,
410.
713
7.2
12,5
31.5
13,6
82.0
1,15
0.5
14,4
38.0
15,7
60.8
1,32
2.8
18.
Miz
oram
8,58
0.2
8,90
0.4
320.
28,
673.
910
,366
.71,
692.
89,
847.
010
,381
.153
4.1
19.
Nag
alan
d11
,019
.211
,465
.344
6.1
11,9
75.0
13,3
08.8
1,33
3.8
13,1
73.6
14,0
24.2
850.
6
20.
Od
isha
85,2
04.3
94,5
63.8
9,35
9.5
1,01
,882
.81,
15,8
18.0
13,9
35.2
1,15
,266
.01,
34,1
43.0
18,8
77.0
21.
Pun
jab
53,0
09.7
65,5
03.9
12,4
94.2
70,3
98.9
88,0
48.8
17,6
49.9
78,5
09.7
98,1
67.6
19,6
57.9
22.
Raj
asth
an1,
27,3
23.8
1,52
,665
.425
,341
.61,
48,2
04.0
1,79
,676
.831
,472
.81,
64,0
29.6
1,96
,708
.032
,678
.3
23.
Sik
kim
5,21
2.8
5,67
4.7
461.
96,
776.
87,
684.
690
7.8
7,39
7.4
8,25
0.4
853.
0
24.
Tam
il N
adu
1,46
,282
.01,
86,1
21.5
39,8
39.5
1,80
,618
.72,
26,1
38.4
45,5
19.7
1,97
,721
.22,
41,8
97.5
44,1
76.4
25.
Tela
ngan
a88
,824
.11,
15,3
38.0
26,5
13.9
1,19
,099
.11,
47,8
21.7
28,7
22.6
1,13
,099
.91,
37,1
81.7
24,0
81.7
26.
Trip
ura
10,0
68.0
12,1
39.6
2,07
1.6
14,6
41.0
15,8
73.5
1,23
2.4
15,0
98.5
16,8
92.9
1,79
4.5
27.
Utt
ar P
rad
esh
2,78
,775
.53,
06,5
85.0
27,8
09.6
3,80
,021
.74,
23,8
61.5
43,8
39.8
3,91
,734
.44,
38,6
45.0
46,9
10.6
28.
Utt
arak
hand
27,1
04.6
35,0
40.4
7,93
5.8
34,7
54.0
40,2
46.0
5,49
2.0
38,9
55.5
45,7
53.6
6,79
8.2
29.
Wes
t B
enga
l1,
31,2
70.4
1,60
,201
.328
,930
.91,
52,6
25.5
1,85
,123
.332
,497
.91,
64,3
28.0
1,91
,582
.327
,254
.4
30.
NC
T D
elhi
38,6
67.3
38,5
54.0
-113
.344
,824
.545
,423
.659
9.2
50,0
17.0
55,9
18.9
5,90
1.9
31.
Pud
uche
rry
6,00
2.7
6,19
9.9
197.
26,
806.
07,
217.
041
1.0
7,30
5.0
7,83
0.3
525.
3
All
Sta
tes
and
UTs
23
,21,
415.
727
,31,
910.
04,
10,4
94.3
28,6
2,34
8.7
34,1
7,82
9.5
5,55
,480
.931
,56,
029.
037
,08,
458.
15,
52,4
29.1
No
te: 1
. GFD
Rec
eip
ts in
clud
es r
even
ue r
ecei
pts
and
mis
cella
neou
s ca
pita
l rec
eip
ts.
2
. GFD
Exp
end
iture
incl
udes
rev
enue
exp
end
iture
, cap
ital o
utla
y an
d lo
ans
and
ad
vanc
es n
et o
f rec
over
ies.
So
urce
: B
udge
t d
ocum
ents
of t
he s
tate
gov
ernm
ents
. Det
ails
in m
etho
dol
ogy.

Statements
111
Sta
tem
ent
4: D
eco
mp
osi
tio
n o
f G
ross
Fis
cal D
efici
t(`
Cro
re)
Stat
e/U
T20
17-1
8(A
ccou
nts)
2018
-19
(Rev
ised
Est
imat
es)
2019
-20
(Bud
get E
stim
ates
)
Rev
enue
D
efici
tC
apita
l O
utla
yN
et
Lend
ing
Non
-deb
t C
apita
l R
ecei
pts
GFD
Rev
enue
D
efici
tC
apita
l O
utla
yN
et
Lend
ing
Non
-deb
t C
apita
l R
ecei
pts
GFD
Rev
enue
D
efici
tC
apita
l O
utla
yN
et
Lend
ing
Non
-deb
t C
apita
l R
ecei
pts
GFD
12
34
56=
(2
+3+4
-5)
78
910
11=
(7+8
+9-1
0)12
1314
1516
= (1
2+13
+14-
15)
1.
And
hra
Pra
desh
16,1
51.7
13,4
90.7
2,73
0.2
-32
,372
.611
,654
.920
,398
.21,
565.
9-
33,6
19.0
1,77
8.5
32,2
93.4
1,18
8.7
-35
,260
.6
2.
Aru
nach
al P
rade
sh-2
,874
.13,
188.
1-0
.6-
313.
4-6
,265
.67,
289.
2-1
6.8
-1,
006.
7-7
,451
.18,
006.
7-3
4.6
-52
1.0
3.
Ass
am1,
350.
07,
692.
824
9.4
-9,
292.
2-7
,849
.519
,604
.7-1
,996
.2-
9,75
9.0
-3,4
05.7
15,2
19.2
-700
.0-
11,1
13.5
4.
Bih
ar-1
4,82
3.0
28,9
07.0
220.
9-
14,3
04.8
-9,3
55.1
33,8
96.7
590.
8-
25,1
32.4
-21,
517.
036
,592
.61,
025.
4-
16,1
01.1
5.
Chh
attis
garh
-3,4
17.3
10,0
01.0
230.
23.
36,
810.
56,
341.
612
,288
.013
8.6
-18
,768
.2-1
,151
.512
,109
.6-7
7.6
-10
,880
.5
6.
Goa
-510
.62,
094.
126
.8-
1,61
0.2
-144
.64,
188.
670
.0-
4,11
3.9
-455
.14,
865.
659
.2-
4,46
9.7
7.
Guj
arat
-5,2
31.6
26,3
13.2
284.
9-
21,3
66.4
-1,3
78.7
31,4
17.2
1,81
3.4
65.0
31,7
87.0
-2,8
74.0
32,8
06.6
1,32
0.3
-31
,252
.9
8.
Har
yana
10,5
62.5
13,5
37.9
-4,9
46.0
39.9
19,1
14.5
8,50
6.7
15,9
63.6
-3,8
97.7
40.0
20,5
32.7
12,0
22.5
16,2
59.7
-4,0
42.2
1,77
8.0
22,4
62.0
9.
Him
acha
l Pra
desh
-313
.93,
755.
746
2.9
34.8
3,86
9.9
2,21
8.8
4,89
3.3
674.
1-
7,78
6.2
2,34
2.1
4,57
9.9
430.
3-
7,35
2.3
10.
Jam
mu
and
Kas
hmir
-7,5
95.2
10,3
52.9
20.3
-2,
778.
1-7
,944
.626
,950
.8-1
,580
.2-
17,4
26.0
-13,
453.
726
,594
.1-2
,068
.1-
11,0
72.3
11.
Jhar
khan
d-1
,805
.611
,952
.71,
809.
325
.111
,931
.3-7
,065
.013
,068
.31,
491.
1-
7,49
4.4
-8,5
55.0
13,8
76.4
1,83
4.3
-7,
155.
6
12.
Kar
nata
ka-4
,517
.330
,666
.84,
955.
33.
731
,101
.0-1
94.1
35,9
20.9
4,51
5.4
75.0
40,1
67.2
-258
.040
,080
.12,
308.
880
.042
,051
.0
13.
Ker
ala
16,9
28.2
8,74
8.9
1,18
9.6
29.3
26,8
37.4
13,0
27.0
9,81
0.7
887.
038
.323
,686
.48,
770.
316
,269
.41,
293.
842
.826
,290
.6
14.
Mad
hya
Pra
desh
-4,6
29.3
30,9
13.2
-3,5
19.3
19.3
22,7
45.2
-137
.327
,243
.71,
505.
5-
28,6
12.0
-732
.633
,489
.7-6
51.4
-32
,105
.7
15.
Mah
aras
htra
-2,0
82.5
26,8
42.2
-798
.7-
23,9
61.0
14,9
60.0
41,5
72.7
-479
.3-
56,0
53.5
19,7
84.4
40,7
32.3
-282
.2-
60,2
34.5
16.
Man
ipur
-1,0
83.8
1,42
8.3
-4.6
-33
9.9
-8.4
3,08
8.1
-0.8
-3,
078.
9-3
76.7
2,26
6.7
-0.8
-1,
889.
2
17.
Meg
hala
ya-8
50.8
983.
44.
6-
137.
2-4
95.2
1,56
1.3
84.4
-1,
150.
5-7
38.5
1,73
0.3
331.
0-
1,32
2.8
18.
Miz
oram
-1,6
99.4
1,99
6.3
23.3
-32
0.2
-531
.42,
213.
111
.1-
1,69
2.8
-1,4
43.5
1,91
4.9
62.7
-53
4.1
19.
Nag
alan
d-8
27.9
1,27
4.8
-0.9
-44
6.1
-525
.91,
860.
8-1
.1-
1,33
3.8
-507
.41,
359.
1-1
.1-
850.
6
20.
Odi
sha
-13,
367.
021
,108
.51,
617.
9-
9,35
9.5
-10,
554.
923
,655
.283
4.9
-13
,935
.2-6
,528
.124
,473
.293
1.9
-18
,877
.0
21.
Pun
jab
9,45
5.3
2,35
2.1
687.
00.
112
,494
.211
,919
.14,
871.
685
9.3
-17
,649
.911
,687
.322
,842
.1-1
4,87
1.4
-19
,657
.9
22.
Raj
asth
an18
,534
.320
,623
.3-1
3,79
9.4
16.6
25,3
41.6
24,8
24.9
21,0
61.6
-14,
393.
720
.031
,472
.827
,015
.019
,472
.3-1
3,78
4.0
25.0
32,6
78.3
23.
Sik
kim
-1,0
60.9
1,50
6.8
16.0
-46
1.9
-895
.71,
759.
144
.4-
907.
8-2
68.4
1,10
9.7
11.6
-85
3.0
24.
Tam
il N
adu
21,5
93.9
20,2
03.2
-1,9
55.3
2.2
39,8
39.5
19,3
19.0
26,1
92.0
8.7
-45
,519
.714
,314
.831
,251
.2-1
,389
.6-
44,1
76.4
25.
Tela
ngan
a-3
,459
.423
,902
.06,
071.
2-
26,5
13.9
-72.
226
,888
.51,
906.
2-
28,7
22.6
-2,0
44.1
17,2
74.7
8,85
1.2
-24
,081
.7
26.
Trip
ura
289.
31,
777.
15.
3-
2,07
1.6
-1,8
39.9
3,07
2.3
--
1,23
2.4
-1,0
37.1
2,83
1.6
--
1,79
4.5
27.
Utta
r Pra
desh
-12,
551.
939
,088
.01,
273.
5-
27,8
09.6
-47,
247.
788
,528
.12,
559.
3-
43,8
39.8
-27,
777.
477
,641
.1-2
,953
.1-
46,9
10.6
28.
Utta
rakh
and
1,97
8.1
5,91
4.4
43.3
-7,
935.
8-2
7.2
5,33
6.2
183.
20.
15,
492.
0-2
2.8
6,57
2.1
248.
9-
6,79
8.2
29.
Wes
t Ben
gal
9,80
7.0
19,3
68.1
-244
.2-
28,9
30.9
7,52
4.1
24,4
12.4
561.
3-
32,4
97.9
-26
,666
.658
7.8
-27
,254
.4
30.
NC
T D
elhi
-4,9
13.2
3,24
2.9
1,55
7.1
--1
13.3
-4,9
30.6
4,17
7.0
1,35
2.8
-59
9.2
-5,2
35.7
9,64
7.2
1,49
0.4
-5,
901.
9
31.
Pud
uche
rry
-196
.039
4.4
-1.1
-19
7.2
-35.
244
6.1
0.1
-41
1.0
-52
2.1
3.3
-52
5.3
All
Stat
es a
nd U
Ts
18,8
39.3
3,93
,620
.7-1
,791
.317
4.4
4,10
,494
.312
,797
.25,
43,6
30.2
-708
.223
8.4
5,55
,480
.9-8
,118
.45,
81,3
49.9
-18,
876.
61,
925.
85,
52,4
29.1
GFD
: Gro
ss F
isca
l Defi
cit.
‘-
’: N
il/N
eglig
ible
.
No
te :
Neg
ativ
e (-
) sig
n in
dic
ates
sur
plu
s in
defi
cit
ind
icat
ors.
So
urce
: B
udge
t d
ocum
ents
of t
he s
tate
gov
ernm
ents
. Det
ails
in m
etho
dol
ogy.

State Finances : A Study of Budgets of 2019-20
112
Sta
tem
ent
5: F
inan
cing
of
Gro
ss F
isca
l Defi
cit
- 20
17-1
8 (A
cco
unts
)(`
Cro
re)
Stat
e/U
TM
arke
t B
orro
win
gsLo
ans
from
Cen
tre
Spe
cial
S
ecur
ities
is
sued
to N
SS
F
Loan
s fr
om L
IC,
NA
BA
RD
, N
CD
C, S
BI
and
othe
r B
anks
Pro
vide
nt
Fund
s,
etc.
Res
erve
Fu
nds
Dep
osits
an
d A
dvan
ces
Sus
pens
e an
d M
isce
llane
ous
Rem
ittan
ces
Oth
ers
Ove
rall
Sur
plus
(-)/
D
efici
t (+
)
Gro
ss F
isca
l S
urpl
us (-
)/D
efici
t (+
) (C
ol.2
to 1
2)
12
34
56
78
910
1112
13
1.
And
hra
Pra
desh
18,9
22.8
-47.
9-1
,133
.51,
059.
01,
643.
1-1
69.4
4,60
8.3
337.
72,
032.
7-5
6.6
5,17
6.1
32,3
72.6
2.
Aru
nach
al P
rade
sh88
7.8
-26.
4-1
2.8
198.
736
1.7
-80.
7-2
01.3
-609
.651
.1-4
05.6
150.
331
3.4
3.
Ass
am6,
796.
9-6
8.6
-665
.542
7.1
1,02
7.7
-2,2
94.5
-443
.665
0.9
20.5
-51.
53,
892.
89,
292.
2
4.
Bih
ar8,
908.
058
6.1
-1,7
68.7
790.
5-8
0.2
-696
.410
,314
.358
0.0
-2.8
--4
,325
.914
,304
.8
5.
Chh
attis
garh
8,10
0.0
292.
4-4
31.1
691.
764
0.6
-765
.112
0.9
-52.
370
.9-1
.5-1
,856
.06,
810.
5
6.
Goa
1,40
0.0
-10.
0-1
90.2
22.3
235.
999
.217
7.1
-24.
6-1
64.2
-6.5
71.1
1,61
0.2
7.
Guj
arat
15,7
85.0
-619
.4-3
,450
.81,
537.
734
0.3
-1,4
67.5
1,09
5.5
498.
320
7.6
-7,
439.
621
,366
.4
8.
Har
yana
15,8
39.5
-44.
6-9
54.1
456.
51,
226.
367
3.7
653.
648
.5-2
5.1
-146
.31,
386.
619
,114
.5
9.
Him
acha
l Pra
desh
2,55
1.0
3.0
-514
.710
5.6
1,39
2.0
105.
418
8.6
-118
.869
.0-4
4.5
133.
13,
869.
9
10.
Jam
mu
and
Kas
hmir
3,97
3.9
-84.
4-3
20.6
-101
.01,
556.
228
9.9
1,08
4.5
-139
.6-2
,954
.818
8.7
-714
.82,
778.
1
11.
Jhar
khan
d4,
807.
570
.6-7
45.9
910.
966
.529
1.8
4,72
1.5
-249
.592
.564
4.3
1,32
1.0
11,9
31.3
12.
Kar
nata
ka17
,348
.076
1.1
-1,5
72.6
320.
92,
811.
548
9.8
1,83
3.9
-1,5
09.3
-75.
8-4
.610
,698
.331
,101
.0
13.
Ker
ala
16,2
03.2
-130
.11,
047.
7-1
3.6
7,20
6.8
175.
326
5.9
1,20
3.9
-166
.0-5
.61,
049.
926
,837
.4
14.
Mad
hya
Pra
desh
13,1
25.0
824.
01,
348.
089
1.3
680.
4-1
,038
.02,
315.
611
1.4
703.
4-7
2.5
3,85
6.7
22,7
45.2
15.
Mah
aras
htra
36,4
76.7
-780
.8-5
,176
.21,
920.
354
6.6
-194
.53,
929.
916
9.3
822.
4-1
46.7
-13,
606.
123
,961
.0
16.
Man
ipur
277.
8-3
5.1
-53.
140
.7-3
.5-1
0.7
-24.
43.
3-6
0.5
6.6
198.
833
9.9
17.
Meg
hala
ya91
9.8
-13.
7-4
5.4
40.8
157.
7-2
3.9
-527
.88.
14.
1-6
.0-3
76.6
137.
2
18.
Miz
oram
277.
5-1
4.2
-15.
038
.8-1
79.1
7.4
325.
8-
-11
6.5
-237
.632
0.2
19.
Nag
alan
d76
5.9
-21.
4-1
2.7
-37.
461
.5-
-123
.8-7
3.3
32.4
-5.5
-139
.844
6.1
20.
Odi
sha
8,43
8.0
140.
6-8
20.5
2,41
6.0
1,55
7.8
-85.
713
,896
.979
.5-1
2.2
-2.7
-16,
248.
39,
359.
5
21.
Pun
jab
13,3
48.7
125.
2-1
,742
.4-1
,072
.11,
126.
265
0.1
-179
.417
2.6
-12.
2-6
4.0
141.
612
,494
.2
22.
Raj
asth
an20
,927
.092
3.6
-1,5
35.8
658.
73,
200.
839
5.2
5,70
3.2
-27.
210
.2-4
,090
.7-8
23.4
25,3
41.6
23.
Sik
kim
747.
3-7
.6-2
3.6
-3.2
80.6
-35.
724
.225
.217
9.9
-1.8
-523
.446
1.9
24.
Tam
il N
adu
36,0
22.9
1,79
7.0
-1,7
49.0
674.
32,
334.
453
5.5
3,52
3.5
387.
7-7
.2-1
4.4
-3,6
65.1
39,8
39.5
25.
Tela
ngan
a21
,828
.222
5.1
-799
.152
4.7
975.
9-8
1.4
5,86
0.3
-573
.31,
306.
4-2
82.8
-2,4
70.1
26,5
13.9
26.
Trip
ura
1,13
7.0
-30.
6-1
13.2
39.6
520.
7-1
4.3
105.
634
.6-3
1.9
-0.2
424.
22,
071.
6
27.
Utt
ar P
rade
sh37
,178
.0-4
37.8
-4,6
43.0
85.9
2,53
0.1
8,26
4.7
1,40
4.4
-2,2
05.8
-3,9
06.3
76.4
-10,
537.
027
,809
.6
28.
Utt
arak
hand
5,83
0.0
74.0
-374
.427
5.8
619.
510
5.1
718.
773
0.0
31.4
-126
.852
.77,
935.
8
29.
Wes
t Ben
gal
25,3
04.3
1,02
4.0
-5,9
75.7
-11.
81,
163.
3-1
,224
.12,
606.
61,
634.
85.
139
1.6
4,01
2.7
28,9
30.9
30.
NC
T D
elhi
-22
3.9
--
--
--
--
-337
.2-1
13.3
31.
Pud
uche
rry
488.
0-6
4.1
--3
8.0
46.1
-21.
2-1
5.7
404.
83.
110
4.8
-710
.519
7.2
All
Sta
tes
and
UTs
3,
44,6
15.8
4,63
4.0
-32,
444.
112
,850
.733
,847
.53,
880.
063
,962
.91,
497.
4-1
,776
.2-4
,007
.5-1
6,56
6.3
4,10
,494
.3
‘-’ :
Nil/
Neg
ligib
le.
No
te:
(1)
Sam
e as
in A
pp
end
ix T
able
9.
(2
) Th
e d
etai
led
bre
ak-u
p o
f ‘D
isch
arge
of I
nter
nal D
ebt’
was
not
ava
ilab
le fo
r Aru
nach
al P
rad
esh
and
the
sam
e ha
s b
een
incl
uded
und
er ‘O
ther
s’. T
he fi
nanc
ing
item
s un
der
‘Int
erna
l Deb
t’
for
thes
e S
tate
s ar
e, t
here
fore
, not
on
a ne
t b
asis
exc
ept
‘Oth
ers’
.
(3)
‘Oth
ers’
incl
ude
Loan
s fr
om o
ther
inst
itutio
ns, c
omp
ensa
tion
bon
ds,
ap
pro
pria
tion
to c
ontin
genc
y fu
nd, i
nter
-sta
te s
ettle
men
t an
d c
ontin
genc
y fu
nd.
So
urce
: B
udge
t d
ocum
ents
of t
he s
tate
gov
ernm
ents
. Det
ails
in m
etho
dol
ogy.

Statements
113
Sta
tem
ent
6: F
inan
cing
of
Gro
ss F
isca
l Defi
cit
- A
s P
er c
ent
to T
ota
l - 2
017-
18 (A
cco
unts
)(P
er c
ent)
Stat
e/U
TM
arke
t B
orro
win
gsLo
ans
from
Cen
tre
Spe
cial
S
ecur
ities
is
sued
to N
SS
F
Loan
s fr
om L
IC,
NA
BA
RD
, N
CD
C, S
BI
and
othe
r B
anks
Pro
vide
nt
Fund
s,
etc.
Res
erve
Fu
nds
Dep
osits
an
d A
dvan
ces
Sus
pens
e an
d M
isce
llane
ous
Rem
ittan
ces
Oth
ers
Ove
rall
Sur
plus
(-)/
D
efici
t (+
)
Gro
ss F
isca
l S
urpl
us (-
)/D
efici
t (+
) (C
ol.2
to 1
2)
12
34
56
78
910
1112
13
1.
And
hra
Pra
desh
58.5
-0.1
-3.5
3.3
5.1
-0.5
14.2
1.0
6.3
-0.2
16.0
100.
0
2.
Aru
nach
al P
rade
sh28
3.3
-8.4
-4.1
63.4
115.
4-2
5.7
-64.
2-1
94.5
16.3
-129
.448
.010
0.0
3.
Ass
am73
.1-0
.7-7
.24.
611
.1-2
4.7
-4.8
7.0
0.2
-0.6
41.9
100.
0
4.
Bih
ar62
.34.
1-1
2.4
5.5
-0.6
-4.9
72.1
4.1
--
-30.
210
0.0
5.
Chh
attis
garh
118.
94.
3-6
.310
.29.
4-1
1.2
1.8
-0.8
1.0
--2
7.3
100.
0
6.
Goa
86.9
-0.6
-11.
81.
414
.76.
211
.0-1
.5-1
0.2
-0.4
4.4
100.
0
7.
Guj
arat
73.9
-2.9
-16.
27.
21.
6-6
.95.
12.
31.
0-
34.8
100.
0
8.
Har
yana
82.9
-0.2
-5.0
2.4
6.4
3.5
3.4
0.3
-0.1
-0.8
7.3
100.
0
9.
Him
acha
l Pra
desh
65.9
0.1
-13.
32.
736
.02.
74.
9-3
.11.
8-1
.13.
410
0.0
10.
Jam
mu
and
Kas
hmir
143.
0-3
.0-1
1.5
-3.6
56.0
10.4
39.0
-5.0
-106
.46.
8-2
5.7
100.
0
11.
Jhar
khan
d40
.30.
6-6
.37.
60.
62.
439
.6-2
.10.
85.
411
.110
0.0
12.
Kar
nata
ka55
.82.
4-5
.11.
09.
01.
65.
9-4
.9-0
.2-
34.4
100.
0
13.
Ker
ala
60.4
-0.5
3.9
-0.1
26.9
0.7
1.0
4.5
-0.6
-3.
910
0.0
14.
Mad
hya
Pra
desh
57.7
3.6
5.9
3.9
3.0
-4.6
10.2
0.5
3.1
-0.3
17.0
100.
0
15.
Mah
aras
htra
152.
2-3
.3-2
1.6
8.0
2.3
-0.8
16.4
0.7
3.4
-0.6
-56.
810
0.0
16.
Man
ipur
81.7
-10.
3-1
5.6
12.0
-1.0
-3.1
-7.2
1.0
-17.
81.
958
.510
0.0
17.
Meg
hala
ya67
0.2
-10.
0-3
3.1
29.7
114.
9-1
7.4
-384
.65.
93.
0-4
.4-2
74.4
100.
0
18.
Miz
oram
86.7
-4.4
-4.7
12.1
-55.
92.
310
1.7
--
36.4
-74.
210
0.0
19.
Nag
alan
d17
1.7
-4.8
-2.8
-8.4
13.8
--2
7.7
-16.
47.
3-1
.2-3
1.3
100.
0
20.
Odi
sha
90.2
1.5
-8.8
25.8
16.6
-0.9
148.
50.
8-0
.1-
-173
.610
0.0
21.
Pun
jab
106.
81.
0-1
3.9
-8.6
9.0
5.2
-1.4
1.4
-0.1
-0.5
1.1
100.
0
22.
Raj
asth
an82
.63.
6-6
.12.
612
.61.
622
.5-0
.1-
-16.
1-3
.210
0.0
23.
Sik
kim
161.
8-1
.6-5
.1-0
.717
.4-7
.75.
25.
538
.9-0
.4-1
13.3
100.
0
24.
Tam
il N
adu
90.4
4.5
-4.4
1.7
5.9
1.3
8.8
1.0
--
-9.2
100.
0
25.
Tela
ngan
a82
.30.
8-3
.02.
03.
7-0
.322
.1-2
.24.
9-1
.1-9
.310
0.0
26.
Trip
ura
54.9
-1.5
-5.5
1.9
25.1
-0.7
5.1
1.7
-1.5
-20
.510
0.0
27.
Utt
ar P
rade
sh13
3.7
-1.6
-16.
70.
39.
129
.75.
0-7
.9-1
4.0
0.3
-37.
910
0.0
28.
Utt
arak
hand
73.5
0.9
-4.7
3.5
7.8
1.3
9.1
9.2
0.4
-1.6
0.7
100.
0
29.
Wes
t Ben
gal
87.5
3.5
-20.
7-
4.0
-4.2
9.0
5.7
-1.
413
.910
0.0
30.
NC
T D
elhi
0.0
-197
.7-
--
--
--
-29
7.7
100.
0
31.
Pud
uche
rry
247.
4-3
2.5
--1
9.3
23.3
-10.
7-7
.920
5.2
1.6
53.1
-360
.210
0.0
All
Sta
tes
and
UTs
84
.01.
1-7
.93.
18.
20.
915
.60.
4-0
.4-1
.0-4
.010
0.0
‘-’ :
Nil/
Neg
ligib
le.
No
te:
(1)
Sam
e as
in A
pp
end
ix T
able
9.
(2
) Th
e d
etai
led
bre
ak-u
p o
f ‘D
isch
arge
of I
nter
nal D
ebt’
was
not
ava
ilab
le fo
r Aru
nach
al P
rad
esh
and
the
sam
e ha
s b
een
incl
uded
und
er ‘O
ther
s’. T
he fi
nanc
ing
item
s un
der
‘Int
erna
l Deb
t’
for
thes
e S
tate
s ar
e, t
here
fore
, not
on
a ne
t b
asis
exc
ept
‘Oth
ers’
.
(3)
‘Oth
ers’
incl
ude
Loan
s fr
om o
ther
inst
itutio
ns, c
omp
ensa
tion
bon
ds
app
rop
riatio
n to
con
tinge
ncy
fund
, int
er-s
tate
set
tlem
ent
and
con
tinge
ncy
fund
.
(4)
In c
ase
of T
ripur
a an
d M
anip
ur t
he c
ontr
ibut
ion
of r
esp
ectiv
e co
mp
onen
t ne
eds
to b
e se
en in
ligh
t of
sur
plu
s G
FD;
for
bot
h th
ese
stat
es t
he p
ositi
ve s
ign
of a
com
pon
ent
rep
rese
nt
pos
itive
con
trib
utio
n w
here
as a
neg
ativ
e si
gn r
epre
sent
a n
egat
ive
cont
ribut
ion
in r
educ
tion
of G
FD.
So
urce
: B
udge
t d
ocum
ents
of t
he s
tate
gov
ernm
ents
. Det
ails
in m
etho
dol
ogy.

State Finances : A Study of Budgets of 2019-20
114
Sta
tem
ent
7: F
inan
cing
of
Gro
ss F
isca
l Defi
cit-
201
8-19
(RE
)(`
Cro
re)
Stat
e/U
TM
arke
t B
orro
win
gsLo
ans
from
Cen
tre
Spe
cial
S
ecur
ities
is
sued
to N
SS
F
Loan
s fr
om L
IC,
NA
BA
RD
, N
CD
C, S
BI
and
othe
r B
anks
Pro
vide
nt
Fund
s,
etc.
Res
erve
Fu
nds
Dep
osits
an
d A
dvan
ces
Sus
pens
e an
d M
isce
llane
ous
Rem
ittan
ces
Oth
ers
Ove
rall
Sur
plus
(-)/
D
efici
t (+
)
Gro
ss F
isca
l S
urpl
us (-
)/D
efici
t (+
) (C
ol.2
to 1
2)
12
34
56
78
910
1112
13
1.
And
hra
Pra
desh
23,8
23.4
1,25
1.7
-1,1
54.4
682.
31,
258.
262
0.1
10,0
38.1
-133
.8-1
,857
.9-5
0.1
-858
.633
,619
.0
2.
Aru
nach
al P
rade
sh71
9.0
-26.
3-3
0.6
262.
736
5.9
-239
.810
0.4
6.9
-427
.9-4
84.0
760.
41,
006.
7
3.
Ass
am7,
143.
1-2
7.5
-709
.51,
305.
394
2.8
--1
,163
.811
7.3
-18.
3-0
.72,
170.
49,
759.
0
4.
Bih
ar14
,947
.21,
251.
1-1
,819
.01,
091.
8-1
00.0
-0.5
99.5
-900
.0-
-2.1
10,5
64.4
25,1
32.4
5.
Chh
attis
garh
12,7
25.0
438.
6-4
55.0
677.
958
5.0
22.0
-102
.0-
--0
.54,
877.
118
,768
.2
6.
Goa
1,00
0.0
-18.
6-2
04.7
-22.
615
0.1
94.0
1.7
-12.
9-1
34.8
-6.5
3,26
8.2
4,11
3.9
7.
Guj
arat
27,4
65.5
1,27
6.0
-3,5
33.8
2,85
3.4
261.
516
.01,
422.
884
8.5
301.
3-
875.
831
,787
.0
8.
Har
yana
17,9
72.0
89.8
-976
.112
5.7
802.
020
1.1
-1,3
28.0
50.0
-7.0
-35.
23,
638.
220
,532
.7
9.
Him
acha
l Pra
desh
3,74
4.2
-19.
6-5
38.3
162.
11,
225.
0-
--
--2
7.5
3,24
0.2
7,78
6.2
10.
Jam
mu
and
Kas
hmir
5,10
1.2
-87.
2-
211.
12,
040.
198
.1-
5.1
-1,
160.
58,
897.
317
,426
.0
11.
Jhar
khan
d6,
514.
039
1.6
-757
.01,
051.
0-1
16.2
-56
9.4
28.8
265.
679
4.9
-1,2
47.6
7,49
4.4
12.
Kar
nata
ka36
,313
.8-2
45.8
-1,5
95.5
475.
73,
326.
2-1
60.1
-1,3
69.1
--
-4.5
3,42
6.4
40,1
67.2
13.
Ker
ala
17,7
34.0
641.
693
0.5
-56.
76,
354.
3-2
88.5
115.
3-2
,643
.876
.2-5
8.2
881.
823
,686
.4
14.
Mad
hya
Pra
desh
20,8
99.1
2,39
6.2
901.
92,
660.
63,
654.
6-1
,558
.83,
788.
4-9
28.8
-79.
2-4
0.3
-3,0
81.7
28,6
12.0
15.
Mah
aras
htra
7,23
7.1
-369
.5-5
,309
.54,
184.
795
7.3
3,12
5.4
4,66
4.3
96.5
-160
.1-1
15.5
41,7
42.7
56,0
53.5
16.
Man
ipur
599.
1-4
8.5
-58.
414
0.6
50.0
--9
0.0
--
-20.
12,
506.
23,
078.
9
17.
Meg
hala
ya86
8.1
16.6
-49.
713
3.9
208.
1-
-544
.41.
114
.48.
749
3.5
1,15
0.5
18.
Miz
oram
393.
8-1
.2-1
0.9
90.6
71.0
1.0
176.
2-
--2
8.5
1,00
0.8
1,69
2.8
19.
Nag
alan
d35
5.0
-9.4
-13.
5-2
5.4
255.
0-1
.0-8
44.1
--
-38.
61,
655.
71,
333.
8
20.
Odi
sha
9,85
7.1
458.
9-1
,025
.93,
447.
31,
000.
01.
2-1
9.6
14.1
-16,
917.
347
.817
,071
.513
,935
.2
21.
Pun
jab
17,0
54.8
1,22
4.0
-1,8
01.5
-1,0
91.3
1,24
3.1
684.
6-1
27.7
--
-62.
052
5.9
17,6
49.9
22.
Raj
asth
an29
,664
.51,
882.
2-1
,560
.064
9.7
3,14
6.7
-1,1
12.2
1,67
6.9
-47.
07.
3-6
,146
.53,
311.
331
,472
.8
23.
Sik
kim
799.
4-1
0.4
-15.
0-4
.716
6.5
-27.
3-
-71.
338
.3-0
.633
.090
7.8
24.
Tam
il N
adu
41,1
78.7
1,77
0.5
-1,7
77.2
1,01
2.6
1,89
1.0
1,79
8.7
-1,8
07.4
-8,0
45.5
--8
.99,
507.
245
,519
.7
25.
Tela
ngan
a26
,942
.939
6.9
-605
.423
7.8
1,10
0.0
220.
91,
179.
8-
--3
66.4
-383
.928
,722
.6
26.
Trip
ura
1,38
6.8
-24.
4-1
40.6
-31.
150
.02.
049
.85.
0-3
0.0
-0.2
-34.
81,
232.
4
27.
Utt
ar P
rade
sh35
,633
.1-4
46.6
-4,8
71.6
3,33
7.9
2,75
6.6
13,7
11.6
-2,4
32.5
-2,7
35.7
-1,2
00.0
139.
0-5
2.0
43,8
39.8
28.
Utt
arak
hand
5,28
8.8
143.
9-4
00.0
196.
019
1.1
-0.1
-239
.1-0
.4-1
51.5
-276
.974
0.2
5,49
2.0
29.
Wes
t Ben
gal
35,4
56.5
331.
9-6
,124
.6-2
3.2
1,23
4.1
-3.8
2,81
9.7
-4.0
-69
7.4
-1,8
86.3
32,4
97.9
30.
NC
T D
elhi
-2,
163.
6-
--
--
--
-90.
0-1
,474
.559
9.2
31.
Pud
uche
rry
474.
6-1
51.0
--5
1.1
-29.
4-
-2.7
795.
9-8
1.1
138.
5-6
82.7
411.
0
All
Sta
tes
and
UTs
4,
09,2
92.0
14,6
38.9
-33,
705.
223
,684
.935
,040
.717
,204
.516
,631
.9-1
3,55
4.1
-20,
362.
1-4
,876
.81,
11,4
86.2
5,55
,480
.9
‘-’ :
Nil/
Neg
ligib
le.
RE
: Rev
ised
Est
imat
es.
No
te:
(1)
Sam
e as
in A
pp
end
ix T
able
9.
(2)
The
det
aile
d b
reak
-up
of ‘
Dis
char
ge o
f Int
erna
l Deb
t’ w
as n
ot a
vaila
ble
for
Aru
nach
al P
rad
esh
and
the
sam
e ha
s b
een
incl
uded
und
er ‘O
ther
s’. T
he fi
nanc
ing
item
s un
der
‘Int
erna
l D
ebt’
for
thes
e st
ates
are
, the
refo
re, n
ot o
n a
net
bas
is e
xcep
t ‘O
ther
s’.
(3
) ‘O
ther
s’ in
clud
e Lo
ans
from
oth
er in
stitu
tions
, com
pen
satio
n b
ond
s ap
pro
pria
tion
to c
ontin
genc
y fu
nd, i
nter
-sta
te s
ettle
men
t an
d c
ontin
genc
y fu
nd.
So
urce
: B
udge
t d
ocum
ents
of t
he s
tate
gov
ernm
ents
.

Statements
115
Sta
tem
ent
8: F
inan
cing
of
Gro
ss F
isca
l Defi
cit-
As
Per
cen
t to
To
tal -
201
8-19
(RE
)(P
er c
ent)
Stat
e/U
TM
arke
t B
orro
win
gsLo
ans
from
Cen
tre
Spe
cial
S
ecur
ities
is
sued
to N
SS
F
Loan
s fr
om L
IC,
NA
BA
RD
, N
CD
C, S
BI
and
othe
r B
anks
Pro
vide
nt
Fund
s,
etc.
Res
erve
Fu
nds
Dep
osits
an
d A
dvan
ces
Sus
pens
e an
d M
isce
llane
ous
Rem
ittan
ces
Oth
ers
Ove
rall
Sur
plus
(-)/
D
efici
t (+
)
Gro
ss F
isca
l S
urpl
us (-
)/D
efici
t (+
) (C
ol.2
to 1
2)
12
34
56
78
910
1112
13
1.
And
hra
Pra
desh
70.9
3.7
-3.4
2.0
3.7
1.8
29.9
-0.4
-5.5
-0.1
-2.6
100.
0
2.
Aru
nach
al P
rade
sh71
.4-2
.6-3
.026
.136
.3-2
3.8
10.0
0.7
-42.
5-4
8.1
75.5
100.
0
3.
Ass
am73
.2-0
.3-7
.313
.49.
7-
-11.
91.
2-0
.2-
22.2
100.
0
4.
Bih
ar59
.55.
0-7
.24.
3-0
.4-
0.4
-3.6
--
42.0
100.
0
5.
Chh
attis
garh
67.8
2.3
-2.4
3.6
3.1
0.1
-0.5
--
-26
.010
0.0
6.
Goa
24.3
-0.5
-5.0
-0.5
3.6
2.3
--0
.3-3
.3-0
.279
.410
0.0
7.
Guj
arat
86.4
4.0
-11.
19.
00.
80.
14.
52.
70.
9-
2.8
100.
0
8.
Har
yana
87.5
0.4
-4.8
0.6
3.9
1.0
-6.5
0.2
--0
.217
.710
0.0
9.
Him
acha
l Pra
desh
48.1
-0.3
-6.9
2.1
15.7
--
--
-0.4
41.6
100.
0
10.
Jam
mu
and
Kas
hmir
29.3
-0.5
-1.
211
.70.
6-
--
6.7
51.1
100.
0
11.
Jhar
khan
d86
.95.
2-1
0.1
14.0
-1.6
-7.
60.
43.
510
.6-1
6.6
100.
0
12.
Kar
nata
ka90
.4-0
.6-4
.01.
28.
3-0
.4-3
.4-
--
8.5
100.
0
13.
Ker
ala
74.9
2.7
3.9
-0.2
26.8
-1.2
0.5
-11.
20.
3-0
.23.
710
0.0
14.
Mad
hya
Pra
desh
73.0
8.4
3.2
9.3
12.8
-5.4
13.2
-3.2
-0.3
-0.1
-10.
810
0.0
15.
Mah
aras
htra
12.9
-0.7
-9.5
7.5
1.7
5.6
8.3
0.2
-0.3
-0.2
74.5
100.
0
16.
Man
ipur
19.5
-1.6
-1.9
4.6
1.6
--2
.9-
--0
.781
.410
0.0
17.
Meg
hala
ya75
.51.
4-4
.311
.618
.1-
-47.
30.
11.
30.
842
.910
0.0
18.
Miz
oram
23.3
-0.1
-0.6
5.4
4.2
0.1
10.4
--
-1.7
59.1
100.
0
19.
Nag
alan
d26
.6-0
.7-1
.0-1
.919
.1-0
.1-6
3.3
--
-2.9
124.
110
0.0
20.
Odi
sha
70.7
3.3
-7.4
24.7
7.2
--0
.10.
1-1
21.4
0.3
122.
510
0.0
21.
Pun
jab
96.6
6.9
-10.
2-6
.27.
03.
9-0
.7-
--0
.43.
010
0.0
22.
Raj
asth
an94
.36.
0-5
.02.
110
.0-3
.55.
3-0
.1-
-19.
510
.510
0.0
23.
Sik
kim
88.1
-1.1
-1.7
-0.5
18.3
-3.0
--7
.94.
2-0
.13.
610
0.0
24.
Tam
il N
adu
90.5
3.9
-3.9
2.2
4.2
4.0
-4.0
-17.
7-
-20
.910
0.0
25.
Tela
ngan
a93
.81.
4-2
.10.
83.
80.
84.
1-
--1
.3-1
.310
0.0
26.
Trip
ura
112.
5-2
.0-1
1.4
-2.5
4.1
0.2
4.0
0.4
-2.4
--2
.810
0.0
27.
Utt
ar P
rade
sh81
.3-1
.0-1
1.1
7.6
6.3
31.3
-5.5
-6.2
-2.7
0.3
-0.1
100.
0
28.
Utt
arak
hand
96.3
2.6
-7.3
3.6
3.5
--4
.4-
-2.8
-5.0
13.5
100.
0
29.
Wes
t Ben
gal
109.
11.
0-1
8.8
-0.1
3.8
-8.
7-
-2.
1-5
.810
0.0
30.
NC
T D
elhi
-36
1.1
--
--
--
--1
5.0
-246
.110
0.0
31.
Pud
uche
rry
115.
5-3
6.7
--1
2.4
-7.2
--0
.719
3.7
-19.
733
.7-1
66.1
100.
0
All
Sta
tes
and
UTs
73
.72.
6-6
.14.
36.
33.
13.
0-2
.4-3
.7-0
.920
.110
0.0
‘-’ :
Nil/
Neg
ligib
le.
RE
: Rev
ised
Est
imat
es.
No
te:
(1)
Sam
e as
in A
pp
end
ix T
able
9.
(2
) Th
e d
etai
led
bre
ak-u
p o
f ‘D
isch
arge
of I
nter
nal D
ebt’
was
not
ava
ilab
le fo
r Aru
nach
al P
rad
esh
and
the
sam
e ha
s b
een
incl
uded
und
er ‘O
ther
s’. T
he fi
nanc
ing
item
s un
der
‘Int
erna
l Deb
t’
for
thes
e st
ates
are
, the
refo
re, n
ot o
n a
net
bas
is e
xcep
t ‘O
ther
s’.
(3
) ‘O
ther
s’ in
clud
e Lo
ans
from
oth
er in
stitu
tions
, com
pen
satio
n b
ond
s ap
pro
pria
tion
to c
ontin
genc
y fu
nd, i
nter
-sta
te s
ettle
men
t an
d c
ontin
genc
y fu
nd.
So
urce
: B
udge
t d
ocum
ents
of t
he s
tate
gov
ernm
ents
.

State Finances : A Study of Budgets of 2019-20
116
Sta
tem
ent
9: F
inan
cing
of
Gro
ss F
isca
l Defi
cit
- 20
19-2
0 (B
E)
(` C
rore
)
Stat
e/U
TM
arke
t B
orro
win
gsLo
ans
from
Cen
tre
Spe
cial
S
ecur
ities
is
sued
to N
SS
F
Loan
s fr
om L
IC,
NA
BA
RD
, N
CD
C, S
BI
and
othe
r B
anks
Pro
vide
nt
Fund
s,
etc.
Res
erve
Fu
nds
Dep
osits
an
d A
dvan
ces
Sus
pens
e an
d M
isce
llane
ous
Rem
ittan
ces
Oth
ers
Ove
rall
Sur
plus
(-)/
D
efici
t (+
)
Gro
ss F
isca
l S
urpl
us (-
)/D
efici
t (+
) (C
ol.2
to 1
2)
12
34
56
78
910
1112
13
1.
And
hra
Pra
desh
32,1
27.0
1,23
4.8
-1,2
12.5
1,04
8.1
1,87
5.2
37.8
-156
.4-
--1
,193
.51,
500.
035
,260
.6
2.
Aru
nach
al P
rade
sh79
0.9
-25.
8-4
2.0
263.
138
4.2
-251
.810
5.4
7.2
-449
.3-5
61.3
300.
452
1.0
3.
Ass
am9,
840.
710
6.9
-755
.084
1.7
1,18
9.1
--6
46.9
141.
3-5
.4-0
.740
1.8
11,1
13.5
4.
Bih
ar15
,970
.21,
601.
8-1
,888
.31,
503.
2-1
00.0
-99
.0-1
,082
.7-
-2.1
-16
,101
.1
5.
Chh
attis
garh
10,2
26.0
438.
6-4
60.0
549.
861
1.5
22.0
-33.
5-
--0
.5-4
73.4
10,8
80.5
6.
Goa
1,40
0.0
-13.
9-2
04.7
77.8
259.
510
9.2
294.
8-5
27.1
-180
.6-6
.53,
261.
34,
469.
7
7.
Guj
arat
25,6
99.5
1,88
3.1
-3,6
29.4
2,38
4.8
282.
49.
31,
336.
681
6.3
325.
4-
2,14
4.9
31,2
52.9
8.
Har
yana
22,4
00.0
26.9
-1,0
04.4
1,08
2.7
453.
023
5.0
-1,2
38.0
-50.
0-5
0.0
5.0
601.
822
,462
.0
9.
Him
acha
l Pra
desh
4,20
2.4
-28.
6-5
69.1
240.
11,
250.
0-
--
--2
5.7
2,28
3.3
7,35
2.3
10.
Jam
mu
and
Kas
hmir
5,68
6.2
-112
.7-
271.
42,
055.
940
.3-
26.7
-1,
149.
51,
955.
211
,072
.3
11.
Jhar
khan
d5,
456.
042
7.2
-769
.51,
707.
0-1
33.0
-20
9.0
-188
.346
.883
4.9
-434
.67,
155.
6
12.
Kar
nata
ka40
,126
.9-4
4.1
-1,6
27.9
185.
13,
452.
0-1
,338
.5-1
,729
.0-
--3
.53,
030.
142
,051
.0
13.
Ker
ala
21,2
34.0
1,30
9.8
778.
3-5
1.4
4,91
5.7
96.9
113.
9-3
,655
.075
.3-3
4.9
1,50
8.1
26,2
90.6
14.
Mad
hya
Pra
desh
21,7
62.0
2,63
6.2
1,05
2.1
2,72
2.0
4,40
0.0
-1,8
51.2
4,16
7.3
-1,0
21.7
-87.
28.
5-1
,682
.332
,105
.7
15.
Mah
aras
htra
50,4
99.0
-595
.4-5
,380
.76,
570.
81,
193.
73,
455.
94,
321.
810
5.3
-176
.1-9
1.7
332.
060
,234
.5
16.
Man
ipur
297.
2-5
3.4
-64.
350
.614
2.5
--9
0.0
--
-21.
01,
627.
41,
889.
2
17.
Meg
hala
ya96
6.7
40.1
-55.
018
4.0
65.1
--2
0.0
6.0
5.0
9.6
121.
41,
322.
8
18.
Miz
oram
444.
78.
5-1
1.7
105.
1-1
79.5
1.0
100.
0-
--1
2.4
78.5
534.
1
19.
Nag
alan
d52
9.7
0.4
-13.
3-3
1.2
468.
0-1
.0-9
.0-
--4
3.3
-49.
785
0.6
20.
Odi
sha
15,4
33.9
340.
0-9
82.5
3,03
7.9
1,00
0.0
2,10
1.2
862.
0-3
.5-2
13.6
47.7
-2,7
46.0
18,8
77.0
21.
Pun
jab
17,5
90.0
545.
3-1
,841
.5-9
30.7
1,26
8.7
859.
0-1
27.7
--
-28.
02,
322.
819
,657
.9
22.
Raj
asth
an28
,659
.63,
778.
4-1
,584
.848
1.6
3,03
5.7
471.
41,
835.
0-4
7.0
7.3
-6,6
95.7
2,73
6.8
32,6
78.3
23.
Sik
kim
484.
3-2
.1-1
6.1
-6.6
149.
224
6.7
--
--2
.4-
853.
0
24.
Tam
il N
adu
40,6
01.0
1,87
0.8
-1,8
03.1
724.
31,
613.
11,
858.
8-1
,659
.446
1.5
--6
.151
5.5
44,1
76.4
25.
Tela
ngan
a24
,588
.343
0.0
-827
.313
7.7
300.
01,
602.
6-1
,402
.6-
--6
94.5
-52.
524
,081
.7
26.
Trip
ura
1,82
7.0
-27.
3-1
19.1
64.1
50.0
-2.1
49.8
5.0
-30.
0-0
.2-2
2.7
1,79
4.5
27.
Utt
ar P
rade
sh41
,954
.6-9
6.5
-5,1
22.1
4,18
7.5
1,23
4.4
7,96
7.9
-8,0
63.4
5,21
1.1
-1,2
00.0
-3,0
29.5
3,86
6.6
46,9
10.6
28.
Utt
arak
hand
6,99
9.5
118.
9-4
00.0
96.0
151.
4-0
.1-4
.612
.80.
6-2
50.7
74.5
6,79
8.2
29.
Wes
t Ben
gal
37,2
22.1
977.
6-6
,340
.0-2
4.4
1,30
9.2
-138
.33,
083.
2-4
.3-
516.
2-9
,347
.027
,254
.4
30.
NC
T D
elhi
-1,
454.
9-
--
--
--
-4,
447.
05,
901.
9
31.
Pud
uche
rry
566.
0-1
25.8
--2
9.2
-2.2
--1
.683
4.2
-85.
211
4.3
-745
.252
5.3
All
Sta
tes
and
UTs
4,
85,5
85.6
18,1
04.4
-34,
893.
827
,442
.632
,694
.715
,532
.01,
395.
51,
047.
6-2
,017
.0-1
0,01
8.4
17,5
55.8
5,52
,429
.1
‘-’ :
Nil/
Neg
ligib
le.
BE
: Bud
get
Est
imat
es.
No
te:
(1)
Sam
e as
in A
pp
end
ix T
able
9.
(2
) Th
e d
etai
led
bre
ak-u
p o
f ‘D
isch
arge
of I
nter
nal D
ebt’
was
not
ava
ilab
le fo
r Aru
nach
al P
rad
esh
and
the
sam
e ha
s b
een
incl
uded
und
er ‘O
ther
s’. T
he fi
nanc
ing
item
s un
der
‘Int
erna
l Deb
t’
for
thes
e st
ates
are
, the
refo
re, n
ot o
n a
net
bas
is e
xcep
t ‘O
ther
s’.
(3
) ‘O
ther
s’ in
clud
e Lo
ans
from
oth
er in
stitu
tions
, com
pen
satio
n b
ond
s ap
pro
pria
tion
to c
ontin
genc
y fu
nd, i
nter
-sta
te s
ettle
men
t an
d c
ontin
genc
y fu
nd.
So
urce
: B
udge
t d
ocum
ents
of t
he s
tate
gov
ernm
ents
.

Statements
117
Sta
tem
ent
10: F
inan
cing
of
Gro
ss F
isca
l Defi
cit
- A
s P
er c
ent
to T
ota
l - 2
019-
20 (B
E)
(Per
cen
t)
Stat
e/U
TM
arke
t B
orro
win
gsLo
ans
from
Cen
tre
Spe
cial
S
ecur
ities
is
sued
to N
SS
F
Loan
s fr
om L
IC,
NA
BA
RD
, N
CD
C, S
BI
and
othe
r B
anks
Pro
vide
nt
Fund
s,
etc.
Res
erve
Fu
nds
Dep
osits
an
d A
dvan
ces
Sus
pens
e an
d M
isce
llane
ous
Rem
ittan
ces
Oth
ers
Ove
rall
Sur
plus
(-)/
D
efici
t (+
)
Gro
ss F
isca
l S
urpl
us (-
)/D
efici
t (+
) (C
ol.2
to 1
2)
12
34
56
78
910
1112
13
1.
And
hra
Pra
desh
91.1
3.5
-3.4
3.0
5.3
0.1
-0.4
--
-3.4
4.3
100.
0
2.
Aru
nach
al P
rade
sh15
1.8
-5.0
-8.1
50.5
73.8
-48.
320
.21.
4-8
6.2
-107
.757
.710
0.0
3.
Ass
am88
.51.
0-6
.87.
610
.7-
-5.8
1.3
--
3.6
100.
0
4.
Bih
ar99
.29.
9-1
1.7
9.3
-0.6
-0.
6-6
.7-
--
100.
0
5.
Chh
attis
garh
94.0
4.0
-4.2
5.1
5.6
0.2
-0.3
--
--4
.410
0.0
6.
Goa
31.3
-0.3
-4.6
1.7
5.8
2.4
6.6
-11.
8-4
.0-0
.173
.010
0.0
7.
Guj
arat
82.2
6.0
-11.
67.
60.
9-
4.3
2.6
1.0
-6.
910
0.0
8.
Har
yana
99.7
0.1
-4.5
4.8
2.0
1.0
-5.5
-0.2
-0.2
-2.
710
0.0
9.
Him
acha
l Pra
desh
57.2
-0.4
-7.7
3.3
17.0
--
--
-0.3
31.1
100.
0
10.
Jam
mu
and
Kas
hmir
51.4
-1.0
-2.
518
.60.
4-
0.2
-10
.417
.710
0.0
11.
Jhar
khan
d76
.26.
0-1
0.8
23.9
-1.9
-2.
9-2
.60.
711
.7-6
.110
0.0
12.
Kar
nata
ka95
.4-0
.1-3
.90.
48.
2-3
.2-4
.1-
--
7.2
100.
0
13.
Ker
ala
80.8
5.0
3.0
-0.2
18.7
0.4
0.4
-13.
90.
3-0
.15.
710
0.0
14.
Mad
hya
Pra
desh
67.8
8.2
3.3
8.5
13.7
-5.8
13.0
-3.2
-0.3
--5
.210
0.0
15.
Mah
aras
htra
83.8
-1.0
-8.9
10.9
2.0
5.7
7.2
0.2
-0.3
-0.2
0.6
100.
0
16.
Man
ipur
15.7
-2.8
-3.4
2.7
7.5
--4
.8-
--1
.186
.110
0.0
17.
Meg
hala
ya73
.13.
0-4
.213
.94.
9-
-1.5
0.5
0.4
0.7
9.2
100.
0
18.
Miz
oram
83.3
1.6
-2.2
19.7
-33.
60.
218
.7-
--2
.314
.710
0.0
19.
Nag
alan
d62
.3-
-1.6
-3.7
55.0
-0.1
-1.1
--
-5.1
-5.8
100.
0
20.
Odi
sha
81.8
1.8
-5.2
16.1
5.3
11.1
4.6
--1
.10.
3-1
4.5
100.
0
21.
Pun
jab
89.5
2.8
-9.4
-4.7
6.5
4.4
-0.6
--
-0.1
11.8
100.
0
22.
Raj
asth
an87
.711
.6-4
.81.
59.
31.
45.
6-0
.1-
-20.
58.
410
0.0
23.
Sik
kim
56.8
-0.2
-1.9
-0.8
17.5
28.9
--
--0
.3-
100.
0
24.
Tam
il N
adu
91.9
4.2
-4.1
1.6
3.7
4.2
-3.8
1.0
--
1.2
100.
0
25.
Tela
ngan
a10
2.1
1.8
-3.4
0.6
1.2
6.7
-5.8
--
-2.9
-0.2
100.
0
26.
Trip
ura
101.
8-1
.5-6
.63.
62.
8-0
.12.
80.
3-1
.7-
-1.3
100.
0
27.
Utt
ar P
rade
sh89
.4-0
.2-1
0.9
8.9
2.6
17.0
-17.
211
.1-2
.6-6
.58.
210
0.0
28.
Utt
arak
hand
103.
01.
7-5
.91.
42.
2-
-0.1
0.2
--3
.71.
110
0.0
29.
Wes
t Ben
gal
136.
63.
6-2
3.3
-0.1
4.8
-0.5
11.3
--
1.9
-34.
310
0.0
30.
NC
T D
elhi
-24
.7-
--
--
--
-75
.310
0.0
31.
Pud
uche
rry
107.
7-2
3.9
--5
.6-0
.4-
-0.3
158.
8-1
6.2
21.8
-141
.910
0.0
All
Sta
tes
and
UTs
87
.93.
3-6
.35.
05.
92.
80.
30.
2-0
.4-1
.83.
210
0.0
‘-’ :
Nil/
Neg
ligib
le.
BE
: Bud
get
Est
imat
es.
No
te:
(1)
Sam
e as
in A
pp
end
ix T
able
9.
(2
) Th
e d
etai
led
bre
ak-u
p o
f ‘D
isch
arge
of I
nter
nal D
ebt’
was
not
ava
ilab
le fo
r Aru
nach
al P
rad
esh
and
the
sam
e ha
s b
een
incl
uded
und
er ‘O
ther
s’. T
he fi
nanc
ing
item
s un
der
‘Int
erna
l Deb
t’
for
thes
e st
ates
are
, the
refo
re, n
ot o
n a
net
bas
is e
xcep
t ‘O
ther
s’.
(3
) ‘O
ther
s’ in
clud
e Lo
ans
from
oth
er in
stitu
tions
, com
pen
satio
n b
ond
s ap
pro
pria
tion
to c
ontin
genc
y fu
nd, i
nter
-sta
te s
ettle
men
t an
d c
ontin
genc
y fu
nd.
So
urce
: B
udge
t d
ocum
ents
of t
he s
tate
gov
ernm
ents
.

State Finances : A Study of Budgets of 2019-20
118
Statement 11: Development Expenditure*(` Crore)
State/UT 2017-18 (Accounts)
2018-19 (Revised
Estimates)
2019-20 (Budget
Estimates)
Variation (Per cent)
Col.3/Col.2 Col.4/Col.3
1 2 3 4 5 6
1. Andhra Pradesh 97,992.0 1,08,246.6 1,64,649.2 10.5 52.1
2. Arunachal Pradesh 10,060.6 16,012.7 13,393.4 59.2 -16.4
3. Assam 40,889.4 74,599.5 67,319.7 82.4 -9.8
4. Bihar 95,619.2 1,38,831.3 1,42,449.6 45.2 2.6
5. Chhattisgarh 52,061.1 75,674.4 72,309.3 45.4 -4.4
6. Goa 8,740.9 11,735.0 12,884.7 34.3 9.8
7. Gujarat 1,02,215.5 1,24,196.7 1,29,118.3 21.5 4.0
8. Haryana 60,563.7 71,588.3 74,971.7 18.2 4.7
9. Himachal Pradesh 20,097.4 25,974.0 26,572.0 29.2 2.3
10. Jammu and Kashmir 33,602.9 60,151.0 57,879.3 79.0 -3.8
11. Jharkhand 47,384.1 57,578.6 62,040.1 21.5 7.7
12. Karnataka 1,36,287.6 1,54,964.4 1,65,841.2 13.7 7.0
13. Kerala 57,232.1 64,213.5 74,888.8 12.2 16.6
14. Madhya Pradesh 1,22,801.6 1,32,952.3 1,60,062.5 8.3 20.4
15. Maharashtra 1,73,992.5 2,33,173.1 2,45,501.0 34.0 5.3
16. Manipur 6,395.0 10,112.7 9,475.9 58.1 -6.3
17. Meghalaya 6,535.6 10,003.4 11,405.0 53.1 14.0
18. Mizoram 6,544.1 7,373.6 5,996.8 12.7 -18.7
19. Nagaland 6,879.7 7,676.2 8,225.3 11.6 7.2
20. Odisha 72,808.0 88,103.1 1,01,776.0 21.0 15.5
21. Punjab 29,558.8 47,417.2 67,370.1 60.4 42.1
22. Rajasthan 1,23,821.2 1,39,630.7 1,53,827.0 12.8 10.2
23. Sikkim 3,934.4 5,403.5 5,269.7 37.3 -2.5
24. Tamil Nadu 1,21,678.9 1,42,976.6 1,45,957.1 17.5 2.1
25. Telangana 83,953.4 1,20,484.9 1,03,848.8 43.5 -13.8
26. Tripura 7,538.2 10,178.9 10,866.8 35.0 6.8
27. Uttar Pradesh 1,86,705.2 2,74,136.3 2,74,973.6 46.8 0.3
28. Uttarakhand 20,392.4 23,153.8 27,073.9 13.5 16.9
29. West Bengal 1,06,505.2 1,26,836.5 1,29,818.6 19.1 2.4
30. NCT Delhi 30,366.9 35,442.1 44,192.5 16.7 24.7
31. Puducherry 4,234.6 4,937.7 5,285.7 16.6 7.0
All States and UTs 18,77,392.3 24,03,758.9 25,75,243.6 28.0 7.1
*: Comprise expenditure on Revenue and capital accounts and loans and advances extended by states for development purposes.Source : Budget documents of the state governments. Details in methodology.

Statements
119
Statement 12: Non-Development Expenditure*(` Crore)
State/UT 2017-18 (Accounts)
2018-19 (Revised
Estimates)
2019-20 (Budget
Estimates)
Variation (Per cent)
Col.3/Col.2 Col.4/Col.3
1 2 3 4 5 6
1. Andhra Pradesh 39,407.2 40,292.8 49,873.8 2.2 23.8
2. Arunachal Pradesh 4,033.0 4,782.0 8,028.4 18.6 67.9
3. Assam 22,413.4 27,111.9 27,504.0 21.0 1.4
4. Bihar 36,150.3 44,755.0 50,809.5 23.8 13.5
5. Chhattisgarh 13,173.7 16,183.7 17,979.9 22.8 11.1
6. Goa 3,930.0 4,274.6 5,187.4 8.8 21.4
7. Gujarat 42,314.4 48,105.2 56,707.7 13.7 17.9
8. Haryana 27,235.9 30,965.1 36,937.2 13.7 19.3
9. Himachal Pradesh 11,203.7 13,018.9 14,543.1 16.2 11.7
10. Jammu and Kashmir 17,691.2 25,590.4 26,490.0 44.7 3.5
11. Jharkhand 17,370.7 19,539.1 19,544.4 12.5 -
12. Karnataka 35,464.0 45,392.1 51,491.2 28.0 13.4
13. Kerala 45,808.5 52,996.4 57,143.1 15.7 7.8
14. Madhya Pradesh 32,842.7 39,921.2 46,542.7 21.6 16.6
15. Maharashtra 79,607.1 90,964.3 1,09,426.8 14.3 20.3
16. Manipur 3,776.6 4,501.9 5,000.2 19.2 11.1
17. Meghalaya 2,892.5 3,701.3 4,380.8 28.0 18.4
18. Mizoram 2,377.9 3,028.6 4,423.2 27.4 46.0
19. Nagaland 4,586.7 5,634.1 5,800.4 22.8 3.0
20. Odisha 20,750.6 26,495.1 31,076.7 27.7 17.3
21. Punjab 34,717.0 37,833.0 41,249.4 9.0 9.0
22. Rajasthan 43,977.5 55,708.3 59,073.2 26.7 6.0
23. Sikkim 1,677.9 2,208.3 2,883.0 31.6 30.6
24. Tamil Nadu 61,444.6 74,063.9 82,466.5 20.5 11.3
25. Telangana 31,489.5 34,110.8 33,367.7 8.3 -2.2
26. Tripura 4,497.0 5,456.5 5,760.1 21.3 5.6
27. Uttar Pradesh 1,08,560.1 1,42,702.7 1,54,853.0 31.5 8.5
28. Uttarakhand 13,212.9 15,288.2 16,530.9 15.7 8.1
29. West Bengal 53,421.3 58,075.0 61,590.2 8.7 6.1
30. NCT Delhi 7,783.5 8,666.6 8,537.4 11.3 -1.5
31. Puducherry 1,962.6 2,280.8 2,546.6 16.2 11.7
All States and UTs 8,25,774.0 9,83,647.7 10,97,748.6 19.1 11.6
*: Comprise expenditure on revenue and capital accounts and loans and advances extended by states for non-development purposes.Source : Budget documents of the state governments. Details in methodology.

State Finances : A Study of Budgets of 2019-20
120
Sta
tem
ent
13: I
nter
est
Pay
men
ts(`
Cro
re)
Stat
e/U
T20
17-1
8 (A
ccou
nts)
2018
-19
(Rev
ised
Est
imat
es)
2019
-20
(Bud
get
Est
imat
es)
Vari
atio
n (P
er c
ent)
Co
l.4/C
ol.2
Co
l.5/C
ol.3
Co
l.6/C
ol.4
Co
l.7/C
ol.5
Gro
ssN
et*
Gro
ssN
et*
Gro
ssN
et*
Gro
ssN
etG
ross
Net
12
34
56
78
910
11
1.
And
hra
Pra
des
h13
,846
.913
,750
.814
,303
.514
,253
.417
,243
.817
,093
.83.
33.
720
.619
.9
2.
Aru
nach
al P
rad
esh
467.
442
0.4
528.
742
8.0
635.
151
6.2
13.1
1.8
20.1
20.6
3.
Ass
am3,
205.
32,
899.
94,
193.
33,
107.
64,
792.
94,
416.
730
.87.
214
.342
.1
4.
Bih
ar9,
053.
87,
476.
510
,764
.88,
577.
410
,723
.58,
429.
618
.914
.7-0
.4-1
.7
5.
Chh
attis
garh
3,09
8.3
2,91
7.9
3,88
8.1
3,70
0.4
4,69
9.0
4,57
2.2
25.5
26.8
20.9
23.6
6.
Goa
1,24
4.3
1,21
7.0
1,37
2.1
1,34
2.6
1,51
2.3
1,47
8.9
10.3
10.3
10.2
10.2
7.
Guj
arat
18,9
54.0
17,8
72.6
20,3
39.9
19,1
39.9
21,5
09.4
20,2
13.4
7.3
7.1
5.7
5.6
8.
Har
yana
11,9
61.3
9,73
3.5
13,8
46.6
11,9
84.5
16,6
32.6
15,0
10.0
15.8
23.1
20.1
25.2
9.
Him
acha
l Pra
des
h3,
788.
23,
447.
74,
100.
03,
786.
94,
550.
04,
231.
88.
29.
811
.011
.7
10.
Jam
mu
and
Kas
hmir
4,66
2.9
4,64
3.7
5,66
4.7
5,66
2.2
6,94
1.1
6,93
8.7
21.5
21.9
22.5
22.5
11.
Jhar
khan
d4,
661.
74,
492.
85,
473.
05,
308.
05,
187.
14,
992.
117
.418
.1-5
.2-6
.0
12.
Kar
nata
ka13
,929
.612
,751
.215
,596
.014
,358
.219
,060
.317
,823
.712
.012
.622
.224
.1
13.
Ker
ala
15,1
19.9
14,9
75.4
15,6
26.4
15,4
50.6
17,2
01.3
17,0
03.3
3.4
3.2
10.1
10.0
14.
Mad
hya
Pra
des
h11
,045
.310
,406
.212
,242
.411
,892
.414
,432
.114
,082
.110
.814
.317
.918
.4
15.
Mah
aras
htra
33,0
18.4
28,8
55.9
33,9
29.1
31,0
28.1
35,2
07.0
32,6
07.0
2.8
7.5
3.8
5.1
16.
Man
ipur
563.
054
3.7
629.
260
9.9
655.
463
5.1
11.8
12.2
4.2
4.1
17.
Meg
hala
ya59
1.2
538.
765
3.5
605.
974
6.2
691.
110
.512
.514
.214
.1
18.
Miz
oram
339.
228
8.1
390.
136
6.0
359.
033
3.1
15.0
27.1
-8.0
-9.0
19.
Nag
alan
d67
7.8
670.
878
0.1
772.
288
1.2
873.
215
.115
.113
.013
.1
20.
Od
isha
4,98
8.3
4,38
7.6
5,85
0.0
4,95
0.0
6,50
0.0
5,50
0.0
17.3
12.8
11.1
11.1
21.
Pun
jab
15,3
34.0
13,9
29.0
16,3
11.5
14,8
78.8
17,6
69.3
16,2
35.9
6.4
6.8
8.3
9.1
22.
Raj
asth
an19
,720
.014
,861
.121
,737
.415
,926
.923
,132
.719
,290
.710
.27.
26.
421
.1
23.
Sik
kim
362.
224
7.4
463.
533
7.7
537.
245
0.9
28.0
36.5
15.9
33.5
24.
Tam
il N
adu
26,0
11.5
20,8
13.0
28,7
03.9
22,0
09.2
32,4
61.0
27,9
97.9
10.4
5.7
13.1
27.2
25.
Tela
ngan
a10
,835
.510
,719
.711
,696
.411
,509
.814
,574
.714
,456
.87.
97.
424
.625
.6
26.
Trip
ura
886.
960
9.9
926.
578
1.1
989.
891
9.8
4.5
28.1
6.8
17.8
27.
Utt
ar P
rad
esh
29,1
35.8
28,0
42.4
31,8
70.7
31,0
27.1
35,3
73.9
34,1
73.9
9.4
10.6
11.0
10.1
28.
Utt
arak
hand
3,98
7.3
3,90
1.9
4,90
4.8
4,84
7.7
5,33
2.2
5,25
7.2
23.0
24.2
8.7
8.4
29.
Wes
t B
enga
l28
,073
.826
,678
.129
,140
.027
,660
.631
,151
.229
,568
.23.
83.
76.
96.
9
30.
NC
T D
elhi
2,87
0.7
2,47
4.4
2,86
7.1
2,68
0.2
3,17
8.3
2,74
9.3
-0.1
8.3
10.9
2.6
31.
Pud
uche
rry
686.
258
7.3
708.
053
7.7
930.
385
5.0
3.2
-8.4
31.4
59.0
All
Sta
tes
and
UTs
2,
93,1
20.5
2,
65,1
54.5
3,
19,5
01.5
2,
89,5
21.3
3,
54,7
99.7
3,
29,3
97.5
9.
0 9.
211
.013
.8
*: G
ross
Inte
rest
Pay
men
t m
inus
Inte
rest
Rec
eip
ts.
So
urce
: Bud
get
doc
umen
ts o
f the
sta
te g
over
nmen
ts. D
etai
ls in
met
hod
olog
y.

Statements
121
Sta
tem
ent
14: T
ax R
even
ue*
(Per
cen
t)
Stat
e/U
TTa
x R
even
ueO
wn
Tax
Rev
enue
Sha
re in
Cen
tral
Tax
es
2017
-18
(Acc
ount
s)20
18-1
9 (R
E)
2019
-20
(BE
)20
17-1
8(A
ccou
nts)
2018
-19
(RE
)20
19-2
0(B
E)
2017
-18
(Acc
ount
s)20
18-1
9 (R
E)
2019
-20
(BE
)
12
34
56
78
910
1.
And
hra
Pra
des
h4.
54.
54.
94.
64.
65.
44.
34.
24.
1
2.
Aru
nach
al P
rad
esh
0.6
0.6
0.6
0.2
0.1
0.1
1.4
1.4
1.4
3.
Ass
am2.
02.
22.
31.
41.
51.
33.
33.
34.
0
4.
Bih
ar5.
15.
35.
42.
62.
62.
69.
79.
810
.2
5.
Chh
attis
garh
2.3
2.3
2.2
1.9
1.8
1.7
3.1
3.1
3.2
6.
Goa
0.4
0.4
0.4
0.4
0.4
0.4
0.4
0.4
0.4
7.
Guj
arat
5.3
5.3
5.2
6.5
6.6
6.5
3.1
3.1
3.1
8.
Har
yana
2.8
2.9
2.8
3.7
4.0
3.6
1.1
1.1
1.3
9.
Him
acha
l Pra
des
h0.
70.
60.
70.
70.
50.
60.
70.
70.
9
10.
Jam
mu
and
Kas
hmir
1.2
1.1
1.1
1.0
0.7
0.7
1.8
1.7
1.7
11.
Jhar
khan
d1.
92.
32.
21.
31.
71.
73.
13.
23.
1
12.
Kar
nata
ka6.
86.
56.
38.
07.
67.
24.
74.
64.
7
13.
Ker
ala
3.6
3.6
3.9
4.3
4.3
4.8
2.5
2.5
2.5
14.
Mad
hya
Pra
des
h5.
55.
45.
74.
44.
24.
67.
67.
67.
5
15.
Mah
aras
htra
11.8
11.4
11.4
15.2
14.9
15.0
5.5
5.5
5.5
16.
Man
ipur
0.3
0.3
0.3
0.1
0.1
0.1
0.6
0.6
0.6
17.
Meg
hala
ya0.
30.
30.
30.
20.
20.
10.
60.
60.
6
18.
Miz
oram
0.2
0.2
0.2
0.1
--
0.5
0.4
0.5
19.
Nag
alan
d0.
20.
20.
20.
10.
10.
10.
50.
50.
5
20.
Od
isha
3.4
3.2
3.2
2.7
2.4
2.3
4.6
4.6
4.6
21.
Pun
jab
2.4
2.2
2.3
2.8
2.6
2.7
1.6
1.5
1.6
22.
Raj
asth
an5.
05.
15.
24.
84.
95.
25.
55.
55.
2
23.
Sik
kim
0.2
0.2
0.2
0.1
0.1
0.1
0.4
0.4
0.3
24.
Tam
il N
adu
7.0
6.9
7.0
8.5
8.7
8.9
4.0
4.0
4.0
25.
Tela
ngan
a4.
24.
23.
95.
15.
24.
92.
42.
42.
3
26.
Trip
ura
0.3
0.4
0.4
0.2
0.2
0.2
0.6
0.7
0.7
27.
Utt
ar P
rad
esh
12.6
13.6
13.0
9.7
10.9
10.2
18.0
18.1
17.5
28.
Utt
arak
hand
1.0
1.1
1.0
1.0
1.2
1.0
1.1
1.1
1.0
29.
Wes
t B
enga
l5.
95.
85.
75.
14.
94.
87.
37.
47.
1
30.
NC
T D
elhi
2.1
1.9
1.9
3.2
3.0
3.0
--
-
31.
Pud
uche
rry
0.1
0.1
0.1
0.2
0.2
0.2
--
-
All
Sta
tes
and
UTs
10
0.0
100.
010
0.0
100.
010
0.0
100.
010
0.0
100.
010
0.0
‘–’:
Not
ap
plic
able
.
RE
: R
evis
ed E
stim
ates
.
BE
: B
udge
t E
stim
ates
. ‘*
’ : A
s a
ratio
to
tota
l (al
l sta
tes
and
Uts
)S
our
ce :
Bud
get
doc
umen
ts o
f the
sta
te g
over
nmen
ts. D
etai
ls in
met
hod
olog
y.

State Finances : A Study of Budgets of 2019-20
122
Sta
tem
ent
15: N
on-
Tax
Rev
enue
*(P
er c
ent)
Stat
e/U
TN
on-
Tax
Rev
enue
Ow
n N
on-
Tax
Rev
enue
Gra
nts
2017
-18
(Acc
ount
s)20
18-1
9 (R
E)
2019
-20
(BE
)20
17-1
8(A
ccou
nts)
2018
-19
(RE
)20
19-2
0(B
E)
2017
-18
(Acc
ount
s)20
18-1
9 (R
E)
2019
-20
(BE
)
12
34
56
78
910
1.
And
hra
Pra
des
h4.
52.
97.
72.
12.
03.
05.
63.
29.
4
2.
Aru
nach
al P
rad
esh
0.6
1.0
0.9
0.2
0.4
0.4
0.8
1.2
1.0
3.
Ass
am3.
25.
53.
42.
35.
93.
53.
65.
43.
4
4.
Bih
ar5.
06.
16.
02.
02.
02.
06.
37.
67.
6
5.
Chh
attis
garh
3.2
3.3
3.2
3.5
3.7
3.6
3.1
3.2
3.1
6.
Goa
0.6
0.4
0.5
1.7
1.3
1.3
0.2
0.1
0.2
7.
Guj
arat
5.3
4.0
4.1
8.4
5.4
5.7
3.9
3.5
3.5
8.
Har
yana
2.4
2.1
2.2
5.1
4.1
4.1
1.3
1.4
1.5
9.
Him
acha
l Pra
des
h2.
62.
32.
11.
31.
01.
03.
22.
72.
5
10.
Jam
mu
and
Kas
hmir
4.6
5.3
5.2
2.4
2.6
2.5
5.6
6.3
6.2
11.
Jhar
khan
d3.
32.
82.
74.
44.
24.
42.
82.
32.
1
12.
Kar
nata
ka4.
84.
14.
53.
63.
33.
35.
34.
45.
0
13.
Ker
ala
3.4
3.2
3.0
6.2
5.8
6.1
2.1
2.3
1.8
14.
Mad
hya
Pra
des
h6.
74.
95.
65.
04.
35.
77.
45.
15.
6
15.
Mah
aras
htra
6.6
6.7
6.4
9.3
7.6
6.9
5.4
6.3
6.2
16.
Man
ipur
0.9
0.8
0.8
0.1
0.1
0.1
1.3
1.1
1.0
17.
Meg
hala
ya0.
60.
70.
80.
20.
20.
20.
80.
91.
0
18.
Miz
oram
0.8
0.6
0.6
0.2
0.1
0.2
1.1
0.7
0.8
19.
Nag
alan
d1.
20.
90.
90.
20.
20.
11.
61.
21.
2
20.
Od
isha
4.4
4.5
4.8
4.7
5.0
5.1
4.3
4.3
4.7
21.
Pun
jab
2.0
3.1
3.1
2.4
4.4
3.9
1.9
2.6
2.8
22.
Raj
asth
an6.
85.
35.
18.
88.
97.
85.
94.
04.
1
23.
Sik
kim
0.3
0.4
0.4
0.4
0.3
0.3
0.3
0.4
0.4
24.
Tam
il N
adu
4.3
4.8
4.4
6.0
6.6
5.4
3.6
4.1
4.0
25.
Tela
ngan
a2.
74.
22.
74.
42.
86.
52.
04.
71.
3
26.
Trip
ura
0.7
0.9
0.7
0.3
0.2
0.1
0.9
1.2
0.9
27.
Utt
ar P
rad
esh
10.3
12.5
11.0
11.0
12.9
12.5
10.0
12.3
10.5
28.
Utt
arak
hand
1.7
1.4
1.7
1.0
1.7
1.7
2.0
1.3
1.7
29.
Wes
t B
enga
l5.
04.
24.
11.
71.
91.
66.
45.
05.
0
30.
NC
T D
elhi
0.5
0.8
0.8
0.4
0.3
0.3
0.5
0.9
1.0
31.
Pud
uche
rry
0.6
0.5
0.5
0.8
0.8
0.7
0.5
0.4
0.4
All
Sta
tes
and
UTs
10
0.0
100.
010
0.0
100.
010
0.0
100.
010
0.0
100.
010
0.0
RE
: R
evis
ed E
stim
ates
.
BE
: B
udge
t E
stim
ates
. ‘*
’ : A
s a
ratio
to
tota
l (al
l sta
tes
and
UTs
)S
our
ce :
Bud
get
doc
umen
ts o
f the
sta
te g
over
nmen
ts. D
etai
ls in
met
hod
olog
y.

Statements
123
Sta
tem
ent
16: L
oan
s fr
om
the
Cen
tre
(` C
rore
)
Stat
e/U
T20
17-1
8 (A
ccou
nts)
2018
-19
(Rev
ised
Est
imat
es)
2019
-20
(Bud
get
Est
imat
es)
Vari
atio
n (P
er c
ent)
Co
l.4/C
ol.2
Co
l.5/C
ol.3
Co
l.6/C
ol.4
Co
l.7/C
ol.5
Gro
ssN
et*
Gro
ssN
et*
Gro
ssN
et*
Gro
ssN
etG
ross
Net
12
34
56
78
910
11
1.
And
hra
Pra
des
h94
6.8
-47.
91,
990.
41,
251.
72,
500.
01,
234.
811
0.2
..25
.6-1
.3
2.
Aru
nach
al P
rad
esh
--2
6.4
--2
6.3
--2
5.8
--0
.4-
-1.9
3.
Ass
am69
.6-6
8.6
114.
5-2
7.5
252.
310
6.9
64.5
-59.
812
0.4
-487
.9
4.
Bih
ar1,
398.
758
6.1
2,27
5.0
1,25
1.1
2,68
5.0
1,60
1.8
62.7
113.
518
.028
.0
5.
Chh
attis
garh
464.
629
2.4
600.
043
8.6
600.
043
8.6
29.2
50.0
--
6.
Goa
78.0
-10.
078
.0-1
8.6
82.7
-13.
9-
87.0
6.0
-25.
1
7.
Guj
arat
89.8
-619
.42,
000.
01,
276.
02,
600.
01,
883.
1..
-306
.030
.047
.6
8.
Har
yana
141.
0-4
4.6
292.
889
.823
1.4
26.9
107.
6-3
01.5
-21.
0-7
0.0
9.
Him
acha
l Pra
des
h81
.93.
065
.5-1
9.6
58.4
-28.
6-2
0.0
-753
.8-1
0.9
46.0
10.
Jam
mu
and
Kas
hmir
31.6
-84.
430
.0-8
7.2
5.0
-112
.7-5
.13.
4-8
3.3
29.2
11.
Jhar
khan
d23
1.6
70.6
600.
039
1.6
600.
042
7.2
159.
145
4.8
-9.
1
12.
Kar
nata
ka1,
943.
276
1.1
1,19
5.5
-245
.81,
473.
8-4
4.1
-38.
5-1
32.3
23.3
-82.
1
13.
Ker
ala
444.
8-1
30.1
1,23
3.8
641.
62,
032.
51,
309.
817
7.4
..64
.710
4.1
14.
Mad
hya
Pra
des
h1,
916.
882
4.0
3,63
6.0
2,39
6.2
4,00
0.0
2,63
6.2
89.7
190.
810
.010
.0
15.
Mah
aras
htra
167.
8-7
80.8
872.
6-3
69.5
637.
1-5
95.4
420.
0-5
2.7
-27.
061
.2
16.
Man
ipur
9.0
-35.
1-
-48.
5-
-53.
4-1
00.0
38.1
-10
.0
17.
Meg
hala
ya6.
7-1
3.7
37.4
16.6
61.4
40.1
460.
8-2
21.5
64.2
141.
6
18.
Miz
oram
7.9
-14.
221
.8-1
.234
.38.
517
6.7
-91.
457
.3..
19.
Nag
alan
d0.
3-2
1.4
12.4
-9.4
22.2
0.4
..-5
6.2
79.9
-104
.1
20.
Od
isha
848.
414
0.6
1,26
0.0
458.
91,
400.
034
0.0
48.5
226.
411
.1-2
5.9
21.
Pun
jab
460.
312
5.2
1,60
0.0
1,22
4.0
1,00
0.0
545.
324
7.6
877.
4-3
7.5
-55.
5
22.
Raj
asth
an1,
556.
992
3.6
2,66
4.9
1,88
2.2
4,64
0.6
3,77
8.4
71.2
103.
874
.110
0.7
23.
Sik
kim
2.5
-7.6
--1
0.4
8.9
-2.1
-98.
537
.0..
-79.
7
24.
Tam
il N
adu
2,75
2.7
1,79
7.0
2,96
7.1
1,77
0.5
3,27
7.4
1,87
0.8
7.8
-1.5
10.5
5.7
25.
Tela
ngan
a63
6.7
225.
180
0.0
396.
980
0.0
430.
025
.776
.3-
8.4
26.
Trip
ura
1.3
-30.
63.
0-2
4.4
3.0
-27.
313
6.6
-20.
3-
12.2
27.
Utt
ar P
rad
esh
1,10
3.2
-437
.81,
000.
0-4
46.6
1,50
0.0
-96.
5-9
.42.
050
.0-7
8.4
28.
Utt
arak
hand
114.
474
.020
0.0
143.
918
0.0
118.
974
.994
.3-1
0.0
-17.
4
29.
Wes
t B
enga
l2,
025.
11,
024.
01,
374.
333
1.9
1,80
9.5
977.
6-3
2.1
-67.
631
.719
4.5
30.
NC
T D
elhi
1,90
6.3
223.
95,
800.
02,
163.
64,
786.
01,
454.
920
4.2
..-1
7.5
-32.
8
31.
Pud
uche
rry
72.0
-64.
1-
-151
.0-
-125
.8-1
00.0
135.
7-
-16.
7
All
Sta
tes
and
UTs
19
,509
.7
4,63
4.0
32,7
24.8
14
,638
.9
37,2
81.3
18
,106
.2
67.7
21
5.9
13.9
23
.7
‘–’ :
Nil/
Neg
ligib
le.
‘..
’ : A
bno
rmal
gro
wth
due
to
low
bas
e.
*:
Gro
ss lo
ans
from
cen
tre
min
us r
epay
men
t of
loan
s to
the
cen
tre.
So
urce
: B
udge
t d
ocum
ents
of t
he s
tate
gov
ernm
ents
. Det
ails
in m
etho
dol
ogy.

State Finances : A Study of Budgets of 2019-20
124
Sta
tem
ent
17: D
evo
luti
on
and
Tra
nsfe
r o
f R
eso
urce
s fr
om
the
Cen
tre
(` C
rore
)
Stat
e/U
T20
17-1
8 (A
ccou
nts)
2018
-19
(Rev
ised
Est
imat
es)
2019
-20
(Bud
get
Est
imat
es)
Vari
atio
n (P
er c
ent)
Co
l.4/C
ol.2
Co
l.5/C
ol.3
Co
l.6/C
ol.4
Co
l.7/C
ol.5
Gro
ssN
et*
Gro
ssN
et*
Gro
ssN
et*
Gro
ssN
etG
ross
Net
12
34
56
78
910
11
1.
And
hra
Pra
des
h49
,781
.348
,348
.353
,588
.352
,413
.998
,405
.096
,856
.77.
68.
483
.684
.8
2.
Aru
nach
al P
rad
esh
11,6
61.3
11,6
34.9
17,7
24.0
17,6
97.7
18,3
67.9
18,3
42.1
52.0
52.1
3.6
3.6
3.
Ass
am34
,661
.634
,423
.358
,301
.058
,047
.256
,874
.456
,635
.768
.268
.6-2
.4-2
.4
4.
Bih
ar85
,630
.284
,424
.31,
22,8
48.8
1,21
,441
.71,
38,4
51.5
1,36
,874
.243
.543
.812
.712
.7
5.
Chh
attis
garh
31,7
82.2
31,4
76.2
43,6
25.1
43,3
17.9
47,8
28.1
47,5
12.5
37.3
37.6
9.6
9.7
6.
Goa
3,10
9.9
3,00
3.7
3,73
1.7
3,60
4.8
4,57
9.9
4,44
8.0
20.0
20.0
22.7
23.4
7.
Guj
arat
34,6
60.7
33,5
21.9
47,0
76.6
45,9
46.1
51,5
90.7
50,4
96.3
35.8
37.1
9.6
9.9
8.
Har
yana
11,8
86.6
11,5
96.9
16,8
27.1
16,5
33.7
21,1
59.7
20,8
81.6
41.6
42.6
25.7
26.3
9.
Him
acha
l Pra
des
h17
,492
.617
,327
.022
,084
.221
,912
.123
,441
.023
,274
.026
.226
.56.
16.
2
10.
Jam
mu
and
Kas
hmir
33,3
84.1
33,1
80.0
51,1
55.3
50,9
56.3
54,6
94.1
54,5
00.5
53.2
53.6
6.9
7.0
11.
Jhar
khan
d30
,653
.130
,375
.939
,050
.038
,674
.440
,533
.840
,224
.427
.427
.33.
84.
0
12.
Kar
nata
ka52
,131
.350
,296
.863
,303
.261
,053
.773
,537
.471
,252
.421
.421
.416
.216
.7
13.
Ker
ala
24,1
05.7
23,2
15.9
33,9
92.7
33,0
87.4
35,2
17.2
34,1
92.4
41.0
42.5
3.6
3.3
14.
Mad
hya
Pra
des
h77
,787
.776
,042
.892
,367
.890
,473
.71,
04,1
11.7
1,02
,078
.318
.719
.012
.712
.8
15.
Mah
aras
htra
55,4
55.8
54,0
74.5
81,3
90.8
79,7
30.9
87,4
95.1
85,8
63.8
46.8
47.4
7.5
7.7
16.
Man
ipur
8,98
2.2
8,91
0.9
10,9
85.3
10,9
03.0
11,6
90.1
11,5
99.6
22.3
22.4
6.4
6.4
17.
Meg
hala
ya7,
026.
96,
990.
710
,053
.210
,017
.611
,809
.011
,771
.343
.143
.317
.517
.5
18.
Miz
oram
7,33
8.7
7,29
6.9
7,88
8.5
7,84
0.5
8,84
8.3
8,79
9.5
7.5
7.4
12.2
12.2
19.
Nag
alan
d9,
654.
19,
618.
910
,929
.210
,895
.712
,086
.712
,052
.513
.213
.310
.610
.6
20.
Od
isha
46,5
83.9
45,5
49.6
61,8
42.6
60,7
17.7
71,1
66.0
69,8
03.9
32.8
33.3
15.1
15.0
21.
Pun
jab
17,6
55.9
17,1
61.3
28,9
95.9
28,4
70.8
32,3
58.5
31,7
06.6
64.2
65.9
11.6
11.4
22.
Raj
asth
an58
,788
.557
,738
.768
,975
.567
,736
.775
,778
.574
,442
.717
.317
.39.
99.
9
23.
Sik
kim
3,62
3.1
3,60
2.9
5,45
8.2
5,43
8.2
5,71
6.5
5,69
6.1
50.7
50.9
4.7
4.7
24.
Tam
il N
adu
41,7
96.3
40,3
34.1
58,7
07.7
56,9
68.3
62,8
58.7
60,9
09.3
40.5
41.2
7.1
6.9
25.
Tela
ngan
a23
,458
.422
,826
.347
,301
.946
,407
.128
,696
.327
,786
.210
1.6
103.
3-3
9.3
-40.
1
26.
Trip
ura
7,71
7.2
7,66
4.5
12,0
09.2
11,9
65.7
12,0
67.3
12,0
19.3
55.6
56.1
0.5
0.4
27.
Utt
ar P
rad
esh
1,50
,479
.01,
48,0
88.2
2,14
,128
.72,
11,9
37.5
2,18
,352
.32,
16,1
16.8
42.3
43.1
2.0
2.0
28.
Utt
arak
hand
14,5
69.1
14,4
72.3
16,4
43.7
16,3
26.6
20,1
43.8
20,0
21.7
12.9
12.8
22.5
22.6
29.
Wes
t B
enga
l72
,477
.670
,844
.588
,228
.986
,612
.894
,943
.093
,587
.221
.722
.37.
68.
1
30.
NC
T D
elhi
4,09
0.5
-462
.611
,574
.55,
376.
311
,503
.08,
324.
718
3.0
-1,2
62.3
-0.6
54.8
31.
Pud
uche
rry
2,22
8.4
1,95
4.2
2,38
6.8
2,11
3.6
2,57
0.0
2,32
1.7
7.1
8.2
7.7
9.8
All
Sta
tes
and
UTs
10
,30,
653.
7 10
,05,
533.
8 14
,02,
976.
4 13
,74,
619.
6 15
,36,
875.
5 15
,10,
392.
0 36
.1
36.7
9.
5 9.
9
*: G
ross
dev
olut
ion
and
tra
nsfe
rs m
inus
rep
aym
ents
of l
oans
to
cent
re a
nd in
tere
st p
aym
ents
on
loan
s fr
om c
entr
e.S
our
ce :
Bud
get
doc
umen
ts o
f the
sta
te g
over
nmen
ts. D
etai
ls in
met
hod
olog
y.
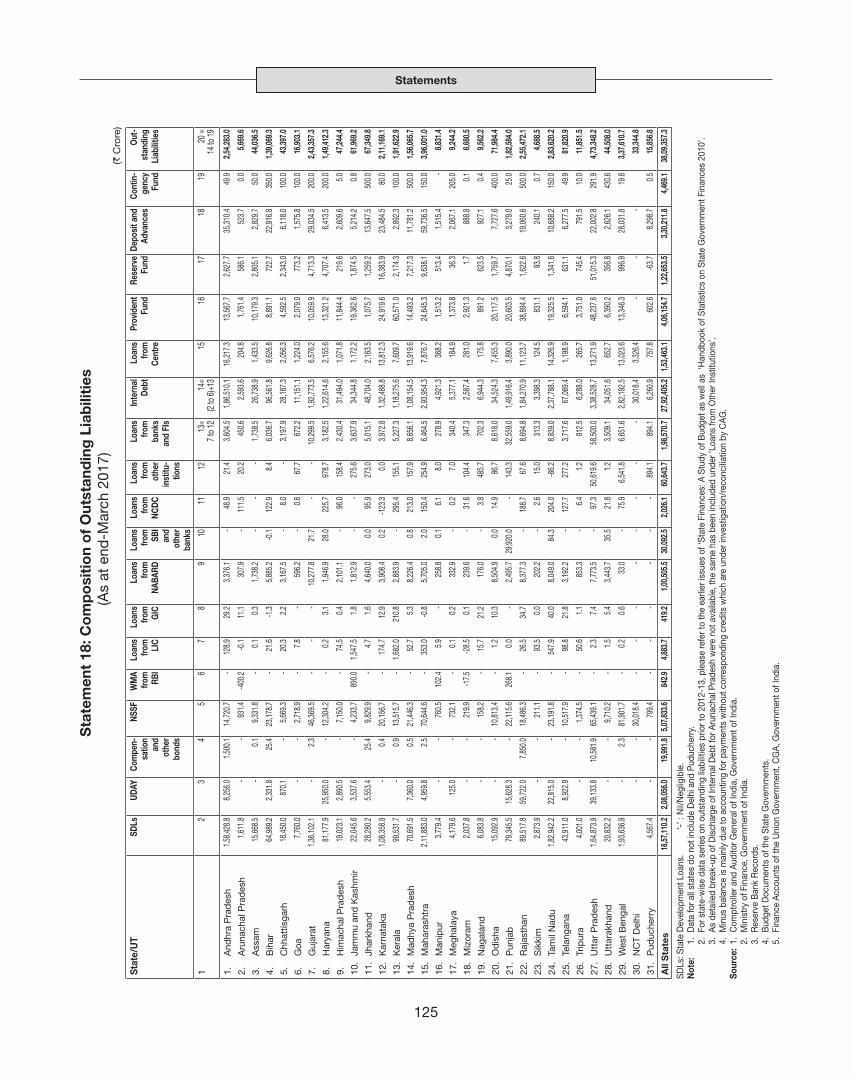
Statements
125
Sta
tem
ent
18: C
om
po
siti
on
of
Out
stan
din
g L
iab
iliti
es
(A
s at
end
-Mar
ch 2
017)
(` C
rore
)
Stat
e/U
TSD
LsUD
AYCo
mpe
n-sa
tion
and
othe
r bo
nds
NSSF
WM
Afro
mRB
I
Loan
sfro
m LIC
Loan
sfro
mG
IC
Loan
sfro
mNA
BARD
Loan
s fro
m
SBI
and
othe
r ba
nks
Loan
sfro
mNC
DC
Loan
s fro
m o
ther
in
stitu
-tio
ns
Loan
s fro
m b
anks
an
d FI
s
Inte
rnal
De
btLo
ans
from
Cent
re
Prov
iden
tFu
ndRe
serv
eFu
ndDe
posi
t and
Adva
nces
Cont
in-
genc
yFu
nd
Out
-st
andi
ngLi
abili
ties
12
34
56
78
910
1112
13=
7 to
12
14=
(2 to
6)+
1315
1617
1819
20 =
14
to 1
9
1.
And
hra
Pra
des
h 1
,58,
428.
8 8
,256
.0
1,5
00.1
1
4,72
0.7
- 1
28.9
2
9.2
3,3
76.1
-
48.
9 2
1.4
3,6
04.5
1
,86,
510.
1 1
6,21
7.3
13,
567.
7 2
,627
.7
35,
310.
4 4
9.9
2,54
,283.0
2.
Aru
nach
al P
rad
esh
1,6
11.8
-
- 9
31.4
-4
00.2
-0
.1
11.
1 3
07.9
-
111
.5
20.
2 4
50.6
2
,593
.6
204
.8
1,7
61.4
5
86.1
5
23.7
0
.0
5,66
9.6
3.
Ass
am 1
5,66
8.5
- 0
.1
9,3
31.8
-
0.1
0
.3
1,7
38.2
-
- -
1,7
38.5
2
6,73
8.9
1,4
33.5
1
0,17
9.3
2,8
05.1
2
,829
.7
50.
0 44
,036.5
4.
Bih
ar 6
4,98
9.2
2,3
31.8
2
5.4
23,
178.
7 -
21.
6 -1
.3
5,8
85.2
-0
.1
122
.9
8.4
6
,036
.7
96,
561.
8 9
,626
.8
8,8
91.1
7
22.7
2
2,91
6.8
350
.0
1,39
,069.3
5.
Chh
attis
garh
18,
450.
0 8
70.1
-
5,6
69.3
-
20.
3 2
.2
3,1
67.5
-
8.0
-
3,1
97.9
2
8,18
7.3
2,0
56.3
4
,592
.5
2,3
43.0
6
,118
.0
100
.0
43,39
7.0
6.
Goa
7,7
60.0
-
- 2
,718
.9
- 7
.8
- 5
96.2
-
0.6
6
7.7
672
.2
11,
151.
1 1
,224
.0
2,0
79.0
7
73.2
1
,575
.8
100
.0
16,90
3.1
7.
Guj
arat
1,3
6,10
2.1
- 2
.3
46,
369.
5 -
- -
10,
277.
8 2
1.7
- -
10,
299.
5 1
,92,
773.
5 6
,576
.2
10,
059.
9 4
,713
.3
29,
034.
5 2
00.0
2,
43,35
7.3
8.
Har
yana
81,
177.
9 2
5,95
0.0
- 1
2,30
4.2
- 0
.2
3.1
1
,946
.9
28.
0 2
25.7
9
78.7
3
,182
.5
1,2
2,61
4.6
2,1
55.6
1
3,32
1.2
4,7
07.4
6
,413
.5
200
.0
1,49
,412.3
9.
Him
acha
l Pra
des
h 1
9,02
3.1
2,8
90.5
-
7,1
50.0
-
74.
5 0
.4
2,1
01.1
-
96.
0 1
58.4
2
,430
.4
31,
494.
0 1
,071
.8
11,
844.
4 2
19.6
2
,609
.6
5.0
47
,244.4
10.
Jam
mu
and
Kas
hmir
22,
045.
6 3
,537
.6
- 4
,233
.7
890
.0
1,5
47.5
1
.8
1,8
12.9
-
- 2
75.6
3
,637
.9
34,
344.
8 1
,172
.2
19,
362.
6 1
,874
.5
5,2
14.2
0
.8
61,96
9.2
11.
Jhar
khan
d 2
8,28
0.2
5,5
53.4
2
5.4
9,8
29.9
-
4.7
1
.6
4,6
40.0
0
.0
95.
9 2
73.0
5
,015
.1
48,
704.
0 2
,163
.5
1,0
75.7
1
,259
.2
13,
647.
5 5
00.0
67
,349.8
12.
Kar
nata
ka 1
,08,
358.
9 -
0.4
2
0,15
6.7
- 1
74.7
1
2.9
3,9
08.4
0
.2
-123
.3
0.0
3
,972
.8
1,3
2,48
8.8
13,
812.
3 2
4,91
9.6
16,
383.
9 2
3,48
4.5
80.
0 2,
11,16
9.1
13.
Ker
ala
99,
531.
7 -
0.9
1
3,51
5.7
- 1
,682
.0
210
.8
2,8
83.9
-
295
.4
155
.1
5,2
27.3
1
,18,
275.
6 7
,609
.7
60,
571.
0 2
,174
.3
2,8
92.3
1
00.0
1,
91,62
2.9
14.
Mad
hya
Pra
des
h 7
0,69
1.5
7,3
60.0
0
.5
21,
446.
3 -
52.
7 5
.3
8,2
26.4
0
.8
213
.0
157
.9
8,6
56.1
1
,08,
154.
5 1
3,91
9.6
14,
493.
2 7
,217
.3
11,
781.
2 5
00.0
1,
56,06
5.7
15.
Mah
aras
htra
2,1
1,88
3.0
4,9
59.8
2
.5
70,
644.
6 -
353
.0
-0.8
5
,705
.0
2.0
1
50.4
2
54.9
6
,464
.5
2,9
3,95
4.3
7,8
76.7
2
4,64
5.3
9,6
38.1
5
9,73
6.5
150
.0
3,96
,001.0
16.
Man
ipur
3,7
79.4
-
- 7
60.5
1
02.4
5
.9
- 2
58.8
0
.1
6.1
8
.0
278
.9
4,9
21.3
3
68.2
1
,513
.2
513
.4
1,5
15.4
-
8,83
1.4
17.
Meg
hala
ya 4
,179
.6
125
.0
- 7
32.1
-
0.1
0
.2
332
.9
- 0
.2
7.0
3
40.4
5
,377
.1
184
.9
1,3
73.8
3
6.3
2,0
67.1
2
05.0
9,
244.2
18.
Miz
oram
2,0
37.8
-
- 2
19.9
-1
7.5
-28.
5 0
.1
239
.6
- 3
1.6
104
.4
347
.3
2,5
87.4
2
81.0
2
,921
.3
1.7
8
88.8
0
.1
6,68
0.5
19.
Nag
alan
d 6
,083
.8
--
158
.2
- 1
5.7
21.
2 1
76.0
-
3.8
4
85.7
7
02.3
6
,944
.3
175
.8
891
.2
623
.5
927
.1
0.4
9,
562.2
20.
Od
isha
15,
092.
9 -
- 1
0,81
3.4
- 1
.2
10.
3 8
,504
.9
0.0
1
4.9
86.
7 8
,618
.0
34,
524.
3 7
,455
.3
20,
117.
5 1
,759
.7
7,7
27.6
4
00.0
71
,984.4
21.
Pun
jab
79,
345.
5 1
5,62
8.3
- 2
2,11
5.6
268
.1
0.0
-
2,4
95.7
2
9,92
0.0
- 1
43.3
3
2,55
9.0
1,4
9,91
6.4
3,8
90.0
2
0,60
3.5
4,8
70.1
3
,279
.0
25.
0 1,
82,58
4.0
22.
Raj
asth
an 8
9,51
7.8
59,
722.
0 7
,850
.0
18,
486.
3 -
26.
5 3
4.7
8,3
77.3
-
188
.7
67.
6 8
,694
.8
1,8
4,27
0.9
11,
123.
7 3
8,89
4.4
1,6
22.6
1
9,06
0.6
500
.0
2,55
,472.1
23.
Sik
kim
2,8
73.9
-
- 2
11.1
-
93.
5 0
.0
202
.2
- 2
.6
15.
0 3
13.3
3
,398
.3
124
.5
831
.1
93.
8 2
40.1
0
.7
4,68
8.5
24.
Tam
il N
adu
1,8
2,94
2.2
22,
815.
0 -
23,
191.
8 -
547
.9
40.
0 8
,049
.0
84.
3 2
04.0
-8
6.2
8,8
39.0
2
,37,
788.
1 1
4,32
6.9
19,
325.
5 1
,341
.6
10,
688.
2 1
50.0
2,
83,62
0.2
25.
Tela
ngan
a 4
3,91
1.0
8,9
22.9
-
10,
517.
9 -
98.
8 2
1.8
3,1
92.2
-
127
.7
277
.2
3,7
17.6
6
7,06
9.4
1,1
98.9
6
,594
.1
631
.1
6,2
77.5
4
9.9
81,82
0.9
26.
Trip
ura
4,0
01.0
-
- 1
,374
.5
- 5
0.6
1.1
8
53.3
-
6.4
1
.2
912
.5
6,2
88.0
2
65.7
3
,751
.0
745
.4
791
.5
10.
0 11
,851.5
27.
Utt
ar P
rad
esh
1,6
4,87
3.9
39,
133.
8 1
0,58
1.9
65,
439.
1 -
2.3
7
.4
7,7
73.5
-
97.
3 5
0,61
9.6
58,
500.
0 3
,38,
528.
7 1
3,27
1.9
48,
237.
6 5
1,01
5.3
22,
002.
8 2
91.9
4,
73,34
8.2
28.
Utt
arak
hand
20,
832.
2 -
- 9
,710
.2
- 1
.5
5.4
3
,443
.7
35.
5 2
1.8
1.2
3
,509
.1
34,
051.
6 6
52.7
6
,390
.2
356
.8
2,6
26.1
4
30.6
44
,508.0
29.
Wes
t B
enga
l 1
,93,
636.
9 -
2.3
8
1,90
1.7
- 0
.2
0.6
3
3.0
- 7
5.9
6,5
41.8
6
,651
.6
2,8
2,19
2.5
13,
023.
6 1
3,34
6.3
996
.9
28,
031.
8 1
9.8
3,37
,610.7
30.
NC
T D
elhi
- -
30,
018.
4 -
--
--
- -
- 3
0,01
8.4
3,3
26.4
-
- -
33,34
4.8
31.
Pud
uche
rry
4,5
67.4
-
- 7
99.4
-
--
--
- 8
94.1
8
94.1
6
,260
.9
757
.8
602
.6
-63.
7 8
,298
.7
0.5
15
,856.8
All
Sta
tes
18,57
,110.2
2,
08,05
6.0
19,99
1.8
5,07,8
33.6
842.9
4,
883.7
41
9.2
1,00
,505.5
30
,092.5
2,
026.1
60
,643.7
1,
98,57
0.7
27,92
,405.2
1,
53,46
3.1
4,06
,154.7
1,
22,65
3.5
3,30
,211.8
4,
469.1
38
,09,35
7.3
SD
Ls: S
tate
Dev
elop
men
t Loa
ns.
‘-’ :
Nil/
Neg
ligib
le.
Not
e:
1. D
ata
for a
ll st
ates
do
not i
nclu
de D
elhi
and
Pud
uche
rry.
2.
For
sta
te-w
ise
data
ser
ies
on o
utst
andi
ng li
abili
ties
prio
r to
2012
-13,
ple
ase
refe
r to
the
earli
er is
sues
of ‘
Sta
te F
inan
ces:
A S
tudy
of B
udge
t as
wel
l as
‘Han
dboo
k of
Sta
tistic
s on
Sta
te G
over
nmen
t Fin
ance
s 20
10’.
3.
As
deta
iled
brea
k-up
of D
isch
arge
of I
nter
nal D
ebt f
or A
runa
chal
Pra
desh
wer
e no
t ava
ilabl
e, th
e sa
me
has
been
incl
uded
und
er ‘L
oans
from
Oth
er In
stitu
tions
’.
4. M
inus
bal
ance
is m
ainl
y du
e to
acc
ount
ing
for p
aym
ents
with
out c
orre
spon
ding
cre
dits
whi
ch a
re u
nder
inve
stig
atio
n/re
conc
iliat
ion
by C
AG
.So
urce
: 1.
Com
ptro
ller a
nd A
udito
r Gen
eral
of I
ndia
, Gov
ernm
ent o
f Ind
ia.
2.
Min
istr
y of
Fin
ance
, Gov
ernm
ent o
f Ind
ia.
3.
Res
erve
Ban
k R
ecor
ds.
4.
Bud
get D
ocum
ents
of t
he S
tate
Gov
ernm
ents
.
5. F
inan
ce A
ccou
nts
of th
e U
nion
Gov
ernm
ent,
CG
A, G
over
nmen
t of I
ndia
.

State Finances : A Study of Budgets of 2019-20
126
Sta
tem
ent
18: C
om
po
siti
on
of
Out
stan
din
g L
iab
iliti
es (C
ontd
.)
(As
at e
nd-M
arch
201
8)(`
Cro
re)
Stat
e/U
TSD
LsUD
AYCo
mpe
n-sa
tion
and
othe
r bo
nds
NSSF
WM
Afro
mRB
I
Loan
sfro
m LIC
Loan
sfro
mG
IC
Loan
sfro
mNA
BARD
Loan
s fro
m
SBI
and
othe
r ba
nks
Loan
sfro
mNC
DC
Loan
s fro
m o
ther
in
stitu
-tio
ns
Loan
s fro
m b
anks
an
d FI
s
Inte
rnal
De
btLo
ans
from
Cent
re
Prov
iden
tFu
ndRe
serv
eFu
ndDe
posi
t and
Adva
nces
Cont
in-
genc
yFu
nd
Out
-st
andi
ngLi
abili
ties
12
34
56
78
910
1112
13=
7 to
12
14=
(2 to
6)+
1315
1617
1819
20 =
14
to 1
9
1.
And
hra
Pra
des
h1,
29,9
69.4
8,25
6.0
1,50
0.1
13,6
58.7
230.
510
2.7
24.3
4,46
8.2
-42
.1-2
2.2
4,61
5.1
1,58
,229
.716
,169
.413
,509
.01,
487.
339
,888
.650
.02,
29,3
33.8
2.
Aru
nach
al P
rad
esh
2,31
4.6
--
1,02
3.5
55.6
-0.2
11.1
422.
3-
113.
313
.355
9.7
3,95
3.4
178.
62,
002.
572
4.0
110.
1-
6,96
8.7
3.
Ass
am22
,465
.4-
0.1
8,66
4.1
--
-1.2
2,16
5.4
--
-2,
164.
233
,293
.71,
366.
311
,207
.04,
738.
7-1
,395
.910
0.0
49,3
09.8
4.
Bih
ar73
,896
.92,
331.
8-
21,4
49.7
-21
.6-1
.36,
705.
0-0
.193
.68.
46,
827.
21,
04,5
05.6
10,2
07.9
8,81
1.0
26.3
33,0
79.8
350.
01,
56,9
80.5
5.
Chh
attis
garh
26,5
50.0
870.
1-
5,33
0.6
-20
.31.
83,
859.
3-
7.8
-3,
889.
236
,639
.92,
348.
46,
075.
43,
648.
86,
237.
010
0.0
55,0
49.5
6.
Goa
9,16
0.0
--
2,54
0.0
-6.
1-
620.
1-
0.6
61.2
688.
112
,388
.01,
213.
62,
315.
087
2.4
1,75
2.8
100.
018
,641
.9
7.
Guj
arat
1,51
,887
.1-
2.3
42,9
18.7
--
-11
,818
.518
.7-
-11
,837
.22,
06,6
45.3
5,95
6.6
10,4
00.2
14,9
31.9
30,1
29.2
200.
02,
68,2
63.2
8.
Har
yana
97,0
17.4
25,9
50.0
-11
,350
.1-
0.1
2.0
2,11
9.9
28.0
509.
383
3.5
3,49
2.7
1,37
,810
.12,
111.
014
,547
.55,
527.
17,
066.
320
0.0
1,67
,262
.1
9.
Him
acha
l Pra
des
h21
,574
.12,
890.
5-
6,63
5.3
-51
.10.
32,
251.
1-
75.0
114.
12,
491.
633
,591
.51,
074.
813
,236
.432
5.0
2,79
7.7
5.0
51,0
30.4
10.
Jam
mu
and
Kas
hmir
26,0
19.5
3,53
7.6
-3,
835.
230
0.7
1,41
5.9
1.4
1,84
3.6
--
464.
83,
725.
637
,418
.51,
087.
920
,918
.82,
175.
36,
286.
00.
867
,887
.3
11.
Jhar
khan
d33
,087
.75,
553.
4-
9,08
2.9
-4.
71.
65,
563.
7-
83.1
417.
36,
070.
453
,794
.32,
234.
11,
142.
21,
551.
018
,364
.150
0.0
77,5
85.7
12.
Kar
nata
ka1,
25,7
06.9
-0.
418
,584
.1-
139.
58.
34,
269.
60.
2-1
28.5
-4,
289.
11,
48,5
80.5
14,5
73.4
27,7
31.1
29,6
74.6
25,3
11.0
80.0
2,45
,950
.6
13.
Ker
ala
1,15
,735
.0-
0.9
14,5
56.5
-1,
413.
219
0.3
3,02
1.2
-41
3.4
170.
15,
208.
11,
35,5
00.5
7,47
9.5
67,7
77.9
2,48
3.3
3,15
8.2
100.
02,
16,4
99.4
14.
Mad
hya
Pra
des
h83
,816
.57,
360.
00.
522
,795
.3-
43.1
4.2
9,13
4.0
0.8
206.
518
0.9
9,56
9.3
1,23
,541
.614
,743
.514
,331
.35,
927.
714
,092
.950
0.0
1,73
,137
.0
15.
Mah
aras
htra
2,48
,363
.34,
959.
82.
565
,445
.0-
198.
9-0
.87,
244.
42.
068
5.4
43.6
8,17
3.5
3,26
,944
.17,
096.
025
,192
.09,
443.
763
,653
.815
0.0
4,32
,479
.4
16.
Man
ipur
4,05
7.2
--
685.
048
5.9
5.9
-29
9.5
0.1
6.1
14.6
326.
35,
554.
433
3.2
1,50
9.7
678.
91,
488.
7-
9,56
4.9
17.
Meg
hala
ya5,
099.
412
5.0
-68
7.7
-0.
10.
137
3.8
-0.
11.
037
5.1
6,28
7.3
170.
61,
531.
532
5.5
1,53
7.6
305.
010
,157
.5
18.
Miz
oram
2,31
4.9
--
203.
9-
-50.
80.
130
2.7
-29
.822
1.0
502.
63,
021.
426
7.5
2,74
2.2
300.
71,
215.
10.
17,
547.
0
19.
Nag
alan
d6,
849.
7-
-13
2.7
-12
.020
.714
7.1
-9.
946
8.3
658.
07,
640.
415
4.2
952.
784
8.5
803.
00.
410
,399
.2
20.
Od
isha
23,5
30.9
--
10,0
21.7
-0.
88.
310
,925
.1-
11.0
86.1
11,0
31.3
44,5
84.0
7,59
5.9
21,6
75.3
7,19
6.9
21,6
13.6
400.
01,
03,0
65.7
21.
Pun
jab
92,6
94.2
15,6
28.3
-20
,336
.970
2.6
--
2,22
3.0
29,1
10.1
10.4
79.3
31,4
22.9
1,60
,784
.84,
015.
321
,729
.75,
520.
23,
099.
125
.01,
95,1
74.1
22.
Raj
asth
an1,
10,4
44.8
55,5
71.8
7,84
6.0
16,9
68.3
-22
.330
.49,
076.
7-
152.
313
1.3
9,41
3.0
2,00
,243
.912
,047
.342
,095
.22,
017.
824
,759
.050
0.0
2,81
,663
.1
23.
Sik
kim
3,61
9.0
--
184.
8-
83.3
-21
0.1
-1.
812
.930
8.0
4,11
1.9
117.
091
1.7
506.
026
3.2
1.0
5,91
0.9
24.
Tam
il N
adu
2,18
,965
.122
,815
.0-
21,3
55.4
-48
1.4
32.9
8,77
6.5
50.7
250.
9-9
3.5
9,49
8.9
2,72
,634
.416
,112
.021
,659
.91,
877.
014
,202
.715
0.0
3,26
,636
.0
25.
Tela
ngan
a1,
13,1
20.4
8,92
2.9
-9,
673.
7-
85.1
18.9
3,74
6.6
-11
1.6
192.
14,
154.
21,
35,8
71.3
1,42
3.9
9,27
2.1
1,52
0.7
12,1
58.5
49.9
1,60
,296
.3
26.
Trip
ura
5,13
8.0
--
1,30
8.6
-35
.80.
890
9.6
-4.
51.
295
1.8
7,39
8.5
235.
44,
271.
757
1.2
897.
010
.013
,383
.7
27.
Utt
ar P
rad
esh
2,02
,050
.339
,133
.810
,540
.360
,608
.3-
1.6
5.7
7,87
6.9
-80
.550
,852
.758
,817
.33,
71,1
49.9
12,8
34.1
50,7
67.8
59,2
80.1
23,4
16.2
136.
95,
17,5
84.9
28.
Utt
arak
hand
26,6
62.2
--
9,83
8.4
-1.
55.
43,
724.
035
.517
.21.
23,
784.
940
,285
.572
7.3
7,00
9.6
1,65
0.5
3,34
4.3
53.7
53,0
71.1
29.
Wes
t B
enga
l2,
18,9
41.2
-2.
375
,801
.0-
-0.1
0.2
32.8
-64
.76,
934.
37,
031.
93,
01,7
76.4
14,0
47.5
14,5
09.6
10,0
80.2
30,6
38.4
19.4
3,71
,071
.5
30.
NC
T D
elhi
--
--
--
--
--
--
-3,
326.
4-
--
-3,
326.
4
31.
Pud
uche
rry
5,05
5.4
--
--
--
--
-66
.866
.85,
122.
276
3.0
648.
723
2.0
497.
20.
57,
263.
6
All
Sta
tes
and
UTs
22
,06,10
6.62,0
3,905
.819
,895.4
4,75,6
75.9
1,775
.34,0
95.9
365.2
1,14,1
30.3
29,24
6.02,8
52.5
61,25
4.32,1
1,944
.331
,19,30
3.31,6
2,011
.44,4
0,484
.21,7
6,143
.33,9
0,465
.34,0
87.7
42,92
,495.3
SD
Ls: S
tate
Dev
elop
men
t Loa
ns.
‘-’ :
Nil/
Neg
ligib
le.
Not
e:
1. F
or s
tate
-wis
e da
ta s
erie
s on
out
stan
ding
liab
ilitie
s pr
ior t
o 20
12-1
3, p
leas
e re
fer t
o th
e ea
rlier
issu
es o
f ‘S
tate
Fin
ance
s: A
Stu
dy o
f Bud
get a
s w
ell a
s ‘H
andb
ook
of S
tatis
tics
on S
tate
Gov
ernm
ent F
inan
ces
2010
’.
2. A
s de
taile
d br
eak-
up o
f Dis
char
ge o
f Int
erna
l Deb
t for
Aru
nach
al P
rade
sh w
ere
not a
vaila
ble,
the
sam
e ha
s be
en in
clud
ed u
nder
‘Loa
ns fr
om O
ther
Inst
itutio
ns’.
3.
Min
us b
alan
ce is
mai
nly
due
to a
ccou
ntin
g fo
r pay
men
ts w
ithou
t cor
resp
ondi
ng c
redi
ts w
hich
are
und
er in
vest
igat
ion/
reco
ncili
atio
n by
CA
G.
Sour
ce:
1. C
ompt
rolle
r and
Aud
itor G
ener
al o
f Ind
ia, G
over
nmen
t of I
ndia
.
2. M
inis
try
of F
inan
ce, G
over
nmen
t of I
ndia
.
3. R
eser
ve B
ank
Rec
ords
.
4. B
udge
t Doc
umen
ts o
f the
Sta
te G
over
nmen
ts.
5.
Fin
ance
Acc
ount
s of
the
Uni
on G
over
nmen
t, C
GA
, Gov
ernm
ent o
f Ind
ia.

Statements
127
Sta
tem
ent
18: C
om
po
siti
on
of
Out
stan
din
g L
iab
iliti
es (C
ontd
.) (A
s at
end
-Mar
ch 2
019)
(` C
rore
)
Stat
e/U
TSD
LsUD
AYCo
mpe
n-sa
tion
and
othe
r bo
nds
NSSF
WM
Afro
mRB
I
Loan
sfro
m LIC
Loan
sfro
mG
IC
Loan
sfro
mNA
BARD
Loan
s fro
m
SBI
and
othe
r ba
nks
Loan
sfro
mNC
DC
Loan
s fro
m o
ther
in
stitu
-tio
ns
Loan
s fro
m b
anks
an
d FI
s
Inte
rnal
De
btLo
ans
from
Cent
re
Prov
iden
tFu
ndRe
serv
eFu
ndDe
posi
t and
Adva
nces
Cont
in-
genc
yFu
nd
Out
-st
andi
ngLi
abili
ties
12
34
56
78
910
1112
13=
7 to
12
14=
(2 to
6)+
1315
1617
1819
20 =
14
to 1
9
1.A
ndhr
a P
rad
esh
1,93
,844
.98,
256.
01,
500.
112
,504
.336
9.7
81.2
24.3
5,08
1.1
-13
3.0
-57.
25,
262.
42,
21,7
37.4
17,4
21.1
14,7
67.0
2,10
7.4
49,9
26.7
50.0
3,06
,009
.6
2.
Aru
nach
al P
rad
esh
3,00
7.6
--
992.
944
8.6
-0.2
11.1
674.
0-
124.
3-4
70.7
338.
44,
787.
515
2.3
2,36
8.4
484.
221
0.6
-8,
003.
0
3.
Ass
am30
,554
.8-
0.1
7,95
4.6
--
-1.2
3,43
7.9
-32
.7-0
.73,
468.
741
,978
.11,
338.
712
,149
.84,
738.
7-2
,559
.710
0.0
57,7
45.7
4.
Bih
ar84
,800
.22,
331.
818
.919
,630
.6-
21.6
-1.3
7,74
2.0
-0.1
148.
48.
47,
919.
11,
14,7
00.7
11,4
59.0
8,71
0.9
25.8
33,1
79.3
350.
01,
68,4
25.6
5.
Chh
attis
garh
39,4
50.0
870.
10.
14,
875.
6-9
24.5
15.3
1.8
4,54
2.4
-7.
7-0
.44,
566.
848
,838
.22,
787.
06,
660.
43,
670.
86,
135.
010
0.0
68,1
91.4
6.
Goa
11,0
10.0
--
2,33
5.2
-4.
5-
599.
1-
0.7
54.8
659.
014
,004
.21,
195.
02,
465.
196
6.5
1,75
4.5
100.
020
,485
.3
7.
Guj
arat
1,79
,323
.7-
2.3
39,3
85.0
--
-14
,674
.915
.8-
-14
,690
.62,
33,4
01.6
7,23
2.6
10,6
61.6
14,9
47.9
31,5
52.0
200.
02,
97,9
95.8
8.
Har
yana
1,14
,987
.425
,950
.0-
10,3
74.0
--
2.0
2,36
2.1
28.0
392.
979
8.3
3,58
3.3
1,54
,894
.72,
200.
815
,349
.55,
728.
25,
738.
320
0.0
1,84
,111
.5
9.
Him
acha
l Pra
des
h23
,682
.22,
890.
5-
6,09
7.1
-34
.70.
32,
409.
1-
95.6
86.6
2,62
6.3
35,2
96.0
1,05
5.2
14,4
61.4
325.
02,
797.
75.
053
,940
.3
10.
Jam
mu
and
Kas
hmir
30,9
46.7
3,53
7.6
-3,
835.
230
0.7
1,29
0.5
1.4
2,18
0.0
--
129.
33,
601.
242
,221
.31,
000.
722
,958
.92,
273.
36,
286.
00.
874
,741
.0
11.
Jhar
khan
d37
,110
.75,
553.
46.
48,
325.
9-
4.7
1.6
6,61
3.7
-84
.171
2.3
7,41
6.4
58,4
12.7
2,62
5.6
1,02
6.0
1,55
1.0
18,9
33.5
1,00
0.0
83,5
48.8
12.
Kar
nata
ka1,
57,8
89.9
-0.
416
,988
.6-
105.
18.
34,
784.
70.
2-1
33.6
-4.5
4,76
0.3
1,79
,639
.214
,327
.631
,057
.429
,514
.523
,941
.880
.02,
78,5
60.5
13.
Ker
ala
1,29
,719
.0-
0.9
15,4
87.0
-1,
145.
619
0.3
3,21
6.9
-42
8.5
111.
95,
093.
21,
50,3
00.1
8,12
1.1
74,1
32.2
2,19
4.7
3,27
3.5
100.
02,
38,1
21.7
14.
Mad
hya
Pra
des
h98
,817
.37,
360.
00.
423
,697
.1-
33.7
4.2
11,7
84.0
0.8
226.
523
4.9
12,2
84.0
1,42
,158
.817
,139
.717
,985
.94,
368.
917
,881
.350
0.0
2,00
,034
.6
15.
Mah
aras
htra
2,51
,470
.04,
959.
82.
560
,135
.5-
65.6
-0.8
11,6
42.5
2.0
605.
3-7
1.9
12,2
42.8
3,28
,810
.66,
726.
526
,149
.212
,569
.168
,318
.115
0.0
4,42
,723
.5
16.
Man
ipur
4,72
3.9
--
626.
570
7.9
5.9
-44
0.2
0.1
6.1
-5.5
446.
86,
505.
228
4.6
1,55
9.7
678.
91,
398.
7-
10,4
27.2
17.
Meg
hala
ya5,
962.
012
5.0
-63
8.1
-0.
10.
150
7.8
--
9.8
517.
87,
242.
918
7.2
1,73
9.6
325.
599
3.2
305.
010
,793
.5
18.
Miz
oram
2,19
1.7
--
192.
9-
-74.
00.
141
7.0
-29
.219
2.5
564.
82,
949.
426
6.2
2,81
3.2
301.
71,
391.
30.
17,
721.
9
19.
Nag
alan
d7,
204.
8-
-11
9.2
-8.
820
.712
6.3
-8.
642
9.6
594.
07,
918.
014
4.8
1,20
7.7
847.
5-4
1.1
0.4
10,0
77.3
20.
Od
isha
28,0
30.9
--
8,99
5.8
-0.
58.
314
,376
.8-
7.0
133.
814
,526
.451
,553
.18,
054.
822
,675
.37,
198.
121
,594
.040
0.0
1,11
,475
.3
21.
Pun
jab
1,09
,747
.715
,628
.3-
18,5
35.4
702.
6-
-1,
962.
128
,248
.441
.817
.330
,269
.61,
74,8
83.5
5,23
9.2
22,9
72.9
6,20
4.7
2,97
1.4
25.0
2,12
,296
.7
22.
Raj
asth
an1,
37,2
67.0
48,9
36.0
7,84
6.0
15,4
08.3
-18
.530
.49,
737.
7-
144.
862
0.6
10,5
51.9
2,20
,009
.313
,929
.545
,241
.990
5.5
26,4
35.9
500.
03,
07,0
22.2
23.
Sik
kim
4,41
4.0
--
169.
8-
73.1
-21
6.4
-1.
012
.330
2.7
4,88
6.6
106.
61,
078.
247
8.7
263.
21.
06,
814.
3
24.
Tam
il N
adu
2,51
,242
.822
,815
.0-
19,5
78.2
-41
5.8
32.9
9,91
3.2
14.4
228.
8-1
02.3
10,5
02.7
3,04
,138
.717
,882
.523
,550
.93,
675.
712
,395
.215
0.0
3,61
,793
.0
25.
Tela
ngan
a95
,251
.18,
922.
9-
9,06
8.3
-70
.618
.94,
028.
5-
82.0
-174
.34,
025.
61,
17,2
68.1
1,82
0.8
10,3
72.1
1,74
1.6
13,3
38.3
49.9
1,44
,590
.7
26.
Trip
ura
6,52
4.8
--
1,16
8.0
-20
.50.
889
5.6
-2.
61.
092
0.5
8,61
3.3
211.
04,
321.
757
3.1
946.
810
.014
,676
.0
27.
Utt
ar P
rad
esh
2,35
,358
.539
,133
.810
,579
.855
,736
.7-
1.0
5.7
11,2
25.1
-70
.650
,991
.862
,294
.34,
03,1
03.0
12,3
87.4
53,5
24.4
72,9
91.7
20,9
83.7
136.
95,
63,1
27.1
28.
Utt
arak
hand
31,9
51.6
-2.
19,
438.
4-
1.5
5.4
3,92
4.0
35.5
13.2
0.5
3,98
0.2
45,3
72.3
871.
27,
200.
81,
650.
43,
105.
2-2
22.5
57,9
77.4
29.
Wes
t B
enga
l2,
49,3
71.6
-2.
369
,676
.4-
-0.5
0.2
32.5
-42
.27,
605.
07,
679.
43,
26,7
29.7
14,3
79.4
15,7
43.7
10,0
76.5
33,4
58.2
46.1
4,00
,433
.5
30.
NC
T D
elhi
--
--
--
--
--
--
-5,
490.
1-
--
-5,
490.
1
31.
Pud
uche
rry
5,53
0.0
--
--
--
-51.
1-
-20
5.3
154.
25,
684.
261
2.0
619.
323
2.0
494.
50.
57,
642.
5
All
Sta
tes
and
UTs
25
,61,38
6.81,9
7,270
.119
,962.4
4,41,9
70.7
1,605
.13,3
44.3
365.2
1,39,4
96.6
28,34
5.12,8
23.8
61,46
8.52,3
5,843
.434
,58,03
8.41,7
6,650
.34,7
5,525
.01,9
3,347
.94,0
7,097
.24,3
38.3
47,14
,997.0
SD
Ls: S
tate
Dev
elop
men
t Loa
ns.
‘-’ :
Nil/
Neg
ligib
le.
Not
e:
1. F
or s
tate
-wis
e da
ta s
erie
s on
out
stan
ding
liab
ilitie
s pr
ior t
o 20
12-1
3, p
leas
e re
fer t
o th
e ea
rlier
issu
es o
f ‘S
tate
Fin
ance
s: A
Stu
dy o
f Bud
get a
s w
ell a
s ‘H
andb
ook
of S
tatis
tics
on S
tate
Gov
ernm
ent F
inan
ces
2010
’.2.
As
deta
iled
brea
k-up
of D
isch
arge
of I
nter
nal D
ebt f
or A
runa
chal
Pra
desh
wer
e no
t ava
ilabl
e, th
e sa
me
has
been
incl
uded
und
er ‘L
oans
from
Oth
er In
stitu
tions
’.3.
Min
us b
alan
ce is
mai
nly
due
to a
ccou
ntin
g fo
r pay
men
ts w
ithou
t cor
resp
ondi
ng c
redi
ts w
hich
are
und
er in
vest
igat
ion/
reco
ncili
atio
n by
CA
G.
4.SD
L of
Rs.
38,
468.
46 c
rore
und
er A
ndhr
a Pr
ades
h re
flect
s tra
nsfe
r to
Tela
ngan
a du
e to
bifu
rcat
ion
of th
e st
ate
of A
ndhr
a Pr
ades
h.So
urce
: 1.
Com
ptro
ller a
nd A
udito
r Gen
eral
of I
ndia
, Gov
ernm
ent o
f Ind
ia.
2. M
inis
try
of F
inan
ce, G
over
nmen
t of I
ndia
.3.
Res
erve
Ban
k R
ecor
ds.
4. B
udge
t Doc
umen
ts o
f the
Sta
te G
over
nmen
ts.
5. F
inan
ce A
ccou
nts
of th
e U
nion
Gov
ernm
ent,
CG
A, G
over
nmen
t of I
ndia
.

State Finances : A Study of Budgets of 2019-20
128
Sta
tem
ent
18: C
om
po
siti
on
of
Out
stan
din
g L
iab
iliti
es (C
oncl
d.)
(As
at e
nd-M
arch
202
0)(`
Cro
re)
Stat
e/U
TSD
LsUD
AYCo
mpe
n-sa
tion
and
othe
r bo
nds
NSSF
WM
Afro
mRB
I
Loan
sfro
m LIC
Loan
sfro
mG
IC
Loan
sfro
mNA
BARD
Loan
s fro
m S
BIan
d ot
her
bank
s
Loan
sfro
mNC
DC
Loan
s fro
m o
ther
in
stitu
-tio
ns
Loan
s fro
m b
anks
an
d FI
s
Inte
rnal
De
btLo
ans
from
Cent
re
Prov
iden
tFu
ndRe
serv
eFu
ndDe
posi
t an
dAd
vanc
es
Cont
in-
genc
yFu
nd
Out
-st
andi
ngLi
abili
ties
12
34
56
78
910
1112
13=
7 to
12
14=
(2 to
6)+
1315
1617
1819
20 =
14
to 1
9
1.
And
hra
Pra
des
h2,2
5,971
.98,2
56.0
1,500
.111
,291.8
1,869
.762
.124
.36,1
81.1
-10
0.2-1
,250.7
5,117
.02,5
4,006
.618
,655.9
16,64
2.22,1
45.3
49,77
0.350
.03,4
1,270
.22.
A
runa
chal
Pra
des
h3,7
98.5
--
950.8
742.4
-0.2
11.1
925.7
-13
5.6-1
,032.0
40.2
5,531
.912
6.42,7
52.7
232.4
316.0
-8,9
59.4
3.
Ass
am40
,395.5
-0.1
7,199
.6-
--1
.24,2
80.8
-31
.5-1
.44,3
09.7
51,90
4.91,4
45.6
13,33
8.94,7
38.7
-3,20
6.610
0.068
,321.5
4.
Bih
ar1,0
0,770
.42,3
31.8
18.9
17,74
2.3-
21.6
-1.3
8,603
.3-0
.179
0.38.4
9,422
.31,3
0,285
.713
,060.8
8,610
.925
.833
,278.3
350.0
1,85,6
11.5
5.
Chh
attis
garh
49,67
6.187
0.10.1
4,415
.6-7
65.3
15.2
1.85,0
82.3
-17
.5-0
.75,1
16.1
59,31
2.83,2
25.6
7,271
.93,6
92.8
6,101
.510
0.079
,704.6
6.
Goa
12,41
0.0-
-2,1
30.5
-3.3
-67
8.1-
0.748
.373
0.315
,270.8
1,181
.12,7
24.6
1,075
.72,0
49.3
100.0
22,40
1.47.
G
ujar
at2,0
5,023
.2-
2.335
,755.6
--
-17
,062.6
12.8
--
17,07
5.42,5
7,856
.69,1
15.7
10,94
4.014
,957.2
32,88
8.620
0.03,2
5,962
.18.
H
arya
na1,3
7,387
.425
,950.0
-9,3
69.6
--
2.03,4
57.3
28.0
380.4
803.3
4,670
.91,7
7,377
.92,2
27.7
15,80
2.55,9
63.2
4,500
.320
0.02,0
6,071
.79.
H
imac
hal P
rad
esh
27,88
4.52,8
90.5
-5,5
28.0
-24
.80.3
2,679
.1-
75.6
60.9
2,840
.639
,143.6
1,026
.615
,711.4
325.0
2,797
.75.0
59,00
9.310
.Ja
mm
u an
d K
ashm
ir36
,632.8
3,537
.6-
3,835
.230
0.71,1
56.5
1.42,5
85.4
--
-220
.73,5
22.5
47,82
8.888
8.025
,014.8
2,313
.66,2
86.0
0.882
,332.0
11.
Jhar
khan
d42
,566.7
5,553
.46.4
7,556
.4-
4.71.6
8,313
.7-
91.1
1,047
.39,4
58.4
65,14
1.23,0
52.8
893.0
1,551
.019
,142.4
1,500
.091
,280.6
12.
Kar
nata
ka1,9
8,016
.8-
0.415
,360.7
-72
.58.3
5,002
.40.2
-133
.6-8
.04,9
41.9
2,18,3
19.8
14,28
3.534
,509.4
28,17
6.022
,212.8
80.0
3,17,5
81.4
13.
Ker
ala
1,50,9
53.0
-0.9
16,26
5.3-
880.6
190.3
3,435
.00.0
424.1
77.0
5,006
.91,7
2,226
.19,4
30.9
79,04
7.92,2
91.6
3,387
.410
0.02,6
6,483
.814
.M
adhy
a P
rad
esh
1,20,5
79.3
7,360
.00.4
24,74
9.2-
24.7
4.214
,484.0
0.825
7.529
0.515
,061.6
1,67,7
50.5
19,77
5.922
,385.9
2,517
.722
,048.6
500.0
2,34,9
78.6
15.
Mah
aras
htra
3,01,9
69.0
4,959
.82.5
54,75
4.8-
-1.1
-0.8
18,33
9.62.0
545.7
-163
.618
,721.9
3,80,4
08.0
6,131
.127
,342.9
16,02
5.072
,639.9
150.0
5,02,6
96.8
16.
Man
ipur
5,021
.1-
-56
2.392
9.95.9
-49
0.80.1
6.1-2
6.447
6.56,9
89.9
231.3
1,702
.267
8.91,3
08.7
-10
,911.0
17.
Meg
hala
ya6,9
28.8
125.0
-58
3.1-
0.10.1
691.8
--
19.4
711.4
8,348
.322
7.31,8
04.7
325.5
973.2
305.0
11,98
3.918
.M
izor
am2,6
36.4
--
181.3
--9
6.60.1
549.0
-24
.817
8.265
5.63,4
73.2
274.7
2,633
.730
2.71,4
91.3
0.18,1
75.7
19.
Nag
alan
d7,7
34.5
--
106.0
-5.5
20.7
100.9
-6.1
386.4
519.5
8,360
.014
5.21,6
75.7
846.5
-50.1
0.410
,977.6
20.
Od
isha
43,46
4.8-
-8,0
13.3
-0.2
8.317
,418.9
-3.0
181.5
17,61
2.069
,090.1
8,394
.823
,675.3
9,299
.322
,456.0
400.0
1,33,3
15.5
21.
Pun
jab
1,27,3
37.7
15,62
8.3-
16,69
3.970
2.6-
-1,9
76.1
27,30
3.741
.8-1
0.729
,310.9
1,89,6
73.3
5,784
.524
,241.6
7,063
.72,8
43.8
25.0
2,29,6
31.8
22.
Raj
asth
an1,6
5,926
.648
,936.0
7,846
.013
,823.6
-15
.430
.410
,230.8
-13
6.483
0.611
,243.6
2,47,7
75.8
17,70
7.948
,277.6
1,377
.028
,270.9
500.0
3,43,9
09.2
23.
Sik
kim
4,898
.4-
-15
3.7-
63.0
-22
0.7-
0.29.9
293.7
5,345
.810
4.51,2
27.4
725.4
263.2
1.07,6
67.3
24.
Tam
il N
adu
2,91,8
43.8
22,81
5.0-
17,77
5.1-
353.8
32.9
10,78
0.6-1
.516
3.5-1
08.4
11,22
0.93,4
3,654
.919
,753.3
25,16
3.95,5
34.5
10,73
5.815
0.04,0
4,992
.525
.Te
lang
ana
1,19,8
39.4
8,922
.9-
8,241
.0-
58.1
18.9
4,196
.6-
64.1
-868
.83,4
68.9
1,40,4
72.3
2,250
.810
,672.1
3,344
.211
,935.7
49.9
1,68,7
24.9
26.
Trip
ura
8,351
.8-
-1,0
48.9
-5.7
0.897
6.6-
0.60.8
984.4
10,38
5.118
3.74,3
71.7
571.1
996.6
10.0
16,51
8.227
.U
ttar
Pra
des
h2,7
7,313
.039
,133.8
10,57
9.850
,614.6
-0.6
5.715
,401.1
-82
.647
,962.4
63,45
2.44,4
1,093
.612
,290.9
54,75
8.880
,959.6
12,92
0.313
6.96,0
2,160
.128
.U
ttar
akha
nd38
,951.1
-2.1
9,038
.4-
1.55.4
4,024
.035
.59.2
-0.2
4,075
.552
,067.1
990.1
7,352
.11,6
50.3
3,100
.6-4
72.5
64,68
7.829
.W
est
Ben
gal
2,86,5
93.7
-2.3
63,33
6.4-
-0.9
0.232
.3-
18.4
8,121
.38,1
71.3
3,58,1
03.7
15,35
7.017
,052.9
9,938
.236
,541.3
46.1
4,37,0
39.2
30.
NC
T D
elhi
--
--
--
--
--
--
-6,9
45.0
--
--
6,945
.031
.P
uduc
herr
y6,0
96.0
--
--
--
-80.2
--
319.5
239.3
6,335
.348
6.261
7.123
2.049
2.80.5
8,164
.0
All
Sta
tes
and
UTs
30
,46,97
2.41,9
7,270
.119
,962.4
4,07,0
76.9
3,780
.12,6
76.9
365.2
1,68,1
20.4
27,38
1.53,2
73.5
56,65
4.12,5
8,471
.739
,33,53
3.41,9
4,754
.85,0
8,219
.72,0
8,879
.94,0
8,492
.74,5
88.3
52,58
,468.7
SD
Ls: S
tate
Dev
elop
men
t Loa
ns.
‘-’ :
Nil/
Neg
ligib
le.
Not
e:
1. F
or s
tate
-wis
e da
ta s
erie
s on
out
stan
ding
liab
ilitie
s pr
ior t
o 20
12-1
3, p
leas
e re
fer t
o th
e ea
rlier
issu
es o
f ‘S
tate
Fin
ance
s: A
Stu
dy o
f Bud
get’
as w
ell a
s ‘H
andb
ook
of S
tatis
tics
on S
tate
Gov
ernm
ent F
inan
ces
2010
’.2.
As
deta
iled
brea
k-up
of D
isch
arge
of I
nter
nal D
ebt f
or A
runa
chal
Pra
desh
, Jam
mu
and
Kas
hmir
and
Man
ipur
wer
e no
t ava
ilabl
e, th
e sa
me
has
been
incl
uded
und
er ‘L
oans
from
Oth
er In
stitu
tions
’.3.
SDL
of R
s. 3
8,46
8.46
cro
re u
nder
And
hra
Prad
esh
refle
cts
trans
fer t
o Te
lang
ana
due
to b
ifurc
atio
n of
the
stat
e of
And
hra
Prad
esh.
Sour
ce:
1. C
ompt
rolle
r and
Aud
itor G
ener
al o
f Ind
ia, G
over
nmen
t of I
ndia
. 2.
Min
istr
y of
Fin
ance
, Gov
ernm
ent o
f Ind
ia.
3. R
eser
ve B
ank
Rec
ords
.4.
Bud
get D
ocum
ents
of t
he S
tate
Gov
ernm
ents
.5.
Fin
ance
Acc
ount
s of
the
Uni
on G
over
nmen
t, C
GA
, Gov
ernm
ent o
f Ind
ia.

Statements
129
Sta
tem
ent
19: T
ota
l Out
stan
din
g L
iab
iliti
es o
f S
tate
Go
vern
men
ts
(As
at e
nd-M
arch
)(`
Cro
re)
Stat
e/U
T20
0120
0220
0320
0420
0520
0620
0720
0820
0920
1020
1120
1220
1320
1420
1520
1620
1720
1820
19 (R
E)20
20 (B
E)
12
34
56
78
910
1112
1314
1516
1718
1920
21
1.
Andh
ra P
rade
sh41
,808
.948
,636
.956
,029
.665
,251
.475
,418
.183
,281
.690
,456
.499
,874
.71,
10,0
53.7
1,23
,677
.81,
39,5
05.8
1,50
,552
.71,
74,2
59.6
1,96
,202
.41,
22,6
05.8
1,47
,935
.22,
54,2
83.0
2,29
,333
.83,
06,0
09.6
3,41
,270
.2
2.
Arun
acha
l Pra
desh
739.
378
9.7
965.
81,
736.
02,
069.
12,
412.
12,
371.
22,
837.
35,
926.
13,
164.
93,
506.
03,
948.
64,
271.
84,
708.
56,
164.
85,
717.
15,
669.
66,
968.
78,
003.
08,
959.
4
3.
Assa
m10
,226
.911
,988
.013
,098
.815
,688
.417
,043
.118
,400
.919
,489
.820
,191
.622
,799
.925
,606
.426
,464
.227
,937
.529
,649
.230
,967
.235
,459
.141
,963
.744
,036
.549
,309
.857
,745
.768
,321
.5
4.
Biha
r29
,941
.634
,134
.638
,253
.539
,999
.143
,182
.947
,289
.749
,846
.052
,807
.355
,781
.659
,513
.563
,580
.467
,960
.377
,653
.588
,622
.799
,398
.61,
16,7
74.8
1,39
,069
.31,
56,9
80.5
1,68
,425
.61,
85,6
11.5
5.
Chha
ttisg
arh
6,96
6.5
8,12
1.0
9,59
2.4
10,8
24.6
12,1
33.0
13,1
90.4
14,0
41.5
14,6
47.4
15,0
28.7
16,2
54.2
17,0
43.9
17,9
37.4
21,4
70.0
26,0
75.6
31,0
88.4
39,2
64.9
43,3
97.0
55,0
49.5
68,1
91.4
79,7
04.6
6.
Goa
2,82
1.7
3,74
5.7
3,50
3.5
3,88
5.2
4,41
7.2
5,12
5.7
5,84
1.0
6,64
2.2
7,14
9.7
8,42
8.9
9,56
0.2
9,95
1.1
11,2
53.8
13,2
77.0
14,0
86.9
15,6
50.9
16,9
03.1
18,6
41.9
20,4
85.3
22,4
01.4
7.
Guj
arat
42,7
80.8
47,9
19.3
55,1
74.6
62,3
07.4
71,3
34.2
83,0
23.6
90,9
55.7
1,00
,327
.91,
09,8
61.9
1,23
,474
.01,
43,0
15.1
1,51
,308
.81,
69,3
18.2
1,88
,517
.62,
02,5
10.9
2,31
,505
.42,
43,3
57.3
2,68
,263
.22,
97,9
95.8
3,25
,962
.1
8.
Hary
ana
14,6
49.7
17,7
25.8
19,9
48.3
22,4
49.9
24,9
00.2
26,9
79.4
29,3
08.0
29,9
11.0
33,4
95.2
41,0
18.3
46,2
96.1
56,6
92.8
67,5
72.4
79,6
08.8
92,6
67.4
1,23
,854
.11,
49,4
12.3
1,67
,262
.11,
84,1
11.5
2,06
,071
.7
9.
Him
acha
l Pra
desh
8,70
4.8
10,0
55.4
12,2
28.3
14,3
78.7
16,4
83.5
17,3
90.2
18,1
41.6
19,4
82.1
21,8
99.9
23,7
65.9
26,4
24.5
28,2
31.6
29,4
32.4
33,8
77.6
38,1
82.4
41,1
97.3
47,2
44.4
51,0
30.4
53,9
40.3
59,0
09.3
10.
Jam
mu
and
Kash
mir
9,10
1.5
9,62
4.1
10,5
27.6
14,7
28.1
15,8
76.8
18,4
26.5
19,6
72.6
22,1
02.5
25,0
76.8
30,1
21.1
32,1
46.6
36,6
96.3
40,5
23.7
44,8
18.6
48,2
24.8
55,1
06.3
61,9
69.2
67,8
87.3
74,7
41.0
82,3
32.0
11.
Jhar
khan
d8,
448.
39,
978.
511
,887
.110
,036
.213
,090
.216
,924
.219
,049
.221
,341
.824
,023
.926
,975
.528
,297
.431
,355
.835
,058
.737
,840
.443
,742
.057
,049
.167
,349
.877
,585
.783
,548
.891
,280
.6
12.
Karn
atak
a25
,301
.431
,337
.336
,019
.639
,959
.444
,345
.249
,586
.758
,078
.560
,555
.165
,218
.984
,534
.593
,446
.61,
06,0
89.5
1,12
,666
.61,
38,9
76.5
1,58
,370
.21,
85,6
98.4
2,11
,169
.12,
45,9
50.6
2,78
,560
.53,
17,5
81.4
13.
Kera
la26
,258
.629
,535
.734
,312
.039
,150
.843
,694
.847
,883
.252
,318
.158
,502
.567
,007
.975
,453
.283
,963
.094
,817
.11,
09,9
66.5
1,25
,678
.31,
43,5
56.8
1,62
,271
.51,
91,6
22.9
2,16
,499
.42,
38,1
21.7
2,66
,483
.8
14.
Mad
hya
Prad
esh
22,1
27.3
26,0
43.4
29,8
82.0
37,9
67.1
44,5
85.9
49,6
46.6
52,7
31.1
54,9
08.6
60,3
12.0
67,9
22.3
75,5
36.0
80,9
76.8
89,4
72.4
96,3
59.0
1,08
,753
.31,
27,7
14.1
1,56
,065
.71,
73,1
37.0
2,00
,034
.62,
34,9
78.6
15.
Mah
aras
htra
67,6
01.1
78,5
40.9
89,9
51.7
1,06
,837
.81,
24,5
54.5
1,46
,227
.71,
60,7
40.8
1,62
,012
.61,
86,6
73.9
2,03
,435
.32,
30,6
28.9
2,45
,795
.32,
82,0
09.6
3,09
,327
.13,
21,8
06.2
3,51
,440
.83,
96,0
01.0
4,32
,479
.44,
42,7
23.5
5,02
,696
.8
16.
Man
ipur
1,87
0.3
1,87
0.0
1,88
9.8
2,44
4.3
3,23
8.5
4,06
2.1
4,18
5.4
4,52
9.4
4,88
2.5
5,58
3.6
6,21
5.3
6,50
2.6
6,82
0.4
7,08
8.6
7,39
1.5
8,14
6.7
8,83
1.4
9,56
4.9
10,4
27.2
10,9
11.0
17.
Meg
hala
ya1,
387.
61,
527.
81,
819.
92,
123.
22,
409.
72,
610.
22,
819.
43,
218.
23,
700.
13,
943.
94,
344.
65,
367.
55,
261.
66,
586.
06,
912.
17,
524.
69,
244.
210
,157
.510
,793
.511
,983
.9
18.
Mizo
ram
1,37
5.2
1,71
3.0
1,96
6.7
2,60
6.2
2,92
1.6
3,15
4.3
3,35
3.7
3,95
0.5
4,14
7.1
3,77
5.8
4,66
3.7
4,91
5.7
5,52
4.0
6,21
5.5
7,00
7.8
7,07
6.1
6,68
0.5
7,54
7.0
7,72
1.9
8,17
5.7
19.
Naga
land
1,60
3.7
1,88
3.8
2,38
5.1
2,38
9.1
2,63
8.0
3,00
5.8
3,22
4.9
3,57
6.6
4,18
4.6
5,49
6.9
5,89
9.1
6,74
9.6
7,43
9.8
8,35
2.0
7,94
6.2
8,92
3.4
9,56
2.2
10,3
99.2
10,0
77.3
10,9
77.6
20.
Odi
sha
24,2
19.7
28,1
61.4
30,8
68.8
33,8
50.0
36,9
82.4
40,7
24.4
42,9
37.8
42,9
75.1
43,9
00.9
45,7
19.2
47,0
32.2
47,8
47.9
49,1
78.1
50,4
70.8
50,8
77.6
65,2
17.9
71,9
84.4
1,03
,065
.71,
11,4
75.3
1,33
,315
.5
21.
Punj
ab30
,762
.735
,730
.540
,124
.842
,818
.747
,070
.951
,140
.251
,009
.055
,794
.161
,529
.067
,779
.474
,782
.082
,858
.492
,281
.81,
02,2
97.5
1,12
,393
.21,
34,1
30.2
1,82
,584
.01,
95,1
74.1
2,12
,296
.72,
29,6
31.8
22.
Raja
stha
n35
,540
.741
,633
.647
,534
.153
,108
.759
,967
.666
,238
.771
,172
.877
,166
.484
,235
.291
,745
.899
,478
.91,
06,6
12.0
1,18
,634
.91,
28,1
87.3
1,48
,090
.62,
09,8
61.4
2,55
,472
.12,
81,6
63.1
3,07
,022
.23,
43,9
09.2
23.
Sikk
im85
1.8
928.
898
9.2
1,00
9.6
1,15
0.0
1,28
9.3
1,40
9.1
1,70
5.3
2,01
8.2
2,48
3.8
2,45
0.4
2,78
6.9
2,98
9.6
3,34
2.7
3,49
9.9
4,33
8.3
4,68
8.5
5,91
0.9
6,81
4.3
7,66
7.3
24.
Tam
il Nad
u34
,540
.939
,068
.844
,471
.551
,759
.355
,968
.263
,848
.468
,561
.473
,886
.886
,153
.61,
01,7
08.7
1,14
,467
.61,
30,6
27.4
1,52
,805
.31,
79,5
67.8
1,85
,610
.62,
28,5
16.1
2,83
,620
.23,
26,6
36.0
3,61
,793
.04,
04,9
92.5
25.
Tela
ngan
a-
--
--
--
--
--
--
-72
,658
.190
,523
.481
,820
.91,
60,2
96.3
1,44
,590
.71,
68,7
24.9
26.
Trip
ura
2,38
3.9
2,81
6.6
3,27
7.6
4,05
7.1
4,85
2.7
5,35
7.8
4,62
4.5
4,54
2.5
4,70
9.7
5,45
3.2
6,08
9.8
6,55
9.2
7,66
6.2
8,73
6.4
9,32
7.2
10,3
54.1
11,8
51.5
13,3
83.7
14,6
76.0
16,5
18.2
27.
Utta
r Pra
desh
83,0
98.1
95,8
22.0
1,05
,125
.81,
24,0
63.0
1,36
,273
.51,
54,0
60.9
1,67
,775
.71,
79,7
40.7
1,92
,767
.12,
06,4
28.1
2,29
,926
.72,
44,3
74.7
2,44
,087
.02,
66,2
44.7
3,14
,072
.13,
85,3
37.1
4,73
,348
.25,
17,5
84.9
5,63
,127
.16,
02,1
60.1
28.
Utta
rakh
and
4,10
6.1
5,01
8.4
6,27
4.0
8,27
2.6
10,1
22.7
12,0
17.1
13,3
08.0
14,6
49.6
17,2
23.2
19,6
50.0
21,2
91.7
24,8
46.1
26,8
67.8
30,3
05.2
34,0
36.8
40,2
91.5
44,5
08.0
53,0
71.1
57,9
77.4
64,6
87.8
29.
Wes
t Ben
gal
54,9
28.6
66,3
96.1
78,3
24.7
89,4
71.7
97,3
41.9
1,14
,418
.71,
24,1
53.3
1,36
,422
.31,
50,4
34.0
1,75
,534
.81,
92,9
19.9
2,13
,617
.02,
36,1
10.7
2,59
,011
.72,
77,3
18.2
3,14
,741
.63,
37,6
10.7
3,71
,071
.54,
00,4
33.5
4,37
,039
.2
30.
NCT
Delh
i7,
924.
49,
776.
812
,494
.114
,149
.015
,835
.921
,566
.625
,568
.725
,339
.025
,381
.726
,544
.230
,140
.129
,608
.329
,242
.732
,531
.832
,497
.933
,303
.933
,344
.83,
326.
45,
490.
16,
945.
0
31.
Pudu
cher
ry-
--
1,31
0.0
1,54
9.0
1,81
8.0
2,16
8.5
2,92
3.1
3,32
5.2
3,93
8.4
4,61
4.2
5,44
1.1
5,17
1.3
6,63
1.8
7,01
3.0
7,80
0.1
15,8
56.8
7,26
3.6
7,64
2.5
8,16
4.0
All S
tate
s an
d UT
s 5,9
4,147
.86,9
0,747
.27,8
6,426
.89,0
3,173
.710
,14,06
6.511
,47,71
6.612
,41,57
6.413
,28,30
2.214
,70,19
5.116
,48,64
8.518
,28,97
6.519
,93,91
6.322
,10,24
5.624
,71,26
3.527
,03,75
9.632
,18,12
5.938
,09,35
7.342
,92,49
5.347
,14,99
7.052
,58,46
8.7
RE:
Rev
ised
Est
imat
es.
B
E: B
udge
t Est
imat
es.
‘-’:
Not
ava
ilabl
e/N
ot a
pplic
able
.N
ote:
1.
Dat
a fro
m 2
017-
18 o
nwar
ds in
clud
e D
elhi
and
Pud
uche
rry
also
.2.
See
‘Exp
lana
tory
not
es o
n D
ata
Sou
rces
and
Met
hodo
logy
’.3.
SDL
of R
s. 3
8,46
8.46
cro
re u
nder
And
hra
Prad
esh
refle
cts
trans
fer t
o Te
lang
ana
due
to b
ifurc
atio
n of
the
stat
e of
And
hra
Prad
esh.
Sou
rce:
Sam
e as
in S
tate
men
t 18.

State Finances : A Study of Budgets of 2019-20
130
Sta
tem
ent
20: T
ota
l Out
stan
din
g L
iab
iliti
es -
As
per
cent
age
of
GS
DP
(A
s at
end
-Mar
ch)
(Per
cen
t)
Stat
e/U
T20
0120
0220
0320
0420
0520
0620
0720
0820
0920
1020
1120
1220
1320
1420
1520
1620
1720
1820
19 (R
E)20
20 (B
E)
12
34
56
78
910
1112
1314
1516
1718
1920
21
1.
Andh
ra P
rade
sh27
.229
.331
.632
.433
.632
.530
.027
.425
.825
.923
.939
.742
.442
.323
.324
.536
.528
.332
.831
.6
2.
Arun
acha
l Pra
desh
33.8
30.7
38.1
60.0
59.3
64.2
57.7
59.0
104.
242
.338
.935
.734
.032
.334
.330
.928
.931
.633
.935
.0
3.
Assa
m27
.330
.829
.732
.631
.931
.030
.128
.428
.126
.723
.519
.518
.917
.418
.118
.417
.317
.117
.818
.9
4.
Biha
r49
.556
.155
.857
.255
.557
.349
.546
.539
.236
.531
.227
.527
.527
.929
.031
.432
.932
.431
.032
.4
5.
Chha
ttisg
arh
24.5
25.0
26.9
25.4
25.4
24.7
21.0
18.3
15.5
16.4
14.3
11.3
12.1
12.6
13.2
17.3
17.0
19.4
21.9
23.7
6.
Goa
37.7
47.7
39.1
37.7
34.7
35.8
35.4
33.9
28.1
28.9
28.4
23.5
29.5
37.0
29.5
28.4
26.6
26.4
26.5
25.9
7.
Guj
arat
35.8
36.1
36.3
34.5
35.1
33.9
32.1
30.5
29.9
28.6
27.4
24.6
23.4
23.3
22.0
22.5
21.1
20.4
19.8
19.2
8.
Hary
ana
24.6
26.4
26.9
26.5
26.0
24.8
22.8
19.7
18.4
18.3
17.8
19.1
19.5
19.9
21.2
25.0
26.9
26.7
26.0
26.3
9.
Him
acha
l Pra
desh
53.2
56.2
62.0
66.5
68.5
64.1
59.9
57.4
52.8
49.3
46.0
38.8
35.5
35.7
36.8
36.1
37.6
36.3
35.2
34.9
10.
Jam
mu
and
Kash
mir
48.4
47.4
46.0
59.0
58.1
61.6
59.2
59.6
59.3
62.3
55.4
46.9
46.5
46.9
49.0
47.0
49.4
49.0
48.1
48.2
11.
Jhar
khan
d22
.624
.426
.920
.321
.927
.828
.525
.427
.426
.822
.220
.820
.120
.120
.027
.628
.528
.127
.226
.0
12.
Karn
atak
a21
.926
.027
.928
.626
.625
.325
.622
.421
.025
.022
.817
.516
.217
.017
.417
.817
.518
.219
.818
.7
13.
Kera
la33
.435
.036
.537
.436
.635
.034
.033
.433
.032
.531
.826
.026
.727
.028
.028
.930
.230
.930
.630
.8
14.
Mad
hya
Prad
esh
26.4
28.4
32.5
34.9
39.5
39.9
36.5
34.0
30.6
29.8
28.7
25.7
23.5
21.9
22.7
23.6
24.1
23.8
24.7
25.4
15.
Mah
aras
htra
24.9
26.7
27.9
29.2
30.0
30.0
27.5
23.7
24.8
23.8
22.0
19.3
19.4
18.8
18.1
17.9
18.1
17.9
16.6
16.9
16.
Man
ipur
53.5
49.4
48.0
54.7
63.1
71.0
68.2
66.8
66.0
67.6
68.0
50.4
49.6
43.8
40.8
41.7
41.5
39.5
40.3
38.1
17.
Meg
hala
ya31
.030
.233
.835
.636
.735
.932
.733
.131
.931
.029
.826
.924
.128
.729
.730
.033
.734
.032
.733
.0
18.
Mizo
ram
72.5
80.5
83.1
102.
610
8.9
106.
210
1.9
103.
590
.671
.873
.067
.766
.160
.451
.946
.738
.942
.534
.731
.6
19.
Naga
land
41.5
41.7
47.0
43.7
45.2
45.6
44.4
44.3
44.3
52.2
50.2
55.4
52.7
50.3
43.2
45.7
44.0
44.0
38.8
38.4
20.
Odi
sha
51.5
55.5
57.3
51.2
47.6
47.9
42.2
33.2
29.6
28.1
23.8
20.7
18.8
17.0
16.2
19.9
18.3
23.6
22.9
24.7
21.
Punj
ab41
.144
.848
.747
.448
.647
.140
.136
.635
.434
.333
.131
.131
.030
.831
.734
.442
.840
.740
.739
.9
22.
Raja
stha
n39
.641
.649
.343
.746
.946
.641
.639
.636
.534
.529
.424
.524
.023
.324
.130
.833
.733
.733
.033
.6
23.
Sikk
im77
.475
.371
.465
.066
.164
.765
.268
.062
.540
.533
.125
.024
.224
.122
.724
.122
.725
.225
.425
.1
24.
Tam
il Nad
u21
.724
.326
.027
.325
.624
.822
.121
.121
.521
.219
.617
.417
.918
.517
.319
.421
.822
.321
.721
.7
25.
Tela
ngan
a-
--
--
--
--
--
--
--
15.7
12.4
21.3
16.7
17.0
26.
Trip
ura
40.4
41.2
45.4
50.1
54.5
54.5
42.4
38.5
34.7
35.4
34.1
34.1
35.4
34.1
34.0
28.8
29.9
29.0
25.4
25.5
27.
Utta
r Pra
desh
43.7
48.0
48.5
52.1
52.2
52.5
49.9
46.9
43.3
39.4
38.3
33.8
29.7
28.3
31.0
33.9
37.9
37.5
38.1
38.1
28.
Utta
rakh
and
27.1
30.3
32.5
38.7
40.8
40.1
36.2
31.9
30.7
27.8
25.4
21.5
20.4
20.3
21.1
22.7
22.8
24.7
24.4
24.6
29.
Wes
t Ben
gal
38.4
42.4
46.8
47.5
46.7
49.7
47.4
45.6
44.0
44.0
41.9
40.4
39.1
36.3
34.6
39.5
38.7
37.1
34.0
32.6
30.
NCT
Delh
i12
.113
.816
.116
.315
.818
.718
.916
.013
.412
.211
.98.
67.
57.
36.
66.
05.
40.
50.
70.
8
31.
Pudu
cher
ry-
--
21.7
26.9
22.8
26.0
31.6
33.1
32.0
35.2
32.4
27.4
30.3
31.1
29.3
53.6
22.0
20.8
20.0
All S
tate
s an
d UT
s 27
.329
.331
.031
.831
.331
.128
.926
.626
.125
.523
.522
.822
.222
.021
.723
.425
.125
.124
.824
.9
RE:
Rev
ised
Est
imat
es.
B
E: B
udge
t Est
imat
es.
‘-’:
Not
ava
ilabl
e/N
ot a
pplic
able
.N
ote:
1.
Dat
a fro
m 2
017-
18 o
nwar
ds in
clud
e D
elhi
and
Pud
uche
rry
also
.2.
See
‘Exp
lana
tory
not
es o
n D
ata
Sou
rces
and
Met
hodo
logy
’.3.
SDL
of R
s. 3
8,46
8.46
cro
re u
nder
And
hra
Prad
esh
refle
cts
trans
fer t
o Te
lang
ana
due
to b
ifurc
atio
n of
the
stat
e of
And
hra
Prad
esh.
Sou
rce:
Sam
e as
in S
tate
men
t 18.

Statements
131
Sta
tem
ent
21: M
arke
t B
orr
ow
ing
s o
f S
tate
Go
vern
men
ts(`
Cro
re)
Stat
e/U
T20
17-1
820
18-1
920
19-2
0*
Gro
ss A
mo
unt
Rai
sed
Rep
aym
ents
Gro
ss A
mo
unt
Rai
sed
Rep
aym
ents
Gro
ss A
mo
unt
Rai
sed
Rep
aym
ents
12
34
56
7
1. A
ndhr
a P
rad
esh
22,
800.
0 3,
878.
3 3
0,20
0.0
6,3
76.5
8,1
04.0
1
5,38
3.1
2. A
runa
chal
Pra
des
h 8
87.5
18
4.7
719
.0
26.
1 2
11.0
-
3. A
ssam
7,7
60.0
96
3.1
10,
595.
0 2
,505
.6
-
1,9
09.8
4. B
ihar
10,
000.
0 1,
092.
0 1
4,30
0.0
3,3
96.9
-
3
,000
.0
5. C
hhat
tisga
rh 8
,100
.0
-
12,
900.
0 -
-
700
.0
6. G
oa 1
,800
.0
400
.0
2,3
50.0
5
00.0
2
00.0
6
00.0
7. G
ujar
at 2
4,00
0.0
8,2
15.0
3
6,97
0.7
9,5
14.0
5
,300
.0
10,
300.
0
8. H
arya
na 1
6,63
9.5
800
.0
21,
265.
0 3
,295
.0
2,0
00.0
4
,000
.0
9. H
imac
hal P
rad
esh
4,6
00.0
2
,049
.0
4,2
10.0
2
,101
.9
600
.0
2,1
20.0
10. J
amm
u an
d K
ashm
ir 6
,200
.0
2,22
6.1
6,6
84.0
1
,756
.9
1,3
49.0
-
11. J
hark
hand
5,9
99.7
1
,192
.2
5,5
09.0
1
,486
.0
-
1,8
44.0
12. K
arna
taka
22,
098.
0 4
,750
.0
39,
600.
0 8
,217
.0
-
6,0
00.0
13. K
eral
a 2
0,50
0.0
4,2
96.8
1
9,50
0.0
4,7
15.9
5
,800
.0
5,4
56.0
14. M
adhy
a P
rad
esh
15,
000.
0 1
,875
.0
20,
496.
0 5
,525
.5
3,0
00.0
5
,821
.0
15. M
ahar
asht
ra 4
5,00
0.0
8,5
19.7
2
0,86
8.9
17,
751.
7 8
,000
.0
15,
500.
0
16. M
anip
ur 5
25.0
2
47.2
9
70.0
3
03.3
2
03.0
5
02.8
17. M
egha
laya
1,1
15.5
1
95.7
1
,122
.0
259
.4
-
273
.5
18. M
izor
am 4
24.0
1
46.9
-
1
23.2
1
58.0
1
55.3
19. N
agal
and
1,1
35.0
3
69.1
8
22.0
4
67.0
1
00.0
5
77.4
20. O
dis
ha 8
,438
.0
-
5,5
00.0
1
,000
.0
1,0
00.0
1
,000
.0
21. P
unja
b 1
7,47
0.0
4,1
21.3
2
2,11
4.7
5,0
61.2
4
,300
.0
8,8
85.0
22. R
ajas
than
24,
914.
0 8
,137
.1
33,
178.
0 1
2,99
1.5
7,0
00.0
1
4,40
5.7
23. S
ikki
m 9
95.0
2
49.9
1
,088
.0
293
.0
213
.0
328
.0
24. T
amil
Nad
u 4
0,96
5.4
4,9
42.4
4
3,12
5.5
10,
847.
7 8
,000
.0
12,
599.
0
25. T
elan
gana
24,
600.
0 2,
771.
7 2
6,74
0.0
4,5
57.1
4
,000
.0
-
26. T
ripur
a 1
,137
.0
-
1,5
42.8
1
56.0
-
3
50.0
27. U
ttar
Pra
des
h 4
1,60
0.0
4,42
2.0
46,
000.
0 1
2,69
3.3
-
600
.0
28. U
ttar
akha
nd 6
,660
.0
830.
0 6
,300
.0
1,0
10.7
5
00.0
1
3,87
6.9
29. W
est
Ben
gal
36,
911.
0 1
1,60
6.7
42,
828.
0 1
2,39
7.5
-
16,
109.
8
30. P
uduc
herr
y 8
25.0
3
37.0
8
25.0
3
50.4
-
5
00.0
All
Sta
tes
and
UT
4,1
9,09
9.5
78,
818.
8 4
,78,
323.
5 1
,29,
680.
3 6
0,03
8.0
1,4
2,79
7.3
*: D
ata
per
tain
to
Ap
ril 0
1-Ju
ne 1
0.S
our
ce: R
eser
ve B
ank
reco
rds.

State Finances : A Study of Budgets of 2019-20
132
Sr.No.
Particulars Balance as at end-March 2019
ANDHRA PRADESH
Loans bearing interest
1 8.91% Andhra Pradesh GS 2022 437.4
2 8.91% Andhra Pradesh SDL 2022 437.4
3 8.59% Andhra Pradesh SDL 2023 1,166.4
4 8.72% Andhra Pradesh SDL 2023 1,458.0
5 8.59% Andhra Pradesh SDL 2023 291.6
6 8.64% Andhra Pradesh SDL 2023 1,166.4
7 8.25% Andhra Pradesh SDL 2023 583.2
8 7.57% Andhra Pradesh SDL 2023 583.2
9 9.84% Andhra Pradesh SDL 2023 583.2
10 9.71% Andhra Pradesh SDL 2023 1,049.8
11 9.77% Andhra Pradesh SDL 2023 583.2
12 9.55% Andhra Pradesh SDL 2023 1,089.1
13 9.84% Andhra Pradesh SDL 2023 463.5
14 9.38% Andhra Pradesh SDL 2023 707.3
15 9.39% Andhra Pradesh SDL 2023 586.0
16 9.52% Andhra Pradesh SDL 2023 1,067.8
17 9.38% Andhra Pradesh SDL 2024 1,108.1
18 9.26% Andhra Pradesh SDL 2024 874.8
19 9.40% Andhra Pradesh SDL 2024 529.3
20 9.63% Andhra Pradesh SDL 2024 858.9
21 9.84% Andhra Pradesh SDL 2024 653.3
22 9.71% Andhra Pradesh SDL 2024 1,020.6
23 9.48% Andhra Pradesh SDL 2024 729.0
24 9.40% Andhra Pradesh SDL 2024 1,166.4
25 9.21% Andhra Pradesh SDL 2024 1,749.6
26 9.18% Andhra Pradesh SDL 2024 1,166.4
27 9.08% Andhra Pradesh SDL 2024 2,000.0
28 8.96% Andhra Pradesh SDL 2024 1,000.0
29 8.88% Andhra Pradesh SDL 2024 2,000.0
30 8.46% Andhra Pradesh SDL 2024 2,000.0
31 8.26% Andhra Pradesh SDL 2024 1,000.0
32 8.09% Andhra Pradesh SDL 2025 1,000.0
33 8.06% Andhra Pradesh SDL 2025 1,000.0
34 8.10% Andhra Pradesh SDL 2025 1,000.0
35 8.18% Andhra Pradesh SDL 2025 1,500.0
36 8.22% Andhra Pradesh SDL 2025 1,000.0
37 8.33% Andhra Pradesh SDL 2025 1,300.0
38 8.31% Andhra Pradesh SDL 2025 1,000.0
39 8.26% Andhra Pradesh SDL 2025 1,200.0
40 8.24% Andhra Pradesh SDL 2025 1,000.0
41 7.98% Andhra Pradesh SDL 2025 1,500.0
42 8.15% Andhra Pradesh SDL 2025 550.0
43 8.24% Andhra Pradesh SDL 2025 1,500.0
44 8.25% Andhra Pradesh SDL 2025 500.0
45 8.29% Andhra Pradesh SDL 2026 2,000.0
46 8.39% Andhra Pradesh SDL 2026 1,000.0
47 8.72% Andhra Pradesh SDL 2026 1,000.0
48 8.57% Andhra Pradesh SDL 2026 1,500.0
49 8.09% Andhra Pradesh SDL 2026 1,500.0
50 8.01% Andhra Pradesh SDL 2026 1,500.0
51 8.09% Andhra Pradesh SDL 2026 1,500.0
Sr.No.
Particulars Balance as at end-March 2019
52 7.85% Andhra Pradesh SDL 2026 1,000.0
53 7.63% Andhra Pradesh SDL 2026 1,000.0
54 7.23% Andhra Pradesh SDL 2026 1,500.0
55 7.42% Andhra Pradesh SDL 2026 1,500.0
56 7.08% Andhra Pradesh SDL 2026 1,000.0
57 7.25% Andhra Pradesh SDL 2026 1,000.0
58 7.14% Andhra Pradesh SDL 2027 1,000.0
59 7.61% Andhra Pradesh SDL 2027 1,000.0
60 7.50% Andhra Pradesh GS 2019 583.2
61 7.11% Andhra Pradesh GS 2019 933.1
62 7.45% Andhra Pradesh GS 2019 583.2
63 7.83% Andhra Pradesh GS 2019 583.2
64 7.93% Andhra Pradesh GS 2019 583.2
65 7.85% Andhra Pradesh GS 2019 583.2
66 8.19% Andhra Pradesh GS 2019 1,166.4
67 8.10% Andhra Pradesh GS 2019 816.5
68 8.22% Andhra Pradesh GS 2019 583.2
69 8.10% Andhra Pradesh GS 2019 583.2
70 8.26% Andhra Pradesh GS 2019 291.6
71 8.25% Andhra Pradesh GS 2020 291.6
72 8.48% Andhra Pradesh GS 2020 583.2
73 8.39% Andhra Pradesh GS 2020 806.6
74 8.57% Andhra Pradesh GS 2020 874.8
75 8.49% Andhra Pradesh GS 2020 291.6
76 8.07% Andhra Pradesh GS 2020 583.2
77 8.11% Andhra Pradesh GS 2020 583.2
78 8.18% Andhra Pradesh GS 2020 583.2
79 8.42% Andhra Pradesh GS 2020 583.2
80 8.37% Andhra Pradesh GS 2020 583.2
81 6.99% Andhra Pradesh SDL 2020 500.0
82 8.52% Andhra Pradesh GS 2020 291.6
83 8.39% Andhra Pradesh GS 2020 583.2
84 8.35% Andhra Pradesh GS 2020 291.6
85 8.53% Andhra Pradesh GS 2021 583.2
86 7.56% Andhra Pradesh SDL 2021 1,500.0
87 8.51% Andhra Pradesh GS 2021 845.6
88 7.77% Andhra Pradesh SDL 2021 565.0
89 7.64% Andhra Pradesh SDL 2021 835.0
90 8.37% Andhra Pradesh GS 2021 320.8
91 8.47% Andhra Pradesh GS 2021 699.8
92 8.67% Andhra Pradesh GS 2021 583.2
93 8.60% Andhra Pradesh GS 2021 583.2
94 8.66% Andhra Pradesh GS 2021 1,049.8
95 7.59% Andhra Pradesh SDL 2021 800.0
96 8.56% Andhra Pradesh GS 2021 1,166.4
97 8.63% Andhra Pradesh GS 2021 1,166.4
98 8.90% Andhra Pradesh GS 2021 947.5
99 9.04% Andhra Pradesh GS 2021 218.9
100 9.17% Andhra Pradesh GS 2021 583.2
101 9.25% Andhra Pradesh GS 2021 291.6
102 6.63% Andhra Pradesh SDL 2021 500.0
103 8.72% Andhra Pradesh GS 2022 583.2
104 8.71% Andhra Pradesh GS 2022 583.2
105 8.97% Andhra Pradesh GS 2022 583.2
Statement 22: State Government Market Loans(` Crore)
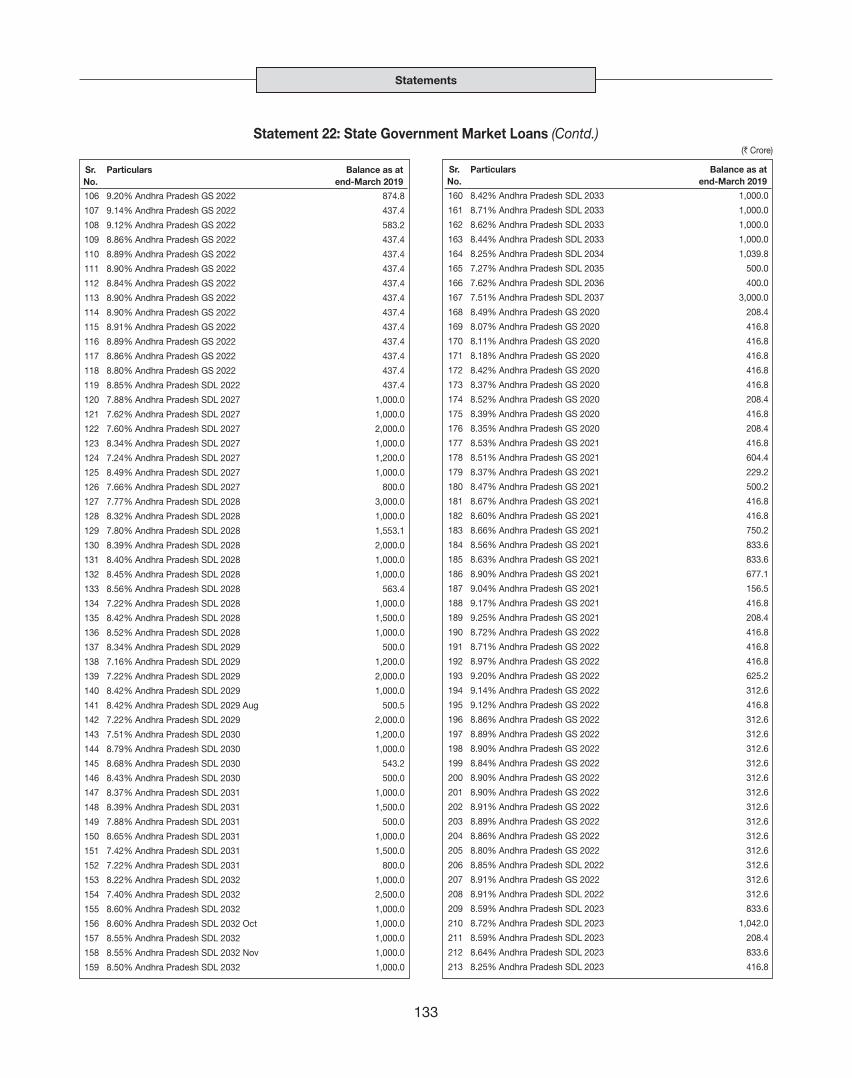
Statements
133
Statement 22: State Government Market Loans (Contd.)(` Crore)
Sr.No.
Particulars Balance as at end-March 2019
106 9.20% Andhra Pradesh GS 2022 874.8
107 9.14% Andhra Pradesh GS 2022 437.4
108 9.12% Andhra Pradesh GS 2022 583.2
109 8.86% Andhra Pradesh GS 2022 437.4
110 8.89% Andhra Pradesh GS 2022 437.4
111 8.90% Andhra Pradesh GS 2022 437.4
112 8.84% Andhra Pradesh GS 2022 437.4
113 8.90% Andhra Pradesh GS 2022 437.4
114 8.90% Andhra Pradesh GS 2022 437.4
115 8.91% Andhra Pradesh GS 2022 437.4
116 8.89% Andhra Pradesh GS 2022 437.4
117 8.86% Andhra Pradesh GS 2022 437.4
118 8.80% Andhra Pradesh GS 2022 437.4
119 8.85% Andhra Pradesh SDL 2022 437.4
120 7.88% Andhra Pradesh SDL 2027 1,000.0
121 7.62% Andhra Pradesh SDL 2027 1,000.0
122 7.60% Andhra Pradesh SDL 2027 2,000.0
123 8.34% Andhra Pradesh SDL 2027 1,000.0
124 7.24% Andhra Pradesh SDL 2027 1,200.0
125 8.49% Andhra Pradesh SDL 2027 1,000.0
126 7.66% Andhra Pradesh SDL 2027 800.0
127 7.77% Andhra Pradesh SDL 2028 3,000.0
128 8.32% Andhra Pradesh SDL 2028 1,000.0
129 7.80% Andhra Pradesh SDL 2028 1,553.1
130 8.39% Andhra Pradesh SDL 2028 2,000.0
131 8.40% Andhra Pradesh SDL 2028 1,000.0
132 8.45% Andhra Pradesh SDL 2028 1,000.0
133 8.56% Andhra Pradesh SDL 2028 563.4
134 7.22% Andhra Pradesh SDL 2028 1,000.0
135 8.42% Andhra Pradesh SDL 2028 1,500.0
136 8.52% Andhra Pradesh SDL 2028 1,000.0
137 8.34% Andhra Pradesh SDL 2029 500.0
138 7.16% Andhra Pradesh SDL 2029 1,200.0
139 7.22% Andhra Pradesh SDL 2029 2,000.0
140 8.42% Andhra Pradesh SDL 2029 1,000.0
141 8.42% Andhra Pradesh SDL 2029 Aug 500.5
142 7.22% Andhra Pradesh SDL 2029 2,000.0
143 7.51% Andhra Pradesh SDL 2030 1,200.0
144 8.79% Andhra Pradesh SDL 2030 1,000.0
145 8.68% Andhra Pradesh SDL 2030 543.2
146 8.43% Andhra Pradesh SDL 2030 500.0
147 8.37% Andhra Pradesh SDL 2031 1,000.0
148 8.39% Andhra Pradesh SDL 2031 1,500.0
149 7.88% Andhra Pradesh SDL 2031 500.0
150 8.65% Andhra Pradesh SDL 2031 1,000.0
151 7.42% Andhra Pradesh SDL 2031 1,500.0
152 7.22% Andhra Pradesh SDL 2031 800.0
153 8.22% Andhra Pradesh SDL 2032 1,000.0
154 7.40% Andhra Pradesh SDL 2032 2,500.0
155 8.60% Andhra Pradesh SDL 2032 1,000.0
156 8.60% Andhra Pradesh SDL 2032 Oct 1,000.0
157 8.55% Andhra Pradesh SDL 2032 1,000.0
158 8.55% Andhra Pradesh SDL 2032 Nov 1,000.0
159 8.50% Andhra Pradesh SDL 2032 1,000.0
Sr.No.
Particulars Balance as at end-March 2019
160 8.42% Andhra Pradesh SDL 2033 1,000.0
161 8.71% Andhra Pradesh SDL 2033 1,000.0
162 8.62% Andhra Pradesh SDL 2033 1,000.0
163 8.44% Andhra Pradesh SDL 2033 1,000.0
164 8.25% Andhra Pradesh SDL 2034 1,039.8
165 7.27% Andhra Pradesh SDL 2035 500.0
166 7.62% Andhra Pradesh SDL 2036 400.0
167 7.51% Andhra Pradesh SDL 2037 3,000.0
168 8.49% Andhra Pradesh GS 2020 208.4
169 8.07% Andhra Pradesh GS 2020 416.8
170 8.11% Andhra Pradesh GS 2020 416.8
171 8.18% Andhra Pradesh GS 2020 416.8
172 8.42% Andhra Pradesh GS 2020 416.8
173 8.37% Andhra Pradesh GS 2020 416.8
174 8.52% Andhra Pradesh GS 2020 208.4
175 8.39% Andhra Pradesh GS 2020 416.8
176 8.35% Andhra Pradesh GS 2020 208.4
177 8.53% Andhra Pradesh GS 2021 416.8
178 8.51% Andhra Pradesh GS 2021 604.4
179 8.37% Andhra Pradesh GS 2021 229.2
180 8.47% Andhra Pradesh GS 2021 500.2
181 8.67% Andhra Pradesh GS 2021 416.8
182 8.60% Andhra Pradesh GS 2021 416.8
183 8.66% Andhra Pradesh GS 2021 750.2
184 8.56% Andhra Pradesh GS 2021 833.6
185 8.63% Andhra Pradesh GS 2021 833.6
186 8.90% Andhra Pradesh GS 2021 677.1
187 9.04% Andhra Pradesh GS 2021 156.5
188 9.17% Andhra Pradesh GS 2021 416.8
189 9.25% Andhra Pradesh GS 2021 208.4
190 8.72% Andhra Pradesh GS 2022 416.8
191 8.71% Andhra Pradesh GS 2022 416.8
192 8.97% Andhra Pradesh GS 2022 416.8
193 9.20% Andhra Pradesh GS 2022 625.2
194 9.14% Andhra Pradesh GS 2022 312.6
195 9.12% Andhra Pradesh GS 2022 416.8
196 8.86% Andhra Pradesh GS 2022 312.6
197 8.89% Andhra Pradesh GS 2022 312.6
198 8.90% Andhra Pradesh GS 2022 312.6
199 8.84% Andhra Pradesh GS 2022 312.6
200 8.90% Andhra Pradesh GS 2022 312.6
201 8.90% Andhra Pradesh GS 2022 312.6
202 8.91% Andhra Pradesh GS 2022 312.6
203 8.89% Andhra Pradesh GS 2022 312.6
204 8.86% Andhra Pradesh GS 2022 312.6
205 8.80% Andhra Pradesh GS 2022 312.6
206 8.85% Andhra Pradesh SDL 2022 312.6
207 8.91% Andhra Pradesh GS 2022 312.6
208 8.91% Andhra Pradesh SDL 2022 312.6
209 8.59% Andhra Pradesh SDL 2023 833.6
210 8.72% Andhra Pradesh SDL 2023 1,042.0
211 8.59% Andhra Pradesh SDL 2023 208.4
212 8.64% Andhra Pradesh SDL 2023 833.6
213 8.25% Andhra Pradesh SDL 2023 416.8
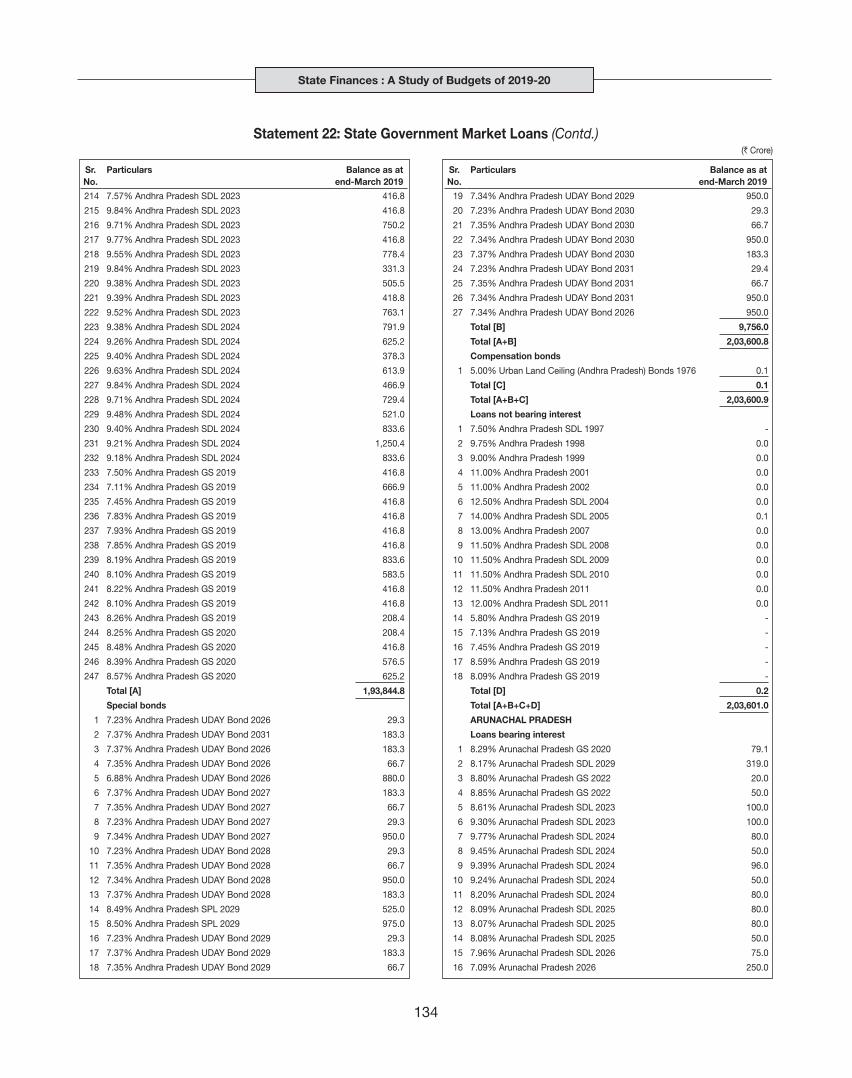
State Finances : A Study of Budgets of 2019-20
134
Statement 22: State Government Market Loans (Contd.)(` Crore)
Sr.No.
Particulars Balance as at end-March 2019
214 7.57% Andhra Pradesh SDL 2023 416.8
215 9.84% Andhra Pradesh SDL 2023 416.8
216 9.71% Andhra Pradesh SDL 2023 750.2
217 9.77% Andhra Pradesh SDL 2023 416.8
218 9.55% Andhra Pradesh SDL 2023 778.4
219 9.84% Andhra Pradesh SDL 2023 331.3
220 9.38% Andhra Pradesh SDL 2023 505.5
221 9.39% Andhra Pradesh SDL 2023 418.8
222 9.52% Andhra Pradesh SDL 2023 763.1
223 9.38% Andhra Pradesh SDL 2024 791.9
224 9.26% Andhra Pradesh SDL 2024 625.2
225 9.40% Andhra Pradesh SDL 2024 378.3
226 9.63% Andhra Pradesh SDL 2024 613.9
227 9.84% Andhra Pradesh SDL 2024 466.9
228 9.71% Andhra Pradesh SDL 2024 729.4
229 9.48% Andhra Pradesh SDL 2024 521.0
230 9.40% Andhra Pradesh SDL 2024 833.6
231 9.21% Andhra Pradesh SDL 2024 1,250.4
232 9.18% Andhra Pradesh SDL 2024 833.6
233 7.50% Andhra Pradesh GS 2019 416.8
234 7.11% Andhra Pradesh GS 2019 666.9
235 7.45% Andhra Pradesh GS 2019 416.8
236 7.83% Andhra Pradesh GS 2019 416.8
237 7.93% Andhra Pradesh GS 2019 416.8
238 7.85% Andhra Pradesh GS 2019 416.8
239 8.19% Andhra Pradesh GS 2019 833.6
240 8.10% Andhra Pradesh GS 2019 583.5
241 8.22% Andhra Pradesh GS 2019 416.8
242 8.10% Andhra Pradesh GS 2019 416.8
243 8.26% Andhra Pradesh GS 2019 208.4
244 8.25% Andhra Pradesh GS 2020 208.4
245 8.48% Andhra Pradesh GS 2020 416.8
246 8.39% Andhra Pradesh GS 2020 576.5
247 8.57% Andhra Pradesh GS 2020 625.2
Total [A] 1,93,844.8
Special bonds
1 7.23% Andhra Pradesh UDAY Bond 2026 29.3
2 7.37% Andhra Pradesh UDAY Bond 2031 183.3
3 7.37% Andhra Pradesh UDAY Bond 2026 183.3
4 7.35% Andhra Pradesh UDAY Bond 2026 66.7
5 6.88% Andhra Pradesh UDAY Bond 2026 880.0
6 7.37% Andhra Pradesh UDAY Bond 2027 183.3
7 7.35% Andhra Pradesh UDAY Bond 2027 66.7
8 7.23% Andhra Pradesh UDAY Bond 2027 29.3
9 7.34% Andhra Pradesh UDAY Bond 2027 950.0
10 7.23% Andhra Pradesh UDAY Bond 2028 29.3
11 7.35% Andhra Pradesh UDAY Bond 2028 66.7
12 7.34% Andhra Pradesh UDAY Bond 2028 950.0
13 7.37% Andhra Pradesh UDAY Bond 2028 183.3
14 8.49% Andhra Pradesh SPL 2029 525.0
15 8.50% Andhra Pradesh SPL 2029 975.0
16 7.23% Andhra Pradesh UDAY Bond 2029 29.3
17 7.37% Andhra Pradesh UDAY Bond 2029 183.3
18 7.35% Andhra Pradesh UDAY Bond 2029 66.7
Sr.No.
Particulars Balance as at end-March 2019
19 7.34% Andhra Pradesh UDAY Bond 2029 950.0
20 7.23% Andhra Pradesh UDAY Bond 2030 29.3
21 7.35% Andhra Pradesh UDAY Bond 2030 66.7
22 7.34% Andhra Pradesh UDAY Bond 2030 950.0
23 7.37% Andhra Pradesh UDAY Bond 2030 183.3
24 7.23% Andhra Pradesh UDAY Bond 2031 29.4
25 7.35% Andhra Pradesh UDAY Bond 2031 66.7
26 7.34% Andhra Pradesh UDAY Bond 2031 950.0
27 7.34% Andhra Pradesh UDAY Bond 2026 950.0
Total [B] 9,756.0
Total [A+B] 2,03,600.8
Compensation bonds
1 5.00% Urban Land Ceiling (Andhra Pradesh) Bonds 1976 0.1
Total [C] 0.1
Total [A+B+C] 2,03,600.9
Loans not bearing interest
1 7.50% Andhra Pradesh SDL 1997 -
2 9.75% Andhra Pradesh 1998 0.0
3 9.00% Andhra Pradesh 1999 0.0
4 11.00% Andhra Pradesh 2001 0.0
5 11.00% Andhra Pradesh 2002 0.0
6 12.50% Andhra Pradesh SDL 2004 0.0
7 14.00% Andhra Pradesh SDL 2005 0.1
8 13.00% Andhra Pradesh 2007 0.0
9 11.50% Andhra Pradesh SDL 2008 0.0
10 11.50% Andhra Pradesh SDL 2009 0.0
11 11.50% Andhra Pradesh SDL 2010 0.0
12 11.50% Andhra Pradesh 2011 0.0
13 12.00% Andhra Pradesh SDL 2011 0.0
14 5.80% Andhra Pradesh GS 2019 -
15 7.13% Andhra Pradesh GS 2019 -
16 7.45% Andhra Pradesh GS 2019 -
17 8.59% Andhra Pradesh GS 2019 -
18 8.09% Andhra Pradesh GS 2019 -
Total [D] 0.2
Total [A+B+C+D] 2,03,601.0
ARUNACHAL PRADESH
Loans bearing interest
1 8.29% Arunachal Pradesh GS 2020 79.1
2 8.17% Arunachal Pradesh SDL 2029 319.0
3 8.80% Arunachal Pradesh GS 2022 20.0
4 8.85% Arunachal Pradesh GS 2022 50.0
5 8.61% Arunachal Pradesh SDL 2023 100.0
6 9.30% Arunachal Pradesh SDL 2023 100.0
7 9.77% Arunachal Pradesh SDL 2024 80.0
8 9.45% Arunachal Pradesh SDL 2024 50.0
9 9.39% Arunachal Pradesh SDL 2024 96.0
10 9.24% Arunachal Pradesh SDL 2024 50.0
11 8.20% Arunachal Pradesh SDL 2024 80.0
12 8.09% Arunachal Pradesh SDL 2025 80.0
13 8.07% Arunachal Pradesh SDL 2025 80.0
14 8.08% Arunachal Pradesh SDL 2025 50.0
15 7.96% Arunachal Pradesh SDL 2026 75.0
16 7.09% Arunachal Pradesh 2026 250.0

Statements
135
Sr.No.
Particulars Balance as at end-March 2019
17 7.60% Arunachal Pradesh SDL 2027 128.0
18 7.62% Arunachal Pradesh SDL 2027 250.0
19 7.22% Arunachal Pradesh SDL 2027 150.0
20 8.41% Arunachal Pradesh SDL 2028 250.0
21 8.12% Arunachal Pradesh SDL 2028 237.5
22 7.80% Arunachal Pradesh SDL 2028 400.0
23 9.02% Arunachal Pradesh GS 2022 33.0
Total [A] 3,007.6
Loans not bearing interest
1 8.47% Arunachal Pradesh GS 2019 -
Total [B] -
Total [A+B] 3,007.6
ASSAM
Loans bearing interest
1 8.34% Assam SDL 2029 1,000.0
2 8.19% Assam SDL 2029 500.0
3 8.40% Assam GS 2020 962.5
4 8.53% Assam GS 2020 947.3
5 8.48% Assam GS 2021 800.0
6 7.96% Assam SDL 2021 500.0
7 7.90% Assam SDL 2021 500.0
8 7.73% Assam SDL 2021 500.0
9 7.86% Assam SDL 2022 500.0
10 8.95% Assam GS 2022 300.0
11 7.69% Assam SDL 2023 695.0
12 8.04% Assam SDL 2024 500.0
13 7.82% Assam SDL 2024 500.0
14 7.72% Assam SDL 2024 500.0
15 8.84% Assam SDL 2024 450.0
16 8.07% Assam SDL 2025 1,000.0
17 8.12% Assam SDL 2025 1,500.0
18 8.06% Assam SDL 2025 950.0
19 8.43% Assam SDL 2026 950.0
20 8.55% Assam SDL 2026 900.0
21 8.63% Assam SDL 2026 350.0
22 7.23% Assam SDL 2026 500.0
23 7.42% Assam SDL 2026 500.0
24 6.97% Assam SDL 2026 412.8
25 7.10% Assam SDL 2026 1,000.0
26 7.22% Assam SDL 2026 677.2
27 7.55% Assam SDL 2027 700.0
28 7.15% Assam SDL 2027 300.0
29 7.29% Assam SDL 2027 530.0
30 7.30% Assam SDL 2027 500.0
31 7.26% Assam SDL 2027 531.6
32 7.30% Assam SDL 2027 418.4
33 7.61% Assam SDL 2027 600.0
34 7.67% Assam SDL 2027 600.0
35 7.73% Assam SDL 2027 567.3
36 8.08% Assam SDL 2028 500.0
37 8.20% Assam SDL 2028 500.0
38 8.05% Assam SDL 2028 500.0
39 8.29% Assam SDL 2028 500.0
40 8.36% Assam SDL 2028 500.0
Sr.No.
Particulars Balance as at end-March 2019
41 8.29% Assam SDL 2028 512.8
42 7.97% Assam SDL 2028 1,000.0
43 7.97% Assam SDL 2028 Apr 500.0
44 8.54% Assam SDL 2028 500.0
45 8.42% Assam SDL 2028 500.0
46 8.41% Assam SDL 2028 500.0
47 8.42% Assam SDL 2028 Aug 500.0
48 8.54% Assam SDL 2028 Aug 500.0
49 8.75% Assam SDL 2028 400.0
50 8.45% Assam SDL 2029 500.0
Total [A] 30,554.8
Compensation bonds
1 2.50% Assam State Acquisition of Zamindari Act 1951 0.1
Total [B] 0.1
Total [A+B] 30,554.8
Loans not bearing interest
1 12.50% Assam SDL 2004 0.0
2 13.00% Assam 2007 0.0
3 8.89% Assam GS 2019 -
4 8.43% Assam GS 2019 -
Total [C] 0.0
Total [A+B+C] 30,554.8
BIHAR
Loans bearing interest
1 7.89% Bihar GS 2019 1,000.0
2 8.39% Bihar SDL 2029 2,300.0
3 8.25% Bihar GS 2019 600.0
4 8.35% Bihar GS 2019 607.2
5 8.53% Bihar GS 2020 1,000.0
6 8.55% Bihar GS 2021 1,000.0
7 8.38% Bihar GS 2021 600.0
8 8.89% Bihar GS 2021 1,000.0
9 8.80% Bihar GS 2021 719.0
10 8.72% Bihar GS 2022 1,281.0
11 8.99% Bihar GS 2022 500.0
12 9.03% Bihar GS 2022 500.0
13 9.16% Bihar GS 2022 750.0
14 8.89% Bihar SDL 2022 1,000.0
15 8.97% Bihar GS 2022 1,250.0
16 8.99% Bihar SDL 2022 1,000.0
17 8.68% Bihar SDL 2023 1,300.0
18 8.69% Bihar SDL 2023 500.0
19 8.62% Bihar SDL 2023 200.0
20 8.64% Bihar SDL 2023 1,100.0
21 9.39% Bihar SDL 2023 1,500.0
22 9.40% Bihar SDL 2023 1,000.0
23 9.52% Bihar SDL 2023 1,000.0
24 9.29% Bihar SDL 2024 1,000.0
25 9.64% Bihar SDL 2024 1,000.0
26 9.84% Bihar SDL 2024 1,000.0
27 8.73% Bihar SDL 2024 1,000.0
28 8.45% Bihar SDL 2024 1,000.0
29 8.17% Bihar SDL 2024 1,000.0
30 8.25% Bihar SDL 2024 1,500.0
Statement 22: State Government Market Loans (Contd.)(` Crore)

State Finances : A Study of Budgets of 2019-20
136
Sr.No.
Particulars Balance as at end-March 2019
31 8.15% Bihar SDL 2025 1,500.0
32 8.08% Bihar SDL 2025 1,500.0
33 8.06% Bihar SDL 2025 600.0
34 8.17% Bihar SDL 2025 2,000.0
35 7.99% Bihar SDL 2025 1,500.0
36 8.54% Bihar SDL 2026 2,500.0
37 8.82% Bihar SDL 2026 2,500.0
38 8.60% Bihar SDL 2026 3,000.0
39 6.89% Bihar SDL 2026 2,000.0
40 7.10% Bihar SDL 2026 2,000.0
41 7.29% Bihar SDL 2026 2,000.0
42 7.12% Bihar SDL 2027 2,000.0
43 7.20% Bihar SDL 2027 2,000.0
44 7.59% Bihar SDL 2027 3,000.0
45 7.78% Bihar SDL 2027 3,000.0
46 7.85% Bihar SDL 2027 1,700.0
47 7.74% Bihar SDL 2028 1,500.0
48 7.89% Bihar SDL 2028 1,500.0
49 7.86% Bihar SDL 2028 1,500.0
50 8.05% Bihar SDL 2028 1,500.0
51 8.36% Bihar SDL 2028 1,500.0
52 8.15% Bihar SDL 2028 2,500.0
53 8.27% Bihar SDL 2029 2,000.0
54 8.21% Bihar SDL 2029 2,000.0
55 8.20% Bihar SDL 2029 2,000.0
56 8.18% Bihar SDL 2029 2,000.0
57 8.36% Bihar SDL 2029 2,000.0
58 8.44% Bihar SDL 2029 2,000.0
59 8.49% Bihar GS 2019 792.8
Total [A] 84,800.0
Special bonds
1 8.53% Bihar UDAY Bond 2022 155.5
2 7.70% Bihar UDAY Bond 2031 77.7
3 8.45% Bihar UDAY Bond 2023 155.5
4 7.55% Bihar UDAY Bond 2023 77.7
5 8.50% Bihar UDAY Bond 2024 155.5
6 7.59% Bihar UDAY Bond 2024 77.7
7 8.50% Bihar UDAY Bond 2025 155.5
8 7.55% Bihar UDAY Bond 2025 77.7
9 8.22% Bihar UDAY Bond 2026 155.5
10 7.42% Bihar UDAY Bond 2026 77.7
11 8.45% Bihar UDAY Bond 2027 155.5
12 7.68% Bihar UDAY Bond 2027 77.7
13 8.65% Bihar UDAY Bond 2028 155.5
14 7.68% Bihar UDAY Bond 2028 77.7
15 8.48% Bihar UDAY Bond 2029 155.5
16 7.58% Bihar UDAY Bond 2029 77.7
17 8.62% Bihar UDAY Bond 2030 155.5
18 7.66% Bihar UDAY Bond 2030 77.7
19 8.72% Bihar UDAY Bond 2031 155.5
20 7.55% Bihar UDAY Bond 2022 77.7
Total [B] 2,331.8
Total [A+B] 87,131.8
Sr.No.
Particulars Balance as at end-March 2019
Compensation bonds
1 2.50% Bihar Bihar Zamindari Abolition Compensation Bond 18.9
Total [C] 18.9
Total [A+B+C] 87,150.7
Loans not bearing interest (prior to reorganisation)
1 9.75% Bihar SDL 1998 0.0
2 9.00% Bihar SDL 1999 0.1
3 8.75% Bihar SDL 2000 0.0
4 11.00% Bihar SDL 2001 0.0
5 11.00% Bihar SDL 2002 0.0
6 13.50% Bihar SDL 2003 0.1
7 14.00% Bihar SDL 2005 0.0
8 13.00% Bihar SDL 2007 0.0
9 11.50% Bihar SDL 2009 0.0
10 11.50% Bihar SDL 2010 0.0
11 11.50% Bihar SDL 2011 0.0
12 12.00% Bihar SDL 2011 0.0
13 7.10% Bihar SDL 2019 -
14 8.78% Bihar SDL 2019 -
15 8.45% Bihar SDL 2019 -
Total [D] 0.2
Total [A+B+C+D] 87,150.9
CHHATTISGARH
Loans bearing interest
1 8.25% Chhattisgarh GS 2019 700.0
2 8.15% Chhattisgarh SDL 2028 750.0
3 7.64% Chhattisgarh SDL 2021 1,500.0
4 8.11% Chhattisgarh SDL 2021 500.0
5 8.07% Chhattisgarh SDL 2021 500.0
6 7.90% Chhattisgarh SDL 2021 500.0
7 7.48% Chhattisgarh SDL 2022 750.0
8 7.43% Chhattisgarh SDL 2022 750.0
9 7.94% Chhattisgarh SDL 2023 2,000.0
10 8.65% Chhattisgarh SDL 2023 1,500.0
11 7.57% Chhattisgarh SDL 2023 700.0
12 8.12% Chhattisgarh SDL 2023 800.0
13 8.02% Chhattisgarh SDL 2023 700.0
14 9.30% Chhattisgarh SDL 2023 800.0
15 9.60% Chhattisgarh SDL 2024 700.0
16 7.93% Chhattisgarh SDL 2024 1,000.0
17 7.68% Chhattisgarh SDL 2024 500.0
18 7.69% Chhattisgarh SDL 2024 500.0
19 9.22% Chhattisgarh SDL 2024 500.0
20 8.98% Chhattisgarh SDL 2024 250.0
21 9.03% Chhattisgarh SDL 2024 750.0
22 8.85% Chhattisgarh SDL 2024 700.0
23 8.08% Chhattisgarh SDL 2025 700.0
24 8.14% Chhattisgarh SDL 2025 1,000.0
25 8.18% Chhattisgarh SDL 2025 1,000.0
26 8.06% Chhattisgarh SDL 2025 800.0
27 8.02% Chhattisgarh SDL 2025 500.0
28 8.32% Chhattisgarh SDL 2025 700.0
29 8.19% Chhattisgarh SDL 2025 800.0
30 8.23% Chhattisgarh SDL 2025 1,500.0
Statement 22: State Government Market Loans (Contd.)(` Crore)
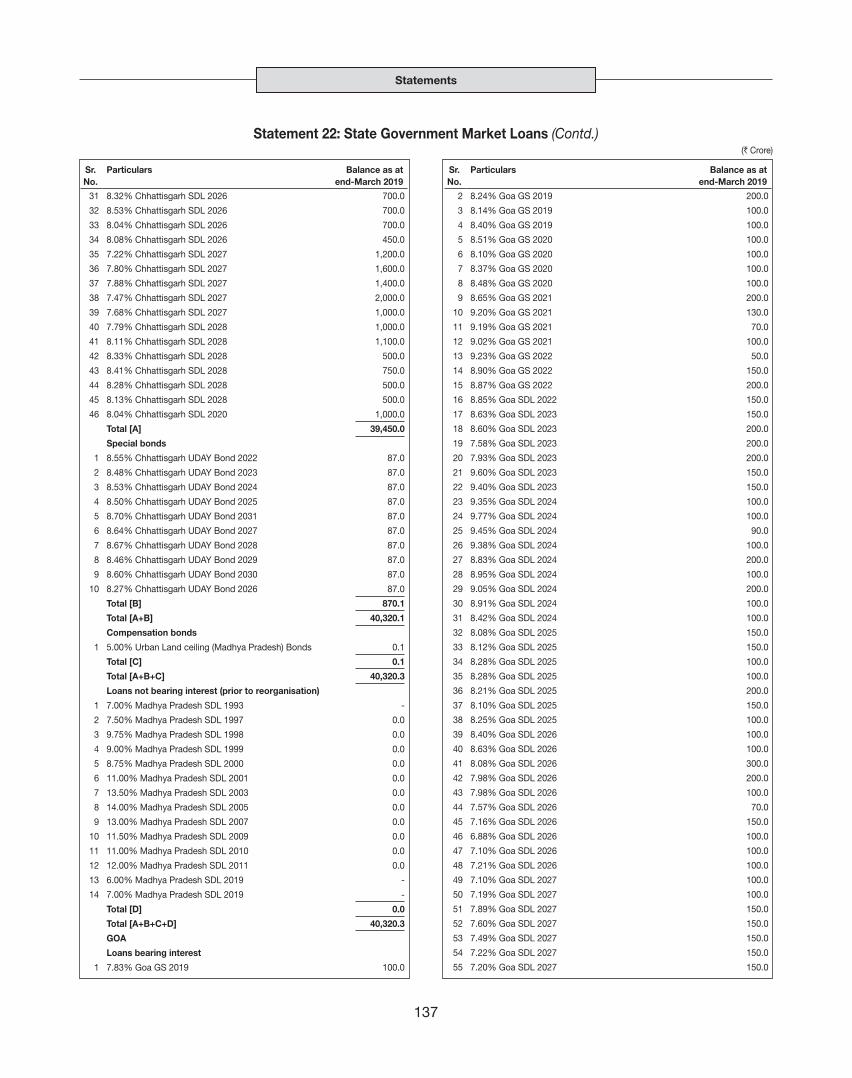
Statements
137
Sr.No.
Particulars Balance as at end-March 2019
31 8.32% Chhattisgarh SDL 2026 700.0
32 8.53% Chhattisgarh SDL 2026 700.0
33 8.04% Chhattisgarh SDL 2026 700.0
34 8.08% Chhattisgarh SDL 2026 450.0
35 7.22% Chhattisgarh SDL 2027 1,200.0
36 7.80% Chhattisgarh SDL 2027 1,600.0
37 7.88% Chhattisgarh SDL 2027 1,400.0
38 7.47% Chhattisgarh SDL 2027 2,000.0
39 7.68% Chhattisgarh SDL 2027 1,000.0
40 7.79% Chhattisgarh SDL 2028 1,000.0
41 8.11% Chhattisgarh SDL 2028 1,100.0
42 8.33% Chhattisgarh SDL 2028 500.0
43 8.41% Chhattisgarh SDL 2028 750.0
44 8.28% Chhattisgarh SDL 2028 500.0
45 8.13% Chhattisgarh SDL 2028 500.0
46 8.04% Chhattisgarh SDL 2020 1,000.0
Total [A] 39,450.0
Special bonds
1 8.55% Chhattisgarh UDAY Bond 2022 87.0
2 8.48% Chhattisgarh UDAY Bond 2023 87.0
3 8.53% Chhattisgarh UDAY Bond 2024 87.0
4 8.50% Chhattisgarh UDAY Bond 2025 87.0
5 8.70% Chhattisgarh UDAY Bond 2031 87.0
6 8.64% Chhattisgarh UDAY Bond 2027 87.0
7 8.67% Chhattisgarh UDAY Bond 2028 87.0
8 8.46% Chhattisgarh UDAY Bond 2029 87.0
9 8.60% Chhattisgarh UDAY Bond 2030 87.0
10 8.27% Chhattisgarh UDAY Bond 2026 87.0
Total [B] 870.1
Total [A+B] 40,320.1
Compensation bonds
1 5.00% Urban Land ceiling (Madhya Pradesh) Bonds 0.1
Total [C] 0.1
Total [A+B+C] 40,320.3
Loans not bearing interest (prior to reorganisation)
1 7.00% Madhya Pradesh SDL 1993 -
2 7.50% Madhya Pradesh SDL 1997 0.0
3 9.75% Madhya Pradesh SDL 1998 0.0
4 9.00% Madhya Pradesh SDL 1999 0.0
5 8.75% Madhya Pradesh SDL 2000 0.0
6 11.00% Madhya Pradesh SDL 2001 0.0
7 13.50% Madhya Pradesh SDL 2003 0.0
8 14.00% Madhya Pradesh SDL 2005 0.0
9 13.00% Madhya Pradesh SDL 2007 0.0
10 11.50% Madhya Pradesh SDL 2009 0.0
11 11.00% Madhya Pradesh SDL 2010 0.0
12 12.00% Madhya Pradesh SDL 2011 0.0
13 6.00% Madhya Pradesh SDL 2019 -
14 7.00% Madhya Pradesh SDL 2019 -
Total [D] 0.0
Total [A+B+C+D] 40,320.3
GOA
Loans bearing interest
1 7.83% Goa GS 2019 100.0
Sr.No.
Particulars Balance as at end-March 2019
2 8.24% Goa GS 2019 200.0
3 8.14% Goa GS 2019 100.0
4 8.40% Goa GS 2019 100.0
5 8.51% Goa GS 2020 100.0
6 8.10% Goa GS 2020 100.0
7 8.37% Goa GS 2020 100.0
8 8.48% Goa GS 2020 100.0
9 8.65% Goa GS 2021 200.0
10 9.20% Goa GS 2021 130.0
11 9.19% Goa GS 2021 70.0
12 9.02% Goa GS 2021 100.0
13 9.23% Goa GS 2022 50.0
14 8.90% Goa GS 2022 150.0
15 8.87% Goa GS 2022 200.0
16 8.85% Goa SDL 2022 150.0
17 8.63% Goa SDL 2023 150.0
18 8.60% Goa SDL 2023 200.0
19 7.58% Goa SDL 2023 200.0
20 7.93% Goa SDL 2023 200.0
21 9.60% Goa SDL 2023 150.0
22 9.40% Goa SDL 2023 150.0
23 9.35% Goa SDL 2024 100.0
24 9.77% Goa SDL 2024 100.0
25 9.45% Goa SDL 2024 90.0
26 9.38% Goa SDL 2024 100.0
27 8.83% Goa SDL 2024 200.0
28 8.95% Goa SDL 2024 100.0
29 9.05% Goa SDL 2024 200.0
30 8.91% Goa SDL 2024 100.0
31 8.42% Goa SDL 2024 100.0
32 8.08% Goa SDL 2025 150.0
33 8.12% Goa SDL 2025 150.0
34 8.28% Goa SDL 2025 100.0
35 8.28% Goa SDL 2025 100.0
36 8.21% Goa SDL 2025 200.0
37 8.10% Goa SDL 2025 150.0
38 8.25% Goa SDL 2025 100.0
39 8.40% Goa SDL 2026 100.0
40 8.63% Goa SDL 2026 100.0
41 8.08% Goa SDL 2026 300.0
42 7.98% Goa SDL 2026 200.0
43 7.98% Goa SDL 2026 100.0
44 7.57% Goa SDL 2026 70.0
45 7.16% Goa SDL 2026 150.0
46 6.88% Goa SDL 2026 100.0
47 7.10% Goa SDL 2026 100.0
48 7.21% Goa SDL 2026 100.0
49 7.10% Goa SDL 2027 100.0
50 7.19% Goa SDL 2027 100.0
51 7.89% Goa SDL 2027 150.0
52 7.60% Goa SDL 2027 150.0
53 7.49% Goa SDL 2027 150.0
54 7.22% Goa SDL 2027 150.0
55 7.20% Goa SDL 2027 150.0
Statement 22: State Government Market Loans (Contd.)(` Crore)

State Finances : A Study of Budgets of 2019-20
138
Sr.No.
Particulars Balance as at end-March 2019
56 7.32% Goa SDL 2027 150.0
57 7.54% Goa SDL 2027 200.0
58 7.66% Goa SDL 2027 200.0
59 7.80% Goa SDL 2027 200.0
60 7.88% Goa SDL 2028 150.0
61 8.13% Goa SDL 2028 150.0
62 8.29% Goa SDL 2028 150.0
63 8.13% Goa SDL 2028 150.0
64 7.95% Goa SDL 2028 150.0
65 8.34% Goa SDL 2028 150.0
66 8.40% Goa SDL 2028 150.0
67 8.44% Goa SDL 2028 150.0
68 8.49% Goa SDL 2028 150.0
69 8.60% Goa SDL 2028 100.0
70 8.75% Goa SDL 2028 100.0
71 8.65% Goa SDL 2028 100.0
72 8.62% Goa SDL 2028 200.0
73 8.36% Goa SDL 2028 50.0
74 8.21% Goa SDL 2028 200.0
75 8.22% Goa SDL 2029 100.0
76 8.38% Goa SDL 2029 200.0
77 8.36% Goa SDL 2029 100.0
78 8.43% Goa SDL 2029 150.0
79 8.08% Goa SDL 2029 300.0
Total [A] 11,010.0
Loans not bearing interest
1 11.50% Goa SDL 2008 0.0
2 7.24% Goa GS 2019 -
3 8.08% Goa GS 2019 -
Total [B] 0.0
Total [A+B] 11,010.0
GUJARAT
Loans bearing interest
1 9.23% Gujarat GS 2022 1,500.0
2 9.13% Gujarat GS 2022 1,500.0
3 9.12% Gujarat GS 2022 1,500.0
4 8.88% Gujarat GS 2022 1,500.0
5 8.83% Gujarat GS 2022 1,200.0
6 8.91% Gujarat GS 2022 1,200.0
7 8.84% Gujarat GS 2022 1,000.0
8 8.79% Gujarat GS 2022 1,000.0
9 7.21% Gujarat SDL 2022 1,000.0
10 6.68% Gujarat SDL 2022 1,300.0
11 8.89% Gujarat SDL 2022 1,000.0
12 8.58% Gujarat SDL 2023 1,500.0
13 8.68% Gujarat SDL 2023 1,000.0
14 8.24% Gujarat SDL 2023 1,000.0
15 7.77% Gujarat SDL 2023 2,000.0
16 9.59% Gujarat SDL 2023 1,015.8
17 8.45% Gujarat SDL 2023 500.0
18 9.50% Gujarat SDL 2023 1,000.0
19 9.65% Gujarat SDL 2023 583.9
20 9.22% Gujarat SDL 2023 469.2
21 9.39% Gujarat SDL 2023 1,000.0
Sr.No.
Particulars Balance as at end-March 2019
22 9.37% Gujarat SDL 2023 3,000.0
23 9.37% Gujarat SDL 2024 1,560.0
24 9.53% Gujarat SDL 2024 1,223.8
25 9.75% Gujarat SDL 2024 1,200.0
26 9.01% Gujarat SDL 2024 3,000.0
27 8.94% Gujarat SDL 2024 1,000.0
28 8.84% Gujarat SDL 2024 1,000.0
29 8.42% Gujarat SDL 2024 1,000.0
30 8.43% Gujarat SDL 2024 1,000.0
31 8.25% Gujarat SDL 2024 1,000.0
32 8.14% Gujarat SDL 2025 1,500.0
33 8.05% Gujarat SDL 2025 1,300.0
34 8.07% Gujarat SDL 2025 1,560.0
35 8.05% Gujarat SDL 2025 1,560.0
36 8.07% Gujarat SDL 2025 1,000.0
37 8.05% Gujarat SDL 2025 1,560.0
38 8.20% Gujarat SDL 2025 1,200.0
39 8.29% Gujarat SDL 2025 1,000.0
40 8.23% Gujarat SDL 2025 1,300.0
41 8.15% Gujarat SDL 2025 1,000.0
42 7.96% Gujarat SDL 2025 1,300.0
43 8.12% Gujarat SDL 2025 1,300.0
44 8.15% Gujarat SDL 2025 1,000.0
45 8.20% Gujarat SDL 2025 1,300.0
46 8.27% Gujarat SDL 2026 2,000.0
47 8.46% Gujarat SDL 2026 1,300.0
48 8.00% Gujarat SDL 2026 1,820.0
49 7.96% Gujarat SDL 2026 1,000.0
50 7.98% Gujarat SDL 2026 1,300.0
51 7.98% Gujarat SDL 2026 1,300.0
52 8.05% Gujarat SDL 2026 1,000.0
53 7.83% Gujarat SDL 2026 1,300.0
54 7.69% Gujarat SDL 2026 1,000.0
55 7.60% Gujarat SDL 2026 1,300.0
56 7.56% Gujarat SDL 2026 1,300.0
57 7.05% Gujarat SDL 2026 1,300.0
58 7.24% Gujarat SDL 2026 1,300.0
59 7.14% Gujarat SDL 2027 1,300.0
60 7.19% Gujarat SDL 2027 1,300.0
61 7.59% Gujarat SDL 2027 1,300.0
62 7.71% Gujarat SDL 2027 1,300.0
63 7.63% Gujarat SDL 2027 1,300.0
64 7.52% Gujarat SDL 2027 1,300.0
65 7.20% Gujarat SDL 2027 1,300.0
66 7.25% Gujarat SDL 2027 1,300.0
67 7.17% Gujarat SDL 2027 1,300.0
68 7.21% Gujarat SDL 2027 1,300.0
69 7.25% Gujarat SDL 2027 1,300.0
70 7.62% Gujarat SDL 2027 1,300.0
71 7.64% Gujarat SDL 2027 1,000.0
72 7.75% Gujarat SDL 2027 1,000.0
73 7.69% Gujarat SDL 2027 1,300.0
74 7.80% Gujarat SDL 2027 1,000.0
75 7.75% Gujarat SDL 2028 1,300.0
Statement 22: State Government Market Loans (Contd.)(` Crore)
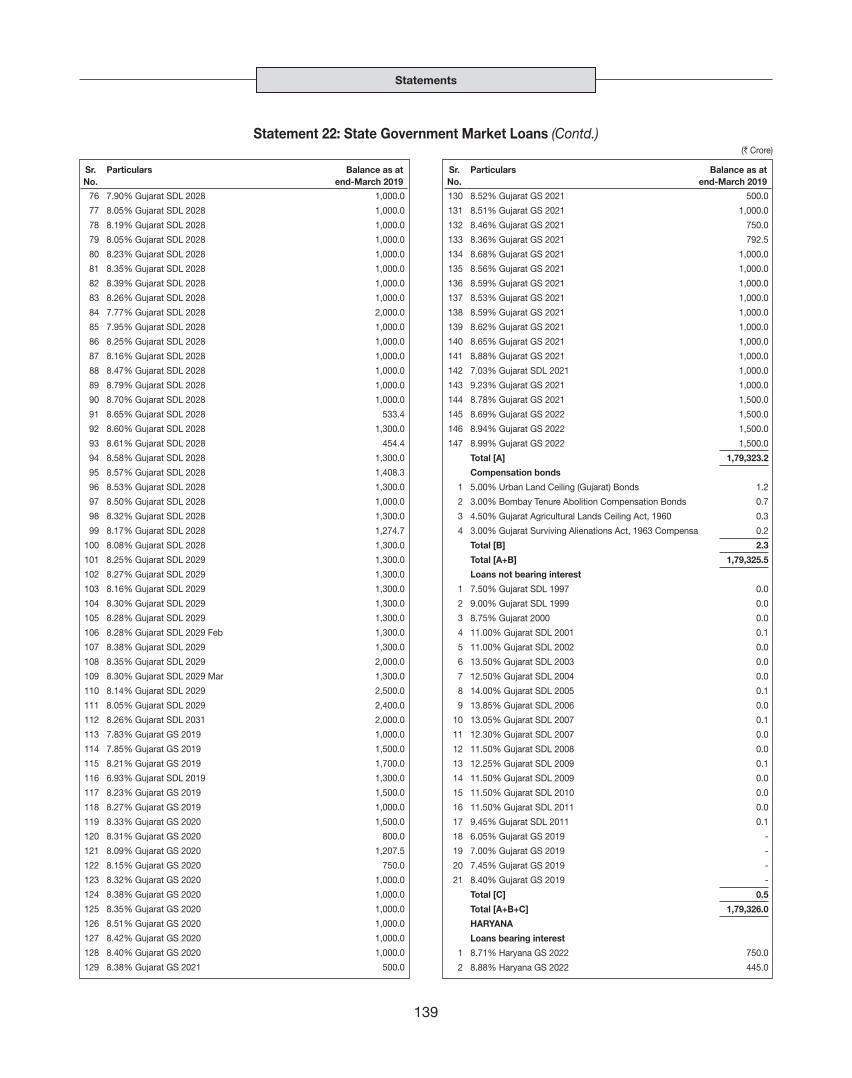
Statements
139
Sr.No.
Particulars Balance as at end-March 2019
76 7.90% Gujarat SDL 2028 1,000.0
77 8.05% Gujarat SDL 2028 1,000.0
78 8.19% Gujarat SDL 2028 1,000.0
79 8.05% Gujarat SDL 2028 1,000.0
80 8.23% Gujarat SDL 2028 1,000.0
81 8.35% Gujarat SDL 2028 1,000.0
82 8.39% Gujarat SDL 2028 1,000.0
83 8.26% Gujarat SDL 2028 1,000.0
84 7.77% Gujarat SDL 2028 2,000.0
85 7.95% Gujarat SDL 2028 1,000.0
86 8.25% Gujarat SDL 2028 1,000.0
87 8.16% Gujarat SDL 2028 1,000.0
88 8.47% Gujarat SDL 2028 1,000.0
89 8.79% Gujarat SDL 2028 1,000.0
90 8.70% Gujarat SDL 2028 1,000.0
91 8.65% Gujarat SDL 2028 533.4
92 8.60% Gujarat SDL 2028 1,300.0
93 8.61% Gujarat SDL 2028 454.4
94 8.58% Gujarat SDL 2028 1,300.0
95 8.57% Gujarat SDL 2028 1,408.3
96 8.53% Gujarat SDL 2028 1,300.0
97 8.50% Gujarat SDL 2028 1,000.0
98 8.32% Gujarat SDL 2028 1,300.0
99 8.17% Gujarat SDL 2028 1,274.7
100 8.08% Gujarat SDL 2028 1,300.0
101 8.25% Gujarat SDL 2029 1,300.0
102 8.27% Gujarat SDL 2029 1,300.0
103 8.16% Gujarat SDL 2029 1,300.0
104 8.30% Gujarat SDL 2029 1,300.0
105 8.28% Gujarat SDL 2029 1,300.0
106 8.28% Gujarat SDL 2029 Feb 1,300.0
107 8.38% Gujarat SDL 2029 1,300.0
108 8.35% Gujarat SDL 2029 2,000.0
109 8.30% Gujarat SDL 2029 Mar 1,300.0
110 8.14% Gujarat SDL 2029 2,500.0
111 8.05% Gujarat SDL 2029 2,400.0
112 8.26% Gujarat SDL 2031 2,000.0
113 7.83% Gujarat GS 2019 1,000.0
114 7.85% Gujarat GS 2019 1,500.0
115 8.21% Gujarat GS 2019 1,700.0
116 6.93% Gujarat SDL 2019 1,300.0
117 8.23% Gujarat GS 2019 1,500.0
118 8.27% Gujarat GS 2019 1,000.0
119 8.33% Gujarat GS 2020 1,500.0
120 8.31% Gujarat GS 2020 800.0
121 8.09% Gujarat GS 2020 1,207.5
122 8.15% Gujarat GS 2020 750.0
123 8.32% Gujarat GS 2020 1,000.0
124 8.38% Gujarat GS 2020 1,000.0
125 8.35% Gujarat GS 2020 1,000.0
126 8.51% Gujarat GS 2020 1,000.0
127 8.42% Gujarat GS 2020 1,000.0
128 8.40% Gujarat GS 2020 1,000.0
129 8.38% Gujarat GS 2021 500.0
Sr.No.
Particulars Balance as at end-March 2019
130 8.52% Gujarat GS 2021 500.0
131 8.51% Gujarat GS 2021 1,000.0
132 8.46% Gujarat GS 2021 750.0
133 8.36% Gujarat GS 2021 792.5
134 8.68% Gujarat GS 2021 1,000.0
135 8.56% Gujarat GS 2021 1,000.0
136 8.59% Gujarat GS 2021 1,000.0
137 8.53% Gujarat GS 2021 1,000.0
138 8.59% Gujarat GS 2021 1,000.0
139 8.62% Gujarat GS 2021 1,000.0
140 8.65% Gujarat GS 2021 1,000.0
141 8.88% Gujarat GS 2021 1,000.0
142 7.03% Gujarat SDL 2021 1,000.0
143 9.23% Gujarat GS 2021 1,000.0
144 8.78% Gujarat GS 2021 1,500.0
145 8.69% Gujarat GS 2022 1,500.0
146 8.94% Gujarat GS 2022 1,500.0
147 8.99% Gujarat GS 2022 1,500.0
Total [A] 1,79,323.2
Compensation bonds
1 5.00% Urban Land Ceiling (Gujarat) Bonds 1.2
2 3.00% Bombay Tenure Abolition Compensation Bonds 0.7
3 4.50% Gujarat Agricultural Lands Ceiling Act, 1960 0.3
4 3.00% Gujarat Surviving Alienations Act, 1963 Compensa 0.2
Total [B] 2.3
Total [A+B] 1,79,325.5
Loans not bearing interest
1 7.50% Gujarat SDL 1997 0.0
2 9.00% Gujarat SDL 1999 0.0
3 8.75% Gujarat 2000 0.0
4 11.00% Gujarat SDL 2001 0.1
5 11.00% Gujarat SDL 2002 0.0
6 13.50% Gujarat SDL 2003 0.0
7 12.50% Gujarat SDL 2004 0.0
8 14.00% Gujarat SDL 2005 0.1
9 13.85% Gujarat SDL 2006 0.0
10 13.05% Gujarat SDL 2007 0.1
11 12.30% Gujarat SDL 2007 0.0
12 11.50% Gujarat SDL 2008 0.0
13 12.25% Gujarat SDL 2009 0.1
14 11.50% Gujarat SDL 2009 0.0
15 11.50% Gujarat SDL 2010 0.0
16 11.50% Gujarat SDL 2011 0.0
17 9.45% Gujarat SDL 2011 0.1
18 6.05% Gujarat GS 2019 -
19 7.00% Gujarat GS 2019 -
20 7.45% Gujarat GS 2019 -
21 8.40% Gujarat GS 2019 -
Total [C] 0.5
Total [A+B+C] 1,79,326.0
HARYANA
Loans bearing interest
1 8.71% Haryana GS 2022 750.0
2 8.88% Haryana GS 2022 445.0
Statement 22: State Government Market Loans (Contd.)(` Crore)

State Finances : A Study of Budgets of 2019-20
140
Sr.No.
Particulars Balance as at end-March 2019
3 8.93% Haryana GS 2022 500.0
4 9.39% Haryana GS 2022 361.7
5 9.17% Haryana GS 2022 650.0
6 8.91% Haryana GS 2022 800.0
7 8.90% Haryana GS 2022 550.0
8 8.85% Haryana GS 2022 550.0
9 8.91% Haryana GS 2022 550.0
10 8.93% Haryana GS 2022 550.0
11 8.86% Haryana GS 2022 550.0
12 8.81% Haryana GS 2022 550.0
13 8.94% Haryana GS 2022 550.0
14 8.88% Haryana SDL 2022 550.0
15 8.64% Haryana SDL 2023 570.0
16 8.57% Haryana SDL 2023 570.0
17 8.66% Haryana SDL 2023 570.0
18 8.62% Haryana SDL 2023 770.0
19 8.60% Haryana SDL 2023 1,000.0
20 8.49% Haryana SDL 2023 663.0
21 7.59% Haryana SDL 2023 1,000.0
22 8.50% Haryana SDL 2023 307.0
23 9.05% Haryana SDL 2023 500.0
24 9.89% Haryana SDL 2023 1,000.0
25 9.72% Haryana SDL 2023 509.5
26 9.50% Haryana SDL 2023 477.0
27 9.81% Haryana SDL 2023 511.6
28 9.25% Haryana SDL 2023 470.0
29 9.25% Haryana SDL 2023 470.0
30 9.39% Haryana SDL 2023 800.0
31 9.48% Haryana SDL 2023 492.1
32 9.24% Haryana SDL 2024 1,056.0
33 9.51% Haryana SDL 2024 1,000.0
34 9.80% Haryana SDL 2024 1,000.0
35 9.71% Haryana SDL 2024 1,290.0
36 9.47% Haryana SDL 2024 400.0
37 9.07% Haryana SDL 2024 300.0
38 8.94% Haryana SDL 2024 700.0
39 9.00% Haryana SDL 2024 300.0
40 8.90% Haryana SDL 2024 1,000.0
41 8.72% Haryana SDL 2024 750.0
42 8.43% Haryana SDL 2024 500.0
43 8.27% Haryana SDL 2024 850.0
44 8.13% Haryana SDL 2025 600.0
45 8.08% Haryana SDL 2025 2,000.0
46 7.83% Haryana GS 2019 700.0
47 8.15% Haryana GS 2019 1,200.0
48 8.27% Haryana GS 2019 1,000.0
49 8.32% Haryana GS 2020 400.0
50 8.54% Haryana GS 2020 700.0
51 8.57% Haryana GS 2020 1,000.0
52 8.07% Haryana GS 2020 800.0
53 8.51% Haryana GS 2020 800.0
54 8.50% Haryana GS 2021 600.0
55 8.52% Haryana GS 2021 600.0
56 8.38% Haryana GS 2021 650.0
Sr.No.
Particulars Balance as at end-March 2019
57 8.36% Haryana GS 2021 1,800.0
58 8.65% Haryana GS 2021 1,000.0
59 8.59% Haryana GS 2021 500.0
60 9.03% Haryana GS 2021 500.0
61 9.22% Haryana GS 2021 500.0
62 8.07% Haryana SDL 2025 750.0
63 8.05% Haryana SDL 2025 1,000.0
64 8.09% Haryana SDL 2025 1,350.0
65 8.04% Haryana SDL 2025 1,500.0
66 8.27% Haryana SDL 2025 1,000.0
67 8.15% Haryana SDL 2025 900.0
68 8.22% Haryana SDL 2025 1,000.0
69 8.30% Haryana SDL 2025 900.0
70 8.29% Haryana SDL 2025 1,000.0
71 8.29% Haryana SDL 2025 1,000.0
72 8.23% Haryana SDL 2025 1,000.0
73 8.16% Haryana SDL 2025 1,000.0
74 8.15% Haryana SDL 2025 800.0
75 8.27% Haryana SDL 2025 800.0
76 8.27% Haryana SDL 2025 1,100.0
77 8.38% Haryana SDL 2026 1,100.0
78 8.51% Haryana SDL 2026 2,500.0
79 7.98% Haryana SDL 2026 1,000.0
80 7.57% Haryana SDL 2026 1,000.0
81 7.35% Haryana SDL 2026 500.0
82 7.18% Haryana SDL 2026 1,200.0
83 7.14% Haryana SDL 2026 500.0
84 7.22% Haryana SDL 2026 1,500.0
85 7.39% Haryana SDL 2026 1,500.0
86 6.86% Haryana SDL 2026 2,000.0
87 7.28% Haryana SDL 2026 1,500.0
88 7.59% Haryana SDL 2027 1,000.0
89 7.80% Haryana SDL 2027 1,000.0
90 7.89% Haryana SDL 2027 1,000.0
91 7.64% Haryana SDL 2027 2,100.0
92 7.53% Haryana SDL 2027 1,500.0
93 7.26% Haryana SDL 2027 1,500.0
94 7.29% Haryana SDL 2027 1,500.0
95 7.32% Haryana SDL 2027 500.0
96 7.41% Haryana SDL 2027 1,200.0
97 7.57% Haryana SDL 2027 500.0
98 7.64% Haryana SDL 2027 750.0
99 7.70% Haryana SDL 2027 1,000.0
100 7.68% Haryana SDL 2027 1,000.0
101 7.86% Haryana SDL 2027 1,500.0
102 8.20% Haryana SDL 2028 794.0
103 8.20% Haryana SDL 2028 800.0
104 8.25% Haryana SDL 2028 500.0
105 8.45% Haryana SDL 2028 950.0
106 8.29% Haryana SDL 2028 720.0
107 8.14% Haryana SDL 2028 1,925.5
108 7.80% Haryana SDL 2028 525.0
109 8.57% Haryana SDL 2028 3,500.0
110 8.41% Haryana SDL 2028 2,000.0
Statement 22: State Government Market Loans (Contd.)(` Crore)

Statements
141
Sr.No.
Particulars Balance as at end-March 2019
111 8.62% Haryana SDL 2028 1,500.0
112 8.44% Haryana SDL 2034 2,000.0
113 8.12% Haryana SDL 2036 740.0
114 8.60% Haryana SDL 2038 1,500.0
115 8.58% Haryana SDL 2038 3,000.0
116 8.25% Haryana SDL 2039 1,500.0
117 8.43% Haryana SDL 2039 2,000.0
118 8.42% Haryana SDL 2039 2,500.0
Total [A] 1,14,987.3
Special bonds
1 8.21% Haryana UDAY Bond 2022 3,460.0
2 8.06% Haryana UDAY Bond 2026 155.0
3 8.14% Haryana UDAY Bond 2022 60.0
4 8.06% Haryana UDAY Bond 2022 155.0
5 8.21% Haryana UDAY Bond 2023 3,460.0
6 8.18% Haryana UDAY Bond 2023 1,515.0
7 8.14% Haryana UDAY Bond 2023 60.0
8 8.06% Haryana UDAY Bond 2023 155.0
9 8.21% Haryana UDAY Bond 2024 3,460.0
10 8.18% Haryana UDAY Bond 2024 1,515.0
11 8.14% Haryana UDAY Bond 2024 60.0
12 8.06% Haryana UDAY Bond 2024 155.0
13 8.21% Haryana UDAY Bond 2025 3,460.0
14 8.18% Haryana UDAY Bond 2025 1,515.0
15 8.14% Haryana UDAY Bond 2025 60.0
16 8.06% Haryana UDAY Bond 2025 155.0
17 8.21% Haryana UDAY Bond 2026 3,460.0
18 8.18% Haryana UDAY Bond 2026 1,515.0
19 8.14% Haryana UDAY Bond 2026 60.0
20 8.18% Haryana UDAY Bond 2022 1,515.0
Total [B] 25,950.0
Total [A+B] 1,40,937.3
Loans not bearing interest
1 7.50% Haryana SDL 1997 0.0
2 9.75% Haryana SDL 1998 0.0
3 14.00% Haryana SDL 2005 0.0
4 12.30% Haryana SDL 2007 0.0
5 7.27% Haryana GS 2019 -
6 7.80% Haryana GS 2019 -
Total [C] 0.0
Total [A+B+C] 1,40,937.4
HIMACHAL PRADESH
Loans bearing interest
1 8.26% Himachal Pradesh GS 2019 900.0
2 7.49% Himachal Pradesh 2032 700.0
3 8.25% Himachal Pradesh GS 2020 200.0
4 8.52% Himachal Pradesh GS 2020 300.0
5 8.38% Himachal Pradesh GS 2020 620.0
6 8.18% Himachal Pradesh SDL 2020 800.0
7 8.14% Himachal Pradesh SDL 2021 300.0
8 8.52% Himachal Pradesh GS 2021 180.0
9 7.78% Himachal Pradesh SDL 2021 500.0
10 8.42% Himachal Pradesh GS 2021 465.0
11 8.85% Himachal Pradesh GS 2021 100.0
Sr.No.
Particulars Balance as at end-March 2019
12 9.20% Himachal Pradesh GS 2021 205.0
13 8.83% Himachal Pradesh GS 2021 200.0
14 8.60% Himachal Pradesh GS 2022 250.0
15 8.73% Himachal Pradesh GS 2022 360.0
16 7.52% Himachal Pradesh SDL 2022 300.0
17 8.94% Himachal Pradesh GS 2022 410.0
18 7.79% Himachal Pradesh SDL 2022 300.0
19 8.87% Himachal Pradesh GS 2022 430.0
20 8.91% Himachal Pradesh GS 2022 430.0
21 8.92% Himachal Pradesh GS 2022 300.0
22 8.91% Himachal Pradesh GS 2022 200.0
23 7.55% Himachal Pradesh SDL 2023 210.0
24 8.24% Himachal Pradesh SDL 2023 250.0
25 7.62% Himachal Pradesh SDL 2023 600.0
26 9.39% Himachal Pradesh SDL 2023 102.1
27 9.75% Himachal Pradesh SDL 2023 175.0
28 9.32% Himachal Pradesh SDL 2023 300.0
29 9.38% Himachal Pradesh SDL 2024 200.0
30 9.50% Himachal Pradesh SDL 2024 300.0
31 9.63% Himachal Pradesh SDL 2024 550.0
32 9.23% Himachal Pradesh SDL 2024 200.0
33 8.98% Himachal Pradesh SDL 2024 200.0
34 8.96% Himachal Pradesh SDL 2024 150.0
35 9.00% Himachal Pradesh SDL 2024 150.0
36 8.87% Himachal Pradesh SDL 2024 400.0
37 8.45% Himachal Pradesh SDL 2024 200.0
38 8.26% Himachal Pradesh SDL 2024 100.0
39 8.13% Himachal Pradesh SDL 2025 300.0
40 8.08% Himachal Pradesh SDL 2025 95.0
41 8.07% Himachal Pradesh SDL 2025 650.0
42 8.25% Himachal Pradesh SDL 2025 500.0
43 8.16% Himachal Pradesh SDL 2025 200.0
44 7.95% Himachal Pradesh SDL 2025 500.0
45 8.17% Himachal Pradesh SDL 2025 300.0
46 7.17% Himachal Pradesh SDL 2026 700.0
47 7.39% Himachal Pradesh SDL 2026 300.0
48 7.25% Himachal Pradesh SDL 2027 1,000.0
49 7.91% Himachal Pradesh SDL 2027 700.0
50 7.62% Himachal Pradesh SDL 2027 700.0
51 7.54% Himachal Pradesh SDL 2027 500.0
52 7.27% Himachal Pradesh SDL 2027 500.0
53 7.30% Himachal Pradesh SDL 2027 800.0
54 7.53% Himachal Pradesh SDL 2027 300.0
55 7.68% Himachal Pradesh SDL 2027 500.0
56 7.88% Himachal Pradesh SDL 2028 500.0
57 8.77% Himachal Pradesh SDL 2028 500.0
58 8.56% Himachal Pradesh SDL 2028 500.0
59 8.30% Himachal Pradesh SDL 2029 500.0
60 8.43% Himachal Pradesh SDL 2029 500.0
61 8.22% Himachal Pradesh GS 2020 100.0
Total [A] 23,682.1
Special bonds
1 7.77% Himachal Pradesh UDAY Bond 2027 50.0
2 7.81% Himachal Pradesh UDAY Bond 2027 10.0
Statement 22: State Government Market Loans (Contd.)(` Crore)

State Finances : A Study of Budgets of 2019-20
142
Sr.No.
Particulars Balance as at end-March 2019
3 8.18% Himachal Pradesh UDAY Bond 2028 10.0
4 8.12% Himachal Pradesh UDAY Bond 2028 10.0
5 8.19% Himachal Pradesh UDAY Bond 2028 129.1
6 8.14% Himachal Pradesh UDAY Bond 2028 50.0
7 7.99% Himachal Pradesh UDAY Bond 2029 90.0
8 7.94% Himachal Pradesh UDAY Bond 2029 10.0
9 8.00% Himachal Pradesh UDAY Bond 2029 10.0
10 8.01% Himachal Pradesh UDAY Bond 2029 129.1
11 7.96% Himachal Pradesh UDAY Bond 2029 50.0
12 7.87% Himachal Pradesh UDAY Bond 2030 10.0
13 7.89% Himachal Pradesh UDAY Bond 2030 50.0
14 7.93% Himachal Pradesh UDAY Bond 2030 10.0
15 7.94% Himachal Pradesh UDAY Bond 2030 129.1
16 7.92% Himachal Pradesh UDAY Bond 2030 90.0
17 7.99% Himachal Pradesh UDAY Bond 2031 10.0
18 8.05% Himachal Pradesh UDAY Bond 2031 10.0
19 8.06% Himachal Pradesh UDAY Bond 2031 129.1
20 8.04% Himachal Pradesh UDAY Bond 2031 90.0
21 8.01% Himachal Pradesh UDAY Bond 2031 50.0
22 7.92% Himachal Pradesh UDAY Bond 2032 10.0
23 7.94% Himachal Pradesh UDAY Bond 2032 50.0
24 7.97% Himachal Pradesh UDAY Bond 2032 90.0
25 7.99% Himachal Pradesh UDAY Bond 2032 129.1
26 7.98% Himachal Pradesh UDAY Bond 2032 10.0
27 7.56% Himachal Pradesh UDAY Bond 2023 129.1
28 7.49% Himachal Pradesh UDAY Bond 2023 10.0
29 7.55% Himachal Pradesh UDAY Bond 2023 10.0
30 7.54% Himachal Pradesh UDAY Bond 2023 90.0
31 7.51% Himachal Pradesh UDAY Bond 2023 50.0
32 7.77% Himachal Pradesh UDAY Bond 2024 90.0
33 7.78% Himachal Pradesh UDAY Bond 2024 10.0
34 7.79% Himachal Pradesh UDAY Bond 2024 129.1
35 7.72% Himachal Pradesh UDAY Bond 2024 10.0
36 7.74% Himachal Pradesh UDAY Bond 2024 50.0
37 7.87% Himachal Pradesh UDAY Bond 2025 10.0
38 7.89% Himachal Pradesh UDAY Bond 2025 50.0
39 7.94% Himachal Pradesh UDAY Bond 2025 129.1
40 7.92% Himachal Pradesh UDAY Bond 2025 90.0
41 7.93% Himachal Pradesh UDAY Bond 2025 10.0
42 7.68% Himachal Pradesh UDAY Bond 2026 129.1
43 7.61% Himachal Pradesh UDAY Bond 2026 10.0
44 7.67% Himachal Pradesh UDAY Bond 2026 10.0
45 7.66% Himachal Pradesh UDAY Bond 2026 90.0
46 7.63% Himachal Pradesh UDAY Bond 2026 50.0
47 7.82% Himachal Pradesh UDAY Bond 2027 129.1
48 7.80% Himachal Pradesh UDAY Bond 2027 90.0
49 7.75% Himachal Pradesh UDAY Bond 2027 10.0
50 8.17% Himachal Pradesh UDAY Bond 2028 90.0
Total [B] 2,890.5
Total [A+B] 26,572.6
Loans not bearing interest
1 11.00% Himachal Pradesh SDL 2001 0.0
2 14.00% Himachal Pradesh SDL 2005 0.0
3 10.35% Himachal Pradesh SDL 2011 0.0
Sr.No.
Particulars Balance as at end-March 2019
4 12.00% Himachal Pradesh SDL 2011 0.0
5 6.10% Himachal Pradesh GS 2019 -
6 7.09% Himachal Pradesh GS 2019 -
7 7.24% Himachal Pradesh GS 2019 -
8 7.40% Himachal Pradesh GS 2019 -
9 8.40% Himachal Pradesh GS 2019 -
10 8.43% Himachal Pradesh GS 2019 -
Total [C] 0.1
Total [A+B+C] 26,572.7
JAMMU AND KASHMIR
Loans bearing interest
1 7.30% Jammu and Kashmir GS 2019 538.9
2 8.58% Jammu and Kashmir GS 2020 543.0
3 8.40% Jammu and Kashmir GS 2020 27.0
4 8.42% Jammu and Kashmir GS 2020 500.0
5 8.26% Jammu and Kashmir GS 2020 500.0
6 8.42% Jammu and Kashmir GS 2020 500.0
7 8.42% Jammu and Kashmir GS 2021 479.1
8 8.55% Jammu and Kashmir GS 2021 750.0
9 8.48% Jammu and Kashmir GS 2021 550.0
10 8.40% Jammu and Kashmir GS 2021 29.4
11 8.61% Jammu and Kashmir GS 2021 700.0
12 9.33% Jammu and Kashmir GS 2021 175.0
13 9.06% Jammu and Kashmir GS 2021 500.0
14 8.83% Jammu and Kashmir GS 2021 200.0
15 9.01% Jammu and Kashmir GS 2022 200.0
16 9.49% Jammu and Kashmir GS 2022 1,200.0
17 8.89% Jammu and Kashmir GS 2022 500.0
18 9.00% Jammu and Kashmir SDL 2022 600.0
19 8.66% Jammu and Kashmir SDL 2023 500.0
20 8.74% Jammu and Kashmir SDL 2023 550.0
21 8.27% Jammu and Kashmir SDL 2023 200.0
22 7.60% Jammu and Kashmir SDL 2023 200.0
23 7.83% Jammu and Kashmir SDL 2023 300.0
24 8.80% Jammu and Kashmir SDL 2023 500.0
25 9.38% Jammu and Kashmir SDL 2023 300.0
26 9.25% Jammu and Kashmir SDL 2024 400.0
27 9.46% Jammu and Kashmir SDL 2024 180.0
28 9.40% Jammu and Kashmir SDL 2024 300.0
29 9.18% Jammu and Kashmir SDL 2024 150.0
30 8.99% Jammu and Kashmir SDL 2024 150.0
31 8.96% Jammu and Kashmir SDL 2024 300.0
32 8.89% Jammu and Kashmir SDL 2024 300.0
33 8.06% Jammu and Kashmir SDL 2025 200.0
34 8.18% Jammu and Kashmir SDL 2025 500.0
35 8.30% Jammu and Kashmir SDL 2025 500.0
36 8.28% Jammu and Kashmir SDL 2025 450.0
37 8.17% Jammu and Kashmir SDL 2025 300.0
38 8.26% Jammu and Kashmir SDL 2025 150.0
39 8.63% Jammu and Kashmir SDL 2026 350.0
40 8.05% Jammu and Kashmir SDL 2026 500.0
41 7.69% Jammu and Kashmir SDL 2026 300.0
42 7.57% Jammu and Kashmir SDL 2026 400.0
43 7.18% Jammu and Kashmir SDL 2026 300.0
44 6.97% Jammu and Kashmir SDL 2026 345.0
Statement 22: State Government Market Loans (Contd.)(` Crore)

Statements
143
Sr.No.
Particulars Balance as at end-March 2019
45 7.10% Jammu and Kashmir SDL 2026 55.0
46 7.58% Jammu and Kashmir SDL 2027 500.0
47 8.05% Jammu and Kashmir SDL 2027 390.0
48 7.59% Jammu and Kashmir SDL 2027 600.0
49 7.50% Jammu and Kashmir SDL 2027 300.0
50 7.20% Jammu and Kashmir SDL 2027 300.0
51 7.34% Jammu and Kashmir SDL 2027 600.0
52 7.27% Jammu and Kashmir SDL 2027 600.0
53 7.44% Jammu and Kashmir SDL 2027 300.0
54 7.42% Jammu and Kashmir SDL 2027 300.0
55 7.56% Jammu and Kashmir SDL 2027 400.0
56 7.75% Jammu and Kashmir SDL 2027 500.0
57 8.00% Jammu and Kashmir SDL 2028 800.0
58 8.10% Jammu and Kashmir SDL 2028 500.0
59 8.34% Jammu and Kashmir SDL 2028 600.0
60 8.33% Jammu and Kashmir SDL 2028 400.0
61 8.26% Jammu and Kashmir SDL 2028 600.0
62 8.34% Jammu and Kashmir SDL 2028 600.0
63 8.61% Jammu and Kashmir SDL 2028 500.0
64 8.59% Jammu and Kashmir SDL 2028 700.0
65 8.52% Jammu and Kashmir SDL 2028 300.0
66 8.75% Jammu and Kashmir SDL 2028 300.0
67 8.86% Jammu and Kashmir SDL 2028 324.6
68 8.59% Jammu and Kashmir SDL 2028 475.4
69 8.56% Jammu and Kashmir SDL 2028 400.0
70 8.20% Jammu and Kashmir SDL 2029 800.0
71 8.38% Jammu and Kashmir SDL 2029 800.0
72 8.37% Jammu and Kashmir SDL 2029 584.0
73 8.44% Jammu and Kashmir SDL 2029 300.0
Total [A] 30,946.4
Special bonds
1 8.53% Jammu and Kashmir UDAY Bond 2022 214.0
2 7.49% Jammu and Kashmir UDAY Bond 2031 139.8
3 8.45% Jammu and Kashmir UDAY Bond 2023 214.0
4 7.18% Jammu and Kashmir UDAY Bond 2023 139.8
5 8.50% Jammu and Kashmir UDAY Bond 2024 214.0
6 7.28% Jammu and Kashmir UDAY Bond 2024 139.8
7 8.50% Jammu and Kashmir UDAY Bond 2025 214.0
8 7.23% Jammu and Kashmir UDAY Bond 2025 139.8
9 8.22% Jammu and Kashmir UDAY Bond 2026 214.0
10 7.14% Jammu and Kashmir UDAY Bond 2026 139.8
11 8.45% Jammu and Kashmir UDAY Bond 2027 214.0
12 7.44% Jammu and Kashmir UDAY Bond 2027 139.8
13 8.65% Jammu and Kashmir UDAY Bond 2028 214.0
14 7.44% Jammu and Kashmir UDAY Bond 2028 139.8
15 8.48% Jammu and Kashmir UDAY Bond 2029 214.0
16 7.29% Jammu and Kashmir UDAY Bond 2029 139.8
17 8.62% Jammu and Kashmir UDAY Bond 2030 214.0
18 7.40% Jammu and Kashmir UDAY Bond 2030 139.8
19 8.72% Jammu and Kashmir UDAY Bond 2031 214.0
20 7.07% Jammu and Kashmir UDAY Bond 2022 139.8
Total [B] 3,537.6
Total [A+B] 34,484.0
Sr.No.
Particulars Balance as at end-March 2019
Loans not bearing interest
1 9.00% Jammu and Kashmir SDL 1999 0.2
2 11.00% Jammu and Kashmir SDL 2002 0.0
3 14.00% Jammu and Kashmir SDL 2005 0.0
4 7.98% Jammu and Kashmir GS 2019 -
5 8.47% Jammu and Kashmir GS 2019 -
6 8.34% Jammu and Kashmir GS 2019 -
Total [C] 0.2
Total [A+B+C] 34,484.2
JHARKHAND
Loans bearing interest
1 7.54% Jharkhand GS 2019 517.5
2 8.08% Jharkhand SDL 2033 500.0
3 8.37% Jharkhand GS 2019 599.9
4 8.19% Jharkhand GS 2019 252.2
5 8.28% Jharkhand GS 2020 500.0
6 8.52% Jharkhand GS 2021 500.0
7 9.05% Jharkhand GS 2021 500.0
8 9.32% Jharkhand GS 2022 254.1
9 8.90% Jharkhand GS 2022 200.0
10 8.93% Jharkhand GS 2022 300.0
11 8.81% Jharkhand GS 2022 500.0
12 9.00% Jharkhand SDL 2022 500.0
13 8.66% Jharkhand SDL 2023 1,000.0
14 8.64% Jharkhand SDL 2023 800.0
15 8.62% Jharkhand SDL 2023 300.0
16 8.55% Jharkhand SDL 2023 300.0
17 9.15% Jharkhand SDL 2023 300.0
18 9.75% Jharkhand SDL 2023 200.0
19 9.36% Jharkhand SDL 2024 500.0
20 9.69% Jharkhand SDL 2024 450.0
21 9.67% Jharkhand SDL 2024 700.0
22 9.69% Jharkhand SDL 2024 500.0
23 8.27% Jharkhand SDL 2024 750.0
24 8.16% Jharkhand SDL 2025 1,500.0
25 8.08% Jharkhand SDL 2025 1,200.0
26 8.10% Jharkhand SDL 2025 1,000.0
27 8.05% Jharkhand SDL 2025 500.0
28 8.30% Jharkhand SDL 2025 1,000.0
29 7.98% Jharkhand SDL 2025 500.0
30 8.17% Jharkhand SDL 2025 500.0
31 8.17% Jharkhand SDL 2025 500.0
32 8.25% Jharkhand SDL 2025 500.0
33 8.42% Jharkhand SDL 2026 500.0
34 8.82% Jharkhand SDL 2026 1,850.0
35 7.25% Jharkhand SDL 2026 1,000.0
36 7.40% Jharkhand SDL 2026 500.0
37 6.90% Jharkhand SDL 2026 1,000.0
38 7.21% Jharkhand SDL 2027 1,000.0
39 7.80% Jharkhand SDL 2027 657.5
40 7.94% Jharkhand SDL 2027 893.0
41 7.59% Jharkhand SDL 2027 103.5
42 7.27% Jharkhand SDL 2027 1,000.0
43 8.51% Jharkhand SDL 2028 500.0
Statement 22: State Government Market Loans (Contd.)(` Crore)

State Finances : A Study of Budgets of 2019-20
144
Sr.No.
Particulars Balance as at end-March 2019
44 8.84% Jharkhand SDL 2028 500.0
45 8.40% Jharkhand SDL 2028 500.0
46 8.35% Jharkhand SDL 2028 500.0
47 8.36% Jharkhand SDL 2029 1,000.0
48 8.31% Jharkhand SDL 2029 1,000.0
49 8.44% Jharkhand SDL 2029 500.0
50 8.43% Jharkhand SDL 2029 1,009.0
51 7.43% Jharkhand SDL 2032 509.7
52 7.49% Jharkhand SDL 2032 1,000.0
53 7.62% Jharkhand SDL 2032 1,000.0
54 7.67% Jharkhand SDL 2032 500.0
55 7.68% Jharkhand SDL 2032 500.0
56 7.79% Jharkhand SDL 2032 490.0
57 7.90% Jharkhand SDL 2033 500.0
58 8.01% Jharkhand GS 2019 474.4
Total [A] 37,110.7
Special bonds
1 8.53% Jharkhand UDAY Bond 2022 555.3
2 8.45% Jharkhand UDAY Bond 2023 555.3
3 8.50% Jharkhand UDAY Bond 2024 555.3
4 8.50% Jharkhand UDAY Bond 2025 555.3
5 8.72% Jharkhand UDAY Bond 2031 555.3
6 8.45% Jharkhand UDAY Bond 2027 555.3
7 8.65% Jharkhand UDAY Bond 2028 555.3
8 8.48% Jharkhand UDAY Bond 2029 555.3
9 8.62% Jharkhand UDAY Bond 2030 555.3
10 8.22% Jharkhand UDAY Bond 2026 555.3
Total [B] 5,553.4
Total [A+B] 42,664.1
Compensation bonds
1 2.50% Bihar Zamindari Abolition Compensation Bonds 6.4
Total [C] 6.4
Total [A+B+C] 42,670.4
Loans not bearing interest
1 6.10% Jharkhand GS 2019 -
2 7.44% Jharkhand GS 2019 -
3 8.75% Jharkhand GS 2019 -
4 8.47% Jharkhand GS 2019 -
Total [D] -
Total [A+B+C+D] 42,670.4
KARNATAKA
Loans bearing interest
1 7.15% Karnataka SDL 2027 2,000.0
2 7.20% Karnataka SDL 2027 1,500.0
3 7.59% Karnataka SDL 2027 2,000.0
4 7.75% Karnataka SDL 2027 2,686.0
5 7.86% Karnataka SDL 2027 2,686.0
6 7.59% Karnataka SDL 2027 2,135.0
7 7.38% Karnataka SDL 2027 1,500.0
8 7.51% Karnataka SDL 2027 1,000.0
9 7.55% Karnataka SDL 2027 1,000.0
10 7.62% Karnataka SDL 2027 1,500.0
11 7.64% Karnataka SDL 2027 1,000.0
12 7.70% Karnataka SDL 2027 1,000.0
Sr.No.
Particulars Balance as at end-March 2019
13 7.54% Karnataka SDL 2027 1,500.0
14 7.65% Karnataka SDL 2027 2,000.0
15 7.65% Karnataka SDL 2027 1,500.0
16 7.76% Karnataka SDL 2027 1,500.0
17 7.69% Karnataka SDL 2027 2,000.0
18 7.82% Karnataka SDL 2027 1,598.0
19 7.79% Karnataka SDL 2028 2,000.0
20 8.00% Karnataka SDL 2028 1,000.0
21 8.03% Karnataka SDL 2028 2,000.0
22 8.52% Karnataka SDL 2028 2,000.0
23 8.08% Karnataka SDL 2028 3,000.0
24 8.28% Karnataka SDL 2029 2,000.0
25 8.17% Karnataka SDL 2029 1,000.0
26 8.19% Karnataka SDL 2029 2,000.0
27 8.32% Karnataka SDL 2029 2,000.0
28 8.30% Karnataka SDL 2029 1,500.0
29 8.34% Karnataka SDL 2029 1,000.0
30 8.32% Karnataka SDL 2029 Mar 2,000.0
31 8.16% Karnataka SDL 2029 1,500.0
32 8.06% Karnataka SDL 2029 1,500.0
33 8.22% Karnataka SDL 2031 2,000.0
34 8.73% Karnataka SDL 2033 2,000.0
35 7.76% Karnataka GS 2019 1,000.0
36 7.95% Karnataka GS 2019 1,000.0
37 8.25% Karnataka GS 2019 750.0
38 8.05% Karnataka GS 2019 2,000.0
39 8.52% Karnataka GS 2020 1,250.0
40 8.13% Karnataka SDL 2020 2,000.0
41 8.42% Karnataka GS 2020 1,000.0
42 7.88% Karnataka SDL 2020 1,600.0
43 8.43% Karnataka GS 2020 1,000.0
44 7.48% Karnataka SDL 2020 1,500.0
45 9.19% Karnataka GS 2021 1,500.0
46 8.69% Karnataka GS 2022 1,250.0
47 8.65% Karnataka GS 2022 1,250.0
48 8.69% Karnataka GS 2022 1,500.0
49 8.74% Karnataka GS 2022 500.0
50 8.92% Karnataka GS 2022 1,500.0
51 8.48% Karnataka SDL 2022 2,000.0
52 8.38% Karnataka SDL 2022 1,500.0
53 8.31% Karnataka SDL 2022 2,000.0
54 7.97% Karnataka SDL 2022 1,500.0
55 8.90% Karnataka SDL 2022 1,000.0
56 8.62% Karnataka SDL 2023 1,000.0
57 8.65% Karnataka SDL 2023 1,000.0
58 9.39% Karnataka SDL 2023 1,102.3
59 9.65% Karnataka SDL 2023 1,000.0
60 9.54% Karnataka SDL 2023 1,500.0
61 9.39% Karnataka SDL 2023 2,000.0
62 9.39% Karnataka SDL 2023 3,000.0
63 9.50% Karnataka SDL 2023 1,200.0
64 9.25% Karnataka SDL 2024 2,000.0
65 9.41% Karnataka SDL 2024 2,000.0
66 9.55% Karnataka SDL 2024 1,195.0
Statement 22: State Government Market Loans (Contd.)(` Crore)

Statements
145
Sr.No.
Particulars Balance as at end-March 2019
67 9.14% Karnataka SDL 2024 1,500.0
68 9.01% Karnataka SDL 2024 1,000.0
69 8.97% Karnataka SDL 2024 2,000.0
70 9.04% Karnataka SDL 2024 2,000.0
71 8.73% Karnataka SDL 2024 2,000.0
72 8.45% Karnataka SDL 2024 2,500.0
73 8.24% Karnataka SDL 2024 2,500.0
74 8.06% Karnataka SDL 2025 1,000.0
75 8.06% Karnataka SDL 2025 1,500.0
76 8.05% Karnataka SDL 2025 1,500.0
77 8.08% Karnataka SDL 2025 1,000.0
78 7.98% Karnataka SDL 2025 2,000.0
79 7.99% Karnataka SDL 2025 1,000.0
80 8.59% Karnataka SDL 2025 2,000.0
81 8.14% Karnataka SDL 2025 2,000.0
82 8.16% Karnataka SDL 2025 2,000.0
83 8.22% Karnataka SDL 2025 2,187.5
84 8.27% Karnataka SDL 2025 2,000.0
85 8.27% Karnataka SDL 2026 1,500.0
86 8.38% Karnataka SDL 2026 1,500.0
87 8.67% Karnataka SDL 2026 2,000.0
88 8.28% Karnataka SDL 2026 2,000.0
89 7.14% Karnataka SDL 2026 2,000.0
90 7.22% Karnataka SDL 2026 2,000.0
91 7.37% Karnataka SDL 2026 2,000.0
92 6.83% Karnataka SDL 2026 2,000.0
93 7.08% Karnataka SDL 2026 3,500.0
94 7.27% Karnataka SDL 2026 3,500.0
Total [A] 1,57,889.8
Compensation bonds
1 3.00% Bombay Land Tenure Abolition Acts.(Mysore) Compe 0.3
2 2.75% Mysore Inams Abolition Compensation Bonds. 0.0
3 5.00% Urban Land Ceiling Karnataka Bonds, 1976 0.1
Total [B] 0.4
Total [A+B] 1,57,890.2
Loans not bearing interest
1 7.50% Karnataka SDL 1997 0.0
2 9.75% Karnataka SDL 1998 -
3 9.00% Karnataka SDL 1999 0.0
4 11.00% Karnataka SDL 2001 0.0
5 11.00% Karnataka SDL 2002 0.0
6 14.00% Karnataka SDL 2005 0.0
7 13.05% Karnataka SDL 2007 0.0
8 11.50% Karnataka SDL 2008 0.0
9 12.50% Karnataka SDL 2008 0.0
10 11.50% Karnataka SDL 2010 0.0
11 6.70% Karnataka GS 2019 -
12 7.76% Karnataka GS 2019 -
13 8.49% Karnataka GS 2019 -
Total [C] 0.1
Total [A+B+C] 1,57,890.3
KERALA
Loans bearing interest
1 7.83% Kerala GS 2019 600.0
Sr.No.
Particulars Balance as at end-March 2019
2 8.13% Kerala GS 2019 1,350.0
3 8.12% Kerala GS 2019 850.0
4 8.05% Kerala GS 2019 676.0
5 8.35% Kerala GS 2019 500.0
6 8.56% Kerala GS 2020 1,480.0
7 8.43% Kerala GS 2020 1,000.0
8 8.34% Kerala GS 2020 1,500.0
9 8.50% Kerala GS 2021 1,000.0
10 8.51% Kerala GS 2021 1,000.0
11 8.36% Kerala GS 2021 1,000.0
12 8.60% Kerala GS 2021 1,000.0
13 8.62% Kerala GS 2021 1,000.0
14 8.85% Kerala GS 2021 500.0
15 9.06% Kerala GS 2021 500.0
16 9.03% Kerala GS 2021 800.0
17 8.80% Kerala GS 2021 1,200.0
18 8.70% Kerala GS 2022 1,380.0
19 8.69% Kerala GS 2022 500.0
20 8.75% Kerala GS 2022 900.0
21 8.97% Kerala GS 2022 450.0
22 9.25% Kerala GS 2022 650.0
23 9.14% Kerala GS 2022 1,000.0
24 9.15% Kerala GS 2022 1,000.0
25 8.85% Kerala GS 2022 1,000.0
26 8.92% Kerala GS 2022 2,000.0
27 8.80% Kerala GS 2022 1,000.0
28 8.93% Kerala GS 2022 1,000.0
29 8.93% Kerala SDL 2022 850.0
30 8.65% Kerala SDL 2023 1,000.0
31 8.60% Kerala SDL 2023 1,500.0
32 8.63% Kerala SDL 2023 1,233.0
33 8.25% Kerala SDL 2023 1,000.0
34 8.10% Kerala SDL 2023 500.0
35 7.58% Kerala SDL 2023 500.0
36 7.77% Kerala SDL 2023 1,000.0
37 7.98% Kerala SDL 2023 500.0
38 9.49% Kerala SDL 2023 1,600.0
39 9.72% Kerala SDL 2023 1,100.0
40 9.25% Kerala SDL 2023 750.0
41 9.28% Kerala SDL 2023 500.0
42 9.32% Kerala SDL 2023 500.0
43 9.37% Kerala SDL 2023 750.0
44 9.35% Kerala SDL 2023 500.0
45 9.48% Kerala SDL 2023 500.0
46 9.41% Kerala SDL 2024 1,000.0
47 9.48% Kerala SDL 2024 500.0
48 9.75% Kerala SDL 2024 1,000.0
49 9.46% Kerala SDL 2024 600.0
50 9.64% Kerala SDL 2024 1,000.0
51 9.37% Kerala SDL 2024 1,000.0
52 9.19% Kerala SDL 2024 1,200.0
53 8.99% Kerala SDL 2024 500.0
54 8.97% Kerala SDL 2024 1,000.0
Statement 22: State Government Market Loans (Contd.)(` Crore)

State Finances : A Study of Budgets of 2019-20
146
Sr.No.
Particulars Balance as at end-March 2019
55 9.03% Kerala SDL 2024 700.0
56 9.07% Kerala SDL 2024 1,000.0
57 9.00% Kerala SDL 2024 500.0
58 8.86% Kerala SDL 2024 1,000.0
59 8.72% Kerala SDL 2024 500.0
60 8.44% Kerala SDL 2024 1,000.0
61 8.24% Kerala SDL 2024 300.0
62 8.14% Kerala SDL 2025 1,500.0
63 8.06% Kerala SDL 2025 1,000.0
64 8.09% Kerala SDL 2025 1,000.0
65 8.07% Kerala SDL 2025 1,500.0
66 8.05% Kerala SDL 2025 500.0
67 8.24% Kerala SDL 2025 1,000.0
68 8.24% Kerala SDL 2025 400.0
69 8.18% Kerala SDL 2025 300.0
70 8.29% Kerala SDL 2025 1,500.0
71 8.27% Kerala SDL 2025 2,000.0
72 8.31% Kerala SDL 2025 500.0
73 7.99% Kerala SDL 2025 1,500.0
74 8.16% Kerala SDL 2025 500.0
75 8.17% Kerala SDL 2025 750.0
76 8.18% Kerala SDL 2025 500.0
77 8.24% Kerala SDL 2025 550.0
78 8.42% Kerala SDL 2026 750.0
79 8.49% Kerala SDL 2026 750.0
80 8.69% Kerala SDL 2026 1,000.0
81 8.53% Kerala SDL 2026 500.0
82 8.08% Kerala SDL 2026 500.0
83 7.98% Kerala SDL 2026 500.0
84 7.96% Kerala SDL 2026 500.0
85 7.98% Kerala SDL 2026 1,800.0
86 8.07% Kerala SDL 2026 1,000.0
87 7.98% Kerala SDL 2026 500.0
88 7.69% Kerala SDL 2026 500.0
89 7.61% Kerala SDL 2026 1,500.0
90 7.59% Kerala SDL 2026 2,300.0
91 7.15% Kerala SDL 2026 750.0
92 7.38% Kerala SDL 2026 1,000.0
93 6.85% Kerala SDL 2026 1,500.0
94 7.29% Kerala SDL 2026 1,050.0
95 7.15% Kerala SDL 2027 1,500.0
96 7.77% Kerala SDL 2027 1,500.0
97 7.80% Kerala SDL 2027 1,400.0
98 7.64% Kerala SDL 2027 2,000.0
99 7.55% Kerala SDL 2027 1,000.0
100 7.20% Kerala SDL 2027 500.0
101 7.22% Kerala SDL 2027 500.0
102 7.25% Kerala SDL 2027 500.0
103 7.19% Kerala SDL 2027 1,000.0
104 7.75% Kerala SDL 2028 1,000.0
105 8.20% Kerala SDL 2028 1,500.0
106 8.27% Kerala SDL 2028 1,000.0
Sr.No.
Particulars Balance as at end-March 2019
107 8.37% Kerala SDL 2028 1,000.0
108 8.13% Kerala SDL 2028 1,000.0
109 8.00% Kerala SDL 2028 3,500.0
110 8.33% Kerala SDL 2028 1,000.0
111 8.41% Kerala SDL 2028 1,000.0
112 8.44% Kerala SDL 2028 1,000.0
113 8.41% Kerala SDL 2028 Aug 1,000.0
114 8.50% Kerala SDL 2028 500.0
115 8.54% Kerala SDL 2028 1,500.0
116 8.38% Kerala SDL 2028 800.0
117 8.19% Kerala SDL 2028 1,000.0
118 8.35% Kerala SDL 2029 1,000.0
119 8.31% Kerala SDL 2029 700.0
120 8.35% Kerala SDL 2029 Mar 500.0
121 8.32% Kerala SDL 2030 1,000.0
122 8.48% Kerala SDL 2030 2,500.0
123 7.48% Kerala SDL 2032 4,500.0
124 7.83% Kerala SDL 2033 1,000.0
125 8.54% Kerala SDL 2033 1,500.0
126 8.40% Kerala SDL 2034 1,000.0
127 7.24% Kerala SDL 2037 4,000.0
Total [A] 1,29,719.0
Compensation bonds
1 4.50% Kerala Land Reforms Bonds 0.8
2 4.00% Jenmikaram Jenmikaram Payment (Abolition) Bonds 0.0
3 4.25% Kerala House Sites Bonds 0.0
4 4.50% Kerala House Sites Bonds 0.0
Total [B] 0.9
Total [A+B] 1,29,719.9
Loans not bearing interest
1 13.50% Kerala SDL 2003 0.0
2 12.50% Kerala SDL 2004 0.0
3 14.00% Kerala SDL 2005 0.0
4 12.30% Kerala SDL 2007 0.0
5 11.50% Kerala SDL 2008 0.0
6 6.10% Kerala GS 2019 -
7 7.45% Kerala GS 2019 -
8 8.45% Kerala GS 2019 -
9 8.27% Kerala GS 2019 -
Total [C] 0.0
Total [A+B+C] 1,29,719.9
MADHYA PRADESH
Loans bearing interest
1 8.31% Madhya Pradesh GS 2019 1,560.0
2 8.32% Madhya Pradesh GS 2019 1,560.0
3 8.32% Madhya Pradesh GS 2020 1,553.0
4 8.54% Madhya Pradesh GS 2020 1,148.0
5 8.44% Madhya Pradesh GS 2020 2,000.0
6 8.39% Madhya Pradesh GS 2021 1,000.0
7 8.48% Madhya Pradesh GS 2021 700.0
8 8.36% Madhya Pradesh GS 2021 2,500.0
Statement 22: State Government Market Loans (Contd.)(` Crore)

Statements
147
Sr.No.
Particulars Balance as at end-March 2019
9 7.13% Madhya Pradesh SDL 2021 600.0
10 9.05% Madhya Pradesh GS 2021 2,000.0
11 8.73% Madhya Pradesh GS 2022 2,500.0
12 8.99% Madhya Pradesh GS 2022 1,500.0
13 7.18% Madhya Pradesh SDL 2022 600.0
14 8.92% Madhya Pradesh GS 2022 2,000.0
15 8.60% Madhya Pradesh SDL 2023 1,000.0
16 8.64% Madhya Pradesh SDL 2023 2,000.0
17 8.63% Madhya Pradesh SDL 2023 1,500.0
18 9.53% Madhya Pradesh SDL 2023 1,000.0
19 9.68% Madhya Pradesh SDL 2023 1,500.0
20 9.29% Madhya Pradesh SDL 2023 1,000.0
21 9.30% Madhya Pradesh SDL 2023 500.0
22 9.29% Madhya Pradesh SDL 2024 1,000.0
23 9.40% Madhya Pradesh SDL 2024 1,000.0
24 9.11% Madhya Pradesh 2024 1,000.0
25 8.98% Madhya Pradesh SDL 2024 350.0
26 8.99% Madhya Pradesh SDL 2024 1,200.0
27 8.95% Madhya Pradesh SDL 2024 1,000.0
28 8.95% Madhya Pradesh SDL 2024 1,050.0
29 8.84% Madhya Pradesh SDL 2024 1,000.0
30 8.45% Madhya Pradesh SDL 2024 750.0
31 8.24% Madhya Pradesh SDL 2024 750.0
32 8.10% Madhya Pradesh SDL 2025 1,000.0
33 8.08% Madhya Pradesh SDL 2025 1,000.0
34 8.09% Madhya Pradesh SDL 2025 1,200.0
35 8.25% Madhya Pradesh SDL 2025 1,000.0
36 8.36% Madhya Pradesh SDL 2025 1,500.0
37 8.27% Madhya Pradesh SDL 2025 1,500.0
38 8.25% Madhya Pradesh SDL 2025 1,000.0
39 8.16% Madhya Pradesh SDL 2025 1,000.0
40 8.15% Madhya Pradesh SDL 2025 3,500.0
41 8.27% Madhya Pradesh SDL 2025 1,500.0
42 8.30% Madhya Pradesh SDL 2026 1,500.0
43 8.39% Madhya Pradesh SDL 2026 1,000.0
44 8.76% Madhya Pradesh SDL 2026 1,200.0
45 7.62% Madhya Pradesh SDL 2026 1,500.0
46 7.57% Madhya Pradesh SDL 2026 1,000.0
47 7.38% Madhya Pradesh SDL 2026 1,500.0
48 7.16% Madhya Pradesh SDL 2026 1,000.0
49 7.15% Madhya Pradesh SDL 2026 2,000.0
50 7.23% Madhya Pradesh SDL 2026 2,000.0
51 7.40% Madhya Pradesh SDL 2026 1,500.0
52 7.19% Madhya Pradesh SDL 2027 1,000.0
53 7.60% Madhya Pradesh SDL 2027 2,600.0
54 7.76% Madhya Pradesh SDL 2027 2,000.0
55 7.22% Madhya Pradesh SDL 2027 2,000.0
56 7.28% Madhya Pradesh SDL 2027 1,000.0
57 7.35% Madhya Pradesh SDL 2027 2,000.0
58 7.46% Madhya Pradesh 2027 2,000.0
59 7.55% Madhya Pradesh SDL 2027 2,000.0
Sr.No.
Particulars Balance as at end-March 2019
60 7.65% Madhya Pradesh SDL 2027 2,000.0
61 7.88% Madhya Pradesh SDL 2028 2,000.0
62 8.05% Madhya Pradesh SDL 2028 2,000.0
63 8.05% Madhya Pradesh SDL 2028 2,000.0
64 8.33% Madhya Pradesh SDL 2028 1,000.0
65 8.55% Madhya Pradesh SDL 2028 1,000.0
66 8.42% Madhya Pradesh SDL 2028 1,000.0
67 8.37% Madhya Pradesh SDL 2028 2,800.0
68 8.64% Madhya Pradesh SDL 2033 1,371.0
69 8.63% Madhya Pradesh SDL 2038 825.0
70 8.52% Madhya Pradesh SDL 2043 1,000.0
Total [A] 98,817.0
Special bonds
1 7.68% Madhya Pradesh UDAY Bond 2023 736.0
2 7.92% Madhya Pradesh UDAY Bond 2024 736.0
3 8.03% Madhya Pradesh UDAY Bond 2025 736.0
4 7.69% Madhya Pradesh UDAY Bond 2026 736.0
5 7.93% Madhya Pradesh UDAY Bond 2032 736.0
6 8.25% Madhya Pradesh UDAY Bond 2028 736.0
7 8.05% Madhya Pradesh UDAY Bond 2029 736.0
8 8.02% Madhya Pradesh UDAY Bond 2030 736.0
9 8.06% Madhya Pradesh UDAY Bond 2031 736.0
10 7.91% Madhya Pradesh UDAY Bond 2027 736.0
Total [B] 7,360.0
Total [A+B] 1,06,177.0
Compensation bonds
1 5.00% Urban Land ceiling (Madhya Pradesh) Bonds 0.4
Total [C] 0.4
Total [A+B+C] 1,06,177.4
Loans not bearing interest
1 7.00% Madhya Pradesh SDL 1993 -
2 7.50% Madhya Pradesh SDL 1997 0.0
3 9.75% Madhya Pradesh SDL 1998 0.0
4 9.00% Madhya Pradesh SDL 1999 0.0
5 8.75% Madhya Pradesh SDL 2000 0.0
6 11.00% Madhya Pradesh SDL 2001 0.0
7 13.50% Madhya Pradesh SDL 2003 0.0
8 14.00% Madhya Pradesh SDL 2005 0.0
9 13.00% Madhya Pradesh SDL 2007 0.0
10 11.50% Madhya Pradesh SDL 2009 0.0
11 11.00% Madhya Pradesh SDL 2010 0.0
12 12.00% Madhya Pradesh SDL 2011 0.1
13 6.00% Madhya Pradesh GS 2019 -
14 7.00% Madhya Pradesh GS 2019 -
15 7.77% Madhya Pradesh GS 2019 -
16 8.40% Madhya Pradesh GS 2019 -
Total 0.2
Loans not bearing interest (prior to reorganisation)
1 7.00% Madhya Pradesh SDL 1993 -
2 7.50% Madhya Pradesh SDL 1997 0.0
3 9.75% Madhya Pradesh SDL 1998 0.0
4 9.00% Madhya Pradesh SDL 1999 0.0
Statement 22: State Government Market Loans (Contd.)(` Crore)
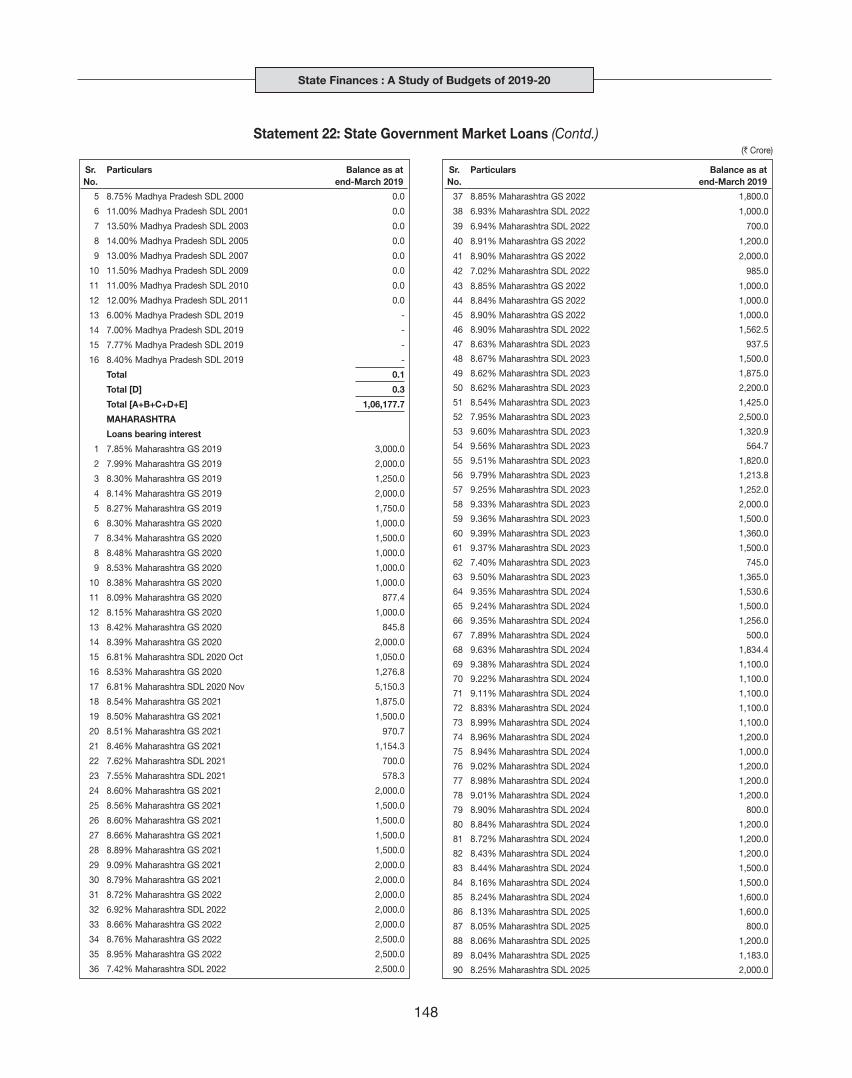
State Finances : A Study of Budgets of 2019-20
148
Sr.No.
Particulars Balance as at end-March 2019
5 8.75% Madhya Pradesh SDL 2000 0.0
6 11.00% Madhya Pradesh SDL 2001 0.0
7 13.50% Madhya Pradesh SDL 2003 0.0
8 14.00% Madhya Pradesh SDL 2005 0.0
9 13.00% Madhya Pradesh SDL 2007 0.0
10 11.50% Madhya Pradesh SDL 2009 0.0
11 11.00% Madhya Pradesh SDL 2010 0.0
12 12.00% Madhya Pradesh SDL 2011 0.0
13 6.00% Madhya Pradesh SDL 2019 -
14 7.00% Madhya Pradesh SDL 2019 -
15 7.77% Madhya Pradesh SDL 2019 -
16 8.40% Madhya Pradesh SDL 2019 -
Total 0.1
Total [D] 0.3
Total [A+B+C+D+E] 1,06,177.7
MAHARASHTRA
Loans bearing interest
1 7.85% Maharashtra GS 2019 3,000.0
2 7.99% Maharashtra GS 2019 2,000.0
3 8.30% Maharashtra GS 2019 1,250.0
4 8.14% Maharashtra GS 2019 2,000.0
5 8.27% Maharashtra GS 2019 1,750.0
6 8.30% Maharashtra GS 2020 1,000.0
7 8.34% Maharashtra GS 2020 1,500.0
8 8.48% Maharashtra GS 2020 1,000.0
9 8.53% Maharashtra GS 2020 1,000.0
10 8.38% Maharashtra GS 2020 1,000.0
11 8.09% Maharashtra GS 2020 877.4
12 8.15% Maharashtra GS 2020 1,000.0
13 8.42% Maharashtra GS 2020 845.8
14 8.39% Maharashtra GS 2020 2,000.0
15 6.81% Maharashtra SDL 2020 Oct 1,050.0
16 8.53% Maharashtra GS 2020 1,276.8
17 6.81% Maharashtra SDL 2020 Nov 5,150.3
18 8.54% Maharashtra GS 2021 1,875.0
19 8.50% Maharashtra GS 2021 1,500.0
20 8.51% Maharashtra GS 2021 970.7
21 8.46% Maharashtra GS 2021 1,154.3
22 7.62% Maharashtra SDL 2021 700.0
23 7.55% Maharashtra SDL 2021 578.3
24 8.60% Maharashtra GS 2021 2,000.0
25 8.56% Maharashtra GS 2021 1,500.0
26 8.60% Maharashtra GS 2021 1,500.0
27 8.66% Maharashtra GS 2021 1,500.0
28 8.89% Maharashtra GS 2021 1,500.0
29 9.09% Maharashtra GS 2021 2,000.0
30 8.79% Maharashtra GS 2021 2,000.0
31 8.72% Maharashtra GS 2022 2,000.0
32 6.92% Maharashtra SDL 2022 2,000.0
33 8.66% Maharashtra GS 2022 2,000.0
34 8.76% Maharashtra GS 2022 2,500.0
35 8.95% Maharashtra GS 2022 2,500.0
36 7.42% Maharashtra SDL 2022 2,500.0
Sr.No.
Particulars Balance as at end-March 2019
37 8.85% Maharashtra GS 2022 1,800.0
38 6.93% Maharashtra SDL 2022 1,000.0
39 6.94% Maharashtra SDL 2022 700.0
40 8.91% Maharashtra GS 2022 1,200.0
41 8.90% Maharashtra GS 2022 2,000.0
42 7.02% Maharashtra SDL 2022 985.0
43 8.85% Maharashtra GS 2022 1,000.0
44 8.84% Maharashtra GS 2022 1,000.0
45 8.90% Maharashtra GS 2022 1,000.0
46 8.90% Maharashtra SDL 2022 1,562.5
47 8.63% Maharashtra SDL 2023 937.5
48 8.67% Maharashtra SDL 2023 1,500.0
49 8.62% Maharashtra SDL 2023 1,875.0
50 8.62% Maharashtra SDL 2023 2,200.0
51 8.54% Maharashtra SDL 2023 1,425.0
52 7.95% Maharashtra SDL 2023 2,500.0
53 9.60% Maharashtra SDL 2023 1,320.9
54 9.56% Maharashtra SDL 2023 564.7
55 9.51% Maharashtra SDL 2023 1,820.0
56 9.79% Maharashtra SDL 2023 1,213.8
57 9.25% Maharashtra SDL 2023 1,252.0
58 9.33% Maharashtra SDL 2023 2,000.0
59 9.36% Maharashtra SDL 2023 1,500.0
60 9.39% Maharashtra SDL 2023 1,360.0
61 9.37% Maharashtra SDL 2023 1,500.0
62 7.40% Maharashtra SDL 2023 745.0
63 9.50% Maharashtra SDL 2023 1,365.0
64 9.35% Maharashtra SDL 2024 1,530.6
65 9.24% Maharashtra SDL 2024 1,500.0
66 9.35% Maharashtra SDL 2024 1,256.0
67 7.89% Maharashtra SDL 2024 500.0
68 9.63% Maharashtra SDL 2024 1,834.4
69 9.38% Maharashtra SDL 2024 1,100.0
70 9.22% Maharashtra SDL 2024 1,100.0
71 9.11% Maharashtra SDL 2024 1,100.0
72 8.83% Maharashtra SDL 2024 1,100.0
73 8.99% Maharashtra SDL 2024 1,100.0
74 8.96% Maharashtra SDL 2024 1,200.0
75 8.94% Maharashtra SDL 2024 1,000.0
76 9.02% Maharashtra SDL 2024 1,200.0
77 8.98% Maharashtra SDL 2024 1,200.0
78 9.01% Maharashtra SDL 2024 1,200.0
79 8.90% Maharashtra SDL 2024 800.0
80 8.84% Maharashtra SDL 2024 1,200.0
81 8.72% Maharashtra SDL 2024 1,200.0
82 8.43% Maharashtra SDL 2024 1,200.0
83 8.44% Maharashtra SDL 2024 1,500.0
84 8.16% Maharashtra SDL 2024 1,500.0
85 8.24% Maharashtra SDL 2024 1,600.0
86 8.13% Maharashtra SDL 2025 1,600.0
87 8.05% Maharashtra SDL 2025 800.0
88 8.06% Maharashtra SDL 2025 1,200.0
89 8.04% Maharashtra SDL 2025 1,183.0
90 8.25% Maharashtra SDL 2025 2,000.0
Statement 22: State Government Market Loans (Contd.)(` Crore)

Statements
149
Sr.No.
Particulars Balance as at end-March 2019
91 8.14% Maharashtra SDL 2025 1,500.0
92 8.25% Maharashtra SDL 2025 1,500.0
93 8.32% Maharashtra SDL 2025 1,500.0
94 8.28% Maharashtra SDL 2025 1,500.0
95 8.26% Maharashtra SDL 2025 1,500.0
96 8.29% Maharashtra SDL 2025 1,500.0
97 8.23% Maharashtra SDL 2025 1,500.0
98 8.16% Maharashtra SDL 2025 1,500.0
99 7.96% Maharashtra SDL 2025 1,500.0
100 7.99% Maharashtra SDL 2025 1,500.0
101 8.12% Maharashtra SDL 2025 2,000.0
102 8.15% Maharashtra SDL 2025 2,000.0
103 8.21% Maharashtra SDL 2025 2,000.0
104 8.26% Maharashtra SDL 2025 2,000.0
105 8.25% Maharashtra SDL 2026 1,000.0
106 8.36% Maharashtra SDL 2026 1,500.0
107 8.47% Maharashtra SDL 2026 1,500.0
108 8.67% Maharashtra SDL 2026 1,500.0
109 8.51% Maharashtra SDL 2026 2,000.0
110 8.08% Maharashtra SDL 2026 2,500.0
111 7.96% Maharashtra SDL 2026 2,500.0
112 7.84% Maharashtra SDL 2026 2,500.0
113 7.69% Maharashtra SDL 2026 2,500.0
114 7.58% Maharashtra SDL 2026 2,500.0
115 7.37% Maharashtra SDL 2026 2,500.0
116 7.16% Maharashtra SDL 2026 2,500.0
117 7.15% Maharashtra SDL 2026 2,500.0
118 7.22% Maharashtra SDL 2026 3,000.0
119 7.39% Maharashtra SDL 2026 5,000.0
120 6.82% Maharashtra SDL 2026 2,000.0
121 7.25% Maharashtra SDL 2026 2,500.0
122 7.51% Maharashtra SDL 2027 2,000.0
123 7.20% Maharashtra SDL 2027 9,998.0
124 7.33% Maharashtra SDL 2027 3,800.0
125 8.56% Maharashtra SDL 2028 1,001.4
126 8.42% Maharashtra SDL 2028 2,000.0
127 8.08% Maharashtra SDL 2028 7,500.0
128 8.26% Maharashtra SDL 2029 2,500.0
129 7.18% Maharashtra SDL 2029 14,161.0
130 7.18% Maharashtra SDL 2032 3,000.0
131 7.25% Maharashtra SDL 2032 2,500.0
132 7.18% Maharashtra SDL 2032 Jun 9,000.0
Total [A] 2,51,469.2
Special bonds
1 7.38% Maharashtra UDAY Bond 2022 2,959.8
2 7.33% Maharashtra UDAY Bond 2022 2,000.0
Total [B] 4,959.8
Total [A+B] 2,56,429.0
Compensation bonds
1 5.00% Urban Land Ceiling (Maharashtra) Bonds 0.4
2 3.00% Maharashtra Revenue Patels (Abolition of Office) 0.0
3 3.00% Bombay Land Tenure Abolition Acts(Bombay) Compe 0.1
4 3.00% Hyderabad (Abolition of cash grants) Act, 1952 C 0.0
5 4.00% Bombay City (Inami & Special Tenure) Abolition 0.0
Sr.No.
Particulars Balance as at end-March 2019
6 3.00% Bombay Land Tenure Abolition Acts (Maharashtra) 0.0
7 3.00% Maharashtra Agricultural Lands (Ceiling of Hold 1.8
8 3.00% Maharashtra Agricultural Lands (Ceiling of Hold 0.2
9 3.00% The Saranjams of Feduatory Jahagirdars of Kolha 0.0
Total [C] 2.5
Total [A+B+C] 2,56,431.5
Loans not bearing interest
1 9.75% Maharashtra SDL 1998 -
2 9.00% Maharashtra SDL 1999 0.1
3 8.75% Maharashtra SDL 2000 0.1
4 11.00% Maharashtra SDL 2001 0.0
5 11.00% Maharashtra SDL 2002 0.0
6 13.50% Maharashtra SDL 2003 0.0
7 12.50% Maharashtra SDL 2004 0.0
8 14.00% Maharashtra SDL 2005 0.0
9 13.85% Maharashtra SDL 2006 0.0
10 13.75% Maharashtra SDL 2007 0.1
11 13.05% Maharashtra SDL 2007 0.0
12 13.00% Maharashtra SDL 2007 0.0
13 12.15% Maharashtra SDL 2008 0.2
14 11.50% Maharashtra SDL 2008 0.1
15 12.50% Maharashtra SDL 2008 0.0
16 11.50% Maharashtra SDL 2009 0.0
17 11.50% Maharashtra SDL 2010 0.0
18 12.00% Maharashtra SDL 2010 0.0
19 11.50% Maharashtra SDL 2011 0.0
20 12.00% Maharashtra SDL 2011 0.0
21 6.73% Maharashtra GS 2019 -
22 7.50% Maharashtra GS 2019 -
23 7.83% Maharashtra GS 2019 -
24 8.46% Maharashtra GS 2019 -
25 8.30% Maharashtra GS 2019 -
Total [D] 0.8
Total [A+B+C+D] 2,56,432.3
MANIPUR
Loans bearing interest
1 8.18% Manipur GS 2019 188.8
2 8.09% Manipur SDL 2029 120.0
3 8.55% Manipur GS 2021 150.0
4 8.47% Manipur GS 2021 31.1
5 8.40% Manipur GS 2021 77.0
6 8.65% Manipur GS 2021 100.0
7 9.04% Manipur GS 2021 50.0
8 8.80% Manipur GS 2022 75.0
9 8.85% Manipur GS 2022 60.0
10 8.95% Manipur GS 2022 90.0
11 8.92% Manipur GS 2022 50.0
12 9.75% Manipur SDL 2023 100.0
13 9.50% Manipur SDL 2023 100.0
14 9.46% Manipur SDL 2024 150.0
15 8.85% Manipur SDL 2024 60.0
16 8.91% Manipur SDL 2024 200.0
17 8.09% Manipur SDL 2025 100.0
Statement 22: State Government Market Loans (Contd.)(` Crore)

State Finances : A Study of Budgets of 2019-20
150
Sr.No.
Particulars Balance as at end-March 2019
18 8.06% Manipur SDL 2025 103.0
19 8.07% Manipur SDL 2025 200.0
20 8.29% Manipur SDL 2025 75.0
21 8.32% Manipur SDL 2025 75.0
22 8.10% Manipur SDL 2025 75.0
23 8.25% Manipur SDL 2025 75.0
24 8.63% Manipur SDL 2026 100.0
25 7.96% Manipur SDL 2026 50.0
26 7.69% Manipur SDL 2026 100.0
27 7.57% Manipur SDL 2026 100.0
28 7.48% Manipur SDL 2026 50.0
29 7.09% Manipur SDL 2026 100.0
30 7.22% Manipur SDL 2026 60.0
31 7.35% Manipur SDL 2026 90.0
32 7.57% Manipur SDL 2027 80.0
33 7.15% Manipur SDL 2027 300.0
34 8.02% Manipur SDL 2028 150.0
35 8.02% Manipur SDL 2028 75.0
36 7.80% Manipur SDL 2028 350.0
37 8.62% Manipur SDL 2028 50.0
38 8.09% Manipur SDL 2028 100.0
39 8.38% Manipur SDL 2029 200.0
40 8.43% Manipur SDL 2029 150.0
41 8.49% Manipur GS 2020 314.0
Total [A] 4,723.9
Loans not bearing interest
1 7.09% Manipur GS 2019 -
Total [B] -
Total [A+B] 4,723.9
MEGHALAYA
Loans bearing interest
1 7.80% Meghalaya GS 2019 50.0
2 8.09% Meghalaya SDL 2029 122.0
3 8.24% Meghalaya GS 2019 123.5
4 8.27% Meghalaya GS 2020 50.0
5 8.39% Meghalaya GS 2020 50.0
6 8.43% Meghalaya GS 2020 100.0
7 8.37% Meghalaya GS 2020 40.0
8 8.65% Meghalaya GS 2021 100.0
9 9.04% Meghalaya GS 2021 60.0
10 9.22% Meghalaya GS 2021 50.0
11 8.58% Meghalaya GS 2022 50.0
12 8.60% Meghalaya GS 2022 50.0
13 8.92% Meghalaya GS 2022 50.0
14 8.95% Meghalaya GS 2022 50.0
15 8.94% Meghalaya SDL 2022 100.0
16 8.94% Meghalaya GS 2022 50.0
17 8.58% Meghalaya SDL 2023 80.0
18 8.54% Meghalaya SDL 2023 55.0
19 8.50% Meghalaya SDL 2023 100.0
20 9.75% Meghalaya SDL 2023 60.0
21 9.35% Meghalaya SDL 2023 100.0
22 9.47% Meghalaya SDL 2024 80.0
23 9.00% Meghalaya SDL 2024 80.0
Sr.No.
Particulars Balance as at end-March 2019
24 9.02% Meghalaya SDL 2024 80.0
25 8.19% Meghalaya SDL 2024 100.0
26 8.14% Meghalaya SDL 2025 100.0
27 8.08% Meghalaya SDL 2025 75.0
28 8.06% Meghalaya SDL 2025 50.0
29 8.09% Meghalaya SDL 2025 60.0
30 8.07% Meghalaya SDL 2025 100.0
31 8.22% Meghalaya SDL 2025 70.0
32 8.31% Meghalaya SDL 2025 50.0
33 8.28% Meghalaya SDL 2025 100.0
34 7.96% Meghalaya SDL 2025 60.0
35 8.10% Meghalaya SDL 2025 100.0
36 8.19% Meghalaya SDL 2025 50.0
37 8.19% Meghalaya SDL 2026 80.0
38 8.63% Meghalaya SDL 2026 70.0
39 7.98% Meghalaya SDL 2026 60.0
40 8.00% Meghalaya SDL 2026 100.0
41 7.69% Meghalaya SDL 2026 50.0
42 7.43% Meghalaya SDL 2026 100.0
43 7.18% Meghalaya SDL 2026 150.0
44 7.10% Meghalaya SDL 2026 180.0
45 7.57% Meghalaya SDL 2027 100.0
46 7.83% Meghalaya SDL 2027 114.0
47 7.60% Meghalaya SDL 2027 147.0
48 7.26% Meghalaya SDL 2027 125.0
49 7.31% Meghalaya SDL 2027 120.0
50 7.43% Meghalaya SDL 2027 125.0
51 7.53% Meghalaya SDL 2027 125.0
52 7.69% Meghalaya SDL 2027 245.0
53 8.28% Meghalaya SDL 2028 100.0
54 8.14% Meghalaya SDL 2028 125.0
55 8.10% Meghalaya SDL 2028 150.5
56 8.74% Meghalaya SDL 2028 150.0
57 8.55% Meghalaya SDL 2028 250.0
58 8.40% Meghalaya SDL 2028 150.0
59 8.09% Meghalaya SDL 2028 100.0
60 8.43% Meghalaya SDL 2029 100.0
61 8.42% Meghalaya SDL 2029 250.0
62 8.24% Meghalaya GS 2019 50.0
Total [A] 5,962.0
Special bonds
1 7.45% Meghalaya UDAY Bond 2023 12.5
2 7.64% Meghalaya UDAY Bond 2024 12.5
3 7.77% Meghalaya UDAY Bond 2025 12.5
4 7.43% Meghalaya UDAY Bond 2026 12.5
5 7.67% Meghalaya UDAY Bond 2032 12.5
6 8.04% Meghalaya UDAY Bond 2028 12.5
7 7.83% Meghalaya UDAY Bond 2029 12.5
8 7.77% Meghalaya UDAY Bond 2030 12.5
9 7.78% Meghalaya UDAY Bond 2031 12.5
10 7.72% Meghalaya UDAY Bond 2027 12.5
Total [B] 125.0
Total [A+B] 6,087.0
Loans not bearing interest
1 7.59% Meghalaya GS 2019 -
Statement 22: State Government Market Loans (Contd.)(` Crore)

Statements
151
Sr.No.
Particulars Balance as at end-March 2019
2 8.16% Meghalaya GS 2019 -
3 8.47% Meghalaya GS 2019 -
Total [C] -
Total [A+B+C] 6,087.0
MIZORAM
Loans bearing interest
1 8.24% Mizoram GS 2019 101.3
2 8.14% Mizoram SDL 2028 150.0
3 8.52% Mizoram GS 2020 100.0
4 8.55% Mizoram GS 2021 40.0
5 8.47% Mizoram GS 2021 50.0
6 8.40% Mizoram GS 2021 76.7
7 8.45% Mizoram GS 2021 150.0
8 8.61% Mizoram GS 2021 100.0
9 8.93% Mizoram GS 2022 50.0
10 9.16% Mizoram GS 2022 65.0
11 8.95% Mizoram GS 2022 50.0
12 8.55% Mizoram SDL 2023 70.8
13 8.50% Mizoram SDL 2023 80.0
14 7.76% Mizoram SDL 2023 50.0
15 7.93% Mizoram SDL 2023 20.0
16 9.52% Mizoram SDL 2023 60.0
17 9.72% Mizoram SDL 2024 50.0
18 9.41% Mizoram SDL 2024 20.0
19 9.25% Mizoram SDL 2024 20.0
20 8.85% Mizoram SDL 2024 20.0
21 8.89% Mizoram SDL 2024 50.0
22 8.46% Mizoram SDL 2024 20.0
23 8.27% Mizoram SDL 2024 100.0
24 8.23% Mizoram SDL 2025 75.0
25 8.16% Mizoram SDL 2025 60.0
26 8.19% Mizoram SDL 2026 65.0
27 8.05% Mizoram SDL 2026 50.0
28 7.21% Mizoram SDL 2026 120.0
29 7.22% Mizoram SDL 2027 100.0
30 7.41% Mizoram SDL 2027 100.0
31 7.71% Mizoram SDL 2027 74.0
32 8.41% Mizoram GS 2020 54.0
Total [A] 2,191.7
Loans not bearing interest
1 8.15% Mizoram GS 2019 -
Total [B] -
Total [A+B] 2,191.7
NAGALAND -
Loans bearing interest
1 7.78% Nagaland SDL 2027 300.0
2 7.43% Nagaland SDL 2027 200.0
3 8.25% Nagaland SDL 2028 150.0
4 8.14% Nagaland SDL 2028 285.0
5 7.97% Nagaland SDL 2028 200.0
6 8.75% Nagaland SDL 2028 150.0
7 8.19% Nagaland SDL 2028 150.0
8 8.37% Nagaland SDL 2029 150.0
9 8.17% Nagaland SDL 2029 172.0
Sr.No.
Particulars Balance as at end-March 2019
10 7.58% Nagaland GS 2019 260.0
11 8.10% Nagaland GS 2019 89.0
12 8.26% Nagaland GS 2019 100.0
13 8.39% Nagaland GS 2020 100.1
14 8.49% Nagaland GS 2020 28.3
15 8.07% Nagaland GS 2020 100.0
16 8.50% Nagaland GS 2020 100.0
17 8.39% Nagaland GS 2021 55.4
18 8.41% Nagaland GS 2021 100.0
19 8.60% Nagaland GS 2021 100.0
20 8.90% Nagaland GS 2021 150.0
21 9.04% Nagaland GS 2022 250.0
22 9.32% Nagaland GS 2022 5.0
23 8.97% Nagaland GS 2022 250.0
24 8.98% Nagaland GS 2022 200.0
25 8.62% Nagaland SDL 2023 195.0
26 8.55% Nagaland SDL 2023 10.0
27 8.50% Nagaland SDL 2023 120.0
28 7.57% Nagaland SDL 2023 80.0
29 9.75% Nagaland SDL 2023 60.0
30 9.40% Nagaland SDL 2023 130.0
31 9.80% Nagaland SDL 2024 100.0
32 9.69% Nagaland SDL 2024 20.0
33 9.49% Nagaland SDL 2024 25.0
34 9.65% Nagaland SDL 2024 135.0
35 9.10% Nagaland SDL 2024 65.0
36 8.46% Nagaland SDL 2024 150.0
37 8.06% Nagaland SDL 2025 100.0
38 8.07% Nagaland SDL 2025 150.0
39 8.14% Nagaland SDL 2025 100.0
40 8.22% Nagaland SDL 2025 100.0
41 8.22% Nagaland SDL 2025 150.0
42 8.15% Nagaland SDL 2025 100.0
43 8.41% Nagaland SDL 2026 100.0
44 8.63% Nagaland SDL 2026 200.0
45 8.53% Nagaland SDL 2026 200.0
46 7.98% Nagaland SDL 2026 60.0
47 7.57% Nagaland SDL 2026 75.0
48 7.49% Nagaland SDL 2026 75.0
49 7.22% Nagaland SDL 2026 75.0
50 6.89% Nagaland SDL 2026 150.0
51 7.10% Nagaland SDL 2026 150.0
52 7.27% Nagaland SDL 2027 100.0
53 7.74% Nagaland SDL 2027 150.0
54 7.60% Nagaland SDL 2027 235.0
55 7.88% Nagaland SDL 2028 200.0
Total [A] 7,204.8
Loans not bearing interest
1 7.40% Nagaland GS 2019 -
2 8.40% Nagaland GS 2019 -
3 8.47% Nagaland GS 2019 -
Total [B] -
Total [A+B] 7,204.8
Statement 22: State Government Market Loans (Contd.)(` Crore)
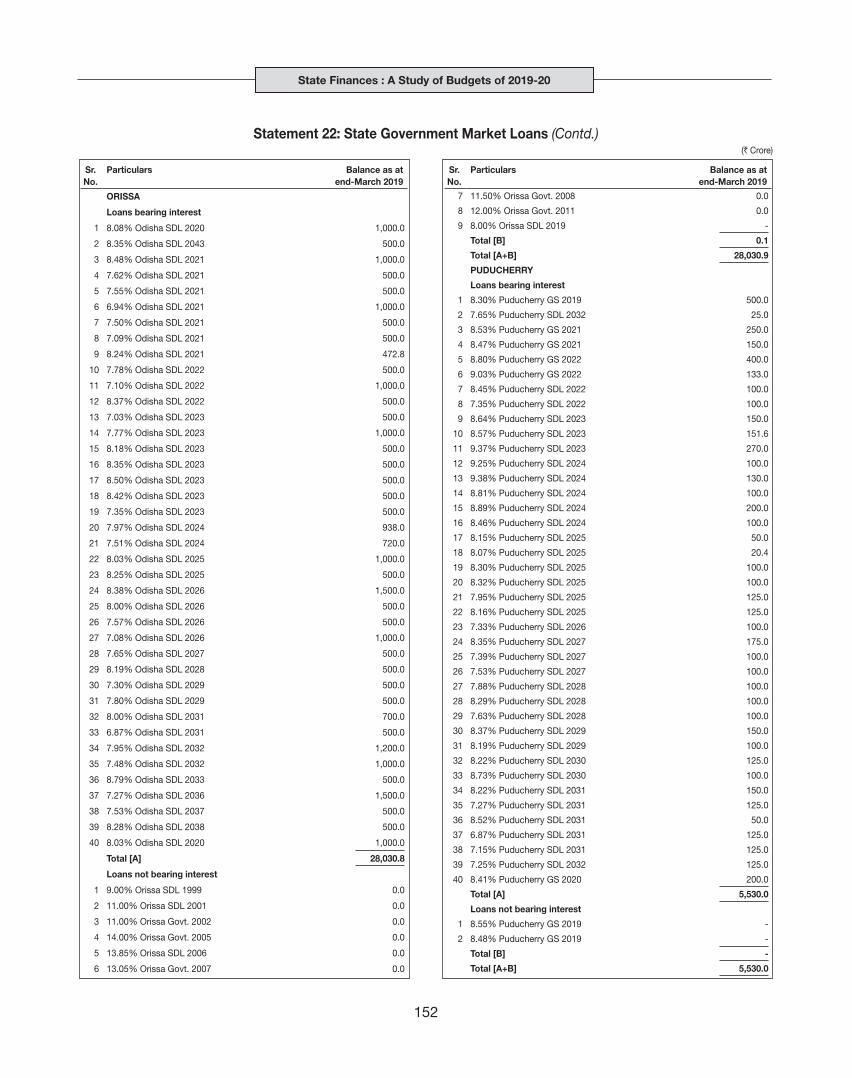
State Finances : A Study of Budgets of 2019-20
152
Sr.No.
Particulars Balance as at end-March 2019
ORISSA
Loans bearing interest
1 8.08% Odisha SDL 2020 1,000.0
2 8.35% Odisha SDL 2043 500.0
3 8.48% Odisha SDL 2021 1,000.0
4 7.62% Odisha SDL 2021 500.0
5 7.55% Odisha SDL 2021 500.0
6 6.94% Odisha SDL 2021 1,000.0
7 7.50% Odisha SDL 2021 500.0
8 7.09% Odisha SDL 2021 500.0
9 8.24% Odisha SDL 2021 472.8
10 7.78% Odisha SDL 2022 500.0
11 7.10% Odisha SDL 2022 1,000.0
12 8.37% Odisha SDL 2022 500.0
13 7.03% Odisha SDL 2023 500.0
14 7.77% Odisha SDL 2023 1,000.0
15 8.18% Odisha SDL 2023 500.0
16 8.35% Odisha SDL 2023 500.0
17 8.50% Odisha SDL 2023 500.0
18 8.42% Odisha SDL 2023 500.0
19 7.35% Odisha SDL 2023 500.0
20 7.97% Odisha SDL 2024 938.0
21 7.51% Odisha SDL 2024 720.0
22 8.03% Odisha SDL 2025 1,000.0
23 8.25% Odisha SDL 2025 500.0
24 8.38% Odisha SDL 2026 1,500.0
25 8.00% Odisha SDL 2026 500.0
26 7.57% Odisha SDL 2026 500.0
27 7.08% Odisha SDL 2026 1,000.0
28 7.65% Odisha SDL 2027 500.0
29 8.19% Odisha SDL 2028 500.0
30 7.30% Odisha SDL 2029 500.0
31 7.80% Odisha SDL 2029 500.0
32 8.00% Odisha SDL 2031 700.0
33 6.87% Odisha SDL 2031 500.0
34 7.95% Odisha SDL 2032 1,200.0
35 7.48% Odisha SDL 2032 1,000.0
36 8.79% Odisha SDL 2033 500.0
37 7.27% Odisha SDL 2036 1,500.0
38 7.53% Odisha SDL 2037 500.0
39 8.28% Odisha SDL 2038 500.0
40 8.03% Odisha SDL 2020 1,000.0
Total [A] 28,030.8
Loans not bearing interest
1 9.00% Orissa SDL 1999 0.0
2 11.00% Orissa SDL 2001 0.0
3 11.00% Orissa Govt. 2002 0.0
4 14.00% Orissa Govt. 2005 0.0
5 13.85% Orissa SDL 2006 0.0
6 13.05% Orissa Govt. 2007 0.0
Sr.No.
Particulars Balance as at end-March 2019
7 11.50% Orissa Govt. 2008 0.0
8 12.00% Orissa Govt. 2011 0.0
9 8.00% Orissa SDL 2019 -
Total [B] 0.1
Total [A+B] 28,030.9
PUDUCHERRY
Loans bearing interest
1 8.30% Puducherry GS 2019 500.0
2 7.65% Puducherry SDL 2032 25.0
3 8.53% Puducherry GS 2021 250.0
4 8.47% Puducherry GS 2021 150.0
5 8.80% Puducherry GS 2022 400.0
6 9.03% Puducherry GS 2022 133.0
7 8.45% Puducherry SDL 2022 100.0
8 7.35% Puducherry SDL 2022 100.0
9 8.64% Puducherry SDL 2023 150.0
10 8.57% Puducherry SDL 2023 151.6
11 9.37% Puducherry SDL 2023 270.0
12 9.25% Puducherry SDL 2024 100.0
13 9.38% Puducherry SDL 2024 130.0
14 8.81% Puducherry SDL 2024 100.0
15 8.89% Puducherry SDL 2024 200.0
16 8.46% Puducherry SDL 2024 100.0
17 8.15% Puducherry SDL 2025 50.0
18 8.07% Puducherry SDL 2025 20.4
19 8.30% Puducherry SDL 2025 100.0
20 8.32% Puducherry SDL 2025 100.0
21 7.95% Puducherry SDL 2025 125.0
22 8.16% Puducherry SDL 2025 125.0
23 7.33% Puducherry SDL 2026 100.0
24 8.35% Puducherry SDL 2027 175.0
25 7.39% Puducherry SDL 2027 100.0
26 7.53% Puducherry SDL 2027 100.0
27 7.88% Puducherry SDL 2028 100.0
28 8.29% Puducherry SDL 2028 100.0
29 7.63% Puducherry SDL 2028 100.0
30 8.37% Puducherry SDL 2029 150.0
31 8.19% Puducherry SDL 2029 100.0
32 8.22% Puducherry SDL 2030 125.0
33 8.73% Puducherry SDL 2030 100.0
34 8.22% Puducherry SDL 2031 150.0
35 7.27% Puducherry SDL 2031 125.0
36 8.52% Puducherry SDL 2031 50.0
37 6.87% Puducherry SDL 2031 125.0
38 7.15% Puducherry SDL 2031 125.0
39 7.25% Puducherry SDL 2032 125.0
40 8.41% Puducherry GS 2020 200.0
Total [A] 5,530.0
Loans not bearing interest
1 8.55% Puducherry GS 2019 -
2 8.48% Puducherry GS 2019 -
Total [B] -
Total [A+B] 5,530.0
Statement 22: State Government Market Loans (Contd.)(` Crore)

Statements
153
Sr.No.
Particulars Balance as at end-March 2019
PUNJAB
Loans bearing interest
1 7.63% Punjab SDL 2023 700.0
2 7.98% Punjab SDL 2023 700.0
3 8.58% Punjab SDL 2023 329.0
4 9.05% Punjab SDL 2023 500.0
5 9.87% Punjab SDL 2023 500.0
6 9.72% Punjab SDL 2023 500.0
7 9.70% Punjab SDL 2023 500.0
8 9.29% Punjab SDL 2023 600.0
9 9.34% Punjab SDL 2023 600.0
10 9.35% Punjab SDL 2023 250.0
11 9.48% Punjab SDL 2023 250.0
12 9.23% Punjab SDL 2024 600.0
13 9.69% Punjab SDL 2024 600.0
14 9.45% Punjab SDL 2024 500.0
15 9.63% Punjab SDL 2024 1,200.0
16 9.21% Punjab SDL 2024 800.0
17 8.84% Punjab SDL 2024 800.0
18 8.16% Punjab SDL 2024 300.0
19 8.12% Punjab SDL 2025 600.0
20 8.05% Punjab SDL 2025 400.0
21 8.08% Punjab SDL 2025 750.0
22 8.06% Punjab SDL 2025 200.0
23 8.05% Punjab SDL 2025 1,000.0
24 8.32% Punjab SDL 2025 900.0
25 8.27% Punjab SDL 2025 600.0
26 8.34% Punjab SDL 2025 600.0
27 8.25% Punjab SDL 2025 900.0
28 8.28% Punjab SDL 2025 600.0
29 8.25% Punjab SDL 2025 900.0
30 8.16% Punjab SDL 2025 400.0
31 8.01% Punjab SDL 2025 1,500.0
32 8.14% Punjab SDL 2025 500.0
33 8.24% Punjab SDL 2025 600.0
34 8.31% Punjab SDL 2026 300.0
35 8.40% Punjab SDL 2026 400.0
36 8.66% Punjab SDL 2026 600.0
37 8.53% Punjab SDL 2026 200.0
38 8.08% Punjab SDL 2026 800.0
39 7.98% Punjab SDL 2026 1,300.0
40 7.96% Punjab SDL 2026 1,100.0
41 8.00% Punjab SDL 2026 800.0
42 7.14% Punjab SDL 2027 800.0
43 7.59% Punjab SDL 2027 600.0
44 7.88% Punjab SDL 2027 1,000.0
45 7.88% Punjab SDL 2027 255.0
46 7.60% Punjab SDL 2027 145.0
47 7.63% Punjab SDL 2027 800.0
48 7.59% Punjab SDL 2027 300.0
49 7.55% Punjab SDL 2027 600.0
50 7.49% Punjab SDL 2027 200.0
51 7.25% Punjab SDL 2027 1,000.0
52 7.20% Punjab SDL 2027 200.0
Sr.No.
Particulars Balance as at end-March 2019
53 7.34% Punjab SDL 2027 600.0
54 7.24% Punjab SDL 2027 200.0
55 7.30% Punjab SDL 2027 1,200.0
56 7.32% Punjab SDL 2027 700.0
57 7.42% Punjab SDL 2027 1,500.0
58 7.42% Punjab SDL 2027 400.0
59 7.46% Punjab SDL 2027 1,000.0
60 7.61% Punjab SDL 2027 600.0
61 7.62% Punjab SDL 2027 200.0
62 7.65% Punjab SDL 2027 500.0
63 7.75% Punjab SDL 2027 500.0
64 7.67% Punjab SDL 2027 800.0
65 7.78% Punjab SDL 2027 400.0
66 7.72% Punjab SDL 2027 300.0
67 7.82% Punjab SDL 2027 600.0
68 7.79% Punjab SDL 2028 300.0
69 7.77% Punjab SDL 2028 500.0
70 8.20% Punjab SDL 2028 875.0
71 8.25% Punjab SDL 2028 300.0
72 8.36% Punjab SDL 2028 500.0
73 8.44% Punjab SDL 2028 1,300.0
74 8.13% Punjab SDL 2028 1,270.0
75 7.99% Punjab SDL 2028 2,450.0
76 8.34% Punjab SDL 2028 1,475.0
77 8.62% Punjab SDL 2028 1,400.0
78 8.61% Punjab SDL 2028 400.0
79 8.43% Punjab SDL 2028 2,326.0
80 8.34% Punjab SDL 2029 1,133.4
81 8.38% Punjab SDL 2029 1,500.0
82 8.23% Punjab SDL 2029 1,972.0
83 8.56% Punjab SDL 2030 2,000.0
84 8.45% Punjab SDL 2031 754.3
85 8.50% Punjab SDL 2033 2,500.0
86 8.49% Punjab SDL 2033 1,800.0
87 7.77% Punjab GS 2019 600.0
88 7.04% Punjab GS 2019 500.0
89 7.82% Punjab GS 2019 500.0
90 8.85% Punjab SDL 2019 500.0
91 8.93% Punjab SDL 2019 300.0
92 7.77% Punjab GS 2019 500.0
93 9.11% Punjab SDL 2019 300.0
94 8.20% Punjab GS 2019 500.0
95 9.08% Punjab SDL 2019 500.0
96 9.06% Punjab SDL 2019 400.0
97 8.20% Punjab GS 2019 700.0
98 8.99% Punjab SDL 2019 200.0
99 8.20% Punjab GS 2019 300.0
100 8.83% Punjab SDL 2019 1,000.0
101 8.67% Punjab SDL 2019 200.0
102 8.08% Punjab GS 2019 200.0
103 8.05% Punjab GS 2019 200.0
104 8.44% Punjab SDL 2019 200.0
105 8.03% Punjab GS 2019 320.0
106 8.45% Punjab SDL 2019 300.0
Statement 22: State Government Market Loans (Contd.)(` Crore)

State Finances : A Study of Budgets of 2019-20
154
Sr.No.
Particulars Balance as at end-March 2019
107 8.37% Punjab GS 2019 465.0
108 8.23% Punjab GS 2020 200.0
109 8.56% Punjab GS 2020 800.0
110 8.32% Punjab GS 2020 500.0
111 8.40% Punjab GS 2020 800.0
112 8.37% Punjab GS 2020 200.0
113 7.01% Punjab SDL 2020 400.0
114 8.34% Punjab GS 2020 500.0
115 6.99% Punjab SDL 2020 1,000.0
116 6.99% Punjab SDL 2020 300.0
117 8.50% Punjab GS 2020 450.0
118 7.06% Punjab SDL 2020 500.0
119 8.44% Punjab GS 2020 450.0
120 6.83% Punjab SDL 2020 250.0
121 6.62% Punjab SDL 2020 250.0
122 8.44% Punjab GS 2020 150.0
123 6.82% Punjab SDL 2020 250.0
124 8.37% Punjab GS 2020 150.0
125 6.93% Punjab SDL 2020 250.0
126 7.07% Punjab SDL 2020 1,000.0
127 8.39% Punjab GS 2021 400.0
128 6.90% Punjab SDL 2021 400.0
129 8.50% Punjab GS 2021 150.0
130 8.52% Punjab GS 2021 378.0
131 8.36% Punjab GS 2021 1,000.0
132 8.47% Punjab GS 2021 600.0
133 8.64% Punjab GS 2021 400.0
134 7.93% Punjab SDL 2021 400.0
135 7.99% Punjab SDL 2021 1,000.0
136 8.54% Punjab GS 2021 650.0
137 7.75% Punjab SDL 2021 800.0
138 8.56% Punjab GS 2021 500.0
139 7.52% Punjab SDL 2021 800.0
140 8.51% Punjab GS 2021 500.0
141 8.59% Punjab GS 2021 250.0
142 7.49% Punjab SDL 2021 400.0
143 8.60% Punjab GS 2021 250.0
144 8.62% Punjab GS 2021 300.0
145 7.28% Punjab SDL 2021 800.0
146 8.66% Punjab GS 2021 300.0
147 8.98% Punjab GS 2021 300.0
148 9.18% Punjab GS 2021 250.0
149 9.21% Punjab GS 2021 250.0
150 8.74% Punjab GS 2021 350.0
151 8.57% Punjab GS 2022 350.0
152 8.67% Punjab GS 2022 250.0
153 8.68% Punjab GS 2022 250.0
154 8.79% Punjab GS 2022 433.0
155 8.96% Punjab GS 2022 567.0
156 8.94% Punjab GS 2022 200.0
157 9.24% Punjab GS 2022 250.0
158 9.17% Punjab GS 2022 700.0
159 9.14% Punjab GS 2022 400.0
160 9.13% Punjab GS 2022 400.0
Sr.No.
Particulars Balance as at end-March 2019
161 9.13% Punjab GS 2022 300.0
162 8.87% Punjab GS 2022 700.0
163 8.91% Punjab GS 2022 1,000.0
164 8.92% Punjab GS 2022 1,000.0
165 8.92% Punjab GS 2022 400.0
166 8.93% Punjab GS 2022 800.0
167 8.91% Punjab GS 2022 500.0
168 8.86% Punjab GS 2022 1,000.0
169 8.86% Punjab SDL 2022 500.0
170 8.90% Punjab SDL 2022 500.0
171 8.64% Punjab SDL 2023 500.0
172 8.71% Punjab SDL 2023 500.0
173 8.51% Punjab SDL 2023 300.0
174 8.54% Punjab SDL 2023 200.0
175 8.51% Punjab SDL 2023 1,500.0
176 8.11% Punjab SDL 2023 500.0
177 8.20% Punjab SDL 2023 700.0
178 7.58% Punjab SDL 2023 200.0
Total [A] 1,09,747.7
Special bonds
1 8.53% Punjab UDAY Bond 2022 559.7
2 8.71% Punjab UDAY Bond 2031 426.9
3 8.22% Punjab UDAY Bond 2022 941.9
4 8.18% Punjab UDAY Bond 2022 100.0
5 7.21% Punjab UDAY Bond 2022 111.8
6 8.45% Punjab UDAY Bond 2023 559.7
7 8.45% Punjab UDAY Bond 2023 426.2
8 8.22% Punjab UDAY Bond 2023 941.9
9 8.18% Punjab UDAY Bond 2023 100.0
10 7.21% Punjab UDAY Bond 2023 111.8
11 8.50% Punjab UDAY Bond 2024 559.7
12 8.45% Punjab UDAY Bond 2024 426.2
13 8.22% Punjab UDAY Bond 2024 941.9
14 8.18% Punjab UDAY Bond 2024 100.0
15 7.21% Punjab UDAY Bond 2024 111.8
16 8.50% Punjab UDAY Bond 2025 559.7
17 8.49% Punjab UDAY Bond 2025 426.2
18 8.22% Punjab UDAY Bond 2025 941.9
19 8.18% Punjab UDAY Bond 2025 100.0
20 7.21% Punjab UDAY Bond 2025 111.8
21 8.22% Punjab UDAY Bond 2026 559.7
22 8.21% Punjab UDAY Bond 2026 426.2
23 8.22% Punjab UDAY Bond 2026 941.9
24 8.18% Punjab UDAY Bond 2026 100.0
25 7.21% Punjab UDAY Bond 2026 111.8
26 8.45% Punjab UDAY Bond 2027 559.7
27 8.43% Punjab UDAY Bond 2027 426.2
28 8.65% Punjab UDAY Bond 2028 559.7
29 8.66% Punjab UDAY Bond 2028 426.2
30 8.48% Punjab UDAY Bond 2029 559.7
31 8.47% Punjab UDAY Bond 2029 426.2
32 8.62% Punjab UDAY Bond 2030 559.7
33 8.61% Punjab UDAY Bond 2030 426.2
Statement 22: State Government Market Loans (Contd.)(` Crore)

Statements
155
Sr.No.
Particulars Balance as at end-March 2019
34 8.72% Punjab UDAY Bond 2031 559.7
35 8.49% Punjab UDAY Bond 2022 426.2
Total [B] 15,628.3
Total [A+B] 1,25,375.9
Loans not bearing interest
1 9.00% Punjab SDL 1999 0.0
2 8.75% Punjab SDL 2000 0.0
3 13.50% Punjab SDL 2003 0.0
4 12.50% Punjab SDL 2004 0.0
5 14.00% Punjab Loan 2005 0.0
6 6.10% Punjab GS 2019 -
7 7.24% Punjab GS 2019 -
8 7.68% Punjab GS 2019 -
9 8.13% Punjab GS 2019 -
Total [C] 0.0
Total [A+B+C] 1,25,376.0
RAJASTHAN
Loans bearing interest
1 8.44% Rajasthan SDL 2028 1,000.0
2 8.54% Rajasthan SDL 2028 1,000.0
3 8.57% Rajasthan SDL 2028 1,000.0
4 8.44% Rajasthan SDL 2028 Jul 500.0
5 8.43% Rajasthan SDL 2028 2,000.0
6 8.49% Rajasthan SDL 2028 1,000.0
7 8.53% Rajasthan SDL 2028 500.0
8 8.63% Rajasthan SDL 2028 2,000.0
9 8.84% Rajasthan SDL 2028 2,000.0
10 8.76% Rajasthan SDL 2028 1,000.0
11 8.65% Rajasthan SDL 2028 1,000.0
12 8.57% Rajasthan SDL 2028 Oct 500.0
13 8.60% Rajasthan SDL 2028 2,000.0
14 8.55% Rajasthan SDL 2028 700.0
15 8.38% Rajasthan SDL 2028 1,000.0
16 8.36% Rajasthan SDL 2028 500.0
17 8.09% Rajasthan SDL 2028 870.0
18 8.27% Rajasthan SDL 2029 1,000.0
19 8.17% Rajasthan SDL 2029 1,000.0
20 8.32% Rajasthan SDL 2029 1,256.0
21 8.44% Rajasthan SDL 2029 1,000.0
22 8.41% Rajasthan SDL 2029 500.0
23 8.40% Rajasthan SDL 2029 1,822.4
24 7.40% Rajasthan SDL 2029 2,000.0
25 7.22% Rajasthan SDL 2032 500.0
26 7.23% Rajasthan SDL 2032 500.0
27 8.25% Rajasthan SDL 2038 500.0
28 8.28% Rajasthan SDL 2038 500.0
29 8.35% Rajasthan SDL 2038 500.0
30 7.44% Rajasthan GS 2019 500.0
31 7.83% Rajasthan GS 2019 500.0
32 7.77% Rajasthan GS 2019 500.0
33 7.95% Rajasthan GS 2019 500.0
34 8.20% Rajasthan GS 2019 500.0
35 8.25% Rajasthan GS 2019 500.0
36 8.16% Rajasthan GS 2019 500.0
Sr.No.
Particulars Balance as at end-March 2019
37 8.21% Rajasthan GS 2019 500.0
38 8.10% Rajasthan GS 2019 500.0
39 8.11% Rajasthan GS 2019 500.0
40 8.06% Rajasthan GS 2019 500.0
41 8.26% Rajasthan GS 2019 500.0
42 8.35% Rajasthan GS 2019 500.0
43 8.30% Rajasthan GS 2020 500.0
44 8.25% Rajasthan GS 2020 500.0
45 8.05% Rajasthan GS 2020 500.0
46 8.11% Rajasthan GS 2020 500.0
47 8.09% Rajasthan GS 2020 500.0
48 8.15% Rajasthan GS 2020 500.0
49 8.12% Rajasthan GS 2020 500.0
50 8.44% Rajasthan GS 2020 500.0
51 8.35% Rajasthan GS 2020 500.0
52 8.51% Rajasthan GS 2020 500.0
53 8.39% Rajasthan GS 2020 500.0
54 8.50% Rajasthan GS 2021 800.0
55 8.52% Rajasthan GS 2021 880.0
56 8.15% Rajasthan SDL 2021 500.0
57 8.33% Rajasthan SDL 2021 1,000.0
58 8.65% Rajasthan GS 2021 500.0
59 8.85% Rajasthan GS 2021 500.0
60 9.06% Rajasthan GS 2021 500.0
61 9.20% Rajasthan GS 2021 500.0
62 9.23% Rajasthan GS 2021 383.0
63 9.02% Rajasthan GS 2021 500.0
64 8.88% Rajasthan GS 2021 500.0
65 8.74% Rajasthan GS 2022 617.0
66 9.24% Rajasthan GS 2022 500.0
67 9.12% Rajasthan GS 2022 500.0
68 8.87% Rajasthan GS 2022 500.0
69 8.89% Rajasthan GS 2022 500.0
70 8.84% Rajasthan GS 2022 500.0
71 8.92% Rajasthan GS 2022 500.0
72 8.92% Rajasthan GS 2022 500.0
73 8.91% Rajasthan GS 2022 500.0
74 8.90% Rajasthan GS 2022 500.0
75 8.85% Rajasthan GS 2022 500.0
76 8.84% Rajasthan GS 2022 500.0
77 8.92% Rajasthan GS 2022 1,000.0
78 8.90% Rajasthan SDL 2022 500.0
79 8.56% Rajasthan SDL 2023 1,000.0
80 8.52% Rajasthan SDL 2023 541.1
81 8.09% Rajasthan SDL 2023 500.0
82 7.58% Rajasthan SDL 2023 500.0
83 7.63% Rajasthan SDL 2023 500.0
84 7.74% Rajasthan SDL 2023 500.0
85 7.94% Rajasthan SDL 2023 500.0
86 9.05% Rajasthan SDL 2023 500.0
87 9.82% Rajasthan SDL 2023 500.0
88 9.70% Rajasthan SDL 2023 500.0
89 9.52% Rajasthan SDL 2023 500.0
90 9.70% Rajasthan SDL 2023 500.0
Statement 22: State Government Market Loans (Contd.)(` Crore)

State Finances : A Study of Budgets of 2019-20
156
Sr.No.
Particulars Balance as at end-March 2019
91 9.25% Rajasthan SDL 2023 500.0
92 9.25% Rajasthan SDL 2023 500.0
93 9.33% Rajasthan SDL 2023 500.0
94 9.40% Rajasthan SDL 2023 500.0
95 9.33% Rajasthan SDL 2023 500.0
96 9.50% Rajasthan SDL 2023 500.0
97 9.45% Rajasthan SDL 2024 800.0
98 9.63% Rajasthan SDL 2024 500.0
99 9.38% Rajasthan SDL 2024 500.0
100 9.21% Rajasthan SDL 2024 500.0
101 9.11% Rajasthan SDL 2024 500.0
102 8.79% Rajasthan SDL 2024 500.0
103 8.97% Rajasthan SDL 2024 500.0
104 8.96% Rajasthan SDL 2024 500.0
105 8.94% Rajasthan SDL 2024 500.0
106 9.03% Rajasthan SDL 2024 500.0
107 8.94% Rajasthan SDL 2024 500.0
108 8.99% Rajasthan SDL 2024 500.0
109 8.90% Rajasthan SDL 2024 500.0
110 8.84% Rajasthan SDL 2024 500.0
111 8.71% Rajasthan SDL 2024 500.0
112 8.42% Rajasthan SDL 2024 500.0
113 8.43% Rajasthan SDL 2024 500.0
114 8.16% Rajasthan SDL 2024 500.0
115 8.24% Rajasthan SDL 2024 500.0
116 8.12% Rajasthan SDL 2025 500.0
117 8.05% Rajasthan SDL 2025 1,000.0
118 8.06% Rajasthan SDL 2025 750.0
119 8.05% Rajasthan SDL 2025 750.0
120 8.02% Rajasthan SDL 2025 300.0
121 8.05% Rajasthan SDL 2025 500.0
122 8.05% Rajasthan SDL 2025 500.0
123 8.29% Rajasthan SDL 2025 1,000.0
124 8.23% Rajasthan SDL 2025 500.0
125 8.20% Rajasthan SDL 2025 500.0
126 8.29% Rajasthan SDL 2025 1,000.0
127 8.23% Rajasthan SDL 2025 500.0
128 7.95% Rajasthan SDL 2025 750.0
129 7.99% Rajasthan SDL 2025 1,000.0
130 8.14% Rajasthan SDL 2025 1,500.0
131 8.16% Rajasthan SDL 2025 750.0
132 8.30% Rajasthan SDL 2026 2,000.0
133 8.38% Rajasthan SDL 2026 1,000.0
134 8.48% Rajasthan SDL 2026 1,000.0
135 8.65% Rajasthan SDL 2026 800.0
136 8.55% Rajasthan SDL 2026 1,000.0
137 8.09% Rajasthan SDL 2026 1,500.0
138 7.98% Rajasthan SDL 2026 750.0
139 8.00% Rajasthan SDL 2026 750.0
140 8.07% Rajasthan SDL 2026 1,500.0
141 7.58% Rajasthan SDL 2026 500.0
142 7.57% Rajasthan SDL 2026 500.0
143 7.38% Rajasthan SDL 2026 2,000.0
144 7.17% Rajasthan SDL 2026 900.0
Sr.No.
Particulars Balance as at end-March 2019
145 7.21% Rajasthan SDL 2026 1,000.0
146 7.37% Rajasthan SDL 2026 500.0
147 6.82% Rajasthan SDL 2026 500.0
148 6.85% Rajasthan SDL 2026 500.0
149 7.06% Rajasthan SDL 2026 1,000.0
150 7.15% Rajasthan SDL 2027 500.0
151 7.59% Rajasthan SDL 2027 500.0
152 7.73% Rajasthan SDL 2027 2,000.0
153 7.85% Rajasthan SDL 2027 2,000.0
154 7.61% Rajasthan SDL 2027 653.8
155 7.51% Rajasthan SDL 2027 1,000.0
156 7.23% Rajasthan SDL 2027 2,000.0
157 7.22% Rajasthan SDL 2027 1,000.0
158 7.45% Rajasthan SDL 2027 2,500.0
159 7.55% Rajasthan SDL 2027 500.0
160 7.64% Rajasthan SDL 2027 2,000.0
161 7.65% Rajasthan SDL 2027 500.0
162 7.65% Rajasthan SDL 2027 1,000.0
163 7.86% Rajasthan SDL 2027 2,000.0
164 7.88% Rajasthan SDL 2028 1,000.0
165 8.07% Rajasthan SDL 2028 1,000.0
166 8.28% Rajasthan SDL 2028 1,500.0
167 8.33% Rajasthan SDL 2028 1,500.0
168 8.44% Rajasthan SDL 2028 2,000.0
169 8.28% Rajasthan SDL 2028 2,000.0
170 8.13% Rajasthan SDL 2028 414.0
171 7.98% Rajasthan SDL 2028 1,500.0
172 8.16% Rajasthan SDL 2028 1,500.0
173 8.40% Rajasthan SDL 2028 1,029.6
174 8.40% Rajasthan SDL 2028 Jun 1,000.0
Total [A] 1,37,266.9
Power bonds
1 8.45% Rajasthan SPL 2028 806.0
2 9.99% Rajasthan SPL 2028 340.0
3 9.16% Rajasthan SPL 2028 1,000.0
4 10.03% Rajasthan SPL 2028 3,000.0
Total [B] 5,146.0
Total [A+B] 1,42,412.9
Special bonds
1 6.80% Rajasthan UDAY Bond 2019 -
2 8.41% Rajasthan SPL 2028 270.0
3 8.39% Rajasthan UDAY Bond 2019 -
4 8.21% Rajasthan UDAY Bond 2019 -
5 7.86% Rajasthan UDAY Bond 2019 2,311.9
6 8.35% Rajasthan SPL 2019 270.0
7 6.93% Rajasthan UDAY Bond 2020 62.8
8 6.83% Rajasthan UDAY Bond 2020 111.1
9 8.39% Rajasthan UDAY Bond 2020 3,161.7
10 8.21% Rajasthan UDAY Bond 2020 988.3
11 8.01% Rajasthan UDAY Bond 2020 2,311.9
12 8.47% Rajasthan SPL 2020 270.0
13 6.97% Rajasthan UDAY Bond 2021 111.1
14 7.07% Rajasthan UDAY Bond 2021 62.8
15 8.39% Rajasthan UDAY Bond 2021 3,161.7
Statement 22: State Government Market Loans (Contd.)(` Crore)
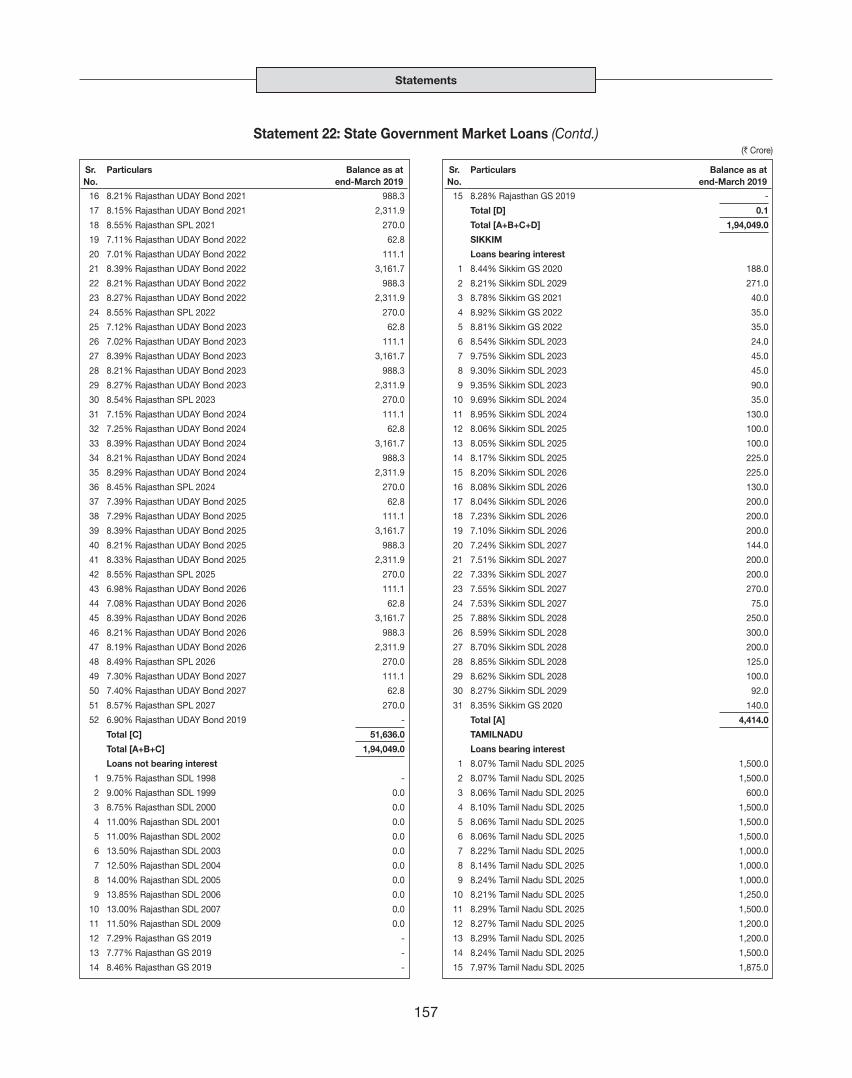
Statements
157
Sr.No.
Particulars Balance as at end-March 2019
16 8.21% Rajasthan UDAY Bond 2021 988.3
17 8.15% Rajasthan UDAY Bond 2021 2,311.9
18 8.55% Rajasthan SPL 2021 270.0
19 7.11% Rajasthan UDAY Bond 2022 62.8
20 7.01% Rajasthan UDAY Bond 2022 111.1
21 8.39% Rajasthan UDAY Bond 2022 3,161.7
22 8.21% Rajasthan UDAY Bond 2022 988.3
23 8.27% Rajasthan UDAY Bond 2022 2,311.9
24 8.55% Rajasthan SPL 2022 270.0
25 7.12% Rajasthan UDAY Bond 2023 62.8
26 7.02% Rajasthan UDAY Bond 2023 111.1
27 8.39% Rajasthan UDAY Bond 2023 3,161.7
28 8.21% Rajasthan UDAY Bond 2023 988.3
29 8.27% Rajasthan UDAY Bond 2023 2,311.9
30 8.54% Rajasthan SPL 2023 270.0
31 7.15% Rajasthan UDAY Bond 2024 111.1
32 7.25% Rajasthan UDAY Bond 2024 62.8
33 8.39% Rajasthan UDAY Bond 2024 3,161.7
34 8.21% Rajasthan UDAY Bond 2024 988.3
35 8.29% Rajasthan UDAY Bond 2024 2,311.9
36 8.45% Rajasthan SPL 2024 270.0
37 7.39% Rajasthan UDAY Bond 2025 62.8
38 7.29% Rajasthan UDAY Bond 2025 111.1
39 8.39% Rajasthan UDAY Bond 2025 3,161.7
40 8.21% Rajasthan UDAY Bond 2025 988.3
41 8.33% Rajasthan UDAY Bond 2025 2,311.9
42 8.55% Rajasthan SPL 2025 270.0
43 6.98% Rajasthan UDAY Bond 2026 111.1
44 7.08% Rajasthan UDAY Bond 2026 62.8
45 8.39% Rajasthan UDAY Bond 2026 3,161.7
46 8.21% Rajasthan UDAY Bond 2026 988.3
47 8.19% Rajasthan UDAY Bond 2026 2,311.9
48 8.49% Rajasthan SPL 2026 270.0
49 7.30% Rajasthan UDAY Bond 2027 111.1
50 7.40% Rajasthan UDAY Bond 2027 62.8
51 8.57% Rajasthan SPL 2027 270.0
52 6.90% Rajasthan UDAY Bond 2019 -
Total [C] 51,636.0
Total [A+B+C] 1,94,049.0
Loans not bearing interest
1 9.75% Rajasthan SDL 1998 -
2 9.00% Rajasthan SDL 1999 0.0
3 8.75% Rajasthan SDL 2000 0.0
4 11.00% Rajasthan SDL 2001 0.0
5 11.00% Rajasthan SDL 2002 0.0
6 13.50% Rajasthan SDL 2003 0.0
7 12.50% Rajasthan SDL 2004 0.0
8 14.00% Rajasthan SDL 2005 0.0
9 13.85% Rajasthan SDL 2006 0.0
10 13.00% Rajasthan SDL 2007 0.0
11 11.50% Rajasthan SDL 2009 0.0
12 7.29% Rajasthan GS 2019 -
13 7.77% Rajasthan GS 2019 -
14 8.46% Rajasthan GS 2019 -
Sr.No.
Particulars Balance as at end-March 2019
15 8.28% Rajasthan GS 2019 -
Total [D] 0.1
Total [A+B+C+D] 1,94,049.0
SIKKIM
Loans bearing interest
1 8.44% Sikkim GS 2020 188.0
2 8.21% Sikkim SDL 2029 271.0
3 8.78% Sikkim GS 2021 40.0
4 8.92% Sikkim GS 2022 35.0
5 8.81% Sikkim GS 2022 35.0
6 8.54% Sikkim SDL 2023 24.0
7 9.75% Sikkim SDL 2023 45.0
8 9.30% Sikkim SDL 2023 45.0
9 9.35% Sikkim SDL 2023 90.0
10 9.69% Sikkim SDL 2024 35.0
11 8.95% Sikkim SDL 2024 130.0
12 8.06% Sikkim SDL 2025 100.0
13 8.05% Sikkim SDL 2025 100.0
14 8.17% Sikkim SDL 2025 225.0
15 8.20% Sikkim SDL 2026 225.0
16 8.08% Sikkim SDL 2026 130.0
17 8.04% Sikkim SDL 2026 200.0
18 7.23% Sikkim SDL 2026 200.0
19 7.10% Sikkim SDL 2026 200.0
20 7.24% Sikkim SDL 2027 144.0
21 7.51% Sikkim SDL 2027 200.0
22 7.33% Sikkim SDL 2027 200.0
23 7.55% Sikkim SDL 2027 270.0
24 7.53% Sikkim SDL 2027 75.0
25 7.88% Sikkim SDL 2028 250.0
26 8.59% Sikkim SDL 2028 300.0
27 8.70% Sikkim SDL 2028 200.0
28 8.85% Sikkim SDL 2028 125.0
29 8.62% Sikkim SDL 2028 100.0
30 8.27% Sikkim SDL 2029 92.0
31 8.35% Sikkim GS 2020 140.0
Total [A] 4,414.0
TAMILNADU
Loans bearing interest
1 8.07% Tamil Nadu SDL 2025 1,500.0
2 8.07% Tamil Nadu SDL 2025 1,500.0
3 8.06% Tamil Nadu SDL 2025 600.0
4 8.10% Tamil Nadu SDL 2025 1,500.0
5 8.06% Tamil Nadu SDL 2025 1,500.0
6 8.06% Tamil Nadu SDL 2025 1,500.0
7 8.22% Tamil Nadu SDL 2025 1,000.0
8 8.14% Tamil Nadu SDL 2025 1,000.0
9 8.24% Tamil Nadu SDL 2025 1,000.0
10 8.21% Tamil Nadu SDL 2025 1,250.0
11 8.29% Tamil Nadu SDL 2025 1,500.0
12 8.27% Tamil Nadu SDL 2025 1,200.0
13 8.29% Tamil Nadu SDL 2025 1,200.0
14 8.24% Tamil Nadu SDL 2025 1,500.0
15 7.97% Tamil Nadu SDL 2025 1,875.0
Statement 22: State Government Market Loans (Contd.)(` Crore)
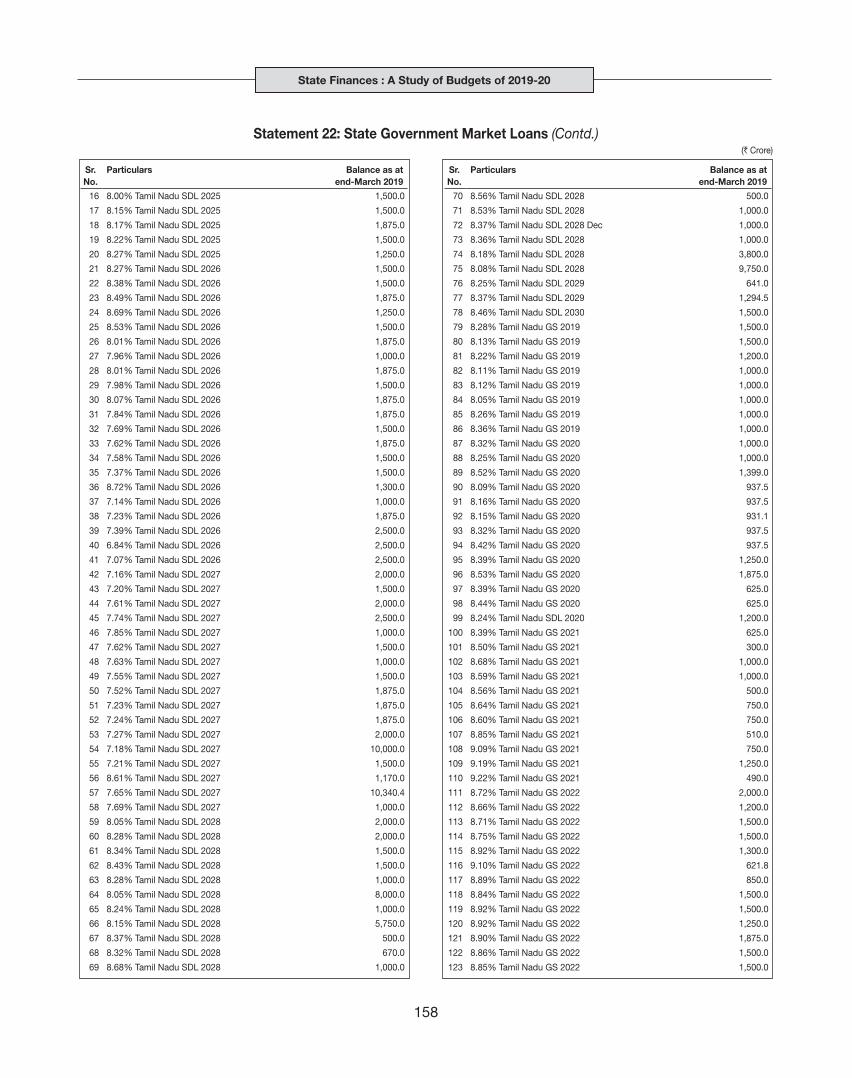
State Finances : A Study of Budgets of 2019-20
158
Sr.No.
Particulars Balance as at end-March 2019
16 8.00% Tamil Nadu SDL 2025 1,500.0
17 8.15% Tamil Nadu SDL 2025 1,500.0
18 8.17% Tamil Nadu SDL 2025 1,875.0
19 8.22% Tamil Nadu SDL 2025 1,500.0
20 8.27% Tamil Nadu SDL 2025 1,250.0
21 8.27% Tamil Nadu SDL 2026 1,500.0
22 8.38% Tamil Nadu SDL 2026 1,500.0
23 8.49% Tamil Nadu SDL 2026 1,875.0
24 8.69% Tamil Nadu SDL 2026 1,250.0
25 8.53% Tamil Nadu SDL 2026 1,500.0
26 8.01% Tamil Nadu SDL 2026 1,875.0
27 7.96% Tamil Nadu SDL 2026 1,000.0
28 8.01% Tamil Nadu SDL 2026 1,875.0
29 7.98% Tamil Nadu SDL 2026 1,500.0
30 8.07% Tamil Nadu SDL 2026 1,875.0
31 7.84% Tamil Nadu SDL 2026 1,875.0
32 7.69% Tamil Nadu SDL 2026 1,500.0
33 7.62% Tamil Nadu SDL 2026 1,875.0
34 7.58% Tamil Nadu SDL 2026 1,500.0
35 7.37% Tamil Nadu SDL 2026 1,500.0
36 8.72% Tamil Nadu SDL 2026 1,300.0
37 7.14% Tamil Nadu SDL 2026 1,000.0
38 7.23% Tamil Nadu SDL 2026 1,875.0
39 7.39% Tamil Nadu SDL 2026 2,500.0
40 6.84% Tamil Nadu SDL 2026 2,500.0
41 7.07% Tamil Nadu SDL 2026 2,500.0
42 7.16% Tamil Nadu SDL 2027 2,000.0
43 7.20% Tamil Nadu SDL 2027 1,500.0
44 7.61% Tamil Nadu SDL 2027 2,000.0
45 7.74% Tamil Nadu SDL 2027 2,500.0
46 7.85% Tamil Nadu SDL 2027 1,000.0
47 7.62% Tamil Nadu SDL 2027 1,500.0
48 7.63% Tamil Nadu SDL 2027 1,000.0
49 7.55% Tamil Nadu SDL 2027 1,500.0
50 7.52% Tamil Nadu SDL 2027 1,875.0
51 7.23% Tamil Nadu SDL 2027 1,875.0
52 7.24% Tamil Nadu SDL 2027 1,875.0
53 7.27% Tamil Nadu SDL 2027 2,000.0
54 7.18% Tamil Nadu SDL 2027 10,000.0
55 7.21% Tamil Nadu SDL 2027 1,500.0
56 8.61% Tamil Nadu SDL 2027 1,170.0
57 7.65% Tamil Nadu SDL 2027 10,340.4
58 7.69% Tamil Nadu SDL 2027 1,000.0
59 8.05% Tamil Nadu SDL 2028 2,000.0
60 8.28% Tamil Nadu SDL 2028 2,000.0
61 8.34% Tamil Nadu SDL 2028 1,500.0
62 8.43% Tamil Nadu SDL 2028 1,500.0
63 8.28% Tamil Nadu SDL 2028 1,000.0
64 8.05% Tamil Nadu SDL 2028 8,000.0
65 8.24% Tamil Nadu SDL 2028 1,000.0
66 8.15% Tamil Nadu SDL 2028 5,750.0
67 8.37% Tamil Nadu SDL 2028 500.0
68 8.32% Tamil Nadu SDL 2028 670.0
69 8.68% Tamil Nadu SDL 2028 1,000.0
Sr.No.
Particulars Balance as at end-March 2019
70 8.56% Tamil Nadu SDL 2028 500.0
71 8.53% Tamil Nadu SDL 2028 1,000.0
72 8.37% Tamil Nadu SDL 2028 Dec 1,000.0
73 8.36% Tamil Nadu SDL 2028 1,000.0
74 8.18% Tamil Nadu SDL 2028 3,800.0
75 8.08% Tamil Nadu SDL 2028 9,750.0
76 8.25% Tamil Nadu SDL 2029 641.0
77 8.37% Tamil Nadu SDL 2029 1,294.5
78 8.46% Tamil Nadu SDL 2030 1,500.0
79 8.28% Tamil Nadu GS 2019 1,500.0
80 8.13% Tamil Nadu GS 2019 1,500.0
81 8.22% Tamil Nadu GS 2019 1,200.0
82 8.11% Tamil Nadu GS 2019 1,000.0
83 8.12% Tamil Nadu GS 2019 1,000.0
84 8.05% Tamil Nadu GS 2019 1,000.0
85 8.26% Tamil Nadu GS 2019 1,000.0
86 8.36% Tamil Nadu GS 2019 1,000.0
87 8.32% Tamil Nadu GS 2020 1,000.0
88 8.25% Tamil Nadu GS 2020 1,000.0
89 8.52% Tamil Nadu GS 2020 1,399.0
90 8.09% Tamil Nadu GS 2020 937.5
91 8.16% Tamil Nadu GS 2020 937.5
92 8.15% Tamil Nadu GS 2020 931.1
93 8.32% Tamil Nadu GS 2020 937.5
94 8.42% Tamil Nadu GS 2020 937.5
95 8.39% Tamil Nadu GS 2020 1,250.0
96 8.53% Tamil Nadu GS 2020 1,875.0
97 8.39% Tamil Nadu GS 2020 625.0
98 8.44% Tamil Nadu GS 2020 625.0
99 8.24% Tamil Nadu SDL 2020 1,200.0
100 8.39% Tamil Nadu GS 2021 625.0
101 8.50% Tamil Nadu GS 2021 300.0
102 8.68% Tamil Nadu GS 2021 1,000.0
103 8.59% Tamil Nadu GS 2021 1,000.0
104 8.56% Tamil Nadu GS 2021 500.0
105 8.64% Tamil Nadu GS 2021 750.0
106 8.60% Tamil Nadu GS 2021 750.0
107 8.85% Tamil Nadu GS 2021 510.0
108 9.09% Tamil Nadu GS 2021 750.0
109 9.19% Tamil Nadu GS 2021 1,250.0
110 9.22% Tamil Nadu GS 2021 490.0
111 8.72% Tamil Nadu GS 2022 2,000.0
112 8.66% Tamil Nadu GS 2022 1,200.0
113 8.71% Tamil Nadu GS 2022 1,500.0
114 8.75% Tamil Nadu GS 2022 1,500.0
115 8.92% Tamil Nadu GS 2022 1,300.0
116 9.10% Tamil Nadu GS 2022 621.8
117 8.89% Tamil Nadu GS 2022 850.0
118 8.84% Tamil Nadu GS 2022 1,500.0
119 8.92% Tamil Nadu GS 2022 1,500.0
120 8.92% Tamil Nadu GS 2022 1,250.0
121 8.90% Tamil Nadu GS 2022 1,875.0
122 8.86% Tamil Nadu GS 2022 1,500.0
123 8.85% Tamil Nadu GS 2022 1,500.0
Statement 22: State Government Market Loans (Contd.)(` Crore)
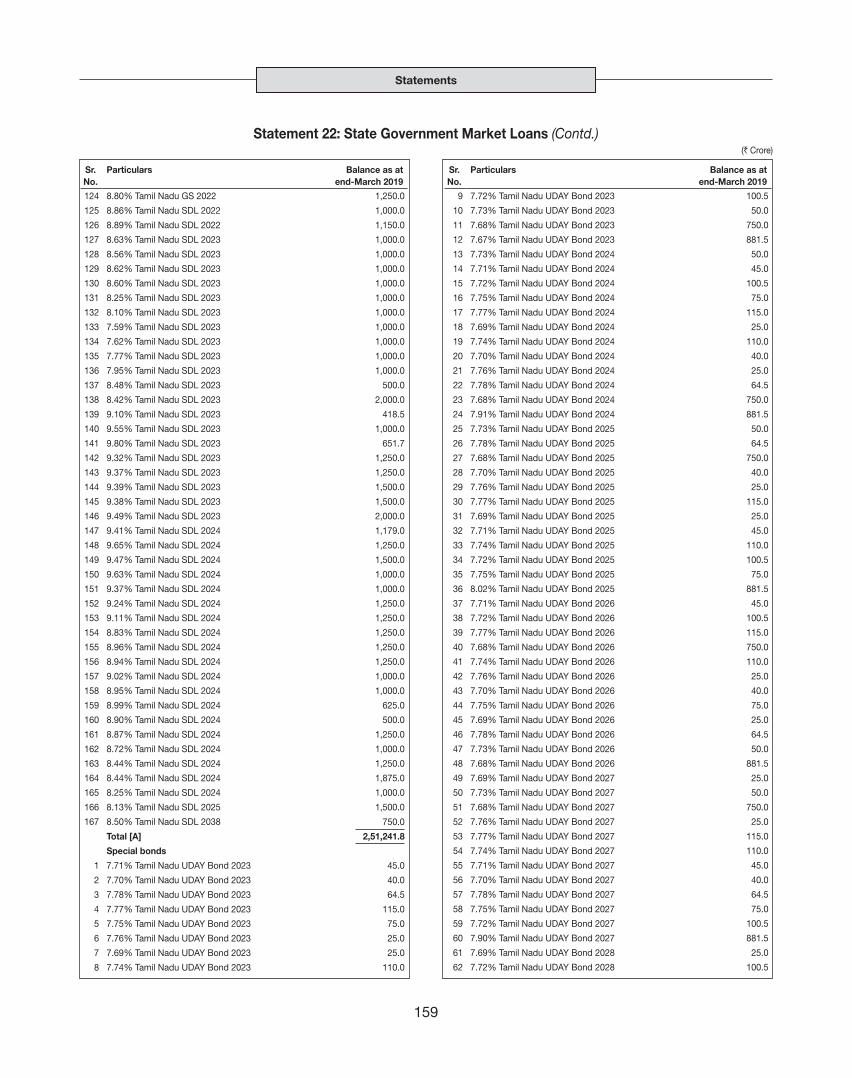
Statements
159
Sr.No.
Particulars Balance as at end-March 2019
124 8.80% Tamil Nadu GS 2022 1,250.0
125 8.86% Tamil Nadu SDL 2022 1,000.0
126 8.89% Tamil Nadu SDL 2022 1,150.0
127 8.63% Tamil Nadu SDL 2023 1,000.0
128 8.56% Tamil Nadu SDL 2023 1,000.0
129 8.62% Tamil Nadu SDL 2023 1,000.0
130 8.60% Tamil Nadu SDL 2023 1,000.0
131 8.25% Tamil Nadu SDL 2023 1,000.0
132 8.10% Tamil Nadu SDL 2023 1,000.0
133 7.59% Tamil Nadu SDL 2023 1,000.0
134 7.62% Tamil Nadu SDL 2023 1,000.0
135 7.77% Tamil Nadu SDL 2023 1,000.0
136 7.95% Tamil Nadu SDL 2023 1,000.0
137 8.48% Tamil Nadu SDL 2023 500.0
138 8.42% Tamil Nadu SDL 2023 2,000.0
139 9.10% Tamil Nadu SDL 2023 418.5
140 9.55% Tamil Nadu SDL 2023 1,000.0
141 9.80% Tamil Nadu SDL 2023 651.7
142 9.32% Tamil Nadu SDL 2023 1,250.0
143 9.37% Tamil Nadu SDL 2023 1,250.0
144 9.39% Tamil Nadu SDL 2023 1,500.0
145 9.38% Tamil Nadu SDL 2023 1,500.0
146 9.49% Tamil Nadu SDL 2023 2,000.0
147 9.41% Tamil Nadu SDL 2024 1,179.0
148 9.65% Tamil Nadu SDL 2024 1,250.0
149 9.47% Tamil Nadu SDL 2024 1,500.0
150 9.63% Tamil Nadu SDL 2024 1,000.0
151 9.37% Tamil Nadu SDL 2024 1,000.0
152 9.24% Tamil Nadu SDL 2024 1,250.0
153 9.11% Tamil Nadu SDL 2024 1,250.0
154 8.83% Tamil Nadu SDL 2024 1,250.0
155 8.96% Tamil Nadu SDL 2024 1,250.0
156 8.94% Tamil Nadu SDL 2024 1,250.0
157 9.02% Tamil Nadu SDL 2024 1,000.0
158 8.95% Tamil Nadu SDL 2024 1,000.0
159 8.99% Tamil Nadu SDL 2024 625.0
160 8.90% Tamil Nadu SDL 2024 500.0
161 8.87% Tamil Nadu SDL 2024 1,250.0
162 8.72% Tamil Nadu SDL 2024 1,000.0
163 8.44% Tamil Nadu SDL 2024 1,250.0
164 8.44% Tamil Nadu SDL 2024 1,875.0
165 8.25% Tamil Nadu SDL 2024 1,000.0
166 8.13% Tamil Nadu SDL 2025 1,500.0
167 8.50% Tamil Nadu SDL 2038 750.0
Total [A] 2,51,241.8
Special bonds
1 7.71% Tamil Nadu UDAY Bond 2023 45.0
2 7.70% Tamil Nadu UDAY Bond 2023 40.0
3 7.78% Tamil Nadu UDAY Bond 2023 64.5
4 7.77% Tamil Nadu UDAY Bond 2023 115.0
5 7.75% Tamil Nadu UDAY Bond 2023 75.0
6 7.76% Tamil Nadu UDAY Bond 2023 25.0
7 7.69% Tamil Nadu UDAY Bond 2023 25.0
8 7.74% Tamil Nadu UDAY Bond 2023 110.0
Sr.No.
Particulars Balance as at end-March 2019
9 7.72% Tamil Nadu UDAY Bond 2023 100.5
10 7.73% Tamil Nadu UDAY Bond 2023 50.0
11 7.68% Tamil Nadu UDAY Bond 2023 750.0
12 7.67% Tamil Nadu UDAY Bond 2023 881.5
13 7.73% Tamil Nadu UDAY Bond 2024 50.0
14 7.71% Tamil Nadu UDAY Bond 2024 45.0
15 7.72% Tamil Nadu UDAY Bond 2024 100.5
16 7.75% Tamil Nadu UDAY Bond 2024 75.0
17 7.77% Tamil Nadu UDAY Bond 2024 115.0
18 7.69% Tamil Nadu UDAY Bond 2024 25.0
19 7.74% Tamil Nadu UDAY Bond 2024 110.0
20 7.70% Tamil Nadu UDAY Bond 2024 40.0
21 7.76% Tamil Nadu UDAY Bond 2024 25.0
22 7.78% Tamil Nadu UDAY Bond 2024 64.5
23 7.68% Tamil Nadu UDAY Bond 2024 750.0
24 7.91% Tamil Nadu UDAY Bond 2024 881.5
25 7.73% Tamil Nadu UDAY Bond 2025 50.0
26 7.78% Tamil Nadu UDAY Bond 2025 64.5
27 7.68% Tamil Nadu UDAY Bond 2025 750.0
28 7.70% Tamil Nadu UDAY Bond 2025 40.0
29 7.76% Tamil Nadu UDAY Bond 2025 25.0
30 7.77% Tamil Nadu UDAY Bond 2025 115.0
31 7.69% Tamil Nadu UDAY Bond 2025 25.0
32 7.71% Tamil Nadu UDAY Bond 2025 45.0
33 7.74% Tamil Nadu UDAY Bond 2025 110.0
34 7.72% Tamil Nadu UDAY Bond 2025 100.5
35 7.75% Tamil Nadu UDAY Bond 2025 75.0
36 8.02% Tamil Nadu UDAY Bond 2025 881.5
37 7.71% Tamil Nadu UDAY Bond 2026 45.0
38 7.72% Tamil Nadu UDAY Bond 2026 100.5
39 7.77% Tamil Nadu UDAY Bond 2026 115.0
40 7.68% Tamil Nadu UDAY Bond 2026 750.0
41 7.74% Tamil Nadu UDAY Bond 2026 110.0
42 7.76% Tamil Nadu UDAY Bond 2026 25.0
43 7.70% Tamil Nadu UDAY Bond 2026 40.0
44 7.75% Tamil Nadu UDAY Bond 2026 75.0
45 7.69% Tamil Nadu UDAY Bond 2026 25.0
46 7.78% Tamil Nadu UDAY Bond 2026 64.5
47 7.73% Tamil Nadu UDAY Bond 2026 50.0
48 7.68% Tamil Nadu UDAY Bond 2026 881.5
49 7.69% Tamil Nadu UDAY Bond 2027 25.0
50 7.73% Tamil Nadu UDAY Bond 2027 50.0
51 7.68% Tamil Nadu UDAY Bond 2027 750.0
52 7.76% Tamil Nadu UDAY Bond 2027 25.0
53 7.77% Tamil Nadu UDAY Bond 2027 115.0
54 7.74% Tamil Nadu UDAY Bond 2027 110.0
55 7.71% Tamil Nadu UDAY Bond 2027 45.0
56 7.70% Tamil Nadu UDAY Bond 2027 40.0
57 7.78% Tamil Nadu UDAY Bond 2027 64.5
58 7.75% Tamil Nadu UDAY Bond 2027 75.0
59 7.72% Tamil Nadu UDAY Bond 2027 100.5
60 7.90% Tamil Nadu UDAY Bond 2027 881.5
61 7.69% Tamil Nadu UDAY Bond 2028 25.0
62 7.72% Tamil Nadu UDAY Bond 2028 100.5
Statement 22: State Government Market Loans (Contd.)(` Crore)

State Finances : A Study of Budgets of 2019-20
160
Sr.No.
Particulars Balance as at end-March 2019
63 7.78% Tamil Nadu UDAY Bond 2028 64.5
64 7.77% Tamil Nadu UDAY Bond 2028 115.0
65 7.68% Tamil Nadu UDAY Bond 2028 750.0
66 7.76% Tamil Nadu UDAY Bond 2028 25.0
67 7.71% Tamil Nadu UDAY Bond 2028 45.0
68 7.74% Tamil Nadu UDAY Bond 2028 110.0
69 7.73% Tamil Nadu UDAY Bond 2028 50.0
70 7.70% Tamil Nadu UDAY Bond 2028 40.0
71 7.75% Tamil Nadu UDAY Bond 2028 75.0
72 8.24% Tamil Nadu UDAY Bond 2028 881.5
73 7.73% Tamil Nadu UDAY Bond 2029 50.0
74 7.74% Tamil Nadu UDAY Bond 2029 110.0
75 7.68% Tamil Nadu UDAY Bond 2029 750.0
76 7.78% Tamil Nadu UDAY Bond 2029 64.5
77 7.69% Tamil Nadu UDAY Bond 2029 25.0
78 7.72% Tamil Nadu UDAY Bond 2029 100.5
79 7.70% Tamil Nadu UDAY Bond 2029 40.0
80 7.77% Tamil Nadu UDAY Bond 2029 115.0
81 7.75% Tamil Nadu UDAY Bond 2029 75.0
82 7.71% Tamil Nadu UDAY Bond 2029 45.0
83 7.76% Tamil Nadu UDAY Bond 2029 25.0
84 8.04% Tamil Nadu UDAY Bond 2029 881.5
85 7.68% Tamil Nadu UDAY Bond 2030 750.0
86 7.69% Tamil Nadu UDAY Bond 2030 25.0
87 7.78% Tamil Nadu UDAY Bond 2030 64.5
88 7.77% Tamil Nadu UDAY Bond 2030 115.0
89 7.72% Tamil Nadu UDAY Bond 2030 100.5
90 7.70% Tamil Nadu UDAY Bond 2030 40.0
91 7.71% Tamil Nadu UDAY Bond 2030 45.0
92 7.74% Tamil Nadu UDAY Bond 2030 110.0
93 7.75% Tamil Nadu UDAY Bond 2030 75.0
94 7.73% Tamil Nadu UDAY Bond 2030 50.0
95 7.76% Tamil Nadu UDAY Bond 2030 25.0
96 8.01% Tamil Nadu UDAY Bond 2030 881.5
97 7.68% Tamil Nadu UDAY Bond 2031 750.0
98 7.78% Tamil Nadu UDAY Bond 2031 64.5
99 7.70% Tamil Nadu UDAY Bond 2031 40.0
100 7.75% Tamil Nadu UDAY Bond 2031 75.0
101 7.73% Tamil Nadu UDAY Bond 2031 50.0
102 7.77% Tamil Nadu UDAY Bond 2031 115.0
103 7.76% Tamil Nadu UDAY Bond 2031 25.0
104 7.74% Tamil Nadu UDAY Bond 2031 110.0
105 7.69% Tamil Nadu UDAY Bond 2031 25.0
106 7.71% Tamil Nadu UDAY Bond 2031 45.0
107 7.72% Tamil Nadu UDAY Bond 2031 100.5
108 8.05% Tamil Nadu UDAY Bond 2031 881.5
109 7.74% Tamil Nadu UDAY Bond 2032 110.0
110 7.76% Tamil Nadu UDAY Bond 2032 25.0
111 7.69% Tamil Nadu UDAY Bond 2032 25.0
112 7.75% Tamil Nadu UDAY Bond 2032 75.0
113 7.77% Tamil Nadu UDAY Bond 2032 115.0
114 7.78% Tamil Nadu UDAY Bond 2032 64.5
115 7.72% Tamil Nadu UDAY Bond 2032 100.5
116 7.70% Tamil Nadu UDAY Bond 2032 40.0
Sr.No.
Particulars Balance as at end-March 2019
117 7.68% Tamil Nadu UDAY Bond 2032 750.0
118 7.71% Tamil Nadu UDAY Bond 2032 45.0
119 7.73% Tamil Nadu UDAY Bond 2032 50.0
120 7.92% Tamil Nadu UDAY Bond 2032 881.5
Total [B] 22,815.0
Total [A+B] 2,74,056.8
Loans not bearing interest
1 9.75% Tamil Nadu SDL 1998 0.0
2 9.00% Tamil Nadu SDL 1999 0.1
3 8.75% Tamil Nadu SDL 2000 0.0
4 11.00% Tamil Nadu SDL 2001 0.1
5 11.00% Tamil Nadu 2002 0.0
6 13.50% Tamil Nadu SDL 2003 0.0
7 12.50% Tamil Nadu SDL 2004 0.0
8 14.00% Tamil Nadu SDL 2005 0.1
9 13.85% Tamil Nadu SDL 2006 0.0
10 13.05% Tamil Nadu Loan 2007 0.0
11 13.00% Tamil Nadu 2007 0.0
12 12.30% Tamil Nadu Loan 2007 0.1
13 12.15% Tamil Nadu SDL 2008 0.0
14 11.50% Tamil Nadu 2008 0.1
15 12.50% Tamil Nadu SDL 2008 0.0
16 11.50% Tamil Nadu 2009 0.0
17 11.50% Tamil Nadu 2010 0.1
18 12.00% Tamil Nadu SDL 2010 0.0
19 11.50% Tamil Nadu 2011 0.0
20 12.00% Tamil Nadu 2011 0.1
21 9.45% Tamil Nadu SDL 2011 0.1
22 6.65% Tamil Nadu GS 2019 -
23 7.00% Tamil Nadu GS 2019 -
24 7.26% Tamil Nadu GS 2019 -
25 7.45% Tamil Nadu GS 2019 -
26 7.65% Tamil Nadu GS 2019 -
27 8.48% Tamil Nadu GS 2019 -
28 8.24% Tamil Nadu GS 2019 -
Total [C] 0.9
Total [A+B+C] 2,74,057.8
TELANGANA
Loans bearing interest
1 9.06% Telangana SDL 2024 2,000.0
2 8.89% Telangana SDL 2024 800.0
3 8.46% Telangana SDL 2024 800.0
4 8.18% Telangana SDL 2024 1,000.0
5 8.16% Telangana SDL 2025 800.0
6 8.09% Telangana SDL 2025 800.0
7 8.08% Telangana SDL 2025 1,000.0
8 8.12% Telangana SDL 2025 1,000.0
9 8.10% Telangana SDL 2025 1,000.0
10 8.33% Telangana SDL 2025 1,348.2
11 8.28% Telangana SDL 2025 1,300.0
12 8.35% Telangana SDL 2025 1,500.0
13 8.31% Telangana SDL 2025 1,000.0
14 8.26% Telangana SDL 2025 800.0
15 8.24% Telangana SDL 2025 1,200.0
Statement 22: State Government Market Loans (Contd.)(` Crore)

Statements
161
Sr.No.
Particulars Balance as at end-March 2019
16 7.98% Telangana SDL 2025 1,201.8
17 8.18% Telangana SDL 2025 1,000.0
18 8.19% Telangana SDL 2025 500.0
19 8.27% Telangana SDL 2025 500.0
20 8.31% Telangana SDL 2026 1,000.0
21 8.52% Telangana SDL 2026 1,000.0
22 8.53% Telangana SDL 2026 500.0
23 8.00% Telangana SDL 2026 1,000.0
24 7.98% Telangana SDL 2026 1,500.0
25 8.02% Telangana SDL 2026 1,500.0
26 8.02% Telangana SDL 2026 500.0
27 7.97% Telangana SDL 2026 1,500.0
28 7.85% Telangana SDL 2026 1,000.0
29 7.69% Telangana SDL 2026 500.0
30 7.62% Telangana SDL 2026 1,500.0
31 7.39% Telangana SDL 2026 2,000.0
32 7.16% Telangana SDL 2026 1,500.0
33 7.40% Telangana SDL 2026 3,000.0
34 7.79% Telangana SDL 2027 1,000.0
35 7.15% Telangana SDL 2031 961.0
36 7.18% Telangana SDL 2032 1,500.0
37 7.65% Telangana SDL 2032 1,200.0
38 7.22% Telangana SDL 2032 2,000.0
39 7.32% Telangana SDL 2032 1,000.0
40 7.49% Telangana SDL 2032 1,100.0
41 7.79% Telangana SDL 2032 800.0
42 7.95% Telangana SDL 2037 1,000.0
43 7.66% Telangana SDL 2037 700.0
44 7.70% Telangana SDL 2037 4,000.0
45 7.58% Telangana SDL 2037 1,200.0
46 7.16% Telangana SDL 2037 1,800.0
47 7.24% Telangana SDL 2037 1,000.0
48 7.23% Telangana SDL 2037 1,000.0
49 7.52% Telangana SDL 2037 1,000.0
50 7.67% Telangana SDL 2037 1,000.0
51 7.70% Telangana SDL 2037 1,000.0
52 7.68% Telangana SDL 2037 1,200.0
53 7.83% Telangana SDL 2038 1,600.0
54 8.16% Telangana SDL 2038 1,200.0
55 8.22% Telangana SDL 2038 1,200.0
56 8.15% Telangana SDL 2038 2,000.0
57 8.22% Telangana SDL 2038 500.0
58 8.50% Telangana SDL 2038 1,250.0
59 8.51% Telangana SDL 2038 500.0
60 8.60% Telangana SDL 2038 1,000.0
61 8.48% Telangana SDL 2038 1,000.0
62 8.25% Telangana SDL 2039 2,000.0
63 8.52% Telangana SDL 2039 750.0
64 8.00% Telangana SDL 2043 600.0
65 8.24% Telangana SDL 2043 800.0
66 8.10% Telangana SDL 2043 1,100.0
67 7.75% Telangana SDL 2043 2,000.0
68 8.05% Telangana SDL 2043 2,000.0
69 8.28% Telangana SDL 2043 1,000.0
Sr.No.
Particulars Balance as at end-March 2019
70 8.42% Telangana SDL 2043 1,250.0
71 8.75% Telangana SDL 2043 1,968.0
72 8.56% Telangana SDL 2043 2,000.0
73 8.52% Telangana SDL 2043 1,000.0
74 8.52% Telangana SDL 2043 Nov 1,000.0
75 8.43% Telangana SDL 2043 1,500.0
76 8.33% Telangana SDL 2044 2,000.0
77 8.42% Telangana SDL 2044 1,000.0
78 8.38% Telangana SDL 2049 1,022.0
Total [A] 95,251.0
Special bonds
1 7.63% Telangana UDAY Bond 2023 699.0
2 7.95% Telangana UDAY Bond 2032 193.3
3 7.87% Telangana UDAY Bond 2024 699.0
4 7.94% Telangana UDAY Bond 2024 193.3
5 8.01% Telangana UDAY Bond 2025 699.0
6 8.05% Telangana UDAY Bond 2025 193.3
7 7.62% Telangana UDAY Bond 2026 699.0
8 7.71% Telangana UDAY Bond 2026 193.3
9 7.81% Telangana UDAY Bond 2027 699.0
10 7.93% Telangana UDAY Bond 2027 193.3
11 8.27% Telangana UDAY Bond 2028 699.0
12 8.27% Telangana UDAY Bond 2028 193.3
13 8.08% Telangana UDAY Bond 2029 699.0
14 8.07% Telangana UDAY Bond 2029 193.3
15 7.98% Telangana UDAY Bond 2030 699.0
16 8.04% Telangana UDAY Bond 2030 193.3
17 8.04% Telangana UDAY Bond 2031 699.0
18 8.08% Telangana UDAY Bond 2031 193.3
19 7.96% Telangana UDAY Bond 2032 699.0
20 7.70% Telangana UDAY Bond 2023 193.3
Total [B] 8,922.9
Total [A+B] 1,04,173.9
Compensation bonds
1 5.00% Urban Land Ceiling (Andhra Pradesh) Bonds 1976 0.0
Total [C] 0.0
Total [A+B+C] 1,04,174.0
Loans not bearing interest
1 7.50% Andhra Pradesh SDL 1997 -
2 9.75% Andhra Pradesh 1998 0.0
3 9.00% Andhra Pradesh 1999 0.0
4 11.00% Andhra Pradesh 2001 0.0
5 11.00% Andhra Pradesh 2002 0.0
6 12.50% Andhra Pradesh SDL 2004 0.0
7 14.00% Andhra Pradesh SDL 2005 0.0
8 13.00% Andhra Pradesh 2007 0.0
9 11.50% Andhra Pradesh SDL 2008 0.0
10 11.50% Andhra Pradesh SDL 2009 0.0
11 11.50% Andhra Pradesh SDL 2010 0.0
12 11.50% Andhra Pradesh 2011 0.0
13 12.00% Andhra Pradesh SDL 2011 0.0
14 5.80% Andhra Pradesh GS 2019 -
15 7.13% Andhra Pradesh GS 2019 -
16 7.45% Andhra Pradesh GS 2019 -
Statement 22: State Government Market Loans (Contd.)(` Crore)

State Finances : A Study of Budgets of 2019-20
162
Sr.No.
Particulars Balance as at end-March 2019
17 8.59% Andhra Pradesh GS 2019 -
18 8.09% Andhra Pradesh GS 2019 -
Total [D] 0.1
Total [A+B+C+D] 1,04,174.1
TRIPURA
Loans bearing interest
1 8.24% Tripura GS 2019 150.0
2 8.38% Tripura SDL 2029 200.0
3 8.49% Tripura GS 2020 100.0
4 8.10% Tripura GS 2020 100.0
5 8.39% Tripura GS 2021 120.0
6 8.40% Tripura GS 2021 65.0
7 8.65% Tripura GS 2021 100.0
8 8.60% Tripura GS 2021 50.0
9 8.60% Tripura GS 2022 50.0
10 9.42% Tripura GS 2022 100.0
11 8.90% Tripura GS 2022 125.0
12 8.94% Tripura GS 2022 90.0
13 8.90% Tripura SDL 2022 100.0
14 8.60% Tripura SDL 2023 250.0
15 8.55% Tripura SDL 2023 80.0
16 9.39% Tripura SDL 2024 200.0
17 9.50% Tripura SDL 2024 150.0
18 9.67% Tripura SDL 2024 150.0
19 9.48% Tripura SDL 2024 50.0
20 8.09% Tripura SDL 2025 150.0
21 8.32% Tripura SDL 2025 200.0
22 8.11% Tripura SDL 2025 300.0
23 8.65% Tripura SDL 2026 75.0
24 8.05% Tripura SDL 2026 250.0
25 7.57% Tripura SDL 2026 230.0
26 7.22% Tripura SDL 2026 240.0
27 7.22% Tripura SDL 2027 270.0
28 7.50% Tripura SDL 2027 400.0
29 7.27% Tripura SDL 2027 417.0
30 7.88% Tripura SDL 2028 320.0
31 8.20% Tripura SDL 2028 500.0
32 8.43% Tripura SDL 2028 200.0
33 8.82% Tripura SDL 2028 200.0
34 8.09% Tripura SDL 2028 242.8
35 8.27% Tripura SDL 2029 200.0
36 8.40% Tripura GS 2019 100.0
Total [A] 6,524.8
Loans not bearing interest
1 11.00% Tripura SDL 2002 0.0
2 7.77% Tripura GS 2019 -
Total [B] 0.0
Total [A+B] 6,524.8
UTTAR PRADESH
Loans bearing interest
1 7.53% Uttar Pradesh GS 2019 1,500.0
2 7.84% Uttar Pradesh GS 2019 500.0
3 7.97% Uttar Pradesh GS 2019 1,000.0
4 7.80% Uttar Pradesh GS 2019 500.0
Sr.No.
Particulars Balance as at end-March 2019
5 8.03% Uttar Pradesh GS 2019 1,500.0
6 8.32% Uttar Pradesh GS 2019 1,500.0
7 8.47% Uttar Pradesh GS 2019 1,500.0
8 8.26% Uttar Pradesh GS 2019 1,306.4
9 8.44% Uttar Pradesh GS 2019 1,500.0
10 8.39% Uttar Pradesh GS 2020 1,873.6
11 8.58% Uttar Pradesh GS 2020 1,197.0
12 8.55% Uttar Pradesh GS 2020 2,000.0
13 8.28% Uttar Pradesh GS 2020 1,000.0
14 8.10% Uttar Pradesh GS 2020 1,000.0
15 8.13% Uttar Pradesh GS 2020 800.0
16 8.19% Uttar Pradesh GS 2020 1,000.0
17 8.37% Uttar Pradesh GS 2020 1,200.0
18 8.41% Uttar Pradesh GS 2020 1,000.0
19 8.39% Uttar Pradesh GS 2020 1,000.0
20 8.55% Uttar Pradesh GS 2020 1,500.0
21 8.34% Uttar Pradesh GS 2020 1,000.0
22 8.56% Uttar Pradesh GS 2021 500.0
23 8.65% Uttar Pradesh GS 2021 1,500.0
24 8.66% Uttar Pradesh GS 2021 1,000.0
25 8.56% Uttar Pradesh GS 2021 1,000.0
26 8.69% Uttar Pradesh GS 2021 1,500.0
27 8.58% Uttar Pradesh GS 2021 512.5
28 8.61% Uttar Pradesh GS 2021 1,000.0
29 8.66% Uttar Pradesh GS 2021 1,000.0
30 8.90% Uttar Pradesh GS 2021 1,000.0
31 9.25% Uttar Pradesh GS 2021 1,487.5
32 9.25% Uttar Pradesh GS 2021 1,000.0
33 9.02% Uttar Pradesh GS 2021 1,000.0
34 8.80% Uttar Pradesh GS 2021 1,000.0
35 8.75% Uttar Pradesh GS 2022 1,000.0
36 8.76% Uttar Pradesh GS 2022 1,000.0
37 9.28% Uttar Pradesh GS 2022 830.0
38 9.17% Uttar Pradesh GS 2022 1,500.0
39 8.92% Uttar Pradesh GS 2022 1,500.0
40 8.88% Uttar Pradesh GS 2022 1,000.0
41 8.93% Uttar Pradesh GS 2022 1,000.0
42 8.93% Uttar Pradesh GS 2022 1,500.0
43 8.91% Uttar Pradesh GS 2022 1,000.0
44 8.88% Uttar Pradesh GS 2022 1,000.0
45 8.86% Uttar Pradesh GS 2022 1,000.0
46 8.11% Uttar Pradesh SDL 2023 1,000.0
47 7.60% Uttar Pradesh SDL 2023 1,000.0
48 7.63% Uttar Pradesh SDL 2023 1,000.0
49 7.78% Uttar Pradesh SDL 2023 1,000.0
50 9.33% Uttar Pradesh SDL 2023 1,250.0
51 9.40% Uttar Pradesh SDL 2023 750.0
52 9.52% Uttar Pradesh SDL 2023 500.0
53 9.39% Uttar Pradesh SDL 2024 500.0
54 9.67% Uttar Pradesh SDL 2024 1,000.0
55 9.66% Uttar Pradesh SDL 2024 1,000.0
56 9.40% Uttar Pradesh SDL 2024 1,000.0
57 9.24% Uttar Pradesh SDL 2024 1,000.0
58 8.87% Uttar Pradesh SDL 2024 1,000.0
Statement 22: State Government Market Loans (Contd.)(` Crore)

Statements
163
Sr.No.
Particulars Balance as at end-March 2019
59 8.73% Uttar Pradesh SDL 2024 1,000.0
60 8.46% Uttar Pradesh SDL 2024 1,250.0
61 8.45% Uttar Pradesh SDL 2024 1,250.0
62 8.18% Uttar Pradesh SDL 2024 1,750.0
63 8.26% Uttar Pradesh SDL 2024 1,750.0
64 8.10% Uttar Pradesh SDL 2025 2,000.0
65 8.08% Uttar Pradesh SDL 2025 1,500.0
66 8.08% Uttar Pradesh SDL 2025 2,500.0
67 8.05% Uttar Pradesh SDL 2025 500.0
68 8.08% Uttar Pradesh SDL 2025 2,000.0
69 8.09% Uttar Pradesh SDL 2025 2,000.0
70 8.27% Uttar Pradesh SDL 2025 2,000.0
71 8.20% Uttar Pradesh SDL 2025 2,000.0
72 8.31% Uttar Pradesh SDL 2025 2,000.0
73 8.26% Uttar Pradesh SDL 2025 500.0
74 8.29% Uttar Pradesh SDL 2025 500.0
75 8.23% Uttar Pradesh SDL 2025 1,000.0
76 8.17% Uttar Pradesh SDL 2025 1,000.0
77 7.98% Uttar Pradesh SDL 2025 1,500.0
78 7.99% Uttar Pradesh SDL 2025 1,500.0
79 8.15% Uttar Pradesh SDL 2025 1,000.0
80 8.17% Uttar Pradesh SDL 2025 1,000.0
81 8.23% Uttar Pradesh SDL 2025 1,500.0
82 8.34% Uttar Pradesh SDL 2026 2,000.0
83 8.39% Uttar Pradesh SDL 2026 2,000.0
84 8.53% Uttar Pradesh SDL 2026 2,500.0
85 8.83% Uttar Pradesh SDL 2026 2,500.0
86 8.58% Uttar Pradesh SDL 2026 1,500.0
87 8.02% Uttar Pradesh SDL 2026 2,400.0
88 8.03% Uttar Pradesh SDL 2026 3,000.0
89 8.02% Uttar Pradesh SDL 2026 1,500.0
90 8.08% Uttar Pradesh SDL 2026 1,000.0
91 7.99% Uttar Pradesh SDL 2026 1,000.0
92 7.86% Uttar Pradesh SDL 2026 2,000.0
93 7.69% Uttar Pradesh SDL 2026 1,000.0
94 7.63% Uttar Pradesh SDL 2026 2,000.0
95 7.58% Uttar Pradesh SDL 2026 2,000.0
96 7.39% Uttar Pradesh SDL 2026 2,250.0
97 7.19% Uttar Pradesh SDL 2026 2,250.0
98 7.16% Uttar Pradesh SDL 2026 2,400.0
99 7.24% Uttar Pradesh SDL 2026 1,600.0
100 7.41% Uttar Pradesh SDL 2026 2,000.0
101 6.85% Uttar Pradesh SDL 2026 2,000.0
102 6.87% Uttar Pradesh SDL 2026 1,350.0
103 7.17% Uttar Pradesh SDL 2027 2,000.0
104 7.20% Uttar Pradesh SDL 2027 2,000.0
105 7.62% Uttar Pradesh SDL 2027 2,500.0
106 7.78% Uttar Pradesh SDL 2027 1,500.0
107 7.87% Uttar Pradesh SDL 2027 1,650.0
108 7.64% Uttar Pradesh SDL 2027 1,650.0
109 7.67% Uttar Pradesh SDL 2027 2,000.0
110 7.61% Uttar Pradesh SDL 2027 2,000.0
111 7.61% Uttar Pradesh SDL 2027 2,000.0
112 7.52% Uttar Pradesh SDL 2027 1,000.0
Sr.No.
Particulars Balance as at end-March 2019
113 7.29% Uttar Pradesh SDL 2027 2,000.0
114 7.19% Uttar Pradesh SDL 2027 2,000.0
115 7.23% Uttar Pradesh SDL 2027 1,000.0
116 7.27% Uttar Pradesh SDL 2027 1,000.0
117 7.37% Uttar Pradesh SDL 2027 2,500.0
118 7.47% Uttar Pradesh SDL 2027 2,500.0
119 7.56% Uttar Pradesh SDL 2027 2,500.0
120 7.59% Uttar Pradesh SDL 2027 3,000.0
121 7.70% Uttar Pradesh SDL 2027 1,500.0
122 7.67% Uttar Pradesh SDL 2027 2,000.0
123 7.76% Uttar Pradesh SDL 2027 1,000.0
124 7.85% Uttar Pradesh SDL 2027 2,800.0
125 7.92% Uttar Pradesh SDL 2028 3,000.0
126 8.34% Uttar Pradesh SDL 2028 3,000.0
127 8.43% Uttar Pradesh SDL 2028 1,400.0
128 8.27% Uttar Pradesh SDL 2028 1,400.0
129 8.14% Uttar Pradesh SDL 2028 2,000.0
130 7.98% Uttar Pradesh SDL 2028 2,500.0
131 8.39% Uttar Pradesh SDL 2028 2,500.0
132 8.45% Uttar Pradesh SDL 2028 3,000.0
133 8.73% Uttar Pradesh SDL 2028 3,000.0
134 8.71% Uttar Pradesh SDL 2028 2,000.0
135 8.73% Uttar Pradesh SDL 2028 Oct 2,000.0
136 8.66% Uttar Pradesh SDL 2028 1,500.0
137 8.60% Uttar Pradesh SDL 2028 2,000.0
138 8.19% Uttar Pradesh SDL 2028 1,500.0
139 8.08% Uttar Pradesh SDL 2028 3,000.0
140 8.29% Uttar Pradesh SDL 2029 2,000.0
141 8.22% Uttar Pradesh SDL 2029 3,000.0
142 8.18% Uttar Pradesh SDL 2029 3,000.0
143 8.34% Uttar Pradesh SDL 2029 3,000.0
144 8.32% Uttar Pradesh SDL 2029 3,000.0
145 8.45% Uttar Pradesh SDL 2029 3,000.0
146 8.43% Uttar Pradesh SDL 2029 3,000.0
147 8.39% Uttar Pradesh SDL 2029 3,000.0
Total [A] 2,35,356.9
Special bonds
1 8.66% Uttar Pradesh Special Bond 2019 448.7
2 8.31% Uttar Pradesh Special Bond 2019 451.2
3 8.32% Uttar Pradesh Special Bond 2019 75.8
4 8.67% Uttar Pradesh Special Bond 2019 78.3
5 8.40% Uttar Pradesh UDAY Bond 2020 306.4
6 8.32% Uttar Pradesh UDAY Bond 2020 1,312.3
7 8.25% Uttar Pradesh UDAY Bond 2020 409.0
8 8.03% Uttar Pradesh UDAY Bond 2020 1,233.4
9 8.70% Uttar Pradesh Special Bond 2020 448.7
10 8.44% Uttar Pradesh SPL 2020 451.2
11 8.44% Uttar Pradesh SPL 2020 Oct 75.8
12 8.71% Uttar Pradesh Special Bond 2020 78.3
13 8.56% Uttar Pradesh UDAY Bond 2021 306.4
14 8.51% Uttar Pradesh UDAY Bond 2021 1,312.3
15 8.43% Uttar Pradesh UDAY Bond 2021 409.0
16 8.15% Uttar Pradesh UDAY Bond 2021 1,233.4
17 8.72% Uttar Pradesh Special Bond 2021 448.7
Statement 22: State Government Market Loans (Contd.)(` Crore)
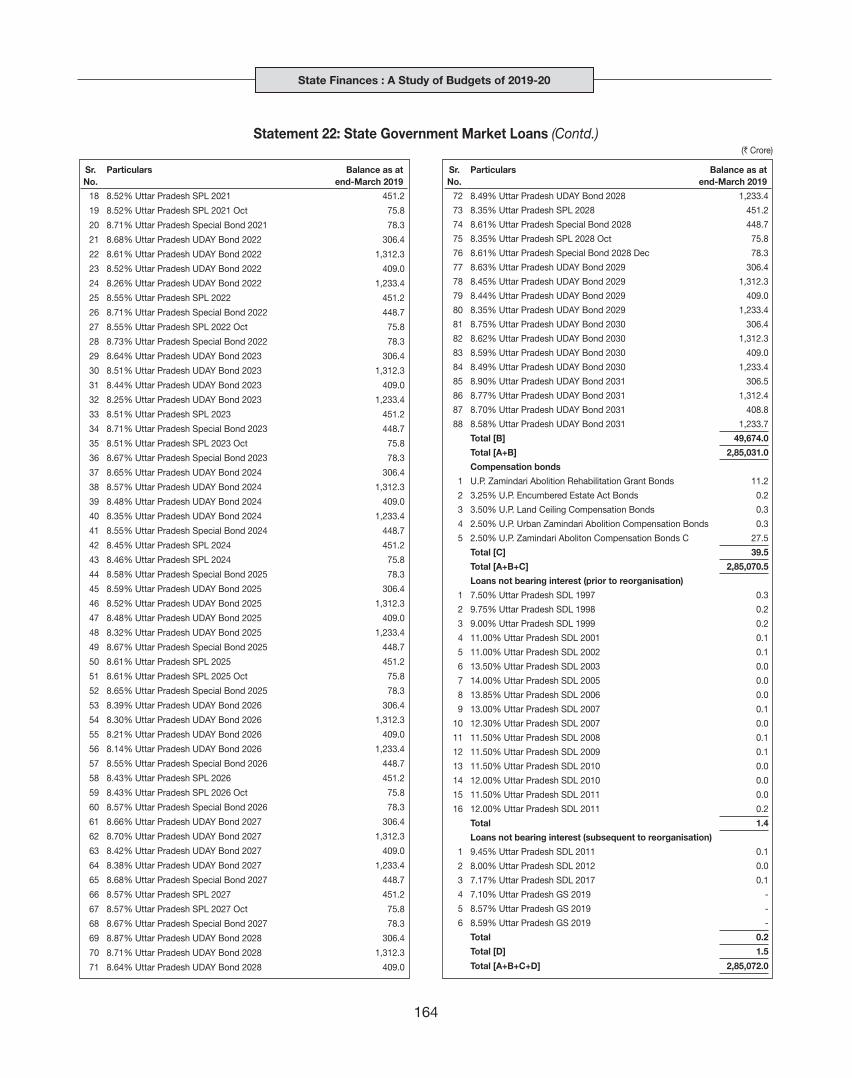
State Finances : A Study of Budgets of 2019-20
164
Sr.No.
Particulars Balance as at end-March 2019
18 8.52% Uttar Pradesh SPL 2021 451.2
19 8.52% Uttar Pradesh SPL 2021 Oct 75.8
20 8.71% Uttar Pradesh Special Bond 2021 78.3
21 8.68% Uttar Pradesh UDAY Bond 2022 306.4
22 8.61% Uttar Pradesh UDAY Bond 2022 1,312.3
23 8.52% Uttar Pradesh UDAY Bond 2022 409.0
24 8.26% Uttar Pradesh UDAY Bond 2022 1,233.4
25 8.55% Uttar Pradesh SPL 2022 451.2
26 8.71% Uttar Pradesh Special Bond 2022 448.7
27 8.55% Uttar Pradesh SPL 2022 Oct 75.8
28 8.73% Uttar Pradesh Special Bond 2022 78.3
29 8.64% Uttar Pradesh UDAY Bond 2023 306.4
30 8.51% Uttar Pradesh UDAY Bond 2023 1,312.3
31 8.44% Uttar Pradesh UDAY Bond 2023 409.0
32 8.25% Uttar Pradesh UDAY Bond 2023 1,233.4
33 8.51% Uttar Pradesh SPL 2023 451.2
34 8.71% Uttar Pradesh Special Bond 2023 448.7
35 8.51% Uttar Pradesh SPL 2023 Oct 75.8
36 8.67% Uttar Pradesh Special Bond 2023 78.3
37 8.65% Uttar Pradesh UDAY Bond 2024 306.4
38 8.57% Uttar Pradesh UDAY Bond 2024 1,312.3
39 8.48% Uttar Pradesh UDAY Bond 2024 409.0
40 8.35% Uttar Pradesh UDAY Bond 2024 1,233.4
41 8.55% Uttar Pradesh Special Bond 2024 448.7
42 8.45% Uttar Pradesh SPL 2024 451.2
43 8.46% Uttar Pradesh SPL 2024 75.8
44 8.58% Uttar Pradesh Special Bond 2025 78.3
45 8.59% Uttar Pradesh UDAY Bond 2025 306.4
46 8.52% Uttar Pradesh UDAY Bond 2025 1,312.3
47 8.48% Uttar Pradesh UDAY Bond 2025 409.0
48 8.32% Uttar Pradesh UDAY Bond 2025 1,233.4
49 8.67% Uttar Pradesh Special Bond 2025 448.7
50 8.61% Uttar Pradesh SPL 2025 451.2
51 8.61% Uttar Pradesh SPL 2025 Oct 75.8
52 8.65% Uttar Pradesh Special Bond 2025 78.3
53 8.39% Uttar Pradesh UDAY Bond 2026 306.4
54 8.30% Uttar Pradesh UDAY Bond 2026 1,312.3
55 8.21% Uttar Pradesh UDAY Bond 2026 409.0
56 8.14% Uttar Pradesh UDAY Bond 2026 1,233.4
57 8.55% Uttar Pradesh Special Bond 2026 448.7
58 8.43% Uttar Pradesh SPL 2026 451.2
59 8.43% Uttar Pradesh SPL 2026 Oct 75.8
60 8.57% Uttar Pradesh Special Bond 2026 78.3
61 8.66% Uttar Pradesh UDAY Bond 2027 306.4
62 8.70% Uttar Pradesh UDAY Bond 2027 1,312.3
63 8.42% Uttar Pradesh UDAY Bond 2027 409.0
64 8.38% Uttar Pradesh UDAY Bond 2027 1,233.4
65 8.68% Uttar Pradesh Special Bond 2027 448.7
66 8.57% Uttar Pradesh SPL 2027 451.2
67 8.57% Uttar Pradesh SPL 2027 Oct 75.8
68 8.67% Uttar Pradesh Special Bond 2027 78.3
69 8.87% Uttar Pradesh UDAY Bond 2028 306.4
70 8.71% Uttar Pradesh UDAY Bond 2028 1,312.3
71 8.64% Uttar Pradesh UDAY Bond 2028 409.0
Sr.No.
Particulars Balance as at end-March 2019
72 8.49% Uttar Pradesh UDAY Bond 2028 1,233.4
73 8.35% Uttar Pradesh SPL 2028 451.2
74 8.61% Uttar Pradesh Special Bond 2028 448.7
75 8.35% Uttar Pradesh SPL 2028 Oct 75.8
76 8.61% Uttar Pradesh Special Bond 2028 Dec 78.3
77 8.63% Uttar Pradesh UDAY Bond 2029 306.4
78 8.45% Uttar Pradesh UDAY Bond 2029 1,312.3
79 8.44% Uttar Pradesh UDAY Bond 2029 409.0
80 8.35% Uttar Pradesh UDAY Bond 2029 1,233.4
81 8.75% Uttar Pradesh UDAY Bond 2030 306.4
82 8.62% Uttar Pradesh UDAY Bond 2030 1,312.3
83 8.59% Uttar Pradesh UDAY Bond 2030 409.0
84 8.49% Uttar Pradesh UDAY Bond 2030 1,233.4
85 8.90% Uttar Pradesh UDAY Bond 2031 306.5
86 8.77% Uttar Pradesh UDAY Bond 2031 1,312.4
87 8.70% Uttar Pradesh UDAY Bond 2031 408.8
88 8.58% Uttar Pradesh UDAY Bond 2031 1,233.7
Total [B] 49,674.0
Total [A+B] 2,85,031.0
Compensation bonds
1 U.P. Zamindari Abolition Rehabilitation Grant Bonds 11.2
2 3.25% U.P. Encumbered Estate Act Bonds 0.2
3 3.50% U.P. Land Ceiling Compensation Bonds 0.3
4 2.50% U.P. Urban Zamindari Abolition Compensation Bonds 0.3
5 2.50% U.P. Zamindari Aboliton Compensation Bonds C 27.5
Total [C] 39.5
Total [A+B+C] 2,85,070.5
Loans not bearing interest (prior to reorganisation)
1 7.50% Uttar Pradesh SDL 1997 0.3
2 9.75% Uttar Pradesh SDL 1998 0.2
3 9.00% Uttar Pradesh SDL 1999 0.2
4 11.00% Uttar Pradesh SDL 2001 0.1
5 11.00% Uttar Pradesh SDL 2002 0.1
6 13.50% Uttar Pradesh SDL 2003 0.0
7 14.00% Uttar Pradesh SDL 2005 0.0
8 13.85% Uttar Pradesh SDL 2006 0.0
9 13.00% Uttar Pradesh SDL 2007 0.1
10 12.30% Uttar Pradesh SDL 2007 0.0
11 11.50% Uttar Pradesh SDL 2008 0.1
12 11.50% Uttar Pradesh SDL 2009 0.1
13 11.50% Uttar Pradesh SDL 2010 0.0
14 12.00% Uttar Pradesh SDL 2010 0.0
15 11.50% Uttar Pradesh SDL 2011 0.0
16 12.00% Uttar Pradesh SDL 2011 0.2
Total 1.4
Loans not bearing interest (subsequent to reorganisation)
1 9.45% Uttar Pradesh SDL 2011 0.1
2 8.00% Uttar Pradesh SDL 2012 0.0
3 7.17% Uttar Pradesh SDL 2017 0.1
4 7.10% Uttar Pradesh GS 2019 -
5 8.57% Uttar Pradesh GS 2019 -
6 8.59% Uttar Pradesh GS 2019 -
Total 0.2
Total [D] 1.5
Total [A+B+C+D] 2,85,072.0
Statement 22: State Government Market Loans (Contd.)(` Crore)

Statements
165
Sr.No.
Particulars Balance as at end-March 2019
UTTARAKHAND
Loans bearing interest
1 8.42% Uttarakhand SDL 2028 250.0
2 8.49% Uttarakhand SDL 2028 200.0
3 8.61% Uttarakhand SDL 2028 300.0
4 8.74% Uttarakhand SDL 2028 250.0
5 8.76% Uttarakhand SDL 2028 300.0
6 8.70% Uttarakhand SDL 2028 250.0
7 8.56% Uttarakhand SDL 2028 250.0
8 8.55% Uttarakhand SDL 2028 300.0
9 8.38% Uttarakhand SDL 2028 300.0
10 8.19% Uttarakhand SDL 2028 300.0
11 8.23% Uttarakhand SDL 2029 200.0
12 8.32% Uttarakhand SDL 2029 200.0
13 8.41% Uttarakhand SDL 2029 250.0
14 8.08% Uttarakhand SDL 2029 300.0
15 7.77% Uttarakhand GS 2019 300.0
16 7.80% Uttarakhand GS 2019 300.0
17 8.58% Uttarakhand GS 2020 500.0
18 8.12% Uttarakhand GS 2020 200.0
19 8.55% Uttarakhand GS 2021 291.5
20 8.39% Uttarakhand GS 2021 500.0
21 8.65% Uttarakhand GS 2021 200.0
22 8.62% Uttarakhand GS 2021 150.0
23 9.05% Uttarakhand GS 2021 150.0
24 8.62% Uttarakhand GS 2022 100.0
25 9.02% Uttarakhand GS 2022 300.0
26 8.93% Uttarakhand SDL 2022 150.0
27 9.01% Uttarakhand SDL 2022 500.0
28 8.67% Uttarakhand SDL 2023 1,100.0
29 9.40% Uttarakhand SDL 2024 500.0
30 9.84% Uttarakhand SDL 2024 1,000.0
31 9.70% Uttarakhand SDL 2024 1,000.0
32 8.25% Uttarakhand SDL 2024 1,000.0
33 8.09% Uttarakhand SDL 2025 650.0
34 8.08% Uttarakhand SDL 2025 500.0
35 8.05% Uttarakhand SDL 2025 250.0
36 8.28% Uttarakhand SDL 2025 750.0
37 8.29% Uttarakhand SDL 2025 500.0
38 8.16% Uttarakhand SDL 2025 500.0
39 7.98% Uttarakhand SDL 2025 250.0
40 8.19% Uttarakhand SDL 2025 400.0
41 8.19% Uttarakhand SDL 2025 200.0
42 8.40% Uttarakhand SDL 2026 300.0
43 8.65% Uttarakhand SDL 2026 500.0
44 8.53% Uttarakhand SDL 2026 500.0
45 7.98% Uttarakhand SDL 2026 290.0
46 8.06% Uttarakhand SDL 2026 500.0
47 7.39% Uttarakhand SDL 2026 1,000.0
48 7.18% Uttarakhand SDL 2026 250.0
49 7.18% Uttarakhand SDL 2026 500.0
50 7.25% Uttarakhand SDL 2026 500.0
51 7.42% Uttarakhand SDL 2026 1,000.0
52 6.97% Uttarakhand SDL 2026 260.0
Sr.No.
Particulars Balance as at end-March 2019
53 7.18% Uttarakhand SDL 2027 400.0
54 7.93% Uttarakhand SDL 2027 750.0
55 7.59% Uttarakhand SDL 2027 200.0
56 7.21% Uttarakhand SDL 2027 500.0
57 7.22% Uttarakhand SDL 2027 300.0
58 7.29% Uttarakhand SDL 2027 300.0
59 7.35% Uttarakhand SDL 2027 400.0
60 7.40% Uttarakhand SDL 2027 500.0
61 7.54% Uttarakhand SDL 2027 500.0
62 7.59% Uttarakhand SDL 2027 500.0
63 7.65% Uttarakhand SDL 2027 300.0
64 7.67% Uttarakhand SDL 2027 300.0
65 7.67% Uttarakhand SDL 2027 300.0
66 7.77% Uttarakhand SDL 2027 200.0
67 8.08% Uttarakhand SDL 2028 200.0
68 8.20% Uttarakhand SDL 2028 300.0
69 8.05% Uttarakhand SDL 2028 500.0
70 8.25% Uttarakhand SDL 2028 400.0
71 8.42% Uttarakhand SDL 2028 400.0
72 8.29% Uttarakhand SDL 2028 200.0
73 8.14% Uttarakhand SDL 2028 360.0
74 7.80% Uttarakhand SDL 2028 500.0
75 8.20% Uttarakhand SDL 2028 300.0
76 8.29% Uttarakhand SDL 2028 300.0
77 8.39% Uttarakhand SDL 2028 300.0
78 8.40% Uttarakhand SDL 2028 200.0
79 8.53% Uttarakhand SDL 2028 300.0
80 8.58% Uttarakhand SDL 2028 500.0
81 8.46% Uttarakhand SDL 2028 250.0
Total [A] 31,951.5
Compensation bonds
1 U.P. Zamindari Abolition Rehabilitation Grant Bonds 0.6
2 3.25% U.P. Encumbered Estate Act Bonds 0.0
3 3.50% U.P. Land Ceiling Compensation Bonds 0.0
4 2.50% U.P. Urban Zamindari Abolition Compensation Bonds 0.0
5 2.50% U.P. Zamindari Aboliton Compensation Bonds C 1.5
Total [B] 2.1
Total [A+B] 31,953.6
Loans not bearing interest (prior to reorganisation)
1 7.50% Uttar Pradesh SDL 1997 0.0
2 9.75% Uttar Pradesh SDL 1998 0.0
3 9.00% Uttar Pradesh SDL 1999 0.0
4 11.00% Uttar Pradesh SDL 2001 0.0
5 11.00% Uttar Pradesh SDL 2002 0.0
6 13.50% Uttar Pradesh SDL 2003 0.0
7 14.00% Uttar Pradesh SDL 2005 0.0
8 13.85% Uttar Pradesh SDL 2006 0.0
9 13.00% Uttar Pradesh SDL 2007 0.0
10 12.30% Uttar Pradesh SDL 2007 0.0
11 11.50% Uttar Pradesh SDL 2008 0.0
12 11.50% Uttar Pradesh SDL 2009 0.0
13 11.50% Uttar Pradesh SDL 2010 0.0
14 12.00% Uttar Pradesh SDL 2010 0.0
15 11.50% Uttar Pradesh SDL 2011 0.0
Statement 22: State Government Market Loans (Contd.)(` Crore)

State Finances : A Study of Budgets of 2019-20
166
Sr.No.
Particulars Balance as at end-March 2019
16 12.00% Uttar Pradesh SDL 2011 0.0
Total [C] 0.1
Total [A+B+C] 31,953.7
Loans not bearing interest (subsequent to reorganisation)
1 7.45% Uttarakhand SDL 2019 -
2 8.55% Uttarakhand SDL 2019 -
Total [D] -
Total [A+B+C+D] 31,953.7
WEST BENGAL
Loans bearing interest
1 7.55% West Bengal GS 2019 2,000.0
2 7.10% West Bengal GS 2019 2,500.0
3 7.50% West Bengal GS 2019 1,500.0
4 7.96% West Bengal GS 2019 2,000.0
5 8.02% West Bengal GS 2019 2,000.0
6 8.31% West Bengal GS 2019 1,500.0
7 7.70% West Bengal GS 2019 (PUT-2013) 386.0
8 7.65% West Bengal GS 2019 (PUT-2013) 10.0
9 7.68% West Bengal GS 2014 82.9
10 8.10% West Bengal GS 2019 2,330.9
11 8.42% West Bengal GS 2019 1,000.0
12 8.57% West Bengal GS 2020 800.0
13 8.58% West Bengal GS 2020 2,000.0
14 8.51% West Bengal GS 2020 500.0
15 8.28% West Bengal GS 2020 1,500.0
16 8.11% West Bengal GS 2020 1,000.0
17 8.17% West Bengal GS 2020 1,000.0
18 8.44% West Bengal GS 2020 500.0
19 8.39% West Bengal GS 2020 498.1
20 8.38% West Bengal GS 2020 1,002.0
21 8.39% West Bengal GS 2020 500.0
22 8.51% West Bengal GS 2020 500.0
23 8.42% West Bengal GS 2020 500.0
24 8.36% West Bengal GS 2021 1,400.0
25 8.44% West Bengal GS 2021 1,773.0
26 8.60% West Bengal GS 2021 2,000.0
27 8.60% West Bengal GS 2021 3,000.0
28 8.65% West Bengal GS 2021 1,000.0
29 8.61% West Bengal GS 2021 1,000.0
30 8.55% West Bengal GS 2021 1,000.0
31 8.64% West Bengal GS 2021 1,000.0
32 8.65% West Bengal GS 2021 1,500.0
33 9.08% West Bengal GS 2021 1,500.0
34 9.28% West Bengal GS 2021 1,000.0
35 9.04% West Bengal GS 2021 1,250.0
36 8.81% West Bengal GS 2021 1,300.0
37 8.75% West Bengal GS 2022 800.0
38 8.66% West Bengal GS 2022 1,000.0
39 8.80% West Bengal GS 2022 1,000.0
40 9.36% West Bengal GS 2022 667.6
41 9.31% West Bengal GS 2022 2,500.0
42 9.23% West Bengal GS 2022 1,000.0
43 9.22% West Bengal GS 2022 1,500.0
44 8.95% West Bengal GS 2022 500.0
Sr.No.
Particulars Balance as at end-March 2019
45 8.91% West Bengal GS 2022 1,500.0
46 8.96% West Bengal GS 2022 1,500.0
47 8.92% West Bengal GS 2022 1,500.0
48 8.90% West Bengal GS 2022 2,000.0
49 8.89% West Bengal SDL 2022 500.0
50 9.01% West Bengal GS 2022 2,000.0
51 9.03% West Bengal SDL 2022 2,000.0
52 8.64% West Bengal SDL 2023 800.0
53 8.60% West Bengal SDL 2023 500.0
54 8.66% West Bengal SDL 2023 1,200.0
55 8.66% West Bengal SDL 2023 1,500.0
56 8.26% West Bengal SDL 2023 1,000.0
57 7.63% West Bengal SDL 2023 1,000.0
58 7.82% West Bengal SDL 2023 2,000.0
59 7.98% West Bengal SDL 2023 1,000.0
60 9.48% West Bengal SDL 2023 1,000.0
61 9.72% West Bengal SDL 2023 1,000.0
62 7.82% West Bengal SDL 2032 3,000.0
63 8.79% West Bengal SDL 2033 1,500.0
64 8.73% West Bengal SDL 2033 2,000.0
65 8.72% West Bengal SDL 2033 2,000.0
66 8.42% West Bengal SDL 2033 4,000.0
67 8.24% West Bengal SDL 2033 1,983.0
68 8.25% West Bengal SDL 2034 3,500.0
69 8.36% West Bengal SDL 2034 1,545.0
70 8.47% West Bengal SDL 2034 2,000.0
71 8.19% West Bengal SDL 2034 2,000.0
72 7.53% West Bengal SDL 2037 2,000.0
73 7.67% West Bengal SDL 2037 1,000.0
74 8.57% West Bengal SDL 2038 2,000.0
75 8.43% West Bengal SDL 2038 2,500.0
76 8.41% West Bengal SDL 2039 2,000.0
77 9.84% West Bengal SDL 2023 933.6
78 9.94% West Bengal SDL 2023 1,500.0
79 9.35% West Bengal SDL 2023 1,000.0
80 9.35% West Bengal SDL 2023 566.4
81 9.42% West Bengal SDL 2023 1,500.0
82 9.42% West Bengal SDL 2023 1,000.0
83 9.37% West Bengal SDL 2023 500.0
84 9.54% West Bengal SDL 2023 1,000.0
85 9.40% West Bengal SDL 2024 800.0
86 9.26% West Bengal SDL 2024 1,200.0
87 9.42% West Bengal SDL 2024 1,000.0
88 9.72% West Bengal SDL 2024 1,000.0
89 9.85% West Bengal SDL 2024 1,000.0
90 9.70% West Bengal SDL 2024 1,000.0
91 9.40% West Bengal SDL 2024 1,800.0
92 9.23% West Bengal SDL 2024 800.0
93 9.15% West Bengal SDL 2024 1,000.0
94 9.00% West Bengal SDL 2024 1,000.0
95 8.98% West Bengal SDL 2024 1,500.0
96 9.10% West Bengal SDL 2024 1,500.0
97 8.99% West Bengal SDL 2024 2,000.0
98 8.74% West Bengal SDL 2024 1,500.0
Statement 22: State Government Market Loans (Contd.)(` Crore)

Statements
167
Sr.No.
Particulars Balance as at end-March 2019
99 8.44% West Bengal SDL 2024 1,000.0
100 8.45% West Bengal SDL 2024 1,000.0
101 8.17% West Bengal SDL 2024 1,000.0
102 8.27% West Bengal SDL 2024 1,000.0
103 8.10% West Bengal SDL 2025 3,000.0
104 8.08% West Bengal SDL 2025 2,500.0
105 8.10% West Bengal SDL 2025 1,300.0
106 8.08% West Bengal SDL 2025 1,000.0
107 8.17% West Bengal SDL 2025 1,500.0
108 8.21% West Bengal SDL 2025 1,500.0
109 8.31% West Bengal SDL 2025 1,500.0
110 8.30% West Bengal SDL 2025 1,500.0
111 8.17% West Bengal SDL 2025 1,500.0
112 7.97% West Bengal SDL 2025 1,000.0
113 8.15% West Bengal SDL 2025 1,500.0
114 8.18% West Bengal SDL 2025 1,200.0
115 8.22% West Bengal SDL 2025 1,000.0
116 8.27% West Bengal SDL 2025 1,300.0
117 8.31% West Bengal SDL 2026 1,000.0
118 8.40% West Bengal SDL 2026 1,500.0
119 8.51% West Bengal SDL 2026 1,000.0
120 8.88% West Bengal SDL 2026 2,500.0
121 8.57% West Bengal SDL 2026 1,000.0
122 8.10% West Bengal SDL 2026 2,500.0
123 8.09% West Bengal SDL 2026 2,000.0
124 7.86% West Bengal SDL 2026 1,500.0
125 7.69% West Bengal SDL 2026 1,000.0
126 7.63% West Bengal SDL 2026 1,000.0
127 7.58% West Bengal SDL 2026 500.0
128 7.19% West Bengal SDL 2026 2,000.0
129 7.16% West Bengal SDL 2026 1,500.0
130 7.25% West Bengal SDL 2026 1,500.0
131 7.42% West Bengal SDL 2026 1,500.0
132 6.88% West Bengal SDL 2026 700.0
133 7.10% West Bengal SDL 2026 2,000.0
134 7.29% West Bengal SDL 2026 2,000.0
135 7.16% West Bengal SDL 2027 2,300.0
136 7.21% West Bengal SDL 2027 2,500.0
137 7.63% West Bengal SDL 2027 2,500.0
138 7.78% West Bengal SDL 2027 3,000.0
139 7.92% West Bengal SDL 2027 5,000.0
140 7.64% West Bengal SDL 2027 1,930.5
141 7.28% West Bengal SDL 2027 2,000.0
142 7.28% West Bengal SDL 2027 1,000.0
143 7.20% West Bengal SDL 2027 1,000.0
144 7.25% West Bengal SDL 2027 2,000.0
145 7.66% West Bengal SDL 2027 1,500.0
146 7.53% West Bengal SDL 2027 2,000.0
147 7.68% West Bengal SDL 2027 2,000.0
148 7.72% West Bengal SDL 2027 3,000.0
Sr.No.
Particulars Balance as at end-March 2019
149 7.77% West Bengal SDL 2028 2,000.0
150 8.09% West Bengal SDL 2028 2,000.0
151 8.29% West Bengal SDL 2028 2,000.0
152 8.42% West Bengal SDL 2028 2,000.0
153 8.27% West Bengal SDL 2028 2,000.0
154 8.09% West Bengal SDL 2028 911.0
155 8.44% West Bengal SDL 2028 2,000.0
156 8.40% West Bengal SDL 2028 1,000.0
157 8.45% West Bengal SDL 2028 2,000.0
158 8.21% West Bengal SDL 2029 2,500.0
159 8.35% West Bengal SDL 2029 1,500.0
160 8.44% West Bengal SDL 2029 2,000.0
161 8.39% West Bengal SDL 2029 2,500.0
162 8.10% West Bengal SDL 2029 2,300.0
163 7.49% West Bengal SDL 2032 3,000.0
164 7.73% West Bengal SDL 2032 1,000.0
165 7.62% West Bengal SDL 2032 1,500.0
Total [A] 2,49,369.9
Compensation bonds
1 West Bengal Estate Acquisition Compensation Bonds 2.2
2 5.00% Urban Land Ceiling (West Bengal) Bonds 1976 0.0
Total [B] 2.3
Total [A+B] 2,49,372.2
Loans not bearing interest
1 9.75% West Bengal SDL 1998 0.2
2 9.00% West Bengal SDL 1999 0.2
3 8.75% West Bengal SDL 2000 0.2
4 11.00% West Bengal SDL 2001 0.3
5 11.00% West Bengal 2002 0.2
6 13.50% West Bengal SDL 2003 0.0
7 12.50% West Bengal SDL 2004 0.1
8 14.00% West Bengal SDL 2005 0.1
9 13.75% West Bengal SDL 2007 0.0
10 13.05% West Bengal SDL 2007 0.0
11 13.00% West Bengal SDL 2007 0.0
12 11.50% West Bengal SDL 2008 0.1
13 12.25% West Bengal SDL 2009 0.0
14 11.50% West Bengal SDL 2009 0.1
15 11.50% West Bengal SDL 2010 0.0
16 10.35% West Bengal SDL 2011 0.0
17 11.50% West Bengal SDL 2011 0.0
18 12.00% West Bengal SDL 2011 0.0
19 9.45% West Bengal SDL 2011 0.1
20 6.35% West Bengal SDL 2013 (II SER) 0.0
21 7.27% West Bengal GS 2019 -
22 8.43% West Bengal GS 2019 -
23 8.25% West Bengal GS 2019 -
Total [C] 1.7
Total [A+B+C] 2,49,373.9
Statement 22: State Government Market Loans (Concld.)(` Crore)
Note: SDL of Rs. 38,468.46 crore under Andhra Pradesh reflects transfer to Telangana due to bifurcation of the state of Andhra Pradesh.

State Finances : A Study of Budgets of 2019-20
168
Sta
tem
ent
23: M
atur
ity
Pro
file
of
Out
stan
din
g S
tate
Go
vern
men
t S
ecur
itie
s (O
utst
and
ing
as o
n M
arch
31,
201
9)(`
Cro
re)
Stat
e/U
T20
19-
2020
2020
-20
2120
21-
2022
2022
-20
2320
23-
2024
2024
-20
2520
25-
2026
2026
-20
2720
27-
2028
2028
- 20
2920
29-
2030
2030
-20
3120
31-
2032
2032
-20
3320
33-
2034
2035
-20
3620
36-
2049
TOTA
L
12
34
56
78
910
1112
1314
1516
1718
19
1.
And
hra
Pra
desh
15,3
83.1
15,4
00.0
16,8
00.0
20,0
00.0
22,4
11.6
18,0
00.0
18,0
50.0
16,1
09.4
11,2
29.3
12,3
45.8
8,42
9.8
6,97
2.5
6,02
9.3
7,50
0.0
5,03
9.8
500.
03,
400.
02,
03,6
00.8
2.
Aru
nach
al P
rade
sh79
.1-
33.0
170.
023
0.0
306.
013
0.0
453.
088
7.5
719.
0-
--
--
--
3,00
7.6
3.A
ssam
1,90
9.8
800.
02,
000.
099
5.0
1,50
0.0
2,95
0.0
3,15
0.0
3,09
0.0
7,76
0.0
6,40
0.0
--
--
--
-30
,554
.8
4.B
ihar
3,00
0.0
2,60
0.0
4,15
5.5
7,33
3.2
6,73
3.2
8,33
3.2
11,7
33.2
17,9
33.2
10,2
33.2
14,5
33.2
233.
223
3.2
77.7
--
--
87,1
31.8
5.C
hhat
tisga
rh70
0.0
2,50
0.0
3,08
7.0
4,28
7.0
5,08
7.0
6,28
7.0
5,63
7.0
4,28
7.0
8,18
7.0
87.0
87.0
87.0
--
--
-40
,320
.1
6.G
oa60
0.0
300.
055
0.0
850.
099
0.0
800.
01,
450.
01,
320.
01,
800.
02,
350.
0-
--
--
--
11,0
10.0
7.G
ujar
at10
,300
.011
,500
.017
,500
.014
,700
.014
,552
.614
,920
.014
,260
.019
,120
.024
,000
.036
,470
.7-
2,00
0.0
--
--
-1,
79,3
23.2
8.H
arya
na4,
000.
04,
450.
09,
816.
714
,520
.017
,136
.216
,790
.019
,290
.017
,530
.016
,639
.57,
525.
0-
--
-2,
000.
074
0.0
10,5
00.0
1,40
,937
.3
9.
Him
acha
l Pra
desh
2,12
0.0
2,24
5.0
2,12
5.0
1,85
9.1
2,21
6.2
2,63
4.1
2,43
9.1
3,68
9.1
3,38
9.1
2,28
9.1
289.
128
9.1
289.
170
0.0
--
-26
,572
.6
10.
Jam
mu
and
Kas
hmir
1,10
8.9
3,30
8.5
3,18
9.0
2,50
3.8
2,43
3.8
1,75
3.8
2,60
3.8
3,14
3.8
6,55
3.8
7,03
7.8
353.
835
3.8
139.
8-
--
-34
,484
.0
11.
Jhar
khan
d1,
844.
050
0.0
1,80
9.4
4,15
5.3
3,50
5.3
5,50
5.3
5,90
5.3
5,70
9.3
1,55
5.3
6,06
4.3
555.
355
5.3
-4,
999.
7-
--
42,6
64.1
12.
Kar
nata
ka6,
000.
07,
100.
07,
500.
010
,000
.014
,997
.318
,500
.020
,187
.528
,007
.022
,098
.019
,500
.0-
2,00
0.0
--
2,00
0.0
--
1,57
,889
.8
13.
Ker
ala
5,45
6.0
5,50
0.0
8,88
0.0
11,5
83.0
12,8
00.0
13,2
00.0
15,0
00.0
17,3
00.0
11,0
00.0
13,5
00.0
-3,
500.
0-
5,50
0.0
2,50
0.0
-4,
000.
01,
29,7
19.0
14.
Mad
hya
Pra
desh
5,82
1.0
6,80
0.0
6,60
0.0
7,23
6.0
6,73
6.0
11,0
36.0
15,4
36.0
16,8
36.0
15,7
36.0
8,53
6.0
736.
073
6.0
736.
0-
1,37
1.0
-1,
825.
01,
06,1
77.0
15.
Mah
aras
htra
15,5
00.0
18,9
78.5
27,9
59.8
22,6
85.0
23,7
62.4
25,0
83.0
32,5
00.0
32,5
00.0
15,7
98.0
13,0
01.4
14,1
61.0
-5,
500.
09,
000.
0-
--
2,56
,429
.0
16.
Man
ipur
502.
825
8.1
150.
027
5.0
350.
046
3.0
600.
063
0.0
525.
097
0.0
--
--
--
-4,
723.
9
17.
Meg
hala
ya27
3.5
190.
031
0.0
397.
535
2.5
557.
569
2.5
1,01
3.5
1,12
8.0
1,13
4.5
12.5
12.5
12.5
--
--
6,08
7.0
18.
Miz
oram
155.
326
6.7
300.
018
5.8
260.
023
0.0
200.
017
0.0
424.
0-
--
--
--
-2,
191.
7
19.
Nag
alan
d57
7.4
355.
450
5.0
655.
053
5.0
600.
095
0.0
1,07
0.0
1,13
5.0
822.
0-
--
--
--
7,20
4.8
20.
Odi
sha
1,00
0.0
2,50
0.0
3,47
2.8
3,50
0.0
3,65
8.0
1,00
0.0
2,00
0.0
2,00
0.0
500.
050
0.0
1,00
0.0
-2,
400.
01,
000.
050
0.0
1,50
0.0
1,50
0.0
28,0
30.8
21.
Pun
jab
8,88
5.0
9,52
8.0
13,3
85.9
11,8
39.6
12,1
68.6
7,18
9.6
12,9
39.6
8,13
9.6
18,6
30.9
13,6
42.3
985.
93,
740.
9-
-4,
300.
0-
-1,
25,3
76.0
22.
Raj
asth
an14
,405
.813
,085
.812
,905
.814
,946
.915
,705
.819
,205
.822
,705
.818
,809
.522
,184
.035
,594
.02,
000.
0-
-1,
000.
0-
-1,
500.
01,
94,0
49.0
23.
Sik
kim
328.
0-
40.0
94.0
215.
033
0.0
580.
074
4.0
995.
01,
088.
0-
--
--
--
4,41
4.0
24.
Tam
il N
adu
12,5
99.0
11,1
81.1
14,5
00.0
20,2
78.3
24,2
80.7
26,6
31.5
32,0
56.5
40,8
31.5
44,4
16.8
38,1
87.0
2,28
1.5
3,78
1.5
2,28
1.5
--
-75
0.0
2,74
,056
.8
25.
Tela
ngan
a-
--
892.
389
2.3
9,09
2.3
14,7
42.3
17,3
92.3
892.
389
2.3
892.
389
2.3
4,55
3.3
4,90
0.0
--
48,1
40.0
1,04
,173
.9
26.
Trip
ura
350.
028
5.0
300.
064
5.0
550.
015
0.0
575.
099
0.0
1,13
7.0
1,54
2.8
--
--
--
-6,
524.
8
27.
Utta
r Pra
desh
16,9
58.7
16,3
15.2
20,1
45.2
13,8
15.2
12,3
15.2
21,8
15.2
34,3
15.2
45,3
65.2
45,9
15.2
50,3
15.2
3,26
1.1
3,26
1.1
1,23
3.7
--
--
2,85
,030
.9
28.
Utta
rakh
and
600.
099
1.5
1,40
0.0
1,75
0.0
2,50
0.0
2,40
0.0
3,90
0.0
5,45
0.0
6,66
0.0
6,30
0.0
--
--
--
-31
,951
.5
29.
Wes
t Ben
gal
16,1
09.8
9,50
0.0
22,1
90.6
20,5
00.0
21,0
00.0
21,9
00.0
24,0
00.0
34,4
30.5
25,4
11.0
15,8
00.0
--
-8,
500.
020
,528
.0-
9,50
0.0
2,49
,369
.9
30.
Pud
uche
rry
500.
060
0.0
533.
050
1.6
500.
047
0.4
450.
027
5.0
400.
025
0.0
225.
025
0.0
575.
0-
--
-5,
530.
0
All
Stat
e an
d U
T1,
47,0
67.0
1,47
,038
.72,
02,1
43.5
2,13
,153
.42,
30,3
74.4
2,58
,133
.53,
18,4
78.7
3,64
,338
.83,
27,2
20.9
3,17
,397
.335
,503
.528
,665
.123
,827
.843
,099
.738
,238
.82,
740.
081
,115
.027
,78,
536.
1
–’: N
il/N
eglig
ible
Not
e: 1
. Com
pens
atio
n B
onds
, Loa
ns n
ot b
earin
g in
tere
st a
nd S
peci
al B
onds
(UD
AY
) are
not
incl
uded
.
2. S
DL o
f Rs.
38,
468.
46 c
rore
und
er A
ndhr
a Pr
ades
h re
flect
s tra
nsfe
r to
Tela
ngan
a du
e to
bifu
rcat
ion
of th
e st
ate
of A
ndhr
a Pr
ades
h. S
ourc
e: R
eser
ve B
ank
reco
rds.

Statements
169
Sta
tem
ent
24: M
atur
ity
Pro
file
of
Out
stan
din
g S
tate
Go
vern
men
t S
ecur
itie
s -
As
Per
cen
t to
To
tal
(Out
stan
din
g as
on
Mar
ch 3
1, 2
019)
(Per
cent)
Stat
e/U
T20
19-
2020
2020
-20
2120
21-
2022
2022
-20
2320
23-
2024
2024
-20
2520
25-
2026
2026
-20
2720
27-
2028
2028
- 20
2920
29-
2030
2030
-20
3120
31-
2032
2032
-20
3320
33-
2034
2035
-20
3620
36-
2049
TO
TAL
12
34
56
78
910
1112
1314
1516
1718
19
1.A
ndhr
a P
rad
esh
7.6
7.6
8.3
9.8
11.0
8.8
8.9
7.9
5.5
6.1
4.1
3.4
3.0
3.7
2.5
0.2
1.7
100.
0
2.A
runa
chal
Pra
des
h2.
6-
1.1
5.7
7.6
10.2
4.3
15.1
29.5
23.9
--
--
--
-10
0.0
3.A
ssam
6.3
2.6
6.5
3.3
4.9
9.7
10.3
10.1
25.4
20.9
--
--
--
-10
0.0
4.B
ihar
3.4
3.0
4.8
8.4
7.7
9.6
13.5
20.6
11.7
16.7
0.3
0.3
0.1
--
--
100.
0
5.C
hhat
tisga
rh1.
76.
27.
710
.612
.615
.614
.010
.620
.30.
20.
20.
2-
--
--
100.
0
6.G
oa5.
42.
75.
07.
79.
07.
313
.212
.016
.321
.3-
--
--
--
100.
0
7.G
ujar
at5.
76.
49.
88.
28.
18.
38.
010
.713
.420
.3-
1.1
--
--
-10
0.0
8.H
arya
na2.
83.
27.
010
.312
.211
.913
.712
.411
.85.
3-
--
-1.
40.
57.
510
0.0
9.H
imac
hal P
rad
esh
8.0
8.4
8.0
7.0
8.3
9.9
9.2
13.9
12.8
8.6
1.1
1.1
1.1
2.6
--
-10
0.0
10. J
amm
u an
d K
ashm
ir3.
29.
69.
27.
37.
15.
17.
69.
119
.020
.41.
01.
00.
4-
--
-10
0.0
11. J
hark
hand
4.3
1.2
4.2
9.7
8.2
12.9
13.8
13.4
3.6
14.2
1.3
1.3
-11
.7-
--
100.
0
12. K
arna
taka
3.8
4.5
4.8
6.3
9.5
11.7
12.8
17.7
14.0
12.4
-1.
3-
-1.
3-
-10
0.0
13. K
eral
a4.
24.
26.
88.
99.
910
.211
.613
.38.
510
.4-
2.7
-4.
21.
9-
3.1
100.
0
14. M
adhy
a P
rad
esh
5.5
6.4
6.2
6.8
6.3
10.4
14.5
15.9
14.8
8.0
0.7
0.7
0.7
-1.
3-
1.7
100.
0
15. M
ahar
asht
ra6.
07.
410
.98.
89.
39.
812
.712
.76.
25.
15.
5-
2.1
3.5
--
-10
0.0
16. M
anip
ur10
.65.
53.
25.
87.
49.
812
.713
.311
.120
.5-
--
--
--
100.
0
17. M
egha
laya
4.5
3.1
5.1
6.5
5.8
9.2
11.4
16.7
18.5
18.6
0.2
0.2
0.2
--
--
100.
0
18. M
izor
am7.
112
.213
.78.
511
.910
.59.
17.
819
.3-
--
--
--
-10
0.0
19. N
agal
and
8.0
4.9
7.0
9.1
7.4
8.3
13.2
14.9
15.8
11.4
--
--
--
-10
0.0
20. O
dis
ha3.
68.
912
.412
.513
.03.
67.
17.
11.
81.
83.
6-
8.6
3.6
1.8
5.4
5.4
100.
0
21. P
unja
b7.
17.
610
.79.
49.
75.
710
.36.
514
.910
.90.
83.
0-
-3.
4-
-10
0.0
22. R
ajas
than
7.4
6.7
6.7
7.7
8.1
9.9
11.7
9.7
11.4
18.3
1.0
--
0.5
--
0.8
100.
0
23. S
ikki
m7.
40.
00.
92.
14.
97.
513
.116
.922
.524
.6-
--
--
--
100.
0
24. T
amil
Nad
u4.
64.
15.
37.
48.
99.
711
.714
.916
.213
.90.
81.
40.
8-
--
0.3
100.
0
25. T
elan
gana
--
-0.
90.
98.
714
.216
.70.
90.
90.
90.
94.
44.
7-
-46
.210
0.0
26. T
ripur
a5.
44.
44.
69.
98.
42.
38.
815
.217
.423
.6-
--
--
--
100.
0
27. U
ttar
Pra
des
h5.
95.
77.
14.
84.
37.
712
.015
.916
.117
.71.
11.
10.
4-
--
-10
0.0
28. U
ttar
akha
nd1.
93.
14.
45.
57.
87.
512
.217
.120
.819
.7-
--
--
--
100.
0
29. W
est
Ben
gal
6.5
3.8
8.9
8.2
8.4
8.8
9.6
13.8
10.2
6.3
--
-3.
48.
2-
3.8
100.
0
30. P
uduc
herr
y9.
010
.89.
69.
19.
08.
58.
15.
07.
24.
54.
14.
510
.4-
--
-10
0.0
All
Stat
e an
d U
T5.
35.
37.
37.
78.
39.
311
.513
.111
.811
.41.
31.
00.
91.
61.
40.
12.
910
0.0
–’: N
il/N
eglig
ible
No
te: 1
. Com
pen
satio
n B
ond
s, L
oans
not
bea
ring
inte
rest
and
Sp
ecia
l Bon
ds
(UD
AY
) are
not
incl
uded
.
2
. SD
L of
Rs.
38,
468.
46 c
rore
und
er A
ndhr
a Pr
ades
h re
flect
s tra
nsfe
r to
Tela
ngan
a du
e to
bifu
rcat
ion
of th
e st
ate
of A
ndhr
a Pr
ades
h.S
our
ce: R
eser
ve B
ank
reco
rds.

State Finances : A Study of Budgets of 2019-20
170
Sta
tem
ent
25: I
nves
tmen
t O
utst
and
ing
in T
reas
ury
Bill
s(A
s at
end
-Mar
ch)
(` C
rore
)
Stat
e/U
T20
1220
1320
1420
1520
1620
1720
1820
19
ITB
AT
BIT
BA
TB
ITB
AT
BIT
BA
TB
ITB
AT
BIT
BA
TB
ITB
AT
BIT
BA
TB
12
34
56
78
910
1112
1314
1516
17
1.
And
hra
Pra
des
h 3
,500
.0
–
4,5
80.0
–
7
,062
.0
–
-
-
2,7
07.3
5
00.0
3
,703
.3
-
-
-
-
-
2.
Aru
nach
al P
rad
esh
50.
0 –
2
00.0
–
-
–
-
-
1
,201
.0
-
277
.2
-
313
.1
-
673
.1
-
3.
Ass
am 6
,020
.0
–
6,2
70.0
–
6
77.0
3
,000
.0
2,0
04.7
-
6
,135
.0
1,4
00.0
3
,801
.9
1,4
00.0
9
37.0
-
8
,323
.8
-
4.
Bih
ar 4
00.0
–
2
,050
.0
–
3,6
30.0
4
00.0
3
,523
.3
400
.0
8,1
94.1
-
12
,996
.6
-
17,3
90.5
-
14
,786
.7
-
5.
Chh
attis
garh
1,5
10.0
2
20.0
2
,620
.0
60.
0 1
,587
.0
–
-
-
1,8
58.4
-
2
,514
.2
-
4,0
75.4
-
9
,772
.7
-
6.
Goa
560
.0
–
190
.0
–
194
.0
–
251
.8
-
254
.6
-
341
.8
-
147
.9
-
342
.5
-
7.
Guj
arat
12,2
40.0
–
8
,930
.0
3,5
00.0
10
,934
.0
–
11,4
14.1
-
7
,951
.0
-
11,6
99.8
-
4
,136
.7
-
5,8
37.5
-
8.
Har
yana
290
.0
–
10.
0 –
3
,691
.0
–
2,4
87.6
-
4
,089
.2
-
2,4
71.0
-
2
,000
.7
-
637
.7
-
9.
Him
acha
l Pra
des
h 9
50.0
–
2
70.0
–
-
–
-
-
5
56.8
-
7
59.4
-
7
23.7
-
1
02.1
-
10. J
amm
u an
d K
ashm
ir 7
10.0
–
1
50.0
–
1
75.0
–
-
-
4
2.9
-
-
-
-
-
-
-
11. J
hark
hand
–
–
740
.0
–
847
.0
–
666
.1
-
2,1
02.2
-
1
,439
.1
-
354
.6
-
167
.9
-
12. K
arna
taka
7,6
70.0
–
6
,890
.0
–
10,9
94.0
–
17
,996
.6
-
16,9
49.3
-
24
,011
.7
-
12,6
73.8
-
5
,149
.1
-
13. K
eral
a 2
,710
.0
–
3,2
00.0
–
7
59.0
–
1
42.2
-
1
,643
.5
-
1,9
50.2
-
8
87.2
-
1
88.2
-
14. M
adhy
a P
rad
esh
6,7
00.0
–
6
,820
.0
–
3,9
06.0
–
4
,800
.2
-
9,5
03.2
-
10
,643
.2
-
7,4
22.6
-
8
,651
.4
-
15. M
ahar
asht
ra19
,060
.0
8,0
00.0
37
,660
.0
–
4,7
78.0
27
,500
.0
14,4
58.5
19
,000
.0
21,5
28.7
15,0
00.0
32,3
43.7
12,0
00.0
43
,446
.5
15,0
00.0
9
,371
.3
26,0
00.0
16. M
anip
ur –
–
–
–
3
15.0
–
1
25.7
-
-
-
-
-
-
-
-
-
17. M
egha
laya
300
.0
–
–
–
1,3
23.0
–
8
79.8
-
2
73.3
-
1
,374
.9
-
1,6
86.3
-
1
,075
.7
-
18. M
izor
am –
–
–
–
2
6.0
–
105
.5
-
155
.0
-
443
.1
-
461
.2
-
163
.0
-
19. N
agal
and
–
–
–
–
-
–
141
.5
-
-
-
35.
4 -
6
3.2
-
135
.0
-
20. O
dis
ha 3
,910
.0
3,0
00.0
4
,360
.0
3,0
00.0
3
,882
.0
–
3,8
21.2
-
5
,786
.3
-
8,6
85.3
-
13
,314
.4
12,0
50.0
8
,944
.8
15,1
00.0
21. P
unja
b –
–
–
–
-
–
2
48.3
-
5
,180
.2
-
-
-
-
-
468
.5
-
22. R
ajas
than
710
.0
8,8
00.0
5
,130
.0
7,6
00.0
2
,197
.0
8,1
12.0
2
,128
.4
6,7
01.0
2
,915
.8
4,9
57.0
5
,584
.9
2,5
17.0
6
,401
.6
2,9
74.0
2
,154
.3
3,7
92.0
23. T
amil
Nad
u10
,720
.0
1,9
90.0
14
,890
.0
4,4
10.0
14
,084
.0
7,1
43.0
11
,996
.0
10,4
16.4
9
,442
.8
14,6
65.0
15
,181
.4
19,3
05.8
11
,277
.8
31,3
68.7
11
,038
.0
27,3
47.1
24. T
elan
gana
-
-
-
-
-
-
1,8
73.9
-
2
,508
.8
-
52.
7 -
2
,280
.7
-
1,5
91.4
-
25. T
ripur
a 1
,100
.0
–
2,3
10.0
–
3
,546
.0
–
1,2
87.4
2
,400
.0
1,3
54.1
1
,300
.0
803
.9
1,1
00.0
1
,206
.8
-
432
.1
800
.0
26. U
ttar
Pra
des
h13
,510
.0
–
4,8
20.0
–
4
,590
.0
–
-
-
614
.9
-
1,2
04.6
-
10
,173
.5
-
25,4
35.4
-
27. U
ttar
akha
nd 5
0.0
–
560
.0
–
802
.0
–
593
.7
-
345
.4
-
452
.4
-
386
.0
-
247
.9
-
28. W
est
Ben
gal
3,0
80.0
–
4
,490
.0
10,0
00.0
5
,128
.0
–
2,7
50.7
-
6
,794
.4
-
12,4
81.5
-
8
,584
.1
-
5,9
89.2
-
29. P
uduc
herr
y 8
60.0
–
9
40.0
–
1
,063
.0
130
.0
488
.1
508
.6
493
.9
506
.1
805
.6
280
.2
526
.2
715
.4
404
.9
888
.3
All
Stat
e an
d U
Ts95
,730
.0
22,0
10.0
1,1
7,12
0.0
28,5
80.0
85
,127
.0
46,1
60.0
83
,697
.2
38,9
17.4
1,2
0,08
8.3
37,8
22.0
1,5
5,25
3.1
36,3
22.8
1,5
0,86
6.2
62,1
06.3
1,22
,084
.073
,927
.4
‘–’ :
Nil
ITB
: Int
erm
edia
te T
reas
ury
Bill
s AT
B: A
uctio
n Tr
easu
ry B
ills.
Not
e: D
ata
from
201
8 on
war
ds in
clud
e D
elhi
and
Pud
uche
rry.
Sour
ce: R
eser
ve B
ank
reco
rds.

Statements
171
Sta
tem
ent
26: E
xpen
dit
ure
on
Ed
ucat
ion*
– A
s R
atio
to
Ag
gre
gat
e E
xpen
dit
ure
(Per
cen
t)
Stat
e/U
T20
02-0
320
03-0
420
04-0
520
05-0
620
06-0
720
07-0
820
08-0
920
09-1
020
10-1
120
11-1
220
12-1
320
13-1
420
14-1
520
15-1
620
16-1
720
17-1
820
18-1
9 (R
E)20
19-2
0 (B
E)
12
34
56
78
910
1112
1314
1516
1718
19
1.
And
hra
Pra
desh
11.7
11.6
9.8
11.1
10.8
9.0
9.0
10.0
12.5
13.0
12.9
13.7
12.6
14.6
12.6
13.6
12.1
14.7
2.
Aru
nach
al P
rade
sh12
.19.
110
.79.
910
.710
.811
.412
.210
.811
.412
.211
.513
.211
.612
.312
.310
.49.
0
3.
Ass
am22
.422
.317
.020
.820
.420
.118
.816
.422
.020
.320
.622
.624
.725
.522
.021
.619
.120
.7
4.
Bih
ar18
.418
.915
.819
.619
.717
.618
.518
.116
.317
.020
.918
.717
.517
.116
.018
.219
.617
.9
5.
Chh
attis
garh
11.0
10.8
12.3
13.4
12.9
13.5
14.4
15.6
18.6
17.7
16.3
18.0
20.2
18.6
19.6
18.5
17.1
17.7
6.
Goa
12.0
12.1
13.9
12.3
13.7
12.3
13.3
14.1
15.4
14.8
15.4
15.7
15.1
14.3
14.3
14.2
14.4
14.4
7.
Guj
arat
13.5
11.2
11.5
12.6
12.7
13.4
11.7
13.8
15.9
15.8
14.3
15.0
15.2
15.2
14.5
14.1
13.6
13.1
8.
Har
yana
13.7
10.2
11.6
13.4
11.9
12.9
15.0
16.3
17.3
16.0
15.4
15.4
16.9
12.3
13.7
13.4
13.2
13.0
9.
Him
acha
l Pra
desh
14.5
12.4
13.5
14.1
14.1
15.4
16.2
16.3
17.9
17.8
17.3
17.8
17.7
16.3
15.2
17.6
17.4
17.7
10. J
amm
u an
d K
ashm
ir10
.911
.19.
79.
310
.09.
210
.011
.312
.712
.612
.113
.012
.614
.512
.614
.414
.914
.8
11. J
hark
hand
19.0
14.2
14.9
15.8
15.2
15.1
18.6
15.4
15.8
15.9
14.8
13.5
14.6
12.2
13.9
12.3
13.9
13.6
12. K
arna
taka
14.8
12.9
12.7
14.0
13.1
14.4
16.1
14.0
15.6
14.7
15.5
15.0
14.3
13.6
12.5
12.0
12.1
11.9
13. K
eral
a17
.615
.716
.216
.617
.115
.916
.716
.817
.017
.717
.217
.216
.416
.016
.216
.314
.814
.0
14. M
adhy
a P
rade
sh12
.29.
98.
810
.212
.411
.112
.813
.014
.212
.413
.215
.414
.814
.314
.014
.415
.114
.2
15. M
ahar
asht
ra18
.915
.514
.015
.716
.417
.217
.019
.120
.820
.220
.720
.519
.219
.217
.717
.015
.217
.7
16. M
anip
ur13
.313
.115
.315
.411
.914
.212
.011
.910
.710
.611
.712
.814
.012
.512
.212
.310
.411
.7
17. M
egha
laya
15.3
15.2
15.0
15.5
14.1
15.5
12.8
14.8
16.1
17.3
15.8
16.6
17.1
16.2
16.1
17.8
15.8
17.5
18. M
izor
am14
.512
.013
.813
.413
.813
.214
.114
.914
.915
.715
.717
.117
.417
.615
.814
.315
.015
.2
19. N
agal
and
11.0
10.8
11.0
11.6
12.3
11.4
11.2
11.3
13.4
12.1
13.2
15.3
13.7
14.0
12.9
12.6
13.1
13.7
20. O
dish
a14
.312
.212
.614
.712
.814
.316
.918
.218
.316
.415
.515
.015
.514
.614
.014
.914
.914
.0
21. P
unja
b12
.110
.210
.111
.38.
910
.311
.312
.211
.714
.815
.314
.214
.314
.08.
613
.012
.010
.3
22. R
ajas
than
15.5
14.1
13.8
17.2
15.6
14.6
17.9
19.0
19.1
17.8
16.1
16.3
16.7
12.5
15.2
15.1
17.1
17.3
23. S
ikki
m7.
611
.88.
810
.410
.59.
210
.612
.417
.314
.015
.015
.615
.817
.617
.115
.714
.516
.3
24. T
amil
Nad
u13
.812
.611
.213
.612
.212
.713
.115
.215
.214
.314
.716
.015
.815
.513
.014
.513
.513
.5
25. T
elan
gana
--
--
--
--
--
--
11.2
10.9
10.0
10.4
7.9
6.6
26. T
ripur
a19
.218
.320
.015
.315
.915
.114
.416
.217
.217
.015
.916
.415
.515
.515
.818
.516
.115
.6
27. U
ttar P
rade
sh14
.69.
112
.515
.214
.714
.113
.213
.816
.117
.117
.316
.015
.015
.516
.714
.812
.813
.4
28. U
ttara
khan
d20
.017
.618
.417
.218
.117
.618
.222
.623
.522
.120
.720
.319
.017
.618
.418
.117
.718
.4
29. W
est B
enga
l15
.911
.814
.913
.715
.215
.213
.117
.719
.719
.118
.117
.217
.215
.215
.113
.914
.716
.1
30. N
CT
Del
hi12
.110
.913
.114
.915
.113
.315
.816
.316
.318
.018
.318
.121
.221
.824
.224
.322
.525
.3
31. P
uduc
herr
y-
--
10.7
9.9
10.0
12.4
13.2
13.2
13.0
14.5
11.9
11.8
11.7
12.6
11.2
11.3
11.0
All
Stat
es a
nd U
Ts15
.112
.612
.714
.214
.013
.814
.315
.316
.616
.316
.416
.516
.015
.314
.715
.014
.414
.8
All
Stat
es a
nd U
Ts
(Per
cen
t to
GD
P)
2.5
2.3
2.3
2.2
2.2
2.2
2.3
2.4
2.5
2.5
2.5
2.5
2.6
2.6
2.6
2.6
2.8
2.8
RE:
Rev
ised
Est
imat
es.
B
E: B
udge
t Est
imat
es.
‘-
’: N
ot a
pplic
able
/Not
ava
ilabl
e.*:
Incl
udes
exp
endi
ture
on
Spo
rts,
Art
and
Cul
ture
und
er re
venu
e ex
pend
iture
and
cap
ital o
utla
y.N
ote:
Dat
a fro
m 2
017-
18 o
nwar
ds in
clud
e D
elhi
and
Pud
uche
rry
also
.So
urce
: Bud
get d
ocum
ents
of t
he s
tate
gov
ernm
ents
. Det
ails
in m
etho
dolo
gy.

State Finances : A Study of Budgets of 2019-20
172
Sta
tem
ent
27: E
xpen
dit
ure
on
Med
ical
and
Pub
lic H
ealt
h an
d F
amily
Wel
fare
* -
As
Rat
io t
o A
gg
reg
ate
Exp
end
itur
e (Per
cen
t)
Stat
e/U
T20
02-0
320
03-0
420
04-0
520
05-0
620
06-0
720
07-0
820
08-0
920
09-1
020
10-1
120
11-1
220
12-1
320
13-1
420
14-1
520
15-1
620
16-1
720
17-1
820
18-1
9 (R
E)20
19-2
0 (B
E)
12
34
56
78
910
1112
1314
1516
1718
19
1.
And
hra
Pra
desh
4.0
3.7
3.2
3.4
3.3
3.3
3.6
3.9
4.1
4.4
4.2
4.3
4.1
4.5
4.7
4.3
4.6
5.1
2.
Aru
nach
al P
rade
sh4.
53.
54.
53.
14.
43.
84.
34.
24.
34.
44.
34.
46.
64.
35.
86.
46.
66.
7
3.
Ass
am3.
73.
52.
93.
44.
24.
35.
05.
75.
24.
94.
64.
64.
26.
85.
66.
86.
97.
2
4.
Bih
ar4.
23.
83.
14.
54.
24.
43.
53.
53.
33.
53.
53.
23.
84.
14.
34.
54.
24.
6
5.
Chh
attis
garh
4.0
3.3
3.3
3.4
3.5
3.2
3.5
3.7
3.6
3.8
3.7
3.9
4.9
5.1
5.6
5.9
5.4
5.3
6.
Goa
4.0
4.5
4.7
4.9
4.6
4.6
5.4
5.3
5.6
5.8
5.8
5.7
5.6
5.5
6.1
6.9
6.1
7.0
7.
Guj
arat
3.2
2.7
2.8
3.1
2.9
3.2
3.1
3.8
4.2
4.2
4.7
4.9
5.5
5.6
5.7
5.4
5.5
5.3
8.
Har
yana
3.3
2.4
2.7
3.1
2.5
2.6
2.9
3.4
3.2
3.1
3.4
3.6
4.0
3.1
3.7
3.7
4.1
4.2
9.
Him
acha
l Pra
desh
4.5
4.3
4.6
4.6
4.4
4.4
4.5
4.8
5.1
4.8
4.9
5.1
5.4
5.2
5.2
5.8
6.3
6.2
10. J
amm
u an
d K
ashm
ir5.
25.
54.
94.
55.
45.
34.
85.
25.
15.
25.
15.
45.
65.
75.
65.
65.
25.
1
11. J
hark
hand
4.2
4.1
3.7
6.9
6.3
5.0
5.1
4.4
4.1
3.8
3.1
3.8
4.0
4.0
4.2
4.2
5.0
4.9
12. K
arna
taka
4.2
3.4
3.0
3.3
3.1
3.8
3.8
3.6
3.9
3.9
4.1
4.1
4.5
4.1
4.1
4.4
4.5
4.1
13. K
eral
a4.
84.
34.
54.
74.
94.
54.
84.
85.
15.
45.
25.
25.
35.
25.
65.
55.
34.
8
14. M
adhy
a P
rade
sh4.
13.
33.
13.
43.
83.
53.
43.
33.
63.
24.
03.
84.
34.
43.
84.
44.
14.
7
15. M
ahar
asht
ra3.
73.
22.
73.
23.
13.
53.
53.
33.
63.
63.
93.
94.
34.
54.
24.
34.
33.
9
16. M
anip
ur2.
93.
22.
63.
02.
74.
13.
54.
45.
05.
74.
95.
76.
55.
44.
85.
24.
94.
7
17. M
egha
laya
5.9
5.5
4.9
5.5
5.1
5.4
4.4
6.0
6.2
5.4
6.5
6.6
7.5
7.6
6.8
7.2
6.9
7.1
18. M
izor
am5.
05.
04.
33.
53.
63.
96.
17.
14.
24.
24.
14.
75.
25.
85.
36.
06.
25.
3
19. N
agal
and
4.6
4.0
5.7
4.3
4.2
4.3
3.8
3.9
4.3
4.3
4.1
4.2
5.1
5.1
4.8
5.1
5.6
5.5
20. O
dish
a3.
83.
24.
03.
03.
13.
33.
53.
83.
53.
23.
73.
54.
94.
75.
45.
15.
14.
9
21. P
unja
b3.
53.
02.
93.
42.
72.
93.
03.
23.
34.
34.
34.
14.
44.
12.
83.
83.
63.
3
22. R
ajas
than
4.2
4.0
3.7
4.4
4.1
4.0
4.8
4.8
4.8
5.1
4.8
5.0
5.6
4.6
5.1
5.6
5.7
5.6
23. S
ikki
m2.
02.
92.
62.
82.
52.
63.
03.
54.
45.
76.
25.
75.
45.
85.
97.
75.
64.
8
24. T
amil
Nad
u4.
13.
83.
24.
23.
33.
33.
74.
84.
84.
04.
44.
54.
74.
94.
25.
15.
04.
7
25. T
elan
gana
--
--
--
--
--
--
4.1
3.9
4.1
4.2
4.2
3.5
26. T
ripur
a3.
83.
43.
54.
75.
15.
04.
84.
84.
45.
34.
45.
26.
15.
35.
56.
36.
35.
5
27. U
ttar P
rade
sh3.
82.
73.
85.
15.
74.
84.
75.
04.
84.
45.
04.
65.
14.
54.
95.
34.
65.
1
28. U
ttara
khan
d3.
83.
43.
94.
64.
84.
64.
53.
94.
94.
94.
94.
95.
55.
04.
84.
45.
25.
6
29. W
est B
enga
l4.
93.
74.
23.
94.
14.
03.
64.
84.
84.
84.
24.
55.
25.
65.
24.
94.
64.
5
30. N
CT
Del
hi6.
36.
06.
68.
28.
57.
28.
28.
09.
39.
99.
28.
711
.710
.310
.811
.611
.912
.5
31. P
uduc
herr
y-
--
5.4
7.6
7.9
6.1
7.7
7.1
8.9
8.4
7.1
7.9
8.3
8.0
7.4
7.6
8.3
All
Stat
es a
nd U
Ts4.
03.
43.
43.
93.
93.
83.
94.
24.
24.
24.
34.
44.
84.
74.
65.
04.
94.
9
All
Stat
es a
nd U
Ts
(Per
cen
t to
GD
P)
0.7
0.6
0.6
0.6
0.6
0.6
0.6
0.7
0.6
0.6
0.7
0.7
0.8
0.8
0.8
0.9
1.0
0.9
RE:
Rev
ised
Est
imat
es.
B
E: B
udge
t Est
imat
es.
‘-
’: N
ot a
pplic
able
/Not
ava
ilabl
e.*:
It in
clud
es re
venu
e ex
pend
iture
and
cap
ital o
utla
y.N
ote:
Dat
a fro
m 2
017-
18 o
nwar
ds in
clud
e D
elhi
and
Pud
uche
rry
also
.So
urce
: Bud
get d
ocum
ents
of t
he s
tate
gov
ernm
ents
. Det
ails
in m
etho
dolo
gy.
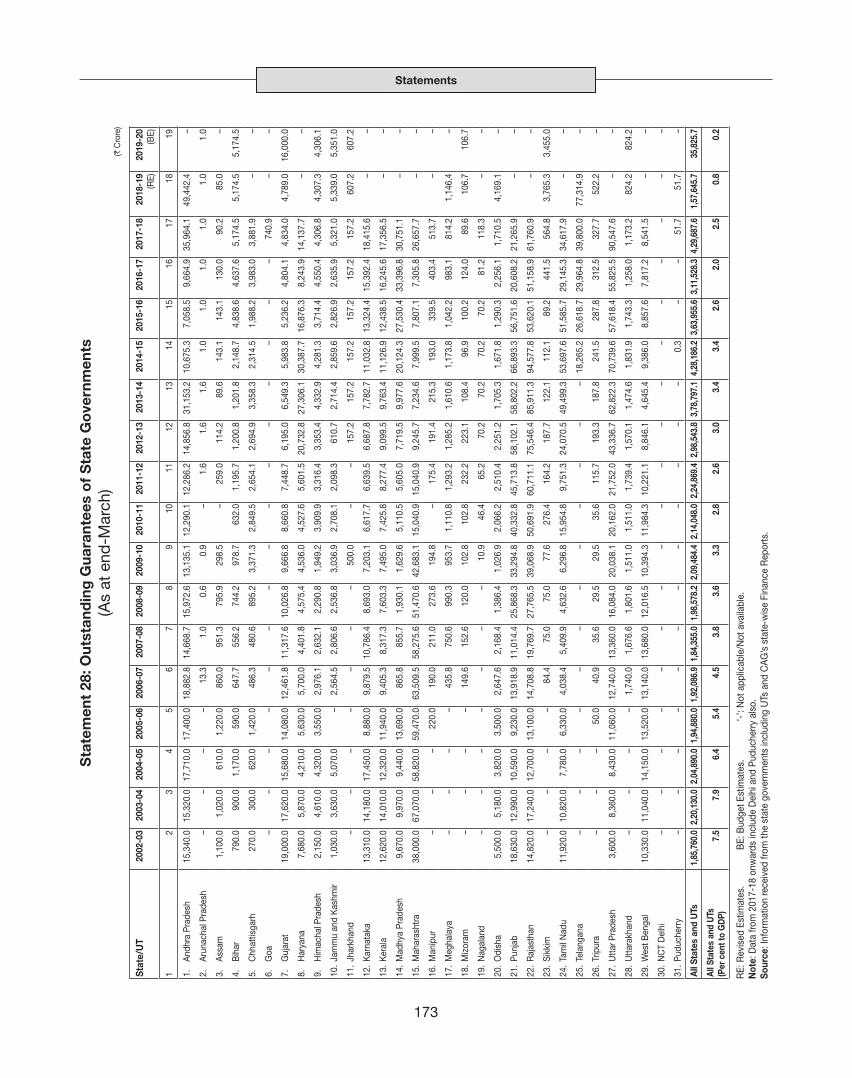
Statements
173
Sta
tem
ent
28: O
utst
and
ing
Gua
rant
ees
of
Sta
te G
ove
rnm
ents
(As
at e
nd-M
arch
)(`
Cro
re)
Stat
e/U
T20
02-0
320
03-0
420
04-0
520
05-0
620
06-0
720
07-0
820
08-0
920
09-1
020
10-1
120
11-1
220
12-1
320
13-1
420
14-1
520
15-1
620
16-1
720
17-1
820
18-1
9 (R
E)20
19-2
0 (B
E)
12
34
56
78
910
1112
1314
1516
1718
19
1.
And
hra
Pra
desh
15,3
40.0
15,3
20.0
17,7
10.0
17,4
00.0
18,8
82.8
14,6
68.7
15,9
72.6
13,1
35.1
12,2
90.1
12,2
86.2
14,8
56.8
31,1
53.2
10,6
75.3
7,05
8.5
9,66
4.9
35,9
64.1
49,4
42.4
–
2.
Aru
nach
al P
rade
sh–
––
–13
.31.
00.
60.
9–
1.6
1.6
1.6
1.0
1.0
1.0
1.0
1.0
1.0
3.
Ass
am1,
100.
01,
020.
061
0.0
1,22
0.0
860.
095
1.3
795.
929
8.5
–25
9.0
114.
289
.614
3.1
143.
113
0.0
90.2
85.0
–
4.
Bih
ar79
0.0
900.
01,
170.
059
0.0
647.
755
6.2
744.
297
8.7
632.
01,
195.
71,
200.
81,
201.
82,
148.
74,
838.
64,
637.
65,
174.
55,
174.
55,
174.
5
5.
Chh
attis
garh
270.
030
0.0
620.
01,
420.
048
6.3
480.
689
5.2
3,37
1.3
2,84
9.5
2,65
4.1
2,69
4.9
3,35
8.3
2,31
4.5
1,98
8.2
3,98
3.0
3,88
1.9
––
6.
Goa
––
––
––
––
––
––
––
–74
0.9
––
7.
Guj
arat
19,0
00.0
17,6
20.0
15,6
80.0
14,0
80.0
12,4
61.8
11,3
17.6
10,0
26.8
9,66
6.8
8,66
0.8
7,44
8.7
6,19
5.0
6,54
9.3
5,98
3.8
5,23
6.2
4,80
4.1
4,83
4.0
4,78
9.0
16,0
00.0
8.
Har
yana
7,68
0.0
5,87
0.0
4,21
0.0
5,63
0.0
5,70
0.0
4,40
1.8
4,57
5.4
4,53
6.0
4,52
7.6
5,60
1.5
20,7
32.8
27,3
06.1
30,3
87.7
16,8
76.3
8,24
3.9
14,1
37.7
––
9.
Him
acha
l Pra
desh
2,15
0.0
4,61
0.0
4,32
0.0
3,55
0.0
2,97
6.1
2,63
2.1
2,29
0.8
1,94
9.2
3,90
9.9
3,31
6.4
3,35
3.4
4,33
2.9
4,28
1.3
3,71
4.4
4,55
0.4
4,30
6.8
4,30
7.3
4,30
6.1
10.
Jam
mu
and
Kas
hmir
1,03
0.0
3,63
0.0
5,07
0.0
–2,
564.
52,
806.
62,
536.
83,
036.
92,
708.
12,
098.
361
0.7
2,71
4.4
2,85
9.6
2,82
6.9
2,63
5.9
5,32
1.0
5,33
9.0
5,35
1.0
11.
Jhar
khan
d–
––
––
––
500.
0–
–15
7.2
157.
215
7.2
157.
215
7.2
157.
260
7.2
607.
2
12.
Kar
nata
ka13
,310
.014
,180
.017
,450
.08,
880.
09,
879.
510
,786
.48,
693.
07,
203.
16,
617.
76,
639.
56,
687.
87,
782.
711
,032
.813
,324
.415
,392
.418
,415
.6–
–
13.
Ker
ala
12,6
20.0
14,0
10.0
12,3
20.0
11,9
40.0
9,40
5.3
8,31
7.3
7,60
3.3
7,49
5.0
7,42
5.8
8,27
7.4
9,09
9.5
9,76
3.4
11,1
26.9
12,4
38.5
16,2
45.6
17,3
56.5
––
14.
Mad
hya
Pra
desh
9,67
0.0
9,97
0.0
9,44
0.0
13,6
90.0
865.
885
5.7
1,93
0.1
1,62
9.6
5,11
0.5
5,60
5.0
7,71
9.5
9,97
7.6
20,1
24.3
27,5
30.4
33,3
96.8
30,7
51.1
––
15.
Mah
aras
htra
38,0
00.0
67,0
70.0
58,8
20.0
59,4
70.0
63,5
09.5
58,2
75.6
51,4
70.6
42,6
83.1
15,0
40.9
15,0
40.9
9,24
5.7
7,23
4.6
7,99
9.5
7,80
7.1
7,30
5.8
26,6
57.7
––
16.
Man
ipur
––
–22
0.0
190.
021
1.0
273.
619
4.8
–17
5.4
191.
421
5.3
193.
033
9.5
403.
451
3.7
––
17.
Meg
hala
ya–
––
–43
5.8
750.
699
0.3
953.
71,
110.
81,
293.
21,
285.
21,
610.
61,
173.
81,
042.
298
3.1
814.
21,
146.
4–
18.
Miz
oram
––
––
149.
615
2.6
120.
010
2.8
102.
823
2.2
223.
110
8.4
96.9
100.
212
4.0
89.6
106.
710
6.7
19.
Nag
alan
d–
––
––
––
10.9
46.4
65.2
70.2
70.2
70.2
70.2
81.2
118.
3–
–
20.
Odi
sha
5,50
0.0
5,18
0.0
3,82
0.0
3,50
0.0
2,64
7.6
2,16
8.4
1,38
6.4
1,02
6.9
2,06
6.2
2,51
0.4
2,25
1.2
1,70
5.3
1,67
1.8
1,29
0.3
2,25
6.1
1,71
0.5
4,16
9.1
–
21.
Pun
jab
18,6
30.0
12,9
90.0
10,5
90.0
9,23
0.0
13,9
18.9
11,0
14.4
25,8
68.3
33,2
94.8
40,3
32.8
45,7
13.8
58,1
02.1
58,8
02.2
66,8
93.3
56,7
51.6
20,6
08.2
21,2
65.9
––
22.
Raj
asth
an14
,820
.017
,240
.012
,700
.013
,100
.014
,708
.819
,769
.727
,765
.539
,068
.950
,691
.960
,711
.175
,546
.485
,911
.394
,577
.853
,620
.151
,158
.961
,760
.9–
–
23.
Sik
kim
––
––
84.4
75.0
75.0
77.6
276.
416
4.2
187.
712
2.1
112.
189
.244
1.5
564.
83,
765.
33,
455.
0
24.
Tam
il N
adu
11,9
20.0
10,8
20.0
7,78
0.0
6,33
0.0
4,03
8.4
5,40
9.9
4,63
2.6
6,29
6.8
15,9
54.8
9,75
1.3
24,0
70.5
49,4
99.3
53,6
97.6
51,5
85.7
29,1
45.3
34,6
17.9
––
25.
Tela
ngan
a–
––
––
––
––
––
–18
,265
.226
,618
.729
,964
.839
,800
.077
,314
.9–
26.
Trip
ura
––
–50
.040
.935
.629
.529
.535
.611
5.7
193.
318
7.8
241.
528
7.8
312.
532
7.7
522.
2–
27.
Utta
r Pra
desh
3,60
0.0
8,36
0.0
8,43
0.0
11,0
60.0
12,7
40.0
13,3
60.0
16,0
84.0
20,0
38.1
20,1
62.0
21,7
52.0
43,3
36.7
62,8
22.3
70,7
39.6
57,6
18.4
55,8
25.5
90,5
47.6
––
28.
Utta
rakh
and
––
––
1,74
0.0
1,67
6.6
1,80
1.6
1,51
1.0
1,51
1.0
1,73
9.4
1,57
0.1
1,47
4.6
1,83
1.9
1,74
3.3
1,25
8.0
1,17
3.2
824.
282
4.2
29.
Wes
t Ben
gal
10,3
30.0
11,0
40.0
14,1
50.0
13,5
20.0
13,1
40.0
13,6
80.0
12,0
16.5
10,3
94.3
11,9
84.3
10,2
21.1
8,84
6.1
4,64
5.4
9,38
6.0
8,85
7.6
7,81
7.2
8,54
1.5
––
30.
NC
T D
elhi
––
––
––
––
––
––
––
––
––
31.
Pud
uche
rry
––
––
––
––
––
––
0.3
––
51.7
51.7
–
All
Stat
es a
nd U
Ts1,
85,7
60.0
2,20
,130
.02,
04,8
90.0
1,94
,880
.01,
92,0
86.9
1,84
,355
.01,
98,5
78.2
2,09
,484
.42,
14,0
48.0
2,24
,869
.42,
98,5
43.8
3,78
,797
.14,
28,1
86.2
3,63
,955
.63,
11,5
28.3
4,29
,687
.61,
57,6
45.7
35,8
25.7
All S
tate
s an
d U
Ts
(Per
cen
t to
GD
P)7.
57.
96.
45.
44.
53.
83.
63.
32.
82.
63.
03.
43.
42.
62.
02.
50.
80.
2
RE:
Rev
ised
Est
imat
es.
B
E: B
udge
t Est
imat
es.
‘-
’: N
ot a
pplic
able
/Not
ava
ilabl
e.N
ote:
Dat
a fro
m 2
017-
18 o
nwar
ds in
clud
e D
elhi
and
Pud
uche
rry
also
.So
urce
: Inf
orm
atio
n re
ceiv
ed fr
om th
e st
ate
gove
rnm
ents
incl
udin
g U
Ts a
nd C
AG
’s s
tate
-wis
e Fi
nanc
e R
epor
ts.

State Finances : A Study of Budgets of 2019-20
174
Sta
tem
ent
29: E
xpen
dit
ure
on
Wag
es a
nd S
alar
ies
(` C
rore
)
Stat
e/U
T20
02-0
320
03-0
420
04-0
520
05-0
620
06-0
720
07-0
820
08-0
920
09-1
020
10-1
120
11-1
220
12-1
320
13-1
420
14-1
520
15-1
620
16-1
720
17-1
820
18-1
9 (R
E)20
19-2
0 (B
E)
12
34
56
78
910
1112
1314
1516
1718
19
1.
Andh
ra P
rade
sh8,
100.
08,
720.
08,
830.
010
,270
.011
,930
.013
,000
.014
,280
.017
,410
.023
,440
.026
,820
.025
,770
.032
,350
.027
,936
.927
,470
.032
,530
.032
,815
.535
,196
.641
,459
.3
2.
Arun
acha
l Pra
desh
––
––
––
––
–2,
040.
02,
230.
0–
––
–4,
434.
65,
012.
65,
531.
8
3.
Assa
m3,
650.
03,
880.
04,
060.
04,
440.
04,
720.
0–
––
–11
,650
.013
,540
.0–
17,5
80.0
18,4
80.0
19,5
00.0
26,0
67.4
32,0
27.7
33,8
47.8
4.
Biha
r5,
070.
05,
020.
05,
010.
0–
––
––
–12
,500
.013
,980
.0–
15,1
87.1
–16
,450
.018
,447
.222
,305
.725
,800
.7
5.
Chh
attis
garh
1,95
0.0
2,06
0.0
2,10
0.0
2,29
0.0
2,50
0.0
2,97
0.0
3,67
0.0
11,1
40.0
6,41
0.0
7,44
0.0
7,69
0.0
9,14
0.0
10,0
03.3
10,8
60.0
11,4
20.0
13,1
83.8
18,9
45.7
22,2
20.9
6.
Goa
––
––
––
––
––
––
––
2,13
0.0
2,82
7.2
2,40
7.0
3,23
6.5
7.
Guj
arat
2,46
0.0
2,55
0.0
2,57
0.0
2,71
0.0
2,80
0.0
8,12
0.0
8,66
0.0
10,2
50.0
15,8
70.0
17,4
60.0
18,6
40.0
–20
,950
.022
,070
.023
,530
.028
,186
.030
,604
.033
,665
.0
8.
Har
yana
3,16
0.0
3,14
0.0
3,46
0.0
3,74
0.0
4,03
0.0
4,47
0.0
6,35
0.0
8,31
0.0
9,52
0.0
9,60
0.0
10,6
20.0
11,2
90.0
13,2
96.3
–15
,780
.017
,254
.319
,997
.021
,901
.7
9.
Him
acha
l Pra
desh
2,06
0.0
2,15
0.0
2,20
0.0
2,44
0.0
2,78
0.0
3,12
0.0
3,44
0.0
4,08
0.0
5,29
0.0
5,46
0.0
6,29
0.0
–7,
168.
27,
020.
08,
420.
09,
458.
911
,151
.112
,627
.6
10. J
amm
u an
d Ka
shm
ir–
––
––
––
––
––
–11
,469
.0–
15,1
20.0
29,6
91.0
28,1
40.0
26,9
31.0
11. J
hark
hand
––
––
2,55
0.0
––
5,45
0.0
–6,
260.
06,
450.
06,
770.
07,
620.
08,
220.
08,
930.
010
,789
.713
,046
.813
,270
.2
12. K
arna
taka
4,94
0.0
5,32
0.0
5,39
0.0
5,90
0.0
6,55
0.0
8,41
0.0
9,93
0.0
10,3
00.0
11,0
90.0
11,5
40.0
16,0
80.0
17,8
10.0
19,7
37.0
21,4
90.0
21,5
00.0
22,8
47.0
31,3
58.7
32,9
99.1
13. K
eral
a4,
750.
05,
140.
05,
420.
05,
680.
06,
660.
07,
790.
09,
180.
09,
930.
011
,210
.016
,290
.017
,560
.019
,620
.021
,689
.123
,830
.028
,470
.032
,349
.132
,935
.233
,602
.2
14. M
adhy
a Pr
ades
h5,
310.
04,
990.
06,
200.
06,
040.
06,
340.
06,
980.
08,
550.
010
,610
.013
,290
.015
,090
.016
,220
.018
,370
.021
,260
.021
,870
.022
,930
.025
,664
.530
,419
.935
,201
.1
15. M
ahar
asht
ra18
,500
.019
,630
.020
,680
.022
,820
.024
,220
.027
,560
.032
,120
.041
,290
.042
,050
.045
,800
.053
,710
.060
,140
.062
,565
.2–
72,0
80.0
75,7
69.5
89,9
83.5
1,14
,942
.9
16. M
anip
ur68
0.0
680.
071
0.0
870.
081
0.0
910.
01,
090.
01,
150.
0–
2,22
0.0
2,36
0.0
––
–2,
980.
03,
521.
43,
889.
74,
747.
9
17. M
egha
laya
––
––
––
––
1,49
0.0
1,64
0.0
––
––
3,89
0.0
3,44
4.7
4,13
1.9
5,23
9.0
18. M
izor
am49
0.0
500.
056
0.0
540.
062
0.0
––
–1,
430.
0–
––
––
2,41
0.0
2,32
6.2
2,82
1.1
3,36
6.7
19. N
agal
and
720.
077
0.0
800.
098
0.0
1,05
0.0
1,20
0.0
1,29
0.0
1,49
0.0
2,08
0.0
2,30
0.0
1,67
0.0
––
–3,
810.
04,
105.
35,
072.
85,
406.
7
20. O
dish
a3,
930.
04,
000.
04,
070.
04,
350.
04,
630.
05,
340.
07,
500.
09,
280.
010
,760
.010
,800
.011
,670
.012
,960
.015
,600
.217
,640
.019
,200
.022
,354
.127
,770
.330
,288
.0
21. P
unja
b–
––
––
––
––
12,4
00.0
16,9
80.0
17,7
60.0
16,3
34.4
–21
,730
.023
,211
.025
,377
.926
,978
.9
22. R
ajas
than
5,28
0.0
5,75
0.0
6,26
0.0
6,82
0.0
7,29
0.0
7,99
0.0
11,7
00.0
14,0
30.0
14,5
70.0
15,8
50.0
17,6
00.0
–23
,615
.626
,010
.030
,150
.037
,751
.150
,924
.755
,948
.3
23. S
ikki
m43
0.0
450.
045
0.0
500.
043
0.0
––
––
1,11
0.0
1,19
0.0
–1,
506.
9–
1,68
0.0
1,75
8.3
1,99
4.6
2,85
7.0
24. T
amil
Nad
u7,
980.
07,
970.
08,
510.
08,
980.
010
,700
.012
,160
.016
,000
.019
,490
.023
,830
.026
,800
.027
,600
.031
,860
.037
,070
.337
,130
.040
,120
.044
,981
.050
,867
.855
,399
.7
25. T
elan
gana
––
––
––
––
––
––
10,8
01.4
18,3
50.0
19,4
70.0
23,8
13.3
24,9
64.2
23,0
59.5
26. T
ripur
a–
––
––
––
––
2,31
0.0
2,47
0.0
––
––
5,27
6.6
5,88
5.3
6,10
5.3
27. U
ttar P
rade
sh7,
400.
08,
040.
08,
420.
09,
060.
09,
870.
011
,190
.023
,860
.033
,350
.0–
27,3
20.0
29,1
50.0
30,0
90.0
32,6
76.4
34,5
20.0
38,3
70.0
44,4
11.0
49,8
96.8
61,8
89.0
28. U
ttara
khan
d–
––
–2,
270.
02,
530.
02,
860.
04,
880.
0–
6,08
0.0
6,71
0.0
7,27
0.0
8,21
6.9
–9,
690.
011
,787
.312
,893
.114
,651
.0
29. W
est B
enga
l9,
270.
09,
450.
09,
800.
010
,190
.010
,880
.012
,210
.013
,770
.021
,320
.024
,950
.026
,980
.028
,340
.029
,430
.030
,985
.1–
–37
,803
.042
,778
.946
,607
.9
30. N
CT
Del
hi1,
170.
01,
280.
01,
440.
0–
––
––
––
4,76
0.0
5,19
0.0
564.
36,
250.
0–
9,08
9.6
10,8
38.6
12,4
71.4
31. P
uduc
herry
290.
035
0.0
380.
044
0.0
470.
071
0.0
900.
01,
020.
0–
–1,
220.
0–
1,37
3.6
––
1,67
9.2
1,81
9.5
1,92
9.0
All S
tate
s an
d U
Ts96
,110.0
1,00,1
90.0
1,05,4
70.0
1,08,6
00.0
1,23,6
10.0
1,35,9
40.0
1,74,2
20.0
2,33,7
70.0
2,17,2
80.0
3,23,7
60.0
3,54,5
10.0
3,04,8
50.0
4,33,2
69.3
2,94,9
60.0
4,92,2
90.0
6,27,0
98.8
7,25,4
58.7
8,14,1
83.1
RE:
Rev
ised
Est
imat
es.
B
E: B
udge
t Est
imat
es.
‘-
’: N
ot a
pplic
able
/Not
ava
ilabl
e.N
ote:
1. D
ata
in re
spec
t of M
ahar
asht
ra a
nd U
ttara
khan
d fo
r 200
8-09
rela
tes
to R
evis
ed E
stim
ates
whi
le 2
009-
10 a
re B
udge
t est
imat
es.
2.
Dat
a fro
m 2
017-
18 o
nwar
ds in
clud
e D
elhi
and
Pud
uche
rry.
Sour
ce: I
nfor
mat
ion
rece
ived
from
the
stat
e go
vern
men
ts a
nd U
Ts.

Statements
175
Sta
tem
ent
30: E
xpen
dit
ure
on
Op
erat
ions
and
Mai
nten
ance
(` C
rore
)
Stat
e/U
T20
02-0
320
03-0
420
04-0
520
05-0
620
06-0
720
07-0
820
08-0
920
09-1
020
10-1
120
11-1
220
12-1
320
13-1
420
14-1
520
15-1
620
16-1
720
17-1
820
18-1
9 (R
E)20
19-2
0 (B
E)
12
34
56
78
910
1112
1314
1516
1718
19
1.
Andh
ra P
rade
sh3,
120.
03,
830.
03,
830.
03,
880.
04,
710.
05,
850.
09,
060.
08,
970.
04,
840.
08,
470.
02,
080.
07,
820.
07,
121.
36,
760.
03,
220.
08,
740.
38,
635.
88,
189.
2
2.
Arun
acha
l Pra
desh
––
––
––
––
–15
0.0
––
––
–15
30.1
1984
.717
02.5
3.
Assa
m33
0.0
370.
051
0.0
540.
036
0.0
––
––
4,25
0.0
3,54
0.0
––
–56
0.0
579.
7–
–
4.
Biha
r–
––
––
––
––
2,48
0.0
5,49
0.0
–7,
832.
2–
2,21
0.0
7,77
1.5
10,7
79.7
11,9
40.1
5.
Chh
attis
garh
220.
021
0.0
190.
011
0.0
330.
038
0.0
450.
051
0.0
400.
058
0.0
710.
091
0.0
687.
654
0.0
570.
063
2.4
1,12
3.1
938.
9
6.
Goa
––
––
––
––
––
––
––
––
––
7.
Guj
arat
1,42
0.0
2,18
0.0
1,38
0.0
790.
064
0.0
1,30
0.0
990.
02,
330.
062
0.0
610.
084
0.0
––
––
––
–
8.
Har
yana
320.
041
0.0
350.
046
0.0
750.
099
0.0
920.
098
0.0
890.
01,
640.
085
0.0
1,85
0.0
995.
7–
1,13
0.0
––
–
9.
Him
acha
l Pra
desh
270.
038
0.0
350.
048
0.0
590.
066
0.0
810.
01,
040.
01,
570.
01,
690.
01,
820.
0–
2,46
6.4
2,37
0.0
3,03
0.0
2,93
5.8
3,89
6.9
3,86
8.3
10. J
amm
u an
d Ka
shm
ir–
––
––
––
––
––
––
–61
0.0
––
–
11. J
hark
hand
––
––
––
–18
0.0
–10
,170
.011
,390
.04,
310.
017
,787
.8–
4,50
0.0
7,06
2.7
6,13
0.4
4,92
6.6
12. K
arna
taka
90.0
250.
028
0.0
450.
086
0.0
670.
067
0.0
660.
079
0.0
1,44
0.0
1,90
0.0
2,27
0.0
2,84
0.0
–2,
830.
02,
880.
13,
159.
83,
740.
5
13. K
eral
a35
0.0
350.
043
0.0
500.
055
0.0
650.
065
0.0
690.
080
0.0
810.
088
0.0
920.
01,
047.
61,
250.
01,
400.
01,
334.
41,
369.
01,
411.
8
14. M
adhy
a Pr
ades
h31
0.0
200.
025
0.0
270.
046
0.0
720.
069
0.0
640.
068
0.0
1,01
0.0
1,47
0.0
1,69
0.0
1,40
6.9
1,67
0.0
2,18
0.0
1,96
5.0
2,04
2.1
1,81
5.2
15. M
ahar
asht
ra8,
630.
09,
230.
012
,350
.016
,000
.018
,500
.018
,400
.023
,190
.015
,940
.06,
450.
06,
330.
07,
750.
09,
330.
010
,331
.7–
5,22
0.0
12,6
20.0
18,0
56.2
21,3
79.7
16. M
anip
ur34
0.0
250.
029
0.0
360.
050
0.0
470.
054
0.0
490.
0–
1,77
0.0
1,76
0.0
––
–3,
490.
05,
752.
68,
300.
38,
032.
8
17. M
egha
laya
––
––
––
––
200.
0–
––
––
–34
1.2
454.
176
8.3
18. M
izor
am12
0.0
130.
013
0.0
170.
037
0.0
––
–2,
660.
0–
––
––
––
––
19. N
agal
and
10.0
20.0
20.0
20.0
20.0
20.0
20.0
20.0
40.0
750.
022
0.0
––
–18
0.0
393.
526
6.6
149.
7
20. O
dish
a44
0.0
420.
048
0.0
670.
01,
210.
01,
600.
01,
820.
01,
940.
02,
290.
02,
610.
03,
360.
03,
920.
04,
237.
64,
510.
04,
710.
05,
108.
84,
522.
34,
748.
9
21. P
unja
b–
––
––
––
––
––
160.
0–
–30
0.0
––
–
22. R
ajas
than
1,12
0.0
1,14
0.0
1,22
0.0
1,27
0.0
1,52
0.0
1,66
0.0
2,02
0.0
2,07
0.0
2,19
0.0
2,73
0.0
––
469.
058
0.0
570.
099
9.1
953.
71,
066.
4
23. S
ikki
m1,
520.
01,
710.
01,
650.
01,
750.
02,
260.
0–
––
–50
.01,
830.
0–
––
––
––
24. T
amil
Nad
u2,
140.
02,
470.
03,
160.
03,
940.
03,
720.
04,
070.
04,
120.
04,
730.
04,
660.
06,
370.
08,
490.
09,
000.
09,
498.
5–
8,75
0.0
9,34
3.7
12,2
70.4
11,0
83.4
25. T
elan
gana
––
––
––
––
––
––
4,27
4.8
7,56
0.0
7,50
0.0
5,55
5.0
8,41
6.8
6,34
7.0
26. T
ripur
a–
––
––
––
––
210.
016
0.0
––
––
177.
315
8.3
151.
3
27. U
ttar P
rade
sh1,
030.
01,
110.
01,
380.
01,
660.
02,
670.
02,
770.
03,
440.
03,
500.
0–
3,70
0.0
4,72
0.0
8,35
0.0
5,80
8.7
5,99
0.0
7,13
0.0
8,66
2.7
10,0
85.2
10,8
18.6
28. U
ttara
khan
d–
––
–90
.030
0.0
290.
028
0.0
–13
0.0
830.
01,
180.
097
0.0
–1,
710.
01,
941.
41,
702.
31,
839.
7
29. W
est B
enga
l1,
020.
01,
070.
01,
230.
01,
600.
02,
160.
01,
070.
01,
170.
01,
210.
089
0.0
1,16
0.0
1,22
0.0
1,67
0.0
1,90
3.1
––
2,53
4.4
2,83
0.8
3,03
1.1
30. N
CT
Del
hi14
0.0
140.
016
0.0
––
––
––
––
––
––
––
–
31. P
uduc
herry
––
––
––
––
––
20.0
–24
.4–
–63
.564
.488
.2
All S
tate
s an
d U
Ts22
,800
.025
,730
.029
,470
.034
,940
.042
,260
.041
,570
.050
,870
.046
,170
.029
,970
.059
,110
.061
,310
.053
,220
.079
,678
.931
,230
.061
,800
.088
,925
.21,
07,2
02.9
1,08
,038
.2
RE:
Rev
ised
Est
imat
es.
B
E: B
udge
t Est
imat
es.
‘-
’: N
ot a
pplic
able
/Not
ava
ilabl
e.$
: R
elat
es to
mai
nten
ance
.
#
: D
ata
rela
te to
repa
ir an
d m
aint
enan
ce.
@ :
Inc
lude
Tra
vel E
xpen
ses,
Offi
ce E
xpen
ses,
Ren
t, M
inor
Wor
ks, M
achi
nery
and
Equ
ipm
ent,
Mat
eria
ls a
nd S
uppl
ies,
Mai
nten
ance
, Mot
or V
ehic
les,
Fue
l cha
rges
and
Oth
er c
harg
es.
* :
Incl
ude
expe
nditu
re u
nder
mai
nten
ance
wor
ks, t
ools
and
pla
nts,
mac
hine
ry a
nd e
quip
men
t, m
ater
ial a
nd s
uppl
ies,
‘gra
nts-
in-a
id n
on-s
alar
y’ a
nd s
uspe
nse.
Sour
ce:
Not
e: D
ata
for 2
017-
18 o
nwar
ds in
clud
e D
elhi
and
Pud
uche
rry.
Sour
ce: I
nfor
mat
ion
rece
ived
from
the
stat
e go
vern
men
ts a
nd U
Ts.

State Finances : A Study of Budgets of 2019-20
176
Sta
tem
ent
31: S
oci
al S
ecto
r E
xpen
dit
ure*
(` C
rore
)
Stat
e/U
T20
02-0
320
03-0
420
04-0
520
05-0
620
06-0
720
07-0
820
08-0
920
09-1
020
10-1
120
11-1
220
12-1
320
13-1
420
14-1
520
15-1
620
16-1
720
17-1
820
18-1
9 (R
E)20
19-2
0 (B
E)
12
34
56
78
910
1112
1314
1516
1718
19
1.
Andh
ra P
rade
sh11
,179
.213
,366
.913
,820
.914
,900
.418
,654
.324
,470
.931
,435
.930
,278
.939
,132
.445
,395
.949
,435
.253
,735
.854
,917
.857
,520
.062
,799
.972
,855
.875
,916
.01,
12,1
94.3
2.
Arun
acha
l Pra
desh
420.
761
9.8
650.
074
1.6
842.
595
3.2
1,27
9.6
1,76
6.9
1,56
7.5
2,15
8.0
1,93
8.5
2,55
3.6
3,05
5.4
3,35
7.6
4,14
8.4
5,47
5.9
7,37
8.2
7,15
5.2
3.
Assa
m3,
233.
13,
709.
24,
775.
14,
452.
35,
220.
16,
056.
46,
759.
99,
159.
510
,242
.911
,189
.212
,303
.214
,507
.520
,396
.920
,218
.226
,362
.627
,844
.548
,582
.846
,321
.2
4.
Biha
r6,
465.
67,
023.
56,
117.
28,
663.
311
,126
.813
,815
.116
,336
.517
,867
.519
,369
.824
,045
.630
,744
.534
,921
.442
,415
.952
,709
.960
,566
.668
,232
.11,
07,0
20.3
1,11
,271
.9
5.
Chh
attis
garh
2,81
9.8
3,24
4.2
3,63
4.8
4,29
5.4
5,70
6.6
6,94
7.3
8,87
3.7
11,6
77.9
11,8
23.8
14,8
06.5
16,9
68.5
21,0
54.7
23,6
76.7
27,5
00.0
31,8
97.6
35,1
28.2
43,7
09.8
42,8
58.1
6.
Goa
626.
268
5.7
798.
188
0.1
1,01
0.4
1,12
4.4
1,45
5.3
1,79
3.5
2,08
8.3
2,30
2.8
2,49
6.4
2,91
8.8
3,17
1.8
3,67
7.3
3,94
5.8
5,00
6.8
6,75
5.3
7,39
9.0
7.
Guj
arat
8,17
7.4
8,99
1.9
10,1
26.6
10,9
94.7
13,1
04.4
14,8
92.7
18,1
75.4
23,1
68.9
28,5
92.6
30,3
45.8
38,0
63.6
41,8
78.0
47,2
58.6
53,4
58.5
56,0
36.8
60,6
16.5
73,9
97.6
78,1
44.8
8.
Har
yana
2,81
0.2
2,81
8.0
3,49
7.5
4,74
2.2
5,60
4.9
7,34
2.7
9,81
3.7
13,3
59.0
13,6
35.9
16,2
70.4
18,9
88.0
18,0
99.8
22,0
41.7
25,5
04.7
30,5
05.0
35,4
34.7
42,2
55.8
45,7
94.9
9.
Him
acha
l Pra
desh
1,97
2.6
2,34
8.0
2,32
8.5
2,80
4.1
3,33
4.3
3,73
6.0
4,57
0.0
4,91
3.5
6,02
2.3
5,99
8.5
7,09
8.5
7,89
1.3
9,07
1.8
9,96
5.6
12,0
24.3
12,6
35.0
16,1
32.9
17,1
43.3
10.
Jam
mu
and
Kash
mir
2,51
7.9
2,49
2.9
3,10
4.1
4,02
9.6
4,34
8.0
5,10
7.9
5,60
8.9
6,89
8.5
7,43
2.0
8,73
8.4
9,11
7.2
9,80
9.9
11,5
57.3
15,7
21.4
16,0
19.9
18,5
79.4
30,3
99.1
29,7
07.4
11.
Jhar
khan
d4,
904.
44,
319.
75,
127.
36,
155.
87,
392.
47,
983.
99,
870.
310
,036
.412
,303
.510
,720
.812
,025
.311
,711
.417
,735
.521
,898
.029
,553
.529
,352
.338
,819
.341
,188
.0
12.
Karn
atak
a7,
569.
78,
315.
29,
763.
911
,675
.514
,406
.517
,644
.520
,444
.925
,104
.428
,685
.332
,373
.237
,829
.341
,587
.751
,509
.259
,432
.970
,665
.576
,436
.590
,644
.597
,528
.4
13.
Kera
la6,
338.
35,
924.
27,
344.
57,
524.
17,
188.
69,
010.
310
,859
.012
,033
.613
,622
.818
,739
.721
,645
.723
,952
.628
,513
.833
,088
.439
,058
.240
,844
.346
,118
.549
,832
.3
14.
Mad
hya
Prad
esh
7,15
7.8
6,78
7.5
7,26
8.4
9,42
5.5
10,6
58.3
12,6
00.2
14,6
87.0
17,6
31.2
23,4
49.8
27,1
30.9
33,3
67.9
35,7
40.8
44,3
83.5
55,5
51.9
65,2
49.2
74,6
35.8
80,0
88.4
98,1
92.6
15.
Mah
aras
htra
15,7
04.2
18,8
77.1
20,4
32.8
24,2
68.2
28,2
76.1
29,7
21.3
36,4
99.7
47,3
58.3
53,8
34.4
61,1
33.5
70,0
28.4
78,1
97.3
88,3
20.7
93,3
15.6
1,04
,677
.01,
06,6
24.0
1,53
,812
.21,
79,8
01.5
16.
Man
ipur
561.
760
2.6
872.
693
8.9
1,04
1.4
1,17
8.5
1,44
8.1
1,53
5.2
1,93
3.5
2,01
7.7
2,05
1.1
2,10
7.0
3,12
8.5
3,07
1.9
3,30
1.8
4,29
8.2
6,72
4.0
6,27
6.6
17.
Meg
hala
ya57
0.0
639.
974
1.2
767.
187
3.0
1,03
8.6
1,22
5.0
1,40
2.4
1,75
1.8
2,34
1.8
2,30
8.8
2,71
5.5
3,30
1.9
3,23
6.7
4,89
5.3
4,57
5.3
6,38
8.2
7,51
9.3
18.
Miz
oram
561.
765
1.7
646.
772
2.5
798.
093
9.9
1,15
0.8
1,46
5.3
1,59
6.2
1,64
0.5
2,11
8.4
2,29
8.3
2,90
1.8
2,89
1.0
3,07
7.4
3,81
4.1
4,57
2.9
4,02
1.1
19.
Nag
alan
d56
6.5
643.
862
8.9
804.
091
4.0
1,05
2.6
1,11
8.7
1,16
8.7
1,57
8.9
1,60
6.3
1,96
9.0
2,15
0.1
2,50
3.9
2,72
5.2
3,58
2.6
4,47
9.7
4,56
1.6
5,24
7.8
20.
Odi
sha
4,21
0.5
4,36
0.1
4,59
8.1
5,38
6.1
6,12
6.5
8,19
5.9
11,0
90.8
12,5
17.0
15,2
41.4
18,0
51.5
19,6
59.2
24,8
10.2
29,2
49.0
36,2
53.1
39,6
39.4
45,1
62.3
56,7
39.8
66,5
88.1
21.
Punj
ab2,
990.
03,
525.
43,
747.
24,
051.
94,
706.
14,
991.
16,
862.
37,
112.
08,
345.
69,
974.
012
,563
.413
,083
.815
,506
.516
,284
.148
,268
.717
,390
.424
,621
.628
,411
.7
22.
Raja
stha
n8,
032.
49,
228.
19,
844.
810
,920
.012
,579
.614
,683
.119
,427
.321
,575
.122
,787
.827
,845
.233
,697
.741
,898
.654
,816
.562
,257
.967
,521
.976
,232
.889
,881
.999
,558
.4
23.
Sikk
im34
8.4
406.
247
9.2
500.
654
7.4
663.
181
6.5
1,01
0.1
1,06
3.0
1,44
9.8
1,39
0.9
1,69
1.0
1,77
2.5
1,60
3.6
1,83
8.2
2,27
4.2
3,09
1.2
3,12
5.8
24.
Tam
il N
adu
9,66
2.3
11,5
85.6
13,6
16.6
14,2
97.5
16,9
21.2
19,9
94.0
26,8
89.7
29,3
45.3
36,4
93.2
41,8
96.6
46,7
53.2
55,1
17.9
62,7
57.9
70,0
57.8
69,6
89.3
71,7
92.6
90,3
90.1
91,9
61.5
25.
Tela
ngan
a–
––
––
––
––
––
–24
,433
.742
,509
.547
,949
.050
,203
.869
,762
.152
,319
.6
26.
Trip
ura
973.
796
2.6
1,12
1.3
1,12
1.4
1,20
6.2
1,39
9.0
1,67
9.9
2,18
2.6
2,15
7.4
2,68
6.6
2,87
3.1
3,25
4.3
5,07
6.9
5,69
0.2
5,95
1.1
5,86
7.6
8,19
5.9
8,71
9.3
27.
Utta
r Pra
desh
13,1
03.0
12,9
99.5
16,9
31.8
20,1
40.7
24,0
32.4
30,0
06.1
39,5
06.8
47,2
49.6
50,6
73.8
59,7
16.1
67,4
35.8
76,5
55.0
86,3
21.7
1,08
,196
.31,
29,7
56.3
1,17
,089
.21,
70,1
89.7
1,82
,456
.8
28.
Utta
rakh
and
1,70
7.8
2,02
7.1
2,32
6.9
2,78
1.4
3,22
6.4
3,72
5.8
4,18
5.1
5,62
2.1
5,95
3.9
7,38
4.9
7,96
8.5
9,37
7.4
12,9
94.0
13,4
02.0
14,5
09.4
15,4
23.1
17,4
37.7
20,2
22.5
29.
Wes
t Ben
gal
8,46
3.0
9,00
8.1
9,73
2.0
11,4
44.9
13,1
41.9
16,1
92.0
19,4
67.2
27,7
02.9
30,5
57.2
35,6
09.3
40,1
03.5
45,5
81.5
57,2
64.4
67,8
36.9
74,6
97.7
87,8
44.7
99,5
96.5
1,01
,221
.6
30.
NC
T D
elhi
3,49
2.1
3,46
4.6
4,26
7.2
4,56
6.4
5,13
9.0
7,35
3.4
8,92
2.4
10,5
07.5
10,8
12.5
13,2
14.3
14,5
66.0
15,4
33.7
16,0
61.2
17,6
36.3
19,6
07.7
22,2
84.8
28,0
88.6
34,6
63.1
31.
Pudu
cher
ry–
––
797.
382
8.5
926.
81,
062.
41,
365.
71,
557.
21,
723.
11,
409.
11,
873.
32,
260.
02,
465.
52,
359.
12,
499.
42,
929.
23,
095.
7
All S
tate
s an
d U
Ts1,
33,6
47.9
1,46
,164
.31,
64,0
76.7
1,89
,429
.82,
22,9
88.2
2,65
,466
.53,
31,5
38.2
3,92
,936
.24,
51,9
37.1
5,23
,569
.36,
02,9
42.7
6,79
,201
.18,
30,0
55.8
9,68
,936
.411
,28,
188.
312
,00,93
4.115
,44,
801.
816
,79,
941.
8
RE: R
evis
ed E
stim
ates
.
BE: B
udge
t Est
imat
es.
‘-’
: Not
app
licab
le/N
ot a
vaila
ble.
*: In
clud
es e
xpen
ditu
re o
n so
cial
ser
vice
s, ru
ral d
evel
opm
ent a
nd fo
od s
tora
ge a
nd w
areh
ousi
ng u
nder
reve
nue
expe
nditu
re, c
apita
l out
lay
and
loan
s an
d ad
vanc
es b
y th
e St
ate
Gov
ernm
ents
. N
ote:
Dat
a fro
m 2
017-
18 o
nwar
ds in
clud
e D
elhi
and
Pud
uche
rry
also
.So
urce
: Bu
dget
doc
umen
ts o
f the
sta
te g
over
nmen
ts. D
etai
ls in
met
hodo
logy
.

Statements
177
Sta
tem
ent
32 :
So
cial
Sec
tor
Exp
end
itur
e* t
o T
ota
l Dis
bur
sem
ent
(Per
cen
t)
Stat
e/U
T20
02-0
320
03-0
420
04-0
520
05-0
620
06-0
720
07-0
820
08-0
920
09-1
020
10-1
120
11-1
220
12-1
320
13-1
420
14-1
520
15-1
620
16-1
720
17-1
820
18-1
9 (R
E)20
19-2
0 (B
E)
12
34
56
78
910
1112
1314
1516
1718
19
1.
And
hra
Pra
desh
32.5
33.3
29.3
30.8
32.9
32.7
38.9
35.6
38.9
39.2
38.2
39.3
41.2
49.3
45.7
49.6
46.8
49.2
2.
Aru
nach
al P
rade
sh30
.928
.331
.230
.430
.231
.129
.933
.728
.132
.430
.532
.834
.627
.834
.137
.234
.432
.2
3.
Ass
am36
.235
.032
.436
.838
.740
.038
.736
.739
.537
.036
.539
.045
.148
.245
.942
.645
.947
.0
4.
Bih
ar36
.436
.730
.538
.441
.043
.843
.941
.838
.240
.044
.443
.444
.846
.948
.050
.056
.155
.5
5.
Chh
attis
garh
41.3
36.2
37.7
44.2
47.6
46.2
50.1
54.2
50.2
51.6
48.7
53.4
50.2
52.2
54.0
52.0
46.4
46.1
6.
Goa
26.1
28.4
31.4
30.9
31.8
31.6
32.2
32.5
33.5
33.1
34.0
35.8
35.2
35.1
35.9
37.2
39.9
38.7
7.
Guj
arat
30.4
27.3
29.0
32.1
33.4
34.9
35.0
38.4
39.9
38.2
38.7
40.0
40.5
42.2
41.3
38.2
39.3
38.5
8.
Har
yana
26.6
18.6
24.2
32.0
28.5
33.3
37.2
41.0
39.6
40.9
40.8
37.0
39.3
31.1
37.2
39.0
38.9
38.7
9.
Him
acha
l Pra
desh
29.8
29.0
29.0
32.7
33.0
35.2
36.6
35.0
37.3
34.6
34.3
37.1
37.5
36.6
34.9
36.7
38.2
38.6
10. J
amm
u an
d K
ashm
ir28
.828
.327
.929
.931
.330
.029
.930
.629
.129
.328
.729
.732
.234
.631
.934
.034
.434
.4
11. J
hark
hand
50.0
44.4
44.1
45.9
47.0
43.5
47.8
44.2
46.4
41.2
39.6
39.0
44.3
40.2
49.9
43.4
48.1
48.2
12. K
arna
taka
31.4
28.4
28.5
33.4
32.7
36.7
37.8
39.9
39.9
37.8
39.2
37.6
40.0
41.7
41.7
41.0
41.7
41.7
13. K
eral
a37
.430
.036
.235
.631
.031
.433
.433
.633
.434
.834
.934
.535
.736
.336
.434
.934
.733
.1
14. M
adhy
a P
rade
sh37
.728
.424
.732
.535
.335
.736
.735
.239
.033
.640
.039
.839
.744
.641
.644
.342
.143
.7
15. M
ahar
asht
ra33
.330
.928
.135
.337
.337
.036
.840
.341
.441
.142
.641
.942
.741
.640
.737
.441
.244
.6
16. M
anip
ur26
.026
.033
.634
.228
.731
.732
.932
.531
.629
.429
.329
.435
.333
.933
.238
.742
.739
.9
17. M
egha
laya
35.9
36.2
35.8
38.2
37.6
37.5
35.7
36.6
36.7
39.4
37.7
39.9
43.3
40.7
48.6
46.9
45.3
46.4
18. M
izor
am40
.035
.735
.633
.334
.836
.740
.141
.538
.636
.639
.740
.843
.344
.041
.141
.642
.837
.6
19. N
agal
and
29.6
27.0
27.6
28.6
29.6
29.5
28.3
25.9
28.3
24.9
27.4
29.8
31.0
29.8
34.9
37.3
32.6
35.4
20. O
dish
a31
.728
.028
.934
.231
.735
.941
.641
.042
.342
.941
.644
.244
.645
.845
.646
.347
.247
.9
21. P
unja
b17
.217
.317
.819
.817
.918
.823
.822
.722
.527
.128
.227
.529
.125
.945
.924
.125
.522
.6
22. R
ajas
than
37.3
35.7
34.1
40.1
39.5
38.9
45.2
44.3
42.4
42.6
41.5
44.5
47.1
36.7
41.7
42.5
42.3
43.0
23. S
ikki
m16
.327
.522
.223
.324
.323
.527
.428
.830
.936
.835
.437
.836
.735
.638
.537
.838
.336
.1
24. T
amil
Nad
u32
.034
.332
.636
.933
.135
.939
.740
.340
.238
.338
.541
.139
.941
.533
.535
.336
.434
.8
25. T
elan
gana
––
––
––
––
––
––
39.2
43.6
39.4
41.8
43.3
35.7
26. T
ripur
a38
.434
.837
.634
.036
.536
.537
.237
.938
.441
.740
.941
.647
.949
.447
.347
.250
.049
.7
27. U
ttar
Pra
desh
31.1
18.7
28.6
33.7
32.1
34.4
37.8
39.0
37.7
38.8
38.8
38.1
36.6
36.3
40.0
36.7
37.9
38.8
28. U
ttar
akha
nd35
.232
.736
.636
.337
.937
.438
.442
.342
.545
.541
.543
.647
.945
.646
.041
.941
.242
.5
29. W
est B
enga
l30
.523
.429
.128
.231
.934
.731
.940
.741
.942
.542
.142
.046
.548
.047
.448
.848
.446
.7
30. N
CT
Del
hi34
.229
.633
.141
.039
.640
.543
.842
.242
.450
.048
.845
.351
.950
.152
.654
.556
.157
.8
31. P
uduc
herr
y-
--
36.7
34.7
35.8
35.9
38.1
38.3
45.9
39.6
37.1
40.4
41.8
38.5
36.9
37.3
36.8
All
Sta
tes
and
UTs
32.6
28.4
29.6
33.7
33.9
35.3
37.6
38.7
39.0
38.7
39.3
39.8
41.0
41.1
41.7
41.1
41.9
41.9
RE: R
evis
ed E
stim
ates
.
BE: B
udge
t Est
imat
es.
‘-’
: Not
app
licab
le/N
ot a
vaila
ble.
*: In
clud
es e
xpen
ditu
re o
n so
cial
ser
vice
s, ru
ral d
evel
opm
ent a
nd fo
od s
tora
ge a
nd w
areh
ousi
ng u
nder
reve
nue
expe
nditu
re, c
apita
l out
lay
and
loan
s an
d ad
vanc
es b
y th
e st
ate
gove
rnm
ents
. N
ote:
Dat
a fro
m 2
017-
18 o
nwar
ds in
clud
e D
elhi
and
Pud
uche
rry
also
.So
urce
: Bu
dget
doc
umen
ts o
f the
sta
te g
over
nmen
ts. D
etai
ls in
met
hodo
logy
.

State Finances : A Study of Budgets of 2019-20
178
Sta
tem
ent
33 :
Rev
enue
Rec
eip
ts o
f S
tate
Go
vern
men
ts a
nd U
Ts(P
er c
ent)
Stat
e/U
T20
17-1
820
18-1
9 (B
E)
2018
-19
(RE
)20
19-2
0 (B
E)
RR
/ G
SD
PO
TR/
GS
DP
ON
TR/
GS
DP
CT/
G
SD
PR
R/
GS
DP
OTR
/ G
SD
PO
NTR
/ G
SD
PC
T/
GS
DP
RR
/ G
SD
PO
TR/
GS
DP
ON
TR/
GS
DP
CT/
G
SD
PR
R/
GS
DP
OTR
/ G
SD
PO
NTR
/ G
SD
PC
T/
GS
DP
12
34
56
78
910
1112
1314
1516
17
1.
And
hra
Pra
desh
13.0
6.5
0.5
6.0
16.7
6.9
0.6
9.2
12.3
6.3
0.5
5.5
16.6
7.0
0.7
8.9
2.
Aru
nach
al P
rade
sh62
.57.
91.
752
.974
.35.
93.
465
.183
.65.
13.
575
.081
.45.
64.
171
.7
3.
Ass
am18
.85.
41.
412
.022
.85.
62.
514
.727
.65.
74.
017
.923
.05.
02.
415
.6
4.
Bih
ar24
.26.
10.
717
.429
.16.
10.
822
.229
.16.
10.
822
.230
.96.
30.
823
.7
5.
Chh
attis
garh
21.0
7.7
2.2
11.0
23.4
8.4
2.6
12.4
23.8
7.3
2.6
13.8
23.7
7.0
2.6
14.0
6.
Goa
15.7
7.1
4.3
4.3
15.4
6.9
3.7
4.7
15.4
6.9
3.7
4.7
15.7
6.8
3.8
5.2
7.
Guj
arat
9.4
5.6
1.1
2.6
9.4
6.0
0.8
2.6
9.4
5.6
0.8
3.0
9.1
5.4
0.8
2.9
8.
Har
yana
10.0
6.7
1.5
1.9
10.9
6.9
1.6
2.3
10.9
7.2
1.3
2.3
10.5
6.5
1.3
2.7
9.
Him
acha
l Pra
desh
19.5
5.4
1.7
12.4
19.8
5.5
1.3
13.1
20.4
4.5
1.5
14.4
20.0
4.7
1.4
13.8
10. J
amm
u an
d K
ashm
ir35
.07.
83.
124
.141
.45.
23.
732
.542
.66.
03.
732
.941
.76.
13.
632
.0
11. J
hark
hand
19.1
5.2
2.8
11.0
22.5
6.3
2.9
13.3
22.6
7.1
3.0
12.5
21.2
6.8
3.0
11.4
12. K
arna
taka
10.9
6.7
0.5
3.7
11.8
6.9
0.5
4.4
11.8
6.9
0.5
4.4
10.7
6.0
0.5
4.2
13. K
eral
a11
.96.
91.
63.
413
.27.
51.
83.
912
.97.
01.
74.
213
.37.
71.
73.
8
14. M
adhy
a P
rade
sh18
.56.
91.
210
.419
.36.
91.
411
.018
.76.
51.
211
.019
.47.
01.
510
.8
15. M
ahar
asht
ra10
.17.
10.
72.
310
.77.
60.
92.
310
.87.
10.
63.
010
.67.
10.
62.
9
16. M
anip
ur42
.85.
00.
737
.148
.94.
00.
943
.947
.24.
00.
742
.545
.94.
11.
040
.8
17. M
egha
laya
31.1
6.3
1.2
23.5
38.0
6.0
1.6
30.4
38.0
6.0
1.6
30.4
39.8
5.8
1.7
32.4
18. M
izor
am48
.44.
82.
241
.340
.03.
01.
535
.538
.92.
21.
535
.338
.12.
21.
834
.1
19. N
agal
and
46.6
4.1
1.6
40.9
48.4
3.0
1.3
44.1
46.1
2.7
1.3
42.0
46.1
2.7
1.2
42.2
20. O
dish
a19
.57.
11.
910
.520
.66.
12.
112
.421
.06.
22.
312
.521
.36.
12.
312
.9
21. P
unja
b11
.16.
60.
93.
614
.18.
22.
04.
013
.56.
31.
95.
213
.76.
61.
65.
5
22. R
ajas
than
15.2
6.5
1.9
6.8
16.3
6.4
2.2
7.8
15.9
6.7
2.1
7.1
16.0
7.2
1.9
6.9
23. S
ikki
m22
.24.
02.
815
.422
.32.
81.
817
.825
.32.
52.
420
.424
.23.
22.
318
.7
24. T
amil
Nad
u10
.06.
60.
72.
710
.66.
80.
73.
110
.96.
60.
93.
310
.66.
70.
73.
2
25. T
elan
gana
11.8
7.7
1.0
3.0
15.1
8.4
1.0
5.7
13.8
7.7
0.7
5.4
11.4
7.0
1.6
2.8
26. T
ripur
a21
.84.
01.
116
.724
.24.
20.
519
.525
.34.
00.
620
.723
.34.
20.
418
.6
27. U
ttar
Pra
desh
20.2
8.0
1.4
10.8
23.6
8.6
2.0
13.1
25.7
9.4
2.0
14.4
24.8
9.1
1.9
13.7
28. U
ttar
akha
nd12
.65.
10.
86.
715
.06.
41.
57.
214
.76.
21.
66.
814
.85.
61.
67.
6
29. W
est B
enga
l13
.15.
80.
37.
012
.54.
70.
37.
513
.05.
20.
47.
412
.25.
00.
36.
9
30. N
CT
Del
hi5.
65.
20.
10.
36.
15.
40.
10.
65.
74.
90.
10.
75.
74.
90.
10.
8
31. P
uduc
herr
y18
.27.
54.
26.
5–
––
–18
.67.
54.
66.
517
.97.
64.
06.
3
All
Sta
tes
and
UTs
13.6
6.6
1.1
5.9
15.1
6.8
1.2
7.0
15.1
6.7
1.2
7.2
14.9
6.7
1.2
7.1
RE:
Rev
ised
Est
imat
es.
BE:
Bud
get E
stim
ates
. R
R: R
even
ue R
ecei
pts.
O
TR: O
wn
Tax
Rev
enue
.O
NTR
: Ow
n N
on-T
ax R
even
ue.
CT:
Cur
rent
Tra
nsfe
rs.
GS
DP
: Gro
ss S
tate
Dom
estic
Pro
duct
.#:
Dat
a fo
r All
Sta
tes
and
UTs
are
as
per c
ent t
o G
DP.
Sou
rce
: Bud
get d
ocum
ents
of t
he s
tate
gov
ernm
ents
. Det
ails
in m
etho
dolo
gy.

Statements
179
Sta
tem
ent
34 :
Rev
enue
Exp
end
itur
e o
f S
tate
Go
vern
men
ts a
nd U
Ts(P
er c
ent)
Stat
e/U
T20
17-1
820
18-1
9 (B
E)
2018
-19
(RE
)20
19-2
0 (B
E)
RE
/G
SD
PD
RE
/G
SD
PN
DR
E/
GS
DP
IP/
GS
DP
PN
/G
SD
PR
E/
GS
DP
DR
E/
GS
DP
ND
RE
/G
SD
PIP
/G
SD
PP
N/
GS
DP
RE
/G
SD
PD
RE
/G
SD
PN
DR
E/
GS
DP
IP/
GS
DP
PN
/G
SD
PR
E/
GS
DP
DR
E/
GS
DP
ND
RE
/G
SD
PIP
/G
SD
PP
N/
GS
DP
12
34
56
78
910
1112
1314
1516
1718
1920
21
1.
And
hra
Pra
desh
15.0
10.1
4.8
1.7
2.0
16.1
11.6
4.5
1.6
1.6
13.5
9.3
4.3
1.5
1.6
16.7
12.7
4.1
1.6
1.3
2.
Aru
nach
al P
rade
sh49
.433
.615
.82.
14.
243
.427
.615
.83.
43.
857
.140
.516
.62.
23.
552
.335
.916
.42.
53.
7
3.
Ass
am19
.211
.57.
61.
12.
921
.914
.77.
11.
32.
525
.217
.27.
81.
32.
522
.014
.57.
31.
32.
5
4.
Bih
ar21
.214
.36.
91.
92.
925
.217
.87.
42.
02.
927
.419
.87.
52.
02.
927
.119
.08.
11.
93.
2
5.
Chh
attis
garh
19.8
14.8
4.5
1.1
1.4
22.0
16.3
5.3
1.2
1.7
25.8
20.4
5.1
1.2
1.5
23.4
18.0
5.2
1.4
1.5
6.
Goa
15.0
10.0
5.0
1.8
1.7
15.2
10.6
4.6
1.8
1.4
15.2
10.6
4.6
1.8
1.4
15.2
10.3
4.9
1.8
1.6
7.
Guj
arat
9.0
5.8
3.1
1.4
1.1
9.0
5.5
3.5
1.3
1.0
9.3
6.1
3.1
1.4
1.0
8.9
5.6
3.3
1.3
0.9
8.
Har
yana
11.7
7.4
4.3
1.9
1.4
12.0
7.8
4.2
2.0
1.2
12.1
7.8
4.2
2.0
1.2
12.0
7.5
4.5
2.1
1.1
9.
Him
acha
l Pra
desh
19.2
11.4
7.8
2.7
3.3
21.9
13.4
8.5
2.8
3.8
21.8
13.5
8.3
2.7
3.8
21.4
12.9
8.5
2.7
3.9
10. J
amm
u an
d K
ashm
ir29
.517
.412
.23.
43.
932
.517
.914
.73.
03.
337
.522
.614
.83.
63.
733
.819
.814
.04.
13.
7
11. J
hark
hand
18.4
12.4
6.0
1.7
2.1
20.4
14.4
6.0
1.8
1.8
20.3
14.3
6.0
1.8
1.8
18.7
13.5
5.2
1.5
1.6
12. K
arna
taka
10.6
7.5
2.6
1.0
0.9
11.8
8.1
3.2
1.2
1.3
11.8
8.2
3.2
1.1
1.2
10.7
7.3
3.0
1.1
1.1
13. K
eral
a14
.36.
76.
52.
22.
814
.97.
26.
51.
92.
314
.56.
86.
82.
02.
514
.36.
66.
62.
02.
2
14. M
adhy
a P
rade
sh17
.912
.54.
41.
51.
319
.213
.35.
01.
61.
618
.712
.94.
81.
51.
619
.313
.64.
91.
61.
5
15. M
ahar
asht
ra10
.06.
13.
31.
40.
811
.36.
83.
71.
30.
811
.37.
23.
31.
30.
811
.26.
93.
61.
20.
9
16. M
anip
ur38
.321
.015
.12.
35.
542
.625
.614
.82.
44.
747
.127
.916
.72.
45.
844
.625
.716
.92.
35.
8
17. M
egha
laya
28.2
18.7
9.5
2.0
2.5
36.5
25.7
10.8
2.0
2.4
36.5
25.7
10.8
2.0
2.4
37.8
26.1
11.6
2.1
2.4
18. M
izor
am38
.826
.212
.61.
94.
732
.219
.312
.91.
84.
036
.624
.012
.61.
84.
032
.520
.711
.81.
44.
1
19. N
agal
and
43.1
24.9
18.3
2.9
5.4
46.6
27.0
19.6
3.2
6.9
44.1
24.0
20.1
3.0
6.6
44.3
25.2
19.1
3.1
7.0
20. O
dish
a16
.511
.54.
61.
12.
018
.612
.85.
51.
12.
518
.813
.25.
31.
22.
320
.114
.35.
61.
22.
5
21. P
unja
b13
.05.
67.
23.
22.
116
.58.
47.
33.
12.
015
.87.
97.
23.
12.
015
.77.
77.
13.
11.
9
22. R
ajas
than
17.5
12.3
5.2
2.4
1.7
18.2
12.5
5.7
2.3
2.1
18.6
12.7
5.9
2.3
2.2
18.6
13.0
5.7
2.3
2.2
23. S
ikki
m17
.710
.96.
51.
52.
220
.011
.68.
11.
72.
422
.013
.97.
81.
72.
423
.313
.89.
21.
83.
9
24. T
amil
Nad
u11
.56.
64.
11.
81.
511
.66.
44.
31.
71.
712
.06.
74.
41.
71.
711
.36.
04.
31.
71.
7
25. T
elan
gana
11.3
7.2
4.1
1.4
1.6
14.5
10.7
3.8
1.4
1.4
13.7
10.0
3.7
1.4
1.4
11.2
7.9
3.3
1.5
1.0
26. T
ripur
a22
.512
.79.
51.
93.
422
.712
.69.
72.
03.
522
.112
.69.
11.
63.
621
.712
.68.
71.
53.
5
27. U
ttar
Pra
desh
19.3
10.8
7.7
2.1
2.8
21.8
11.7
9.2
2.2
3.1
22.5
12.4
9.3
2.2
3.2
23.0
12.6
9.5
2.2
3.4
28. U
ttar
akha
nd13
.57.
15.
81.
92.
315
.08.
26.
02.
12.
314
.67.
76.
12.
12.
414
.88.
06.
02.
02.
3
29. W
est B
enga
l14
.18.
85.
22.
81.
512
.57.
84.
62.
31.
313
.68.
74.
82.
51.
312
.27.
74.
52.
31.
2
30. N
CT
Del
hi4.
93.
71.
00.
4–
5.5
4.2
1.1
0.4
–5.
13.
71.
10.
4–
5.1
3.8
0.9
0.4
–
31. P
uduc
herr
y17
.611
.95.
72.
12.
3–
––
––
18.5
12.3
6.1
1.9
2.6
17.9
11.8
6.1
2.3
2.3
All
Sta
tes
and
UTs
13.7
8.6
4.7
1.7
1.6
14.9
9.4
5.0
1.7
1.6
15.1
9.7
5.0
1.7
1.7
14.9
9.5
5.0
1.7
1.6
BE:
Bud
get E
stim
ates
. R
E: R
even
ue E
xpen
ditu
re.
ND
RE:
Non
-dev
elop
men
t Rev
enue
Exp
endi
ture
IP
: Int
eres
t Pay
men
t. P
N: P
ensi
on
DR
E: D
evel
opm
ent R
even
ue E
xpen
ditu
re
GS
DP
: Gro
ss S
tate
Dom
estic
Pro
duct
. ‘-’
: Nil/
Neg
ligib
le#:
Dat
a fo
r All
Sta
tes/
UTs
are
as
per c
ent t
o G
DP.
Sou
rce
: Bud
get d
ocum
ents
of t
he s
tate
gov
ernm
ents
. Det
ails
in m
etho
dolo
gy.

State Finances : A Study of Budgets of 2019-20
180
Sta
tem
ent
35 :
Dev
elo
pm
ent
Exp
end
itur
e: S
elec
t In
dic
ato
rs(P
er c
ent)
Stat
e/U
T20
17-1
820
18-1
9 (B
E)
2018
-19
(RE
)20
19-2
0 (B
E)
DE
V/
GS
DP
SS
E/
GS
DP
CO
/G
SD
PD
EV
/G
SD
PS
SE
/G
SD
PC
O/
GS
DP
DE
V/
GS
DP
SS
E/
GS
DP
CO
/G
SD
PD
EV
/G
SD
PS
SE
/G
SD
PC
O/
GS
DP
12
34
56
78
910
1112
13
1.
And
hra
Pra
des
h12
.19.
01.
714
.710
.43.
111
.68.
12.
215
.310
.43.
0
2.
Aru
nach
al P
rad
esh
45.6
24.8
14.5
44.3
24.7
33.4
67.8
31.2
30.9
52.3
27.9
31.2
3.
Ass
am14
.29.
72.
718
.913
.14.
122
.914
.96.
018
.612
.84.
2
4.
Bih
ar19
.714
.16.
023
.217
.86.
025
.519
.76.
224
.919
.46.
4
5.
Chh
attis
garh
18.3
12.4
3.5
20.8
13.3
4.6
24.3
14.0
3.9
21.5
12.7
3.6
6.
Goa
12.4
7.1
3.0
15.2
8.8
5.4
15.2
8.8
5.4
14.9
8.6
5.6
7.
Guj
arat
7.8
4.6
2.0
7.5
4.7
2.0
8.3
4.9
2.1
7.6
4.6
1.9
8.
Har
yana
9.7
5.7
2.2
10.1
6.2
2.2
10.1
6.0
2.3
9.6
5.8
2.1
9.
Him
acha
l Pra
des
h14
.39.
02.
716
.410
.42.
817
.010
.53.
215
.710
.12.
7
10. J
amm
u an
d K
ashm
ir24
.313
.47.
533
.215
.716
.538
.719
.617
.333
.917
.415
.6
11. J
hark
hand
17.2
10.6
4.3
18.7
12.6
4.0
18.7
12.6
4.2
17.7
11.7
4.0
12. K
arna
taka
10.1
5.7
2.3
11.0
6.6
2.5
11.0
6.4
2.6
9.8
5.7
2.4
13. K
eral
a8.
25.
81.
28.
66.
21.
38.
35.
91.
38.
65.
81.
9
14. M
adhy
a P
rad
esh
16.9
10.2
4.2
17.0
10.4
3.6
16.4
9.9
3.4
17.3
10.6
3.6
15. M
ahar
asht
ra7.
24.
41.
18.
15.
61.
48.
85.
81.
68.
26.
01.
4
16. M
anip
ur26
.417
.85.
933
.821
.88.
739
.126
.011
.933
.121
.97.
9
17. M
egha
laya
21.9
15.3
3.3
30.3
19.4
4.7
30.3
19.4
4.7
31.4
20.7
4.8
18. M
izor
am36
.921
.511
.324
.115
.28.
933
.120
.59.
923
.215
.57.
4
19. N
agal
and
29.1
19.0
5.4
30.0
20.1
5.2
29.5
17.6
7.2
28.8
18.4
4.8
20. O
dis
ha16
.710
.34.
817
.811
.45.
118
.111
.74.
918
.812
.34.
5
21. P
unja
b6.
23.
60.
59.
85.
01.
29.
14.
70.
911
.74.
94.
0
22. R
ajas
than
14.8
9.1
2.5
15.2
9.7
2.8
15.0
9.7
2.3
15.0
9.7
1.9
23. S
ikki
m16
.79.
76.
416
.18.
84.
920
.211
.56.
617
.210
.23.
6
24. T
amil
Nad
u8.
34.
91.
48.
35.
21.
78.
65.
41.
67.
84.
91.
7
25. T
elan
gana
11.1
6.7
3.2
15.4
8.6
3.9
13.9
8.1
3.1
10.5
5.3
1.7
26. T
ripur
a16
.312
.73.
916
.913
.54.
817
.614
.25.
316
.813
.54.
4
27. U
ttar
Pra
des
h13
.58.
52.
816
.610
.75.
018
.611
.56.
017
.411
.54.
9
28. U
ttar
akha
nd9.
57.
22.
810
.88.
12.
89.
87.
42.
310
.37.
72.
5
29. W
est
Ben
gal
10.7
8.8
1.9
9.9
7.9
2.2
10.8
8.5
2.1
9.7
7.5
2.0
30. N
CT
Del
hi4.
43.
20.
55.
24.
10.
74.
53.
60.
55.
04.
01.
1
31. P
uduc
herr
y12
.87.
61.
2-
--
13.5
8.0
1.2
13.0
7.6
1.3
All
Sta
tes
and
UTs
11.0
7.0
2.3
12.3
8.0
2.9
12.6
8.1
2.9
12.2
8.0
2.8
BE:
Bud
get E
stim
ates
. R
E: R
even
ue E
xpen
ditu
re.
DEV
: Dev
elop
men
t Exp
endi
ture
. C
O: C
apita
l Out
lay.
SS
E: S
ocia
l Sec
tor E
xpen
ditu
re
GS
DP
: Gro
ss S
tate
Dom
estic
Pro
duct
.#:
Dat
a fo
r All
Sta
tes/
UTs
are
as
per c
ent t
o G
DP.
Sou
rce
: Bud
get d
ocum
ents
of t
he s
tate
gov
ernm
ents
. Det
ails
in m
etho
dolo
gy.

2019-20 Appendices I to IV


Appendix I
183
Appendix I: Revenue Receipts of States and Union Territories with Legislature
(₹ Lakh)
Item
ANDHRA PRADESH ARUNACHAL PRADESH
2017-18(Accounts)
2018-19(Budget
Estimates)
2018-19(Revised
Estimates)
2019-20(Budget
Estimates)
2017-18(Accounts)
2018-19(Budget
Estimates)
2018-19(Revised
Estimates)
2019-20(Budget
Estimates)
1 2 3 4 5 2 3 4 5
TOTAL REVENUE (I+II) 1,05,06,209.6 1,55,50,723.0 1,14,68,414.5 1,78,69,741.8 13,77,460.3 17,55,356.6 19,74,904.0 20,85,792.0
I. TAX REVENUE (A+B) 78,48,757.2 97,46,485.0 90,83,601.6 1,10,27,118.0 10,05,435.9 11,89,847.1 11,63,614.0 13,01,110.0
A. State’s Own Tax Revenue (1 to 3) 52,41,373.5 64,43,881.0 58,69,478.6 75,43,770.3 1,74,712.9 1,38,770.1 1,20,000.0 1,44,000.0
1. Taxes on Income (i+ii) 24,501.7 39,976.0 25,227.2 49,470.4 – – – –
i) Agricultural Income Tax – – – – – – – –
ii) Taxes on Professions, Trades, Callings and Employment 24,501.7 39,976.0 25,227.2 49,470.4 – – – –
2. Taxes on Property and Capital
Transactions (i to iii) 4,50,991.8 5,50,000.0 5,64,422.9 7,22,000.0 2,373.6 1,392.6 2,615.0 2,872.1
i) Land Revenue 10,734.1 30,000.0 5,724.3 30,000.0 1,332.0 778.8 1,465.1 1,611.7
ii) Stamps and Registration Fees 4,27,052.0 4,88,000.0 5,42,780.9 6,60,000.0 1,041.7 613.8 1,149.8 1,260.4
iii) Urban Immovable Property Tax 13,205.6 32,000.0 15,917.7 32,000.0 – – – –
3. Taxes on Commodities and Services
(i to viii) 47,65,880.0 58,53,905.0 52,79,828.5 67,72,300.0 1,72,339.3 1,37,377.5 1,17,385.0 1,41,128.0
i) Sales Tax (a to e) 25,33,501.1 38,44,800.0 21,91,445.9 28,00,000.0 28,512.5 37,473.1 28,313.0 31,144.3
a) State Sales Tax/VAT 24,47,042.0 37,66,415.9 21,52,798.6 27,42,655.1 28,512.5 37,473.1 28,313.0 31,144.3
b) Central Sales Tax 82,844.0 78,384.1 38,387.0 57,083.7 – – – –
c) Surcharge on Sales Tax – – – – – – – –
d) Receipts of Turnover Tax 3,234.8 – 64.3 65.0 – – – –
e) Other Receipts 380.3 – 196.0 196.2 – – – –
ii) State Excise 5,46,029.6 7,35,750.0 6,22,020.2 8,51,800.0 12,261.0 13,095.5 14,713.2 20,835.8
iii) Taxes on Vehicles 3,03,898.1 3,68,750.0 3,35,883.0 4,00,000.0 3,140.4 2,959.0 3,454.5 3,799.9
iv) Taxes on Goods and Passengers 499.9 – 2,620.2 500.0 12,896.2 – 424.0 –
v) Taxes and Duties on Electricity 1,596.8 35,000.0 1,146.7 10,000.0 – – – –
vi) Entertainment Tax 3,268.5 12,861.3 137.6 – – – – –
vii) SGST 13,74,798.7 8,39,605.0 21,25,707.4 27,00,000.0 1,15,529.2 83,849.9 70,480.4 85,348.0
viii) Other Taxes and Duties 2,287.4 17,138.7 867.7 10,000.0 – – – –
B. Share in Central Taxes (i to x) 26,07,383.8 33,02,604.0 32,14,123.0 34,83,347.7 8,30,723.0 10,51,077.0 10,43,614.0 11,57,110.0
i) Corporation Tax 8,87,973.0 9,52,644.0 11,40,139.0 11,86,832.0 2,82,584.0 3,03,164.0 3,30,780.0 3,74,731.0
ii) Income Tax 7,49,830.0 8,43,037.0 8,39,665.0 9,07,265.0 2,38,620.0 2,68,283.0 2,68,077.0 3,14,846.0
iii) Estate Duty – – – – – – – –
iv) Other Taxes on Income and Expenditure -11.3 24.0 5,938.0 29.7 – – 33,866.0 –
v) Taxes on Wealth -27.0 -30.0 418.0 -32.0 -8.0 -10.0 -10.0 -10.0
vi) Customs 2,92,640.0 1,67,158.0 2,32,394.0 2,50,740.0 93,130.0 53,196.0 64,751.0 72,708.0
vii) Union Excise Duties 3,05,890.0 1,62,892.0 1,54,439.0 1,89,951.0 97,350.0 51,838.0 51,690.0 44,636.0
viii) Service Tax 2,97,488.0 – 30,250.0 – 1,06,255.0 – 5,202.0 –
ix) CGST 40,940.0 10,91,911.0 8,09,186.0 9,48,562.0 12,792.0 3,47,484.0 2,89,258.0 3,50,199.0
x) Other Taxes and Duties on Commodities and Services 32,661.0 84,968.0 1,694.0 – – 27,122.0 – –
II. NON-TAX REVENUE (C+D) 26,57,452.4 58,04,238.0 23,84,813.0 68,42,623.8 3,72,024.4 5,65,509.5 8,11,290.0 7,84,682.0
C. State’s Own Non-Tax Revenue (1 to 6) 3,81,381.7 5,34,660.0 4,39,140.5 7,35,472.3 36,618.7 80,000.0 82,500.0 1,05,000.0
1. Interest Receipts 9,608.6 27,529.7 5,010.9 15,000.0 4,697.8 9,225.7 10,067.6 11,884.4
2. Dividends and Profits 100.4 1,680.0 131.8 500.0 0.2 – – –
3. General Services 1,00,501.2 74,622.5 67,635.2 94,035.2 4,048.6 14,482.6 9,528.1 12,230.0
of which: State Lotteries – – – – – – – –

State Finances : A Study of Budgets of 2019-20
184
Item
ANDHRA PRADESH ARUNACHAL PRADESH
2017-18(Accounts)
2018-19(Budget
Estimates)
2018-19(Revised
Estimates)
2019-20(Budget
Estimates)
2017-18(Accounts)
2018-19(Budget
Estimates)
2018-19(Revised
Estimates)
2019-20(Budget
Estimates)
1 2 3 4 5 2 3 4 5
4. Social Services ( i to ix) -56,965.1 45,144.3 62,260.9 62,661.4 3,586.0 5,358.0 7,025.9 9,569.9
i) Education, Sports, Art and Culture 10,358.2 17,910.7 3,096.7 10,000.0 456.8 561.0 789.1 1,077.4
ii) Medical and Public Health 17,175.2 16,360.0 22,203.9 25,000.0 77.9 101.6 306.7 522.7
iii) Family Welfare 2.8 10.2 0.1 3.0 0.1 – – –
iv) Housing 90.6 159.1 437.8 500.0 0.9 4.8 5.1 5.9
v) Urban Development -89,143.3 2,074.3 21,808.6 22,000.0 395.7 676.0 909.8 1,516.2
vi) Labour and Employment 2,099.6 5,748.7 2,225.7 2,500.0 2,128.6 3,078.9 3,732.8 4,717.7
vii) Social Security and Welfare 166.2 754.4 11,725.4 500.0 12.7 39.9 41.9 48.2
viii) Water Supply and Sanitation 1,193.8 1,381.6 585.2 1,421.2 505.0 882.4 1,226.6 1,665.6
ix) Others 1,091.9 745.3 177.6 737.2 8.2 13.3 14.0 16.1
5. Fiscal Services – – – – – – – –
6. Economic Services ( i to xvii ) 3,28,136.6 3,85,683.6 3,04,101.6 5,63,275.7 24,286.1 50,933.7 55,878.3 71,315.8
i) Crop Husbandry 2,228.3 592.8 250.9 592.8 220.2 220.2 431.2 765.9
ii) Animal Husbandry 35.2 210.8 26.4 50.0 171.1 176.7 285.5 413.3
iii) Fisheries -117.0 420.5 308.7 432.8 18.3 21.8 22.9 26.3
iv) Forestry and Wildlife 34,156.8 60,000.0 42,584.0 1,04,505.4 1,344.1 3,314.7 4,478.5 6,626.3
v) Plantations – – – – – – – –
vi) Co-operation 1,801.1 2,816.2 2,273.9 2,897.0 121.5 148.8 356.3 579.7
vii) Other Agricultural Programmes 0.1 2.2 6.5 7.0 31.8 76.2 80.1 92.1
viii) Major and Medium Irrigation Projects 16,860.3 32,600.0 12,556.6 30,700.0 – – – –
ix) Minor Irrigation 199.5 398.1 31.6 409.5 12.3 12.1 12.7 14.6
x) Power 751.2 2,980.1 863.7 950.0 13,340.9 34,050.0 35,100.0 44,237.2
xi) Petroleum – – – – – – – –
xii) Village and Small Industries 700.6 849.9 660.3 849.9 1,542.9 127.1 1,633.4 2,053.4
xiii) Industries@ 2,15,637.5 2,50,116.6 2,21,053.8 3,95,119.9 4,885.8 8,986.9 8,988.6 10,719.3
xiv) Ports and Light Houses 16,910.1 26,000.0 15,036.6 18,000.0 – – – –
xv) Road Transport – – – – 1,836.8 2,755.0 3,192.8 3,726.7
xvi) Tourism 5.6 13.8 1.6 14.2 119.8 127.1 233.4 553.4
xvii) Others* 38,967.3 8,682.6 8,447.0 8,747.1 640.7 917.2 1,063.1 1,507.6
D. Grants from the Centre (1 to 5) 22,76,070.6 52,69,578.0 19,45,672.5 61,07,151.5 3,35,405.7 4,85,509.5 7,28,790.0 6,79,682.0
1. State Plan Schemes – – 32,688.0 – 20,693.6 – 18,800.0 20,000.0
of which: Advance release of Plan
Assistance for Natural Calamities – – – – – – – –
2. Central Plan Schemes -20,000.0 – – – 1,367.8 – – –
3. Centrally Sponsored Schemes 15,48,179.0 31,69,428.0 12,50,944.8 42,25,701.5 2,70,784.0 4,45,035.0 5,49,592.0 5,42,500.0
4. NEC/ Special Plan Scheme – – – – 21,198.8 17,096.0 29,500.0 20,000.0
5. Non-Plan Grants (a to c) 7,47,891.6 21,00,150.0 6,62,039.7 18,81,450.0 21,361.5 23,378.5 1,30,898.0 97,182.0
a) Statutory Grants 6,97,457.7 6,80,200.0 6,55,303.7 6,71,500.0 – – – –
b) Grants for relief on account
of Natural Calamities – – – – 5,130.0 5,400.0 5,400.0 5,700.0
c) Others 50,433.9 14,19,950.0 6,736.0 12,09,950.0 16,231.5 17,978.5 1,25,498.0 91,482.0
of which: GST Compensation cess
i) GST compensation – – – – – – – –
ii) VAT compensation – – – – – – – –
iii) Central sales tax compensation 50,021.0 – – – – – – –
iv) Compensation cess – 2,00,000.0 – – – – – –
Appendix I: Revenue Receipts of States and Union Territories with Legislature (Contd.)
(₹ Lakh)
See ‘Notes to Appendix I’.

Appendix I
185
Appendix I: Revenue Receipts of States and Union Territories with Legislature (Contd.)
(₹ Lakh)
Item
ASSAM BIHAR
2017-18(Accounts)
2018-19(Budget
Estimates)
2018-19(Revised
Estimates)
2019-20(Budget
Estimates)
2017-18(Accounts)
2018-19(Budget
Estimates)
2018-19(Revised
Estimates)
2019-20(Budget
Estimates)
1 2 3 4 5 2 3 4 5
TOTAL REVENUE (I+II) 54,13,093.8 74,11,849.7 89,85,430.4 83,14,799.2 1,17,44,673.7 1,58,05,140.9 1,58,05,140.9 1,76,74,763.9
I. TAX REVENUE (A+B) 35,51,706.0 43,54,699.6 43,72,386.4 52,36,835.4 88,21,987.4 1,07,17,439.6 1,07,17,439.6 1,22,92,179.0
A. State’s Own Tax Revenue (1 to 3) 15,46,692.0 18,14,700.6 18,50,801.4 17,99,415.4 29,70,849.1 33,03,167.6 33,03,167.6 36,17,469.1
1. Taxes on Income (i+ii) 20,690.1 24,282.5 24,282.5 24,113.0 8,651.5 10,200.0 10,200.0 13,800.0
i) Agricultural Income Tax 1,352.2 2,698.6 2,698.6 1,450.0 – – – –
ii) Taxes on Professions, Trades, Callings and Employment 19,337.9 21,583.9 21,583.9 22,663.0 8,651.5 10,200.0 10,200.0 13,800.0
2. Taxes on Property and Capital
Transactions (i to iii) 45,855.8 52,852.6 59,652.8 65,009.8 4,50,431.7 5,70,000.0 5,70,000.0 5,80,000.0
i) Land Revenue 21,939.3 25,411.9 32,212.1 25,329.8 77,865.3 1,00,000.0 1,00,000.0 1,10,000.0
ii) Stamps and Registration Fees 23,916.5 27,440.7 27,440.7 39,680.0 3,72,566.4 4,70,000.0 4,70,000.0 4,70,000.0
iii) Urban Immovable Property Tax – – – – – – – –
3. Taxes on Commodities and Services
(i to viii) 14,80,146.1 17,37,565.5 17,66,866.1 17,10,292.5 25,11,765.9 27,22,967.6 27,22,967.6 30,23,669.1
i) Sales Tax (a to e) 6,37,300.0 4,04,131.0 4,52,962.5 4,85,625.0 8,29,809.9 7,89,000.0 7,89,000.0 7,15,000.0
a) State Sales Tax/VAT 6,02,161.1 3,87,262.0 4,12,262.0 4,65,075.0 1,11,747.0 – – –
b) Central Sales Tax 33,840.2 16,869.0 40,700.5 20,550.0 5,390.4 1,000.0 1,000.0 5,000.0
c) Surcharge on Sales Tax – – – – – – – –
d) Receipts of Turnover Tax – – – – 0.3 – – –
e) Other Receipts 1,298.7 – – – 7,12,672.3 7,88,000.0 7,88,000.0 7,10,000.0
ii) State Excise 1,09,515.6 1,30,000.0 1,30,000.0 1,45,000.0 -343.1 – – –
iii) Taxes on Vehicles 64,695.4 73,735.2 1,23,735.2 89,830.8 1,59,950.5 2,00,000.0 2,00,000.0 2,50,000.0
iv) Taxes on Goods and Passengers 26,263.4 1,064.8 1,064.8 95.0 1,64,485.4 – – 5,000.0
v) Taxes and Duties on Electricity 6,019.3 6,190.4 6,190.4 14,250.8 23,916.1 31,000.0 31,000.0 35,000.0
vi) Entertainment Tax 65.9 – – – 1,748.4 – – –
vii) SGST 6,32,907.2 11,22,444.1 10,52,913.1 9,75,491.0 13,31,896.2 17,02,965.0 17,02,965.0 20,18,669.1
viii) Other Taxes and Duties 3,379.3 – – – 302.4 2.6 2.6 –
B. Share in Central Taxes (i to x) 20,05,014.0 25,39,999.0 25,21,585.0 34,37,420.0 58,51,138.3 74,14,272.0 74,14,272.0 86,74,710.0
i) Corporation Tax 6,82,945.0 7,32,684.0 7,99,425.0 9,83,440.8 19,93,556.0 21,38,747.0 21,38,747.0 25,02,334.0
ii) Income Tax 5,76,700.0 6,48,384.0 6,47,884.0 7,64,838.0 16,83,416.0 18,92,671.0 18,92,671.0 22,14,425.1
iii) Estate Duty – – – – – – – –
iv) Other Taxes on Income and Expenditure – – – – – – – –
v) Taxes on Wealth -20.0 -23.0 -25.0 – -60.0 -68.0 -68.0 -68.0
vi) Customs 2,25,070.0 1,28,562.0 1,56,489.0 4,48,266.0 6,57,000.0 3,75,281.0 3,75,281.0 4,39,078.8
vii) Union Excise Duties 2,35,260.0 1,25,281.0 1,24,924.0 3,44,579.0 6,86,750.0 3,65,703.0 3,65,703.0 4,27,872.5
viii) Service Tax 2,53,480.0 – 12,254.0 – 7,37,929.3 1,90,528.0 1,90,528.0 2,22,917.8
ix) CGST 31,580.0 9,05,111.0 7,80,634.0 8,96,296.2 92,548.0 24,51,411.0 24,51,411.0 28,68,150.9
x) Other Taxes and Duties on Commodities and Services -1.0 – – – -1.0 -1.0 -1.0 -1.0
II. NON-TAX REVENUE (C+D) 18,61,387.8 30,57,150.1 46,13,044.0 30,77,963.8 29,22,686.3 50,87,701.3 50,87,701.3 53,82,584.8
C. State’s Own Non-Tax Revenue (1 to 6) 4,07,196.8 8,19,166.6 13,15,978.7 8,53,165.0 3,50,673.7 4,44,589.0 4,44,589.0 4,80,646.7
1. Interest Receipts 30,538.9 58,573.8 1,08,573.8 37,626.9 1,57,723.7 2,18,738.7 2,18,738.7 2,29,384.4
2. Dividends and Profits 22,555.1 15,332.8 15,332.8 27,790.1 133.9 375.1 375.1 175.0
3. General Services 16,923.7 35,360.8 1,35,355.8 21,091.4 47,385.8 30,182.3 30,182.3 33,593.2
of which: State Lotteries 0.3 – – 0.3 0.1 – – –

State Finances : A Study of Budgets of 2019-20
186
Item
ASSAM BIHAR
2017-18(Accounts)
2018-19(Budget
Estimates)
2018-19(Revised
Estimates)
2019-20(Budget
Estimates)
2017-18(Accounts)
2018-19(Budget
Estimates)
2018-19(Revised
Estimates)
2019-20(Budget
Estimates)
1 2 3 4 5 2 3 4 5
4. Social Services ( i to ix) 7,401.8 5,487.0 5,539.4 9,119.7 12,404.4 8,873.4 8,873.4 11,234.8
i) Education, Sports, Art and Culture 2,661.3 1,945.7 1,945.7 3,279.0 2,147.1 1,756.9 1,756.9 2,152.7
ii) Medical and Public Health 2,268.4 1,518.7 1,518.7 2,794.9 5,452.5 4,692.8 4,692.8 5,506.6
iii) Family Welfare 0.4 – 0.4 0.5 2.2 – – 2.2
iv) Housing 1,307.2 597.9 597.9 1,610.7 656.6 370.0 370.0 256.7
v) Urban Development 0.1 – 0.1 0.1 743.1 75.0 75.0 756.0
vi) Labour and Employment 998.8 1,194.5 1,194.5 1,230.6 1,679.3 1,191.1 1,191.1 1,740.5
vii) Social Security and Welfare 70.6 93.0 144.9 87.0 16.6 21.1 21.1 17.4
viii) Water Supply and Sanitation 93.4 135.6 135.6 115.0 1,662.6 741.3 741.3 757.5
ix) Others 1.5 1.6 1.6 1.9 44.4 25.2 25.2 45.3
5. Fiscal Services – – – – – – – –
6. Economic Services ( i to xvii ) 3,29,777.4 7,04,412.3 10,51,177.0 7,57,536.8 1,33,026.0 1,86,419.5 1,86,419.5 2,06,259.4
i) Crop Husbandry 79.6 88.6 88.6 98.1 1,193.0 1,561.1 1,561.1 1,271.6
ii) Animal Husbandry 78.9 110.5 110.5 97.2 76.1 134.3 134.3 102.6
iii) Fisheries 373.7 446.0 446.0 460.4 1,202.0 1,332.0 1,332.0 1,336.0
iv) Forestry and Wildlife 25,073.7 15,553.0 42,763.2 30,893.3 2,940.8 1,595.0 1,595.0 1,595.0
v) Plantations – – – – – – – –
vi) Co-operation 56.3 69.5 1,238.0 69.4 862.4 3,576.1 3,576.1 24,918.3
vii) Other Agricultural Programmes 21.3 29.3 29.3 26.2 0.3 0.3 0.3 0.3
viii) Major and Medium Irrigation Projects 88.4 57.4 57.4 109.0 3,949.3 5,000.0 5,000.0 5,000.0
ix) Minor Irrigation 22.2 40.6 40.6 27.4 520.8 300.0 300.0 523.1
x) Power – – – – – – – –
xi) Petroleum 2,53,320.2 6,41,100.0 8,41,427.2 5,29,371.6 – – – –
xii) Village and Small Industries 61.5 101.3 101.3 75.7 6.5 7.1 7.1 1.7
xiii) Industries@ 612.8 1,595.0 1,595.0 1,271.9 1,08,279.0 1,60,009.0 1,60,009.0 1,60,010.2
xiv) Ports and Light Houses – – – – – – – –
xv) Road Transport – – – – 17.4 20.0 20.0 20.0
xvi) Tourism 59.0 192.8 192.8 72.7 162.4 200.0 200.0 200.0
xvii) Others* 49,929.9 45,028.4 1,63,087.1 1,94,964.1 13,816.3 12,684.6 12,684.6 11,280.8
D. Grants from the Centre (1 to 5) 14,54,191.1 22,37,983.5 32,97,065.3 22,24,798.8 25,72,012.5 46,43,112.3 46,43,112.3 49,01,938.1
1. State Plan Schemes – – – – -220.2 – – –
of which: Advance release of Plan
Assistance for Natural Calamities – – – – – – – –
2. Central Plan Schemes – – – –
3. Centrally Sponsored Schemes 11,77,125.0 17,47,309.7 27,39,693.3 18,18,234.0 13,31,125.4 36,95,026.3 36,95,026.3 37,90,473.1
4. NEC/ Special Plan Scheme – – – – – – – –
5. Non-Plan Grants (a to c) 2,77,066.1 4,90,673.8 5,57,372.0 4,06,564.8 12,41,107.4 9,48,086.0 9,48,086.0 11,11,465.0
a) Statutory Grants 1,28,305.7 3,31,267.0 3,51,267.0 2,44,126.0 4,04,639.3 5,37,561.0 5,37,561.0 7,18,715.0
b) Grants for relief on account
of Natural Calamities – – – – 1,85,303.0 40,725.0 40,725.0 42,750.0
c) Others 1,48,760.4 1,59,406.8 2,06,105.0 1,62,438.8 6,51,165.1 3,69,800.0 3,69,800.0 3,50,000.0
of which: GST Compensation cess
i) GST compensation 90,271.0 1,00,000.0 1,00,000.0 1,00,000.0 3,04,100.0 3,69,800.0 3,69,800.0 3,50,000.0
ii) VAT compensation – – – – – – – –
iii) Central sales tax compensation – – – – – – – –
iv) Compensation cess – – – – – – – –
Appendix I: Revenue Receipts of States and Union Territories with Legislature (Contd.)
(₹ Lakh)

Appendix I
187
Item
CHHATTISGARH GOA
2017-18(Accounts)
2018-19(Budget
Estimates)
2018-19(Revised
Estimates)
2019-20(Budget
Estimates)
2017-18(Accounts)
2018-19(Budget
Estimates)
2018-19(Revised
Estimates)
2019-20(Budget
Estimates)
1 2 3 4 5 2 3 4 5
TOTAL REVENUE (I+II) 59,64,707.5 72,86,797.0 74,02,849.0 79,74,600.0 11,05,352.5 11,88,069.4 11,88,069.4 13,59,378.8
I. TAX REVENUE (A+B) 40,64,949.2 48,98,497.0 46,41,549.0 50,84,700.0 7,27,562.7 8,25,725.2 8,25,725.2 9,09,319.4
A. State’s Own Tax Revenue (1 to 3) 21,98,904.2 26,03,000.0 22,80,342.6 23,69,294.5 4,98,839.7 5,35,763.2 5,35,763.2 5,84,562.6
1. Taxes on Income (i+ii) 386.4 – – – – – – –
i) Agricultural Income Tax – – – – – – – –
ii) Taxes on Professions, Trades, Callings and Employment 386.4 – – – – – – –
2. Taxes on Property and Capital
Transactions (i to iii) 1,64,388.4 2,45,000.0 2,21,000.0 2,25,000.0 57,171.0 65,212.1 65,212.1 70,147.3
i) Land Revenue 44,641.2 66,000.0 66,000.0 70,000.0 4,202.1 3,958.7 3,958.7 6,017.1
ii) Stamps and Registration Fees 1,19,747.3 1,79,000.0 1,55,000.0 1,55,000.0 52,968.9 61,253.4 61,253.4 64,130.2
iii) Urban Immovable Property Tax – – – – – – – –
3. Taxes on Commodities and Services
(i to viii) 20,34,129.4 23,58,000.0 20,59,342.6 21,44,294.5 4,41,668.6 4,70,551.0 4,70,551.0 5,14,415.3
i) Sales Tax (a to e) 6,44,960.0 3,71,841.8 3,87,940.0 3,78,830.4 1,62,169.0 78,258.0 78,258.0 1,39,573.9
a) State Sales Tax/VAT 6,02,205.0 3,37,140.4 3,62,223.0 3,53,717.3 1,52,132.6 77,482.0 77,482.0 1,36,035.9
b) Central Sales Tax 27,305.4 34,244.9 16,424.0 16,038.4 7,699.7 776.0 776.0 3,538.0
c) Surcharge on Sales Tax – – – – – – – –
d) Receipts of Turnover Tax 8,827.8 – 5,310.0 5,185.2 – – – –
e) Other Receipts 6,621.9 456.5 3,983.0 3,889.5 2,336.8 – – –
ii) State Excise 4,05,399.9 4,35,500.0 4,35,500.0 5,00,000.0 40,999.6 40,586.4 40,586.4 47,527.4
iii) Taxes on Vehicles 1,18,001.4 1,50,000.0 1,50,000.0 1,60,000.0 31,472.5 25,686.0 25,686.0 32,563.9
iv) Taxes on Goods and Passengers 47,766.1 562.5 2,298.0 – 20,974.5 3,161.0 3,161.0 3,031.9
v) Taxes and Duties on Electricity 1,68,895.5 1,85,000.0 1,90,000.0 2,09,000.0 – – – –
vi) Entertainment Tax 591.9 – – – 5,823.8 538.6 538.6 408.8
vii) SGST 6,48,092.3 12,15,095.7 8,93,604.6 8,96,464.2 1,72,077.4 3,20,300.0 3,20,300.0 2,84,579.7
viii) Other Taxes and Duties 422.3 – – – 8,151.8 2,021.2 2,021.2 6,729.7
B. Share in Central Taxes (i to x) 18,66,045.0 22,95,497.0 23,61,206.4 27,15,405.5 2,28,723.0 2,89,962.0 2,89,962.0 3,24,756.8
i) Corporation Tax 6,35,298.0 6,75,533.2 6,99,086.4 8,03,954.7 77,968.0 83,647.0 83,647.0 93,684.6
ii) Income Tax 5,36,462.0 5,90,591.2 6,18,652.6 7,11,455.3 65,839.0 74,023.0 74,023.0 82,905.8
iii) Estate Duty – – – – – – – –
iv) Other Taxes on Income and Expenditure – – – – – – – –
v) Taxes on Wealth -19.0 – -22.5 -25.9 -2.0 -3.0 -3.0 -4.0
vi) Customs 2,09,370.0 3,22,428.8 1,22,667.3 1,41,068.3 18,765.0 14,677.0 14,677.0 16,438.2
vii) Union Excise Duties 2,18,850.0 3,37,029.1 1,19,535.8 1,37,467.1 19,437.0 14,303.0 14,303.0 16,019.4
viii) Service Tax 2,36,940.0 3,69,914.7 – – 11,568.0 – – –
ix) CGST 29,144.0 – 8,01,286.8 9,21,486.0 35,148.0 1,03,315.0 1,03,315.0 1,15,712.8
x) Other Taxes and Duties on Commodities and Services – – – – – – – –
II. NON-TAX REVENUE (C+D) 18,99,758.3 23,88,300.0 27,61,300.0 28,89,900.0 3,77,789.8 3,62,344.2 3,62,344.2 4,50,059.4
C. State’s Own Non-Tax Revenue (1 to 6) 6,34,041.7 8,17,000.0 8,20,000.0 8,82,500.0 3,03,327.6 2,86,933.3 2,86,933.3 3,25,091.1
1. Interest Receipts 18,043.8 13,293.2 18,770.5 12,682.9 2,723.7 2,956.1 2,956.1 3,339.5
2. Dividends and Profits 480.1 100.5 100.0 55.0 196.2 104.4 104.4 118.2
3. General Services 14,174.9 15,869.6 13,718.3 12,629.9 18,422.5 22,391.4 22,391.4 37,052.4
of which: State Lotteries – – – – 3,169.7 4,600.0 4,600.0 4,300.0
Appendix I: Revenue Receipts of States and Union Territories with Legislature (Contd.)
(₹ Lakh)

State Finances : A Study of Budgets of 2019-20
188
Item
CHHATTISGARH GOA
2017-18(Accounts)
2018-19(Budget
Estimates)
2018-19(Revised
Estimates)
2019-20(Budget
Estimates)
2017-18(Accounts)
2018-19(Budget
Estimates)
2018-19(Revised
Estimates)
2019-20(Budget
Estimates)
1 2 3 4 5 2 3 4 5
4. Social Services ( i to ix) 15,461.9 16,243.6 16,402.4 16,199.9 24,681.0 27,364.5 27,364.5 33,071.1
i) Education, Sports, Art and Culture 1,715.1 2,802.6 2,108.8 2,119.8 2,648.9 3,473.4 3,473.4 4,170.0
ii) Medical and Public Health 5,255.7 4,598.6 4,406.2 4,472.8 3,836.8 3,126.3 3,126.3 3,409.2
iii) Family Welfare 6.3 5.0 7.0 7.5 – 0.1 0.1 0.1
iv) Housing 394.0 381.1 390.0 400.0 79.8 84.8 84.8 138.3
v) Urban Development 3,136.8 2,000.0 4,332.7 4,000.0 4,332.5 6,100.0 6,100.0 9,000.0
vi) Labour and Employment 2,060.8 2,000.1 2,225.1 2,240.2 764.5 776.3 776.3 806.3
vii) Social Security and Welfare 345.9 870.0 406.0 406.0 35.0 64.6 64.6 65.5
viii) Water Supply and Sanitation 799.2 580.2 475.0 500.0 12,979.8 13,695.7 13,695.7 15,472.9
ix) Others 1,748.1 3,006.0 2,051.6 2,053.6 3.8 43.3 43.3 8.8
5. Fiscal Services – 0.6 – – – – – –
6. Economic Services ( i to xvii ) 5,85,881.0 7,71,492.6 7,71,008.8 8,40,932.3 2,57,304.2 2,34,116.9 2,34,116.9 2,51,509.9
i) Crop Husbandry 1,222.1 1,540.7 596.2 596.2 172.9 161.5 161.5 164.5
ii) Animal Husbandry 701.2 757.0 579.1 677.8 313.7 313.7 313.7 432.8
iii) Fisheries 445.1 490.0 445.0 445.0 348.4 309.4 309.4 309.4
iv) Forestry and Wildlife 29,116.9 60,000.0 60,000.0 60,000.0 495.5 520.3 520.3 633.6
v) Plantations – – – – – – – –
vi) Co-operation 257.4 425.5 900.1 900.1 105.5 75.1 75.1 95.1
vii) Other Agricultural Programmes 132.6 261.2 100.5 100.5 13.3 5.8 5.8 5.8
viii) Major and Medium Irrigation Projects 46,714.6 74,724.1 74,724.1 80,061.5 4,477.0 2,247.9 2,247.9 10,663.7
ix) Minor Irrigation 12,173.0 30,275.9 30,275.9 32,438.5 770.9 1,198.3 1,198.3 2,186.6
x) Power 2.6 – – – 2,11,908.9 1,90,765.0 1,90,765.0 2,24,415.8
xi) Petroleum – 0.1 – – – – – –
xii) Village and Small Industries 483.0 207.2 207.2 207.2 – 605.0 605.0 600.2
xiii) Industries@ 4,92,198.9 6,00,265.0 6,00,795.0 6,50,845.0 33,445.1 33,011.4 33,011.4 6,125.1
xiv) Ports and Light Houses – – – – 841.5 1,129.1 1,129.1 969.1
xv) Road Transport – – – – – – – –
xvi) Tourism – – – – 279.1 440.2 440.2 440.2
xvii) Others* 2,433.7 2,546.0 2,385.8 14,660.5 4,132.6 3,334.4 3,334.4 4,468.2
D. Grants from the Centre (1 to 5) 12,65,716.6 15,71,300.0 19,41,300.0 20,07,400.0 74,462.2 75,410.9 75,410.9 1,24,968.3
1. State Plan Schemes – – – – 2,047.0 9,634.6 9,634.6 9,638.2
of which: Advance release of Plan
Assistance for Natural Calamities – – – – – – – –
2. Central Plan Schemes – – – – 2,365.7 11,118.1 11,118.1 12,445.5
3. Centrally Sponsored Schemes 9,27,576.5 13,41,779.3 13,54,789.8 12,73,123.9 27,133.1 44,665.2 44,665.2 41,604.3
4. NEC/ Special Plan Scheme – – – –
5. Non-Plan Grants (a to c) 3,38,140.1 2,29,520.7 5,86,510.2 7,34,276.1 42,916.5 9,993.0 9,993.0 61,280.3
a) Statutory Grants 1,56,987.5 2,00,759.0 1,95,598.9 2,50,783.0 – – – –
b) Grants for relief on account
of Natural Calamities 4,931.0 – 2,800.0 2,900.0 – – – –
c) Others 1,76,221.6 28,761.7 3,88,111.3 4,80,593.1 42,916.5 9,993.0 9,993.0 61,280.3
of which: GST Compensation cess
i) GST compensation 1,48,300.0 – 3,70,036.0 4,50,641.0 – – – 50,499.7
ii) VAT compensation – – – – – – – –
iii) Central sales tax compensation – – – – – – – –
iv) Compensation cess – – – – – – – –
Appendix I: Revenue Receipts of States and Union Territories with Legislature (Contd.)
(₹ Lakh)

Appendix I
189
Item
GUJARAT HARYANA
2017-18(Accounts)
2018-19(Budget
Estimates)
2018-19(Revised
Estimates)
2019-20(Budget
Estimates)
2017-18(Accounts)
2018-19(Budget
Estimates)
2018-19(Revised
Estimates)
2019-20(Budget
Estimates)
1 2 3 4 5 2 3 4 5
TOTAL REVENUE (I+II) 1,23,29,127.5 1,40,63,115.3 1,40,53,172.0 1,54,73,196.0 62,69,487.4 76,93,301.9 76,82,811.5 82,21,941.4
I. TAX REVENUE (A+B) 92,33,170.1 1,13,03,588.0 1,06,84,213.0 1,17,80,921.0 48,39,689.9 58,43,174.0 59,20,060.0 62,32,164.0
A. State’s Own Tax Revenue (1 to 3) 73,64,645.0 89,37,644.0 83,35,281.0 91,76,157.0 41,83,645.9 49,13,167.0 51,17,361.0 51,26,609.0
1. Taxes on Income (i+ii) 25,990.0 26,903.0 30,300.0 33,000.0 – – – –
i) Agricultural Income Tax – – – – – – – –
ii) Taxes on Professions, Trades, Callings and Employment 25,990.0 26,903.0 30,300.0 33,000.0 – – – –
2. Taxes on Property and Capital
Transactions (i to iii) 9,40,054.0 11,37,230.0 10,83,100.0 12,07,432.0 4,21,056.1 4,52,674.0 6,02,000.0 6,52,500.0
i) Land Revenue 1,85,904.0 2,62,520.0 2,50,000.0 2,75,000.0 1,806.8 2,674.0 2,000.0 2,500.0
ii) Stamps and Registration Fees 7,25,475.0 8,38,014.0 8,01,100.0 8,97,232.0 4,19,249.3 4,50,000.0 6,00,000.0 6,50,000.0
iii) Urban Immovable Property Tax 28,675.0 36,696.0 32,000.0 35,200.0 – – – –
3. Taxes on Commodities and Services
(i to viii) 63,98,601.0 77,73,511.0 72,21,881.0 79,35,725.0 37,62,589.8 44,60,493.0 45,15,361.0 44,74,109.0
i) Sales Tax (a to e) 29,63,889.0 20,78,312.0 23,00,000.0 24,84,000.0 15,60,891.8 11,44,000.0 11,29,000.0 10,90,000.0
a) State Sales Tax/VAT 3,41,068.1 2,13,952.0 2,57,289.0 2,66,380.0 14,30,429.5 9,93,993.3 10,06,000.0 10,48,200.0
b) Central Sales Tax 3,46,273.6 2,71,215.0 3,07,585.0 3,87,489.0 1,30,107.0 1,50,006.7 1,23,000.0 41,800.0
c) Surcharge on Sales Tax – – – – 15.6 – – –
d) Receipts of Turnover Tax – – – – – – – –
e) Other Receipts 22,76,547.1 15,93,145.0 17,35,126.0 18,30,131.0 339.6 – – –
ii) State Excise 8,475.0 7,908.0 12,610.0 13,367.0 4,96,621.1 6,00,000.0 6,45,000.0 7,00,000.0
iii) Taxes on Vehicles 3,88,544.0 4,78,499.0 4,50,000.0 4,50,000.0 2,77,756.5 2,95,000.0 2,95,000.0 3,50,000.0
iv) Taxes on Goods and Passengers 13,128.0 11,233.0 11,500.0 12,500.0 2,31,746.8 – 2,100.0 –
v) Taxes and Duties on Electricity 6,48,429.0 8,12,957.0 7,80,000.0 7,90,000.0 30,603.2 33,000.0 33,000.0 33,000.0
vi) Entertainment Tax 5,155.9 8,360.0 6,200.0 4,952.0 836.0 11,583.0 11,565.2 6,952.0
vii) SGST 23,34,789.0 43,39,764.0 36,20,271.0 41,43,358.0 11,57,051.5 23,76,000.0 23,98,764.0 22,91,112.0
viii) Other Taxes and Duties 36,191.1 36,478.0 41,300.0 37,548.0 7,083.1 910.0 931.8 3,045.0
B. Share in Central Taxes (i to x) 18,68,525.1 23,65,944.0 23,48,932.0 26,04,764.0 6,56,044.0 9,30,007.0 8,02,699.0 11,05,555.0
i) Corporation Tax 6,36,123.0 6,82,452.0 8,16,769.0 8,43,555.0 2,23,592.0 2,92,462.0 2,31,337.0 3,46,503.0
ii) Income Tax 5,37,141.1 6,03,931.0 6,05,770.0 7,08,748.0 1,88,808.0 2,26,657.0 1,99,971.0 2,99,119.0
iii) Estate Duty – – – – – – – –
iv) Other Taxes on Income and Expenditure – – – – – – 1,649.0 –
v) Taxes on Wealth – -22.0 299.0 -23.0 -7.0 – 84.0 -8.0
vi) Customs 2,09,640.0 1,19,748.0 1,66,482.0 1,63,672.0 73,690.0 1,45,726.0 48,528.0 77,529.0
vii) Union Excise Duties 2,19,129.0 1,16,692.0 1,10,637.0 1,00,481.0 77,020.0 1,16,420.0 43,322.0 55,318.0
viii) Service Tax 2,37,320.0 60,924.0 23,030.0 – 82,505.0 1,48,735.0 2,859.0 –
ix) CGST 29,172.0 7,82,219.0 6,25,945.0 7,88,331.0 10,436.0 – 2,74,946.0 3,27,091.0
x) Other Taxes and Duties on Commodities and Services – – – – – 7.0 3.0 3.0
II. NON-TAX REVENUE (C+D) 30,95,957.4 27,59,527.3 33,68,959.0 36,92,275.0 14,29,797.5 18,50,127.9 17,62,751.5 19,89,777.4
C. State’s Own Non-Tax Revenue (1 to 6) 15,07,397.0 11,70,504.0 12,10,230.0 13,97,973.0 9,11,285.3 11,30,265.8 9,12,016.4 10,02,494.9
1. Interest Receipts 1,08,144.0 1,20,000.0 1,20,000.0 1,29,600.0 2,22,782.1 1,90,608.5 1,86,208.0 1,62,258.0
2. Dividends and Profits 9,629.0 10,000.0 12,244.0 13,223.0 753.2 900.0 2,496.8 2,564.1
3. General Services 67,067.0 76,979.0 74,233.0 80,171.0 65,637.1 51,715.9 53,162.7 52,350.4
of which: State Lotteries – – – – 7.8 2.5 2.5 2.5
Appendix I: Revenue Receipts of States and Union Territories with Legislature (Contd.)
(₹ Lakh)

State Finances : A Study of Budgets of 2019-20
190
Item
GUJARAT HARYANA
2017-18(Accounts)
2018-19(Budget
Estimates)
2018-19(Revised
Estimates)
2019-20(Budget
Estimates)
2017-18(Accounts)
2018-19(Budget
Estimates)
2018-19(Revised
Estimates)
2019-20(Budget
Estimates)
1 2 3 4 5 2 3 4 5
4. Social Services ( i to ix) 1,18,374.0 1,64,812.0 1,74,840.0 1,88,827.0 3,89,678.9 5,60,675.5 4,13,834.1 4,65,655.4
i) Education, Sports, Art and Culture 25,326.0 65,247.0 53,108.0 57,357.0 67,402.7 1,17,316.5 70,393.1 70,285.4
ii) Medical and Public Health 17,381.0 21,061.0 23,046.0 24,889.0 18,933.9 24,263.0 24,266.0 24,943.0
iii) Family Welfare 929.0 1,620.0 1,220.0 1,318.0 24.0 14.0 24.0 25.0
iv) Housing 2,387.0 2,890.0 2,890.0 3,121.0 377.6 450.0 450.0 500.0
v) Urban Development 4,141.0 4,176.0 18,529.0 20,011.0 2,86,144.9 4,00,000.0 3,00,000.0 3,50,000.0
vi) Labour and Employment 51,179.0 54,541.0 58,496.0 63,176.0 4,092.1 3,000.0 3,500.0 4,000.0
vii) Social Security and Welfare 673.0 909.0 631.0 681.0 5,355.4 6,800.0 6,000.0 6,500.0
viii) Water Supply and Sanitation 108.0 972.0 286.0 309.0 7,289.9 8,690.0 9,051.0 9,232.0
ix) Others 16,250.0 13,396.0 16,634.0 17,965.0 58.3 142.0 150.0 170.0
5. Fiscal Services 6.0 5.0 4.0 4.0 – – – –
6. Economic Services ( i to xvii ) 12,04,177.0 7,98,708.0 8,28,909.0 9,86,148.0 2,32,434.0 3,26,366.0 2,56,314.9 3,19,667.0
i) Crop Husbandry 6,421.0 4,212.0 11,234.0 12,133.0 1,352.1 900.0 1,000.0 1,200.0
ii) Animal Husbandry 6,273.0 8,557.0 8,136.0 8,787.0 631.3 300.0 2,500.0 1,000.0
iii) Fisheries 1,119.0 1,485.0 1,485.0 1,604.0 339.1 750.0 400.0 420.0
iv) Forestry and Wildlife 5,474.0 4,968.0 6,000.0 6,480.0 3,310.2 6,505.0 3,500.0 3,500.0
v) Plantations – – – – – – – –
vi) Co-operation 6,450.0 12,744.0 42,294.0 3,500.0 1,177.7 1,100.0 1,260.0 1,302.0
vii) Other Agricultural Programmes 4,599.0 648.0 733.0 791.0 110.7 120.0 120.4 120.0
viii) Major and Medium Irrigation Projects 1,21,152.0 1,27,467.0 1,32,754.0 1,43,374.0 13,242.4 17,500.0 14,160.0 14,660.0
ix) Minor Irrigation 568.0 110.0 1,022.0 1,104.0 – – 4.0 4.0
x) Power 195.0 – 1.0 2.0 279.0 – – –
xi) Petroleum 1.0 – – 1,655.0 – – – –
xii) Village and Small Industries 854.0 1,321.0 2,472.0 2,669.0 886.0 210.0 180.7 180.7
xiii) Industries@ 9,01,892.0 4,36,380.0 4,26,570.0 5,93,799.0 71,292.9 80,006.0 70,004.8 80,005.3
xiv) Ports and Light Houses 96,759.0 1,40,000.0 1,38,730.0 1,49,828.0 –
xv) Road Transport 11.0 18.0 20.0 22.0 1,27,966.1 2,00,000.0 1,35,000.0 2,00,000.0
xvi) Tourism 1,854.0 2,922.0 2,922.0 3,156.0 113.1 130.0 650.0 130.0
xvii) Others* 50,555.0 57,876.0 54,536.0 57,244.0 11,733.6 18,845.0 27,535.0 17,145.0
D. Grants from the Centre (1 to 5) 15,88,560.4 15,89,023.3 21,58,729.0 22,94,302.0 5,18,512.2 7,19,862.1 8,50,735.1 9,87,282.4
1. State Plan Schemes – 1,680.4 – – – – – –
of which: Advance release of Plan
Assistance for Natural Calamities – – – – – – – –
2. Central Plan Schemes – 1,242.1 – – – – – –
3. Centrally Sponsored Schemes 8,94,207.9 12,54,062.9 10,27,470.9 10,88,142.1 2,32,662.1 5,52,964.4 4,03,837.4 4,72,263.7
4. NEC/ Special Plan Scheme
5. Non-Plan Grants (a to c) 6,94,352.5 3,32,037.9 11,31,258.1 12,06,159.9 2,85,850.1 1,66,897.7 4,46,897.7 5,15,018.7
a) Statutory Grants 3,16,685.0 3,24,878.6 4,13,835.0 4,41,490.4 1,31,668.2 1,66,897.7 1,66,897.7 2,15,018.7
b) Grants for relief on account
of Natural Calamities – – – – – – – –
c) Others 3,77,667.5 7,159.4 7,17,423.1 7,64,669.5 1,54,181.9 – 2,80,000.0 3,00,000.0
of which: GST Compensation cess
i) GST compensation 3,68,700.0 – 6,54,729.0 7,30,142.0 1,19,900.0 – 2,80,000.0 3,00,000.0
ii) VAT compensation – – – – – – –
iii) Central sales tax compensation – – – – – – – –
iv) Compensation cess – – – – – – – –
Appendix I: Revenue Receipts of States and Union Territories with Legislature (Contd.)
(₹ Lakh)

Appendix I
191
Item
HIMACHAL PRADESH JAMMU AND KASHMIR
2017-18(Accounts)
2018-19(Budget
Estimates)
2018-19(Revised
Estimates)
2019-20(Budget
Estimates)
2017-18(Accounts)
2018-19(Budget
Estimates)
2018-19(Revised
Estimates)
2019-20(Budget
Estimates)
1 2 3 4 5 2 3 4 5
TOTAL REVENUE (I+II) 27,36,706.3 30,40,020.7 31,18,935.7 33,74,694.7 48,51,165.4 64,26,884.6 66,15,988.7 71,14,255.7
I. TAX REVENUE (A+B) 11,90,898.3 14,63,492.3 12,27,674.7 15,31,942.9 21,44,805.3 21,00,297.0 22,17,497.0 24,97,734.0
A. State’s Own Tax Revenue (1 to 3) 7,59,251.1 8,41,810.6 6,84,697.7 7,92,142.9 10,79,708.2 8,01,947.0 9,30,757.0 10,38,728.0
1. Taxes on Income (i+ii) – – – – – – – –
i) Agricultural Income Tax – – – – – – – –
ii) Taxes on Professions, Trades, Callings and Employment – – – – – – – –
2. Taxes on Property and Capital
Transactions (i to iii) 24,614.7 29,130.2 29,130.2 31,175.1 33,650.6 34,289.0 25,110.0 27,661.0
i) Land Revenue 1,696.5 2,119.9 2,119.9 2,251.9 2,907.5 939.0 960.0 960.0
ii) Stamps and Registration Fees 22,918.2 27,010.3 27,010.3 28,923.2 30,743.0 33,350.0 24,150.0 26,701.0
iii) Urban Immovable Property Tax – – – – 0.1 – – –
3. Taxes on Commodities and Services
(i to viii) 7,34,636.4 8,12,680.4 6,55,567.5 7,60,967.8 10,46,057.5 7,67,658.0 9,05,647.0 10,11,067.0
i) Sales Tax (a to e) 2,52,587.1 1,31,981.8 1,27,606.4 1,49,139.0 4,49,311.2 1,41,500.0 1,30,000.0 1,40,000.0
a) State Sales Tax/VAT 1,43,004.1 79,148.2 83.2 74,406.4 4,49,026.8 1,41,500.0 1,30,000.0 1,40,000.0
b) Central Sales Tax 13,756.2 1,261.3 1,240.9 1,945.8 – – – –
c) Surcharge on Sales Tax – – – – 284.4 – – –
d) Receipts of Turnover Tax – – – – – – – –
e) Other Receipts 95,826.8 51,572.2 1,26,282.3 72,786.8 – – – –
ii) State Excise 1,31,125.2 1,42,576.0 1,42,576.0 1,62,536.7 83,315.5 70,000.0 1,20,000.0 1,40,000.0
iii) Taxes on Vehicles 36,715.7 30,011.0 34,501.8 36,288.8 22,810.9 17,500.0 22,500.0 22,500.0
iv) Taxes on Goods and Passengers 11,169.5 14,527.4 12,528.8 14,527.4 85,261.8 1,00,000.0 1,00,000.0 1,05,000.0
v) Taxes and Duties on Electricity 36,078.6 35,000.0 35,000.0 37,800.0 17,919.8 50,000.0 50,000.0 53,000.0
vi) Entertainment Tax 140.6 4.9 4.9 11.3 244.2 – – –
vii) SGST 2,31,799.5 4,23,464.7 2,68,235.0 3,23,799.9 3,87,194.0 3,88,658.0 4,83,147.0 5,50,567.0
viii) Other Taxes and Duties 35,020.1 35,114.7 35,114.7 36,864.7 – – – –
B. Share in Central Taxes (i to x) 4,31,647.3 6,21,681.7 5,42,977.0 7,39,800.0 10,65,097.2 12,98,350.0 12,86,740.0 14,59,006.0
i) Corporation Tax 1,47,067.0 1,79,337.0 1,72,150.0 2,39,584.2 3,82,416.0 4,06,637.0 3,80,965.0 4,31,976.0
ii) Income Tax 1,24,188.0 1,58,699.8 1,39,517.0 2,01,292.2 3,22,922.2 3,55,509.0 3,37,129.0 3,82,271.0
iii) Estate Duty – – – – – – – –
iv) Other Taxes on Income and Expenditure – – – – – – – –
v) Taxes on Wealth -4.0 -5.0 -5.0 -5.0 -11.0 – – –
vi) Customs 48,470.0 31,466.8 33,699.0 46,481.6 1,26,030.0 1,94,086.0 66,846.0 75,797.0
vii) Union Excise Duties 50,650.0 30,663.2 44,450.0 28,553.9 2,02,060.0 3,42,118.0 65,143.0 73,837.0
viii) Service Tax 54,440.3 – 2,625.0 – – – – –
ix) CGST 6,836.0 2,21,519.9 1,50,541.0 2,23,893.1 31,680.0 – 4,36,657.0 4,95,125.0
x) Other Taxes and Duties on Commodities and Services – – – – – – – –
II. NON-TAX REVENUE (C+D) 15,45,807.9 15,76,528.4 18,91,260.9 18,42,751.8 27,06,360.1 43,26,587.6 43,98,491.7 46,16,521.7
C. State’s Own Non-Tax Revenue (1 to 6) 2,36,384.5 1,98,119.7 2,32,366.3 2,44,285.8 4,36,211.1 5,76,104.8 5,72,700.8 6,06,622.6
1. Interest Receipts 34,054.3 31,310.4 31,310.4 31,822.4 1,920.9 242.5 248.5 246.5
2. Dividends and Profits 25,558.4 11,661.6 11,661.6 13,296.3 – 10,000.0 – –
3. General Services 19,457.3 21,521.5 26,744.5 30,743.1 16,461.9 13,574.0 15,627.0 15,485.5
of which: State Lotteries – – – – – – – –
Appendix I: Revenue Receipts of States and Union Territories with Legislature (Contd.)
(₹ Lakh)

State Finances : A Study of Budgets of 2019-20
192
Item
HIMACHAL PRADESH JAMMU AND KASHMIR
2017-18(Accounts)
2018-19(Budget
Estimates)
2018-19(Revised
Estimates)
2019-20(Budget
Estimates)
2017-18(Accounts)
2018-19(Budget
Estimates)
2018-19(Revised
Estimates)
2019-20(Budget
Estimates)
1 2 3 4 5 2 3 4 5
4. Social Services ( i to ix) 27,617.0 33,546.7 33,139.4 35,855.5 13,969.6 12,069.2 12,906.0 13,541.6
i) Education, Sports, Art and Culture 18,075.8 23,288.2 23,288.2 25,235.0 506.9 831.1 448.6 468.6
ii) Medical and Public Health 1,026.8 1,088.2 1,120.1 1,246.7 2,602.7 3,764.7 4,460.0 4,770.0
iii) Family Welfare 0.4 3.6 3.6 3.9 – – – –
iv) Housing 399.0 500.7 500.7 526.2 404.4 320.0 397.0 447.0
v) Urban Development 1,125.5 864.4 400.4 400.4 52.4 39.7 40.3 44.5
vi) Labour and Employment 683.7 870.6 885.8 955.9 664.8 360.1 303.0 303.0
vii) Social Security and Welfare 801.0 871.2 871.3 940.8 427.3 3.1 6.6 8.0
viii) Water Supply and Sanitation 5,295.3 5,815.5 5,815.5 6,280.7 9,306.7 6,750.0 7,250.0 7,500.0
ix) Others 209.6 244.3 253.8 266.0 4.5 0.5 0.5 0.5
5. Fiscal Services – – – – – – – –
6. Economic Services ( i to xvii ) 1,29,697.6 1,00,079.6 1,29,510.4 1,32,568.5 4,03,858.7 5,40,219.1 5,43,919.3 5,77,349.0
i) Crop Husbandry 1,228.2 676.1 719.1 621.6 1,019.6 2,232.0 2,257.0 2,280.0
ii) Animal Husbandry 115.8 106.0 106.0 114.5 812.3 876.6 1,065.0 1,175.0
iii) Fisheries 337.6 396.1 396.1 427.7 573.7 650.4 700.0 800.0
iv) Forestry and Wildlife 4,687.2 4,642.6 5,226.0 5,500.0 1,812.1 9,279.7 11,393.0 12,503.0
v) Plantations 0.6 1.6 1.6 1.7 – – – –
vi) Co-operation 526.2 360.2 1,368.9 447.0 9.0 20.0 20.0 20.0
vii) Other Agricultural Programmes 39.3 60.5 60.5 65.3 38.8 180.7 181.1 181.2
viii) Major and Medium Irrigation Projects 8.2 113.0 113.0 122.1 76,108.2 80.0 80.0 80.0
ix) Minor Irrigation 144.1 185.2 185.2 200.0 839.1 1,191.5 1,191.5 1,191.5
x) Power 68,760.8 72,500.0 94,799.2 97,286.0 3,15,093.9 5,04,182.5 5,04,182.5 5,34,265.0
xi) Petroleum – – – – – – – –
xii) Village and Small Industries 63.1 51.6 92.8 92.8 267.2 306.5 372.0 466.0
xiii) Industries@ 44,625.8 17,887.9 18,102.4 19,008.9 4,745.5 15,010.0 15,500.0 17,000.0
xiv) Ports and Light Houses – – – – – – – –
xv) Road Transport 82.6 42.9 42.9 46.4 – – – –
xvi) Tourism 327.2 202.7 202.7 219.8 156.7 1,000.0 1,080.0 1,170.0
xvii) Others* 8,751.0 2,853.3 8,094.2 8,414.9 2,382.5 5,209.3 5,897.2 6,217.3
D. Grants from the Centre (1 to 5) 13,09,423.4 13,78,408.7 16,58,894.7 15,98,466.0 22,70,149.0 37,50,482.8 38,25,790.9 40,09,899.1
1. State Plan Schemes – – – – – 8,30,000.0 8,38,280.3 8,38,280.3
of which: Advance release of Plan
Assistance for Natural Calamities – – – – – – – –
2. Central Plan Schemes – – – – – – – –
3. Centrally Sponsored Schemes 3,59,026.0 4,87,883.4 4,89,726.6 4,35,056.0 9,09,619.2 10,42,376.4 10,34,096.1 10,34,096.1
4. NEC/ Special Plan Scheme – – – – – – – –
5. Non-Plan Grants (a to c) 9,50,397.5 8,90,525.3 11,69,168.1 11,63,410.0 13,60,529.8 18,78,106.4 19,53,414.5 21,37,522.7
a) Statutory Grants 8,88,858.0 8,90,525.0 8,90,525.0 8,73,410.0 11,87,949.1 1,07,711.0 1,61,556.0 1,98,746.0
b) Grants for relief on account
of Natural Calamities 6,323.0 0.3 8,443.1 – – 26,600.0 26,600.0 27,900.0
c) Others 55,216.5 – 2,70,200.0 2,90,000.0 1,72,580.7 17,43,795.4 17,65,258.5 19,10,876.7
of which: GST Compensation cess
i) GST compensation 53,900.0 – 2,70,200.0 2,90,000.0 – 3,17,489.0 2,59,153.0 2,95,434.0
ii) VAT compensation – – – – – – – –
iii) Central sales tax compensation – – – – – – – –
iv) Compensation cess – – – – – – – –
Appendix I: Revenue Receipts of States and Union Territories with Legislature (Contd.)
(₹ Lakh)

Appendix I
193
Item
JHARKHAND KARNATAKA
2017-18(Accounts)
2018-19(Budget
Estimates)
2018-19(Revised
Estimates)
2019-20(Budget
Estimates)
2017-18(Accounts)
2018-19(Budget
Estimates)
2018-19(Revised
Estimates)
2019-20(Budget
Estimates)
1 2 3 4 5 2 3 4 5
TOTAL REVENUE (I+II) 52,75,603.2 69,12,999.9 69,57,841.0 74,35,800.0 1,46,99,964.8 1,66,39,566.0 1,65,89,695.8 1,81,86,295.8
I. TAX REVENUE (A+B) 33,49,707.1 46,24,999.2 46,35,000.0 49,85,000.0 1,18,88,233.9 1,32,03,608.0 1,31,72,770.0 1,41,55,024.0
A. State’s Own Tax Revenue (1 to 3) 14,48,786.1 19,24,590.7 21,75,000.0 23,75,000.0 90,33,509.7 96,81,053.0 96,50,215.0 1,01,74,398.0
1. Taxes on Income (i+ii) 7,400.8 11,990.0 12,000.0 15,000.0 97,909.9 93,800.0 93,800.0 90,000.0
i) Agricultural Income Tax 1.9 – – – 1,468.8 – – –
ii) Taxes on Professions, Trades, Callings and Employment 7,398.9 11,990.0 12,000.0 15,000.0 96,441.1 93,800.0 93,800.0 90,000.0
2. Taxes on Property and Capital
Transactions (i to iii) 62,534.7 1,10,000.0 1,05,000.0 1,35,000.0 9,21,910.1 10,68,542.0 10,68,542.0 12,06,426.0
i) Land Revenue 15,600.6 40,000.0 40,000.0 65,000.0 19,542.4 28,542.0 28,542.0 23,626.0
ii) Stamps and Registration Fees 46,934.0 70,000.0 65,000.0 70,000.0 9,02,367.7 10,40,000.0 10,40,000.0 11,82,800.0
iii) Urban Immovable Property Tax – – – – – – – –
3. Taxes on Commodities and Services
(i to viii) 13,78,850.6 18,02,600.8 20,58,000.0 22,25,000.0 80,13,689.7 85,18,711.0 84,87,873.0 88,77,972.0
i) Sales Tax (a to e) 5,71,469.4 4,90,000.0 4,95,000.0 5,05,000.0 25,09,316.3 13,53,205.0 13,53,205.0 15,14,900.0
a) State Sales Tax/VAT 5,46,470.8 4,46,603.7 4,73,346.3 4,82,908.8 11,98,156.6 13,53,205.0 13,53,205.0 15,34,900.0
b) Central Sales Tax 24,998.2 43,460.5 21,653.5 22,090.9 1,31,905.8 – – –
c) Surcharge on Sales Tax – – – – – – – –
d) Receipts of Turnover Tax 0.3 10.3 0.3 0.3 – – – –
e) Other Receipts – -74.5 – – 11,79,254.0 – – -20,000.0
ii) State Excise 84,079.8 1,00,000.0 1,10,000.0 1,60,000.0 17,94,851.4 19,75,000.0 19,75,000.0 20,95,000.0
iii) Taxes on Vehicles 77,836.9 1,10,000.0 1,05,000.0 1,20,000.0 6,20,857.4 6,65,642.0 6,65,642.0 7,10,000.0
iv) Taxes on Goods and Passengers – 10,000.0 5,000.0 – 1,27,912.6 – – –
v) Taxes and Duties on Electricity 18,350.0 28,000.0 28,000.0 30,000.0 1,48,498.6 2,58,096.0 2,27,258.0 2,80,272.0
vi) Entertainment Tax 543.9 1,943.0 594.1 – 11,779.6 – – –
vii) SGST 6,25,831.9 10,60,000.0 13,13,600.0 14,10,000.0 27,38,689.9 42,63,968.0 42,63,968.0 42,74,800.0
viii) Other Taxes and Duties 738.9 2,657.8 805.9 – 61,783.8 2,800.0 2,800.0 3,000.0
B. Share in Central Taxes (i to x) 19,00,921.0 27,00,408.5 24,60,000.0 26,10,000.0 28,54,724.2 35,22,555.0 35,22,555.0 39,80,626.0
i) Corporation Tax 6,47,467.4 8,71,581.0 8,65,820.0 8,88,000.0 9,72,129.0 10,42,929.0 10,42,929.0 12,89,130.0
ii) Income Tax 5,46,742.0 6,17,038.0 6,00,000.0 7,50,000.0 8,20,894.0 9,22,934.0 9,22,934.0 10,83,115.0
iii) Estate Duty – – – – – – – –
iv) Other Taxes on Income and Expenditure – 10.0 – – – – – –
v) Taxes on Wealth -19.0 2,421.1 2,400.0 – -29.0 -33.0 -33.0 -35.0
vi) Customs 2,13,380.0 4,32,581.0 3,01,780.0 2,95,000.0 3,20,380.0 1,83,030.0 1,83,030.0 2,50,125.0
vii) Union Excise Duties 2,23,040.0 3,46,578.1 3,40,000.0 3,06,000.0 3,34,880.0 1,78,300.0 1,78,300.0 1,53,556.0
viii) Service Tax 2,40,390.6 4,29,800.0 3,20,000.0 3,30,000.0 3,61,715.2 – – –
ix) CGST 29,920.0 – 30,000.0 41,000.0 44,756.0 11,95,396.0 11,95,396.0 12,04,735.0
x) Other Taxes and Duties on Commodities and Services – 399.3 – – -1.0 -1.0 -1.0 –
II. NON-TAX REVENUE (C+D) 19,25,896.1 22,88,000.7 23,22,841.0 24,50,800.0 28,11,730.9 34,35,958.0 34,16,925.8 40,31,271.8
C. State’s Own Non-Tax Revenue (1 to 6) 7,84,667.2 9,03,000.3 9,37,841.0 10,67,420.0 6,47,652.8 8,18,094.0 7,28,708.6 8,05,540.8
1. Interest Receipts 16,887.9 16,000.0 16,500.0 19,500.0 1,17,839.9 1,40,676.0 1,23,776.6 1,23,657.0
2. Dividends and Profits 0.1 3,000.1 50.0 100.0 7,883.2 8,914.0 2,746.3 8,780.0
3. General Services 38,470.2 70,346.0 61,518.0 55,900.0 90,959.0 1,22,436.0 1,20,557.8 1,25,746.7
of which: State Lotteries 6.5 – 6.8 8.6 – 405.0 – –
Appendix I: Revenue Receipts of States and Union Territories with Legislature (Contd.)
(₹ Lakh)
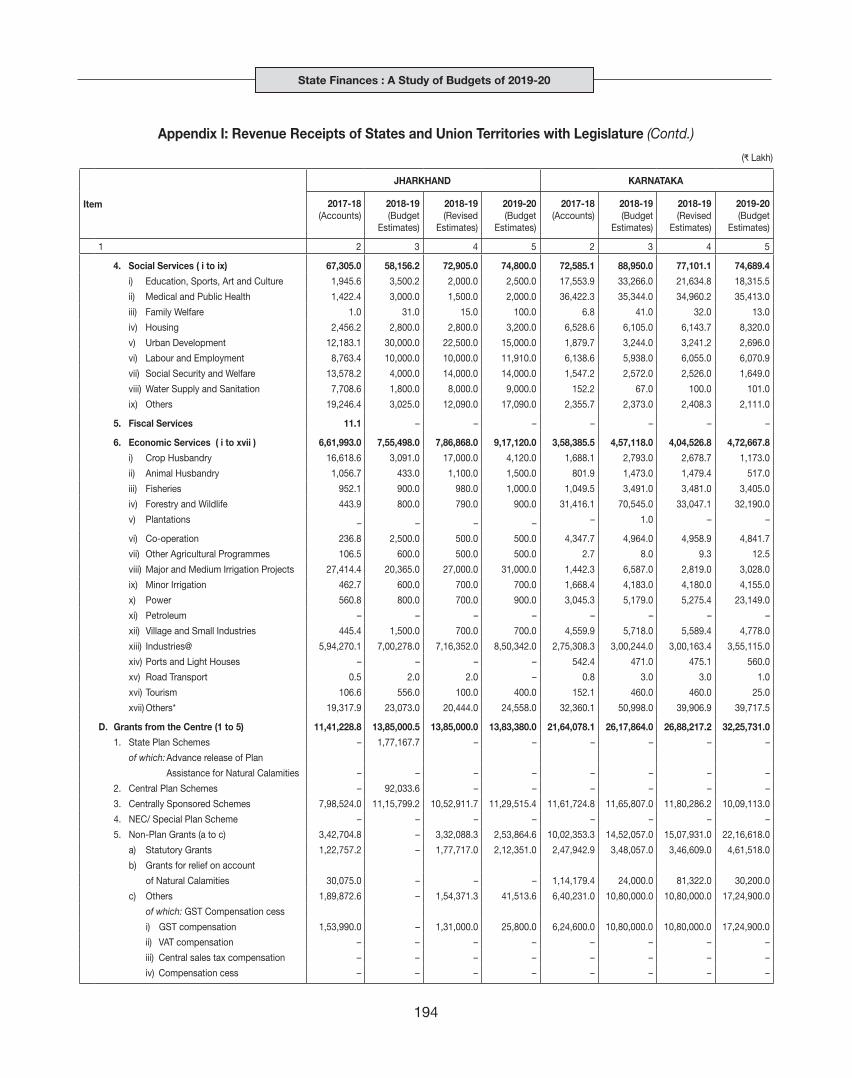
State Finances : A Study of Budgets of 2019-20
194
Item
JHARKHAND KARNATAKA
2017-18(Accounts)
2018-19(Budget
Estimates)
2018-19(Revised
Estimates)
2019-20(Budget
Estimates)
2017-18(Accounts)
2018-19(Budget
Estimates)
2018-19(Revised
Estimates)
2019-20(Budget
Estimates)
1 2 3 4 5 2 3 4 5
4. Social Services ( i to ix) 67,305.0 58,156.2 72,905.0 74,800.0 72,585.1 88,950.0 77,101.1 74,689.4
i) Education, Sports, Art and Culture 1,945.6 3,500.2 2,000.0 2,500.0 17,553.9 33,266.0 21,634.8 18,315.5
ii) Medical and Public Health 1,422.4 3,000.0 1,500.0 2,000.0 36,422.3 35,344.0 34,960.2 35,413.0
iii) Family Welfare 1.0 31.0 15.0 100.0 6.8 41.0 32.0 13.0
iv) Housing 2,456.2 2,800.0 2,800.0 3,200.0 6,528.6 6,105.0 6,143.7 8,320.0
v) Urban Development 12,183.1 30,000.0 22,500.0 15,000.0 1,879.7 3,244.0 3,241.2 2,696.0
vi) Labour and Employment 8,763.4 10,000.0 10,000.0 11,910.0 6,138.6 5,938.0 6,055.0 6,070.9
vii) Social Security and Welfare 13,578.2 4,000.0 14,000.0 14,000.0 1,547.2 2,572.0 2,526.0 1,649.0
viii) Water Supply and Sanitation 7,708.6 1,800.0 8,000.0 9,000.0 152.2 67.0 100.0 101.0
ix) Others 19,246.4 3,025.0 12,090.0 17,090.0 2,355.7 2,373.0 2,408.3 2,111.0
5. Fiscal Services 11.1 – – – – – – –
6. Economic Services ( i to xvii ) 6,61,993.0 7,55,498.0 7,86,868.0 9,17,120.0 3,58,385.5 4,57,118.0 4,04,526.8 4,72,667.8
i) Crop Husbandry 16,618.6 3,091.0 17,000.0 4,120.0 1,688.1 2,793.0 2,678.7 1,173.0
ii) Animal Husbandry 1,056.7 433.0 1,100.0 1,500.0 801.9 1,473.0 1,479.4 517.0
iii) Fisheries 952.1 900.0 980.0 1,000.0 1,049.5 3,491.0 3,481.0 3,405.0
iv) Forestry and Wildlife 443.9 800.0 790.0 900.0 31,416.1 70,545.0 33,047.1 32,190.0
v) Plantations – – – – – 1.0 – –
vi) Co-operation 236.8 2,500.0 500.0 500.0 4,347.7 4,964.0 4,958.9 4,841.7
vii) Other Agricultural Programmes 106.5 600.0 500.0 500.0 2.7 8.0 9.3 12.5
viii) Major and Medium Irrigation Projects 27,414.4 20,365.0 27,000.0 31,000.0 1,442.3 6,587.0 2,819.0 3,028.0
ix) Minor Irrigation 462.7 600.0 700.0 700.0 1,668.4 4,183.0 4,180.0 4,155.0
x) Power 560.8 800.0 700.0 900.0 3,045.3 5,179.0 5,275.4 23,149.0
xi) Petroleum – – – – – – – –
xii) Village and Small Industries 445.4 1,500.0 700.0 700.0 4,559.9 5,718.0 5,589.4 4,778.0
xiii) Industries@ 5,94,270.1 7,00,278.0 7,16,352.0 8,50,342.0 2,75,308.3 3,00,244.0 3,00,163.4 3,55,115.0
xiv) Ports and Light Houses – – – – 542.4 471.0 475.1 560.0
xv) Road Transport 0.5 2.0 2.0 – 0.8 3.0 3.0 1.0
xvi) Tourism 106.6 556.0 100.0 400.0 152.1 460.0 460.0 25.0
xvii) Others* 19,317.9 23,073.0 20,444.0 24,558.0 32,360.1 50,998.0 39,906.9 39,717.5
D. Grants from the Centre (1 to 5) 11,41,228.8 13,85,000.5 13,85,000.0 13,83,380.0 21,64,078.1 26,17,864.0 26,88,217.2 32,25,731.0
1. State Plan Schemes – 1,77,167.7 – – – – – –
of which: Advance release of Plan
Assistance for Natural Calamities – – – – – – – –
2. Central Plan Schemes – 92,033.6 – – – – – –
3. Centrally Sponsored Schemes 7,98,524.0 11,15,799.2 10,52,911.7 11,29,515.4 11,61,724.8 11,65,807.0 11,80,286.2 10,09,113.0
4. NEC/ Special Plan Scheme – – – – – – – –
5. Non-Plan Grants (a to c) 3,42,704.8 – 3,32,088.3 2,53,864.6 10,02,353.3 14,52,057.0 15,07,931.0 22,16,618.0
a) Statutory Grants 1,22,757.2 – 1,77,717.0 2,12,351.0 2,47,942.9 3,48,057.0 3,46,609.0 4,61,518.0
b) Grants for relief on account
of Natural Calamities 30,075.0 – – – 1,14,179.4 24,000.0 81,322.0 30,200.0
c) Others 1,89,872.6 – 1,54,371.3 41,513.6 6,40,231.0 10,80,000.0 10,80,000.0 17,24,900.0
of which: GST Compensation cess
i) GST compensation 1,53,990.0 – 1,31,000.0 25,800.0 6,24,600.0 10,80,000.0 10,80,000.0 17,24,900.0
ii) VAT compensation – – – – – – – –
iii) Central sales tax compensation – – – – – – – –
iv) Compensation cess – – – – – – – –
Appendix I: Revenue Receipts of States and Union Territories with Legislature (Contd.)
(₹ Lakh)

Appendix I
195
Item
KERALA MADHYA PRADESH
2017-18(Accounts)
2018-19(Budget
Estimates)
2018-19(Revised
Estimates)
2019-20(Budget
Estimates)
2017-18(Accounts)
2018-19(Budget
Estimates)
2018-19(Revised
Estimates)
2019-20(Budget
Estimates)
1 2 3 4 5 2 3 4 5
TOTAL REVENUE (I+II) 83,02,014.4 1,02,80,123.7 1,00,00,658.4 1,15,35,471.1 1,34,87,538.9 1,55,88,646.5 1,51,15,975.1 1,79,35,375.0
I. TAX REVENUE (A+B) 63,29,268.9 78,52,071.0 73,04,285.3 88,58,221.1 95,66,391.7 1,14,14,516.0 1,10,25,789.0 1,29,02,455.0
A. State’s Own Tax Revenue (1 to 3) 48,15,956.9 58,58,743.8 54,25,572.3 67,09,996.1 49,94,332.7 56,24,032.0 52,77,102.0 65,27,374.0
1. Taxes on Income (i+ii) 285.5 357.6 100.2 100.0 34,285.9 25,000.0 25,000.0 35,300.0
i) Agricultural Income Tax 285.5 357.6 100.2 100.0 – – – –
ii) Taxes on Professions, Trades, Callings and Employment – – – – 34,285.9 25,000.0 25,000.0 35,300.0
2. Taxes on Property and Capital
Transactions (i to iii) 3,80,151.2 4,11,888.2 4,33,507.9 4,93,749.0 5,92,321.5 7,50,000.0 6,45,000.0 8,25,000.0
i) Land Revenue 16,216.2 15,779.0 19,178.9 22,129.0 49,098.8 1,20,000.0 50,000.0 1,00,000.0
ii) Stamps and Registration Fees 3,45,256.1 3,76,653.0 3,93,592.0 4,48,695.0 4,78,850.9 5,60,000.0 5,30,000.0 6,50,000.0
iii) Urban Immovable Property Tax 18,678.9 19,456.2 20,737.0 22,925.0 64,371.9 70,000.0 65,000.0 75,000.0
3. Taxes on Commodities and Services
(i to viii) 44,35,520.2 54,46,498.1 49,91,964.1 62,16,147.1 43,67,725.3 48,49,032.0 46,07,102.0 56,67,074.0
i) Sales Tax (a to e) 24,57,781.4 19,79,110.0 19,08,537.0 23,94,817.0 14,98,403.5 11,50,000.0 10,21,112.0 12,00,000.0
a) State Sales Tax/VAT 24,38,149.3 19,79,109.0 19,05,464.3 23,94,817.0 55,552.8 11,50,000.0 10,11,112.0 11,95,000.0
b) Central Sales Tax 14,967.5 – 2,950.0 – 51,558.1 – 10,000.0 5,000.0
c) Surcharge on Sales Tax – 1.0 0.1 – – – – –
d) Receipts of Turnover Tax – – – – – – – –
e) Other Receipts 4,664.6 – 122.6 – 13,91,292.5 – – –
ii) State Excise 2,24,042.3 2,80,442.0 2,57,647.0 2,98,374.0 8,24,501.4 9,00,000.0 9,50,000.0 13,00,000.0
iii) Taxes on Vehicles 3,66,285.3 4,68,341.1 4,10,225.1 4,71,158.1 2,69,161.9 3,20,000.0 3,00,000.0 4,00,000.0
iv) Taxes on Goods and Passengers 0.4 2.5 – – 1,15,930.2 1,500.0 1,500.0 1,500.0
v) Taxes and Duties on Electricity 6,687.3 18,602.4 16,600.0 17,700.0 2,59,028.7 3,05,000.0 2,85,000.0 3,13,500.0
vi) Entertainment Tax 6.3 – 0.4 – 3,216.4 1,249.0 119.0 59.0
vii) SGST 13,70,765.3 27,00,000.0 23,96,674.0 30,32,598.0 13,82,859.7 21,69,308.0 20,10,800.0 24,10,000.0
viii) Other Taxes and Duties 9,951.9 – 2,280.6 1,500.0 14,623.6 1,975.0 38,571.0 42,015.0
B. Share in Central Taxes (i to x) 15,13,312.0 19,93,327.2 18,78,713.0 21,48,225.0 45,72,059.0 57,90,484.0 57,48,687.0 63,75,081.0
i) Corporation Tax 5,15,664.0 5,88,200.5 5,53,220.0 6,36,008.0 15,56,892.0 18,19,293.0 18,22,427.0 20,64,577.0
ii) Income Tax 4,35,440.0 5,14,239.3 4,89,568.0 5,62,831.0 13,14,686.0 14,78,104.0 14,76,965.0 17,34,639.0
iii) Estate Duty – – – – – – – –
iv) Other Taxes on Income and Expenditure – – 3,448.0 – – – – –
v) Taxes on Wealth -15.0 – 195.0 – -47.0 -53.0 -56.0 -56.0
vi) Customs 1,69,940.0 2,80,727.4 97,072.0 1,11,599.0 5,13,090.0 2,93,080.0 3,56,745.0 4,00,582.0
vii) Union Excise Duties 1,77,640.0 2,93,457.7 94,595.0 1,08,751.0 5,36,330.0 2,85,600.0 2,84,787.0 2,45,923.0
viii) Service Tax 1,90,655.0 3,16,602.3 6,620.0 – 5,79,460.0 – 28,088.0 –
ix) CGST 23,988.0 100.0 6,33,995.0 7,29,036.0 71,648.0 19,14,460.0 17,79,731.0 19,29,416.0
x) Other Taxes and Duties on Commodities and Services – – – – – – – –
II. NON-TAX REVENUE (C+D) 19,72,745.5 24,28,052.7 26,96,373.1 26,77,250.0 39,21,147.3 41,74,130.5 40,90,186.1 50,32,919.9
C. State’s Own Non-Tax Revenue (1 to 6) 11,19,961.1 14,27,113.7 12,99,197.1 15,07,007.0 9,06,118.2 10,93,377.8 9,65,694.6 13,96,826.7
1. Interest Receipts 14,449.8 19,178.1 17,586.0 19,801.0 63,911.0 35,000.0 35,000.0 35,000.0
2. Dividends and Profits 12,648.0 16,343.2 13,843.2 16,535.2 62,235.9 35,000.1 35,000.1 36,950.1
3. General Services 9,61,569.2 12,02,826.5 11,01,784.6 12,79,879.3 51,594.6 1,45,937.3 63,924.5 2,10,437.6
of which: State Lotteries 9,03,416.5 11,11,000.0 10,21,000.0 11,87,300.0 – – – –
Appendix I: Revenue Receipts of States and Union Territories with Legislature (Contd.)
(₹ Lakh)

State Finances : A Study of Budgets of 2019-20
196
Item
KERALA MADHYA PRADESH
2017-18(Accounts)
2018-19(Budget
Estimates)
2018-19(Revised
Estimates)
2019-20(Budget
Estimates)
2017-18(Accounts)
2018-19(Budget
Estimates)
2018-19(Revised
Estimates)
2019-20(Budget
Estimates)
1 2 3 4 5 2 3 4 5
4. Social Services ( i to ix) 48,421.6 72,311.0 66,747.1 77,969.7 1,60,840.8 2,31,106.1 2,04,166.7 2,08,171.4
i) Education, Sports, Art and Culture 25,778.4 41,834.4 35,555.4 43,764.8 1,30,968.6 1,95,505.6 1,70,707.5 1,70,718.5
ii) Medical and Public Health 18,152.9 24,058.5 25,098.7 27,252.4 12,898.5 15,279.1 15,147.4 15,147.4
iii) Family Welfare 11.9 31.0 31.0 31.0 19.1 1.1 7.2 8.0
iv) Housing 319.1 343.3 341.9 362.0 2,610.9 4,000.0 4,007.0 7,013.4
v) Urban Development 447.1 662.3 727.9 829.8 1,841.3 531.1 531.1 531.1
vi) Labour and Employment 2,987.2 4,425.8 4,049.5 4,656.7 2,663.2 2,877.7 2,867.8 2,850.7
vii) Social Security and Welfare 678.5 833.7 823.8 946.0 2,414.2 891.5 891.5 891.5
viii) Water Supply and Sanitation 0.2 0.9 0.7 0.7 1,724.6 1,000.0 987.2 990.7
ix) Others 46.4 121.1 118.1 126.2 5,700.5 11,020.0 9,020.0 10,020.0
5. Fiscal Services – – – – – 0.6 0.6 0.6
6. Economic Services ( i to xvii ) 82,872.5 1,16,454.8 99,236.3 1,12,821.8 5,67,536.0 6,46,333.8 6,27,602.9 9,06,267.1
i) Crop Husbandry 1,054.2 1,425.5 1,204.0 1,489.6 4,888.0 5,120.0 5,090.0 5,550.0
ii) Animal Husbandry 706.8 833.9 813.5 882.2 488.8 400.0 400.0 400.0
iii) Fisheries 1,701.8 1,820.7 1,862.3 2,043.5 948.8 600.0 600.0 600.0
iv) Forestry and Wildlife 24,541.6 39,767.8 29,767.9 36,222.3 1,11,225.2 1,15,000.3 1,20,006.3 1,50,000.0
v) Plantations – – – – – – – –
vi) Co-operation 19,482.2 20,616.0 21,114.0 23,117.0 1,273.0 735.4 735.4 2,235.0
vii) Other Agricultural Programmes 12.2 20.3 20.6 20.6 208.3 110.0 110.0 110.0
viii) Major and Medium Irrigation Projects 1,323.0 2,785.6 1,767.6 1,933.6 16,969.8 23,438.8 27,283.6 88,991.6
ix) Minor Irrigation 708.7 920.2 870.2 975.2 35,420.2 41,561.2 37,690.4 61,008.4
x) Power – – – – 19,514.9 42,500.0 40,020.8 32,420.8
xi) Petroleum 0.9 1.3 1.1 1.3 0.9 0.1 0.1 0.1
xii) Village and Small Industries 705.9 806.1 895.4 998.8 1,507.6 1,000.0 1,998.3 2,998.1
xiii) Industries@ 15,934.9 18,690.1 18,216.5 19,296.8 3,64,498.3 4,10,600.5 3,88,400.5 5,10,600.5
xiv) Ports and Light Houses 2,805.2 9,093.3 6,357.5 7,102.5 – – – –
xv) Road Transport 5,885.8 8,320.0 6,443.0 7,355.0 276.3 500.0 500.0 500.0
xvi) Tourism 706.1 1,055.5 956.5 1,136.5 5,356.0 – – –
xvii) Others* 7,303.1 10,298.6 8,946.4 10,247.0 4,959.9 4,767.5 4,767.5 50,852.6
D. Grants from the Centre (1 to 5) 8,52,784.4 10,00,939.0 13,97,176.0 11,70,243.0 30,15,029.1 30,80,752.7 31,24,491.4 36,36,093.3
1. State Plan Schemes – – – – 25,24,180.1 20,76,704.4 21,21,816.6 –
of which: Advance release of Plan
Assistance for Natural Calamities – – – – – – – –
2. Central Plan Schemes -47.3 – – – 6,737.4 2,29,572.3 2,28,198.9 –
3. Centrally Sponsored Schemes 3,21,358.5 8,10,883.0 6,94,771.8 9,09,467.0 – – – 26,06,793.3
4. NEC/ Special Plan Scheme – – – – – – – –
5. Non-Plan Grants (a to c) 5,31,473.2 1,90,056.0 7,02,404.2 2,60,776.0 4,84,111.5 7,74,476.0 7,74,476.0 10,29,300.0
a) Statutory Grants 3,18,204.0 1,90,056.0 1,93,216.0 2,50,656.0 – – – 6,99,300.0
b) Grants for relief on account
of Natural Calamities 16,472.0 – 290.5 – 72,525.0 91,400.0 91,400.0 –
c) Others 1,96,797.2 – 5,08,897.7 10,120.0 4,11,586.5 6,83,076.0 6,83,076.0 3,30,000.0
of which: GST Compensation cess
i) GST compensation 1,77,200.0 – 2,10,000.0 – – – – 3,30,000.0
ii) VAT compensation – – – – – – – –
iii) Central sales tax compensation – – – – – – – –
iv) Compensation cess – – – – – – – –
Appendix I: Revenue Receipts of States and Union Territories with Legislature (Contd.)
(₹ Lakh)
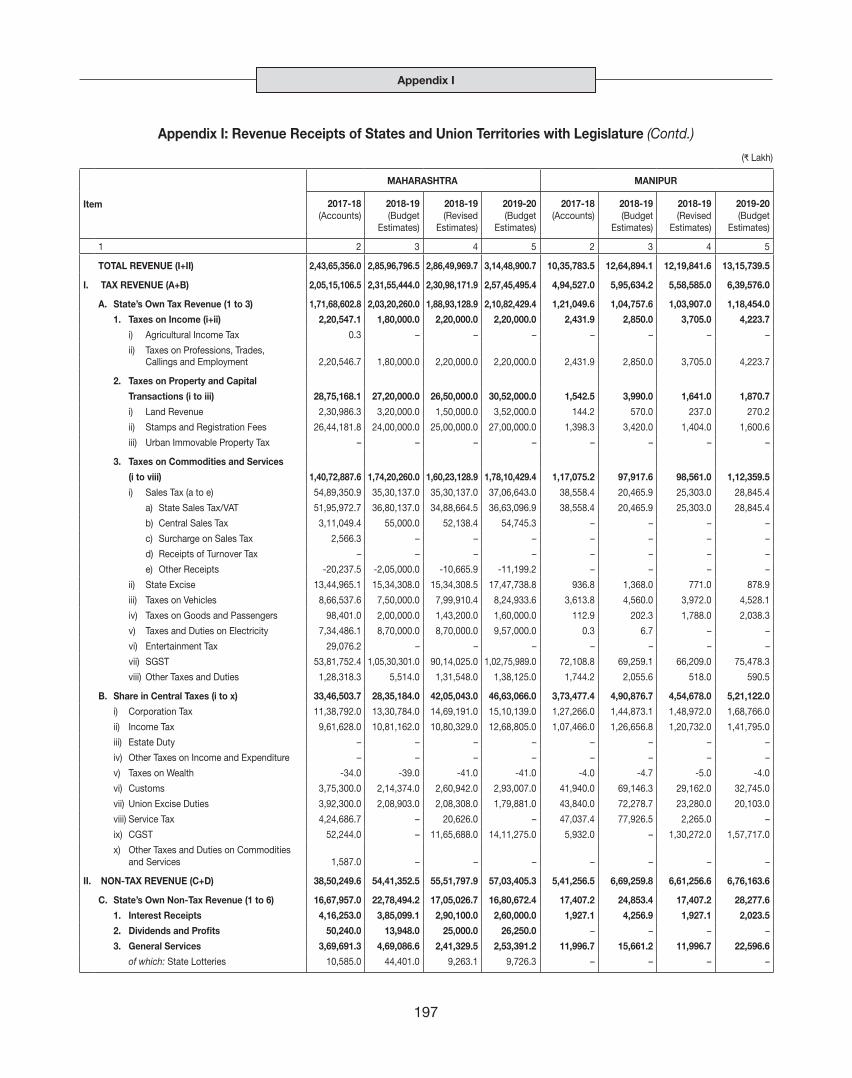
Appendix I
197
Item
MAHARASHTRA MANIPUR
2017-18(Accounts)
2018-19(Budget
Estimates)
2018-19(Revised
Estimates)
2019-20(Budget
Estimates)
2017-18(Accounts)
2018-19(Budget
Estimates)
2018-19(Revised
Estimates)
2019-20(Budget
Estimates)
1 2 3 4 5 2 3 4 5
TOTAL REVENUE (I+II) 2,43,65,356.0 2,85,96,796.5 2,86,49,969.7 3,14,48,900.7 10,35,783.5 12,64,894.1 12,19,841.6 13,15,739.5
I. TAX REVENUE (A+B) 2,05,15,106.5 2,31,55,444.0 2,30,98,171.9 2,57,45,495.4 4,94,527.0 5,95,634.2 5,58,585.0 6,39,576.0
A. State’s Own Tax Revenue (1 to 3) 1,71,68,602.8 2,03,20,260.0 1,88,93,128.9 2,10,82,429.4 1,21,049.6 1,04,757.6 1,03,907.0 1,18,454.0
1. Taxes on Income (i+ii) 2,20,547.1 1,80,000.0 2,20,000.0 2,20,000.0 2,431.9 2,850.0 3,705.0 4,223.7
i) Agricultural Income Tax 0.3 – – – – – – –
ii) Taxes on Professions, Trades, Callings and Employment 2,20,546.7 1,80,000.0 2,20,000.0 2,20,000.0 2,431.9 2,850.0 3,705.0 4,223.7
2. Taxes on Property and Capital
Transactions (i to iii) 28,75,168.1 27,20,000.0 26,50,000.0 30,52,000.0 1,542.5 3,990.0 1,641.0 1,870.7
i) Land Revenue 2,30,986.3 3,20,000.0 1,50,000.0 3,52,000.0 144.2 570.0 237.0 270.2
ii) Stamps and Registration Fees 26,44,181.8 24,00,000.0 25,00,000.0 27,00,000.0 1,398.3 3,420.0 1,404.0 1,600.6
iii) Urban Immovable Property Tax – – – – – – – –
3. Taxes on Commodities and Services
(i to viii) 1,40,72,887.6 1,74,20,260.0 1,60,23,128.9 1,78,10,429.4 1,17,075.2 97,917.6 98,561.0 1,12,359.5
i) Sales Tax (a to e) 54,89,350.9 35,30,137.0 35,30,137.0 37,06,643.0 38,558.4 20,465.9 25,303.0 28,845.4
a) State Sales Tax/VAT 51,95,972.7 36,80,137.0 34,88,664.5 36,63,096.9 38,558.4 20,465.9 25,303.0 28,845.4
b) Central Sales Tax 3,11,049.4 55,000.0 52,138.4 54,745.3 – – – –
c) Surcharge on Sales Tax 2,566.3 – – – – – – –
d) Receipts of Turnover Tax – – – – – – – –
e) Other Receipts -20,237.5 -2,05,000.0 -10,665.9 -11,199.2 – – – –
ii) State Excise 13,44,965.1 15,34,308.0 15,34,308.5 17,47,738.8 936.8 1,368.0 771.0 878.9
iii) Taxes on Vehicles 8,66,537.6 7,50,000.0 7,99,910.4 8,24,933.6 3,613.8 4,560.0 3,972.0 4,528.1
iv) Taxes on Goods and Passengers 98,401.0 2,00,000.0 1,43,200.0 1,60,000.0 112.9 202.3 1,788.0 2,038.3
v) Taxes and Duties on Electricity 7,34,486.1 8,70,000.0 8,70,000.0 9,57,000.0 0.3 6.7 – –
vi) Entertainment Tax 29,076.2 – – – – – – –
vii) SGST 53,81,752.4 1,05,30,301.0 90,14,025.0 1,02,75,989.0 72,108.8 69,259.1 66,209.0 75,478.3
viii) Other Taxes and Duties 1,28,318.3 5,514.0 1,31,548.0 1,38,125.0 1,744.2 2,055.6 518.0 590.5
B. Share in Central Taxes (i to x) 33,46,503.7 28,35,184.0 42,05,043.0 46,63,066.0 3,73,477.4 4,90,876.7 4,54,678.0 5,21,122.0
i) Corporation Tax 11,38,792.0 13,30,784.0 14,69,191.0 15,10,139.0 1,27,266.0 1,44,873.1 1,48,972.0 1,68,766.0
ii) Income Tax 9,61,628.0 10,81,162.0 10,80,329.0 12,68,805.0 1,07,466.0 1,26,656.8 1,20,732.0 1,41,795.0
iii) Estate Duty – – – – – – – –
iv) Other Taxes on Income and Expenditure – – – – – – – –
v) Taxes on Wealth -34.0 -39.0 -41.0 -41.0 -4.0 -4.7 -5.0 -4.0
vi) Customs 3,75,300.0 2,14,374.0 2,60,942.0 2,93,007.0 41,940.0 69,146.3 29,162.0 32,745.0
vii) Union Excise Duties 3,92,300.0 2,08,903.0 2,08,308.0 1,79,881.0 43,840.0 72,278.7 23,280.0 20,103.0
viii) Service Tax 4,24,686.7 – 20,626.0 – 47,037.4 77,926.5 2,265.0 –
ix) CGST 52,244.0 – 11,65,688.0 14,11,275.0 5,932.0 – 1,30,272.0 1,57,717.0
x) Other Taxes and Duties on Commodities and Services 1,587.0 – – – – – – –
II. NON-TAX REVENUE (C+D) 38,50,249.6 54,41,352.5 55,51,797.9 57,03,405.3 5,41,256.5 6,69,259.8 6,61,256.6 6,76,163.6
C. State’s Own Non-Tax Revenue (1 to 6) 16,67,957.0 22,78,494.2 17,05,026.7 16,80,672.4 17,407.2 24,853.4 17,407.2 28,277.6
1. Interest Receipts 4,16,253.0 3,85,099.1 2,90,100.0 2,60,000.0 1,927.1 4,256.9 1,927.1 2,023.5
2. Dividends and Profits 50,240.0 13,948.0 25,000.0 26,250.0 – – – –
3. General Services 3,69,691.3 4,69,086.6 2,41,329.5 2,53,391.2 11,996.7 15,661.2 11,996.7 22,596.6
of which: State Lotteries 10,585.0 44,401.0 9,263.1 9,726.3 – – – –
Appendix I: Revenue Receipts of States and Union Territories with Legislature (Contd.)
(₹ Lakh)
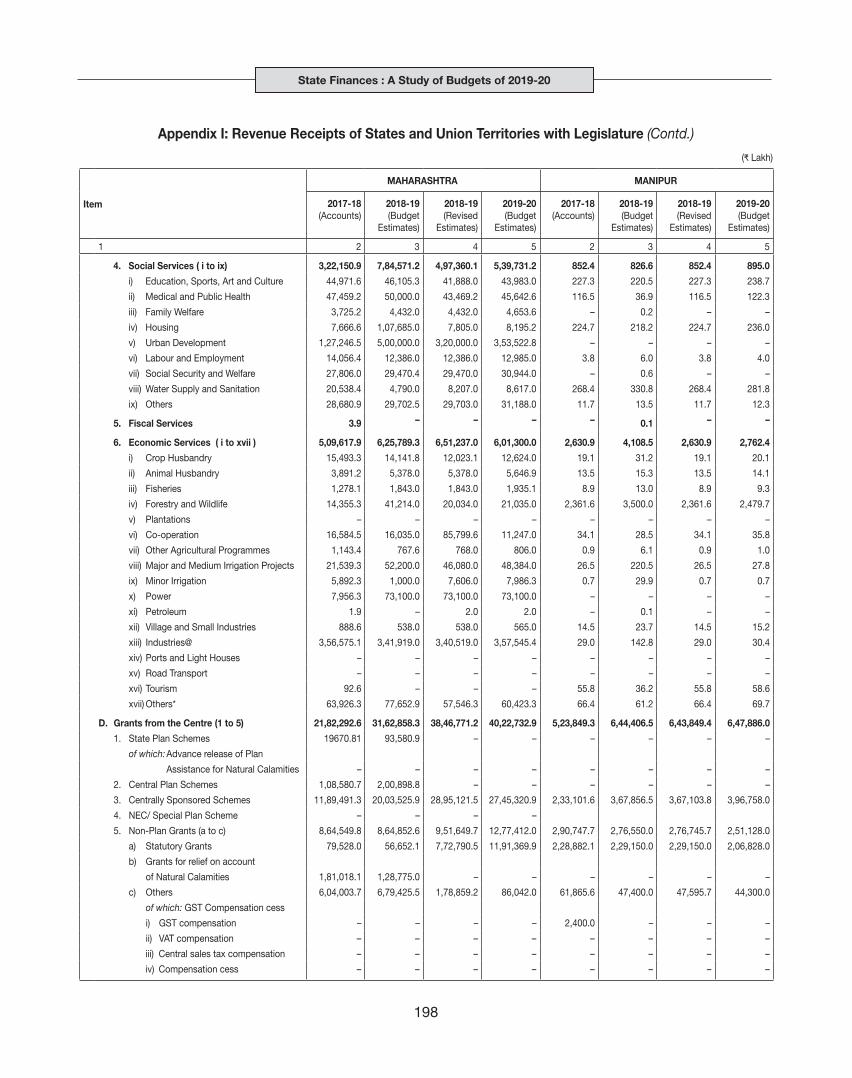
State Finances : A Study of Budgets of 2019-20
198
Item
MAHARASHTRA MANIPUR
2017-18(Accounts)
2018-19(Budget
Estimates)
2018-19(Revised
Estimates)
2019-20(Budget
Estimates)
2017-18(Accounts)
2018-19(Budget
Estimates)
2018-19(Revised
Estimates)
2019-20(Budget
Estimates)
1 2 3 4 5 2 3 4 5
4. Social Services ( i to ix) 3,22,150.9 7,84,571.2 4,97,360.1 5,39,731.2 852.4 826.6 852.4 895.0
i) Education, Sports, Art and Culture 44,971.6 46,105.3 41,888.0 43,983.0 227.3 220.5 227.3 238.7
ii) Medical and Public Health 47,459.2 50,000.0 43,469.2 45,642.6 116.5 36.9 116.5 122.3
iii) Family Welfare 3,725.2 4,432.0 4,432.0 4,653.6 – 0.2 – –
iv) Housing 7,666.6 1,07,685.0 7,805.0 8,195.2 224.7 218.2 224.7 236.0
v) Urban Development 1,27,246.5 5,00,000.0 3,20,000.0 3,53,522.8 – – – –
vi) Labour and Employment 14,056.4 12,386.0 12,386.0 12,985.0 3.8 6.0 3.8 4.0
vii) Social Security and Welfare 27,806.0 29,470.4 29,470.0 30,944.0 – 0.6 – –
viii) Water Supply and Sanitation 20,538.4 4,790.0 8,207.0 8,617.0 268.4 330.8 268.4 281.8
ix) Others 28,680.9 29,702.5 29,703.0 31,188.0 11.7 13.5 11.7 12.3
5. Fiscal Services 3.9 – – – – 0.1 – –
6. Economic Services ( i to xvii ) 5,09,617.9 6,25,789.3 6,51,237.0 6,01,300.0 2,630.9 4,108.5 2,630.9 2,762.4
i) Crop Husbandry 15,493.3 14,141.8 12,023.1 12,624.0 19.1 31.2 19.1 20.1
ii) Animal Husbandry 3,891.2 5,378.0 5,378.0 5,646.9 13.5 15.3 13.5 14.1
iii) Fisheries 1,278.1 1,843.0 1,843.0 1,935.1 8.9 13.0 8.9 9.3
iv) Forestry and Wildlife 14,355.3 41,214.0 20,034.0 21,035.0 2,361.6 3,500.0 2,361.6 2,479.7
v) Plantations – – – – – – – –
vi) Co-operation 16,584.5 16,035.0 85,799.6 11,247.0 34.1 28.5 34.1 35.8
vii) Other Agricultural Programmes 1,143.4 767.6 768.0 806.0 0.9 6.1 0.9 1.0
viii) Major and Medium Irrigation Projects 21,539.3 52,200.0 46,080.0 48,384.0 26.5 220.5 26.5 27.8
ix) Minor Irrigation 5,892.3 1,000.0 7,606.0 7,986.3 0.7 29.9 0.7 0.7
x) Power 7,956.3 73,100.0 73,100.0 73,100.0 – – – –
xi) Petroleum 1.9 – 2.0 2.0 – 0.1 – –
xii) Village and Small Industries 888.6 538.0 538.0 565.0 14.5 23.7 14.5 15.2
xiii) Industries@ 3,56,575.1 3,41,919.0 3,40,519.0 3,57,545.4 29.0 142.8 29.0 30.4
xiv) Ports and Light Houses – – – – – – – –
xv) Road Transport – – – – – – – –
xvi) Tourism 92.6 – – – 55.8 36.2 55.8 58.6
xvii) Others* 63,926.3 77,652.9 57,546.3 60,423.3 66.4 61.2 66.4 69.7
D. Grants from the Centre (1 to 5) 21,82,292.6 31,62,858.3 38,46,771.2 40,22,732.9 5,23,849.3 6,44,406.5 6,43,849.4 6,47,886.0
1. State Plan Schemes 19670.81 93,580.9 – – – – – –
of which: Advance release of Plan
Assistance for Natural Calamities – – – – – – – –
2. Central Plan Schemes 1,08,580.7 2,00,898.8 – – – – – –
3. Centrally Sponsored Schemes 11,89,491.3 20,03,525.9 28,95,121.5 27,45,320.9 2,33,101.6 3,67,856.5 3,67,103.8 3,96,758.0
4. NEC/ Special Plan Scheme – – – –
5. Non-Plan Grants (a to c) 8,64,549.8 8,64,852.6 9,51,649.7 12,77,412.0 2,90,747.7 2,76,550.0 2,76,745.7 2,51,128.0
a) Statutory Grants 79,528.0 56,652.1 7,72,790.5 11,91,369.9 2,28,882.1 2,29,150.0 2,29,150.0 2,06,828.0
b) Grants for relief on account
of Natural Calamities 1,81,018.1 1,28,775.0 – – – – – –
c) Others 6,04,003.7 6,79,425.5 1,78,859.2 86,042.0 61,865.6 47,400.0 47,595.7 44,300.0
of which: GST Compensation cess
i) GST compensation – – – – 2,400.0 – – –
ii) VAT compensation – – – – – – – –
iii) Central sales tax compensation – – – – – – – –
iv) Compensation cess – – – – – – – –
Appendix I: Revenue Receipts of States and Union Territories with Legislature (Contd.)
(₹ Lakh)

Appendix I
199
Item
MEGHALAYA MIZORAM
2017-18(Accounts)
2018-19(Budget
Estimates)
2018-19(Revised
Estimates)
2019-20(Budget
Estimates)
2017-18(Accounts)
2018-19(Budget
Estimates)
2018-19(Revised
Estimates)
2019-20(Budget
Estimates)
1 2 3 4 5 2 3 4 5
TOTAL REVENUE (I+II) 9,27,348.1 12,53,151.0 12,53,151.0 14,43,796.0 8,58,019.4 8,90,942.6 8,67,390.6 9,84,698.8
I. TAX REVENUE (A+B) 5,77,323.5 6,77,598.0 6,77,598.0 7,51,217.0 3,64,295.7 4,10,865.7 3,87,313.7 4,45,887.8
A. State’s Own Tax Revenue (1 to 3) 1,88,665.5 1,97,759.0 1,97,759.0 2,08,980.0 85,870.7 67,056.7 48,333.7 57,368.8
1. Taxes on Income (i+ii) 352.2 453.0 453.0 498.0 1,577.8 1,620.0 1,620.0 1,670.0
i) Agricultural Income Tax – – – – – – – –
ii) Taxes on Professions, Trades, Callings and Employment 352.2 453.0 453.0 498.0 1,577.8 1,620.0 1,620.0 1,670.0
2. Taxes on Property and Capital
Transactions (i to iii) 2,233.1 2,093.0 2,093.0 2,302.0 1,149.0 2,070.1 2,070.1 1,692.2
i) Land Revenue 208.0 154.0 154.0 169.0 828.8 1,081.1 1,081.1 1,100.0
ii) Stamps and Registration Fees 2,025.1 1,939.0 1,939.0 2,133.0 320.2 989.0 989.0 592.2
iii) Urban Immovable Property Tax – – – – – – – –
3. Taxes on Commodities and Services
(i to viii) 1,86,080.2 1,95,213.0 1,95,213.0 2,06,180.0 83,143.9 63,366.6 44,643.6 54,006.6
i) Sales Tax (a to e) 76,662.7 1,33,973.0 1,33,973.0 1,65,000.0 24,284.8 30,780.0 30,780.0 15,006.0
a) State Sales Tax/VAT 29,324.5 67,045.5 67,045.5 72,320.0 24,284.8 30,780.0 30,780.0 15,006.0
b) Central Sales Tax 725.0 6.0 6.0 30,500.0 – – – –
c) Surcharge on Sales Tax 10.2 – – – – – – –
d) Receipts of Turnover Tax – – – – – – – –
e) Other Receipts 46,603.0 66,921.5 66,921.5 62,180.0 – – – –
ii) State Excise 19,930.2 26,350.0 26,350.0 28,985.0 6,582.6 5,940.0 5,940.0 500.0
iii) Taxes on Vehicles 6,700.8 6,994.0 6,994.0 10,000.0 3,158.2 2,573.6 2,573.6 2,706.5
iv) Taxes on Goods and Passengers 783.4 618.0 618.0 941.0 783.2 350.0 350.0 275.0
v) Taxes and Duties on Electricity 182.3 248.0 248.0 273.0 – – – –
vi) Entertainment Tax 200.2 482.0 482.0 610.0 – – – –
vii) SGST 81,255.7 26,138.0 26,138.0 – 48,256.2 23,723.0 5,000.0 35,503.1
viii) Other Taxes and Duties 365.0 410.0 410.0 371.0 78.9 – – 16.0
B. Share in Central Taxes (i to x) 3,88,658.0 4,79,839.0 4,79,839.0 5,42,237.0 2,78,425.0 3,43,809.0 3,38,980.0 3,88,519.0
i) Corporation Tax 1,32,423.0 1,42,067.0 1,42,067.0 1,75,604.0 94,882.0 1,01,792.0 1,11,065.0 1,25,822.0
ii) Income Tax 1,11,820.0 1,25,721.0 1,25,721.0 1,47,541.0 80,120.0 90,081.0 90,011.0 1,05,715.0
iii) Estate Duty – – – – – – – –
iv) Other Taxes on Income and Expenditure – – – – – – – –
v) Taxes on Wealth -4.0 -5.0 -5.0 -5.0 -3.0 -3.0 -3.0 -3.0
vi) Customs 43,640.0 24,928.0 24,928.0 34,072.0 31,270.0 17,861.0 21,741.0 24,413.0
vii) Union Excise Duties 45,620.0 24,292.0 24,292.0 20,917.0 32,690.0 17,405.0 17,356.0 14,987.0
viii) Service Tax 49,015.0 – – – 35,050.0 – 1,687.0 –
ix) CGST 6,144.0 1,62,836.0 1,62,836.0 1,64,108.0 4,416.0 1,16,673.0 97,123.0 1,17,585.0
x) Other Taxes and Duties on Commodities and Services – – – – – – – –
II. NON-TAX REVENUE (C+D) 3,50,024.6 5,75,553.0 5,75,553.0 6,92,579.0 4,93,723.7 4,80,076.9 4,80,076.9 5,38,811.1
C. State’s Own Non-Tax Revenue (1 to 6) 36,663.5 53,810.0 53,810.0 60,057.0 39,065.0 32,385.3 32,385.3 45,930.2
1. Interest Receipts 5,249.6 4,760.0 4,760.0 5,506.0 5,113.6 2,404.1 2,404.1 2,596.4
2. Dividends and Profits 10.9 19.0 19.0 21.0 – – – –
3. General Services 2,687.5 4,399.0 4,399.0 5,434.0 3,213.5 2,546.2 2,546.2 2,938.6
of which: State Lotteries 94.5 1,561.0 1,561.0 1,717.0 1,380.5 1,350.3 1,350.3 1,400.0
Appendix I: Revenue Receipts of States and Union Territories with Legislature (Contd.)
(₹ Lakh)

State Finances : A Study of Budgets of 2019-20
200
Item
MEGHALAYA MIZORAM
2017-18(Accounts)
2018-19(Budget
Estimates)
2018-19(Revised
Estimates)
2019-20(Budget
Estimates)
2017-18(Accounts)
2018-19(Budget
Estimates)
2018-19(Revised
Estimates)
2019-20(Budget
Estimates)
1 2 3 4 5 2 3 4 5
4. Social Services ( i to ix) 1,433.5 1,429.0 1,429.0 1,572.0 4,682.8 4,898.8 4,898.8 5,546.8
i) Education, Sports, Art and Culture 143.9 332.0 332.0 365.0 233.6 242.0 242.0 261.4
ii) Medical and Public Health 204.1 216.0 216.0 238.0 35.4 18.1 18.1 19.6
iii) Family Welfare – – – – – 1.1 1.1 1.2
iv) Housing 46.6 40.0 40.0 44.0 136.7 127.4 127.4 137.6
v) Urban Development 5.2 48.0 48.0 53.0 10.9 8.5 8.5 59.2
vi) Labour and Employment 512.0 303.0 303.0 333.0 5.3 12.5 12.5 13.5
vii) Social Security and Welfare 0.7 – – – 290.3 149.1 149.1 46.3
viii) Water Supply and Sanitation 513.3 490.0 490.0 539.0 3,949.4 4,320.0 4,320.0 5,000.0
ix) Others 7.9 – – – 21.3 20.0 20.0 8.0
5. Fiscal Services – – – – – – – 1.5
6. Economic Services ( i to xvii ) 27,282.0 43,203.0 43,203.0 47,524.0 26,055.1 22,536.3 22,536.3 34,846.9
i) Crop Husbandry 449.5 859.0 859.0 945.0 72.9 83.9 83.9 63.9
ii) Animal Husbandry 184.7 250.0 250.0 275.0 58.4 64.3 64.3 69.4
iii) Fisheries 1.8 19.0 19.0 21.0 10.7 52.2 52.2 12.0
iv) Forestry and Wildlife 5,561.2 11,439.0 11,439.0 12,583.0 366.5 249.5 249.5 350.0
v) Plantations – – – – – – – –
vi) Co-operation 4.0 220.0 220.0 242.0 110.6 29.5 29.5 250.0
vii) Other Agricultural Programmes 20.1 282.0 282.0 310.0 276.6 183.7 183.7 302.7
viii) Major and Medium Irrigation Projects – – – – – – – –
ix) Minor Irrigation 23.1 28.0 28.0 31.0 0.8 12.5 12.5 3.0
x) Power -22.0 340.0 340.0 374.0 21,309.7 19,870.5 19,870.5 30,000.0
xi) Petroleum – – – – – – – –
xii) Village and Small Industries 74.2 92.0 92.0 101.0 51.6 51.0 51.0 55.1
xiii) Industries@ 20,788.0 29,139.0 29,139.0 32,053.0 633.5 518.2 518.2 520.0
xiv) Ports and Light Houses – – – – – – – –
xv) Road Transport – – – – 162.6 216.0 216.0 230.0
xvi) Tourism 53.7 11.0 11.0 12.0 250.2 238.1 238.1 257.2
xvii) Others* 143.7 524.0 524.0 577.0 2,751.0 966.9 966.9 2,733.6
D. Grants from the Centre (1 to 5) 3,13,361.2 5,21,743.0 5,21,743.0 6,32,522.0 4,54,658.7 4,47,691.6 4,47,691.6 4,92,880.9
1. State Plan Schemes – – – – – 49,977.7 – –
of which: Advance release of Plan
Assistance for Natural Calamities – – – – – – – –
2. Central Plan Schemes – – – – – – – –
3. Centrally Sponsored Schemes 2,14,584.7 4,18,964.0 4,18,964.0 5,25,252.0 1,46,479.9 1,21,098.9 1,58,892.2 1,90,266.5
4. NEC/ Special Plan Scheme – – – – – 12,264.0 12,264.0 –
5. Non-Plan Grants (a to c) 98,776.5 1,02,779.0 1,02,779.0 1,07,270.0 3,08,178.8 2,64,351.0 2,76,535.4 3,02,614.4
a) Statutory Grants 49,996.0 32,270.0 32,270.0 11,548.0 2,53,551.0 2,58,800.0 2,63,341.0 2,77,078.0
b) Grants for relief on account
of Natural Calamities – – – – – 1,800.0 – –
c) Others 48,780.5 70,509.0 70,509.0 95,722.0 54,627.8 3,751.0 13,194.4 25,536.4
of which: GST Compensation cess
i) GST compensation 12,400.0 – – – – – – –
ii) VAT compensation – – – – – – – –
iii) Central sales tax compensation – – – – – – – –
iv) Compensation cess – – – – – – – –
Appendix I: Revenue Receipts of States and Union Territories with Legislature (Contd.)
(₹ Lakh)

Appendix I
201
Item
NAGALAND ODISHA
2017-18(Accounts)
2018-19(Budget
Estimates)
2018-19(Revised
Estimates)
2019-20(Budget
Estimates)
2017-18(Accounts)
2018-19(Budget
Estimates)
2018-19(Revised
Estimates)
2019-20(Budget
Estimates)
1 2 3 4 5 2 3 4 5
TOTAL REVENUE (I+II) 11,01,921.1 12,58,672.8 11,97,501.9 13,17,360.3 85,20,429.3 1,00,20,000.0 1,01,88,280.0 1,15,26,600.0
I. TAX REVENUE (A+B) 3,99,141.5 4,41,842.3 4,50,347.0 4,97,264.0 59,18,587.5 65,13,592.0 64,60,370.5 72,20,658.9
A. State’s Own Tax Revenue (1 to 3) 97,692.5 77,118.3 71,105.0 78,014.0 31,07,029.3 29,52,481.0 30,05,020.5 32,99,999.9
1. Taxes on Income (i+ii) 3,488.0 3,750.0 3,706.4 3,750.0 18,781.1 20,400.0 20,000.0 21,000.0
i) Agricultural Income Tax – – – – – – – –
ii) Taxes on Professions, Trades, Callings and Employment 3,488.0 3,750.0 3,706.4 3,750.0 18,781.1 20,400.0 20,000.0 21,000.0
2. Taxes on Property and Capital
Transactions (i to iii) 352.4 305.0 313.5 344.8 1,57,895.0 1,63,509.0 1,63,600.0 1,75,000.0
i) Land Revenue 90.0 65.0 73.5 80.8 54,227.1 53,509.0 53,600.0 55,000.0
ii) Stamps and Registration Fees 262.4 240.0 240.0 264.0 1,03,668.0 1,10,000.0 1,10,000.0 1,20,000.0
iii) Urban Immovable Property Tax – – – – – – – –
3. Taxes on Commodities and Services
(i to viii) 93,852.1 73,063.3 67,085.0 73,919.2 29,30,353.2 27,68,572.1 28,21,420.5 31,03,999.9
i) Sales Tax (a to e) 28,754.5 22,500.0 23,678.2 25,288.8 11,52,165.3 6,88,000.0 6,88,000.0 8,00,000.0
a) State Sales Tax/VAT 28,754.5 22,500.0 23,678.2 25,288.8 11,26,485.9 6,86,337.2 6,86,387.2 7,98,127.0
b) Central Sales Tax – – – – 25,679.4 1,607.8 1,607.8 1,869.0
c) Surcharge on Sales Tax – – – – – – – –
d) Receipts of Turnover Tax – – – – – – – –
e) Other Receipts – – – – – 55.0 5.0 4.0
ii) State Excise 420.0 510.0 480.0 510.0 3,22,098.6 3,80,000.0 3,89,997.6 4,50,000.0
iii) Taxes on Vehicles 10,152.6 10,500.0 11,003.9 12,104.0 1,53,494.9 1,70,000.0 1,80,000.0 2,02,500.0
iv) Taxes on Goods and Passengers 1,759.2 1,460.1 1,719.0 1,890.9 1,26,048.7 0.1 13,000.0 1,000.0
v) Taxes and Duties on Electricity 5.9 6.2 8.1 8.9 1,96,973.6 2,30,000.0 2,70,000.0 2,80,000.0
vi) Entertainment Tax – – – – 2,023.6 2,463.0 365.8 460.9
vii) SGST 52,620.8 38,062.0 30,120.9 34,036.6 9,76,575.1 12,97,482.0 12,80,023.0 13,70,000.0
viii) Other Taxes and Duties 139.1 25.0 75.0 80.0 973.3 627.0 34.1 39.0
B. Share in Central Taxes (i to x) 3,01,449.0 3,64,724.0 3,79,242.0 4,19,250.0 28,11,558.2 35,61,111.0 34,55,350.0 39,20,659.0
i) Corporation Tax 1,02,720.0 1,05,991.0 1,25,867.2 1,36,216.0 9,57,485.0 10,68,279.0 11,28,768.0 12,69,710.0
ii) Income Tax 86,742.0 93,797.0 1,02,007.5 1,13,086.0 8,08,526.0 9,45,367.0 9,15,309.0 10,66,798.0
iii) Estate Duty – – – – – – – –
iv) Other Taxes on Income and Expenditure – – – – – – – –
v) Taxes on Wealth -3.0 -3.0 -4.0 1,27,294.0 -29.0 -33.0 -35.0 -34.0
vi) Customs 33,850.0 18,598.0 24,638.5 26,429.0 3,15,550.0 1,87,448.0 2,20,860.0 2,46,357.0
vii) Union Excise Duties 35,390.0 18,123.0 19,669.4 16,225.0 3,29,840.0 1,82,663.0 1,76,143.0 1,51,242.0
viii) Service Tax 37,970.0 – 1,917.3 – 3,56,063.2 – 17,245.0 –
ix) CGST 4,780.0 1,28,218.0 1,05,146.0 – 44,124.0 11,77,388.0 9,90,183.0 11,86,586.0
x) Other Taxes and Duties on Commodities and Services – – – – -1.0 -1.0 6,877.0 –
II. NON-TAX REVENUE (C+D) 7,02,779.6 8,16,830.5 7,47,155.0 8,20,096.3 26,01,841.9 35,06,408.0 37,27,909.5 43,05,941.1
C. State’s Own Non-Tax Revenue (1 to 6) 38,852.6 34,745.2 34,709.7 32,902.3 8,39,847.5 10,30,000.0 11,25,002.4 12,50,000.0
1. Interest Receipts 697.3 500.0 785.0 795.0 60,071.5 83,000.0 90,000.0 1,00,000.0
2. Dividends and Profits – – – – 6,622.4 55,000.0 63,550.0 63,900.0
3. General Services 8,562.7 2,445.4 3,232.8 3,489.7 38,882.6 40,858.9 40,468.9 41,171.0
of which: State Lotteries – – – – – – – –
Appendix I: Revenue Receipts of States and Union Territories with Legislature (Contd.)
(₹ Lakh)

State Finances : A Study of Budgets of 2019-20
202
Item
NAGALAND ODISHA
2017-18(Accounts)
2018-19(Budget
Estimates)
2018-19(Revised
Estimates)
2019-20(Budget
Estimates)
2017-18(Accounts)
2018-19(Budget
Estimates)
2018-19(Revised
Estimates)
2019-20(Budget
Estimates)
1 2 3 4 5 2 3 4 5
4. Social Services ( i to ix) 14,335.5 10,969.5 12,732.8 9,128.4 20,863.4 22,298.0 20,780.7 22,320.4
i) Education, Sports, Art and Culture 13,284.4 10,000.0 11,500.0 8,000.0 2,388.3 4,000.0 4,000.0 4,000.0
ii) Medical and Public Health 60.3 74.6 68.5 74.6 5,779.4 5,100.0 3,490.0 3,769.4
iii) Family Welfare – 0.4 0.1 0.1 4.7 5.0 5.0 5.0
iv) Housing 628.1 580.0 610.0 670.0 1,603.6 1,900.0 1,900.0 2,001.0
v) Urban Development 12.3 7.1 4.5 5.0 283.5 252.0 252.0 292.0
vi) Labour and Employment 20.3 16.5 115.0 20.0 1,160.0 1,290.0 1,287.0 1,300.0
vii) Social Security and Welfare 1.9 3.1 88.5 2.5 22.5 9.0 9.0 9.0
viii) Water Supply and Sanitation 320.7 280.0 345.0 355.0 8,538.0 8,900.0 9,000.0 10,000.0
ix) Others 7.6 7.8 1.2 1.3 1,083.3 842.0 837.7 944.0
5. Fiscal Services – – – – – 0.1 0.1 0.1
6. Economic Services ( i to xvii ) 15,257.1 20,830.3 17,959.1 19,489.2 7,13,407.8 8,28,843.0 9,10,202.7 10,22,608.5
i) Crop Husbandry 14.9 25.0 13.5 14.5 3,187.9 7,200.0 4,744.0 6,195.0
ii) Animal Husbandry 68.1 95.0 70.2 75.0 177.1 174.7 171.8 183.3
iii) Fisheries 0.3 1.0 2.1 0.3 169.3 222.0 219.0 222.0
iv) Forestry and Wildlife 973.5 1,300.0 1,050.0 1,100.0 6,279.4 4,800.0 5,000.0 5,450.0
v) Plantations – – – – – – – –
vi) Co-operation 6.5 10.0 418.5 10.0 609.2 333.0 333.0 476.1
vii) Other Agricultural Programmes 9.4 9.5 0.1 0.2 278.5 299.0 299.0 300.0
viii) Major and Medium Irrigation Projects – – – – 66,346.1 78,000.0 75,084.0 79,000.0
ix) Minor Irrigation 2.0 3.5 5.3 3.0 2,535.2 2,000.0 1,000.0 1,000.0
x) Power 12,789.4 15,800.0 14,500.0 16,000.0 339.3 257.0 257.0 289.0
xi) Petroleum – – – – 0.1 – – –
xii) Village and Small Industries 20.9 34.1 15.0 17.0 32.9 116.0 116.0 116.0
xiii) Industries@ 94.7 85.1 75.0 82.5 6,13,216.4 7,10,028.0 8,00,026.0 9,00,045.0
xiv) Ports and Light Houses – – – – 8,436.7 4,250.0 5,282.0 8,610.0
xv) Road Transport 734.7 1,100.0 790.0 850.0 – – – –
xvi) Tourism 48.7 45.0 55.0 60.0 17.9 50.0 50.0 50.0
xvii) Others* 494.1 2,322.1 964.3 1,276.8 11,781.9 21,113.3 17,620.9 20,672.1
D. Grants from the Centre (1 to 5) 6,63,927.1 7,82,085.3 7,12,445.3 7,87,194.0 17,61,994.3 24,76,408.0 26,02,907.1 30,55,941.1
1. State Plan Schemes 2,92,215.8 3,73,688.3 3,10,192.1 3,59,494.0
of which: Advance release of Plan
Assistance for Natural Calamities – – – – – – – –
2. Central Plan Schemes – – – – – – – –
3. Centrally Sponsored Schemes – – – – 12,89,991.7 16,64,493.0 17,00,993.0 17,42,357.0
4. NEC/ Special Plan Scheme – – – – – – – –
5. Non-Plan Grants (a to c) 3,71,711.3 4,08,397.0 4,02,253.1 4,27,700.0 4,72,002.6 8,11,915.0 9,01,914.2 13,13,584.1
a) Statutory Grants 3,70,000.0 3,97,407.0 3,94,500.0 4,17,700.0 2,40,555.0 3,04,514.0 3,04,514.0 4,04,196.0
b) Grants for relief on account
of Natural Calamities – 990.0 – – – – – –
c) Others 1,711.3 10,000.0 7,753.1 10,000.0 2,31,447.6 5,07,401.0 5,97,400.2 9,09,388.1
of which: GST Compensation cess
i) GST compensation – – – – 2,07,976.0 4,07,400.0 4,07,400.0 4,86,704.0
ii) VAT compensation – – – – – – – –
iii) Central sales tax compensation – – – – – – – –
iv) Compensation cess – – – – – 1.0 0.1 0.1
Appendix I: Revenue Receipts of States and Union Territories with Legislature (Contd.)
(₹ Lakh)

Appendix I
203
Item
PUNJAB RAJASTHAN
2017-18(Accounts)
2018-19(Budget
Estimates)
2018-19(Revised
Estimates)
2019-20(Budget
Estimates)
2017-18(Accounts)
2018-19(Budget
Estimates)
2018-19(Revised
Estimates)
2019-20(Budget
Estimates)
1 2 3 4 5 2 3 4 5
TOTAL REVENUE (I+II) 53,00,958.1 73,81,185.7 70,39,891.4 78,50,969.8 1,27,30,718.2 1,51,66,350.4 1,48,18,400.6 1,64,00,463.4
I. TAX REVENUE (A+B) 41,04,018.7 54,99,284.0 44,75,071.6 50,99,361.5 87,63,342.3 1,01,40,876.7 1,03,75,936.3 1,18,20,442.9
A. State’s Own Tax Revenue (1 to 3) 31,49,556.7 42,89,548.0 33,07,300.6 37,67,419.5 54,34,189.3 59,25,305.7 61,90,701.3 73,74,256.9
1. Taxes on Income (i+ii) – – 7,200.0 7,800.0 0.2 0.2 0.4 0.3
i) Agricultural Income Tax – – – – – 0.1 0.3 0.3
ii) Taxes on Professions, Trades, Callings and Employment – – 7,200.0 7,800.0 0.2 0.1 0.2 –
2. Taxes on Property and Capital
Transactions (i to iii) 2,22,647.4 2,61,000.0 2,39,840.6 2,76,153.0 4,03,997.0 4,84,710.5 5,22,316.5 5,78,655.5
i) Land Revenue 9,134.2 11,000.0 9,840.6 11,153.0 36,386.5 58,710.5 46,316.5 42,655.5
ii) Stamps and Registration Fees 2,13,513.2 2,50,000.0 2,30,000.0 2,65,000.0 3,67,477.9 4,25,000.0 4,75,000.0 5,35,000.0
iii) Urban Immovable Property Tax – – – – 132.7 1,000.0 1,000.0 1,000.0
3. Taxes on Commodities and Services
(i to viii) 29,26,909.3 40,28,548.0 30,60,260.0 34,83,466.5 50,30,192.2 54,40,595.0 56,68,384.4 67,95,601.1
i) Sales Tax (a to e) 11,16,030.1 6,33,300.0 6,23,300.0 6,35,300.0 19,00,824.1 15,60,000.0 16,50,000.0 20,00,000.0
a) State Sales Tax/VAT 9,67,385.0 6,13,300.0 6,03,300.0 6,16,300.0 – – – –
b) Central Sales Tax 39,221.1 20,000.0 20,000.0 19,000.0 72,280.3 42,300.0 60,000.0 72,600.0
c) Surcharge on Sales Tax – – – – – – – –
d) Receipts of Turnover Tax – – – – – – – –
e) Other Receipts 1,09,423.9 – 18,28,543.8 15,17,700.0 15,90,000.0 19,27,400.0
ii) State Excise 5,13,568.2 6,00,000.0 5,46,200.0 6,20,100.0 7,27,583.4 9,30,000.0 9,30,000.0 10,50,000.0
iii) Taxes on Vehicles 1,91,119.8 2,14,000.0 2,14,000.0 2,46,000.0 4,36,296.7 4,90,000.0 5,00,000.0 5,65,000.0
iv) Taxes on Goods and Passengers – – – – 34,077.9 100.0 3,757.0 100.0
v) Taxes and Duties on Electricity 2,05,307.2 2,50,000.0 2,50,000.0 2,71,110.5 3,37,666.8 2,45,000.0 2,33,950.2 2,80,401.0
vi) Entertainment Tax 1,648.8 2,024.0 – – 4,015.7 60.0 582.0 60.0
vii) SGST 8,97,346.1 21,77,172.0 14,26,760.0 17,10,956.0 15,87,350.2 22,15,395.0 23,50,000.0 29,00,000.0
viii) Other Taxes and Duties 1,889.0 1,52,052.0 – – 2,377.3 40.0 95.1 40.1
B. Share in Central Taxes (i to x) 9,54,462.0 12,09,736.0 11,67,771.0 13,31,942.0 33,29,153.0 42,15,571.0 41,85,235.0 44,46,186.0
i) Corporation Tax 3,25,281.0 3,48,971.0 3,36,376.0 4,31,351.0 11,33,429.0 12,49,889.0 14,55,299.0 15,14,899.0
ii) Income Tax 2,74,676.0 3,08,820.0 2,91,018.0 3,62,417.0 9,57,100.0 10,82,846.0 10,71,766.0 11,58,053.0
iii) Estate Duty – – – – – – – –
iv) Other Taxes on Income and Expenditure – – 2,175.0 – – 7,579.0 7,579.0 –
v) Taxes on Wealth -10.0 -11.0 122.0 -12.0 -34.0 388.0 533.0 -40.0
vi) Customs 1,07,200.0 61,233.0 70,590.0 83,693.0 3,73,530.0 2,45,958.0 2,96,633.0 3,20,051.0
vii) Union Excise Duties 1,12,050.0 59,670.0 63,018.0 51,381.0 3,90,450.0 2,19,591.0 1,97,130.0 2,42,457.0
viii) Service Tax 1,20,105.0 31,066.0 4,164.0 – 4,22,675.0 14,799.0 38,839.0 –
ix) CGST 15,160.0 3,99,987.0 3,99,994.0 4,03,112.0 52,004.0 13,93,741.0 11,15,295.0 12,10,766.0
x) Other Taxes and Duties on Commodities and Services – – 314.0 – -1.0 780.0 2,161.0 –
II. NON-TAX REVENUE (C+D) 11,96,939.4 18,81,901.7 25,64,819.8 27,51,608.3 39,67,375.8 50,25,473.7 44,42,464.3 45,80,020.5
C. State’s Own Non-Tax Revenue (1 to 6) 4,31,838.6 10,24,885.4 9,92,996.9 9,47,698.3 15,73,371.7 20,39,741.7 19,96,640.6 19,12,411.8
1. Interest Receipts 1,40,494.3 1,34,007.8 1,43,273.6 1,43,339.8 4,85,890.2 6,32,380.9 5,81,044.3 3,84,199.6
2. Dividends and Profits 444.6 469.8 383.0 415.0 6,676.4 7,100.2 7,587.3 8,345.0
3. General Services 1,83,637.0 7,25,027.9 7,46,885.1 6,66,104.3 1,41,685.5 2,47,955.7 2,08,697.1 2,12,008.7
of which: State Lotteries 5,618.6 93,880.0 8,000.0 82,832.0 – – – –
Appendix I: Revenue Receipts of States and Union Territories with Legislature (Contd.)
(₹ Lakh)

State Finances : A Study of Budgets of 2019-20
204
Item
PUNJAB RAJASTHAN
2017-18(Accounts)
2018-19(Budget
Estimates)
2018-19(Revised
Estimates)
2019-20(Budget
Estimates)
2017-18(Accounts)
2018-19(Budget
Estimates)
2018-19(Revised
Estimates)
2019-20(Budget
Estimates)
1 2 3 4 5 2 3 4 5
4. Social Services ( i to ix) 50,538.1 65,537.9 56,781.6 58,287.5 1,32,678.4 1,63,542.9 1,58,605.2 1,53,223.9
i) Education, Sports, Art and Culture 4,186.6 11,602.6 5,393.5 6,109.5 16,177.5 20,752.6 16,886.3 18,896.6
ii) Medical and Public Health 25,334.5 25,736.4 28,280.8 24,617.7 13,067.5 17,500.1 16,601.8 17,250.1
iii) Family Welfare 3.6 1.0 2.7 1.8 17.9 29.0 55.1 60.1
iv) Housing 567.5 665.8 760.0 836.0 845.3 1,029.8 1,031.7 1,042.0
v) Urban Development 7,242.9 11,602.6 8,555.3 12,630.8 694.3 406.3 341.7 284.0
vi) Labour and Employment 1,745.1 2,412.0 2,400.0 2,693.7 36,195.8 46,924.4 42,738.8 45,719.3
vii) Social Security and Welfare 10,662.0 6,629.2 11,100.0 11,100.0 2,246.1 1,372.5 1,926.0 1,411.9
viii) Water Supply and Sanitation 14.2 6,430.0 100.0 100.0 62,437.5 75,000.0 78,000.0 67,500.0
ix) Others 781.7 458.3 189.3 198.0 996.6 528.4 1,023.8 1,059.9
5. Fiscal Services – – – – – – – –
6. Economic Services ( i to xvii ) 56,724.5 99,842.0 45,673.6 79,551.8 8,06,441.2 9,88,761.9 10,40,706.6 11,54,634.8
i) Crop Husbandry 820.4 1,260.9 860.0 966.0 2,064.2 691.2 825.4 719.7
ii) Animal Husbandry 833.2 993.4 913.5 959.5 1,717.9 1,336.1 1,660.0 1,811.4
iii) Fisheries 8.6 9.9 10.0 10.3 6,116.4 6,042.0 6,420.5 6,736.0
iv) Forestry and Wildlife 4,866.5 2,531.5 1,535.6 5,818.2 18,226.2 14,241.0 15,401.0 16,556.0
v) Plantations – – – – – – – –
vi) Co-operation 282.1 407.8 293.1 355.1 6,311.2 5,061.0 2,902.5 3,552.5
vii) Other Agricultural Programmes 732.4 2,012.6 515.8 1,020.5 900.6 1,136.5 1,020.7 1,139.0
viii) Major and Medium Irrigation Projects 7,137.5 9,926.9 2,401.0 2,293.8 27,771.1 10,877.0 11,526.0 12,726.0
ix) Minor Irrigation 2.1 3.4 0.5 0.5 962.9 3,765.3 3,765.4 3,815.3
x) Power – – – – 5,397.6 6,334.2 7,234.8 7,968.4
xi) Petroleum – – – – 2,57,908.2 3,50,000.0 3,82,500.0 4,30,000.0
xii) Village and Small Industries 82.6 115.7 42.9 50.8 1,157.7 1,325.1 700.2 750.2
xiii) Industries@ 12,239.6 40,000.0 5,000.0 30,000.0 4,52,225.0 5,80,050.2 6,00,407.2 6,60,056.2
xiv) Ports and Light Houses – – – – – – – –
xv) Road Transport 15,869.5 25,880.8 17,000.0 20,000.0 – – – –
xvi) Tourism – 572.3 – – 97.5 105.0 105.0 110.0
xvii) Others* 13,850.0 16,127.0 17,101.3 18,077.1 25,584.8 7,797.3 6,238.0 8,694.2
D. Grants from the Centre (1 to 5) 7,65,100.9 8,57,016.3 15,71,822.9 18,03,910.0 23,94,004.1 29,85,732.0 24,45,823.7 26,67,608.7
1. State Plan Schemes – 5,50,846.9 – – – – – –
of which: Advance release of Plan
Assistance for Natural Calamities – – – – – – – –
2. Central Plan Schemes – 60,680.6 – – -12.2 – – –
3. Centrally Sponsored Schemes 3,09,550.8 1,482.3 4,30,184.5 5,81,571.1 16,10,348.2 19,76,796.0 15,14,543.7 16,66,712.8
4. NEC/ Special Plan Scheme – – – – – – – –
5. Non-Plan Grants (a to c) 4,55,550.1 2,44,006.5 11,41,638.4 12,22,338.9 7,83,668.1 10,08,936.0 9,31,280.0 10,00,895.9
a) Statutory Grants 35,569.2 54,006.5 1,71,336.9 3,19,205.0 4,26,240.0 5,05,462.0 5,24,617.0 8,03,674.5
b) Grants for relief on account
of Natural Calamities – – – – 60,777.0 31,925.0 1,02,614.0 1,16,499.0
c) Others 4,19,980.9 1,90,000.0 9,70,301.5 9,03,133.9 2,96,651.1 4,71,549.0 3,04,049.0 80,722.4
of which: GST Compensation cess
i) GST compensation 4,03,700.0 – 9,37,500.0 8,61,900.0 2,65,314.0 4,50,000.0 2,82,500. 40,500.0
ii) VAT compensation – – – – – – – –
iii) Central sales tax compensation – – – – – – – –
iv) Compensation cess – – – – – – – –
Appendix I: Revenue Receipts of States and Union Territories with Legislature (Contd.)
(₹ Lakh)

Appendix I
205
Item
SIKKIM TAMIL NADU
2017-18(Accounts)
2018-19(Budget
Estimates)
2018-19(Revised
Estimates)
2019-20(Budget
Estimates)
2017-18(Accounts)
2018-19(Budget
Estimates)
2018-19(Revised
Estimates)
2019-20(Budget
Estimates)
1 2 3 4 5 2 3 4 5
TOTAL REVENUE (I+II) 5,21,279.1 5,98,093.2 6,77,675.7 7,39,743.6 1,46,27,974.9 1,76,25,148.1 1,80,61,870.7 1,97,72,117.4
I. TAX REVENUE (A+B) 3,32,299.3 3,55,207.1 3,46,735.1 3,95,473.7 1,20,83,631.4 1,44,32,350.1 1,40,81,729.6 1,58,79,152.9
A. State’s Own Tax Revenue (1 to 3) 93,789.2 73,680.1 67,268.1 98,521.7 96,47,217.3 1,13,46,124.1 1,10,17,842.6 1,24,81,305.9
1. Taxes on Income (i+ii) 803.9 1,000.0 1,000.0 1,500.0 1.8 2.2 14.5 14.5
i) Agricultural Income Tax – – – – 1.8 2.2 14.5 14.5
ii) Taxes on Professions, Trades, Callings and Employment 803.9 1,000.0 1,000.0 1,500.0 – – – –
2. Taxes on Property and Capital
Transactions (i to iii) 2,101.7 2,044.0 2,044.0 2,474.0 9,35,529.3 11,23,106.0 11,86,536.1 13,49,374.4
i) Land Revenue 744.4 710.0 710.0 860.0 15,230.3 28,238.9 34,026.5 35,728.8
ii) Stamps and Registration Fees 1,357.4 1,334.0 1,334.0 1,614.0 9,19,462.8 10,93,567.2 11,51,209.6 13,12,280.6
iii) Urban Immovable Property Tax – – – – 836.3 1,300.0 1,300.0 1,365.0
3. Taxes on Commodities and Services
(i to viii) 90,883.6 70,636.1 64,224.1 94,547.7 87,11,686.2 1,02,23,016.0 98,31,292.1 1,11,31,917.1
i) Sales Tax (a to e) 24,965.7 15,400.0 15,400.0 20,000.0 46,35,614.5 44,42,703.9 42,98,921.1 48,03,364.7
a) State Sales Tax/VAT 24,468.8 15,400.0 15,400.0 20,000.0 44,62,979.9 44,38,380.7 42,39,953.2 47,40,283.8
b) Central Sales Tax 496.8 – – – 1,72,634.6 4,323.3 58,967.8 63,080.9
c) Surcharge on Sales Tax – – – – – – – –
d) Receipts of Turnover Tax – – – – – – – –
e) Other Receipts – – – – – – – –
ii) State Excise 15,047.5 15,854.0 16,854.0 23,700.0 5,81,529.7 6,99,782.8 6,72,437.6 7,26,232.6
iii) Taxes on Vehicles 2,936.6 3,105.0 3,400.0 4,915.5 5,36,262.7 6,21,174.4 5,91,881.9 6,51,070.0
iv) Taxes on Goods and Passengers – – – – 89,950.8 – 371.6 –
v) Taxes and Duties on Electricity – – – – 1,21,931.9 1,30,896.2 1,29,915.0 1,36,444.8
vi) Entertainment Tax 0.3 – – – -394.1 0.1 -1,675.3 -1,700.0
vii) SGST 42,095.1 33,014.0 25,307.0 41,500.1 27,32,487.2 43,27,638.4 41,38,678.9 48,15,739.7
viii) Other Taxes and Duties 5,838.4 3,263.1 3,263.1 4,432.1 14,303.5 820.3 761.2 765.4
B. Share in Central Taxes (i to x) 2,38,510.1 2,81,527.0 2,79,467.0 2,96,952.0 24,36,414.0 30,86,226.0 30,63,887.0 33,97,847.0
i) Corporation Tax 83,564.0 88,440.0 88,610.0 1,01,177.0 8,29,806.0 9,15,068.0 10,65,453.0 11,00,397.0
ii) Income Tax 67,005.1 71,869.0 71,813.0 77,344.0 7,00,712.0 7,92,773.0 7,84,662.0 9,24,543.0
iii) Estate Duty – – – – – – – –
iv) Other Taxes on Income and Expenditure – – – – – – – –
v) Taxes on Wealth 101.0 -3.0 -3.0 -3.0 -25.0 285.0 391.0 -30.0
vi) Customs 27,025.0 14,250.0 26,372.0 21,376.0 2,73,470.0 1,80,071.0 2,17,171.0 2,13,506.0
vii) Union Excise Duties 26,134.0 13,886.0 13,847.0 16,193.0 2,85,860.0 1,60,767.0 1,44,323.0 1,31,074.0
viii) Service Tax 31,152.0 – 1,341.0 – 3,08,299.0 10,756.0 28,227.0 –
ix) CGST 3,528.0 93,085.0 77,487.0 80,865.0 38,292.0 10,20,386.0 8,16,529.0 10,28,357.0
x) Other Taxes and Duties on Commodities and Services 1.0 – – – – 6,120.0 7,131.0 –
II. NON-TAX REVENUE (C+D) 1,88,979.8 2,42,886.1 3,30,940.6 3,44,269.9 25,44,343.6 31,92,797.9 39,80,141.1 38,92,964.5
C. State’s Own Non-Tax Revenue (1 to 6) 65,437.6 48,192.3 64,588.1 70,453.9 10,76,399.8 11,30,110.7 14,69,970.9 13,32,690.5
1. Interest Receipts 11,476.3 5,040.8 12,579.7 8,624.8 5,19,856.0 3,89,995.0 6,69,464.6 4,46,311.3
2. Dividends and Profits 292.0 100.0 200.0 100.0 15,858.6 18,631.0 18,487.0 16,789.9
3. General Services 13,382.7 13,651.7 14,908.5 18,230.1 96,962.5 1,14,134.3 1,67,133.0 2,14,564.8
of which: State Lotteries 5,503.3 5,500.0 5,500.0 3,500.0 0.3 – 0.1 0.1
Appendix I: Revenue Receipts of States and Union Territories with Legislature (Contd.)
(₹ Lakh)

State Finances : A Study of Budgets of 2019-20
206
Item
SIKKIM TAMIL NADU
2017-18(Accounts)
2018-19(Budget
Estimates)
2018-19(Revised
Estimates)
2019-20(Budget
Estimates)
2017-18(Accounts)
2018-19(Budget
Estimates)
2018-19(Revised
Estimates)
2019-20(Budget
Estimates)
1 2 3 4 5 2 3 4 5
4. Social Services ( i to ix) 1,330.8 1,526.1 1,526.1 1,928.3 2,76,796.5 4,03,420.1 3,79,106.9 3,94,685.5
i) Education, Sports, Art and Culture 231.6 117.0 117.0 131.8 1,15,344.7 1,44,899.4 1,21,601.1 1,26,459.0
ii) Medical and Public Health 210.9 250.0 250.0 575.0 51,670.1 92,544.3 76,660.6 78,926.3
iii) Family Welfare – – – – 10,393.8 17,323.3 17,147.0 17,848.9
iv) Housing 58.7 60.0 60.0 66.0 16,021.2 20,399.2 18,699.7 19,875.7
v) Urban Development 202.6 41.8 41.8 199.8 51,358.0 70,080.2 1,02,311.4 1,07,136.3
vi) Labour and Employment 60.2 30.0 30.0 75.0 9,172.7 16,002.4 15,571.4 15,677.4
vii) Social Security and Welfare 49.8 3.8 3.8 50.0 6,989.8 24,415.6 8,731.1 8,672.1
viii) Water Supply and Sanitation 487.6 1,000.1 1,000.1 800.1 33.8 60.6 39.8 43.1
ix) Others 29.5 23.5 23.5 30.6 15,812.6 17,695.2 18,344.9 20,046.7
5. Fiscal Services – – – – – – 0.1 0.1
6. Economic Services ( i to xvii ) 38,955.9 27,873.8 35,373.8 41,570.8 1,66,926.1 2,03,930.4 2,35,779.5 2,60,338.9
i) Crop Husbandry 34.0 63.0 63.0 69.1 7,646.5 5,981.8 6,385.3 6,215.7
ii) Animal Husbandry 239.8 99.5 99.5 106.0 1,391.0 1,668.4 1,765.9 1,803.1
iii) Fisheries 3.8 3.5 3.5 4.3 1,956.7 894.8 599.4 602.5
iv) Forestry and Wildlife 1,420.9 1,350.5 1,350.5 1,750.0 5,751.4 10,307.0 7,165.7 4,862.9
v) Plantations 219.0 700.0 700.0 250.0 – – – –
vi) Co-operation 10.6 2.5 2.5 3.0 2,467.4 3,325.3 2,186.9 2,225.3
vii) Other Agricultural Programmes – – – – 4,026.7 4,454.9 5,723.7 7,095.2
viii) Major and Medium Irrigation Projects – – – – 3,128.2 3,548.9 14,746.6 9,882.5
ix) Minor Irrigation 33.7 6.3 6.3 6.9 258.0 137.3 192.7 167.7
x) Power 31,025.6 19,010.0 26,310.0 32,010.0 – – 286.6 –
xi) Petroleum – – – – 0.9 0.8 0.9 0.8
xii) Village and Small Industries 18.6 25.0 25.0 27.5 3,052.5 3,559.9 2,596.1 2,508.9
xiii) Industries@ 105.2 73.5 73.5 94.0 1,14,639.2 1,45,244.4 1,68,401.9 1,98,767.6
xiv) Ports and Light Houses – – – – 275.0 302.5 330.0 365.0
xv) Road Transport 5,208.5 5,900.0 6,100.0 6,500.0 – – – –
xvi) Tourism 514.0 463.5 463.5 533.4 20.3 50.0 30.0 32.0
xvii) Others* 122.3 176.5 176.5 216.6 22,312.5 24,454.5 25,367.9 25,809.9
D. Grants from the Centre (1 to 5) 1,23,542.2 1,94,693.8 2,66,352.5 2,73,816.0 14,67,943.8 20,62,687.2 25,10,170.2 25,60,274.0
1. State Plan Schemes 626.4 112.7 1,387.3 1,838.8 – – – –
of which: Advance release of Plan
Assistance for Natural Calamities – – – – – – – –
2. Central Plan Schemes – – – – – – – –
3. Centrally Sponsored Schemes 95,866.1 1,42,598.0 1,70,269.7 1,82,464.8 10,98,297.4 13,20,442.2 14,60,491.7 13,36,524.9
4. NEC/ Special Plan Scheme 52.0 – – –
5. Non-Plan Grants (a to c) 26,997.7 51,983.0 94,695.6 89,512.3 3,69,646.4 7,42,245.1 10,49,678.5 12,23,749.1
a) Statutory Grants 8,154.8 8,379.0 15,242.0 11,026.0 1,95,482.0 4,44,967.0 4,56,757.0 5,92,952.0
b) Grants for relief on account
of Natural Calamities – – – – 35,181.0 – 90,031.0 –
c) Others 18,842.9 43,604.0 79,453.6 78,486.3 1,38,983.4 2,97,278.1 5,02,890.5 6,30,797.1
of which: GST Compensation cess
i) GST compensation – – – – 68,200.0 1,73,728.0 4,23,800.0 5,58,200.0
ii) VAT compensation – – – – – – – –
iii) Central sales tax compensation – – – – 19,713.0 – – –
iv) Compensation cess – 11,058.1 11,058.1 23,500.0 – – – –
Appendix I: Revenue Receipts of States and Union Territories with Legislature (Contd.)
(₹ Lakh)

Appendix I
207
Item
TELANGANA TRIPURA
2017-18(Accounts)
2018-19(Budget
Estimates)
2018-19(Revised
Estimates)
2019-20(Budget
Estimates)
2017-18(Accounts)
2018-19(Budget
Estimates)
2018-19(Revised
Estimates)
2019-20(Budget
Estimates)
1 2 3 4 5 2 3 4 5
TOTAL REVENUE (I+II) 88,82,409.2 1,30,97,510.9 1,19,09,913.1 1,13,09,992.3 10,06,795.6 14,01,321.0 14,64,102.7 15,09,846.4
I. TAX REVENUE (A+B) 72,93,989.6 91,45,931.2 84,20,976.0 89,04,714.0 5,74,410.3 7,45,600.0 7,24,611.0 8,70,495.0
A. State’s Own Tax Revenue (1 to 3) 58,17,693.6 72,76,365.2 66,24,975.0 69,32,857.0 1,85,858.3 2,42,900.0 2,29,063.0 2,74,895.0
1. Taxes on Income (i+ii) 41,135.0 44,650.0 43,306.5 58,600.0 4,229.0 5,020.0 4,410.0 4,611.0
i) Agricultural Income Tax – – – – 9.0 20.0 10.0 11.0
ii) Taxes on Professions, Trades, Callings and Employment 41,135.0 44,650.0 43,306.5 58,600.0 4,220.0 5,000.0 4,400.0 4,600.0
2. Taxes on Property and Capital
Transactions (i to iii) 4,31,338.9 4,83,437.5 6,72,614.0 6,28,719.0 4,462.0 7,010.0 6,009.0 6,510.0
i) Land Revenue 411.8 464.3 131.0 539.0 446.5 2,000.0 1,000.0 1,000.0
ii) Stamps and Registration Fees 4,20,246.2 4,70,000.0 6,68,961.0 6,14,600.0 4,015.6 5,000.0 5,000.0 5,500.0
iii) Urban Immovable Property Tax 10,680.9 12,973.3 3,522.0 13,580.0 – 10.0 9.0 10.0
3. Taxes on Commodities and Services
(i to viii) 53,45,219.7 67,48,277.6 59,09,054.5 62,45,538.0 1,77,167.4 2,30,870.0 2,18,644.0 2,63,774.0
i) Sales Tax (a to e) 25,10,648.4 25,94,200.0 22,13,800.0 21,97,200.0 61,187.7 69,264.9 37,000.0 40,700.0
a) State Sales Tax/VAT 23,98,484.8 24,05,200.0 20,56,500.0 19,28,504.0 61,072.0 68,688.8 36,730.0 40,339.0
b) Central Sales Tax 1,10,647.0 1,79,500.0 1,49,100.0 2,57,723.0 115.7 51.0 31.0 45.0
c) Surcharge on Sales Tax – – – – – 14.1 11.0 22.0
d) Receipts of Turnover Tax 1,350.8 7,500.0 6,450.0 8,663.0 – 501.0 221.0 278.0
e) Other Receipts 165.8 2,000.0 1,750.0 2,310.0 – 10.1 7.0 16.0
ii) State Excise 9,42,133.0 10,60,000.0 10,31,368.5 10,90,100.0 18,695.9 19,740.0 21,000.0 23,100.0
iii) Taxes on Vehicles 3,58,948.2 3,95,000.0 4,02,409.0 3,71,400.0 5,438.4 6,000.0 7,300.0 8,000.0
iv) Taxes on Goods and Passengers 8,763.1 – 170.0 – – – – –
v) Taxes and Duties on Electricity 39,699.4 43,400.6 34,721.0 2,563.0 1.3 0.1 – –
vi) Entertainment Tax 4,651.6 500.0 136.0 1,075.0 139.0 240.0 70.0 120.0
vii) SGST 14,73,002.7 26,55,177.0 22,26,450.0 25,81,700.0 91,627.3 1,35,000.0 1,50,854.0 1,84,974.0
viii) Other Taxes and Duties 7,373.3 – – 1,500.0 77.9 625.0 2,420.0 6,880.0
B. Share in Central Taxes (i to x) 14,76,296.0 18,69,566.0 17,96,001.0 19,71,857.0 3,88,552.0 5,02,700.0 4,95,548.0 5,95,600.0
i) Corporation Tax 5,02,669.0 5,87,399.0 5,88,402.0 6,71,849.0 1,32,423.0 1,65,000.0 1,40,000.0 1,50,000.0
ii) Income Tax 4,24,468.0 4,77,231.0 4,76,863.0 5,13,590.0 1,11,774.0 1,25,000.0 1,20,000.0 1,30,000.0
iii) Estate Duty – – – – – – – –
iv) Other Taxes on Income and Expenditure – – – – – 100.0 1,048.0 1,200.0
v) Taxes on Wealth -15.0 -17.0 -18.0 -18.0 -4.0 400.0 700.0 1,000.0
vi) Customs 1,65,660.0 94,626.0 1,15,181.0 1,41,941.0 43,640.0 60,000.0 50,000.0 65,000.0
vii) Union Excise Duties 1,73,160.0 92,211.0 91,948.0 1,07,528.0 45,620.0 70,000.0 50,000.0 80,000.0
viii) Service Tax 1,87,250.0 – 9,084.0 – 48,935.0 70,000.0 3,500.0 8,000.0
ix) CGST 23,104.0 6,18,116.0 5,14,541.0 5,36,967.0 6,164.0 12,000.0 1,30,000.0 1,60,000.0
x) Other Taxes and Duties on Commodities and Services – – – – – 200.0 300.0 400.0
II. NON-TAX REVENUE (C+D) 15,88,419.6 39,51,579.8 34,88,937.1 24,05,278.3 4,32,385.2 6,55,721.0 7,39,491.7 6,39,351.4
C. State’s Own Non-Tax Revenue (1 to 6) 7,82,539.9 8,97,392.1 6,34,749.4 15,87,503.0 49,348.1 28,136.0 34,421.7 28,521.0
1. Interest Receipts 11,584.6 18,662.0 18,662.0 11,798.0 27,698.8 6,286.0 14,539.7 7,000.0
2. Dividends and Profits 10,070.6 15,613.3 15,613.3 12,720.0 1,468.7 600.0 300.0 300.0
3. General Services 1,17,013.5 3,42,883.3 84,683.3 10,53,552.0 8,513.5 8,537.0 7,899.0 8,597.0
of which: State Lotteries – – – – – – – –
Appendix I: Revenue Receipts of States and Union Territories with Legislature (Contd.)
(₹ Lakh)

State Finances : A Study of Budgets of 2019-20
208
Item
TELANGANA TRIPURA
2017-18(Accounts)
2018-19(Budget
Estimates)
2018-19(Revised
Estimates)
2019-20(Budget
Estimates)
2017-18(Accounts)
2018-19(Budget
Estimates)
2018-19(Revised
Estimates)
2019-20(Budget
Estimates)
1 2 3 4 5 2 3 4 5
4. Social Services ( i to ix) 71,145.6 89,596.2 89,596.2 94,120.0 842.1 1,132.0 1,135.0 1,305.0
i) Education, Sports, Art and Culture 33,604.6 57,872.4 57,872.4 60,784.0 147.9 200.0 100.0 100.0
ii) Medical and Public Health 26,157.5 26,877.0 26,877.0 28,230.0 150.6 200.0 520.0 600.0
iii) Family Welfare 2.8 2.9 2.9 4.0 – 10.0 1.0 1.0
iv) Housing 113.2 120.0 120.0 127.0 208.5 250.0 200.0 230.0
v) Urban Development 2,822.6 94.2 94.2 100.0 0.1 0.5 2.0 2.0
vi) Labour and Employment 7,601.5 3,869.1 3,869.1 4,068.0 92.3 163.0 140.0 140.0
vii) Social Security and Welfare 347.0 352.0 352.0 371.0 2.8 10.0 17.0 17.0
viii) Water Supply and Sanitation 168.2 129.5 129.5 137.0 236.1 291.0 140.0 200.0
ix) Others 328.2 279.1 279.1 299.0 3.9 7.5 15.0 15.0
5. Fiscal Services – – – – 0.9 – 3.0 4.0
6. Economic Services ( i to xvii ) 5,72,725.7 4,30,637.4 4,26,194.7 4,15,313.0 10,824.2 11,581.1 10,545.0 11,315.0
i) Crop Husbandry 718.1 441.4 441.4 465.0 270.5 300.0 400.0 400.0
ii) Animal Husbandry 76.8 81.7 81.7 88.0 179.2 300.0 200.0 200.0
iii) Fisheries 143.8 152.0 152.0 163.0 74.5 80.0 100.0 100.0
iv) Forestry and Wildlife 12,736.7 10,808.0 10,808.0 11,355.0 975.7 1,000.0 800.0 1,000.0
v) Plantations – – – – – – – –
vi) Co-operation 2,112.6 2,836.1 2,836.1 2,983.0 16.5 20.0 30.0 30.0
vii) Other Agricultural Programmes 249.7 262.1 262.1 276.0 – 0.1 – –
viii) Major and Medium Irrigation Projects 1,52,740.8 2,843.9 2,843.9 2,989.0 – – – –
ix) Minor Irrigation 191.6 165.2 165.2 177.0 99.1 100.0 100.0 100.0
x) Power 935.5 980.7 980.7 1,030.0 – – – –
xi) Petroleum – – – – 0.3 0.5 – –
xii) Village and Small Industries 262.9 130.3 130.3 141.0 0.2 8.5 – –
xiii) Industries@ 3,59,252.3 4,06,003.1 4,01,560.3 3,89,401.0 8,736.0 9,200.0 8,000.0 8,500.0
xiv) Ports and Light Houses – – – – – – – –
xv) Road Transport – – – – – – – –
xvi) Tourism 386.2 576.8 576.8 606.0 – – – –
xvii) Others* 42,919.0 5,356.0 5,356.1 5,639.0 472.3 572.0 915.0 985.0
D. Grants from the Centre (1 to 5) 8,05,879.7 30,54,187.7 28,54,187.7 8,17,775.3 3,83,037.1 6,27,585.0 7,05,069.9 6,10,830.4
1. State Plan Schemes – 10,27,161.7 10,27,161.7 5,26,234.3 -157.5 – – –
of which: Advance release of Plan
Assistance for Natural Calamities – – – – – – – –
2. Central Plan Schemes - - - - – – – –
3. Centrally Sponsored Schemes 6,10,772.1 – – – 1,98,832.3 3,20,637.0 3,77,942.2 4,44,288.3
4. NEC/ Special Plan Scheme – – – – – – – –
5. Non-Plan Grants (a to c) 1,95,107.5 20,27,026.0 18,27,026.0 2,91,541.0 1,84,362.3 3,06,948.0 3,27,127.8 1,66,542.1
a) Statutory Grants – 18,33,226.0 17,33,226.0 2,66,566.0 1,19,120.0 1,15,040.0 1,15,080.0 1,07,897.0
b) Grants for relief on account
of Natural Calamities – 23,800.0 23,800.0 24,975.0 – – 17,174.0 –
c) Others 1,95,107.5 1,70,000.0 70,000.0 – 65,242.3 1,91,908.0 1,94,873.8 58,645.1
of which: GST Compensation cess
i) GST compensation – – – – 12,900.0 – – –
ii) VAT compensation – – – – – – – –
iii) Central sales tax compensation – – – – – – – –
iv) Compensation cess – 1,50,000.0 50,000.0 – – – – –
Appendix I: Revenue Receipts of States and Union Territories with Legislature (Contd.)
(₹ Lakh)

Appendix I
209
Item
UTTARAKHAND UTTAR PRADESH
2017-18(Accounts)
2018-19(Budget
Estimates)
2018-19(Revised
Estimates)
2019-20(Budget
Estimates)
2017-18(Accounts)
2018-19(Budget
Estimates)
2018-19(Revised
Estimates)
2019-20(Budget
Estimates)
1 2 3 4 5 2 3 4 5
TOTAL REVENUE (I+II) 27,10,457.4 35,65,999.3 34,75,387.4 38,95,549.1 2,78,77,545.1 3,48,61,937.3 3,80,02,172.0 3,91,73,440.0
I. TAX REVENUE (A+B) 17,24,984.2 23,25,484.5 22,77,520.6 23,62,210.7 2,18,33,214.4 2,56,24,840.0 2,75,83,997.0 2,93,03,917.0
A. State’s Own Tax Revenue (1 to 3) 10,88,029.2 15,18,453.6 14,76,361.6 14,73,684.7 1,09,60,476.3 1,26,25,831.0 1,38,07,139.0 1,44,24,910.0
1. Taxes on Income (i+ii) 1,906.9 100.0 100.0 10.0 1,915.1 – – –
i) Agricultural Income Tax – – – – – – – –
ii) Taxes on Professions, Trades, Callings and Employment 1,906.9 100.0 100.0 10.0 1,915.1 – – –
2. Taxes on Property and Capital
Transactions (i to iii) 90,635.3 1,24,354.1 1,24,354.1 1,37,544.1 14,73,403.5 18,80,000.0 20,50,000.0 20,03,507.0
i) Land Revenue 2,409.3 4,783.0 4,783.0 3,471.0 1,33,646.3 80,000.0 85,000.0 85,600.0
ii) Stamps and Registration Fees 88,226.0 1,19,571.1 1,19,571.1 1,34,073.1 13,39,757.1 18,00,000.0 19,65,000.0 19,17,907.0
iii) Urban Immovable Property Tax – – – – – – – –
3. Taxes on Commodities and Services
(i to viii) 9,95,487.0 13,93,999.5 13,51,907.5 13,36,130.7 94,85,157.7 1,07,45,831.0 1,17,57,139.0 1,24,21,403.0
i) Sales Tax (a to e) 3,70,269.0 2,12,900.0 2,12,900.0 2,35,300.0 31,11,252.1 22,07,800.0 24,07,500.0 24,66,000.0
a) State Sales Tax/VAT 3,57,247.7 2,02,700.0 2,02,700.0 2,35,000.0 29,74,531.7 21,34,300.0 23,27,351.7 23,83,904.3
b) Central Sales Tax 12,691.7 10,000.0 10,000.0 100.0 98,952.5 48,500.0 52,886.9 54,172.0
c) Surcharge on Sales Tax – – – – – – – –
d) Receipts of Turnover Tax – – – – – – – –
e) Other Receipts 329.6 200.0 200.0 200.0 37,768.0 25,000.0 27,261.4 27,923.7
ii) State Excise 2,26,167.2 2,65,000.0 2,65,000.0 3,04,750.1 17,32,026.6 23,00,000.0 25,10,000.0 31,51,741.0
iii) Taxes on Vehicles 81,599.4 85,000.0 85,000.0 96,500.0 6,40,364.7 7,40,000.0 8,00,000.0 7,86,342.0
iv) Taxes on Goods and Passengers 0.6 – – – 4.0 – – –
v) Taxes and Duties on Electricity 32,361.8 40,007.5 40,007.5 44,005.5 2,12,412.9 2,00,000.0 2,60,000.0 3,12,000.0
vi) Entertainment Tax 2,920.0 – – – 30,183.0 – – –
vii) SGST 2,68,717.9 7,61,092.0 7,19,000.0 6,25,575.1 37,58,572.0 52,98,031.0 57,79,639.0 57,05,320.0
viii) Other Taxes and Duties 13,451.1 30,000.0 30,000.0 30,000.0 342.4 – – –
B. Share in Central Taxes (i to x) 6,36,955.0 8,07,030.9 8,01,159.0 8,88,526.0 1,08,72,738.2 1,29,99,009.0 1,37,76,858.0 1,48,79,007.0
i) Corporation Tax 2,16,991.0 2,50,095.0 2,54,000.0 2,87,750.0 37,04,322.0 38,54,142.0 39,74,108.0 42,92,037.0
ii) Income Tax 1,83,234.0 2,09,456.0 2,05,851.0 2,41,765.0 31,28,037.0 33,39,050.0 35,16,862.0 37,98,211.0
iii) Estate Duty – – – – – – – –
iv) Other Taxes on Income and Expenditure – – – – – – – –
v) Taxes on Wealth -7.0 -0.1 -8.0 2,68,904.0 -207.8 -127.0 -127.0 -137.0
vi) Customs 71,510.0 40,848.0 49,721.0 55,831.0 12,20,800.2 7,58,434.0 6,97,327.0 7,53,113.0
vii) Union Excise Duties 74,750.0 39,805.0 39,692.0 34,276.0 12,76,080.0 6,77,127.0 6,79,529.0 7,33,891.0
viii) Service Tax 80,425.0 – 3,882.0 – 13,71,880.8 – – –
ix) CGST 10,052.0 2,66,827.0 2,48,021.0 – 1,71,829.0 43,70,385.0 49,09,161.0 53,01,894.0
x) Other Taxes and Duties on Commodities and Services – – – – -3.0 -2.0 -2.0 -2.0
II. NON-TAX REVENUE (C+D) 9,85,473.3 12,40,514.8 11,97,866.8 15,33,338.3 60,44,330.7 92,37,097.3 1,04,18,175.0 98,69,523.0
C. State’s Own Non-Tax Revenue (1 to 6) 1,76,952.5 3,47,051.2 3,74,653.2 4,25,481.2 19,79,485.8 28,82,166.0 28,82,166.0 30,63,296.0
1. Interest Receipts 8,539.1 5,710.0 5,710.0 7,500.0 1,09,338.4 84,360.0 84,360.0 1,20,000.0
2. Dividends and Profits 2,268.7 2,500.0 2,500.0 4,000.0 3,083.8 843.0 6,649.0 5,000.0
3. General Services 25,738.1 1,46,010.4 1,74,760.4 1,78,843.3 6,80,621.3 13,80,509.0 14,08,868.0 15,87,521.0
of which: State Lotteries
Appendix I: Revenue Receipts of States and Union Territories with Legislature (Contd.)
(₹ Lakh)

State Finances : A Study of Budgets of 2019-20
210
Item
UTTARAKHAND UTTAR PRADESH
2017-18(Accounts)
2018-19(Budget
Estimates)
2018-19(Revised
Estimates)
2019-20(Budget
Estimates)
2017-18(Accounts)
2018-19(Budget
Estimates)
2018-19(Revised
Estimates)
2019-20(Budget
Estimates)
1 2 3 4 5 2 3 4 5
4. Social Services ( i to ix) 27,342.0 26,915.2 24,845.2 29,903.6 1,57,112.4 97,191.0 98,791.0 1,29,018.0
i) Education, Sports, Art and Culture 10,885.3 5,571.6 7,021.6 9,139.5 43,205.1 52,000.0 52,000.0 55,120.0
ii) Medical and Public Health 8,412.3 9,054.1 9,054.1 10,326.1 26,049.8 19,561.0 19,561.0 26,735.0
iii) Family Welfare 2.0 2.0 2.0 1.0 26.4 112.0 112.0 119.0
iv) Housing 739.4 800.0 1,000.0 1,050.0 3,362.0 3,400.0 5,000.0 3,600.0
v) Urban Development 138.4 355.0 125.0 110.0 2,897.4 3,374.0 3,374.0 3,576.0
vi) Labour and Employment 3,197.7 3,551.5 3,551.5 3,726.0 8,483.3 7,500.0 7,500.0 7,950.0
vii) Social Security and Welfare 433.6 3,501.0 801.0 1,001.0 65,398.2 5,500.0 5,500.0 25,830.0
viii) Water Supply and Sanitation 835.1 800.0 10.0 10.0 39.0 53.0 53.0 56.0
ix) Others 2,698.4 3,280.0 3,280.0 4,540.0 7,651.4 5,691.0 5,691.0 6,032.0
5. Fiscal Services 1.2 3.0 3.0 0.7 3.0 – – –
6. Economic Services ( i to xvii ) 1,13,063.4 1,65,912.6 1,66,834.6 2,05,233.5 10,29,326.8 13,19,263.0 12,83,498.0 12,21,757.0
i) Crop Husbandry 566.2 623.5 1,672.5 1,691.2 53,697.7 7,500.0 52,000.0 13,340.0
ii) Animal Husbandry 332.6 367.1 367.1 227.0 4,698.7 4,000.0 4,000.0 4,240.0
iii) Fisheries 2.5 10.0 37.0 40.0 715.0 928.0 928.0 984.0
iv) Forestry and Wildlife 31,219.8 50,735.0 50,735.0 81,012.1 32,004.6 47,500.0 42,500.0 47,500.0
v) Plantations – – – – – – – –
vi) Co-operation 114.3 102.1 102.1 102.0 996.6 2,412.0 2,412.0 2,557.0
vii) Other Agricultural Programmes 3.1 5.4 6.4 7.0 876.6 1,450.0 1,450.0 1,537.0
viii) Major and Medium Irrigation Projects 766.4 777.7 777.7 672.7 86,919.8 1,60,695.0 1,10,695.0 1,62,500.0
ix) Minor Irrigation 196.0 300.0 300.0 300.0 8,372.1 6,305.0 6,305.0 6,700.0
x) Power 28,621.1 40,000.0 40,000.0 44,000.0 4,69,585.4 5,70,000.0 5,70,000.0 4,17,500.0
xi) Petroleum – – – – – – – –
xii) Village and Small Industries 96.8 105.0 130.0 130.0 -8,522.1 6,707.0 1,707.0 7,109.0
xiii) Industries@ 43,982.3 70,006.0 70,006.0 75,001.0 3,25,935.3 4,00,043.0 3,79,734.0 4,40,046.0
xiv) Ports and Light Houses – – – – – – – –
xv) Road Transport 685.6 705.0 705.0 205.0 488.8 560.0 560.0 594.0
xvi) Tourism 166.1 300.0 300.0 300.0 578.8 559.0 559.0 593.0
xvii) Others* 6,310.8 1,875.8 1,695.8 1,545.5 52,979.5 1,10,604.0 1,10,648.0 1,16,557.0
D. Grants from the Centre (1 to 5) 8,08,520.7 8,93,463.6 8,23,213.6 11,07,857.2 40,64,844.9 63,54,931.3 75,36,009.0 68,06,227.0
1. State Plan Schemes 1,62,099.4 – – – – 2,71,089.2 2,91,754.3 –
of which: Advance release of Plan
Assistance for Natural Calamities – – – – – – – –
2. Central Plan Schemes 7,612.0 – – – – 3,411.3 4,111.3 –
3. Centrally Sponsored Schemes 4,39,081.6 7,80,238.6 7,09,988.6 6,85,971.2 27,73,091.0 48,97,122.8 60,56,835.4 49,69,332.8
4. NEC/ Special Plan Scheme – – – – – – – –
5. Non-Plan Grants (a to c) 1,99,727.7 1,13,225.0 1,13,225.0 4,21,886.0 12,91,754.0 11,83,308.0 11,83,308.0 18,36,894.2
a) Statutory Grants 48,514.8 67,325.0 67,325.0 77,261.0 8,85,111.5 10,38,733.0 10,38,733.0 14,61,219.4
b) Grants for relief on account
of Natural Calamities 20,790.0 21,800.0 21,800.0 22,900.0 11,967.0 1,44,575.0 1,44,575.0 1,00,000.0
c) Others 1,30,422.9 24,100.0 24,100.0 3,21,725.0 3,94,675.5 – – 2,75,674.8
of which: GST Compensation cess
i) GST compensation 1,28,300.0 – – 3,01,725.0 2,12,400.0 – – –
ii) VAT compensation – – – – – – – –
iii) Central sales tax compensation – – – – – – – –
iv) Compensation cess – – – – – – – –
Appendix I: Revenue Receipts of States and Union Territories with Legislature (Contd.)
(₹ Lakh)

Appendix I
211
Item
WEST BENGAL
2017-18(Accounts)
2018-19(Budget
Estimates)
2018-19(Revised
Estimates)
2019-20(Budget
Estimates)
1 2 3 4 5
TOTAL REVENUE (I+II) 1,31,27,038.6 1,46,74,776.3 1,52,62,547.7 1,64,32,795.4
I. TAX REVENUE (A+B) 1,02,04,167.2 1,10,63,798.1 1,17,80,132.0 1,27,94,241.8
A. State’s Own Tax Revenue (1 to 3) 57,70,073.2 55,20,058.1 61,61,686.0 67,20,720.0
1. Taxes on Income (i+ii) 53,633.5 57,481.6 55,542.0 58,504.0
i) Agricultural Income Tax 714.0 770.4 300.0 500.0
ii) Taxes on Professions, Trades, Callings and Employment 52,919.6 56,711.2 55,242.0 58,004.0
2. Taxes on Property and Capital
Transactions (i to iii) 8,13,528.0 8,00,220.8 8,89,117.0 9,79,888.0
i) Land Revenue 2,87,451.1 2,83,559.1 3,19,719.0 3,54,888.0
ii) Stamps and Registration Fees 5,26,077.0 5,16,661.7 5,69,398.0 6,25,000.0
iii) Urban Immovable Property Tax – – – –
3. Taxes on Commodities and Services
(i to viii) 49,02,911.7 46,62,355.8 52,17,027.0 56,82,328.0
i) Sales Tax (a to e) 12,99,933.7 7,01,416.0 7,39,084.0 7,51,593.0
a) State Sales Tax/VAT 11,96,366.5 6,81,364.0 6,85,033.0 7,41,537.0
b) Central Sales Tax 1,03,693.9 20,000.0 54,000.0 10,000.0
c) Surcharge on Sales Tax – – – –
d) Receipts of Turnover Tax – – – –
e) Other Receipts -126.8 52.0 51.0 56.0
ii) State Excise 9,34,004.6 10,50,340.8 10,55,436.0 11,87,365.0
iii) Taxes on Vehicles 2,31,723.0 2,50,757.4 2,47,592.0 2,72,352.0
iv) Taxes on Goods and Passengers 1,53,195.8 0.1 2,000.0 1,000.0
v) Taxes and Duties on Electricity 2,33,355.1 3,00,000.0 2,43,567.0 2,51,010.0
vi) Entertainment Tax 2,409.6 100.0 118.0 38.0
vii) SGST 19,94,390.1 23,06,000.0 28,71,148.0 31,55,187.0
viii) Other Taxes and Duties 53,900.0 53,741.5 58,082.0 63,783.0
B. Share in Central Taxes (i to x) 44,34,094.0 55,43,740.0 56,18,446.0 60,73,521.8
i) Corporation Tax 15,10,689.0 16,79,383.0 16,92,910.0 18,28,342.8
ii) Income Tax 12,75,668.0 14,68,215.0 15,06,438.0 16,26,953.0
iii) Estate Duty – – – –
iv) Other Taxes on Income and Expenditure – – – –
v) Taxes on Wealth -45.0 – -52.0 –
vi) Customs 4,97,860.0 8,01,560.0 2,84,382.0 3,07,132.6
vii) Union Excise Duties 5,20,410.0 – 2,77,124.0 3,04,836.4
viii) Service Tax 5,59,425.0 – – –
ix) CGST 70,088.0 15,94,582.0 18,57,645.0 20,06,257.0
x) Other Taxes and Duties on Commodities and Services -1.0 – -1.0 –
II. NON-TAX REVENUE (C+D) 29,22,871.4 36,10,978.1 34,82,415.7 36,38,553.6
C. State’s Own Non-Tax Revenue (1 to 6) 3,11,717.1 3,39,541.0 4,15,397.7 3,98,725.6
1. Interest Receipts 1,39,567.8 1,37,535.9 1,47,941.9 1,58,297.8
2. Dividends and Profits 3,659.9 120.6 3,879.5 4,151.1
3. General Services 51,313.5 67,161.9 1,39,369.9 1,03,175.8
of which: State Lotteries 11,803.1 16,204.9 92,511.3 53,387.1
Appendix I: Revenue Receipts of States and Union Territories with Legislature (Contd.)
(₹ Lakh)

State Finances : A Study of Budgets of 2019-20
212
Item
WEST BENGAL
2017-18(Accounts)
2018-19(Budget
Estimates)
2018-19(Revised
Estimates)
2019-20(Budget
Estimates)
1 2 3 4 5
4. Social Services ( i to ix) 34,158.5 43,545.4 36,207.9 38,942.5
i) Education, Sports, Art and Culture 6,831.2 20,223.6 7,241.0 7,747.9
ii) Medical and Public Health 21,047.5 15,431.5 22,310.4 23,872.1
iii) Family Welfare 0.2 1.6 0.2 0.3
iv) Housing 1,030.3 1,283.7 1,092.1 1,168.5
v) Urban Development 3,387.3 4,220.5 3,590.5 3,841.8
vi) Labour and Employment 603.2 980.3 639.3 684.1
vii) Social Security and Welfare 373.2 312.4 395.6 623.3
viii) Water Supply and Sanitation 442.4 710.0 468.9 501.7
ix) Others 443.3 381.8 469.9 502.7
5. Fiscal Services – – – –
6. Economic Services ( i to xvii ) 83,017.5 91,177.4 87,998.5 94,158.4
i) Crop Husbandry 817.3 844.6 866.4 927.0
ii) Animal Husbandry 881.1 461.1 933.9 999.3
iii) Fisheries 802.0 182.9 850.1 909.7
iv) Forestry and Wildlife 9,373.5 14,480.4 9,935.9 10,631.5
v) Plantations 2.3 2.1 2.4 2.6
vi) Co-operation 1,005.4 968.5 1,065.7 1,140.3
vii) Other Agricultural Programmes 34.7 38.6 36.8 39.4
viii) Major and Medium Irrigation Projects 884.2 834.3 937.3 1,002.9
ix) Minor Irrigation 1,734.5 2,018.5 1,838.6 1,967.3
x) Power 0.2 0.3 0.2 0.2
xi) Petroleum 1.0 1.6 1.1 1.1
xii) Village and Small Industries 149.2 215.4 158.2 169.3
xiii) Industries@ 44,346.1 46,060.3 47,006.9 50,297.4
xiv) Ports and Light Houses 50.0 40.8 53.0 56.8
xv) Road Transport – – – –
xvi) Tourism 339.0 134.7 359.4 384.6
xvii) Others* 22,596.8 24,893.4 23,952.6 25,629.2
D. Grants from the Centre (1 to 5) 26,11,154.3 32,71,437.1 30,67,018.0 32,39,828.0
1. State Plan Schemes – – – –
of which: Advance release of Plan
Assistance for Natural Calamities – – – –
2. Central Plan Schemes – – – –
3. Centrally Sponsored Schemes 15,73,411.2 14,46,341.1 18,37,646.0 19,88,356.0
4. NEC/ Special Plan Scheme
5. Non-Plan Grants (a to c) 10,37,743.0 18,25,096.0 12,29,372.0 12,51,472.0
a) Statutory Grants 5,33,723.5 5,15,587.0 5,23,687.0 6,89,072.0
b) Grants for relief on account
of Natural Calamities 32,523.4 98.0 50.0 60.0
c) Others 4,71,496.1 13,09,411.0 7,05,635.0 5,62,340.0
of which: GST Compensation cess
i) GST compensation 1,60,800.0 9,87,600.0 1,99,000.0 2,00,000.0
ii) VAT compensation – – – –
iii) Central sales tax compensation 7,964.0 – – –
iv) Compensation cess – – – –
Appendix I: Revenue Receipts of States and Union Territories with Legislature (Contd.)
(₹ Lakh)

Appendix I
213
Item
NATIONAL CAPITAL TERRITORY OF DELHI PUDUCHERRY
2017-18(Accounts)
2018-19(Budget
Estimates)
2018-19(Revised
Estimates)
2019-20(Budget
Estimates)
2017-18(Accounts)
2018-19(Budget
Estimates)
2018-19(Revised
Estimates)
2019-20(Budget
Estimates)
1 2 3 4 5 2 3 4 5
TOTAL REVENUE (I+II) 38,66,727.1 47,55,700.0 44,82,448.0 50,01,700.0 6,00,266.9 6,45,500.0 6,80,600.0 7,30,500.0
I. TAX REVENUE (A+B) 35,71,702.0 42,00,000.0 38,40,000.0 42,50,000.0 2,47,255.1 2,67,800.0 2,74,122.8 3,09,800.0
A. State’s Own Tax Revenue (1 to 3) 35,71,702.0 42,00,000.0 38,40,000.0 42,50,000.0 2,47,255.1 2,67,800.0 2,74,122.8 3,09,800.0
1. Taxes on Income (i+ii) – – – – – – – –
i) Agricultural Income Tax – – – – – – – –
ii) Taxes on Professions, Trades, Callings and Employment – – – – – – – –
2. Taxes on Property and Capital
Transactions (i to iii) 4,11,857.9 4,30,000.0 4,50,000.0 5,00,000.0 7,158.0 10,262.5 10,262.5 10,262.5
i) Land Revenue 150.8 200.0 1.0 1.0 107.9 262.5 262.5 262.5
ii) Stamps and Registration Fees 4,11,707.2 4,29,800.0 4,49,999.0 4,99,999.0 7,050.2 10,000.0 10,000.0 10,000.0
iii) Urban Immovable Property Tax – – – – – – – –
3. Taxes on Commodities and Services
(i to viii) 31,59,844.1 37,70,000.0 33,90,000.0 37,50,000.0 2,40,097.1 2,57,537.5 2,63,860.3 2,99,537.5
i) Sales Tax (a to e) 11,14,917.0 6,60,000.0 5,83,000.0 6,38,000.0 1,00,844.7 1,10,000.0 68,686.5 72,700.0
a) State Sales Tax/VAT 10,03,724.1 5,42,000.0 5,65,800.0 6,19,900.0 1,00,844.7 1,10,000.0 68,686.5 72,700.0
b) Central Sales Tax 1,11,198.8 1,17,900.0 16,200.0 17,000.0 – – – –
c) Surcharge on Sales Tax – – – – – – – –
d) Receipts of Turnover Tax – – – – – – – –
e) Other Receipts -5.9 100.0 1,000.0 1,100.0 – – – –
ii) State Excise 4,45,349.3 5,20,000.0 5,20,000.0 6,00,000.0 76,992.7 80,000.0 84,000.0 1,10,000.0
iii) Taxes on Vehicles 2,11,576.3 2,50,000.0 2,19,400.0 2,50,000.0 10,428.8 11,500.0 12,500.0 12,500.0
iv) Taxes on Goods and Passengers – – – – – – – –
v) Taxes and Duties on Electricity – – – – – – – –
vi) Entertainment Tax 4,293.3 – – – – – – –
vii) SGST 13,62,083.6 23,40,000.0 20,67,000.0 22,62,000.0 51,831.0 56,000.0 98,636.3 1,04,300.0
viii) Other Taxes and Duties 21,624.7 – 600.0 – – 37.5 37.5 37.5
B. Share in Central Taxes (i to x) – – – – – – – –
i) Corporation Tax – – – – – – – –
ii) Income Tax – – – – – – – –
iii) Estate Duty – – – – – – – –
iv) Other Taxes on Income and Expenditure – – – – – – – –
v) Taxes on Wealth – – – – – – – –
vi) Customs – – – – – – – –
vii) Union Excise Duties – – – – – – – –
viii) Service Tax – – – – – – – –
ix) CGST – – – – – – – –
x) Other Taxes and Duties on Commodities and Services – – – – – – – –
II. NON-TAX REVENUE (C+D) 2,95,025.0 5,55,700.0 6,42,448.0 7,51,700.0 3,53,011.8 3,77,700.0 4,06,477.3 4,20,700.0
C. State’s Own Non-Tax Revenue (1 to 6) 76,606.0 80,000.0 65,000.0 80,000.0 1,37,372.3 1,52,700.0 1,67,800.0 1,63,700.0
1. Interest Receipts 39,624.9 42,894.0 18,689.7 42,894.0 9,890.4 8,548.1 17,030.1 7,535.5
2. Dividends and Profits 1,591.2 1,750.0 1,450.0 1,750.0 234.1 709.5 709.5 372.1
3. General Services 12,787.6 14,722.3 12,332.3 14,722.3 1,879.5 2,212.3 2,398.3 1,692.5
of which: State Lotteries – – – – – – – –
Appendix I: Revenue Receipts of States and Union Territories with Legislature (Contd.)
(₹ Lakh)
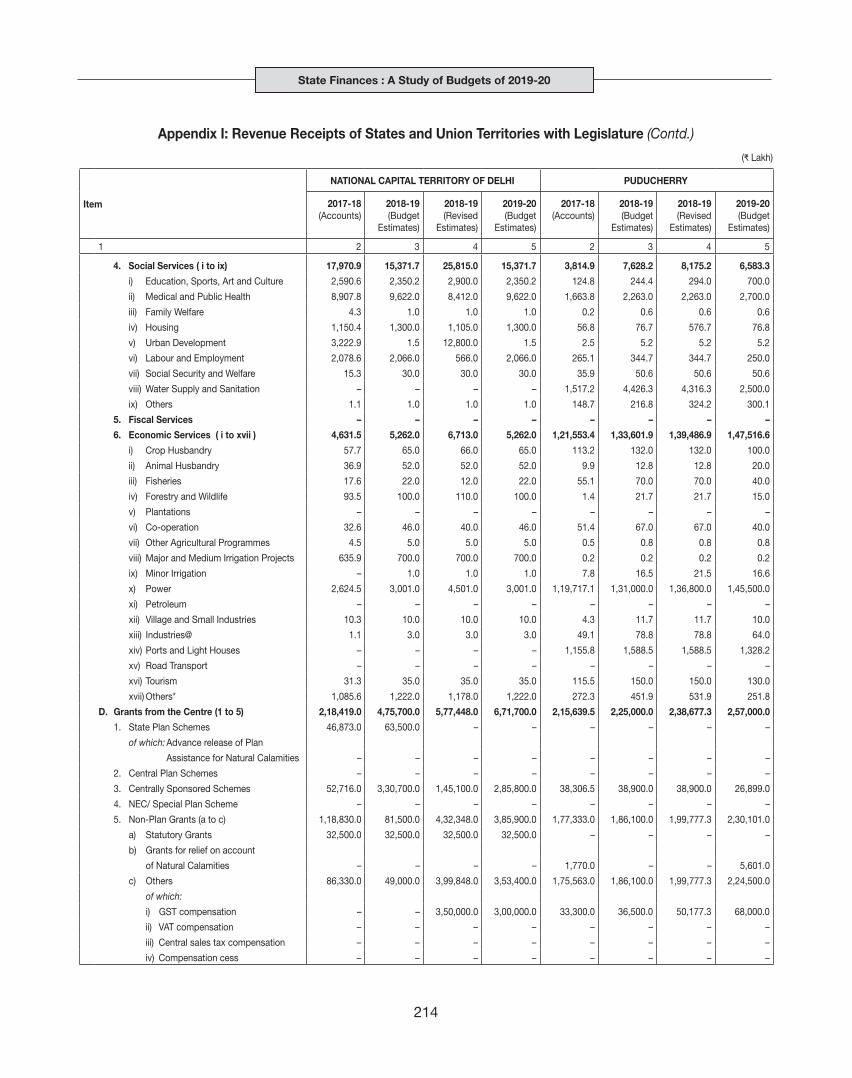
State Finances : A Study of Budgets of 2019-20
214
Item
NATIONAL CAPITAL TERRITORY OF DELHI PUDUCHERRY
2017-18(Accounts)
2018-19(Budget
Estimates)
2018-19(Revised
Estimates)
2019-20(Budget
Estimates)
2017-18(Accounts)
2018-19(Budget
Estimates)
2018-19(Revised
Estimates)
2019-20(Budget
Estimates)
1 2 3 4 5 2 3 4 5
4. Social Services ( i to ix) 17,970.9 15,371.7 25,815.0 15,371.7 3,814.9 7,628.2 8,175.2 6,583.3
i) Education, Sports, Art and Culture 2,590.6 2,350.2 2,900.0 2,350.2 124.8 244.4 294.0 700.0
ii) Medical and Public Health 8,907.8 9,622.0 8,412.0 9,622.0 1,663.8 2,263.0 2,263.0 2,700.0
iii) Family Welfare 4.3 1.0 1.0 1.0 0.2 0.6 0.6 0.6
iv) Housing 1,150.4 1,300.0 1,105.0 1,300.0 56.8 76.7 576.7 76.8
v) Urban Development 3,222.9 1.5 12,800.0 1.5 2.5 5.2 5.2 5.2
vi) Labour and Employment 2,078.6 2,066.0 566.0 2,066.0 265.1 344.7 344.7 250.0
vii) Social Security and Welfare 15.3 30.0 30.0 30.0 35.9 50.6 50.6 50.6
viii) Water Supply and Sanitation – – – – 1,517.2 4,426.3 4,316.3 2,500.0
ix) Others 1.1 1.0 1.0 1.0 148.7 216.8 324.2 300.1
5. Fiscal Services – – – – – – – –
6. Economic Services ( i to xvii ) 4,631.5 5,262.0 6,713.0 5,262.0 1,21,553.4 1,33,601.9 1,39,486.9 1,47,516.6
i) Crop Husbandry 57.7 65.0 66.0 65.0 113.2 132.0 132.0 100.0
ii) Animal Husbandry 36.9 52.0 52.0 52.0 9.9 12.8 12.8 20.0
iii) Fisheries 17.6 22.0 12.0 22.0 55.1 70.0 70.0 40.0
iv) Forestry and Wildlife 93.5 100.0 110.0 100.0 1.4 21.7 21.7 15.0
v) Plantations – – – – – – – –
vi) Co-operation 32.6 46.0 40.0 46.0 51.4 67.0 67.0 40.0
vii) Other Agricultural Programmes 4.5 5.0 5.0 5.0 0.5 0.8 0.8 0.8
viii) Major and Medium Irrigation Projects 635.9 700.0 700.0 700.0 0.2 0.2 0.2 0.2
ix) Minor Irrigation – 1.0 1.0 1.0 7.8 16.5 21.5 16.6
x) Power 2,624.5 3,001.0 4,501.0 3,001.0 1,19,717.1 1,31,000.0 1,36,800.0 1,45,500.0
xi) Petroleum – – – – – – – –
xii) Village and Small Industries 10.3 10.0 10.0 10.0 4.3 11.7 11.7 10.0
xiii) Industries@ 1.1 3.0 3.0 3.0 49.1 78.8 78.8 64.0
xiv) Ports and Light Houses – – – – 1,155.8 1,588.5 1,588.5 1,328.2
xv) Road Transport – – – – – – – –
xvi) Tourism 31.3 35.0 35.0 35.0 115.5 150.0 150.0 130.0
xvii) Others* 1,085.6 1,222.0 1,178.0 1,222.0 272.3 451.9 531.9 251.8
D. Grants from the Centre (1 to 5) 2,18,419.0 4,75,700.0 5,77,448.0 6,71,700.0 2,15,639.5 2,25,000.0 2,38,677.3 2,57,000.0
1. State Plan Schemes 46,873.0 63,500.0 – – – – – –
of which: Advance release of Plan
Assistance for Natural Calamities – – – – – – – –
2. Central Plan Schemes – – – – – – – –
3. Centrally Sponsored Schemes 52,716.0 3,30,700.0 1,45,100.0 2,85,800.0 38,306.5 38,900.0 38,900.0 26,899.0
4. NEC/ Special Plan Scheme – – – – – – – –
5. Non-Plan Grants (a to c) 1,18,830.0 81,500.0 4,32,348.0 3,85,900.0 1,77,333.0 1,86,100.0 1,99,777.3 2,30,101.0
a) Statutory Grants 32,500.0 32,500.0 32,500.0 32,500.0 – – – –
b) Grants for relief on account
of Natural Calamities – – – – 1,770.0 – – 5,601.0
c) Others 86,330.0 49,000.0 3,99,848.0 3,53,400.0 1,75,563.0 1,86,100.0 1,99,777.3 2,24,500.0
of which:
i) GST compensation – – 3,50,000.0 3,00,000.0 33,300.0 36,500.0 50,177.3 68,000.0
ii) VAT compensation – – – – – – – –
iii) Central sales tax compensation – – – – – – – –
iv) Compensation cess – – – – – – – –
Appendix I: Revenue Receipts of States and Union Territories with Legislature (Contd.)
(₹ Lakh)
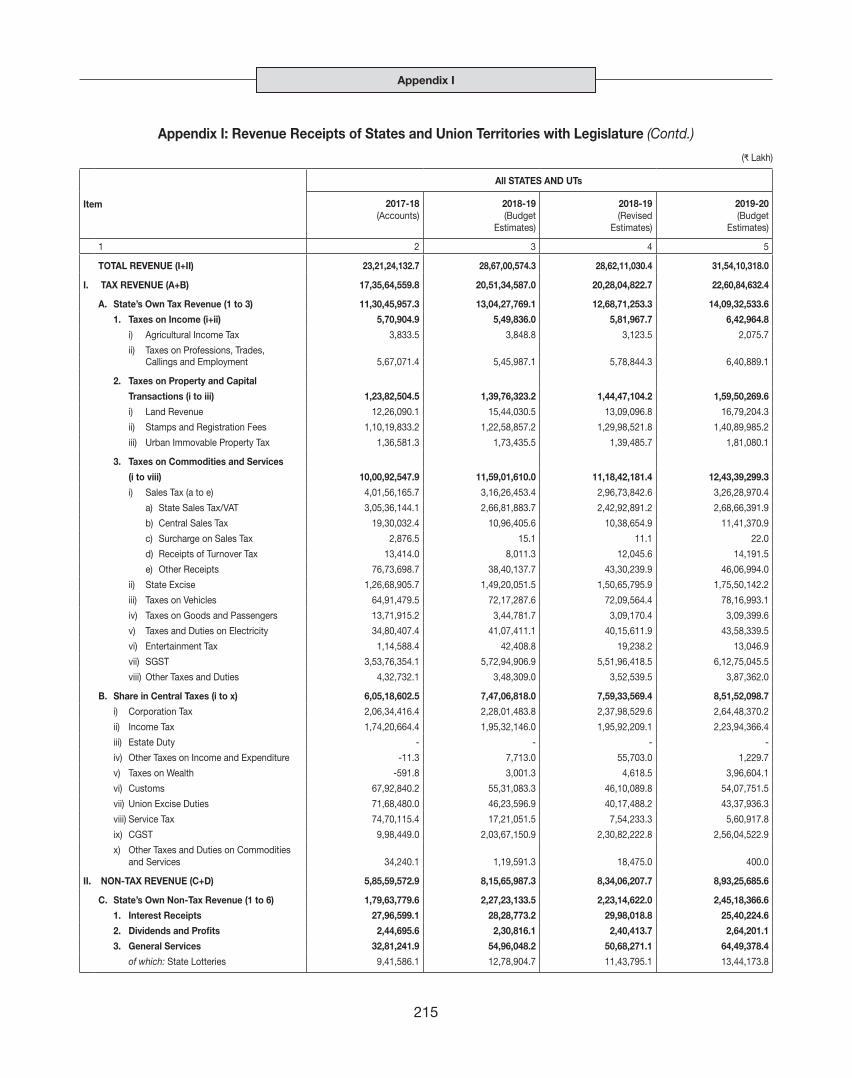
Appendix I
215
Item
All STATES AND UTs
2017-18(Accounts)
2018-19(Budget
Estimates)
2018-19(Revised
Estimates)
2019-20(Budget
Estimates)
1 2 3 4 5
TOTAL REVENUE (I+II) 23,21,24,132.7 28,67,00,574.3 28,62,11,030.4 31,54,10,318.0
I. TAX REVENUE (A+B) 17,35,64,559.8 20,51,34,587.0 20,28,04,822.7 22,60,84,632.4
A. State’s Own Tax Revenue (1 to 3) 11,30,45,957.3 13,04,27,769.1 12,68,71,253.3 14,09,32,533.6
1. Taxes on Income (i+ii) 5,70,904.9 5,49,836.0 5,81,967.7 6,42,964.8
i) Agricultural Income Tax 3,833.5 3,848.8 3,123.5 2,075.7
ii) Taxes on Professions, Trades, Callings and Employment 5,67,071.4 5,45,987.1 5,78,844.3 6,40,889.1
2. Taxes on Property and Capital
Transactions (i to iii) 1,23,82,504.5 1,39,76,323.2 1,44,47,104.2 1,59,50,269.6
i) Land Revenue 12,26,090.1 15,44,030.5 13,09,096.8 16,79,204.3
ii) Stamps and Registration Fees 1,10,19,833.2 1,22,58,857.2 1,29,98,521.8 1,40,89,985.2
iii) Urban Immovable Property Tax 1,36,581.3 1,73,435.5 1,39,485.7 1,81,080.1
3. Taxes on Commodities and Services
(i to viii) 10,00,92,547.9 11,59,01,610.0 11,18,42,181.4 12,43,39,299.3
i) Sales Tax (a to e) 4,01,56,165.7 3,16,26,453.4 2,96,73,842.6 3,26,28,970.4
a) State Sales Tax/VAT 3,05,36,144.1 2,66,81,883.7 2,42,92,891.2 2,68,66,391.9
b) Central Sales Tax 19,30,032.4 10,96,405.6 10,38,654.9 11,41,370.9
c) Surcharge on Sales Tax 2,876.5 15.1 11.1 22.0
d) Receipts of Turnover Tax 13,414.0 8,011.3 12,045.6 14,191.5
e) Other Receipts 76,73,698.7 38,40,137.7 43,30,239.9 46,06,994.0
ii) State Excise 1,26,68,905.7 1,49,20,051.5 1,50,65,795.9 1,75,50,142.2
iii) Taxes on Vehicles 64,91,479.5 72,17,287.6 72,09,564.4 78,16,993.1
iv) Taxes on Goods and Passengers 13,71,915.2 3,44,781.7 3,09,170.4 3,09,399.6
v) Taxes and Duties on Electricity 34,80,407.4 41,07,411.1 40,15,611.9 43,58,339.5
vi) Entertainment Tax 1,14,588.4 42,408.8 19,238.2 13,046.9
vii) SGST 3,53,76,354.1 5,72,94,906.9 5,51,96,418.5 6,12,75,045.5
viii) Other Taxes and Duties 4,32,732.1 3,48,309.0 3,52,539.5 3,87,362.0
B. Share in Central Taxes (i to x) 6,05,18,602.5 7,47,06,818.0 7,59,33,569.4 8,51,52,098.7
i) Corporation Tax 2,06,34,416.4 2,28,01,483.8 2,37,98,529.6 2,64,48,370.2
ii) Income Tax 1,74,20,664.4 1,95,32,146.0 1,95,92,209.1 2,23,94,366.4
iii) Estate Duty - - - -
iv) Other Taxes on Income and Expenditure -11.3 7,713.0 55,703.0 1,229.7
v) Taxes on Wealth -591.8 3,001.3 4,618.5 3,96,604.1
vi) Customs 67,92,840.2 55,31,083.3 46,10,089.8 54,07,751.5
vii) Union Excise Duties 71,68,480.0 46,23,596.9 40,17,488.2 43,37,936.3
viii) Service Tax 74,70,115.4 17,21,051.5 7,54,233.3 5,60,917.8
ix) CGST 9,98,449.0 2,03,67,150.9 2,30,82,222.8 2,56,04,522.9
x) Other Taxes and Duties on Commodities and Services 34,240.1 1,19,591.3 18,475.0 400.0
II. NON-TAX REVENUE (C+D) 5,85,59,572.9 8,15,65,987.3 8,34,06,207.7 8,93,25,685.6
C. State’s Own Non-Tax Revenue (1 to 6) 1,79,63,779.6 2,27,23,133.5 2,23,14,622.0 2,45,18,366.6
1. Interest Receipts 27,96,599.1 28,28,773.2 29,98,018.8 25,40,224.6
2. Dividends and Profits 2,44,695.6 2,30,816.1 2,40,413.7 2,64,201.1
3. General Services 32,81,241.9 54,96,048.2 50,68,271.1 64,49,378.4
of which: State Lotteries 9,41,586.1 12,78,904.7 11,43,795.1 13,44,173.8
Appendix I: Revenue Receipts of States and Union Territories with Legislature (Contd.)
(₹ Lakh)

State Finances : A Study of Budgets of 2019-20
216
Item
All STATES AND UTs
2017-18(Accounts)
2018-19(Budget
Estimates)
2018-19(Revised
Estimates)
2019-20(Budget
Estimates)
1 2 3 4 5
4. Social Services ( i to ix) 20,43,410.4 30,70,497.0 26,01,744.9 27,83,929.7 i) Education, Sports, Art and Culture 6,02,124.3 8,85,972.9 7,19,922.5 7,55,830.4 ii) Medical and Public Health 3,79,233.7 4,32,741.5 4,24,021.9 4,50,688.4 iii) Family Welfare 15,185.1 23,679.1 23,103.1 24,209.7 iv) Housing 52,471.3 1,58,942.3 59,768.1 67,056.9 v) Urban Development 4,26,807.3 10,40,939.9 8,30,750.1 9,08,604.6 vi) Labour and Employment 1,72,156.7 1,93,860.1 1,88,960.7 2,04,863.5 vii) Social Security and Welfare 1,40,796.7 90,532.9 96,777.7 1,06,899.1 viii) Water Supply and Sanitation 1,49,158.5 1,50,523.4 1,55,237.7 1,49,987.1 ix) Others 1,05,477.0 93,304.9 1,03,203.2 1,15,790.1 5. Fiscal Services 26.2 9.4 10.7 10.9 6. Economic Services ( i to xvii ) 95,97,806.5 1,10,96,989.6 1,14,06,162.9 1,24,80,621.8 i) Crop Husbandry 1,25,429.1 64,858.9 1,25,727.0 76,877.6 ii) Animal Husbandry 27,052.8 30,031.8 33,083.6 32,919.4 iii) Fisheries 20,656.9 23,658.0 24,094.9 25,121.5 iv) Forestry and Wildlife 4,22,605.6 6,08,068.9 5,42,168.7 6,75,147.2 v) Plantations 221.8 704.7 704.0 254.3 vi) Co-operation 67,456.1 82,055.1 1,79,443.3 90,717.4 vii) Other Agricultural Programmes 13,874.5 13,036.4 12,512.5 14,872.1 viii) Major and Medium Irrigation Projects 6,97,645.7 6,33,590.2 5,66,381.4 7,29,902.4 ix) Minor Irrigation 73,821.7 96,868.4 99,050.9 1,27,214.1 x) Power 13,33,732.8 17,32,650.3 17,65,888.3 17,28,398.3 xi) Petroleum 5,11,235.3 9,91,104.3 12,23,932.3 9,61,031.8 xii) Village and Small Industries 9,479.3 25,879.1 21,852.6 28,447.3 xiii) Industries@ 54,80,474.4 58,11,674.7 58,29,340.3 68,11,765.1 xiv) Ports and Light Houses 1,27,775.7 1,82,875.2 1,68,981.9 1,86,819.5 xv) Road Transport 1,59,226.8 2,46,022.7 1,70,594.7 2,40,050.0 xvi) Tourism 12,165.2 10,626.5 10,427.9 10,679.6 xvii) Others* 5,14,952.6 5,43,284.6 6,31,978.8 7,40,404.2 D. Grants from the Centre (1 to 5) 4,05,95,793.3 5,88,42,853.9 6,10,91,585.7 6,48,07,319.1 1. State Plan Schemes 30,68,028.4 55,25,144.6 46,51,714.9 17,55,485.7 of which: Advance release of Plan Assistance for Natural Calamities - - - - 2. Central Plan Schemes 1,06,604.2 5,98,956.8 2,43,428.2 12,445.5 3. Centrally Sponsored Schemes 2,18,32,967.7 3,27,04,215.9 3,38,00,788.2 3,81,43,958.8 4. NEC/ Special Plan Scheme 21,250.8 29,360.0 41,764.0 20,000.0 5. Non-Plan Grants (a to c) 1,55,66,942.2 1,99,85,176.6 2,23,53,890.4 2,48,75,429.0 a) Statutory Grants 81,08,382.6 96,71,930.9 1,07,65,155.7 1,21,07,706.9 b) Grants for relief on account of Natural Calamities 7,78,964.9 5,41,888.4 6,57,024.6 3,79,485.0 c) Others 66,79,594.8 97,71,357.3 1,09,31,710.0 1,23,88,237.1 of which: - - - - i) GST compensation 35,48,651.0 39,22,517.0 63,75,295.3 74,64,445.7 ii) VAT compensation - - - - iii) Central sales tax compensation 77,698.0 - - - iv) Compensation cess - 3,61,059.1 61,058.3 23,500.1
‘–’ : Nil/Negligible/Not available.@ : Include Non-Ferrous Mining and Metallurgical Industries and Other Industries.* : Include receipts from Dairy Development, Land Reforms, Other Rural Development Programmes, Hill Areas, Civil Aviation, Inland Water Transport,Foreign Trade and Export Promotion, Non-conventional Energy Sources, General Economic Services, Civil Supplies, Roads and Bridges, etc.Also see notes to Appendices.Note: 1. Data pertaining to Jammu and Kashmir for 2017-18 is taken from CAG and are provisional. 2. Compensation cess is added in ‘Grants from the Centre’ if the numbers are given in different components.Source : Budget Documents of the State Governments.
Appendix I: Revenue Receipts of States and Union Territories with Legislature (Concld.)
(₹ Lakh)

Appendix II
217
Appendix II : Revenue Expenditure of States and Union Territories with Legislature
(₹ Lakh)
Item
ANDHRA PRADESH ARUNACHAL PRADESH
2017-18(Accounts)
2018-19(Budget
Estimates)
2018-19(Revised
Estimates)
2019-20(Budget
Estimates)
2017-18(Accounts)
2018-19(Budget
Estimates)
2018-19(Revised
Estimates)
2019-20(Budget
Estimates)
1 2 3 4 5 2 3 4 5
TOTAL EXPENDITURE (I+II+III) 1,21,21,377.6 1,50,27,199.1 1,26,33,905.5 1,80,47,594.1 10,90,046.9 10,25,566.4 13,48,345.5 13,40,678.2
I. DEVELOPMENTAL EXPENDITURE (A + B) 82,05,302.0 1,08,39,545.3 86,52,831.0 1,36,63,486.4 7,41,571.0 6,53,048.1 9,56,873.0 9,20,357.9
A. Social Services (1 to 12) 59,15,935.0 79,54,640.8 64,18,855.6 93,09,295.0 3,95,083.4 3,18,783.1 5,02,712.4 4,79,653.1
1. Education, Sports, Art and Culture 19,65,355.9 25,83,514.0 19,34,175.5 31,33,212.7 1,71,766.1 1,48,319.9 1,98,050.6 1,82,060.7
2. Medical and Public Health 4,45,007.7 5,72,035.5 5,21,969.2 6,05,549.5 87,487.6 73,051.2 1,29,549.5 1,31,266.6
3. Family Welfare 1,73,748.0 2,56,366.5 2,00,548.7 3,10,721.5 1,863.9 1,365.5 1,943.2 756.1
4. Water Supply and Sanitation 3,17,270.6 2,21,721.5 1,58,972.9 1,75,260.1 67,034.4 40,479.5 74,459.0 76,465.0
5. Housing 1,61,546.4 3,10,181.7 3,46,699.2 3,71,323.1 5,321.4 2,371.0 4,264.3 4,750.2
6. Urban Development 2,89,920.7 6,31,364.0 3,65,219.3 4,52,621.0 9,546.5 6,435.5 23,454.8 20,758.8
7. Welfare of Scheduled Castes, Scheduled Tribes and Other Backward Classes 9,74,607.5 13,09,983.2 5,33,464.6 13,67,429.6 - - - -
8. Labour and Labour Welfare 20,844.0 42,704.3 55,288.2 1,09,900.9 3,351.3 4,573.4 3,602.7 5,090.6
9. Social Security and Welfare 10,02,798.0 14,93,607.5 20,30,107.5 21,76,460.8 27,896.1 29,414.2 31,086.0 37,445.2
10. Nutrition 3,42,924.2 4,45,937.9 95,379.5 4,53,269.4 4,553.0 1,240.0 6,458.6 1,984.9
11. Relief on account of Natural Calamities 1,92,303.3 51,621.5 1,47,497.0 98,789.7 11,496.7 5,879.8 22,820.3 6,540.0
12. Others* 29,608.7 35,603.3 29,533.9 54,756.9 4,766.6 5,653.1 7,023.5 12,535.1
B. Economic Services (1 to 9) 22,89,367.1 28,84,904.4 22,33,975.3 43,54,191.4 3,46,487.7 3,34,265.1 4,54,160.7 4,40,704.8
1. Agriculture and Allied Activities (i to xii) 7,32,620.8 7,80,496.9 8,48,862.8 19,61,097.8 76,918.5 85,861.1 1,04,880.5 1,22,313.0
i) Crop Husbandry 5,19,597.4 4,72,003.6 4,04,651.3 4,89,573.9 25,211.9 25,096.4 36,163.5 42,307.3
ii) Soil and Water Conservation 3,964.1 7,909.5 3,617.2 7,017.9 7,447.0 8,526.7 9,029.2 8,325.7
iii) Animal Husbandry 88,592.1 1,12,103.9 95,619.3 1,07,788.1 11,599.4 10,139.5 12,128.5 16,748.9
iv) Dairy Development - - - - 252.3 648.4 1,041.4 3,812.4
v) Fisheries 25,635.6 36,607.1 19,059.7 40,961.6 2,599.6 2,066.2 2,615.3 2,788.3
vi) Forestry and Wild Life 33,194.5 31,845.6 28,269.7 36,595.8 21,532.1 19,199.4 27,700.5 24,774.2
vii) Plantations - - - - - - - -
viii) Food Storage and Warehousing -14.3 38,910.0 -2,090.0 18,900.0 3,442.0 18,479.9 13,332.5 21,512.7
ix) Agricultural Research and Education 47,684.0 59,122.4 2,30,012.4 66,561.3 3,078.9 277.2 486.4 371.0
x) Agricultural Finance Institutions - - - - - - - -
xi) Co-operation 13,044.1 20,811.9 18,733.0 17,464.3 1,429.7 1,248.9 2,048.9 1,480.9
xii) Other Agricultural Programmes 923.3 1,183.0 50,990.4 11,76,234.9 325.7 178.6 334.6 191.7
2. Rural Development 7,99,015.4 10,50,819.7 6,65,756.9 9,57,297.7 57,562.3 40,031.8 63,880.9 60,028.8
3. Special Area Programmes - - - - 1,770.6 1,307.8 781.0 521.2
4. Irrigation and Flood Control 63,448.9 67,835.9 60,510.0 73,008.7 27,486.2 22,310.3 22,759.5 17,685.0
of which:
i) Major and Medium Irrigation 53,502.1 57,116.6 50,518.9 60,252.5 - 2,450.0 - -
ii) Minor Irrigation 9,420.9 10,144.8 9,421.6 12,059.3 25,226.1 19,860.3 21,969.5 14,685.0
iii) Flood Control and Drainage 16.1 30.3 18.1 18.7 1,860.1 - 790.0 -
5. Energy 3,41,740.0 3,23,251.4 1,90,829.9 6,59,959.7 70,421.7 79,711.4 97,479.8 1,01,155.7
of which: Power 3,34,357.2 3,23,251.4 1,90,829.9 6,59,959.7 68,570.7 77,722.8 94,338.4 96,710.4
6. Industry and Minerals (i to iii) 1,53,559.0 1,41,700.3 1,00,873.6 2,28,883.0 9,078.1 10,443.2 11,488.5 16,072.3
i) Village and Small Industries 35,340.6 76,061.6 22,379.9 87,991.0 6,500.4 9,089.3 9,488.4 10,433.7
ii) Industries@ 1,16,818.4 64,438.6 64,117.4 78,692.0 2,577.6 1,353.9 2,000.1 5,638.5
iii) Others** 1,400.0 1,200.0 14,376.3 62,200.0 - - - -
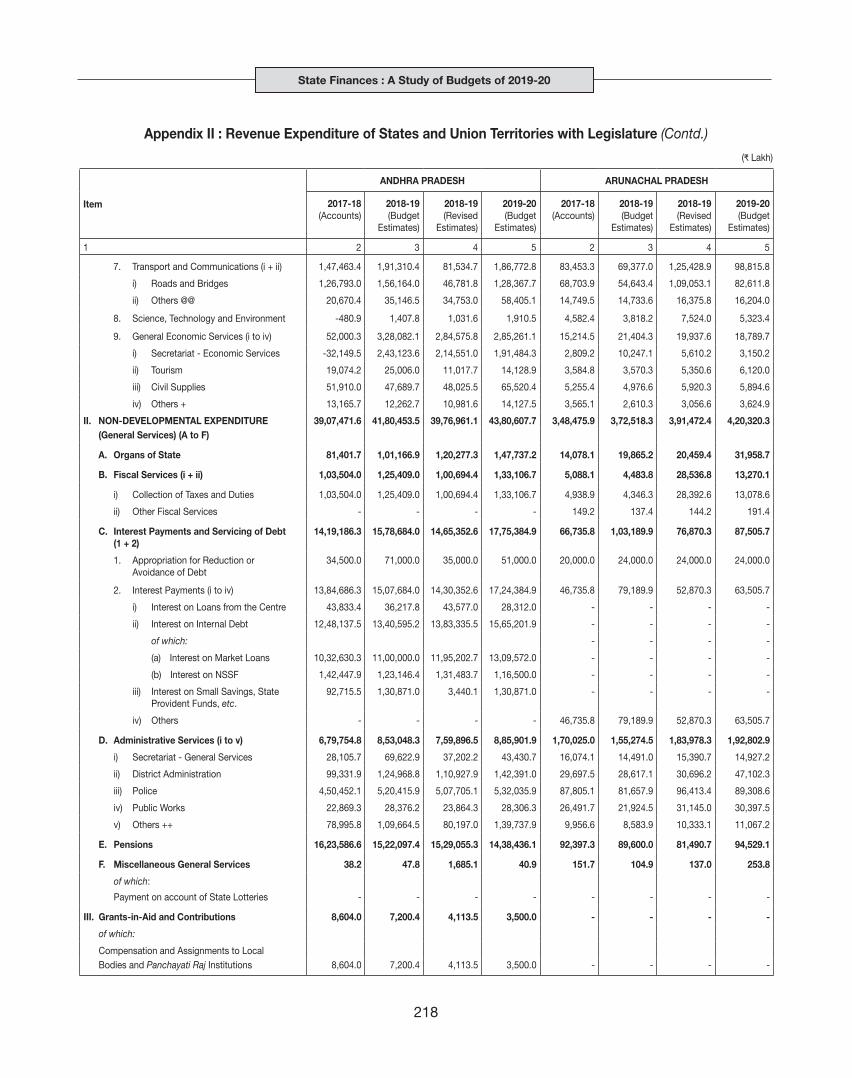
State Finances : A Study of Budgets of 2019-20
218
Appendix II : Revenue Expenditure of States and Union Territories with Legislature (Contd.)
(₹ Lakh)
Item
ANDHRA PRADESH ARUNACHAL PRADESH
2017-18(Accounts)
2018-19(Budget
Estimates)
2018-19(Revised
Estimates)
2019-20(Budget
Estimates)
2017-18(Accounts)
2018-19(Budget
Estimates)
2018-19(Revised
Estimates)
2019-20(Budget
Estimates)
1 2 3 4 5 2 3 4 5
7. Transport and Communications (i + ii) 1,47,463.4 1,91,310.4 81,534.7 1,86,772.8 83,453.3 69,377.0 1,25,428.9 98,815.8
i) Roads and Bridges 1,26,793.0 1,56,164.0 46,781.8 1,28,367.7 68,703.9 54,643.4 1,09,053.1 82,611.8
ii) Others @@ 20,670.4 35,146.5 34,753.0 58,405.1 14,749.5 14,733.6 16,375.8 16,204.0
8. Science, Technology and Environment -480.9 1,407.8 1,031.6 1,910.5 4,582.4 3,818.2 7,524.0 5,323.4
9. General Economic Services (i to iv) 52,000.3 3,28,082.1 2,84,575.8 2,85,261.1 15,214.5 21,404.3 19,937.6 18,789.7
i) Secretariat - Economic Services -32,149.5 2,43,123.6 2,14,551.0 1,91,484.3 2,809.2 10,247.1 5,610.2 3,150.2
ii) Tourism 19,074.2 25,006.0 11,017.7 14,128.9 3,584.8 3,570.3 5,350.6 6,120.0
iii) Civil Supplies 51,910.0 47,689.7 48,025.5 65,520.4 5,255.4 4,976.6 5,920.3 5,894.6
iv) Others + 13,165.7 12,262.7 10,981.6 14,127.5 3,565.1 2,610.3 3,056.6 3,624.9
II. NON-DEVELOPMENTAL EXPENDITURE 39,07,471.6 41,80,453.5 39,76,961.1 43,80,607.7 3,48,475.9 3,72,518.3 3,91,472.4 4,20,320.3 (General Services) (A to F)
A. Organs of State 81,401.7 1,01,166.9 1,20,277.3 1,47,737.2 14,078.1 19,865.2 20,459.4 31,958.7
B. Fiscal Services (i + ii) 1,03,504.0 1,25,409.0 1,00,694.4 1,33,106.7 5,088.1 4,483.8 28,536.8 13,270.1
i) Collection of Taxes and Duties 1,03,504.0 1,25,409.0 1,00,694.4 1,33,106.7 4,938.9 4,346.3 28,392.6 13,078.6
ii) Other Fiscal Services - - - - 149.2 137.4 144.2 191.4
C. Interest Payments and Servicing of Debt (1 + 2)
14,19,186.3 15,78,684.0 14,65,352.6 17,75,384.9 66,735.8 1,03,189.9 76,870.3 87,505.7
1. Appropriation for Reduction or Avoidance of Debt
34,500.0 71,000.0 35,000.0 51,000.0 20,000.0 24,000.0 24,000.0 24,000.0
2. Interest Payments (i to iv) 13,84,686.3 15,07,684.0 14,30,352.6 17,24,384.9 46,735.8 79,189.9 52,870.3 63,505.7
i) Interest on Loans from the Centre 43,833.4 36,217.8 43,577.0 28,312.0 - - - -
ii) Interest on Internal Debt 12,48,137.5 13,40,595.2 13,83,335.5 15,65,201.9 - - - -
of which: - - - -
(a) Interest on Market Loans 10,32,630.3 11,00,000.0 11,95,202.7 13,09,572.0 - - - -
(b) Interest on NSSF 1,42,447.9 1,23,146.4 1,31,483.7 1,16,500.0 - - - -
iii) Interest on Small Savings, State Provident Funds, etc.
92,715.5 1,30,871.0 3,440.1 1,30,871.0 - - - -
iv) Others - - - - 46,735.8 79,189.9 52,870.3 63,505.7
D. Administrative Services (i to v) 6,79,754.8 8,53,048.3 7,59,896.5 8,85,901.9 1,70,025.0 1,55,274.5 1,83,978.3 1,92,802.9
i) Secretariat - General Services 28,105.7 69,622.9 37,202.2 43,430.7 16,074.1 14,491.0 15,390.7 14,927.2
ii) District Administration 99,331.9 1,24,968.8 1,10,927.9 1,42,391.0 29,697.5 28,617.1 30,696.2 47,102.3
iii) Police 4,50,452.1 5,20,415.9 5,07,705.1 5,32,035.9 87,805.1 81,657.9 96,413.4 89,308.6
iv) Public Works 22,869.3 28,376.2 23,864.3 28,306.3 26,491.7 21,924.5 31,145.0 30,397.5
v) Others ++ 78,995.8 1,09,664.5 80,197.0 1,39,737.9 9,956.6 8,583.9 10,333.1 11,067.2
E. Pensions 16,23,586.6 15,22,097.4 15,29,055.3 14,38,436.1 92,397.3 89,600.0 81,490.7 94,529.1
F. Miscellaneous General Services 38.2 47.8 1,685.1 40.9 151.7 104.9 137.0 253.8
of which:
Payment on account of State Lotteries - - - - - - - -
III. Grants-in-Aid and Contributions 8,604.0 7,200.4 4,113.5 3,500.0 - - - -
of which:
Compensation and Assignments to Local Bodies and Panchayati Raj Institutions 8,604.0 7,200.4 4,113.5 3,500.0 - - - -

Appendix II
219
Appendix II : Revenue Expenditure of States and Union Territories with Legislature (Contd.)
(₹ Lakh)
Item
ASSAM BIHAR
2017-18(Accounts)
2018-19(Budget
Estimates)
2018-19(Revised
Estimates)
2019-20(Budget
Estimates)
2017-18(Accounts)
2018-19(Budget
Estimates)
2018-19(Revised
Estimates)
2019-20(Budget
Estimates)
1 2 3 4 5 2 3 4 5
TOTAL EXPENDITURE (I+II+III) 55,48,094.5 71,32,936.6 82,00,480.5 79,74,225.9 1,02,62,372.7 1,36,73,967.5 1,48,69,628.7 1,55,23,065.5
I. DEVELOPMENTAL EXPENDITURE (A + B) 33,29,809.1 47,96,286.5 56,05,804.0 52,66,445.1 69,24,539.9 96,49,978.6 1,07,90,551.9 1,09,07,823.3
A. Social Services (1 to 12) 21,37,316.9 32,62,850.3 37,64,703.5 36,44,923.4 45,76,946.6 66,92,156.3 76,26,225.2 75,14,718.6
1. Education, Sports, Art and Culture 14,08,955.5 17,51,724.2 19,26,476.2 19,87,526.8 23,31,458.8 32,25,233.2 36,12,921.2 34,45,774.3
2. Medical and Public Health 3,90,984.1 4,33,556.9 5,99,253.4 5,91,193.6 5,06,417.6 5,80,785.8 5,93,785.5 6,38,425.2
3. Family Welfare 30,239.0 43,525.1 43,689.1 47,903.8 55,240.2 64,834.4 92,859.4 83,205.8
4. Water Supply and Sanitation 39,105.5 80,395.6 91,158.4 91,824.2 2,33,835.7 5,58,926.8 6,37,579.7 5,89,218.3
5. Housing 1,83,239.8 1,72,029.2 1,72,192.0 1,13,349.7 94,445.5 6,58,491.9 6,58,491.9 6,11,035.0
6. Urban Development 59,570.3 2,23,280.9 2,41,874.3 1,97,819.8 2,39,346.7 4,08,888.4 4,38,693.3 4,85,449.7
7. Welfare of Scheduled Castes, Scheduled Tribes and Other Backward Classes 64,251.6 1,82,108.2 2,46,032.8 1,96,583.4 95,060.1 2,93,499.5 2,98,144.5 3,12,609.9
8. Labour and Labour Welfare 11,546.6 30,452.9 30,622.9 38,568.7 32,040.3 68,467.8 68,801.5 74,822.6
9. Social Security and Welfare 86,030.1 1,95,822.9 2,16,856.0 1,94,285.1 5,01,314.8 5,65,685.6 7,17,995.3 6,32,626.1
10. Nutrition 24,920.0 33,837.6 60,220.1 63,671.5 1,20,310.9 1,64,486.8 1,75,412.2 1,73,019.7
11. Relief on account of Natural Calamities -1,70,573.5 1,08,414.6 1,28,307.6 1,12,940.2 3,46,895.7 64,805.1 2,92,934.7 4,28,782.8
12. Others* 9,047.8 7,702.2 8,020.8 9,256.7 20,580.2 38,051.1 38,606.1 39,749.2
B. Economic Services (1 to 9) 11,92,492.1 15,33,436.2 18,41,100.6 16,21,521.7 23,47,593.4 29,57,822.3 31,64,326.7 33,93,104.7
1. Agriculture and Allied Activities (i to xii) 2,90,523.5 3,75,045.6 4,17,489.7 5,11,996.7 3,62,559.1 4,93,479.0 5,00,059.2 6,22,040.3
i) Crop Husbandry 85,688.7 1,12,542.3 1,30,923.7 1,48,677.7 1,57,063.5 2,62,618.7 2,68,915.8 3,09,844.1
ii) Soil and Water Conservation 7,951.3 9,299.9 10,791.2 18,699.0 6,868.0 14,002.7 14,649.4 17,236.5
iii) Animal Husbandry 30,902.9 45,792.7 50,005.9 58,768.6 38,263.7 45,055.4 42,840.0 60,569.0
iv) Dairy Development 2,793.4 4,431.3 4,431.3 3,811.3 10,794.6 11,184.6 11,202.5 11,238.7
v) Fisheries 7,046.8 9,806.8 9,930.3 10,852.5 4,787.9 10,325.8 10,596.9 10,763.0
vi) Forestry and Wild Life 60,497.2 63,094.4 72,593.4 83,438.8 25,334.7 35,168.6 34,662.3 41,166.5
vii) Plantations - - - - - - - -
viii) Food Storage and Warehousing 50,250.7 80,386.3 82,974.3 1,22,666.9 59,893.1 41,755.0 41,756.1 41,755.0
ix) Agricultural Research and Education 31,811.4 34,118.8 40,060.8 42,381.2 34,011.9 40,405.2 42,573.0 43,145.8
x) Agricultural Finance Institutions - - - - - - - -
xi) Co-operation 12,126.2 13,820.1 14,025.8 13,413.6 24,126.1 31,819.9 31,720.1 84,676.4
xii) Other Agricultural Programmes 1,454.8 1,753.1 1,753.1 9,287.1 1,415.7 1,143.2 1,143.2 1,645.3
2. Rural Development 3,11,439.8 4,24,796.1 4,30,953.8 5,09,310.1 11,21,222.2 14,27,595.7 14,50,847.7 16,61,861.5
3. Special Area Programmes 44,409.9 33,794.5 34,560.8 20,873.0 - - - -
4. Irrigation and Flood Control 84,695.0 1,04,317.2 1,05,968.7 1,14,516.8 1,30,116.5 1,38,411.1 1,38,411.1 1,57,488.7
of which:
i) Major and Medium Irrigation 13,413.4 17,741.2 18,039.3 19,685.9 50,079.2 54,983.6 54,983.6 53,751.4
ii) Minor Irrigation 39,925.7 50,489.3 51,664.4 52,609.9 29,126.8 36,757.6 36,757.6 47,715.3
iii) Flood Control and Drainage 29,955.8 35,448.7 35,626.9 41,545.4 38,748.4 40,838.5 40,838.5 42,720.0
5. Energy 1,56,281.9 2,12,000.1 4,04,881.1 1,15,494.4 4,30,465.6 4,43,908.9 6,06,136.8 4,31,771.8
of which: Power 1,56,216.3 2,11,911.0 4,04,792.0 1,15,410.0 4,37,207.9 4,35,450.0 5,97,677.9 4,25,763.0
6. Industry and Minerals (i to iii) 70,948.7 1,01,479.4 1,04,216.3 71,834.5 75,591.6 86,190.7 96,345.4 1,06,247.3
i) Village and Small Industries 56,162.9 55,586.1 56,845.3 56,020.6 12,332.8 12,084.4 12,814.4 16,127.2
ii) Industries@ 14,785.7 45,893.4 47,371.0 15,814.0 63,258.8 74,106.3 83,531.0 90,120.0
iii) Others** - - - - - - - -

State Finances : A Study of Budgets of 2019-20
220
Item
ASSAM BIHAR
2017-18(Accounts)
2018-19(Budget
Estimates)
2018-19(Revised
Estimates)
2019-20(Budget
Estimates)
2017-18(Accounts)
2018-19(Budget
Estimates)
2018-19(Revised
Estimates)
2019-20(Budget
Estimates)
1 2 3 4 5 2 3 4 5
7. Transport and Communications (i + ii) 1,73,670.8 2,06,425.3 2,53,076.5 1,80,497.7 1,40,180.1 2,31,985.4 2,33,113.9 2,67,276.5
i) Roads and Bridges 1,52,306.4 1,82,208.5 2,28,758.9 1,50,460.0 1,39,773.2 2,31,232.0 2,31,460.5 2,36,554.4
ii) Others @@ 21,364.4 24,216.8 24,317.6 30,037.7 406.9 753.4 1,653.4 30,722.1
8. Science, Technology and Environment 2,828.8 3,853.2 3,971.2 2,352.7 - - - -
9. General Economic Services (i to iv) 57,693.8 71,724.8 85,982.7 94,645.7 87,458.3 1,36,251.6 1,39,412.8 1,46,418.7
i) Secretariat - Economic Services 46,285.8 52,684.3 65,476.8 77,503.2 13,661.5 12,195.0 12,404.9 12,100.3
ii) Tourism 6,087.2 7,570.0 8,707.1 6,309.1 6,411.5 4,269.8 4,269.8 4,516.9
iii) Civil Supplies 55.5 85.6 86.8 91.5 58,554.2 92,160.6 92,769.9 92,088.3
iv) Others + 5,265.4 11,384.9 11,712.0 10,742.0 8,831.1 27,626.3 29,968.2 37,713.2
II. NON-DEVELOPMENTAL EXPENDITURE 22,05,780.4 23,12,458.2 25,49,808.2 26,59,173.0 33,37,429.9 40,23,385.4 40,78,473.3 46,14,638.7 (General Services) (A to F)
A. Organs of State 38,526.4 73,418.7 76,190.6 63,594.6 1,09,337.5 1,45,116.0 1,48,948.8 2,05,530.0
B. Fiscal Services (i + ii) 56,971.9 1,21,617.7 1,24,178.7 1,64,367.6 85,593.2 1,08,164.3 1,15,716.1 1,34,430.9
i) Collection of Taxes and Duties 56,750.3 1,21,317.8 1,23,878.3 1,64,023.8 85,327.5 1,07,883.9 1,15,351.7 1,34,051.6
ii) Other Fiscal Services 221.6 300.0 300.3 343.8 265.7 280.4 364.4 379.3
C. Interest Payments and Servicing of Debt (1 + 2)
3,41,529.6 4,42,240.0 4,42,240.0 5,07,296.3 9,74,740.0 11,53,866.8 11,54,872.3 11,59,849.8
1. Appropriation for Reduction or Avoidance of Debt
20,997.5 22,905.4 22,905.4 28,004.0 69,362.0 77,518.2 78,391.4 87,503.0
2. Interest Payments (i to iv) 3,20,532.1 4,19,334.6 4,19,334.6 4,79,292.3 9,05,378.0 10,76,348.6 10,76,480.9 10,72,346.8
i) Interest on Loans from the Centre 10,015.8 11,173.7 11,173.7 9,335.0 39,330.1 38,319.1 38,319.1 49,409.1
ii) Interest on Internal Debt 2,38,103.2 3,02,873.8 3,02,873.8 3,59,822.3 8,14,754.2 9,33,320.0 9,33,452.2 9,62,209.5
of which:
(a) Interest on Market Loans 1,37,189.6 2,01,239.0 2,01,239.0 2,65,876.2 5,37,427.9 6,61,800.2 6,61,800.2 7,06,807.0
(b) Interest on NSSF 89,353.7 83,170.7 83,170.7 76,332.6 2,22,328.7 2,05,261.8 2,05,261.8 1,87,717.2
iii) Interest on Small Savings, State Provident Funds, etc.
72,413.1 1,05,287.1 1,05,287.1 1,10,135.1 50,144.4 1,03,434.5 1,03,434.5 59,453.2
iv) Others - - - - 1,149.4 1,275.0 1,275.0 1,275.0
D. Administrative Services (i to v) 5,81,922.7 8,09,227.5 9,13,828.7 8,99,284.3 7,74,650.3 10,33,356.9 10,76,031.8 12,69,074.5
i) Secretariat - General Services 69,414.9 1,34,719.8 1,94,038.8 1,23,165.7 21,743.0 29,552.8 30,249.9 32,192.0
ii) District Administration 18,958.9 27,487.7 27,589.8 27,889.6 42,155.5 65,748.8 66,416.8 69,789.7
iii) Police 3,65,390.3 4,91,768.8 5,07,749.3 5,65,945.7 5,73,698.8 7,20,152.0 7,52,750.7 8,90,594.3
iv) Public Works 26,699.0 51,992.6 53,743.2 55,060.5 49,364.5 72,807.7 73,474.0 75,018.8
v) Others ++ 1,01,459.5 1,03,258.6 1,30,707.6 1,27,222.8 87,688.5 1,45,095.7 1,53,140.5 2,01,479.7
E. Pensions 8,28,734.4 8,02,849.4 8,02,849.4 8,98,201.2 14,29,348.3 15,82,881.2 15,82,904.2 18,45,753.3
F. Miscellaneous General Services 3,58,095.5 63,104.9 1,90,520.9 1,26,429.0 -36,239.4 0.2 0.2 0.2
of which:
Payment on account of State Lotteries - - - - - - - -
III. Grants-in-Aid and Contributions 12,505.1 24,191.9 44,868.3 48,607.8 402.9 603.5 603.5 603.5
of which:
Compensation and Assignments to Local Bodies and Panchayati Raj Institutions 12,505.1 24,191.9 44,868.3 48,607.8 402.9 603.5 603.5 603.5
Appendix II : Revenue Expenditure of States and Union Territories with Legislature (Contd.)
(₹ Lakh)

Appendix II
221
Item
CHHATTISGARH GOA
2017-18(Accounts)
2018-19(Budget
Estimates)
2018-19(Revised
Estimates)
2019-20(Budget
Estimates)
2017-18(Accounts)
2018-19(Budget
Estimates)
2018-19(Revised
Estimates)
2019-20(Budget
Estimates)
1 2 3 4 5 2 3 4 5
TOTAL EXPENDITURE (I+II+III) 56,22,975.1 68,42,289.8 80,37,004.6 78,59,453.0 10,54,289.5 11,73,604.6 11,73,604.6 13,13,868.1
I. DEVELOPMENTAL EXPENDITURE (A + B) 41,99,467.7 50,65,178.6 63,42,575.5 60,45,144.3 7,02,314.2 8,20,799.3 8,20,799.3 8,88,783.9
A. Social Services (1 to 12) 24,37,159.1 28,10,809.4 31,03,264.9 28,92,897.0 4,15,510.5 4,73,261.5 4,73,261.5 5,26,880.4
1. Education, Sports, Art and Culture 11,84,455.7 14,38,530.6 15,21,951.2 15,60,591.3 1,79,151.0 2,04,768.1 2,04,768.1 2,26,652.4
2. Medical and Public Health 3,37,649.9 3,95,743.3 4,28,677.1 4,03,411.1 82,631.0 85,030.9 85,030.9 1,06,165.1
3. Family Welfare 23,020.3 31,814.0 31,814.0 31,998.5 1,543.7 1,404.8 1,404.8 1,798.0
4. Water Supply and Sanitation 1,37,885.8 1,25,537.8 1,21,564.9 85,469.8 37,702.8 36,777.0 36,777.0 44,273.8
5. Housing 3,26,396.5 2,47,345.0 3,72,643.1 1,82,656.3 972.7 1,723.3 1,723.3 1,440.2
6. Urban Development 1,25,580.7 1,60,587.4 1,79,709.3 1,91,497.1 21,322.7 26,985.7 26,985.7 24,329.3
7. Welfare of Scheduled Castes, Scheduled Tribes and Other Backward Classes 17,614.7 29,061.8 30,882.7 32,022.2 10,966.6 16,069.7 16,069.7 14,021.6
8. Labour and Labour Welfare 25,500.3 37,618.1 40,727.5 44,006.8 5,999.8 11,825.7 11,825.7 15,124.4
9. Social Security and Welfare 1,52,416.6 1,99,732.1 2,24,567.9 2,20,488.6 68,720.6 79,943.4 79,943.4 82,559.5
10. Nutrition 63,729.8 84,686.3 84,686.3 85,837.0 1,357.7 2,047.5 2,047.5 2,031.7
11. Relief on account of Natural Calamities 26,025.9 33,064.0 32,952.0 34,400.5 586.0 1,382.9 1,382.9 4,029.0
12. Others* 16,883.0 27,089.0 33,089.0 20,518.0 4,555.9 5,302.7 5,302.7 4,455.6
B. Economic Services (1 to 9) 17,62,308.7 22,54,369.2 32,39,310.5 31,52,247.3 2,86,803.7 3,47,537.8 3,47,537.8 3,61,903.4
1. Agriculture and Allied Activities (i to xii) 8,78,104.4 11,40,786.2 21,61,586.4 20,29,429.9 32,018.8 41,487.2 41,487.2 49,797.6
i) Crop Husbandry 3,25,159.9 3,94,930.4 9,82,839.0 7,12,495.2 10,818.3 14,348.2 14,348.2 15,381.2
ii) Soil and Water Conservation 12,410.0 24,249.9 24,249.9 24,585.3 233.2 226.6 226.6 531.5
iii) Animal Husbandry 40,895.6 48,205.4 57,426.5 58,001.2 3,647.0 5,038.8 5,038.8 6,642.7
iv) Dairy Development - - - - 5,751.0 7,375.7 7,375.7 8,326.5
v) Fisheries 7,902.6 10,628.0 10,652.3 12,279.4 3,852.0 4,443.1 4,443.1 5,400.9
vi) Forestry and Wild Life 1,16,208.7 1,49,515.7 1,49,464.2 1,47,151.4 5,469.9 5,715.2 5,715.2 7,472.6
vii) Plantations - - - - - - - -
viii) Food Storage and Warehousing 3,45,532.5 4,73,149.1 4,73,260.9 5,33,238.1 418.7 2,155.1 2,155.1 3,197.2
ix) Agricultural Research and Education 12,706.2 13,249.7 13,249.7 13,630.0 304.0 263.2 263.2 366.5
x) Agricultural Finance Institutions - - - - - - - -
xi) Co-operation 15,919.6 24,658.0 3,25,897.0 1,75,849.3 1,408.7 1,830.7 1,830.7 2,342.1
xii) Other Agricultural Programmes 1,369.5 2,200.0 1,24,547.0 3,52,200.0 116.1 90.8 90.8 136.4
2. Rural Development 3,69,549.6 3,82,548.2 3,80,836.7 4,52,149.8 14,703.0 23,193.6 23,193.6 27,843.5
3. Special Area Programmes - - - - 747.1 1,190.4 1,190.4 1,158.2
4. Irrigation and Flood Control 53,445.1 48,746.9 46,835.4 46,138.5 16,260.7 16,895.7 16,895.7 18,015.7
of which:
i) Major and Medium Irrigation 45,900.6 35,603.8 34,152.2 36,516.5 8,628.0 7,215.8 7,215.8 8,152.4
ii) Minor Irrigation 7,250.4 12,672.4 12,268.8 9,184.6 4,575.7 5,472.3 5,472.3 5,850.1
iii) Flood Control and Drainage 294.1 470.7 414.3 437.4 1,686.0 2,950.0 2,950.0 2,490.0
5. Energy 2,63,518.5 3,59,301.0 3,62,575.0 3,34,334.0 1,67,118.8 1,70,762.8 1,70,762.8 1,78,510.6
of which: Power 2,59,957.0 3,53,988.0 3,57,262.0 3,28,349.0 1,67,033.0 1,70,038.2 1,70,038.2 1,77,768.9
6. Industry and Minerals (i to iii) 85,623.9 97,540.0 85,649.7 1,07,215.9 8,748.4 35,181.7 35,181.7 31,103.4
i) Village and Small Industries 16,952.8 22,513.4 21,813.3 23,309.8 1,951.0 10,032.6 10,032.6 8,092.7
ii) Industries@ 67,671.1 73,926.5 62,736.4 82,606.1 6,519.1 22,449.2 22,449.2 20,310.7
iii) Others** 1,000.0 1,100.0 1,100.0 1,300.0 278.3 2,700.0 2,700.0 2,700.0
Appendix II : Revenue Expenditure of States and Union Territories with Legislature (Contd.)
(₹ Lakh)

State Finances : A Study of Budgets of 2019-20
222
Item
CHHATTISGARH GOA
2017-18(Accounts)
2018-19(Budget
Estimates)
2018-19(Revised
Estimates)
2019-20(Budget
Estimates)
2017-18(Accounts)
2018-19(Budget
Estimates)
2018-19(Revised
Estimates)
2019-20(Budget
Estimates)
1 2 3 4 5 2 3 4 5
7. Transport and Communications (i + ii) 1,00,541.2 2,14,043.1 1,90,390.1 1,70,634.1 33,034.3 35,235.2 35,235.2 37,075.6
i) Roads and Bridges 94,308.9 2,00,148.2 1,81,506.1 1,58,488.6 15,147.0 15,087.9 15,087.9 12,527.4
ii) Others @@ 6,232.4 13,895.0 8,884.0 12,145.5 17,887.3 20,147.3 20,147.3 24,548.3
8. Science, Technology and Environment 833.3 1,821.0 1,821.0 2,320.0 2,656.5 9,015.9 9,015.9 3,762.5
9. General Economic Services (i to iv) 10,692.7 9,582.9 9,616.4 10,025.1 11,516.2 14,575.2 14,575.2 14,636.4
i) Secretariat - Economic Services 5,334.4 2,581.7 2,591.7 2,860.7 1,321.6 2,170.0 2,170.0 2,124.2
ii) Tourism 1,910.6 2,730.0 2,730.0 2,630.0 8,078.0 9,167.1 9,167.1 9,108.9
iii) Civil Supplies - - - - 816.0 1,245.8 1,245.8 1,276.8
iv) Others + 3,447.7 4,271.2 4,294.7 4,534.4 1,300.6 1,992.2 1,992.2 2,126.5
II. NON-DEVELOPMENTAL EXPENDITURE 12,87,041.2 16,62,080.6 15,79,378.5 17,52,276.9 3,51,975.3 3,52,805.3 3,52,805.3 4,25,084.2 (General Services) (A to F)
A. Organs of State 37,114.3 65,573.8 72,111.8 88,608.9 11,831.5 11,833.7 11,833.7 23,126.7
B. Fiscal Services (i + ii) 1,08,421.3 1,24,733.7 1,21,479.5 1,17,991.2 7,594.6 7,798.0 7,798.0 10,305.0
i) Collection of Taxes and Duties 1,08,415.6 1,24,733.7 1,21,479.5 1,17,991.2 7,592.9 7,785.5 7,785.5 10,299.0
ii) Other Fiscal Services 5.8 - - - 1.8 12.5 12.5 6.0
C. Interest Payments and Servicing of Debt (1 + 2)
3,29,832.8 4,06,754.7 4,10,808.7 4,96,399.5 1,27,428.5 1,42,213.7 1,42,213.7 1,54,232.2
1. Appropriation for Reduction or Avoidance of Debt
20,000.0 22,000.0 22,000.0 26,500.0 3,000.0 5,000.0 5,000.0 3,000.0
2. Interest Payments (i to iv) 3,09,832.8 3,84,754.7 3,88,808.7 4,69,899.5 1,24,428.5 1,37,213.7 1,37,213.7 1,51,232.2
i) Interest on Loans from the Centre 13,382.8 17,047.1 14,578.2 15,420.6 1,820.5 3,033.5 3,033.5 3,533.5
ii) Interest on Internal Debt 2,46,817.7 3,04,746.0 3,14,379.0 3,78,387.5 98,052.3 1,09,584.6 1,09,584.6 1,19,771.1
of which:
(a) Interest on Market Loans 1,68,185.3 2,18,737.0 2,32,448.0 2,96,236.5 66,877.5 73,420.7 73,420.7 86,047.2
(b) Interest on NSSF 57,225.9 60,000.0 57,500.0 55,000.0 26,524.9 29,940.0 29,940.0 27,500.0
iii) Interest on Small Savings, State Provident Funds, etc.
41,955.1 42,850.2 42,550.2 44,990.1 17,214.0 16,440.0 16,440.0 18,485.0
iv) Others 7,677.2 20,111.4 17,301.4 31,101.4 7,341.7 8,155.7 8,155.7 9,442.7
D. Administrative Services (i to v) 4,19,212.5 5,29,029.9 5,12,084.9 5,56,247.8 84,799.5 76,702.7 76,702.7 95,214.6
i) Secretariat - General Services 11,881.7 15,107.1 15,092.7 16,623.5 5,384.0 4,535.9 4,535.9 6,615.3
ii) District Administration 24,640.7 30,857.8 30,576.6 32,208.9 5,546.5 4,815.1 4,815.1 6,161.1
iii) Police 3,06,939.8 4,04,514.4 3,87,968.0 4,24,251.2 48,862.0 41,970.9 41,970.9 52,300.8
iv) Public Works 36,007.0 24,216.5 24,332.9 26,151.9 11,687.0 11,998.5 11,998.5 12,584.0
v) Others ++ 39,743.3 54,334.1 54,114.7 57,012.4 13,320.0 13,382.3 13,382.3 17,553.5
E. Pensions 3,92,357.7 5,35,955.5 4,62,860.5 4,92,995.5 1,16,358.5 1,09,618.0 1,09,618.0 1,37,600.0
F. Miscellaneous General Services 102.6 33.1 33.1 34.0 3,962.7 4,639.3 4,639.3 4,605.7
of which:
Payment on account of State Lotteries - - - - 80.3 106.9 106.9 103.5
III. Grants-in-Aid and Contributions 1,36,466.1 1,15,030.6 1,15,050.6 62,031.8 - - - -
of which:
Compensation and Assignments to Local Bodies and Panchayati Raj Institutions 1,36,466.1 1,15,030.6 1,15,050.6 62,031.8 - - - -
Appendix II : Revenue Expenditure of States and Union Territories with Legislature (Contd.)
(₹ Lakh)

Appendix II
223
Item
GUJARAT HARYANA
2017-18(Accounts)
2018-19(Budget
Estimates)
2018-19(Revised
Estimates)
2019-20(Budget
Estimates)
2017-18(Accounts)
2018-19(Budget
Estimates)
2018-19(Revised
Estimates)
2019-20(Budget
Estimates)
1 2 3 4 5 2 3 4 5
TOTAL EXPENDITURE (I+II+III) 1,18,05,966.0 1,34,63,330.0 1,39,15,306.0 1,51,85,799.0 73,25,735.6 85,18,652.8 85,33,480.9 94,24,190.5
I. DEVELOPMENTAL EXPENDITURE (A + B) 76,18,402.0 82,44,337.0 91,78,775.0 95,89,775.0 46,16,815.8 55,09,253.8 55,39,374.1 58,88,453.6
A. Social Services (1 to 12) 49,03,900.0 55,39,802.0 59,04,095.0 61,74,014.0 28,06,133.8 34,17,648.3 33,03,485.9 36,11,422.2
1. Education, Sports, Art and Culture 21,52,849.0 22,38,169.0 24,51,171.0 25,04,546.0 11,78,292.3 14,46,488.2 13,86,786.9 14,86,116.5
2. Medical and Public Health 5,57,590.0 5,96,110.0 6,38,745.0 6,91,267.0 2,90,363.3 3,77,461.6 3,55,147.7 4,16,836.4
3. Family Welfare 1,36,948.0 1,69,634.0 1,92,683.0 2,60,098.0 17,062.4 27,600.0 18,356.2 22,462.0
4. Water Supply and Sanitation 96,749.0 1,00,291.0 1,43,712.0 1,29,775.0 1,70,364.7 1,93,022.5 1,80,490.8 2,11,473.5
5. Housing 1,40,284.0 2,89,488.0 2,66,013.0 2,97,722.0 3,799.2 3,576.0 4,021.0 3,481.0
6. Urban Development 8,42,495.0 10,06,554.0 10,32,599.0 10,60,194.0 4,02,873.7 4,32,676.4 4,41,819.8 4,60,297.0
7. Welfare of Scheduled Castes, Scheduled Tribes and Other Backward Classes 3,51,066.0 4,03,395.0 4,04,531.0 4,38,410.0 39,630.5 72,250.6 50,019.0 50,880.7
8. Labour and Labour Welfare 1,52,402.0 1,39,883.0 1,14,955.0 1,18,540.0 51,730.0 78,997.1 80,107.8 93,346.7
9. Social Security and Welfare 96,042.0 1,16,380.0 1,26,747.0 2,04,362.0 5,72,992.0 6,99,441.4 6,92,162.7 7,90,938.5
10. Nutrition 2,42,691.0 3,66,191.0 3,06,723.0 3,44,631.0 13,979.7 42,570.2 29,759.3 33,851.5
11. Relief on account of Natural Calamities 1,13,328.0 88,371.0 2,00,899.0 97,184.0 51,197.2 23,580.5 27,508.4 21,104.7
12. Others* 21,456.0 25,336.0 25,317.0 27,285.0 13,848.8 19,984.0 37,306.3 20,633.7
B. Economic Services (1 to 9) 27,14,502.0 27,04,535.0 32,74,680.0 34,15,761.0 18,10,682.0 20,91,605.5 22,35,888.2 22,77,031.4
1. Agriculture and Allied Activities (i to xii) 7,80,151.0 6,75,831.0 8,90,867.0 7,34,058.0 2,73,470.9 4,55,372.9 4,46,372.5 4,74,011.6
i) Crop Husbandry 4,31,567.0 3,17,816.0 4,99,585.0 2,90,894.0 86,502.7 2,05,936.2 2,18,263.6 1,94,775.2
ii) Soil and Water Conservation 27,686.0 28,744.0 27,250.0 28,867.0 7,551.1 13,914.5 10,834.2 28,973.7
iii) Animal Husbandry 48,647.0 77,377.0 67,150.0 82,480.0 66,673.1 89,240.0 89,453.0 1,00,571.0
iv) Dairy Development 4,725.0 6,360.0 3,995.0 6,370.0 78.9 102.6 80.0 97.0
v) Fisheries 28,801.0 31,682.0 35,739.0 36,519.0 4,402.6 7,836.2 6,686.0 7,017.0
vi) Forestry and Wild Life 50,849.0 56,532.0 56,310.0 71,657.0 28,662.3 39,438.7 33,414.3 38,030.8
vii) Plantations - - - - - - - -
viii) Food Storage and Warehousing 5,417.0 7,451.0 6,389.0 7,221.0 10,722.7 20,299.3 19,316.3 21,459.1
ix) Agricultural Research and Education 76,202.0 70,394.0 74,524.0 70,182.0 35,935.8 48,208.2 38,809.0 49,725.5
x) Agricultural Finance Institutions - - - - - - - -
xi) Co-operation 1,05,214.0 77,430.0 1,18,236.0 1,38,157.0 32,829.0 30,250.7 29,367.1 33,205.5
xii) Other Agricultural Programmes 1,043.0 2,045.0 1,689.0 1,711.0 112.9 146.6 149.0 157.0
2. Rural Development 3,19,953.0 3,96,297.0 4,09,841.0 4,91,332.0 2,98,083.9 4,23,187.4 4,21,082.7 5,06,452.0
3. Special Area Programmes 7,939.0 9,222.0 9,131.0 9,570.0 - - - -
4. Irrigation and Flood Control 1,08,749.0 1,26,106.0 1,07,663.0 1,38,478.0 1,46,308.6 1,71,499.7 1,56,279.2 1,78,009.0
of which:
i) Major and Medium Irrigation 54,172.0 52,934.0 50,502.0 60,418.0 1,29,779.9 1,44,020.4 1,41,490.2 1,51,965.0
ii) Minor Irrigation 50,155.0 65,790.0 51,710.0 71,031.0 708.7 879.3 789.0 824.0
iii) Flood Control and Drainage 3,042.0 5,662.0 4,092.0 5,401.0 - - - -
5. Energy 5,82,038.0 5,53,998.0 7,62,687.0 9,07,430.0 7,63,152.0 6,58,609.4 8,27,785.6 7,33,816.0
of which: Power 5,79,459.0 5,43,285.0 7,37,099.0 7,93,058.0 7,60,306.1 6,48,066.0 8,12,028.0 6,87,840.0
6. Industry and Minerals (i to iii) 3,08,480.0 3,34,339.0 4,62,872.0 4,46,109.0 31,769.5 53,350.0 66,751.0 57,533.6
i) Village and Small Industries 1,62,000.0 1,27,881.0 1,78,580.0 1,46,138.0 9,967.9 28,612.1 19,754.0 28,285.5
ii) Industries@ 1,46,480.0 2,06,458.0 2,84,292.0 2,99,971.0 21,801.6 24,737.9 46,997.0 29,248.1
iii) Others** - - - - - - - -
Appendix II : Revenue Expenditure of States and Union Territories with Legislature (Contd.)
(₹ Lakh)

State Finances : A Study of Budgets of 2019-20
224
Item
GUJARAT HARYANA
2017-18(Accounts)
2018-19(Budget
Estimates)
2018-19(Revised
Estimates)
2019-20(Budget
Estimates)
2017-18(Accounts)
2018-19(Budget
Estimates)
2018-19(Revised
Estimates)
2019-20(Budget
Estimates)
1 2 3 4 5 2 3 4 5
7. Transport and Communications (i + ii) 4,69,629.0 4,55,393.0 4,90,168.0 4,44,192.0 2,90,244.5 3,17,171.0 3,06,247.4 3,14,657.4
i) Roads and Bridges 4,17,052.0 4,18,092.0 4,47,827.0 4,05,344.0 93,383.3 91,602.4 73,002.4 83,355.8
ii) Others @@ 52,577.0 37,301.0 42,341.0 38,848.0 1,96,861.2 2,25,568.6 2,33,245.0 2,31,301.6
8. Science, Technology and Environment 34,461.0 31,701.0 30,974.0 1,25,240.0 2,652.6 4,105.6 3,548.4 4,185.5
9. General Economic Services (i to iv) 1,03,102.0 1,21,648.0 1,10,477.0 1,19,352.0 5,000.0 8,309.6 7,821.6 8,366.2
i) Secretariat - Economic Services 11,326.0 14,852.0 12,855.0 14,979.0 2,167.9 3,702.1 3,056.0 3,945.0
ii) Tourism 8,430.0 8,596.0 7,519.0 11,330.0 282.9 397.8 1,569.7 912.0
iii) Civil Supplies 77,229.0 88,268.0 78,570.0 80,640.0 22.9 - 39.0 28.0
iv) Others + 6,117.0 9,932.0 11,533.0 12,403.0 2,526.2 4,209.8 3,157.0 3,481.2
II. NON-DEVELOPMENTAL EXPENDITURE 41,40,158.0 51,82,205.0 46,99,753.0 55,51,531.0 26,69,867.5 29,78,827.0 29,71,534.8 35,35,737.0 (General Services) (A to F)
A. Organs of State 1,22,884.0 1,35,599.0 1,43,479.0 1,62,194.0 93,406.5 1,12,989.7 1,08,917.9 1,45,661.5
B. Fiscal Services (i + ii) 72,581.0 87,886.0 81,301.0 91,329.0 43,286.7 55,030.9 60,294.2 66,627.2
i) Collection of Taxes and Duties 72,337.0 87,596.0 81,051.0 91,040.0 43,157.6 54,876.7 60,129.7 66,469.2
ii) Other Fiscal Services 244.0 290.0 250.0 289.0 129.2 154.2 164.5 158.0
C. Interest Payments and Servicing of Debt (1 + 2)
18,95,404.0 21,37,911.0 21,33,987.0 22,70,939.0 11,96,127.3 14,03,739.2 13,84,656.2 16,63,261.9
1. Appropriation for Reduction or Avoidance of Debt
- 1,20,000.0 1,00,000.0 1,20,000.0 - - - -
2. Interest Payments (i to iv) 18,95,404.0 20,17,911.0 20,33,987.0 21,50,939.0 11,96,127.3 14,03,739.2 13,84,656.2 16,63,261.9
i) Interest on Loans from the Centre 42,957.3 37,511.3 40,648.5 37,740.8 10,408.7 5,291.3 9,046.4 7,368.6
ii) Interest on Internal Debt 16,74,764.1 17,95,153.2 17,75,502.8 19,19,910.2 10,60,274.4 12,57,822.3 12,29,524.3 14,94,526.6
of which:
(a) Interest on Market Loans 11,56,519.8 12,96,760.2 12,75,892.7 14,48,201.9 6,96,647.2 8,97,673.7 8,44,979.6 11,15,415.6
(b) Interest on NSSF 4,47,778.3 4,14,250.9 4,14,250.9 3,79,935.3 1,18,525.3 1,08,053.0 1,09,453.8 99,994.9
iii) Interest on Small Savings, State Provident Funds, etc.
78,735.4 90,933.0 88,712.0 85,854.0 1,09,353.1 1,19,219.0 1,20,018.0 1,31,770.0
iv) Others 98,947.3 94,313.5 1,29,123.7 1,07,434.0 16,091.2 21,406.5 26,067.5 29,596.6
D. Administrative Services (i to v) 6,47,827.0 6,41,265.0 7,60,198.0 7,31,129.0 4,57,275.5 5,51,687.8 5,69,550.8 5,93,433.0
i) Secretariat - General Services 41,140.0 48,947.0 44,434.0 49,062.0 14,824.9 17,486.6 16,878.6 17,209.0
ii) District Administration 44,950.0 54,740.0 52,759.0 55,764.0 19,527.2 21,537.2 21,527.0 24,126.0
iii) Police 4,42,757.0 4,21,838.0 5,21,253.0 4,97,476.0 3,57,569.5 4,27,697.6 4,43,857.0 4,63,270.0
iv) Public Works 32,724.0 27,774.0 44,947.0 33,776.0 16,504.2 25,491.3 23,171.4 27,501.0
v) Others ++ 86,256.0 87,966.0 96,805.0 95,051.0 48,849.7 59,475.1 64,116.8 61,327.0
E. Pensions 13,97,881.0 14,76,755.0 15,75,470.0 15,42,334.0 8,78,313.5 8,30,122.0 8,30,122.0 9,00,001.0
F. Miscellaneous General Services 3,581.0 7,02,789.0 5,318.0 7,53,606.0 1,458.0 25,257.5 17,993.6 1,66,752.3
of which:
Payment on account of State Lotteries - - - - - - - -
III. Grants-in-Aid and Contributions 47,406.0 36,788.0 36,778.0 44,493.0 39,052.4 30,572.0 22,572.0 -
of which:
Compensation and Assignments to Local Bodies and Panchayati Raj Institutions 47,406.0 36,788.0 36,778.0 44,493.0 39,052.4 30,572.0 22,572.0 -
Appendix II : Revenue Expenditure of States and Union Territories with Legislature (Contd.)
(₹ Lakh)

Appendix II
225
Item
HIMACHAL PRADESH JAMMU AND KASHMIR
2017-18(Accounts)
2018-19(Budget
Estimates)
2018-19(Revised
Estimates)
2019-20(Budget
Estimates)
2017-18(Accounts)
2018-19(Budget
Estimates)
2018-19(Revised
Estimates)
2019-20(Budget
Estimates)
1 2 3 4 5 2 3 4 5
TOTAL EXPENDITURE (I+II+III) 27,05,315.9 33,56,796.3 33,40,818.5 36,08,903.0 40,91,649.5 50,56,008.0 58,21,526.6 57,68,889.4
I. DEVELOPMENTAL EXPENDITURE (A + B) 16,03,332.2 20,55,456.6 20,61,661.2 21,72,693.2 24,02,828.3 27,75,315.7 35,16,422.8 33,86,636.0
A. Social Services (1 to 12) 10,33,654.9 12,85,164.7 13,16,702.4 13,89,512.6 13,11,697.2 15,06,337.7 20,35,493.3 19,63,342.1
1. Education, Sports, Art and Culture 5,69,910.6 6,97,349.9 6,98,106.8 7,54,322.5 6,97,515.8 7,95,042.3 11,56,704.1 11,22,782.5
2. Medical and Public Health 1,40,200.1 1,76,295.8 1,74,210.8 1,96,020.1 2,40,674.8 2,75,405.3 3,60,096.0 3,60,949.6
3. Family Welfare 34,097.1 51,344.2 54,626.5 56,006.6 16,038.2 4,107.9 10,462.9 10,339.9
4. Water Supply and Sanitation 98,289.3 1,21,272.9 1,16,428.7 1,18,048.7 1,29,986.9 1,20,918.9 1,57,135.5 1,50,246.9
5. Housing 11,756.9 11,556.7 12,264.0 9,537.6 9,974.4 9,039.8 12,337.8 10,079.0
6. Urban Development 23,850.8 45,354.9 59,374.2 56,194.4 70,293.5 71,311.5 74,497.0 73,248.4
7. Welfare of Scheduled Castes, Scheduled Tribes and Other Backward Classes 5,614.8 7,579.6 6,862.1 7,948.8 10,876.2 9,390.1 10,609.7 11,140.1
8. Labour and Labour Welfare 15,588.9 23,133.1 27,329.8 24,132.2 3,520.7 6,848.8 7,603.7 7,122.0
9. Social Security and Welfare 87,438.9 1,07,747.3 1,13,679.6 1,21,855.4 1,04,246.8 1,05,369.1 1,12,595.5 83,636.9
10. Nutrition 7,339.8 8,161.0 8,501.0 8,176.0 7,034.1 67,870.1 90,447.5 89,623.1
11. Relief on account of Natural Calamities 32,425.6 27,300.3 36,996.5 28,700.0 13,519.4 29,683.8 29,690.9 31,095.4
12. Others* 7,142.1 8,069.0 8,322.4 8,570.3 8,016.6 11,350.0 13,312.6 13,078.4
B. Economic Services (1 to 9) 5,69,677.2 7,70,291.9 7,44,958.8 7,83,180.6 10,91,131.2 12,68,978.1 14,80,929.5 14,23,293.8
1. Agriculture and Allied Activities (i to xii) 1,79,954.9 2,40,782.0 2,40,715.0 2,47,609.3 2,03,233.6 2,38,058.9 3,33,375.4 3,25,793.0
i) Crop Husbandry 45,351.6 79,012.1 76,123.8 75,044.0 41,996.4 54,453.4 69,354.8 69,171.9
ii) Soil and Water Conservation 6,873.1 9,313.5 8,819.9 9,652.4 6,165.3 7,763.1 9,398.2 8,841.4
iii) Animal Husbandry 31,779.7 40,063.9 42,725.9 41,296.0 40,195.0 50,236.7 59,259.7 63,019.0
iv) Dairy Development 1,703.5 2,261.3 3,461.3 2,563.6 - - - -
v) Fisheries 1,767.5 2,528.1 2,587.3 2,904.2 6,858.9 7,108.9 10,558.1 9,421.9
vi) Forestry and Wild Life 40,284.5 60,772.9 50,180.4 65,801.8 60,705.0 65,065.3 84,525.6 79,373.3
vii) Plantations 132.9 165.5 137.9 173.1 - - - -
viii) Food Storage and Warehousing 22,750.2 24,787.3 27,971.8 25,932.1 15,984.9 16,852.8 21,494.7 19,077.1
ix) Agricultural Research and Education 25,143.0 16,782.0 22,011.9 19,125.0 24,388.6 26,882.6 68,344.2 65,297.9
x) Agricultural Finance Institutions - - - - - - - -
xi) Co-operation 3,169.0 3,595.4 5,194.9 3,617.2 3,981.1 6,443.6 5,948.6 7,245.9
xii) Other Agricultural Programmes 1,000.0 1,500.0 1,500.0 1,500.0 2,958.4 3,252.7 4,491.6 4,344.7
2. Rural Development 92,179.0 1,78,665.1 1,41,061.3 1,70,412.2 36,385.1 42,760.9 46,719.2 43,087.5
3. Special Area Programmes - - - - 59,568.6 4,704.9 5,365.4 4,972.4
4. Irrigation and Flood Control 45,048.5 48,875.4 49,143.1 50,848.7 52,194.7 66,798.9 82,229.8 76,137.2
of which:
i) Major and Medium Irrigation 4,195.2 2,637.4 2,750.9 2,613.2 7,261.7 10,068.1 9,939.0 9,803.8
ii) Minor Irrigation 40,253.8 45,703.9 45,858.0 47,650.1 32,837.3 41,880.0 55,057.4 49,837.2
iii) Flood Control and Drainage 599.5 534.2 534.2 585.5 9,402.2 11,403.7 12,696.9 12,177.9
5. Energy 37,260.4 53,862.3 63,672.6 49,957.5 5,06,191.0 8,28,105.0 9,08,492.9 8,72,546.8
of which: Power 36,771.8 53,296.9 63,188.2 49,360.0 5,06,191.0 8,28,105.0 9,08,492.9 8,72,546.8
6. Industry and Minerals (i to iii) 10,581.1 20,984.6 21,658.5 25,286.2 32,662.3 41,951.6 49,459.9 49,730.7
i) Village and Small Industries 9,048.6 19,240.2 18,559.1 22,037.2 28,988.1 36,237.8 42,806.5 43,415.8
ii) Industries@ 1,532.5 1,744.4 3,099.4 3,249.1 3,674.2 5,713.9 6,653.4 6,315.0
iii) Others** - - - - - - - -
Appendix II : Revenue Expenditure of States and Union Territories with Legislature (Contd.)
(₹ Lakh)

State Finances : A Study of Budgets of 2019-20
226
Item
HIMACHAL PRADESH JAMMU AND KASHMIR
2017-18(Accounts)
2018-19(Budget
Estimates)
2018-19(Revised
Estimates)
2019-20(Budget
Estimates)
2017-18(Accounts)
2018-19(Budget
Estimates)
2018-19(Revised
Estimates)
2019-20(Budget
Estimates)
1 2 3 4 5 2 3 4 5
7. Transport and Communications (i + ii) 1,81,441.4 2,08,086.5 2,07,279.5 2,19,616.6 1,33,389.9 11,721.4 12,479.6 11,901.8
i) Roads and Bridges 1,49,936.3 1,82,389.3 1,75,486.6 1,93,285.1 1,33,389.9 11,721.4 12,479.6 11,901.8
ii) Others @@ 31,505.0 25,697.2 31,793.0 26,331.5 - - - -
8. Science, Technology and Environment 1,223.3 1,345.6 1,467.9 1,696.5 3,074.2 4,464.1 4,464.6 4,288.7
9. General Economic Services (i to iv) 21,988.6 17,690.6 19,960.8 17,753.6 64,431.8 30,412.5 38,342.7 34,835.7
i) Secretariat - Economic Services 5,557.5 5,775.0 5,219.2 5,714.2 44,920.5 7,169.1 9,624.4 8,839.6
ii) Tourism 14,013.6 8,685.2 11,672.1 8,726.7 13,194.0 14,442.3 16,460.3 15,347.2
iii) Civil Supplies 1,165.5 1,543.5 1,448.3 1,486.2 - - - -
iv) Others + 1,252.0 1,687.0 1,621.3 1,826.6 6,317.3 8,801.2 12,258.0 10,648.8
II. NON-DEVELOPMENTAL EXPENDITURE 11,00,954.3 13,00,258.0 12,78,218.2 14,35,128.1 16,88,821.1 22,80,692.3 23,05,103.8 23,82,253.5 (General Services) (A to F)
A. Organs of State 31,853.5 31,838.4 32,591.8 37,802.9 31,348.0 40,390.6 70,792.0 55,317.7
B. Fiscal Services (i + ii) 24,539.0 31,036.3 32,225.9 32,972.8 28,095.1 1,18,169.8 61,396.8 31,303.1
i) Collection of Taxes and Duties 24,415.9 30,876.2 32,075.0 32,798.5 27,984.1 1,16,637.3 60,427.0 29,569.6
ii) Other Fiscal Services 123.1 160.1 150.9 174.3 111.0 1,532.5 969.8 1,733.5
C. Interest Payments and Servicing of Debt (1 + 2)
3,78,822.1 4,26,000.0 4,10,000.0 4,55,200.0 4,71,366.1 4,76,705.0 5,76,171.0 6,98,038.8
1. Appropriation for Reduction or Avoidance of Debt
- - - 200.0 5,079.0 4,227.0 9,705.0 3,926.8
2. Interest Payments (i to iv) 3,78,822.1 4,26,000.0 4,10,000.0 4,55,000.0 4,66,287.1 4,72,478.0 5,66,466.0 6,94,112.0
i) Interest on Loans from the Centre 8,673.2 8,029.8 8,702.9 8,003.9 8,805.9 7,883.0 8,180.0 7,595.0
ii) Interest on Internal Debt 2,74,198.0 3,09,109.2 2,87,110.6 3,16,996.1 2,95,533.9 2,94,485.0 2,97,054.0 3,07,701.0
of which:
(a) Interest on Market Loans 1,63,679.0 2,03,727.3 1,83,224.8 2,17,141.9 1,95,255.8 2,29,401.0 2,31,970.0 2,46,434.0
(b) Interest on NSSF 68,232.4 63,300.1 63,300.1 58,144.3 40,668.4 37,011.0 37,011.0 34,242.0
iii) Interest on Small Savings, State Provident Funds, etc.
95,950.9 1,08,861.0 1,14,186.6 1,30,000.0 1,46,481.4 1,30,181.0 2,00,900.0 2,38,392.0
iv) Others - - - - 15,465.9 39,929.0 60,332.0 1,40,424.0
D. Administrative Services (i to v) 1,92,202.2 2,19,489.2 2,21,069.5 2,40,489.4 6,17,045.3 11,35,312.4 10,16,624.2 9,59,477.4
i) Secretariat - General Services 8,207.4 9,957.3 8,518.5 10,904.0 8,533.8 10,932.1 15,914.7 14,478.0
ii) District Administration 20,713.4 22,030.1 22,593.4 24,290.2 17,526.6 52,439.9 59,423.9 63,480.4
iii) Police 1,04,938.0 1,24,613.2 1,24,468.0 1,36,019.4 4,80,806.6 5,30,508.6 7,63,790.1 6,69,658.9
iv) Public Works 30,962.0 36,857.4 36,882.5 41,153.5 52,308.1 67,199.6 81,433.0 73,876.1
v) Others ++ 27,381.5 26,031.3 28,607.1 28,122.3 57,870.2 4,74,232.2 96,062.6 1,37,984.1
E. Pensions 4,70,884.9 5,89,293.0 5,79,493.0 6,66,042.0 5,40,831.7 5,10,000.0 5,80,000.0 6,38,000.0
F. Miscellaneous General Services 2,652.6 2,601.1 2,838.0 2,621.1 135.0 114.5 119.9 116.5
of which:
Payment on account of State Lotteries - - - - 35.0 - - -
III. Grants-in-Aid and Contributions 1,029.5 1,081.7 939.1 1,081.7 - - - -
of which:
Compensation and Assignments to Local Bodies and Panchayati Raj Institutions 1,029.5 1,081.7 939.1 1,081.7 - - - -
Appendix II : Revenue Expenditure of States and Union Territories with Legislature (Contd.)
(₹ Lakh)

Appendix II
227
Item
JHARKHAND KARNATAKA
2017-18(Accounts)
2018-19(Budget
Estimates)
2018-19(Revised
Estimates)
2019-20(Budget
Estimates)
2017-18(Accounts)
2018-19(Budget
Estimates)
2018-19(Revised
Estimates)
2019-20(Budget
Estimates)
1 2 3 4 5 2 3 4 5
TOTAL EXPENDITURE (I+II+III) 50,95,040.4 62,74,444.1 62,51,341.5 65,80,299.7 1,42,48,233.0 1,66,28,960.0 1,65,70,289.1 1,81,60,499.8
I. DEVELOPMENTAL EXPENDITURE (A + B) 34,39,207.7 44,19,702.8 43,94,996.1 47,50,578.6 1,01,50,813.0 1,14,37,805.0 1,15,28,009.2 1,24,25,722.4
A. Social Services (1 to 12) 19,57,446.4 24,96,195.2 24,85,158.5 26,58,546.6 58,65,235.1 70,22,624.0 69,54,719.7 71,35,041.5
1. Education, Sports, Art and Culture 7,96,523.7 10,74,026.3 10,76,947.6 11,20,343.6 21,30,680.5 25,26,481.0 25,08,696.7 26,52,229.6
2. Medical and Public Health 2,45,817.1 3,39,101.8 3,43,311.7 3,54,170.9 6,35,408.1 7,36,432.0 7,59,216.2 7,80,212.2
3. Family Welfare 9,054.5 10,627.9 10,652.5 307.9 63,053.9 1,00,215.0 1,00,215.0 82,724.4
4. Water Supply and Sanitation 1,76,178.1 1,76,920.8 1,83,052.7 1,80,426.3 4,75,590.0 3,74,288.0 3,20,498.6 2,38,868.9
5. Housing 1,238.2 3,215.0 3,215.0 2,100.0 4,12,931.7 3,43,350.0 2,92,467.0 2,52,853.0
6. Urban Development 2,90,960.3 2,80,002.3 2,71,519.5 2,91,036.4 2,82,667.8 2,56,182.0 2,54,810.8 2,35,268.4
7. Welfare of Scheduled Castes, Scheduled Tribes and Other Backward Classes 1,08,496.8 1,58,055.9 1,36,317.8 1,61,166.3 8,54,600.5 8,59,327.0 8,57,425.6 8,23,779.4
8. Labour and Labour Welfare 11,089.6 19,063.6 17,617.3 20,836.8 56,656.4 60,851.0 64,309.3 65,581.5
9. Social Security and Welfare 2,03,644.7 2,58,486.1 2,62,084.3 3,50,533.3 6,16,760.9 14,51,469.0 14,63,027.6 16,93,886.8
10. Nutrition 51,515.1 86,160.0 70,852.0 84,338.0 1,37,641.6 2,15,605.0 2,15,584.0 2,15,042.0
11. Relief on account of Natural Calamities 41,202.6 71,086.4 90,563.3 71,690.8 1,24,508.6 58,538.0 79,538.0 55,637.0
12. Others* 21,725.9 19,449.1 19,024.8 21,596.3 74,735.1 39,886.0 38,930.9 38,958.2
B. Economic Services (1 to 9) 14,81,761.3 19,23,507.7 19,09,837.6 20,92,032.1 42,85,577.9 44,15,181.0 45,73,289.5 52,90,680.9
1. Agriculture and Allied Activities (i to xii) 2,01,569.2 3,16,878.6 3,07,204.2 4,78,639.0 14,52,127.8 16,10,915.0 17,86,604.8 21,60,894.0
i) Crop Husbandry 53,168.0 1,18,796.4 1,14,494.9 2,90,741.8 4,64,162.0 5,70,045.0 4,96,395.1 5,10,654.8
ii) Soil and Water Conservation 11,315.4 11,671.2 11,679.3 16,633.3 52,678.8 47,957.0 45,983.3 26,584.0
iii) Animal Husbandry 21,320.2 35,956.3 34,839.4 26,087.4 91,898.1 1,04,033.0 1,07,156.9 1,04,811.5
iv) Dairy Development 17,546.9 31,920.6 28,988.5 24,309.3 1,18,766.1 1,21,702.0 1,21,713.1 1,46,801.0
v) Fisheries 5,721.4 8,286.6 7,298.6 7,310.4 27,855.3 21,817.0 24,228.7 23,470.1
vi) Forestry and Wild Life 58,540.6 69,520.7 69,352.3 72,219.4 1,90,057.1 1,71,694.0 1,72,960.8 1,39,630.6
vii) Plantations - - - - - - - -
viii) Food Storage and Warehousing - - - - 2,60,399.0 3,77,494.0 3,65,494.0 3,95,034.0
ix) Agricultural Research and Education 18,524.6 16,833.7 16,836.2 12,789.9 75,308.0 60,698.0 60,698.0 66,908.9
x) Agricultural Finance Institutions - - - - - - - -
xi) Co-operation 15,163.4 23,358.7 22,358.7 26,188.5 1,71,003.5 1,35,475.0 3,91,975.0 7,46,999.0
xii) Other Agricultural Programmes 268.6 534.5 1,356.3 2,358.9 - - - -
2. Rural Development 6,04,487.3 9,04,972.3 8,88,913.0 9,49,562.7 5,20,949.4 6,90,332.0 6,91,780.4 7,77,621.3
3. Special Area Programmes - - - - 50,637.9 30,648.0 30,648.0 30,373.0
4. Irrigation and Flood Control 39,819.4 51,790.3 51,764.6 51,119.3 1,84,543.9 2,30,977.0 2,16,775.0 2,56,057.2
of which:
i) Major and Medium Irrigation 30,910.1 40,378.2 40,350.8 39,910.8 1,37,946.5 1,83,063.0 1,70,561.0 2,08,348.0
ii) Minor Irrigation 8,313.1 11,387.2 11,388.8 11,183.5 25,645.9 29,424.0 28,424.0 32,255.4
iii) Flood Control and Drainage - 25.0 25.0 25.0 50.0 60.0 60.0 60.0
5. Energy 4,53,011.3 3,92,088.2 4,02,916.2 3,47,058.5 9,40,261.3 10,07,506.0 10,07,006.0 12,26,959.7
of which: Power 4,29,122.3 3,72,088.2 3,82,916.2 3,31,558.5 9,39,462.0 10,06,635.0 10,06,135.0 12,26,410.7
6. Industry and Minerals (i to iii) 26,482.6 53,450.2 52,900.8 48,925.3 1,25,448.1 1,22,732.0 1,19,690.0 1,49,301.1
i) Village and Small Industries 9,752.2 15,516.6 15,576.2 18,331.4 91,072.9 87,789.0 85,689.0 1,01,253.6
ii) Industries@ 16,730.4 37,933.6 37,324.6 30,593.9 34,375.2 34,943.0 34,001.0 48,047.5
iii) Others** - - - - - - - -
Appendix II : Revenue Expenditure of States and Union Territories with Legislature (Contd.)
(₹ Lakh)

State Finances : A Study of Budgets of 2019-20
228
Item
JHARKHAND KARNATAKA
2017-18(Accounts)
2018-19(Budget
Estimates)
2018-19(Revised
Estimates)
2019-20(Budget
Estimates)
2017-18(Accounts)
2018-19(Budget
Estimates)
2018-19(Revised
Estimates)
2019-20(Budget
Estimates)
1 2 3 4 5 2 3 4 5
7. Transport and Communications (i + ii) 53,093.2 58,808.5 58,819.4 64,413.3 4,96,953.2 3,54,808.0 3,62,690.9 3,77,351.4
i) Roads and Bridges 28,414.4 45,679.3 45,682.6 42,088.9 3,85,747.3 2,47,291.0 2,45,173.9 2,65,829.4
ii) Others @@ 24,678.8 13,129.3 13,136.8 22,324.4 1,11,205.9 1,07,517.0 1,17,517.0 1,11,522.0
8. Science, Technology and Environment - - - - 9,580.6 8,823.0 9,254.4 7,505.4
9. General Economic Services (i to iv) 1,03,298.2 1,45,519.6 1,47,319.4 1,52,314.0 5,05,075.7 3,58,440.0 3,48,840.0 3,04,617.8
i) Secretariat - Economic Services 5,261.8 6,058.3 6,212.5 5,951.1 49,460.6 41,342.0 41,642.0 35,426.4
ii) Tourism 4,489.2 5,136.1 5,136.1 8,944.4 20,123.2 20,606.0 15,106.0 11,770.0
iii) Civil Supplies 91,108.6 1,30,273.2 1,31,403.5 1,33,327.9 6,225.5 6,784.0 2,384.0 2,602.0
iv) Others + 2,438.7 4,052.0 4,567.3 4,090.6 4,29,266.4 2,89,708.0 2,89,708.0 2,54,819.5
II. NON-DEVELOPMENTAL EXPENDITURE 16,55,832.7 18,54,726.3 18,56,330.4 18,29,706.0 34,48,443.7 45,74,434.0 44,51,106.9 50,49,161.4 (General Services) (A to F)
A. Organs of State 54,289.8 65,244.3 74,543.4 67,281.5 1,15,081.5 2,08,457.0 2,15,194.0 1,82,556.9
B. Fiscal Services (i + ii) 43,290.2 51,197.2 52,174.9 63,915.1 1,17,019.0 1,31,110.0 1,30,517.3 1,64,554.8
i) Collection of Taxes and Duties 43,060.1 50,910.5 51,839.3 63,595.7 1,16,160.8 1,30,148.0 1,29,538.0 1,63,365.8
ii) Other Fiscal Services 230.1 286.7 335.6 319.3 858.2 962.0 979.3 1,189.0
C. Interest Payments and Servicing of Debt (1 + 2)
4,66,168.3 5,88,604.0 5,53,504.0 5,46,723.0 13,92,958.1 16,55,858.0 15,94,598.0 19,41,031.0
1. Appropriation for Reduction or Avoidance of Debt
- 25,500.0 6,200.0 28,016.0 - 35,000.0 35,000.0 35,000.0
2. Interest Payments (i to iv) 4,66,168.3 5,63,104.0 5,47,304.0 5,18,707.0 13,92,958.1 16,20,858.0 15,59,598.0 19,06,031.0
i) Interest on Loans from the Centre 11,618.4 16,720.0 16,720.0 13,659.0 65,227.8 81,969.0 80,819.0 76,710.0
ii) Interest on Internal Debt 4,33,004.9 5,16,550.0 5,16,550.0 4,79,824.0 11,19,604.9 12,86,459.0 12,37,311.0 15,41,652.0
of which:
(a) Interest on Market Loans 2,65,848.6 3,15,200.0 3,15,200.0 2,79,500.0 8,92,800.0 10,73,205.0 10,24,922.0 13,43,614.0
(b) Interest on NSSF 99,406.6 87,440.0 87,440.0 80,124.0 1,94,180.0 1,78,962.0 1,78,962.0 1,63,527.0
iii) Interest on Small Savings, State Provident Funds, etc.
21,367.6 28,502.0 28,502.0 23,502.0 2,08,117.0 2,52,108.0 2,41,146.0 2,87,656.0
iv) Others 177.3 1,332.0 -14,468.0 1,722.0 8.3 322.0 322.0 13.0
D. Administrative Services (i to v) 5,00,307.7 5,89,929.0 6,14,356.4 5,74,944.4 6,41,657.3 7,85,386.0 7,47,009.6 8,23,920.6
i) Secretariat - General Services 9,723.6 12,404.1 12,594.4 12,917.2 20,481.6 26,991.0 26,780.2 24,365.0
ii) District Administration 47,056.2 82,504.6 92,976.1 50,114.7 38,193.4 52,038.0 50,138.0 45,815.7
iii) Police 3,95,645.1 4,34,860.3 4,47,390.8 4,57,178.0 4,22,149.9 4,79,923.0 4,84,011.2 5,39,608.1
iv) Public Works 14,287.8 19,431.8 19,431.8 16,237.6 76,253.5 92,727.0 88,530.9 95,190.8
v) Others ++ 33,595.1 40,728.4 41,963.3 38,496.8 84,578.8 1,33,707.0 97,549.3 1,18,941.0
E. Pensions 5,91,324.1 5,59,551.7 5,61,551.7 5,76,192.1 11,68,374.9 17,80,120.0 17,50,285.0 19,23,584.0
F. Miscellaneous General Services 452.7 200.0 200.0 650.0 13,353.0 13,503.0 13,503.0 13,514.0
of which:
Payment on account of State Lotteries - - - - - - - -
III. Grants-in-Aid and Contributions - 15.0 15.0 15.0 6,48,976.3 6,16,721.0 5,91,173.0 6,85,616.0
of which:
Compensation and Assignments to Local Bodies and Panchayati Raj Institutions - 15.0 15.0 15.0 6,48,976.3 6,16,721.0 5,91,173.0 6,85,616.0
Appendix II : Revenue Expenditure of States and Union Territories with Legislature (Contd.)
(₹ Lakh)

Appendix II
229
Item
KERALA MADHYA PRADESH
2017-18(Accounts)
2018-19(Budget
Estimates)
2018-19(Revised
Estimates)
2019-20(Budget
Estimates)
2017-18(Accounts)
2018-19(Budget
Estimates)
2018-19(Revised
Estimates)
2019-20(Budget
Estimates)
1 2 3 4 5 2 3 4 5
TOTAL EXPENDITURE (I+II+III) 99,94,835.4 1,15,66,104.5 1,13,03,356.7 1,24,12,499.7 1,30,24,608.8 1,55,62,391.8 1,51,02,246.0 1,78,62,112.0
I. DEVELOPMENTAL EXPENDITURE (A + B) 47,22,735.2 56,01,867.2 52,83,149.3 57,34,441.6 91,08,076.3 1,07,79,672.3 1,04,70,578.7 1,25,94,970.3
A. Social Services (1 to 12) 35,87,627.1 38,81,700.7 39,06,271.5 38,82,118.4 58,34,617.4 62,97,398.9 61,46,830.0 72,67,188.0
1. Education, Sports, Art and Culture 18,51,486.0 19,99,150.1 19,24,190.0 20,57,266.6 23,65,343.8 26,98,699.6 27,58,615.5 30,29,592.8
2. Medical and Public Health 5,59,925.1 6,26,797.9 6,21,074.2 6,38,409.2 6,00,567.5 6,46,280.4 6,25,679.3 8,80,621.4
3. Family Welfare 57,515.1 52,798.0 51,541.6 51,935.9 40,320.6 55,566.7 48,984.5 54,525.2
4. Water Supply and Sanitation 69,760.9 45,246.8 43,750.8 50,514.6 3,08,289.0 3,10,087.1 1,72,185.6 1,36,515.7
5. Housing 8,083.5 12,581.3 11,309.8 12,227.6 8,55,063.7 7,30,765.3 6,47,189.9 7,25,857.6
6. Urban Development -4,117.7 2,60,185.5 1,90,438.9 1,97,095.3 5,68,392.7 4,80,248.9 5,72,827.2 8,57,275.0
7. Welfare of Scheduled Castes, Scheduled Tribes and Other Backward Classes 2,80,376.6 2,93,383.7 2,53,064.8 3,00,362.2 3,35,673.3 4,14,885.9 3,97,730.3 4,40,185.0
8. Labour and Labour Welfare 97,665.8 1,09,111.5 1,26,928.9 1,36,108.9 35,603.7 73,345.1 88,519.9 1,33,553.9
9. Social Security and Welfare 6,12,550.6 4,38,656.2 3,50,564.0 3,92,985.5 4,25,620.4 5,13,424.3 4,95,562.6 6,65,696.8
10. Nutrition 69.7 96.0 97.5 87.7 1,27,042.5 1,79,363.1 1,34,357.0 1,57,932.9
11. Relief on account of Natural Calamities 37,603.1 23,000.0 3,13,524.0 24,000.0 1,13,111.5 1,29,473.0 1,39,309.8 1,31,698.3
12. Others* 16,708.5 20,694.0 19,787.2 21,124.9 59,588.9 65,259.8 65,868.3 53,733.6
B. Economic Services (1 to 9) 11,35,108.0 17,20,166.4 13,76,877.8 18,52,323.3 32,73,458.9 44,82,273.4 43,23,748.8 53,27,782.3
1. Agriculture and Allied Activities (i to xii) 5,52,845.8 7,27,218.3 6,59,066.2 7,43,069.9 11,92,816.4 16,34,442.6 20,69,695.0 22,59,208.6
i) Crop Husbandry 1,66,776.4 1,91,132.0 1,91,009.8 1,92,353.4 5,78,437.4 10,13,964.1 15,00,389.9 16,37,805.5
ii) Soil and Water Conservation 11,710.2 13,682.2 12,197.3 13,462.1 6,266.3 8,724.6 7,482.8 8,843.4
iii) Animal Husbandry 51,811.5 71,593.4 61,751.7 71,478.3 78,905.2 1,02,334.6 1,05,731.8 1,18,752.0
iv) Dairy Development 17,796.5 17,619.8 15,118.4 17,909.1 - - - -
v) Fisheries 21,206.8 39,937.6 39,198.2 46,674.1 6,771.7 9,130.3 9,314.2 10,294.6
vi) Forestry and Wild Life 52,119.1 59,416.8 56,541.6 57,142.0 1,74,375.6 2,08,490.7 1,83,686.9 1,79,328.3
vii) Plantations - - - - - - - -
viii) Food Storage and Warehousing 1,35,216.9 1,67,375.8 1,54,598.6 1,74,390.2 1,55,839.9 1,33,463.5 1,69,287.8 1,51,651.7
ix) Agricultural Research and Education 52,381.8 65,235.4 57,721.1 69,255.5 18,188.3 19,193.3 19,183.5 16,256.9
x) Agricultural Finance Institutions - - - - - - - -
xi) Co-operation 24,518.3 44,194.2 36,533.6 44,143.7 1,74,031.9 1,39,141.4 74,618.2 1,36,276.3
xii) Other Agricultural Programmes 19,308.2 57,031.1 34,395.9 56,261.4 - - - -
2. Rural Development 1,44,545.0 4,47,774.1 1,89,835.5 4,70,044.2 6,82,057.6 8,70,828.4 7,98,453.7 10,15,007.5
3. Special Area Programmes -546.5 12,608.0 7,936.2 9,373.0 - - - -
4. Irrigation and Flood Control 59,614.2 58,828.1 60,968.9 59,289.7 64,532.8 91,624.5 82,359.0 1,07,924.3
of which:
i) Major and Medium Irrigation 31,329.4 32,559.5 32,915.2 32,545.3 46,818.3 67,132.6 60,623.2 86,351.3
ii) Minor Irrigation 23,054.5 21,374.4 23,108.1 21,643.7 16,898.4 22,123.6 19,332.6 19,326.3
iii) Flood Control and Drainage 5,324.9 4,894.2 4,904.3 5,100.8 - - - -
5. Energy 11,539.6 15,370.0 11,459.5 48,254.8 9,75,326.1 14,03,388.3 10,45,364.3 14,95,343.8
of which: Power 6,457.2 8,120.0 6,730.1 41,238.0 9,60,216.7 13,90,998.0 10,24,501.1 14,68,212.8
6. Industry and Minerals (i to iii) 61,162.7 60,034.4 55,745.2 61,310.4 1,95,994.5 2,64,645.8 1,54,568.2 2,78,518.3
i) Village and Small Industries 46,614.4 54,783.5 49,274.1 55,412.1 98,538.2 1,01,583.0 98,813.1 96,833.9
ii) Industries@ 13,638.8 4,440.9 6,371.2 4,598.3 97,456.3 1,63,062.8 55,755.1 1,81,684.4
iii) Others** 909.5 810.0 100.0 1,300.0 - - - -
Appendix II : Revenue Expenditure of States and Union Territories with Legislature (Contd.)
(₹ Lakh)

State Finances : A Study of Budgets of 2019-20
230
Item
KERALA MADHYA PRADESH
2017-18(Accounts)
2018-19(Budget
Estimates)
2018-19(Revised
Estimates)
2019-20(Budget
Estimates)
2017-18(Accounts)
2018-19(Budget
Estimates)
2018-19(Revised
Estimates)
2019-20(Budget
Estimates)
1 2 3 4 5 2 3 4 5
7. Transport and Communications (i + ii) 2,25,537.5 2,75,309.8 2,84,205.9 3,37,807.3 1,10,225.1 1,53,526.8 1,16,099.5 1,25,435.9
i) Roads and Bridges 2,16,860.1 2,54,422.9 2,65,444.2 3,13,560.6 1,10,225.1 1,53,396.8 1,15,969.5 1,24,908.7
ii) Others @@ 8,677.4 20,887.0 18,761.7 24,246.7 - 130.0 130.0 527.3
8. Science, Technology and Environment 14,831.4 36,158.9 23,891.9 37,729.2 21,227.2 30,549.5 24,631.0 19,096.4
9. General Economic Services (i to iv) 65,578.2 86,864.9 83,768.4 85,444.8 31,279.3 33,267.7 32,578.3 27,247.6
i) Secretariat - Economic Services 12,373.9 40,340.1 35,020.9 39,347.1 2,602.5 3,348.3 3,793.1 5,067.3
ii) Tourism 19,207.6 22,407.2 21,115.9 20,527.9 15,615.9 15,549.8 14,546.4 12,335.8
iii) Civil Supplies 10,989.9 5,020.1 3,554.9 5,339.2 - - - -
iv) Others + 23,006.8 19,097.5 24,076.7 20,230.7 13,061.0 14,369.7 14,238.8 9,844.5
II. NON-DEVELOPMENTAL EXPENDITURE 45,52,376.9 50,51,249.8 52,73,312.5 56,83,216.0 32,10,008.3 40,67,524.2 38,91,094.8 45,19,200.8 (General Services) (A to F)
A. Organs of State 98,940.4 1,08,776.8 1,06,075.9 1,23,613.4 1,18,905.6 1,52,139.8 1,75,175.3 1,87,732.6
B. Fiscal Services (i + ii) 1,79,209.9 1,91,484.2 1,93,071.7 1,89,068.0 3,20,488.5 4,23,712.6 3,20,850.6 5,25,442.2
i) Collection of Taxes and Duties 1,58,877.8 1,73,877.1 1,75,361.6 1,70,514.7 3,20,285.5 4,23,355.4 3,20,558.4 5,25,130.6
ii) Other Fiscal Services 20,332.1 17,607.1 17,710.1 18,553.3 203.1 357.3 292.3 311.6
C. Interest Payments and Servicing of Debt (1 + 2)
15,11,993.0 14,93,770.7 15,62,644.9 17,20,128.4 11,04,533.8 12,86,729.4 12,24,240.7 14,43,207.5
1. Appropriation for Reduction or Avoidance of Debt
- - - - - - - -
2. Interest Payments (i to iv) 15,11,993.0 14,93,770.7 15,62,644.9 17,20,128.4 11,04,533.8 12,86,729.4 12,24,240.7 14,43,207.5
i) Interest on Loans from the Centre 31,489.8 31,311.0 31,311.0 30,202.5 65,205.6 70,427.4 65,427.4 66,970.1
ii) Interest on Internal Debt 10,64,699.8 11,72,210.7 11,79,366.7 13,27,223.7 9,31,165.1 10,48,598.9 9,93,990.2 11,87,493.2
of which:
(a) Interest on Market Loans 8,82,424.6 9,92,770.5 9,99,620.5 11,44,276.7 5,96,786.7 6,87,323.6 6,82,337.7 8,12,359.3
(b) Interest on NSSF 1,39,707.3 1,36,130.6 1,36,952.1 1,42,932.3 2,05,511.6 2,25,000.0 1,85,000.0 2,25,000.0
iii) Interest on Small Savings, State Provident Funds, etc.
4,15,807.9 2,90,248.9 3,50,050.2 3,62,702.2 1,07,872.3 1,35,214.6 1,35,458.6 1,49,004.4
iv) Others -4.6 - 1,917.0 - 290.7 32,488.5 29,364.5 39,739.7
D. Administrative Services (i to v) 5,44,623.5 6,11,685.7 5,70,532.5 6,21,725.4 7,34,704.2 9,46,294.7 8,98,528.8 9,57,384.3
i) Secretariat - General Services 24,296.9 26,744.0 26,570.7 27,393.6 19,267.3 24,275.8 25,632.8 26,791.7
ii) District Administration 38,054.1 45,367.5 46,309.6 47,490.5 67,008.8 75,024.6 69,366.6 80,578.7
iii) Police 3,48,979.8 3,87,017.3 3,57,806.6 3,90,617.0 5,15,427.8 6,14,737.9 6,33,704.5 6,47,054.8
iv) Public Works 14,643.0 21,209.8 16,216.7 23,777.2 44,921.1 53,349.2 52,537.8 58,249.9
v) Others ++ 1,18,649.6 1,31,347.0 1,23,628.9 1,32,447.1 88,079.2 1,78,907.2 1,17,287.2 1,44,709.2
E. Pensions 19,93,840.6 18,22,129.6 19,18,932.1 18,91,183.5 9,29,024.9 12,55,663.0 12,66,865.8 14,01,708.2
F. Miscellaneous General Services 2,23,769.5 8,23,402.8 9,22,055.5 11,37,497.3 2,351.3 2,984.7 5,433.6 3,726.0
of which:
Payment on account of State Lotteries 7,62,763.9 7,87,415.4 7,99,321.9 10,96,246.4 - - - -
III. Grants-in-Aid and Contributions 7,19,723.3 9,12,987.6 7,46,894.9 9,94,842.2 7,06,524.3 7,15,195.4 7,40,572.4 7,47,941.0
of which:
Compensation and Assignments to Local Bodies and Panchayati Raj Institutions 7,19,723.3 9,12,987.6 7,46,894.9 9,94,842.2 7,06,524.3 7,15,195.4 7,40,572.4 7,47,941.0
Appendix II : Revenue Expenditure of States and Union Territories with Legislature (Contd.)
(₹ Lakh)

Appendix II
231
Item
MAHARASHTRA MANIPUR
2017-18(Accounts)
2018-19(Budget
Estimates)
2018-19(Revised
Estimates)
2019-20(Budget
Estimates)
2017-18(Accounts)
2018-19(Budget
Estimates)
2018-19(Revised
Estimates)
2019-20(Budget
Estimates)
1 2 3 4 5 2 3 4 5
TOTAL EXPENDITURE (I+II+III) 2,41,57,106.6 3,01,34,286.1 3,01,45,974.1 3,34,27,338.9 9,27,400.3 11,00,924.5 12,18,997.2 12,78,071.5
I. DEVELOPMENTAL EXPENDITURE (A + B) 1,47,24,332.9 1,81,66,235.0 1,92,53,939.8 2,05,14,549.3 5,07,303.3 6,62,918.9 7,21,055.5 7,35,703.6
A. Social Services (1 to 12) 93,05,430.1 1,23,84,230.3 1,29,49,900.6 1,48,39,342.6 2,56,941.8 2,97,457.1 3,42,478.2 3,51,062.8
1. Education, Sports, Art and Culture 48,47,631.1 59,19,394.2 56,41,878.3 71,20,185.2 1,30,435.8 1,47,576.8 1,54,272.0 1,77,104.9
2. Medical and Public Health 10,78,227.3 11,21,083.3 13,57,709.8 13,63,618.0 53,752.3 62,673.9 65,588.7 69,795.9
3. Family Welfare 82,244.6 98,209.5 1,00,440.3 1,17,419.3 2,342.6 2,289.1 2,888.1 3,238.1
4. Water Supply and Sanitation 3,09,002.2 6,36,590.2 6,65,260.8 6,85,959.0 6,257.1 5,739.9 5,424.4 6,610.4
5. Housing 1,09,378.8 2,43,732.3 2,30,412.2 8,21,341.2 1,068.5 1,180.0 1,680.0 1,180.0
6. Urban Development 8,03,027.0 12,51,685.7 12,58,485.8 14,33,109.8 8,960.2 18,697.0 20,194.4 22,814.8
7. Welfare of Scheduled Castes, Scheduled Tribes and Other Backward Classes 12,43,882.0 17,27,229.3 15,49,247.6 17,71,065.5 16,686.8 18,822.9 31,205.4 18,987.3
8. Labour and Labour Welfare 83,439.2 1,36,594.6 1,21,567.2 1,44,168.6 2,059.2 1,841.7 5,561.1 5,981.4
9. Social Security and Welfare 3,62,604.3 3,64,647.9 5,58,240.0 4,25,411.6 25,623.0 30,395.1 30,193.4 33,737.0
10. Nutrition 2,53,231.5 2,89,637.8 4,19,052.2 2,68,232.0 3,360.7 4,620.5 10,421.1 7,626.7
11. Relief on account of Natural Calamities 1,13,309.1 5,56,624.8 10,12,214.0 6,41,052.1 4,434.2 2,595.4 13,893.3 2,697.9
12. Others* 19,453.0 38,800.9 35,392.4 47,780.4 1,961.6 1,024.7 1,156.5 1,288.6
B. Economic Services (1 to 9) 54,18,902.8 57,82,004.7 63,04,039.3 56,75,206.6 2,50,361.5 3,65,461.9 3,78,577.2 3,84,640.8
1. Agriculture and Allied Activities (i to xii) 26,12,960.9 23,62,143.1 23,46,812.7 15,83,036.7 47,128.2 64,091.5 73,224.2 78,779.0
i) Crop Husbandry 4,73,560.1 6,59,774.2 6,69,206.7 6,94,218.0 13,238.7 23,579.7 28,184.0 28,917.4
ii) Soil and Water Conservation 7,719.9 42,414.0 40,847.8 49,302.6 3,721.7 3,339.4 3,889.7 3,948.6
iii) Animal Husbandry 95,974.9 1,09,861.3 1,15,448.4 1,37,368.9 7,972.5 11,105.7 12,177.7 14,035.9
iv) Dairy Development 34,261.6 37,546.4 1,01,413.5 44,710.1 180.4 252.7 269.9 323.4
v) Fisheries 14,263.4 14,002.2 17,719.0 13,582.6 3,625.4 3,214.1 3,713.0 3,617.5
vi) Forestry and Wild Life 2,10,810.6 2,49,292.0 2,67,307.9 3,00,998.0 8,278.5 14,929.1 12,436.6 17,199.3
vii) Plantations - - - - 8.0 8.0 8.0 8.0
viii) Food Storage and Warehousing 31,514.7 38,059.0 41,843.4 55,942.9 7,737.8 5,176.9 9,670.3 7,302.6
ix) Agricultural Research and Education 99,867.4 1,05,131.0 1,03,345.1 1,41,309.1 314.6 378.7 374.2 454.0
x) Agricultural Finance Institutions - - - - - - - -
xi) Co-operation 1,29,380.5 91,911.1 3,08,792.7 1,05,042.5 2,042.6 2,099.3 2,492.8 2,964.3
xii) Other Agricultural Programmes 15,15,607.8 10,14,152.0 6,80,888.0 40,562.0 8.0 8.0 8.0 8.0
2. Rural Development 6,58,872.6 12,09,063.5 13,27,233.2 16,02,738.3 98,755.1 1,84,739.0 1,88,869.1 1,94,419.1
3. Special Area Programmes 58.0 100.8 100.7 129.8 6,726.1 8,608.1 9,636.2 7,526.6
4. Irrigation and Flood Control 2,15,927.9 2,00,663.0 1,87,976.2 2,27,729.8 8,975.4 10,200.6 9,335.0 10,377.3
of which:
i) Major and Medium Irrigation 1,49,580.2 1,57,202.3 1,46,175.8 1,71,848.9 4,217.6 4,785.0 4,600.7 5,045.7
ii) Minor Irrigation 63,343.1 39,270.7 37,597.6 51,493.9 909.0 1,265.1 950.5 1,141.5
iii) Flood Control and Drainage 1,620.0 2,271.8 2,458.7 2,171.4 1,490.0 1,703.5 1,518.0 1,845.5
5. Energy 8,94,572.9 7,68,602.5 11,65,527.0 8,41,095.1 56,563.6 48,622.2 54,928.9 44,043.2
of which: Power 8,40,314.7 6,93,737.9 10,81,635.6 7,99,888.9 55,759.4 47,872.2 54,178.9 43,293.2
6. Industry and Minerals (i to iii) 2,43,893.8 3,12,628.6 3,56,071.9 3,27,644.8 8,030.8 13,640.3 17,922.4 19,809.3
i) Village and Small Industries 21,809.1 33,036.8 39,034.2 47,342.8 7,468.2 13,030.7 17,364.9 19,176.3
ii) Industries@ 2,22,084.7 2,79,591.9 3,17,037.8 2,80,301.9 562.6 609.5 557.5 633.0
iii) Others** - - - - - - - -
Appendix II : Revenue Expenditure of States and Union Territories with Legislature (Contd.)
(₹ Lakh)

State Finances : A Study of Budgets of 2019-20
232
Item
MAHARASHTRA MANIPUR
2017-18(Accounts)
2018-19(Budget
Estimates)
2018-19(Revised
Estimates)
2019-20(Budget
Estimates)
2017-18(Accounts)
2018-19(Budget
Estimates)
2018-19(Revised
Estimates)
2019-20(Budget
Estimates)
1 2 3 4 5 2 3 4 5
7. Transport and Communications (i + ii) 5,46,091.5 6,17,799.1 6,05,311.5 7,11,400.8 9,879.2 11,546.0 7,384.9 11,679.7
i) Roads and Bridges 4,98,431.0 5,71,826.2 5,33,794.8 6,44,478.3 9,879.2 11,546.0 7,384.9 11,679.7
ii) Others @@ 47,660.5 45,972.9 71,516.7 66,922.4 - - - -
8. Science, Technology and Environment 22,451.5 33,396.3 29,996.0 45,592.2 4,400.8 5,401.2 5,568.7 4,969.6
9. General Economic Services (i to iv) 2,24,073.7 2,77,607.8 2,85,010.0 3,35,839.2 9,902.1 18,613.0 11,707.9 13,037.1
i) Secretariat - Economic Services 1,85,390.0 2,24,178.2 2,16,392.9 2,69,488.2 6,318.1 14,471.0 7,061.2 7,646.8
ii) Tourism 29,303.1 40,860.7 57,504.2 52,065.8 1,663.6 1,836.7 2,270.1 2,530.4
iii) Civil Supplies - - - - - - - -
iv) Others + 9,380.5 12,569.0 11,112.9 14,285.2 1,920.4 2,305.3 2,376.7 2,860.0
II. NON-DEVELOPMENTAL EXPENDITURE 78,53,478.1 99,04,575.0 88,25,873.5 1,07,04,261.6 3,66,687.9 3,81,680.2 4,31,297.1 4,84,940.1 (General Services) (A to F)
A. Organs of State 1,99,412.6 2,63,082.3 2,65,722.7 5,04,307.6 16,976.6 19,640.4 22,543.8 22,812.4
B. Fiscal Services (i + ii) 2,78,411.5 3,63,389.9 3,59,422.4 4,01,947.4 6,520.9 8,505.5 8,521.6 9,353.9
i) Collection of Taxes and Duties 2,78,174.3 3,63,389.9 3,59,422.4 4,01,947.4 6,488.3 8,456.8 8,472.9 9,295.2
ii) Other Fiscal Services 237.2 - - - 32.6 48.7 48.7 58.8
C. Interest Payments and Servicing of Debt (1 + 2)
36,11,842.6 38,18,464.8 37,72,908.1 39,20,702.1 63,439.5 67,402.1 68,276.8 72,806.0
1. Appropriation for Reduction or Avoidance of Debt
3,10,000.0 3,80,000.0 3,80,000.0 4,00,000.0 7,143.0 5,355.0 5,355.0 7,268.0
2. Interest Payments (i to iv) 33,01,842.6 34,38,464.8 33,92,908.1 35,20,702.1 56,296.5 62,047.1 62,921.8 65,538.0
i) Interest on Loans from the Centre 43,270.6 41,096.8 41,777.0 39,872.1 2,720.6 3,370.7 3,370.7 3,707.8
ii) Interest on Internal Debt 27,82,745.5 28,36,411.0 28,13,267.9 28,99,659.9 41,662.8 44,291.0 44,607.4 46,757.2
of which:
(a) Interest on Market Loans 19,99,531.7 21,14,833.3 20,96,779.1 22,16,112.9 31,989.8 31,484.8 31,510.9 32,000.0
(b) Interest on NSSF 7,26,492.1 6,31,468.0 6,31,468.0 5,79,918.1 7,249.1 9,386.5 9,386.5 10,325.2
iii) Interest on Small Savings, State Provident Funds, etc.
4,53,134.6 5,32,757.3 4,90,477.4 5,45,474.7 11,912.6 14,361.5 14,919.8 15,049.1
iv) Others 22,692.0 28,199.8 47,385.9 35,695.4 0.4 23.8 23.8 23.8
D. Administrative Services (i to v) 18,92,172.4 33,71,791.1 23,15,536.1 30,68,524.7 1,47,319.0 1,65,584.1 1,80,805.0 2,14,161.5
i) Secretariat - General Services 44,304.8 77,408.3 95,321.5 1,00,347.9 6,565.2 6,141.5 7,022.9 7,334.7
ii) District Administration 5,14,628.4 6,52,670.7 6,09,060.0 7,90,927.3 4,522.6 5,856.7 6,020.7 7,296.1
iii) Police 11,23,319.9 13,38,503.8 13,40,260.6 16,84,233.6 1,22,145.0 1,39,094.6 1,52,351.4 1,83,450.9
iv) Public Works 1,08,633.6 1,65,350.3 1,25,586.9 1,85,903.5 5,651.6 3,934.8 4,155.8 4,093.9
v) Others ++ 1,01,285.7 11,37,858.0 1,45,307.2 3,07,112.5 8,434.6 10,556.5 11,254.1 11,986.0
E. Pensions 18,60,269.4 20,72,041.8 20,76,781.2 27,83,244.6 1,32,431.4 1,20,531.4 1,51,133.2 1,65,789.5
F. Miscellaneous General Services 11,369.5 15,805.0 35,503.1 25,535.3 0.5 16.8 16.8 16.8
of which:
Payment on account of State Lotteries 9,418.8 13,363.5 6,708.8 9,134.6 - - - -
III. Grants-in-Aid and Contributions 15,79,295.6 20,63,476.1 20,66,160.7 22,08,528.0 53,409.1 56,325.4 66,644.6 57,427.9
of which:
Compensation and Assignments to Local Bodies and Panchayati Raj Institutions 15,79,295.6 20,63,476.1 20,66,160.7 22,08,528.0 53,409.1 56,325.4 66,644.6 57,427.9
Appendix II : Revenue Expenditure of States and Union Territories with Legislature (Contd.)
(₹ Lakh)

Appendix II
233
Item
MEGHALAYA MIZORAM
2017-18(Accounts)
2018-19(Budget
Estimates)
2018-19(Revised
Estimates)
2019-20(Budget
Estimates)
2017-18(Accounts)
2018-19(Budget
Estimates)
2018-19(Revised
Estimates)
2019-20(Budget
Estimates)
1 2 3 4 5 2 3 4 5
TOTAL EXPENDITURE (I+II+III) 8,42,268.1 12,03,629.5 12,03,629.5 13,69,947.6 6,88,076.4 7,17,961.9 8,14,252.6 8,40,352.0
I. DEVELOPMENTAL EXPENDITURE (A + B) 5,59,581.2 8,48,963.9 8,48,963.9 9,47,711.8 4,64,162.4 4,30,838.5 5,33,830.4 5,35,693.6
A. Social Services (1 to 12) 3,14,761.1 4,28,749.1 4,28,749.1 5,14,522.2 2,60,652.8 2,49,144.5 3,20,191.4 3,18,731.4
1. Education, Sports, Art and Culture 1,73,518.6 2,22,400.9 2,22,400.9 2,81,780.7 1,25,687.2 1,27,463.1 1,50,376.2 1,61,583.6
2. Medical and Public Health 62,346.3 85,375.4 85,375.4 99,924.4 43,498.3 39,159.7 48,351.7 51,614.9
3. Family Welfare 4,481.1 7,646.6 7,646.6 8,716.4 3,390.4 3,045.5 4,057.0 4,530.7
4. Water Supply and Sanitation 21,223.4 24,994.0 24,994.0 27,076.3 21,351.2 15,547.5 22,160.5 20,493.7
5. Housing 3,518.1 4,166.4 4,166.4 4,356.5 685.7 663.7 1,301.6 726.9
6. Urban Development 2,974.4 7,813.4 7,813.4 11,417.1 9,755.9 8,159.7 22,186.2 16,322.4
7. Welfare of Scheduled Castes, Scheduled Tribes and Other Backward Classes 8,166.7 - - - 37,098.5 36,546.0 43,370.1 40,106.9
8. Labour and Labour Welfare 3,550.6 9,497.0 9,497.0 13,677.5 1,300.0 1,334.8 2,560.6 3,859.1
9. Social Security and Welfare 12,075.4 42,851.2 42,851.2 43,081.8 14,836.5 13,534.8 17,591.3 14,832.8
10. Nutrition 17,968.2 17,054.0 17,054.0 17,187.9 284.4 297.1 793.2 735.7
11. Relief on account of Natural Calamities 2,891.2 3,257.0 3,257.0 3,307.5 1,395.5 2,000.0 5,651.4 2,398.4
12. Others* 2,047.0 3,693.3 3,693.3 3,996.1 1,369.5 1,392.7 1,791.6 1,526.4
B. Economic Services (1 to 9) 2,44,820.1 4,20,214.8 4,20,214.8 4,33,189.5 2,03,509.5 1,81,694.0 2,13,638.9 2,16,962.3
1. Agriculture and Allied Activities (i to xii) 57,334.6 1,11,670.1 1,11,670.1 1,11,506.1 54,441.9 49,379.9 59,976.4 58,841.6
i) Crop Husbandry 15,709.0 21,478.0 21,478.0 22,209.2 24,058.0 25,911.5 27,219.8 24,516.9
ii) Soil and Water Conservation 7,738.6 27,486.2 27,486.2 27,366.3 1,806.5 1,642.6 2,450.4 1,958.1
iii) Animal Husbandry 10,388.4 12,682.0 12,682.0 14,407.5 5,584.7 5,800.4 6,244.7 6,463.4
iv) Dairy Development 873.3 3,212.5 3,212.5 3,588.5 115.6 475.9 481.9 469.9
v) Fisheries 1,808.8 6,777.0 6,777.0 6,128.4 1,311.7 902.4 1,666.7 1,040.0
vi) Forestry and Wild Life 14,138.6 23,670.4 23,670.4 24,059.4 12,304.6 7,657.5 13,219.4 15,852.0
vii) Plantations - - - - - - - -
viii) Food Storage and Warehousing - - - - 5,938.8 4,632.9 5,820.4 6,004.8
ix) Agricultural Research and Education 1,701.9 1,785.5 1,785.5 2,055.4 1,207.5 403.7 620.4 516.1
x) Agricultural Finance Institutions - - - - - - - -
xi) Co-operation 2,113.9 3,015.5 3,015.5 2,797.0 1,586.1 1,450.5 1,680.3 1,389.2
xii) Other Agricultural Programmes 2,861.9 11,563.0 11,563.0 8,894.4 528.5 502.5 572.4 631.2
2. Rural Development 1,06,573.4 1,53,191.2 1,53,191.2 1,78,722.3 35,570.5 32,084.2 36,756.0 36,889.8
3. Special Area Programmes 1,297.5 4,509.0 4,509.0 2,277.0 4,019.6 4,039.4 4,061.8 6,039.4
4. Irrigation and Flood Control 4,857.7 8,538.0 8,538.0 6,903.7 1,139.7 1,115.6 1,548.6 1,468.2
of which:
i) Major and Medium Irrigation - 50.0 50.0 50.0 - - - -
ii) Minor Irrigation 4,752.0 8,203.5 8,203.5 6,743.7 1,139.5 1,115.5 1,548.5 1,468.1
iii) Flood Control and Drainage 105.7 284.5 284.5 110.0 0.2 0.2 0.2 0.2
5. Energy 11,639.8 38,969.5 38,969.5 21,951.1 51,136.6 39,518.7 58,948.4 53,393.8
of which: Power 10,916.4 36,494.5 36,494.5 18,440.1 51,136.6 39,518.7 58,948.4 53,393.8
6. Industry and Minerals (i to iii) 23,120.8 20,044.1 20,044.1 21,625.4 8,611.9 8,877.6 9,588.6 9,735.3
i) Village and Small Industries 8,806.4 12,729.0 12,729.0 12,914.4 7,083.0 8,167.4 8,572.2 8,818.1
ii) Industries@ 14,314.4 7,315.1 7,315.1 8,711.0 1,528.9 710.2 1,016.4 917.3
iii) Others** - - - - - - - -
Appendix II : Revenue Expenditure of States and Union Territories with Legislature (Contd.)
(₹ Lakh)
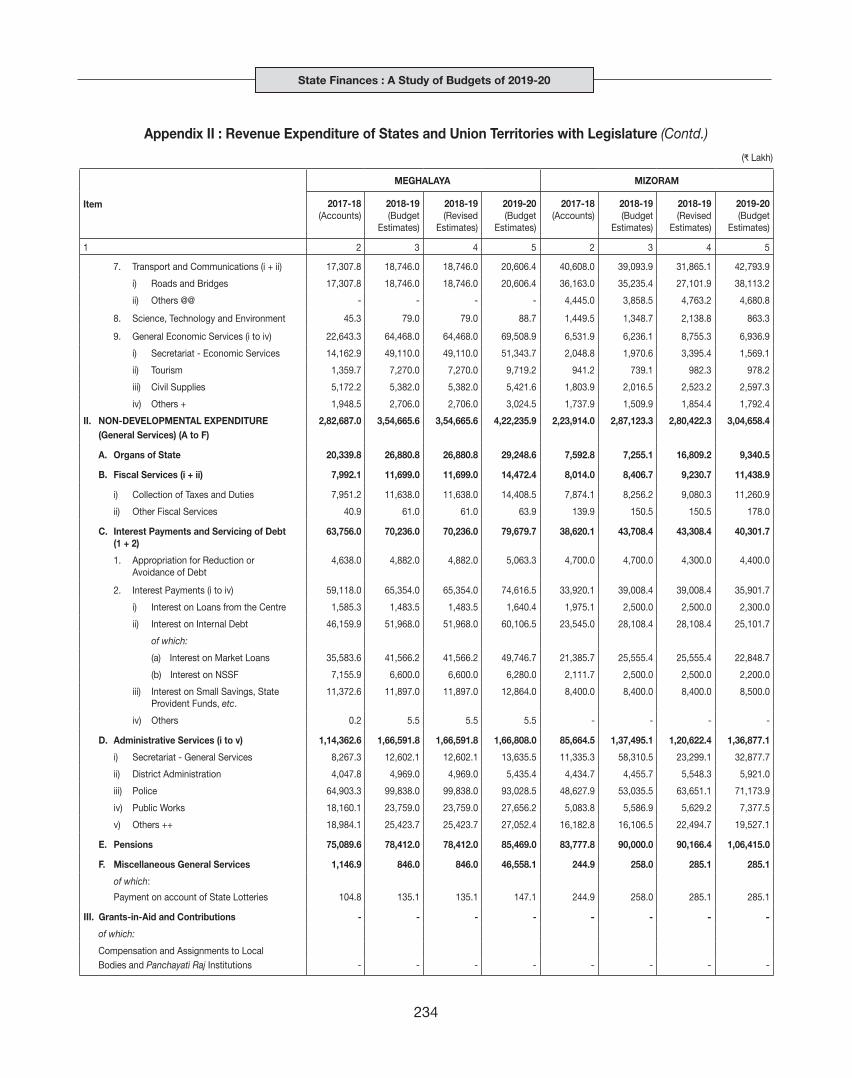
State Finances : A Study of Budgets of 2019-20
234
Item
MEGHALAYA MIZORAM
2017-18(Accounts)
2018-19(Budget
Estimates)
2018-19(Revised
Estimates)
2019-20(Budget
Estimates)
2017-18(Accounts)
2018-19(Budget
Estimates)
2018-19(Revised
Estimates)
2019-20(Budget
Estimates)
1 2 3 4 5 2 3 4 5
7. Transport and Communications (i + ii) 17,307.8 18,746.0 18,746.0 20,606.4 40,608.0 39,093.9 31,865.1 42,793.9
i) Roads and Bridges 17,307.8 18,746.0 18,746.0 20,606.4 36,163.0 35,235.4 27,101.9 38,113.2
ii) Others @@ - - - - 4,445.0 3,858.5 4,763.2 4,680.8
8. Science, Technology and Environment 45.3 79.0 79.0 88.7 1,449.5 1,348.7 2,138.8 863.3
9. General Economic Services (i to iv) 22,643.3 64,468.0 64,468.0 69,508.9 6,531.9 6,236.1 8,755.3 6,936.9
i) Secretariat - Economic Services 14,162.9 49,110.0 49,110.0 51,343.7 2,048.8 1,970.6 3,395.4 1,569.1
ii) Tourism 1,359.7 7,270.0 7,270.0 9,719.2 941.2 739.1 982.3 978.2
iii) Civil Supplies 5,172.2 5,382.0 5,382.0 5,421.6 1,803.9 2,016.5 2,523.2 2,597.3
iv) Others + 1,948.5 2,706.0 2,706.0 3,024.5 1,737.9 1,509.9 1,854.4 1,792.4
II. NON-DEVELOPMENTAL EXPENDITURE 2,82,687.0 3,54,665.6 3,54,665.6 4,22,235.9 2,23,914.0 2,87,123.3 2,80,422.3 3,04,658.4 (General Services) (A to F)
A. Organs of State 20,339.8 26,880.8 26,880.8 29,248.6 7,592.8 7,255.1 16,809.2 9,340.5
B. Fiscal Services (i + ii) 7,992.1 11,699.0 11,699.0 14,472.4 8,014.0 8,406.7 9,230.7 11,438.9
i) Collection of Taxes and Duties 7,951.2 11,638.0 11,638.0 14,408.5 7,874.1 8,256.2 9,080.3 11,260.9
ii) Other Fiscal Services 40.9 61.0 61.0 63.9 139.9 150.5 150.5 178.0
C. Interest Payments and Servicing of Debt (1 + 2)
63,756.0 70,236.0 70,236.0 79,679.7 38,620.1 43,708.4 43,308.4 40,301.7
1. Appropriation for Reduction or Avoidance of Debt
4,638.0 4,882.0 4,882.0 5,063.3 4,700.0 4,700.0 4,300.0 4,400.0
2. Interest Payments (i to iv) 59,118.0 65,354.0 65,354.0 74,616.5 33,920.1 39,008.4 39,008.4 35,901.7
i) Interest on Loans from the Centre 1,585.3 1,483.5 1,483.5 1,640.4 1,975.1 2,500.0 2,500.0 2,300.0
ii) Interest on Internal Debt 46,159.9 51,968.0 51,968.0 60,106.5 23,545.0 28,108.4 28,108.4 25,101.7
of which:
(a) Interest on Market Loans 35,583.6 41,566.2 41,566.2 49,746.7 21,385.7 25,555.4 25,555.4 22,848.7
(b) Interest on NSSF 7,155.9 6,600.0 6,600.0 6,280.0 2,111.7 2,500.0 2,500.0 2,200.0
iii) Interest on Small Savings, State Provident Funds, etc.
11,372.6 11,897.0 11,897.0 12,864.0 8,400.0 8,400.0 8,400.0 8,500.0
iv) Others 0.2 5.5 5.5 5.5 - - - -
D. Administrative Services (i to v) 1,14,362.6 1,66,591.8 1,66,591.8 1,66,808.0 85,664.5 1,37,495.1 1,20,622.4 1,36,877.1
i) Secretariat - General Services 8,267.3 12,602.1 12,602.1 13,635.5 11,335.3 58,310.5 23,299.1 32,877.7
ii) District Administration 4,047.8 4,969.0 4,969.0 5,435.4 4,434.7 4,455.7 5,548.3 5,921.0
iii) Police 64,903.3 99,838.0 99,838.0 93,028.5 48,627.9 53,035.5 63,651.1 71,173.9
iv) Public Works 18,160.1 23,759.0 23,759.0 27,656.2 5,083.8 5,586.9 5,629.2 7,377.5
v) Others ++ 18,984.1 25,423.7 25,423.7 27,052.4 16,182.8 16,106.5 22,494.7 19,527.1
E. Pensions 75,089.6 78,412.0 78,412.0 85,469.0 83,777.8 90,000.0 90,166.4 1,06,415.0
F. Miscellaneous General Services 1,146.9 846.0 846.0 46,558.1 244.9 258.0 285.1 285.1
of which:
Payment on account of State Lotteries 104.8 135.1 135.1 147.1 244.9 258.0 285.1 285.1
III. Grants-in-Aid and Contributions - - - - - - - -
of which:
Compensation and Assignments to Local Bodies and Panchayati Raj Institutions - - - - - - - -
Appendix II : Revenue Expenditure of States and Union Territories with Legislature (Contd.)
(₹ Lakh)

Appendix II
235
Item
NAGALAND ODISHA
2017-18(Accounts)
2018-19(Budget
Estimates)
2018-19(Revised
Estimates)
2019-20(Budget
Estimates)
2017-18(Accounts)
2018-19(Budget
Estimates)
2018-19(Revised
Estimates)
2019-20(Budget
Estimates)
1 2 3 4 5 2 3 4 5
TOTAL EXPENDITURE (I+II+III) 10,19,134.8 12,11,283.5 11,44,913.7 12,66,623.2 71,83,730.5 90,22,000.0 91,32,785.0 1,08,73,791.0
I. DEVELOPMENTAL EXPENDITURE (A + B) 5,87,194.4 7,02,435.7 6,23,143.2 7,20,544.2 50,31,373.2 62,12,809.7 64,33,137.9 77,09,756.2
A. Social Services (1 to 12) 2,55,856.2 3,24,768.1 3,30,574.4 3,44,869.2 29,55,682.7 38,41,905.4 39,54,366.2 46,21,359.9
1. Education, Sports, Art and Culture 1,48,235.4 1,88,407.2 1,79,070.5 1,95,404.7 13,78,833.7 16,81,059.1 17,12,386.1 18,75,119.0
2. Medical and Public Health 50,981.1 61,977.2 65,975.8 68,954.1 3,80,556.0 4,83,395.3 5,14,819.6 5,48,643.5
3. Family Welfare 2,755.5 2,814.0 3,468.8 3,522.0 34,748.4 39,841.7 40,881.2 42,241.6
4. Water Supply and Sanitation 9,080.8 10,565.2 10,113.8 9,992.7 1,75,695.2 2,28,461.4 3,25,852.9 3,92,150.4
5. Housing 2,826.2 13,950.1 2,507.9 2,575.5 31,594.7 27,686.5 27,687.5 30,491.4
6. Urban Development 2,125.9 4,930.6 5,288.2 6,104.0 1,78,131.6 2,27,251.4 2,38,080.9 2,57,032.8
7. Welfare of Scheduled Castes, Scheduled Tribes and Other Backward Classes 4,586.1 4,343.2 4,960.2 4,715.0 2,21,758.3 2,91,695.4 2,99,977.6 2,99,324.7
8. Labour and Labour Welfare 3,535.0 6,602.5 5,387.5 5,560.9 14,187.1 15,540.6 18,994.7 21,198.8
9. Social Security and Welfare 17,174.3 18,394.2 16,952.0 20,750.4 4,10,252.1 5,93,607.0 5,42,366.7 6,50,680.7
10. Nutrition 6,503.6 5,216.4 9,733.4 9,073.4 5,113.8 10,701.6 2,515.3 1,725.4
11. Relief on account of Natural Calamities 3,714.7 1,171.3 20,758.7 11,297.0 1,03,041.1 2,08,618.5 2,01,500.0 4,70,306.1
12. Others* 4,337.6 6,396.2 6,357.6 6,919.6 21,770.8 34,047.0 29,303.8 32,445.5
B. Economic Services (1 to 9) 3,31,338.2 3,77,667.7 2,92,568.8 3,75,675.0 20,75,690.5 23,70,904.2 24,78,771.6 30,88,396.3
1. Agriculture and Allied Activities (i to xii) 62,553.4 69,114.9 78,219.5 76,731.5 5,80,142.3 8,10,534.7 8,29,810.0 12,69,523.9
i) Crop Husbandry 26,102.7 30,387.6 35,546.9 35,228.7 2,75,235.0 4,14,283.3 4,37,201.8 8,54,359.1
ii) Soil and Water Conservation 4,111.7 8,160.7 6,083.1 6,836.2 31,612.8 60,178.2 50,146.5 36,545.4
iii) Animal Husbandry 8,987.1 9,965.2 9,885.1 10,399.6 37,775.2 52,051.7 52,738.8 50,353.8
iv) Dairy Development 25.1 2,027.6 437.6 337.6 1,223.5 4,698.4 4,598.4 3,795.9
v) Fisheries 2,060.4 2,449.0 2,207.0 2,942.1 15,833.6 18,221.5 17,227.4 18,017.3
vi) Forestry and Wild Life 11,575.3 10,095.2 13,949.4 12,831.1 56,192.6 74,879.6 74,676.3 83,398.0
vii) Plantations - - - - - - - -
viii) Food Storage and Warehousing 6,991.0 2,717.1 5,463.5 2,795.0 93,179.4 1,10,423.6 1,12,905.1 1,10,220.9
ix) Agricultural Research and Education 835.0 1,306.7 1,387.5 1,346.4 14,443.4 15,530.8 15,463.6 17,779.7
x) Agricultural Finance Institutions - - - - - - - -
xi) Co-operation 1,865.0 2,005.8 3,259.4 4,014.8 53,717.0 59,101.9 63,686.6 93,836.5
xii) Other Agricultural Programmes - - - - 929.8 1,165.6 1,165.6 1,217.3
2. Rural Development 1,35,647.1 1,47,970.3 66,661.3 1,26,459.7 9,01,788.4 9,51,982.8 10,30,225.2 11,73,895.2
3. Special Area Programmes 5,244.3 18,748.1 3,338.8 21,680.2 - - 3,000.0 -
4. Irrigation and Flood Control 2,794.3 4,116.0 4,013.6 3,958.6 1,91,139.3 1,87,199.6 1,63,741.0 2,24,449.6
of which:
i) Major and Medium Irrigation - - - - 69,926.2 72,174.8 76,104.6 73,921.5
ii) Minor Irrigation 2,794.3 4,116.0 4,013.6 3,958.6 76,251.1 76,938.7 48,836.4 99,515.7
iii) Flood Control and Drainage - - - - 17,879.4 16,655.2 16,915.3 17,848.5
5. Energy 45,058.5 46,869.5 48,870.1 48,773.6 4,518.5 16,749.0 25,949.3 5,715.3
of which: Power 44,653.1 46,396.8 48,369.1 48,254.1 611.9 13,204.5 23,444.1 1,758.8
6. Industry and Minerals (i to iii) 12,232.5 11,247.9 13,814.7 11,740.6 67,855.2 89,110.9 85,441.8 79,929.9
i) Village and Small Industries 9,165.2 8,284.2 10,247.2 8,224.7 27,171.5 37,478.3 33,765.9 34,662.6
ii) Industries@ 3,067.3 2,963.7 3,567.5 3,515.9 15,371.3 20,868.0 19,675.9 22,050.3
iii) Others** - - - - 25,312.4 30,764.6 32,000.0 23,217.0
Appendix II : Revenue Expenditure of States and Union Territories with Legislature (Contd.)
(₹ Lakh)

State Finances : A Study of Budgets of 2019-20
236
Item
NAGALAND ODISHA
2017-18(Accounts)
2018-19(Budget
Estimates)
2018-19(Revised
Estimates)
2019-20(Budget
Estimates)
2017-18(Accounts)
2018-19(Budget
Estimates)
2018-19(Revised
Estimates)
2019-20(Budget
Estimates)
1 2 3 4 5 2 3 4 5
7. Transport and Communications (i + ii) 45,427.0 42,791.9 45,386.6 42,211.1 2,22,378.5 2,13,987.1 2,25,274.0 2,15,902.0
i) Roads and Bridges 38,247.2 34,912.5 37,383.6 34,595.5 2,20,818.1 2,12,247.3 2,23,010.6 2,13,650.2
ii) Others @@ 7,179.8 7,879.4 8,003.0 7,615.6 1,560.4 1,739.8 2,263.4 2,251.8
8. Science, Technology and Environment 981.3 480.4 1,244.0 802.4 6,706.4 7,110.9 7,704.8 8,821.4
9. General Economic Services (i to iv) 21,399.8 36,328.7 31,020.3 43,317.3 1,01,161.9 94,229.3 1,07,625.5 1,10,159.0
i) Secretariat - Economic Services 15,539.5 30,269.8 23,574.8 36,624.8 86,343.6 78,242.6 90,655.2 97,575.2
ii) Tourism 1,744.4 1,030.6 2,319.8 1,661.8 7,561.0 8,417.7 8,917.7 6,700.5
iii) Civil Supplies - - - - 3,593.0 1,676.9 2,103.9 943.7
iv) Others + 4,116.0 5,028.3 5,125.7 5,030.7 3,664.2 5,892.1 5,948.8 4,939.7
II. NON-DEVELOPMENTAL EXPENDITURE 4,31,940.4 5,08,847.8 5,21,770.6 5,46,079.0 20,26,091.7 26,72,209.1 25,62,666.0 30,20,001.6 (General Services) (A to F)
A. Organs of State 14,732.9 9,245.5 18,819.4 10,112.9 54,017.1 90,269.5 98,242.4 87,793.7
B. Fiscal Services (i + ii) 6,869.9 8,086.1 8,009.3 7,869.8 85,572.6 1,06,061.6 1,08,350.8 1,16,815.7
i) Collection of Taxes and Duties 6,864.9 8,081.1 8,004.3 7,861.8 85,104.8 1,05,409.3 1,07,698.6 1,16,197.6
ii) Other Fiscal Services 5.0 5.0 5.0 8.0 467.8 652.2 652.2 618.2
C. Interest Payments and Servicing of Debt (1 + 2)
90,275.4 1,06,054.6 1,00,508.7 1,10,615.2 4,98,833.8 5,50,000.0 5,85,000.0 6,50,000.0
1. Appropriation for Reduction or Avoidance of Debt
22,500.0 22,500.0 22,500.0 22,500.0 - - - -
2. Interest Payments (i to iv) 67,775.4 83,554.6 78,008.7 88,115.2 4,98,833.8 5,50,000.0 5,85,000.0 6,50,000.0
i) Interest on Loans from the Centre 1,350.6 1,437.8 1,177.9 1,229.3 32,651.6 32,373.2 32,375.4 30,211.6
ii) Interest on Internal Debt 60,012.1 72,245.7 67,065.0 70,770.9 3,00,102.3 3,62,134.9 3,87,027.5 4,26,048.4
of which:
(a) Interest on Market Loans 50,514.4 60,464.6 57,359.6 60,556.1 1,36,240.7 1,76,660.3 2,01,552.8 2,26,953.3
(b) Interest on NSSF 1,452.7 2,000.0 1,327.5 1,327.5 1,03,987.4 95,985.7 95,985.7 87,854.9
iii) Interest on Small Savings, State Provident Funds, etc.
6,412.7 9,871.1 9,765.8 16,115.0 1,66,080.0 1,55,491.8 1,65,597.2 1,93,700.0
iv) Others - - - - - - - 40.0
D. Administrative Services (i to v) 1,93,189.7 2,06,304.0 2,21,346.3 2,16,161.5 5,15,326.8 6,81,646.0 5,96,840.7 7,79,360.1
i) Secretariat - General Services 12,959.1 11,281.0 12,298.0 14,598.5 19,091.9 1,44,898.2 47,559.7 1,88,223.5
ii) District Administration 13,738.6 16,438.5 16,223.5 16,910.2 18,339.1 21,273.0 21,287.1 23,492.0
iii) Police 1,31,345.5 1,40,935.7 1,53,204.7 1,45,016.8 2,97,190.6 3,24,234.8 3,34,354.5 3,57,083.6
iv) Public Works 15,892.4 16,154.2 16,257.1 15,999.5 1,02,813.1 1,00,236.3 1,00,809.2 1,04,809.1
v) Others ++ 19,254.2 21,494.6 23,363.1 23,636.6 77,892.1 91,003.8 92,830.3 1,05,752.0
E. Pensions 1,26,409.8 1,78,644.2 1,72,486.2 2,00,783.4 8,69,285.8 11,91,200.0 11,21,200.0 13,33,000.0
F. Miscellaneous General Services 462.7 513.4 600.8 536.2 3,055.6 53,032.0 53,032.0 53,032.0
of which:
Payment on account of State Lotteries 276.2 297.2 376.1 308.5 - - - -
III. Grants-in-Aid and Contributions - - - - 1,26,265.6 1,36,981.2 1,36,981.2 1,44,033.2
of which:
Compensation and Assignments to Local Bodies and Panchayati Raj Institutions - - - - 1,26,265.6 1,36,981.2 1,36,981.2 1,44,033.2
Appendix II : Revenue Expenditure of States and Union Territories with Legislature (Contd.)
(₹ Lakh)

Appendix II
237
Item
PUNJAB RAJASTHAN
2017-18(Accounts)
2018-19(Budget
Estimates)
2018-19(Revised
Estimates)
2019-20(Budget
Estimates)
2017-18(Accounts)
2018-19(Budget
Estimates)
2018-19(Revised
Estimates)
2019-20(Budget
Estimates)
1 2 3 4 5 2 3 4 5
TOTAL EXPENDITURE (I+II+III) 62,46,485.4 86,35,127.2 82,31,796.5 90,19,695.7 1,45,84,151.8 1,69,11,835.3 1,73,00,891.5 1,91,01,960.8
I. DEVELOPMENTAL EXPENDITURE (A + B) 26,66,414.3 44,03,170.8 41,28,288.5 44,21,021.9 1,02,39,105.5 1,15,75,784.0 1,17,99,211.6 1,32,73,930.4
A. Social Services (1 to 12) 15,46,974.3 21,31,256.4 20,09,753.6 22,80,579.4 53,06,407.1 64,45,623.3 68,25,822.6 76,62,674.3
1. Education, Sports, Art and Culture 9,31,238.9 11,21,274.5 11,10,812.3 12,42,344.7 26,66,808.3 33,72,135.4 35,33,533.1 39,20,601.0
2. Medical and Public Health 2,53,395.3 3,28,554.0 3,04,209.8 3,55,855.5 6,69,696.8 9,04,927.7 8,72,982.2 9,06,622.0
3. Family Welfare 21,250.4 28,033.3 21,679.8 23,773.7 2,64,515.7 2,78,966.4 2,85,209.8 3,18,262.2
4. Water Supply and Sanitation 36,040.5 57,424.1 48,324.1 54,964.1 3,00,686.4 3,16,310.4 3,48,378.4 3,60,255.3
5. Housing 36,694.2 73,774.7 56,822.7 57,678.6 5,594.0 6,490.4 6,526.3 7,113.4
6. Urban Development 3,737.4 7,700.5 8,509.2 4,596.8 4,16,663.3 5,03,350.1 4,64,635.0 5,26,784.0
7. Welfare of Scheduled Castes, Scheduled Tribes and Other Backward Classes 29,304.9 1,19,569.7 72,121.3 1,16,495.4 1,32,798.9 1,56,224.7 1,61,394.9 1,72,072.9
8. Labour and Labour Welfare 21,987.7 36,878.6 24,972.7 41,802.2 54,871.2 64,577.3 62,458.3 1,17,680.0
9. Social Security and Welfare 1,73,006.4 2,65,657.3 2,82,647.0 2,86,706.8 4,79,681.5 4,98,955.3 6,15,963.3 8,12,896.8
10. Nutrition 4,131.4 15,985.3 13,336.5 25,493.9 1,47,786.4 1,98,874.3 2,23,787.4 2,50,788.3
11. Relief on account of Natural Calamities 28,380.4 68,441.2 56,113.5 59,135.2 1,52,513.0 1,28,771.6 2,23,486.6 2,51,541.7
12. Others* 7,806.8 7,963.3 10,205.0 11,732.7 14,791.8 16,039.8 27,467.3 18,056.5
B. Economic Services (1 to 9) 11,19,440.0 22,71,914.3 21,18,535.0 21,40,442.5 49,32,698.5 51,30,160.7 49,73,389.0 56,11,256.1
1. Agriculture and Allied Activities (i to xii) 7,48,712.6 15,42,031.2 14,61,222.3 14,47,575.8 5,11,355.6 8,22,643.3 8,97,004.1 9,74,407.5
i) Crop Husbandry 6,31,807.8 14,01,928.7 13,29,880.9 12,90,284.6 2,56,735.2 3,03,078.4 2,80,246.3 2,96,201.8
ii) Soil and Water Conservation 8,136.9 11,479.4 11,970.5 12,392.9 6,225.1 5,190.7 7,022.2 5,424.0
iii) Animal Husbandry 39,941.8 50,054.3 48,630.6 52,357.3 99,743.4 1,28,816.1 1,22,856.1 1,54,786.7
iv) Dairy Development 1,072.7 1,581.9 1,426.8 3,603.5 177.5 401.0 3,913.2 20,000.0
v) Fisheries 1,803.1 2,473.8 1,939.3 2,075.9 1,210.8 1,936.2 1,495.1 1,682.8
vi) Forestry and Wild Life 14,216.1 19,504.7 18,042.7 19,806.8 71,669.5 85,944.9 78,956.7 82,490.6
vii) Plantations - - - - - - - -
viii) Food Storage and Warehousing - - - 12,000.0 - - - -
ix) Agricultural Research and Education 43,185.9 40,046.7 37,333.3 39,949.9 23,992.0 26,690.0 27,860.3 29,405.2
x) Agricultural Finance Institutions - - - - - - - -
xi) Co-operation 7,768.8 14,961.8 11,998.2 15,104.9 50,617.8 2,69,419.5 3,73,471.2 3,83,267.2
xii) Other Agricultural Programmes 779.6 - - - 984.5 1,166.5 1,183.0 1,149.2
2. Rural Development 32,179.3 60,169.8 58,760.3 91,270.7 15,01,493.5 14,96,955.7 13,33,998.2 13,94,811.8
3. Special Area Programmes - - - - 174.0 278.0 222.0 301.0
4. Irrigation and Flood Control 1,18,318.7 1,26,921.5 1,20,763.4 1,31,560.8 2,05,706.9 2,33,350.1 1,74,190.0 1,90,336.5
of which:
i) Major and Medium Irrigation 92,191.1 99,906.9 96,752.7 1,04,265.7 1,89,514.3 2,15,506.3 1,56,053.7 1,73,448.4
ii) Minor Irrigation 13,524.0 13,434.7 12,277.0 14,536.7 14,374.2 15,543.9 15,924.7 14,637.2
iii) Flood Control and Drainage 12,603.6 13,579.9 11,733.8 12,758.4 - - - -
5. Energy 1,31,859.8 2,95,420.0 2,34,652.7 2,06,722.0 23,45,573.7 22,62,733.3 21,21,621.6 25,73,066.4
of which: Power 1,31,781.0 2,95,300.0 2,34,532.7 2,06,582.0 23,44,256.3 22,60,746.8 21,20,888.1 25,72,315.2
6. Industry and Minerals (i to iii) 5,697.0 1,65,884.9 1,55,258.8 1,72,824.7 34,824.6 33,194.1 28,552.5 55,674.5
i) Village and Small Industries 4,941.7 12,640.6 8,559.5 12,988.9 5,224.4 9,879.8 4,803.1 5,427.6
ii) Industries@ 755.2 1,53,244.3 1,46,699.3 1,59,835.7 29,600.2 23,314.2 23,749.4 50,246.9
iii) Others** - - - - - - - -
Appendix II : Revenue Expenditure of States and Union Territories with Legislature (Contd.)
(₹ Lakh)

State Finances : A Study of Budgets of 2019-20
238
Item
PUNJAB RAJASTHAN
2017-18(Accounts)
2018-19(Budget
Estimates)
2018-19(Revised
Estimates)
2019-20(Budget
Estimates)
2017-18(Accounts)
2018-19(Budget
Estimates)
2018-19(Revised
Estimates)
2019-20(Budget
Estimates)
1 2 3 4 5 2 3 4 5
7. Transport and Communications (i + ii) 55,185.7 39,901.8 52,339.2 54,411.3 2,17,740.4 1,67,406.1 2,14,786.9 2,68,838.9
i) Roads and Bridges 26,286.7 5,450.0 18,682.0 19,800.0 1,59,335.9 1,38,463.7 1,53,847.7 2,38,899.7
ii) Others @@ 28,899.0 34,451.8 33,657.2 34,611.3 58,404.6 28,942.4 60,939.2 29,939.2
8. Science, Technology and Environment 456.2 1,736.8 547.7 1,831.4 1,984.6 3,721.3 2,590.1 2,642.8
9. General Economic Services (i to iv) 27,030.7 39,848.3 34,990.5 34,245.9 1,13,845.2 1,09,878.8 2,00,423.7 1,51,176.8
i) Secretariat - Economic Services 2,511.3 13,788.4 4,613.7 5,652.6 23,313.7 5,099.6 3,934.5 4,516.3
ii) Tourism 383.9 860.4 524.6 771.4 13,534.9 11,815.2 9,577.0 6,960.9
iii) Civil Supplies 21,005.7 22,586.9 27,117.6 24,471.9 31,852.0 40,401.5 48,876.9 64,264.1
iv) Others + 3,129.9 2,612.8 2,734.6 3,350.0 45,144.6 52,562.5 1,38,035.4 75,435.5
II. NON-DEVELOPMENTAL EXPENDITURE 34,49,951.2 38,05,089.2 37,49,310.1 40,75,348.8 43,45,035.3 53,36,030.5 55,01,666.1 58,28,009.2 (General Services) (A to F)
A. Organs of State 75,992.4 90,943.1 97,969.0 1,20,425.8 1,02,612.9 1,44,559.7 1,68,779.8 1,79,468.8
B. Fiscal Services (i + ii) 43,106.2 47,746.2 48,213.5 53,148.7 2,09,730.9 2,64,101.2 2,35,691.4 2,19,326.2
i) Collection of Taxes and Duties 41,873.2 45,975.2 46,145.1 51,102.0 2,09,483.2 2,63,795.1 2,35,318.2 2,18,922.4
ii) Other Fiscal Services 1,233.0 1,771.0 2,068.4 2,046.7 247.8 306.1 373.3 403.8
C. Interest Payments and Servicing of Debt (1 + 2)
15,33,396.2 16,26,009.3 16,31,154.4 17,66,925.5 19,71,999.2 21,41,262.1 21,73,737.4 23,13,265.7
1. Appropriation for Reduction or Avoidance of Debt
- - - - - - - -
2. Interest Payments (i to iv) 15,33,396.2 16,26,009.3 16,31,154.4 17,66,925.5 19,71,999.2 21,41,262.1 21,73,737.4 23,13,265.7
i) Interest on Loans from the Centre 15,954.6 12,132.4 14,906.0 19,719.2 41,650.8 42,052.3 45,609.4 47,363.0
ii) Interest on Internal Debt 13,13,319.9 13,85,207.0 13,97,563.7 15,05,390.6 15,79,720.3 17,21,189.5 17,36,132.3 18,80,790.3
of which:
(a) Interest on Market Loans 6,85,010.7 7,95,100.0 8,10,505.0 9,43,565.8 7,71,549.6 9,72,365.1 9,85,227.2 11,95,584.5
(b) Interest on NSSF 2,30,939.6 1,96,673.0 1,96,673.0 1,79,420.0 1,80,650.3 1,65,563.3 1,65,563.3 1,50,246.4
iii) Interest on Small Savings, State Provident Funds, etc.
1,62,815.5 1,80,276.9 1,66,746.9 1,82,240.7 3,35,133.1 3,65,510.9 3,73,851.5 3,68,217.6
iv) Others 41,306.2 48,392.9 51,937.8 59,574.9 15,495.0 12,509.3 18,144.3 16,894.8
D. Administrative Services (i to v) 7,11,736.3 7,87,884.2 7,90,549.0 8,54,964.9 6,10,874.0 7,64,624.1 8,08,018.1 8,07,618.2
i) Secretariat - General Services 23,675.5 39,527.8 40,135.6 44,222.3 19,106.0 23,853.4 26,434.7 26,160.4
ii) District Administration 34,093.3 36,222.6 37,138.3 39,378.6 44,367.4 49,236.3 49,754.5 53,313.5
iii) Police 5,24,784.5 5,65,404.8 5,72,000.9 6,29,185.6 4,65,962.5 5,94,359.3 6,17,043.5 6,24,535.4
iv) Public Works 42,105.6 44,429.1 47,470.7 43,312.7 5,906.1 -592.2 10,241.3 9,122.7
v) Others ++ 87,077.5 1,02,300.0 93,803.6 98,865.7 75,531.9 97,767.4 1,04,544.1 94,486.2
E. Pensions 10,20,848.9 10,30,450.0 10,25,405.0 10,87,500.0 13,92,523.4 19,71,153.0 20,61,485.1 22,57,968.1
F. Miscellaneous General Services 64,871.2 2,22,056.4 1,56,019.1 1,92,383.9 57,294.9 50,330.5 53,954.3 50,362.4
of which:
Payment on account of State Lotteries 5,340.4 78,021.1 4,455.5 70,280.4 - - - -
III. Grants-in-Aid and Contributions 1,30,120.0 4,26,867.2 3,54,197.8 5,23,325.0 11.0 20.9 13.9 21.2
of which:
Compensation and Assignments to Local Bodies and Panchayati Raj Institutions 1,30,120.0 4,26,867.2 3,54,197.8 5,23,325.0 11.0 20.9 13.9 21.2
Appendix II : Revenue Expenditure of States and Union Territories with Legislature (Contd.)
(₹ Lakh)
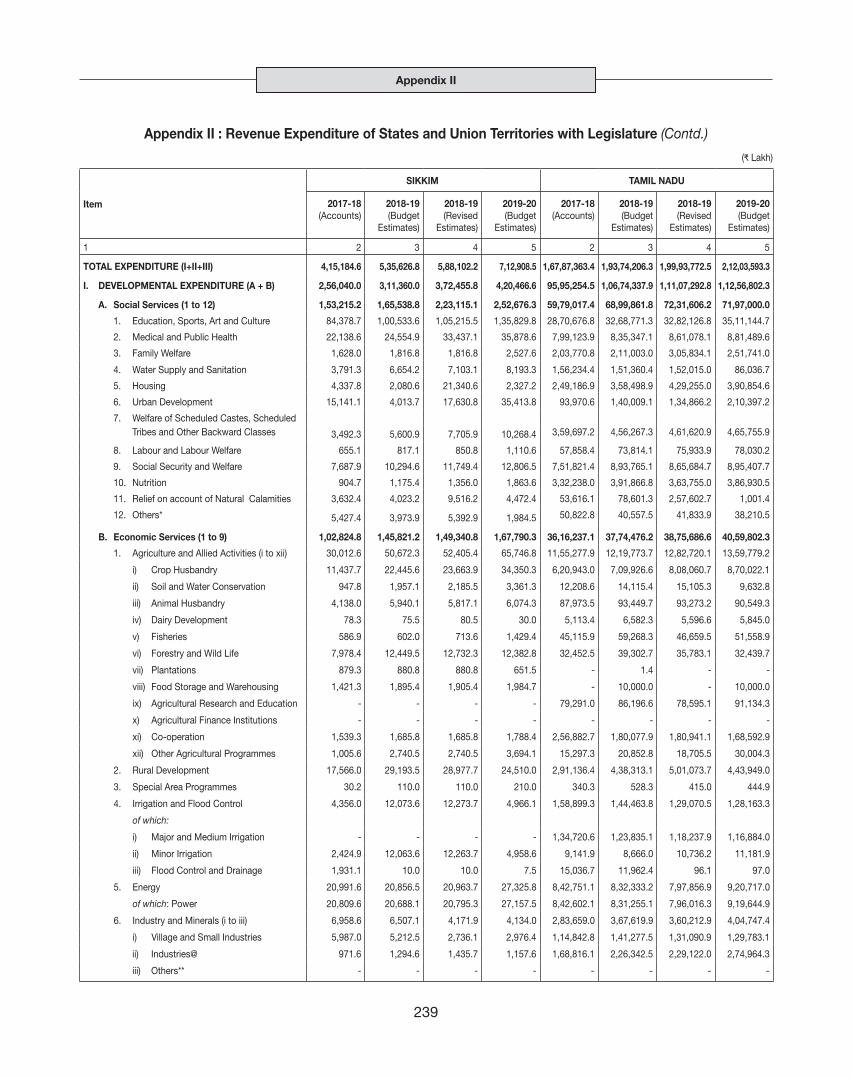
Appendix II
239
Item
SIKKIM TAMIL NADU
2017-18(Accounts)
2018-19(Budget
Estimates)
2018-19(Revised
Estimates)
2019-20(Budget
Estimates)
2017-18(Accounts)
2018-19(Budget
Estimates)
2018-19(Revised
Estimates)
2019-20(Budget
Estimates)
1 2 3 4 5 2 3 4 5
TOTAL EXPENDITURE (I+II+III) 4,15,184.6 5,35,626.8 5,88,102.2 7,12,908.5 1,67,87,363.4 1,93,74,206.3 1,99,93,772.5 2,12,03,593.3
I. DEVELOPMENTAL EXPENDITURE (A + B) 2,56,040.0 3,11,360.0 3,72,455.8 4,20,466.6 95,95,254.5 1,06,74,337.9 1,11,07,292.8 1,12,56,802.3
A. Social Services (1 to 12) 1,53,215.2 1,65,538.8 2,23,115.1 2,52,676.3 59,79,017.4 68,99,861.8 72,31,606.2 71,97,000.0
1. Education, Sports, Art and Culture 84,378.7 1,00,533.6 1,05,215.5 1,35,829.8 28,70,676.8 32,68,771.3 32,82,126.8 35,11,144.7
2. Medical and Public Health 22,138.6 24,554.9 33,437.1 35,878.6 7,99,123.9 8,35,347.1 8,61,078.1 8,81,489.6
3. Family Welfare 1,628.0 1,816.8 1,816.8 2,527.6 2,03,770.8 2,11,003.0 3,05,834.1 2,51,741.0
4. Water Supply and Sanitation 3,791.3 6,654.2 7,103.1 8,193.3 1,56,234.4 1,51,360.4 1,52,015.0 86,036.7
5. Housing 4,337.8 2,080.6 21,340.6 2,327.2 2,49,186.9 3,58,498.9 4,29,255.0 3,90,854.6
6. Urban Development 15,141.1 4,013.7 17,630.8 35,413.8 93,970.6 1,40,009.1 1,34,866.2 2,10,397.2
7. Welfare of Scheduled Castes, Scheduled Tribes and Other Backward Classes 3,492.3 5,600.9 7,705.9 10,268.4 3,59,697.2 4,56,267.3 4,61,620.9 4,65,755.9
8. Labour and Labour Welfare 655.1 817.1 850.8 1,110.6 57,858.4 73,814.1 75,933.9 78,030.2
9. Social Security and Welfare 7,687.9 10,294.6 11,749.4 12,806.5 7,51,821.4 8,93,765.1 8,65,684.7 8,95,407.7
10. Nutrition 904.7 1,175.4 1,356.0 1,863.6 3,32,238.0 3,91,866.8 3,63,755.0 3,86,930.5
11. Relief on account of Natural Calamities 3,632.4 4,023.2 9,516.2 4,472.4 53,616.1 78,601.3 2,57,602.7 1,001.4
12. Others* 5,427.4 3,973.9 5,392.9 1,984.5 50,822.8 40,557.5 41,833.9 38,210.5
B. Economic Services (1 to 9) 1,02,824.8 1,45,821.2 1,49,340.8 1,67,790.3 36,16,237.1 37,74,476.2 38,75,686.6 40,59,802.3
1. Agriculture and Allied Activities (i to xii) 30,012.6 50,672.3 52,405.4 65,746.8 11,55,277.9 12,19,773.7 12,82,720.1 13,59,779.2
i) Crop Husbandry 11,437.7 22,445.6 23,663.9 34,350.3 6,20,943.0 7,09,926.6 8,08,060.7 8,70,022.1
ii) Soil and Water Conservation 947.8 1,957.1 2,185.5 3,361.3 12,208.6 14,115.4 15,105.3 9,632.8
iii) Animal Husbandry 4,138.0 5,940.1 5,817.1 6,074.3 87,973.5 93,449.7 93,273.2 90,549.3
iv) Dairy Development 78.3 75.5 80.5 30.0 5,113.4 6,582.3 5,596.6 5,845.0
v) Fisheries 586.9 602.0 713.6 1,429.4 45,115.9 59,268.3 46,659.5 51,558.9
vi) Forestry and Wild Life 7,978.4 12,449.5 12,732.3 12,382.8 32,452.5 39,302.7 35,783.1 32,439.7
vii) Plantations 879.3 880.8 880.8 651.5 - 1.4 - -
viii) Food Storage and Warehousing 1,421.3 1,895.4 1,905.4 1,984.7 - 10,000.0 - 10,000.0
ix) Agricultural Research and Education - - - - 79,291.0 86,196.6 78,595.1 91,134.3
x) Agricultural Finance Institutions - - - - - - - -
xi) Co-operation 1,539.3 1,685.8 1,685.8 1,788.4 2,56,882.7 1,80,077.9 1,80,941.1 1,68,592.9
xii) Other Agricultural Programmes 1,005.6 2,740.5 2,740.5 3,694.1 15,297.3 20,852.8 18,705.5 30,004.3
2. Rural Development 17,566.0 29,193.5 28,977.7 24,510.0 2,91,136.4 4,38,313.1 5,01,073.7 4,43,949.0
3. Special Area Programmes 30.2 110.0 110.0 210.0 340.3 528.3 415.0 444.9
4. Irrigation and Flood Control 4,356.0 12,073.6 12,273.7 4,966.1 1,58,899.3 1,44,463.8 1,29,070.5 1,28,163.3
of which:
i) Major and Medium Irrigation - - - - 1,34,720.6 1,23,835.1 1,18,237.9 1,16,884.0
ii) Minor Irrigation 2,424.9 12,063.6 12,263.7 4,958.6 9,141.9 8,666.0 10,736.2 11,181.9
iii) Flood Control and Drainage 1,931.1 10.0 10.0 7.5 15,036.7 11,962.4 96.1 97.0
5. Energy 20,991.6 20,856.5 20,963.7 27,325.8 8,42,751.1 8,32,333.2 7,97,856.9 9,20,717.0
of which: Power 20,809.6 20,688.1 20,795.3 27,157.5 8,42,602.1 8,31,255.1 7,96,016.3 9,19,644.9
6. Industry and Minerals (i to iii) 6,958.6 6,507.1 4,171.9 4,134.0 2,83,659.0 3,67,619.9 3,60,212.9 4,04,747.4
i) Village and Small Industries 5,987.0 5,212.5 2,736.1 2,976.4 1,14,842.8 1,41,277.5 1,31,090.9 1,29,783.1
ii) Industries@ 971.6 1,294.6 1,435.7 1,157.6 1,68,816.1 2,26,342.5 2,29,122.0 2,74,964.3
iii) Others** - - - - - - - -
Appendix II : Revenue Expenditure of States and Union Territories with Legislature (Contd.)
(₹ Lakh)

State Finances : A Study of Budgets of 2019-20
240
Item
SIKKIM TAMIL NADU
2017-18(Accounts)
2018-19(Budget
Estimates)
2018-19(Revised
Estimates)
2019-20(Budget
Estimates)
2017-18(Accounts)
2018-19(Budget
Estimates)
2018-19(Revised
Estimates)
2019-20(Budget
Estimates)
1 2 3 4 5 2 3 4 5
7. Transport and Communications (i + ii) 18,375.4 19,965.1 23,819.0 32,863.7 2,13,358.3 1,05,783.4 1,35,499.3 1,38,171.9
i) Roads and Bridges 12,608.6 13,651.0 17,526.3 24,086.6 1,28,151.0 1,02,238.6 1,05,115.9 1,09,650.1
ii) Others @@ 5,766.8 6,314.1 6,292.7 8,777.1 85,207.3 3,544.8 30,383.4 28,521.9
8. Science, Technology and Environment 487.3 1,195.7 1,197.6 1,878.4 1,961.1 2,254.7 2,582.3 1,374.3
9. General Economic Services (i to iv) 4,047.3 5,247.4 5,421.9 6,155.5 6,68,853.9 6,63,406.1 6,66,255.9 6,62,455.3
i) Secretariat - Economic Services 492.9 790.6 805.1 816.4 7,442.7 9,158.1 9,343.2 9,226.2
ii) Tourism 2,344.0 2,830.8 2,960.8 3,730.9 2,480.2 2,623.8 2,735.5 2,623.7
iii) Civil Supplies 113.6 204.4 204.4 235.9 6,22,340.2 6,14,657.6 6,16,340.8 6,14,677.7
iv) Others + 1,096.8 1,421.6 1,451.6 1,372.3 36,590.9 36,966.6 37,836.4 35,927.7
II. NON-DEVELOPMENTAL EXPENDITURE 1,52,812.5 2,16,934.8 2,08,287.6 2,82,589.8 60,45,069.3 71,00,575.8 72,91,872.5 80,92,690.5 (General Services) (A to F)
A. Organs of State 8,297.6 9,542.2 11,698.2 14,162.9 1,25,237.7 1,69,633.9 1,78,769.8 2,09,951.3
B. Fiscal Services (i + ii) 8,169.4 5,488.0 5,585.6 7,640.7 1,10,410.6 1,23,355.3 1,21,926.1 1,28,157.5
i) Collection of Taxes and Duties 8,157.1 5,482.0 5,579.6 7,634.7 1,09,512.0 1,22,166.0 1,20,883.9 1,27,049.9
ii) Other Fiscal Services 12.3 6.0 6.0 6.0 898.7 1,189.3 1,042.2 1,107.6
C. Interest Payments and Servicing of Debt (1 + 2)
37,417.3 47,554.0 47,554.0 54,917.9 26,73,309.3 29,67,105.4 29,69,988.7 33,28,398.9
1. Appropriation for Reduction or Avoidance of Debt
1,200.0 1,200.0 1,200.0 1,200.0 72,156.2 94,200.0 99,600.0 82,300.0
2. Interest Payments (i to iv) 36,217.3 46,354.0 46,354.0 53,717.9 26,01,153.2 28,72,905.4 28,70,388.7 32,46,098.9
i) Interest on Loans from the Centre 1,001.3 961.8 961.8 951.1 50,647.5 46,540.7 54,279.0 54,271.6
ii) Interest on Internal Debt 27,749.7 37,332.2 37,332.2 42,941.2 21,16,052.0 23,87,837.7 23,64,348.1 26,68,329.5
of which:
(a) Interest on Market Loans 24,095.1 33,417.5 33,417.5 39,297.3 17,71,931.1 20,92,248.3 20,45,714.7 24,04,491.0
(b) Interest on NSSF 1,270.9 1,574.9 1,574.9 1,448.5 2,21,892.7 2,05,043.0 2,05,043.0 1,87,925.8
iii) Interest on Small Savings, State Provident Funds, etc.
7,466.3 8,060.0 8,060.0 9,825.6 3,96,933.2 4,23,205.2 4,32,396.2 5,06,472.5
iv) Others - - - - 37,520.4 15,321.8 19,365.3 17,025.3
D. Administrative Services (i to v) 46,707.1 74,051.1 73,073.4 81,122.6 8,72,315.0 10,62,580.6 10,88,905.6 10,85,224.9
i) Secretariat - General Services 4,334.8 19,856.6 20,399.6 8,983.1 26,595.8 37,636.3 38,788.1 27,834.4
ii) District Administration 2,086.4 2,445.4 2,450.4 3,332.1 1,13,195.5 1,32,611.0 1,27,684.9 1,32,617.8
iii) Police 28,357.5 37,581.4 35,346.0 50,571.3 5,73,089.9 7,12,052.1 7,20,635.8 7,31,803.7
iv) Public Works 2,607.0 3,646.1 4,148.4 6,688.3 37,696.8 42,617.2 46,575.0 44,658.7
v) Others ++ 9,321.4 10,521.8 10,729.1 11,547.9 1,21,736.9 1,37,664.0 1,55,221.8 1,48,310.3
E. Pensions 50,518.3 64,146.1 64,222.9 1,18,582.9 22,35,987.2 27,48,186.1 28,21,144.7 32,39,530.3
F. Miscellaneous General Services 1,702.9 16,153.4 6,153.4 6,162.8 27,809.5 29,714.6 1,11,137.6 1,01,427.6
of which:
Payment on account of State Lotteries 160.6 177.0 177.0 218.4 - - - -
III. Grants-in-Aid and Contributions 6,332.0 7,332.0 7,358.8 9,852.1 11,47,039.6 15,99,292.6 15,94,607.2 18,54,100.6
of which:
Compensation and Assignments to Local Bodies and Panchayati Raj Institutions 6,332.0 7,332.0 7,358.8 9,852.1 11,47,039.6 15,99,292.6 15,94,607.2 18,54,100.6
Appendix II : Revenue Expenditure of States and Union Territories with Legislature (Contd.)
(₹ Lakh)

Appendix II
241
Item
TELANGANA TRIPURA
2017-18(Accounts)
2018-19(Budget
Estimates)
2018-19(Revised
Estimates)
2019-20(Budget
Estimates)
2017-18(Accounts)
2018-19(Budget
Estimates)
2018-19(Revised
Estimates)
2019-20(Budget
Estimates)
1 2 3 4 5 2 3 4 5
TOTAL EXPENDITURE (I+II+III) 85,36,472.1 1,25,45,470.2 1,19,02,693.6 1,11,05,584.3 10,35,722.0 13,10,897.0 12,80,113.3 14,06,132.7
I. DEVELOPMENTAL EXPENDITURE (A + B) 54,45,951.1 92,94,234.3 86,76,128.3 77,89,248.1 5,87,677.4 7,28,185.1 7,31,082.4 8,14,202.9
A. Social Services (1 to 12) 37,25,929.1 55,36,530.9 52,48,923.4 42,05,123.5 4,34,861.1 5,39,863.1 5,41,644.7 6,20,733.1
1. Education, Sports, Art and Culture 12,24,593.8 12,52,945.0 12,22,032.5 9,55,561.2 2,14,273.5 2,89,982.8 2,57,586.9 2,69,053.6
2. Medical and Public Health 3,40,807.5 4,80,219.0 4,44,866.0 3,72,590.2 47,911.2 60,481.0 58,189.0 64,845.0
3. Family Welfare 1,36,032.5 1,62,040.5 1,48,905.8 1,29,550.4 16,491.6 22,196.0 27,025.1 21,910.3
4. Water Supply and Sanitation 89,686.9 54,197.1 54,011.4 24,586.1 14,869.7 18,121.5 16,851.7 17,809.6
5. Housing 55,141.5 2,72,886.4 2,72,886.4 39,157.4 124.4 115.9 920.0 37,245.1
6. Urban Development 1,51,516.7 5,80,759.6 5,61,966.8 2,39,881.0 10,555.7 11,719.0 13,090.5 51,343.2
7. Welfare of Scheduled Castes, Scheduled Tribes and Other Backward Classes 7,86,203.2 14,50,322.2 13,49,321.4 9,26,301.9 33,417.1 40,575.7 44,487.7 39,006.5
8. Labour and Labour Welfare 17,477.2 38,810.0 35,328.1 21,202.6 5,123.6 6,046.0 4,236.6 7,473.9
9. Social Security and Welfare 5,88,815.4 7,51,224.9 7,28,514.3 11,30,254.7 64,389.6 69,566.7 82,929.9 95,662.3
10. Nutrition 2,91,598.0 3,96,269.9 3,74,718.2 3,20,541.8 20,752.0 5,613.0 11,686.0 8,570.1
11. Relief on account of Natural Calamities 6,013.9 35,986.7 4,792.0 10,174.6 3,454.8 11,774.7 21,055.1 3,960.0
12. Others* 38,042.5 60,869.6 51,580.7 35,321.5 3,497.9 3,671.0 3,586.3 3,853.6
B. Economic Services (1 to 9) 17,20,022.0 37,57,703.5 34,27,204.9 35,84,124.6 1,52,816.3 1,88,322.0 1,89,437.7 1,93,469.8
1. Agriculture and Allied Activities (i to xii) 6,56,007.3 16,89,592.5 16,34,777.4 21,64,364.3 66,291.4 84,279.7 88,846.2 96,268.0
i) Crop Husbandry 1,12,016.3 15,01,796.1 14,61,276.9 13,91,540.0 33,076.5 46,919.0 51,380.2 53,158.6
ii) Soil and Water Conservation 8,069.9 32,740.3 27,359.5 3,859.5 907.7 1,152.7 3,857.3 5,368.2
iii) Animal Husbandry 34,923.2 53,447.8 48,961.6 40,777.3 12,409.4 10,669.9 9,941.1 10,802.2
iv) Dairy Development - - - - 187.1 654.7 165.4 682.5
v) Fisheries 4,239.0 10,957.8 9,794.1 5,152.8 4,379.3 6,479.2 5,708.8 5,953.0
vi) Forestry and Wild Life 48,883.8 31,401.0 31,113.7 77,381.7 10,340.6 11,730.4 11,977.3 13,997.8
vii) Plantations - - - - - 50.0 - -
viii) Food Storage and Warehousing 298.0 403.2 187.5 210.8 2,615.5 3,695.2 3,356.0 3,653.0
ix) Agricultural Research and Education 36,245.9 46,794.6 44,238.4 35,267.8 101.4 107.1 81.7 105.6
x) Agricultural Finance Institutions - - - - - - - -
xi) Co-operation 9,060.9 11,136.6 10,930.7 9,266.4 2,266.4 2,821.5 2,378.4 2,547.2
xii) Other Agricultural Programmes 4,02,270.3 915.1 915.1 6,00,908.0 7.5 - - -
2. Rural Development 3,79,049.5 3,65,810.6 3,47,595.7 4,10,349.2 36,515.5 50,973.1 51,199.4 54,592.5
3. Special Area Programmes - - - - 529.9 408.4 378.4 466.0
4. Irrigation and Flood Control 39,836.5 8,24,948.4 6,08,017.6 70,368.3 6,548.7 7,563.7 8,508.0 8,998.8
of which:
i) Major and Medium Irrigation 34,908.2 8,12,842.8 5,95,912.0 63,560.3 9.7 12.5 9.4 9.5
ii) Minor Irrigation 3,212.3 6,087.7 6,087.7 4,342.4 5,073.3 4,538.8 6,545.1 6,417.7
iii) Flood Control and Drainage - - - - 1,465.7 3,012.5 1,953.5 2,571.7
5. Energy 4,39,080.7 5,05,160.8 5,04,230.4 8,10,976.5 6,476.5 6,056.2 2,934.6 1,088.0
of which: Power 4,35,025.6 5,02,666.0 5,02,021.9 8,10,098.7 5,899.9 6,013.0 2,769.9 1,088.0
6. Industry and Minerals (i to iii) 82,569.8 1,54,717.8 1,29,893.4 33,098.1 7,131.8 9,595.8 6,950.0 7,350.5
i) Village and Small Industries 24,559.8 41,495.6 35,342.1 8,983.9 5,093.7 7,173.8 5,853.0 6,267.5
ii) Industries@ 57,348.9 1,01,847.5 85,190.8 22,368.2 273.8 - - -
iii) Others** 661.0 11,374.7 9,360.5 1,746.1 1,764.3 2,422.0 1,097.0 1,083.0
Appendix II : Revenue Expenditure of States and Union Territories with Legislature (Contd.)
(₹ Lakh)

State Finances : A Study of Budgets of 2019-20
242
Item
TELANGANA TRIPURA
2017-18(Accounts)
2018-19(Budget
Estimates)
2018-19(Revised
Estimates)
2019-20(Budget
Estimates)
2017-18(Accounts)
2018-19(Budget
Estimates)
2018-19(Revised
Estimates)
2019-20(Budget
Estimates)
1 2 3 4 5 2 3 4 5
7. Transport and Communications (i + ii) 59,479.5 1,15,385.1 1,14,927.6 68,672.5 17,271.7 16,810.1 16,841.7 14,962.1
i) Roads and Bridges 32,089.7 60,782.6 60,780.8 15,849.7 11,896.5 10,900.0 10,900.0 10,700.0
ii) Others @@ 27,389.8 54,602.5 54,146.7 52,822.8 5,375.2 5,910.1 5,941.7 4,262.1
8. Science, Technology and Environment 1,140.3 2,009.9 1,720.1 1,021.3 215.9 894.0 502.7 632.4
9. General Economic Services (i to iv) 62,858.5 1,00,078.4 86,042.8 25,274.4 11,834.8 11,740.9 13,276.8 9,111.5
i) Secretariat - Economic Services 46,016.8 70,125.3 58,800.6 12,026.1 361.9 437.4 392.2 423.3
ii) Tourism 3,065.4 3,793.6 3,263.6 705.6 331.5 324.6 323.9 355.2
iii) Civil Supplies 7,861.5 18,009.3 15,942.1 5,134.7 9,936.3 9,360.5 10,952.4 6,755.5
iv) Others + 5,914.9 8,150.3 8,036.6 7,408.0 1,205.0 1,618.5 1,608.2 1,577.5
II. NON-DEVELOPMENTAL EXPENDITURE 30,87,221.2 32,47,919.4 32,23,248.8 33,15,326.2 4,37,433.8 5,59,211.9 5,25,030.9 5,65,129.8 (General Services) (A to F)
A. Organs of State 65,091.3 1,05,175.4 1,02,304.1 86,973.6 18,564.1 23,254.0 21,195.7 23,703.9
B. Fiscal Services (i + ii) 76,205.5 87,213.5 84,532.3 74,343.2 8,590.7 9,651.5 8,896.8 9,249.9
i) Collection of Taxes and Duties 76,205.5 87,141.5 84,473.1 74,343.2 8,242.7 9,228.2 8,476.1 8,818.3
ii) Other Fiscal Services - 72.0 59.2 - 348.0 423.4 420.6 431.6
C. Interest Payments and Servicing of Debt (1 + 2)
10,83,553.8 11,79,111.4 11,79,644.4 14,58,473.3 88,688.9 1,14,682.0 92,647.9 98,981.1
1. Appropriation for Reduction or Avoidance of Debt
- 10,000.0 10,000.0 1,000.0 - - - -
2. Interest Payments (i to iv) 10,83,553.8 11,69,111.4 11,69,644.4 14,57,473.3 88,688.9 1,14,682.0 92,647.9 98,981.1
i) Interest on Loans from the Centre 22,048.1 49,165.6 49,165.6 54,011.7 2086.9333 4,160.1 1609.7100 1770.6900
ii) Interest on Internal Debt 9,98,503.7 10,38,544.4 10,39,077.4 13,36,961.7 57,144.8 74,303.8 61,461.1 64,687.6
of which:
(a) Interest on Market Loans 7,91,609.4 8,31,555.0 8,31,555.0 11,00,733.1 36461.1461 59,084.5 42054.8600 45737.8400
(b) Interest on NSSF 98,727.4 96,424.5 96,424.5 90,542.1 13691.4070 7,054.3 11969.1400 13166.0500
iii) Interest on Small Savings, State Provident Funds, etc.
63,002.0 81,401.4 81,401.4 76,499.8 29457.1375 36,098.1 29457.1300 32402.8400
iv) Others - - - -10,000.0 - 120.0 120.0 120.0
D. Administrative Services (i to v) 6,69,173.4 7,06,642.8 6,86,744.3 6,62,166.9 1,63,670.7 2,09,024.1 1,94,074.9 2,04,157.4
i) Secretariat - General Services 13,923.3 50,051.1 47,169.4 18,270.2 6,399.3 7,303.1 7,918.7 8,462.0
ii) District Administration 86,012.1 1,16,435.2 1,15,817.9 1,02,839.2 6,481.5 8,374.1 7,396.0 8,315.5
iii) Police 4,94,436.3 4,38,144.6 4,23,098.5 4,60,897.0 1,14,788.0 1,36,800.1 1,36,970.8 1,32,073.5
iv) Public Works 17,968.4 25,506.7 25,492.5 23,661.3 20,196.1 24,577.5 23,339.6 24,598.3
v) Others ++ 56,833.4 76,505.3 75,165.9 56,499.2 15,805.8 31,969.3 18,449.8 30,708.1
E. Pensions 11,93,166.2 11,69,759.7 11,70,009.7 10,33,267.6 1,57,918.8 2,02,600.0 2,08,215.4 2,29,037.0
F. Miscellaneous General Services 31.1 16.7 14.0 101.7 0.6 0.3 0.3 0.5
of which:
Payment on account of State Lotteries - - - - - - - -
III. Grants-in-Aid and Contributions 3,299.8 3,316.5 3,316.5 1,010.0 10,610.9 23,500.0 24,000.0 26,800.0
of which:
Compensation and Assignments to Local Bodies and Panchayati Raj Institutions 3,299.8 3,316.5 3,316.5 1,010.0 10,610.9 23,500.0 24,000.0 26,800.0
Appendix II : Revenue Expenditure of States and Union Territories with Legislature (Contd.)
(₹ Lakh)

Appendix II
243
Item
UTTARAKHAND UTTAR PRADESH
2017-18(Accounts)
2018-19(Budget
Estimates)
2018-19(Revised
Estimates)
2019-20(Budget
Estimates)
2017-18(Accounts)
2018-19(Budget
Estimates)
2018-19(Revised
Estimates)
2019-20(Budget
Estimates)
1 2 3 4 5 2 3 4 5
TOTAL EXPENDITURE (I+II+III) 29,08,268.9 35,62,730.8 34,72,663.1 38,93,269.7 2,66,22,351.8 3,21,52,027.3 3,32,77,406.4 3,63,95,704.2
I. DEVELOPMENTAL EXPENDITURE (A + B) 15,20,564.6 19,48,160.0 18,34,719.7 20,99,733.0 1,48,88,644.3 1,73,08,842.4 1,83,57,550.3 1,99,78,435.4
A. Social Services (1 to 12) 10,92,943.5 13,98,792.1 12,95,845.1 14,80,971.8 84,25,168.3 1,10,66,385.4 1,11,08,178.4 1,28,74,837.7
1. Education, Sports, Art and Culture 6,45,407.9 7,70,641.7 7,23,119.5 8,32,633.5 46,14,089.6 55,16,109.0 55,46,929.0 60,77,362.9
2. Medical and Public Health 1,43,802.9 2,15,588.5 1,92,144.6 2,31,739.0 9,49,901.8 12,40,084.8 11,87,945.0 13,24,779.3
3. Family Welfare 11,736.0 14,298.7 12,980.9 14,747.8 5,29,343.7 6,48,669.4 6,04,480.7 7,30,672.6
4. Water Supply and Sanitation 44,289.5 30,066.9 32,620.1 35,704.1 1,15,529.3 1,46,750.0 1,49,250.0 3,21,413.0
5. Housing 237.0 560.0 560.0 746.0 17,089.0 79,784.5 82,902.2 75,618.1
6. Urban Development 17,373.5 30,580.5 20,052.8 24,513.9 5,17,800.0 9,86,595.4 9,84,712.1 14,22,515.2
7. Welfare of Scheduled Castes, Scheduled Tribes and Other Backward Classes 24,627.1 43,391.9 34,425.9 46,378.4 4,68,683.7 5,60,240.2 5,80,301.0 6,29,499.3
8. Labour and Labour Welfare 13,484.1 27,150.3 20,918.7 29,581.2 88,039.3 1,26,106.4 1,19,959.3 1,26,570.2
9. Social Security and Welfare 1,34,116.3 1,82,855.9 1,77,820.0 1,98,588.3 10,05,625.8 15,43,322.6 16,05,479.7 19,17,529.0
10. Nutrition - - - - - - - -
11. Relief on account of Natural Calamities 51,874.7 72,026.0 66,296.1 57,363.4 74,744.8 1,67,183.0 1,94,715.5 1,85,442.5
12. Others* 5,994.7 11,631.6 14,906.5 8,976.2 44,321.2 51,540.2 51,504.0 63,435.5
B. Economic Services (1 to 9) 4,27,621.0 5,49,367.9 5,38,874.5 6,18,761.2 64,63,476.0 62,42,457.0 72,49,371.9 71,03,597.7
1. Agriculture and Allied Activities (i to xii) 2,13,219.7 2,65,856.1 2,65,702.2 3,17,239.4 27,26,539.1 13,05,045.3 14,31,484.4 10,81,089.6
i) Crop Husbandry 90,608.7 1,05,964.0 1,15,454.0 1,30,460.1 23,82,926.7 8,19,827.7 9,65,320.3 5,55,437.9
ii) Soil and Water Conservation - - - - 59,626.2 96,702.7 92,720.5 94,586.2
iii) Animal Husbandry 19,070.3 22,438.9 25,481.2 25,488.2 1,15,372.4 1,59,515.4 1,54,489.7 1,73,331.6
iv) Dairy Development 4,157.3 4,668.5 4,878.2 6,336.7 8,944.8 10,987.7 11,169.4 14,199.4
v) Fisheries 1,595.6 2,516.1 2,502.7 2,622.6 8,405.2 14,717.8 13,941.3 18,482.5
vi) Forestry and Wild Life 55,459.5 73,856.9 70,824.1 96,406.2 61,955.8 82,439.1 77,180.8 90,952.9
vii) Plantations 60.0 70.0 70.0 70.0 516.2 804.4 749.9 865.8
viii) Food Storage and Warehousing 17,336.6 23,114.0 18,618.8 20,764.2 24,036.5 27,528.8 25,689.3 30,581.1
ix) Agricultural Research and Education 18,729.2 24,287.0 20,287.0 25,805.8 21,634.6 25,944.1 25,780.3 28,876.6
x) Agricultural Finance Institutions - - - - - - - -
xi) Co-operation 6,202.6 8,940.7 7,586.2 9,285.7 41,230.4 64,174.8 62,211.0 71,418.4
xii) Other Agricultural Programmes 1,890.4 2,402.9 2,232.1 2,357.4
2. Rural Development 1,26,640.2 1,58,609.9 1,59,574.7 1,69,352.7 17,08,630.1 19,86,492.1 31,03,704.6 25,13,187.9
3. Special Area Programmes - - - - 7,261.0 15,925.0 14,692.6 15,600.0
4. Irrigation and Flood Control 40,744.1 49,400.7 43,486.7 52,179.6 6,98,060.9 7,99,461.9 7,70,504.0 10,26,839.3
of which:
i) Major and Medium Irrigation 31,607.2 38,786.3 32,983.2 39,215.7 4,37,362.7 5,66,866.6 5,40,584.3 6,36,784.8
ii) Minor Irrigation 8,646.4 10,114.4 10,003.5 12,363.9 2,33,270.6 2,00,996.7 1,99,469.1 2,77,399.9
iii) Flood Control and Drainage 490.4 500.0 500.0 600.0 14,380.0 10,890.0 10,890.0 34,527.7
5. Energy 1,208.6 1,341.9 1,401.9 1,466.1 7,16,154.1 12,90,808.9 10,41,594.9 16,04,761.6
of which: Power 29.1 22.8 32.8 33.3 6,83,685.3 12,56,566.6 10,03,202.6 15,69,683.0
6. Industry and Minerals (i to iii) 10,838.1 18,310.0 15,462.7 18,948.1 1,30,839.8 3,17,270.1 3,64,790.0 2,87,832.4
i) Village and Small Industries 9,959.7 16,766.9 14,008.8 17,636.7 59,586.7 92,166.9 88,972.2 96,870.0
ii) Industries@ 878.4 1,543.1 1,453.8 1,311.3 35,613.0 1,13,175.6 1,58,834.2 80,812.4
iii) Others** - - - - 35,640.1 1,11,927.6 1,16,983.6 1,10,150.0
Appendix II : Revenue Expenditure of States and Union Territories with Legislature (Contd.)
(₹ Lakh)

State Finances : A Study of Budgets of 2019-20
244
Item
UTTARAKHAND UTTAR PRADESH
2017-18(Accounts)
2018-19(Budget
Estimates)
2018-19(Revised
Estimates)
2019-20(Budget
Estimates)
2017-18(Accounts)
2018-19(Budget
Estimates)
2018-19(Revised
Estimates)
2019-20(Budget
Estimates)
1 2 3 4 5 2 3 4 5
7. Transport and Communications (i + ii) 23,604.9 37,572.0 38,914.5 41,922.2 4,12,524.2 4,43,109.0 4,41,161.4 5,09,623.7
i) Roads and Bridges 18,681.4 28,850.0 30,052.5 31,197.5 3,90,172.6 4,00,514.1 4,01,014.1 4,63,087.5
ii) Others @@ 4,923.5 8,722.0 8,862.0 10,724.7 22,351.7 42,595.0 40,147.4 46,536.2
8. Science, Technology and Environment 2,073.7 3,866.4 2,716.5 3,469.8 5,616.8 6,965.8 7,684.6 8,197.4
9. General Economic Services (i to iv) 9,291.9 14,411.0 11,615.5 14,183.4 57,850.1 77,378.8 73,755.4 56,465.9
i) Secretariat - Economic Services 572.9 1,203.0 1,163.0 992.2 12,566.8 16,470.3 15,687.9 18,488.2
ii) Tourism 5,916.8 7,427.9 5,973.9 8,965.2 4,110.5 12,608.6 12,435.0 12,671.9
iii) Civil Supplies 532.2 1,706.3 1,591.7 869.4 4,601.3 10,453.7 10,078.9 5,459.1
iv) Others + 2,270.0 4,073.9 2,886.9 3,356.5 36,571.5 37,846.2 35,553.5 19,846.7
II. NON-DEVELOPMENTAL EXPENDITURE 12,40,850.5 14,29,207.8 14,54,241.5 15,75,257.7 1,05,78,166.9 1,36,24,432.9 1,37,01,104.1 1,49,67,266.8 (General Services) (A to F)
A. Organs of State 32,279.8 42,404.5 40,967.3 49,132.7 2,54,737.1 3,69,496.4 3,70,775.8 4,30,006.7
B. Fiscal Services (i + ii) 44,045.4 44,248.1 41,784.7 41,312.9 4,00,955.7 4,84,449.6 4,51,457.6 5,31,506.9
i) Collection of Taxes and Duties 43,455.8 43,539.6 41,129.8 40,565.3 3,98,173.4 4,80,764.7 4,48,006.7 5,28,141.1
ii) Other Fiscal Services 589.6 708.4 654.9 747.7 2,782.3 3,684.9 3,450.9 3,365.8
C. Interest Payments and Servicing of Debt (1 + 2)
3,98,728.7 4,97,112.3 5,16,982.3 5,68,219.5 41,36,805.8 58,83,770.4 58,27,465.3 57,23,092.9
1. Appropriation for Reduction or Avoidance of Debt
- 6,500.0 26,500.0 35,000.0 12,23,222.6 26,40,395.0 26,40,395.0 21,85,701.0
2. Interest Payments (i to iv) 3,98,728.7 4,90,612.3 4,90,482.3 5,33,219.5 29,13,583.2 32,43,375.4 31,87,070.3 35,37,391.9
i) Interest on Loans from the Centre 5,650.0 6,100.0 6,100.0 6,100.0 84,982.2 73,450.5 74,450.2 63,905.4
ii) Interest on Internal Debt 3,35,978.4 4,06,294.6 4,06,294.6 4,39,621.7 24,56,499.7 27,95,235.0 27,37,930.3 30,94,932.5
of which:
(a) Interest on Market Loans 1,84,765.2 2,67,592.6 2,67,592.6 2,96,819.7 13,96,763.3 17,20,834.8 16,61,978.3 20,30,918.1
(b) Interest on NSSF 1,27,206.6 1,00,000.0 1,00,000.0 1,00,000.0 6,52,594.3 5,81,513.9 5,81,513.9 5,34,446.4
iii) Interest on Small Savings, State Provident Funds, etc.
52,230.8 61,190.0 61,060.0 65,940.0 3,65,546.7 3,68,154.8 3,68,154.8 3,72,019.0
iv) Others 4,869.5 17,027.8 17,027.8 21,557.8 6,554.5 6,535.0 6,535.0 6,535.0
D. Administrative Services (i to v) 2,62,449.1 3,10,193.1 2,96,427.2 3,22,323.7 19,33,832.9 23,32,427.8 22,84,947.1 29,64,747.6
i) Secretariat - General Services 16,582.7 22,585.5 21,806.5 25,535.8 46,210.0 66,339.8 62,495.0 70,882.3
ii) District Administration 12,699.3 15,329.7 15,080.8 17,664.1 81,959.5 1,04,368.7 97,605.7 1,16,425.2
iii) Police 1,61,313.5 1,85,251.9 1,79,303.8 1,86,765.5 13,96,348.0 15,97,219.5 15,59,351.0 21,02,195.9
iv) Public Works 45,600.1 54,132.3 48,906.0 53,040.6 1,45,488.4 2,63,308.7 2,46,961.6 2,87,874.2
v) Others ++ 26,253.5 32,893.7 31,330.0 39,317.7 2,63,827.1 3,01,191.1 3,18,533.7 3,87,370.0
E. Pensions 5,03,347.5 5,35,249.8 5,58,080.0 5,94,269.0 38,47,649.1 45,49,549.9 47,61,748.8 53,13,431.5
F. Miscellaneous General Services - - - - 4,186.4 4,738.9 4,709.6 4,481.3
of which:
Payment on account of State Lotteries - - - - - - - -
III. Grants-in-Aid and Contributions 1,46,853.8 1,85,363.0 1,83,702.0 2,18,279.0 11,55,540.6 12,18,752.0 12,18,752.0 14,50,002.0
of which:
Compensation and Assignments to Local Bodies and Panchayati Raj Institutions 1,46,853.8 1,85,363.0 1,83,702.0 2,18,279.0 11,55,540.6 12,18,752.0 12,18,752.0 14,50,002.0
Appendix II : Revenue Expenditure of States and Union Territories with Legislature (Contd.)
(₹ Lakh)

Appendix II
245
Item
WEST BENGAL
2017-18(Accounts)
2018-19(Budget
Estimates)
2018-19(Revised
Estimates)
2019-20(Budget
Estimates)
1 2 3 4 5
TOTAL EXPENDITURE (I+II+III) 1,41,07,736.3 1,46,74,776.3 1,60,14,960.4 1,64,32,795.4
I. DEVELOPMENTAL EXPENDITURE (A + B) 88,17,279.9 91,75,784.4 1,02,79,362.3 1,03,51,834.1
A. Social Services (1 to 12) 59,59,075.5 63,33,848.3 68,99,102.4 71,22,837.4
1. Education, Sports, Art and Culture 24,61,377.7 29,86,109.8 28,93,960.0 33,75,686.9
2. Medical and Public Health 7,20,409.7 7,08,982.3 7,47,423.9 7,64,943.6
3. Family Welfare 72,083.5 73,484.2 74,538.3 95,111.1
4. Water Supply and Sanitation 1,29,614.8 1,31,758.7 1,35,687.0 1,33,862.4
5. Housing 14,918.8 16,118.1 1,18,461.3 1,22,001.4
6. Urban Development 6,03,702.6 5,82,264.3 6,22,853.8 6,63,696.7
7. Welfare of Scheduled Castes, Scheduled Tribes and Other Backward Classes 2,20,043.2 1,68,034.5 2,09,542.0 1,77,992.7
8. Labour and Labour Welfare 19,829.6 27,416.2 24,590.3 27,157.7
9. Social Security and Welfare 15,00,930.7 13,93,043.5 17,75,868.4 15,25,985.4
10. Nutrition 1,07,671.3 1,23,387.2 1,32,421.7 1,27,462.3
11. Relief on account of Natural Calamities 57,200.6 47,227.7 70,516.7 24,705.4
12. Others* 51,293.1 76,022.0 93,238.9 84,231.7
B. Economic Services (1 to 9) 28,58,204.4 28,41,936.1 33,80,259.9 32,28,996.7
1. Agriculture and Allied Activities (i to xii) 3,73,045.2 5,06,948.8 8,42,173.7 8,19,979.1
i) Crop Husbandry 1,36,246.1 2,07,584.9 5,76,494.3 5,06,312.0
ii) Soil and Water Conservation 5,813.0 9,562.6 10,581.2 10,245.7
iii) Animal Husbandry 41,954.7 76,844.8 57,192.9 76,877.1
iv) Dairy Development 11,964.9 16,250.6 13,885.3 16,007.9
v) Fisheries 18,696.5 31,304.1 24,903.4 32,750.1
vi) Forestry and Wild Life 47,636.3 71,577.7 64,973.3 76,352.4
vii) Plantations - - - -
viii) Food Storage and Warehousing 36,620.2 22,992.1 22,205.5 23,111.8
ix) Agricultural Research and Education 16,809.0 18,720.6 18,603.6 20,618.2
x) Agricultural Finance Institutions - - - -
xi) Co-operation 32,676.8 30,645.5 30,654.5 35,037.2
xii) Other Agricultural Programmes 24,627.6 21,465.9 22,679.6 22,666.6
2. Rural Development 18,16,215.6 16,78,170.4 18,01,643.4 17,51,904.1
3. Special Area Programmes 1,03,619.8 1,22,584.7 1,36,051.0 1,31,414.0
4. Irrigation and Flood Control 1,05,527.8 1,33,450.8 1,34,196.3 1,37,907.9
of which:
i) Major and Medium Irrigation 30,292.0 37,412.4 37,741.3 39,862.4
ii) Minor Irrigation 37,921.4 45,397.8 49,891.8 45,848.7
iii) Flood Control and Drainage 36,478.9 49,640.6 45,563.3 52,196.7
5. Energy 2,15,819.5 75,013.5 1,05,218.9 66,130.4
of which: Power 2,27,707.9 70,000.0 1,00,099.6 60,000.0
6. Industry and Minerals (i to iii) 30,363.3 1,14,676.4 1,26,492.4 93,329.0
i) Village and Small Industries 23,105.1 65,779.4 57,258.8 53,881.3
ii) Industries@ 7,258.3 48,897.1 69,233.6 39,447.7
iii) Others** - - - -
Appendix II : Revenue Expenditure of States and Union Territories with Legislature (Contd.)
(₹ Lakh)

State Finances : A Study of Budgets of 2019-20
246
Item
WEST BENGAL
2017-18(Accounts)
2018-19(Budget
Estimates)
2018-19(Revised
Estimates)
2019-20(Budget
Estimates)
1 2 3 4 5
7. Transport and Communications (i + ii) 1,71,350.3 1,48,850.3 1,71,451.6 1,54,504.1
i) Roads and Bridges 61,860.3 54,210.7 56,702.1 56,812.4
ii) Others @@ 1,09,490.0 94,639.7 1,14,749.4 97,691.7
8. Science, Technology and Environment 6,622.1 11,397.1 10,939.6 12,573.5
9. General Economic Services (i to iv) 35,641.0 50,844.1 52,093.1 61,254.7
i) Secretariat - Economic Services 11,361.1 14,898.5 15,870.7 17,603.8
ii) Tourism 10,186.2 20,682.0 20,731.9 23,895.4
iii) Civil Supplies 6,817.1 9,676.2 9,881.8 13,257.6
iv) Others + 7,276.6 5,587.4 5,608.7 6,497.9
II. NON-DEVELOPMENTAL EXPENDITURE 52,41,618.1 54,46,789.4 56,84,710.9 60,28,609.3 (General Services) (A to F)
A. Organs of State 77,965.7 1,24,802.4 1,14,136.1 1,21,276.4
B. Fiscal Services (i + ii) 1,07,976.0 1,34,247.8 1,19,715.8 1,30,337.4
i) Collection of Taxes and Duties 1,07,377.9 1,33,402.0 1,19,072.8 1,29,634.5
ii) Other Fiscal Services 598.1 845.8 643.0 702.9
C. Interest Payments and Servicing of Debt (1 + 2)
28,27,375.8 27,53,656.8 29,44,000.7 31,55,116.6
1. Appropriation for Reduction or Avoidance of Debt
20,000.0 40,000.0 30,000.0 40,000.0
2. Interest Payments (i to iv) 28,07,375.8 27,13,656.8 29,14,000.7 31,15,116.6
i) Interest on Loans from the Centre 63,192.3 65,412.7 57,372.8 52,382.7
ii) Interest on Internal Debt 24,93,623.7 24,31,173.2 25,90,692.8 27,83,973.7
of which:
(a) Interest on Market Loans 16,57,885.8 16,67,029.4 18,11,072.9 20,63,402.5
(b) Interest on NSSF 7,86,665.7 7,29,342.5 7,29,342.5 6,70,024.5
iii) Interest on Small Savings, State Provident Funds, etc.
1,21,408.5 1,02,932.1 1,30,975.1 1,41,000.1
iv) Others 1,29,151.3 1,14,138.9 1,34,960.0 1,37,760.2
D. Administrative Services (i to v) 7,46,147.6 8,45,294.3 8,81,756.4 9,75,461.2
i) Secretariat - General Services 23,303.8 27,124.7 28,904.9 30,942.1
ii) District Administration 20,643.4 22,838.5 22,838.1 24,944.4
iii) Police 5,35,583.6 6,04,146.3 6,44,751.0 7,21,010.8
iv) Public Works 65,211.5 73,015.9 70,515.7 74,254.1
v) Others ++ 1,01,405.4 1,18,168.9 1,14,746.8 1,24,309.9
E. Pensions 14,58,807.7 15,71,710.6 15,29,740.9 15,90,657.3
F. Miscellaneous General Services 23,345.3 17,077.5 95,360.9 55,760.3
of which:
Payment on account of State Lotteries 4,660.9 5,704.9 80,153.7 40,038.9
III. Grants-in-Aid and Contributions 48,838.2 52,202.5 50,887.3 52,351.9
of which:
Compensation and Assignments to Local Bodies and Panchayati Raj Institutions 48,838.2 52,202.5 50,887.3 52,351.9
Appendix II : Revenue Expenditure of States and Union Territories with Legislature (Contd.)
(₹ Lakh)

Appendix II
247
Item
NATIONAL CAPITAL TERRITORY OF DELHI PUDUCHERRY
2017-18(Accounts)
2018-19(Budget
Estimates)
2018-19(Revised
Estimates)
2019-20(Budget
Estimates)
2017-18(Accounts)
2018-19(Budget
Estimates)
2018-19(Revised
Estimates)
2019-20(Budget
Estimates)
1 2 3 4 5 2 3 4 5
TOTAL EXPENDITURE (I+II+III) 33,75,402.2 43,09,080.9 39,89,389.3 44,78,130.5 5,80,665.6 6,45,700.0 6,77,078.3 7,30,500.0
I. DEVELOPMENTAL EXPENDITURE (A + B) 25,46,412.1 33,06,128.3 29,23,468.6 32,99,878.5 3,92,838.6 4,27,983.0 4,52,397.1 4,80,055.7
A. Social Services (1 to 12) 19,60,211.4 27,33,509.6 23,90,215.9 26,68,915.7 2,23,479.5 2,40,180.7 2,52,110.1 2,62,206.4
1. Education, Sports, Art and Culture 9,03,932.2 13,23,720.9 10,38,189.7 13,35,744.9 74,938.7 81,863.8 87,219.9 89,785.0
2. Medical and Public Health 4,33,390.2 5,59,485.0 5,35,870.0 6,27,798.0 48,700.0 51,453.8 56,441.9 56,799.5
3. Family Welfare 5,363.5 14,579.0 19,599.0 18,435.0 914.6 1,476.4 1,384.6 1,901.5
4. Water Supply and Sanitation 1,22,578.0 1,46,300.0 1,38,602.0 1,35,185.0 5,069.4 10,300.5 9,328.1 10,950.3
5. Housing 10,261.5 16,544.0 72,789.0 15,224.0 4,649.3 5,993.0 7,999.5 6,308.1
6. Urban Development 1,91,290.1 2,78,210.6 1,92,949.9 1,07,275.8 18,288.0 13,570.6 13,352.2 11,803.6
7. Welfare of Scheduled Castes, Scheduled Tribes and Other Backward Classes 23,678.0 31,741.0 28,452.0 33,560.5 12,713.4 15,413.8 15,105.6 15,363.5
8. Labour and Labour Welfare 13,308.9 39,635.3 16,070.0 20,202.1 3,020.5 3,904.4 3,966.4 4,001.0
9. Social Security and Welfare 2,29,968.2 2,70,227.0 3,04,836.0 3,15,804.4 48,767.8 50,564.4 50,878.9 52,894.2
10. Nutrition 11,002.2 21,752.0 16,706.0 23,233.0 2,860.2 3,086.5 3,362.0 4,031.0
11. Relief on account of Natural Calamities 1,965.5 3,704.0 13,785.0 3,815.0 2,775.3 1,657.1 2,170.1 6,590.8
12. Others* 13,473.1 27,610.9 12,367.4 32,638.0 782.2 896.5 901.0 1,778.0
B. Economic Services (1 to 9) 5,86,200.7 5,72,618.7 5,33,252.7 6,30,962.8 1,69,359.2 1,87,802.3 2,00,287.0 2,17,849.3
1. Agriculture and Allied Activities (i to xii) 11,579.2 15,353.0 15,215.6 27,534.7 28,836.5 32,892.3 36,154.8 38,716.3
i) Crop Husbandry 2,157.7 3,733.5 3,613.7 14,361.7 5,383.8 5,889.2 6,164.5 7,747.0
ii) Soil and Water Conservation 34.8 48.0 48.0 52.7 283.6 336.1 342.5 279.0
iii) Animal Husbandry 2,544.1 3,301.0 3,609.9 4,013.5 3,210.6 3,459.6 3,717.3 3,950.0
iv) Dairy Development 984.6 1,100.0 1,100.0 1,200.0 256.8 264.0 254.3 260.0
v) Fisheries 44.3 388.0 375.1 544.0 4,909.3 5,154.6 6,183.6 5,902.3
vi) Forestry and Wild Life 3,714.1 4,458.5 4,545.5 5,153.9 771.2 777.8 823.7 841.0
vii) Plantations - - - - - - - -
viii) Food Storage and Warehousing - - - - 11,420.7 14,000.0 15,515.6 16,000.0
ix) Agricultural Research and Education 436.3 372.0 319.4 431.9 1,538.2 1,810.0 1,896.8 2,215.0
x) Agricultural Finance Institutions - - - - - - - -
xi) Co-operation 1,440.6 1,703.0 1,359.0 1,504.0 781.8 833.5 853.2 1,066.0
xii) Other Agricultural Programmes 222.8 249.0 245.0 273.0 280.5 367.5 403.4 456.0
2. Rural Development 1,366.5 2,587.0 1,688.5 3,687.5 4,316.5 11,655.7 9,769.3 6,660.8
3. Special Area Programmes - - - - 730.5 1,500.0 1,500.0 2,700.0
4. Irrigation and Flood Control 16,779.8 18,462.0 20,295.6 25,391.0 2,420.2 2,710.1 2,489.3 2,947.2
of which:
i) Major and Medium Irrigation - - - - - - - -
ii) Minor Irrigation 1,709.8 2,066.0 2,085.6 3,576.0 2,347.8 2,615.3 2,394.3 2,856.2
iii) Flood Control and Drainage 15,070.0 16,396.0 18,210.0 21,815.0 72.4 94.8 95.0 91.0
5. Energy 1,69,457.7 1,75,182.0 1,73,839.0 1,75,522.0 1,21,376.0 1,24,961.2 1,37,017.3 1,40,659.0
of which: Power 1,69,432.2 1,74,582.0 1,73,639.0 1,74,922.0 1,21,376.0 1,24,961.2 1,37,017.3 1,40,659.0
6. Industry and Minerals (i to iii) 1,465.4 2,515.0 2,220.0 2,427.0 4,301.7 4,269.5 4,434.0 11,766.0
i) Village and Small Industries 1,454.7 2,415.0 2,180.0 2,377.0 2,132.1 1,959.0 1,922.0 2,616.0
ii) Industries@ 10.7 100.0 40.0 50.0 2,169.6 2,310.5 2,512.0 9,150.0
iii) Others** - - - - - - - -
Appendix II : Revenue Expenditure of States and Union Territories with Legislature (Contd.)
(₹ Lakh)

State Finances : A Study of Budgets of 2019-20
248
Item
NATIONAL CAPITAL TERRITORY OF DELHI PUDUCHERRY
2017-18(Accounts)
2018-19(Budget
Estimates)
2018-19(Revised
Estimates)
2019-20(Budget
Estimates)
2017-18(Accounts)
2018-19(Budget
Estimates)
2018-19(Revised
Estimates)
2019-20(Budget
Estimates)
1 2 3 4 5 2 3 4 5
7. Transport and Communications (i + ii) 3,69,860.3 3,08,005.0 2,97,630.0 3,39,509.0 2,709.5 3,429.6 3,717.4 5,878.2
i) Roads and Bridges 53,107.6 70,500.0 60,125.0 61,005.0 1,976.3 2,537.0 2,701.9 3,941.2
ii) Others @@ 3,16,752.7 2,37,505.0 2,37,505.0 2,78,504.0 733.3 892.6 1,015.5 1,937.0
8. Science, Technology and Environment 1,050.0 1,625.5 2,053.2 4,184.9 348.6 512.5 411.0 470.0
9. General Economic Services (i to iv) 14,642.0 48,889.3 20,310.9 52,706.8 4,319.7 5,871.5 4,793.9 8,051.7
i) Secretariat - Economic Services 1,016.4 2,139.0 1,408.4 1,765.3 1,068.0 2,036.6 1,165.0 3,940.0
ii) Tourism 1,461.3 4,606.0 2,702.0 4,920.0 1,488.0 1,782.9 1,852.4 1,682.0
iii) Civil Supplies 10,091.4 36,824.8 10,511.0 37,724.5 894.4 1,093.0 901.2 1,636.1
iv) Others + 2,072.8 5,319.5 5,689.5 8,297.0 869.3 959.1 875.3 793.6
II. NON-DEVELOPMENTAL EXPENDITURE 7,19,595.9 8,82,618.9 8,29,422.8 7,84,352.0 1,87,425.0 2,17,567.0 2,24,531.2 2,50,444.3
(General Services) (A to F)
A. Organs of State 1,20,937.3 1,57,468.1 1,58,906.0 1,80,086.4 4,393.3 4,904.8 5,831.0 6,187.0
B. Fiscal Services (i + ii) 1,61,616.6 2,17,818.7 1,82,210.3 52,473.7 5,406.9 5,978.0 5,671.7 6,065.1
i) Collection of Taxes and Duties 1,61,614.4 2,17,811.7 1,82,183.3 52,461.7 5,406.9 5,978.0 5,671.7 6,065.1
ii) Other Fiscal Services 2.2 7.0 27.0 12.0 - - - -
C. Interest Payments and Servicing of Debt (1 + 2)
2,87,067.2 2,95,898.4 2,86,712.0 3,17,827.0 69,616.8 74,300.0 73,800.0 93,033.1
1. Appropriation for Reduction or Avoidance of Debt
- - - - 1,000.0 3,000.0 3,000.0 -
2. Interest Payments (i to iv) 2,87,067.2 2,95,898.4 2,86,712.0 3,17,827.0 68,616.8 71,300.0 70,800.0 93,033.1
i) Interest on Loans from the Centre 2,87,067.2 2,95,898.4 2,86,712.0 3,17,827.0 13,809.2 13,200.0 12,221.6 12,249.9
ii) Interest on Internal Debt - - - - 48,008.8 50,099.8 51,361.9 73,383.2
of which:
(a) Interest on Market Loans - - - - 39,336.5 41,299.8 42,217.3 64,666.1
(b) Interest on NSSF - - - - - - - -
iii) Interest on Small Savings, State Provident Funds, etc.
- - - - 6,402.4 7,300.0 6,716.5 6,500.0
iv) Others - - - - 396.4 700.2 500.0 900.0
D. Administrative Services (i to v) 1,49,462.9 1,97,902.7 1,97,871.9 2,20,104.0 33,262.4 44,714.3 44,465.7 51,989.1
i) Secretariat - General Services 8,684.7 12,922.1 12,941.9 18,532.0 2,710.6 2,851.0 2,959.0 3,268.0
ii) District Administration 16,334.6 22,933.2 28,515.5 29,741.1 614.6 754.0 686.4 772.3
iii) Police 3,541.2 4,594.0 4,431.0 5,311.0 18,017.3 21,073.2 20,985.1 21,913.2
iv) Public Works 66,720.5 84,625.0 73,556.0 75,387.0 3,162.3 10,820.8 10,613.1 16,077.4
v) Others ++ 54,181.9 72,828.5 78,427.5 91,132.9 8,757.6 9,215.4 9,222.1 9,958.3
E. Pensions 238.2 12,500.0 2,425.0 12,500.0 74,577.9 87,480.0 94,572.8 92,980.0
F. Miscellaneous General Services 273.6 1,031.0 1,297.6 1,361.0 167.7 190.0 190.0 190.0
of which:
Payment on account of State Lotteries - - - - - - - -
III. Grants-in-Aid and Contributions 1,09,394.2 1,20,333.7 2,36,497.9 3,93,900.0 402.0 150.0 150.0 -
of which:
Compensation and Assignments to Local
Bodies and Panchayati Raj Institutions 1,09,394.2 1,20,333.7 2,36,497.9 3,93,900.0 402.0 150.0 150.0 -
Appendix II : Revenue Expenditure of States and Union Territories with Legislature (Contd.)
(₹ Lakh)

Appendix II
249
Item
ALL STATES AND UTs
2017-18(Accounts)
2018-19(Budget
Estimates)
2018-19(Revised
Estimates)
2019-20(Budget
Estimates)
1 2 3 4 5
TOTAL EXPENDITURE (I+II+III) 23,40,08,061.7 28,33,49,815.0 28,74,90,753.5 31,45,98,477.2
I. DEVELOPMENTAL EXPENDITURE (A + B) 14,65,95,344.0 17,88,26,418.7 18,42,18,428.8 19,95,84,879.1
A. Social Services (1 to 12) 9,13,34,870.2 11,39,77,017.6 11,62,94,356.7 12,60,67,996.4
1. Education, Sports, Art and Culture 4,24,79,802.5 5,11,97,885.2 5,12,20,670.3 5,68,19,944.5
2. Medical and Public Health 1,12,19,362.7 1,31,77,431.5 1,36,68,154.9 1,46,20,389.1
3. Family Welfare 20,52,837.8 24,81,613.9 25,22,618.1 28,03,084.9
4. Water Supply and Sanitation 39,19,042.8 44,97,027.6 45,83,743.8 46,09,622.7
5. Housing 27,62,360.1 39,19,939.4 41,43,050.0 42,13,357.8
6. Urban Development 62,67,717.4 89,47,368.3 87,60,491.1 96,48,106.6
7. Welfare of Scheduled Castes, Scheduled Tribes and Other Backward Classes 67,75,672.6 91,75,008.6 81,34,393.9 89,23,433.9
8. Labour and Labour Welfare 9,27,266.0 13,23,442.2 12,91,093.4 15,55,993.8
9. Social Security and Welfare 1,03,85,849.0 1,32,48,086.5 1,46,27,545.4 1,60,80,790.9
10. Nutrition 23,50,515.6 31,83,790.1 28,81,223.7 31,66,991.6
11. Relief on account of Natural Calamities 15,98,587.1 21,09,864.1 37,21,248.0 28,85,853.6
12. Others* 5,95,856.7 7,15,560.2 7,40,124.3 7,40,427.0
B. Economic Services (1 to 9) 5,52,60,473.8 6,48,49,401.1 6,79,24,072.1 7,35,16,882.6
1. Agriculture and Allied Activities (i to xii) 1,71,44,352.9 1,98,18,677.5 2,23,15,684.7 2,42,91,078.3
i) Crop Husbandry 81,02,744.2 1,01,37,202.9 1,18,43,851.2 1,17,89,045.4
ii) Soil and Water Conservation 3,28,084.6 5,22,491.6 4,98,304.5 4,89,412.9
iii) Animal Husbandry 12,73,094.6 16,46,574.3 16,14,275.0 17,89,050.3
iv) Dairy Development 2,49,825.0 2,94,385.9 3,50,290.4 3,46,629.3
v) Fisheries 2,85,098.8 3,83,567.6 3,56,434.0 4,00,139.2
vi) Forestry and Wild Life 15,86,208.2 18,49,436.8 18,37,590.3 20,06,325.8
vii) Plantations 1,596.4 1,980.0 1,846.5 1,768.4
viii) Food Storage and Warehousing 13,04,963.6 16,67,197.5 16,39,121.7 18,36,607.1
ix) Agricultural Research and Education 8,16,001.7 8,67,168.4 10,62,745.3 9,73,268.2
x) Agricultural Finance Institutions - - - -
xi) Co-operation 11,99,137.6 13,00,062.9 21,45,483.9 23,39,982.1
xii) Other Agricultural Programmes 19,97,598.1 11,48,609.7 9,65,741.9 23,18,849.8
2. Rural Development 1,32,24,448.9 1,62,61,764.0 1,68,04,077.7 1,82,69,411.3
3. Special Area Programmes 2,94,557.9 2,70,815.3 2,67,628.3 2,65,629.7
4. Irrigation and Flood Control 28,98,296.8 40,09,656.3 35,97,510.2 35,99,262.7
of which:
i) Major and Medium Irrigation 17,88,266.1 28,37,285.0 24,79,247.7 21,95,211.0
ii) Minor Irrigation 7,94,227.8 8,26,393.4 8,02,050.8 9,58,295.8
iii) Flood Control and Drainage 2,09,603.0 2,29,318.5 2,13,178.5 2,57,202.1
5. Energy 1,17,72,565.3 1,30,51,061.5 1,33,96,574.4 1,50,46,000.1
of which: Power 1,16,27,325.3 1,28,42,981.8 1,31,50,114.9 1,47,21,398.0
6. Industry and Minerals (i to iii) 21,58,524.3 30,74,132.6 31,18,722.6 32,40,687.6
i) Village and Small Industries 9,23,614.0 11,66,503.8 11,16,865.8 11,84,629.6
ii) Industries@ 11,67,944.7 17,45,330.0 18,24,139.5 18,52,362.0
iii) Others** 66,965.6 1,62,298.9 1,77,717.4 2,03,696.0
Appendix II : Revenue Expenditure of States and Union Territories with Legislature (Contd.)
(₹ Lakh)

State Finances : A Study of Budgets of 2019-20
250
Item
ALL STATES AND UTs
2017-18(Accounts)
2018-19(Budget
Estimates)
2018-19(Revised
Estimates)
2019-20(Budget
Estimates)
1 2 3 4 5
7. Transport and Communications (i + ii) 50,82,008.9 51,33,383.0 52,01,825.8 55,10,400.0
i) Roads and Bridges 38,49,053.3 40,16,690.0 39,58,584.0 42,07,437.2
ii) Others @@ 12,32,955.6 11,16,693.0 12,43,241.8 13,02,962.8
8. Science, Technology and Environment 1,55,461.7 2,21,059.8 2,01,272.4 3,14,824.3
9. General Economic Services (i to iv) 25,30,257.1 30,08,851.2 30,20,776.0 29,79,588.6
i) Secretariat - Economic Services 5,87,460.9 9,79,977.4 9,23,601.2 9,48,190.7
ii) Tourism 2,28,378.1 2,77,643.8 2,76,712.3 2,73,645.6
iii) Civil Supplies 10,29,947.2 11,52,096.6 11,27,855.9 11,71,743.9
iv) Others + 6,84,470.9 5,99,133.4 6,92,606.6 5,86,008.5
II. NON-DEVELOPMENTAL EXPENDITURE 8,05,74,615.5 9,61,69,096.2 9,50,25,474.5 10,54,85,235.2 (General Services) (A to F) A. Organs of State 21,58,179.8 29,30,968.0 30,96,941.9 36,07,707.6 B. Fiscal Services (i + ii) 27,65,277.5 35,12,280.0 32,41,155.4 35,54,143.9 i) Collection of Taxes and Duties 27,34,767.4 34,80,268.7 32,09,818.6 35,20,744.7
ii) Other Fiscal Services 30,510.0 32,011.3 31,336.8 33,399.3
C. Interest Payments and Servicing of Debt (1 + 2)
3,11,51,551.9 3,55,32,594.2 3,55,16,084.5 3,86,71,554.2
1. Appropriation for Reduction or Avoidance of Debt
18,39,498.2 36,19,882.6 35,65,933.8 31,91,582.1
2. Interest Payments (i to iv) 2,93,12,053.7 3,19,12,711.6 3,19,50,150.7 3,54,79,972.2
i) Interest on Loans from the Centre 10,24,413.3 10,56,270.7 10,57,609.2 10,63,773.5
ii) Interest on Internal Debt 2,41,79,938.5 2,63,93,884.0 2,63,74,273.1 2,93,80,175.9
of which:
(a) Interest on Market Loans 1,64,26,926.1 1,88,82,350.0 1,89,07,917.4 2,20,64,915.7
(b) Interest on NSSF 50,13,978.3 45,82,795.9 45,55,097.8 42,62,075.1
iii) Interest on Small Savings, State Provident Funds, etc.
36,55,835.6 39,21,058.4 39,10,001.9 43,25,635.9
iv) Others 4,51,866.3 5,41,498.5 6,08,266.5 7,10,386.8
D. Administrative Services (i to v) 1,61,93,673.6 2,10,02,440.7 1,98,68,968.3 2,22,12,802.9 i) Secretariat - General Services 5,93,128.9 10,66,460.2 9,81,891.0 10,60,185.2
ii) District Administration 14,91,559.3 19,05,389.2 18,54,192.7 20,96,528.3
iii) Police 1,10,05,176.3 1,26,73,945.2 1,31,28,416.1 1,45,55,568.9
iv) Public Works 11,64,619.4 14,96,464.6 14,65,726.0 16,01,795.8
v) Others ++ 19,39,189.7 38,60,181.5 24,38,742.6 28,98,724.7
E. Pensions 2,75,36,105.2 3,11,40,250.3 3,16,18,727.0 3,46,90,985.1 F. Miscellaneous General Services 7,69,827.5 20,50,563.0 16,83,597.4 27,48,041.5 of which:
Payment on account of State Lotteries 7,83,085.6 8,85,479.1 8,91,720.1 12,16,762.8
III. Grants-in-Aid and Contributions 68,38,102.2 83,54,300.1 82,46,850.2 95,28,362.9 of which:
Compensation and Assignments to Local
Bodies and Panchayati Raj Institutions 68,38,102.2 83,54,300.1 82,46,850.2 95,28,362.9
- : Nil/Negligible/Not available. * : Include expenditure on Information and Publicity, Secretariat-Social Services, other Social Services, etc.@ : Include expenditure on Non-Ferrous Mining and Metallurgical Industries. ** : Include expenditure on other Industries and other Outlays on Industries and Minerals.@@ : Include expenditure on Port and Light Houses, Civil Aviation, Road Transport, Inland Water Transport, etc.+ : Include expenditure on Foreign Trade and Export Promotion, Census Survey and Statistics and Other General Economic Services.++ : Include expenditure on Public Service Commission, Treasury and Accounts, Administration, Jails, Supplies and Disposal, Stationery and Printing, Other
Administrative Services, etc.Also see notes to Appendices.Note: Data pertaining to Jammu & Kashmir for 2017-18 are taken from CAG and are provisional.Source : Budget documents of state governments.
Appendix II : Revenue Expenditure of States and Union Territories with Legislature (Concld.)
(₹ Lakh)

Appendix III
251
Appendix III : Capital Receipts of States and Union Territories with Legislature(₹ Lakh)
Item
ANDHRA PRADESH ARUNACHAL PRADESH
2017-18(Accounts)
2018-19(Budget
Estimates)
2018-19(Revised
Estimates)
2019-20(Budget
Estimates)
2017-18(Accounts)
2018-19(Budget
Estimates)
2018-19(Revised
Estimates)
2019-20(Budget
Estimates)
1 2 3 4 5 2 3 4 5
TOTAL CAPITAL RECEIPTS (I to XII) 4,74,79,279.5 1,02,61,196.0 4,77,04,093.3 1,62,83,273.2 58,92,065.2 23,11,467.8 1,70,23,160.6 1,78,64,828.6 TOTAL CAPITAL RECEIPTS 36,69,764.5 34,05,249.2 48,29,363.5 47,77,758.1 77,733.2 99,393.8 96,534.3 1,03,760.0 (Includes Public Accounts on a net basis)*I. Internal Debt (1 to 8) 27,48,639.4 32,46,106.0 36,25,554.1 44,42,100.0 1,76,726.7 1,67,100.0 1,51,379.0 1,49,263.0 1. Market Loans 25,57,285.9 29,60,506.0 34,75,712.9 41,12,100.0 88,779.5 1,00,000.0 71,900.0 79,090.0 2. Loans from LIC - - - - - - - - 3. Loans from SBI and other Banks - - - - - - - - 4. Loans from National Bank for Agriculture and Rural Development 1,66,965.0 1,35,600.0 1,24,385.0 1,80,000.0 18,900.0 25,000.0 25,171.0 25,171.0 5. Loans from National Co-operative Development Corporation 1,341.6 - 11,529.2 - 969.3 1,100.0 1,100.0 1,136.0 6. WMA from RBI 23,047.0 1,50,000.0 13,927.0 1,50,000.0 51,694.0 30,000.0 39,300.0 29,376.0 7. Special Securities issued to NSSF - - - - 16,359.0 11,000.0 13,908.0 14,490.0 8. Others@ - - - - 25.0 - - - of which: Land Compensation and other Bonds - - - - - - - - II. Loans and Advances from the Centre (1 to 6) 94,678.9 1,00,000.0 1,99,037.0 2,50,000.0 - - - - 1. State Plan Schemes 94,678.9 1,00,000.0 -94,678.9 2,50,000.0 - - - - of which: Advance release of Plan Assistance for Natural Calamities - - - - - - - - 2. Central Plan Schemes - - - - - - - - 3. Centrally Sponsored Schemes - - - - - - - - 4. Non-Plan (i + ii) - - - - - - - - (i) Relief for Natural Calamities - - - - - - - - (ii) Others - - - - - - - - 5. Ways and Means Advances from Centre - - - - - - - - 6. Loans for Special Schemes - - 2,93,715.9 - - - - - III. Recovery of Loans and Advances (1 to 12) 5,052.1 50,000.0 27,738.8 60,000.1 568.3 3,674.0 3,900.0 4,290.0 1. Housing 430.9 5,500.0 446.5 6,600.0 - - - - 2. Urban Development - - - - - - - - 3. Crop Husbandry - - - - - 4.0 4.0 4.0 4. Food Storage and Warehousing - - - - - - - - 5. Co-operation 751.2 1,985.4 281.0 463.3 264.6 3,200.0 3,200.0 3,520.0 6. Minor Irrigation - - - - - - - - 7. Power Projects 171.8 12,708.0 473.2 15,249.6 - - - - 8. Village and Small Industries - 0.1 - 0.1 - - - - 9. Industries and Minerals - 8,189.1 - 2,178.0 - - - - 10. Road Transport - - - - - - - - 11. Government Servants, etc.+ 3,535.7 14,527.4 26,538.1 27,001.0 303.7 470.0 696.0 766.0 12. Others** 162.5 7,090.0 - 8,508.1 - - - - IV. Inter-State Settlement - - - - - - - - V. Contingency Fund 12.2 - - - - - - - VI. State Provident Funds, etc. (1 + 2) 3,78,485.3 3,24,307.3 3,48,425.9 4,54,543.3 70,673.2 6,817.9 59,638.1 62,619.9 1. State Provident Funds 2,72,780.9 2,30,208.7 2,65,699.8 3,27,570.9 69,222.1 6,745.0 58,287.4 61,201.7 2. Others 1,05,704.4 94,098.6 82,726.1 1,26,972.4 1,451.0 72.9 1,350.7 1,418.2 VII. Reserve Funds (1 to 4) 2,04,136.9 3,56,366.6 2,24,912.9 2,12,201.3 25,021.1 - 75.0 78.8 1. Depreciation/Renewal Reserve Funds - - - - - - - - 2. Sinking Funds 1,10,458.5 1,48,536.9 1,46,730.5 1,32,550.2 31,327.1 - - - 3. Famine Relief Fund - - - - - - - - 4. Others 93,678.5 2,07,829.8 78,182.4 79,651.2 -6,306.0 - 75.0 78.8 VIII. Deposits and Advances (1 to 4) 99,72,597.2 61,84,416.0 89,86,152.1 1,08,64,428.5 82,385.9 4,515.8 40,473.4 42,497.1 1. Civil Deposits 32,39,270.3 20,41,469.7 37,86,085.3 38,87,833.8 76,781.5 4,093.4 39,077.9 41,031.8 2. Deposits of Local Funds 20,23,235.4 19,20,040.0 29,95,217.1 24,18,809.8 - - - - 3. Civil Advances 6,785.2 4,962.4 - 8,142.2 5,593.2 422.4 1,395.5 1,465.3 4. Others 47,03,306.3 22,17,943.9 22,04,849.7 45,49,642.6 11.2 - - - IX. Suspense and Miscellaneous (1 to 4) 2,48,58,829.1 - 3,42,91,620.2 - 48,25,820.9 21,05,631.6 1,65,33,675.6 1,73,60,359.4 1. Suspense 35,427.4 - 2,89,310.6 - -72,316.7 -36,723.4 7,024.9 7,376.2 2. Cash Balance Investment Accounts 41,40,963.1 - 42,25,305.8 - 48,98,014.5 5,67,720.3 46,44,054.0 48,76,256.7 3. Deposits with RBI 1,84,20,702.4 - 2,97,77,002.8 - - 15,74,614.6 1,18,82,400.1 1,24,76,520.1 4. Others 22,61,736.2 - 1.0 - 123.1 20.0 196.6 206.4 X. Appropriation to Contingency Fund - - - - - - - - XI. Miscellaneous Capital Receipts - - - - - - - - of which: Disinvestment - - - - - - - - XII. Remittances 92,16,848.4 - 652.5 - 7,10,869.0 23,728.5 2,34,019.5 2,45,720.4
See ‘Notes to Appendix III’.

State Finances : A Study of Budgets of 2019-20
252
Appendix III : Capital Receipts of States and Union Territories with Legislature (Contd.)(₹ Lakh)
Item
ASSAM BIHAR
2017-18(Accounts)
2018-19(Budget
Estimates)
2018-19(Revised
Estimates)
2019-20(Budget
Estimates)
2017-18(Accounts)
2018-19(Budget
Estimates)
2018-19(Revised
Estimates)
2019-20(Budget
Estimates)
1 2 3 4 5 2 3 4 5
TOTAL CAPITAL RECEIPTS (I to XII) 1,84,04,829.3 3,07,56,977.2 1,99,75,862.2 2,11,83,313.7 4,58,30,520.6 51,89,208.3 51,89,208.3 60,18,211.9 TOTAL CAPITAL RECEIPTS 7,36,272.2 29,15,319.5 13,72,565.4 14,92,912.9 23,30,620.3 22,30,293.1 22,30,293.1 23,75,337.4 (Includes Public Accounts on a net basis)*I. Internal Debt (1 to 8) 8,37,750.5 13,89,373.0 13,92,644.7 13,89,048.0 11,77,077.1 20,52,043.4 20,52,043.4 21,73,574.2 1. Market Loans 7,76,000.0 9,64,873.0 9,64,873.0 11,75,048.0 10,00,000.0 18,34,436.0 18,34,436.0 18,97,043.6 2. Loans from LIC - - - - - - - - 3. Loans from SBI and other Banks - - - - - - - - 4. Loans from National Bank for Agriculture and Rural Development 61,750.5 1,50,500.0 1,50,500.0 1,20,000.0 1,77,077.1 2,10,000.0 2,10,000.0 2,10,000.0 5. Loans from National Co-operative Development Corporation - - 3,271.7 - - 7,607.4 7,607.4 66,530.6 6. WMA from RBI - 2,74,000.0 2,74,000.0 94,000.0 - - - - 7. Special Securities issued to NSSF - - - - - - - 8. Others@ - - - - - - - - of which: Land Compensation and other Bonds - - - - - - - - II. Loans and Advances from the Centre (1 to 6) 6,957.0 11,446.1 11,446.1 25,225.0 1,39,865.1 2,27,500.0 2,27,500.0 2,68,500.0 1. State Plan Schemes - - - - - - - - of which: Advance release of Plan Assistance for Natural Calamities - - - - - - - - 2. Central Plan Schemes - - - - - - - - 3. Centrally Sponsored Schemes - - - - - - - - 4. Non-Plan (i + ii) - - - - - - - - (i) Relief for Natural Calamities - - - - - - - - (ii) Others - - - - - - - - 5. Ways and Means Advances from Centre - - - - - - - - 6. Loans for Special Schemes 6,957.0 11,446.1 11,446.1 25,225.0 1,39,865.1 2,27,500.0 2,27,500.0 2,68,500.0 III. Recovery of Loans and Advances (1 to 12) 470.8 2,54,673.6 2,54,673.6 1,04,832.7 2,189.4 40,849.8 40,849.8 41,637.7 1. Housing - 1,672.7 1,672.7 1,672.7 0.1 0.5 0.5 0.5 2. Urban Development - 21,718.8 21,718.8 21,718.8 - - - - 3. Crop Husbandry - 2,917.5 2,917.5 2,917.5 - - - - 4. Food Storage and Warehousing - 1,392.2 1,392.2 1,392.2 - - - - 5. Co-operation 25.0 3,836.9 3,836.9 3,825.6 369.8 39,009.0 39,009.0 39,853.8 6. Minor Irrigation - - - - - - - - 7. Power Projects - 2,12,959.1 2,12,959.1 62,959.1 - - - - 8. Village and Small Industries - 892.4 892.4 892.4 0.2 5.8 5.8 5.5 9. Industries and Minerals 0.5 1,664.3 1,664.3 1,827.2 0.7 1.4 1.4 1.8 10. Road Transport - - - - - - - - 11. Government Servants, etc.+ 364.3 165.4 165.4 184.3 1,816.9 1,833.2 1,833.2 1,776.3 12. Others** 81.0 7,454.3 7,454.3 7,442.9 1.7 - - - IV. Inter-State Settlement - - - - - - - - V. Contingency Fund 10,000.0 10,000.0 10,000.0 10,000.0 - - - - VI. State Provident Funds, etc. (1 + 2) 2,02,912.9 2,48,443.8 2,23,204.2 2,45,524.6 1,84,408.9 1,36,400.0 1,36,400.0 1,64,500.0 1. State Provident Funds 1,92,562.7 2,32,888.9 2,11,819.0 2,33,000.9 1,58,021.9 1,34,850.0 1,34,850.0 1,60,000.0 2. Others 10,350.2 15,554.9 11,385.2 12,523.8 26,387.1 1,550.0 1,550.0 4,500.0 VII. Reserve Funds (1 to 4) 96,259.8 1,06,281.5 1,06,252.1 1,17,442.8 1,41,492.3 1,31,815.2 1,31,815.2 1,44,500.0 1. Depreciation/Renewal Reserve Funds - - - - - - - - 2. Sinking Funds 44,865.2 52,382.3 52,382.3 60,986.2 69,360.8 77,515.2 77,515.2 87,500.0 3. Famine Relief Fund - - - - - - - - 4. Others 51,394.6 53,899.2 53,869.8 56,456.7 72,131.5 54,300.0 54,300.0 57,000.0 VIII. Deposits and Advances (1 to 4) 11,63,805.7 11,26,724.6 12,46,920.1 13,71,516.1 43,17,992.1 25,30,600.0 25,30,600.0 31,25,500.0 1. Civil Deposits 6,30,753.0 6,80,624.3 7,60,210.0 8,36,231.0 4,83,441.6 4,15,000.0 4,15,000.0 4,50,000.0 2. Deposits of Local Funds - - 0.1 - 27,17,293.8 20,87,000.0 20,87,000.0 25,60,000.0 3. Civil Advances 4,22,866.8 3,53,313.0 3,66,695.5 4,03,365.1 19,590.7 28,600.0 28,600.0 20,500.0 4. Others 1,10,185.9 92,787.4 1,20,014.5 1,31,920.0 10,97,666.0 - - 95,000.0 IX. Suspense and Miscellaneous (1 to 4) 1,55,40,231.5 2,58,94,762.8 1,61,58,808.7 1,72,90,620.6 3,88,81,238.1 70,000.0 70,000.0 1,00,000.0 1. Suspense 24,357.7 10,000.0 24,357.7 26,793.5 80,573.0 70,000.0 70,000.0 1,00,000.0 2. Cash Balance Investment Accounts 1,55,13,423.0 2,58,83,069.9 1,61,33,959.9 1,72,63,337.1 3,87,38,974.1 - - - 3. Deposits with RBI - - - - - - - - 4. Others 2,450.8 1,692.8 491.1 490.0 61,691.0 - - - X. Appropriation to Contingency Fund - - - - - - - - XI. Miscellaneous Capital Receipts - - - - - - - - of which: Disinvestment - - - - - - - - XII. Remittances 5,46,441.1 17,15,271.9 5,71,912.7 6,29,103.8 9,86,257.7 - - -

Appendix III
253
Item
CHHATTISGARH GOA
2017-18(Accounts)
2018-19(Budget
Estimates)
2018-19(Revised
Estimates)
2019-20(Budget
Estimates)
2017-18(Accounts)
2018-19(Budget
Estimates)
2018-19(Revised
Estimates)
2019-20(Budget
Estimates)
1 2 3 4 5 2 3 4 5
TOTAL CAPITAL RECEIPTS (I to XII) 1,95,77,896.7 1,47,26,728.6 1,57,19,446.5 1,64,74,101.6 22,21,729.6 18,77,743.8 18,77,743.8 22,99,567.4 TOTAL CAPITAL RECEIPTS 9,80,830.1 11,38,541.9 15,24,191.0 13,61,894.0 2,33,634.8 1,78,236.6 1,78,236.6 2,24,720.8 (Includes Public Accounts on a net basis)*I. Internal Debt (1 to 8) 9,18,789.3 10,77,751.0 13,92,503.0 13,21,975.0 3,08,280.9 1,69,122.0 1,69,122.0 2,35,020.0 1. Market Loans 8,10,000.0 8,19,300.0 12,72,500.0 10,92,604.0 1,80,000.0 1,50,000.0 1,50,000.0 2,00,000.0 2. Loans from LIC - - - - - - - - 3. Loans from SBI and other Banks - - - - - - - - 4. Loans from National Bank for Agriculture and Rural Development 1,08,789.3 1,65,000.0 1,20,000.0 1,20,000.0 12,761.2 9,092.0 9,092.0 20,000.0 5. Loans from National Co-operative Development Corporation - 1,000.0 1.0 1,000.0 12.7 30.0 30.0 20.0 6. WMA from RBI - 92,451.0 2.0 1,08,371.0 1,15,507.0 10,000.0 10,000.0 15,000.0 7. Special Securities issued to NSSF - - - - - - - - 8. Others@ - - - - - - - - of which: - Land Compensation and other Bonds - - - - - - - - II. Loans and Advances from the Centre (1 to 6) 46,455.4 60,000.0 60,000.0 60,000.0 7,803.0 7,800.0 7,800.0 8,268.0 1. State Plan Schemes - - - - 7,803.0 7,800.0 7,800.0 8,268.0 of which: Advance release of Plan Assistance for Natural Calamities - - - - - - - - 2. Central Plan Schemes - - - - - - - - 3. Centrally Sponsored Schemes - - - - - - - - 4. Non-Plan (i + ii) 46,455.4 60,000.0 60,000.0 60,000.0 - - - - (i) Relief for Natural Calamities - - - - (ii) Others 46,455.4 60,000.0 60,000.0 60,000.0 - - - - 5. Ways and Means Advances from Centre - - - - - - - - 6. Loans for Special Schemes - - - - - - - - III. Recovery of Loans and Advances (1 to 12) 13,858.7 31,401.9 21,200.0 28,300.0 715.2 1,503.4 1,503.4 855.8 1. Housing - - - - - 94.0 94.0 94.0 2. Urban Development 4,324.8 6,569.4 2,500.0 5,500.0 - - - - 3. Crop Husbandry 3.2 6.0 9.0 9.0 - - - - 4. Food Storage and Warehousing 2,621.7 3,510.0 2,402.6 2,890.0 - - - - 5. Co-operation 3,873.5 7,889.1 8,889.2 8,713.3 42.6 337.6 337.6 24.9 6. Minor Irrigation - - - - - - - - 7. Power Projects - 2,580.2 2,580.2 2,580.2 - - - - 8. Village and Small Industries 4.8 20.0 9.8 9.8 - - - - 9. Industries and Minerals 30.3 100.0 40.0 55.0 - - - - 10. Road Transport - - - - - - - - 11. Government Servants, etc.+ -70.8 127.2 2.3 26.8 550.3 940.6 940.6 635.6 12. Others** 3,071.2 10,600.0 4,767.0 8,516.0 122.3 131.2 131.2 101.3 IV. Inter-State Settlement - - - - - - - - V. Contingency Fund 3,886.1 10,000.0 3,818.0 10,000.0 - - - - VI. State Provident Funds, etc. (1 + 2) 1,43,586.7 1,38,312.0 1,39,260.0 1,41,811.0 55,480.2 47,311.6 47,311.6 61,028.2 1. State Provident Funds 1,29,751.5 1,27,312.0 1,28,260.0 1,30,811.0 54,822.6 46,560.7 46,560.7 60,304.9 2. Others 13,835.2 11,000.0 11,000.0 11,000.0 657.5 750.9 750.9 723.3 VII. Reserve Funds (1 to 4) 1,22,458.7 1,43,502.2 1,48,372.5 1,97,683.6 24,188.8 29,415.8 29,415.8 26,607.7 1. Depreciation/Renewal Reserve Funds - 1.0 1.0 1.0 - - - - 2. Sinking Funds 20,000.0 22,000.0 22,000.0 26,500.0 5,554.0 7,236.6 7,236.6 6,109.4 3. Famine Relief Fund 8.6 57.0 12.0 13.0 - - - - 4. Others 1,02,450.1 1,21,444.2 1,26,359.5 1,71,169.6 18,634.9 22,179.1 22,179.1 20,498.4 VIII. Deposits and Advances (1 to 4) 4,03,917.0 4,70,861.3 5,15,398.7 5,20,836.8 66,365.5 60,684.0 60,684.0 83,002.1 1. Civil Deposits 2,93,962.2 2,87,828.3 2,60,803.8 2,49,303.8 32,198.2 36,466.7 36,466.7 35,418.0 2. Deposits of Local Funds - 8.0 8.0 8.0 - - - - 3. Civil Advances 50,075.0 50,000.0 50,000.0 50,000.0 492.1 1,119.7 1,119.7 541.3 4. Others 59,879.8 1,33,025.0 2,04,586.9 2,21,525.0 33,675.2 23,097.7 23,097.7 47,042.7 IX. Suspense and Miscellaneous (1 to 4) 1,69,24,253.1 1,20,62,298.2 1,27,56,792.2 1,35,61,393.2 13,47,565.4 10,84,757.9 10,84,757.9 14,32,322.0 1. Suspense -4,434.9 1,296.2 1,291.2 892.2 51,081.6 7,468.7 7,468.7 56,189.8 2. Cash Balance Investment Accounts 1,00,02,839.4 58,50,000.0 60,00,000.0 65,00,000.0 5,62,716.9 3,48,875.2 3,48,875.2 6,18,988.6 3. Deposits with RBI 13,85,699.5 11,50,000.0 12,00,000.0 12,50,000.0 - - - - 4. Others 55,40,149.1 50,61,002.0 55,55,501.0 58,10,501.0 7,33,766.9 7,28,414.0 7,28,414.0 7,57,143.6 X. Appropriation to Contingency Fund - - - - - - - - XI. Miscellaneous Capital Receipts 331.6 - - - - - - - of which: Disinvestment - - - - - - - -XII. Remittances 10,00,360.2 7,32,602.0 6,82,102.0 6,32,102.0 4,11,330.6 4,77,149.2 4,77,149.2 4,52,463.7
Appendix III : Capital Receipts of States and Union Territories with Legislature (Contd.)(₹ Lakh)

State Finances : A Study of Budgets of 2019-20
254
Appendix III : Capital Receipts of States and Union Territories with Legislature (Contd.)(₹ Lakh)
Item
GUJARAT HARYANA
2017-18(Accounts)
2018-19(Budget
Estimates)
2018-19(Revised
Estimates)
2019-20(Budget
Estimates)
2017-18(Accounts)
2018-19(Budget
Estimates)
2018-19(Revised
Estimates)
2019-20(Budget
Estimates)
1 2 3 4 5 2 3 4 5
TOTAL CAPITAL RECEIPTS (I to XII) 5,28,08,912.3 2,04,98,011.0 1,67,96,450.0 1,79,98,935.0 1,41,42,178.9 2,70,60,524.1 1,70,82,777.3 1,91,80,166.0 TOTAL CAPITAL RECEIPTS 27,97,031.1 42,09,305.4 46,69,805.4 45,98,105.4 26,66,802.2 32,17,095.6 28,09,411.3 35,42,978.0 (Includes Public Accounts on a net basis)*I. Internal Debt (1 to 8) 26,86,290.9 36,50,100.0 41,50,100.0 40,32,900.0 21,34,874.6 31,27,821.0 34,47,990.0 42,53,600.0 1. Market Loans 24,00,000.0 33,00,000.0 37,00,000.0 36,00,000.0 16,63,948.6 22,32,896.0 21,26,700.0 26,40,000.0 2. Loans from LIC - - - - - - - - 3. Loans from SBI and other Banks - - - - 3,70,000.0 6,50,000.0 10,90,000.0 13,00,000.0 4. Loans from National Bank for Agriculture and Rural Development 2,86,290.9 3,50,000.0 4,50,000.0 4,32,800.0 50,827.1 1,32,135.0 70,000.0 1,50,000.0 5. Loans from National Co-operative Development Corporation - - - - 31,716.0 2,000.0 52,000.0 52,000.0 6. WMA from RBI - 100.0 100.0 100.0 7,948.0 91,500.0 91,500.0 91,500.0 7. Special Securities issued to NSSF - - - - - - - - 8. Others@ - - - - 10,435.0 19,290.0 17,790.0 20,100.0 of which: Land Compensation and other Bonds - - - - - - - - II. Loans and Advances from the Centre (1 to 6) 8,983.4 30,000.0 2,00,000.0 2,60,000.0 14,101.0 55,453.0 29,276.0 23,135.0 1. State Plan Schemes 8,983.4 30,000.0 2,00,000.0 60,000.0 - 55,453.0 29,276.0 23,135.0 of which: Advance release of Plan Assistance for Natural Calamities - - - - - - - - 2. Central Plan Schemes - - - - - - - - 3. Centrally Sponsored Schemes - - - - - - - - 4. Non-Plan (i + ii) - - - - 14,101.0 - - - (i) Relief for Natural Calamities - - - - - - - - (ii) Others - - - - 14,101.0 - - - 5. Ways and Means Advances from Centre - - - - - - - - 6. Loans for Special Schemes - - - 2,00,000.0 III. Recovery of Loans and Advances (1 to 12) 34,622.0 28,600.0 28,600.0 28,600.0 6,34,093.0 5,36,018.5 5,37,831.6 5,44,944.4 1. Housing 50.0 523.0 523.0 523.0 1.5 1.4 1.0 1.0 2. Urban Development 10.0 1,535.0 1,535.0 1,535.0 - - - - 3. Crop Husbandry - 9.0 9.0 9.0 1,738.0 - 3,000.0 3,500.0 4. Food Storage and Warehousing 5.0 72.0 72.0 72.0 - - - - 5. Co-operation 85.0 1,307.0 1,307.0 1,307.0 20,846.0 1,170.5 1,170.0 1,170.0 6. Minor Irrigation - - - - - - - - 7. Power Projects 11,227.0 10,591.0 10,591.0 10,591.0 6,00,750.3 5,27,795.6 5,27,840.5 5,28,990.3 8. Village and Small Industries 2.0 150.0 150.0 150.0 715.2 675.0 650.0 800.0 9. Industries and Minerals 12,500.0 1,981.0 1,981.0 1,981.0 700.1 - - - 10. Road Transport 5,282.0 - - - - - - - 11. Government Servants, etc.+ 1,545.0 7,091.0 7,091.0 7,091.0 9,318.6 6,327.0 5,117.0 10,430.0 12. Others** 3,916.0 5,341.0 5,341.0 5,341.0 23.3 49.1 53.1 53.1 IV. Inter-State Settlement - 1.0 1.0 1.0 - - - - V. Contingency Fund - - 6,935.0 - 2,677.0 - 1,217.7 - VI. State Provident Funds, etc. (1 + 2) 2,34,061.0 3,21,156.0 2,34,488.0 2,53,246.0 3,34,250.0 3,24,500.0 3,24,000.0 3,34,500.0 1. State Provident Funds 2,14,255.0 2,99,074.0 2,12,406.0 2,29,399.0 3,30,754.0 3,20,000.0 3,20,000.0 3,30,000.0 2. Others 19,806.0 22,082.0 22,082.0 23,847.0 3,496.0 4,500.0 4,000.0 4,500.0 VII. Reserve Funds (1 to 4) 1,79,702.0 2,71,677.0 1,96,002.0 3,70,812.0 1,05,072.6 1,00,231.5 99,662.0 1,08,286.6 1. Depreciation/Renewal Reserve Funds 280.0 280.0 280.0 280.0 8,985.0 9,069.4 9,120.0 9,463.6 2. Sinking Funds 69,356.0 1,20,000.0 1,00,000.0 1,20,000.0 13,346.0 13,000.0 14,500.0 15,600.0 3. Famine Relief Fund - - - - - - - - 4. Others 1,10,066.0 1,51,397.0 95,722.0 2,50,532.0 82,741.6 78,162.2 76,042.0 83,223.0 VIII. Deposits and Advances (1 to 4) 50,06,836.0 48,10,028.0 51,87,606.0 57,34,263.0 20,57,986.8 27,26,700.0 25,48,200.0 31,02,200.0 1. Civil Deposits 8,67,032.0 8,24,559.0 9,02,612.0 11,23,281.0 2,86,248.8 3,10,000.0 3,10,000.0 3,30,000.0 2. Deposits of Local Funds 40,10,210.0 38,20,123.0 40,94,702.0 44,12,278.0 313.4 700.0 500.0 700.0 3. Civil Advances 32.0 31,008.0 31,008.0 33,485.0 198.9 6,000.0 1,000.0 1,500.0 4. Others 1,29,562.0 1,34,338.0 1,59,284.0 1,65,219.0 17,71,225.7 24,10,000.0 22,36,700.0 27,70,000.0 IX. Suspense and Miscellaneous (1 to 4) 4,27,70,290.0 1,10,46,323.0 63,79,966.0 68,80,360.0 80,45,331.6 1,91,85,800.0 91,90,600.0 96,85,700.0 1. Suspense 15,28,823.0 434.0 2,696.0 2,911.0 90,053.8 1,15,000.0 1,00,000.0 1,10,000.0 2. Cash Balance Investment Accounts 2,87,19,364.0 1,00,000.0 10,00,000.0 10,80,000.0 79,54,731.0 1,90,70,000.0 90,90,000.0 95,75,000.0 3. Deposits with RBI 1,24,46,059.0 51,66,789.0 51,66,789.0 55,80,132.0 - - - - 4. Others 76,044.0 57,79,100.0 2,10,481.0 2,17,317.0 546.8 800.0 600.0 700.0 X. Appropriation to Contingency Fund - - - - - - - - XI. Miscellaneous Capital Receipts - 1,000.0 6,500.0 - 3,987.3 1,04,000.0 4,000.0 1,77,800.0 of which: Disinvestment - - - - 3,987.3 1,04,000.0 4,000.0 1,77,800.0 XII. Remittances 18,88,127.0 3,39,126.0 4,06,252.0 4,38,753.0 8,09,805.0 9,00,000.0 9,00,000.0 9,50,000.0
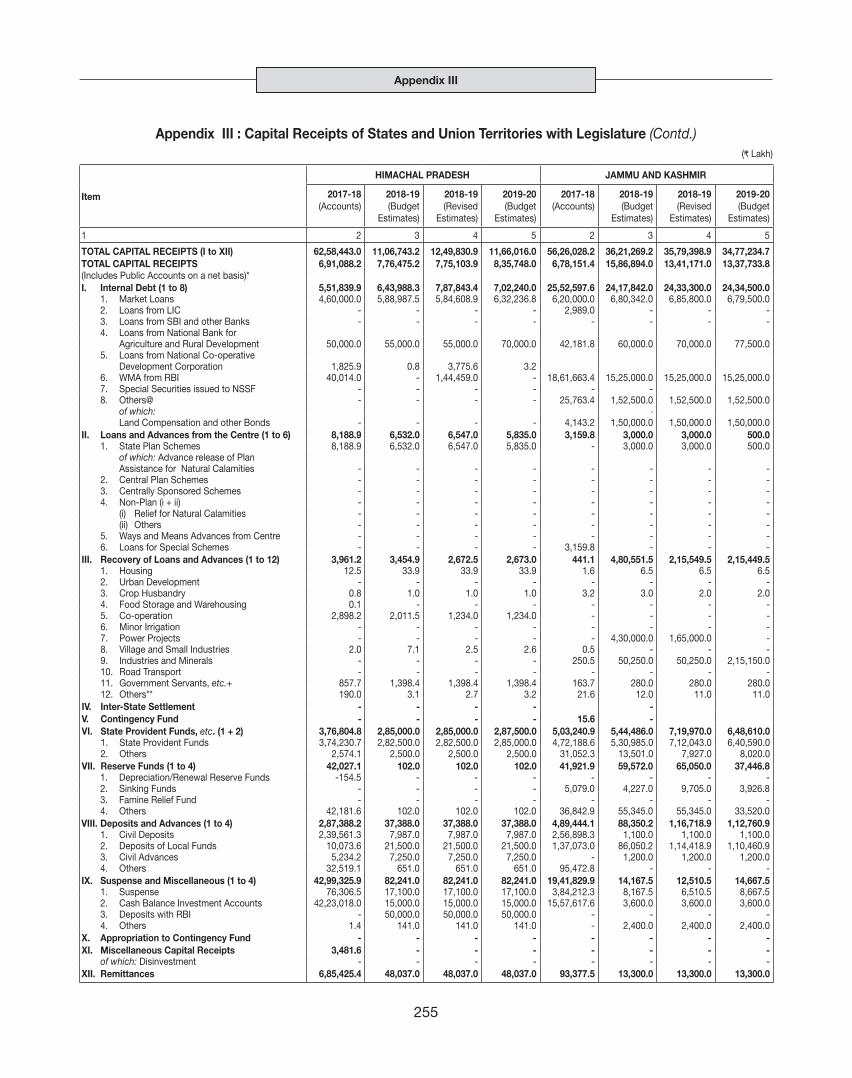
Appendix III
255
Item
HIMACHAL PRADESH JAMMU AND KASHMIR
2017-18(Accounts)
2018-19(Budget
Estimates)
2018-19(Revised
Estimates)
2019-20(Budget
Estimates)
2017-18(Accounts)
2018-19(Budget
Estimates)
2018-19(Revised
Estimates)
2019-20(Budget
Estimates)
1 2 3 4 5 2 3 4 5
TOTAL CAPITAL RECEIPTS (I to XII) 62,58,443.0 11,06,743.2 12,49,830.9 11,66,016.0 56,26,028.2 36,21,269.2 35,79,398.9 34,77,234.7 TOTAL CAPITAL RECEIPTS 6,91,088.2 7,76,475.2 7,75,103.9 8,35,748.0 6,78,151.4 15,86,894.0 13,41,171.0 13,37,733.8 (Includes Public Accounts on a net basis)*I. Internal Debt (1 to 8) 5,51,839.9 6,43,988.3 7,87,843.4 7,02,240.0 25,52,597.6 24,17,842.0 24,33,300.0 24,34,500.0 1. Market Loans 4,60,000.0 5,88,987.5 5,84,608.9 6,32,236.8 6,20,000.0 6,80,342.0 6,85,800.0 6,79,500.0 2. Loans from LIC - - - - 2,989.0 - - - 3. Loans from SBI and other Banks - - - - - - - - 4. Loans from National Bank for Agriculture and Rural Development 50,000.0 55,000.0 55,000.0 70,000.0 42,181.8 60,000.0 70,000.0 77,500.0 5. Loans from National Co-operative Development Corporation 1,825.9 0.8 3,775.6 3.2 6. WMA from RBI 40,014.0 - 1,44,459.0 - 18,61,663.4 15,25,000.0 15,25,000.0 15,25,000.0 7. Special Securities issued to NSSF - - - - - - 8. Others@ - - - - 25,763.4 1,52,500.0 1,52,500.0 1,52,500.0 of which: - Land Compensation and other Bonds - - - - 4,143.2 1,50,000.0 1,50,000.0 1,50,000.0 II. Loans and Advances from the Centre (1 to 6) 8,188.9 6,532.0 6,547.0 5,835.0 3,159.8 3,000.0 3,000.0 500.0 1. State Plan Schemes 8,188.9 6,532.0 6,547.0 5,835.0 - 3,000.0 3,000.0 500.0 of which: Advance release of Plan Assistance for Natural Calamities - - - - - - - - 2. Central Plan Schemes - - - - - - - - 3. Centrally Sponsored Schemes - - - - - - - - 4. Non-Plan (i + ii) - - - - - - - - (i) Relief for Natural Calamities - - - - - - - - (ii) Others - - - - - - - - 5. Ways and Means Advances from Centre - - - - - - - - 6. Loans for Special Schemes - - - - 3,159.8 - - - III. Recovery of Loans and Advances (1 to 12) 3,961.2 3,454.9 2,672.5 2,673.0 441.1 4,80,551.5 2,15,549.5 2,15,449.5 1. Housing 12.5 33.9 33.9 33.9 1.6 6.5 6.5 6.5 2. Urban Development - - - - - - - - 3. Crop Husbandry 0.8 1.0 1.0 1.0 3.2 3.0 2.0 2.0 4. Food Storage and Warehousing 0.1 - - - - - - - 5. Co-operation 2,898.2 2,011.5 1,234.0 1,234.0 - - - - 6. Minor Irrigation - - - - - - - - 7. Power Projects - - - - - 4,30,000.0 1,65,000.0 - 8. Village and Small Industries 2.0 7.1 2.5 2.6 0.5 - - - 9. Industries and Minerals - - - - 250.5 50,250.0 50,250.0 2,15,150.0 10. Road Transport - - - - - - - - 11. Government Servants, etc.+ 857.7 1,398.4 1,398.4 1,398.4 163.7 280.0 280.0 280.0 12. Others** 190.0 3.1 2.7 3.2 21.6 12.0 11.0 11.0 IV. Inter-State Settlement - - - - - V. Contingency Fund - - - - 15.6 - VI. State Provident Funds, etc. (1 + 2) 3,76,804.8 2,85,000.0 2,85,000.0 2,87,500.0 5,03,240.9 5,44,486.0 7,19,970.0 6,48,610.0 1. State Provident Funds 3,74,230.7 2,82,500.0 2,82,500.0 2,85,000.0 4,72,188.6 5,30,985.0 7,12,043.0 6,40,590.0 2. Others 2,574.1 2,500.0 2,500.0 2,500.0 31,052.3 13,501.0 7,927.0 8,020.0 VII. Reserve Funds (1 to 4) 42,027.1 102.0 102.0 102.0 41,921.9 59,572.0 65,050.0 37,446.8 1. Depreciation/Renewal Reserve Funds -154.5 - - - - - - - 2. Sinking Funds - - - - 5,079.0 4,227.0 9,705.0 3,926.8 3. Famine Relief Fund - - - - - - - - 4. Others 42,181.6 102.0 102.0 102.0 36,842.9 55,345.0 55,345.0 33,520.0 VIII. Deposits and Advances (1 to 4) 2,87,388.2 37,388.0 37,388.0 37,388.0 4,89,444.1 88,350.2 1,16,718.9 1,12,760.9 1. Civil Deposits 2,39,561.3 7,987.0 7,987.0 7,987.0 2,56,898.3 1,100.0 1,100.0 1,100.0 2. Deposits of Local Funds 10,073.6 21,500.0 21,500.0 21,500.0 1,37,073.0 86,050.2 1,14,418.9 1,10,460.9 3. Civil Advances 5,234.2 7,250.0 7,250.0 7,250.0 - 1,200.0 1,200.0 1,200.0 4. Others 32,519.1 651.0 651.0 651.0 95,472.8 - - -IX. Suspense and Miscellaneous (1 to 4) 42,99,325.9 82,241.0 82,241.0 82,241.0 19,41,829.9 14,167.5 12,510.5 14,667.5 1. Suspense 76,306.5 17,100.0 17,100.0 17,100.0 3,84,212.3 8,167.5 6,510.5 8,667.5 2. Cash Balance Investment Accounts 42,23,018.0 15,000.0 15,000.0 15,000.0 15,57,617.6 3,600.0 3,600.0 3,600.0 3. Deposits with RBI - 50,000.0 50,000.0 50,000.0 - - - - 4. Others 1.4 141.0 141.0 141.0 - 2,400.0 2,400.0 2,400.0 X. Appropriation to Contingency Fund - - - - - - - -XI. Miscellaneous Capital Receipts 3,481.6 - - - - - - - of which: Disinvestment - - - - - - - -XII. Remittances 6,85,425.4 48,037.0 48,037.0 48,037.0 93,377.5 13,300.0 13,300.0 13,300.0
Appendix III : Capital Receipts of States and Union Territories with Legislature (Contd.)(₹ Lakh)

State Finances : A Study of Budgets of 2019-20
256
Appendix III : Capital Receipts of States and Union Territories with Legislature (Contd.)(₹ Lakh)
Item
JHARKHAND KARNATAKA
2017-18(Accounts)
2018-19(Budget
Estimates)
2018-19(Revised
Estimates)
2019-20(Budget
Estimates)
2017-18(Accounts)
2018-19(Budget
Estimates)
2018-19(Revised
Estimates)
2019-20(Budget
Estimates)
1 2 3 4 5 2 3 4 5
TOTAL CAPITAL RECEIPTS (I to XII) 2,14,29,161.1 1,28,51,755.4 2,44,08,744.1 2,30,07,426.4 7,89,17,882.0 5,62,33,639.0 5,61,32,843.0 5,71,74,595.0 TOTAL CAPITAL RECEIPTS 13,62,723.4 12,24,532.7 12,29,255.9 11,50,557.2 28,81,255.7 49,13,556.0 48,12,760.0 49,25,993.0 (Includes Public Accounts on a net basis)*I. Internal Debt (1 to 8) 7,90,523.9 10,40,000.0 10,40,000.0 10,40,000.0 23,17,861.5 44,93,100.0 44,93,100.0 47,12,700.0 1. Market Loans 5,99,965.0 8,00,000.0 8,00,000.0 7,30,000.0 22,09,800.0 43,73,100.0 43,73,100.0 46,12,700.0 2. Loans from LIC - - - - - - - - 3. Loans from SBI and other Banks - - - - - - - - 4. Loans from National Bank for Agriculture and Rural Development 1,60,000.0 1,80,000.0 1,80,000.0 2,50,000.0 1,08,061.5 1,20,000.0 1,20,000.0 1,00,000.0 5. Loans from National Co-operative Development Corporation - 1,500.0 1,500.0 1,500.0 - - - - 6. WMA from RBI - - - - - - - - 7. Special Securities issued to NSSF - - - - - - - - 8. Others@ 30,558.9 58,500.0 58,500.0 58,500.0 - - - - of which: Land Compensation and other Bonds - - - - - - - - II. Loans and Advances from the Centre (1 to 6) 23,160.9 60,000.0 60,000.0 60,000.0 1,94,324.5 2,20,343.0 1,19,547.0 1,47,379.0 1. State Plan Schemes 23,160.9 60,000.0 60,000.0 60,000.0 - 2,20,343.0 - - of which: Advance release of Plan Assistance for Natural Calamities - - - - - - - - 2. Central Plan Schemes - - - - - - - - 3. Centrally Sponsored Schemes - - - - - - - - 4. Non-Plan (i + ii) - - - - 1,94,324.5 - 1,19,547.0 1,47,379.0 (i) Relief for Natural Calamities - - - - - - - - (ii) Others - - - - 1,94,324.5 - 1,19,547.0 1,47,379.0 5. Ways and Means Advances from Centre - - - - - - - - 6. Loans for Special Schemes - - - - - - - -III. Recovery of Loans and Advances (1 to 12) 4,241.1 7,000.1 4,500.0 7,100.0 13,692.7 12,910.0 12,910.0 19,467.0 1. Housing - - - - 4.8 46.0 46.0 - 2. Urban Development - - - - - - - - 3. Crop Husbandry - - - - - - - - 4. Food Storage and Warehousing - - - - - - - - 5. Co-operation 82.0 1,582.0 200.0 1,300.0 78.2 324.0 324.0 325.0 6. Minor Irrigation - - - - 2.2 6.0 6.0 6.0 7. Power Projects - - - - 1,444.0 2,807.0 2,807.0 9,808.0 8. Village and Small Industries - - - - 16.7 22.0 22.0 5.0 9. Industries and Minerals - - - - 1,104.5 553.0 553.0 1,011.3 10. Road Transport - - - - - - - - 11. Government Servants, etc.+ 4,088.5 5,100.0 4,100.0 5,500.0 426.8 830.0 830.0 500.0 12. Others** 70.5 318.1 200.0 300.0 10,615.6 8,322.0 8,322.0 7,811.7 IV. Inter-State Settlement - - - - - - - - V. Contingency Fund 50,000.0 50,000.0 50,000.0 50,000.0 - 500.0 500.0 500.0 VI. State Provident Funds, etc. (1 + 2) 1,01,642.6 81,463.5 94,668.0 1,01,443.4 6,26,221.0 7,17,998.0 7,17,998.0 7,66,092.0 1. State Provident Funds 1,00,867.3 80,499.9 93,786.0 1,00,670.5 3,50,666.7 4,01,888.0 4,01,888.0 4,25,115.0 2. Others 775.2 963.6 882.0 772.9 2,75,554.3 3,16,110.0 3,16,110.0 3,40,977.0 VII. Reserve Funds (1 to 4) 40,100.0 94,318.7 48,300.0 72,216.0 5,66,749.8 3,89,110.0 3,89,110.0 3,19,030.0 1. Depreciation/Renewal Reserve Funds - - - - 1.1 - - - 2. Sinking Funds - 25,500.0 6,200.0 28,016.0 - 35,000.0 35,000.0 35,000.0 3. Famine Relief Fund - - - - - 52,000.0 52,000.0 53,600.0 4. Others 40,100.0 68,818.7 42,100.0 44,200.0 5,66,748.7 3,02,110.0 3,02,110.0 2,30,430.0 VIII. Deposits and Advances (1 to 4) 16,02,019.9 20,78,198.7 20,73,513.1 22,74,629.0 50,96,928.9 53,80,794.0 53,80,794.0 59,83,177.0 1. Civil Deposits 2,57,094.3 2,13,500.5 2,09,230.5 2,83,220.4 8,63,136.7 6,65,389.0 6,65,389.0 8,63,137.0 2. Deposits of Local Funds 12,69,402.0 10,90,162.2 10,68,359.0 11,95,593.8 30,35,878.8 40,16,880.0 40,16,880.0 39,13,520.0 3. Civil Advances 36,894.0 32,428.8 33,077.4 38,000.9 43.0 285.0 285.0 - 4. Others 38,629.6 7,42,107.1 7,62,846.2 7,57,813.8 11,97,870.4 6,98,240.0 6,98,240.0 12,06,520.0 IX. Suspense and Miscellaneous (1 to 4) 1,77,59,076.3 84,07,109.7 1,99,80,543.7 1,83,14,473.9 7,00,98,075.8 4,49,51,039.0 4,49,51,039.0 4,52,14,793.0 1. Suspense -16,321.4 20,770.1 21,185.8 5,814.2 1,51,538.6 29,639.0 29,639.0 29,639.0 2. Cash Balance Investment Accounts 61,28,938.2 83,69,007.6 85,36,387.7 63,12,806.4 2,99,55,362.4 2,99,87,065.0 2,99,87,065.0 3,02,07,062.0 3. Deposits with RBI 1,16,38,052.5 - 1,14,05,291.5 1,19,87,194.1 2,63,74,727.5 - - - 4. Others 8,407.0 17,332.0 17,678.6 8,659.2 1,36,16,447.3 1,49,34,335.0 1,49,34,335.0 1,49,78,092.0 X. Appropriation to Contingency Fund - - - - - - - - XI. Miscellaneous Capital Receipts 2,508.9 - - - 370.4 7,500.0 7,500.0 8,000.0 of which: Disinvestment - - - - - - - -XII. Remittances 10,55,887.5 10,33,664.8 10,57,219.3 10,87,564.1 3,657.6 60,345.0 60,345.0 3,457.0

Appendix III
257
Item
KERALA MADHYA PRADESH
2017-18(Accounts)
2018-19(Budget
Estimates)
2018-19(Revised
Estimates)
2019-20(Budget
Estimates)
2017-18(Accounts)
2018-19(Budget
Estimates)
2018-19(Revised
Estimates)
2019-20(Budget
Estimates)
1 2 3 4 5 2 3 4 5
TOTAL CAPITAL RECEIPTS (I to XII) 2,99,38,836.5 2,72,31,234.6 2,93,84,000.9 3,23,63,710.0 6,56,69,735.4 6,08,15,713.6 6,06,22,913.6 6,72,59,816.7 TOTAL CAPITAL RECEIPTS 32,96,441.0 33,35,369.4 32,17,208.9 33,83,128.8 29,75,382.1 40,58,564.6 42,15,764.6 47,21,645.8 (Includes Public Accounts on a net basis)*I. Internal Debt (1 to 8) 29,78,899.9 35,88,700.0 35,96,390.4 38,94,200.0 19,97,535.4 33,84,000.0 33,63,800.0 38,98,407.0 1. Market Loans 20,50,000.0 25,98,500.0 23,25,000.0 26,69,000.0 15,00,000.0 23,80,000.0 26,49,800.0 27,68,307.0 2. Loans from LIC - - - - - - - - 3. Loans from SBI and other Banks - - - - - - - - 4. Loans from National Bank for Agriculture and Rural Development 60,000.0 1,00,000.0 70,000.0 80,000.0 2,03,335.2 3,00,000.0 4,00,000.0 4,40,000.0 5. Loans from National Co-operative Development Corporation 18,041.9 7,700.0 8,890.4 7,700.0 2,733.5 6,000.0 6,000.0 7,100.0 6. WMA from RBI 6,33,550.0 6,62,500.0 9,62,500.0 9,02,500.0 - 4,00,000.0 50,000.0 4,00,000.0 7. Special Securities issued to NSSF 2,12,308.0 2,20,000.0 2,30,000.0 2,35,000.0 2,87,411.0 2,90,000.0 2,50,000.0 2,75,000.0 8. Others@ 5,000.0 - - - 4,055.7 8,000.0 8,000.0 8,000.0 of which: Land Compensation and other Bonds - - - - - - - - II. Loans and Advances from the Centre (1 to 6) 44,476.4 1,23,402.0 1,23,382.0 2,03,250.0 1,91,681.1 4,00,000.0 3,63,600.0 4,00,000.0 1. State Plan Schemes 44,007.7 - - - 1,91,681.1 4,00,000.0 3,63,600.0 - of which: Advance release of Plan Assistance for Natural Calamities - - - - - - - - 2. Central Plan Schemes - - - - - - - - 3. Centrally Sponsored Schemes - - - - - - - - 4. Non-Plan (i + ii) 468.7 1,23,402.0 1,23,382.0 2,03,250.0 - - - - (i) Relief for Natural Calamities - - - - - - - (ii) Others 468.7 1,23,402.0 1,23,382.0 2,03,250.0 - - - - 5. Ways and Means Advances from Centre - - - - - - - - 6. Loans for Special Schemes - - - - - - - 4,00,000.0 III. Recovery of Loans and Advances (1 to 12) 35,097.4 29,712.3 94,760.0 29,219.0 5,06,953.3 4,01,852.4 50,752.4 2,62,515.4 1. Housing 1.6 996.5 887.5 864.3 104.3 - - - 2. Urban Development 22.6 380.0 386.7 392.1 7,510.9 - - - 3. Crop Husbandry 1,780.6 4.1 13.9 14.0 7.6 - - - 4. Food Storage and Warehousing 175.1 270.6 285.3 312.8 10.7 - - - 5. Co-operation 1,358.4 2,342.1 2,419.9 2,560.5 36,683.0 445.5 445.5 445.5 6. Minor Irrigation - - - - - - - - 7. Power Projects - - - - 4,62,200.0 4,01,100.0 50,000.0 2,61,762.0 8. Village and Small Industries 356.7 1,114.6 960.6 1,077.5 0.2 - - - 9. Industries and Minerals 12,697.9 2,300.4 2,516.5 2,705.8 190.2 - - - 10. Road Transport - - - - - - - - 11. Government Servants, etc.+ 15,191.6 17,246.7 81,867.7 15,653.1 0.9 - - - 12. Others** 3,512.9 5,057.2 5,421.9 5,638.9 245.6 306.9 306.9 307.9 IV. Inter-State Settlement - - - - -4.9 - - - V. Contingency Fund - 100.0 100.0 100.0 - 50,000.0 50,000.0 50,000.0 VI. State Provident Funds, etc. (1 + 2) 85,77,091.5 44,78,923.9 68,63,691.5 89,04,346.2 3,41,679.5 4,25,538.0 6,45,538.0 7,48,091.8 1. State Provident Funds 9,67,858.8 7,51,495.8 7,07,585.5 8,78,902.6 3,30,621.4 4,00,000.0 6,20,000.0 7,20,000.0 2. Others 76,09,232.7 37,27,428.1 61,56,106.0 80,25,443.7 11,058.1 25,538.0 25,538.0 28,091.8 VII. Reserve Funds (1 to 4) 95,872.7 45,084.0 3,38,616.0 58,104.5 2,25,781.0 2,84,400.0 2,79,300.0 2,93,580.0 1. Depreciation/Renewal Reserve Funds - - - - - - - - 2. Sinking Funds 57,632.2 23,600.0 23,600.0 23,600.0 - - - - 3. Famine Relief Fund - - - - - - - - 4. Others 38,240.5 21,484.0 3,15,016.0 34,504.5 2,25,781.0 2,84,400.0 2,79,300.0 2,93,580.0 VIII. Deposits and Advances (1 to 4) 3,26,435.9 3,51,563.9 2,91,512.5 3,21,301.9 25,01,582.9 35,92,279.4 35,92,279.4 41,01,814.3 1. Civil Deposits 2,68,854.0 3,14,861.3 2,18,421.1 2,29,163.5 8,25,684.7 10,64,006.5 10,64,006.5 11,70,407.2 2. Deposits of Local Funds 1,009.7 1,339.4 2,578.3 2,832.0 1,74,028.2 1,44,552.7 1,44,552.7 1,59,008.0 3. Civil Advances - 1.1 1.1 - 371.2 2,787.7 2,787.7 3,066.4 4. Others 56,572.2 35,362.1 70,512.0 89,306.4 15,01,498.9 23,80,932.5 23,80,932.5 27,69,332.7 IX. Suspense and Miscellaneous (1 to 4) 1,74,69,142.3 1,83,65,788.2 1,78,55,906.3 1,87,17,619.3 5,81,36,603.4 5,02,86,144.8 5,02,86,144.8 5,53,14,759.2 1. Suspense 36,24,244.5 39,05,611.1 43,74,784.6 45,99,122.6 14,765.1 5,040.3 5,040.3 5,544.3 2. Cash Balance Investment Accounts 52,33,907.0 57,17,500.0 44,59,742.5 49,94,039.9 3,50,48,296.7 2,78,48,761.7 2,78,48,761.7 3,06,33,637.9 3. Deposits with RBI - - - - 1,07,55,738.7 1,04,49,345.7 1,04,49,345.7 1,14,94,280.2 4. Others 86,10,990.8 87,42,677.1 90,21,379.2 91,24,456.7 1,23,17,802.9 1,19,82,997.1 1,19,82,997.1 1,31,81,296.8 X. Appropriation to Contingency Fund - - - - - - - XI. Miscellaneous Capital Receipts 2,928.4 3,802.1 3,825.6 4,283.6 1,934.6 - - - of which: Disinvestment - - - - - - - -XII. Remittances 4,08,891.9 2,44,158.1 2,15,816.6 2,31,285.5 17,65,989.0 19,91,499.1 19,91,499.1 21,90,649.0
Appendix III : Capital Receipts of States and Union Territories with Legislature (Contd.)(₹ Lakh)

State Finances : A Study of Budgets of 2019-20
258
Appendix III : Capital Receipts of States and Union Territories with Legislature (Contd.)(₹ Lakh)
Item
MAHARASHTRA MANIPUR
2017-18(Accounts)
2018-19(Budget
Estimates)
2018-19(Revised
Estimates)
2019-20(Budget
Estimates)
2017-18(Accounts)
2018-19(Budget
Estimates)
2018-19(Revised
Estimates)
2019-20(Budget
Estimates)
1 2 3 4 5 2 3 4 5
TOTAL CAPITAL RECEIPTS (I to XII) 7,41,85,514.6 6,12,13,418.8 7,13,40,313.6 7,40,51,485.7 16,01,829.2 23,79,025.5 17,55,219.2 16,93,745.2 TOTAL CAPITAL RECEIPTS 55,12,727.0 84,52,470.9 44,99,214.2 88,28,660.9 54,472.2 1,19,310.5 1,04,616.5 95,629.5 (Includes Public Accounts on a net basis)*I. Internal Debt (1 to 8) 49,50,168.3 73,00,793.0 33,19,037.0 76,55,938.0 1,28,694.7 80,000.0 2,20,437.0 1,42,200.0 1. Market Loans 44,99,641.3 66,00,793.0 25,00,000.0 66,00,000.0 52,500.0 70,000.0 90,237.0 80,000.0 2. Loans from LIC - - - - - - - - 3. Loans from SBI and other Banks - - - - - - - - 4. Loans from National Bank for Agriculture and Rural Development 2,28,817.0 4,00,000.0 5,19,037.0 7,45,938.0 7,499.9 10,000.0 18,000.0 10,000.0 5. Loans from National Co-operative Development Corporation 62,165.7 - - - - - - - 6. WMA from RBI 1,59,400.0 3,00,000.0 0.1 10,000.0 66,339.7 - 1,12,200.0 52,200.0 7. Special Securities issued to NSSF - - - - - - - - 8. Others@ 144.3 - 2,99,999.9 3,00,000.0 2,355.0 - - - of which: Land Compensation and other Bonds - - - - - - - -II. Loans and Advances from the Centre (1 to 6) 16,781.8 1,09,668.0 87,261.3 63,709.9 895.9 - - - 1. State Plan Schemes 16,781.8 1,09,668.0 87,261.3 63,709.9 - - - - of which: Advance release of Plan Assistance for Natural Calamities - - - - - - - - 2. Central Plan Schemes - - - - - - - - 3. Centrally Sponsored Schemes - - - - - - - - 4. Non-Plan (i + ii) - - - - 895.9 - - - (i) Relief for Natural Calamities - - - - - - - (ii) Others - - - - 895.9 - - - 5. Ways and Means Advances from Centre - - - - - - - 6. Loans for Special Schemes - - - - - - - -III. Recovery of Loans and Advances (1 to 12) 1,77,801.4 2,26,556.5 2,24,580.8 2,28,960.9 802.2 379.5 379.5 379.5 1. Housing 5,387.6 11,535.5 11,535.5 11,535.5 - - - - 2. Urban Development 1,799.6 1,255.0 1,255.0 1,380.5 - - - - 3. Crop Husbandry 5,435.5 7.9 7.9 7.9 - - - 4. Food Storage and Warehousing - - - - - - - - 5. Co-operation 13,059.0 16,154.5 16,154.5 16,154.5 4.9 7.0 7.0 7.0 6. Minor Irrigation 0.2 1.0 1.0 1.0 - - - - 7. Power Projects 1,11,942.3 1,48,298.0 1,48,298.0 1,48,298.0 - - - - 8. Village and Small Industries 189.9 263.0 263.0 263.0 - 0.5 0.5 0.5 9. Industries and Minerals 523.9 1,265.0 1,265.0 1,265.0 - - - - 10. Road Transport - - - - - - - 11. Government Servants, etc.+ 32,719.7 38,725.9 36,750.2 41,282.1 60.2 120.0 120.0 120.0 12. Others** 6,743.7 9,050.7 9,050.7 8,773.4 737.0 252.0 252.0 252.0 IV. Inter-State Settlement - - - - - - - - V. Contingency Fund - - - - - - - - VI. State Provident Funds, etc. (1 + 2) 4,78,420.6 6,49,982.6 5,16,985.1 5,46,175.8 30,202.3 30,300.0 30,300.0 45,050.0 1. State Provident Funds 4,21,057.5 5,76,063.3 4,47,346.3 4,76,386.9 29,880.6 30,000.0 30,000.0 44,750.0 2. Others 57,363.1 73,919.4 69,638.8 69,788.9 321.7 300.0 300.0 300.0 VII. Reserve Funds (1 to 4) 8,89,854.5 9,66,537.2 9,93,007.2 10,25,762.7 17,622.8 7,355.0 7,555.0 9,568.0 1. Depreciation/Renewal Reserve Funds - 5.0 5.0 5.0 - 2,000.0 2,200.0 2,300.0 2. Sinking Funds 6,11,838.8 3,80,000.0 3,80,000.0 4,00,000.0 13,528.2 3,338.0 3,338.0 4,700.0 3. Famine Relief Fund - - - - - - - - 4. Others 2,78,015.8 5,86,532.2 6,13,002.2 6,25,757.7 4,094.6 2,017.0 2,017.0 2,568.0 VIII. Deposits and Advances (1 to 4) 39,96,087.5 38,05,087.8 37,88,477.4 38,46,109.0 51,105.1 85,931.0 42,000.0 42,000.0 1. Civil Deposits 33,98,708.8 34,07,672.3 34,51,122.7 35,31,750.2 25,465.7 40,000.0 25,000.0 25,000.0 2. Deposits of Local Funds - - - - - - - - 3. Civil Advances 1,20,778.7 61,663.7 61,663.7 61,663.7 3,125.8 2,000.0 2,000.0 2,000.0 4. Others 4,76,600.0 3,35,751.8 2,75,691.0 2,52,695.1 22,513.6 43,931.0 15,000.0 15,000.0 IX. Suspense and Miscellaneous (1 to 4) 6,09,07,236.5 4,56,73,032.5 5,96,81,032.5 5,76,81,909.0 12,24,967.6 19,35,060.0 12,14,547.7 12,14,547.7 1. Suspense 2,599.7 8,855.1 16,855.1 17,731.6 16,789.4 7,000.0 7,000.0 7,000.0 2. Cash Balance Investment Accounts 6,08,47,213.7 4,30,00,000.0 5,70,00,000.0 5,50,00,000.0 12,04,541.0 19,22,000.0 12,04,541.0 12,04,541.0 3. Deposits with RBI - - - - 4. Others 57,423.1 26,64,177.4 26,64,177.4 26,64,177.4 3,637.2 6,060.0 3,006.7 3,006.7 X. Appropriation to Contingency Fund - - - - - - - - XI. Miscellaneous Capital Receipts - - - - - - - - of which: Disinvestment - - - - - - - - XII. Remittances 27,69,163.9 24,81,761.2 27,29,932.3 30,02,920.5 1,47,538.6 2,40,000.0 2,40,000.0 2,40,000.0

Appendix III
259
Item
MEGHALAYA MIZORAM
2017-18(Accounts)
2018-19(Budget
Estimates)
2018-19(Revised
Estimates)
2019-20(Budget
Estimates)
2017-18(Accounts)
2018-19(Budget
Estimates)
2018-19(Revised
Estimates)
2019-20(Budget
Estimates)
1 2 3 4 5 2 3 4 5
TOTAL CAPITAL RECEIPTS (I to XII) 36,85,332.8 30,76,713.0 30,76,713.0 45,15,883.0 3,07,036.2 12,13,045.7 12,12,648.7 10,90,981.8 TOTAL CAPITAL RECEIPTS 86,086.4 1,07,685.2 1,07,685.2 1,64,258.4 83,500.5 1,01,141.7 1,01,144.7 76,677.8 (Includes Public Accounts on a net basis)*I. Internal Debt (1 to 8) 1,21,847.1 1,51,250.0 1,51,250.0 1,67,525.0 88,627.0 70,599.6 70,599.6 77,203.0 1. Market Loans 1,11,550.0 1,12,750.0 1,12,750.0 1,24,025.0 42,437.0 55,000.0 55,000.0 60,000.0 2. Loans from LIC - - - - - - - - 3. Loans from SBI and other Banks - - - - - - - - 4. Loans from National Bank for Agriculture and Rural Development 10,297.1 20,000.0 20,000.0 25,000.0 10,674.5 15,000.0 15,000.0 17,000.0 5. Loans from National Co-operative Development Corporation - - - - - 596.6 596.6 200.0 6. WMA from RBI - 17,500.0 17,500.0 17,500.0 23,489.7 3.0 3.0 3.0 7. Special Securities issued to NSSF - - - - - - - - 8. Others@ - 1,000.0 1,000.0 1,000.0 12,025.8 - - - of which: Land Compensation and other Bonds - - - - - - - -II. Loans and Advances from the Centre (1 to 6) 666.9 3,740.0 3,740.0 6,140.0 787.0 2,175.0 2,178.0 3,426.0 1. State Plan Schemes - - - - 787.0 2,175.0 2,178.0 3,426.0 of which: Advance release of Plan Assistance for Natural Calamities - - - - - - - - 2. Central Plan Schemes - - - - - - - - 3. Centrally Sponsored Schemes - 10.0 10.0 25.0 - - - - 4. Non-Plan (i + ii) - - - - - - - - (i) Relief for Natural Calamities - - - - - - - - (ii) Others - - - - - - - - 5. Ways and Means Advances from Centre - - - - - - - - 6. Loans for Special Schemes 666.9 3,730.0 3,730.0 6,115.0 - - - - III. Recovery of Loans and Advances (1 to 12) 1,745.3 2,267.0 2,267.0 2,494.0 2,164.2 3,547.1 3,547.1 3,901.8 1. Housing 9.0 12.0 12.0 13.0 447.2 1,512.0 1,512.0 1,663.2 2. Urban Development - 3.0 3.0 3.0 - 1.1 1.1 1.2 3. Crop Husbandry - - - - - - - - 4. Food Storage and Warehousing - - - - - - - - 5. Co-operation 4.4 7.0 7.0 8.0 296.0 86.4 86.4 95.0 6. Minor Irrigation - - - - - - - - 7. Power Projects - - - - - - - - 8. Village and Small Industries - - - - - 1.1 1.1 1.2 9. Industries and Minerals - 2.0 2.0 2.0 - - - - 10. Road Transport - - - - - - - - 11. Government Servants, etc.+ 1,732.0 2,243.0 2,243.0 2,468.0 1,419.7 1,944.0 1,944.0 2,138.4 12. Others** - - - - 1.3 2.5 2.5 2.7 IV. Inter-State Settlement - - - - - - - -V. Contingency Fund 30,500.0 30,500.0 30,500.0 30,500.0 - - - - VI. State Provident Funds, etc. (1 + 2) 31,915.1 37,268.0 37,268.0 30,800.0 84,715.9 91,800.0 91,800.0 93,850.0 1. State Provident Funds 31,915.1 37,268.0 37,268.0 30,800.0 83,091.0 90,000.0 90,000.0 92,000.0 2. Others - - - - 1,624.9 1,800.0 1,800.0 1,850.0 VII. Reserve Funds (1 to 4) 8,461.7 7,998.7 7,998.7 8,470.3 7,537.9 6,700.0 6,300.0 7,900.0 1. Depreciation/Renewal Reserve Funds - - - - - - - - 2. Sinking Funds 4,719.5 4,491.8 4,491.8 5,063.3 4,000.0 4,000.0 3,600.0 3,700.0 3. Famine Relief Fund - - - - - - - - 4. Others 3,742.2 3,506.9 3,506.9 3,407.0 3,537.9 2,700.0 2,700.0 4,200.0 VIII. Deposits and Advances (1 to 4) 1,36,348.4 1,01,882.4 1,01,882.4 98,814.2 1,23,204.1 65,623.0 65,623.0 53,000.0 1. Civil Deposits 1,28,112.5 87,295.4 87,295.4 88,636.7 1,23,204.1 62,623.0 62,623.0 50,000.0 2. Deposits of Local Funds - - - - - - - - 3. Civil Advances 3,803.6 8,100.0 8,100.0 4,488.2 - 3,000.0 3,000.0 3,000.0 4. Others 4,432.4 6,487.0 6,487.0 5,689.3 - - - -IX. Suspense and Miscellaneous (1 to 4) 31,13,374.3 25,01,779.0 25,01,779.0 38,79,656.8 - 8,02,501.0 8,02,501.0 7,01,601.0 1. Suspense 1,586.6 704.9 704.9 1,330.4 - - - - 2. Cash Balance Investment Accounts 31,11,708.0 25,00,954.1 25,00,954.1 38,78,285.6 - 8,00,000.0 8,00,000.0 7,00,000.0 3. Deposits with RBI - - - - - 1,000.0 1,000.0 1,000.0 4. Others 79.7 120.0 120.0 40.8 - 1,501.0 1,501.0 601.0 X. Appropriation to Contingency Fund - - - - - - - -XI. Miscellaneous Capital Receipts - - - - - - - - of which: Disinvestment - - - - - - - -XII. Remittances 2,40,474.2 2,40,028.0 2,40,028.0 2,91,482.6 - 1,70,100.0 1,70,100.0 1,50,100.0
Appendix III : Capital Receipts of States and Union Territories with Legislature (Contd.)(₹ Lakh)

State Finances : A Study of Budgets of 2019-20
260
Appendix III : Capital Receipts of States and Union Territories with Legislature (Contd.)(₹ Lakh)
Item
NAGALAND ORISSA
2017-18(Accounts)
2018-19(Budget
Estimates)
2018-19(Revised
Estimates)
2019-20(Budget
Estimates)
2017-18(Accounts)
2018-19(Budget
Estimates)
2018-19(Revised
Estimates)
2019-20(Budget
Estimates)
1 2 3 4 5 2 3 4 5
TOTAL CAPITAL RECEIPTS (I to XII) 14,36,255.8 14,41,868.0 12,14,076.5 13,59,178.2 3,78,60,913.2 2,66,43,640.3 2,63,58,680.7 4,16,15,027.2 TOTAL CAPITAL RECEIPTS 1,13,302.7 1,49,573.0 34,574.5 1,68,883.2 28,55,543.9 2,84,548.7 1,17,069.0 26,48,003.6 (Includes Public Accounts on a net basis)*I. Internal Debt (1 to 8) 5,14,069.0 5,63,137.0 3,12,200.0 4,40,715.0 12,01,325.0 17,05,700.0 15,68,220.0 21,18,400.0 1. Market Loans 1,13,500.0 1,33,137.0 82,200.0 1,10,715.0 8,43,800.0 12,03,200.0 10,85,720.0 16,43,400.0 2. Loans from LIC - - - - - - - 3. Loans from SBI and other Banks - - - - - - - 4. Loans from National Bank for Agriculture and Rural Development 1,954.0 3,000.0 3,000.0 3,000.0 3,57,525.0 4,97,500.0 4,77,500.0 4,70,000.0 5. Loans from National Co-operative Development Corporation - - - - - - - 6. WMA from RBI 3,90,599.7 4,20,000.0 2,20,000.0 3,20,000.0 - - - - 7. Special Securities issued to NSSF - - - - - - - 8. Others@ 8,015.3 7,000.0 7,000.0 7,000.0 - 5,000.0 5,000.0 5,000.0 of which: Land Compensation and other Bonds - - - - - - - - II. Loans and Advances from the Centre (1 to 6) 33.2 1,150.0 1,235.5 2,222.2 84,835.4 1,56,000.0 1,26,000.0 1,40,000.0 1. State Plan Schemes 33.2 - - - -1.5 - - - of which: Advance release of Plan Assistance for Natural Calamities - - - - - - - - 2. Central Plan Schemes - - - - - - - - 3. Centrally Sponsored Schemes - - - - 22.5 - - - 4. Non-Plan (i + ii) - 1,150.0 1,235.5 2,222.2 - - - - (i) Relief for Natural Calamities - - - - - - - - (ii) Others - 1,150.0 1,235.5 2,222.2 - - - - 5. Ways and Means Advances from Centre - - - - - - - - 6. Loans for Special Schemes - - - - 84,814.4 1,56,000.0 1,26,000.0 1,40,000.0 III. Recovery of Loans and Advances (1 to 12) 108.5 291.0 151.0 151.0 25,748.8 15,000.0 15,000.0 15,000.0 1. Housing - - - - 6.4 8.7 8.7 9.5 2. Urban Development - - - - 1.7 10.4 10.4 10.8 3. Crop Husbandry - - - - 16,000.0 0.5 0.5 0.5 4. Food Storage and Warehousing - - - - - 0.7 0.7 0.7 5. Co-operation 67.3 120.0 100.0 100.0 1,266.1 128.0 128.0 44.1 6. Minor Irrigation - - - - 34.2 8.1 8.1 8.1 7. Power Projects - - - - 200.0 0.2 0.2 0.2 8. Village and Small Industries - 1.0 1.0 1.0 103.5 103.4 103.4 86.6 9. Industries and Minerals - - - - 0.5 6.1 6.1 6.1 10. Road Transport - - - - - 0.1 0.1 0.1 11. Government Servants, etc.+ 41.3 170.0 50.0 50.0 7,728.7 14,496.9 14,496.9 14,600.3 12. Others** - - - - 407.7 237.0 237.0 233.1 IV. Inter-State Settlement - - - - - - - - V. Contingency Fund - - - - 40,000.0 40,000.0 40,000.0 40,000.0 VI. State Provident Funds, etc. (1 + 2) 35,397.4 35,780.0 66,280.0 75,480.0 4,79,216.7 3,91,316.3 3,91,316.3 4,91,316.3 1. State Provident Funds 34,607.3 35,000.0 65,500.0 74,700.0 4,79,216.7 3,91,275.0 3,91,275.0 4,91,275.0 2. Others 790.1 780.0 780.0 780.0 - 41.3 41.3 41.3 VII. Reserve Funds (1 to 4) 26,101.0 23,500.0 23,500.0 23,500.0 3,82,581.7 3,36,623.3 3,36,623.3 6,40,124.0 1. Depreciation/Renewal Reserve Funds - - - - - 0.1 0.1 0.1 2. Sinking Funds 22,400.0 22,400.0 22,400.0 22,400.0 - 0.1 0.1 0.1 3. Famine Relief Fund - - - - - 1.0 1.0 1.0 4. Others 3,701.0 1,100.0 1,100.0 1,100.0 3,82,581.7 3,36,622.1 3,36,622.1 6,40,122.8 VIII. Deposits and Advances (1 to 4) 47,501.8 13,000.0 5,700.0 12,100.0 40,35,669.3 20,49,674.3 19,32,194.3 26,44,167.1 1. Civil Deposits 39,601.8 1,000.0 1,000.0 1,000.0 28,99,211.2 5,41,362.2 5,41,362.2 6,25,694.8 2. Deposits of Local Funds - - - - 1,64,501.2 1,73,434.0 1,73,434.0 2,11,434.1 3. Civil Advances 1,399.5 1,000.0 1,000.0 1,000.0 13,805.0 26,053.1 26,053.1 26,053.1 4. Others 6,500.5 11,000.0 3,700.0 10,100.0 9,58,152.0 13,08,825.0 11,91,345.0 17,80,985.0 IX. Suspense and Miscellaneous (1 to 4) 5,92,985.0 6,55,000.0 6,55,000.0 6,55,000.0 2,93,31,484.7 2,16,66,556.4 2,16,66,556.5 3,32,62,474.8 1. Suspense 2,893.6 5,000.0 5,000.0 5,000.0 8,221.1 913.0 913.0 918.4 2. Cash Balance Investment Accounts 5,39,528.0 6,00,000.0 6,00,000.0 6,00,000.0 2,93,21,225.2 2,16,49,387.3 2,16,49,387.4 3,32,45,300.0 3. Deposits with RBI - - - - - 1.0 1.0 1.0 4. Others 50,563.4 50,000.0 50,000.0 50,000.0 2,038.4 16,255.1 16,255.1 16,255.4 X. Appropriation to Contingency Fund - - - - - - - - XI. Miscellaneous Capital Receipts - - - - - - - - of which: Disinvestment - - - - - - - -XII. Remittances 2,20,059.9 1,50,010.0 1,50,010.0 1,50,010.0 22,80,051.7 2,82,770.0 2,82,770.3 22,63,545.1

Appendix III
261
Item
PUNJAB RAJASTHAN
2017-18(Accounts)
2018-19(Budget
Estimates)
2018-19(Revised
Estimates)
2019-20(Budget
Estimates)
2017-18(Accounts)
2018-19(Budget
Estimates)
2018-19(Revised
Estimates)
2019-20(Budget
Estimates)
1 2 3 4 5 2 3 4 5
TOTAL CAPITAL RECEIPTS (I to XII) 1,01,55,684.6 76,78,250.6 88,82,318.6 1,10,07,963.1 3,76,18,896.1 4,11,45,100.8 4,27,92,873.7 4,19,72,429.7 TOTAL CAPITAL RECEIPTS 19,10,289.6 23,34,060.7 25,62,894.0 44,71,548.1 52,98,870.3 60,74,848.5 60,76,358.6 64,78,614.6 (Includes Public Accounts on a net basis)*I. Internal Debt (1 to 8) 45,53,910.8 47,45,495.3 52,34,733.3 58,97,500.0 26,99,966.3 38,26,729.2 38,74,470.0 40,04,210.0 1. Market Loans 17,47,000.0 19,42,364.0 22,11,602.0 26,47,500.0 24,91,397.6 35,49,806.2 36,02,027.0 36,15,965.0 2. Loans from LIC - - - - - - - - 3. Loans from SBI and other Banks - - - - - - - - 4. Loans from National Bank for Agriculture and Rural Development 14,153.7 50,000.0 20,000.0 50,000.0 2,02,091.7 2,30,000.0 2,20,000.0 2,20,000.0 5. Loans from National Co-operative Development Corporation 1,043.8 3,131.3 3,131.3 - - 3,000.0 3,000.0 3,300.0 6. WMA from RBI 27,91,713.3 27,50,000.0 30,00,000.0 32,00,000.0 - - - 1,41,640.0 7. Special Securities issued to NSSF - - - - - - - - 8. Others@ - - - - 6,477.0 43,923.0 49,443.0 23,305.0 of which: Land Compensation and other Bonds - - - - - - - - II. Loans and Advances from the Centre (1 to 6) 46,031.0 1,60,000.0 1,60,000.0 1,00,000.0 1,55,690.3 2,61,153.1 2,66,489.4 4,64,059.1 1. State Plan Schemes 46,031.0 1,60,000.0 1,60,000.0 1,00,000.0 - - -6,72,034.7 - of which: Advance release of Plan Assistance for Natural Calamities - - - - - - - - 2. Central Plan Schemes - - - - - - - - 3. Centrally Sponsored Schemes - - - - - - - - 4. Non-Plan (i + ii) - - - - - - - - (i) Relief for Natural Calamities - - - - - - - - (ii) Others - - - - - - - - 5. Ways and Means Advances from Centre - - - - - - - - 6. Loans for Special Schemes - - - - 1,55,690.3 2,61,153.1 9,38,524.1 4,64,059.1 III. Recovery of Loans and Advances (1 to 12) 7,307.7 5,577.0 74,333.9 15,68,517.6 15,13,341.1 15,73,424.8 15,66,235.9 16,19,250.9 1. Housing 0.4 - - - 10.2 - - 2,000.0 2. Urban Development 5.8 - - - 445.3 20.1 343.6 1,393.6 3. Crop Husbandry 14.5 - - - - - - 2,000.0 4. Food Storage and Warehousing 2,640.1 - 70,137.0 500.0 410.1 941.2 941.2 1,088.2 5. Co-operation 15.4 15.0 - - 3,768.0 52,040.4 53,044.9 1,04,952.3 6. Minor Irrigation - - - - 7. Power Projects 631.3 - - 15,62,826.0 15,05,706.9 15,06,654.3 15,06,654.3 14,79,850.4 8. Village and Small Industries 3.4 - - - 103.7 77.0 927.0 75.0 9. Industries and Minerals - - - - 0.1 - - 14,280.3 10. Road Transport - - - - 312.9 300.0 1,310.0 7,000.0 11. Government Servants, etc.+ 3,972.3 5,562.0 4,196.9 5,191.6 -55.4 5.1 0.1 0.1 12. Others** 24.6 - - - 2,639.2 13,386.7 3,014.9 6,611.0 IV. Inter-State Settlement - - - - - - - - V. Contingency Fund - - - - - - - - VI. State Provident Funds, etc. (1 + 2) 3,52,198.9 3,70,803.3 3,75,861.0 3,90,408.4 9,34,560.9 9,55,017.5 11,35,426.4 12,33,737.2 1. State Provident Funds 3,45,905.7 3,64,325.9 3,70,119.0 3,84,379.3 4,92,863.4 5,70,568.1 6,27,733.3 6,09,492.8 2. Others 6,293.2 6,477.4 5,742.0 6,029.1 4,41,697.5 3,84,449.4 5,07,693.1 6,24,244.4 VII. Reserve Funds (1 to 4) 72,995.3 92,402.5 81,829.2 95,975.9 5,82,076.4 5,46,500.1 7,24,639.5 9,45,483.4 1. Depreciation/Renewal Reserve Funds 831.5 902.5 902.2 975.9 - - - - 2. Sinking Funds - - - - - - - - 3. Famine Relief Fund - - - - - - - - 4. Others 72,163.8 91,500.0 80,927.0 95,000.0 5,82,076.4 5,46,500.1 7,24,639.5 9,45,483.4 VIII. Deposits and Advances (1 to 4) 3,11,209.1 6,10,065.2 4,14,718.1 4,14,718.1 1,42,60,338.9 1,67,83,904.8 1,70,38,642.0 1,63,55,019.8 1. Civil Deposits 2,44,604.5 5,20,000.0 2,65,651.1 2,65,651.1 33,06,264.8 40,80,663.6 40,80,123.9 41,33,208.9 2. Deposits of Local Funds 3.1 3.2 1.5 1.5 83,44,313.9 99,11,575.5 1,01,39,181.1 1,01,50,081.1 3. Civil Advances - - - - 150.4 549.5 549.5 549.5 4. Others 66,601.5 90,062.0 1,49,065.5 1,49,065.5 26,09,609.8 27,91,116.2 28,18,787.5 20,71,180.3 IX. Suspense and Miscellaneous (1 to 4) 48,01,069.8 16,86,000.0 25,33,414.7 25,33,414.7 1,73,36,756.2 1,60,83,477.2 1,78,48,573.8 1,70,11,772.5 1. Suspense 92,194.2 1,00,000.0 5,31,153.8 5,31,153.8 5,135.3 8,121.0 20,149.5 20,149.3 2. Cash Balance Investment Accounts 7,82,683.0 10,50,000.0 14,05,000.0 14,05,000.0 1,73,31,606.0 1,60,74,655.0 1,78,27,723.0 1,69,90,922.0 3. Deposits with RBI - - - - - - - - 4. Others 39,26,192.6 5,36,000.0 5,97,260.9 5,97,260.9 14.9 701.3 701.3 701.3 X. Appropriation to Contingency Fund - - - - XI. Miscellaneous Capital Receipts 12.5 - - - 1,660.9 3,000.0 2,000.0 2,500.0 of which: Disinvestment - - - - 1,660.9 3,000.0 2,000.0 2,500.0 XII. Remittances 10,949.6 7,907.4 7,428.4 7,428.4 1,34,505.1 11,11,894.1 3,36,396.7 3,36,396.7
Appendix III : Capital Receipts of States and Union Territories with Legislature (Contd.)(₹ Lakh)

State Finances : A Study of Budgets of 2019-20
262
Appendix III : Capital Receipts of States and Union Territories with Legislature (Contd.)(₹ Lakh)
Item
SIKKIM TAMIL NADU
2017-18(Accounts)
2018-19(Budget
Estimates)
2018-19(Revised
Estimates)
2019-20(Budget
Estimates)
2017-18(Accounts)
2018-19(Budget
Estimates)
2018-19(Revised
Estimates)
2019-20(Budget
Estimates)
1 2 3 4 5 2 3 4 5
TOTAL CAPITAL RECEIPTS (I to XII) 12,38,023.9 9,12,000.4 9,36,130.1 6,64,709.3 6,15,78,421.0 5,25,57,288.6 6,01,25,140.0 5,25,54,692.3 TOTAL CAPITAL RECEIPTS 1,32,880.2 1,03,714.4 1,25,151.1 1,26,792.5 60,93,643.4 63,67,903.8 58,19,792.9 66,30,355.5 (Includes Public Accounts on a net basis)*I. Internal Debt (1 to 8) 1,05,092.6 1,02,848.0 1,14,448.0 86,235.0 42,96,885.5 53,06,493.1 54,58,217.7 55,70,100.0 1. Market Loans 99,721.0 97,638.0 1,09,238.0 81,235.0 40,96,537.0 50,52,740.0 52,02,740.0 53,20,000.0 2. Loans from LIC - - - - - - - - 3. Loans from SBI and other Banks - - - - - - - - 4. Loans from National Bank for Agriculture and Rural Development 5,371.6 5,000.0 5,000.0 5,000.0 1,90,211.8 2,50,100.0 2,50,100.0 2,50,100.0 5. Loans from National Co-operative Development Corporation - - - - 9,915.7 3,653.1 5,356.3 - 6. WMA from RBI - - - - - - - - 7. Special Securities issued to NSSF - - - - - - - - 8. Others@ - 210.0 210.0 - 221.0 - 21.3 - of which: Land Compensation and other Bonds - - - - - - - -II. Loans and Advances from the Centre (1 to 6) 253.5 3.7 3.7 885.0 2,75,269.7 4,59,941.6 2,96,708.9 3,27,744.4 1. State Plan Schemes 253.5 - - 830.0 2,74,213.4 4,59,941.6 2,96,708.9 3,27,744.4 of which: Advance release of Plan Assistance for Natural Calamities - - - - - - - - 2. Central Plan Schemes - - - - - - - - 3. Centrally Sponsored Schemes - 3.7 3.7 55.0 - - - - 4. Non-Plan (i + ii) - - - - 1,056.3 - - - (i) Relief for Natural Calamities - - - - - - - - (ii) Others - - - - 1,056.3 - - - 5. Ways and Means Advances from Centre - - - - - - - - 6. Loans for Special Schemes - - - - - - - -III. Recovery of Loans and Advances (1 to 12) 91.3 82.7 82.7 82.7 8,47,235.2 5,59,463.8 6,84,819.0 5,06,708.5 1. Housing - - - - 7.3 1.6 3.8 1.5 2. Urban Development - - - - 4,038.8 4,273.5 4,336.1 2,795.5 3. Crop Husbandry - - - - - 13,000.0 1,034.4 - 4. Food Storage and Warehousing - - - - 1.0 1.7 0.4 - 5. Co-operation 80.0 80.0 80.0 80.0 2,202.9 993.3 87,239.2 1,435.6 6. Minor Irrigation - - - - 0.2 - 6.0 - 7. Power Projects - - - - 5,09,681.0 4,69,593.7 4,58,432.3 4,57,779.8 8. Village and Small Industries - - - - 42.1 5,963.1 147.2 47.8 9. Industries and Minerals - - - - 31,907.6 8.3 76,981.4 9,007.5 10. Road Transport - - - - 2,71,620.2 - - - 11. Government Servants, etc.+ 8.5 - - - 23,795.8 58,446.7 26,714.6 28,363.8 12. Others** 2.7 2.7 2.7 2.7 3,938.4 7,181.8 29,923.6 7,276.8 IV. Inter-State Settlement - - - - - - - - V. Contingency Fund - - - - - - - - VI. State Provident Funds, etc. (1 + 2) 30,965.9 33,550.0 39,586.7 40,553.0 8,38,995.9 8,06,764.6 8,08,945.7 9,00,680.6 1. State Provident Funds 30,352.9 33,000.0 39,036.7 40,000.0 8,25,925.8 7,93,720.7 7,95,742.2 8,87,477.1 2. Others 613.0 550.0 550.0 553.0 13,070.1 13,043.9 13,203.6 13,203.6 VII. Reserve Funds (1 to 4) 13,915.6 9,300.0 14,793.0 46,615.7 6,59,093.6 4,36,459.6 6,89,233.8 5,81,724.6 1. Depreciation/Renewal Reserve Funds - - - - - 145.7 811.4 450.2 2. Sinking Funds 3,622.7 1,200.0 1,200.0 1,200.0 1,09,259.6 1,72,750.5 1,77,651.8 1,10,200.1 3. Famine Relief Fund - - - - - - - - 4. Others 10,292.9 8,100.0 13,593.0 45,415.7 5,49,833.9 2,63,563.5 5,10,770.5 4,71,074.3 VIII. Deposits and Advances (1 to 4) 51,469.8 94,615.2 95,615.2 1,01,615.3 1,01,38,552.0 1,34,14,255.5 89,92,925.5 1,05,05,459.2 1. Civil Deposits 42,738.6 83,615.2 83,615.2 83,615.3 32,89,484.6 30,10,307.7 31,51,914.5 31,38,230.4 2. Deposits of Local Funds - - - - 1,70,406.2 1,85,494.5 1,93,980.5 1,93,980.5 3. Civil Advances - - - - 4.1 - 1.7 5.3 4. Others 8,731.2 11,000.0 12,000.0 18,000.0 66,78,657.1 1,02,18,453.3 56,47,028.8 71,73,243.0 IX. Suspense and Miscellaneous (1 to 4) 8,11,488.2 5,36,756.6 5,36,756.6 3,88,722.5 4,45,22,243.9 3,15,72,869.1 4,31,94,289.2 3,41,62,274.7 1. Suspense -261.0 - - - 11,646.2 4,99,321.0 -8,913.2 -8,913.2 2. Cash Balance Investment Accounts 3,88,722.4 1,64,000.0 1,64,000.0 3,88,722.4 3,06,44,604.5 1,81,46,366.8 2,95,33,594.0 2,40,49,918.5 3. Deposits with RBI - - - - - - - - 4. Others 4,23,026.8 3,72,756.6 3,72,756.6 - 1,38,65,993.3 1,29,27,181.3 1,36,69,608.5 1,01,21,269.5 X. Appropriation to Contingency Fund - - - - - - - -XI. Miscellaneous Capital Receipts - - - - 224.3 - - - of which: Disinvestment - - - - - - - -XII. Remittances 2,24,747.1 1,34,844.2 1,34,844.2 - -79.0 1,041.4 0.3 0.3

Appendix III
263
Item
TELANGANA TRIPURA
2017-18(Accounts)
2018-19(Budget
Estimates)
2018-19(Revised
Estimates)
2019-20(Budget
Estimates)
2017-18(Accounts)
2018-19(Budget
Estimates)
2018-19(Revised
Estimates)
2019-20(Budget
Estimates)
1 2 3 4 5 2 3 4 5
TOTAL CAPITAL RECEIPTS (I to XII) 1,93,81,446.9 1,10,77,300.7 1,09,77,305.7 1,07,82,881.4 34,04,803.5 43,59,229.0 33,85,218.0 34,58,105.0 TOTAL CAPITAL RECEIPTS 33,67,126.6 43,40,717.4 42,40,792.4 33,34,486.1 1,94,991.0 1,99,500.0 1,77,459.0 2,45,475.0 (Includes Public Accounts on a net basis)*I. Internal Debt (1 to 8) 48,51,672.0 32,40,000.0 32,40,000.0 32,10,000.0 1,33,214.1 1,54,000.0 1,69,283.0 2,37,700.0 1. Market Loans 24,60,000.0 31,50,000.0 31,50,000.0 31,00,000.0 1,13,700.0 1,39,000.0 1,54,283.0 2,17,700.0 2. Loans from LIC - - - - - - - - 3. Loans from SBI and other Banks - - - - - - - - 4. Loans from National Bank for Agriculture and Rural Development 1,00,000.0 80,000.0 80,000.0 1,00,000.0 19,514.1 15,000.0 15,000.0 20,000.0 5. Loans from National Co-operative Development Corporation 352.8 - - - - - - - 6. WMA from RBI 22,92,177.0 10,000.0 10,000.0 10,000.0 - - - - 7. Special Securities issued to NSSF - - - - - - - - 8. Others@ -857.8 - - - - - - - of which: - - - - - - - Land Compensation and other Bonds -857.8 - - - - - - - II. Loans and Advances from the Centre (1 to 6) 63,667.9 80,000.0 80,000.0 80,000.0 126.8 300.0 300.0 300.0 1. State Plan Schemes 63,667.9 80,000.0 80,000.0 80,000.0 - 300.0 - - of which: Advance release of Plan Assistance for Natural Calamities - - - - - - - - 2. Central Plan Schemes - - - - - - - - 3. Centrally Sponsored Schemes - - - - - - - - 4. Non-Plan (i + ii) - - - - 126.8 - 300.0 300.0 (i) Relief for Natural Calamities - - - - - - - - (ii) Others - - - - 126.8 - 300.0 300.0 5. Ways and Means Advances from Centre - - - - - - - - 6. Loans for Special Schemes - - - - - - - - III. Recovery of Loans and Advances (1 to 12) 13,796.6 7,80,717.4 6,80,717.4 4,486.1 168.7 200.0 200.0 200.0 1. Housing - 2,55,013.2 2,55,013.2 510.3 4.0 21.5 21.5 21.5 2. Urban Development - 4,80,002.9 3,80,002.9 - - - - - 3. Crop Husbandry - 98.0 98.0 - - - - - 4. Food Storage and Warehousing - 0.4 0.4 0.4 - - - - 5. Co-operation 1,951.9 87.5 87.5 87.5 62.0 62.0 62.0 62.0 6. Minor Irrigation - - - - - - - - 7. Power Projects 4,864.2 40,054.9 40,054.9 - - - - - 8. Village and Small Industries - 247.7 247.7 - - - - - 9. Industries and Minerals - 249.7 249.7 249.7 - - - - 10. Road Transport - - - - - - - - 11. Government Servants, etc.+ 6,980.5 3,636.8 3,636.8 3,636.8 52.7 116.5 116.5 116.5 12. Others** - 1,326.3 1,326.3 1.5 50.0 - - - IV. Inter-State Settlement - - - - - - - - V. Contingency Fund - - - - - - - - VI. State Provident Funds, etc. (1 + 2) 2,49,532.5 2,50,000.0 2,50,000.0 2,99,439.0 1,25,414.0 1,28,200.0 1,24,700.0 1,25,800.0 1. State Provident Funds 1,81,854.5 1,75,827.0 1,75,827.0 2,18,225.5 1,23,786.6 1,26,400.0 1,23,000.0 1,24,000.0 2. Others 67,677.9 74,173.1 74,173.1 81,213.5 1,627.4 1,800.0 1,700.0 1,800.0 VII. Reserve Funds (1 to 4) 1,01,529.8 15,87,369.0 15,87,369.0 3,41,984.2 11,226.5 6,315.0 6,070.0 6,275.0 1. Depreciation/Renewal Reserve Funds - - - - - - - - 2. Sinking Funds 49,203.2 53,880.6 53,880.6 59,065.0 7,744.3 - - - 3. Famine Relief Fund - - - - - - - - 4. Others 52,326.6 15,33,488.5 15,33,488.5 2,82,919.2 3,482.2 6,315.0 6,070.0 6,275.0 VIII. Deposits and Advances (1 to 4) 54,04,845.6 51,39,214.3 51,39,219.3 68,46,972.1 44,831.1 49,220.0 31,865.0 32,880.0 1. Civil Deposits 29,02,713.2 28,08,502.5 28,08,502.5 38,44,355.0 42,985.7 49,000.0 30,000.0 31,000.0 2. Deposits of Local Funds 13,09,313.9 13,30,171.1 13,30,171.1 15,71,234.9 - - - - 3. Civil Advances 7,183.1 20,509.1 20,509.1 8,619.7 1,781.3 160.0 1,800.0 1,810.0 4. Others 11,85,635.4 9,80,031.7 9,80,036.7 14,22,762.5 64.2 60.0 65.0 70.0 IX. Suspense and Miscellaneous (1 to 4) 66,40,897.1 - - - 29,46,214.4 39,20,973.0 29,09,800.0 29,11,850.0 1. Suspense -1,42,711.5 - - - 12,304.5 7,823.0 8,000.0 9,000.0 2. Cash Balance Investment Accounts 37,82,745.4 - - - 29,31,989.0 39,12,000.0 29,00,000.0 29,01,000.0 3. Deposits with RBI - - - - - - - - 4. Others 30,00,863.2 - - - 1,920.9 1,150.0 1,800.0 1,850.0 X. Appropriation to Contingency Fund - - - - - - - - XI. Miscellaneous Capital Receipts - - - - - - - - of which: Disinvestment - - - - - - - - XII. Remittances 20,55,505.5 - - - 1,43,607.8 1,00,021.0 1,43,000.0 1,43,100.0
Appendix III : Capital Receipts of States and Union Territories with Legislature (Contd.)(₹ Lakh)

State Finances : A Study of Budgets of 2019-20
264
Appendix III : Capital Receipts of States and Union Territories with Legislature (Contd.)(₹ Lakh)
Item
UTTARAKHAND UTTAR PRADESH
2017-18(Accounts)
2018-19(Budget
Estimates)
2018-19(Revised
Estimates)
2019-20(Budget
Estimates)
2017-18(Accounts)
2018-19(Budget
Estimates)
2018-19(Revised
Estimates)
2019-20(Budget
Estimates)
1 2 3 4 5 2 3 4 5
TOTAL CAPITAL RECEIPTS (I to XII) 65,52,049.3 17,06,645.0 14,90,450.7 33,93,061.6 14,94,31,039.6 5,14,97,964.8 5,02,20,310.8 5,27,68,399.5 TOTAL CAPITAL RECEIPTS 9,63,736.2 8,39,284.1 6,86,685.1 8,53,394.4 50,65,148.2 72,38,009.1 69,60,355.1 74,10,008.4 (Includes Public Accounts on a net basis)*I. Internal Debt (1 to 8) 13,34,262.3 9,31,000.0 8,21,000.0 9,51,000.0 46,31,340.2 65,61,500.0 53,33,846.0 71,76,848.0 1. Market Loans 6,66,000.0 7,30,000.0 6,30,000.0 7,60,000.0 41,60,000.0 49,60,300.0 48,32,646.0 55,83,148.0 2. Loans from LIC - 3. Loans from SBI and other Banks - - - - - - - - 4. Loans from National Bank for - - - - - - - - Agriculture and Rural Development 75,000.0 90,000.0 80,000.0 80,000.0 1,50,000.0 5,80,000.0 4,80,000.0 5,80,000.0 5. Loans from National Co-operative Development Corporation 171.7 1,000.0 1,000.0 1,000.0 252.8 1,200.0 1,200.0 1,200.0 6. WMA from RBI 5,93,090.5 1,10,000.0 1,10,000.0 1,10,000.0 2,93,295.0 10,00,000.0 - 10,00,000.0 7. Special Securities issued to NSSF - - - - - - - - 8. Others@ - - - - 27,792.4 20,000.0 20,000.0 12,500.0 of which: Land Compensation and other Bonds - - - - - - - -II. Loans and Advances from the Centre (1 to 6) 11,435.8 20,000.0 20,000.0 18,000.0 1,10,316.4 1,50,000.0 1,00,000.0 1,50,000.0 1. State Plan Schemes - - - - - 1,50,000.0 1,00,000.0 - of which: Advance release of Plan Assistance for Natural Calamities - - - - - - - - 2. Central Plan Schemes - - - - - - - - 3. Centrally Sponsored Schemes - - - - - - - - 4. Non-Plan (i + ii) 11,435.8 20,000.0 20,000.0 18,000.0 1,10,316.4 - - 1,50,000.0 (i) Relief for Natural Calamities - - (ii) Others 11,435.8 20,000.0 20,000.0 18,000.0 1,10,316.4 - - 1,50,000.0 5. Ways and Means Advances from Centre - - - - - - - 6. Loans for Special Schemes - - - - - - - -III. Recovery of Loans and Advances (1 to 12) 3,350.3 3,274.2 3,294.2 3,394.4 23,577.0 5,16,509.0 5,16,509.0 5,68,160.0 1. Housing - - - - - - - - 2. Urban Development - - - - 75.0 5.0 5.0 423.0 3. Crop Husbandry - - - - 806.8 2.0 2.0 1,002.0 4. Food Storage and Warehousing - - - - 0.1 - - - 5. Co-operation 96.1 101.0 121.0 131.0 458.0 - - 500.0 6. Minor Irrigation - - - - - - - - 7. Power Projects 3,053.5 3,000.0 3,000.0 3,150.0 - 4,89,172.0 4,89,172.0 4,89,172.0 8. Village and Small Industries 4.1 10.0 10.0 5.0 14.5 8.0 8.0 8.0 9. Industries and Minerals - - - - 9,372.6 5,000.0 5,000.0 43,500.0 10. Road Transport - - - - 327.7 - - - 11. Government Servants, etc.+ 196.6 163.1 163.1 108.4 10,180.6 11,318.0 11,318.0 11,400.0 12. Others** - - - - 2,341.7 11,004.0 11,004.0 22,155.0 IV. Inter-State Settlement V. Contingency Fund 10,466.2 15,000.0 15,000.0 15,000.0 25,803.9 20,000.0 20,000.0 20,000.0 VI. State Provident Funds, etc. (1 + 2) 1,84,079.0 91,954.5 84,413.2 92,220.0 11,71,806.3 14,26,835.0 14,26,835.0 15,66,890.0 1. State Provident Funds 1,80,791.5 89,300.0 83,000.0 89,300.0 11,35,859.0 13,78,835.0 13,78,835.0 15,11,390.0 2. Others 3,287.5 2,654.5 1,413.2 2,920.0 35,947.3 48,000.0 48,000.0 55,500.0 VII. Reserve Funds (1 to 4) 23,234.0 1,331.0 1,210.0 1,464.2 15,26,753.0 31,11,795.0 31,11,795.0 26,95,101.0 1. Depreciation/Renewal Reserve Funds - - - - - - - - 2. Sinking Funds - - - - 12,23,222.6 26,40,395.0 26,40,395.0 21,85,701.0 3. Famine Relief Fund - - - - - - - - 4. Others 23,234.0 1,331.0 1,210.0 1,464.2 3,03,530.4 4,71,400.0 4,71,400.0 5,09,400.0 VIII. Deposits and Advances (1 to 4) 4,72,746.8 2,88,548.5 2,37,780.8 3,17,403.4 15,87,636.2 12,71,650.1 12,71,650.1 13,87,060.1 1. Civil Deposits 2,31,799.0 2,18,835.2 1,74,486.6 2,40,718.7 11,68,611.6 7,58,550.1 7,58,550.1 7,98,760.1 2. Deposits of Local Funds 1,65,696.6 54,941.8 44,904.2 60,436.0 1,07,583.2 2,77,500.1 2,77,500.0 2,77,500.0 3. Civil Advances 13,401.2 14,771.6 12,490.0 16,248.7 22,634.6 - - - 4. Others 61,850.1 - 5,900.0 - 2,88,806.9 2,35,600.0 2,35,600.0 3,10,800.0 IX. Suspense and Miscellaneous (1 to 4) 46,04,100.2 26,952.2 23,402.0 16,33,147.4 13,74,60,913.8 3,80,89,675.7 3,80,89,675.7 3,88,54,340.4 1. Suspense 5,425.6 26,952.2 23,402.0 29,647.4 8,549.7 1,16,240.0 1,16,240.0 1,16,240.0 2. Cash Balance Investment Accounts 14,07,185.3 - - 15,00,000.0 3,43,91,646.7 2,80,00,000.0 2,80,00,000.0 2,80,00,000.0 3. Deposits with RBI - - - 7,81,97,633.5 - - - 4. Others 31,91,489.3 - - 1,03,500.0 2,48,63,083.9 99,73,435.7 99,73,435.7 1,07,38,100.4 X. Appropriation to Contingency Fund 25,000.0 - - - - - - -XI. Miscellaneous Capital Receipts - 10.0 10.0 - - - - - of which: Disinvestment - - - - - - - -XII. Remittances -1,16,625.2 3,28,574.7 2,84,340.6 3,61,432.1 28,92,892.9 3,50,000.0 3,50,000.0 3,50,000.0

Appendix III
265
Item
WEST BENGAL
2017-18(Accounts)
2018-19(Budget
Estimates)
2018-19(Revised
Estimates)
2019-20(Budget
Estimates)
1 2 3 4 5
TOTAL CAPITAL RECEIPTS (I to XII) 8,68,88,412.7 6,32,58,898.6 9,24,35,204.8 9,79,56,762.8 TOTAL CAPITAL RECEIPTS 44,74,781.7 54,20,039.1 55,19,811.7 61,98,338.3 (Includes Public Accounts on a net basis)*I. Internal Debt (1 to 8) 43,71,871.6 66,54,800.0 70,45,400.0 76,57,400.0 1. Market Loans 36,91,100.0 43,94,800.0 47,85,400.0 53,77,400.0 2. Loans from LIC - - - - 3. Loans from SBI and other Banks - - - - 4. Loans from National Bank for Agriculture and Rural Development - - - - 5. Loans from National Co-operative Development Corporation 713.7 - - - 6. WMA from RBI 5,39,487.0 21,00,000.0 21,00,000.0 21,00,000.0 7. Special Securities issued to NSSF - - - - 8. Others@ 1,40,570.8 1,60,000.0 1,60,000.0 1,80,000.0 of which: Land Compensation and other Bonds 0.1 - - -II. Loans and Advances from the Centre (1 to 6) 2,02,509.2 1,44,329.1 1,37,430.0 1,80,953.0 1. State Plan Schemes 2,02,509.2 1,44,329.1 - - of which: Advance release of Plan Assistance for Natural Calamities - - - - 2. Central Plan Schemes - - - - 3. Centrally Sponsored Schemes - - - - 4. Non-Plan (i + ii) - - 1,37,430.0 1,80,953.0 (i) Relief for Natural Calamities - - - - (ii) Others - - 1,37,430.0 1,80,953.0 5. Ways and Means Advances from Centre 6. Loans for Special Schemes - - - -III. Recovery of Loans and Advances (1 to 12) 21,359.5 2,82,274.5 29,700.7 35,001.0 1. Housing 2.2 2.3 2.4 2.6 2. Urban Development - - - - 3. Crop Husbandry 2,200.0 2,402.0 3,723.0 2,650.0 4. Food Storage and Warehousing - - - - 5. Co-operation 46.7 23.4 11.3 12.5 6. Minor Irrigation - - - - 7. Power Projects 15,736.4 2,79,217.0 23,046.0 29,481.0 8. Village and Small Industries 6.3 8.2 3.3 3.5 9. Industries and Minerals 1,509.2 186.8 1,003.0 930.0 10. Road Transport 1,331.0 220.0 1,366.8 1,366.8 11. Government Servants, etc.+ 327.6 14.8 344.7 354.3 12. Others** 200.0 200.0 200.2 200.3 IV. Inter-State Settlement - - - V. Contingency Fund 20.0 - 3,746.1 - VI. State Provident Funds, etc. (1 + 2) 3,72,752.0 3,67,237.0 3,95,059.5 4,18,704.2 1. State Provident Funds 3,71,309.6 3,65,723.0 3,93,588.2 4,17,203.4 2. Others 1,442.5 1,514.0 1,471.3 1,500.7 VII. Reserve Funds (1 to 4) 2,99,732.9 3,24,211.0 2,77,626.0 2,45,866.0 1. Depreciation/Renewal Reserve Funds - - - - 2. Sinking Funds 19,139.2 40,000.0 30,000.0 40,000.0 3. Famine Relief Fund - - - - 4. Others 2,80,593.7 2,84,211.0 2,47,626.0 2,05,866.0 VIII. Deposits and Advances (1 to 4) 75,11,163.9 74,27,971.2 92,76,743.0 1,06,62,249.3 1. Civil Deposits 12,05,556.3 9,80,774.5 13,93,052.2 16,28,398.1 2. Deposits of Local Funds 19,56,787.7 14,68,917.3 23,53,195.3 28,22,824.3 3. Civil Advances 28.0 50.0 30.8 33.8 4. Others 43,48,791.9 49,78,229.4 55,30,464.8 62,10,993.1 IX. Suspense and Miscellaneous (1 to 4) 7,41,09,073.4 4,80,57,000.4 7,52,69,333.1 7,87,56,399.6 1. Suspense 8,78,925.3 23,000.4 9,70,257.4 10,67,282.7 2. Cash Balance Investment Accounts 2,17,14,085.6 92,00,000.0 2,32,58,868.0 2,36,85,700.0 3. Deposits with RBI 4,03,67,754.9 2,90,00,000.0 3,90,00,000.0 4,10,00,000.0 4. Others 1,11,48,307.6 98,34,000.0 1,20,40,207.8 1,30,03,417.0 X. Appropriation to Contingency Fund - - - -XI. Miscellaneous Capital Receipts - - - - of which: Disinvestment - - - -XII. Remittances -69.8 1,075.5 166.4 189.7
Appendix III : Capital Receipts of States and Union Territories with Legislature (Contd.)(₹ Lakh)

State Finances : A Study of Budgets of 2019-20
266
Appendix III : Capital Receipts of States and Union Territories with Legislature (Contd.)(₹ Lakh)
Item
NATIONAL CAPITAL TERRITORY OF DELHI PUDUCHERRY
2017-18(Accounts)
2018-19(Budget
Estimates)
2018-19(Revised
Estimates)
2019-20(Budget
Estimates)
2017-18(Accounts)
2018-19(Budget
Estimates)
2018-19(Revised
Estimates)
2019-20(Budget
Estimates)
1 2 3 4 5 2 3 4 5TOTAL CAPITAL RECEIPTS (I to XII) 2,59,676.0 3,47,400.0 6,85,000.0 5,53,600.0 1,77,968.0 31,04,950.0 31,08,874.7 32,63,640.9 TOTAL CAPITAL RECEIPTS 2,59,676.0 3,47,400.0 6,76,000.0 5,53,600.0 1,47,912.4 1,78,096.2 1,73,568.4 1,84,719.2 (Includes Public Accounts on a net basis)*I. Internal Debt (1 to 8) - - - - 98,870.8 1,05,000.0 1,05,000.0 1,10,000.0 1. Market Loans - - - - 82,500.0 82,500.0 82,500.0 90,000.0 2. Loans from LIC - - - - - - - - 3. Loans from SBI and other Banks - - - - - - - - 4. Loans from National Bank for Agriculture and Rural Development - - - - - - - - 5. Loans from National Co-operative Development Corporation - - - - - - - - 6. WMA from RBI - - - - - - - - 7. Special Securities issued to NSSF - - - - - - - - 8. Others@ - - - - 16,370.8 22,500.0 22,500.0 20,000.0 of which: Land Compensation and other Bonds - - - - - - - -II. Loans and Advances from the Centre (1 to 6) 1,90,634.0 2,92,400.0 5,80,000.0 4,78,600.0 7,200.0 - - - 1. State Plan Schemes - - - - - - - - of which: Advance release of Plan Assistance for Natural Calamities - - - - - - - - 2. Central Plan Schemes - - - - - - - - 3. Centrally Sponsored Schemes - - - - - - - - 4. Non-Plan (i + ii) 1,90,634.0 2,92,400.0 5,80,000.0 4,78,600.0 7,200.0 - - - (i) Relief for Natural Calamities (ii) Others 1,90,634.0 2,92,400.0 5,80,000.0 4,78,600.0 7,200.0 - - - 5. Ways and Means Advances from Centre 6. Loans for Special Schemes - - - - - - - -III. Recovery of Loans and Advances (1 to 12) 69,042.0 55,000.0 1,05,000.0 75,000.0 134.8 300.4 300.0 200.0 1. Housing - - - - 0.7 0.9 1.0 1.0 2. Urban Development - - - - - - - - 3. Crop Husbandry - - - - - - - - 4. Food Storage and Warehousing - - - - - - - - 5. Co-operation - - - - 1.4 1.0 3.0 1.0 6. Minor Irrigation - - - - - - - - 7. Power Projects - - - - - - - - 8. Village and Small Industries - - - - - 1.0 1.0 2.0 9. Industries and Minerals - - - - - - - - 10. Road Transport - - - - - - - - 11. Government Servants, etc.+ 57.4 150.0 150.0 150.0 111.5 269.5 273.0 173.0 12. Others** 68,984.6 54,850.0 1,04,850.0 74,850.0 21.2 28.0 22.0 23.0 IV. Inter-State Settlement - - - - - - - -V. Contingency Fund - - - - - - - -VI. State Provident Funds, etc. (1 + 2) - - - - 32,836.2 31,151.8 26,938.0 31,151.8 1. State Provident Funds - - - - 32,286.8 31,000.0 26,800.0 31,000.0 2. Others - - - - 549.5 151.8 138.0 151.8 VII. Reserve Funds (1 to 4) - - - - 1,003.2 3,000.0 3,000.0 - 1. Depreciation/Renewal Reserve Funds - - - - - - - - 2. Sinking Funds - - - - 1,000.0 3,000.0 3,000.0 - 3. Famine Relief Fund - - - - - - - - 4. Others - - - - 3.2 - - - VIII. Deposits and Advances (1 to 4) - - - - 15,315.5 17,376.9 16,671.4 17,630.0 1. Civil Deposits - - - - 14,903.5 16,969.9 16,275.7 17,194.7 2. Deposits of Local Funds - - - - 257.9 283.7 272.1 299.3 3. Civil Advances - - - - 78.1 85.9 86.2 94.8 4. Others - - - - 76.0 37.4 37.5 41.2 IX. Suspense and Miscellaneous (1 to 4) - - - - -6,329.7 28,96,989.9 29,05,680.9 30,50,810.4 1. Suspense - - - - -2,955.3 1,35,844.8 1,36,252.3 1,43,065.0 2. Cash Balance Investment Accounts - - - - - 20,05,197.6 20,11,213.2 21,11,773.9 3. Deposits with RBI - - - - - 7,59,028.0 7,61,305.1 7,99,370.4 4. Others - - - - -3,374.4 -3,080.5 -3,089.8 -3,398.8X. Appropriation to Contingency Fund - - - - - - - -XI. Miscellaneous Capital Receipts - - - - - - - - of which: Disinvestment - - - - - - - -XII. Remittances - - - - 28,937.2 51,131.1 51,284.5 53,848.7

Appendix III
267
Item
ALL STATES AND UTs
2017-18(Accounts)
2018-19(Budget Estimates)
2018-19(Revised Estimates)
2019-20(Budget Estimates)
1 2 3 4 5
TOTAL CAPITAL RECEIPTS (I to XII) 90,99,60,801.7 60,81,54,951.4 69,67,42,951.9 70,44,53,742.4 TOTAL CAPITAL RECEIPTS 6,19,92,418.4 7,59,47,130.1 7,12,84,837.3 8,33,01,718.5 (Includes Public Accounts on a net basis)*I. Internal Debt (1 to 8) 5,62,59,504.8 7,19,46,391.9 6,91,33,911.5 8,01,82,501.3 1. Market Loans 4,21,87,162.8 5,60,56,968.7 5,37,00,773.7 6,22,98,717.5 2. Loans from LIC 2,989.0 - - - 3. Loans from SBI and other Banks 3,70,000.0 6,50,000.0 10,90,000.0 13,00,000.0 4. Loans from National Bank for Agriculture and Rural Development 28,80,049.9 42,37,927.0 42,56,785.0 48,51,509.0 5. Loans from National Co-operative Development Corporation 1,31,257.1 39,519.1 1,09,989.4 1,42,689.8 6. WMA from RBI 98,83,015.4 99,43,054.0 86,80,491.1 1,02,77,190.0 7. Special Securities issued to NSSF 5,16,078.0 5,21,000.0 4,93,908.0 5,24,490.0 8. Others@ 2,88,952.7 4,97,923.0 8,01,964.3 7,87,905.0 of which: Land Compensation and other Bonds 3,285.6 1,50,000.0 1,50,000.0 1,50,000.0 II. Loans and Advances from the Centre (1 to 6) 19,50,970.3 31,46,336.5 32,72,481.8 37,28,131.6 1. State Plan Schemes 9,82,779.4 19,89,541.7 6,29,657.6 9,83,448.3 of which: Advance release of Plan Assistance for Natural Calamities - - - - 2. Central Plan Schemes - - - - 3. Centrally Sponsored Schemes 22.5 13.7 13.7 80.0 4. Non-Plan (i + ii) 5,77,014.9 4,96,952.0 10,41,894.5 12,40,704.2 (i) Relief for Natural Calamities - - - - (ii) Others 5,77,014.9 4,96,952.0 10,41,894.5 12,40,704.2 5. Ways and Means Advances from Centre - - - - 6. Loans for Special Schemes 3,91,153.5 6,59,829.1 16,00,916.0 15,03,899.1 III. Recovery of Loans and Advances (1 to 12) 39,63,730.7 59,07,067.0 52,04,559.7 59,81,772.7 1. Housing 6,482.3 2,76,982.2 2,71,821.8 25,554.0 2. Urban Development 18,234.5 5,15,774.3 4,12,097.6 35,153.6 3. Crop Husbandry 27,990.2 18,455.1 10,822.3 12,117.0 4. Food Storage and Warehousing 5,863.8 6,188.8 75,231.7 6,256.3 5. Co-operation 90,737.5 1,35,346.9 2,19,785.7 1,88,413.1 6. Minor Irrigation 36.7 15.1 21.0 15.1 7. Power Projects 32,27,608.8 45,36,531.0 36,40,908.7 50,62,497.5 8. Village and Small Industries 1,565.7 9,570.9 4,406.3 3,436.4 9. Industries and Minerals 70,788.7 71,757.1 1,41,513.3 2,94,150.6 10. Road Transport 2,78,873.8 520.1 2,677.0 8,367.0 11. Government Servants, etc.+ 1,27,422.3 1,93,719.1 2,33,377.4 1,81,395.8 12. Others** 1,08,126.5 1,42,206.6 1,91,897.0 1,64,416.5 IV. Inter-State Settlement -4.9 1.0 1.0 1.0 V. Contingency Fund 1,73,381.0 2,26,100.0 2,31,816.8 2,26,100.0 VI. State Provident Funds, etc. (1 + 2) 1,75,63,547.8 1,37,78,618.7 1,66,41,308.2 1,95,56,112.7 1. State Provident Funds 88,19,308.1 89,33,313.9 92,70,756.0 1,01,04,946.3 2. Others 87,44,239.8 48,45,304.7 73,70,552.2 94,51,166.4 VII. Reserve Funds (1 to 4) 65,34,504.6 94,79,274.0 99,29,535.0 86,33,907.1 1. Depreciation/Renewal Reserve Funds 9,943.1 12,403.6 13,319.8 13,475.8 2. Sinking Funds 24,96,656.8 38,54,453.8 38,14,826.8 33,71,817.9 3. Famine Relief Fund 8.6 52,058.0 52,013.0 53,614.0 4. Others 40,27,896.1 55,60,358.6 60,49,375.4 51,94,999.3 VIII. Deposits and Advances (1 to 4) 8,15,63,711.3 8,06,61,123.9 8,10,59,947.6 9,10,12,512.1 1. Civil Deposits 2,76,84,882.7 2,35,34,057.0 2,56,06,964.6 2,80,11,328.5 2. Deposits of Local Funds 2,55,97,381.5 2,65,90,676.6 2,90,58,355.8 3,00,82,502.2 3. Civil Advances 7,36,349.5 6,57,320.9 6,61,703.9 6,94,083.1 4. Others 2,75,45,097.6 2,98,79,069.4 2,57,32,923.3 3,22,24,598.4 IX. Suspense and Miscellaneous (1 to 4) 71,12,94,088.4 40,96,60,686.5 49,94,66,948.4 48,06,67,230.7 1. Suspense 68,68,654.0 50,93,579.0 67,83,424.3 69,09,655.8 2. Cash Balance Investment Accounts 40,10,77,649.6 27,27,85,160.4 30,11,48,032.4 30,77,40,891.9 3. Deposits with RBI 19,95,86,368.0 4,81,50,778.3 10,96,93,135.2 8,46,38,497.9 4. Others 10,37,61,416.8 8,36,31,168.8 8,18,42,356.6 8,13,78,185.2 X. Appropriation to Contingency Fund 25,000.0 - - -XI. Miscellaneous Capital Receipts 17,440.3 1,19,312.2 23,835.5 1,92,583.6 of which: Disinvestment 5,648.2 1,07,000.0 6,000.0 1,80,300.0 XII. Remittances 3,06,14,927.2 1,32,30,039.9 1,17,78,606.4 1,42,72,889.8
– : Nil/Negligible/Not available.* : Sum of Items I to XII where Items IV to X, XII and I(3) are on a net basis while Items I (6) and IX (2 and 3) are excluded. Items I (6) and IX (2 and 3) have been taken as financing items for
overall surplus/deficit.@ : Include Land Compensation Bonds, loans from Khadi and Village Industries Commission, CWC, etc.+ : Comprises recovery of loans and advances from Government Servants for housing, purchase of conveyance, festivals, marriages, etc.** : Include recovery of loans and advances for Education, Art and Culture, Social Security and Welfare, Fisheries and Animal Husbandry, etc.$ : State Provident Funds also includes other savings deposits. Also see Notes to Appendices.Note: 1. Data pertaining to Jammu and Kashmir for 2017-18 is taken from CAG and are provisional 2. As per the Constitution of India, States cannot raise resources directly from external agencies.Source: Budget documents of state governments.
Appendix III : Capital Receipts of States and Union Territories with Legislature (Concld.)(₹ Lakh)

State Finances : A Study of Budgets of 2019-20
268
Appendix IV : Capital Expenditure of States and Union Territories with Legislature(₹ Lakh)
Item
ANDHRA PRADESH ARUNACHAL PRADESH
2017-18(Accounts)
2018-19(Budget
Estimates)
2018-19(Revised
Estimates)
2019-20(Budget
Estimates)
2017-18(Accounts)
2018-19(Budget
Estimates)
2018-19(Revised
Estimates)
2019-20(Budget
Estimates)
1 2 3 4 5 2 3 4 5
TOTAL CAPITAL DISBURSEMENTS (I to XII) 4,59,26,498.2 1,07,85,108.5 4,64,38,810.6 1,61,05,421.0 61,48,200.3 31,50,906.9 1,80,74,711.6 1,90,18,269.7
TOTAL CAPITAL DISBURSEMENTS (Excluding Public Accounts)$ 25,72,210.7 39,29,161.7 35,78,007.8 47,49,905.8 3,80,180.4 9,05,477.4 7,99,132.8 8,78,912.0
I. Total Capital Outlay (1 + 2) 13,49,070.7 28,67,848.7 20,39,815.2 32,29,338.7 3,18,810.3 7,87,785.7 7,28,916.0 8,00,672.1
1. Development (a + b) 13,20,766.6 27,65,658.2 20,12,316.0 26,50,382.0 2,64,318.2 3,93,712.7 6,42,886.8 4,18,835.4
(a) Social Services (1 to 9) 2,89,048.4 4,71,855.3 2,86,436.3 8,07,087.4 85,480.1 1,91,695.9 1,49,496.7 1,42,631.3
1. Education, Sports, Art and Culture 36,318.1 67,480.9 24,485.9 2,07,747.6 8,662.0 50,858.5 26,201.0 17,475.8
2. Medical and Public Health 20,096.0 47,413.1 16,875.5 2,44,778.3 4,171.4 43,025.3 11,182.2 16,935.0
3. Family Welfare - 1.0 442.9 - - - - -
4. Water Supply and Sanitation 56,287.4 78,486.3 51,368.1 61,261.5 30,251.8 34,531.0 46,023.3 44,973.0
5. Housing 32.7 240.0 - 690.0 2,731.0 - 3,635.1 4,500.0
6. Urban Development 52,996.7 96,986.1 1,22,792.6 1,68,452.1 23,837.9 48,853.6 42,541.3 9,025.6
7. Welfare of Scheduled Castes, Scheduled
Tribes and Other Backward Classes 67,739.9 58,831.5 14,386.0 41,389.6 - - - -
8. Social Security and Welfare 8,886.7 5,689.4 4,935.7 17,598.8 15,671.8 9,757.8 19,097.4 7,737.2
9. Others * 46,690.8 1,16,727.0 51,149.7 65,169.5 154.3 4,669.8 816.5 41,984.6
(b) Economic Services (1 to 10) 10,31,718.2 22,93,802.9 17,25,879.7 18,43,294.6 1,78,838.1 2,02,016.8 4,93,390.1 2,76,204.1
1. Agriculture and Allied Activities (i to xi) 24,308.6 61,495.6 27,769.6 94,657.7 1,358.5 41,790.8 6,684.4 5,753.5
i) Crop Husbandry 1,842.9 20,500.0 10,246.0 20,528.0 - 6,150.0 1,701.1 2,000.0
ii) Soil and Water Conservation - 3,000.0 1,412.0 2,500.0 - - - -
iii) Animal Husbandry 2,063.9 10,237.0 2,718.0 16,305.5 25.4 4,370.0 39.0 100.0
iv) Dairy Development - - - - - 1,875.0 51.0 -
v) Fisheries 971.1 2,000.0 1,357.4 14,123.5 28.0 598.6 317.0 2,000.0
vi) Forestry and Wild Life 134.7 14,758.6 6,323.6 3,699.7 - 2,050.0 170.0 700.0
vii) Plantations - - - - - - - -
viii) Food Storage and Warehousing - - - - 532.9 3,616.0 1,529.4 -
ix) Agricultural Research and Education 19,296.0 11,000.0 5,503.6 12,500.0 175.8 - 245.4 953.5
x) Co-operation - - 209.1 5,000.0 421.0 135.0 461.5 -
xi) Others @ - - - 20,001.0 175.5 22,996.2 2,170.0 -
2. Rural Development 86,934.5 1,56,015.0 98,231.2 1,09,893.1 5,309.5 9,735.0 6,867.5 11,689.2
3. Special Area Programmes - - - - 16,857.4 15,400.1 20,692.7 13,009.5
of which: Hill Areas - - - - - - - -
4. Major and Medium Irrigation and Flood Control 8,24,266.8 15,91,531.1 13,38,589.7 11,98,166.8 6,956.6 12,647.0 33,179.6 8,660.0
5. Energy 2,275.1 2,255.0 166.5 2,325.9 25,091.7 6,065.1 40,222.9 25,500.0
6. Industry and Minerals (i to iv) 9,979.1 1,46,409.3 65,361.5 1,11,612.3 1,027.7 4,044.0 4,014.3 1,344.0
i) Village and Small Industries - 15,001.3 13,234.8 20,000.0 812.5 3,729.0 3,827.0 1,044.0
ii) Iron and Steel Industries - - - - - - - -
iii) Non-Ferrous Mining and Metallurgical Industries - 50.0 9.0 10.0 182.6 315.0 92.0 220.0
iv) Others # 9,979.1 1,31,358.0 52,117.7 91,602.3 32.6 - 95.3 80.0
7. Transport (i + ii) 45,287.0 2,18,714.8 1,16,394.4 2,39,956.9 1,17,403.7 88,061.2 3,70,270.9 2,07,610.1
i) Roads and Bridges 36,909.0 1,95,296.0 1,08,856.6 2,21,617.0 1,15,804.9 82,886.2 3,66,084.9 2,00,221.0
ii) Others ** 8,378.0 23,418.8 7,537.8 18,339.8 1,598.9 5,175.0 4,186.0 7,389.1
8. Communications - - - - - - - -

Appendix IV
269
Item
ANDHRA PRADESH ARUNACHAL PRADESH
2017-18(Accounts)
2018-19(Budget
Estimates)
2018-19(Revised
Estimates)
2019-20(Budget
Estimates)
2017-18(Accounts)
2018-19(Budget
Estimates)
2018-19(Revised
Estimates)
2019-20(Budget
Estimates)
1 2 3 4 5 2 3 4 5
9. Science, Technology and Environment - 2,737.1 - - 1,314.3 8,100.0 - 680.0
10. General Economic Services (i + ii) 38,667.3 1,14,645.0 79,366.9 86,682.0 3,518.6 16,173.6 11,458.0 1,957.8
i) Tourism 3,955.3 4,000.0 988.0 1,500.0 3,112.3 12,300.0 11,190.0 1,565.3
ii) Others @@ 34,712.0 1,10,645.0 78,378.9 85,182.0 406.3 3,873.6 268.0 392.5
2. Non-Development (General Services) 28,304.1 1,02,190.6 27,499.2 5,78,956.7 54,492.0 3,94,073.0 86,029.2 3,81,836.6
II. Discharge of Internal Debt (1 to 8) 8,45,597.5 9,78,605.6 12,79,995.3 12,15,184.1 58,219.5 1,14,688.4 65,368.4 74,826.4
1. Market Loans 6,65,004.0 6,37,677.0 10,93,374.6 8,99,400.0 - - - -
2. Loans from LIC 2,622.8 2,138.7 2,149.1 1,908.0 - - - -
3. Loans from SBI and other Banks - - - - - - - -
4. Loans from NABARD 57,758.2 61,000.0 63,093.2 70,000.0 - - - -
5. Loans from National Co-operative
Development Corporation 2,021.8 2,631.6 2,440.1 3,281.1 - - - -
6. WMA from RBI - 1,50,000.0 - - - - - -
7. Special Securities issued to NSSF 1,13,345.9 1,21,244.4 1,15,439.6 1,21,245.0 17,638.9 65,793.8 16,968.6 18,692.8
8. Others 4,844.8 3,914.0 3,498.7 1,19,350.0 40,580.7 48,894.6 48,399.8 56,133.6
of which: Land Compensation Bonds - - - - - - - -
III. Repayment of Loans to the Centre (1 to 7) 99,471.3 1,06,511.0 73,864.5 1,26,516.0 2,643.3 2,643.3 2,632.9 2,583.6
1. State Plan Schemes 99,112.8 - 73,540.5 - 2,643.3 2,643.3 2,632.9 2,583.6
of which: Advance release of Plan
Assistance for Natural Calamities - - - - - - - -
2. Central Plan Schemes - - - - - - - -
3. Centrally Sponsored Schemes - - - - - - - -
4. Non-Plan (i + ii) 358.5 25.0 324.0 25.0 - - - -
i) Relief for Natural Calamities
ii) Others 358.5 25.0 324.0 25.0 - - - -
5. Ways and Means Advances from Centre - - - - - - - -
6. Loans for Special Schemes - - - - - - - -
7. Others - 1,06,486.1 - 1,26,491.0 - - - -
IV. Loans and Advances by State Governments (1 + 2)
2,78,071.4 1,26,196.3 1,84,332.8 1,78,867.0 507.3 360.0 2,215.5 830.0
1. Development Purposes (a + b) 2,73,130.4 1,18,292.8 1,59,512.8 1,51,053.5 175.3 - 1,512.4 150.0
a) Social Services ( 1 to 7) 1,94,665.7 17,402.8 1,24,412.4 16,953.5 175.3 - - -
1. Education, Sports, Art and Culture - - - - - - - -
2. Medical and Public Health - - - - - - - -
3. Family Welfare - - - - - - - -
4. Water Supply and Sanitation - - 15,239.8 - - - - -
5. Housing 1,84,818.5 7,877.8 1,07,877.8 7,428.5 - - - -
6. Government Servants (Housing) 1,238.0 9,525.0 750.1 9,525.0 - - - -
7. Others 8,609.2 - 544.7 - 175.3 - - -
b) Economic Services (1 to 10) 78,464.7 1,00,890.0 35,100.4 1,34,100.0 - - 1,512.4 150.0
1. Crop Husbandry - - - - - - - -
2. Soil and Water Conservation - - - - - - - -
3. Food Storage and Warehousing - - - - - - - -
4. Co-operation - - - 1,000.0 - - 1,512.4 150.0
5. Major and Medium Irrigation, etc. - - - - - - - -
6. Power Projects 32,199.3 97,800.0 30,032.9 27,900.0 - - - -
Appendix IV : Capital Expenditure of States and Union Territories with Legislature (Contd.)(₹ Lakh)
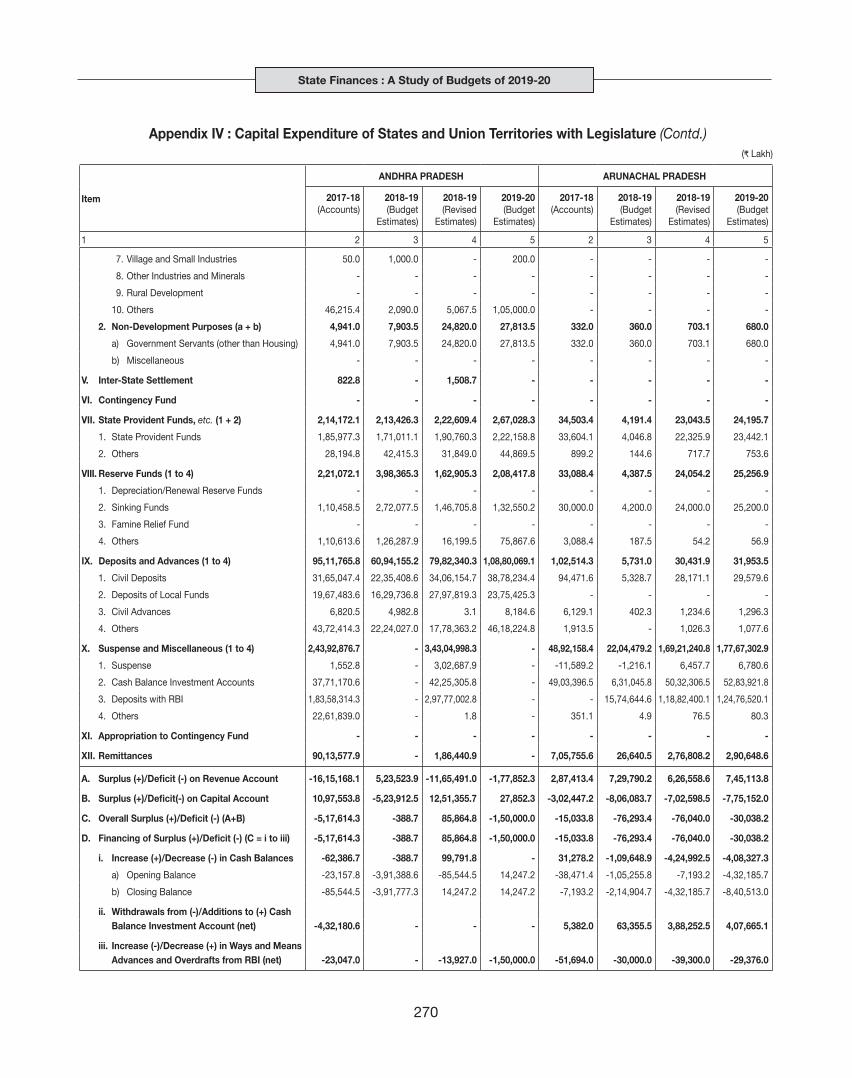
State Finances : A Study of Budgets of 2019-20
270
Item
ANDHRA PRADESH ARUNACHAL PRADESH
2017-18(Accounts)
2018-19(Budget
Estimates)
2018-19(Revised
Estimates)
2019-20(Budget
Estimates)
2017-18(Accounts)
2018-19(Budget
Estimates)
2018-19(Revised
Estimates)
2019-20(Budget
Estimates)
1 2 3 4 5 2 3 4 5
7. Village and Small Industries 50.0 1,000.0 - 200.0 - - - -
8. Other Industries and Minerals - - - - - - - -
9. Rural Development - - - - - - - -
10. Others 46,215.4 2,090.0 5,067.5 1,05,000.0 - - - -
2. Non-Development Purposes (a + b) 4,941.0 7,903.5 24,820.0 27,813.5 332.0 360.0 703.1 680.0
a) Government Servants (other than Housing) 4,941.0 7,903.5 24,820.0 27,813.5 332.0 360.0 703.1 680.0
b) Miscellaneous - - - - - - - -
V. Inter-State Settlement 822.8 - 1,508.7 - - - - -
VI. Contingency Fund - - - - - - - -
VII. State Provident Funds, etc. (1 + 2) 2,14,172.1 2,13,426.3 2,22,609.4 2,67,028.3 34,503.4 4,191.4 23,043.5 24,195.7
1. State Provident Funds 1,85,977.3 1,71,011.1 1,90,760.3 2,22,158.8 33,604.1 4,046.8 22,325.9 23,442.1
2. Others 28,194.8 42,415.3 31,849.0 44,869.5 899.2 144.6 717.7 753.6
VIII. Reserve Funds (1 to 4) 2,21,072.1 3,98,365.3 1,62,905.3 2,08,417.8 33,088.4 4,387.5 24,054.2 25,256.9
1. Depreciation/Renewal Reserve Funds - - - - - - - -
2. Sinking Funds 1,10,458.5 2,72,077.5 1,46,705.8 1,32,550.2 30,000.0 4,200.0 24,000.0 25,200.0
3. Famine Relief Fund - - - - - - - -
4. Others 1,10,613.6 1,26,287.9 16,199.5 75,867.6 3,088.4 187.5 54.2 56.9
IX. Deposits and Advances (1 to 4) 95,11,765.8 60,94,155.2 79,82,340.3 1,08,80,069.1 1,02,514.3 5,731.0 30,431.9 31,953.5
1. Civil Deposits 31,65,047.4 22,35,408.6 34,06,154.7 38,78,234.4 94,471.6 5,328.7 28,171.1 29,579.6
2. Deposits of Local Funds 19,67,483.6 16,29,736.8 27,97,819.3 23,75,425.3 - - - -
3. Civil Advances 6,820.5 4,982.8 3.1 8,184.6 6,129.1 402.3 1,234.6 1,296.3
4. Others 43,72,414.3 22,24,027.0 17,78,363.2 46,18,224.8 1,913.5 - 1,026.3 1,077.6
X. Suspense and Miscellaneous (1 to 4) 2,43,92,876.7 - 3,43,04,998.3 - 48,92,158.4 22,04,479.2 1,69,21,240.8 1,77,67,302.9
1. Suspense 1,552.8 - 3,02,687.9 - -11,589.2 -1,216.1 6,457.7 6,780.6
2. Cash Balance Investment Accounts 37,71,170.6 - 42,25,305.8 - 49,03,396.5 6,31,045.8 50,32,306.5 52,83,921.8
3. Deposits with RBI 1,83,58,314.3 - 2,97,77,002.8 - - 15,74,644.6 1,18,82,400.1 1,24,76,520.1
4. Others 22,61,839.0 - 1.8 - 351.1 4.9 76.5 80.3
XI. Appropriation to Contingency Fund - - - - - - - -
XII. Remittances 90,13,577.9 - 1,86,440.9 - 7,05,755.6 26,640.5 2,76,808.2 2,90,648.6
A. Surplus (+)/Deficit (-) on Revenue Account -16,15,168.1 5,23,523.9 -11,65,491.0 -1,77,852.3 2,87,413.4 7,29,790.2 6,26,558.6 7,45,113.8
B. Surplus (+)/Deficit(-) on Capital Account 10,97,553.8 -5,23,912.5 12,51,355.7 27,852.3 -3,02,447.2 -8,06,083.7 -7,02,598.5 -7,75,152.0
C. Overall Surplus (+)/Deficit (-) (A+B) -5,17,614.3 -388.7 85,864.8 -1,50,000.0 -15,033.8 -76,293.4 -76,040.0 -30,038.2
D. Financing of Surplus (+)/Deficit (-) (C = i to iii) -5,17,614.3 -388.7 85,864.8 -1,50,000.0 -15,033.8 -76,293.4 -76,040.0 -30,038.2
i. Increase (+)/Decrease (-) in Cash Balances -62,386.7 -388.7 99,791.8 - 31,278.2 -1,09,648.9 -4,24,992.5 -4,08,327.3
a) Opening Balance -23,157.8 -3,91,388.6 -85,544.5 14,247.2 -38,471.4 -1,05,255.8 -7,193.2 -4,32,185.7
b) Closing Balance -85,544.5 -3,91,777.3 14,247.2 14,247.2 -7,193.2 -2,14,904.7 -4,32,185.7 -8,40,513.0
ii. Withdrawals from (-)/Additions to (+) Cash Balance Investment Account (net) -4,32,180.6 - - - 5,382.0 63,355.5 3,88,252.5 4,07,665.1
iii. Increase (-)/Decrease (+) in Ways and Means Advances and Overdrafts from RBI (net) -23,047.0 - -13,927.0 -1,50,000.0 -51,694.0 -30,000.0 -39,300.0 -29,376.0
Appendix IV : Capital Expenditure of States and Union Territories with Legislature (Contd.)(₹ Lakh)

Appendix IV
271
Appendix IV : Capital Expenditure of States and Union Territories with Legislature (Contd.)(₹ Lakh)
Item
ASSAM BIHAR
2017-18(Accounts)
2018-19(Budget
Estimates)
2018-19(Revised
Estimates)
2019-20(Budget
Estimates)
2017-18(Accounts)
2018-19(Budget
Estimates)
2018-19(Revised
Estimates)
2019-20(Budget
Estimates)
1 2 3 4 5 2 3 4 5
TOTAL CAPITAL DISBURSEMENTS (I to XII) 1,82,34,638.9 3,09,35,890.3 2,09,58,894.2 2,14,63,206.8 4,73,19,621.4 69,83,975.2 71,81,158.2 81,69,910.3
TOTAL CAPITAL DISBURSEMENTS (Excluding Public Accounts)$ 9,90,550.7 16,20,055.2 23,74,554.4 18,73,665.1 33,80,329.1 40,25,060.1 42,22,243.1 45,27,035.8
I. Total Capital Outlay (1 + 2) 7,69,283.9 14,57,156.9 19,60,465.1 15,21,919.9 28,90,695.1 32,41,687.3 33,89,670.3 36,59,261.6
1. Development (a + b) 7,34,220.9 13,02,081.8 17,99,487.7 14,31,101.6 26,14,233.7 29,12,168.7 29,95,046.8 31,94,604.0
(a) Social Services (1 to 9) 2,84,587.7 4,87,054.6 5,65,269.6 3,53,457.9 4,25,833.9 5,17,949.1 5,22,403.8 7,63,218.3
1. Education, Sports, Art and Culture 6,089.3 92,974.1 93,435.7 53,545.7 1,51,870.2 1,15,910.0 1,25,595.0 1,48,448.0
2. Medical and Public Health 22,946.5 60,751.7 82,854.1 65,883.5 56,496.6 1,10,823.3 1,15,823.3 1,94,065.0
3. Family Welfare - - - - - - - -
4. Water Supply and Sanitation 2,13,082.2 2,05,751.0 2,60,802.0 1,57,853.0 1,76,358.0 2,12,584.0 2,12,584.0 3,08,434.0
5. Housing 1,779.7 5,278.0 5,278.0 5,689.7 16,896.3 37,423.5 37,423.5 80,253.5
6. Urban Development 39,651.3 97,123.3 97,723.3 53,885.4 - - - -
7. Welfare of Scheduled Castes, Scheduled
Tribes and Other Backward Classes 707.1 17,782.9 17,782.9 14,174.6 3,009.5 3,550.0 3,550.0 7,850.0
8. Social Security and Welfare - 650.0 650.0 22.0 10,374.5 22,658.2 12,427.9 9,587.7
9. Others * 331.8 6,743.6 6,743.6 2,403.9 10,828.9 15,000.0 15,000.0 14,580.0
(b) Economic Services (1 to 10) 4,49,633.3 8,15,027.2 12,34,218.1 10,77,643.6 21,88,399.8 23,94,219.7 24,72,643.0 24,31,385.8
1. Agriculture and Allied Activities (i to xi) 26,216.8 88,952.2 90,609.0 47,322.2 19,813.9 24,170.8 25,325.9 31,676.9
i) Crop Husbandry 7,098.5 47,051.4 47,051.4 19,639.0 5,564.6 4,800.0 4,800.0 3,500.0
ii) Soil and Water Conservation 8,107.4 13,392.0 13,711.0 8,722.0 - - - -
iii) Animal Husbandry 5,022.7 8,515.0 9,457.0 4,110.3 - - 1,000.0 0.2
iv) Dairy Development 137.7 289.2 289.2 110.0 - - - -
v) Fisheries 1,110.7 8,518.2 8,518.2 3,466.0 - - - -
vi) Forestry and Wild Life 2,508.0 4,992.1 5,387.9 6,223.6 937.5 5,504.8 5,659.9 8,300.0
vii) Plantations - - - - - - - -
viii) Food Storage and Warehousing 12.1 1,065.4 1,065.4 1,067.4 -138.0 13,466.0 13,466.0 13,466.0
ix) Agricultural Research and Education - - - 1.0 - - - -
x) Co-operation 2,219.8 5,129.0 5,129.0 3,983.0 13,449.7 400.0 400.0 6,410.7
xi) Others @ - - - - - - - -
2. Rural Development - - - - 6,38,765.6 9,79,898.0 9,96,230.0 10,47,630.0
3. Special Area Programmes 44,676.5 1,32,708.7 1,40,577.2 2,85,823.6 - - - -
of which: Hill Areas - - - - - - - -
4. Major and Medium Irrigation and Flood Control 66,298.7 1,91,004.5 2,56,105.0 1,17,149.5 2,66,549.2 2,61,031.7 3,01,031.7 2,78,218.0
5. Energy 80,399.2 38,942.0 71,035.0 40,826.0 6,93,110.5 5,42,483.0 5,42,483.0 4,47,733.0
6. Industry and Minerals (i to iv) 8,945.1 21,499.4 23,137.7 13,661.6 11,048.3 7,410.0 12,394.3 12,114.0
i) Village and Small Industries 1,031.1 3,709.5 3,709.5 2,237.0 1,043.9 1,310.0 1,310.0 613.0
ii) Iron and Steel Industries - - - - - - - -
iii) Non-Ferrous Mining and Metallurgical Industries 10.6 113.5 113.5 158.0 2,000.0 - 1,384.3 -
iv) Others # 7,903.4 17,676.4 19,314.7 11,266.6 8,004.4 6,100.0 9,700.0 11,501.0
7. Transport (i + ii) 2,20,394.3 3,38,667.5 6,48,351.1 5,55,048.1 5,40,244.6 5,53,594.1 5,72,394.2 5,68,683.0
i) Roads and Bridges 2,10,172.0 3,13,635.0 6,20,792.5 5,27,193.2 5,37,265.3 5,47,321.0 5,69,521.0 5,53,642.0
ii) Others ** 10,222.3 25,032.5 27,558.6 27,854.9 2,979.3 6,273.1 2,873.2 15,041.0
8. Communications - - - - - - - -
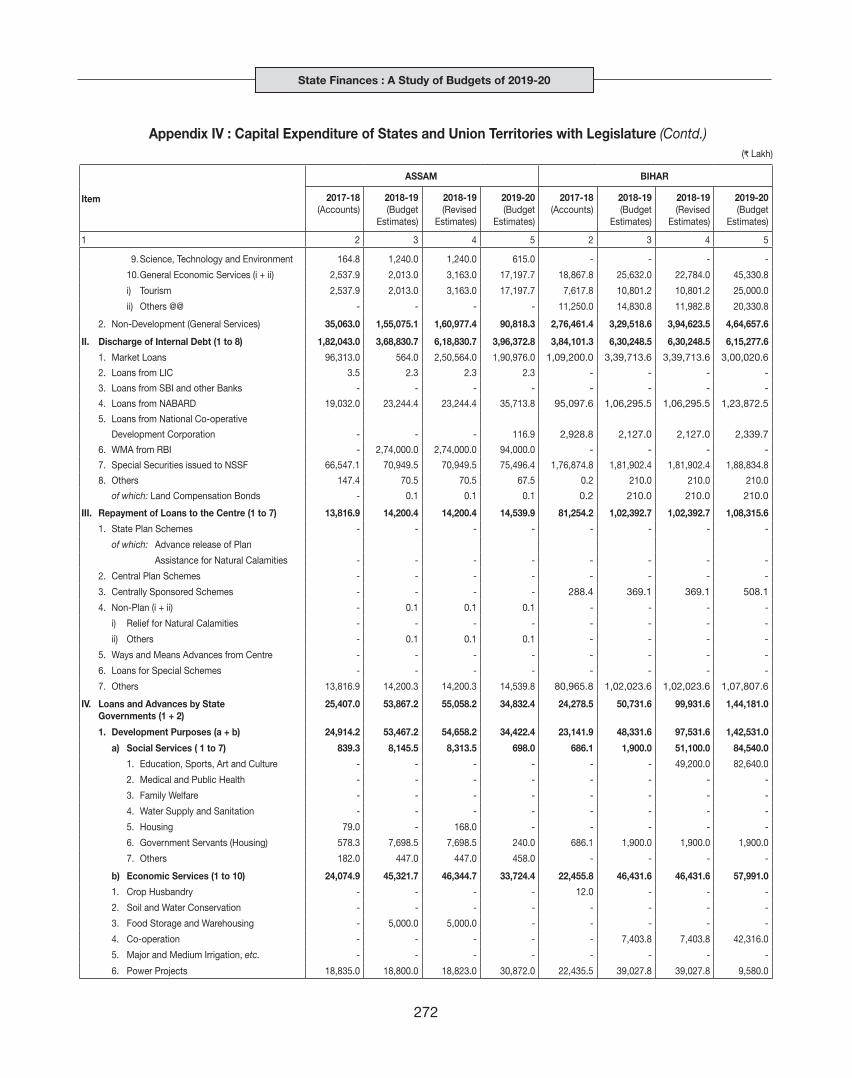
State Finances : A Study of Budgets of 2019-20
272
Item
ASSAM BIHAR
2017-18(Accounts)
2018-19(Budget
Estimates)
2018-19(Revised
Estimates)
2019-20(Budget
Estimates)
2017-18(Accounts)
2018-19(Budget
Estimates)
2018-19(Revised
Estimates)
2019-20(Budget
Estimates)
1 2 3 4 5 2 3 4 5
9. Science, Technology and Environment 164.8 1,240.0 1,240.0 615.0 - - - -
10. General Economic Services (i + ii) 2,537.9 2,013.0 3,163.0 17,197.7 18,867.8 25,632.0 22,784.0 45,330.8
i) Tourism 2,537.9 2,013.0 3,163.0 17,197.7 7,617.8 10,801.2 10,801.2 25,000.0
ii) Others @@ - - - - 11,250.0 14,830.8 11,982.8 20,330.8
2. Non-Development (General Services) 35,063.0 1,55,075.1 1,60,977.4 90,818.3 2,76,461.4 3,29,518.6 3,94,623.5 4,64,657.6
II. Discharge of Internal Debt (1 to 8) 1,82,043.0 3,68,830.7 6,18,830.7 3,96,372.8 3,84,101.3 6,30,248.5 6,30,248.5 6,15,277.6
1. Market Loans 96,313.0 564.0 2,50,564.0 1,90,976.0 1,09,200.0 3,39,713.6 3,39,713.6 3,00,020.6
2. Loans from LIC 3.5 2.3 2.3 2.3 - - - -
3. Loans from SBI and other Banks - - - - - - - -
4. Loans from NABARD 19,032.0 23,244.4 23,244.4 35,713.8 95,097.6 1,06,295.5 1,06,295.5 1,23,872.5
5. Loans from National Co-operative
Development Corporation - - - 116.9 2,928.8 2,127.0 2,127.0 2,339.7
6. WMA from RBI - 2,74,000.0 2,74,000.0 94,000.0 - - - -
7. Special Securities issued to NSSF 66,547.1 70,949.5 70,949.5 75,496.4 1,76,874.8 1,81,902.4 1,81,902.4 1,88,834.8
8. Others 147.4 70.5 70.5 67.5 0.2 210.0 210.0 210.0
of which: Land Compensation Bonds - 0.1 0.1 0.1 0.2 210.0 210.0 210.0
III. Repayment of Loans to the Centre (1 to 7) 13,816.9 14,200.4 14,200.4 14,539.9 81,254.2 1,02,392.7 1,02,392.7 1,08,315.6
1. State Plan Schemes - - - - - - - -
of which: Advance release of Plan
Assistance for Natural Calamities - - - - - - - -
2. Central Plan Schemes - - - - - - - -
3. Centrally Sponsored Schemes - - - - 288.4 369.1 369.1 508.1
4. Non-Plan (i + ii) - 0.1 0.1 0.1 - - - -
i) Relief for Natural Calamities - - - - - - - -
ii) Others - 0.1 0.1 0.1 - - - -
5. Ways and Means Advances from Centre - - - - - - - -
6. Loans for Special Schemes - - - - - - - -
7. Others 13,816.9 14,200.3 14,200.3 14,539.8 80,965.8 1,02,023.6 1,02,023.6 1,07,807.6
IV. Loans and Advances by State Governments (1 + 2)
25,407.0 53,867.2 55,058.2 34,832.4 24,278.5 50,731.6 99,931.6 1,44,181.0
1. Development Purposes (a + b) 24,914.2 53,467.2 54,658.2 34,422.4 23,141.9 48,331.6 97,531.6 1,42,531.0
a) Social Services ( 1 to 7) 839.3 8,145.5 8,313.5 698.0 686.1 1,900.0 51,100.0 84,540.0
1. Education, Sports, Art and Culture - - - - - - 49,200.0 82,640.0
2. Medical and Public Health - - - - - - - -
3. Family Welfare - - - - - - - -
4. Water Supply and Sanitation - - - - - - - -
5. Housing 79.0 - 168.0 - - - - -
6. Government Servants (Housing) 578.3 7,698.5 7,698.5 240.0 686.1 1,900.0 1,900.0 1,900.0
7. Others 182.0 447.0 447.0 458.0 - - - -
b) Economic Services (1 to 10) 24,074.9 45,321.7 46,344.7 33,724.4 22,455.8 46,431.6 46,431.6 57,991.0
1. Crop Husbandry - - - - 12.0 - - -
2. Soil and Water Conservation - - - - - - - -
3. Food Storage and Warehousing - 5,000.0 5,000.0 - - - - -
4. Co-operation - - - - - 7,403.8 7,403.8 42,316.0
5. Major and Medium Irrigation, etc. - - - - - - - -
6. Power Projects 18,835.0 18,800.0 18,823.0 30,872.0 22,435.5 39,027.8 39,027.8 9,580.0
Appendix IV : Capital Expenditure of States and Union Territories with Legislature (Contd.)(₹ Lakh)

Appendix IV
273
Item
ASSAM BIHAR
2017-18(Accounts)
2018-19(Budget
Estimates)
2018-19(Revised
Estimates)
2019-20(Budget
Estimates)
2017-18(Accounts)
2018-19(Budget
Estimates)
2018-19(Revised
Estimates)
2019-20(Budget
Estimates)
1 2 3 4 5 2 3 4 5
7. Village and Small Industries 430.0 473.0 473.0 500.0 - - - 6,095.0
8. Other Industries and Minerals - - - - - - - -
9. Rural Development - - - - - - - -
10. Others 4,809.9 21,048.7 22,048.7 2,352.4 8.3 - - -
2. Non-Development Purposes (a + b) 492.8 400.0 400.0 410.0 1,136.6 2,400.0 2,400.0 1,650.0
a) Government Servants (other than Housing) 492.8 400.0 400.0 410.0 1,136.6 2,400.0 2,400.0 1,650.0
b) Miscellaneous - - - - - - - -
V. Inter-State Settlement - - - - - - - -
VI. Contingency Fund 10,000.0 10,000.0 10,000.0 10,000.0 - - - -
VII. State Provident Funds, etc. (1 + 2) 1,00,146.9 1,28,920.0 1,28,920.0 1,26,615.0 1,92,433.8 1,46,400.0 1,46,400.0 1,74,500.0
1. State Provident Funds 88,449.7 1,14,414.3 1,14,414.3 1,12,368.6 1,69,596.2 1,44,850.0 1,44,850.0 1,70,000.0
2. Others 11,697.2 14,505.7 14,505.7 14,246.3 22,837.6 1,550.0 1,550.0 4,500.0
VIII. Reserve Funds (1 to 4) 3,25,714.0 53,081.5 1,06,252.1 1,17,442.8 2,11,131.3 1,31,865.2 1,31,865.2 1,44,500.0
1. Depreciation/Renewal Reserve Funds - - - - - - - -
2. Sinking Funds 44,865.2 52,382.3 52,382.3 60,986.2 69,360.8 77,515.2 77,515.2 87,500.0
3. Famine Relief Fund - - - - - - - -
4. Others 2,80,848.7 699.2 53,869.8 56,456.7 1,41,770.6 54,350.0 54,350.0 57,000.0
IX. Deposits and Advances (1 to 4) 12,08,166.7 9,94,685.5 13,63,302.4 14,36,207.6 32,86,560.4 25,20,650.0 25,20,650.0 31,15,600.0
1. Civil Deposits 6,19,849.4 4,84,622.7 6,60,000.0 6,93,000.0 3,13,480.0 4,15,000.0 4,15,000.0 4,50,000.0
2. Deposits of Local Funds - - - - 18,55,490.2 20,76,950.0 20,76,950.0 25,50,000.0
3. Civil Advances 4,74,499.4 4,24,953.2 6,08,502.4 6,38,927.6 19,762.7 28,700.0 28,700.0 20,600.0
4. Others 1,13,818.0 85,109.6 94,800.0 1,04,280.0 10,97,827.5 - - 95,000.0
X. Suspense and Miscellaneous (1 to 4) 1,50,50,669.2 2,73,72,049.7 1,61,28,117.8 1,71,75,633.9 3,92,62,633.3 1,60,000.0 1,60,000.0 2,08,274.5
1. Suspense -40,797.3 12,297.6 12,297.6 12,297.6 22,593.0 1,60,000.0 1,60,000.0 2,08,274.5
2. Cash Balance Investment Accounts 1,50,88,954.0 2,73,57,247.3 1,61,15,002.9 1,71,62,478.1 3,91,78,366.1 - - -
3. Deposits with RBI - - - - - - - -
4. Others 2,512.5 2,504.8 817.3 858.2 61,674.1 - - -
XI. Appropriation to Contingency Fund 5,000.0 - - - - - - -
XII. Remittances 5,44,391.3 4,83,098.4 5,73,747.4 6,29,642.5 9,86,533.6 - - -
A. Surplus (+)/Deficit (-) on Revenue Account -1,35,000.6 2,78,913.1 7,84,949.8 3,40,573.3 14,82,300.9 21,31,173.4 9,35,512.1 21,51,698.4
B. Surplus (+)/Deficit(-) on Capital Account -2,54,278.5 12,95,264.3 -10,01,989.1 -3,80,752.2 -10,49,708.8 -17,94,767.0 -19,91,950.0 -21,51,698.4
C. Overall Surplus (+)/Deficit (-) (A+B) -3,89,279.2 15,74,177.4 -2,17,039.2 -40,178.9 4,32,592.1 3,36,406.4 -10,56,437.8 -
D. Financing of Surplus (+)/Deficit (-) (C = i to iii) -3,89,279.2 15,74,177.4 -2,17,039.2 -40,178.9 4,32,592.0 3,36,406.4 -10,56,438.0 -
i. Increase (+)/Decrease (-) in Cash Balances 35,189.8 1,00,000.0 -1,98,082.2 60,680.1 -6,800.0 3,36,406.4 -10,56,438.0 -
a) Opening Balance -22,091.6 -3,14,903.8 18,098.2 -1,79,983.9 11,490.0 5,000.0 5,000.0 5,000.0
b) Closing Balance 13,098.2 -2,14,903.7 -1,79,984.0 -1,19,303.8 4,690.0 3,41,406.4 -10,51,438.0 5,000.0
ii. Withdrawals from (-)/Additions to (+) Cash Balance Investment Account (net) -4,24,469.0 14,74,177.4 -18,957.1 -1,00,859.1 4,39,392.0 - - -
iii. Increase (-)/Decrease (+) in Ways and Means Advances and Overdrafts from RBI (net) - - - - - - - -
Appendix IV : Capital Expenditure of States and Union Territories with Legislature (Contd.)(₹ Lakh)

State Finances : A Study of Budgets of 2019-20
274
Appendix IV : Capital Expenditure of States and Union Territories with Legislature (Contd.)(₹ Lakh)
Item
CHHATTISGARH GOA
2017-18(Accounts)
2018-19(Budget
Estimates)
2018-19(Revised
Estimates)
2019-20(Budget
Estimates)
2017-18(Accounts)
2018-19(Budget
Estimates)
2018-19(Revised
Estimates)
2019-20(Budget
Estimates)
1 2 3 4 5 2 3 4 5
TOTAL CAPITAL DISBURSEMENTS (I to XII) 1,98,89,911.2 1,51,79,576.9 1,56,83,453.1 1,65,25,984.6 22,60,794.8 22,27,227.5 22,27,227.5 26,50,185.0
TOTAL CAPITAL DISBURSEMENTS (Excluding Public Accounts)$ 11,36,959.5 15,89,540.2 13,77,748.6 14,29,697.0 2,91,809.3 5,19,520.2 5,19,520.2 5,96,358.7
I. Total Capital Outlay (1 + 2) 10,00,095.7 14,45,393.4 12,28,801.8 12,10,961.4 2,09,407.5 4,18,855.6 4,18,855.6 4,86,561.4
1. Development (a + b) 9,69,762.8 13,91,990.2 11,89,821.1 11,65,245.6 1,68,536.2 3,44,428.7 3,44,428.7 3,93,059.3
(a) Social Services (1 to 9) 2,65,177.5 3,91,106.3 3,38,916.1 3,31,310.6 65,429.5 1,65,823.9 1,65,823.9 1,86,316.6
1. Education, Sports, Art and Culture 66,769.1 96,721.5 89,638.9 79,423.4 11,816.0 38,378.4 38,378.4 48,780.7
2. Medical and Public Health 40,119.0 58,264.0 52,232.2 57,939.0 8,037.0 16,603.0 16,603.0 26,136.0
3. Family Welfare - - - - - - - -
4. Water Supply and Sanitation 33,516.4 52,668.4 49,763.4 52,714.8 31,157.0 79,522.1 79,522.1 70,025.1
5. Housing 2,380.5 7,559.2 4,206.4 17,120.4 - 34.0 34.0 32.1
6. Urban Development 73,579.6 1,18,024.1 80,885.1 66,449.1 13,529.4 20,365.0 20,365.0 28,905.0
7. Welfare of Scheduled Castes, Scheduled
Tribes and Other Backward Classes 38,791.3 47,483.0 52,021.0 50,490.2 697.2 9,533.7 9,533.7 10,480.0
8. Social Security and Welfare 6,067.1 5,286.0 5,260.0 4,495.2 192.9 1,107.7 1,107.7 1,747.7
9. Others * 3,954.4 5,100.0 4,909.1 2,678.6 - 280.0 280.0 210.0
(b) Economic Services (1 to 10) 7,04,585.3 10,00,884.0 8,50,905.0 8,33,935.0 1,03,106.7 1,78,604.8 1,78,604.8 2,06,742.8
1. Agriculture and Allied Activities (i to xi) 8,426.1 17,152.5 18,455.3 15,775.5 6,493.4 11,694.2 11,694.2 -1,330.2
i) Crop Husbandry 325.1 1,008.0 1,008.0 1,296.1 1,619.9 2,895.2 2,895.2 2,403.5
ii) Soil and Water Conservation 1,991.4 2,380.0 2,380.0 2,500.0 160.8 500.0 500.0 500.0
iii) Animal Husbandry 1,272.2 3,575.7 3,678.5 3,312.3 108.7 540.0 540.0 740.0
iv) Dairy Development - - - - - - - -
v) Fisheries 978.4 755.0 755.0 200.0 945.0 1,433.0 1,433.0 2,373.5
vi) Forestry and Wild Life 2,008.9 4,257.7 5,457.7 3,896.8 300.0 510.0 510.0 1,283.0
vii) Plantations - - - - - -
viii) Food Storage and Warehousing -4.3 122.0 122.0 102.3 1,391.0 1,730.9 1,730.9 -11,703.8
ix) Agricultural Research and Education 1,658.0 3,916.0 3,916.0 3,800.0 - 1,020.0 1,020.0 1,009.0
x) Co-operation 196.5 1,138.0 1,138.0 668.0 1,968.0 3,065.0 3,065.0 2,064.6
xi) Others @ - - - - - - - -
2. Rural Development 65,552.5 63,931.6 56,931.6 60,676.6 - 1,265.0 1,265.0 1,265.0
3. Special Area Programmes - - - - 256.5 457.1 457.1 538.0
of which: Hill Areas - - - - 256.5 457.1 457.1 538.0
4. Major and Medium Irrigation and Flood Control 1,67,870.6 2,68,990.3 2,11,226.4 2,28,032.8 15,196.2 22,465.7 22,465.7 41,355.8
5. Energy 82,481.1 65,179.0 62,589.0 61,166.0 16,903.0 48,016.5 48,016.5 61,983.3
6. Industry and Minerals (i to iv) 6,476.9 7,185.5 6,685.5 6,760.1 1,578.0 6,520.0 6,520.0 4,235.0
i) Village and Small Industries 6,421.6 7,054.5 6,554.5 6,681.1 1,578.0 6,505.0 6,505.0 4,220.0
ii) Iron and Steel Industries - - - - - - - -
iii) Non-Ferrous Mining and Metallurgical Industries 55.3 131.0 131.0 79.0 - 15.0 15.0 15.0
iv) Others # - - - - - -
7. Transport (i + ii) 3,73,200.1 5,20,875.1 4,10,047.1 4,57,270.9 49,871.7 68,890.4 68,890.4 78,799.9
i) Roads and Bridges 3,70,303.0 5,14,644.1 4,03,774.1 4,53,790.9 43,020.0 60,682.4 60,682.4 66,271.9
ii) Others ** 2,897.1 6,231.0 6,273.0 3,480.0 6,851.7 8,208.0 8,208.0 12,528.0
8. Communications 178.0 54,000.0 81,400.0 783.0 - - - -

Appendix IV
275
Item
CHHATTISGARH GOA
2017-18(Accounts)
2018-19(Budget
Estimates)
2018-19(Revised
Estimates)
2019-20(Budget
Estimates)
2017-18(Accounts)
2018-19(Budget
Estimates)
2018-19(Revised
Estimates)
2019-20(Budget
Estimates)
1 2 3 4 5 2 3 4 5
9. Science, Technology and Environment - 400.0 400.0 200.0 3,500.0 6,550.0 6,550.0 7,350.0
10. General Economic Services (i + ii) 400.0 3,170.0 3,170.0 3,270.0 9,308.0 12,746.0 12,746.0 12,546.0
i) Tourism 400.0 3,170.0 3,170.0 3,270.0 9,308.0 12,746.0 12,746.0 12,546.0
ii) Others @@ - - - - - -
2. Non-Development (General Services) 30,333.0 53,403.2 38,980.7 45,715.8 40,871.3 74,426.9 74,426.9 93,502.1
II. Discharge of Internal Debt (1 to 8) 82,773.6 1,90,197.7 1,90,197.7 2,74,511.3 1,85,718.0 92,504.5 92,504.5 1,08,359.1
1. Market Loans - - - 70,000.0 40,000.0 50,000.0 50,000.0 60,000.0
2. Loans from LIC - 500.0 500.0 5.0 164.5 164.5 164.5 119.1
3. Loans from SBI and other Banks - - - - - -
4. Loans from NABARD 39,605.4 51,693.2 51,693.2 66,001.8 10,363.4 11,200.0 11,200.0 12,100.0
5. Loans from National Co-operative
Development Corporation 16.8 16.9 16.9 16.9 14.9 20.0 20.0 20.0
6. WMA from RBI - 92,451.0 92,451.0 92,451.0 1,15,507.0 10,000.0 10,000.0 15,000.0
7. Special Securities issued to NSSF 43,113.0 45,500.0 45,500.0 46,000.0 19,021.4 20,473.0 20,473.0 20,473.0
8. Others 38.3 36.6 36.6 36.7 646.8 647.0 647.0 647.0
of which: Land Compensation Bonds - - - - - -
III. Repayment of Loans to the Centre (1 to 7) 17,214.6 16,139.1 16,139.1 16,139.1 8,798.2 9,660.9 9,660.9 9,660.9
1. State Plan Schemes 17,161.3 16,085.8 16,085.8 16,085.8 8,781.2 9,540.0 9,540.0 9,540.0
of which: Advance release of Plan
Assistance for Natural Calamities - - - - - -
2. Central Plan Schemes - - - 0.5 0.5 0.5
3. Centrally Sponsored Schemes - - - 10.0 10.0 10.0
4. Non-Plan (i + ii) 53.3 53.3 53.3 53.3 17.0 110.4 110.4 110.4
i) Relief for Natural Calamities - - -
ii) Others 53.3 53.3 53.3 53.3 17.0 110.4 110.4 110.4
5. Ways and Means Advances from Centre - - - - - -
6. Loans for Special Schemes - - - - - -
7. Others - - - - - -
IV. Loans and Advances by State Governments (1 + 2)
36,875.6 30,261.0 35,061.0 20,536.1 3,392.6 8,499.2 8,499.2 6,777.2
1. Development Purposes (a + b) 36,875.6 30,246.0 35,046.0 20,536.1 3,235.7 8,274.2 8,274.2 6,627.2
a) Social Services ( 1 to 7) 29,320.0 21,350.0 16,350.0 14,140.1 3,230.0 8,102.0 8,102.0 6,102.0
1. Education, Sports, Art and Culture - - - - - -
2. Medical and Public Health - - - - - -
3. Family Welfare - - - - - -
4. Water Supply and Sanitation 9,220.0 7,600.0 5,600.0 7,840.0 - - - -
5. Housing - - 3,200.0 8,000.0 8,000.0 6,000.0
6. Government Servants (Housing) - - 30.0 100.0 100.0 100.0
7. Others 20,100.0 13,750.0 10,750.0 6,300.1 - 2.0 2.0 2.0
b) Economic Services (1 to 10) 7,555.7 8,896.0 18,696.0 6,396.0 5.7 172.2 172.2 525.2
1. Crop Husbandry - 20.0 20.0 20.0 - 0.2 0.2 0.1
2. Soil and Water Conservation - - - - - -
3. Food Storage and Warehousing 531.2 1,300.0 1,300.0 1,300.0 - - - -
4. Co-operation 7,024.5 7,575.0 17,375.0 5,075.0 5.7 142.0 142.0 135.0
5. Major and Medium Irrigation, etc. - - - - - -
6. Power Projects - - - - - -
Appendix IV : Capital Expenditure of States and Union Territories with Legislature (Contd.)(₹ Lakh)

State Finances : A Study of Budgets of 2019-20
276
Item
CHHATTISGARH GOA
2017-18(Accounts)
2018-19(Budget
Estimates)
2018-19(Revised
Estimates)
2019-20(Budget
Estimates)
2017-18(Accounts)
2018-19(Budget
Estimates)
2018-19(Revised
Estimates)
2019-20(Budget
Estimates)
1 2 3 4 5 2 3 4 5
7. Village and Small Industries - 1.0 1.0 1.0 - 0.1 0.1 360.1
8. Other Industries and Minerals - - - - - - - -
9. Rural Development - - - - - - - -
10. Others - - - - - 30.0 30.0 30.0
2. Non-Development Purposes (a + b) - 15.0 15.0 - 157.0 225.0 225.0 150.0
a) Government Servants (other than Housing) - 15.0 15.0 - 157.0 225.0 225.0 150.0
b) Miscellaneous - - - - - - - -
V. Inter-State Settlement 107.6 10.0 10.0 10.0 - - - -
VI. Contingency Fund 3,886.1 10,000.0 3,818.0 10,000.0 - - - -
VII. State Provident Funds, etc. (1 + 2) 79,525.7 95,169.0 80,760.0 80,661.0 31,886.5 32,297.4 32,297.4 35,075.2
1. State Provident Funds 69,810.7 85,169.0 70,760.0 70,661.0 31,616.4 32,039.1 32,039.1 34,778.0
2. Others 9,715.0 10,000.0 10,000.0 10,000.0 270.1 258.3 258.3 297.1
VIII. Reserve Funds (1 to 4) 1,98,972.4 1,28,296.2 1,46,172.5 1,95,483.6 14,264.4 20,011.1 20,011.1 15,690.9
1. Depreciation/Renewal Reserve Funds - 1.0 1.0 1.0 - - - -
2. Sinking Funds 20,000.0 22,000.0 22,000.0 26,500.0 5,554.0 7,188.7 7,188.7 6,109.4
3. Famine Relief Fund - 57.0 12.0 13.0 - - - -
4. Others 1,78,972.4 1,06,238.2 1,24,159.5 1,68,969.6 8,710.4 12,822.4 12,822.4 9,581.5
IX. Deposits and Advances (1 to 4) 3,91,822.5 4,67,360.3 5,25,598.7 5,24,186.8 48,660.1 60,519.0 60,519.0 53,526.1
1. Civil Deposits 2,81,130.2 2,84,328.3 2,71,003.8 2,52,653.8 18,898.7 23,704.8 23,704.8 20,788.6
2. Deposits of Local Funds 22.2 7.0 8.0 8.0 - - - -
3. Civil Advances 50,056.7 50,000.0 50,000.0 50,000.0 492.1 1,189.6 1,189.6 541.3
4. Others 60,613.4 1,33,025.0 2,04,586.9 2,21,525.0 29,269.2 35,624.6 35,624.6 32,196.1
X. Suspense and Miscellaneous (1 to 4) 1,70,85,368.8 1,20,64,148.2 1,27,74,792.2 1,35,61,393.2 13,30,918.7 10,94,246.2 10,94,246.2 14,64,010.6
1. Suspense 2,848.6 1,296.2 1,291.2 892.2 48,755.8 14,177.6 14,177.6 53,631.3
2. Cash Balance Investment Accounts 1,01,58,724.4 58,51,850.0 60,18,000.0 65,00,000.0 5,43,607.7 3,57,075.2 3,57,075.2 5,97,968.4
3. Deposits with RBI 13,85,699.5 11,50,000.0 12,00,000.0 12,50,000.0 - - - -
4. Others 55,38,096.3 50,61,002.0 55,55,501.0 58,10,501.0 7,38,555.3 7,22,993.5 7,22,993.5 8,12,410.8
XI. Appropriation to Contingency Fund - - - - - - - -
XII. Remittances 9,93,268.6 7,32,602.0 6,82,102.0 6,32,102.0 4,27,748.9 4,90,633.6 4,90,633.6 4,70,523.8
A. Surplus (+)/Deficit (-) on Revenue Account 3,41,732.5 4,44,507.2 -6,34,155.5 1,15,147.0 51,062.9 14,464.8 14,464.8 45,510.7
B. Surplus (+)/Deficit(-) on Capital Account -1,56,129.5 -4,50,998.3 1,46,442.4 -67,803.0 -58,174.4 -3,41,283.6 -3,41,283.6 -3,71,637.8
C. Overall Surplus (+)/Deficit (-) (A+B) 1,85,603.0 -6,491.1 -4,87,713.1 47,344.0 -7,111.5 -3,26,818.8 -3,26,818.8 -3,26,127.1
D. Financing of Surplus (+)/Deficit (-) (C = i to iii) 1,85,603.0 -6,491.0 -4,87,713.1 47,344.0 -7,111.5 -3,26,818.8 -3,26,818.8 -3,26,127.1
i. Increase (+)/Decrease (-) in Cash Balances 29,718.0 -8,341.0 -5,98,162.1 63,264.0 11,997.8 -3,35,018.9 -3,35,018.9 -3,05,106.9
a) Opening Balance 33,917.2 24,336.0 63,635.1 -5,34,527.0 -12,649.0 -2,43,937.1 -651.2 -3,35,670.1
b) Closing Balance 63,635.1 15,995.0 -5,34,527.0 -4,71,263.0 -651.2 -5,78,955.9 -3,35,670.1 -6,40,777.0
ii. Withdrawals from (-)/Additions to (+) Cash Balance Investment Account (net) 1,55,885.1 1,850.0 18,000.0 - -19,109.3 8,200.0 8,200.0 -21,020.2
iii. Increase (-)/Decrease (+) in Ways and Means Advances and Overdrafts from RBI (net) - - 92,449.0 -15,920.0 - - - -
Appendix IV : Capital Expenditure of States and Union Territories with Legislature (Contd.)(₹ Lakh)

Appendix IV
277
Appendix IV : Capital Expenditure of States and Union Territories with Legislature (Contd.)(₹ Lakh)
Item
GUJARAT HARyANA
2017-18(Accounts)
2018-19(Budget
Estimates)
2018-19(Revised
Estimates)
2019-20(Budget
Estimates)
2017-18(Accounts)
2018-19(Budget
Estimates)
2018-19(Revised
Estimates)
2019-20(Budget
Estimates)
1 2 3 4 5 2 3 4 5
TOTAL CAPITAL DISBURSEMENTS (I to XII) 5,33,20,844.3 2,10,19,494.0 1,67,96,898.6 1,82,57,820.3 1,31,77,561.4 2,62,58,104.2 1,62,15,925.5 1,79,63,096.4
TOTAL CAPITAL DISBURSEMENTS (Excluding Public Accounts)$ 40,64,154.1 47,30,788.4 48,95,254.0 50,99,990.8 17,49,216.6 22,59,675.7 23,22,559.4 24,00,908.4
I. Total Capital Outlay (1 + 2) 26,31,320.0 30,34,164.0 31,41,724.0 32,80,657.0 13,53,790.7 15,77,958.7 15,96,364.9 16,25,966.7
1. Development (a + b) 25,44,269.0 29,12,160.0 30,35,100.0 31,66,236.0 13,05,700.9 14,94,578.7 14,76,652.2 14,78,785.2
(a) Social Services (1 to 9) 6,81,277.0 8,85,897.0 8,11,289.0 8,79,478.0 3,17,270.2 4,86,928.6 4,80,515.6 4,45,211.8
1. Education, Sports, Art and Culture 79,358.0 1,71,543.0 1,12,540.0 1,47,267.0 40,365.0 47,000.0 51,543.7 48,500.0
2. Medical and Public Health 1,52,654.0 1,93,879.0 2,05,198.0 1,23,488.0 30,221.8 71,800.0 73,986.8 62,336.0
3. Family Welfare 4,362.0 900.0 700.0 507.0 - - - -
4. Water Supply and Sanitation 3,15,934.0 3,10,677.0 3,32,194.0 4,06,844.0 1,16,920.3 1,75,949.0 1,75,556.0 1,47,058.3
5. Housing 60,860.0 85,186.0 72,327.0 83,112.0 5,322.0 20,120.0 14,100.0 16,820.0
6. Urban Development 30,768.0 28,450.0 20,257.0 32,701.0 1,00,000.0 1,30,000.0 1,30,000.0 1,30,000.0
7. Welfare of Scheduled Castes, Scheduled
Tribes and Other Backward Classes 13,572.0 38,266.0 21,172.0 42,671.0 350.0 1,527.3 1,327.2 760.2
8. Social Security and Welfare 829.0 1,758.0 1,202.0 2,440.0 6,540.4 19,768.2 12,801.1 18,612.0
9. Others * 22,940.0 55,238.0 45,699.0 40,448.0 17,550.8 20,764.2 21,200.8 21,125.3
(b) Economic Services (1 to 10) 18,62,992.0 20,26,263.0 22,23,811.0 22,86,758.0 9,88,430.8 10,07,650.1 9,96,136.6 10,33,573.4
1. Agriculture and Allied Activities (i to xi) 82,496.0 1,12,784.0 97,585.0 1,05,322.0 1,35,081.5 10,630.7 5,228.8 -20,090.5
i) Crop Husbandry 358.0 11,433.0 403.0 10,851.0 - 1,044.0 400.0 1,000.0
ii) Soil and Water Conservation 9,672.0 9,550.0 9,420.0 9,443.0 - - - -
iii) Animal Husbandry 1,536.0 7,071.0 5,968.0 3,319.0 1,408.7 2,000.0 2,000.0 2,000.0
iv) Dairy Development - - - - - - - -
v) Fisheries - - - - 4.7 - - -
vi) Forestry and Wild Life 63,769.0 67,945.0 68,154.0 68,142.0 - - - -
vii) Plantations - - - - - - - -
viii) Food Storage and Warehousing 2,666.0 10,897.0 10,152.0 9,526.0 1,04,755.6 -9,879.3 -10,198.6 -38,530.5
ix) Agricultural Research and Education - - - - - - - -
x) Co-operation 47.0 2.0 2.0 75.0 28,912.4 17,466.0 13,027.4 15,440.0
xi) Others @ 4,448.0 5,886.0 3,486.0 3,966.0 - - - -
2. Rural Development 1,20,640.0 1,21,700.0 1,30,050.0 1,29,883.0 - 10,000.0 9,813.6 30,000.0
3. Special Area Programmes 2,191.0 2,000.0 500.0 1,000.0 - - - -
of which: Hill Areas - - - - - - - -
4. Major and Medium Irrigation and Flood Control 9,07,981.0 9,94,113.0 12,09,172.0 10,33,048.0 97,355.0 1,60,706.9 1,64,077.7 1,61,993.7
5. Energy 2,93,936.0 2,88,907.0 2,82,587.0 3,78,015.0 5,45,443.8 5,49,001.0 5,50,025.0 5,83,419.0
6. Industry and Minerals (i to iv) 10,963.0 11,567.0 11,817.0 66,956.0 223.8 1,521.0 221.0 1,521.0
i) Village and Small Industries 179.0 840.0 1,090.0 1,333.0 - 1,500.0 200.0 1,500.0
ii) Iron and Steel Industries 10.0 10.0 10.0 10.0 - - - -
iii) Non-Ferrous Mining and Metallurgical Industries 200.0 155.0 155.0 816.0 - - - -
iv) Others # 10,574.0 10,562.0 10,562.0 64,797.0 223.8 21.0 21.0 21.0
7. Transport (i + ii) 3,96,348.0 4,34,235.0 4,32,421.0 5,16,411.0 1,78,231.1 2,27,430.5 1,93,790.5 2,29,512.0
i) Roads and Bridges 3,13,468.0 3,21,959.0 3,49,611.0 3,87,767.0 1,62,182.6 1,87,720.0 1,70,720.0 1,88,801.0
ii) Others ** 82,880.0 1,12,276.0 82,810.0 1,28,644.0 16,048.5 39,710.5 23,070.5 40,711.0
8. Communications - - - - - - - -

State Finances : A Study of Budgets of 2019-20
278
Item
GUJARAT HARyANA
2017-18(Accounts)
2018-19(Budget
Estimates)
2018-19(Revised
Estimates)
2019-20(Budget
Estimates)
2017-18(Accounts)
2018-19(Budget
Estimates)
2018-19(Revised
Estimates)
2019-20(Budget
Estimates)
1 2 3 4 5 2 3 4 5
9. Science, Technology and Environment - 2.0 2.0 - - 2,585.0 480.0 2,350.0
10. General Economic Services (i + ii) 48,437.0 60,955.0 59,677.0 56,123.0 32,095.6 45,775.0 72,500.0 44,868.0
i) Tourism 46,437.0 60,950.0 59,675.0 56,093.0 1,672.0 4,775.0 2,500.0 3,940.0
ii) Others @@ 2,000.0 5.0 2.0 30.0 30,423.6 41,000.0 70,000.0 40,928.0
2. Non-Development (General Services) 87,051.0 1,22,004.0 1,06,624.0 1,14,421.0 48,089.7 83,380.0 1,19,712.6 1,47,181.5
II. Discharge of Internal Debt (1 to 8) 12,99,100.0 14,71,584.3 14,71,584.3 15,87,403.2 6,15,325.2 12,34,131.9 17,39,338.0 20,05,271.7
1. Market Loans 8,21,500.0 9,53,450.0 9,53,450.0 10,30,050.0 80,000.0 3,29,500.0 3,29,500.0 4,00,000.0
2. Loans from LIC - - - - 28.6 14.5 14.5 -
3. Loans from SBI and other Banks 296.2 295.6 295.6 295.6 3,70,000.0 6,50,000.0 10,90,000.0 13,00,000.0
4. Loans from NABARD 1,32,225.2 1,64,362.7 1,64,362.7 1,94,021.3 33,528.5 34,698.2 45,772.4 40,487.5
5. Loans from National Co-operative
Development Corporation - - - - 3,340.9 3,907.4 63,638.6 53,246.7
6. WMA from RBI - 100.0 100.0 100.0 7,948.0 91,500.0 91,500.0 91,500.0
7. Special Securities issued to NSSF 3,45,078.6 3,53,375.1 3,53,375.1 3,62,935.4 95,413.7 95,413.7 97,605.7 1,00,438.7
8. Others - 1.0 1.0 1.0 25,065.5 29,098.0 21,306.8 19,598.8
of which: Land Compensation Bonds - 1.0 1.0 1.0 - - - -
III. Repayment of Loans to the Centre (1 to 7) 70,923.3 71,843.7 72,399.3 71,692.1 18,559.6 12,443.1 20,293.0 20,443.0
1. State Plan Schemes 70,572.2 47,187.0 47,187.0 71,347.1 18,395.5 12,280.9 20,130.9 20,280.9
of which: Advance release of Plan
Assistance for Natural Calamities - - - - - - - -
2. Central Plan Schemes - - - - - - - -
3. Centrally Sponsored Schemes - 5.0 5.0 - - - - -
4. Non-Plan (i + ii) - 24,651.7 25,207.3 - 164.2 162.2 162.2 162.2
i) Relief for Natural Calamities - - - - - - - -
ii) Others - 24,651.7 25,207.3 - 164.2 162.2 162.2 162.2
5. Ways and Means Advances from Centre - - - - - - - -
6. Loans for Special Schemes - - - - - - - -
7. Others 351.1 - - 345.0 - - - -
IV. Loans and Advances by State Governments (1 + 2)
63,107.0 1,53,592.0 2,09,942.0 1,60,634.0 1,39,489.2 1,76,642.1 1,48,063.5 1,40,727.0
1. Development Purposes (a + b) 58,879.9 1,49,197.0 2,05,799.5 1,55,818.5 1,33,851.9 1,69,592.1 1,42,801.5 1,29,927.0
a) Social Services ( 1 to 7) 27,798.9 1,27,942.0 1,27,947.5 1,23,026.5 6,469.5 1,600.0 385.0 1,500.0
1. Education, Sports, Art and Culture - - - - - - - -
2. Medical and Public Health - - - - - - - -
3. Family Welfare - - - - - - - -
4. Water Supply and Sanitation - - - - - - - -
5. Housing - - 61.0 244.0 - - - -
6. Government Servants (Housing) 1,324.9 1,755.0 1,269.5 1,600.5 6,469.5 1,600.0 385.0 1,500.0
7. Others 26,474.0 1,26,187.0 1,26,617.0 1,21,182.0 - - - -
b) Economic Services (1 to 10) 31,081.0 21,255.0 77,852.0 32,792.0 1,27,382.4 1,67,992.1 1,42,416.5 1,28,427.0
1. Crop Husbandry - - - - - - 3,554.0 1.0
2. Soil and Water Conservation - - - - - - - -
3. Food Storage and Warehousing - - - - - 1,000.0 1,000.0 1,800.0
4. Co-operation 571.0 200.0 - 200.0 15,602.6 12,347.0 20,490.5 10,925.0
5. Major and Medium Irrigation, etc. - - - - - - - -
6. Power Projects 10,659.0 8,251.0 8,251.0 20,000.0 88,747.6 1,27,464.0 68,191.0 28,521.0
Appendix IV : Capital Expenditure of States and Union Territories with Legislature (Contd.)(₹ Lakh)

Appendix IV
279
Item
GUJARAT HARyANA
2017-18(Accounts)
2018-19(Budget
Estimates)
2018-19(Revised
Estimates)
2019-20(Budget
Estimates)
2017-18(Accounts)
2018-19(Budget
Estimates)
2018-19(Revised
Estimates)
2019-20(Budget
Estimates)
1 2 3 4 5 2 3 4 5
7. Village and Small Industries - 4.0 1.0 4.0 3,000.0 7,000.0 7,000.0 7,000.0
8. Other Industries and Minerals - - - - - - - -
9. Rural Development - - - - 32.3 180.0 180.0 180.0
10. Others 19,851.0 12,800.0 69,600.0 12,588.0 20,000.0 20,001.1 42,001.0 80,000.0
2. Non-Development Purposes (a + b) 4,227.1 4,395.0 4,142.5 4,815.5 5,637.2 7,050.0 5,262.0 10,800.0
a) Government Servants (other than Housing) 43.1 83.0 70.5 68.5 5,637.2 7,050.0 5,262.0 10,800.0
b) Miscellaneous 4,184.0 4,312.0 4,072.0 4,747.0 - - - -
V. Inter-State Settlement - - - - - - - -
VI. Contingency Fund - - 6,935.0 - 2,677.0 - 1,217.7 -
VII. State Provident Funds, etc. (1 + 2) 2,00,029.0 1,86,333.0 2,08,341.0 2,25,008.0 2,11,618.4 2,19,000.0 2,43,800.0 2,89,200.0
1. State Provident Funds 1,87,059.0 1,66,940.0 1,89,500.0 2,04,660.0 2,08,493.6 2,15,000.0 2,40,000.0 2,85,000.0
2. Others 12,970.0 19,393.0 18,841.0 20,348.0 3,124.8 4,000.0 3,800.0 4,200.0
VIII. Reserve Funds (1 to 4) 3,26,448.0 2,69,177.0 1,94,402.0 3,69,880.0 37,700.9 70,428.5 79,548.4 84,788.0
1. Depreciation/Renewal Reserve Funds 60.0 280.0 280.0 280.0 7,550.0 6,000.0 6,000.0 6,000.0
2. Sinking Funds 69,358.0 1,20,000.0 1,00,000.0 1,20,000.0 13,346.0 13,000.0 14,500.0 15,600.0
3. Famine Relief Fund - - - - - - - -
4. Others 2,57,030.0 1,48,897.0 94,122.0 2,49,600.0 16,804.9 51,428.5 59,048.4 63,188.0
IX. Deposits and Advances (1 to 4) 48,97,282.0 44,47,512.0 50,45,326.0 56,00,604.0 19,92,631.7 27,16,700.0 26,81,000.0 32,26,000.0
1. Civil Deposits 7,37,493.0 6,28,172.0 7,50,879.0 9,69,409.0 2,22,881.3 2,95,000.0 3,30,000.0 3,50,000.0
2. Deposits of Local Funds 40,31,379.0 36,53,994.0 41,04,177.0 44,32,511.0 549.1 700.0 700.0 700.0
3. Civil Advances 30.0 31,008.0 31,008.0 33,489.0 198.9 6,000.0 300.0 300.0
4. Others 1,28,380.0 1,34,338.0 1,59,262.0 1,65,195.0 17,69,002.5 24,15,000.0 23,50,000.0 28,75,000.0
X. Suspense and Miscellaneous (1 to 4) 4,19,65,269.0 1,10,46,162.0 60,70,119.0 65,55,727.0 79,93,454.3 1,93,45,800.0 88,05,600.0 96,15,700.0
1. Suspense 15,30,164.0 259.0 2,922.0 3,155.0 85,220.4 1,20,000.0 95,000.0 1,15,000.0
2. Cash Balance Investment Accounts 2,79,64,173.0 1,00,000.0 7,75,000.0 8,37,000.0 79,07,699.0 1,92,25,000.0 87,10,000.0 95,00,000.0
3. Deposits with RBI 1,24,46,059.0 51,66,789.0 51,66,789.0 55,80,132.0 - - - -
4. Others 24,873.0 57,79,114.0 1,25,408.0 1,35,440.0 535.0 800.0 600.0 700.0
XI. Appropriation to Contingency Fund - - - - - - - -
XII. Remittances 18,67,366.0 3,39,126.0 3,76,126.0 4,06,215.0 8,12,314.5 9,05,000.0 9,00,700.0 9,55,000.0
A. Surplus (+)/Deficit (-) on Revenue Account 5,23,161.5 5,99,785.3 1,37,866.0 2,87,397.0 -10,56,248.2 -8,25,350.9 -8,50,669.3 -12,02,249.2
B. Surplus (+)/Deficit(-) on Capital Account -12,67,123.0 -5,21,483.0 -2,25,448.6 -5,01,885.3 9,17,585.5 9,57,419.8 4,86,851.9 11,42,069.5
C. Overall Surplus (+)/Deficit (-) (A+B) -7,43,961.5 78,302.3 -87,582.6 -2,14,488.4 -1,38,662.7 1,32,068.9 -3,63,817.5 -60,179.7
D. Financing of Surplus (+)/Deficit (-) (C = i to iii) -7,43,962.0 78,302.0 -87,582.0 -2,14,488.0 -1,38,662.7 1,32,068.9 -3,63,817.5 -60,179.7
i. Increase (+)/Decrease (-) in Cash Balances 11,229.0 78,302.0 1,37,418.0 28,512.0 -91,630.7 -22,931.1 16,182.5 14,820.3
a) Opening Balance -46,764.0 58,398.0 -35,535.0 1,01,883.0 42,673.3 13,492.4 -48,957.5 -32,774.9
b) Closing Balance -35,535.0 1,36,700.0 1,01,883.0 1,30,395.0 -48,957.5 -9,438.7 -32,774.9 -17,954.6
ii. Withdrawals from (-)/Additions to (+) Cash Balance Investment Account (net) -7,55,191.0 - -2,25,000.0 -2,43,000.0 -47,032.0 1,55,000.0 -3,80,000.0 -75,000.0
iii. Increase (-)/Decrease (+) in Ways and Means Advances and Overdrafts from RBI (net) - - - - - - - -
Appendix IV : Capital Expenditure of States and Union Territories with Legislature (Contd.)(₹ Lakh)

State Finances : A Study of Budgets of 2019-20
280
Appendix IV : Capital Expenditure of States and Union Territories with Legislature (Contd.)(₹ Lakh)
Item
HIMACHAL PRADESH JAMMU AND KASHMIR
2017-18(Accounts)
2018-19(Budget
Estimates)
2018-19(Revised
Estimates)
2019-20(Budget
Estimates)
2017-18(Accounts)
2018-19(Budget
Estimates)
2018-19(Revised
Estimates)
2019-20(Budget
Estimates)
1 2 3 4 5 2 3 4 5
TOTAL CAPITAL DISBURSEMENTS (I to XII) 62,99,574.1 11,17,464.6 13,51,966.3 11,60,137.9 63,72,967.9 49,30,623.9 52,63,586.4 50,18,116.1
TOTAL CAPITAL DISBURSEMENTS (Excluding Public Accounts)$ 7,35,790.3 7,87,196.6 8,77,239.4 8,29,869.9 13,66,183.7 28,96,248.7 30,25,358.5 28,78,615.1
I. Total Capital Outlay (1 + 2) 3,75,567.2 4,23,962.7 4,89,328.9 4,57,989.3 10,35,288.0 25,66,729.7 26,95,084.5 26,59,407.1
1. Development (a + b) 3,56,388.9 4,07,022.0 4,66,369.5 4,39,866.6 9,54,985.6 23,33,321.6 24,41,150.9 23,92,657.9
(a) Social Services (1 to 9) 1,13,496.0 1,05,717.0 1,24,528.0 1,26,106.8 2,78,701.1 5,68,949.4 5,97,358.0 5,80,643.5
1. Education, Sports, Art and Culture 34,156.1 30,877.2 35,817.1 31,530.7 88,489.8 1,61,724.0 1,62,523.3 1,57,979.5
2. Medical and Public Health 26,286.5 28,135.3 35,567.5 23,147.2 51,057.9 73,380.3 87,363.3 73,525.8
3. Family Welfare - - - - - - - -
4. Water Supply and Sanitation 46,157.8 35,833.8 42,334.8 59,886.6 59,311.6 66,034.4 60,695.1 65,840.2
5. Housing 5,357.7 7,545.0 7,540.0 7,181.0 1,459.9 5,986.0 5,126.0 5,126.0
6. Urban Development 127.2 142.0 142.0 1,207.0 41,793.4 1,42,753.3 1,63,553.9 1,64,321.8
7. Welfare of Scheduled Castes, Scheduled
Tribes and Other Backward Classes 528.4 1,655.0 1,655.0 2,529.0 10,057.3 7,408.4 7,405.9 6,690.0
8. Social Security and Welfare 791.3 1,243.0 1,222.0 478.0 24,520.8 71,888.4 75,815.2 72,939.9
9. Others * 91.0 285.8 249.7 147.3 2,010.5 39,774.6 34,875.3 34,220.3
(b) Economic Services (1 to 10) 2,42,892.9 3,01,305.0 3,41,841.5 3,13,759.8 6,76,284.5 17,64,372.1 18,43,792.9 18,12,014.3
1. Agriculture and Allied Activities (i to xi) 5,983.1 8,726.5 8,852.7 9,877.7 91,701.6 1,77,892.3 1,67,492.1 1,69,452.7
i) Crop Husbandry 1,285.9 952.0 912.6 1,615.0 22,820.2 1,16,515.5 1,05,886.6 1,06,671.2
ii) Soil and Water Conservation 2,669.7 4,097.0 4,189.8 3,531.0 621.9 465.0 421.0 421.0
iii) Animal Husbandry 712.9 1,796.4 1,810.5 2,018.6 2,417.0 10,192.1 10,664.6 11,332.6
iv) Dairy Development - - - - - 30.0 30.0 30.0
v) Fisheries 244.0 317.4 385.4 433.4 1,452.3 1,547.0 1,594.3 1,539.3
vi) Forestry and Wild Life 741.3 1,226.5 1,219.1 1,943.2 5,801.7 14,855.7 14,771.0 15,749.0
vii) Plantations - - - - - - - -
viii) Food Storage and Warehousing 313.9 318.7 318.2 318.5 29,788.5 30,807.0 30,822.0 30,807.0
ix) Agricultural Research and Education - - - - 2,803.6 2,980.0 2,897.8 2,497.8
x) Co-operation 15.4 18.5 17.0 18.0 25,996.3 500.0 405.0 405.0
xi) Others @ - - - - - - - -
2. Rural Development 226.2 2,171.5 2,171.5 1,800.0 1,84,985.3 2,68,617.7 3,07,494.1 3,33,133.7
3. Special Area Programmes - - - - 22,633.7 6,946.0 14,476.5 14,476.5
of which: Hill Areas - - - - - - - -
4. Major and Medium Irrigation and Flood Control 25,146.7 52,535.0 69,232.6 52,748.0 37,351.6 1,44,043.4 1,58,434.9 1,54,335.8
5. Energy 18,710.8 25,000.0 25,000.0 26,000.0 66,022.2 4,71,202.0 5,60,350.4 3,89,080.4
6. Industry and Minerals (i to iv) 7,282.8 7,484.5 7,433.8 5,575.0 21,092.3 23,130.3 20,814.6 25,272.6
i) Village and Small Industries 7,282.8 7,484.5 7,433.8 5,575.0 14,984.8 22,623.3 20,176.6 24,319.6
ii) Iron and Steel Industries - - - - 5,793.6 257.0 207.0 707.0
iii) Non-Ferrous Mining and Metallurgical Industries - - - - 313.9 250.0 431.0 246.0
iv) Others # - - - - - - - -
7. Transport (i + ii) 1,69,446.9 1,84,238.0 2,05,742.6 1,91,330.0 1,57,100.1 86,279.8 1,11,024.3 1,11,949.3
i) Roads and Bridges 1,53,174.9 1,69,886.0 1,91,363.0 1,78,169.0 1,56,572.4 85,704.8 1,08,624.3 1,11,174.3
ii) Others ** 16,272.0 14,352.0 14,379.7 13,161.0 527.7 575.0 2,400.0 775.0
8. Communications - - - - - - - -

Appendix IV
281
Item
HIMACHAL PRADESH JAMMU AND KASHMIR
2017-18(Accounts)
2018-19(Budget
Estimates)
2018-19(Revised
Estimates)
2019-20(Budget
Estimates)
2017-18(Accounts)
2018-19(Budget
Estimates)
2018-19(Revised
Estimates)
2019-20(Budget
Estimates)
1 2 3 4 5 2 3 4 5
9. Science, Technology and Environment - - - - 5,244.6 72,417.5 42,139.4 41,753.8
10. General Economic Services (i + ii) 16,096.5 21,149.4 23,408.4 26,429.0 90,153.2 5,13,843.2 4,61,566.6 5,72,559.6
i) Tourism 264.0 5,348.0 5,386.0 5,414.0 10,599.7 46,938.9 44,096.4 46,518.9
ii) Others @@ 15,832.5 15,801.4 18,022.4 21,015.0 79,553.5 4,66,904.3 4,17,470.2 5,26,040.7
2. Non-Development (General Services) 19,178.3 16,940.7 22,959.3 18,122.7 80,302.4 2,33,408.1 2,53,933.6 2,66,749.3
II. Discharge of Internal Debt (1 to 8) 3,42,095.4 3,10,101.0 4,53,784.0 3,17,479.2 22,37,419.0 17,86,027.0 17,86,027.0 17,23,803.0
1. Market Loans 2,04,901.3 2,10,190.0 2,10,190.0 2,12,000.0 2,22,610.1 1,75,685.0 1,75,685.0 1,10,884.0
2. Loans from LIC 2,342.5 1,637.1 1,637.1 996.4 16,151.2 12,537.0 12,537.0 13,405.0
3. Loans from SBI and other Banks - - - - - - - -
4. Loans from NABARD 34,999.8 40,000.0 39,200.0 43,000.0 39,118.8 36,357.0 36,357.0 36,959.0
5. Loans from National Co-operative
Development Corporation 3,921.6 1,700.0 1,724.0 2,000.0 - - - -
6. WMA from RBI 40,014.0 - 1,44,459.0 - 19,20,593.5 15,25,000.0 15,25,000.0 15,25,000.0
7. Special Securities issued to NSSF 51,471.1 53,825.5 53,825.5 56,909.9 32,056.7 - - -
8. Others 4,445.1 2,748.4 2,748.4 2,572.8 6,888.8 36,448.0 36,448.0 37,555.0
of which: Land Compensation Bonds - - - - 4,143.2 403.0 403.0 50.0
III. Repayment of Loans to the Centre (1 to 7) 7,889.2 8,319.3 8,506.4 8,695.8 11,595.4 11,642.0 11,722.0 11,765.0
1. State Plan Schemes 7,833.5 8,268.5 8,455.4 8,648.9 11,595.4 11,642.0 11,722.0 11,765.0
of which: Advance release of Plan
Assistance for Natural Calamities - - - - - - - -
2. Central Plan Schemes - - - - - - - -
3. Centrally Sponsored Schemes - - - - - - - -
4. Non-Plan (i + ii) 55.6 50.8 51.0 47.0 - - - -
i) Relief for Natural Calamities - - - - - - -
ii) Others 55.6 50.8 51.0 47.0 - - - -
5. Ways and Means Advances from Centre - - - - - - - -
6. Loans for Special Schemes - - - - - - - -
7. Others - - - - - - - -
IV. Loans and Advances by State Governments (1 + 2)
50,252.5 44,813.6 70,079.1 45,705.6 2,474.7 56,850.0 57,525.0 8,640.0
1. Development Purposes (a + b) 50,017.8 43,751.1 69,371.0 44,643.1 2,474.7 56,850.0 57,525.0 8,640.0
a) Social Services ( 1 to 7) 882.2 251.0 536.0 251.0 395.8 650.0 525.0 650.0
1. Education, Sports, Art and Culture 100.0 - 200.0 - - - - -
2. Medical and Public Health - - - - - - - -
3. Family Welfare - - - - - - - -
4. Water Supply and Sanitation - - - - - - - -
5. Housing - - - - - - - -
6. Government Servants (Housing) 82.2 220.0 305.0 220.0 395.8 150.0 225.0 150.0
7. Others 700.0 31.0 31.0 31.0 - 500.0 300.0 500.0
b) Economic Services (1 to 10) 49,135.7 43,500.0 68,835.0 44,392.0 2,078.9 56,200.0 57,000.0 7,990.0
1. Crop Husbandry 1,200.0 - - - - - - -
2. Soil and Water Conservation - - - - - - - -
3. Food Storage and Warehousing - - - - - - - -
4. Co-operation 5,632.5 - 2,835.0 2.0 - - - -
5. Major and Medium Irrigation, etc. - - - - - - - -
6. Power Projects 41,758.7 43,000.0 65,500.0 44,000.0 - - - -
Appendix IV : Capital Expenditure of States and Union Territories with Legislature (Contd.)(₹ Lakh)

State Finances : A Study of Budgets of 2019-20
282
Item
HIMACHAL PRADESH JAMMU AND KASHMIR
2017-18(Accounts)
2018-19(Budget
Estimates)
2018-19(Revised
Estimates)
2019-20(Budget
Estimates)
2017-18(Accounts)
2018-19(Budget
Estimates)
2018-19(Revised
Estimates)
2019-20(Budget
Estimates)
1 2 3 4 5 2 3 4 5
7. Village and Small Industries - - - - - - - -
8. Other Industries and Minerals 544.5 500.0 500.0 390.0 1,328.9 53,200.0 54,000.0 4,990.0
9. Rural Development - - - - - - - -
10. Others - - - - 750.0 3,000.0 3,000.0 3,000.0
2. Non-Development Purposes (a + b) 234.7 1,062.5 708.1 1,062.5 - - - -
a) Government Servants (other than Housing) 234.7 1,062.5 708.1 1,062.5 - - - -
b) Miscellaneous - - - - - - - -
V. Inter-State Settlement - - - - - - - -
VI. Contingency Fund - - - - 16.6 - - -
VII. State Provident Funds, etc. (1 + 2) 2,37,607.6 1,62,500.0 1,62,500.0 1,62,500.0 3,47,624.2 3,40,480.0 5,15,964.0 4,43,020.0
1. State Provident Funds 2,36,071.7 1,60,000.0 1,60,000.0 1,60,000.0 3,29,994.2 3,38,390.0 5,12,312.0 4,38,300.0
2. Others 1,535.9 2,500.0 2,500.0 2,500.0 17,630.1 2,090.0 3,652.0 4,720.0
VIII. Reserve Funds (1 to 4) 31,482.6 102.0 102.0 102.0 12,935.4 55,245.0 55,245.0 33,420.0
1. Depreciation/Renewal Reserve Funds - - - - - - - -
2. Sinking Funds - - - - - - - -
3. Famine Relief Fund - - - - - - - -
4. Others 31,482.6 102.0 102.0 102.0 12,935.4 55,245.0 55,245.0 33,420.0
IX. Deposits and Advances (1 to 4) 2,68,525.6 37,388.0 37,388.0 37,388.0 3,80,995.0 88,350.2 1,16,718.9 1,12,760.9
1. Civil Deposits 1,93,693.7 7,987.0 7,987.0 7,987.0 1,83,086.3 1,100.0 1,100.0 1,100.0
2. Deposits of Local Funds 34,559.5 21,500.0 21,500.0 21,500.0 1,26,830.8 86,050.2 1,14,418.9 1,10,460.9
3. Civil Advances 5,233.9 7,250.0 7,250.0 7,250.0 - 1,200.0 1,200.0 1,200.0
4. Others 35,038.5 651.0 651.0 651.0 71,077.9 - - -
X. Suspense and Miscellaneous (1 to 4) 43,07,630.8 82,241.0 82,241.0 82,241.0 19,55,763.5 12,000.0 12,000.0 12,000.0
1. Suspense 88,182.5 17,100.0 17,100.0 17,100.0 3,98,168.5 6,000.0 6,000.0 6,000.0
2. Cash Balance Investment Accounts 42,19,447.0 15,000.0 15,000.0 15,000.0 15,57,595.0 3,600.0 3,600.0 3,600.0
3. Deposits with RBI - 50,000.0 50,000.0 50,000.0 - - - -
4. Others 1.4 141.0 141.0 141.0 - 2,400.0 2,400.0 2,400.0
XI. Appropriation to Contingency Fund - - - - - - - -
XII. Remittances 6,78,523.2 48,037.0 48,037.0 48,037.0 3,88,856.0 13,300.0 13,300.0 13,300.0
A. Surplus (+)/Deficit (-) on Revenue Account 31,390.4 -3,16,775.7 -2,21,882.9 -2,34,208.3 7,59,515.9 13,70,876.6 7,94,462.2 13,45,366.2
B. Surplus (+)/Deficit(-) on Capital Account -44,702.1 -10,721.3 -1,02,135.4 5,878.1 -6,88,032.3 -13,09,354.7 -16,84,187.5 -15,40,881.4
C. Overall Surplus (+)/Deficit (-) (A+B) -13,311.7 -3,27,497.0 -3,24,018.3 -2,28,330.2 71,483.6 61,521.9 -8,89,725.4 -1,95,515.2
D. Financing of Surplus (+)/Deficit (-) (C = i to iii) -13,311.8 -3,27,497.0 -3,24,018.3 -2,28,330.2 71,483.6 61,521.9 -8,89,725.4 -1,95,515.2
i. Increase (+)/Decrease (-) in Cash Balances -9,740.8 -3,27,497.0 -3,24,018.3 -2,28,330.2 12,576.2 61,521.9 -8,89,725.4 -1,95,515.2
a) Opening Balance -44,327.4 -3,78,655.0 -54,068.2 -3,78,086.5 2,874.9 15,451.1 15,451.1 -8,74,274.3
b) Closing Balance -54,068.2 -7,06,152.0 -3,78,086.5 -6,06,416.7 15,451.1 76,973.0 -8,74,274.3 -10,69,789.4
ii. Withdrawals from (-)/Additions to (+) Cash Balance Investment Account (net) -3,571.0 - - - -22.6 - - -
iii. Increase (-)/Decrease (+) in Ways and Means Advances and Overdrafts from RBI (net) - - - - 58,930.0 - - -
Appendix IV : Capital Expenditure of States and Union Territories with Legislature (Contd.)(₹ Lakh)

Appendix IV
283
Appendix IV : Capital Expenditure of States and Union Territories with Legislature (Contd.)(₹ Lakh)
Item
JHARKHAND KARNATAKA
2017-18(Accounts)
2018-19(Budget
Estimates)
2018-19(Revised
Estimates)
2019-20(Budget
Estimates)
2017-18(Accounts)
2018-19(Budget
Estimates)
2018-19(Revised
Estimates)
2019-20(Budget
Estimates)
1 2 3 4 5 2 3 4 5
TOTAL CAPITAL DISBURSEMENTS (I to XII) 2,15,58,930.5 1,33,74,764.3 2,49,55,106.5 2,37,01,423.7 7,93,07,241.6 5,62,87,020.0 5,62,41,978.2 5,72,51,698.0
TOTAL CAPITAL DISBURSEMENTS (Excluding Public Accounts)$ 16,75,388.2 17,45,555.9 18,10,999.8 19,62,600.3 44,02,813.8 52,19,852.0 51,74,810.2 52,54,796.0
I. Total Capital Outlay (1 + 2) 11,95,270.7 12,30,559.0 13,06,830.8 13,87,635.7 30,66,675.7 35,24,592.0 35,92,093.2 40,08,013.0
1. Development (a + b) 11,14,559.2 11,66,886.1 12,10,149.5 12,64,103.9 29,68,931.1 34,40,578.0 35,05,246.3 39,08,926.0
(a) Social Services (1 to 9) 1,52,806.4 1,95,462.0 2,22,023.5 2,25,981.9 8,67,675.6 9,89,497.0 9,13,069.4 12,30,879.2
1. Education, Sports, Art and Culture 36,027.2 44,122.2 44,122.2 38,421.0 1,14,311.8 1,20,136.0 1,18,948.0 1,42,062.9
2. Medical and Public Health 30,948.9 32,876.8 46,876.8 60,222.2 1,13,231.9 1,27,754.0 1,26,197.5 1,06,375.9
3. Family Welfare - - - - - - - -
4. Water Supply and Sanitation 33,225.6 51,910.0 51,910.0 75,000.0 54,362.0 1,55,577.0 1,51,257.0 2,47,558.0
5. Housing 15,994.6 15,150.0 15,150.0 11,700.0 30,239.0 24,098.0 26,598.0 25,226.0
6. Urban Development 4,000.0 3,000.0 3,000.0 100.0 2,28,000.9 2,33,563.0 1,72,563.0 4,01,560.2
7. Welfare of Scheduled Castes, Scheduled
Tribes and Other Backward Classes 26,528.6 38,350.0 46,526.7 26,170.0 2,99,339.9 3,00,621.0 2,96,691.0 2,87,639.2
8. Social Security and Welfare 1,652.8 2,660.0 3,296.5 2,557.0 16,517.8 13,967.0 12,664.4 7,228.0
9. Others * 4,428.7 7,393.0 11,141.3 11,811.7 11,672.3 13,781.0 8,150.6 13,229.0
(b) Economic Services (1 to 10) 9,61,752.8 9,71,424.0 9,88,126.0 10,38,122.0 21,01,255.5 24,51,081.0 25,92,176.9 26,78,046.8
1. Agriculture and Allied Activities (i to xi) 60,733.2 64,145.0 63,873.0 26,236.2 22,511.7 47,012.0 52,765.9 70,030.0
i) Crop Husbandry 3,655.2 2,400.0 2,400.0 400.0 7,153.6 35,000.0 33,680.0 46,089.0
ii) Soil and Water Conservation 29,915.5 31,500.0 31,500.0 11,060.0 - - - -
iii) Animal Husbandry 910.5 3,045.0 3,045.0 1,000.0 9,076.8 7,398.0 7,398.0 7,568.0
iv) Dairy Development 1,104.6 920.0 160.0 200.0 - - - -
v) Fisheries 4,381.3 5,680.0 6,168.0 4,226.2 4,541.5 2,909.0 9,982.9 4,677.0
vi) Forestry and Wild Life - - - - 999.5 1,696.0 1,696.0 11,696.0
vii) Plantations - - - - - - - -
viii) Food Storage and Warehousing 2,654.0 3,100.0 3,100.0 1,000.0 - - - -
ix) Agricultural Research and Education - - - - - - - -
x) Co-operation 18,112.1 17,500.0 17,500.0 8,350.0 740.5 9.0 9.0 -
xi) Others @ - - - - - - - -
2. Rural Development 2,09,278.8 2,71,544.0 2,71,562.4 2,73,390.8 11,374.3 6,787.0 5,867.0 6,039.8
3. Special Area Programmes - - - - 92,011.3 1,30,000.0 1,30,000.0 1,80,000.0
of which: Hill Areas - - - - - - - -
4. Major and Medium Irrigation and Flood Control 1,68,915.3 2,09,350.0 2,26,720.0 2,51,960.0 10,39,182.9 12,24,650.0 12,24,423.0 13,21,421.4
5. Energy - - - - 82,700.0 62,852.0 62,852.0 85,835.0
6. Industry and Minerals (i to iv) 1,550.0 1,225.0 1,225.0 1,583.0 73,283.4 1,25,336.0 1,25,837.0 96,810.6
i) Village and Small Industries - - - 400.0 14,732.8 30,489.0 30,989.0 40,810.0
ii) Iron and Steel Industries - - - - 45,722.9 27,327.0 27,327.0 25,000.0
iii) Non-Ferrous Mining and Metallurgical Industries - 75.0 75.0 550.0 - - - -
iv) Others # 1,550.0 1,150.0 1,150.0 633.0 12,827.7 67,520.0 67,521.0 31,000.6
7. Transport (i + ii) 5,14,175.5 4,14,100.0 4,13,572.0 4,75,702.0 7,37,850.6 7,92,501.0 9,46,989.0 8,70,558.5
i) Roads and Bridges 5,03,691.1 4,00,000.0 4,00,000.0 4,70,000.0 6,96,321.9 7,19,900.0 8,79,388.0 7,99,687.5
ii) Others ** 10,484.4 14,100.0 13,572.0 5,702.0 41,528.7 72,601.0 67,601.0 70,871.0
8. Communications - - - - - - - -

State Finances : A Study of Budgets of 2019-20
284
Item
JHARKHAND KARNATAKA
2017-18(Accounts)
2018-19(Budget
Estimates)
2018-19(Revised
Estimates)
2019-20(Budget
Estimates)
2017-18(Accounts)
2018-19(Budget
Estimates)
2018-19(Revised
Estimates)
2019-20(Budget
Estimates)
1 2 3 4 5 2 3 4 5
9. Science, Technology and Environment - - - - 21.0 - - -
10. General Economic Services (i + ii) 7,099.9 11,060.0 11,173.6 9,250.0 42,320.2 61,943.0 43,443.0 47,351.6
i) Tourism 7,099.9 11,060.0 11,060.0 9,250.0 25,870.6 45,093.0 26,593.0 37,983.0
ii) Others @@ - - 113.6 - 16,449.7 16,850.0 16,850.0 9,368.6
2. Non-Development (General Services) 80,711.5 63,672.9 96,681.3 1,23,531.8 97,744.7 84,014.0 86,846.9 99,087.0
II. Discharge of Internal Debt (1 to 8) 2,78,846.2 3,29,710.8 3,29,710.8 3,67,157.0 7,08,699.4 9,74,141.0 9,74,141.0 8,44,645.0
1. Market Loans 1,19,218.0 1,48,600.0 1,48,600.0 1,84,398.0 4,75,000.0 7,41,717.0 7,41,717.0 6,00,009.0
2. Loans from LIC - - - - 3,523.6 3,433.0 3,433.0 3,264.0
3. Loans from SBI and other Banks - - - - - - - -
4. Loans from NABARD 67,626.5 75,000.0 75,000.0 80,000.0 71,934.6 68,489.0 68,489.0 78,229.0
5. Loans from National Co-operative
Development Corporation 1,281.1 1,400.0 1,400.0 800.0 517.0 505.0 505.0 2.0
6. WMA from RBI - - - - - - - -
7. Special Securities issued to NSSF 74,594.6 75,700.8 75,700.8 76,949.0 1,57,264.8 1,59,547.0 1,59,547.0 1,62,792.0
8. Others 16,126.1 29,010.0 29,010.0 25,010.0 459.3 450.0 450.0 349.0
of which: Land Compensation Bonds 0.4 10.0 10.0 10.0 - - - -
III. Repayment of Loans to the Centre (1 to 7) 16,104.0 20,845.0 20,845.0 17,279.9 1,18,216.8 1,39,443.0 1,44,129.0 1,51,791.0
1. State Plan Schemes 15,924.3 18,658.0 18,658.0 17,011.0 1,17,689.9 1,38,930.0 1,43,607.0 1,51,277.0
of which: Advance release of Plan
Assistance for Natural Calamities - - - - - - - -
2. Central Plan Schemes - - - - - - - -
3. Centrally Sponsored Schemes - - - - - - - -
4. Non-Plan (i + ii) 179.7 2,187.0 2,187.0 268.9 526.9 513.0 522.0 514.0
i) Relief for Natural Calamities - - - - - - - -
ii) Others 179.7 2,187.0 2,187.0 268.9 526.9 513.0 522.0 514.0
5. Ways and Means Advances from Centre - - - - - - - -
6. Loans for Special Schemes - - - - - - - -
7. Others - - - - - - - -
IV. Loans and Advances by State Governments (1 + 2)
1,85,167.2 1,64,441.1 1,53,613.1 1,90,527.8 5,09,221.8 5,81,676.0 4,64,447.0 2,50,347.0
1. Development Purposes (a + b) 1,84,639.1 1,63,541.1 1,52,713.1 1,89,327.8 5,09,011.7 5,80,791.0 4,63,187.0 2,49,471.0
a) Social Services ( 1 to 7) 8,200.9 10,572.1 10,572.1 9,714.8 1,18,020.9 1,36,324.0 1,33,524.0 2,08,221.0
1. Education, Sports, Art and Culture - - - - - - - -
2. Medical and Public Health - - - - - - - -
3. Family Welfare - - - - - - - -
4. Water Supply and Sanitation - - - - 34,151.2 35,000.0 35,000.0 1,15,700.0
5. Housing 200.0 2,000.0 2,000.0 - - - - -
6. Government Servants (Housing) 5,031.3 5,000.0 5,000.0 6,000.0 241.8 3,500.0 700.0 1,500.0
7. Others 2,969.6 3,572.1 3,572.1 3,714.8 83,628.0 97,824.0 97,824.0 91,021.0
b) Economic Services (1 to 10) 1,76,438.2 1,52,969.0 1,42,141.0 1,79,613.0 3,90,990.8 4,44,467.0 3,29,663.0 41,250.0
1. Crop Husbandry - - - - - - - -
2. Soil and Water Conservation - - - - - - - -
3. Food Storage and Warehousing - - - - - - - -
4. Co-operation 19.8 - - - 3,40,067.0 4,00,000.0 2,86,521.0 -
5. Major and Medium Irrigation, etc. - - - - - - - -
6. Power Projects 1,76,067.1 1,52,369.0 1,41,541.0 1,79,013.0 1,295.0 - - -
Appendix IV : Capital Expenditure of States and Union Territories with Legislature (Contd.)(₹ Lakh)

Appendix IV
285
Item
JHARKHAND KARNATAKA
2017-18(Accounts)
2018-19(Budget
Estimates)
2018-19(Revised
Estimates)
2019-20(Budget
Estimates)
2017-18(Accounts)
2018-19(Budget
Estimates)
2018-19(Revised
Estimates)
2019-20(Budget
Estimates)
1 2 3 4 5 2 3 4 5
7. Village and Small Industries - - - - 2,630.0 1.0 451.0 700.0
8. Other Industries and Minerals - - - - - 500.0 500.0 500.0
9. Rural Development 351.3 600.0 600.0 600.0 - 5,000.0 - -
10. Others - - - - 46,998.9 38,966.0 42,191.0 40,050.0
2. Non-Development Purposes (a + b) 528.1 900.0 900.0 1,200.0 210.1 885.0 1,260.0 876.0
a) Government Servants (other than Housing) 528.1 900.0 900.0 1,200.0 118.1 685.0 1,060.0 676.0
b) Miscellaneous - - - - 92.0 200.0 200.0 200.0
V. Inter-State Settlement - - - - - - - -
VI. Contingency Fund - - - - - 500.0 500.0 500.0
VII. State Provident Funds, etc. (1 + 2) 94,991.5 1,04,201.1 1,06,285.1 1,14,739.8 3,45,071.1 3,85,374.0 3,85,374.0 4,20,891.0
1. State Provident Funds 83,885.7 88,500.0 90,270.0 1,01,412.9 2,00,614.7 2,31,491.0 2,31,491.0 2,47,831.0
2. Others 11,105.8 15,701.1 16,015.1 13,326.9 1,44,456.4 1,53,883.0 1,53,883.0 1,73,060.0
VIII. Reserve Funds (1 to 4) 10,916.4 93,372.4 48,300.0 72,216.0 5,17,771.0 4,05,119.0 4,05,119.0 4,52,880.0
1. Depreciation/Renewal Reserve Funds - - - - - - - -
2. Sinking Funds - 25,500.0 6,200.0 28,016.0 - 35,000.0 35,000.0 35,000.0
3. Famine Relief Fund - - - - - 52,000.0 52,000.0 53,600.0
4. Others 10,916.4 67,872.4 42,100.0 44,200.0 5,17,771.0 3,18,119.0 3,18,119.0 3,64,280.0
IX. Deposits and Advances (1 to 4) 11,29,865.7 19,92,009.5 20,16,576.3 22,53,731.1 49,13,542.6 55,17,706.0 55,17,706.0 61,56,081.0
1. Civil Deposits 1,56,664.8 1,84,639.2 1,88,332.0 1,87,997.8 8,32,640.2 6,65,389.0 6,65,389.0 8,63,137.0
2. Deposits of Local Funds 8,97,976.2 8,47,641.6 8,64,594.5 10,77,571.5 28,95,993.4 41,53,792.0 41,53,792.0 40,86,778.0
3. Civil Advances 36,977.3 32,492.0 32,427.0 38,234.6 - 285.0 285.0 -
4. Others 38,247.4 9,27,236.7 9,31,222.8 9,49,927.3 11,84,908.9 6,98,240.0 6,98,240.0 12,06,166.0
X. Suspense and Miscellaneous (1 to 4) 1,76,01,128.6 84,06,900.3 1,99,42,285.7 1,82,15,255.6 6,91,16,805.7 4,46,98,124.0 4,46,98,124.0 4,49,63,093.0
1. Suspense 5,472.7 18,047.7 18,164.1 21,345.5 1,49,841.8 29,639.0 29,639.0 29,639.0
2. Cash Balance Investment Accounts 60,20,485.2 83,70,993.2 83,54,251.2 62,25,181.7 2,88,23,163.9 2,97,34,150.0 2,97,34,150.0 2,99,55,362.0
3. Deposits with RBI 1,15,63,610.2 - 1,15,52,046.6 1,19,56,773.0 2,63,74,727.5 - - -
4. Others 11,560.4 17,859.5 17,823.8 11,955.4 1,37,69,072.6 1,49,34,335.0 1,49,34,335.0 1,49,78,092.0
XI. Appropriation to Contingency Fund - - - - - - - -
XII. Remittances 10,46,640.2 10,32,725.1 10,30,659.7 10,82,880.9 11,237.5 60,345.0 60,345.0 3,457.0
A. Surplus (+)/Deficit (-) on Revenue Account 1,80,562.7 6,38,555.8 7,06,499.5 8,55,500.3 4,51,731.8 10,606.0 19,406.6 25,796.1
B. Surplus (+)/Deficit(-) on Capital Account -3,12,664.7 -5,21,023.2 -5,81,743.8 -8,12,043.2 -15,21,558.1 -3,06,296.0 -3,62,050.2 -3,28,803.0
C. Overall Surplus (+)/Deficit (-) (A+B) -1,32,102.0 1,17,532.6 1,24,755.7 43,457.2 -10,69,826.4 -2,95,690.0 -3,42,643.6 -3,03,007.0
D. Financing of Surplus (+)/Deficit (-) (C = i to iii) -1,32,102.0 1,17,532.6 1,24,755.6 43,457.2 -10,69,826.5 -2,95,690.0 -3,42,643.0 -3,03,007.0
i. Increase (+)/Decrease (-) in Cash Balances 50,793.3 1,15,547.0 1,60,137.0 1,61,503.0 62,372.0 -42,775.0 -89,728.0 -51,307.0
a) Opening Balance 50,226.0 -24,216.0 -24,216.0 1,35,921.0 10,006.0 -15,130.3 72,378.0 -17,350.0
b) Closing Balance 1,01,019.3 91,331.0 1,35,921.0 2,97,424.0 72,378.0 -57,905.3 -17,350.0 -68,657.0
ii. Withdrawals from (-)/Additions to (+) Cash Balance Investment Account (net) -1,82,895.3 1,985.6 -35,381.4 -1,18,045.8 -11,32,198.5 -2,52,915.0 -2,52,915.0 -2,51,700.0
iii. Increase (-)/Decrease (+) in Ways and Means Advances and Overdrafts from RBI (net) - - - - - - - -
Appendix IV : Capital Expenditure of States and Union Territories with Legislature (Contd.)(₹ Lakh)

State Finances : A Study of Budgets of 2019-20
286
Appendix IV : Capital Expenditure of States and Union Territories with Legislature (Contd.)(₹ Lakh)
Item
KERALA MADHyA PRADESH
2017-18(Accounts)
2018-19(Budget
Estimates)
2018-19(Revised
Estimates)
2019-20(Budget
Estimates)
2017-18(Accounts)
2018-19(Budget
Estimates)
2018-19(Revised
Estimates)
2019-20(Budget
Estimates)
1 2 3 4 5 2 3 4 5
TOTAL CAPITAL DISBURSEMENTS (I to XII) 2,82,45,653.6 2,59,52,819.9 2,81,24,961.0 3,14,89,195.8 6,61,96,731.5 6,08,40,625.5 6,04,56,067.5 6,73,05,200.9
TOTAL CAPITAL DISBURSEMENTS (Excluding Public Accounts)$ 17,08,605.5 19,63,954.8 20,02,688.0 26,56,908.7 38,23,981.1 39,55,883.9 39,21,325.8 46,26,678.1
I. Total Capital Outlay (1 + 2) 8,74,887.2 10,33,030.8 9,81,070.8 16,26,937.8 30,91,322.4 29,34,283.4 27,24,373.9 33,48,969.1
1. Development (a + b) 8,48,086.1 10,00,185.7 9,56,267.8 15,97,378.7 30,17,064.3 28,42,133.1 26,23,360.0 32,13,908.6
(a) Social Services (1 to 9) 1,40,588.4 2,63,208.3 2,47,698.7 2,50,018.5 5,35,838.0 7,57,038.0 5,53,527.0 8,33,686.8
1. Education, Sports, Art and Culture 52,810.1 53,637.0 49,411.4 51,650.0 68,833.8 1,83,023.4 1,00,470.4 1,75,036.7
2. Medical and Public Health 30,739.5 38,229.0 33,879.3 32,381.9 1,03,986.8 1,36,668.7 1,03,844.4 1,14,719.2
3. Family Welfare - - - - -
4. Water Supply and Sanitation 31,990.0 1,04,126.0 97,047.1 88,940.0 1,82,614.8 1,43,733.6 1,50,921.2 2,65,402.7
5. Housing 2,639.0 5,641.0 5,486.5 4,965.0 4,484.6 10,612.0 11,452.0 10,650.0
6. Urban Development 5,906.8 1.0 7,343.7 17,501.0 49,324.6 1,29,328.1 78,327.1 86,447.1
7. Welfare of Scheduled Castes, Scheduled
Tribes and Other Backward Classes 9,993.9 29,778.0 31,603.2 26,234.3 1,06,128.5 1,32,205.1 96,226.2 1,59,364.0
8. Social Security and Welfare 4,042.6 11,836.3 4,019.9 9,095.3 11,815.7 13,937.1 4,585.1 13,623.1
9. Others * 2,466.5 19,960.0 18,907.5 19,251.0 8,649.2 7,530.0 7,700.5 8,444.0
(b) Economic Services (1 to 10) 7,07,497.7 7,36,977.5 7,08,569.1 13,47,360.2 24,81,226.3 20,85,095.1 20,69,833.1 23,80,221.9
1. Agriculture and Allied Activities (i to xi) 70,159.0 76,778.7 79,895.6 54,958.1 39,632.0 56,764.5 1,52,527.5 1,58,221.8
i) Crop Husbandry 1,510.5 1,571.3 571.0 1,460.8 - 0.1 0.1 10,000.1
ii) Soil and Water Conservation 9,281.2 5,750.0 9,706.9 5,650.0 - - - -
iii) Animal Husbandry 1,661.7 1,485.0 1,681.0 1,355.0 307.6 1,565.0 1,889.0 1,718.0
iv) Dairy Development 177.2 536.3 455.9 500.0 - - - -
v) Fisheries 36,608.5 42,205.0 37,213.8 23,770.0 16.3 - - 69.0
vi) Forestry and Wild Life 7,176.2 11,885.0 8,367.8 8,635.0 37,044.0 50,832.4 46,248.4 44,441.0
vii) Plantations - - - - - - - -
viii) Food Storage and Warehousing 1,469.4 7,270.2 6,948.2 7,461.0 - 362.0 215.0 140.0
ix) Agricultural Research and Education - - - - - - - -
x) Co-operation 11,347.2 5,075.9 13,950.9 5,126.4 2,264.1 4,005.0 1,04,175.0 1,01,853.7
xi) Others @ 927.0 1,000.0 1,000.0 1,000.0 - - - -
2. Rural Development 51,547.1 67,262.0 54,484.2 1,97,372.0 2,18,653.7 3,14,242.4 3,05,585.7 4,82,202.4
3. Special Area Programmes 493.4 300.0 794.1 2,800.0 - - - -
of which: Hill Areas 493.4 300.0 794.1 2,800.0 - - - -
4. Major and Medium Irrigation and Flood Control 54,448.8 66,819.5 58,770.3 54,770.5 7,97,314.2 8,65,684.1 8,76,072.1 8,63,246.4
5. Energy 2,347.0 518.0 470.0 570.0 7,47,957.1 2,17,802.6 1,00,743.2 34,806.5
6. Industry and Minerals (i to iv) 54,806.1 65,722.0 48,981.4 58,772.2 25,828.8 28,601.5 51,601.5 1,04,025.7
i) Village and Small Industries 5,033.4 7,629.0 5,709.0 6,405.2 22,407.5 8,251.5 31,251.5 34,051.6
ii) Iron and Steel Industries - - - - 385.0 - - -
iii) Non-Ferrous Mining and Metallurgical Industries - - - - 196.8 100.0 100.0 30,000.0
iv) Others # 49,772.8 58,093.0 43,272.3 52,367.0 2,839.5 20,250.0 20,250.0 39,974.0
7. Transport (i + ii) 3,44,244.4 2,67,663.6 2,79,695.2 3,76,343.2 6,40,034.7 5,92,950.0 5,74,303.0 7,21,019.1
i) Roads and Bridges 2,37,859.8 2,33,875.1 2,32,968.1 3,42,828.1 6,39,232.8 5,91,850.0 5,73,303.0 7,10,969.1
ii) Others ** 1,06,384.6 33,788.6 46,727.1 33,515.1 801.9 1,100.0 1,000.0 10,050.0
8. Communications - - - - - - - -

Appendix IV
287
Item
KERALA MADHyA PRADESH
2017-18(Accounts)
2018-19(Budget
Estimates)
2018-19(Revised
Estimates)
2019-20(Budget
Estimates)
2017-18(Accounts)
2018-19(Budget
Estimates)
2018-19(Revised
Estimates)
2019-20(Budget
Estimates)
1 2 3 4 5 2 3 4 5
9. Science, Technology and Environment - - - - 400.0 750.0 700.0 6,100.0
10. General Economic Services (i + ii) 1,29,451.9 1,91,913.6 1,85,478.3 6,01,774.1 11,405.9 8,300.0 8,300.0 10,600.0
i) Tourism 17,924.6 24,366.0 22,131.6 23,530.0 11,405.9 8,300.0 8,300.0 10,600.0
ii) Others @@ 1,11,527.3 1,67,547.6 1,63,346.8 5,78,244.1 - - - -
2. Non-Development (General Services) 26,801.1 32,845.1 24,803.0 29,559.1 74,258.1 92,150.3 1,01,013.8 1,35,060.4
II. Discharge of Internal Debt (1 to 8) 12,55,718.8 14,35,618.0 17,41,433.5 17,01,605.5 4,68,353.1 11,25,771.1 9,21,667.2 13,43,954.9
1. Market Loans 4,29,676.5 5,51,597.0 5,51,597.0 5,45,604.0 1,87,500.0 4,59,504.0 5,59,888.3 5,92,107.0
2. Loans from LIC 26,885.8 26,753.9 26,753.9 26,508.8 967.1 935.0 935.0 900.0
3. Loans from SBI and other Banks - - - - - - - -
4. Loans from NABARD 46,276.3 50,428.0 50,428.0 58,186.4 1,12,577.5 1,34,300.0 1,35,000.0 1,70,000.0
5. Loans from National Co-operative
Development Corporation 6,239.4 7,578.6 7,380.3 8,141.7 3,391.0 4,000.0 4,000.0 4,000.0
6. WMA from RBI 6,33,550.0 6,62,500.0 9,62,500.0 9,02,500.0 - 4,00,000.0 50,000.0 4,00,000.0
7. Special Securities issued to NSSF 1,07,535.3 1,30,938.4 1,36,952.1 1,57,173.7 1,52,615.7 1,15,000.0 1,59,811.9 1,69,793.9
8. Others 5,555.5 5,822.2 5,822.2 3,491.0 11,301.8 12,032.0 12,032.0 7,154.0
of which: Land Compensation Bonds 0.4 0.2 0.2 0.2 9,432.0 9,432.0 9,432.0 4,716.0
III. Repayment of Loans to the Centre (1 to 7) 57,491.0 47,596.7 59,223.1 72,271.2 1,09,285.3 1,23,980.8 1,23,980.8 1,36,378.8
1. State Plan Schemes 57,300.0 - 59,034.1 62,034.1 1,08,922.3 1,23,401.4 1,23,401.4 1,35,741.5
of which: Advance release of Plan
Assistance for Natural Calamities - - - - - - - -
2. Central Plan Schemes - - - - - - - -
3. Centrally Sponsored Schemes - - - - - 170.4 170.4 187.4
4. Non-Plan (i + ii) 191.0 - 189.1 187.1 363.0 409.0 409.0 449.9
i) Relief for Natural Calamities - - - - - - - -
ii) Others 191.0 - 189.1 187.1 363.0 409.0 409.0 449.9
5. Ways and Means Advances from Centre - - - - - - - -
6. Loans for Special Schemes - - - - - - - -
7. Others - 47,596.7 - 10,050.0 - - - -
IV. Loans and Advances by State Governments (1 + 2)
1,54,058.6 1,10,209.2 1,83,460.6 1,58,594.2 1,55,020.3 1,71,848.7 2,01,304.0 1,97,375.3
1. Development Purposes (a + b) 1,52,385.7 1,08,876.8 1,81,932.5 1,57,056.1 1,55,020.3 1,71,838.7 2,01,294.0 1,97,371.3
a) Social Services ( 1 to 7) 22,445.8 24,064.6 51,369.4 1,600.0 36,520.8 49,697.0 34,902.1 69,321.4
1. Education, Sports, Art and Culture - - - - 4,000.0 5,784.0 5,784.0 5,784.0
2. Medical and Public Health 11,616.5 6,609.5 13,145.3 - - - - -
3. Family Welfare - - - - - - - -
4. Water Supply and Sanitation - - - - - - - -
5. Housing 419.8 1,260.0 1,260.0 - - - - -
6. Government Servants (Housing) 4,797.2 14,520.0 35,512.2 25.0 - 70.0 70.0 70.0
7. Others 5,612.2 1,675.0 1,451.8 1,575.0 32,520.8 43,843.0 29,048.1 63,467.4
b) Economic Services (1 to 10) 1,29,939.9 84,812.2 1,30,563.1 1,55,456.1 1,18,499.6 1,22,141.7 1,66,391.9 1,28,049.9
1. Crop Husbandry 352.6 - - - - 3.5 - -
2. Soil and Water Conservation - - - - - - - -
3. Food Storage and Warehousing 986.2 228.0 644.6 228.0 50.6 150.0 41.9 60.0
4. Co-operation 6,398.4 8,063.2 9,509.0 7,855.0 13,207.2 13,643.0 11,703.0 13,032.7
5. Major and Medium Irrigation, etc. - - - - - - - -
6. Power Projects 3,527.9 3,600.0 3,099.1 3,506.0 70,625.8 81,129.1 1,27,431.0 89,957.1
Appendix IV : Capital Expenditure of States and Union Territories with Legislature (Contd.)(₹ Lakh)

State Finances : A Study of Budgets of 2019-20
288
Item
KERALA MADHyA PRADESH
2017-18(Accounts)
2018-19(Budget
Estimates)
2018-19(Revised
Estimates)
2019-20(Budget
Estimates)
2017-18(Accounts)
2018-19(Budget
Estimates)
2018-19(Revised
Estimates)
2019-20(Budget
Estimates)
1 2 3 4 5 2 3 4 5
7. Village and Small Industries 3,811.8 4,211.0 4,328.8 3,951.1 9,616.0 2,216.0 2,216.0 -
8. Other Industries and Minerals 6,861.0 6,160.0 5,160.0 9,253.0 - - - -
9. Rural Development - - - - - - - -
10. Others 1,08,002.1 62,550.0 1,07,821.6 1,30,663.0 25,000.0 25,000.0 25,000.0 25,000.0
2. Non-Development Purposes (a + b) 1,672.9 1,332.4 1,528.1 1,538.1 - 10.0 10.0 4.0
a) Government Servants (other than Housing) 1,280.7 1,082.4 1,228.1 1,238.1 - 10.0 10.0 4.0
b) Miscellaneous 392.2 250.0 300.0 300.0 - - - -
V. Inter-State Settlement - - - - -1.4 - - -
VI. Contingency Fund - 100.0 100.0 100.0 - 50,000.0 50,000.0 50,000.0
VII. State Provident Funds, etc. (1 + 2) 78,56,408.1 40,60,169.8 62,28,257.7 84,12,776.8 2,73,636.6 2,80,081.0 2,80,081.0 3,08,089.1
1. State Provident Funds 5,40,583.3 5,12,613.6 6,26,585.1 7,98,881.0 2,45,939.5 2,50,000.0 2,50,000.0 2,75,000.0
2. Others 73,15,824.8 35,47,556.2 56,01,672.6 76,13,895.9 27,697.1 30,081.0 30,081.0 33,089.1
VIII. Reserve Funds (1 to 4) 78,346.6 46,720.1 3,67,469.1 48,416.6 3,29,580.7 4,35,182.7 4,35,182.7 4,78,700.9
1. Depreciation/Renewal Reserve Funds - - - - - - - -
2. Sinking Funds 57,632.2 23,600.0 23,600.0 23,600.0 - - - -
3. Famine Relief Fund - - - - - 5.9 5.9 6.5
4. Others 20,714.4 23,120.1 3,43,869.1 24,816.6 3,29,580.7 4,35,176.8 4,35,176.8 4,78,694.4
IX. Deposits and Advances (1 to 4) 2,99,845.8 3,39,770.2 2,79,986.8 3,09,915.3 22,70,021.2 32,13,435.9 32,13,435.9 36,85,086.5
1. Civil Deposits 2,42,245.5 3,03,013.9 2,06,327.4 2,17,239.3 7,56,110.1 8,10,313.2 8,10,313.2 8,91,344.5
2. Deposits of Local Funds 423.3 1,392.1 3,325.5 3,663.1 10,138.2 16,242.5 16,242.5 17,866.7
3. Civil Advances 0.1 1.2 1.2 - 318.4 2,691.6 2,691.6 2,960.8
4. Others 57,176.9 35,363.1 70,332.7 89,012.9 15,03,454.5 23,84,188.6 23,84,188.6 27,72,914.4
X. Suspense and Miscellaneous (1 to 4) 1,72,43,408.4 1,86,28,457.8 1,80,75,765.9 1,89,34,824.3 5,78,03,864.6 5,05,06,618.1 5,05,06,618.1 5,55,57,279.9
1. Suspense 35,55,068.2 39,09,701.9 45,79,264.8 49,95,743.8 64,870.5 21,591.1 21,591.1 23,750.3
2. Cash Balance Investment Accounts 51,28,559.6 58,10,500.0 44,15,223.5 48,45,745.8 3,47,26,693.8 2,79,76,354.4 2,79,76,354.4 3,07,73,989.8
3. Deposits with RBI - - - - 1,07,55,738.7 1,04,49,345.7 1,04,49,345.7 1,14,94,280.2
4. Others 85,59,780.6 89,08,255.9 90,81,277.5 90,93,334.7 1,22,56,561.5 1,20,59,327.0 1,20,59,327.0 1,32,65,259.6
XI. Appropriation to Contingency Fund - - - - - - - -
XII. Remittances 4,25,489.2 2,51,147.2 2,08,193.5 2,23,754.1 16,95,648.8 19,99,424.0 19,99,424.0 21,99,366.4
A. Surplus (+)/Deficit (-) on Revenue Account -16,92,821.0 -12,85,980.8 -13,02,698.3 -8,77,028.6 4,62,930.1 26,254.7 13,729.1 73,262.9
B. Surplus (+)/Deficit(-) on Capital Account 15,87,835.5 13,71,414.6 12,14,520.9 7,26,220.1 -8,48,599.0 1,02,680.7 2,94,438.8 94,967.8
C. Overall Surplus (+)/Deficit (-) (A+B) -1,04,985.5 85,433.8 -88,177.4 -1,50,808.5 -3,85,668.9 1,28,935.4 3,08,167.9 1,68,230.7
D. Financing of Surplus (+)/Deficit (-) (C = i to iii) -1,04,985.4 85,433.8 -88,177.0 -1,50,809.1 -3,85,668.9 1,28,935.4 3,08,167.9 1,68,230.7
i. Increase (+)/Decrease (-) in Cash Balances 362.0 -7,566.2 -43,658.0 -2,515.0 -64,066.0 1,342.7 1,80,575.2 27,878.8
a) Opening Balance -4,770.0 -74,056.6 -4,408.0 -48,066.0 -5,298.8 -8,069.5 -69,364.8 1,11,210.4
b) Closing Balance -4,408.0 -81,622.8 -48,066.0 -50,581.0 -69,364.8 -6,726.8 1,11,210.4 1,39,089.2
ii. Withdrawals from (-)/Additions to (+) Cash Balance Investment Account (net) -1,05,347.4 93,000.0 -44,519.0 -1,48,294.1 -3,21,602.9 1,27,592.7 1,27,592.7 1,40,352.0
iii. Increase (-)/Decrease (+) in Ways and Means Advances and Overdrafts from RBI (net) - - - - - - - -
Appendix IV : Capital Expenditure of States and Union Territories with Legislature (Contd.)(₹ Lakh)

Appendix IV
289
Appendix IV : Capital Expenditure of States and Union Territories with Legislature (Contd.)(₹ Lakh)
Item
MAHARASHTRA MANIPUR
2017-18(Accounts)
2018-19(Budget
Estimates)
2018-19(Revised
Estimates)
2019-20(Budget
Estimates)
2017-18(Accounts)
2018-19(Budget
Estimates)
2018-19(Revised
Estimates)
2019-20(Budget
Estimates)
1 2 3 4 5 2 3 4 5
TOTAL CAPITAL DISBURSEMENTS (I to XII) 7,44,59,505.5 5,96,65,849.4 6,99,18,579.6 7,21,06,250.9 16,91,741.0 25,25,436.3 19,84,485.4 18,71,955.9
TOTAL CAPITAL DISBURSEMENTS (Excluding Public Accounts)$ 43,60,364.4 62,93,801.5 71,77,480.3 68,83,426.1 1,82,735.8 2,60,721.3 3,56,082.7 2,96,040.3
I. Total Capital Outlay (1 + 2) 26,84,218.5 36,29,786.5 41,57,269.9 40,73,228.1 1,42,830.5 2,25,289.3 3,08,814.1 2,26,666.2
1. Development (a + b) 25,79,438.6 33,91,937.3 38,91,569.0 38,40,234.5 1,32,181.0 2,10,795.6 2,90,152.8 2,11,819.7
(a) Social Services (1 to 9) 2,26,845.2 3,97,440.7 5,41,798.2 3,11,454.7 66,370.0 77,299.9 1,31,316.3 74,810.2
1. Education, Sports, Art and Culture 10,661.6 19,932.4 43,561.4 10,004.6 5,741.0 6,638.9 9,783.0 6,978.5
2. Medical and Public Health 56,985.4 1,25,724.0 1,54,548.3 1,10,898.7 1,929.6 3,370.9 8,276.1 1,492.0
3. Family Welfare - - - - - - - -
4. Water Supply and Sanitation 1,990.2 3,254.5 3,253.1 - 24,084.4 18,988.4 32,939.4 19,507.7
5. Housing 4,564.5 13,271.3 14,271.4 30,249.9 737.7 3,300.0 1,800.0 1,800.0
6. Urban Development 86,831.5 35,008.7 2,05,929.8 37,009.0 20,878.7 33,109.3 46,518.6 34,679.0
7. Welfare of Scheduled Castes, Scheduled
Tribes and Other Backward Classes 57,501.6 1,78,624.3 91,894.8 1,07,450.6 9,881.5 8,599.0 29,063.2 8,253.0
8. Social Security and Welfare 2,922.0 4,878.9 4,742.6 4,325.2 1,979.0 100.0 2,753.2 2,025.0
9. Others * 5,388.5 16,746.5 23,596.9 11,516.8 1,138.0 3,193.5 182.8 75.0
(b) Economic Services (1 to 10) 23,52,593.4 29,94,496.6 33,49,770.8 35,28,779.8 65,811.1 1,33,495.7 1,58,836.5 1,37,009.5
1. Agriculture and Allied Activities (i to xi) 5,37,364.4 6,06,115.7 7,12,229.1 6,55,205.7 396.2 1,342.0 1,556.6 1,359.0
i) Crop Husbandry - - - - - 600.0 664.6 600.0
ii) Soil and Water Conservation 2,24,372.9 2,73,925.9 2,74,993.2 2,80,804.3 100.0 50.0 50.0 70.0
iii) Animal Husbandry 2,431.6 3,866.0 3,866.0 6,013.1 131.0 131.0 131.0 131.0
iv) Dairy Development - - - - - - - -
v) Fisheries 9,247.0 11,145.7 28,454.1 7,230.5 52.2 48.0 198.0 48.0
vi) Forestry and Wild Life 61,308.2 91,727.3 1,31,687.3 1,21,909.2 - - - -
vii) Plantations - - - - - - - -
viii) Food Storage and Warehousing 2,32,620.8 2,16,515.2 2,15,249.1 2,31,349.7 - - - -
ix) Agricultural Research and Education 1,835.1 755.0 2,364.7 1,250.0 - - - -
x) Co-operation 5,507.8 7,910.7 55,344.6 6,648.9 113.0 513.0 513.0 510.0
xi) Others @ 41.2 270.0 270.0 - - - - -
2. Rural Development 1,25,756.3 4,59,129.0 1,59,273.5 7,94,345.8 - - - -
3. Special Area Programmes 6,702.3 9,500.0 9,500.0 9,500.0 13,590.8 29,740.6 20,030.2 21,453.5
of which: Hill Areas 6,702.3 9,500.0 9,500.0 9,500.0 - - - -
4. Major and Medium Irrigation and Flood Control 9,36,843.5 9,38,013.3 12,49,407.8 10,08,228.6 16,972.9 35,915.2 59,689.1 57,243.9
5. Energy 77,593.8 72,976.5 65,476.5 22,860.7 - - - -
6. Industry and Minerals (i to iv) 1,356.8 1,754.9 2,754.9 2,959.2 998.1 2,030.0 1,343.0 1,275.0
i) Village and Small Industries 1,356.8 1,254.9 1,254.9 1,521.2 872.7 505.0 500.0 460.0
ii) Iron and Steel Industries - - - - - - - -
iii) Non-Ferrous Mining and Metallurgical Industries - - - - - - - -
iv) Others # - 500.0 1,500.0 1,438.0 125.5 1,525.0 843.0 815.0
7. Transport (i + ii) 6,63,943.5 8,86,239.2 11,26,551.1 10,02,033.1 31,492.3 62,417.8 72,483.0 52,050.0
i) Roads and Bridges 6,11,647.0 8,25,639.2 10,50,551.1 9,34,933.1 31,492.3 62,417.8 71,814.6 52,000.0
ii) Others ** 52,296.4 60,600.0 76,000.0 67,100.0 - - 668.4 50.0
8. Communications - - - - - - - -

State Finances : A Study of Budgets of 2019-20
290
Item
MAHARASHTRA MANIPUR
2017-18(Accounts)
2018-19(Budget
Estimates)
2018-19(Revised
Estimates)
2019-20(Budget
Estimates)
2017-18(Accounts)
2018-19(Budget
Estimates)
2018-19(Revised
Estimates)
2019-20(Budget
Estimates)
1 2 3 4 5 2 3 4 5
9. Science, Technology and Environment - - - - 1,000.0 100.0 400.0 230.0
10. General Economic Services (i + ii) 3,033.0 20,768.1 24,578.0 33,646.9 1,360.8 1,950.1 3,334.6 3,398.1
i) Tourism 2,400.0 18,520.6 22,250.6 32,497.1 1,202.6 1,950.1 3,334.6 3,398.1
ii) Others @@ 633.0 2,247.5 2,327.4 1,149.8 158.3 - - -
2. Non-Development (General Services) 1,04,779.9 2,37,849.2 2,65,700.9 2,32,993.6 10,649.5 14,493.7 18,661.3 14,846.5
II. Discharge of Internal Debt (1 to 8) 16,42,757.6 27,21,943.9 27,19,347.7 24,96,200.4 63,143.9 30,278.7 1,32,115.3 93,735.5
1. Market Loans 8,51,970.8 17,76,393.0 17,76,288.0 15,50,100.0 24,722.9 18,371.4 30,330.0 50,278.0
2. Loans from LIC 15,406.7 13,333.3 13,333.3 6,666.7 - - - -
3. Loans from SBI and other Banks - - - - - - - -
4. Loans from NABARD 74,876.2 79,223.7 79,223.7 76,234.9 3,425.0 4,100.0 3,936.0 4,935.0
5. Loans from National Co-operative
Development Corporation 8,669.9 10,500.0 8,009.0 5,957.9 - - - -
6. WMA from RBI 1,59,400.0 3,00,000.0 - 10,000.0 27,988.0 - 90,000.0 30,000.0
7. Special Securities issued to NSSF 5,17,622.7 5,30,947.0 5,30,947.0 5,38,070.8 5,311.1 5,842.2 5,842.2 6,426.4
8. Others 14,811.4 11,546.9 3,11,546.7 3,09,170.1 1,696.9 1,965.1 2,007.0 2,096.0
of which: Land Compensation Bonds 0.1 0.1 - - - - - -
III. Repayment of Loans to the Centre (1 to 7) 94,859.3 1,24,207.5 1,24,207.5 1,23,252.1 4,409.4 4,853.3 4,853.3 5,338.6
1. State Plan Schemes 94307.01 1,23,685.0 123684.99 122677.12 594.7 654.2 654.2 719.6
of which: Advance release of Plan
Assistance for Natural Calamities - - - - - - - -
2. Central Plan Schemes - - - - - - - -
3. Centrally Sponsored Schemes - - - - - - - -
4. Non-Plan (i + ii) 552.3 522.5 522.5 575.0 3,790.4 4,170.0 4,170.0 4,587.0
i) Relief for Natural Calamities - - - - - - - -
ii) Others 552.29 522.5 522.46 575.02 3,790.4 4,170.0 4,170.0 4,587.0
5. Ways and Means Advances from Centre - - - - - - - -
6. Loans for Special Schemes - - - - 24.3 29.1 29.1 32.0
7. Others - - - - - - - -
IV. Loans and Advances by State Governments (1 + 2)
97,929.0 1,17,863.7 1,76,655.2 2,00,745.5 340.0 300.0 300.0 300.0
1. Development Purposes (a + b) 95,475.1 1,12,063.7 1,71,803.9 1,95,320.2 20.0 65.0 65.0 65.0
a) Social Services ( 1 to 7) 81,359.6 92,532.2 1,45,925.0 1,44,973.1 20.0 65.0 65.0 65.0
1. Education, Sports, Art and Culture - - - - - - - -
2. Medical and Public Health - - - - - - - -
3. Family Welfare - - - - - - - -
4. Water Supply and Sanitation - 368.5 368.5 339.4 - - - -
5. Housing 121.9 147.4 147.4 147.4 - - - -
6. Government Servants (Housing) 55,099.3 63,050.4 59,646.2 66,717.0 20.0 65.0 65.0 65.0
7. Others 26,138.5 28,965.8 85,762.8 77,769.3 - - - -
b) Economic Services (1 to 10) 14,115.5 19,531.5 25,878.9 50,347.1 - - - -
1. Crop Husbandry - - - - - - - -
2. Soil and Water Conservation - - - - - - - -
3. Food Storage and Warehousing - - - - - - - -
4. Co-operation 9,077.0 9,800.4 10,200.4 19,100.0 - - - -
5. Major and Medium Irrigation, etc. - - - 1.0 - - - -
6. Power Projects 3,164.0 8,483.0 14,383.0 30,001.0 - - - -
Appendix IV : Capital Expenditure of States and Union Territories with Legislature (Contd.)(₹ Lakh)

Appendix IV
291
Item
MAHARASHTRA MANIPUR
2017-18(Accounts)
2018-19(Budget
Estimates)
2018-19(Revised
Estimates)
2019-20(Budget
Estimates)
2017-18(Accounts)
2018-19(Budget
Estimates)
2018-19(Revised
Estimates)
2019-20(Budget
Estimates)
1 2 3 4 5 2 3 4 5
7. Village and Small Industries 1,164.5 1,248.0 1,248.0 1,245.0 - - - -
8. Other Industries and Minerals - - - - - - - -
9. Rural Development - - - - - - - -
10. Others 710.0 0.1 47.5 0.1 - - - -
2. Non-Development Purposes (a + b) 2,453.8 5,800.0 4,851.3 5,425.3 320.0 235.0 235.0 235.0
a) Government Servants (other than Housing) 2,453.8 5,800.0 4,851.3 5,425.3 320.0 235.0 235.0 235.0
b) Miscellaneous - - - - - - - -
V. Inter-State Settlement - 0.1 0.1 0.2 - - - -
VI. Contingency Fund - - - - - - - -
VII. State Provident Funds, etc. (1 + 2) 4,23,755.9 4,22,884.4 4,21,256.3 4,26,810.4 30,549.9 25,300.0 25,300.0 30,800.0
1. State Provident Funds 3,92,967.0 3,90,365.9 3,92,967.0 3,92,967.0 30,109.4 25,000.0 25,000.0 30,500.0
2. Others 30,788.9 32,518.5 28,289.3 33,843.4 440.5 300.0 300.0 300.0
VIII. Reserve Funds (1 to 4) 9,09,303.1 6,96,356.4 6,80,467.4 6,80,170.1 18,692.8 7,355.0 7,555.0 9,568.0
1. Depreciation/Renewal Reserve Funds - 5.0 5.0 5.0 - - - -
2. Sinking Funds 6,11,838.8 3,80,000.0 3,80,000.0 4,00,000.0 13,528.2 3,338.0 3,338.0 4,700.0
3. Famine Relief Fund - - - - - - - -
4. Others 2,97,464.3 3,16,351.4 3,00,462.4 2,80,165.1 5,164.6 4,017.0 4,217.0 4,868.0
IX. Deposits and Advances (1 to 4) 36,03,096.0 31,72,872.3 33,22,046.7 34,13,927.7 53,543.4 52,000.0 51,000.0 51,000.0
1. Civil Deposits 32,34,416.5 27,80,983.1 28,53,625.7 28,77,916.0 26,186.5 25,000.0 25,000.0 25,000.0
2. Deposits of Local Funds - - - - - - - -
3. Civil Advances 1,20,784.2 61,614.3 61,614.3 61,614.3 3,132.0 3,000.0 2,000.0 2,000.0
4. Others 2,47,895.3 3,30,274.8 4,06,806.7 4,74,397.4 24,224.9 24,000.0 24,000.0 24,000.0
X. Suspense and Miscellaneous (1 to 4) 6,23,16,659.6 4,62,98,173.7 5,55,71,383.2 5,76,71,381.2 12,24,638.8 19,40,060.0 12,14,547.7 12,14,547.7
1. Suspense 7,337.1 3,613.2 4,922.7 4,920.7 18,954.7 7,000.0 7,000.0 7,000.0
2. Cash Balance Investment Accounts 6,22,73,567.3 4,36,11,100.0 5,29,00,000.0 5,50,00,000.0 12,04,541.0 19,27,000.0 12,04,541.0 12,04,541.0
3. Deposits with RBI - - - - - - - -
4. Others 35,755.3 26,83,460.5 26,66,460.5 26,66,460.5 1,143.2 6,060.0 3,006.7 3,006.7
XI. Appropriation to Contingency Fund - - - - - - - -
XII. Remittances 26,86,926.5 24,81,761.2 27,45,945.7 30,20,535.3 1,53,592.3 2,40,000.0 2,40,000.0 2,40,000.0
A. Surplus (+)/Deficit (-) on Revenue Account 2,08,249.4 -15,37,489.6 -14,96,004.3 -19,78,438.2 1,08,383.1 1,63,969.6 844.4 37,668.1
B. Surplus (+)/Deficit(-) on Capital Account 11,52,362.7 21,58,669.5 -26,78,266.1 19,45,234.8 -1,28,263.5 -1,41,410.8 -2,51,466.2 -2,00,410.8
C. Overall Surplus (+)/Deficit (-) (A+B) 13,60,612.1 6,21,179.9 -41,74,270.4 -33,203.5 -19,880.4 22,558.8 -2,50,621.7 -1,62,742.7
D. Financing of Surplus (+)/Deficit (-) (C = i to iii) 13,60,612.1 6,21,179.9 -41,74,270.4 -33,203.5 -19,880.4 22,558.8 -2,50,621.7 -1,62,742.7
i. Increase (+)/Decrease (-) in Cash Balances -65,741.5 10,079.9 -74,270.4 -33,203.5 18,471.3 17,558.8 -2,28,421.7 -1,40,542.7
a) Opening Balance -3,25,062.9 -3,20,070.0 -3,90,804.4 -4,65,074.7 -15,039.0 -21,412.3 3,432.3 -2,24,989.4
b) Closing Balance -3,90,804.4 -3,09,990.1 -4,65,074.7 -4,98,278.2 3,432.3 -3,853.6 -2,24,989.4 -3,65,532.1
ii. Withdrawals from (-)/Additions to (+) Cash Balance Investment Account (net) 14,26,353.6 6,11,100.0 -41,00,000.0 - - 5,000.0 - -
iii. Increase (-)/Decrease (+) in Ways and Means Advances and Overdrafts from RBI (net) - - -0.1 - -38,351.7 - -22,200.0 -22,200.0
Appendix IV : Capital Expenditure of States and Union Territories with Legislature (Contd.)(₹ Lakh)
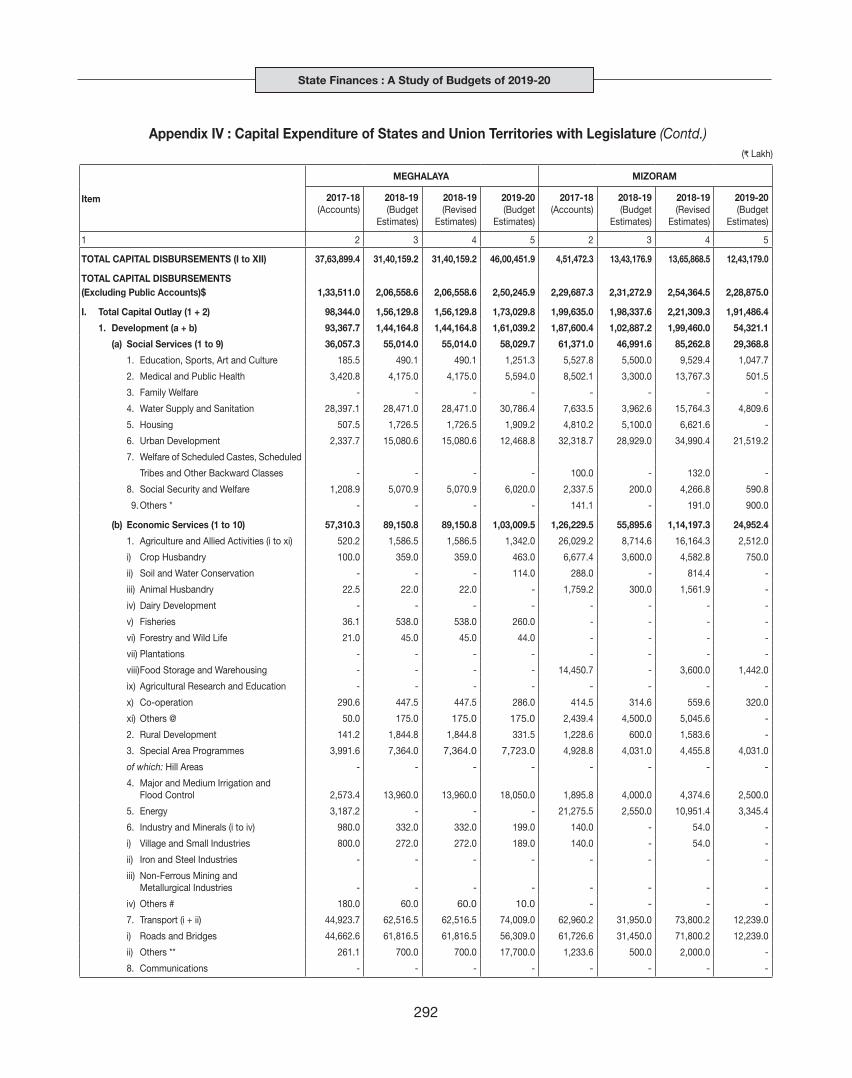
State Finances : A Study of Budgets of 2019-20
292
Appendix IV : Capital Expenditure of States and Union Territories with Legislature (Contd.)(₹ Lakh)
Item
MEGHALAyA MIzORAM
2017-18(Accounts)
2018-19(Budget
Estimates)
2018-19(Revised
Estimates)
2019-20(Budget
Estimates)
2017-18(Accounts)
2018-19(Budget
Estimates)
2018-19(Revised
Estimates)
2019-20(Budget
Estimates)
1 2 3 4 5 2 3 4 5
TOTAL CAPITAL DISBURSEMENTS (I to XII) 37,63,899.4 31,40,159.2 31,40,159.2 46,00,451.9 4,51,472.3 13,43,176.9 13,65,868.5 12,43,179.0
TOTAL CAPITAL DISBURSEMENTS (Excluding Public Accounts)$ 1,33,511.0 2,06,558.6 2,06,558.6 2,50,245.9 2,29,687.3 2,31,272.9 2,54,364.5 2,28,875.0
I. Total Capital Outlay (1 + 2) 98,344.0 1,56,129.8 1,56,129.8 1,73,029.8 1,99,635.0 1,98,337.6 2,21,309.3 1,91,486.4
1. Development (a + b) 93,367.7 1,44,164.8 1,44,164.8 1,61,039.2 1,87,600.4 1,02,887.2 1,99,460.0 54,321.1
(a) Social Services (1 to 9) 36,057.3 55,014.0 55,014.0 58,029.7 61,371.0 46,991.6 85,262.8 29,368.8
1. Education, Sports, Art and Culture 185.5 490.1 490.1 1,251.3 5,527.8 5,500.0 9,529.4 1,047.7
2. Medical and Public Health 3,420.8 4,175.0 4,175.0 5,594.0 8,502.1 3,300.0 13,767.3 501.5
3. Family Welfare - - - - - - - -
4. Water Supply and Sanitation 28,397.1 28,471.0 28,471.0 30,786.4 7,633.5 3,962.6 15,764.3 4,809.6
5. Housing 507.5 1,726.5 1,726.5 1,909.2 4,810.2 5,100.0 6,621.6 -
6. Urban Development 2,337.7 15,080.6 15,080.6 12,468.8 32,318.7 28,929.0 34,990.4 21,519.2
7. Welfare of Scheduled Castes, Scheduled
Tribes and Other Backward Classes - - - - 100.0 - 132.0 -
8. Social Security and Welfare 1,208.9 5,070.9 5,070.9 6,020.0 2,337.5 200.0 4,266.8 590.8
9. Others * - - - - 141.1 - 191.0 900.0
(b) Economic Services (1 to 10) 57,310.3 89,150.8 89,150.8 1,03,009.5 1,26,229.5 55,895.6 1,14,197.3 24,952.4
1. Agriculture and Allied Activities (i to xi) 520.2 1,586.5 1,586.5 1,342.0 26,029.2 8,714.6 16,164.3 2,512.0
i) Crop Husbandry 100.0 359.0 359.0 463.0 6,677.4 3,600.0 4,582.8 750.0
ii) Soil and Water Conservation - - - 114.0 288.0 - 814.4 -
iii) Animal Husbandry 22.5 22.0 22.0 - 1,759.2 300.0 1,561.9 -
iv) Dairy Development - - - - - - - -
v) Fisheries 36.1 538.0 538.0 260.0 - - - -
vi) Forestry and Wild Life 21.0 45.0 45.0 44.0 - - - -
vii) Plantations - - - - - - - -
viii) Food Storage and Warehousing - - - - 14,450.7 - 3,600.0 1,442.0
ix) Agricultural Research and Education - - - - - - - -
x) Co-operation 290.6 447.5 447.5 286.0 414.5 314.6 559.6 320.0
xi) Others @ 50.0 175.0 175.0 175.0 2,439.4 4,500.0 5,045.6 -
2. Rural Development 141.2 1,844.8 1,844.8 331.5 1,228.6 600.0 1,583.6 -
3. Special Area Programmes 3,991.6 7,364.0 7,364.0 7,723.0 4,928.8 4,031.0 4,455.8 4,031.0
of which: Hill Areas - - - - - - - -
4. Major and Medium Irrigation and Flood Control 2,573.4 13,960.0 13,960.0 18,050.0 1,895.8 4,000.0 4,374.6 2,500.0
5. Energy 3,187.2 - - - 21,275.5 2,550.0 10,951.4 3,345.4
6. Industry and Minerals (i to iv) 980.0 332.0 332.0 199.0 140.0 - 54.0 -
i) Village and Small Industries 800.0 272.0 272.0 189.0 140.0 - 54.0 -
ii) Iron and Steel Industries - - - - - - - -
iii) Non-Ferrous Mining and Metallurgical Industries - - - - - - - -
iv) Others # 180.0 60.0 60.0 10.0 - - - -
7. Transport (i + ii) 44,923.7 62,516.5 62,516.5 74,009.0 62,960.2 31,950.0 73,800.2 12,239.0
i) Roads and Bridges 44,662.6 61,816.5 61,816.5 56,309.0 61,726.6 31,450.0 71,800.2 12,239.0
ii) Others ** 261.1 700.0 700.0 17,700.0 1,233.6 500.0 2,000.0 -
8. Communications - - - - - - - -

Appendix IV
293
Item
MEGHALAyA MIzORAM
2017-18(Accounts)
2018-19(Budget
Estimates)
2018-19(Revised
Estimates)
2019-20(Budget
Estimates)
2017-18(Accounts)
2018-19(Budget
Estimates)
2018-19(Revised
Estimates)
2019-20(Budget
Estimates)
1 2 3 4 5 2 3 4 5
9. Science, Technology and Environment - - - - - - - -
10. General Economic Services (i + ii) 993.0 1,547.0 1,547.0 1,355.0 7,771.5 4,050.0 2,813.4 325.0
i) Tourism 993.0 1,547.0 1,547.0 1,355.0 7,661.5 550.0 2,288.4 -
ii) Others @@ - - - - 110.0 3,500.0 525.0 325.0
2. Non-Development (General Services) 4,976.4 11,965.0 11,965.0 11,990.6 12,034.5 95,450.4 21,849.3 1,37,165.3
II. Discharge of Internal Debt (1 to 8) 30,928.0 55,138.2 55,138.2 56,993.0 45,093.3 26,098.2 26,098.2 24,821.6
1. Market Loans 19,568.7 25,940.0 25,940.0 27,354.0 14,686.5 15,618.0 15,618.0 15,532.4
2. Loans from LIC - - - - 2,229.7 2,317.4 2,317.4 2,257.2
3. Loans from SBI and other Banks - - - - - - - -
4. Loans from NABARD 6,209.9 6,600.0 6,600.0 6,600.0 4,373.0 3,568.0 3,568.0 3,800.5
5. Loans from National Co-operative
Development Corporation 10.1 7.2 7.2 3.0 189.6 650.0 650.0 637.0
6. WMA from RBI - 17,500.0 17,500.0 17,500.0 21,739.0 3.0 3.0 3.0
7. Special Securities issued to NSSF 4,538.3 4,965.0 4,965.0 5,500.0 1,501.8 1,092.4 1,092.4 1,166.8
8. Others 601.1 126.0 126.0 36.0 373.8 2,849.4 2,849.4 1,424.8
of which: Land Compensation Bonds - - - - - - - -
III. Repayment of Loans to the Centre (1 to 7) 2,033.6 2,079.1 2,079.1 2,127.0 2,202.6 2,300.0 2,300.0 2,400.0
1. State Plan Schemes - - - - 2,202.6 2,300.0 2,300.0 2,400.0
of which: Advance release of Plan
Assistance for Natural Calamities - - - - - - - -
2. Central Plan Schemes - - - - - - - -
3. Centrally Sponsored Schemes 2.5 1.9 1.9 1.9 - - - -
4. Non-Plan (i + ii) - - - - - - - -
i) Relief for Natural Calamities - - - - - - - -
ii) Others - - - - - - - -
5. Ways and Means Advances from Centre - - - - - - - -
6. Loans for Special Schemes - - - - - - - -
7. Others 2,031.1 2,077.2 2,077.2 2,125.1 - - - -
IV. Loans and Advances by State Governments (1 + 2)
2,205.4 10,711.5 10,711.5 35,596.1 4,495.5 4,540.0 4,660.0 10,170.0
1. Development Purposes (a + b) 614.2 7,211.5 7,211.5 31,746.1 2,651.3 4,040.0 4,072.0 9,670.0
a) Social Services ( 1 to 7) - 18.0 18.0 327.3 2,196.7 4,040.0 4,072.0 9,670.0
1. Education, Sports, Art and Culture - - - - - - - -
2. Medical and Public Health - - - - - - - -
3. Family Welfare - - - - - - - -
4. Water Supply and Sanitation - - - - - - - -
5. Housing - - - - 0.9 - - -
6. Government Servants (Housing) - 18.0 18.0 18.0 2,195.8 4,040.0 4,072.0 9,670.0
7. Others - - - 309.3 - - - -
b) Economic Services (1 to 10) 614.2 7,193.5 7,193.5 31,418.8 454.6 - - -
1. Crop Husbandry - - - - - - - -
2. Soil and Water Conservation - - - - - - - -
3. Food Storage and Warehousing - - - - - - - -
4. Co-operation 4.0 200.0 200.0 - 454.6 - - -
5. Major and Medium Irrigation, etc. - - - - - - - -
6. Power Projects 108.3 6,993.5 6,993.5 31,416.8 - - - -
Appendix IV : Capital Expenditure of States and Union Territories with Legislature (Contd.)(₹ Lakh)

State Finances : A Study of Budgets of 2019-20
294
Item
MEGHALAyA MIzORAM
2017-18(Accounts)
2018-19(Budget
Estimates)
2018-19(Revised
Estimates)
2019-20(Budget
Estimates)
2017-18(Accounts)
2018-19(Budget
Estimates)
2018-19(Revised
Estimates)
2019-20(Budget
Estimates)
1 2 3 4 5 2 3 4 5
7. Village and Small Industries - - - - - - - -
8. Other Industries and Minerals 501.9 - - 2.0 - - - -
9. Rural Development - - - - - - - -
10. Others - - - - - - - -
2. Non-Development Purposes (a + b) 1,591.2 3,500.0 3,500.0 3,850.0 1,844.2 500.0 588.0 500.0
a) Government Servants (other than Housing) 1,591.2 3,500.0 3,500.0 3,850.0 1,844.2 500.0 588.0 500.0
b) Miscellaneous - - - - - - - -
V. Inter-State Settlement - - - - - - - -
VI. Contingency Fund 20,500.0 30,500.0 30,500.0 30,500.0 - - - -
VII. State Provident Funds, etc. (1 + 2) 16,143.9 16,456.0 16,456.0 24,292.0 1,02,629.6 84,700.0 84,700.0 1,11,800.0
1. State Provident Funds 16,143.9 16,456.0 16,456.0 24,292.0 1,01,039.8 83,000.0 83,000.0 1,10,000.0
2. Others - - - - 1,589.8 1,700.0 1,700.0 1,800.0
VIII. Reserve Funds (1 to 4) 10,851.0 7,998.7 7,998.7 8,470.3 6,794.5 6,600.0 6,200.0 7,800.0
1. Depreciation/Renewal Reserve Funds - - - - - - - -
2. Sinking Funds 4,638.0 4,491.8 4,491.8 5,063.3 4,000.0 4,000.0 3,600.0 3,700.0
3. Famine Relief Fund - - - - - - - -
4. Others 6,213.0 3,506.9 3,506.9 3,407.0 2,794.5 2,600.0 2,600.0 4,100.0
IX. Deposits and Advances (1 to 4) 1,89,124.9 1,56,318.8 1,56,318.8 1,00,818.3 90,621.9 48,000.0 48,000.0 43,000.0
1. Civil Deposits 1,82,293.9 1,42,954.8 1,42,954.8 90,992.7 90,621.9 45,000.0 45,000.0 40,000.0
2. Deposits of Local Funds - - - - - - - -
3. Civil Advances 3,803.6 7,000.0 7,000.0 4,136.3 - 3,000.0 3,000.0 3,000.0
4. Others 3,027.4 6,364.0 6,364.0 5,689.3 - - - -
X. Suspense and Miscellaneous (1 to 4) 31,43,703.1 24,66,241.0 24,66,241.0 38,77,642.8 - 8,02,501.0 8,02,501.0 7,01,601.0
1. Suspense 729.7 614.2 614.2 775.8 - - - -
2. Cash Balance Investment Accounts 31,42,850.0 24,65,526.8 24,65,526.8 38,76,867.0 - 8,00,000.0 8,00,000.0 7,00,000.0
3. Deposits with RBI - - - - - 1,000.0 1,000.0 1,000.0
4. Others 123.4 100.0 100.0 - - 1,501.0 1,501.0 601.0
XI. Appropriation to Contingency Fund 10,000.0 - - - - - - -
XII. Remittances 2,40,065.6 2,38,586.1 2,38,586.1 2,90,982.6 - 1,70,100.0 1,70,100.0 1,50,100.0
A. Surplus (+)/Deficit (-) on Revenue Account 85,080.0 49,521.5 49,521.5 73,848.4 1,69,943.0 1,72,980.8 53,138.0 1,44,346.9
B. Surplus (+)/Deficit(-) on Capital Account -47,424.6 -98,873.4 -98,873.4 -85,987.5 -1,46,186.9 -1,30,131.2 -1,53,219.8 -1,52,197.3
C. Overall Surplus (+)/Deficit (-) (A+B) 37,655.3 -49,351.9 -49,351.9 -12,139.1 23,756.2 42,849.6 -1,00,081.8 -7,850.4
D. Financing of Surplus (+)/Deficit (-) (C = i to iii) 37,655.4 -49,351.9 -49,351.9 -12,139.1 23,756.4 42,849.6 -1,00,081.8 -7,850.0
i. Increase (+)/Decrease (-) in Cash Balances 6,513.4 -13,924.7 -13,924.7 -10,720.6 25,507.2 42,849.6 -1,00,081.8 -7,850.0
a) Opening Balance -2,983.0 -16,736.0 3,530.4 -10,394.3 1,06,632.4 81,818.4 1,32,139.6 32,057.8
b) Closing Balance 3,530.4 -30,660.6 -10,394.3 -21,114.9 1,32,139.6 1,24,668.0 32,057.8 24,207.8
ii. Withdrawals from (-)/Additions to (+) Cash Balance Investment Account (net) 31,142.0 -35,427.3 -35,427.3 -1,418.6 - - - -
iii. Increase (-)/Decrease (+) in Ways and Means Advances and Overdrafts from RBI (net) - - - - -1,750.7 - - -
Appendix IV : Capital Expenditure of States and Union Territories with Legislature (Contd.)(₹ Lakh)

Appendix IV
295
Appendix IV : Capital Expenditure of States and Union Territories with Legislature (Contd.)(₹ Lakh)
Item
NAGALAND ODISHA
2017-18(Accounts)
2018-19(Budget
Estimates)
2018-19(Revised
Estimates)
2019-20(Budget
Estimates)
2017-18(Accounts)
2018-19(Budget
Estimates)
2018-19(Revised
Estimates)
2019-20(Budget
Estimates)
1 2 3 4 5 2 3 4 5
TOTAL CAPITAL DISBURSEMENTS (I to XII) 15,07,832.8 14,91,551.7 14,32,237.3 14,04,945.3 3,91,73,774.0 2,76,41,640.3 2,74,14,175.6 4,22,67,836.3
TOTAL CAPITAL DISBURSEMENTS (Excluding Public Accounts)$ 1,82,104.7 1,99,256.7 2,52,735.3 2,14,650.3 25,67,417.6 29,80,800.0 28,79,714.9 30,26,209.2
I. Total Capital Outlay (1 + 2) 1,27,484.6 1,34,108.8 1,86,075.7 1,35,911.4 21,10,854.7 24,56,689.9 23,65,524.0 24,47,319.8
1. Development (a + b) 1,00,775.0 76,108.8 1,44,456.4 1,01,965.1 20,64,398.1 23,57,576.2 22,85,679.8 23,65,339.3
(a) Social Services (1 to 9) 48,568.5 45,116.1 52,737.4 49,533.7 4,20,095.2 4,55,153.9 3,74,328.3 6,36,250.5
1. Education, Sports, Art and Culture 3,040.7 10,600.0 4,399.8 6,805.9 74,557.5 84,760.1 77,038.7 77,034.0
2. Medical and Public Health 7,079.8 8,540.0 9,438.8 9,070.0 77,406.5 86,500.0 57,500.0 89,500.0
3. Family Welfare - - - - - - - -
4. Water Supply and Sanitation 12,057.2 10,801.2 14,324.4 14,500.0 1,57,975.5 1,77,299.5 1,44,499.5 3,42,260.0
5. Housing 3,431.9 - 4,690.7 2,473.0 29,473.9 43,161.8 33,714.2 45,700.3
6. Urban Development 22,025.6 13,374.9 17,186.8 15,097.8 13,162.2 12,440.0 11,340.1 12,680.1
7. Welfare of Scheduled Castes, Scheduled
Tribes and Other Backward Classes - - - - 52,735.6 40,587.5 39,894.5 48,363.8
8. Social Security and Welfare 469.8 1,000.0 2,396.9 1,428.5 6,050.0 2,105.0 2,105.0 2,412.3
9. Others * 463.5 800.0 300.0 158.6 8,734.0 8,300.0 8,236.3 18,300.1
(b) Economic Services (1 to 10) 52,206.5 30,992.7 91,719.0 52,431.4 16,44,302.9 19,02,422.3 19,11,351.5 17,29,088.9
1. Agriculture and Allied Activities (i to xi) 2,957.3 700.0 1,371.5 2,100.0 12,483.4 22,287.4 21,875.1 26,018.0
i) Crop Husbandry 1,437.1 - 342.0 500.0 4,160.0 5,920.3 5,920.3 5,491.0
ii) Soil and Water Conservation 17.7 - 120.0 - - - - -
iii) Animal Husbandry 17.3 - 25.0 400.0 3,159.0 3,054.3 2,175.3 2,822.6
iv) Dairy Development - - - - - 5,252.3 6,779.3 7,024.4
v) Fisheries 150.0 - 284.5 100.0 -606.7 2,000.0 2,000.0 5,200.0
vi) Forestry and Wild Life 430.0 - - 100.0 289.0 400.0 400.0 500.0
vii) Plantations - - - - - - - -
viii) Food Storage and Warehousing 905.2 700.0 600.0 1,000.0 - 160.0 160.0 80.0
ix) Agricultural Research and Education - - - - - - - -
x) Co-operation - - - - 5,182.1 5,200.6 4,140.3 4,600.0
xi) Others @ - - - - 300.0 300.0 300.0 300.0
2. Rural Development - - 105.0 100.0 - 1,25,000.0 1,25,000.0 40,000.0
3. Special Area Programmes 20,927.1 5,966.2 27,969.8 20,201.0 14,850.0 14,850.0 21,850.0 14,850.0
of which: Hill Areas - - - - - - - -
4. Major and Medium Irrigation and Flood Control 1,746.1 18,530.1 2,764.2 2,600.0 6,84,106.4 8,26,778.5 7,60,119.4 7,40,583.3
5. Energy 2,169.8 - 9,569.2 2,057.9 2,04,933.1 1,67,473.8 1,72,100.0 1,96,071.0
6. Industry and Minerals (i to iv) 1,587.6 - 362.0 200.0 -201.5 300.0 227.4 545.4
i) Village and Small Industries 291.9 - 262.0 100.0 -294.8 - - -
ii) Iron and Steel Industries - - - - 93.3 300.0 227.4 545.4
iii) Non-Ferrous Mining and Metallurgical Industries 1,295.7 - 100.0 100.0 - - - -
iv) Others # - - - - - - - -
7. Transport (i + ii) 22,137.6 5,796.5 48,702.3 24,506.5 7,14,819.0 7,26,896.6 7,95,481.7 6,93,550.1
i) Roads and Bridges 21,053.6 5,796.5 47,433.9 23,579.9 6,82,483.5 6,72,536.6 7,78,470.0 6,35,560.1
ii) Others ** 1,084.1 - 1,268.3 926.6 32,335.5 54,360.0 17,011.7 57,990.0
8. Communications - - - - - - - -

State Finances : A Study of Budgets of 2019-20
296
Item
NAGALAND ODISHA
2017-18(Accounts)
2018-19(Budget
Estimates)
2018-19(Revised
Estimates)
2019-20(Budget
Estimates)
2017-18(Accounts)
2018-19(Budget
Estimates)
2018-19(Revised
Estimates)
2019-20(Budget
Estimates)
1 2 3 4 5 2 3 4 5
9. Science, Technology and Environment 88.5 - 394.0 316.0 - - - -
10. General Economic Services (i + ii) 592.6 - 481.1 350.0 13,312.5 18,835.9 14,697.9 17,471.1
i) Tourism 302.6 - 191.1 100.0 8,730.0 12,600.0 8,462.0 12,350.0
ii) Others @@ 290.0 - 290.0 250.0 4,582.5 6,235.9 6,235.9 5,121.1
2. Non-Development (General Services) 26,709.6 58,000.0 41,619.4 33,946.3 46,456.7 99,113.6 79,844.2 81,980.4
II. Discharge of Internal Debt (1 to 8) 4,43,029.4 4,82,936.5 2,84,447.2 3,96,514.5 1,98,243.1 3,35,590.0 3,35,590.0 3,64,700.0
1. Market Loans 36,905.2 46,696.0 46,696.0 57,741.0 0.2 1,00,005.3 1,00,005.3 1,00,007.7
2. Loans from LIC 365.1 450.5 325.0 325.0 41.4 33.3 33.3 24.6
3. Loans from SBI and other Banks - - - - - - - -
4. Loans from NABARD 4,846.5 5,269.9 5,075.3 5,548.4 1,15,500.2 1,32,334.9 1,32,334.9 1,65,783.6
5. Loans from National Co-operative
Development Corporation 480.9 275.9 138.3 250.0 385.4 403.4 403.4 404.0
6. WMA from RBI 3,90,599.7 4,20,000.0 2,20,000.0 3,20,000.0 - - - -
7. Special Securities issued to NSSF 1,265.9 1,400.0 1,350.0 1,325.0 82,048.5 1,02,588.4 1,02,588.4 98,253.5
8. Others 8,566.2 8,844.3 10,862.7 11,325.1 267.3 224.7 224.7 226.5
of which: Land Compensation Bonds - - - - - - - -
III. Repayment of Loans to the Centre (1 to 7) 2,171.7 2,171.2 2,172.2 2,184.3 70,777.9 80,110.0 80,110.1 1,06,000.0
1. State Plan Schemes 2,030.3 2,030.6 2,031.9 2,044.0 70,554.5 79,890.9 79,890.9 1,05,758.8
of which: Advance release of Plan
Assistance for Natural Calamities - - - - - - - -
2. Central Plan Schemes - - 73.6 73.6 - - - -
3. Centrally Sponsored Schemes 43.0 43.0 43.0 43.0 - - - 45.6
4. Non-Plan (i + ii) 74.3 73.6 - - 223.4 218.8 218.8 195.2
i) Relief for Natural Calamities - - - - - - - -
ii) Others 74.3 73.6 - - 223.4 218.8 218.8 195.2
5. Ways and Means Advances from Centre - - - - - - - -
6. Loans for Special Schemes 24.1 24.1 23.7 23.7 - - - -
7. Others - - - - - 0.3 0.3 0.3
IV. Loans and Advances by State Governments (1 + 2)
18.7 40.2 40.2 40.2 1,87,542.0 1,08,410.2 98,491.0 1,08,189.4
1. Development Purposes (a + b) - 21.5 21.5 21.5 1,85,032.4 1,01,410.1 91,490.9 1,02,499.6
a) Social Services ( 1 to 7) - 21.5 21.5 21.5 1,45,485.4 77,000.0 77,000.0 77,000.0
1. Education, Sports, Art and Culture - - - - - - - -
2. Medical and Public Health - - - - - - - -
3. Family Welfare - - - - - - - -
4. Water Supply and Sanitation - - - - - - - -
5. Housing - - - - - - - -
6. Government Servants (Housing) - 21.5 21.5 21.5 5,485.4 7,000.0 7,000.0 7,000.0
7. Others - - - - 1,40,000.0 70,000.0 70,000.0 70,000.0
b) Economic Services (1 to 10) - - - - 39,547.0 24,410.1 14,490.9 25,499.5
1. Crop Husbandry - - - - 16,000.0 - - -
2. Soil and Water Conservation - - - - - - - -
3. Food Storage and Warehousing - - - - - - - -
4. Co-operation - - - - 1,000.0 10,000.1 10,000.1 1,529.5
5. Major and Medium Irrigation, etc. - - - - - - - -
6. Power Projects - - - - 22,547.0 14,400.0 4,400.0 23,970.0
Appendix IV : Capital Expenditure of States and Union Territories with Legislature (Contd.)(₹ Lakh)

Appendix IV
297
Item
NAGALAND ODISHA
2017-18(Accounts)
2018-19(Budget
Estimates)
2018-19(Revised
Estimates)
2019-20(Budget
Estimates)
2017-18(Accounts)
2018-19(Budget
Estimates)
2018-19(Revised
Estimates)
2019-20(Budget
Estimates)
1 2 3 4 5 2 3 4 5
7. Village and Small Industries - - - - - 10.0 10.0 -
8. Other Industries and Minerals - - - - - - - -
9. Rural Development - - - - - - - -
10. Others - - - - - - 80.8 -
2. Non-Development Purposes (a + b) 18.7 18.7 18.7 18.7 2,509.6 7,000.0 7,000.0 5,689.9
a) Government Servants (other than Housing) 18.7 18.7 18.7 18.7 2,509.6 4,500.0 4,500.0 4,500.0
b) Miscellaneous - - - - - 2,500.0 2,500.0 1,189.9
V. Inter-State Settlement - - - - - - - -
VI. Contingency Fund - - - - 40,000.0 40,000.0 40,000.0 40,000.0
VII. State Provident Funds, etc. (1 + 2) 29,243.8 30,685.0 40,780.0 28,685.0 3,23,436.1 2,91,315.6 2,91,315.6 3,91,315.5
1. State Provident Funds 28,455.8 30,000.0 40,000.0 28,000.0 3,23,436.1 2,91,275.1 2,91,275.1 3,91,275.0
2. Others 788.0 685.0 780.0 685.0 - 40.5 40.5 40.5
VIII. Reserve Funds (1 to 4) 26,101.0 23,600.0 23,600.0 23,600.0 3,91,152.9 3,36,507.3 3,36,507.3 4,30,008.0
1. Depreciation/Renewal Reserve Funds - - - - - 0.1 0.1 0.1
2. Sinking Funds 22,400.0 22,400.0 22,400.0 22,400.0 1.8 3.0 3.0 3.0
3. Famine Relief Fund - - - - - - - -
4. Others 3,701.0 1,200.0 1,200.0 1,200.0 3,91,151.1 3,36,504.2 3,36,504.2 4,30,004.9
IX. Deposits and Advances (1 to 4) 59,877.4 13,000.0 90,112.0 13,000.0 26,45,977.3 20,51,629.7 19,34,149.7 25,57,969.4
1. Civil Deposits 52,808.7 1,000.0 78,112.0 1,000.0 15,57,598.1 5,18,547.7 5,18,547.7 5,64,987.4
2. Deposits of Local Funds - - - - 1,18,873.4 1,95,756.0 1,95,756.0 1,95,756.0
3. Civil Advances 1,399.5 1,000.0 1,000.0 1,000.0 13,847.7 25,265.0 25,265.0 25,265.0
4. Others 5,669.1 11,000.0 11,000.0 11,000.0 9,55,658.1 13,12,061.0 11,94,581.0 17,71,961.0
X. Suspense and Miscellaneous (1 to 4) 6,03,091.0 6,55,000.0 6,55,000.0 6,55,000.0 3,09,24,523.2 1,99,66,892.1 1,99,57,992.5 3,35,37,431.5
1. Suspense 2,930.0 5,000.0 5,000.0 5,000.0 -2,264.7 584.1 584.1 2,146.1
2. Cash Balance Investment Accounts 5,42,303.0 6,00,000.0 6,00,000.0 6,00,000.0 3,09,22,212.3 1,99,51,136.0 1,99,42,236.4 3,35,19,903.4
3. Deposits with RBI - - - - - 1.0 1.0 1.0
4. Others 57,858.0 50,000.0 50,000.0 50,000.0 4,575.6 15,171.0 15,171.0 15,381.0
XI. Appropriation to Contingency Fund - - - - - - - -
XII. Remittances 2,16,815.3 1,50,010.0 1,50,010.0 1,50,010.0 22,81,266.8 19,74,495.5 19,74,495.5 22,84,902.6
A. Surplus (+)/Deficit (-) on Revenue Account 82,786.3 47,389.3 52,588.2 50,737.0 13,36,698.8 9,98,000.0 10,55,495.0 6,52,809.0
B. Surplus (+)/Deficit(-) on Capital Account -68,802.0 -49,683.7 -2,18,160.8 -45,767.1 2,88,126.3 -26,96,251.3 -27,62,646.0 -3,78,205.6
C. Overall Surplus (+)/Deficit (-) (A+B) 13,984.3 -2,294.4 -1,65,572.6 4,969.9 16,24,825.1 -16,98,251.3 -17,07,151.0 2,74,603.4
D. Financing of Surplus (+)/Deficit (-) (C = i to iii) 13,984.3 -2,294.4 -1,65,572.6 4,969.9 16,24,825.1 -16,98,251.3 -17,07,151.0 2,74,603.4
i. Increase (+)/Decrease (-) in Cash Balances 11,209.3 -2,294.4 -1,65,572.6 4,969.9 23,838.0 - - -
a) Opening Balance 22,692.0 -1,60,772.9 -595.0 -1,66,167.6 31,864.7 31,864.7 55,702.7 55,702.7
b) Closing Balance 33,901.3 -1,63,067.3 -1,66,167.6 -1,61,197.7 55,702.7 31,864.7 55,702.7 55,702.7
ii. Withdrawals from (-)/Additions to (+) Cash Balance Investment Account (net) 2,775.0 - - - 16,00,987.1 -16,98,251.3 -17,07,151.0 2,74,603.4
iii. Increase (-)/Decrease (+) in Ways and Means Advances and Overdrafts from RBI (net) - - - - - - - -
Appendix IV : Capital Expenditure of States and Union Territories with Legislature (Contd.)(₹ Lakh)

State Finances : A Study of Budgets of 2019-20
298
Appendix IV : Capital Expenditure of States and Union Territories with Legislature (Contd.)(₹ Lakh)
Item
PUNJAB RAJASTHAN
2017-18(Accounts)
2018-19(Budget
Estimates)
2018-19(Revised
Estimates)
2019-20(Budget
Estimates)
2017-18(Accounts)
2018-19(Budget
Estimates)
2018-19(Revised
Estimates)
2019-20(Budget
Estimates)
1 2 3 4 5 2 3 4 5
TOTAL CAPITAL DISBURSEMENTS (I to XII) 91,80,867.9 68,41,813.9 77,43,004.0 1,00,71,515.5 3,57,64,783.3 3,93,94,569.8 4,03,09,249.2 3,92,64,693.4
TOTAL CAPITAL DISBURSEMENTS (Excluding Public Accounts)$ 9,78,917.8 14,97,624.0 14,23,579.4 35,35,100.5 33,63,095.5 43,15,630.5 39,24,997.1 40,50,800.4
I. Total Capital Outlay (1 + 2) 2,35,208.3 6,38,531.8 4,87,156.9 22,84,205.8 20,62,328.4 25,74,030.2 21,06,158.7 19,47,233.7
1. Development (a + b) 2,17,241.4 6,10,718.1 4,57,791.2 22,39,775.2 20,09,614.2 25,00,567.3 20,36,995.6 18,67,919.9
(a) Social Services (1 to 9) 91,654.9 3,37,763.5 2,43,408.8 3,20,387.3 7,22,137.5 9,40,878.1 7,63,372.1 8,18,871.6
1. Education, Sports, Art and Culture 6,967.1 54,932.6 48,205.5 46,498.4 51,461.9 83,196.4 90,063.2 80,808.1
2. Medical and Public Health 139.3 36,060.0 21,030.0 35,984.3 65,753.6 97,453.9 58,148.9 78,975.5
3. Family Welfare - - - - -9.3 - - -
4. Water Supply and Sanitation 54,162.3 91,511.0 41,012.0 1,03,454.0 4,59,043.6 5,50,855.6 4,28,846.9 4,84,273.0
5. Housing -373.4 60.7 60.7 21.6 2,037.5 2,793.1 2,273.0 9,498.8
6. Urban Development 28,468.0 1,40,499.1 1,25,798.1 1,18,709.8 91,559.2 1,46,103.3 1,37,601.8 1,15,518.5
7. Welfare of Scheduled Castes, Scheduled
Tribes and Other Backward Classes 515.3 6,455.0 4,552.0 6,323.0 27,744.2 33,528.2 30,380.6 28,266.0
8. Social Security and Welfare - 5,221.0 1,082.5 3,929.1 868.7 6,773.3 4,867.3 5,253.3
9. Others * 1,776.3 3,024.1 1,668.0 5,467.1 23,678.3 20,174.3 11,190.4 16,278.4
(b) Economic Services (1 to 10) 1,25,586.5 2,72,954.6 2,14,382.4 19,19,387.9 12,87,476.6 15,59,689.2 12,73,623.5 10,49,048.3
1. Agriculture and Allied Activities (i to xi) 10,837.0 1,192.3 12,170.7 2,377.6 39,100.7 60,157.8 56,217.2 34,175.9
i) Crop Husbandry - 75.0 - 1,462.0 18,151.4 41,045.6 16,111.7 16,596.0
ii) Soil and Water Conservation - - - - - - - -
iii) Animal Husbandry 402.0 992.3 1,170.7 914.6 2,902.8 2,560.1 3,377.2 3,790.1
iv) Dairy Development - - - - - - - -
v) Fisheries - 125.0 - - 294.2 103.0 227.5 108.4
vi) Forestry and Wild Life - - - - 16,058.0 15,512.4 10,675.4 12,800.8
vii) Plantations - - - - - - - -
viii) Food Storage and Warehousing - - - - - - - -
ix) Agricultural Research and Education - - - - - - - -
x) Co-operation 10,435.0 - 11,000.0 1.0 1,694.2 936.7 25,825.4 880.6
xi) Others @ - - - - - - - -
2. Rural Development 6,742.0 29,185.3 23,370.3 86,931.0 65,300.0 59,700.0 36,300.0 46,603.5
3. Special Area Programmes - - - - 38,627.7 44,030.0 34,164.3 20,799.0
of which: Hill Areas - - - - - - - -
4. Major and Medium Irrigation and Flood Control 31,512.9 83,846.0 60,461.5 95,081.1 2,18,838.7 3,04,098.8 2,48,773.7 2,85,877.5
5. Energy 225.0 5,290.0 5,290.0 15,73,891.0 3,91,622.0 4,59,300.1 3,96,915.1 2,76,774.1
6. Industry and Minerals (i to iv) - 1,713.6 406.2 1,229.2 1,316.2 48,727.0 5,590.0 13,580.2
i) Village and Small Industries - 1,713.6 406.2 1,229.2 176.2 100.0 100.0 100.0
ii) Iron and Steel Industries - - - - - - - -
iii) Non-Ferrous Mining and Metallurgical Industries
- - - - 287.0 165.9 - 50.0
iv) Others # - - - - 853.0 48,461.1 5,490.0 13,430.1
7. Transport (i + ii) 67,454.9 1,04,319.5 91,219.6 1,11,757.0 4,53,932.0 5,25,993.1 4,26,933.6 3,49,832.6
i) Roads and Bridges 67,341.0 1,04,118.5 90,611.6 1,11,432.0 4,53,932.0 5,25,993.0 4,26,933.6 3,49,832.5
ii) Others ** 113.8 201.0 608.0 325.0 - 0.1 0.1 0.1
8. Communications - - - - - - - -

Appendix IV
299
Item
PUNJAB RAJASTHAN
2017-18(Accounts)
2018-19(Budget
Estimates)
2018-19(Revised
Estimates)
2019-20(Budget
Estimates)
2017-18(Accounts)
2018-19(Budget
Estimates)
2018-19(Revised
Estimates)
2019-20(Budget
Estimates)
1 2 3 4 5 2 3 4 5
9. Science, Technology and Environment - 2,253.3 588.3 439.3 303.9 641.0 276.0 450.0
10. General Economic Services (i + ii) 8,814.7 45,154.7 20,875.9 47,681.7 78,435.5 57,041.5 68,453.4 20,955.6
i) Tourism 5,014.4 18,411.0 9,592.2 22,282.5 3,092.1 7,592.1 3,427.2 6,044.1
ii) Others @@ 3,800.3 26,743.7 11,283.7 25,399.1 75,343.4 49,449.3 65,026.2 14,911.6
2. Non-Development (General Services) 17,966.9 27,813.8 29,365.7 44,430.7 52,714.2 73,463.0 69,163.2 79,313.8
II. Discharge of Internal Debt (1 to 8) 34,63,448.9 35,73,404.0 38,24,726.9 44,18,517.4 11,04,038.5 16,13,698.3 16,13,701.4 19,18,132.5
1. Market Loans 4,12,127.6 5,06,119.0 5,06,119.0 8,88,500.0 3,98,695.8 6,35,580.1 6,35,580.1 7,50,000.1
2. Loans from LIC 2.4 - - - 420.8 375.2 375.2 318.6
3. Loans from SBI and other Banks 80,984.4 87,012.0 86,173.6 94,470.0 - - - -
4. Loans from NABARD 41,422.9 43,625.5 46,086.8 48,600.0 1,32,156.8 1,53,927.7 1,53,896.7 1,70,690.7
5. Loans from National Co-operative
Development Corporation - - - - 3,643.1 3,722.1 3,756.2 4,131.8
6. WMA from RBI 27,48,268.3 27,50,000.0 30,00,000.0 32,00,000.0 - 0.0 0.0 1,41,640.0
7. Special Securities issued to NSSF 1,74,242.0 1,80,147.5 1,80,147.5 1,84,147.4 1,53,576.0 1,55,996.0 1,55,996.0 1,58,476.0
8. Others 6,401.4 6,500.0 6,200.0 2,800.0 4,15,545.9 6,64,097.2 6,64,097.2 6,92,875.4
of which: Land Compensation Bonds - - - - 4,15,017.6 6,63,574.9 6,63,574.9 6,90,574.9
III. Repayment of Loans to the Centre (1 to 7) 33,509.0 37,595.0 37,605.0 45,474.2 63,327.2 69,871.3 78,270.5 86,220.3
1. State Plan Schemes 33,062.3 37,172.6 37,172.6 45,172.6 60,658.1 50,335.6 50,400.0 50,626.8
of which: Advance release of Plan
Assistance for Natural Calamities - - - - - - - -
2. Central Plan Schemes - - - - - - - -
3. Centrally Sponsored Schemes - - - - - - - -
4. Non-Plan (i + ii) 446.5 422.1 432.1 301.4 501.2 504.2 471.4 445.0
i) Relief for Natural Calamities - - - -
ii) Others 446.5 422.1 432.1 301.4 501.2 504.2 471.4 445.0
5. Ways and Means Advances from Centre - - - - - - - -
6. Loans for Special Schemes - - - - - - -
7. Others 0.2 0.2 0.2 0.2 2,168.0 19,031.5 27,399.0 35,148.5
IV. Loans and Advances by State Governments (1 + 2)
76,004.3 85,105.3 1,60,264.3 81,373.0 1,33,401.4 58,030.8 1,26,866.5 2,40,853.8
1. Development Purposes (a + b) 72,225.9 77,635.3 1,55,639.3 76,213.0 1,33,401.2 58,030.8 1,26,866.5 2,40,853.8
a) Social Services ( 1 to 7) - - - - 20,941.4 20,185.3 25,200.3 27,880.3
1. Education, Sports, Art and Culture - - - - - - - -
2. Medical and Public Health - - - - 10.0 - - -
3. Family Welfare - - - - - - - -
4. Water Supply and Sanitation - - - - - - - -
5. Housing - - - - - - - -
6. Government Servants (Housing) - - - - - - - -
7. Others - - - - 20,931.4 20,185.3 25,200.3 27,880.3
b) Economic Services (1 to 10) 72,225.9 77,635.3 1,55,639.3 76,213.0 1,12,459.8 37,845.5 1,01,666.2 2,12,973.5
1. Crop Husbandry - - - - 2,210.0 15.0 6,292.0 9,117.0
2. Soil and Water Conservation -833.9 - - - - - -
3. Food Storage and Warehousing 61,494.0 50,000.0 1,26,866.0 50,000.0 7,000.0 8,000.0 3,500.0 5,000.0
4. Co-operation 11,565.8 21,131.3 24,631.3 20,000.0 55,302.9 2,500.1 50,500.0 500.6
5. Major and Medium Irrigation, etc. - - - - - - - -
6. Power Projects - - - - 34,156.4 23,220.1 25,189.1 1,91,730.7
Appendix IV : Capital Expenditure of States and Union Territories with Legislature (Contd.)(₹ Lakh)

State Finances : A Study of Budgets of 2019-20
300
Item
PUNJAB RAJASTHAN
2017-18(Accounts)
2018-19(Budget
Estimates)
2018-19(Revised
Estimates)
2019-20(Budget
Estimates)
2017-18(Accounts)
2018-19(Budget
Estimates)
2018-19(Revised
Estimates)
2019-20(Budget
Estimates)
1 2 3 4 5 2 3 4 5
7. Village and Small Industries - - - - - - - -
8. Other Industries and Minerals - - - - - - - 500.0
9. Rural Development - - - - - - - -
10. Others - 6,504.0 4,142.0 6,213.0 13,790.5 4,110.1 16,185.1 6,125.1
2. Non-Development Purposes (a + b) 3,778.4 7,470.0 4,625.0 5,160.0 0.2 - - -
a) Government Servants (other than Housing) 3,778.4 5,160.0 4,625.0 5,160.0 0.2 - - -
b) Miscellaneous - 2,310.0 - - - - - -
V. Inter-State Settlement - - - - - - - -
VI. Contingency Fund - - - - - - - -
VII. State Provident Funds, etc. (1 + 2) 2,39,578.6 2,03,268.0 2,51,548.3 2,63,535.3 6,14,484.1 6,16,563.8 8,20,759.3 9,30,168.3
1. State Provident Funds 2,36,178.9 2,00,000.0 2,47,987.9 2,59,796.8 3,05,855.7 3,37,191.2 4,23,244.0 4,53,952.4
2. Others 3,399.7 3,268.0 3,560.4 3,738.5 3,08,628.4 2,79,372.6 3,97,515.4 4,76,215.9
VIII. Reserve Funds (1 to 4) 7,985.2 10,000.0 13,373.0 10,080.0 5,42,560.7 6,09,859.6 8,35,860.3 8,98,340.1
1. Depreciation/Renewal Reserve Funds - - - - 49.2 300.0 3.0 20.0
2. Sinking Funds - - - - - - - -
3. Famine Relief Fund - - - - - - - -
4. Others 7,985.2 10,000.0 13,373.0 10,080.0 5,42,511.5 6,09,559.6 8,35,857.3 8,98,320.1
IX. Deposits and Advances (1 to 4) 3,29,153.5 6,00,002.5 4,27,486.7 4,27,486.7 1,36,90,022.3 1,66,42,984.4 1,68,70,948.4 1,61,71,520.9
1. Civil Deposits 2,60,169.9 5,10,000.0 2,57,127.3 2,57,127.3 28,17,280.3 40,32,851.6 40,18,605.6 40,66,785.4
2. Deposits of Local Funds - 2.5 1.5 1.5 82,47,031.1 98,22,699.4 1,00,38,002.7 1,00,38,002.7
3. Civil Advances - - - - 0.7 722.1 722.1 722.1
4. Others 68,983.6 90,000.0 1,70,357.8 1,70,357.8 26,25,710.2 27,86,711.2 28,13,617.9 20,66,010.7
X. Suspense and Miscellaneous (1 to 4) 47,83,810.3 16,86,000.0 25,33,414.7 25,33,414.7 1,74,21,133.9 1,60,96,808.4 1,75,21,013.6 1,67,36,553.3
1. Suspense 94,906.5 1,00,000.0 5,31,153.8 5,31,153.8 5,842.0 9,470.8 21,558.0 21,557.7
2. Cash Balance Investment Accounts 7,82,683.0 10,50,000.0 14,05,000.0 14,05,000.0 1,74,13,268.0 1,60,83,342.0 1,74,95,460.0 1,67,11,000.0
3. Deposits with RBI - - - - - - -
4. Others 39,06,220.8 5,36,000.0 5,97,260.9 5,97,260.9 2,023.9 3,995.6 3,995.6 3,995.6
XI. Appropriation to Contingency Fund - - - - - - - -
XII. Remittances 12,169.8 7,907.4 7,428.4 7,428.4 1,33,486.8 11,12,723.2 3,35,670.5 3,35,670.5
A. Surplus (+)/Deficit (-) on Revenue Account -9,45,527.3 -12,53,941.4 -11,91,905.1 -11,68,725.8 -18,53,433.6 -17,45,484.9 -24,82,490.9 -27,01,497.4
B. Surplus (+)/Deficit(-) on Capital Account 9,31,371.7 8,36,436.7 11,39,314.6 9,36,447.6 19,35,774.8 17,59,218.0 21,51,361.5 24,27,814.3
C. Overall Surplus (+)/Deficit (-) (A+B) -14,155.6 -4,17,504.8 -52,590.5 -2,32,278.3 82,341.2 13,733.1 -3,31,129.4 -2,73,683.2
D. Financing of Surplus (+)/Deficit (-) (C = i to iii) -14,156.0 -4,17,505.0 -52,591.0 -2,32,278.0 82,341.0 13,733.1 -3,31,129.4 -2,73,683.2
i. Increase (+)/Decrease (-) in Cash Balances 29,289.0 -4,17,505.0 -52,591.0 -2,32,278.0 679.0 5,046.1 1,133.6 6,238.8
a) Opening Balance -36,784.0 -7,73,666.0 -7,495.0 -60,086.0 -216.0 463.0 463.0 1,596.6
b) Closing Balance -7,495.0 -11,91,171.0 -60,086.0 -2,92,364.0 463.0 5,509.1 1,596.6 7,835.4
ii. Withdrawals from (-)/Additions to (+) Cash Balance Investment Account (net) - - - - 81,662.0 8,687.0 -3,32,263.0 -2,79,922.0
iii. Increase (-)/Decrease (+) in Ways and Means Advances and Overdrafts from RBI (net) -43,445.0 - - - - - - -
Appendix IV : Capital Expenditure of States and Union Territories with Legislature (Contd.)(₹ Lakh)

Appendix IV
301
Appendix IV : Capital Expenditure of States and Union Territories with Legislature (Contd.)(₹ Lakh)
Item
SIKKIM TAMIL NADU
2017-18(Accounts)
2018-19(Budget
Estimates)
2018-19(Revised
Estimates)
2019-20(Budget
Estimates)
2017-18(Accounts)
2018-19(Budget
Estimates)
2018-19(Revised
Estimates)
2019-20(Budget
Estimates)
1 2 3 4 5 2 3 4 5
TOTAL CAPITAL DISBURSEMENTS (I to XII) 12,95,618.8 9,74,468.4 10,25,705.2 6,91,544.4 5,93,96,595.8 5,08,30,458.7 5,81,82,597.5 5,11,24,843.5
TOTAL CAPITAL DISBURSEMENTS (Excluding Public Accounts)$ 1,86,635.7 1,69,482.4 2,18,026.3 1,53,627.6 35,67,743.7 47,87,440.7 48,38,609.6 52,50,425.1
I. Total Capital Outlay (1 + 2) 1,50,678.0 1,30,395.5 1,75,911.6 1,10,970.3 20,20,319.9 28,28,275.8 26,19,198.3 31,25,120.7
1. Development (a + b) 1,35,701.7 1,18,837.0 1,63,380.0 1,05,266.7 19,35,586.6 26,77,883.2 25,17,800.4 29,84,281.1
(a) Social Services (1 to 9) 53,453.3 37,338.3 52,269.2 31,895.8 4,73,117.9 9,21,723.3 7,61,924.6 10,33,238.1
1. Education, Sports, Art and Culture 9,757.6 7,420.6 11,682.5 5,112.1 61,681.4 85,528.6 78,651.7 66,563.5
2. Medical and Public Health 22,403.4 4,607.1 9,652.1 3,437.6 28,573.7 50,656.9 45,059.8 79,810.5
3. Family Welfare - - - - 12,157.1 15,022.5 24,597.2 26,751.4
4. Water Supply and Sanitation 11,044.6 13,996.2 14,582.0 15,585.5 87,203.5 1,72,918.4 1,19,389.8 1,99,868.2
5. Housing 209.6 200.0 3,500.0 1,764.0 7,805.0 16,978.7 14,926.7 6,982.7
6. Urban Development 8,482.0 8,243.8 9,701.1 3,495.7 2,57,933.0 5,48,157.0 4,41,643.1 6,25,450.1
7. Welfare of Scheduled Castes, Scheduled
Tribes and Other Backward Classes 1,356.3 2,185.5 2,226.5 1,726.1 11,787.5 16,736.2 18,787.4 13,845.9
8. Social Security and Welfare 199.7 685.0 915.0 774.9 1,395.6 1,911.9 2,071.0 2,239.6
9. Others * - - 10.0 - 4,581.2 13,813.1 16,798.0 11,726.3
(b) Economic Services (1 to 10) 82,248.5 81,498.7 1,11,110.9 73,370.9 14,62,468.7 17,56,159.9 17,55,875.7 19,51,043.0
1. Agriculture and Allied Activities (i to xi) 1,396.0 2,519.2 2,953.7 1,934.0 84,680.6 1,21,697.4 1,14,108.4 1,64,959.1
i) Crop Husbandry 270.8 370.3 682.6 158.1 4,515.4 8,188.6 9,957.8 8,313.0
ii) Soil and Water Conservation - - - - 1,866.1 12,336.0 4,467.2 13,406.0
iii) Animal Husbandry 413.4 243.4 365.6 236.0 4,568.1 6,718.6 6,692.2 6,992.1
iv) Dairy Development - - - - 975.0 6,500.0 6,500.0 20,000.0
v) Fisheries 121.0 84.3 84.3 150.5 18,194.1 28,352.1 28,243.9 34,628.9
vi) Forestry and Wild Life 66.0 580.2 580.2 218.3 16,161.5 15,836.4 13,668.4 9,342.0
vii) Plantations - - - - 222.0 - - -
viii) Food Storage and Warehousing 51.9 1,241.0 1,241.0 1,171.0 19,199.6 13,122.4 24,133.4 48,131.0
ix) Agricultural Research and Education - - - - 657.1 448.7 499.2 390.0
x) Co-operation 472.9 - - - 5,149.2 4,531.3 6,254.4 3,607.2
xi) Others @ - - - - 13,172.5 25,663.3 13,691.7 20,148.9
2. Rural Development 1,267.4 800.0 1,565.0 220.6 1,77,157.9 2,21,685.0 3,09,953.0 1,99,547.9
3. Special Area Programmes 2,507.1 4,675.0 3,880.0 4,240.0 7,658.4 35,539.0 7,614.1 7,613.6
of which: Hill Areas - - - - 7,658.4 35,539.0 7,614.1 7,613.6
4. Major and Medium Irrigation and Flood Control 191.2 1,253.5 5,270.5 23.0 1,20,547.6 2,99,462.6 2,39,066.4 3,78,899.3
5. Energy 7,628.8 7,476.9 8,534.0 4,235.2 78,154.0 48,265.0 27,793.8 56,371.3
6. Industry and Minerals (i to iv) 209.6 72.2 72.2 13.0 645.1 9,450.1 1,61,112.9 7,100.0
i) Village and Small Industries - - - - 66.3 9,450.0 4,884.8 7,100.0
ii) Iron and Steel Industries - - - - - - - -
iii) Non-Ferrous Mining and Metallurgical Industries - - - - - - - -
iv) Others # 209.6 72.2 72.2 13.0 578.9 0.1 1,56,228.1 -
7. Transport (i + ii) 62,556.8 57,589.1 80,659.5 59,965.4 9,85,468.7 9,76,316.7 8,75,632.2 10,84,164.0
i) Roads and Bridges 62,259.3 57,389.1 80,369.5 59,865.4 6,84,440.4 8,81,251.2 7,90,267.3 10,69,663.9
ii) Others ** 297.5 200.0 290.0 100.0 3,01,028.3 95,065.6 85,364.9 14,500.1
8. Communications - - - - - - - -

State Finances : A Study of Budgets of 2019-20
302
Item
SIKKIM TAMIL NADU
2017-18(Accounts)
2018-19(Budget
Estimates)
2018-19(Revised
Estimates)
2019-20(Budget
Estimates)
2017-18(Accounts)
2018-19(Budget
Estimates)
2018-19(Revised
Estimates)
2019-20(Budget
Estimates)
1 2 3 4 5 2 3 4 5
9. Science, Technology and Environment - - - - -686.0 1,318.0 1,318.0 -
10. General Economic Services (i + ii) 6,491.6 7,112.9 8,176.1 2,739.6 8,842.5 42,426.2 19,276.9 52,387.8
i) Tourism 6,478.7 6,867.9 7,931.1 2,494.6 3,004.1 5,500.1 4,712.4 15,500.1
ii) Others @@ 12.9 245.0 245.0 245.0 5,838.4 36,926.1 14,564.5 36,887.7
2. Non-Development (General Services) 14,976.3 11,558.5 12,531.6 5,703.6 84,733.3 1,50,392.6 1,01,398.0 1,40,839.6
II. Discharge of Internal Debt (1 to 8) 33,249.3 36,514.7 36,544.6 40,314.2 8,03,514.2 14,16,776.4 14,17,685.4 16,18,482.5
1. Market Loans 24,990.5 29,302.0 29,302.0 32,801.0 4,94,249.2 10,84,773.2 10,84,867.5 12,59,896.0
2. Loans from LIC 1,020.3 1,019.8 1,019.8 1,019.3 6,655.0 6,561.5 6,561.5 6,192.4
3. Loans from SBI and other Banks - - - - 3,363.8 3,625.8 3,625.8 1,592.8
4. Loans from NABARD 4,586.9 4,368.2 4,368.2 4,563.7 1,17,458.4 1,36,432.1 1,36,432.1 1,63,355.2
5. Loans from National Co-operative
Development Corporation 80.0 80.0 80.0 80.0 5,225.1 6,532.0 7,573.9 6,532.0
6. WMA from RBI - - - - - - -
7. Special Securities issued to NSSF 2,360.8 1,504.4 1,504.4 1,610.5 1,74,902.9 1,77,717.9 1,77,717.9 1,80,308.1
8. Others 210.9 240.2 270.2 239.7 1,659.9 1,133.9 906.7 606.0
of which: Land Compensation Bonds - 0.0 0.0 0.0 - - -
III. Repayment of Loans to the Centre (1 to 7) 1,013.4 1,017.2 1,044.7 1,096.1 95,570.6 1,15,811.3 1,19,659.2 1,40,667.3
1. State Plan Schemes 967.1 970.6 998.1 1,048.1 95,027.7 1,15,273.9 1,19,016.2 1,40,050.1
of which: Advance release of Plan
Assistance for Natural Calamities - - - - - - - -
2. Central Plan Schemes - - - - - - - -
3. Centrally Sponsored Schemes 12.5 12.2 12.2 11.5 - - - -
4. Non-Plan (i + ii) 11.8 12.5 12.5 14.6 542.9 537.4 537.4 511.6
i) Relief for Natural Calamities - - - - - - - -
ii) Others 11.8 12.5 12.5 14.6 542.9 537.4 537.4 511.6
5. Ways and Means Advances from Centre - - - - - - - -
6. Loans for Special Schemes 22.0 22.0 22.0 22.0 - - - -
7. Others - - - - - - 105.6 105.6
IV. Loans and Advances by State Governments (1 + 2)
1,695.0 1,555.0 4,525.3 1,247.0 6,51,702.8 4,30,203.0 6,85,692.4 3,67,747.6
1. Development Purposes (a + b) 1,695.0 1,545.0 4,515.3 1,237.0 6,37,045.9 4,17,051.0 6,72,570.3 3,54,625.5
a) Social Services ( 1 to 7) 445.0 245.0 45.0 125.0 2,39,628.1 1,90,878.9 2,10,321.6 2,64,286.1
1. Education, Sports, Art and Culture 400.0 200.0 - - 27,425.0 - 3,511.3 -
2. Medical and Public Health - - - - - - - -
3. Family Welfare - - - - - - - -
4. Water Supply and Sanitation - - - - 1,824.4 410.5 79,875.3 329.7
5. Housing - - - - - - - -
6. Government Servants (Housing) 45.0 45.0 45.0 125.0 15,997.7 20,475.3 19,289.9 19,354.9
7. Others - - - - 1,94,381.0 1,69,993.0 1,07,645.1 2,44,601.4
b) Economic Services (1 to 10) 1,250.0 1,300.0 4,470.3 1,112.0 3,97,417.9 2,26,172.0 4,62,248.7 90,339.5
1. Crop Husbandry - - - - - 13,000.0 13,000.0 13,000.0
2. Soil and Water Conservation - - - - - - - -
3. Food Storage and Warehousing - - - - - - - -
4. Co-operation - - - - 7,068.8 4,950.8 29,638.7 1,143.5
5. Major and Medium Irrigation, etc. - - - - - - - -
6. Power Projects - - - - 50,832.9 93,121.1 72,823.5 66,095.8
Appendix IV : Capital Expenditure of States and Union Territories with Legislature (Contd.)(₹ Lakh)

Appendix IV
303
Item
SIKKIM TAMIL NADU
2017-18(Accounts)
2018-19(Budget
Estimates)
2018-19(Revised
Estimates)
2019-20(Budget
Estimates)
2017-18(Accounts)
2018-19(Budget
Estimates)
2018-19(Revised
Estimates)
2019-20(Budget
Estimates)
1 2 3 4 5 2 3 4 5
7. Village and Small Industries - - - - 7,095.0 - - -
8. Other Industries and Minerals - - - - 10.0 - 7,499.3 -
9. Rural Development - - - - - - - -
10. Others 1,250.0 1,300.0 4,470.3 1,112.0 3,32,411.2 1,15,100.1 3,39,287.2 10,100.2
2. Non-Development Purposes (a + b) - 10.0 10.0 10.0 14,656.9 13,152.1 13,122.1 13,122.1
a) Government Servants (other than Housing) - 10.0 10.0 10.0 14,656.9 13,072.0 13,072.0 13,072.0
b) Miscellaneous - - - - - 80.0 50.0 50.0
V. Inter-State Settlement - - - - - - - -
VI. Contingency Fund -31.0 - - - - - - -
VII. State Provident Funds, etc. (1 + 2) 22,908.8 26,240.0 22,940.0 25,635.0 6,05,555.7 6,44,363.5 6,19,845.7 7,39,375.3
1. State Provident Funds 22,620.5 26,000.0 22,700.0 25,380.0 5,95,380.8 6,33,781.9 6,09,671.3 7,29,200.9
2. Others 288.3 240.0 240.0 255.0 10,174.9 10,581.6 10,174.4 10,174.4
VIII. Reserve Funds (1 to 4) 17,487.9 12,530.0 17,523.0 21,944.0 6,05,546.2 3,08,939.1 5,09,365.9 3,95,843.9
1. Depreciation/Renewal Reserve Funds - - - - - - - -
2. Sinking Funds 3,622.7 1,200.0 1,200.0 1,200.0 76,662.9 1,21,829.1 1,77,229.1 1,09,772.1
3. Famine Relief Fund - - - - - - - -
4. Others 13,865.3 11,330.0 16,323.0 20,744.0 5,28,883.2 1,87,110.0 3,32,136.8 2,86,071.8
IX. Deposits and Advances (1 to 4) 49,053.2 94,615.2 95,615.2 1,01,615.3 97,86,204.7 1,32,65,776.1 91,73,668.6 1,06,71,397.0
1. Civil Deposits 40,238.0 83,615.2 83,615.2 83,615.3 30,99,950.2 31,80,729.2 32,35,329.2 32,27,987.4
2. Deposits of Local Funds - - - - 1,57,684.8 1,88,812.4 2,48,290.0 1,93,290.0
3. Civil Advances - - - - - - - -
4. Others 8,815.2 11,000.0 12,000.0 18,000.0 65,28,569.6 98,96,234.4 56,90,049.4 72,50,119.5
X. Suspense and Miscellaneous (1 to 4) 8,12,806.6 5,40,590.4 5,40,590.4 3,88,722.5 4,48,27,543.7 3,18,20,043.8 4,30,37,481.7 3,40,66,209.1
1. Suspense -188.4 - - - 12,981.1 18,551.0 -10,482.1 -10,482.1
2. Cash Balance Investment Accounts 3,92,561.9 1,60,700.0 1,60,700.0 3,88,722.4 3,09,88,679.0 1,80,00,000.0 2,85,72,234.8 2,40,00,000.0
3. Deposits with RBI - - - - - - - -
4. Others 4,20,433.1 3,79,890.4 3,79,890.4 - 1,38,25,883.6 1,38,01,492.8 1,44,75,728.9 1,00,76,691.2
XI. Appropriation to Contingency Fund - - - - - - - -
XII. Remittances 2,06,757.6 1,31,010.3 1,31,010.3 - 638.1 269.7 0.3 0.3
A. Surplus (+)/Deficit (-) on Revenue Account 1,06,094.5 62,466.4 89,573.6 26,835.1 -21,59,388.4 -17,49,058.2 -19,31,901.8 -14,31,475.9
B. Surplus (+)/Deficit(-) on Capital Account -53,755.5 -65,768.0 -92,875.1 -26,835.1 25,25,899.7 15,80,463.1 9,81,183.3 13,79,930.3
C. Overall Surplus (+)/Deficit (-) (A+B) 52,339.1 -3,301.6 -3,301.6 - 3,66,511.3 -1,68,595.1 -9,50,718.5 -51,545.6
D. Financing of Surplus (+)/Deficit (-) (C = i to iii) 52,339.1 -3,301.6 -3,301.6 - 3,66,511.3 -1,68,595.1 -9,50,718.5 -51,545.6
i. Increase (+)/Decrease (-) in Cash Balances 48,499.6 -1.6 -1.6 - 22,436.8 -22,228.3 10,640.7 -1,627.1
a) Opening Balance 11,216.6 9,371.6 59,716.3 59,714.7 -28,875.0 12,757.3 -6,438.2 4,202.5
b) Closing Balance 59,716.3 9,370.0 59,714.7 59,714.7 -6,438.2 -9,471.1 4,202.5 2,575.4
ii. Withdrawals from (-)/Additions to (+) Cash Balance Investment Account (net) 3,839.4 -3,300.0 -3,300.0 - 3,44,074.4 -1,46,366.8 -9,61,359.2 -49,918.4
iii. Increase (-)/Decrease (+) in Ways and Means Advances and Overdrafts from RBI (net) - - - - - - - -
Appendix IV : Capital Expenditure of States and Union Territories with Legislature (Contd.)(₹ Lakh)
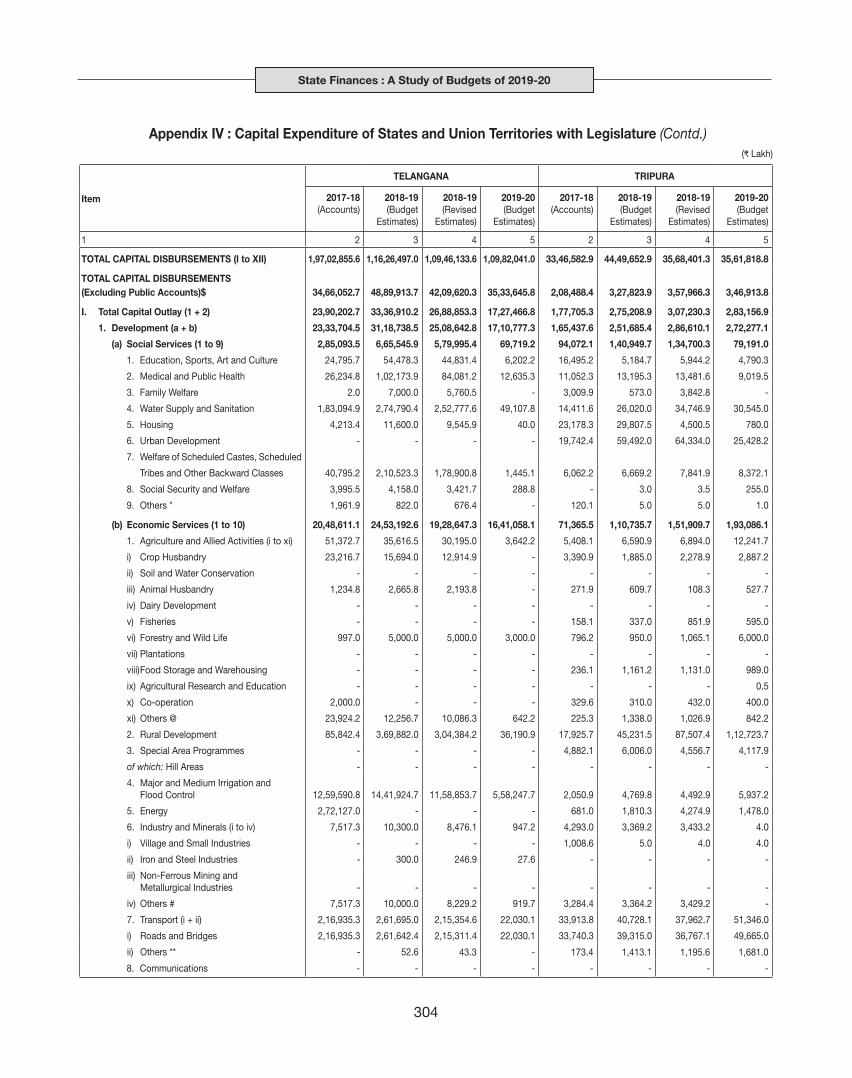
State Finances : A Study of Budgets of 2019-20
304
Appendix IV : Capital Expenditure of States and Union Territories with Legislature (Contd.)(₹ Lakh)
Item
TELANGANA TRIPURA
2017-18(Accounts)
2018-19(Budget
Estimates)
2018-19(Revised
Estimates)
2019-20(Budget
Estimates)
2017-18(Accounts)
2018-19(Budget
Estimates)
2018-19(Revised
Estimates)
2019-20(Budget
Estimates)
1 2 3 4 5 2 3 4 5
TOTAL CAPITAL DISBURSEMENTS (I to XII) 1,97,02,855.6 1,16,26,497.0 1,09,46,133.6 1,09,82,041.0 33,46,582.9 44,49,652.9 35,68,401.3 35,61,818.8
TOTAL CAPITAL DISBURSEMENTS (Excluding Public Accounts)$ 34,66,052.7 48,89,913.7 42,09,620.3 35,33,645.8 2,08,488.4 3,27,823.9 3,57,966.3 3,46,913.8
I. Total Capital Outlay (1 + 2) 23,90,202.7 33,36,910.2 26,88,853.3 17,27,466.8 1,77,705.3 2,75,208.9 3,07,230.3 2,83,156.9
1. Development (a + b) 23,33,704.5 31,18,738.5 25,08,642.8 17,10,777.3 1,65,437.6 2,51,685.4 2,86,610.1 2,72,277.1
(a) Social Services (1 to 9) 2,85,093.5 6,65,545.9 5,79,995.4 69,719.2 94,072.1 1,40,949.7 1,34,700.3 79,191.0
1. Education, Sports, Art and Culture 24,795.7 54,478.3 44,831.4 6,202.2 16,495.2 5,184.7 5,944.2 4,790.3
2. Medical and Public Health 26,234.8 1,02,173.9 84,081.2 12,635.3 11,052.3 13,195.3 13,481.6 9,019.5
3. Family Welfare 2.0 7,000.0 5,760.5 - 3,009.9 573.0 3,842.8 -
4. Water Supply and Sanitation 1,83,094.9 2,74,790.4 2,52,777.6 49,107.8 14,411.6 26,020.0 34,746.9 30,545.0
5. Housing 4,213.4 11,600.0 9,545.9 40.0 23,178.3 29,807.5 4,500.5 780.0
6. Urban Development - - - - 19,742.4 59,492.0 64,334.0 25,428.2
7. Welfare of Scheduled Castes, Scheduled
Tribes and Other Backward Classes 40,795.2 2,10,523.3 1,78,900.8 1,445.1 6,062.2 6,669.2 7,841.9 8,372.1
8. Social Security and Welfare 3,995.5 4,158.0 3,421.7 288.8 - 3.0 3.5 255.0
9. Others * 1,961.9 822.0 676.4 - 120.1 5.0 5.0 1.0
(b) Economic Services (1 to 10) 20,48,611.1 24,53,192.6 19,28,647.3 16,41,058.1 71,365.5 1,10,735.7 1,51,909.7 1,93,086.1
1. Agriculture and Allied Activities (i to xi) 51,372.7 35,616.5 30,195.0 3,642.2 5,408.1 6,590.9 6,894.0 12,241.7
i) Crop Husbandry 23,216.7 15,694.0 12,914.9 - 3,390.9 1,885.0 2,278.9 2,887.2
ii) Soil and Water Conservation - - - - - - - -
iii) Animal Husbandry 1,234.8 2,665.8 2,193.8 - 271.9 609.7 108.3 527.7
iv) Dairy Development - - - - - - - -
v) Fisheries - - - - 158.1 337.0 851.9 595.0
vi) Forestry and Wild Life 997.0 5,000.0 5,000.0 3,000.0 796.2 950.0 1,065.1 6,000.0
vii) Plantations - - - - - - - -
viii) Food Storage and Warehousing - - - - 236.1 1,161.2 1,131.0 989.0
ix) Agricultural Research and Education - - - - - - - 0.5
x) Co-operation 2,000.0 - - - 329.6 310.0 432.0 400.0
xi) Others @ 23,924.2 12,256.7 10,086.3 642.2 225.3 1,338.0 1,026.9 842.2
2. Rural Development 85,842.4 3,69,882.0 3,04,384.2 36,190.9 17,925.7 45,231.5 87,507.4 1,12,723.7
3. Special Area Programmes - - - - 4,882.1 6,006.0 4,556.7 4,117.9
of which: Hill Areas - - - - - - - -
4. Major and Medium Irrigation and Flood Control 12,59,590.8 14,41,924.7 11,58,853.7 5,58,247.7 2,050.9 4,769.8 4,492.9 5,937.2
5. Energy 2,72,127.0 - - - 681.0 1,810.3 4,274.9 1,478.0
6. Industry and Minerals (i to iv) 7,517.3 10,300.0 8,476.1 947.2 4,293.0 3,369.2 3,433.2 4.0
i) Village and Small Industries - - - - 1,008.6 5.0 4.0 4.0
ii) Iron and Steel Industries - 300.0 246.9 27.6 - - - -
iii) Non-Ferrous Mining and Metallurgical Industries - - - - - - - -
iv) Others # 7,517.3 10,000.0 8,229.2 919.7 3,284.4 3,364.2 3,429.2 -
7. Transport (i + ii) 2,16,935.3 2,61,695.0 2,15,354.6 22,030.1 33,913.8 40,728.1 37,962.7 51,346.0
i) Roads and Bridges 2,16,935.3 2,61,642.4 2,15,311.4 22,030.1 33,740.3 39,315.0 36,767.1 49,665.0
ii) Others ** - 52.6 43.3 - 173.4 1,413.1 1,195.6 1,681.0
8. Communications - - - - - - - -

Appendix IV
305
Item
TELANGANA TRIPURA
2017-18(Accounts)
2018-19(Budget
Estimates)
2018-19(Revised
Estimates)
2019-20(Budget
Estimates)
2017-18(Accounts)
2018-19(Budget
Estimates)
2018-19(Revised
Estimates)
2019-20(Budget
Estimates)
1 2 3 4 5 2 3 4 5
9. Science, Technology and Environment - - - - 4.0 55.8 509.7 50.0
10. General Economic Services (i + ii) 1,55,225.6 3,33,774.4 2,11,383.7 10,20,000.0 2,207.0 2,174.2 2,278.2 5,187.7
i) Tourism 561.5 - - - 10.6 - - 10.0
ii) Others @@ 1,54,664.2 3,33,774.4 2,11,383.7 10,20,000.0 2,196.3 2,174.2 2,278.2 5,177.7
2. Non-Development (General Services) 56,498.2 2,18,171.7 1,80,210.5 16,689.5 12,267.7 23,523.5 20,620.3 10,879.9
II. Discharge of Internal Debt (1 to 8) 27,05,947.8 6,19,111.2 6,19,112.3 8,89,578.2 26,900.3 46,686.0 47,797.8 60,520.9
1. Market Loans 2,77,175.4 4,55,712.0 4,55,712.0 6,41,169.3 - - 15,600.0 35,000.0
2. Loans from LIC 1,365.0 1,450.0 1,450.0 1,250.0 1,479.4 1,484.9 1,526.9 1,484.8
3. Loans from SBI and other Banks - - - - - - - -
4. Loans from NABARD 44,558.6 51,806.0 51,806.0 83,193.7 13,885.0 17,925.0 16,395.0 11,904.4
5. Loans from National Co-operative
Development Corporation 1,964.1 2,965.0 2,965.0 1,781.8 191.4 220.0 191.4 200.0
6. WMA from RBI 22,92,177.0 10,000.0 10,000.0 10,000.0 - - - -
7. Special Securities issued to NSSF 79,908.0 60,538.8 60,538.8 82,730.3 11,319.9 27,036.0 14,064.4 11,911.6
8. Others 8,799.9 36,639.3 36,640.5 69,453.1 24.6 20.1 20.1 20.2
of which: Land Compensation Bonds - - 1.1 1.1 - - - -
III. Repayment of Loans to the Centre (1 to 7) 41,161.9 40,337.1 40,313.3 36,998.9 3,182.0 5,364.0 2,735.7 3,033.4
1. State Plan Schemes 40,905.7 40,081.7 40,081.7 36,777.3 2,966.3 5,144.8 2,541.1 2,819.6
of which: Advance release of Plan
Assistance for Natural Calamities - - - - - - - -
2. Central Plan Schemes - - - - - - - -
3. Centrally Sponsored Schemes - - - - 54.5 23.8 94.3 103.7
4. Non-Plan (i + ii) 256.2 255.4 231.6 221.6 54.3 95.4 17.4 18.9
i) Relief for Natural Calamities - - - - - - - -
ii) Others 256.2 255.4 231.6 221.6 54.3 95.4 17.4 18.9
5. Ways and Means Advances from Centre - - - - 106.9 100.0 79.7 87.7
6. Loans for Special Schemes - - - - - - - -
7. Others - - - - - - 3.2 3.5
IV. Loans and Advances by State Governments (1 + 2)
6,20,917.2 9,03,555.4 8,71,341.4 8,89,601.8 700.8 565.0 202.5 202.5
1. Development Purposes (a + b) 6,15,687.8 8,94,432.4 8,63,718.4 8,84,851.8 700.8 565.0 202.5 202.5
a) Social Services ( 1 to 7) 5,44,169.8 4,95,626.9 4,95,126.9 5,10,365.4 535.8 50.0 50.0 50.0
1. Education, Sports, Art and Culture - - - - - - - -
2. Medical and Public Health 27,628.0 53,070.9 53,070.9 72,012.2 500.0 - - -
3. Family Welfare - - - - - - - -
4. Water Supply and Sanitation 2,08,770.1 3,07,050.0 3,07,050.0 3,63,573.0 - - - -
5. Housing 31,721.1 57,496.0 57,496.0 62,241.1 - - - -
6. Government Servants (Housing) 3,205.9 5,400.0 5,400.0 5,000.0 35.8 50.0 50.0 50.0
7. Others 2,72,844.7 72,610.0 72,110.0 7,539.2
b) Economic Services (1 to 10) 71,518.0 3,98,805.5 3,68,591.5 3,74,486.4 165.0 515.0 152.5 152.5
1. Crop Husbandry 2,551.4 8,648.4 8,648.4 26,000.0 - - - -
2. Soil and Water Conservation - - - - - - - -
3. Food Storage and Warehousing - - - - - - - -
4. Co-operation - - - - 165.0 515.0 152.5 152.5
5. Major and Medium Irrigation, etc. - 2,31,678.3 2,31,678.3 2,19,000.0 - - - -
6. Power Projects 29,378.7 59,824.0 29,610.0 18,000.0 - - - -
Appendix IV : Capital Expenditure of States and Union Territories with Legislature (Contd.)(₹ Lakh)
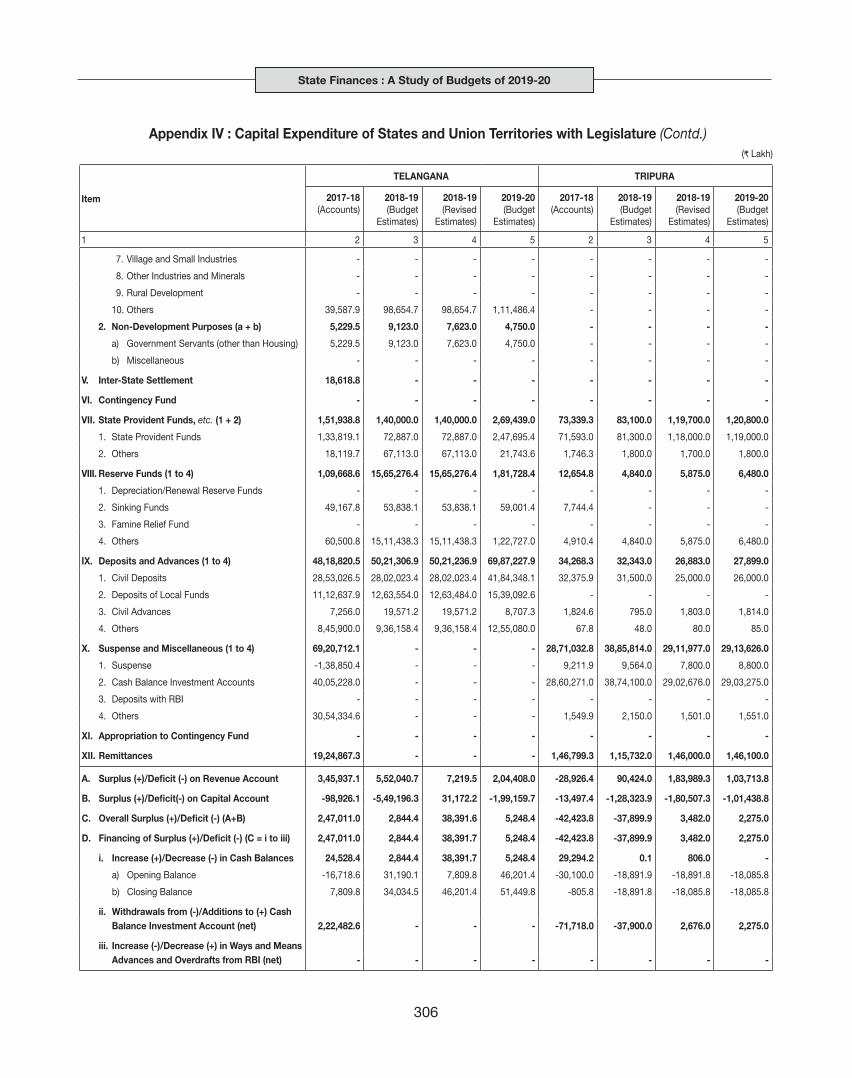
State Finances : A Study of Budgets of 2019-20
306
Item
TELANGANA TRIPURA
2017-18(Accounts)
2018-19(Budget
Estimates)
2018-19(Revised
Estimates)
2019-20(Budget
Estimates)
2017-18(Accounts)
2018-19(Budget
Estimates)
2018-19(Revised
Estimates)
2019-20(Budget
Estimates)
1 2 3 4 5 2 3 4 5
7. Village and Small Industries - - - - - - - -
8. Other Industries and Minerals - - - - - - - -
9. Rural Development - - - - - - - -
10. Others 39,587.9 98,654.7 98,654.7 1,11,486.4 - - - -
2. Non-Development Purposes (a + b) 5,229.5 9,123.0 7,623.0 4,750.0 - - - -
a) Government Servants (other than Housing) 5,229.5 9,123.0 7,623.0 4,750.0 - - - -
b) Miscellaneous - - - - - - - -
V. Inter-State Settlement 18,618.8 - - - - - - -
VI. Contingency Fund - - - - - - - -
VII. State Provident Funds, etc. (1 + 2) 1,51,938.8 1,40,000.0 1,40,000.0 2,69,439.0 73,339.3 83,100.0 1,19,700.0 1,20,800.0
1. State Provident Funds 1,33,819.1 72,887.0 72,887.0 2,47,695.4 71,593.0 81,300.0 1,18,000.0 1,19,000.0
2. Others 18,119.7 67,113.0 67,113.0 21,743.6 1,746.3 1,800.0 1,700.0 1,800.0
VIII. Reserve Funds (1 to 4) 1,09,668.6 15,65,276.4 15,65,276.4 1,81,728.4 12,654.8 4,840.0 5,875.0 6,480.0
1. Depreciation/Renewal Reserve Funds - - - - - - - -
2. Sinking Funds 49,167.8 53,838.1 53,838.1 59,001.4 7,744.4 - - -
3. Famine Relief Fund - - - - - - - -
4. Others 60,500.8 15,11,438.3 15,11,438.3 1,22,727.0 4,910.4 4,840.0 5,875.0 6,480.0
IX. Deposits and Advances (1 to 4) 48,18,820.5 50,21,306.9 50,21,236.9 69,87,227.9 34,268.3 32,343.0 26,883.0 27,899.0
1. Civil Deposits 28,53,026.5 28,02,023.4 28,02,023.4 41,84,348.1 32,375.9 31,500.0 25,000.0 26,000.0
2. Deposits of Local Funds 11,12,637.9 12,63,554.0 12,63,484.0 15,39,092.6 - - - -
3. Civil Advances 7,256.0 19,571.2 19,571.2 8,707.3 1,824.6 795.0 1,803.0 1,814.0
4. Others 8,45,900.0 9,36,158.4 9,36,158.4 12,55,080.0 67.8 48.0 80.0 85.0
X. Suspense and Miscellaneous (1 to 4) 69,20,712.1 - - - 28,71,032.8 38,85,814.0 29,11,977.0 29,13,626.0
1. Suspense -1,38,850.4 - - - 9,211.9 9,564.0 7,800.0 8,800.0
2. Cash Balance Investment Accounts 40,05,228.0 - - - 28,60,271.0 38,74,100.0 29,02,676.0 29,03,275.0
3. Deposits with RBI - - - - - - - -
4. Others 30,54,334.6 - - - 1,549.9 2,150.0 1,501.0 1,551.0
XI. Appropriation to Contingency Fund - - - - - - - -
XII. Remittances 19,24,867.3 - - - 1,46,799.3 1,15,732.0 1,46,000.0 1,46,100.0
A. Surplus (+)/Deficit (-) on Revenue Account 3,45,937.1 5,52,040.7 7,219.5 2,04,408.0 -28,926.4 90,424.0 1,83,989.3 1,03,713.8
B. Surplus (+)/Deficit(-) on Capital Account -98,926.1 -5,49,196.3 31,172.2 -1,99,159.7 -13,497.4 -1,28,323.9 -1,80,507.3 -1,01,438.8
C. Overall Surplus (+)/Deficit (-) (A+B) 2,47,011.0 2,844.4 38,391.6 5,248.4 -42,423.8 -37,899.9 3,482.0 2,275.0
D. Financing of Surplus (+)/Deficit (-) (C = i to iii) 2,47,011.0 2,844.4 38,391.7 5,248.4 -42,423.8 -37,899.9 3,482.0 2,275.0
i. Increase (+)/Decrease (-) in Cash Balances 24,528.4 2,844.4 38,391.7 5,248.4 29,294.2 0.1 806.0 -
a) Opening Balance -16,718.6 31,190.1 7,809.8 46,201.4 -30,100.0 -18,891.9 -18,891.8 -18,085.8
b) Closing Balance 7,809.8 34,034.5 46,201.4 51,449.8 -805.8 -18,891.8 -18,085.8 -18,085.8
ii. Withdrawals from (-)/Additions to (+) Cash Balance Investment Account (net) 2,22,482.6 - - - -71,718.0 -37,900.0 2,676.0 2,275.0
iii. Increase (-)/Decrease (+) in Ways and Means Advances and Overdrafts from RBI (net) - - - - - - - -
Appendix IV : Capital Expenditure of States and Union Territories with Legislature (Contd.)(₹ Lakh)
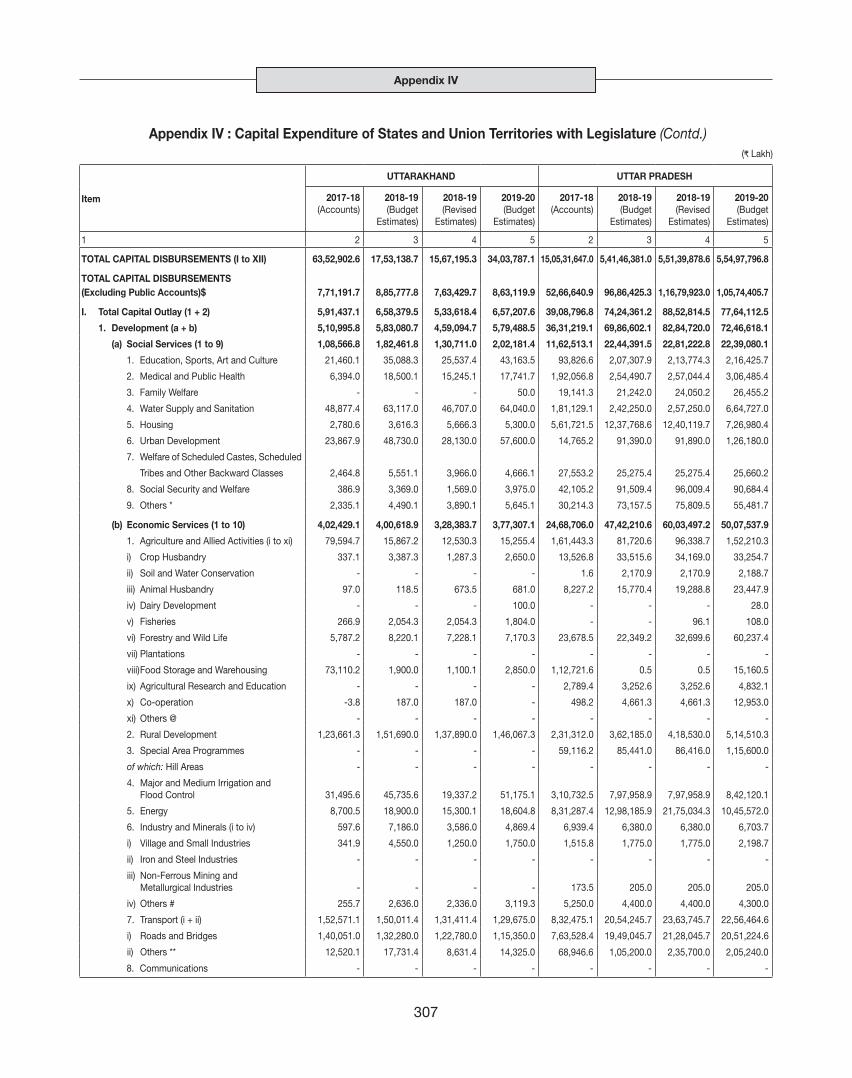
Appendix IV
307
Appendix IV : Capital Expenditure of States and Union Territories with Legislature (Contd.)(₹ Lakh)
Item
UTTARAKHAND UTTAR PRADESH
2017-18(Accounts)
2018-19(Budget
Estimates)
2018-19(Revised
Estimates)
2019-20(Budget
Estimates)
2017-18(Accounts)
2018-19(Budget
Estimates)
2018-19(Revised
Estimates)
2019-20(Budget
Estimates)
1 2 3 4 5 2 3 4 5
TOTAL CAPITAL DISBURSEMENTS (I to XII) 63,52,902.6 17,53,138.7 15,67,195.3 34,03,787.1 15,05,31,647.0 5,41,46,381.0 5,51,39,878.6 5,54,97,796.8
TOTAL CAPITAL DISBURSEMENTS (Excluding Public Accounts)$ 7,71,191.7 8,85,777.8 7,63,429.7 8,63,119.9 52,66,640.9 96,86,425.3 1,16,79,923.0 1,05,74,405.7
I. Total Capital Outlay (1 + 2) 5,91,437.1 6,58,379.5 5,33,618.4 6,57,207.6 39,08,796.8 74,24,361.2 88,52,814.5 77,64,112.5
1. Development (a + b) 5,10,995.8 5,83,080.7 4,59,094.7 5,79,488.5 36,31,219.1 69,86,602.1 82,84,720.0 72,46,618.1
(a) Social Services (1 to 9) 1,08,566.8 1,82,461.8 1,30,711.0 2,02,181.4 11,62,513.1 22,44,391.5 22,81,222.8 22,39,080.1
1. Education, Sports, Art and Culture 21,460.1 35,088.3 25,537.4 43,163.5 93,826.6 2,07,307.9 2,13,774.3 2,16,425.7
2. Medical and Public Health 6,394.0 18,500.1 15,245.1 17,741.7 1,92,056.8 2,54,490.7 2,57,044.4 3,06,485.4
3. Family Welfare - - - 50.0 19,141.3 21,242.0 24,050.2 26,455.2
4. Water Supply and Sanitation 48,877.4 63,117.0 46,707.0 64,040.0 1,81,129.1 2,42,250.0 2,57,250.0 6,64,727.0
5. Housing 2,780.6 3,616.3 5,666.3 5,300.0 5,61,721.5 12,37,768.6 12,40,119.7 7,26,980.4
6. Urban Development 23,867.9 48,730.0 28,130.0 57,600.0 14,765.2 91,390.0 91,890.0 1,26,180.0
7. Welfare of Scheduled Castes, Scheduled
Tribes and Other Backward Classes 2,464.8 5,551.1 3,966.0 4,666.1 27,553.2 25,275.4 25,275.4 25,660.2
8. Social Security and Welfare 386.9 3,369.0 1,569.0 3,975.0 42,105.2 91,509.4 96,009.4 90,684.4
9. Others * 2,335.1 4,490.1 3,890.1 5,645.1 30,214.3 73,157.5 75,809.5 55,481.7
(b) Economic Services (1 to 10) 4,02,429.1 4,00,618.9 3,28,383.7 3,77,307.1 24,68,706.0 47,42,210.6 60,03,497.2 50,07,537.9
1. Agriculture and Allied Activities (i to xi) 79,594.7 15,867.2 12,530.3 15,255.4 1,61,443.3 81,720.6 96,338.7 1,52,210.3
i) Crop Husbandry 337.1 3,387.3 1,287.3 2,650.0 13,526.8 33,515.6 34,169.0 33,254.7
ii) Soil and Water Conservation - - - - 1.6 2,170.9 2,170.9 2,188.7
iii) Animal Husbandry 97.0 118.5 673.5 681.0 8,227.2 15,770.4 19,288.8 23,447.9
iv) Dairy Development - - - 100.0 - - - 28.0
v) Fisheries 266.9 2,054.3 2,054.3 1,804.0 - - 96.1 108.0
vi) Forestry and Wild Life 5,787.2 8,220.1 7,228.1 7,170.3 23,678.5 22,349.2 32,699.6 60,237.4
vii) Plantations - - - - - - - -
viii) Food Storage and Warehousing 73,110.2 1,900.0 1,100.1 2,850.0 1,12,721.6 0.5 0.5 15,160.5
ix) Agricultural Research and Education - - - - 2,789.4 3,252.6 3,252.6 4,832.1
x) Co-operation -3.8 187.0 187.0 - 498.2 4,661.3 4,661.3 12,953.0
xi) Others @ - - - - - - - -
2. Rural Development 1,23,661.3 1,51,690.0 1,37,890.0 1,46,067.3 2,31,312.0 3,62,185.0 4,18,530.0 5,14,510.3
3. Special Area Programmes - - - - 59,116.2 85,441.0 86,416.0 1,15,600.0
of which: Hill Areas - - - - - - - -
4. Major and Medium Irrigation and Flood Control 31,495.6 45,735.6 19,337.2 51,175.1 3,10,732.5 7,97,958.9 7,97,958.9 8,42,120.1
5. Energy 8,700.5 18,900.0 15,300.1 18,604.8 8,31,287.4 12,98,185.9 21,75,034.3 10,45,572.0
6. Industry and Minerals (i to iv) 597.6 7,186.0 3,586.0 4,869.4 6,939.4 6,380.0 6,380.0 6,703.7
i) Village and Small Industries 341.9 4,550.0 1,250.0 1,750.0 1,515.8 1,775.0 1,775.0 2,198.7
ii) Iron and Steel Industries - - - - - - - -
iii) Non-Ferrous Mining and Metallurgical Industries - - - - 173.5 205.0 205.0 205.0
iv) Others # 255.7 2,636.0 2,336.0 3,119.3 5,250.0 4,400.0 4,400.0 4,300.0
7. Transport (i + ii) 1,52,571.1 1,50,011.4 1,31,411.4 1,29,675.0 8,32,475.1 20,54,245.7 23,63,745.7 22,56,464.6
i) Roads and Bridges 1,40,051.0 1,32,280.0 1,22,780.0 1,15,350.0 7,63,528.4 19,49,045.7 21,28,045.7 20,51,224.6
ii) Others ** 12,520.1 17,731.4 8,631.4 14,325.0 68,946.6 1,05,200.0 2,35,700.0 2,05,240.0
8. Communications - - - - - - - -

State Finances : A Study of Budgets of 2019-20
308
Item
UTTARAKHAND UTTAR PRADESH
2017-18(Accounts)
2018-19(Budget
Estimates)
2018-19(Revised
Estimates)
2019-20(Budget
Estimates)
2017-18(Accounts)
2018-19(Budget
Estimates)
2018-19(Revised
Estimates)
2019-20(Budget
Estimates)
1 2 3 4 5 2 3 4 5
9. Science, Technology and Environment - - - - - - - 1,000.0
10. General Economic Services (i + ii) 5,808.3 11,228.7 8,328.7 11,660.0 35,400.3 56,093.5 59,093.5 73,356.9
i) Tourism 5,808.3 11,228.7 8,328.7 11,660.0 35,400.3 56,093.5 59,093.5 73,290.2
ii) Others @@ - - - - - - - 66.8
2. Non-Development (General Services) 80,441.2 75,298.7 74,523.7 77,719.1 2,77,577.7 4,37,759.1 5,68,094.5 5,17,494.5
II. Discharge of Internal Debt (1 to 8) 7,61,130.5 3,12,589.0 3,12,589.0 2,81,520.0 13,46,113.6 29,10,007.4 19,10,008.4 33,77,798.7
1. Market Loans 83,000.0 1,01,119.0 1,01,119.0 60,050.0 4,42,200.0 12,69,333.0 12,69,333.0 13,87,693.0
2. Loans from LIC - - - - 69.0 58.0 58.0 47.3
3. Loans from SBI and other Banks - - - - - - - -
4. Loans from NABARD 46,970.9 60,000.0 60,000.0 70,000.0 1,39,659.8 1,45,169.7 1,45,170.7 1,62,404.1
5. Loans from National Co-operative
Development Corporation 625.7 1,400.0 1,400.0 1,400.0 1,931.0 2,184.7 2,184.7 -
6. WMA from RBI 5,93,090.5 1,10,000.0 1,10,000.0 1,10,000.0 2,93,295.0 10,00,000.0 - 10,00,000.0
7. Special Securities issued to NSSF 37,443.4 40,000.0 40,000.0 40,000.0 4,64,304.6 4,87,164.2 4,87,164.2 5,12,207.4
8. Others - 70.0 70.0 70.0 4,654.1 6,097.7 6,097.7 3,15,446.9
of which: Land Compensation Bonds - - - - - 7.9 7.9 7.9
III. Repayment of Loans to the Centre (1 to 7) 4,031.8 5,611.0 5,611.0 6,111.0 1,54,096.8 1,44,666.5 1,44,665.0 1,59,649.2
1. State Plan Schemes 3,983.8 5,500.0 5,500.0 6,000.0 - 1,43,990.6 1,43,990.6 -
of which: Advance release of Plan
Assistance for Natural Calamities - - - - - - - -
2. Central Plan Schemes - 1.0 1.0 1.0 - - - -
3. Centrally Sponsored Schemes - 10.0 10.0 10.0 - - - -
4. Non-Plan (i + ii) 48.0 100.0 100.0 100.0 1,54,096.8 676.0 674.4 1,59,649.2
i) Relief for Natural Calamities - - - - - - - -
ii) Others 48.0 100.0 100.0 100.0 1,54,096.8 676.0 674.4 1,59,649.2
5. Ways and Means Advances from Centre - - - - - - - -
6. Loans for Special Schemes - - - - - - - -
7. Others - - - - - - - -
IV. Loans and Advances by State Governments (1 + 2)
7,682.9 19,198.3 21,611.3 28,281.3 1,50,928.7 2,07,390.2 7,72,435.2 2,72,845.4
1. Development Purposes (a + b) 7,682.9 19,148.3 21,561.3 28,171.3 1,50,658.5 2,06,318.2 7,71,363.2 2,72,303.3
a) Social Services ( 1 to 7) 51.9 30.0 30.0 60.0 44,541.1 81,641.9 81,641.9 58,321.4
1. Education, Sports, Art and Culture - - - - - - - -
2. Medical and Public Health - - - - - - - -
3. Family Welfare - - - - - - - -
4. Water Supply and Sanitation - - - - 16,372.2 30,000.0 30,000.0 15,000.0
5. Housing - - - - - - - -
6. Government Servants (Housing) 51.9 30.0 30.0 60.0 8,571.8 11,062.0 11,062.0 11,046.5
7. Others - - - - 19,597.1 40,579.9 40,579.9 32,274.9
b) Economic Services (1 to 10) 7,631.0 19,118.3 21,531.3 28,111.3 1,06,117.4 1,24,676.2 6,89,721.2 2,13,981.9
1. Crop Husbandry 500.0 3,000.0 12,200.0 1,000.0 - - - -
2. Soil and Water Conservation - - - - - - - -
3. Food Storage and Warehousing - - - - - - - -
4. Co-operation 43.7 281.3 281.3 10,000.0 1,000.0 426.0 426.0 2,500.0
5. Major and Medium Irrigation, etc. - - - - - - - -
6. Power Projects 6,263.6 14,837.0 8,350.1 16,111.3 - - 61,545.0 -
Appendix IV : Capital Expenditure of States and Union Territories with Legislature (Contd.)(₹ Lakh)

Appendix IV
309
Item
UTTARAKHAND UTTAR PRADESH
2017-18(Accounts)
2018-19(Budget
Estimates)
2018-19(Revised
Estimates)
2019-20(Budget
Estimates)
2017-18(Accounts)
2018-19(Budget
Estimates)
2018-19(Revised
Estimates)
2019-20(Budget
Estimates)
1 2 3 4 5 2 3 4 5
7. Village and Small Industries - - - - - - - -
8. Other Industries and Minerals - - - - 28,436.0 30,000.0 30,000.0 30,000.0
9. Rural Development - - - - - - - -
10. Others 823.6 1,000.0 700.0 1,000.0 76,681.4 94,250.3 5,97,750.3 1,81,481.9
2. Non-Development Purposes (a + b) - 50.0 50.0 110.0 270.2 1,072.1 1,072.1 542.0
a) Government Servants (other than Housing) - - - - 270.2 1,072.1 1,072.1 542.0
b) Miscellaneous - 50.0 50.0 110.0 - - - -
V. Inter-State Settlement - - - - - - - -
VI. Contingency Fund 48,149.9 40,000.0 42,619.0 40,000.0 41,300.1 20,000.0 20,000.0 20,000.0
VII. State Provident Funds, etc. (1 + 2) 1,22,132.0 71,830.2 65,300.4 77,083.2 9,18,794.2 11,51,175.0 11,51,175.0 14,43,450.0
1. State Provident Funds 1,17,812.8 69,300.0 63,000.0 74,300.0 8,92,261.3 11,24,665.0 11,24,665.0 13,98,440.0
2. Others 4,319.1 2,530.2 2,300.4 2,783.2 26,533.0 26,510.0 26,510.0 45,010.0
VIII. Reserve Funds (1 to 4) 12,726.5 1,340.8 1,218.9 1,475.0 7,00,281.4 17,70,648.3 17,40,631.7 18,98,308.7
1. Depreciation/Renewal Reserve Funds 12,123.0 - - 0.1 - - - -
2. Sinking Funds - - - - 4,42,200.0 12,69,333.0 12,69,333.0 13,87,693.0
3. Famine Relief Fund - - - - - - - -
4. Others 603.5 1,340.8 1,218.9 1,474.9 2,58,081.4 5,01,315.3 4,71,298.7 5,10,615.7
IX. Deposits and Advances (1 to 4) 4,00,879.3 2,88,964.4 2,61,695.1 3,17,860.9 14,47,198.4 15,14,900.1 15,14,900.1 21,93,400.1
1. Civil Deposits 1,88,250.7 2,20,353.3 2,00,321.3 2,42,388.7 8,57,815.9 10,09,600.1 10,09,600.1 14,99,900.1
2. Deposits of Local Funds 1,35,522.6 54,195.6 48,268.8 59,615.2 3,00,362.3 2,69,700.0 2,69,700.0 3,32,700.0
3. Civil Advances 13,400.5 14,415.5 13,105.0 15,857.1 22,205.8 - - -
4. Others 63,705.4 - - - 2,66,814.5 2,35,600.0 2,35,600.0 3,60,800.0
X. Suspense and Miscellaneous (1 to 4) 45,24,494.9 25,783.2 23,439.3 16,32,871.5 13,85,80,612.9 3,85,33,232.3 3,85,63,248.9 3,78,98,232.3
1. Suspense -6,818.7 25,783.2 23,439.3 28,361.5 1,52,188.9 1,16,240.0 1,16,240.0 1,16,240.0
2. Cash Balance Investment Accounts 14,00,583.1 - - 15,01,000.0 3,52,90,761.3 2,82,00,000.0 2,82,00,000.0 2,75,65,000.0
3. Deposits with RBI - - - - 7,81,97,633.5 - - -
4. Others 31,30,730.5 - - 1,03,510.0 2,49,40,029.2 1,02,16,992.3 1,02,47,008.9 1,02,16,992.3
XI. Appropriation to Contingency Fund - - - - - - - -
XII. Remittances -1,19,762.1 3,29,442.3 2,99,493.0 3,61,376.5 32,83,524.0 4,70,000.0 4,70,000.0 4,70,000.0
A. Surplus (+)/Deficit (-) on Revenue Account -1,97,811.4 3,268.5 2,724.3 2,279.4 12,55,193.3 27,09,910.0 47,24,765.6 27,77,735.8
B. Surplus (+)/Deficit(-) on Capital Account 1,92,544.5 -46,493.6 -76,744.6 -9,725.5 -2,01,492.7 -24,48,416.2 -47,19,567.9 -31,64,397.3
C. Overall Surplus (+)/Deficit (-) (A+B) -5,266.9 -43,225.1 -74,020.3 -7,446.1 10,53,700.6 2,61,493.8 5,197.7 -3,86,661.5
D. Financing of Surplus (+)/Deficit (-) (C = i to iii) -5,267.2 -43,225.0 -74,021.0 -7,446.0 10,53,700.7 2,61,494.0 5,198.0 -3,86,662.0
i. Increase (+)/Decrease (-) in Cash Balances 1,335.0 -43,225.0 -74,021.0 -8,446.0 1,54,586.0 61,494.0 -1,94,802.0 48,338.0
a) Opening Balance 1,15,765.0 70,961.0 1,17,100.0 43,079.0 -1,28,065.0 66,929.0 10,17,349.0 8,22,547.0
b) Closing Balance 1,17,100.0 27,736.0 43,079.0 34,633.0 26,521.0 1,28,423.0 8,22,547.0 8,70,885.0
ii. Withdrawals from (-)/Additions to (+) Cash Balance Investment Account (net) -6,602.2 - - 1,000.0 8,99,114.7 2,00,000.0 2,00,000.0 -4,35,000.0
iii. Increase (-)/Decrease (+) in Ways and Means Advances and Overdrafts from RBI (net) - - - - - - - -
Appendix IV : Capital Expenditure of States and Union Territories with Legislature (Contd.)(₹ Lakh)
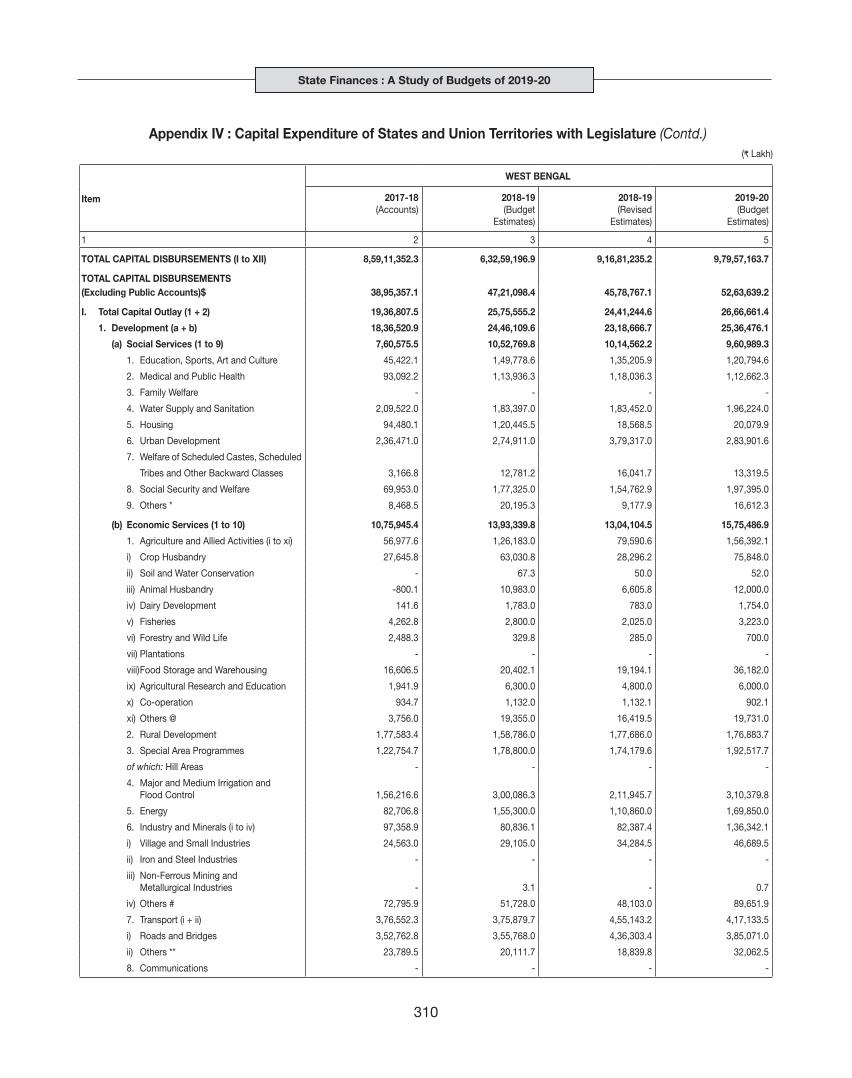
State Finances : A Study of Budgets of 2019-20
310
Appendix IV : Capital Expenditure of States and Union Territories with Legislature (Contd.)(₹ Lakh)
Item
WEST BENGAL
2017-18(Accounts)
2018-19(Budget
Estimates)
2018-19(Revised
Estimates)
2019-20(Budget
Estimates)
1 2 3 4 5
TOTAL CAPITAL DISBURSEMENTS (I to XII) 8,59,11,352.3 6,32,59,196.9 9,16,81,235.2 9,79,57,163.7
TOTAL CAPITAL DISBURSEMENTS (Excluding Public Accounts)$ 38,95,357.1 47,21,098.4 45,78,767.1 52,63,639.2
I. Total Capital Outlay (1 + 2) 19,36,807.5 25,75,555.2 24,41,244.6 26,66,661.4
1. Development (a + b) 18,36,520.9 24,46,109.6 23,18,666.7 25,36,476.1
(a) Social Services (1 to 9) 7,60,575.5 10,52,769.8 10,14,562.2 9,60,989.3
1. Education, Sports, Art and Culture 45,422.1 1,49,778.6 1,35,205.9 1,20,794.6
2. Medical and Public Health 93,092.2 1,13,936.3 1,18,036.3 1,12,662.3
3. Family Welfare - - - -
4. Water Supply and Sanitation 2,09,522.0 1,83,397.0 1,83,452.0 1,96,224.0
5. Housing 94,480.1 1,20,445.5 18,568.5 20,079.9
6. Urban Development 2,36,471.0 2,74,911.0 3,79,317.0 2,83,901.6
7. Welfare of Scheduled Castes, Scheduled
Tribes and Other Backward Classes 3,166.8 12,781.2 16,041.7 13,319.5
8. Social Security and Welfare 69,953.0 1,77,325.0 1,54,762.9 1,97,395.0
9. Others * 8,468.5 20,195.3 9,177.9 16,612.3
(b) Economic Services (1 to 10) 10,75,945.4 13,93,339.8 13,04,104.5 15,75,486.9
1. Agriculture and Allied Activities (i to xi) 56,977.6 1,26,183.0 79,590.6 1,56,392.1
i) Crop Husbandry 27,645.8 63,030.8 28,296.2 75,848.0
ii) Soil and Water Conservation - 67.3 50.0 52.0
iii) Animal Husbandry -800.1 10,983.0 6,605.8 12,000.0
iv) Dairy Development 141.6 1,783.0 783.0 1,754.0
v) Fisheries 4,262.8 2,800.0 2,025.0 3,223.0
vi) Forestry and Wild Life 2,488.3 329.8 285.0 700.0
vii) Plantations - - - -
viii) Food Storage and Warehousing 16,606.5 20,402.1 19,194.1 36,182.0
ix) Agricultural Research and Education 1,941.9 6,300.0 4,800.0 6,000.0
x) Co-operation 934.7 1,132.0 1,132.1 902.1
xi) Others @ 3,756.0 19,355.0 16,419.5 19,731.0
2. Rural Development 1,77,583.4 1,58,786.0 1,77,686.0 1,76,883.7
3. Special Area Programmes 1,22,754.7 1,78,800.0 1,74,179.6 1,92,517.7
of which: Hill Areas - - - -
4. Major and Medium Irrigation and Flood Control 1,56,216.6 3,00,086.3 2,11,945.7 3,10,379.8
5. Energy 82,706.8 1,55,300.0 1,10,860.0 1,69,850.0
6. Industry and Minerals (i to iv) 97,358.9 80,836.1 82,387.4 1,36,342.1
i) Village and Small Industries 24,563.0 29,105.0 34,284.5 46,689.5
ii) Iron and Steel Industries - - - -
iii) Non-Ferrous Mining and Metallurgical Industries - 3.1 - 0.7
iv) Others # 72,795.9 51,728.0 48,103.0 89,651.9
7. Transport (i + ii) 3,76,552.3 3,75,879.7 4,55,143.2 4,17,133.5
i) Roads and Bridges 3,52,762.8 3,55,768.0 4,36,303.4 3,85,071.0
ii) Others ** 23,789.5 20,111.7 18,839.8 32,062.5
8. Communications - - - -

Appendix IV
311
Item
WEST BENGAL
2017-18(Accounts)
2018-19(Budget
Estimates)
2018-19(Revised
Estimates)
2019-20(Budget
Estimates)
1 2 3 4 5
9. Science, Technology and Environment - - - -
10. General Economic Services (i + ii) 5,795.2 17,468.7 12,312.0 15,988.0
i) Tourism 5,955.7 16,400.0 10,503.4 14,100.0
ii) Others @@ -160.6 1,068.7 1,808.6 1,888.0
2. Non-Development (General Services) 1,00,286.6 1,29,445.6 1,22,577.9 1,30,185.3
II. Discharge of Internal Debt (1 to 8) 24,00,978.7 40,53,992.1 40,47,455.0 45,20,002.4
1. Market Loans 11,60,666.0 12,39,745.5 12,39,745.5 16,55,191.0
2. Loans from LIC 34.7 35.0 38.4 37.3
3. Loans from SBI and other Banks - - - -
4. Loans from NABARD 22.5 30.0 25.0 25.0
5. Loans from National Co-operative
Development Corporation 1,832.6 2,090.0 2,254.0 2,374.5
6. WMA from RBI 5,39,487.0 21,00,000.0 21,00,000.0 21,00,000.0
7. Special Securities issued to NSSF 5,97,572.3 6,12,463.3 6,12,463.5 6,33,999.5
8. Others 1,01,363.7 99,628.3 92,928.6 1,28,375.1
of which: Land Compensation Bonds 0.5 0.3 - -
III. Repayment of Loans to the Centre (1 to 7) 1,00,113.7 1,04,288.5 1,04,238.5 83,198.0
1. State Plan Schemes 56,613.0 - - -
of which: Advance release of Plan
Assistance for Natural Calamities - - - -
2. Central Plan Schemes - - - -
3. Centrally Sponsored Schemes - - - -
4. Non-Plan (i + ii) 43,500.8 371.0 371.0 317.0
i) Relief for Natural Calamities - - - -
ii) Others 43,500.8 371.0 371.0 317.0
5. Ways and Means Advances from Centre - - - -
6. Loans for Special Schemes - - - -
7. Others - 1,03,917.5 1,03,867.5 82,881.0
IV. Loans and Advances by State Governments (1 + 2)
-3,055.8 87,262.7 85,829.0 93,777.4
1. Development Purposes (a + b) -3,277.9 86,918.7 85,622.0 93,550.2
a) Social Services ( 1 to 7) 17,797.6 50,352.7 25,252.0 50,252.2
1. Education, Sports, Art and Culture - - - -
2. Medical and Public Health 83.0 105.0 6.8 7.0
3. Family Welfare - - - -
4. Water Supply and Sanitation - - - -
5. Housing - - - -
6. Government Servants (Housing) 0.6 2.5 - -
7. Others 17,714.0 50,245.2 25,245.2 50,245.2
b) Economic Services (1 to 10) -21,075.5 36,566.0 60,370.1 43,298.0
1. Crop Husbandry - - - -
2. Soil and Water Conservation - - - -
3. Food Storage and Warehousing - - - -
4. Co-operation 1,008.0 360.0 360.0 220.0
5. Major and Medium Irrigation, etc. - - - -
6. Power Projects 3,545.5 2,500.0 22,500.0 5,000.0
Appendix IV : Capital Expenditure of States and Union Territories with Legislature (Contd.)(₹ Lakh)
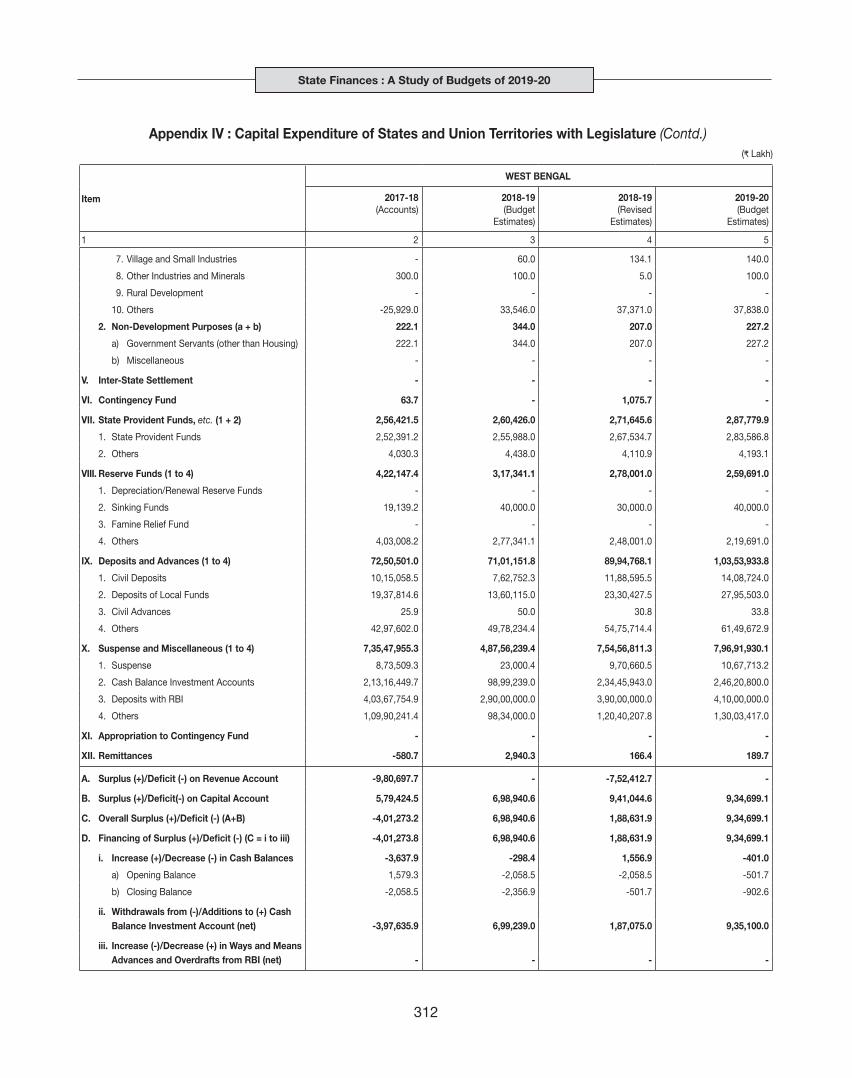
State Finances : A Study of Budgets of 2019-20
312
Item
WEST BENGAL
2017-18(Accounts)
2018-19(Budget
Estimates)
2018-19(Revised
Estimates)
2019-20(Budget
Estimates)
1 2 3 4 5
7. Village and Small Industries - 60.0 134.1 140.0
8. Other Industries and Minerals 300.0 100.0 5.0 100.0
9. Rural Development - - - -
10. Others -25,929.0 33,546.0 37,371.0 37,838.0
2. Non-Development Purposes (a + b) 222.1 344.0 207.0 227.2
a) Government Servants (other than Housing) 222.1 344.0 207.0 227.2
b) Miscellaneous - - - -
V. Inter-State Settlement - - - -
VI. Contingency Fund 63.7 - 1,075.7 -
VII. State Provident Funds, etc. (1 + 2) 2,56,421.5 2,60,426.0 2,71,645.6 2,87,779.9
1. State Provident Funds 2,52,391.2 2,55,988.0 2,67,534.7 2,83,586.8
2. Others 4,030.3 4,438.0 4,110.9 4,193.1
VIII. Reserve Funds (1 to 4) 4,22,147.4 3,17,341.1 2,78,001.0 2,59,691.0
1. Depreciation/Renewal Reserve Funds - - - -
2. Sinking Funds 19,139.2 40,000.0 30,000.0 40,000.0
3. Famine Relief Fund - - - -
4. Others 4,03,008.2 2,77,341.1 2,48,001.0 2,19,691.0
IX. Deposits and Advances (1 to 4) 72,50,501.0 71,01,151.8 89,94,768.1 1,03,53,933.8
1. Civil Deposits 10,15,058.5 7,62,752.3 11,88,595.5 14,08,724.0
2. Deposits of Local Funds 19,37,814.6 13,60,115.0 23,30,427.5 27,95,503.0
3. Civil Advances 25.9 50.0 30.8 33.8
4. Others 42,97,602.0 49,78,234.4 54,75,714.4 61,49,672.9
X. Suspense and Miscellaneous (1 to 4) 7,35,47,955.3 4,87,56,239.4 7,54,56,811.3 7,96,91,930.1
1. Suspense 8,73,509.3 23,000.4 9,70,660.5 10,67,713.2
2. Cash Balance Investment Accounts 2,13,16,449.7 98,99,239.0 2,34,45,943.0 2,46,20,800.0
3. Deposits with RBI 4,03,67,754.9 2,90,00,000.0 3,90,00,000.0 4,10,00,000.0
4. Others 1,09,90,241.4 98,34,000.0 1,20,40,207.8 1,30,03,417.0
XI. Appropriation to Contingency Fund - - - -
XII. Remittances -580.7 2,940.3 166.4 189.7
A. Surplus (+)/Deficit (-) on Revenue Account -9,80,697.7 - -7,52,412.7 -
B. Surplus (+)/Deficit(-) on Capital Account 5,79,424.5 6,98,940.6 9,41,044.6 9,34,699.1
C. Overall Surplus (+)/Deficit (-) (A+B) -4,01,273.2 6,98,940.6 1,88,631.9 9,34,699.1
D. Financing of Surplus (+)/Deficit (-) (C = i to iii) -4,01,273.8 6,98,940.6 1,88,631.9 9,34,699.1
i. Increase (+)/Decrease (-) in Cash Balances -3,637.9 -298.4 1,556.9 -401.0
a) Opening Balance 1,579.3 -2,058.5 -2,058.5 -501.7
b) Closing Balance -2,058.5 -2,356.9 -501.7 -902.6
ii. Withdrawals from (-)/Additions to (+) Cash Balance Investment Account (net) -3,97,635.9 6,99,239.0 1,87,075.0 9,35,100.0
iii. Increase (-)/Decrease (+) in Ways and Means Advances and Overdrafts from RBI (net) - - - -
Appendix IV : Capital Expenditure of States and Union Territories with Legislature (Contd.)(₹ Lakh)

Appendix IV
313
Item
NATIONAL CAPITAL TERRITORy OF DELHI PUDUCHERRy
2017-18(Accounts)
2018-19(Budget
Estimates)
2018-19(Revised
Estimates)
2019-20(Budget
Estimates)
2017-18(Accounts)
2018-19(Budget
Estimates)
2018-19(Revised
Estimates)
2019-20(Budget
Estimates)
1 2 3 4 5 2 3 4 5
TOTAL CAPITAL DISBURSEMENTS (I to XII) 7,17,283.4 9,90,919.1 10,30,610.8 15,21,869.5 1,74,970.2 30,85,492.2 30,97,827.0 32,45,505.6
TOTAL CAPITAL DISBURSEMENTS (Excluding Public Accounts)$ 7,17,283.4 9,90,919.1 10,21,610.8 15,21,869.5 96,460.4 1,05,100.0 1,08,821.8 1,10,200.0
I. Total Capital Outlay (1 + 2) 3,24,292.3 5,47,458.5 4,17,698.8 9,64,718.0 39,439.0 43,850.0 44,613.8 52,208.1
1. Development (a + b) 3,01,464.2 5,26,861.5 3,90,479.8 9,14,288.0 30,625.1 37,792.5 41,069.3 48,002.5
(a) Social Services (1 to 9) 1,57,470.6 2,93,530.5 2,26,693.5 5,96,083.0 10,725.8 12,946.4 14,673.0 24,195.1
1. Education, Sports, Art and Culture 84,821.9 72,473.5 81,898.5 1,77,589.0 1,215.4 1,601.5 1,491.5 2,754.0
2. Medical and Public Health 34,567.3 98,807.0 41,305.0 1,02,298.0 810.7 960.5 1,915.2 10,667.5
3. Family Welfare - - - - - - - -
4. Water Supply and Sanitation - - - - 8,363.3 9,462.0 10,409.2 8,874.1
5. Housing 49.5 100.0 330.0 700.0 28.1 30.5 30.5 71.8
6. Urban Development 23,991.7 84,700.0 74,200.0 2,69,600.0 24.0 0.1 0.0 550.0
7. Welfare of Scheduled Castes, Scheduled
Tribes and Other Backward Classes 4,835.7 7,050.0 7,000.0 8,050.0 138.1 443.0 402.2 853.5
8. Social Security and Welfare 2,540.4 8,170.0 4,950.0 8,999.0 117.8 320.2 320.2 320.2
9. Others * 6,664.2 22,230.0 17,010.0 28,847.0 28.4 128.6 104.3 104.0
(b) Economic Services (1 to 10) 1,43,993.6 2,33,331.0 1,63,786.3 3,18,205.0 19,899.3 24,846.1 26,396.3 23,807.4
1. Agriculture and Allied Activities (i to xi) 1,996.4 3,900.0 3,422.0 4,470.0 544.0 912.9 1,723.8 1,507.7
i) Crop Husbandry - 550.0 2.0 550.0 -46.3 50.0 59.0 59.0
ii) Soil and Water Conservation - - - - - - - -
iii) Animal Husbandry 121.5 270.0 400.0 700.0 13.8 16.5 5.0 30.0
iv) Dairy Development - - - - - - - -
v) Fisheries 10.0 30.0 20.0 20.0 527.0 336.4 556.6 894.7
vi) Forestry and Wild Life 1,864.9 3,050.0 3,000.0 3,200.0 - - 53.2 11.0
vii) Plantations - - - - - - - -
viii) Food Storage and Warehousing - - - - - 10.0 550.0 -
ix) Agricultural Research and Education - - - - 49.5 - - -
x) Co-operation - - - - - 500.0 500.0 513.0
xi) Others @ - - - - - - - -
2. Rural Development 10,249.9 20,163.0 21,013.0 39,163.0 - - - -
3. Special Area Programmes - - - - - - - -
of which: Hill Areas - - - - - - - -
4. Major and Medium Irrigation and Flood Control 6,496.6 8,942.0 7,695.0 21,350.0 3,022.4 3,224.6 2,132.7 3,344.9
5. Energy 284.7 6,299.0 2,099.0 3,499.0 7,252.3 4,754.4 5,715.0 3,965.0
6. Industry and Minerals (i to iv) -10.0 10.0 10.0 10.0 200.0 266.0 266.0 716.0
i) Village and Small Industries -10.0 10.0 10.0 10.0 200.0 266.0 266.0 716.0
ii) Iron and Steel Industries - - - - -
iii) Non-Ferrous Mining and Metallurgical Industries - - - - -
iv) Others # - - - - -
7. Transport (i + ii) 1,24,960.8 1,93,702.0 1,29,162.3 2,48,703.0 6,482.8 8,712.0 10,290.2 10,386.9
i) Roads and Bridges 92,143.3 1,59,100.0 1,09,600.0 1,89,500.0 5,520.0 6,065.1 6,949.7 7,538.9
ii) Others ** 32,817.5 34,602.0 19,562.3 59,203.0 962.8 2,646.9 3,340.5 2,848.0
8. Communications - - - - - - - -
Appendix IV : Capital Expenditure of States and Union Territories with Legislature (Contd.)(₹ Lakh)
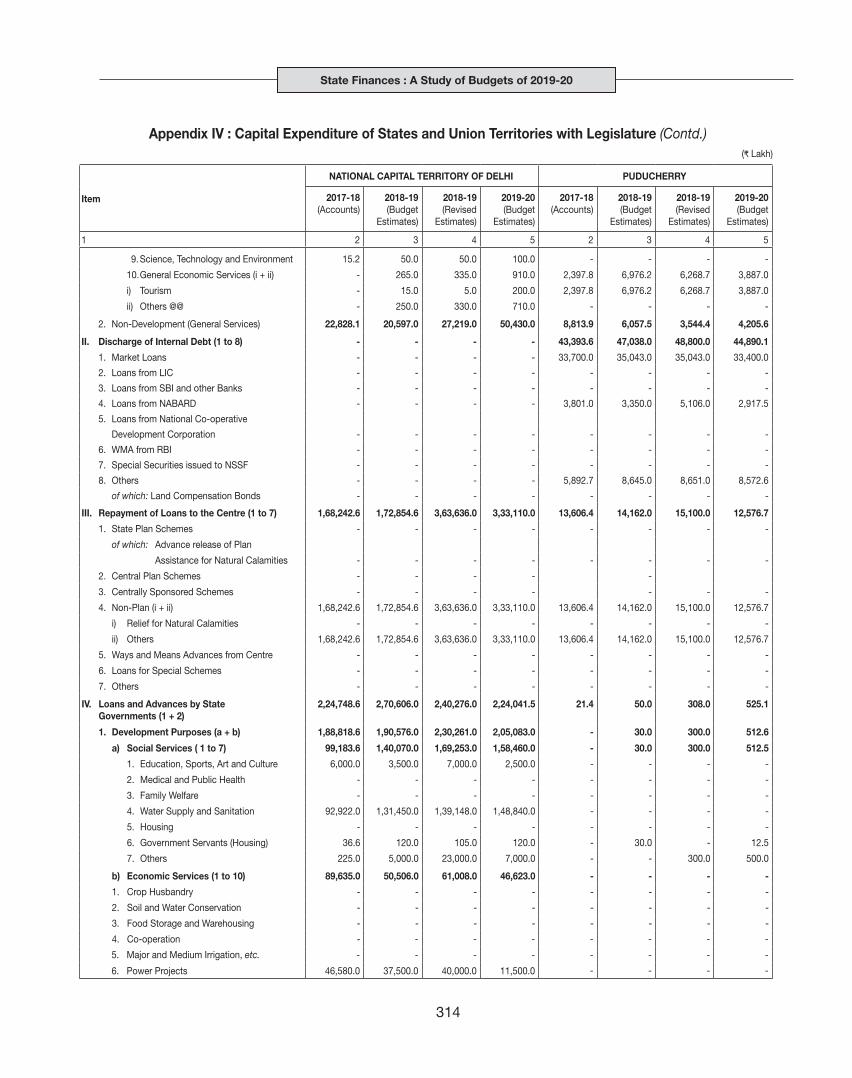
State Finances : A Study of Budgets of 2019-20
314
Item
NATIONAL CAPITAL TERRITORy OF DELHI PUDUCHERRy
2017-18(Accounts)
2018-19(Budget
Estimates)
2018-19(Revised
Estimates)
2019-20(Budget
Estimates)
2017-18(Accounts)
2018-19(Budget
Estimates)
2018-19(Revised
Estimates)
2019-20(Budget
Estimates)
1 2 3 4 5 2 3 4 5
9. Science, Technology and Environment 15.2 50.0 50.0 100.0 - - - -
10. General Economic Services (i + ii) - 265.0 335.0 910.0 2,397.8 6,976.2 6,268.7 3,887.0
i) Tourism - 15.0 5.0 200.0 2,397.8 6,976.2 6,268.7 3,887.0
ii) Others @@ - 250.0 330.0 710.0 - - - -
2. Non-Development (General Services) 22,828.1 20,597.0 27,219.0 50,430.0 8,813.9 6,057.5 3,544.4 4,205.6
II. Discharge of Internal Debt (1 to 8) - - - - 43,393.6 47,038.0 48,800.0 44,890.1
1. Market Loans - - - - 33,700.0 35,043.0 35,043.0 33,400.0
2. Loans from LIC - - - - - - - -
3. Loans from SBI and other Banks - - - - - - - -
4. Loans from NABARD - - - - 3,801.0 3,350.0 5,106.0 2,917.5
5. Loans from National Co-operative
Development Corporation - - - - - - - -
6. WMA from RBI - - - - - - - -
7. Special Securities issued to NSSF - - - - - - - -
8. Others - - - - 5,892.7 8,645.0 8,651.0 8,572.6
of which: Land Compensation Bonds - - - - - - - -
III. Repayment of Loans to the Centre (1 to 7) 1,68,242.6 1,72,854.6 3,63,636.0 3,33,110.0 13,606.4 14,162.0 15,100.0 12,576.7
1. State Plan Schemes - - - - - - - -
of which: Advance release of Plan
Assistance for Natural Calamities - - - - - - - -
2. Central Plan Schemes - - - - -
3. Centrally Sponsored Schemes - - - - - - -
4. Non-Plan (i + ii) 1,68,242.6 1,72,854.6 3,63,636.0 3,33,110.0 13,606.4 14,162.0 15,100.0 12,576.7
i) Relief for Natural Calamities - - - - - - - -
ii) Others 1,68,242.6 1,72,854.6 3,63,636.0 3,33,110.0 13,606.4 14,162.0 15,100.0 12,576.7
5. Ways and Means Advances from Centre - - - - - - - -
6. Loans for Special Schemes - - - - - - - -
7. Others - - - - - - - -
IV. Loans and Advances by State Governments (1 + 2)
2,24,748.6 2,70,606.0 2,40,276.0 2,24,041.5 21.4 50.0 308.0 525.1
1. Development Purposes (a + b) 1,88,818.6 1,90,576.0 2,30,261.0 2,05,083.0 - 30.0 300.0 512.6
a) Social Services ( 1 to 7) 99,183.6 1,40,070.0 1,69,253.0 1,58,460.0 - 30.0 300.0 512.5
1. Education, Sports, Art and Culture 6,000.0 3,500.0 7,000.0 2,500.0 - - - -
2. Medical and Public Health - - - - - - - -
3. Family Welfare - - - - - - - -
4. Water Supply and Sanitation 92,922.0 1,31,450.0 1,39,148.0 1,48,840.0 - - - -
5. Housing - - - - - - - -
6. Government Servants (Housing) 36.6 120.0 105.0 120.0 - 30.0 - 12.5
7. Others 225.0 5,000.0 23,000.0 7,000.0 - - 300.0 500.0
b) Economic Services (1 to 10) 89,635.0 50,506.0 61,008.0 46,623.0 - - - -
1. Crop Husbandry - - - - - - - -
2. Soil and Water Conservation - - - - - - - -
3. Food Storage and Warehousing - - - - - - - -
4. Co-operation - - - - - - - -
5. Major and Medium Irrigation, etc. - - - - - - - -
6. Power Projects 46,580.0 37,500.0 40,000.0 11,500.0 - - - -
Appendix IV : Capital Expenditure of States and Union Territories with Legislature (Contd.)(₹ Lakh)

Appendix IV
315
Item
NATIONAL CAPITAL TERRITORy OF DELHI PUDUCHERRy
2017-18(Accounts)
2018-19(Budget
Estimates)
2018-19(Revised
Estimates)
2019-20(Budget
Estimates)
2017-18(Accounts)
2018-19(Budget
Estimates)
2018-19(Revised
Estimates)
2019-20(Budget
Estimates)
1 2 3 4 5 2 3 4 5
7. Village and Small Industries 105.0 227.0 19.0 122.0 - - - -
8. Other Industries and Minerals - - - - - - - -
9. Rural Development - - - - - - - -
10. Others 42,950.0 12,779.0 20,989.0 35,001.0 - - - -
2. Non-Development Purposes (a + b) 35,930.0 80,030.0 10,015.0 18,958.5 21.4 20.0 8.0 12.5
a) Government Servants (other than Housing) 2.0 30.0 15.0 30.0 21.4 20.0 8.0 12.5
b) Miscellaneous 35,928.0 80,000.0 10,000.0 18,928.5 - - - -
V. Inter-State Settlement - - - - - - - -
VI. Contingency Fund - - - - - - - -
VII. State Provident Funds, etc. (1 + 2) - - - - 28,231.1 28,432.3 29,878.3 31,372.3
1. State Provident Funds - - - - 27,838.1 28,000.0 29,484.0 30,958.2
2. Others - - - - 393.0 432.3 394.3 414.1
VIII. Reserve Funds (1 to 4) - - - - 3,123.5 3,000.0 3,000.0 -
1. Depreciation/Renewal Reserve Funds - - - - - - - -
2. Sinking Funds - - - - 3,123.5 3,000.0 3,000.0 -
3. Famine Relief Fund - - - - - - - -
4. Others - - - - - - - -
IX. Deposits and Advances (1 to 4) - - - - 16,882.0 18,570.2 16,946.2 17,793.5
1. Civil Deposits - - - - 16,516.6 18,168.3 16,571.1 17,399.7
2. Deposits of Local Funds - - - - 281.2 309.3 282.1 296.2
3. Civil Advances - - - - 84.2 92.7 92.9 97.6
4. Others - - - - - - - -
X. Suspense and Miscellaneous (1 to 4) - - - - 1,645.7 28,71,172.5 28,79,786.0 30,23,775.3
1. Suspense - - - - -46,830.0 53,376.4 53,536.6 56,213.4
2. Cash Balance Investment Accounts - - - - 48,454.2 20,05,197.6 20,11,213.2 21,11,773.9
3. Deposits with RBI - - - - 8,12,566.4 8,15,004.1 8,55,754.3
4. Others - - - - 21.4 32.1 32.2 33.8
XI. Appropriation to Contingency Fund - - 9,000.0 - - - - -
XII. Remittances - - - - 28,627.5 59,217.1 59,394.7 62,364.5
A. Surplus (+)/Deficit (-) on Revenue Account 4,91,324.9 4,46,619.1 4,93,058.8 5,23,569.5 19,601.3 -200.0 3,521.8 -
B. Surplus (+)/Deficit(-) on Capital Account -4,57,607.3 -6,43,519.1 -3,45,610.8 -9,68,269.5 51,452.1 72,996.2 64,746.7 74,519.2
C. Overall Surplus (+)/Deficit (-) (A+B) 33,717.5 -1,96,900.0 1,47,448.0 -4,44,700.0 71,053.4 72,796.2 68,268.4 74,519.2
D. Financing of Surplus (+)/Deficit (-) (C = i to iii) 33,718.0 -1,96,900.0 1,47,448.0 -4,44,700.0 71,053.4 72,795.8 68,268.4 74,519.2
i. Increase (+)/Decrease (-) in Cash Balances 33,718.0 -1,96,900.0 1,47,448.0 -4,44,700.0 22,599.2 19,257.4 14,569.4 18,135.3
a) Opening Balance 2,63,534.0 1,96,900.0 2,97,252.0 4,44,700.0 98,359.5 1,01,912.2 1,21,169.7 1,35,739.1
b) Closing Balance 2,97,252.0 - 4,44,700.0 - 1,20,958.6 1,21,169.7 1,35,739.1 1,53,874.4
ii. Withdrawals from (-)/Additions to (+) Cash
Balance Investment Account (net) - - - - 48,454.2 53,538.4 53,699.0 56,383.9
iii. Increase (-)/Decrease (+) in Ways and Means
Advances and Overdrafts from RBI (net) - - - - - - - -
Appendix IV : Capital Expenditure of States and Union Territories with Legislature (Contd.)(₹ Lakh)

State Finances : A Study of Budgets of 2019-20
316
Appendix IV : Capital Expenditure of States and Union Territories with Legislature (Contd.)(₹ Lakh)
Item
ALL STATES AND UTs
2017-18(Accounts)
2018-19(Budget
Estimates)
2018-19(Revised
Estimates)
2019-20(Budget
Estimates)
1 2 3 4 5
TOTAL CAPITAL DISBURSEMENTS (I to XII) 90,76,82,854.2 61,22,04,004.0 69,95,18,088.4 70,68,96,865.1
TOTAL CAPITAL DISBURSEMENTS (Excluding Public Accounts)$ 5,84,51,860.9 7,86,97,617.5 8,11,53,729.5 8,58,69,135.8
I. Total Capital Outlay (1 + 2) 3,93,62,067.4 5,43,77,306.4 5,43,63,016.9 5,81,34,994.2
1. Development (a + b) 3,74,47,695.5 5,08,49,251.2 5,11,19,016.7 5,39,54,979.9
(a) Social Services (1 to 9) 92,81,897.8 1,43,85,497.2 1,34,22,345.5 1,46,91,308.0
1. Education, Sports, Art and Culture 13,13,495.1 21,59,298.5 19,55,199.5 22,21,692.3
2. Medical and Public Health 13,27,396.1 20,62,055.2 19,21,188.7 21,88,706.6
3. Family Welfare 38,663.1 44,738.5 59,393.6 53,763.6
4. Water Supply and Sanitation 28,70,159.1 35,78,478.4 33,90,403.1 42,80,353.5
5. Housing 8,89,832.9 17,14,833.2 15,70,702.7 11,27,417.3
6. Urban Development 15,46,374.7 25,88,758.3 26,23,155.2 29,20,443.0
7. Welfare of Scheduled Castes, Scheduled - - - -
Tribes and Other Backward Classes 8,24,081.5 12,42,000.6 10,56,239.8 9,53,037.0
8. Social Security and Welfare 2,44,433.1 4,95,007.6 4,50,392.8 4,99,078.2
9. Others * 2,27,462.3 5,00,326.9 3,95,670.2 4,46,816.5
(b) Economic Services (1 to 10) 2,81,65,797.7 3,64,63,754.1 3,76,96,671.2 3,92,63,671.9
1. Agriculture and Allied Activities (i to xi) 16,68,017.0 18,97,093.5 19,79,686.3 20,05,566.3
i) Crop Husbandry 1,56,617.7 4,29,592.0 3,29,583.1 3,77,035.7
ii) Soil and Water Conservation 2,89,066.2 3,59,184.1 3,55,906.6 3,40,962.0
iii) Animal Husbandry 51,496.9 1,10,111.8 1,00,550.6 1,13,565.5
iv) Dairy Development 2,536.1 17,185.9 15,048.4 29,746.4
v) Fisheries 83,994.4 1,13,916.9 1,33,359.2 1,11,248.8
vi) Forestry and Wild Life 2,51,366.4 3,44,514.1 3,70,352.6 3,99,942.2
vii) Plantations 222.0 - - -
viii) Food Storage and Warehousing 6,13,343.9 3,18,088.3 3,26,229.7 3,52,009.1
ix) Agricultural Research and Education 31,206.4 29,672.3 24,499.3 33,233.9
x) Co-operation 1,38,708.0 81,088.0 2,70,486.0 1,81,016.2
xi) Others @ 49,459.1 93,740.1 53,671.0 66,806.3
2. Rural Development 26,17,435.4 42,79,050.9 40,52,559.6 48,78,594.7
3. Special Area Programmes 4,79,656.4 7,13,754.6 7,09,478.1 9,20,294.3
of which: Hill Areas 15,110.5 45,796.1 18,365.4 20,451.6
4. Major and Medium Irrigation and Flood Control 82,59,667.2 1,11,94,072.0 1,09,95,803.9 1,01,46,748.0
5. Energy 46,47,206.3 45,66,805.1 53,56,453.5 55,15,835.5
6. Industry and Minerals (i to iv) 3,58,013.2 6,30,382.6 6,62,837.9 6,86,936.3
i) Village and Small Industries 1,06,535.6 1,65,133.2 1,77,314.2 2,11,257.1
ii) Iron and Steel Industries 52,004.8 28,194.0 28,018.2 26,290.0
iii) Non-Ferrous Mining and Metallurgical Industries 4,715.4 1,578.5 2,810.8 32,449.7
iv) Others # 1,94,757.3 4,35,476.9 4,54,694.7 4,16,939.5
7. Transport (i + ii) 93,37,412.2 1,13,13,209.9 1,23,40,935.6 1,22,00,039.7
i) Roads and Bridges 85,01,696.9 1,05,56,984.0 1,15,61,514.6 1,13,37,926.4
ii) Others ** 8,35,715.3 7,56,225.9 7,79,421.0 8,62,113.2
8. Communications 178.0 54,000.0 81,400.0 783.0

Appendix IV
317
Item
ALL STATES AND UTs
2017-18(Accounts)
2018-19(Budget
Estimates)
2018-19(Revised
Estimates)
2019-20(Budget
Estimates)
1 2 3 4 5
9. Science, Technology and Environment 11,370.3 99,199.6 55,047.5 61,634.2
10. General Economic Services (i + ii) 7,86,841.7 17,16,186.0 14,62,468.9 28,47,239.9
i) Tourism 2,37,218.2 4,16,113.3 3,69,735.9 4,53,576.5
ii) Others @@ 5,49,623.5 13,00,072.8 10,92,733.0 23,93,663.4
2. Non-Development (General Services) 19,14,371.9 35,28,055.1 32,44,000.2 41,80,014.2
II. Discharge of Internal Debt (1 to 8) 2,40,55,920.7 2,93,23,962.9 2,97,25,988.2 3,31,78,572.7
1. Market Loans 77,25,581.6 1,19,37,948.2 1,27,71,577.9 1,37,40,162.1
2. Loans from LIC 81,778.9 75,234.9 75,165.3 66,731.8
3. Loans from SBI and other Banks 4,54,644.4 7,40,933.4 11,80,094.9 13,96,358.4
4. Loans from NABARD 15,13,897.3 17,04,798.7 17,20,159.7 19,89,127.8
5. Loans from National Co-operative - - - -
Development Corporation 48,902.4 54,916.7 1,12,864.9 97,717.0
6. WMA from RBI 97,83,656.9 99,13,054.1 86,97,513.0 1,00,59,694.0
7. Special Securities issued to NSSF 37,60,489.3 38,79,066.3 38,64,432.6 40,13,867.6
8. Others 6,86,969.9 10,18,010.6 13,04,179.8 18,14,913.9
of which: Land Compensation Bonds 4,28,594.3 6,73,639.5 6,73,640.3 6,95,571.3
III. Repayment of Loans to the Centre (1 to 7) 14,87,572.8 16,14,960.5 18,08,590.1 19,17,509.3
1. State Plan Schemes 9,99,804.8 9,95,667.3 11,42,257.3 10,22,409.0
of which: Advance release of Plan - - - -
Assistance for Natural Calamities - - - -
2. Central Plan Schemes - 1.5 75.1 75.1
3. Centrally Sponsored Schemes 401.0 645.4 715.9 921.2
4. Non-Plan (i + ii) 3,87,856.9 2,23,137.8 4,15,710.3 5,14,441.1
i) Relief for Natural Calamities - - - -
ii) Others 3,87,856.9 2,23,137.8 4,15,710.3 5,14,441.1
5. Ways and Means Advances from Centre 106.9 100.0 79.7 87.7
6. Loans for Special Schemes 70.3 75.1 74.7 77.7
7. Others 99,333.0 3,95,333.4 2,49,677.0 3,79,497.6
IV. Loans and Advances by State Governments (1 + 2)
37,84,601.3 40,35,375.1 51,33,742.3 40,94,112.1
1. Development Purposes (a + b) 36,96,185.8 38,80,112.0 50,38,443.5 39,84,501.4
a) Social Services ( 1 to 7) 16,46,006.8 15,60,788.7 18,02,361.2 18,39,088.2
1. Education, Sports, Art and Culture 37,925.0 9,484.0 65,695.3 90,924.0
2. Medical and Public Health 39,837.5 59,785.4 66,223.0 72,019.2
3. Family Welfare - - - -
4. Water Supply and Sanitation 3,63,259.8 5,11,879.1 6,12,281.6 6,51,622.1
5. Housing 2,20,561.2 76,781.3 1,77,010.3 76,061.1
6. Government Servants (Housing) 1,11,620.5 1,57,448.3 1,60,719.9 1,42,091.0
7. Others 8,72,802.7 7,45,410.5 7,20,431.1 8,06,370.8
b) Economic Services (1 to 10) 20,50,179.0 23,19,323.3 32,36,082.3 21,45,413.2
1. Crop Husbandry 22,825.9 24,687.1 43,714.6 49,138.2
2. Soil and Water Conservation -833.9 - - -
3. Food Storage and Warehousing 70,062.0 65,678.1 1,38,352.5 58,388.1
4. Co-operation 4,75,218.5 4,99,538.8 4,83,881.8 1,35,836.9
5. Major and Medium Irrigation, etc. - 2,31,678.3 2,31,678.3 2,19,001.0
6. Power Projects 6,62,727.2 8,32,319.6 7,87,691.0 8,27,174.6
Appendix IV : Capital Expenditure of States and Union Territories with Legislature (Contd.)(₹ Lakh)

State Finances : A Study of Budgets of 2019-20
318
Item
ALL STATES AND UTs
2017-18(Accounts)
2018-19(Budget
Estimates)
2018-19(Revised
Estimates)
2019-20(Budget
Estimates)
1 2 3 4 5
7. Village and Small Industries 27,902.3 16,451.2 15,882.0 20,318.2
8. Other Industries and Minerals 37,982.2 90,460.1 97,664.3 45,735.1
9. Rural Development 383.6 5,780.0 780.0 780.0
10. Others 7,53,911.3 5,52,730.2 14,36,437.8 7,89,041.1
2. Non-Development Purposes (a + b) 88,415.5 1,55,263.1 95,298.9 1,09,610.7
a) Government Servants (other than Housing) 47,819.3 65,561.1 78,126.9 84,085.4
b) Miscellaneous 40,596.2 89,702.0 17,172.0 25,525.4
V. Inter-State Settlement 19,547.8 10.1 1,518.8 10.2
VI. Contingency Fund 1,66,562.5 2,01,100.0 2,06,765.4 2,01,100.0
VII. State Provident Funds, etc. (1 + 2) 1,41,78,798.0 1,04,55,282.8 1,31,37,233.7 1,62,86,641.0
1. State Provident Funds 61,59,599.5 61,79,674.9 67,03,179.6 77,43,837.7
2. Others 80,19,198.5 42,75,607.9 64,34,054.1 85,42,803.2
VIII. Reserve Funds (1 to 4) 61,46,501.7 77,93,546.0 82,09,082.0 70,80,702.9
1. Depreciation/Renewal Reserve Funds 19,782.2 6,586.1 6,289.1 6,306.2
2. Sinking Funds 16,78,641.9 25,55,896.7 24,57,525.0 25,94,594.5
3. Famine Relief Fund - 52,062.9 52,017.9 53,619.5
4. Others 44,48,077.6 51,79,000.3 56,93,250.0 44,26,182.8
IX. Deposits and Advances (1 to 4) 7,51,67,423.2 7,85,70,408.2 7,93,96,755.6 9,08,72,960.1
1. Civil Deposits 2,41,42,300.1 2,25,09,086.5 2,42,64,390.6 2,74,26,643.0
2. Deposits of Local Funds 2,38,31,053.4 2,56,43,150.4 2,85,47,740.3 2,98,30,741.7
3. Civil Advances 7,88,284.0 7,27,681.4 8,99,996.8 9,27,231.6
4. Others 2,64,05,785.6 2,96,90,489.9 2,56,84,627.8 3,26,88,343.8
X. Suspense and Miscellaneous (1 to 4) 71,25,06,313.7 41,19,65,778.3 49,37,11,577.2 48,06,55,674.9
1. Suspense 68,83,991.1 46,81,691.3 69,98,620.1 73,33,009.9
2. Cash Balance Investment Accounts 40,25,76,448.5 27,40,60,157.2 29,38,36,800.6 30,78,08,130.4
3. Deposits with RBI 19,94,49,537.6 4,82,04,346.7 10,98,93,589.3 8,46,64,460.7
4. Others 10,35,96,336.5 8,50,19,583.1 8,29,82,567.2 8,08,50,074.0
XI. Appropriation to Contingency Fund 15,000.0 - 9,000.0 0.0
XII. Remittances 3,07,92,545.1 1,38,66,273.8 1,38,14,818.3 1,44,74,587.8
A. Surplus (+)/Deficit (-) on Revenue Account -18,83,929.0 33,50,759.3 -12,79,723.1 8,11,840.8
B. Surplus (+)/Deficit(-) on Capital Account 35,40,557.5 -27,50,487.4 -98,68,892.3 -25,67,417.4
C. Overall Surplus (+)/Deficit (-) (A+B) 16,56,628.5 6,00,272.0 -1,11,48,615.4 -17,55,576.6
D. Financing of Surplus (+)/Deficit (-) (C = i to iii) 16,56,627.0 6,00,271.5 -1,11,48,615.1 -17,55,576.5
i. Increase (+)/Decrease (-) in Cash Balances 3,94,017.1 -6,98,293.7 -40,54,859.3 -16,31,281.8
a) Opening Balance 21,457.4 -21,48,375.3 12,34,005.9 -17,64,415.4
b) Closing Balance 4,15,474.4 -28,46,669.0 -28,20,853.4 -33,95,697.2
ii. Withdrawals from (-)/Additions to (+) Cash
Balance Investment Account (net) 13,61,968.4 13,28,565.2 -71,10,777.7 93,201.3
iii. Increase (-)/Decrease (+) in Ways and Means
Advances and Overdrafts from RBI (net) -99,358.5 -30,000.0 17,021.9 -2,17,496.0
– : Nil/Negligible/Not Available. $ : Sum of Items I to IV while items at II(3) and II(6) are excluded item II(3) has been taken on a net basis under capital receipts while item II(6) has been taken as financing item for overall
surplus/deficit.* : Include outlay on Information and Publicity, other Social Services, etc.@ : Include outlay on other Agricultural Programmes, etc.# : Include outlay on Cement and Non-Metallic Industries, Petro-Chemical Industries, Chemical Industries, Engineering Industries, Telecommunication and Electronic Industries,
Consumer Industries, Atomic Energy Industries, other Industries and Minerals, etc. ** : Include outlay on Indian Railway Commercial Lines, Indian Railway Strategic Lines, Ports and Light Houses, Shipping, Civil Aviation, Road Transport, Inland Water Transport, Other
Transport, etc.@@ : Include outlay on Foreign Trade and Export Promotion Technology, other General Economic Services, Investments in General Financial and Trading Institutions, International Financial
Institutions, etc.Note: Data pertaining to Jammu and Kashmir for 2017-18 are taken from CAG and are provisional.Source: Budget documents of state governments.
Appendix IV : Capital Expenditure of States and Union Territories with Legislature (Concld.)(₹ Lakh)
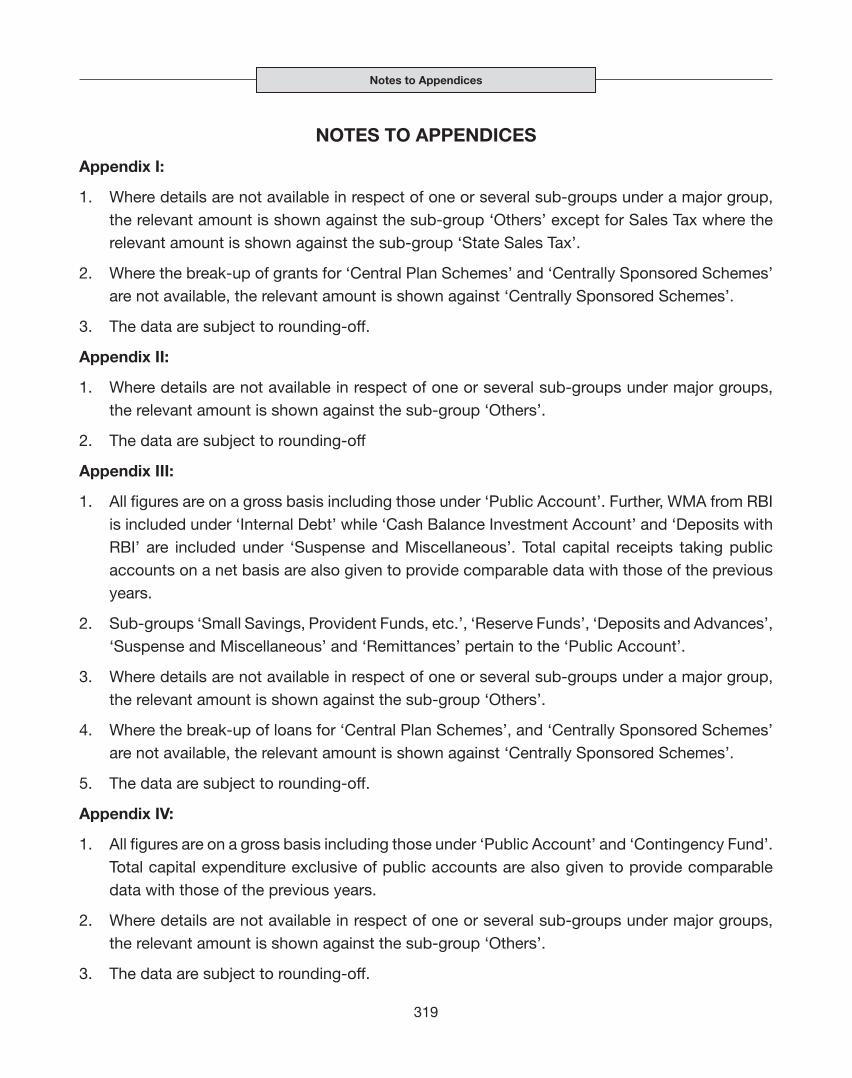
Notes to Appendices
319
NOTES TO APPENDICES
Appendix I:
1. Where details are not available in respect of one or several sub-groups under a major group, the relevant amount is shown against the sub-group ‘Others’ except for Sales Tax where the relevant amount is shown against the sub-group ‘State Sales Tax’.
2. Where the break-up of grants for ‘Central Plan Schemes’ and ‘Centrally Sponsored Schemes’ are not available, the relevant amount is shown against ‘Centrally Sponsored Schemes’.
3. The data are subject to rounding-off.
Appendix II:
1. Where details are not available in respect of one or several sub-groups under major groups, the relevant amount is shown against the sub-group ‘Others’.
2. The data are subject to rounding-off
Appendix III:
1. All figures are on a gross basis including those under ‘Public Account’. Further, WMA from RBI is included under ‘Internal Debt’ while ‘Cash Balance Investment Account’ and ‘Deposits with RBI’ are included under ‘Suspense and Miscellaneous’. Total capital receipts taking public accounts on a net basis are also given to provide comparable data with those of the previous years.
2. Sub-groups ‘Small Savings, Provident Funds, etc.’, ‘Reserve Funds’, ‘Deposits and Advances’, ‘Suspense and Miscellaneous’ and ‘Remittances’ pertain to the ‘Public Account’.
3. Where details are not available in respect of one or several sub-groups under a major group, the relevant amount is shown against the sub-group ‘Others’.
4. Where the break-up of loans for ‘Central Plan Schemes’, and ‘Centrally Sponsored Schemes’ are not available, the relevant amount is shown against ‘Centrally Sponsored Schemes’.
5. The data are subject to rounding-off.
Appendix IV:
1. All figures are on a gross basis including those under ‘Public Account’ and ‘Contingency Fund’. Total capital expenditure exclusive of public accounts are also given to provide comparable data with those of the previous years.
2. Where details are not available in respect of one or several sub-groups under major groups, the relevant amount is shown against the sub-group ‘Others’.
3. The data are subject to rounding-off.