state forest management and use for energy in estonia
TRANSCRIPT

State Forest
Management and
Use for Energy in
Estonia
Ulvar Kaubi
Timber Marketing Department
15th June 2011

2IN THIS PRESENTATION…
Facts and figures, manageable resources
RMK in numbers
History of the bio energy topic within the RMK
Experiences gained in the wood energy field
Threats & weaknesses
Opportunities & expectations
Energy wood in context of FSC & PEFC
Environmental aspects in procurement of residuals
Price dynamics
Forecast of the wood fuel supply for the coming years
Conclusion

3

4ESTONIA BY LAND CATEGORIES
Total area of Estonia by land categories
Agricultural land
30,1%
Forest land
52,3%
Others
6,0%
Bogs
5,7%
Urban settlements
3,6%
Inland water bodies
2,3%
Source: Centre of Forest Protection and Silviculture,
Yearbook 2006 *Lake Peipsi not included

5DISTRIBUTION OF FOREST LAND AREA
Distribution of forest land by ownership categories
State Forest
37%
Private Forest
48%
Non-restituted
forest
15%

6RMK BY LAND CATEGORIES
Area managed by State Forest Management Centre
Forest land
78,7%
Agricultural land
0,8%
Bogs
14,9% Others
2,4%
Tracks
1,9% Inland water bodies
1,3%
Source: Centre of Forest Protection and Silviculture,
NFI 2004

7STATE FOREST LAND BY FOREST CATEGORIES
Distribution of forest land by categories
Protected forest
17%
Protection forest
17%
Commercial forest
66%

8RMK IN NUMBERS
Volume of tree species on forest land
Distribution of growing stock by tree species- State forest districts
Pine
35,8%
Spruce
26,3%
Birch
20,1%
Others
2,1%
Grey alder
2,1%Black alder
5,0%
Aspen
8,6%
Source: Centre of Forest Protection and Silviculture,
NFI 2004

9FOREST ACT
The Forest Act was adopted in Jun 7, 2006 and entered
into force in Jan 1, 2007
Main aspects of the Forest Act for RMK:
RMK continues as governmental profit making institution
RMK operates within the area of government of the Ministry of the
Environment
Main operating areas of RMK remain same:
- forest administration and management
- creation of free recreation possibilities
ISO 14001, 9001, FSC (SW-FM/CoC-000176), PEFC certified (PEFC-002/A)
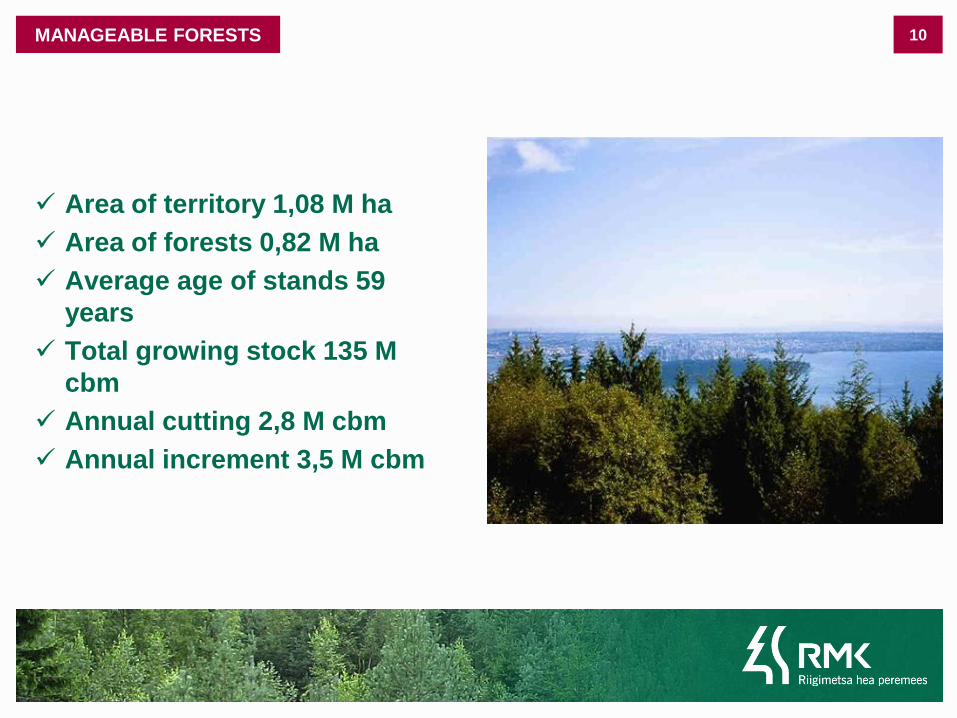
10MANAGEABLE FORESTS
Area of territory 1,08 M ha
Area of forests 0,82 M ha
Average age of stands 59
years
Total growing stock 135 M
cbm
Annual cutting 2,8 M cbm
Annual increment 3,5 M cbm

11STATE FOREST REGIONS FROM 01.07.2008

12RMK IN NUMBERS
RMK in numbers in 2010
Number of forest management regions 3
Number of forest districts 17
Number of employees 836 (no of workers 335)
The value of forests managed by RMK as biological assets 767,9 million EUR
Turnover 116,3 million EUR (growth 45%)
Operating profit 26,7 million EUR (growth 180%)
Revenue from forest transferred to thestate budget 3,3 million EUR

13DISTRIBUTION OF TURNOVER IN 2010
Roundwood sales
in assortments
89,9%
Sales of standing
crop
0,2%
Recreation, game
management
2,1%Sales of wood
chips, residuals
7,8%

14HISTORY OF THE BIO ENERGY TOPIC WITHIN THE RMK
2003 First Analysis of bioenergetic resources and technological
potential in Estonia in co-operation with AS Eesti Energia and
Erametsa Majandamise Ühistu
2006 Preparation of adoption of cutting waste as a renewable
energy source (funded by the European Regional Development
Fund ERDF)
2007 The promotion and environmental assessment of wood
based fuels (funded by the ERDF + Ministry of Internal Affairs of
the Republic of Estonia in the framework of the Southern-Finnish
and Estonian INTERREG III A programme)
2009 Start of selling wooden chips to CHP plants

15Sale of wooden chips from state forest
2009 2010 2011 2012
69 th m³ 262 th m³ 359 th m³ 400 th m³
157 GWh 595 GWh 815 GWh 909 GWh

16EXPERIENCES GAINED IN THE WOOD ENERGY FIELD
Minimum quantity at forest road side is one container (80-90 loose
m3). If two stocks are enough close to each other it could be
smaller per stock
Viable distance to local boiler-plant up to 70 km, to bigger
consumer (CHP) up to 150 km
In cutting area residuals (tops of trees, branches) are put on
forwarding trails, which restricts their later use for energy due to
high minerals content. Rough estimation that 66–80% of potential
quantity could not be used
To enable practical usage of forest residuals and ensure stabile
supply to customers chips made of roundwood should be added

17THREATS & WEAKNESSES
Average size of clearcut area in state forest is 1,3 ha only
Majority of forest soils have high humidity content and wouldn´t resist heavy machinery if soil is not frozen
Tree branches that have been used in forwarding trails consist minerals which makes them unusable due to high minerals content
Procurement cost of wooden residues is relatively high compared with the average amount available per site:
mobile chippers production 70-200 loose m3/h
average amount of residuals per cutting area is 150 loose m3 i.e work for 1-2 h
mobile chippers need usually “pockets” at forest road side which has not been built
New technology has been seen as a threat to the forest

18OPPORTUNITIES & EXPECTATIONS
Procurement of residues in smaller clearcut areas could grow if appropriate techology will be used
Whole tree method in cleanings of young stands and thinnings
Cleaning of drainage and forest improvement objects to collect brushwood
Deforestation in military training and infrastucture areas together with stump lifting
New CHP plants create additional demand
Development of energy wood logistics and machinery
Higher incomes to forest owner and economic development on rural areas
Increasing share of renewables in primary energy productions

19ENERGY WOOD IN CONTEXT OF FSC & PEFC
Sustainable use of forest = multiple use of forest
FSC International Standard - forest residual quantities must
be minimized during harvesting; rational solution to be find
to each tree and wood species
PEFC – forest to be managed in a balanced manner in
environmental, social and economic terms

20ENVIRONMENTAL ASPECTS IN PROCUREMENT OF RESIDUALS
Small size of cutting sites
Potential for forest fires, diseases and insect attacks in
stocks of residuals
Regeneration is hampered
Procurement difficulties on unfrozen grounds
Additional trample of soils
Cutting technology in young stands

21Dynamics of fuelwood price at forest road side (EEK/m3) 1997-2010
Küttepuidu hinna muutus riigimetsa majandaja vaheladudes 1997-2010
0
50
100
150
200
250
300
350
400
450
jaan
.97
juuli.9
7
jaan
.98
juuli.9
8
jaan
.99
juuli.9
9
jaan
.00
juuli.0
0
jaan
.01
juuli.0
1
jaan
.02
juuli.0
2
jaan
.03
juuli.0
3
jaan
.04
juuli.0
4
jaan
.05
juuli.0
5
jaan
.06
juuli.0
6
jaan
.07
juuli.0
7
jaan
.08
juuli.0
8
jaan
.09
juuli.0
9
jaan
.10
juuli.1
0

22Dynamics of energy wood price at customer Jan 2009 – Apr 2011 (€/m3)
0,0
5,0
10,0
15,0
20,0
25,0
30,0
35,0
40,0
jaan
.09
märts.09
mai.09
juuli.0
9
sept
.09
nov.09
jaan
.10
märts.10
mai.10
juuli.1
0
sept
.10
nov.10
jaan
.11
märts.11
chips
residuals
fuelwood
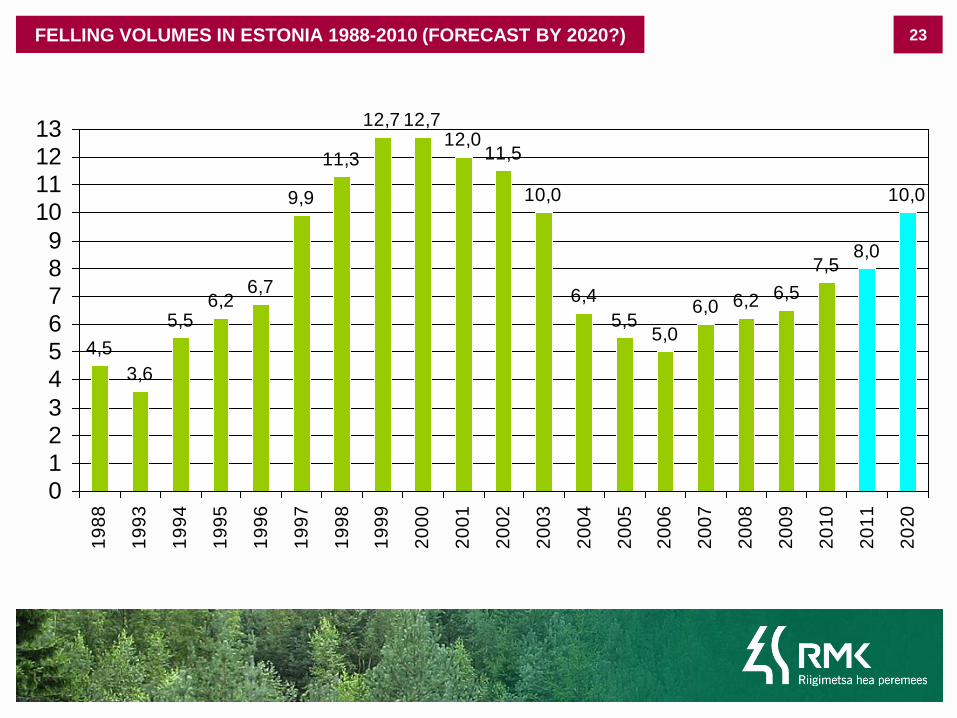
23FELLING VOLUMES IN ESTONIA 1988-2010 (FORECAST BY 2020?)
4,5
3,6
5,56,2
6,7
9,9
11,3
12,7 12,712,0
11,5
10,0
6,4
5,55,0
6,0 6,2 6,5
7,58,0
10,0
0123
456789
10111213
19
88
19
93
19
94
19
95
19
96
19
97
19
98
19
99
20
00
20
01
20
02
20
03
20
04
20
05
20
06
20
07
20
08
20
09
20
10
20
11
20
20

24FORECAST OF THE WOOD FUEL SUPPLY FOR THE COMING YEARS
Today we could use for energy production about 5 Mm3 of fuelwood and forest residues, but the actual production of fuelwood and different wooden residues today is 3.0 Mm3.
Out of total available quantity of wooden fuel today the share of traditional fuelwood is 64% and the share of harvesting residues is 36%. After 20 years the expected distribution by the assortments will be in opposite. Therefore in the future the main attention should be given to the utilization of harvesting residues and other wooden biomass otherwise in the long-run the supply with wood fuels will not be sufficient to keep the consumption on the present level.
There has been wood processing residues available for production of wood chips, but this amount will not grow in the future.
Mechanical wood (pulp) industry and energy producers start to compete for the same resource soon.

25CONCLUSION
All the wooden parts of trees after harvesting
of commercial wood are organic wastes, which
has been used for energy (heating) throughout
centuries and those should have the same
position in current energy balance
