state legislation, regulations, and hospital guidelines ... · morbidity and mortality weekly...
TRANSCRIPT
Continuing Education examination available at http://www.cdc.gov/mmwr/cme/conted_info.html#weekly.
U.S. Department of Health and Human ServicesCenters for Disease Control and Prevention
Morbidity and Mortality Weekly ReportWeekly / Vol. 64 / No. 23 June 19, 2015
Critical congenital heart defects (CCHD) occur in approxi-mately two of every 1,000 live births (1). Newborn screening provides an opportunity for reducing infant morbidity and mortality (2,3). In September 2011, the U.S. Department of Health and Human Services (HHS) Secretary endorsed the recommendation that critical congenital heart defects be added to the Recommended Uniform Screening Panel (RUSP) for all newborns (4). In 2014, CDC collaborated with the American Academy of Pediatrics (AAP) Division of State Government Affairs and the Newborn Screening Technical Assistance and Evaluation Program (NewSTEPs) to assess states’ actions for adopting newborn screening for CCHD. Forty-three states have taken action toward newborn screening for CCHD through legislation, regulations, or hospital guidelines. Among those 43, 32 (74%) are collecting or planning to collect CCHD screening data; however, the type of data collected by CCHD newborn screening programs varies by state. State mandates for newborn screening for CCHD will likely increase the number of newborns screened, allowing for the possibility of early identification and prevention of morbidity and mortality. Data collection at the state level is important for surveillance, monitoring of outcomes, and evaluation of state CCHD newborn screening programs.
Congenital heart defects occur in approximately eight of every 1,000 live births, one fourth of which are considered to be CCHD (1). CCHD are defined as those requiring surgery or catheterization before age 1 year. In the absence of early detec-tion, infants with CCHD are at risk for serious complications or death within the first few days or weeks of life (1). Newborn screening for CCHD uses pulse oximetry, a noninvasive tech-nology to measure blood oxygen saturation. Low oxygen satu-ration indicates hypoxemia, an early clinical sign of CCHD. Additional testing (e.g., repeat screening, echocardiogram) is
needed following an abnormal pulse oximetry screen (1) to determine whether CCHD are present (or to determine the cause of the abnormal result). Thus, unlike most newborn screening conditions, screening for CCHD is not based on performing a blood test. In addition, hypoxemia detected by screening could indicate a medical problem, and requires immediate follow-up before discharge from the hospital.
When accompanied by early identification and treatment, newborn screening provides an opportunity to reduce infant morbidity and mortality (2,3). The Secretary’s Advisory Committee on Heritable Disorders in Newborns and Children has provided national guidelines and recommendations on
State Legislation, Regulations, and Hospital Guidelines for Newborn Screening for Critical Congenital Heart Defects — United States, 2011–2014
Jill Glidewell, MSN1; Richard S. Olney, MD1; Cynthia Hinton, PhD2; Jim Pawelski, MS3; Marci Sontag, PhD4; Thalia Wood, MPH5; James E. Kucik, PhD6; Rachel Daskalov, MHA3; Jeff Hudson, MA3 (Author affiliations at end of text)
INSIDE631 Opioid Overdose Prevention Programs Providing
Naloxone to Laypersons — United States, 2014636 Coccidioidomycosis in a State Where It Is Not Known
To Be Endemic — Missouri, 2004–2013640 Update on Vaccine-Derived Polioviruses —
Worldwide, January 2014–March 2015647 Yellow Fever Vaccine Booster Doses:
Recommendations of the Advisory Committee on Immunization Practices, 2015
651 Notes from the Field: Tickborne Relapsing Fever Outbreak at an Outdoor Education Camp — Arizona, 2014
653 Notes from the Field: Update: Silicosis Mortality — United States, 1999–2013
655 QuickStats

Morbidity and Mortality Weekly Report
626 MMWR / June 19, 2015 / Vol. 64 / No. 23
The MMWR series of publications is published by the Center for Surveillance, Epidemiology, and Laboratory Services, Centers for Disease Control and Prevention (CDC), U.S. Department of Health and Human Services, Atlanta, GA 30329-4027.Suggested citation: [Author names; first three, then et al., if more than six.] [Report title]. MMWR Morb Mortal Wkly Rep 2015;64:[inclusive page numbers].
Centers for Disease Control and PreventionThomas R. Frieden, MD, MPH, Director
Harold W. Jaffe, MD, MA, Associate Director for Science Joanne Cono, MD, ScM, Director, Office of Science Quality
Chesley L. Richards, MD, MPH, Deputy Director for Public Health Scientific ServicesMichael F. Iademarco, MD, MPH, Director, Center for Surveillance, Epidemiology, and Laboratory Services
MMWR Editorial and Production Staff (Weekly)Sonja A. Rasmussen, MD, MS, Editor-in-Chief
Charlotte K. Kent, PhD, MPH, Executive Editor Jacqueline Gindler, MD, Acting EditorTeresa F. Rutledge, Managing Editor
Douglas W. Weatherwax, Lead Technical Writer-EditorTeresa M. Hood, MS, Jude C. Rutledge, Writer-Editors
Martha F. Boyd, Lead Visual Information SpecialistMaureen A. Leahy, Julia C. Martinroe,
Stephen R. Spriggs, Brian E Wood,Visual Information Specialists
Quang M. Doan, MBA, Phyllis H. King,Terraye M. Starr, Information Technology Specialists
MMWR Editorial BoardTimothy F. Jones, MD, Nashville, TN, ChairmanMatthew L. Boulton, MD, MPH, Ann Arbor, MI
Virginia A. Caine, MD, Indianapolis, INJonathan E. Fielding, MD, MPH, MBA, Los Angeles, CA
David W. Fleming, MD, Seattle, WAWilliam E. Halperin, MD, DrPH, MPH, Newark, NJ
King K. Holmes, MD, PhD, Seattle, WARima F. Khabbaz, MD, Atlanta, GA
Patricia Quinlisk, MD, MPH, Des Moines, IAPatrick L. Remington, MD, MPH, Madison, WIWilliam L. Roper, MD, MPH, Chapel Hill, NC
William Schaffner, MD, Nashville, TN
newborn screening, known as the RUSP, and this panel is reviewed and endorsed by the HHS Secretary (3). As of March 2015, 32 conditions were included in the RUSP. States use the RUSP as guidance when considering adopting conditions for their own screening panels (3). State decisions might differ depending on method of screening required or the legislative authority of the newborn screening program. When states add conditions to their state-specific screening panels, they do so by state legislation, or rules and regulations (5). In 2010, the Secretary’s Advisory Committee on Heritable Disorders in Newborns and Children recommended adding CCHD to the RUSP for all newborns (4). In September 2011, the HHS Secretary endorsed the recommendation.
To assess states’ actions for adopting newborn screening for CCHD, CDC collaborated with the AAP Division of State Government Affairs and NewSTEPs. AAP obtained primary information through direct contact and partnership with AAP state chapters. AAP monitored state legislation by use of tracking software; regulations and hospital guidelines were researched on state websites.
NewSTEPs is a program of the Association of Public Health Laboratories in collaboration with the Colorado School of Public Health, funded through a cooperative agreement from the Health Resources and Services Administration (6). NewSTEPs maintains a data repository of state newborn screening program metrics and provides education and techni-cal assistance to newborn screening programs. In January 2014, NewSTEPs distributed a survey on CCHD newborn screening
adoption and data collection practices to state CCHD newborn screening programs. The survey requested the status of CCHD mandates and requirements for data collection. If data collec-tion was required at the state level, additional information was requested on the type of data collected. All 50 states and the District of Columbia participated.
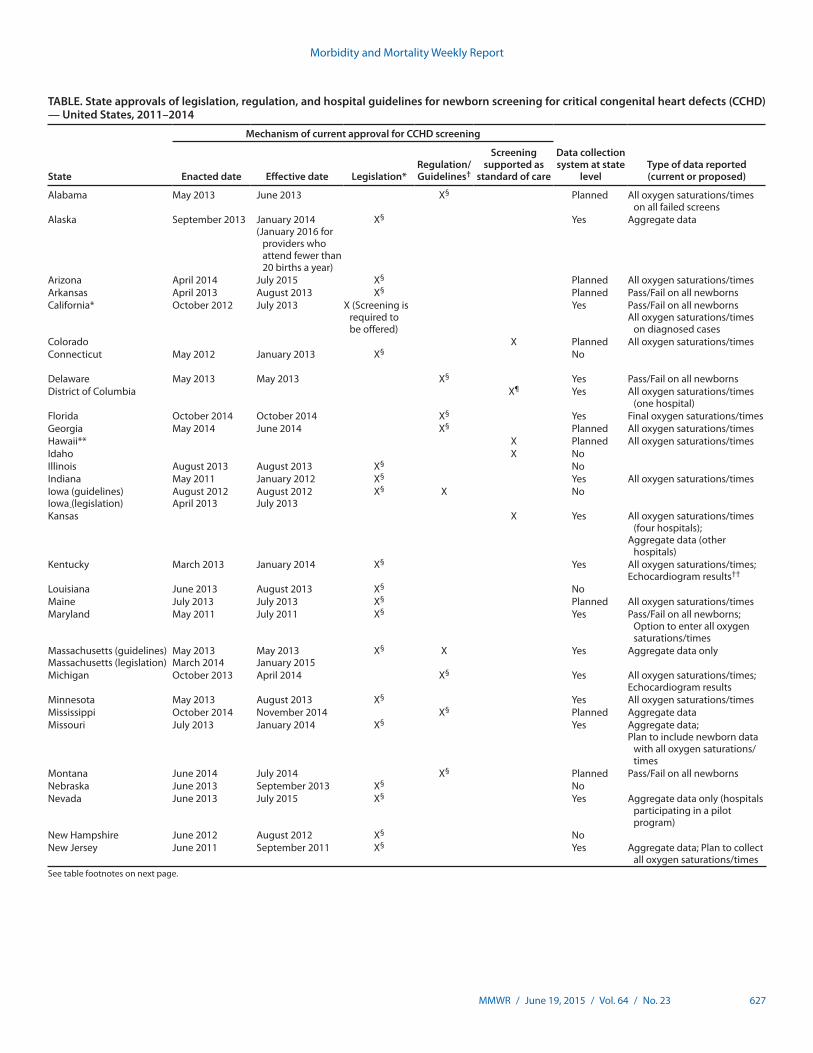
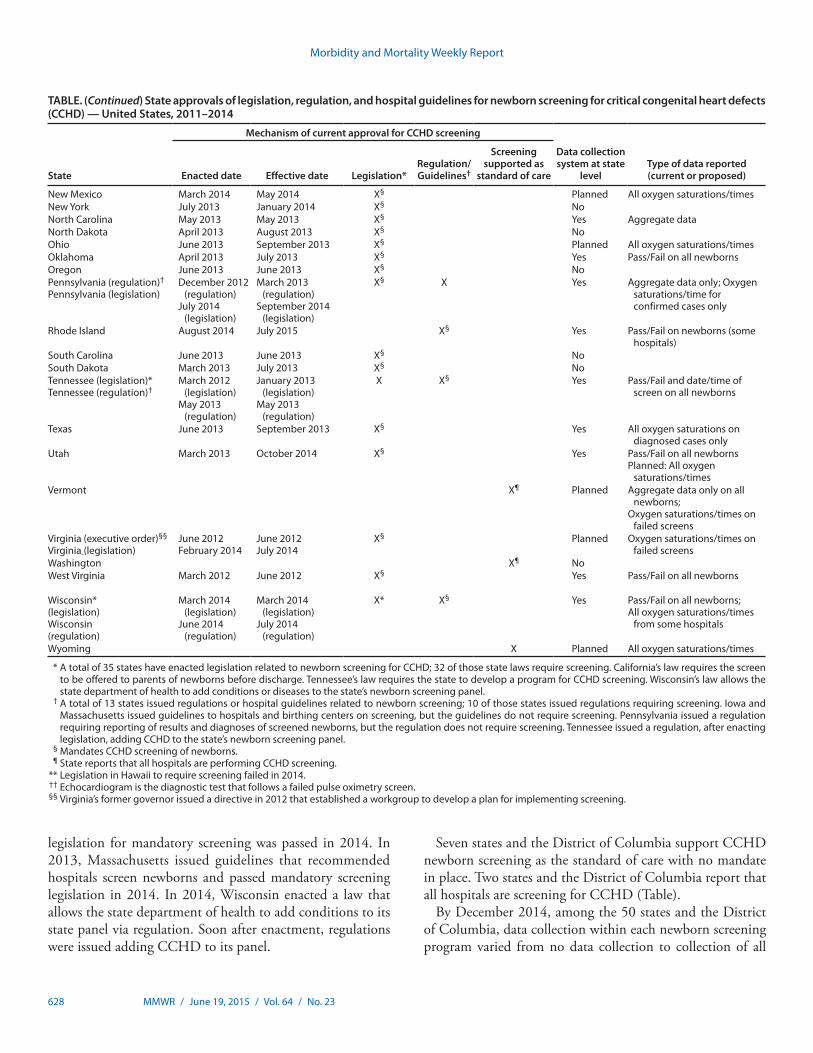
The survey findings indicated that 43 states have legislation, regulations, or hospital guidelines in place supporting CCHD newborn screening; 35 states have legislation, and 13 have regulations related to CCHD screening (Table). Among the 43, three states (Indiana, Maryland, and New Jersey) enacted legislation before the Secretary’s approval of adding CCHD to the RUSP in 2011 (Table). State adoption of CCHD screening peaked in 2013 with 25 states adopting screening (Figure 1).
The manner in which these 43 states developed universal screening varied substantially (Figure 2), and for some was a multistage process (Table). For example, California passed legislation requiring that CCHD screening be offered to parents of newborns. In 2013, Pennsylvania issued a regula-tion requiring reporting of results and diagnoses of screened newborns. However, the regulation did not mandate screening. In 2014, Pennsylvania enacted a law requiring screening. In 2012, Tennessee initially passed legislation that required the state’s genetic advisory committee to develop a program for addition of CCHD to its screening panel. In 2013, Tennessee added CCHD to its panel via regulation. In 2012, Virginia’s governor issued an executive order establishing a work group to develop a CCHD screening implementation plan, and
Morbidity and Mortality Weekly Report
MMWR / June 19, 2015 / Vol. 64 / No. 23 627
See table footnotes on next page.
TABLE. State approvals of legislation, regulation, and hospital guidelines for newborn screening for critical congenital heart defects (CCHD) — United States, 2011–2014
State
Mechanism of current approval for CCHD screening
Data collection system at state
levelType of data reported (current or proposed)Enacted date Effective date Legislation*
Regulation/Guidelines†
Screening supported as
standard of care
Alabama May 2013 June 2013 X§ Planned All oxygen saturations/times on all failed screens
Alaska September 2013 January 2014(January 2016 for
providers who attend fewer than 20 births a year)
X§ Yes Aggregate data
Arizona April 2014 July 2015 X§ Planned All oxygen saturations/timesArkansas April 2013 August 2013 X§ Planned Pass/Fail on all newbornsCalifornia* October 2012 July 2013 X (Screening is
required to be offered)
Yes Pass/Fail on all newbornsAll oxygen saturations/times
on diagnosed casesColorado X Planned All oxygen saturations/timesConnecticut May 2012 January 2013 X§ No
Delaware May 2013 May 2013 X§ Yes Pass/Fail on all newbornsDistrict of Columbia X¶ Yes All oxygen saturations/times
(one hospital)Florida October 2014 October 2014 X§ Yes Final oxygen saturations/timesGeorgia May 2014 June 2014 X§ Planned All oxygen saturations/timesHawaii** X Planned All oxygen saturations/timesIdaho X NoIllinois August 2013 August 2013 X§ NoIndiana May 2011 January 2012 X§ Yes All oxygen saturations/timesIowa (guidelines)Iowa (legislation)
August 2012April 2013
August 2012July 2013
X§ X No
Kansas X Yes All oxygen saturations/times (four hospitals);
Aggregate data (other hospitals)
Kentucky March 2013 January 2014 X§ Yes All oxygen saturations/times;Echocardiogram results††
Louisiana June 2013 August 2013 X§ NoMaine July 2013 July 2013 X§ Planned All oxygen saturations/timesMaryland May 2011 July 2011 X§ Yes Pass/Fail on all newborns;
Option to enter all oxygen saturations/times
Massachusetts (guidelines)Massachusetts (legislation)
May 2013March 2014
May 2013January 2015
X§ X Yes Aggregate data only
Michigan October 2013 April 2014 X§ Yes All oxygen saturations/times;Echocardiogram results
Minnesota May 2013 August 2013 X§ Yes All oxygen saturations/timesMississippi October 2014 November 2014 X§ Planned Aggregate dataMissouri July 2013 January 2014 X§ Yes Aggregate data;
Plan to include newborn data with all oxygen saturations/times
Montana June 2014 July 2014 X§ Planned Pass/Fail on all newbornsNebraska June 2013 September 2013 X§ NoNevada June 2013 July 2015 X§ Yes Aggregate data only (hospitals
participating in a pilot program)
New Hampshire June 2012 August 2012 X§ NoNew Jersey June 2011 September 2011 X§ Yes Aggregate data; Plan to collect
all oxygen saturations/times
Morbidity and Mortality Weekly Report
628 MMWR / June 19, 2015 / Vol. 64 / No. 23
TABLE. (Continued) State approvals of legislation, regulation, and hospital guidelines for newborn screening for critical congenital heart defects (CCHD) — United States, 2011–2014
State
Mechanism of current approval for CCHD screening
Data collection system at state
levelType of data reported (current or proposed)Enacted date Effective date Legislation*
Regulation/Guidelines†
Screening supported as
standard of care
New Mexico March 2014 May 2014 X§ Planned All oxygen saturations/timesNew York July 2013 January 2014 X§ NoNorth Carolina May 2013 May 2013 X§ Yes Aggregate dataNorth Dakota April 2013 August 2013 X§ NoOhio June 2013 September 2013 X§ Planned All oxygen saturations/timesOklahoma April 2013 July 2013 X§ Yes Pass/Fail on all newbornsOregon June 2013 June 2013 X§ NoPennsylvania (regulation)†
Pennsylvania (legislation)December 2012
(regulation)July 2014
(legislation)
March 2013 (regulation)
September 2014 (legislation)
X§ X Yes Aggregate data only; Oxygen saturations/time for confirmed cases only
Rhode Island August 2014 July 2015 X§ Yes Pass/Fail on newborns (some hospitals)
South Carolina June 2013 June 2013 X§ NoSouth Dakota March 2013 July 2013 X§ NoTennessee (legislation)*Tennessee (regulation)†
March 2012 (legislation)
May 2013 (regulation)
January 2013 (legislation)
May 2013 (regulation)
X X§ Yes Pass/Fail and date/time of screen on all newborns
Texas June 2013 September 2013 X§ Yes All oxygen saturations on diagnosed cases only
Utah March 2013 October 2014 X§ Yes Pass/Fail on all newbornsPlanned: All oxygen
saturations/timesVermont X¶ Planned Aggregate data only on all
newborns;Oxygen saturations/times on
failed screensVirginia (executive order)§§
Virginia (legislation)June 2012February 2014
June 2012July 2014
X§ Planned Oxygen saturations/times on failed screens
Washington X¶ NoWest Virginia March 2012 June 2012 X§ Yes Pass/Fail on all newborns
Wisconsin*(legislation)Wisconsin(regulation)
March 2014 (legislation)
June 2014 (regulation)
March 2014 (legislation)
July 2014 (regulation)
X* X§ Yes Pass/Fail on all newborns;All oxygen saturations/times
from some hospitals
Wyoming X Planned All oxygen saturations/times
* A total of 35 states have enacted legislation related to newborn screening for CCHD; 32 of those state laws require screening. California’s law requires the screen to be offered to parents of newborns before discharge. Tennessee’s law requires the state to develop a program for CCHD screening. Wisconsin’s law allows the state department of health to add conditions or diseases to the state’s newborn screening panel.
† A total of 13 states issued regulations or hospital guidelines related to newborn screening; 10 of those states issued regulations requiring screening. Iowa and Massachusetts issued guidelines to hospitals and birthing centers on screening, but the guidelines do not require screening. Pennsylvania issued a regulation requiring reporting of results and diagnoses of screened newborns, but the regulation does not require screening. Tennessee issued a regulation, after enacting legislation, adding CCHD to the state’s newborn screening panel.
§ Mandates CCHD screening of newborns. ¶ State reports that all hospitals are performing CCHD screening. ** Legislation in Hawaii to require screening failed in 2014. †† Echocardiogram is the diagnostic test that follows a failed pulse oximetry screen. §§ Virginia’s former governor issued a directive in 2012 that established a workgroup to develop a plan for implementing screening.
legislation for mandatory screening was passed in 2014. In 2013, Massachusetts issued guidelines that recommended hospitals screen newborns and passed mandatory screening legislation in 2014. In 2014, Wisconsin enacted a law that allows the state department of health to add conditions to its state panel via regulation. Soon after enactment, regulations were issued adding CCHD to its panel.
Seven states and the District of Columbia support CCHD newborn screening as the standard of care with no mandate in place. Two states and the District of Columbia report that all hospitals are screening for CCHD (Table).
By December 2014, among the 50 states and the District of Columbia, data collection within each newborn screening program varied from no data collection to collection of all

Morbidity and Mortality Weekly Report
MMWR / June 19, 2015 / Vol. 64 / No. 23 629
screening results for every newborn. Of the states that have implemented, or are planning to implement CCHD screen-ing, 24 reported current data collection, 14 reported planning future data collection, and 13 reported no plans for data col-lection (Table). The types of data collection vary from aggre-gate data collection only, collection of pass/fail results on all newborns, oxygen saturation results on all newborns, oxygen saturation results on failed newborns only, or a combination of these (Table).
Discussion
The increasing number of states mandating newborn screen-ing for CCHD will likely increase the number of newborns screened, allowing for early identification and the potential for the prevention of morbidity and mortality. Most newborn screening conditions are tested through a heel stick test, with bloodspot analysis at public health or contracted laboratories. Screening for CCHD is a point-of-care test that occurs in hospitals before a newborn is discharged, with results entered into the medical record. Therefore, the role of public health is different than that for newborn bloodspot screening (7). This role might present challenges in data collection and surveillance for evaluating CCHD screening, because uniform reporting systems might not be established between public health pro-grams, birthing centers, and hospitals (8). States have previ-ously reported barriers to involvement with CCHD screening, such as the lack of legislative authority, staffing, funding, and informatics infrastructure (9). This report represents the first assessment of state legislative activities, requirements for col-lection of screening data, and progress made with screening activities, despite previously reported barriers.
State-level data collection is vital for surveillance, monitor-ing of outcomes, and evaluation of state CCHD newborn screening programs. Although all types of screening data can be valuable, individual-level data are important for surveillance and evaluation. Collecting data related to factors associated with false-positive and false-negative results could help refine the recommended CCHD screening algorithm and screening activities (7). As states evaluate the implementation of CCHD screening, they are encouraged to consider programmatic changes that would improve their screening program, such as the inclusion of individual-level data reporting.
Enactment of a state law or regulation does not translate into immediate and universal change in clinical practice. In addi-tion to policy changes, the proper public health infrastructure, including infrastructure needs for data collection and report-ing of CCHD screening results, is vital to ensure a successful CCHD newborn screening program. 1Division of Birth Defects and Developmental Disabilities, National Center
on Birth Defects and Developmental Disabilities, CDC; 2Division of Human Development and Disability, National Center on Birth Defects and Developmental Disabilities, CDC; 3American Academy of Pediatrics, Elk Grove Village, Illinois; 4University of Colorado—Denver; 5Association of Public Health Laboratories, Silver Spring, Maryland; 6Office of the Associate Director for Policy, Office of the Director, CDC.
Corresponding author: Jill Glidewell, [email protected], 404-498-3800.
FIGURE 2. Actions taken by states to adopt newborn screening for critical congenital heart defects — United States, 2011–2014*
Legislation enacted and executive order
Legislation enactedRegulation/Hospital guidelines
Legislation enacted and Regulation/Hospital guidelines
* Actions taken as of December 2014.
FIGURE 1. Number of states (N = 43) adopting legislation, regulation, or hospital guidelines for universal newborn screening for critical congenital heart defects, by year — United States, 2011–2014
0
5
10
15
20
25
2011 2012
Year
2013 2014
No.
of s
tate
s

Morbidity and Mortality Weekly Report
630 MMWR / June 19, 2015 / Vol. 64 / No. 23
References1. Mahle WT, Newburger JW, Matherne GP, et al.; American Heart
Association Congenital Heart Defects Committee of the Council on Cardiovascular Disease in the Young, Council on Cardiovascular Nursing, and Interdisciplinary Council on Quality of Care and Outcomes Research; American Academy of Pediatrics Section on Cardiology And Cardiac Surgery; Committee On Fetus And Newborn. Role of pulse oximetry in examining newborns for congenital heart disease: a scientific statement from the AHA and AAP. Pediatrics 2009;124:823–36.
SummaryWhat is already known on this topic?
Congenital heart defects occur in approximately eight in every 1,000 live births, one fourth of which are considered to be critical congenital heart defects (CCHD). Newborn screening using pulse oximetry can detect hypoxemia, a clinical sign of CCHD.
What is added by this report?
This report represents the first assessment of state’s actions to adopt newborn screening for CCHD and requirements for collection of CCHD screening data. Forty-three states have taken action toward newborn screening for CCHD through statute, regulations, or hospital guidelines. Among the 43 states, 32 (74%) are collecting or planning to collect CCHD screening data.
What are the implications for public health practice?
State mandates for newborn screening for CCHD might increase the number of newborns screened, allowing for early identifica-tion and prevention of morbidity and mortality. Data collection and reporting are essential to evaluate the effect of this public health program.
2. Pass KA, Lane PA, Fernhoff PM, et al. Statement of the Council of Regional Networks for Genetic Services (CORN). US newborn screening system guidelines II: follow-up of children, diagnosis, management, and evaluation. J Pediatr 2000;137(4 Suppl):S1–46.
3. Calonge N, Green NS, Rinaldo P, et al.; Advisory Committee on Heritable Disorders in Newborns and Children. Committee report: method for evaluating conditions nominated for population-based screening of newborns and children. Genet Med 2010;12:153–9.
4. Secretary’s Advisory Committee on Heritable Disorders in Newborns and Children. HHS Secretary adopts recommendation to add critical congenital heart disease to the Recommended Uniform Screening Panel. September 21, 2011. Washington, DC: US Department of Health and Human Services; 2011. Available at http://www.hrsa.gov/advisorycommittees/mchbadvisory/heritabledisorders/recommendations/correspondence/cyanoticheartsecre09212011.pdf.
5. Therrell BL Jr. U.S. newborn screening policy dilemmas for the twenty-first century. Mol Genet Metab 2001;74:64–74.
6. NewSTEPs: Newborn Screening Technical assistance and Evaluation Program., Silver Spring, Maryland, Association of Public Health Laboratories. Available at https://www.newsteps.org.
7. Kemper AR, Mahle WT, Martin GR, et al. Strategies for implementing screening for critical congenital heart disease. Pediatrics 2011; 128:e1259–67.
8. Association of Maternal and Child Health Programs. Issue brief: state newborn screening and birth defects program roles in screening for CCHD. October 2013. Available at http://www.amchp.org/programsandtopics/CHILD-HEALTH/projects/newborn-screening/Documents/AMCHP_Screening_for_CCHD_Issue_Brief_FINAL-Oct2013.pdf.
9. CDC. Newborn screening for critical congenital heart disease: potential roles of birth defects surveillance programs—United States, 2010–2011. MMWR Morb Mortal Wkly Rep 2012;61:849–53.

Morbidity and Mortality Weekly Report
MMWR / June 19, 2015 / Vol. 64 / No. 23 631
Drug overdose deaths in the United States have more than doubled since 1999 (1). During 2013, 43,982 drug overdose deaths (unintentional, intentional [suicide or homicide], or undetermined intent) were reported (1). Among these, 16,235 (37%) were associated with prescription opioid analgesics (e.g., oxycodone and hydrocodone) and 8,257 (19%) with heroin (2). For many years, community-based programs have offered opioid overdose prevention services to laypersons who might witness an overdose, including persons who use drugs, their families and friends, and service providers. Since 1996, an increasing number of programs provide laypersons with training and kits containing the opioid antagonist naloxone hydrochloride (naloxone) to reverse the potentially fatal respi-ratory depression caused by heroin and other opioids (3). In July 2014, the Harm Reduction Coalition (HRC), a national advocacy and capacity-building organization, surveyed 140 managers of organizations in the United States known to provide naloxone kits to laypersons. Managers at 136 orga-nizations completed the survey, reporting on the amount of naloxone distributed, overdose reversals by bystanders, and other program data for 644 sites that were providing nalox-one kits to laypersons as of June 2014. From 1996 through June 2014, surveyed organizations provided naloxone kits to 152,283 laypersons and received reports of 26,463 overdose reversals. Providing opioid overdose training and naloxone kits to laypersons who might witness an opioid overdose can help reduce opioid overdose mortality.
Since 2008, HRC has maintained a database of organizations providing naloxone kits to laypersons. The Opioid Safety and Naloxone Network is a national network of naloxone experts, program administrators, and advocates. Before the survey, HRC staff polled network participants for information on any new organizations providing naloxone kits to laypersons that should be included in the survey. In July 2014, HRC e-mailed a link to an online survey to managers of 140 organizations known to provide naloxone kits to laypersons. These orga-nizations included public health departments, pharmacies, health care facilities, substance use treatment facilities, and community-based organizations providing services to persons who use drugs, including current or former opioid (heroin or pharmaceutical) users, and other potential witnesses to over-doses. Law enforcement organizations, emergency medical
services, and other professional first responders using naloxone were not included in this survey.
The survey included questions about the year the organiza-tion began operating; the numbers of sites or local programs providing naloxone kits; the number of persons trained in overdose prevention and provided naloxone kits; and the number of reports of overdose reversals (administration of naloxone by a trained layperson in the event of an overdose) (4), as well as whether the reports were based on program data or were estimates. The survey also asked about the naloxone formulations currently provided in kits, models for training and providing naloxone kits, funding sources, and any dif-ficulties obtaining naloxone. To obtain data for a recent full calendar year, organizations providing naloxone kits during calendar year 2013 were asked to provide specific data for that year, including numbers of persons provided naloxone kits, reversals reported, and naloxone vials provided; charac-teristics of persons who received naloxone kits (e.g., persons who use drugs, friends and family members, service providers); characteristics of persons reporting overdose reversals; and the drugs involved in reported overdose reversals. HRC staff used follow-up e-mails and telephone calls to encourage participa-tion and clarify responses.
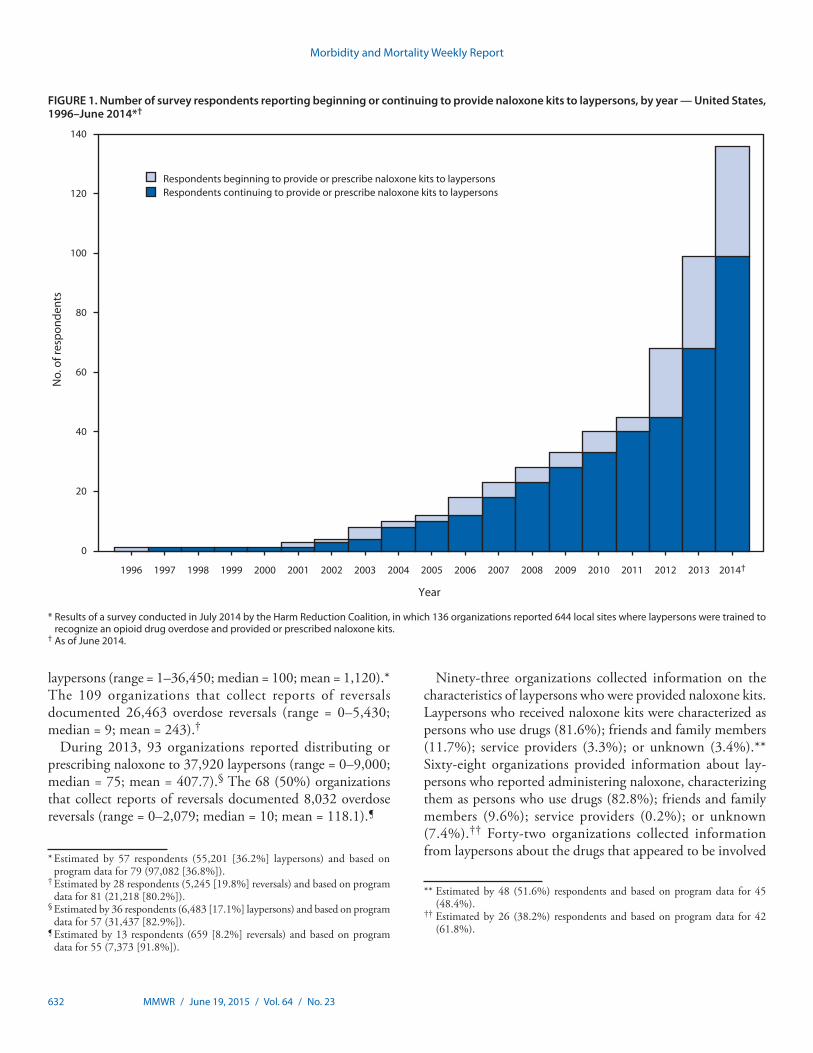
Managers from 136 (97.1%) organizations completed the survey, including those from 84 community-based organiza-tions, 18 health care facilities, 10 Veterans Administration health care systems, 18 state or local health departments, and six pharmacies. Half of the responding organizations began operating during January 2013‒June 2014 (Figure 1). Respondents provided reports for 644 local opioid overdose prevention sites that provide naloxone kits, located in 30 states and the District of Columbia (DC) (Figure 2). Thirty-eight respondents provided consolidated data for multiple local sites providing naloxone kits. Some organizations estimated responses; for example, one health department estimated the number of laypersons receiving naloxone kits on the basis of the number of kits distributed to local sites. Three state health departments (Massachusetts, New Mexico, and New York) oversee operations of statewide naloxone programs, with 334 local sites (51.9% of the 644 local sites).
From 1996, when the first organization began providing naloxone, through June 2014, the 136 responding organiza-tions reported providing training and naloxone kits to 152,283
Opioid Overdose Prevention Programs Providing Naloxone to Laypersons — United States, 2014
Eliza Wheeler, MPA1; T. Stephen Jones, MD2; Michael K. Gilbert, MPH3; Peter J. Davidson, PhD4 (Author affiliations at end of text)
Morbidity and Mortality Weekly Report
632 MMWR / June 19, 2015 / Vol. 64 / No. 23
laypersons (range = 1–36,450; median = 100; mean = 1,120).* The 109 organizations that collect reports of reversals documented 26,463 overdose reversals (range = 0–5,430; median = 9; mean = 243).†
During 2013, 93 organizations reported distributing or prescribing naloxone to 37,920 laypersons (range = 0–9,000; median = 75; mean = 407.7).§ The 68 (50%) organizations that collect reports of reversals documented 8,032 overdose reversals (range = 0–2,079; median = 10; mean = 118.1).¶
Ninety-three organizations collected information on the characteristics of laypersons who were provided naloxone kits. Laypersons who received naloxone kits were characterized as persons who use drugs (81.6%); friends and family members (11.7%); service providers (3.3%); or unknown (3.4%).** Sixty-eight organizations provided information about lay-persons who reported administering naloxone, characterizing them as persons who use drugs (82.8%); friends and family members (9.6%); service providers (0.2%); or unknown (7.4%).†† Forty-two organizations collected information from laypersons about the drugs that appeared to be involved
FIGURE 1. Number of survey respondents reporting beginning or continuing to provide naloxone kits to laypersons, by year — United States, 1996–June 2014*†
No.
of r
espo
nden
ts
0
20
40
60
80
100
120
140
1996 1997 1998 1999 2000 2001 2002 2003 2004 2005 2006 2007 2008 2009 2010 2011 2012 2013 2014†
Respondents beginning to provide or prescribe naloxone kits to laypersonsRespondents continuing to provide or prescribe naloxone kits to laypersons
Year
* Results of a survey conducted in July 2014 by the Harm Reduction Coalition, in which 136 organizations reported 644 local sites where laypersons were trained to recognize an opioid drug overdose and provided or prescribed naloxone kits.
† As of June 2014.
* Estimated by 57 respondents (55,201 [36.2%] laypersons) and based on program data for 79 (97,082 [36.8%]).
† Estimated by 28 respondents (5,245 [19.8%] reversals) and based on program data for 81 (21,218 [80.2%]).
§ Estimated by 36 respondents (6,483 [17.1%] laypersons) and based on program data for 57 (31,437 [82.9%]).
¶ Estimated by 13 respondents (659 [8.2%] reversals) and based on program data for 55 (7,373 [91.8%]).
** Estimated by 48 (51.6%) respondents and based on program data for 45 (48.4%).
†† Estimated by 26 (38.2%) respondents and based on program data for 42 (61.8%).

Morbidity and Mortality Weekly Report
MMWR / June 19, 2015 / Vol. 64 / No. 23 633
in the reversed overdoses; heroin was involved in 81.6% and prescription opioids in 14.1%.§§
Various program models were used by organizations to pro-vide naloxone to laypersons, including distribution of naloxone kits by trained nonmedical staff or volunteers under a standing order (60 [44.1%]), by medical staff (49 [36.0%]), prescrip-tions written by a medical provider and filled at a pharmacy (39 [28.7%]), pharmacists dispensing directly via collaborative practice agreements and other mechanisms (12 [8.8%]), and other protocols (19 [14.0%]). Thirty-three organizations used more than one model.
During 2013, 90 (66.2%) of the 136 organizations reported distributing 140,053 naloxone vials, including refills (range = 1–53,200; median = 179.5; mean = 1,556.1).¶¶ Three respondents whose organizations were operational in 2013 did not report on the number of vials because they furnished prescriptions to be filled at a pharmacy. The remaining 43 organizations indicated that they were not yet providing naloxone kits during 2013. Sixty-nine respondents (50.7%)
reported their organization provided only injectable naloxone, 51 (37.5%) provided only intranasal naloxone, and 16 (11.8%) provided both injectable and intranasal naloxone.*** A total of 111,602 vials (79.7%) of injectable naloxone (21.4% 10 mL and 58.1% 1 mL) and 28,446 (20.3%) vials of intranasal naloxone were provided to laypersons. Organizations were characterized as small, medium, large, or very large, on the basis of the number of naloxone vials distributed during 2013. The 11 large and very large organizations provided naloxone to 28,604 laypersons, representing 75.4% of all 2013 recipi-ents (Table). Forty (29.4%) organizations reported difficulties maintaining an adequate supply of naloxone, and 73 (53.7%) reported inadequate resources to sustain or expand their orga-nization’s efforts to disseminate naloxone kits.
Discussion
Organizations that provide naloxone kits to laypersons have expanded substantially since a similar survey in 2010 (5), reflecting a 183% (from 48 to 136) increase in the number of
FIGURE 2. Number* and location of local drug overdose prevention programs providing naloxone to laypersons, as of June 2014, and age-adjusted rates† of drug overdose deaths§ in 2013 — United States
9.5–11.58.1–9.4
11.6–18.6
Location of one or morenaloxone programs
2013 age-adjusted deaths per 100,000
2.7–8.0
DC: 1
29
99
1
4
1
3
1
32
43274
2
4
1
2
26
26
69
161
4
511
68
19
5
42
8
* Total N = 644; numbers on map indicate the total number of programs within each state.† Per 100,000 population.§ CDC, National Center for Health Statistics; Compressed Mortality File 1999–2013 on CDC WONDER Online Database, released January 2015.
§§ Estimated by 18 (42.9%) respondents and based on program data for 24 (57.1%).
¶¶ Estimated by 37 survey respondents (31,838 [22.7%] vials) and based on program data for 53 (108,215 [77.2%]).
*** Organizations provide laypersons with naloxone for injection and/or for intranasal administration. Injectable naloxone is distributed in multi-dose (10 mL) and single-dose (1 mL) vials with concentrations of 0.4 mg/mL. Intranasal naloxone is distributed in single-dose 2 mL vials with concentration of 1 mg/mL that are adapted for intranasal use with a mucosal atomizer.

Morbidity and Mortality Weekly Report
634 MMWR / June 19, 2015 / Vol. 64 / No. 23
responding organizations; a 243% (from 188 to 644) increase in the number of local sites providing naloxone; a 187% (from 53,032 to 152,283) increase in the number of laypersons pro-vided naloxone kits; a 160% (from 10,171 to 26,463) increase in the number of reversals reported; and a 94% (from 16 to 30) increase in states (including DC) with at least one organiza-tion providing naloxone. Half of the responding organizations began operating during January 2013–June 2014. Although early adopters of naloxone kit provision were mainly syringe exchanges, other programs, including substance use treatment facilities, Veterans Administration health care systems, primary care clinics, and pharmacies have started providing naloxone to laypersons.
Providing naloxone kits to laypersons reduces overdose deaths (4), is safe (3), and is cost-effective (6). U.S. and inter-national health organizations recommend providing naloxone kits to laypersons who might witness an opioid overdose (3,7); to patients in substance use treatment programs (3,7,8); to persons leaving prison and jail (3,7,8); and as a component of responsible opioid prescribing (8).
Although the number of organizations providing naloxone kits to laypersons is increasing, in 2013, 20 states had no such organization, and nine had less than one layperson per 100,000 population who had received a naloxone kit. Among these 29 states with minimal or no access to naloxone kits for laypersons, 11 had age-adjusted 2013 drug overdose death rates higher than the national median (2).
Some organizations reported information on the laypersons receiving naloxone kits (N = 99 organizations), using naloxone in overdose reversals (N = 68), and the drugs that appeared to have caused the overdose (N = 42). Persons who use drugs accounted for 81.6% of laypersons who received naloxone kits; they also performed the majority (82.8%) of reported
overdose reversals. A majority (81.6%) of the overdoses that were reversed involved heroin, indicating that organizations are reaching laypersons who witness heroin overdoses. A study of a community-based naloxone program in San Francisco also found that persons who use drugs play a major role in reversing heroin overdoses (9). Additional interventions are needed to reach persons who may witness prescription opioid analgesic overdoses, which account for nearly twice as many deaths as heroin overdoses.
Forty (29.4%) respondents reported that their organiza-tion has experienced problems obtaining naloxone. Prices of intranasal naloxone more than doubled in the second half of 2014 (10) and Opioid Safety and Naloxone Network members report that cost increases are reducing the quantity of naloxone purchased and provided to laypersons (Matt Curtis, VOCAL NY, personal communication, 2015).
The findings in this report are subject to at least four limitations. First, despite extensive knowledge of naloxone distribution programs by the Harm Reduction Coalition and Opioid Safety and Naloxone Network, organizations provid-ing naloxone kits are increasing rapidly and some might not yet be known to HRC and therefore, might not be included in the survey, which may underestimate the impact of these programs. Second, survey responses are based on unconfirmed reports from organizations providing naloxone kits. Third, some reports provided by organizations are based on estimates. These three limitations could result in either under or over-reporting of persons provided naloxone kits. Finally, the num-bers of overdose reversals likely were under-reported, because some sites, such as pharmacies, do not collect reversal reports.
Organizations providing naloxone kits to laypersons receive many reports of overdose reversals and can reach large numbers of potential overdose bystanders. Comprehensive prevention
TABLE. Reported number of laypersons receiving or prescribed naloxone kits, overdose reversals, and opioid overdose prevention programs, by survey respondent program size — United States, 1996–June 2014
Category (by size)*
Respondents Sites
Calendar year 2013 1996—June 2014
Laypersons received/prescribed kits†
Opioid overdose reversals§
Laypersons received/prescribed kits¶
Opioid overdose reversals**
No. (%) No. (%) No. (%) No. (%) No. (%) No. (%)
Small (<100) 84 (61.8) 154 (23.9) 1,709 (4.5) 134 (1.7) 7,867 (5.2) 641 (2.4)Medium (101–1,000) 41 (30.1) 129 (20.0) 7,607 (20.1) 1,351 (16.8) 19,239 (12.6) 4,414 (16.7)Large (1,001–10,000) 7 (5.1) 62 (9.6) 6,117 (16.1) 4,329 (53.9) 29,099 (19.1) 11,807 (44.6)Very large (>10,000) 4 (2.9) 299 (46.4) 22,487 (59.3) 2,218 (27.6) 96,078 (63.1) 9,601 (36.3)Total 136 (100.0) 644 (100.0) 37,920 (100.0) 8,032 (100.0) 152,283 (100.0) 26,463 (100.0)
* Based on reported number of vials of naloxone provided during 2013. † Calendar year 2013 information provided by 93 survey respondents distributing kits/prescribing naloxone during that year, with 36 estimating (6,483 [17.1%]
persons) and 57 based on program data (31,437 [82.9%]). § Sixty-eight of 93 respondents distributing kits/prescribing naloxone in 2013 provided information on reported reversals, with 13 estimating (659 [8.2%] reversals)
and 55 based on program data (7,373 [91.8%]). ¶ Estimated by 57 survey respondents (55,201 [36.2%] persons) and 79 based on program data (97,082 [63.8%]). ** Program began in 1996; as of June 2014, 109 respondents distributing kits/prescribing naloxone provided information on reported reversals, with 28 estimating
(5,245 [19.8%] reversals) and 81 based on program data (21,218 [80.2%]).
Morbidity and Mortality Weekly Report
MMWR / June 19, 2015 / Vol. 64 / No. 23 635
measures that include teaching laypersons how to respond to overdoses and administer naloxone might help prevent opioid drug overdose deaths. This report suggests that many programs reach persons who witness heroin-related overdoses; additional methods are needed to provide naloxone kits to persons who might witness prescription opioid analgesic overdoses.
SummaryWhat is already known on this topic?
Drug overdose deaths in the United States have more than doubled since 1999, reaching a total of 43,982 in 2013. Heroin and prescription opioids are major causes of drug overdose deaths. Naloxone is the standard medication used for reversal of the potentially fatal respiratory depression caused by opioid overdose.
What is added by this report?
From 1996 through June 2014, a total of 644 local sites in 30 states and the District of Columbia reported providing naloxone kits to 152,283 laypersons and receiving reports of 26,463 drug overdose reversals using naloxone from 1996 through June 2014. Most laypersons who reported using the kits to reverse an overdose were persons who use drugs, and many of the reported reversals involved heroin overdoses. Medical clinics and pharmacies have started providing naloxone kits to laypersons, and the reported number of organizations provid-ing kits almost doubled from January 2013 through June 2014.
What are the implications for public health practice?
Organizations training and providing naloxone kits to layper-sons can reach large numbers of potential overdose witnesses and result in many reported overdose reversals. Comprehensive prevention measures that include teaching laypersons how to respond to overdoses and administer naloxone prevent opioid-related drug overdose deaths. Additional methods are needed to provide naloxone kits to persons who might witness prescription opioid analgesic overdoses.
1Drug Overdose Prevention and Education (DOPE) Project, Harm Reduction Coalition, Oakland, California; 2T. Stephen Jones Public Health Consulting, Florence, Massachusetts; 3T. H. Chan School of Public Health, Harvard University, Boston, Massachusetts; 4University of California, San Diego, California.
Corresponding author: Eliza Wheeler, [email protected], 510-444-6969.
References 1. Chen LH, Hedegaard H, Warner M. QuickStats: rates of deaths from
drug poisoning and drug poisoning involving opioid analgesics—United States, 1999–2013. MMWR Morb Mortal Wkly Rep 2015;64:32.
2. Hedegaard H, Chen LH, Warner M. Drug-poisoning deaths involving heroin: United States, 2000–2013. Hyattsville, MD: US Department of Health and Human Services, CDC, National Center for Health Statistics; 2015. NCHS data brief no. 190. Available at http://www.cdc.gov/nchs/data/databriefs/db190.htm.
3. Doyon S, Aks SE, Schaeffer S. Expanding access to naloxone in the United States. Clin Toxicol (Phila) 2014;52:989–92.
4. Walley A, Xuan Z, Hackman HH, et al. Opioid overdose rates and implementation of overdose education and nasal naloxone distribution in Massachusetts: interrupted time series analysis. BMJ 2013;346:1–12.
5. Wheeler E, Davidson PJ, Jones TS, Irwin KS. Community-based opioid overdose prevention programs providing naloxone—United States, 2010. MMWR Morb Mortal Wkly Rep 2012;61:101–5.
6. Coffin PO, Sullivan SD. Cost-effectiveness of distributing naloxone to heroin users for lay overdose reversal. Ann Intern Med 2013;158:1–9.
7. World Health Organization. Community management of opioid overdose. Geneva, Switzerland: World Health Organization; 2014.
8. Substance Abuse and Mental Health Services Administration. Opioid overdose prevention toolkit. Rockville, MD: Substance Abuse and Mental Health Services Administration; 2014. Available at http://store.samhsa.gov/product/Opioid-Overdose-Prevention-Toolkit-Updated-2014/SMA14-4742.
9. Rowe C, Santos GM, Vittinghoff E, Wheeler E, Davidson P, Coffin PO. Predictors of participant engagement and naloxone utilization in a community-based naloxone distribution program. Addiction. In press 2015.
10. Goodman JD. Naloxone, a drug to stop heroin deaths, is more costly, the police say. New York Times. November 30, 2014. Available at http://www.nytimes.com/2014/12/01/nyregion/prices-increase-for-antidote-to-heroin-overdoses-used-by-police.html?_r=0.

Morbidity and Mortality Weekly Report
636 MMWR / June 19, 2015 / Vol. 64 / No. 23
During 1998‒2012, coccidioidomycosis cases increased nationally nearly eightfold (1). To describe the epidemiology of coccidioidomycosis in Missouri, a state without endemic coccidioidomycosis, coccidioidomycosis surveillance data dur-ing 2004–2013 at the Missouri Department of Health and Senior Services were retrospectively reviewed. The incidence of reported coccidioidomycosis increased from 0.05 per 100,000 population in 2004 to 0.28 per 100,000 in 2013, with cases distributed throughout all regions of Missouri. Persons aged >60 years were most affected. In cases in which patients had dis-ease manifestations, the most common were pneumonia (37%) and influenza-like illness (31%). Nearly half (48%) of patients had traveled to an area where coccidioidomycosis is endemic, whereas approximately one-quarter (26%) of patients did not report such travel. Those with history of travel to endemic areas were significantly more likely to receive a diagnosis by positive culture or polymerase chain reaction (PCR) testing, compared with those without a history of travel to endemic areas, who were more likely to receive a diagnosis by serological tests. Additional studies will be required to ascertain whether truly endemic cases exist in Missouri.
Coccidioidomycosis, or Valley Fever, is a systemic disease caused by the fungus Coccidioides, which is endemic to the southwestern United States, Mexico, and Central and South America (2). This fungus normally resides in soil, but airborne spores can cause infection if inhaled. Sixty percent of infections are asymptomatic and do not come to medical attention (3). Manifestations range from influenza-like illness to pneumonia, lung nodules, and disseminated infections. Laboratory tests typically used for coccidioidomycosis diagnosis include com-plement fixation, immunodiffusion, enzyme immunoassay, culture, histopathology, and PCR. In most patients, infection is mild and resolves without specific antifungal treatment. Azole antifungals are the most commonly used drugs in patients who require treatment (4).
During 1998–2011, among all coccidioidomycosis cases reported to CDC from 28 states and the District of Columbia, 97% were from Arizona and California, 1% from states where coccidioidomycosis is uncommon, and <1% from states where it is not endemic (4). In areas where coccidioidomycosis is endemic (excluding Texas), the age-adjusted incidence of reported cases increased sevenfold from 5.3 cases per 100,000 population in 1998 to 42.6 per 100,000 in 2011 (5). In states
where it is not endemic, in 2011, 240 coccidioidomycosis cases were reported, compared with only six in 1998 (1).
Coccidioidomycosis surveillance data during 2004–2013 at the Missouri Department of Health and Senior Services were retrospectively reviewed. Only cases meeting the defini-tion of a confirmed case of coccidioidomycosis as defined by CDC’s National Notifiable Diseases Surveillance System and the Council of State and Territorial Epidemiologists were included (6).
Patients with known travel history were categorized into three groups: 1) those who had not traveled to an area where coccidioidomycosis is known to be endemic, 2) those who had traveled at any time to an area where it is endemic, and 3) those who had recently traveled to an area where the disease is endemic. Recent travel was defined as travel associated with the experience of symptoms either during travel or within 21 days of leaving the endemic area. Poisson regression analy-sis was used to model the incidence of coccidioidomycosis reported in Missouri.
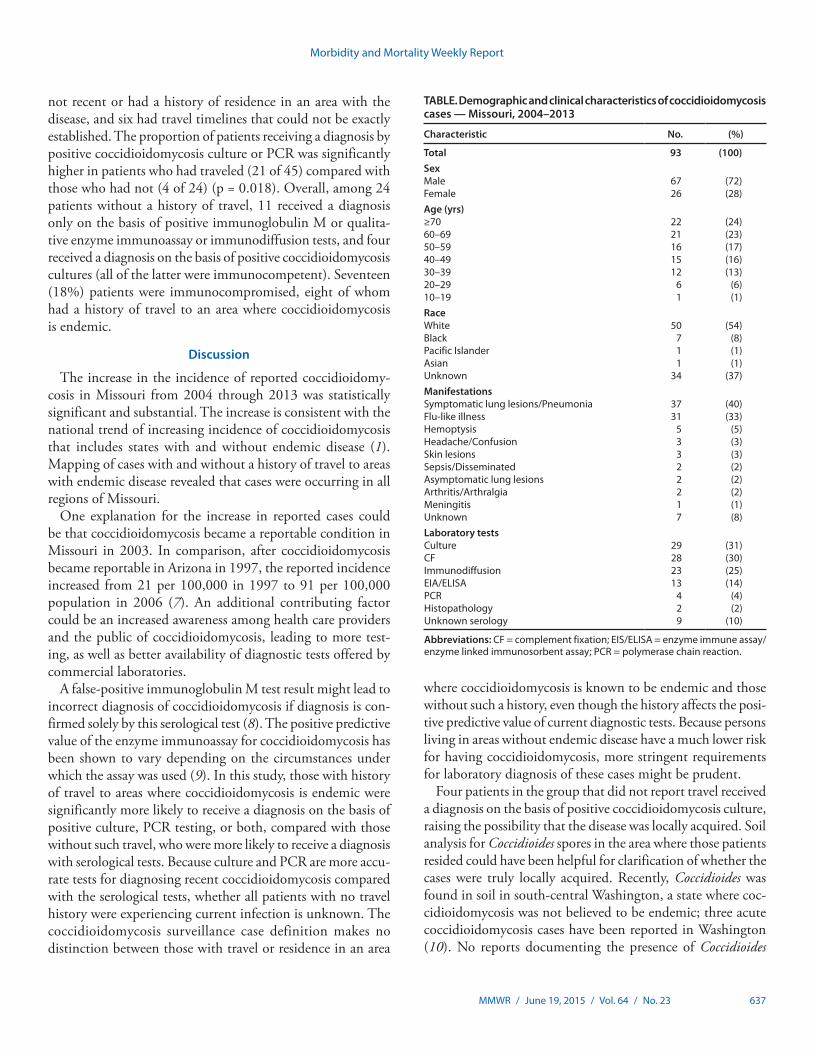
A total of 93 confirmed coccidioidomycosis cases were reported during the study period (Table). Disease incidence increased from 0.05 per 100,000 population in 2004 to 0.28 per 100,000 in 2013 (p<0.001) (Figure 1). The median age of patients was 58 years (range = 19–94 years). Among 51 (55%) patients with a known symptom onset date, median time to diagnosis was 25 days (range = 3–304). Fungal culture (31%) and complement fixation (30%) were the most com-mon diagnostic tests. Forty-three (46%) patients required hospitalization (five in intensive care). Among 29 patients who received antifungal drugs, 14 were treated as outpatients and 15 were inpatients. Fluconazole was the most used antifungal drug (20% of patients). Eight (8.6%) of the 93 patients died: three deaths were attributed to coccidioidomycosis, three to other illnesses, and the cause of death in the remaining two patients was not reported.
Mapping of cases by residence at the time of diagnosis revealed that patients, with or without travel to an area where coccidioidomycosis is endemic, were distributed throughout all regions of the state (Figure 2). Forty-five patients (48%) traveled to an area where the disease is endemic, 24 (26%) did not, and the travel history for the remaining 24 (26%) was unknown. Among the 45 patients with travel to an area with endemic disease, 19 had recent travel, 20 had travel that was
Coccidioidomycosis in a State Where It Is Not Known To Be Endemic — Missouri, 2004–2013
George Turabelidze, MD, PhD1; Ravi K. Aggu-Sher, MD1; Ehsan Jahanpour, MS1; C. Jon Hinkle1 (Author affiliations at end of text)
Morbidity and Mortality Weekly Report
MMWR / June 19, 2015 / Vol. 64 / No. 23 637
not recent or had a history of residence in an area with the disease, and six had travel timelines that could not be exactly established. The proportion of patients receiving a diagnosis by positive coccidioidomycosis culture or PCR was significantly higher in patients who had traveled (21 of 45) compared with those who had not (4 of 24) (p = 0.018). Overall, among 24 patients without a history of travel, 11 received a diagnosis only on the basis of positive immunoglobulin M or qualita-tive enzyme immunoassay or immunodiffusion tests, and four received a diagnosis on the basis of positive coccidioidomycosis cultures (all of the latter were immunocompetent). Seventeen (18%) patients were immunocompromised, eight of whom had a history of travel to an area where coccidioidomycosis is endemic.
Discussion
The increase in the incidence of reported coccidioidomy-cosis in Missouri from 2004 through 2013 was statistically significant and substantial. The increase is consistent with the national trend of increasing incidence of coccidioidomycosis that includes states with and without endemic disease (1). Mapping of cases with and without a history of travel to areas with endemic disease revealed that cases were occurring in all regions of Missouri.
One explanation for the increase in reported cases could be that coccidioidomycosis became a reportable condition in Missouri in 2003. In comparison, after coccidioidomycosis became reportable in Arizona in 1997, the reported incidence increased from 21 per 100,000 in 1997 to 91 per 100,000 population in 2006 (7). An additional contributing factor could be an increased awareness among health care providers and the public of coccidioidomycosis, leading to more test-ing, as well as better availability of diagnostic tests offered by commercial laboratories.
A false-positive immunoglobulin M test result might lead to incorrect diagnosis of coccidioidomycosis if diagnosis is con-firmed solely by this serological test (8). The positive predictive value of the enzyme immunoassay for coccidioidomycosis has been shown to vary depending on the circumstances under which the assay was used (9). In this study, those with history of travel to areas where coccidioidomycosis is endemic were significantly more likely to receive a diagnosis on the basis of positive culture, PCR testing, or both, compared with those without such travel, who were more likely to receive a diagnosis with serological tests. Because culture and PCR are more accu-rate tests for diagnosing recent coccidioidomycosis compared with the serological tests, whether all patients with no travel history were experiencing current infection is unknown. The coccidioidomycosis surveillance case definition makes no distinction between those with travel or residence in an area
where coccidioidomycosis is known to be endemic and those without such a history, even though the history affects the posi-tive predictive value of current diagnostic tests. Because persons living in areas without endemic disease have a much lower risk for having coccidioidomycosis, more stringent requirements for laboratory diagnosis of these cases might be prudent.
Four patients in the group that did not report travel received a diagnosis on the basis of positive coccidioidomycosis culture, raising the possibility that the disease was locally acquired. Soil analysis for Coccidioides spores in the area where those patients resided could have been helpful for clarification of whether the cases were truly locally acquired. Recently, Coccidioides was found in soil in south-central Washington, a state where coc-cidioidomycosis was not believed to be endemic; three acute coccidioidomycosis cases have been reported in Washington (10). No reports documenting the presence of Coccidioides
TABLE. Demographic and clinical characteristics of coccidioidomycosis cases — Missouri, 2004–2013
Characteristic No. (%)
Total 93 (100)SexMale 67 (72)Female 26 (28)Age (yrs)≥70 22 (24)60–69 21 (23)50–59 16 (17)40–49 15 (16)30–39 12 (13)20–29 6 (6)10–19 1 (1)RaceWhite 50 (54)Black 7 (8)Pacific Islander 1 (1)Asian 1 (1)Unknown 34 (37)ManifestationsSymptomatic lung lesions/Pneumonia 37 (40)Flu-like illness 31 (33)Hemoptysis 5 (5)Headache/Confusion 3 (3)Skin lesions 3 (3)Sepsis/Disseminated 2 (2)Asymptomatic lung lesions 2 (2)Arthritis/Arthralgia 2 (2)Meningitis 1 (1)Unknown 7 (8)Laboratory testsCulture 29 (31)CF 28 (30)Immunodiffusion 23 (25)EIA/ELISA 13 (14)PCR 4 (4)Histopathology 2 (2)Unknown serology 9 (10)
Abbreviations: CF = complement fixation; EIS/ELISA = enzyme immune assay/enzyme linked immunosorbent assay; PCR = polymerase chain reaction.

Morbidity and Mortality Weekly Report
638 MMWR / June 19, 2015 / Vol. 64 / No. 23
spores in Missouri soil have been published in the indexed literature. Cluster analyses of a larger sample of coccidioidomycosis cases using software that analyzes spatial, temporal, and space-time data using spatial, temporal, or space-time scan statistics might be helpful for more accurate estimation of the possibility of endemic cases in Missouri.
The findings in this report are subject to one main limitation. The retrospective analysis was conducted on routine public health surveil-lance data, and no medical chart review or direct patient interviews were conducted. The surveillance data were not sufficiently complete in some cases with respect to demographics, travel history, medical history, clinical symp-toms, diagnosis, treatment, and follow-up. In some cases, the exact diagnostic tests used for serology (e.g., immunoglobulin G or immuno-globulin M) or the exact titer for those tested by complement fixation were not known.
Follow-up of patients with coccidioidomycosis to ensure that no alternative diagnoses emerged often was not available.
Epidemiology of coccidioidomycosis has been well described in states where it is known to be endemic, such as Arizona and California, but little information exists about it in other states. This research is a first attempt to study the epidemiology of coccidioidomycosis in a state without known endemic disease. Sustained surveillance for coccidioidomycosis in non-endemic states is important to ascertain whether locally acquired cases are occurring. 1Missouri Department of Health and Senior Services.
Corresponding author: George Turabelidze, MD, PhD, [email protected], 314-877-2826.
FIGURE 1. Incidence of coccidioidomycosis, by year — Missouri, 2004–2013
2004 2006 2008 2010 2012
Year
No.
of c
ases
10
5
15
0
*
* Line represents estimated Poisson Regression model ŷ =e-463.29+0.23×year; p<0.001.
FIGURE 2. Coccidioidomycosis cases, by location and travel status — Missouri, 2004–2013
St. Louis
Kansas City
Travel to endemic areaNo travel to endemic areaTravel unknown

Morbidity and Mortality Weekly Report
MMWR / June 19, 2015 / Vol. 64 / No. 23 639
SummaryWhat is already known on this topic?
The incidence of reported coccidioidomycosis is increasing nationally, both in states where the disease is known to be endemic and those where it is not.
What is added by this report?
This is the first study of the epidemiology of coccidioidomycosis in a state without endemic disease. In Missouri, during 2004–2013, reported coccidioidomycosis incidence per 100,000 population significantly increased from 0.05 to 0.28. Nearly half of the patients with known travel history had visited areas where coccidioidomycosis is endemic, and were more likely to receive a diagnosis of the disease by fungal culture and polymerase chain reaction, rather than serological assays.
What are the implications for public health practice?
Surveillance for coccidioidomycosis is needed in non-endemic states to discover if locally acquired cases are occurring. For persons living in areas where coccidioidomycosis is not believed to be endemic, more stringent requirements for laboratory diagnosis of coccidioidomycosis might be appropriate.
References 1. CDC. Valley fever (coccidioidomycosis). Atlanta, GA: US Department
of Health and Human Services, CDC; 2014. Available at http://www.cdc.gov/fungal/diseases/coccidioidomycosis/index.html.
2. Hector RF, Laniado-Laborin R. Coccidioidomycosis—a fungal disease of the Americas. PLoS Med 2005;2:e2.
3. Chiller TM, Galgiani JN, Stevens DA. Coccidioidomycosis. Infect Dis Clin North Am 2003;17:41–57, viii.
4. Nguyen C, Barker BM, Hoover S, et al. Recent advances in our understanding of the environmental, epidemiological, immunological, and clinical dimensions of coccidioidomycosis. Clin Microbiol Rev 2013;26:505–25.
5. CDC. Increase in reported coccidioidomycosis—United States, 1998–2011. MMWR Morb Mortal Wkly Rep 2013;62:217–21.
6. CDC. National Notifiable Diseases Surveillance System (NNDSS): case definitions. Atlanta, GA: US Department of Health and Human Services, CDC; 2015. Available at http://wwwn.cdc.gov/NNDSS/script/casedefDefault.aspx.
7. Sunenshine RH, Anderson S, Erhart L, et al. Public health surveillance for coccidioidomycosis in Arizona. Ann N Y Acad Sci 2007; 1111:96–102.
8. Kuberski T, Herrig J, Pappagianis D. False-positive IgM serology in coccidioidomycosis. J Clin Microbiol 2010;48:2047–9.
9. Blair JE, Mendoza N, Force S, Chang YH, Grys TE. Clinical specificity of the enzyme immunoassay test for coccidioidomycosis varies according to the reason for its performance. Clin Vaccine Immunol 2013;20:95–8.
10. Marsden-Haug N, Hill H, Litvintseva AP, et al. Coccidioides immitis identified in soil outside of its known range—Washington, 2013. MMWR Morb Mortal Wkly Rep 2014;63:450.

Morbidity and Mortality Weekly Report
640 MMWR / June 19, 2015 / Vol. 64 / No. 23
Since the World Health Assembly’s 1988 resolution to eradicate poliomyelitis (1), one of the main tools of the World Health Organization (WHO) Global Polio Eradication Initiative (GPEI) has been the live, attenuated oral poliovi-rus vaccine (OPV) (2). OPV might require several doses to induce immunity but provides long-term protection against paralytic disease. Through effective use of OPV, GPEI has brought polio to the threshold of eradication. Wild poliovi-rus type 2 (WPV2) was eliminated in 1999, WPV3 has not been detected since November 2012, and WPV1 circulation appears to be restricted to parts of Pakistan and Afghanistan (1). However, continued use of OPV carries two key risks. The first, vaccine-associated paralytic poliomyelitis (VAPP) has been recognized since the early 1960s (2,3). VAPP is a very rare event that occurs sporadically when an administered dose of OPV reverts to neurovirulence and causes paralysis in the vaccine recipient or a nonimmune contact. VAPP can occur among immunologically normal vaccine recipients and their contacts as well as among persons who have primary immunodeficiencies (PIDs) manifested by defects in antibody production; it is not associated with outbreaks. The second, the emergence of genetically divergent, neurovirulent vaccine-derived polioviruses (VDPVs) was recognized more recently (4). Circulating VDPVs (cVDPVs) resemble WPVs and, in areas with low OPV coverage, can cause polio outbreaks. Immunodeficiency-associated VDPVs (iVDPVs) can replicate and be excreted for years in some persons with PIDs; GPEI maintains a registry of iVDPV cases. Ambiguous VDPVs (aVDPVs) are isolates that cannot be classified definitively (4,5). This report updates previous surveillance summaries (5) and describes VDPVs detected worldwide during January 2014–March 2015. Those include new cVDPV outbreaks in Madagascar and South Sudan, and sharply reduced type 2 cVDPV (cVDPV2) circulation in Nigeria and Pakistan during the latter half of 2014. Eight newly identified persons in six countries were found to excrete iVDPVs, and a patient in the United Kingdom was still excreting iVDPV2 in 2014 after more than 28 years. Ambiguous VDPVs were found among immunocompetent persons and environmental samples in 16 countries. Because the large majority of VDPV case-isolates are type 2, WHO has developed a plan for coordinated world-wide withdrawal of trivalent (types 1, 2, and 3) OPV (tOPV) and replacement with bivalent (types 1 and 3) OPV (bOPV)
in April 2016, preceded by introduction of at least 1 dose of injectable inactivated poliovirus vaccine (IPV) into routine immunization schedules worldwide to maintain immunity to type 2 viruses (6).
Properties of VDPVsVDPVs are polioviruses whose genetic divergence from
the parental OPV strains indicates prolonged replication or circulation (4,5). Poliovirus isolates are grouped into three categories: 1) WPVs; 2) vaccine-related polioviruses (VRPVs); and 3) VDPVs. Current WPVs are genetically unrelated to any vaccine strain. The demarcation between VRPVs and VDPVs is based on the known poliovirus evolution rate. Nucleotide substitutions accumulate in poliovirus genomes at an overall rate of approximately 1% per year and are routinely monitored by sequencing the ~900-nucleotide region encoding VP1, the major poliovirus surface protein. Although nucleotide substitutions might accumulate more rapidly in the early phases of OPV replication, fewer than five VP1 substitutions typically accumulate in the vaccine virus during the normal period of replication in an immunocompetent OPV recipient (4–6 weeks). Based on this rate of nucleotide substitution, type 1 and type 3 isolates that are <1.0% divergent and type 2 isolates that are <0.6% divergent in VP1 sequences from the corresponding vaccine strain are classified as VRPVs. Type 1 and type 3 isolates that are >1.0% divergent or type 2 isolates that are >0.6% divergent in VP1 sequences from the corre-sponding OPV strain are classified as VDPVs (5). VDPVs are further categorized as 1) cVDPVs when evidence of person-to-person transmission in the community exists; 2) iVDPVs, which are isolated from persons with PIDs; and 3) aVDPVs, which are either clinical isolates from persons with no known immunodeficiency and no evidence of transmission, or sewage isolates that are unrelated to known cVDPVs or iVDPVs and whose source is unknown (5).
Virologic Testing for VDPVsAll poliovirus isolates are characterized by laboratories of
the Global Polio Laboratory Network (5) using a real-time reverse transcription–polymerase chain reaction (rRT-PCR) nucleic acid amplification, targeted to nucleotide substitutions that typically revert to the parental WPV sequence during replication of OPV in the human intestine (7). The rRT-PCR
Update on Vaccine-Derived Polioviruses — Worldwide, January 2014–March 2015
Ousmane M. Diop, PhD1; Cara C. Burns, PhD2; Roland W. Sutter, MD3; Steven G. Wassilak, MD4; Olen M. Kew, PhD2 (Author affiliations at end of text)

Morbidity and Mortality Weekly Report
MMWR / June 19, 2015 / Vol. 64 / No. 23 641
methods are used in 88 of 146 Global Polio Laboratory Network laboratories (5). Candidate VDPVs identified by rRT-PCR screening are sequenced in the VP1 region for defini-tive analysis; the complete genome is sequenced if required for higher-resolution analysis.
cVDPVsThe number of countries with circulation of indigenously
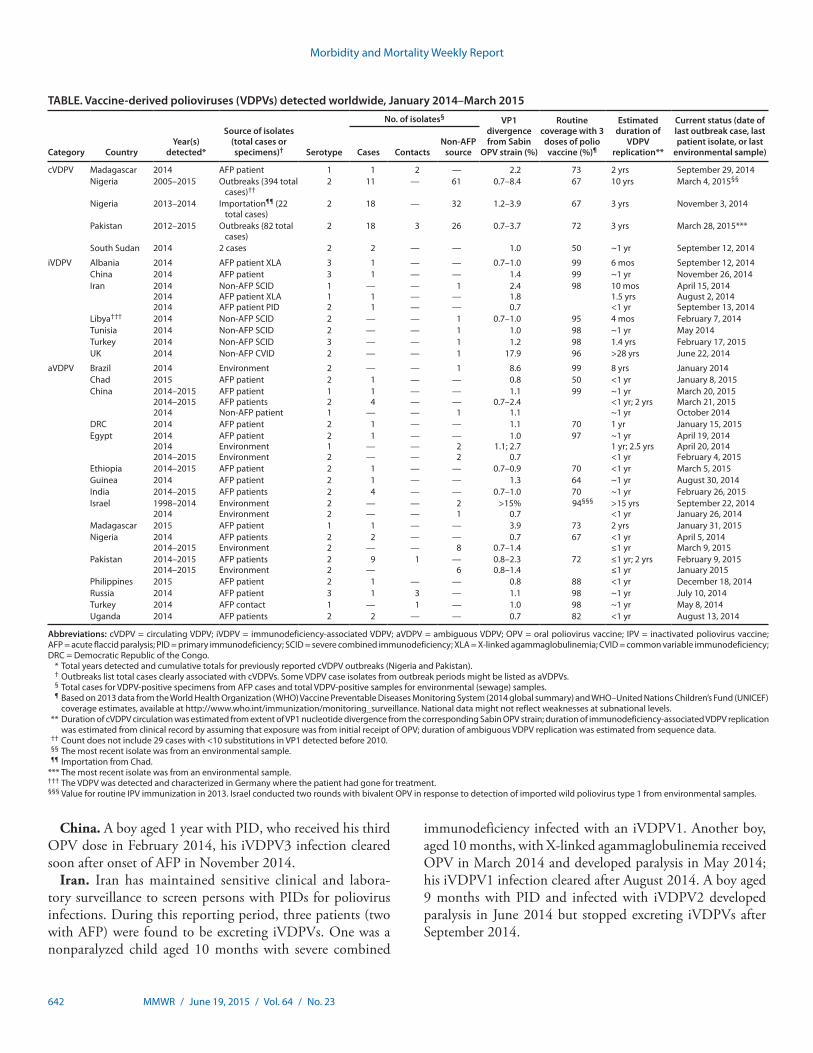
emergent cVDPVs decreased from seven during July 2012–December 2013 (5) to four (Pakistan, Nigeria, Madagascar, and South Sudan) during January 2014–March 2015. Outbreaks associated with indigenous cVDPV2 (Afghanistan, Chad, China, Somalia, and Yemen) and with imported cVDPV2 (Cameroon, Kenya, and Niger) (5) have been interrupted. Although the cVDPV2 outbreak in Pakistan has continued (5), the large outbreak in Nigeria has nearly stopped (5,8), and the two new outbreaks in Madagascar (cVDPV1) and South Sudan (cVDPV2) are small (Table, Figure 1). The most prevalent cVDPVs are type 2 (88.2%), followed by type 1 (10.3%) and type 3 (1.6%). Among the 686 cVDPV cases reported since 2006, >97% were associated with cVDPV2 (Figure 2).
Madagascar. One cVDPV1 was isolated from an acute flac-cid paralysis (AFP) patient in Analalava, Mahjanga Province, on the northwest coast. Circulation is suspected because of the extent of VP1 nucleotide sequence divergence (2.2%) from the parental OPV strain, the absence of immunodeficiency in the AFP patient, and the infection of two nonhousehold contacts with closely related cVDPV1 viruses, as well as the history of repeated cVDPV emergence in Madagascar (5).
Nigeria. The large indigenous cVDPV2 outbreaks in northern Nigeria, associated with >20 independent cVDPV2 emergences, peaked in 2009 (8), but low-level circulation con-tinued (5). Virus from the major cVDPV2 lineage group that first emerged in 2005 (8) was isolated from 11 AFP patients (most recent onset date: October 14, 2014) and 61 sewage samples (most recent positive sample: March 4, 2015) during the reporting period. Virus from an independent cVDPV2 emergence, apparently originating in Chad in 2012 (5), was isolated from 18 AFP patients (most recent onset date: November 3, 2014) and 32 sewage samples (most recent posi-tive sample: June 18, 2014) in 2014. In addition, four Kaduna State sewage isolates from samples collected from August 2014 through January 2015 had shared nucleotide substitutions at six VP1 positions and the accumulation of VP1 substitutions (0.8%–1.4%) over time (8), both characteristics consistent with cVDPV2s. Circulating VDPV2s were found only in the northern states during the reporting period.
Pakistan. At least five independent cVDPV2 emergences have occurred in Pakistan since 2012. The emergence associ-ated with most reported cases (71 in Pakistan and four in
Afghanistan) was first detected in Killa Abdullah, Balochistan, in August 2012 (5), spread to the insecure North Waziristan Agency in 2013, causing a large outbreak; to parts of Karachi in 2012–2013; and to neighboring Tribal Agencies and Khyber Pakhtunkhwa in 2014. Four cases in Kandahar, Afghanistan, in 2012–2013 were associated with this emergence. The last case from this emergence was reported in June 2014, and the most divergent isolate differed from OPV type 2 at 3.7% of VP1 nucleotide positions. Three additional independent emergences were detected in North Waziristan Agency, associated with five cases in 2013 (0.8%–1.1% VP1 divergence), three during 2013–2014 (0.8%–1.2% VP1 divergence), and two in 2014 (1.1% VP1 divergence), respectively. A fifth cVDPV2 emer-gence, associated with one AFP case (December 13, 2014), and 29 closely related but nonidentical 2014–2015 sewage isolates (0.8%–2.1% VP1 divergence), has been detected in an insecure part of Karachi, with subsequent introduction into Quetta, Balochistan.
South Sudan. In September 2014, two cVDPV2 isolates (1.0% VP1 divergence) were identified from patients with AFP in Rubkona, Unity State. The isolates shared three VP1 nucleo-tide substitutions, consistent with epidemiologic linkage.
iVDPVsSince the introduction of OPV in 1961, approximately 100
persons with PIDs worldwide have been found to be excreting iVDPVs, indicating prolonged infection; the majority of these immunodeficiencies were detected only after onset of paralysis. After implementation of intensified surveillance for VDPVs and special studies of iVDPV excretion among persons with PIDs in developing and middle-income countries (9), detection of new iVDPV infections increased from two during January 2008–June 2009, to nine during July 2009–June 2011, and to 12 during April 2011–June 2012, but decreased to 10 during July 2012–December 2013 (5), and to eight during the current reporting period (Table). Like cVDPVs, type 2 iVDPVs are the most prevalent (65%), followed by type 1 (18%) and type 3 (17%). Some patients have heterotypic (i.e., types 1 and 2 or types 2 and 3) iVDPV infections, with the extent of sequence divergence in each isolate of the heterotypic mixture consistent with derivation from a single tOPV source dose (4). Eight new patients with iVDPV infections were reported during January 2014–March 2015 (in addition to the patient with the longest known iVDPV infection, whose infection continued during the reporting period) are described as follows.
Albania. A boy aged 5 months with X-linked agammaglobu-linemia, who first received OPV in March 2014 and developed paralysis in June 2014, his iVDPV3 infection cleared after September 2014.
Morbidity and Mortality Weekly Report
642 MMWR / June 19, 2015 / Vol. 64 / No. 23
China. A boy aged 1 year with PID, who received his third OPV dose in February 2014, his iVDPV3 infection cleared soon after onset of AFP in November 2014.
Iran. Iran has maintained sensitive clinical and labora-tory surveillance to screen persons with PIDs for poliovirus infections. During this reporting period, three patients (two with AFP) were found to be excreting iVDPVs. One was a nonparalyzed child aged 10 months with severe combined
immunodeficiency infected with an iVDPV1. Another boy, aged 10 months, with X-linked agammaglobulinemia received OPV in March 2014 and developed paralysis in May 2014; his iVDPV1 infection cleared after August 2014. A boy aged 9 months with PID and infected with iVDPV2 developed paralysis in June 2014 but stopped excreting iVDPVs after September 2014.
TABLE. Vaccine-derived polioviruses (VDPVs) detected worldwide, January 2014–March 2015
Category CountryYear(s)
detected*
Source of isolates(total cases or specimens)† Serotype
No. of isolates§ VP1 divergence from Sabin
OPV strain (%)
Routine coverage with 3 doses of polio vaccine (%)¶
Estimated duration of
VDPV replication**
Current status (date of last outbreak case, last patient isolate, or last
environmental sample)Cases ContactsNon-AFP
source
cVDPV Madagascar 2014 AFP patient 1 1 2 — 2.2 73 2 yrs September 29, 2014Nigeria 2005–2015 Outbreaks (394 total
cases)††2 11 — 61 0.7–8.4 67 10 yrs March 4, 2015§§
Nigeria 2013–2014 Importation¶¶ (22 total cases)
2 18 — 32 1.2–3.9 67 3 yrs November 3, 2014
Pakistan 2012–2015 Outbreaks (82 total cases)
2 18 3 26 0.7–3.7 72 3 yrs March 28, 2015***
South Sudan 2014 2 cases 2 2 — — 1.0 50 ~1 yr September 12, 2014
iVDPV Albania 2014 AFP patient XLA 3 1 — — 0.7–1.0 99 6 mos September 12, 2014China 2014 AFP patient 3 1 — — 1.4 99 ~1 yr November 26, 2014Iran 2014
20142014
Non-AFP SCIDAFP patient XLAAFP patient PID
112
—11
———
1——
2.41.80.7
98 10 mos1.5 yrs<1 yr
April 15, 2014August 2, 2014September 13, 2014
Libya††† 2014 Non-AFP SCID 2 — — 1 0.7–1.0 95 4 mos February 7, 2014Tunisia 2014 Non-AFP SCID 2 — — 1 1.0 98 ~1 yr May 2014Turkey 2014 Non-AFP SCID 3 — — 1 1.2 98 1.4 yrs February 17, 2015UK 2014 Non-AFP CVID 2 — — 1 17.9 96 >28 yrs June 22, 2014
aVDPV Brazil 2014 Environment 2 — — 1 8.6 99 8 yrs January 2014Chad 2015 AFP patient 2 1 — — 0.8 50 <1 yr January 8, 2015China 2014–2015
2014–20152014
AFP patientAFP patientsNon-AFP patient
121
14
—
———
——
1
1.10.7–2.4
1.1
99 ~1 yr<1 yr; 2 yrs~1 yr
March 20, 2015March 21, 2015October 2014
DRC 2014 AFP patient 2 1 — — 1.1 70 1 yr January 15, 2015Egypt 2014
20142014–2015
AFP patientEnvironmentEnvironment
212
1——
———
—22
1.01.1; 2.7
0.7
97 ~1 yr 1 yr; 2.5 yrs<1 yr
April 19, 2014April 20, 2014February 4, 2015
Ethiopia 2014–2015 AFP patient 2 1 — — 0.7–0.9 70 <1 yr March 5, 2015Guinea 2014 AFP patient 2 1 — — 1.3 64 ~1 yr August 30, 2014India 2014–2015 AFP patients 2 4 — — 0.7–1.0 70 ~1 yr February 26, 2015Israel 1998–2014
2014EnvironmentEnvironment
22
——
——
21
>15%0.7
94§§§ >15 yrs<1 yr
September 22, 2014January 26, 2014
Madagascar 2015 AFP patient 1 1 — — 3.9 73 2 yrs January 31, 2015Nigeria 2014
2014–2015AFP patientsEnvironment
22
2—
——
—8
0.70.7–1.4
67 <1 yr≤1 yr
April 5, 2014March 9, 2015
Pakistan 2014–20152014–2015
AFP patientsEnvironment
22
9—
1 —6
0.8–2.30.8–1.4
72 ≤1 yr; 2 yrs≤1 yr
February 9, 2015January 2015
Philippines 2015 AFP patient 2 1 — — 0.8 88 <1 yr December 18, 2014Russia 2014 AFP patient 3 1 3 — 1.1 98 ~1 yr July 10, 2014Turkey 2014 AFP contact 1 — 1 — 1.0 98 ~1 yr May 8, 2014Uganda 2014 AFP patients 2 2 — — 0.7 82 <1 yr August 13, 2014
Abbreviations: cVDPV = circulating VDPV; iVDPV = immunodeficiency-associated VDPV; aVDPV = ambiguous VDPV; OPV = oral poliovirus vaccine; IPV = inactivated poliovirus vaccine; AFP = acute flaccid paralysis; PID = primary immunodeficiency; SCID = severe combined immunodeficiency; XLA = X-linked agammaglobulinemia; CVID = common variable immunodeficiency; DRC = Democratic Republic of the Congo. * Total years detected and cumulative totals for previously reported cVDPV outbreaks (Nigeria and Pakistan). † Outbreaks list total cases clearly associated with cVDPVs. Some VDPV case isolates from outbreak periods might be listed as aVDPVs. § Total cases for VDPV-positive specimens from AFP cases and total VDPV-positive samples for environmental (sewage) samples. ¶ Based on 2013 data from the World Health Organization (WHO) Vaccine Preventable Diseases Monitoring System (2014 global summary) and WHO–United Nations Children’s Fund (UNICEF)
coverage estimates, available at http://www.who.int/immunization/monitoring_surveillance. National data might not reflect weaknesses at subnational levels. ** Duration of cVDPV circulation was estimated from extent of VP1 nucleotide divergence from the corresponding Sabin OPV strain; duration of immunodeficiency-associated VDPV replication
was estimated from clinical record by assuming that exposure was from initial receipt of OPV; duration of ambiguous VDPV replication was estimated from sequence data. †† Count does not include 29 cases with <10 substitutions in VP1 detected before 2010. §§ The most recent isolate was from an environmental sample. ¶¶ Importation from Chad. *** The most recent isolate was from an environmental sample. ††† The VDPV was detected and characterized in Germany where the patient had gone for treatment. §§§ Value for routine IPV immunization in 2013. Israel conducted two rounds with bivalent OPV in response to detection of imported wild poliovirus type 1 from environmental samples.

Morbidity and Mortality Weekly Report
MMWR / June 19, 2015 / Vol. 64 / No. 23 643
Libya. A nonparalyzed girl aged 1 month with severe com-bined immunodeficiency traveled to Germany for treatment and was found to be infected with iVDPV2 during November 2013–February 2014; excretion stopped following bone mar-row transplantation.
Tunisia. A nonparalyzed boy aged 11 years with severe combined immunodeficiency was infected with an iVDPV2. He stopped excreting iVDPVs after May 2014.
Turkey. A nonparalyzed girl aged 1 year with severe com-bined immunodeficiency was infected with an iVDPV3, which she continued to excrete into December 2014.
United Kingdom. A man aged 44 years with common vari-able immunodeficiency was found to be excreting iVDPV2 since 1995. He has no AFP, but the sequence properties of the isolates obtained from serial specimens are consistent with chronic iVDPV2 infection since his last OPV dose at age 7 years.
aVDPVsDuring January 2014–March 2015, aVDPVs were isolated
in 16 countries (Table). Detection of aVDPVs in settings with <60% vaccination coverage with 3 doses of polio vac-cine might signal cVDPV emergence and potential gaps in surveillance. Some aVDPVs, especially those with limited divergence detected in areas with high vaccination coverage and in patients with no known immunodeficiency, might represent limited spread of OPV or the upper limit of OPV sequence divergence in a single normal vaccine recipient or contact. The most divergent aVDPV was from Brazil, a country with >90% vaccination coverage with 3 doses of polio vaccine. Selected aVDPVs from the reporting period are described as follows.
Brazil. An aVDPV2 (8.6% VP1 divergence) was isolated from sewage in the Port of São Sebastião, São Paulo, in January 2014. The isolate resembles an iVDPV but is classified as an aVDPV because no immunodeficient source patient has been identified.
China. Sporadic aVDPVs were isolated in six different provinces during January 2014–March 2015; one aVDPV1
FIGURE 1. Vaccine-derived polioviruses (VDPVs) detected worldwide, January 2014–March 2015
Type 1 cVDPVType 2 cVDPVType 3 cVDPV
Type 1 iVDPVType 2 iVDPVType 3 iVDPV
Type 1 aVDPV (AFP patient)Type 2 aVDPV (AFP patient)Type 3 aVDPV (AFP patient)
Type 1 aVDPV (Environment)Type 2 aVDPV (Environment)Type 3 aVDPV (Environment)
416 casesof type 2 cVDPV
(2005−2014)*
1 case, 2 contactsof type 1 cVDPV
(2014)*
82 casesof type 2 cVDPV
(2012−2014)*
2 casesof type 2 cVDPV
(2014)*
Abbreviations: cVDPV = circulating VDPV; iVDPV = immunodeficiency-associated VDPV; aVDPV = ambiguous VDPV; AFP = acute flaccid paralysis.* Spread of cVDPVs followed the elimination of the corresponding serotype of indigenous wild poliovirus, but with continued introduction of oral poliovirus vaccine
into communities with growing immunity gaps. All of the cVDPV outbreaks were detected first by the laboratory, using sequence data and evolutionary analyses.

Morbidity and Mortality Weekly Report
644 MMWR / June 19, 2015 / Vol. 64 / No. 23
and four aVDPV2s were isolated from AFP patients, and one aVDPV1 was isolated from a healthy child.
India. Four aVDPV2s (0.7%–1.0% VP1 divergence) were isolated from AFP patients in four different states during January 2014–March 2015.
Israel. Two isolates of the highly divergent, neurovirulent aVDPV2 first detected in 1998 were detected in sewage samples collected on May 4 and September 22, 2014, and an independent aVDPV2 was found in sewage collected on January 26, 2014.
Madagascar. An aVDPV1 (3.9% VP1 divergence) was isolated from a patient in Nosy-Varika, Fianarantsoa Province (central east coast), with onset of paralysis on January 31, 2015. Despite a small number of VP1 substitutions shared with the 2014 cVDPV1 isolates from Analalava, this aVDPV1 appears to be an independent emergence.
Nigeria. Ten aVDPV2s (two from AFP patients, eight from sewage samples, and all with 0.6%–0.7% VP1 divergence) were isolated in the northern states and the Federal Capital Territory during the reporting period.
Pakistan. Fifteen aVDPV2s isolates (10 from AFP cases/contacts, four from sewage samples, and all with 0.8%–2.3% VP1 divergence) were isolated during January 2014–March 2015. The most recent aVDPV2 isolates were from the Khyber Agency (two AFP cases in February 2015 and 0.8% VP1 diver-gence), and Peshawar, Khyber Pakhtunkhwa (from a January 2015 sewage sample, with 0.8% VP1 divergence).
Discussion
During January 2014–March 2015, the size and geographic distribution of cVDPV outbreaks further declined since July 2012–December 2013. However, new cVDPV2 lineages have emerged in both Nigeria and Pakistan in settings of insecu-rity and widening immunity gaps to cVDPV2. Inclusion of more tOPV rounds in the steadily improving supplementary immunization activities (SIAs)* and ensuring increased access to unimmunized children are important factors in control-ling cVDPV2 outbreaks. The new outbreaks in Madagascar and South Sudan underscore the importance of maintaining high population immunity to all polioviruses and of sensitive AFP surveillance.
Although expanded testing of sewage samples for the pres-ence of poliovirus (environmental surveillance) in Nigeria and Pakistan has increased the sensitivity of poliovirus detection, especially cVDPV2, which has a 10-fold lower case-to-infection
ratio than WPV1 (4), it also presents new logistical and techni-cal challenges to the Global Polio Laboratory Network, because VDPVs must be detected within the complex mixtures of polioviruses and other enteric viruses present in sewage. The rRT-PCR screening for VDPVs must be capable of recogniz-ing the small number of genetic differences distinguishing VDPVs from the closely related VRPVs, which are currently of little public health interest, while striking a balance between sensitivity and specificity not required for the identification of WPVs, which are readily distinguishable from VRPVs and VDPVs (7); the requirement for high specificity has resulted in an increased need for nucleotide sequencing.
Interpreting the virologic data presents additional chal-lenges: one VDPV isolate from an AFP patient might signal hundreds to thousands of inapparent cVDPV infections, whereas multiple VDPV sewage isolates might derive from a single iVDPV infection. Environmental cVDPV isolates can be recognized by their close genetic relationship with known cVDPVs from one or more AFP patients or by local detection of closely related VDPVs over several months that show pro-gressive divergence from the parental OPV strain. These latter environmental cVDPVs are distinguishable by their sequence properties from those environmental aVDPVs (4) which very likely signal the presence of a chronic iVDPV excretor in the community. Indeed, highly divergent environmental aVDPVs that are probably iVDPVs from unidentified chronic excretors have been detected in five countries, most recently in Brazil.
FIGURE 2. Circulating vaccine-derived poliovirus (cVDPV) cases detected worldwide, by serotype and year, January 2000–March 2015*
0
20
40
60
80
100
No.
of c
ases 120
140
160
180
200
2000 2002 2004 2006 2008
Year
2010 2012 2014
cVDPV1cVDPV2cVDPV3
* Data through March 2015, as available by June 15, 2015.
* SIAs are mass vaccination campaigns conducted in a short period (days to weeks) during which a dose of OPV is administered to all children aged <5 years, regardless of previous vaccination history. Campaigns can be conducted nationally or in portions of a country.

Morbidity and Mortality Weekly Report
MMWR / June 19, 2015 / Vol. 64 / No. 23 645
Detection of less divergent environmental VDPVs (especially VDPV2s) without linkage to known infected persons presents the greatest challenges for epidemiologic interpretation.
Special studies in several countries to search for VDPV infec-tions among patients with PIDs have increased the number of known iVDPV excretors, while documenting the infrequency of iVDPV infections, even among persons with PIDs (9). Global AFP surveillance and environmental surveillance have proven most sensitive in detecting prolonged iVDPV excretion.
In view of the rising incidence of cVDPV2 outbreaks more than a decade after the last known WPV2 case, GPEI has incorporated the coordinated worldwide withdrawal of tOPV and replacement with bOPV into its new strategic plan, with the ultimate goal of stopping all OPV use (6). The switch from tOPV to bOPV, planned for April 2016, is predicated on the
absence of any known cVDPV2 transmission (6). The absence of any reported cases associated with cVDPV2 in 2015 (all cVDPV2 isolates through March 2015 were from environment samples) and the current low frequency of cVDPV2 detection worldwide is encouraging. To ensure that VDPV emergence is minimized and that any VDPV infections are detected, it will be essential to continue efforts to strengthen routine immunization services and to strengthen AFP and poliovirus surveillance during 2015. Most countries will incorporate at least 1 dose of IPV into routine childhood immunization schedules in 2015 (6).
Replacement of tOPV with bOPV will greatly reduce the risk for cVDPV2 outbreaks, and global cessation of OPV use will ultimately prevent all cVDPV outbreaks and all new iVDPV infections (6). However, a small number of persons with chronic iVDPV infections, as exemplified by the non-AFP common variable immunodeficiency patient from the United Kingdom, might continue to excrete poliovirus for a decade or more after receipt of the last OPV dose. Therefore, maintenance of high levels of population immunity through comprehensive IPV coverage will be necessary to protect against iVDPV becoming a source of spread in the community. Detection of chronic iVDPV excretors in all countries (9) and development of antivirals to clear chronic iVDPV infections are also important (10).
Acknowledgments
Global Polio Laboratory Network. Humayun Asghar, MD, WHO Regional Office, Cairo, Egypt. Sunil Bahl, MD, National Polio Surveillance Program, New Delhi, India. Eugene Gavrilin, PhD, WHO Regional Office, Copenhagen, Denmark. Nicksy Gumede, PhD, WHO Regional Office, Brazzaville, Republic of the Congo. Gloria Rey, MSc, WHO Regional Office, Washington, DC. W. William Schluter, MD, WHO Regional Office, Manila, Philippines. Shohreh Shahmahmoodi, PhD, Tehran University of Medical Sciences, Tehran, Iran. Salmaan Sharif, PhD, Sohail Zaidi, MSc, National Institute of Health of Pakistan, Islamabad, Pakistan. Lester Shulman, PhD, Central Virology Laboratory, Tell Hashomer, Israel. Wenbo Xu, PhD, China CDC, Beijing, China. Eric Mast, MD, Global Immunization Division, Center for Global Health, CDC; Jane Iber, MSc, Qi Chen, MSc, David Kilpatrick, PhD, Steven Oberste, PhD, Division of Viral Diseases, National Center for Immunization and Respiratory Diseases, CDC.
1Department of Immunization, Vaccines, and Biologicals, World Health Organization, Geneva, Switzerland; 2Division of Viral Diseases, National Center for Immunization and Respiratory Diseases, CDC; 3Polio Operations and Research Department, World Health Organization, Geneva, Switzerland; 4Global Immunization Division, Center for Global Health, CDC.
Corresponding author: Olen M. Kew, [email protected], 404-639-3940.
SummaryWhat is already known on this topic?
Genetically divergent vaccine-derived polioviruses (VDPVs) are detected by poliovirus surveillance and have biologic proper-ties indistinguishable from wild polioviruses. High polio vaccination coverage can prevent circulating VDPV (cVDPV) outbreaks, but prolonged immunodeficiency-associated VDPV (iVDPV) infections will occur as long as oral poliovirus vaccine (OPV) is used.
What is added by this report?
The intensity of cVDPV transmission fell after mid-2014. Recent cVDPV outbreaks in Afghanistan, Chad, Somalia, and Yemen have apparently stopped, and the large outbreak in Nigeria has nearly stopped. Virus of the major cVDPV emergence in Pakistan was last detected in June 2014, but low-level circulation of a new emergence was detected into 2015. New, possibly small, outbreaks were detected in Madagascar and South Sudan. Nine new prolonged iVDPV infections in seven countries were detected, either by characterization of isolates from patients with acute flaccid paralysis (AFP) or by intensified search for iVDPV excretion among persons with primary B-cell immunodeficien-cies. Since 2006, >97% of cVDPVs detected have been type 2.
What are the implications for public health practice?
Circulating VDPV outbreaks can be prevented and controlled by high OPV coverage. By contrast, only cessation of OPV use will prevent prolonged iVDPV infections. WHO has responded to the continued global type 2 VDPV risk by incorporating the following into its new strategic plan: 1) shifting from trivalent OPV to bivalent OPV (types 1 and 3) by April 2016; 2) including ≥1 dose of inactivated poliovirus vaccine into routine immuni-zation schedules worldwide; 3) maintaining strategic stockpiles of monovalent OPV; 4) developing a robust acute flaccid paralysis and poliovirus surveillance and response capacity; and 5) encouraging development of antiviral drugs to clear prolonged iVDPV infections.

Morbidity and Mortality Weekly Report
646 MMWR / June 19, 2015 / Vol. 64 / No. 23
References 1. Hagan JE, Wassilak SGF, Craig AS, et al. Progress toward polio
eradication—worldwide, 2014‒2015. MMWR Morb Mortal Wkly Rep 2015;64:527–31.
2. Sutter RW, Kew OM, Cochi SL, Aylward RB. Poliovirus vaccine—live. In: Plotkin SA, Orenstein WA, Offit PA, eds. Vaccines. Sixth ed. London, England: W.B. Saunders; 2013:598–645.
3. Platt LR, Estívariz CF, Sutter RW. Vaccine-associated paralytic poliomyelitis: a review of the epidemiology and estimation of the global burden. J Infect Dis 2014;210(Suppl 1):S380–9.
4. Burns CC, Diop OM, Sutter RW, Kew OM. Vaccine-derived polioviruses. J Infect Dis 2014;210(Suppl 1):S283–93.
5. Diop OM, Burns CC, Wassilak SG, Kew OM. Update on vaccine-derived polioviruses—worldwide, July 2012–December 2013. MMWR Morb Mortal Wkly Rep 2014;63:242–8.
6. Global Polio Eradication Initiative. Polio eradication and endgame strategic plan (2013–2018). Available at http://www.polioeradication.org/portals/0/document/resources/strategywork/endgamestratplan_20130414_eng.pdf.
7. Kilpatrick DR, Ching K, Iber J, et al. Identification of vaccine-derived polioviruses using dual-stage real-time RT-PCR. J Virol Methods 2014;197:25–8.
8. Burns CC, Shaw J, Jorba J, et al. Multiple independent emergences of type 2 vaccine-derived polioviruses during a large outbreak in northern Nigeria. J Virol 2013;87:4907–22.
9. Li L, Ivanova O, Driss N, et al. Poliovirus excretion among persons with primary immune deficiency disorders: summary of a seven-country study series. J Infect Dis 2014;210(Suppl 1):S368–72.
10. Rhoden E, Liu HM, Wang-Chern SW, Oberste MS. Anti-poliovirus activity of protease inhibitor AG-7404, and assessment of in vitro activity in combination with antiviral capsid inhibitor compounds. Antiviral Res 2013;98:186–91.

Morbidity and Mortality Weekly Report
MMWR / June 19, 2015 / Vol. 64 / No. 23 647
On February 26, 2015, the Advisory Committee on Immunization Practices (ACIP) voted that a single primary dose of yellow fever vaccine provides long-lasting protection and is adequate for most travelers (1). ACIP also approved recommendations for at-risk laboratory personnel and certain travelers to receive additional doses of yellow fever vaccine (Box). The ACIP Japanese Encephalitis and Yellow Fever Vaccines Workgroup evaluated published and unpublished data on yellow fever vaccine immunogenicity and safety. The evidence for benefits and risks associated with yellow fever vaccine booster doses was evaluated using the Grading of Recommendations, Assessment, Development, and Evaluation (GRADE) framework (2,3). This report summarizes the evi-dence considered by ACIP and provides the updated recom-mendations for yellow fever vaccine booster doses.
Yellow Fever Epidemiology and Risk for Disease in Travelers
Yellow fever is a mosquito-borne viral disease that is endemic to sub-Saharan Africa and tropical South America. Worldwide, yellow fever virus causes an estimated 200,000 cases of clinical disease and 30,000 deaths annually (4). Clinical disease ranges
from a mild, nonspecific febrile illness to severe disease with jaundice and hemorrhage. The case-fatality ratio for severe yel-low fever is 20%–50% (5). Because no specific treatment exists, prevention through vaccination is critical to reduce morbidity and mortality from yellow fever virus infection.
The risk of a traveler acquiring yellow fever varies based on season, location, activities, and duration of their travel. For a 2-week stay, the estimated risk for illness attributed to yellow fever for an unvaccinated traveler to West Africa is 50 cases per 100,000 population; for South America, the risk for illness is five cases per 100,000 population (6).
Yellow Fever Vaccine Recommendations and International Health Regulations Requirements
Yellow fever vaccine is recommended for persons aged ≥9 months who are traveling to or living in areas with risk for yellow fever virus transmission (7). International Health Regulations allow countries to require proof of yellow fever vaccination from travelers entering their country (8). These requirements are intended to minimize the potential importa-tion and spread of yellow fever virus. Currently, International Health Regulations specify that a dose of yellow fever vaccine is valid for 10 years. Therefore, at present, travelers to countries with a yellow fever vaccination entry requirement must have received a dose of yellow fever vaccine within the past 10 years.
Recent changes to yellow fever vaccine recommenda-tions. In April 2013, the World Health Organization Strategic Advisory Group of Experts on Immunization concluded that a single primary dose of yellow fever vaccine is sufficient to confer sustained immunity and lifelong protection against yellow fever disease, and that a booster dose is not needed (9). This conclu-sion was based on a systematic review of published studies on the duration of immunity after a single dose of yellow fever vaccine, and on data that suggest vaccine failures are extremely rare and do not increase in frequency with time since vaccina-tion (10). The advisory group noted that future studies and surveillance data should be used to identify specific risk groups, such as persons infected with human immunodeficiency virus (HIV) or infants, who might benefit from a booster dose. In May 2014, the World Health Assembly adopted the recom-mendation to remove the 10-year booster dose requirement from the International Health Regulations by June 2016 (11).
Yellow Fever Vaccine Booster Doses: Recommendations of the Advisory Committee on Immunization Practices, 2015
J. Erin Staples, MD1; Joseph A. Bocchini Jr., MD2,3; Lorry Rubin, MD2,4; Marc Fischer, MD1 (Author affiliations at end of text)
Recommendations for routine use of vaccines in children, ado-lescents, and adults are developed by the Advisory Committee on Immunization Practices (ACIP). ACIP is chartered as a federal advisory committee to provide expert external advice and guid-ance to the Director of the Centers for Disease Control and Pre-vention (CDC) on use of vaccines and related agents for the con-trol of vaccine-preventable diseases in the civilian population of the United States. Recommendations for routine use of vaccines in children and adolescents are harmonized to the greatest extent possible with recommendations made by the American Academy of Pediatrics (AAP), the American Academy of Family Physicians (AAFP), and the American College of Obstetricians and Gyne-cologists (ACOG). Recommendations for routine use of vaccines in adults are harmonized with recommendations of AAFP, ACOG, and the American College of Physicians (ACP). ACIP recommen-dations approved by the CDC Director become agency guidelines on the date published in the Morbidity and Mortality Weekly Re-port (MMWR). Additional information regarding ACIP is avail-able at http://www.cdc.gov/vaccines/acip.

Morbidity and Mortality Weekly Report
648 MMWR / June 19, 2015 / Vol. 64 / No. 23
Yellow Fever Vaccine Long-term Immunogenicity Data
No data are available on vaccine efficacy or protective anti-body titers (i.e., seroprotection) related to long-term immu-nogenicity after yellow fever vaccination. Benefits considered critical in assessing the need for booster doses of yellow fever vaccine for U.S. travelers or laboratory workers included vac-cine effectiveness (i.e., a lack of vaccine failures) and evidence of seropositivity (i.e., yellow fever virus–specific antibodies detected in a blood sample) (3).
Vaccine effectiveness. A total of 23 vaccine failures were identified after the administration of >540 million doses of yellow fever vaccine (3). Of the 23 cases, five occurred <10 days after vaccination and were excluded because most persons are not expected to develop protective titers in that timeframe (5). Of the remaining 18 cases, 16 (89%) occurred in persons who reported receiving a dose of the vaccine within the previous 10 years (3). One vaccine failure occurred at 20 years and one at 27 years post-vaccination.
Seropositivity. Thirteen observational studies provided immunogenicity data on 1,137 persons vaccinated ≥10 years previously (3). Using a random effects model, the estimated seropositivity rate for persons vaccinated ≥10 years previously was 92% (95% confidence interval [CI] = 85%–96%). Of the 164 persons vaccinated ≥20 years previously, the estimated seropositivity rate was 80% (CI = 74%–86%).
Yellow Fever Vaccine Booster Dose Safety DataSerious adverse events, yellow fever vaccine–associated vis-
cerotropic disease (a severe illness similar to wild-type disease), and yellow fever vaccine-associated neurologic disease were considered critical risks to assess the need for yellow fever vaccine booster doses (7).
Serious adverse events. Nine observational studies provided data on serious adverse events for 333 million distributed doses of yellow fever vaccine (3). Overall, 1,255 persons were reported to have a serious adverse event after yellow fever vaccination. For most (84%) persons, it was unknown if the adverse event occurred after a primary or booster dose of the vaccine. Of the 201 persons with a serious adverse event where dose type was known, 14 (7%) of the adverse events occurred after a booster dose of vaccine.
Viscerotropic disease. Eight observational studies provided data on viscerotropic disease for 437 million distributed doses of yellow fever vaccine (3). A total of 72 persons had yellow fever vaccine–associated viscerotropic disease. Of the 31 persons where dose type was known, one (3%) had viscero-tropic disease after receiving a booster dose of the vaccine; no
laboratory testing to assess vaccine causality was performed for that case.
Neurologic disease. Eight observational studies provided neurologic disease data for approximately 462 million
BOX. Recommendations for use of yellow fever vaccine booster doses*
•A single primary dose of yellow fever vaccine provides long-lasting protection and is adequate for most travelers [Category A].
•Additional doses of yellow fever vaccine are recommended for certain travelers:
– Women who were pregnant (regardless of trimester) when they received their initial dose of yellow fever vaccine should receive 1 additional dose of yellow fever vaccine before their next travel that puts them at risk for yellow fever virus infection [Category A];
– Persons who received a hematopoietic stem cell transplant after receiving a dose of yellow fever vaccine and who are sufficiently immunocompetent to be safely vaccinated should be revaccinated before their next travel that puts them at risk for yellow fever virus infection [Category A];
– Persons who were infected with human immunodeficiency virus when they received their last dose of yellow fever vaccine should receive a dose every 10 years if they continue to be at risk for yellow fever virus infection [Category A].
•A booster dose may be given to travelers who received their last dose of yellow fever vaccine at least 10 years previously and who will be in a higher-risk setting based on season, location, activities, and duration of their travel [Category B]. This would include travelers who plan to spend a prolonged period in endemic areas or those traveling to highly endemic areas such as rural West Africa during peak transmission season or an area with an ongoing outbreak.
• Laboratory workers who routinely handle wild-type yellow fever virus should have yellow fever virus–specific neutralizing antibody titers measured at least every 10 years to determine if they should receive additional doses of the vaccine. For laboratory workers who are unable to have neutralizing antibody titers measured, yellow fever vaccine should be given every 10 years as long as they remain at risk [Category A].
* Persons being considered for additional doses of yellow fever vaccine should be assessed for contraindications or precautions in accordance with the current yellow fever vaccine ACIP recommendations (7).

Morbidity and Mortality Weekly Report
MMWR / June 19, 2015 / Vol. 64 / No. 23 649
distributed doses of yellow fever vaccine (3). A total of 218 persons had yellow fever vaccine–associated neurologic disease. Of the 110 persons where dose type was known, three (3%) persons reported neurologic disease after receiving a booster dose of the vaccine.
Other relevant evidencePregnant women. The proportion of women who develop
yellow fever virus antibodies is variable and might be related to the trimester in which they received the vaccine. Among pregnant women who received yellow fever vaccine primarily in their third trimester, 39% (32 of 83) had evidence of sero-conversion to yellow fever virus at 2–4 weeks post-vaccination, compared with 94% (89 of 95) in the general population (12). Of 433 women vaccinated primarily in the first trimester (mean gestational age = 5.7 weeks; CI = 5.2–6.2), 425 (98%) developed yellow fever virus–specific neutralizing antibodies at 6 weeks post-vaccination (13).
Hematopoietic stem cell transplant recipients. Data are limited on safety and immunogenicity for yellow fever vaccine in hematopoietic stem cell transplant recipients. However, data suggest most recipients become seronegative to live viral vaccine antigens after transplantation (14). Infectious Diseases Society of America guidelines recommend re-administering live viral vaccines, such as measles, mumps, and rubella vaccine and varicella vaccine, to post-transplant patients if the recipient is seronegative and is no longer immunosuppressed (15).
HIV-infected persons. Two published studies provide immunogenicity data for yellow fever vaccines in HIV-infected persons (16,17). Both studies found lower rates of yellow fever virus–specific neutralizing antibodies among HIV-infected persons compared with uninfected controls at 10 to 12 months post-vaccination. Although the mechanisms for the diminished immune response in HIV-infected persons are uncertain, an inverse correlation exists between immune response and HIV RNA levels and a positive correlation with CD4+ cell counts (18).
Young children. Twelve studies provided data on the initial immune response to yellow fever vaccine in children aged 4 months–10 years (3). All studies included children who resided in endemic areas, and 10 studies included children who received at least one other vaccine at the same time as yellow fever vaccine. Based on a random effects model, the estimated seroconversion rate in 4,675 children was 93% (CI = 88%‒96%). No difference was observed in the sero-conversion rates between children aged <9 months and those aged ≥9 months (3).
Other higher-risk groups. Over the preceding 20 years, 90% of all yellow fever cases were reported from countries in West Africa, and epidemiologic data suggest that travelers to West Africa are at the highest risk for travel-associated yellow
fever (5). Persons traveling to an area with an ongoing outbreak, persons traveling for a prolonged period in an endemic area, and laboratory workers who routinely handle wild-type yellow fever virus are also considered to be at higher risk for yellow fever virus exposure and disease than other persons for whom yellow fever vaccine is recommended.
Rationale for Yellow Fever Vaccine Booster Dose Recommendations
The GRADE evaluation found that there are few vaccine fail-ures documented after a primary dose of yellow fever vaccine, most (92%) primary vaccine recipients maintain detectable levels of neutralizing antibodies ≥10 years post-vaccination, and few serious adverse events have been reported after a booster dose of yellow fever vaccine (3). Based on the available data, ACIP voted to no longer recommend booster dose of yellow fever vaccine for most travelers, because a single dose of yellow fever vaccine provides long-lasting protection (Box). However, additional doses of yellow fever vaccine are recommended for certain populations (i.e., pregnant women, hematopoietic stem cell transplant recipients, and HIV-infected persons) who might not have as robust or sustained immune response to yel-low fever vaccine compared with other recipients. Furthermore,
SummaryWhat is currently recommended?
In 2009, the Advisory Committee on Immunization Practices (ACIP) approved yellow fever vaccine recommendations that noted International Health Regulations require revaccination at intervals of 10 years to boost antibody titer. Evidence from multiple studies demonstrates that yellow fever vaccine immunity persists for many decades and might provide life-long protection.
Why are the recommendations being modified now?
The World Health Organization Strategic Advisory Group of Experts in Immunization concluded in April 2013 that a single primary dose of yellow fever vaccine is sufficient to confer sustained immunity and lifelong protection against yellow fever disease, and a booster dose of the vaccine is not needed. In May 2014, the World Health Assembly adopted the recommendation to remove the 10-year booster dose requirement from the International Health Regulations by June 2016. Once the International Health Regulations are updated, the current statement in the ACIP recommendation will no longer be relevant.
What are the new recommendations?
A single primary dose of yellow fever vaccine provides long-lasting protection and is adequate for most travelers. The recommendations also provide considerations and recommen-dations for at-risk laboratory personnel and certain travelers to receive additional doses of yellow fever vaccine.

Morbidity and Mortality Weekly Report
650 MMWR / June 19, 2015 / Vol. 64 / No. 23
additional doses may be given to certain groups believed to be at increased risk for yellow fever disease either because of their location and duration of travel or because of more consistent exposure to virulent virus (i.e., laboratory workers). ACIP meeting minutes are available at http://www.cdc.gov/vaccines/acip/meetings/meetings-info.html.
Acknowledgments
Members of the Advisory Committee on Immunization Practices (ACIP). ACIP Japanese Encephalitis and Yellow Fever Vaccines Workgroup. Bradley Biggerstaff, National Center for Emerging and Zoonotic Diseases, CDC. ACIP member roster for July 2014–June 2015 available at http://www.cdc.gov/vaccines/acip/committee/members.html.
1National Center for Emerging and Zoonotic Diseases, CDC; 2Advisory Committee on Immunization Practices; 3Louisiana State University Health Sciences Center, Shreveport, Louisiana; 4North Shore-Long Island Jewish Health System, New Hyde Park, New York.
Corresponding author: J. Erin Staples, [email protected], 970-221-6400.
References 1. CDC. Advisory Committee on Immunization Practices (ACIP):
summary report, February 26, 2015. Atlanta, GA: US Department of Health and Human Services, CDC; 2015. Available at http://www.cdc.gov/vaccines/acip/meetings/meetings-info.html.
2. Ahmed F, Temte JL, Campos-Outcalt D, Schünemann HJ; ACIP Evidence Based Recommendations Work Group (EBRWG). Methods for developing evidence-based recommendations by the Advisory Committee on Immunization Practices (ACIP) of the U.S. Centers for Disease Control and Prevention (CDC). Vaccine 2011;29:9171–6.
3. CDC. GRADE evidence tables–recommendations in MMWR. Atlanta, GA: US Department of Health and Human Services, CDC; 2015. Available at http://www.cdc.gov/vaccines/acip/recs/GRADE/table-refs.html.
4. World Health Organization, Division of Epidemiological Surveillance and Health Situation Trend Assessment. Global health situation and projections—estimates. Geneva, Switzerland: World Health Organization; 1992.
5. Monath T, Gershman MD, Staples JE, Barrett AD. Yellow fever vaccine. In: Plotkin SA, Orenstein WA, Offit PA, eds. Vaccines. Sixth ed. London, England: W.B. Saunders; 2013.
6. Monath TP, Cetron MS. Prevention of yellow fever in persons traveling to the tropics. Clin Infect Dis 2002;34:1369–78.
7. Staples JE, Gershman M, Fischer M. Yellow fever vaccine: recommendations of the Advisory Committee on Immunization Practices (ACIP). MMWR Recomm Rep 2010;59(No. RR-7).
8. World Health Organization. International Health Regulations. Second ed. Geneva, Switzerland: World Health Organization; 2005. Available at http://whqlibdoc.who.int/publications/2008/9789241580410_eng.pdf.
9. World Health Organization. Vaccines and vaccination against yellow fever. WHO position paper—June 2013. Wkly Epidemiol Rec 2013;88:269–83.
10. Gotuzzo E, Yactayo S, Córdova E. Efficacy and duration of immunity following yellow fever vaccination: systematic review on the need for a booster every 10 years. Am J Trop Med Hyg 2013;89:434–44.
11. World Health Organization. International travel and health: world–yellow fever vaccination booster, June 5, 2014. Geneva, Switzerland: World Health Organization; 2014. Available at http://www.who.int/ith/updates/20140605/en.
12. Nasidi A, Monath TP, Vandenberg J, et al. Yellow fever vaccination and pregnancy: a four-year prospective study. Trans R Soc Trop Med Hyg 1993;87:337–9.
13. Suzano CE, Amaral E, Sato HK, Papaiordanou PM; Campinas Group on Yellow Fever Immunization during pregnancy. The effects of yellow fever immunization (17DD) inadvertently used in early pregnancy during a mass campaign in Brazil. Vaccine 2006;24:1421–6.
14. Ljungman P, Lewensohn-Fuchs I, Hammarström V, et al. Long-term immunity to measles, mumps, and rubella after allogeneic bone marrow transplantation. Blood 1994;84:657–63.
15. Rubin LG, Levin MJ, Ljungman P, et al.; Infectious Diseases Society of America. 2013 IDSA clinical practice guideline for vaccination of the immunocompromised host. Clin Infect Dis 2014;58:e44–100.
16. Veit O, Niedrig M, Chapuis-Taillard C, et al.; Swiss HIV Cohort Study. Immunogenicity and safety of yellow fever vaccination for 102 HIV-infected patients. Clin Infect Dis 2009;48:659–66.
17. Sibailly TS, Wiktor SZ, Tsai TF, et al. Poor antibody response to yellow fever vaccination in children infected with human immunodeficiency virus type 1. Pediatr Infect Dis J 1997;16:1177–9.
18. Veit O, Hatz C, Niedrig M, Furrer H. Yellow fever vaccination in HIV-infected patients. HIV Ther 2010;4:17–26.

Morbidity and Mortality Weekly Report
MMWR / June 19, 2015 / Vol. 64 / No. 23 651
Notes from the Field
Tickborne Relapsing Fever Outbreak at an Outdoor Education Camp — Arizona, 2014
Jefferson M. Jones, MD1,2,3; Mare Schumacher, MPH4; Marie Peoples, PhD4; Nina Souders, MD5; Kimberly Horn5; Lisa Fox, DO6; Michele
Scott, MD6; Shane Brady, MD3; Joli Weiss, PhD3; Ken Komatsu, MPH3; Nathan Nieto, PhD7 (Author affiliations at end of text)
Tickborne relapsing fever (TBRF) is a bacterial infection characterized by recurring episodes of fever, headache, muscle and joint aches, and nausea. In North America, TBRF pri-marily is caused by Borrelia hermsii spirochetes transmitted by Ornithodoros hermsii ticks (1). Once infected, these soft ticks are infectious for life (2) and transmit the spirochete to sleeping humans quickly (possibly within 30 seconds) during short feeds (15–90 minutes) (1–3). On August 10, 2014, the Coconino County Public Health Services District in Arizona was notified by a local hospital that five high school students who attended the same outdoor education camp had been hospitalized with fever, headache, and myalgias. Hantavirus infection initially was suspected because of reported exposure to rodent droppings, but after detecting spirochetes on peripheral blood smears from all five hospitalized students, TBRF was diagnosed. The camp was instructed to close immediately, and the health department, in collaboration with local university experts, investigated to identify additional cases, determine the cause, and prevent further infections. A total of 11 cases (six confirmed and five probable) were identified.
Camp staff members and attendees were interviewed during August 11–14. Medical records of the five hospitalized patients were reviewed, and the campsite was inspected for evidence of rodent or tick infestation. Consistent with the Arizona Department of Health Services case definition, a probable case was defined as an illness with at least three of the four major TBRF signs and symptoms (fever, chills, myalgias, and headache) without laboratory testing in a person attending the camp during August 1–3, 2014. A case was confirmed by visualization of spirochetes in an attendee’s blood smear or by Borrelia hermsii isolation by culture.
During August 1–3, a total of 45 persons (39 high school football players and six adult coaches) attended a school-run outdoor education camp located in a wooded area in Coconino County. Thirty-one (69%) of the 45 persons at the camp were interviewed. Six confirmed cases (four by visualization of spirochetes on blood smear and isolation and two by visu-alization of spirochetes alone) and five probable cases were
identified (attack rate: 24%). Ten patients were students aged 15–17 years, and one was a coach aged 33 years.
All six persons with confirmed TBRF and four of the five persons with probable TBRF had slept in the camp’s main cabin. Using the earliest date when common exposure might have occurred (August 1), the median incubation period was 6 days (range = 2–10 days). All six of the persons with con-firmed TBRF had fever, headache, myalgias, and arthralgias; all five of those with probable TBRF had fever, headache, and myalgias (Table). Among the six with confirmed TBRF and known laboratory values, five had thrombocytopenia (platelets <150/µL); four had decreased albumin; and three had elevated transaminases. Eight of the 11 patients were treated with doxycycline and had no known major complica-tions; the six patients with confirmed TBRF were treated with 100 mg doxycycline twice daily for 7–10 days. Attempts to obtain clinical and laboratory information on patients with probable TBRF were unsuccessful.
The investigation revealed that, during July 17–24, profes-sional pest controllers had performed rodent-proofing activities at the main cabin; however, no acaricides (pesticides that kill ticks and mites) were applied. On August 12 and 28, the public health team inspected the cabin and found evidence of rodents and soft tick infestation, including rodent nesting material in a woodpile in a crawl space beneath the cabin, squirrel drop-pings in a chimney crevasse, and one live and one desiccated Ornithodoros hermsii tick. Among four chipmunks (Tamias dosalis) trapped on August 12, two were documented with B. hermsii by positive quantitative polymerase chain reaction. Testing of one soft tick for B. hermsii was negative. Camp management was provided written instructions regarding rodent-proofing and acaricide application. The camp reopened after recommendations were implemented; no additional cases have been identified.
During 1982–2013, a total of 22 TBRF cases (0–3 cases annually) were reported in Arizona residents. This 2014 out-break of TBRF with 11 confirmed and probable cases is the largest recorded in Arizona since 1990. Health care providers and public health professionals should be aware that TBRF is a possible cause of febrile illness among patients with a travel history to areas where TBRF is endemic, particularly if they have slept in a rustic cabin (1). These findings suggest that pest control companies and cabin owners might benefit from education regarding prevention of tickborne diseases, including sleeping off the floor and away from walls, applying insect repellent on skin and clothing, and rodent-proofing.

Morbidity and Mortality Weekly Report
652 MMWR / June 19, 2015 / Vol. 64 / No. 23
To eliminate tick populations in a building, it is important to consider acaricide spraying concurrently with rodent-proofing because removing rodents from buildings can result in ticks losing their primary source of food and feeding on humans as an alternative (2).
TABLE. Number of signs and symptoms of patients with confirmed or probable tickborne relapsing fever in an outbreak associated with an outdoor education camp — Arizona, 2014
Sign or symptomTotal no. (N = 11)
Confirmed no. (n = 6)
Probable no. (n = 5)
Fever 11 6 5Headache 11 6 5Myalgias 11 6 5Arthralgias 10 6 4Abdominal pain 7 5 2Fatigue 6 2 4Vomiting 5 4 1Cough 4 2 2Dizziness 3 3 0Syncope 2 2 0Rash 2 2 0
1Epidemic Intelligence Service, CDC, Atlanta, Georgia; 2Maricopa County Department of Public Health, Phoenix, Arizona; 3Arizona Department of Health Services; 4Coconino County Public Health Services District, Flagstaff, Arizona; 5Flagstaff Medical Center, Flagstaff, Arizona; 6Phoenix Children’s Hospital, Phoenix, Arizona; 7Northern Arizona University, Flagstaff, Arizona.
Corresponding author: Jefferson M. Jones, [email protected], 602-376-8251.
References1. Dworkin MS, Schwan TG, Anderson DE Jr, Borchardt SM. Tick-borne
relapsing fever. Infect Dis Clin North Am 2008;22:449–68, viii.2. Forrester JD, Kjemtrup AM, Fritz CL, et al. Tickborne relapsing fever—
United States, 1990–2011. MMWR Morb Mortal Wkly Rep 2015; 64:58–60.
3. Fritz CL, Payne JR, Schwan TG. Serologic evidence for Borrelia hermsii infection in rodents on federally owned recreational areas in California. Vector Borne Zoonotic Dis 2013;13:376–81.

Morbidity and Mortality Weekly Report
MMWR / June 19, 2015 / Vol. 64 / No. 23 653
Notes from the Field
Update: Silicosis Mortality — United States, 1999–2013
Jacek M. Mazurek, MD1; Patricia L. Schleiff, MS1; John M. Wood, MS1; Scott A. Hendricks, MS2; Ainsley Weston, PhD1
(Author affiliations at end of text)
Silicosis is a potentially fatal but preventable occupa-tional lung disease caused by inhaling respirable crystalline silica (silica) (1). Chronic silicosis, the most common form, occurs after exposure to relatively low silica concentrations for >10 years. Accelerated silicosis occurs after 5–10 years of exposure to higher silica levels, and acute silicosis can occur after only weeks or months of exposure to extremely high silica concentrations (1). New national mortality data for silicosis have become available since a previous report on silicosis surveillance was published earlier this year (2). CDC reviewed multiple cause-of-death mortality files from the National Center for Health Statistics to analyze deaths from silicosis (International Classification of Diseases, 10th Revision diagnosis code J62: a pneumoconiosis due to dust contain-ing silica) reported during 1999–2013. Each record lists one underlying cause of death (the disease or injury that initiated the chain of events that led directly and inevitably to death), and up to 20 contributing causes of death (other significant conditions contributing to death but not resulting in under-lying cause). Available death certificates from 35 states were reviewed for the period 2004–2006 to identify occupations associated with silicosis among decedents aged 15–44 years. Results indicate that despite substantial progress in eliminat-ing silicosis, silicosis deaths continue to occur. Of particular concern are silicosis deaths in young adults (aged 15–44 years). These young deaths likely reflect higher exposures than those causing chronic silicosis mortality in older persons, some of sufficient magnitude to cause severe disease and death after relatively short periods of exposure. A total of 12 such deaths occurred during 2011–2013, with nine that had silicosis listed as the underlying cause of death.
During 1999–2013, a total of 2,065 decedents had silicosis listed as the underlying or as a contributing cause of death (1,122 [54.3%] decedents had silicosis listed as the underlying cause of death) (Table). The annual number of silicosis deaths declined 40% from 185 in 1999 to 111 in 2013 (p-value for trend <0.001), but the decline appears to have leveled off during 2010–2013. The lowest number of silicosis deaths (88) occurred in 2011. Higher numbers of deaths occurred in 2012 (103) and 2013 (111), but remained within the 95% confidence interval predicted by the first-order autoregressive
linear regression model used to evaluate trends for 1999–2013. Among all silicosis deaths, 47 (2.3%) decedents were aged 15–44 years; of these, 34 (72.3%) had silicosis coded as the underlying cause of death (Table). The annual number of silicosis deaths in persons aged 15–44 years varied and was 4, 0, and 8 in 2011, 2012, and 2013, respectively.
Death certificate review identified 62 silicosis deaths, accounting for 13.7% of the 451 reported silicosis deaths dur-ing 2004–2006. Of 39 (62.9%) decedents with silicosis listed as the underlying cause of death, three were aged 15–44 years. Entries on death certificates of these young decedents related to industry and occupation were classified* as miscellaneous nonmetallic mineral product manufacturing (stationary engi-neers and boiler operators), construction (brickmasons and blockmasons), and cut stone and stone product manufacturing (crushing, grinding, and polishing machine setters, operators, and tenders). These industries and occupations are well-known for their association with exposure to crystalline silica (1).
Silicosis mortality in the United States has declined over time (2,3). The continuing occurrence of silicosis deaths in young adults and reports of new occupations and tasks that place workers at risk for silicosis, including fabricators and installers of quartz-containing engineered stone products and workers employed to extract natural gas by hydraulic fractur-ing (4–7), underscore the need for strengthening efforts to limit workplace exposure to crystalline silica. Effective silico-sis prevention strategies for employers are available from the Occupational Safety and Health Administration† and CDC’s National Institute for Occupational Safety and Health.§ State health departments can strengthen silicosis prevention efforts by identifying silicosis cases through review of state morbid-ity and mortality data and by investigating the circumstances surrounding silicosis cases.
Acknowledgments
David N. Weissman, MD, Brent Doney, PhD, Division of Respiratory Disease Studies, National Institute for Occupational Safety and Health, CDC.
* The National Institute for Occupational Safety and Health Industry and Occupation Computerized Coding System was used to classify and code the industry and occupation according to the U.S. Census Bureau, North American Industry Classification System, and the U.S. Bureau of Labor Statistics, Standard Occupational Classification System, respectively. Additional information available at http://wwwn.cdc.gov/niosh-nioccs.
† Additional information available at https://www.osha.gov/pls/oshaweb/owadisp.show_document?p_table=standards&p_id=12716.
§ Additional information available at http://www.cdc.gov/niosh/topics/silica.

Morbidity and Mortality Weekly Report
654 MMWR / June 19, 2015 / Vol. 64 / No. 23
TABLE. Number of silicosis deaths, by age group, other selected characteristics, and year — United States, 1999–2013
Characteristic
Age group
15–44 yrs ≥45 yrs Overall
DeathsUnderlying
cause DeathsUnderlying
cause DeathsUnderlying
cause
Total 47 34 2,018 1,088 2,065 1,122SexMale 39 30 1,933 1,031 1,972 1,061Female 8 4 85 57 93 61RaceWhite 37 27 1,727 927 1,764 954Black 8 6 265 142 273 148Other 2 1 26 19 28 20EthnicityHispanic 9 7 131 83 140 90Non-Hispanic 38 27 1,883 1,002 1,921 1,029Unknown 0 0 4 3 4 3Year1999 3 2 182 100 185 1022000 5 5 146 66 151 712001 1 1 162 81 163 822002 5 4 141 85 146 892003 6 5 171 97 177 1022004 2 0 163 76 165 762005 2 1 158 73 160 742006 6 3 120 64 126 672007 1 1 121 71 122 722008 2 2 144 83 146 852009 1 1 120 65 121 662010 1 0 100 52 101 522011 4 3 84 53 88 562012 0 0 103 58 103 582013 8 6 103 64 111 70P-value* 0.45 0.33 <0.001 0.003 <0.001 0.004
* For trend during 1999–2013. Trends examined using a first-order autoregressive linear regression model.
1Division of Respiratory Disease Studies, National Institute for Occupational Safety and Health, CDC; 2Division of Safety Research, National Institute for Occupational Safety and Health, CDC.
Corresponding author: Jacek Mazurek, [email protected], 304-285-5983.
References1. CDC. NIOSH hazard review. Health effects of occupational exposure to
respirable crystalline silica. Washington, DC: US Department of Health and Human Services, CDC, National Institute for Occupational Safety and Health; 2002. DHHS (NIOSH) publication no. 2002-129. Available at http://www.cdc.gov/niosh/docs/2002-129/pdfs/2002-129.pdf.
2. Bang KM, Mazurek JM, Wood JM, White GE, Hendricks SA, Weston A. Silicosis mortality trends and new exposures to respirable crystalline silica—United States, 2001–2010. MMWR Morb Mortal Wkly Rep 2015;64:117–20.
3. Bang KM, Attfield MD, Wood JM, Syamlal G. National trends in silicosis mortality in the United States, 1981–2004. Am J Ind Med 2008; 51:633–9.
4. CDC. Silicosis in dental laboratory technicians—five states, 1994–2000. MMWR Morb Mortal Wkly Rep 2004;53:195–7.
5. Esswein EJ, Breitenstein M, Snawder J, Kiefer M, Sieber WK. Occupational exposures to respirable crystalline silica during hydraulic fracturing. J Occup Environ Hyg 2013;10:347–56.
6. Friedman GK, Harrison R, Bojes H, Worthington K, Filios M. Notes from the field: silicosis in a countertop fabricator—Texas, 2014. MMWR Morb Mortal Wkly Rep 2015;64:129–30.
7. Pérez-Alonso A, Córdoba-Doña JA, Millares-Lorenzo JL, Figueroa-Murillo E, García-Vadillo C, Romero-Morillos J. Outbreak of silicosis in Spanish quartz conglomerate workers. Int J Occup Environ Health 2014;20:26–32.

Morbidity and Mortality Weekly Report
MMWR / June 19, 2015 / Vol. 64 / No. 23 655
* Per U.S. Department of Health and Human Services 2008 Physical Activity Guidelines for Americans. Available at http://www.health.gov/paguidelines/guidelines/default.aspx. Respondents defined as meeting both aerobic-activity and muscle-strengthening guidelines reported moderate-intensity physical activity for ≥150 minutes per week, vigorous-intensity physical activity for ≥75 minutes per week, or an equivalent combination of moderate- and vigorous-intensity activity, and engaging in physical activities specifically designed to strengthen muscles at least twice per week.
† Estimates are based on household interviews of a sample of the civilian, noninstitutionalized U.S. population and are derived from the National Health Interview Survey sample adult component.
§ 95% confidence interval.
The percentage of adults aged ≥18 years who met the aerobic-activity and muscle-strengthening guidelines increased from 18.2% in 2008 to 20.8% in 2013. Adults aged 18–44 years were the most likely to meet the aerobic-activity and muscle-strengthening guidelines, and those aged ≥65 years were the least likely in both 2008 and 2013. For all age groups, the percentage meeting the guidelines increased from 2008 to 2013.
Source: CDC. National Health Interview Survey data, 2008 and 2013. Available at http://www.cdc.gov/nchs/nhis.htm.
Reported by: Travis Combest, MS; Sirin Yaemsiri, PhD, [email protected], 301-458-4186; Deepthi Kandi.
0
5
10
15
20
25
30
Total 18–44 45–64 ≥65
Perc
enta
ge
Age group (yrs)
20082013
§
QuickStats
FROM THE NATIONAL CENTER FOR HEALTH STATISTICS
Percentage of Adults Aged ≥18 Years Who Met National Guidelines for Aerobic Activity and Muscle Strengthening,* by Age Group — National Health
Interview Survey, United States, 2008 and 2013†

ISSN: 0149-2195
The Morbidity and Mortality Weekly Report (MMWR) Series is prepared by the Centers for Disease Control and Prevention (CDC) and is available free of charge in electronic format. To receive an electronic copy each week, visit MMWR’s free subscription page at http://www.cdc.gov/mmwr/mmwrsubscribe.html. Paper copy subscriptions are available through the Superintendent of Documents, U.S. Government Printing Office, Washington, DC 20402; telephone 202-512-1800.
Readers who have difficulty accessing this PDF file may access the HTML file at http://www.cdc.gov/mmwr/index2015.html. Address all inquiries about the MMWR Series, including material to be considered for publication, to Executive Editor, MMWR Series, Mailstop E-90, CDC, 1600 Clifton Rd., N.E., Atlanta, GA 30329-4027 or to [email protected].
All material in the MMWR Series is in the public domain and may be used and reprinted without permission; citation as to source, however, is appreciated.
Use of trade names and commercial sources is for identification only and does not imply endorsement by the U.S. Department of Health and Human Services.
References to non-CDC sites on the Internet are provided as a service to MMWR readers and do not constitute or imply endorsement of these organizations or their programs by CDC or the U.S. Department of Health and Human Services. CDC is not responsible for the content of these sites. URL addresses listed in MMWR were current as of the date of publication.
Morbidity and Mortality Weekly Report