state nutrition, physical activity and obesity (npao ...€¦ · obesity (npao) program . technical...
TRANSCRIPT

State Nutrition, Physical Activity and Obesity (NPAO) Program
Technical Assistance Manual
January 2008
Centers for Disease Control and Prevention
Division of Nutrition, Physical Activity and Obesity
Table of Contents Using the NPAO Technical Assistance Manual.................................................................... iv Section I. CDC’s NPAO Program: Goals and Components........................................... 1
Program Purpose........................................................................................................... 2 Background.......................................................................................................... 2 Program Philosophy............................................................................................. 3 Program Goal and Objectives............................................................................... 4 Elements of Program Implementation........................................................................... 6
Milestones............................................................................................................ 6 State Plan Development and Implementation...................................................... 7
Gain Internal and External Support and Resources..................................... 7 Collect and Use Data................................................................................... 8 Develop Goals and SMART Objectives........................................................ 11 Select Population(s) and Strategies for Interventions................................... 12 Develop an Evaluation Plan for the State Plan............................................. 13 Develop a Dissemination Plan...................................................................... 14 Prepare for Implementation.......................................................................... 14 Resources............................................................................................................ 15
Section II. CDC NPAO Program Management Practices of Funded States.................. 17 Program Management at the State Level.................................................................... 18 CDC Review Processes....................................................................................... 18 CDC Review of the State Plan...................................................................... 18 CDC Review of Intervention/Projects............................................................ 19 Annual Work Plan................................................................................................. 20
Staff Descriptions.................................................................................................. 22 Surveillance Data and Reporting Plans....................................................................... 23 Surveillance Data Plan......................................................................................... 23 Surveillance Reporting Plan................................................................................. 23 Evaluation Guidance for State NPAO Programs......................................................... 24
Evaluation Component #1: Evaluation of the Creation and Implementation of the State NPAO Plan....................................................... 24 Evaluation Component #2: Intervention Evaluation............................................. 29 Evaluation Component #3: Monitoring for Accountability.................................... 30 Evaluation Component #4: Tracking Progress in the Annual Work Plan ............ 31 Evaluation Component #5: Participate in the PMR.............................................. 31
Section III. Interventions and Strategies Addressing the NPAO Principal Target Areas.. 34 Introduction................................................................................................................. 35 Design and Implement Strategies and Interventions.......................................... 35 Evidence-Based Intervention Strategies............................................................. 36 Terminology Used in This Section of the Manual............................................... 37 Target Area: Physical Activity..................................................................................... . 38 Background and Rationale.................................................................................. 38 Overview of Strategies........................................................................................ 38 Community Guide Approaches and Interventions............................................... 39 Physical Activity Strategy 1: Community-Wide Campaigns................................. 40 Physical Activity Strategy 2: Point-of-Decision Prompts for Stairwells................ 41 Physical Activity Strategy 3: Individually Adapted Health Behavior Change....... 42 Physical Activity Strategy 4: Enhanced Physical Education in Schools.............. 44 Physical Activity Strategy 5: School Support in Community Settings................. . 46
i
Physical Activity Strategy 6: Create or Enhance Access to Places for Physical Activity....................................................................................... 47 Physical Activity Strategy 7: Street-Scale Urban Design and Land-Use Policies and Practices.................................................................. 49 Physical Activity Strategy 8: Community-Scale Urban Design and Land-Use Policies and Practices................................................................... 50 Physical Activity Strategy 9: Safe Routes to School............................................. 52 Target Area: Increase Consumption of Fruits and Vegetables.................................... 55 Background and Rationale................................................................................... 55 Overview of Strategies......................................................................................... 56 Fruit and Vegetable Strategy 1: Multi-component Interventions in Schools........ 58 Fruit and Vegetable Strategy 2: Multi-component Interventions in Childcare...... 60 Fruit and Vegetable Strategy 3: Multi-component Interventions in Worksites..... 62 Fruit and Vegetable Strategy 4: Multi-component Interventions in Faith-Based Organizations.......................................................................... 63 Fruit and Vegetable Strategy 5: Multi-component Interventions in Health Care Settings.................................................................................... 65 Fruit and Vegetable Strategy 6: Increasing Access to Fruits and Vegetables..... 67 Fruit and Vegetable Strategy 7: Increasing Availability of Fruits and Vegetables.. 69 Fruit and Vegetable Strategy 8: Economic Incentives........................................... 71 Target Area: Decrease Consumption of Sugar-Sweetened Beverages........................ 74 Background and Rationale................................................................................... 74 Intervention Strategies......................................................................................... 74 Target Area: Increased Breastfeeding Initiation, Duration, and Exclusivity................. 78 Background and Rationale................................................................................... 78 Overview of Strategies......................................................................................... 78 Breastfeeding Strategy 1: Maternity-Care Practices............................................ 79 Breastfeeding Strategy 2: Support for Breastfeeding in the Workplace............... 82 Breastfeeding Strategy 3: Peer Support.............................................................. 83 Breastfeeding Strategy 4: Educating Mothers...................................................... 85 Breastfeeding Strategy 5: Professional Support................................................... 87 Breastfeeding Strategy 6: Media and Community-wide Campaigns.................... 88 Target Area: Reduce the Consumption of High-Energy-Dense Foods........................ 90 Background and Rationale................................................................................... 90 Overview of Strategies......................................................................................... 90 Reduce the Consumption of High-Energy-Dense Foods Strategy 1: Substitute Low-Energy-Dense Foods for High-Energy-Dense Foods........................... 92 Reduce the Consumption of High-Energy-Dense Foods Strategy 2: Decrease the Portion Size of High-Energy-Dense Foods........................................... 94 Reduce the Consumption of High-Energy-Dense Foods Strategy 3: Limit Availability of High-Energy-Dense Foods..................................................... 96 Target Area: Decrease Television Viewing.................................................................. 99 Background and Rationale................................................................................... 99 Decreasing Television Viewing: Intervention Strategies...................................... 99 Section IV. Resources...................................................................................................... 103 Selected National Reports and Activities.................................................................... 104
ii

Appendices........................................................................................................................ 107 Appendix A: Social Marketing, the Social-Ecological Model, and Evidence-Based Strategies................................................................... 108 Appendix B: State Implementation Plan................................................................ 112 Appendix C:.NPAO Definition of an Intervention................................................... 114 Appendix D: University of North Carolina 2006 Competencies.............................. 115 Appendix E: Logic Models for NPAO Programs..................................................... 119
iii

Using the NPAO Technical Assistance Manual This manual was created to serve the state and community partners of the Centers for Disease Control and Prevention (CDC) as they develop, implement, and evaluate an array of nutrition and physical activity activities that aim to prevent and control obesity and other chronic diseases. This is a living document, a one-stop reference for NPAO program guidance and technical assistance that will be updated as the program matures and as the evidence base of proven strategies evolves. The manual is divided into four sections:
• Section I: CDC’s NPAO Program: Goal and Components. The first section is for all states and their partners, regardless of their CDC funding status. The section begins with CDC’s philosophy and long-term direction that underlie the State Nutrition, Physical Activity, and Obesity (NPAO) Program. The section also discusses how to align state and local nutrition, physical activity, and obesity initiatives with national approaches. Finally, it covers how the Social-Ecological Model, social marketing, and evidence-based strategies can form an overall framework for state plan development and intervention development.
• Section II: CDC’s NPAO Program Management Practices with Funded States. The second section contains information specifically for states that receive cooperative-agreement funding from CDC and therefore must fulfill certain requirements as a condition of that funding― namely, building the capacity of their nutrition, physical activity, and obesity programs, and aligning their strategic direction with CDC. Information in this section includes program requirements, suggested formats for an annual state work plan, surveillance data and reporting plans, evaluation expectations, and the NPAO logic model and evaluation plan. This guidance is also useful for unfunded states.
• Section III: Interventions and Strategies Addressing the NPAO Principal Target
Areas. The third section explores a variety of evidence-based strategies that states can use to develop nutrition and physical activity interventions for controlling obesity and other chronic diseases.
• Section IV: Resources. The fourth section includes information on potential
partners and stakeholders, selected national reports and activities, descriptions of sample interventions, and a glossary of relevant terms.
• The appendices contain more detailed, practical information for some topics in
the manual.
iv

Section I: CDC’s NPAO Program: Goals and Components
Section I: CDC’s NPAO Program: Goals and Components January 2008
1

Program Purpose Background Obesity in the United States has reached epidemic proportions. Since the mid-1970s, the prevalence of overweight and obesity has increased sharply for both adults and children. Data from two NHANES surveys show that among adults aged 20-74 years, the prevalence of obesity jumped from 15.0% (1976-1980 survey) to 32.9% (2003-2004 survey) (www.cdc.gov/nchs/products/pubs/pubd/hestats/overweight/overwght_adult_03.htm). Data from the NHANES 2005-2006 survey show no significant change (33.3% of men were obese and 35.3% of women). http://www.cdc.gov/nchs/data/databriefs/db01.pdf These surveys also show increases in overweight among children and teens. For children aged 2-5 years of age, the prevalence of overweight increased from 5.0% to 13.9%; for those aged 6-11, prevalence increased from 6.5% to 18.8%; and for those aged 12-19, prevalence increased from 5.0% to 17.4%. (www.cdc.gov/nchs/products/pubs/pubd/hestats/overweight/overwght_child_03.htm). These increasing rates have serious implications for the health of Americans today and in the future. Being overweight or obese increases the risk of many diseases and health conditions, the annual cost of which is estimated to exceed $100 billion (1). These health issues include the following (2):
• Hypertension • Dyslipidemia (e.g., high total cholesterol, low HDL cholesterol, and/or high levels
of triglycerides) • Type 2 diabetes • Coronary heart disease • Stroke • Gallbladder disease • Osteoarthritis • Sleep apnea and respiratory problems • Some cancers (endometrial, breast, and colon)
In addition to health-related costs, a recent report from the Milken Institute estimates the annual economic impact of chronic disease on the U.S. economy to be more than $1 trillion (3). CDC is committed to the goal of reducing obesity by promoting more healthful behaviors among Americans of all ages. Because the problem is so widespread across the United States, prevention efforts should use public health population-based approaches, including coordinated policy and environmental changes that affect large numbers of different populations simultaneously. The solution to the problem requires many resources, both public and private, to bring about change. States must be prepared to convene and empower both public and private organizations to develop collaboratively a state plan in which all partners have a stake and which provides the platform for their cooperative efforts. In response to this epidemic, the U.S. Congress funded CDC in 1999 to initiate a national state-based nutrition and physical activity program to prevent obesity and other chronic diseases. These resources have built the capacity of funded states to address the prevention of obesity and other chronic diseases through nutrition and physical
Section I: CDC’s NPAO Program: Goals and Components January 2008
2

activity strategies. The Nutrition, Physical Activity and Obesity Program was originally funded to support six states; by 2004, this number grew to 28. Based on their funding levels, states worked to establish state program capacity and infrastructure; collaborated and coordinated with partners; planned nutrition, physical activity, and obesity prevention and control efforts; identified data sources to monitor the burden of poor nutrition, physical inactivity, and obesity; implemented policy, environmental, and behavioral interventions; provided training and technical assistance to partners and communities; and evaluated the progress and impact of both the state plan and interventions. Fundamental to the long-term success of NPAO-funded state programs is their ability to leverage resources and coordinate interventions with multiple partners to address NPAO’s principal target areas. These target areas are—
1. Increase physical activity.
2. Increase the consumption of fruits and vegetables.
3. Decrease the consumption of sugar-sweetened beverages.
4. Increase breastfeeding initiation and duration.
5. Reduce the consumption of high-energy-dense foods.
6. Decrease television viewing.
The program also emphasizes reducing health disparities related to race/ethnicity, socioeconomic status, geography, gender, age, disability, and other populations identified as at risk for health disparities. Program Philosophy In his 2001 Call to Action (1), former Surgeon General of the United States, David Satcher, stated, “Individual behavior change can only occur in a supportive environment with accessible and affordable healthy food choices and opportunities for regular physical activity.” It is not enough to have places to be physically active and healthful foods; individuals must have access to them. The failure of individual-based nutrition and physical activity efforts can be explained, in part, by the fact that the environments where they have been implemented are not hospitable to healthful choices (4). Thus, NPAO encourages states to implement local and statewide interventions that address these barriers through changes in policies and the environments where healthy foods and opportunities for physical activity are offered. Behavior-change efforts are most effective when they are implemented on multiple levels (4). Thus, NPAO encourages states to base their programs on the Social-Ecological Model, a framework that helps states take a more holistic approach to their obesity problem, serving as a reminder to look at all levels of influence (societal, community, organizational, interpersonal, and individual) that can be addressed to support long-term, healthful eating and physical activity choices. This “systems approach” to overweight and obesity helps states and communities develop interventions that include a wide range of individual and institutional stakeholders (5).
Section I: CDC’s NPAO Program: Goals and Components January 2008
3

The International Obesity Task Force’s framework for evidence-based obesity prevention identifies the need to develop a balanced portfolio of policies, programs, and other actions that are both achievable and sufficient to reduce rates of obesity (6). NPAO developed the program philosophy drawing upon lessons learned from previous attempts to address public-health problems caused by social forces (7). These lessons included: • Identifying a “crisis,” a problem that would personally affect many individuals. • Basing program strategies on sound science and a wide range of disciplines. • Identifying the economic cost of unhealthful behaviors and their health outcomes,
and quantify prevention benefits. • Developing coalitions to strengthen and move nutrition and physical activity efforts
forward. • Encouraging the use of media advocacy and strategic, integrated media efforts. • Involving government at the federal, state, and local levels. • Using media to raise public awareness, support community programs, and keep
issues in front of the public. • Using policy and environmental change as the key to initiating and sustaining
systemic changes. • Developing a strategic yet flexible plan with multiple pieces working synergistically. Program Goal and Objectives The goal of the national NPAO Program is to prevent and control obesity and other chronic diseases through healthful eating and physical activity. This goal will be achieved through strategic public health efforts aimed at the following program objectives: Outcome objectives: • Decrease prevalence of obesity. • Increase physical activity. • Improve dietary behaviors related to the population burden of obesity and chronic
diseases. Impact objectives: • Increase the number, reach, and quality of policies and standards set in place to
support healthful eating and physical activity in various settings. • Increase access to healthy food and places for physical activity and support healthful
eating and physical activity in various settings. • Increase the number, reach and quality of social and behavioral approaches that
complement policy and environmental strategies to promote healthful eating and physical activity.
Section I: CDC’s NPAO Program: Goals and Components January 2008
4

References 1. DHHS. The Surgeon General’s call to action to prevent and decrease overweight and
obesity. Washington, DC: US Government Printing Office, 2001:16. [On-line Access] http://surgeongeneral.gov/topics/obesity
2. National Institutes of Health. Clinical guidelines on the identification, ealuation, and treatment
of overweight and obesity in adults: the evidence report. NIH Publ No. 98-4083. [On-line Access] http://www.ncbi.nlm.nih.gov/books/bv.fcgi?rid=obesity.TOC
3. DeVol R, Bedroussian A, Charuworn A, et al. An unhealthy America: the economic burden of
chronic disease—charting a new course to save lives and increase productivity and economic growth. October 2007 [On-line Access] http://www.milkeninstitute.org/publications/publications.taf?function=detail&ID=38801018&cat=ResRep
4. Booth SL, Sallis JF, Ritenbaugh C, et al. Environmental and societal factors affect food
choice and physical activity: rationale, influences, and leverage points. Nutrition Reviews 2001 Mar;59(3 Pt 2):S21-39; discussion S57-65.
5. Economos CD, Irish-Haiser S. Community interventions: a brief overview and their
application to the obesity epidemic. J Law, Med & Ethics 2007 (Spring);35(1):131–137. 6. Swinburn B, Gill T, Kumanyika S. Obesity prevention: a proposed framework for translating
evidence into action. Obesity Reviews 2005; 6:23-33. 7. Economos C, Brownson RC, DeAngelis MS, et al. What lessons have been learned from
other attempts to guide social change? Nutrition Reviews 2001 (Mar);59(3 Pt 2):S40-56.
Section I: CDC’s NPAO Program: Goals and Components January 2008
5

Elements of Program Implementation Milestones The national NPAO Program at CDC developed suggested milestones to gauge reasonable progression in the development and life of state nutrition, physical activity, and obesity programs. These milestones are used in the states funded through CDC’s NPAO cooperative agreements. We urge all states to consider using these milestones to develop a comprehensive and accountable program. The milestones that follow give a chronological outline of tasks to be completed within a broad timeframe. States may find that the progression of these milestones in their work does not follow the year designations given below. This outline is provided to give a general overall picture and a starting point for states to consider in developing their own timeframes for completion of milestones. More detailed descriptions of the components of these tasks are in the following pages. If a state plan has not been developed and published: In year 1:
• Develop a plan for convening and maintaining a state partnership. • Establish a state partnership made up of diverse partners. • Outline the steps needed to develop a state nutrition, physical activity and
obesity plan (state plan). • Leverage resources from partners to facilitate the development and
implementation of the state plan. • Convene partnership meetings to develop a state plan.
In year 2:
• Develop and implement a training plan to increase the capacity of state and local health department staff and partners to carry out the activities outlined in the state plan.
• Publish and disseminate a state plan. • Develop an implementation plan for the state plan. • Begin to develop an evaluation plan for the state plan
In year 3: • Start implementing the state plan in collaboration with partners. • Begin to collect evaluation measures on the state plan. • Develop a plan for surveillance data and reporting.
Once the state plan is published, then: Annually:
• Implement priorities and evaluate the state plan in collaboration with partners. Leverage resources from partners to facilitate the implementation of the state plan.
• Update the implementation and evaluation plans for the state plan.
Section I: CDC’s NPAO Program: Goals and Components January 2008
6
• Document and disseminate evaluation results. Every two years:
• Update the surveillance data and reporting plans. • Complete an evaluation of the state partnership including, for example,
commitment and involvement, effectiveness and outcomes, and potential for sustainability.
• Reassess training needs; adjust and implement the training plan to increase the capacity of state and local health department staff and partners.
By year 5:
• Develop and implement a plan to sustain the program beyond five years. State Plan Development and Implementation
This section covers the following steps to developing the state plan and planning for its implementation:
• Gain internal and external support and resources • Collect and use data • Develop goals and SMART objectives • Select population(s) and strategies for interventions • Develop an evaluation plan for the state plan • Develop a dissemination plan • Prepare for implementation
The steps listed above are not linear and may be readdressed as needed at different times during the planning and implementation of the state plan. When revising existing state plans, states should use those steps they determine to be appropriate to complete the revision process.
We strongly encourage states to use the State Plan Index (SPI) in the development of their state plans. The SPI can also be used as an assessment tool for the the draft state plan to determine if major components are adequately addressed.
To access the tool and articles about the process, see: http://www.cdc.gov/nccdphp/dnpa/obesity/state_programs/pdf/State_Plan_Index_April_2005.pdf) www.cdc.gov/pcd/issues/2005/apr/pdf/04_0089.pdf www.cdc.gov/pcd/issues/2005/apr/pdf/04_0090.pdf 1. Gain Internal and External Support and Resources Support for the development and implementation of the state plan will need both internal and external support as well as many resources. Paying attention to this step is crucial to success.
Build and Enhance Infrastructure A strong, supportive infrastructure within the state public health department is vital to a strong planning process. A core planning committee within the agency should include staff who currently work in the area of nutrition, physical activity or obesity. Guided by a
Section I: CDC’s NPAO Program: Goals and Components January 2008
7
work plan, the committee’s first step is to gain buy-in from agency leadership. The next step is to assess the existing infrastructure capacity and identify gaps. Gaps may be addressed by a) identifying or hiring dedicated staff, b) identifying in-kind resources, and/or c) seeking additional sources of funding. A more detailed discussion of the national program’s recommendations for staff is in Section II, page 22.
Mobilize External Partners The next step in developing the state plan is to identify partners and gain their support. Many states have nurtured partners for some time in the context of different projects, so this effort could build on these existing relationships. It is important to get partners involved early so that they take ownership and commit to its success. This in turn makes it more likely that they will contribute resources to the project and its implementation. Partners bring the perspectives of their constituencies, assuring diversity and the plan’s ability to respond to the needs of various populations. Partners may also provide leaders, people who are in high-profile professional or management positions in influential organizations, who can be very helpful in getting activities done. After the data and research findings are compiled and some decisions of the plan direction are made, reassess the partnership representation and coverage for implementation. Original partners may stay committed but you may need new partners to address issues that come up during the planning.
Resources The plan should identify the resources necessary to accomplish its goals and include strategies for locating, obtaining, using, and maintaining the supply of those resources. Resources can be money or physical assets, such as buildings, gardens, or trails as well as people and organizations with specific skills and experience.
Managing the Partnership and the Process In managing the partnership, make certain the conduct of the meetings and the decision-making process are transparent. The plan should also address issues of individual and/or organizational authority and responsibility for ensuring distribution of resources are appropriate and that resources are available when they are needed. 2. Collect and Use Data Obesity is a multifaceted problem and identifying populations at risk and selecting appropriate interventions require reliable data. Decisions about priority populations can be controversial and having reliable data to document the rationale behind the decisions is essential. This kind of information is rarely available from a single source; therefore, you will need to selectively use multiple data sources. National surveillance systems like those operated by CDC and state-designed surveillance systems are examples of data resources. Some CDC databases allow for comparing a state with other states over time and with the national health goals. Useful data also can come from other sources, such
Section I: CDC’s NPAO Program: Goals and Components January 2008
8

as surveys designed to produce high-quality quantitative data or carefully constructed qualitative studies using interviews or focus groups. State Surveillance Systems State-specific data on individual weight and weight control practices, physical activity and sedentary behaviors, dietary behaviors and nutritional status, morbidity (related chronic diseases or conditions), and breastfeeding practices are essential to provide a picture of the burden of obesity in the state. The CDC surveillance systems that provide state-specific information on the nutrition, physical activity, and weight elements include the Behavior Risk Factor Surveillance System (BRFSS), Youth Risk Behavior Surveillance System (YRBSS) and the Pediatric Nutrition Surveillance System (PedNSS). The BRFSS and YRBSS are population-based surveillance systems. The Pediatric Nutrition Surveillance System monitors data routinely collected in public health programs serving low-income populations (WIC, Early Periodic Screening Diagnostic, and Treatment, MCH Block Grants) and is therefore program-based. The BRFSS collects self-reported data on adults, aged 18 years and older, the YRBSS includes 9th through 12th grade students, and the PedNSS has data on low-income children, birth to 5 years of age. Surveillance data can be aggregated by race and ethnicity, gender, age, income, and rural/urban/suburban location to identify subpopulations that are at the highest risk. National Data Systems Existing federal data systems that also address nutrition, physical activity, and weight include the National Health and Nutrition Examination Survey (NHANES) and the National Health Interview Survey (NHIS). NHANES is a series of surveys designed to assess the health and nutritional status of adults and children in the United States. It is unique in that it combines interviews and physical examinations. NHIS is a multipurpose health survey that provides national estimates for a broad range of health measures including weight and participation in physical activity for the U.S. civilian noninstitutionalized adult population. Because of the sampling size and methodology, NHANES and NHIS do not provide state representative data. NHANES includes adults, adolescents, and children, and NHIS includes primarily adults, with some questions about children. Other useful CDC surveillance systems or surveys include:
• Pregnancy Nutrition Surveillance System—a program-based surveillance system that monitors the nutritional status of low-income infants, children, and women in federally funded maternal and child health programs.
• National Immunization Survey—an annual survey that monitors childhood immunization coverage, but which also contains breastfeeding questions.
• Pregnancy Risk Assessment Monitoring System—a surveillance system that collects state-specific population-based data on maternal attitudes and experiences (including those on breastfeeding) before, during, and shortly after pregnancy.
Section I: CDC’s NPAO Program: Goals and Components January 2008
9

• School Health Policies and Programs Study—a comprehensive assessment of
school health policies and practices in the United States covering eight school health components, including physical education and activity and nutrition services.
• National Hospital Discharge Survey—a national survey providing information on characteristics of inpatients discharged from non-Federal short-stay hospitals in the United States. Data are available annually.
• National Vital Statistics System—a system of data-sharing through which CDC collects and disseminates the nation’s vital statistics, which are provided by the states and U.S. territories.
Qualitative Data and Formative Research Related to Population Groups Other information resources that can be used in the development of the state plan include qualitative data and any formative research that has been conducted in the state related to a population’s attitudes, perceptions, and intentions that may affect the prevalence of obesity and affect the success or failure of interventions. If the state has undergone any social marketing planning, there may be valuable qualitative information that was gathered in that effort. This information may include:
• Knowledge, attitudes, and beliefs of the population about various aspects of obesity and the behaviors that lead to obesity. Examples include where people enjoy physical activity and the perceived benefits of breastfeeding.
• Social norms about time spent grocery shopping, preparing food, eating away from home, TV viewing, and enjoying outdoor play.
• Media habits of the priority population, such as reading newspapers and magazines, listening to radio, and watching TV.
• Readiness of different population groups to change behavior as measured by Prochaska’s “stages of change” model.
More information on social marketing is in Appendix A.
Surveillance of Environmental and Policy Changes Many environmental factors and policies may affect the physical activity and nutrition choices available to people. These factors include access to parks and recreation areas, existence or lack of sidewalks, availability of fruits and vegetables, and the content of vending machines in parks, schools and worksites. Knowing about environmental factors and policies that already exist in communities as well as the potential for change in these areas is important in the planning stage. CDC is aware that data regarding surveillance of environmental and policy changes currently are limited and is working with researchers, states, and other partners to develop better resources in these areas.
Section I: CDC’s NPAO Program: Goals and Components January 2008
10

Existing State Efforts Previous or existing nutrition and physical activity interventions in the state can provide insights helpful to future efforts, primarily providing information about what was successful, what was not, and what could be the basis for future activities. They can also provide clues about how a population might respond to additional efforts. All of this information will help when prioritizing state plan goals. The kinds of information on previous and existing initiatives that would be helpful include:
• Priority population • Behaviors addressed • Strategies used • Level(s) of the social structure addressed • Evaluation methods and results
3. Develop Goals and SMART Objectives The national NPAO Program requires that goals and objectives of funded state programs reflect the national goal and objectives (see page 4). We urge all other states to do the same, as this would help develop a coordinated and integrated approach across the nation to this public health issue. Goals and objectives should be based on the guidance provided in the following. Goals Goals link state-specific information on the disease burden and current activities to actions that will expand and improve the effectiveness of intervention efforts and, ultimately, reduce the disease burden. Goals should clearly state desired outcomes that are measurable. They should be ambitious but attainable, achieving something new and not merely extending or modifying existing efforts. Goals should focus on statewide desired changes. Goals should reflect statewide efforts that involve the full range of public and private organizations as stakeholders in the state prevention plan, not just a work plan for the state public health department. Goals target specific populations to address health disparities where appropriate. Goals should be long-term. The changes that the goals will describe are too profound to be accomplished quickly and simply. A realistic (and often minimum) time frame for achieving goals of this magnitude should be 8-10 years. Altering the entire picture of nutrition, physical activity and obesity in the state is a complex undertaking, and planners may be inclined to write many goals to accommodate the many facets of the problem. However, the number of goals should not be so great that they might end up conflicting or competing with each other for attention or resources.
Section I: CDC’s NPAO Program: Goals and Components January 2008
11

The goals in the plan add up to improvements in nutrition and physical activity behaviors, and in the social and physical environments that result in a measurable reduction in the prevalence of obesity and chronic diseases statewide. Objectives Objectives are the roadmap of the landmarks that need to be attained to reach the goals. They should be consistent with the overall public health priorities of the state and tied directly to the goals specified in the plan. Objectives should be clearly stated, measurable, and presented in a logical order. Objectives should include sufficient information to make a good estimate of the resources, both human and other, that will be needed to achieve them. Objectives may even deal with strategies for obtaining resources. Objectives must be achievable. An achievable objective requires actions or changes that are within the planners' control. This does not mean that objectives should not be ambitious, just not impossible. Objectives should address priority populations. Objectives should address different time periods. Short-term, intermediate, and long-term objectives help sequence the plan over time.
• Short-term objectives often reflect process changes, things that need to change to eliminate obstacles and generally pave the way for the more direct implementation steps to follow. They may be more specific than later objectives because the desired results are precisely known. Because the desired outcomes usually are clear, short-term objectives provide opportunities to test the assumptions on which the plan is based and to identify potential problems that might not have been apparent during plan development.
• Intermediate objectives are steps to take after the short-term objectives are
achieved, such as changes in behavior, environment, or policy. They provide an opportunity for fine-tuning before tackling the long-term objectives and, ultimately, the goals. They may be broader in nature than the short-term objectives, with somewhat less precise outcomes, but they flow logically from the changes brought about by the short-term objectives.
• Long-term objectives are more ambitious and broader than intermediate
objectives, usually focusing on changing health status indicators. Built on the achievement of earlier short-term and intermediate objectives, they should take you to your desired destination — the realization of the goals. In this sense, the long-term objectives reflect the ideals and vision for the future. They are the last steps that tie all the pieces together.
4. Select Population(s) and Strategies for Interventions Implementation of state plan objectives is carried out through specific activities and interventions. To refine objectives, it is helpful to assess their potential for developing specific interventions designed for populations that the state wants to target. Decisions
Section I: CDC’s NPAO Program: Goals and Components January 2008
12

about priority populations and strategies should be based not only on detailed knowledge of the disease burden, but on what is known about the different populations in relation to obesity and its behavioral determinants. Individual, social, cultural, environmental, and economic factors that shape or influence behaviors related to nutrition and physical activity are key. Different communities often have different traditions and attitudes related to food, eating, physical activity, and body weight that result in very different perceptions of the severity of the problem and the need for change. Some of those perceptions may support environmental and behavioral interventions to achieve healthy weights, while others may work against change. These must be carefully balanced for any intervention to have a chance of making a real difference. Using a social marketing planning approach can help you understand these determinants and thus design a plan that can succeed. (Social marketing is discussed in Appendix A.) Before planning any intervention, engage the stakeholders who can contribute to its success: partners who will help implement the intervention, people in the target audience, and those who have decision-making power to help fund the intervention. Choose interventions based on the best available evidence. Section III of this manual discusses evidence-based strategies and interventions. 5. Develop an Evaluation Plan for the State Plan Evaluation provides information that can be used to improve the effectiveness of the implementation of the plan and also provides information that is essential to sustaining support and obtaining resources. Evaluation is an important tool to be used to design, shape, and guide the program effort. The need for resources to evaluate must be balanced with the need for resources for program implementation. The State Plan Index can be very helpful in developing an evaluation plan for the state plan. During the planning process, the following should be addressed:
• What evaluation measures are needed to support the objectives and their outcomes?
• Who will collect the data and how will they do it? • How will information be used and disseminated? • How can this be done with minimal burden for the populations involved?
Just as short-term, intermediate, and long-term objectives are needed, the identification of short-term, intermediate, and long-term indicators to measure progress toward the plan is essential. The plan should be very clear about how soon useful results can be expected for each indicator. The evaluation plan should clearly specify the methods that will be used for data collection and analysis for each indicator. The evaluation plan also should include an assessment of changes that need to be made in existing surveillance systems to support the evaluation process. The evaluation section beginning on page 24 provides more guidance about evaluation plans.
Section I: CDC’s NPAO Program: Goals and Components January 2008
13

6. Develop a Dissemination Plan
The dissemination plan should reflect the state plan’s vision concerning who should be involved in and who will be affected by the state’s effort. Therefore the first task in developing the plan is to decide who the target audiences are. Plans may have multiple audiences such as state health department staff, partner organizations, private businesses, schools, health organizations, and the general public. A social marketing planning process will help you determine how best to communicate with your target audiences, using various communication vehicles. As you write your dissemination plan, consider the following:
• Use a table of contents that allows readers to quickly find sections of interest to them.
• Provide an executive summary that gives a quick overview of the most important elements of the plan.
• Avoid any professional jargon that may not be familiar to all readers. • Clearly explain acronyms the first time they appear in a chapter or section. A list
of acronyms that can be easily referenced is also helpful. • Use separate documents that focus on particular goals that are of interest to
different audiences, such as school officials, business leaders, or advocacy groups.
• When multiple versions of a plan exist, the information included in a shorter version should be clearly identified as part of a larger, more comprehensive plan.
Engaging the general public to help address the nutrition, physical activity and obesity efforts may call for different types of communication strategies beyond written documents. How and where the plan will be available is critical for building support. A distribution plan using a variety of methods should ensure that the plan gets to anyone who might contribute to its success. 7. Prepare for Implementation
The implementation plan provides the snapshot of how your program will unfold over the life of the plan. As you are completing the state plan, begin work with the partners on a plan for implementation that shows the relationship of what will be done, by whom, and in what time frame. You should build on the momentum for action already established. Partner involvement is critical for selecting and prioritizing which objectives to implement over time. A suggested format for an implementation plan is provided in Appendix B and should include the following:
• Steps for accomplishing strategies/activities including the related goals and objectives in a sequential format with well-defined time lines.
• The identification of agencies/organizations necessary to accomplish each step
developed in partnership with the listed agencies/organizations.
Section I: CDC’s NPAO Program: Goals and Components January 2008
14

• Specific recommendations regarding the future support of partners to ensure successful implementation and sustainability of interventions.
• The process for documenting and assessing progress.
The implementation plan should be periodically reassessed and updated. At least annually you should consider whether or not it needs revision. Revising the plan allows you and your partners to reflect on lessons learned and make needed changes based on unforeseen factors and issues. Resources State Plan Index. www.cdc.gov/pcd/issues/2005/apr/pdf/04_0089.pdf and www.cdc.gov/pcd/issues/2005/apr/pdf/04_0090.pdf; tool at http://www.cdc.gov/nccdphp/dnpa/obesity/state_programs/pdf/State_Plan_Index_April_2005.pdf) Guide for Comprehensive Cancer Control Planning, Volume 1: Guidelines & Volume 2 Toolkit. Available at http://www.cdc.gov/cancer/ncccp/cccpdf/guidance-guidelines.pdf. Nutrition and Physical Activity Workgroup, Guidelines for Comprehensive Programs to Promote Healthy Eating and Physical Activity. 2002. [On-line Access] http://www.astphnd.org/resource_files/6/6_resource_file1.pdf?zoom_highlight=guidelines+for+comprehensive+programs+to+promote+healthy+eating+and+physical+activity Centers for Disease Control and Prevention, Principles of Community Engagement, 1997. Available at http://www.phppo.cdc.gov/dphsdr/FaithBase/PCE/PrinciplesOfComm.asp. Many surveillance systems and surveys have public access web pages where national and state data may be available. Here are some of the available surveillance system web sites: Nutrition and Physical Activity Data and Information Sources Web Pages: Behavior Risk Factor Surveillance System: http://www.cdc.gov/brfss/
Breastfeeding Promotion and Support Resources:
http://www.cdc.gov/breastfeeding/promotion/index.htm
Breastfeeding Statistics (national immunization site):
http://www.cdc.gov/breastfeeding/data/NIS_data/data_2004.htm
National Health and Nutrition Examination Survey: http://www.cdc.gov/nchs/nhanes.htm
National Health Interview Survey: http://www.cdc.gov/nchs/nhis.htm
Pediatric Nutrition Surveillance System: http://www.cdc.gov/nccdphp/dnpa/PedNSS.htm
Youth Risk Behavior Surveillance System: http://www.cdc.gov/nccdphp/dash/yrbs/
Pregnancy Nutrition Surveillance System: http://www.cdc.gov/nccdphp/dnpa/PNSS.htm
Section I: CDC’s NPAO Program: Goals and Components January 2008
15

National Immunization Survey: http://www.cdc.gov/nis/
Pregnancy Risk Assessment Monitoring System:
http://www.cdc.gov/reproductivehealth/srv_prams.htm
School Health Policies and Programs Study: http://www.cdc.gov/nccdphp/dash/shpps/
National Hospital Discharge Survey:
http://www.cdc.gov/nchs/about/major/hdasd/nhdsdes.htm
Vital Statistics: http://www.cdc.gov/nchs/nvss.htm
Economic Census (Census Bureau): http://www.census.gov/
Section I: CDC’s NPAO Program: Goals and Components January 2008
16

Section II
CDC’s NPAO Program Management Practices with Funded States
Section II: CDC’s NPAO Program Management Practices with Funded States January 2008
17

Program Management at the State Level
States that receive NPAO cooperative agreement funding are required to develop state plans in collaboration with partners, conduct training to increase capacity of their partners to implement programs, conduct surveillance, lead and coordinate the implementation of the state plan, and evaluate the efforts undertaken as a result of the state plan. Because this is a cooperative agreement funding mechanism, CDC staff are substantially involved in program activities. In addition to annual reports, there are various points in the process at which CDC staff will review state efforts. CDC Review Processes CDC reviews the following four items in draft form to ensure that they are consistent with funding requirements and national goals:
• State plan • Interventions/Projects • Annual work plan as a funding requirement
CDC Review of State Plan CDC will review all new or substantially revised state plans prior to the publication of the plan. The CDC program will use the State Plan Index (SPI) as a review guide (see page 25). If sections of the SPI are not addressed in the state plan, the state program can include a brief narrative of why they made this decision and the document that contains this information. The plan is not considered complete until CDC reviews the plan. The CDC program may decide to review only the goals and objectives section of revised plans, depending on the extent of the plan revisions. The funded program may choose to undergo a review of new or revised state plans in two stages. The initial review can be done when the goals and objectives are developed, prior to the development of the plan strategies. The second review would be of the entire draft plan when completed. For this second review, states submit the following:
• The draft state plan (Final formatting is not necessary.) • Narrative explanation for the decision to exclude SPI components from the state
plan, if needed • Draft evaluation plan for state plan implementation • Other supporting materials
The review is an iterative process which may require phone and e-mail correspondence between the project officer, other CDC program and division representatives, the state program staff, state health department administration, and state partners. The participating staff will be determined on a state-by-state basis.
Section II: CDC’s NPAO Program Management Practices with Funded States January 2008
18

CDC Review of Interventions Past experience with intervention reviews has generated productive discussions contributing to improving the design and implementation of large-scale interventions. The CDC program recommends that each year the state program coordinator and the CDC project officer select an intervention related to the state plan for review by CDC program staff. Information to be provided includes:
• Intervention name • Purpose • Description • Goals and objectives, including expected outcomes of the intervention (short,
intermediate, and long-term objectives) • Target population • Formative research findings • Social Ecological Model levels addressed • Health-related theories that are the basis of the intervention • Intervention strategies (evidence-based or promising practices) • How the intervention will be evaluated and who will be responsible for each
evaluation component • Roles of staff, partners, and collaborators in implementing the intervention and
preparing an evaluation report to be shared with partners, collaborators, and CDC.
The CDC staff will review the intervention for:
• use of formative research data in designing the intervention • evidence-based strategies and promising practices selected for the intervention • evaluation design • potential of the intervention to change behavior among the target population and
address health disparities • dissemination plan for evaluation findings
Following the review, the project officer will provide written comments to the state and offer conference calls for discussion of issues raised. The definition and characteristics of an intervention that are used by NPAO for reporting in the Progress Monitoring Report (PMR) are in Appendix C.
Section II: CDC’s NPAO Program Management Practices with Funded States January 2008
19

Section II: CDC’s NPAO Program Management Practices with Funded States January 2008
20
Annual Work Plan Include the following details in the annual work plan for the elements at the top of the table on the next page. Directions for filling in the columns are within the table. 1. Program Goal: The health impact or result that an agency intends to achieve—i.e.,
what the agency must achieve to fulfill its vision or mission. Example: Workplaces throughout the state will provide environments that support healthful eating and physical activity for their employees.
2. Annual Objective: A result or outcome targeted to achieve a particular goal.
Objectives should be SMART-specific (see page 26), measurable, achievable, relevant, and time-framed.
Example: Between June 30, 2008, and June 30, 2009, establish 25 additional workplace wellness programs that support an environment for healthful eating and physical activity.
3. Baseline Measure: The initial measurement that is compared with other sets of data
to determine whether a particular objective has been met. Example: Fifteen workplace wellness programs in December 2007.
4. Current Data: The measurement that is compared to the baseline data to determine
if a particular objective has been met. Current data should always be provided, if different from baseline measure ― e.g., “45 workplace wellness programs in December 2008.”
5. State Plan Objective: If applicable, cite the state plan objective that relates to the
annual work plan objective. If a state plan does not already exist, this does not apply. Example: Increase the number of worksites with 100 or more employees offering employer-sponsored worksite wellness programs that include physical activity and nutrition.
6. Background: A summary of key related activities that are anticipated in the six
months prior to the work plan, i.e., between the submission of this application and start of proposed work plan.
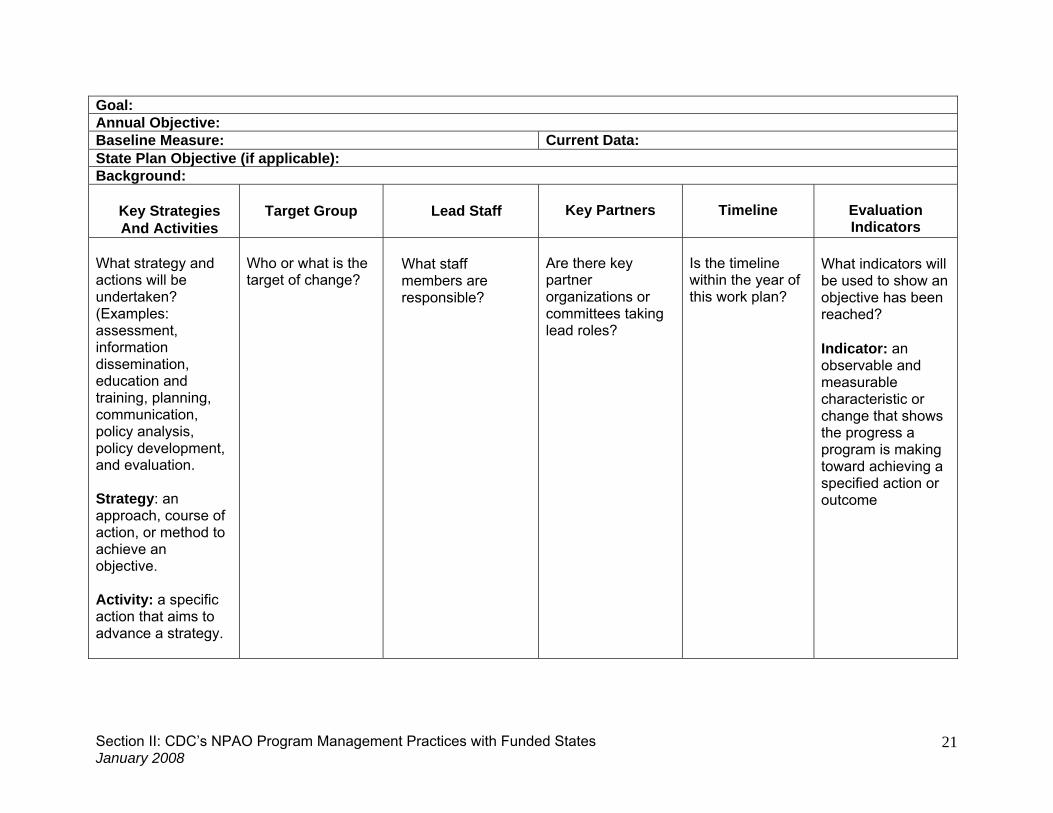
Goal: Annual Objective: Baseline Measure: Current Data: State Plan Objective (if applicable): Background:
Key Strategies And Activities
Target Group
Lead Staff
Key Partners
Timeline
Evaluation Indicators
What strategy and actions will be undertaken? (Examples: assessment, information dissemination, education and training, planning, communication, policy analysis, policy development, and evaluation. Strategy: an approach, course of action, or method to achieve an objective. Activity: a specific action that aims to advance a strategy.
Who or what is the target of change?
What staff members are responsible?
Are there key partner organizations or committees taking lead roles?
Is the timeline within the year of this work plan?
What indicators will be used to show an objective has been reached? Indicator: an observable and measurable characteristic or change that shows the progress a program is making toward achieving a specified action or outcome
Section II: CDC’s NPAO January 200
Program Management Practices with Funded States 8
21
Staff Descriptions State NPAO programs funded under CDC Program Announcements 00099 and 03022 previously had a requirement for specific core staff. The national NPAO Program still encourages states to hire staff that have the program skills and expertise in the following areas (not listed in priority order):
• Program coordination, management and strategic planning • Partnership and coalition building • Nutrition • Physical activity • Obesity prevention • Epidemiology and surveillance • Program evaluation • Qualitative and quantitative data collection, management and analysis • Health education • Communication, public relations, media relations • Social marketing and behavioral science
Recommendations
A fully staffed state Nutrition, Physical Activity and Obesity Program would include at least three full-time staff with appropriate competencies to plan, implement and evaluate major program areas, including a high-level program coordinator, a physical activity coordinator, and a nutrition coordinator.
Desirable credentials for the program coordinator are a master’s degree in public health, public administration, business or related field. The program coordinator is responsible for overseeing the state NPAO program activities.
Desirable credentials for the physical activity (PA) coordinator are at least a master's degree as well as substantial experience and/or education credentials in a discipline related to physical activity and public health (e.g., exercise science, public health, or physical education). The PA coordinator will provide technical assistance and leadership in state-level initiatives to promote physical activity and will oversee evaluation of physical activity interventions. The PA coordinator should be able to review and advise on physical activity initiatives coordinated by the health department, ensure that they are consistent, based on best available evidence, and coordinated with other efforts, thus promoting their effectiveness.
Desirable credentials for the nutrition coordinator are certification as a registered dietitian with the American Dietetic Association Commission on Dietetic Registration and/or have at least a master’s degree in nutrition or public-health nutrition, as well as experience in public-health nutrition. The nutrition coordinator will provide technical assistance and leadership in state-level initiatives to promote nutrition and will oversee the evaluation of nutrition interventions. The nutrition coordinator should be able to review and advise on pertinent nutrition initiatives coordinated by the health department, ensure that they are consistent, based on best available evidence, and coordinated with other efforts, thus promoting their effectiveness.
Strong consideration should be given to identifying staff with relevant professional experience in the following areas: analytic assessment, policy development and program
Section II: CDC’s NPAO Program Management Practices with Funded States January 2008
22

planning, public health science, communication, community dimensions of practice, diversity and cultural proficiency, financial planning and management, and leadership and systems thinking. The Center of Excellence for Training and Research Translation at the University of North Carolina developed a list of competencies related to these areas that states may find useful. This list is in Appendix D.
Highly desirable additional staff include a program evaluator, management and administrative support staff, a minority health specialist, surveillance and epidemiology staff, a breastfeeding specialist, a communication specialist, and someone with expertise in social marketing. Surveillance Data and Reporting Plans Planning for data reporting based on available data allows states to be proactive rather than reactive. The Surveillance Data Plan and Surveillance Reporting Plan are suggested planning formats that states have found useful. Surveillance Data Plan A surveillance data plan includes an inventory of currently available surveillance and survey data, an assessment of the gaps in needed data, and plans for filling those gaps. Information in the data inventory portion of the plan includes the type of data collected, the surveillance system or survey from which the data come, time frame of collection, population covered, and the correlating state plan objective. If needed by the state, it is possible to expand the data plan beyond nutrition, physical activity, and obesity to consider other chronic disease issues (and therefore developing a chronic disease plan). Because evaluation indicators draw upon many surveillance systems in the state, an overall framework showing what data elements are available for analysis and reporting will help in implementing the evaluation plan. Surveillance Reporting Plan A surveillance reporting plan projects potential reports for several years in the future including information such as the topics covered by a report, the frequency of that report, and the lead party responsible for writing the report. This plan will allow programs to prioritize the data publications they need for surveillance and evaluation reporting purposes.
Section II: CDC’s NPAO Program Management Practices with Funded States January 2008
23

Evaluation Guidance for State NPAO Programs Overview As cooperative agreement recipients, states have the responsibility to evaluate various components of their programs; this section describes those components. Although this guidance is not intended to provide basic instruction on evaluation methods, this manual provides references to resources on evaluation planning, methods, and use. States funded under this cooperative agreement are required to undertake five types of evaluation. (The first two are also recommended for unfunded states.) 1. Evaluation of the creation and implementation of your state plan for nutrition,
physical activity, and obesity. 2. Evaluation of selected interventions or projects undertaken to implement your state
plan. Those specific to states with CDC NPAO cooperative agreements are: 3. Ongoing monitoring for accountability as a recipient of federal funds. 4. Monitoring and tracking your progress in accomplishing the activities submitted in
the annual work plan for the cooperative agreement. 5. Participation in CDC’s national-level evaluation by providing the state’s data
electronically for CDC’s Progress Monitoring Report (PMR) system. To accomplish these evaluation responsibilities, state programs must seek the expertise of trained and experienced program evaluators. For suggestions on identifying program evaluators, see http://meera.snre.umich.edu/plan-an-evaluation/plonearticlemultipage.2007-10-30.3630902539/finding-working-with-an-evaluator
Evaluation Component #1: Evaluation of the Creation and Implementation of the State Nutrition, Physical Activity and Obesity Plan The state plan represents a roadmap of activities that the state program and partners intend to undertake to achieve important goals for nutrition and physical activity approaches that address obesity and other chronic diseases. The evaluation of this activity depends on whether a state is in the process of development or implementation. For those developing a plan, the focus is on using an effective process to develop and write the plan and ensuring the quality of the plan itself. For those implementing a state plan, the focus is on practical monitoring of plan implementation, with evaluation activities aimed at early identification of potential progress.
State plan goals are addressed by one or more objectives, which in turn are addressed by one or more activities (See Figure 1). For instance, an objective to improve nutrition among children may be influenced by a school-based policy for snacks, an intervention to provide nutrition education to childcare providers, and an environmental change in restaurants to improve children’s menus. While each of these activities can be evaluated individually for their impact, it is more important to track or monitor the
Section II: CDC’s NPAO Program Management Practices with Funded States January 2008
24

progress of the objective overall. All program efforts do not need to be evaluated at the same level.
Figure 1. Evaluating State Plan Objectives Based on Multiple Activities to Address Goals
Policies & Legislative
Acts
Objective A
Environmental Changes
Interventions
Policies & Legislative
Acts
Environmental Changes
Interventions
Objective B
GOAL
Use CDC’s State Plan Index http://www.cdc.gov/nccdphp/dnpa/obesity/state_programs/pdf/State_Plan_Index_April_2005.pdf) (see articles at www.cdc.gov/pcd/issues/2005/apr/pdf/04_0089.pdf and www.cdc.gov/pcd/issues/2005/apr/pdf/04_0090.pdf
CDC’s State Plan Index provides a checklist of key components that states should consider as they develop their plans. It can be used in several ways:
• As a tool in the planning process • As a checklist to review their final written plan to ensure that it appropriately
documents steps that were taken in the planning process, stakeholders who participated, its goals and objectives, and how the plan will be implemented and evaluated
• As a tool to review the state plan to identify areas that need to be revisited before it is finalized and disseminated
Evaluating the state plan through the use of a logic model
Developing a logic model is an effective method for creating a picture of your state plan. Use of the logic model to chart progress is an effective way to evaluate the plan’s implementation. A logic model can be a very useful tool, and there is no single right way to create one. The process of developing a logic model is iterative. It requires stakeholders to work together to clarify the rationale of the plan. It provides a focal point for development, implementation and evaluation of the plan. To get more detail on the use of logic models, please see the resource section. A logic model for the national NPAO program is in Appendix E.
Section II: CDC’s NPAO Program Management Practices with Funded States January 2008
25

Monitor the implementation of the state plan States in the implementation stage must monitor progress in carrying out activities and achieving intended objectives. In so doing they can address and resolve barriers as they move toward achieving their goals. The evaluation of the state plan will be a record of what actually is implemented instead of what was planned. Consider addressing the following factors in your monitoring: facilitators to implementation, barriers to implementation, and critical pathways within your plan that are necessary to assure its effective implementation.
Use SMART objectives to form the basis of an implementation assessment Objectives that are in SMART format (specific, measurable, achievable, realistic, and time-specific) identify a way to measure specific progress as well as the time frame for achieving it. As part of the format for SMART objectives, consider including a data source that can be used to measure achievement of the objective.
Focus management attention on the most important issues
Evaluation of plan implementation is common sense, and it should be practical and problem-focused. The goal is to use the tools of evaluation to manage and improve the program and strategies. Monitor key milestones and key objectives and then track progress as part of ongoing management and evaluation. Note when an objective or milestone has been met and the data used to verify this. For some objectives, this is easy: if an objective is to develop a model policy, the existence of such a written model is readily observed. However, an equally important use of a tracking system is to identify when an activity has not been undertaken as planned or when an objective is not achieved as intended. This allows the program manager to “shine a spotlight” on an area where progress has stalled or fallen short. Finally, not every objective in the state plan may be equally important. Resources for more intensive evaluation are limited and should be focused on those objectives key to the success of the state plan.
Questions asked as part of an evaluation of the state plan implementation might include:
What are the critical components/activities of this plan?
How do these components connect (explicitly and implicitly) to the goals and intended outcomes for this plan (both explicit and implicit)? (This was determined during the state plan development process.)
What aspects of the implementation process are facilitating success or acting as barriers for the plan?
The focus of an implementation evaluation will depend on the phase of the state plan, the purpose of the evaluation, and the particular questions you ask. Implementation questions for a newly adopted plan:
What characteristics of the plan implementation process have facilitated or hindered plan objectives/goals? Answers might come from relevant stakeholders in this
Section II: CDC’s NPAO Program Management Practices with Funded States January 2008
26
discussion, such as clients, residents, staff administrators, other agencies, and policy makers.
Which initial strategies or activities of the plan are being implemented? Which are not? Why or Why not? Do any changes to the initial plan reflect lessons learned or unrelated factors (e.g., organizational dynamics, personalities, etc.)
How can those strategies or activities not successfully implemented be modified or adapted to the realities of the project?
What lessons have been learned about the initial plan design? How should those lessons be utilized to revise the original plan?
Implementation questions for established plans:
How do the different plan components interact and fit together to form a coherent whole?
Which components appear to be the most important to the plan’s success, as indicated by the evaluation data?
How effective is the established structure in supporting plan implementation? Do changes need to be made to improve support of the plan implementation?
Plan ahead for baseline data and systems to measure outcomes.
State plans may include goals and objectives that can be adequately measured by current data collection systems. For example, if a goal is to reduce the prevalence of childhood overweight, state surveillance systems may already capture these data at the level of specificity and precision desired. However in other cases, data systems may need revision or augmentation in order to measure desired outcomes. Part of state planning should be a comprehensive review to ensure that the state plan objectives themselves are realistic, and that the proposed measurement and data sources are also realistic.
Use a checklist of state plan objectives to form the basis of implementation assessment.
The summary checklist that follows is a list of questions that can serve as a checklist for implementation of the state plan. Depending on the level of detail included in the state plan objectives, you may decide to include only key objectives as important milestones to track. Track the following aspects of key objectives: how success will be measured, the time frame for desired accomplishment, the data source to use to assess implementation, and additional information important for the state’s particular needs. One may also decide to use an electronic system such as a spread sheet or Gant chart to track progress on state plan objectives. In addition, the CDC Progress Monitoring Report (discussed on page 31) provides space to list the state plan objectives and to record activities and progress. The needs of individual states will vary, thus the approach to implementation monitoring will vary as well. However, all states should invest time and resources in creating a plan that will lead to successful outcomes.
Section II: CDC’s NPAO Program Management Practices with Funded States January 2008
27

In many cases, it is important not only to track whether an activity has happened, but also to assess the quality of those activities as an indication of likely effect or impact. This may be especially true for objectives that are critical to success, that involve a substantial amount of resources, or for high-visibility activities. For example, forming a coalition may be a critical key strategy to achieve a desired policy change. While it may be easy to verify that a coalition was formed, it may be even more important to assess the quality of the coalition and the participation of members. Pertinent quality-related questions may include: Are the appropriate partners engaged? Do members participate actively? Is the level of collaboration among members as expected? Does the coalition as an entity feel empowered to accomplish its goals? A tool such as the “Participant Involvement Scorecard” (Butterfoss, 2007, p. 197-198) can be useful in doing a partnership assessment.
Emphasize program improvement. Remember, the emphasis for this evaluation is ensuring that the state plan is implemented effectively and fully to achieve intended public health outcomes. Documenting in the evaluation why certain parts of the state plan were not implemented is also useful for program improvement.
Summary checklist.
The following is a list of questions or activities to consider when deciding on how to evaluate the development and implementation of the state plan:
• Did you use the State Plan Index to develop the state plan?
• Did you identify your most important stakeholders and seek input on evaluation needs, such as what they view as success?
• Did you set priorities within your evaluation of the state plan?
• Do your priorities include evaluating objectives that focus on policies,
environmental changes, or interventions?
• Does the evaluation plan consider priority data sources and the following components:
o State program objective: What is the objective to be evaluated? o Evaluation questions: What information needs to be obtained? o Indicator/measure: What and how will the information be measured? o Data source: Where will the information be obtained? o Methods/Design: How will success be determined (e.g., compare to
baseline, national sample, etc.) o Schedule: When will the information be collected? o Responsibility: Who will be responsible for collecting the information? o Use of data: How will the information be used?
Section II: CDC’s NPAO Program Management Practices with Funded States January 2008
28
• Did you determine your data collection approach? Have you identified who would be responsible for each step in your data collection?
• Does your data collection approach identify data to be used as baseline
measures?
• Did you develop a plan to make sure the evaluation information collected is useful and appropriate?
• Have you explicitly stated how the evaluation results will be used, who is the
audience for the results, and how the results will be disseminated?
Resources Butterfoss FD. Coalitions and partnerships in community health. San Francisco, CA: Wiley and Sons, Inc., 2007. Butterfoss FD, Dunet DO. State Plan Index: a tool for assessing the quality of state public health plans. Prev Chronic Dis [serial online] 2005 Apr [cited September 20, 2007]. Available from: URL: http://www.cdc.gov/pcd/issues/2005/apr/04_0089.htm. Dunet DO, Butterfoss FD, Hamre R, Kuester S. Using the State Plan Index to evaluate the quality of state plans to prevent obesity and other chronic diseases. Prev Chronic Dis [serial online] 2005 Apr [cited September 20, 2007]. Available from: URL: http://www.cdc.gov/pcd/issues/2005/apr/04_0090.htm. Evaluation Component #2: Intervention Evaluation
Ensure that activities are evaluation, not research.
Program evaluation methods are used to assess programs and strategies operating in the field. The key purpose of evaluation is to generate feedback that can be used for program improvement. In contrast, research activities are usually intended to generate new knowledge using methodology that provides the ability to generalize the findings to other conditions, such as populations or locations. Cooperative agreement funding cannot be used for research. See the following for a definition of research: http://www.hhs.gov/ohrp/humansubjects/guidance/45cfr46.htm#46.102
Interventions and policies to be evaluated should represent key approaches in the state plan.
Not every intervention should be evaluated when resources are limited. Rather, evaluation efforts should focus on interventions that are critical to the success of the state plan.
When replicating evidence-based interventions, focus on process evaluation. Interventions that have been rigorously evaluated are expected to show similar results when implemented in similar settings and with similar target audiences. When
Section II: CDC’s NPAO Program Management Practices with Funded States January 2008
29

replicating an evidence-based intervention, process evaluation should be used to verify that:
• All components of an intervention are being delivered and received. • There is fidelity between the way an intervention was designed and how it is
being delivered. • Short-term outcomes are in the range of what was achieved in the research
setting. (For example, if an intervention is supposed to reduce blood pressure by 30 points, then community participants should be attaining a reduction in a similar range.)
Document and assess adaptations of evidence-based interventions that are implemented.
In some cases, an evidence-based intervention is adapted to a new population group, implemented in a substantially different setting, or altered in some way that merits a more careful evaluation than a simple process check. In these cases, document the intervention as it is implemented and use appropriate evaluation methods to assess short-term outcomes. As above, the focus will be to ensure that results are in the range expected from the evidence-based version of the intervention. The emphasis should continue to be on feedback for program improvement and not on generalizing the intervention.
When packaging a set of evidence-based interventions, use evaluation methods to verify that short-term outcomes are within an expected range.
States and communities may combine a set of evidence-based interventions to form a more comprehensive strategy set, in contrast to a single intervention. If possible, clarify the expectations for the range and level of outcomes anticipated from the combined strategies. Then, use appropriate evaluation methods to verify that the short-term outcomes achieved are within an acceptable range. Use the results of such evaluation as feedback for further refinement of the set of strategies. Evaluation Component #3: Monitoring for Accountability The first and most basic type of evaluation activity is tracking the cooperative agreement funds received and monitoring expenditures. In accepting cooperative agreement federal funds, a state agrees to the fiscal reporting requirements. Monitoring is essential to ensure accountability and careful stewardship of federal funds. Monitoring expenditures is part of the project’s management function, but it also a source of evaluation data. For example, if funds intended for activities are not spent, the state team should examine the reasons why planned activities have not taken place and address any barriers. In some cases, the state plan may need revision to reflect alternative activities. States are expected to work closely with their CDC project officer to monitor the use of funds and any need for changes to the state plan and the work plan. The cooperative agreement award documents include additional information about fiscal management, accountability, and reporting. Compliance with these requirements is important.
Section II: CDC’s NPAO Program Management Practices with Funded States January 2008
30

Evaluation Component #4: Tracking Progress in the Annual Work Plan
For every budget period in the cooperative agreement, state grantees complete work plans describing the program activities that will take place. Work plans need to indicate for all objectives and major activities how one will know when the objective/activity has been reached. The suggested work plan template on page 21 includes evaluation indicators to show the progress a program is making toward achieving a specified action or outcome. Evaluation Component #5: Participate in the Progress Monitoring Report (PMR) CDC’s PMR system provides an electronic format for cooperative agreement recipients to contribute to a national-level assessment of the impact of CDC’s cooperative agreement program. Completing the PMR is a mandatory reporting requirement of the cooperative agreement and is part of the state’s evaluation expectations. The PMR provides data important to evaluate the program, document progress, and understand success, and is used to provide Congress with an understanding of the important accomplishments of the program and to document the need for continued funding.
Web-based PMR reports are completed every 6 months to update a state’s progress on infrastructure, planning, collaboration, policy, implementation, data sources, and evaluation. States are encouraged to enter their program data throughout the year as activities are completed as a way of complementing their other monitoring activities.
Section II: CDC’s NPAO Program Management Practices with Funded States January 2008
31

Selected Evaluation Resources
SMART Objectives DASH Tutorial on Goals & SMART Objectives
http://apps.nccd.cdc.gov/dashoet/writing_good_goals/menu.html DHDSP Evaluation Guides (SMART objectives, Evaluation Plan development)
http://www.cdc.gov/dhdsp/state_program/evaluation_guides/smart_objectives.htm Logic Model Resources CDC Evaluation Logic Models Selected Bibliography: http://www.cdc.gov/eval/logic%20model%20bibliography.PDF DHDSP Evaluation Guides (Logic Model)
http://www.cdc.gov/dhdsp/state_program/evaluation_guides/logic_model.htm W.K. Kellogg Foundation* – Logic Model Development Guide
http://www.wkkf.org/Pubs/Tools/Evaluation/Pub3669.pdf Comprehensive Evaluation Resources Basic Guide to Program Evaluation*
http://www.managementhelp.org/evaluatn/fnl_eval.htm Guidance for Comprehensive Cancer Control Planning Guidelines http://www.cdc.gov/cancer/ncccp/cccpdf/Guidance-Guidelines.pdf Guidance for Comprehensive Cancer Control Planning Toolkit
http://www.cdc.gov/cancer/ncccp/cccpdf/Guidance-Toolkit.pdf Physical Activity Evaluation Handbook (PA focused)
http://www.cdc.gov/nccdphp/dnpa/physical/handbook/index.htm Practical Evaluation of Public Health Programs
http://www.cdc.gov/eval/workbook.PDF
Evaluation Frameworks CDC Evaluation Framework
http://www.cdc.gov/eval/framework.htm RE-AIM Framework* http://www.re-aim.org/ Evaluation Tools and Templates CDC Evaluation Resource list
http://www.cdc.gov/eval/resources.htm TB Evaluation Toolkit
http://www.cdc.gov/tb/Program_Evaluation/default.htm Innonet (Advocacy and Policy Evaluation, Point K logic model and evaluation plan builder, organizational assessment tool)*
http://www.innonet.org/ Community Evaluation Community Food Project Evaluation Toolkit *
http://www.foodsecurity.org/pubs.html#handouts Community Food Project Evaluation Handbook* (Comprehensive)
http://www.foodsecurity.org/Handbook2005JAN.pdf Community Toolbox *
http://ctb.ku.edu
Section II: CDC’s NPAO Program Management Practices with Funded States January 2008
32

CYFERnet Evaluation Resources* http://cyfernet.ces.ncsu.edu/cyfres/browse_2.php?search=Evaluation
Georgia Family Service Evaluation Toolkit* http://www.gafcp.org/fcnetwork/eval/evaltools.htm
Policy Evaluation Issue Topic: Advocacy and Policy Change. Evaluation Exchange, Volume 13(1), Spring
2007 http://www.gse.harvard.edu/hfrp/eval/issue34/index.html
Annie E. Casey Foundation. A Guide to Measuring Advocacy and Policy, 2007* http://www.aecf.org/KnowledgeCenter/Publications.aspx?pubguid={4977C910-1A39-44BD-A106-1FC8D81EB792}
J Fielding and P Briss. (2006) Promoting evidence-based public health policy: Can we have better evidence and more action? Health Affairs 25(4): 969-978.
Public Health Institute in Ireland * http://www.publichealth.ie/index.asp?locID=632&docID=-1
*Note: Non-Federal organization Web site addresses are provided solely as a service to our users. Inclusion of these Web site addresses in this manual does not constitute an endorsement of these organizations or their programs by CDC or the federal government, and none should be inferred. CDC is not responsible for the content of the individual organization Web pages provided here.
Section II: CDC’s NPAO Program Management Practices with Funded States January 2008
33

Section III:
Interventions and Strategies Addressing
NPAO Principal Target Areas
Section III: Interventions and Strategies Addressing NPAO Target Areas January 2008
34
Introduction
The national NPAO program supports state efforts to work with communities to develop, implement, and evaluate interventions that address behaviors related to the following six principal target areas:
• Increase physical activity • Increase consumption of fruits and vegetables • Decrease the consumption of sugar-sweetened beverages • Reduce the consumption of high-energy-dense foods • Increase breastfeeding initiation and duration • Decrease television viewing
This section of the manual provides the background and rationale for the target area, intervention strategies and examples of interventions. The example interventions are provided as illustrations of the strategy only; therefore, materials may not be available to replicate the intervention. The summary of intervention strategies for each target area describes systematic reviews of the effectiveness of interventions. If a systematic review is not available, the summary includes the best evidence available from the peer-reviewed literature. This manual is a living document, and it will be updated as more evidence related to the effectiveness of interventions is reported in the literature. Design and Implement Strategies and Interventions Public health practitioners can implement interventions at every level of the Social-Ecological Model (societal, community, organizational, interpersonal, and individual levels). The Socio-Ecological Model in the figure on the next page shows the various behavioral settings and stakeholders that commonly exist in a community. Interventions to prevent and control obesity should include an approach that creates environments, policy and practices that support both the increase in physical activity and improvement in dietary behaviors within the target audience. Interventions that are multi-component (education with skill-building, creating access with campaigns for awareness, etc.) go beyond the audience acquiring new knowledge and toward building skills and practicing the desired behavior. Approaches and interventions selected should be determined only after formative assessment of the target audience (as provided in the social marketing and the evaluation framework process). Further assessment of the target audience and their needs, barriers and goals will direct the practitioner to the most appropriate intervention to reach the target population’s nutrition and physical activity goals. See Appendix A, “Social Marketing, the Social Ecological Model, and Evidence-Based Strategies,” for more information on how to use social marketing and the Social-Ecological Model when planning and implementing interventions. Evaluation planning in the early stages of developing interventions is also critical. Guidance on how to evaluate interventions is included in the section “Evaluation Guidance for State NPAO Programs” on page 24.
Section III: Interventions and Strategies Addressing NPAO Target Areas January 2008
35

Community Framework for Addressing Overweight and Obesity
Evidence-Based Intervention Strategies The paragraph titled “Effectiveness” included for each strategy describes the effectiveness of interventions reported in systematic reviews and individual studies published in peer-reviewed journals. One of the most rigorous types of evidence is the scientific reviews of published studies conducted by the Task Force on Community Preventive Services. From these reviews, the Task Force makes recommendations that are published as part of the Guide to Community Preventive Services, commonly referred to as the Community Guide. The Community Guide has several reviews in process; however, only a few recommendations have been published related to physical activity, nutrition, and obesity. The Community Guide has found sufficient evidence to recommend eight community interventions that include informational; behavioral and social; and environmental and policy approaches to increase physical activity. It also found sufficient evidence to recommend that interventions in the worksite that combine nutrition and physical activity are effective in helping employees lose weight and keep it off in the short term.
Section III: Interventions and Strategies Addressing NPAO Target Areas January 2008
36
Additional resources on interventions and strategies are also available.
• The national NPAO Program has a Prevention Research Center cooperative agreement special interest project with the University of North Carolina Center of Excellence for Training and Research Translation to develop a Web site, www.center-trt.org that provides practitioners with the best available evidence for interventions and strategies related to the prevention and control of obesity.
• The Community Guide recommendations are available on their Web site,
www.thecommunityguide.org. A link in the Community Guide’s “Research Tested Intervention Programs” provides access to the next Web site:
• http://cancercontrolplanet.cancer.gov/index.html. This site provides general
examples and access to materials sorted by the Community Guide strategies. It is important however, to tailor interventions to the needs, cultures, and barriers of the target audience. Additional tools are also provided on this Web site to assist in properly adapting evidence-base programs: http://cancercontrol.cancer.gov/use_what_works/start.htm
Terminology Used in This Section of the Manual Intervention strategy: The term strategy is not used consistently in evidence summaries and literature reviews of interventions. In this manual the term strategy is used to describe an approach, course of action, or method used to achieve an objective, which in turn is a means to achieving a goal. A strategy may be a health intervention at the individual or population level, but it can also refer to such things as a systems change initiative. Please note that the Community Guide does not use the term strategy to describe the eight community interventions that are recommended to promote physical activity. However, they are defined as strategies in this manual so a consistent term can be used throughout the document. Intervention: Any kind of planned activity or group of activities (including programs, policies, and laws) designed to prevent disease or injury or promote health in a group of people. (For the definition and characteristics of an intervention that are used by NPAO for the state reporting in the PMR, see Appendix C.) Intervention example: Examples of interventions are provided as illustrations of the strategy. They were obtained from the Community Guide review, other objective reviews, or peer-reviewed articles. Other interventions consistent with the strategy may also exist. Users of this manual may not always find available materials to replicate the interventions described in this manual. Sources for the Community Framework for Addressing Overweight and Obesity: Sobush K, Dunet D, Kettel Khan L. Common community measures for obesity prevention. Draft Methodology Report. Atlanta, GA: CDC, 2007. Institute of Medicine. 2007. Progress in preventing childhood obesity: how do we measure up? Washington, DC: The National Academies Press, 2007.
Section III: Interventions and Strategies Addressing NPAO Target Areas January 2008
37

Target Area: Physical Activity
Background and Rationale Regular physical activity helps maintain good health across the life stages. It substantially reduces the risk of coronary heart disease—the nation's leading cause of death and decreases the risk for stroke and breast and colon cancer. It also contributes to healthy bones, muscles, and joints and promotes healthy growth and development in children and reduces the risk of falls among older adults. Physical activity reduces the risk of anxiety and depression and promotes psychological well-being, and is associated with fewer hospitalizations, physician visits, and medications. Regular physical activity is effective, recommended treatment for many chronic diseases, including arthritis, heart disease, high blood pressure, high blood cholesterol, osteoporosis, diabetes, and chronic lung disease. In addition, physical activity, combined with appropriate calorie intake, is an important component of weight control. In both adults and children, physical activity reduces the adverse effects of overweight and obesity, such as elevated blood pressure, hyperlipidemia, and glucose intolerance (1-3). Despite these well-documented benefits, 52% of U.S. adults in 2005 did not engage in recommended amounts of physical activity; during that same time, 27.5% of adult men and 23.2% of adult women did not engage in any physical activity during their leisure time (4) [BRFSS 2005]. There is also cause for concern among adolescents: In 2003, for example, 10% of surveyed youth had not participated in any moderate or vigorous physical activity during the prior week (4) [YRBS 2005]. Barriers for individuals include lack of time, energy, motivation, skills, resources, and supportive social environments; concerns about injury; inclement weather; age-related loss of fitness and health problems (5-7). Community barriers for physical activity include lack of access to quality recreational facilities (i.e., parks, trails, and gyms) and public transit (bicycle and pedestrian infrastructure and connectivity)(8-9). Changjng physical activity behaviors requires an understanding of how factors at each level of the social ecological model affect the individual’s physical activity. Therefore, understanding the determinants of physical activity becomes the cornerstone in setting policies, recommendations, and guidelines that better enable individuals and communities to engage in physical activity as part of a healthier lifestyle and helps to guide the development, implementation, and evaluation of interventions. Physical activity resources for health professionals may be found on CDC’s Web site: http://www.cdc.gov/nccdphp/dnpa/physical/health_professionals/index.htm Overview of Strategies
Section III: Interventions and Strategies Addressing NPAO Principal Target Areas—Physical Activity January 2008
38
The Community Guide recommends the following eight community-level physical activity intervention strategies (10-12). Though they are described separately, these interventions are typically multi-component and can share the same components in practice. For example, community-wide campaigns can simultaneously use social support and point-of-decision prompts to create or enhance access to places for physical activity. For any intervention strategy to be selected, decision-makers should consider these interventions in light of factors such as community resources, needs, priorities, and constraints.

Section III: Interventions and Strategies Addressing NPAO Principal Target Areas—Physical Activity January 2008
39
Community Guide Approaches and Interventions Informational
• Community-wide campaigns • Point-of-decision prompts
Behavioral and social • Individually adapted health behavior change programs • Enhanced school-based physical education • Social support interventions in community settings
Environmental and policy • Creation of or enhanced access to places for physical activity combined with
informational outreach activities • Community-scale urban design/land-use policies and practices • Street-scale urban design/land-use policies and practices
Promising Interventions
• Safe Routes to School References 1. Haskell WL, Lee I-M, Pate RP, et al. Physical activity and public health: updated
recommendation for adults from the American College of Sports Medicine and the American Heart Association. Circulation 2007;116:1081–93.
2. DHHS. Physical activity and health. A report of the Surgeon General 1996. [On-line Access] http://www.cdc.gov/nccdphp/sgr/sgr.htm
3. Strong WB, Malina RM, Limkie CJ, et al. Evidence based physical activity for school-age youth. J Pediatr 2005; 146:732-7.
4. DNPA. Importance of physical activity. [On-line Access] http://www.cdc.gov/nccdphp/dnpa/physical/importance/index.htm
5. Sallis JF, Hovell MF. Determinants of exercise behavior. Exercise and Sport Science Reviews 1990;18:307-330.
6. Sallis JF, Hovell MF, Hofstetter CR. Predictors of adoption and maintenance of vigorous physical activity in men and women. Preventive Medicine 1992;21(2):237-251.
7. DHHS. Promoting physical activity:a guide for community action 1999. and DNPA Overcoming Barriers to Physical Activity: http://www.cdc.gov/nccdphp/dnpa/physical/life/overcome.htm
8. Schmid T, Pratt M, Howze E. 1995. Policy as intervention: environmental and policy approaches to the prevention of cardiovascular disease. Am J Public Health
1995;85(9): 1207-11. 9. Active Community Environments Initiative:
http://www.cdc.gov/nccdphp/dnpa/physical/health_professionals/active_environments/aces.htm
10. CDC. Increasing physical activity: A report on recommendations of the Task Force on Community Preventive Services. MMWR 2001;50(RR18):1-16.
11. CDC. Guide to preventive services: systematic reviews and evidence-based recommendations—physical activity 2005. (http://www.thecommunityguide.org/pa/)
12. Kahn ET, Ramsey LT, Brownson RC, Heath GW, et al. The effectiveness of interventions to increase physical activity: a systematic review. Am J Prev Med 2002; 22(4S):73-107.

Section III: Interventions and Strategies Addressing NPAO Principal Target Areas—Physical Activity January 2008
40
Physical Activity Strategy 1: Community-Wide Campaigns
Description (1-5) Community-wide campaigns can successfully integrate multiple strategies in community settings to positively affect levels of physical activity and related outcomes. The following are general characteristics of community-wide campaigns: • They are large-scale, intense, and highly visible, with messages directed to large
audiences through various media, including television, radio, newspapers, movie theaters, billboards, and mailings.
• They include non-media components such as:
o partnerships o environmental change (e.g., new walking trails) o policy change o social support (e.g., buddy system, self-help groups) o physical activity counseling
Examples
• Wheeling Walks (6) used paid advertising to encourage walking among sedentary older adults. The program's campaign activities included paid newspaper, TV and radio advertising; weekly press conferences and news coverage; worksite programs; Web site exposure; and other public health education programs implemented by physicians, health professionals, and ministers. The results indicate that 30% of Wheeling's sedentary residents increased their walking to the recommended level compared to a 16% increase in a control community.
• BC Walks (7) promoted 30 minutes or more of moderate-intensity daily walking among insufficiently active residents of Broome County, New York, aged 40 to 65 years. Promotion activities included paid advertising, media relations, and community health activities. Impact was determined by pre-intervention and post-intervention random-digit-dial cohort telephone surveys in intervention and comparison counties. Exposure to the campaign was reported by 78% of Broome County survey respondents. Sixteen percent of Broome County participants changed from nonactive to active walkers compared to 11% in the comparison county. Forty-seven percent of Broome County respondents reported any increase in total weekly walking time compared to 36% in the comparison county.
Effectiveness (2-4)
• The Community Guide rates the evidence for community-wide campaigns as strong. • The recommendation for community-wide campaigns is based on review of 10
studies in which the median effect size suggests these campaigns result in a 5% increase in the proportion of the population that is physically active, and a 16% increase in average, individual energy expenditure.
• In addition to increasing physical activity, community-wide campaigns were often shown to improve community capacity by developing or strengthening social networks and by improving community members’ sense of cohesion as well as their collective ability to bring about change.

Section III: Interventions and Strategies Addressing NPAO Principal Target Areas—Physical Activity January 2008
41
• This strategy is effective among diverse populations (e.g., different racial/ethnic and socioeconomic groups) and in diverse settings (e.g., rural, urban).
References 1. Brownson RC, Haire-Joshu D, Luke DA. Shaping the context of health: a review of
environmental and policy approaches in the prevention of chronic diseases. Ann Rev Public Health 2006;27:341-70.
2. CDC. Increasing physical activity: a report on recommendations of the Task Force on Community Preventive Services. Morbidity and Mortality Weekly Report 2001;50(RR18):1-16.
3. CDC. 2005. Guide to preventive services: systematic reviews and evidence-based recommendations—physical activity. (http://www.thecommunityguide.org/pa/)
4. Kahn ET, Ramsey LT, Brownson RC, Heath GW, et al. The effectiveness of interventions to increase physical activity: a systematic review. Am J Prev Med 2002;22(4S), 73-107.
5. Matson-Koffman DM, Brownstein JN, Neiner JA, Greaney ML. A site-specific literature review of policy and environmental interventions that promote physical activity and nutrition for cardiovascular health: what works? Am J Health Promotion 2005;19(3:167-93.
6. Reger-Nash B, Bauman A, Booth-Butterfield S, et al. Wheeling Walks: Evaluation of a media-based community intervention. Family & Community Health 2005;28(1):64-78.
7. Reger-Nash B, Fell P, Spicer D, Fisher BD, et al. Walks: replication of a communitywide physical activity campaign. Prev Chronic Dis 2006 3(3):A90.
Physical Activity Strategy 2: Point-of-Decision Prompts for Stairwell
Description (1-5) Point-of-decision prompts are low-cost, easy to implement, and effective ways to increase levels of physical activity by increasing the number of individuals who use stairs instead of elevators or escalators in worksites and elsewhere in the community. Most interventions are multi-component involving physical change of stairwell, promotion of stairwell as a means of daily physical activity and sometimes include a challenge or competition. The following are general characteristics of Point-of-Decision Prompts for Stairwells:
• Visual cues (e.g., signs or banners posted near elevators, escalators, or moving walkways) designed to encourage individuals to use stairs.
• A variety of messages highlighting the benefits of physical activity, weight loss, and saving time. Examples (6) include: “Your heart needs exercise, use the stairs.” “Improve your waist line, use the stairs.”
• Signs designed to be highly visible (e.g., through placement and size). • Reminders to people that opportunities to be more physically active are nearby. • Making stairs a viable and appealing option by ensuring stairwells are accessible,
safe, well-lighted, and clean, and by providing music or displaying art.

Section III: Interventions and Strategies Addressing NPAO Principal Target Areas—Physical Activity January 2008
42
Example • Stairwell to Better Health (6) was a study conducted by CDC’s Division of Nutrition
and Physical Activity to determine if making physical changes to a stairwell in the Atlanta-based, Koger Center Rhodes Building, along with adding music and motivational signs would motivate employees to use the stairs instead of the elevator. Effectiveness (2-4)
• The Community Guide rates the evidence for point-of-decision prompts as sufficient. • The recommendation for point-of-decision prompts is based on review of six studies
in which the median effect size suggests that these prompts increase stair use by 54%.
• This intervention is effective among diverse populations (e.g., men, women, the obese, older adults) and in diverse settings (e.g., malls, subways, trains, bus stations, university libraries).
References 1. Brownson RC, Haire-Joshu D, Luke DA. Shaping the context of health: a review of
environmental and policy approaches in the prevention of chronic diseases. Ann Rev Public Health 2006;27:341-70.
2. CDC. Increasing physical activity: a report on recommendations of the Task Force on Community Preventive Services. MMWR 2001;50(RR18):1-16.
3. CDC. Guide to preventive services: systematic reviews and evidence-based recommendations –physical activity 2005: (http://www.thecommunityguide.org/pa/)
4. Kahn ET, Ramsey LT, Brownson RC, Heath GW, et al. The effectiveness of interventions to increase physical activity: a systematic review. Am J Preventive Medicine 2002;22(4S):73-107.
5. Matson-Koffman DM, Brownstein JN, Neiner JA, Greaney ML. A site-specific literature review of policy and environmental interventions that promote physical activity and nutrition for cardiovascular health: what works? Am J Health Promotion 2005;19(3):167-193.
6. Kerr NA, Yore MM, Ham SA, Dietz WH. Increasing stair use in a worksite through environmental changes. Am J Health Promotion 2004;18(4):312–15.
Physical Activity Strategy 3: Individually Adapted Health Behavior Change Programs
Description (1-3) Individually adapted health behavior change programs can increase physical activity in diverse settings and among diverse populations. The following are general characteristics of individually adapted health behavior change programs:
• Targeting participants in a variety of community settings (through workshops and seminars) or larger populations (through web-based programs, mail, or telephone) which may provide opportunities to reach larger numbers of people at less expense.

Section III: Interventions and Strategies Addressing NPAO Principal Target Areas—Physical Activity January 2008
43
• Tailoring to an individual’s specific interests, preferences, and readiness for change.
• Follow-up phone calls or monitoring by a counselor or coach. • Teaching of behavioral skills such as:
o setting goals and monitoring progress o building social support for new behavioral patterns o reinforcing behavior through self-reward and positive self-talk o problem solving geared toward maintenance of behavior change o preventing relapse into sedentary behaviors
Examples
• The Strong for Life Program (4) was cited by the Community Guide as one example of an evidenced-based program to increase physical activity in sedentary older adults. The program consisted of a 35-minute videotaped program of 11 exercises performed by a trained leader. Participants used color-coded elastic bands of varying resistance. Those in the program also received two home visits by a physical therapist who also reviewed behavioral techniques to maintain program adherence and progression such as goal setting, rewards, behavioral contracts and self-monitoring. This program resulted in significant improvements in the intervention group as opposed to the control group (those on waiting list) in the areas of hip extension, hip abduction, shoulder abduction in addition to a significant reduction (18%) in overall disability.
• Active Choices (5): One of the Active for Life interventions developed at the Stanford Prevention Research Center, Active Choices is a telephone-assisted physical activity counseling program for older adults that helps to incorporate more physical activity into their daily lives. The program includes an introductory face-to-face session with a health educator in order to determine realistic, individualized exercise plans. Written information on physical activity is also provided to help increase understanding of the different aspects of physical activity and to motivate behavior change. This initial session is followed by regular telephone contacts initiated by the health educator. This program was shown to be effective from pretest to posttest in increasing moderate-to-vigorous physical activity and total physical activity. In addition, participants reported improvements in satisfaction with body appearance, body function, depressive symptoms, perceived stress, and decreased BMI. Effectiveness (1-3)
• The Community Guide rates the evidence for individually adapted health behavior
change interventions as strong. • The recommendation for individually adapted behavior change is based on review of
18 studies in which the median effect size suggests this intervention increases an individual’s physical activity by 35% and energy expenditure by 64%.
• Individually adapted behavior change increases other measures of physical activity, such as the percentage of people starting exercise programs and the frequency of physical activity.
• These interventions are effective among diverse populations (e.g., different racial/ethnic minority and socioeconomic groups) and in diverse settings (e.g., communities, worksites, schools).

Section III: Interventions and Strategies Addressing NPAO Principal Target Areas—Physical Activity January 2008
44
References 1. CDC. Increasing physical activity; a report on recommendations of the Task Force on
Community Preventive Services. MMWR 2001;50(RR18):1-16. 2. CDC. Guide to preventive services: systematic reviews and evidence-based
recommendations—physical activity. 2005. http://www.thecommunityguide.org/pa/ 3. Kahn ET, Ramsey LT, Brownson RC, Heath GW, et al. The effectiveness of interventions to
increase physical activity: a systematic review. Am J Preventive Med 2002;22(4S):73-107. 4. Jette A et al. Exercise—it’s never too late: the strong-for-life program. AJPH 1999;89(1):66-
72. 5. Wilcox S, Dowda M, Griffin SF, Rheaume C, et al. Results of the first year of Active For Life:
translation of 2 evidence-based physical activity programs for older adults in community settings. Am J Public Health 2006;96(7):1201-09.
Physical Activity Strategy 4: Enhanced Physical Education (PE) in Schools
Description (1-3) School-based PE interventions have been shown to increase the amount of time youth are moderately to vigorously physically active in PE classes. Characteristics of this intervention could also be applied in a variety of youth-oriented settings, such as after-school programs and community and recreation centers. The following are general characteristics of enhanced physical education programs: • Increase in the amount of time a child is physically active in class. • Increase in length and frequency of classes. • Increase in the number of children moving as part of a game/activity.
by modifying game rules (e.g., in softball, having the entire team run the bases) or changing activities (e.g., replacing softball with soccer, so more students are active).
• High equipment-to-student ratio (e.g., at least every other student has a ball or jump rope).
• Active instruction and class management (e.g., students walk during roll call or engage in an activity while returning equipment).
• Use of limited and appropriate competition (e.g., no individual competition, a reduced emphasis on winning).
• Enthusiastic role models and reinforcement for active students. • Focus on activities that are enjoyable to the children. • Classroom instruction and/or behavior change strategies, such as goal setting,
decision-making, and self management. • Health-education activities.
Examples • CATCH (Coordinated Approach to Child Health) (4) uses a multi-component
behavioral health intervention to be delivered in grades 3, 4, and 5 to students of diverse communities. CATCH consists of components that are school-based (school food service, physical education, and classroom curricula) and family-based (home

Section III: Interventions and Strategies Addressing NPAO Principal Target Areas—Physical Activity January 2008
45
curricula, family fun nights), and are aimed at decreasing consumption of fatty and salty foods and increasing physical activity. Curricula are implemented by classroom teachers over a specific time period during the school year. CATCH has been shown to increase moderate-to-vigorous physical activity in PE classes and exceeds the Healthy People 2010 goal of greater than 50% of (PE) class time should be devoted to moderate-vigorous activity.
• SPARK (Sports, Play, and Active Recreation for Kids) (5) promotes high levels of
enjoyable physical activity among fourth- and fifth-grade students during physical education classes and outside of school. SPARK consists of a physical education component and a self-management component. The physical education includes health fitness activities such as aerobic dance, aerobic games, walking/jogging, and jump rope, combined with skill-fitness activities such as basketball and soccer. The self-management program teaches behavioral change skills to help children generalize regular physical activity outside of school. Students spent significantly more minutes being physically active in specialist-led and teacher-led classes than in control groups. Also, two years later, girls in specialist-led classes were superior in abdominal strength and cardiorespiratory endurance than girls in control classes. Effectiveness (1-3)
• The Community Guide rates the evidence for school-based PE as strong. • The recommendation for school-based PE is based on review of 14 studies, in which
the median effect size suggests that PE interventions result in an 8% increase in aerobic fitness among school-aged children.
• This strategy is effective among diverse populations (e.g., different racial/ethnic minority and socioeconomic groups, boys and girls, elementary- and high-school students) and in diverse settings (e.g., rural, urban).
References 1. CDC. Increasing physical activity: a report on recommendations of the Task Force on
Community Preventive Services. MMWR 2001;50(RR18):1-16. 2. CDC. Guide to preventive services: systematic reviews and evidence-based
recommendations—physical activity, 2005. (http://www.thecommunityguide.org/pa/) 3. Kahn ET, Ramsey LT, Brownson RC, Heath GW, et al. The effectiveness of interventions to
increase physical activity: a systematic review. Am J Preventive Med 2002;22(4S):73-107. 4. Perry C, Lytle L, Feldman H, et al. Effects of the child and adolescent trial for cardiovascular
health (CATCH) on fruit and vegetable intake. J Nutr Ed 1998;30:354-60. 5. Sallis JF, McKenzie TL, Alcaraz JE, Kolody B, Faucette N, Hovell MF. The effects of a 2-year
physical education program (SPARK) on physical activity and fitness in elementary school students. Am J Public Health 1997;87(8):1328-34.

Section III: Interventions and Strategies Addressing NPAO Principal Target Areas—Physical Activity January 2008
46
Physical Activity Strategy 5: Social Support in Community Settings
Description (1-3)
Social support interventions can create, strengthen, and/or maintain new or preexisting social networks that provide supportive relationships for physical activity behavior change and which address barriers to exercise and negative perceptions about activity. The following are general characteristics of social support interventions in community settings:
• Buddy systems. • Making contracts with others to complete specified levels of physical activity • Walking or other activity groups to provide companionship, friendship, and
support while being physically active. • Monitoring of progress (e.g., through phone calls from other participants or
project staff to encourage continued participation).
Examples
• Physical activity training for weight loss in Latinas was a controlled trial (4) that consisted of a support group that attended 10 weekly one-hour sessions and included self-monitoring using diaries and exercise, as well as describing the assistance received from an assigned buddy. Additionally, women were taught problem-solving skills such as identifying weight-related or exercise-related problems, generating a plan for solving the problem, implementing the plan, evaluating the outcome, as well as re-evaluating and revising the plan if not successful. Women participating in this study showed significant reductions in body mass index, waist-to-hip ratio, waist circumference, and hip circumference, and increases in fitness, as well as frequency of walking for exercise.
• Healthy Mothers On the Move (MOMs), (Madres Saludables en Movimiento) (5) is a
community-based program that consists of a 10-week curriculum designed to increase knowledge, skills, and reduce physical and social environmental barriers to stress management, health-promoting exercise, and dietary practices for pregnant and post-partum Latino women. Women’s Health Advocates (WHA’s) lead curriculum-focused meetings as well as make phone calls and home visits to the participants. Weekly group discussions garner social support (through mothers addressing their concerns, ideas, and successes) as well as provide skill-building activities (food demonstrations, exercise classes, stress management lessons, etc.). Participants in the program report an increase in physical activity as well as healthier eating. Effectiveness (1-3)
• The Community Guide rates the evidence for community social support as strong. • The recommendation is based on review of nine studies, in which the median effect
size suggests this intervention results in a 44% increase in time spent being physically active and a 20% increase in energy expenditure.
• This intervention is effective with diverse populations (e.g., men, women, adults of different ages, sedentary individuals, physically active individuals) and in diverse settings (e.g., communities, worksites, universities).

Section III: Interventions and Strategies Addressing NPAO Principal Target Areas—Physical Activity January 2008
47
References 1. CDC. Increasing physical activity: a report on recommendations of the Task Force on
Community Preventive Services. MMWR 2001;50(RR18):1-16. 2. CDC. Guide to preventive services: systematic reviews and evidence-based
recommendations—physical activity 2005. ((http://www.thecommunityguide.org/pa/)) 3. Kahn ET, Ramsey LT, Brownson RC, Heath GW, et al. The effectiveness of interventions to
increase physical activity: a systematic review. Am J Preventive Med 2002;22(4S):73-107. 4. Avila P, Hovell MF. Physical activity training for weight loss in Latinas: a controlled trial. Int J
Obesity & Related Metabolic Disorders 1994;18(7):476-82. 5. Healthy Mothers On the Move, Madres Saludables en Movimiento, Translation Trial, Dr. Edie
Kieffer, NIDDKD grant #5 R18 DK 062344, July 1, 2002 - June 30, 2007. Physical Activity Strategy 6: Create or Enhance Access to Places for Physical Activity Combined with Informational Outreach Activities
Description (1-5) This intervention provides and promotes physical activity opportunities for the target population by creating or improving access, combined with distribution of information. The following are general characteristics of interventions that create or enhance access to places for physical activity, combined with informational outreach activities:
• Creating access such as building a new facility or walking trail or providing access to an existing nearby facility in a community where an opportunity for physical activity did not exist.
• Enhancing or improving access or eliminating barriers to improve physical activity opportunities such as adding new equipment or extending facility hours of operation, extending or improving walking trails.
• Involving the efforts and partnerships of various community entities (e.g., worksites, coalitions, agencies, and community members) to create an ongoing and sustainable supportive environment for physical activity.
• Multi-component interventions that promote and sustain environmental or policy changes (e.g., promotion/awareness, skill-building, health education, referrals to physicians or additional services, health and fitness programs, and support or buddy systems).
Examples • The Stanford University’s Health Improvement Program (HIP) (6) was an employee
health program that aimed to increase physical activity and decrease weight. The intervention was a 16-week exercise program on a nearby worksite paracourse that consisted of 19 different activity stations placed around a 1½ mile course. Also, free ninety-minute exercise classes, occurring immediately after work, were offered to employees twice a week. Participants were also provided exercise-related information about potential health benefits of regular aerobic activity and were encouraged to exercise at least one additional time per week outside of class in order to reach the program goal of exercising at least three times a week. Those
Section III: Interventions and Strategies Addressing NPAO Principal Target Areas—Physical Activity January 2008
48
attending the classes showed significant increases in fitness and decreases in weight and significantly greater confidence concerning their ability to exercise regularly and increased energy relative.
• The Physical Activity for Risk Reduction (PARR) (7) project sought to promote
physical activity among low-income and low-education African American residents of public housing and rental communities in Birmingham, Alabama. PARR enhanced access to existing facilities and physical activity programming by providing childcare, transportation, enhanced safety, and peer-led programming. To ensure enhanced access to facilities and programming, the PARR staff recruited and extensively trained individuals from each community and paid them as part-time leaders for the local activity sessions. Each participating community also received physical activity tools as well as incentives for participants that included weightlifting equipment, supplies for aerobics programs (including audiotapes and boom boxes), tools for screening participants (scales, stethoscopes and sphygmomanometers), and prizes for participation (mugs, t-shirts, certificates for free laundry, etc). As part of data collection prior to program implementation, several barriers to physical activity were addressed such as childcare, transportation, organized and facilitated walking groups, safer walking routes, and waived fees at local community recreation centers for a full year. Sixty-nine percent of community members attended at least one event.
Effectiveness (2-4)
• The Community Guide rates the evidence for creating or enhancing access
combined with informational outreach to places for physical activity as strong. • The recommendation for creating or enhancing access to places for physical activity
is based on review of 10 studies in which the median effect size suggests this intervention results in a 25% increase in the proportion of the population who are physically active at least three times per week.
• Most of the studies reported weight loss or decrease in body fat among participants. • This intervention is effective among diverse populations (e.g., different racial/ethnic
minority and socioeconomic groups) and in diverse settings (e.g., low-income communities, industrial plants, universities, federal agencies).
References 1. Brownson RC, Haire-Joshu D, Luke DA. Shaping the context of health: a review of
environmental and policy approaches in the prevention of chronic diseases. Ann Rev Public Health 2006;27:341-70.
2. CDC. Increasing physical activity: a report on recommendations of the Task Force on Community Preventive Services. MMWR 2001;50(RR18):1-16.
3. CDC. Guide to preventive services: systematic reviews and evidence-based recommendations—physical activity. 2003. (http://www.thecommunityguide.org/pa/)
4. Kahn ET, Ramsey LT, Brownson RC, Heath GW, et al. The effectiveness of interventions to increase physical activity: a systematic review. Am J Preventive Medicine, 2002;22(4S):73-107.
5. Matson-Koffman DM, Brownstein JN, Neiner JA, Greaney ML. A site-specific literature review of policy and environmental interventions that promote physical activity and nutrition for cardiovascular health: what works? Am J Health Promotion, 2005;19(3):167-193.
6 King A., Carl F, Birkel L, Haskell W. Increasing exercise among blue-collar employees: the tailoring of worksite programs to meet specific needs. Preventive Med 1988;17(3):357-65.

Section III: Interventions and Strategies Addressing NPAO Principal Target Areas—Physical Activity January 2008
49
7. Lewis C, Raczynski J, Heath G, Levinson R, Hilyer J, Cutter G. Promoting physical activity in low-income African-American communities: the PARR project. Ethnicity & Disease 1993;3:106-18.
Physical Activity Strategy 7: Street-Scale Urban Design and Land-Use Policies and Practices
Description (1,2)
Using street-scale urban design and land-use policies and practices can help increase physical activity among target populations. The following are general characteristics of street-scale urban design and land-use policies and practices:
• They are implemented in small geographic areas, generally a few blocks. • Urban-design elements and practices include:
o ensuring sidewalk construction or improvements o increasing the ease and safety of crossing streets o introducing or enhancing traffic-calming and speed-reduction measures
(e.g., speed bumps, traffic circles) o improving street lighting o enhancing aesthetics of the street landscape o addressing safety issues (e.g., perception of crime)
• Land-use policies and practices include: o environmental changes o roadway design standards o zoning regulations o building codes o builders’ practices
• A broad array of disciplines and expertise are used, such as public health professionals, urban planners, architects, engineers, and developers.
Example
• Sunnyside Piazza (3) was a neighborhood revitalization effort, the goal of which was
to convert a neighborhood intersection that was in disrepair into an attractive community gathering place. They used artistic features intended to foster a sense of community, and they enhanced the street landscape, repaired and improved sidewalks, including the installation of a canopy. The intersection was enhanced by including a large sunflower street mural, a community kiosk with a solar-powered lamp, an art wall, seating areas adorned with glass mosaic, and overarching trellised hanging gardens in front of nearby homes. The multidisciplinary team for the project included local nonprofit organizations that addressed city repairs, resident landscape designers and architects, advocates, and other community members.
Effectiveness (1-3)
• The Community Guide rates the evidence for street-scale urban design and land-use
policies and practices as sufficient.

Section III: Interventions and Strategies Addressing NPAO Principal Target Areas—Physical Activity January 2008
50
• The recommendation for street-scale urban design is based on review of six studies, in which the median increase in physical activity across all effect measures (difference or change in people walking, number active, or users of path or cyclists) was 35%.
• Other potential benefits include improvements in green space, increased sense of community, decreased isolation, and reduction in crime and stress.
References 1. CDC. Guide to preventive services: systematic reviews and evidence-based
recommendations–physical activity 2005. (http://www.thecommunityguide.org/pa/) 2. Heath GW, Brownson RC, Kruger K, Miles R, et al. The effectiveness of urban design and
land use and transport policies and practices to increase physical activity: a systematic review. J Physical Activity and Health 2006;3(Supp 1):S55-S76.
3. Semenza JC. The intersection of urban planning, art, and public health: The Sunnyside Piazza. Am J Public Health 2003;93(9):1439-41.
Physical Activity Strategy 8: Community-Scale Urban Design and Land-Use Policies and Practices
Description (1,2)
Community-scale urban design and land-use regulations, policies and practices commonly strive to create more livable communities. The following are general characteristics of Community-scale urban design and land-use policies and practices:
• Typically represent large geographic areas, generally several square miles or more and involve a broad array of disciplines and expertise, such as public-health professionals, urban planners, architects, engineers, and developers.
• Design elements and practices, such as: o ensuring sidewalk construction or improvements o increasing the ease and safety of crossing streets o introducing or enhancing traffic-calming and speed-reduction measures
(e.g., speed bumps, traffic circles) o improving street lighting o enhancing aesthetics of the street landscape o addressing safety issues (e.g., perception of crime) o considering community design, density, and diversity by planning mixed-
development communities; addressing the density and diversity of residential and commercial development; and locating stores, jobs, schools, and recreation areas within walking distance of where people live
• Land-use policies and practices, such as: o environmental changes o roadway design standards o zoning regulations o building codes o builders’ practices

Section III: Interventions and Strategies Addressing NPAO Principal Target Areas—Physical Activity January 2008
51
Example:
• The Montgomery County, Maryland Pedestrian Safety Advisory Committee (3-5) appointed a Blue Ribbon Panel on Pedestrian and Traffic Safety in June 2000 under growing concerns about pedestrian safety and access amidst increasing pedestrian fatalities. As part of their research, the panel, consisting of 40 multidisciplinary members, analyzed trends and examined all aspects of hazardous driving from both behavioral and engineering perspectives. The panel released a report of their work in 2002 that outlined 54 recommendations organized by a) education, b) enforcement, c) engineering, and d) legislation. The report recommended a pedestrian impact statement as a requirement for all construction projects. The statement includes assessment of connectivity with destinations within two miles; master plan items for sidewalks, bikeways, and streetscape requirements; existing conditions related to pedestrian walkability and safety; and recommended improvements and their related costs. Developers in Montgomery County were encouraged to assess pedestrian impact on both new and existing projects. Following this report, a recommendation was made to create the Pedestrian Safety Advisory Committee to oversee the implementation of the recommendations made in the Blue Ribbon Panel report. The Pedestrian Impact Statement Policy was formally adopted in May 2004. Collaboration with developers was key, but most were already conducting similar assessments so the new county policy was adopted with little resistance. In July 2007 legislation was approved to require all capital improvement projects to submit bicycle and pedestrian impact statements. The Pedestrian Safety Advisory Committee continues to sustain itself as a committee within the county executive government and continues to set the agenda and report on the status of the implementation of the recommendations made by the Blue Ribbon Panel Report.
Effectiveness (1-3)
• The Community Guide rates the evidence for community-scale urban design and
land use policies and practices as sufficient. • The recommendation for this intervention is based on review of 12 studies in which
the median increase across a variety of measures of physical activity related to these interventions was 161%.
• Other potential benefits include improvements in green space, increased sense of community, decreased isolation, and reductions in crime and stress.
References 1. CDC. Guide to preventive services: systematic reviews and evidence-based
recommendations–physical activity 2005. (http://www.thecommunityguide.org/pa/) 2. Heath GW, Brownson RC, Kruger K, Miles R, et al. The effectiveness of urban design and
land use and transport policies and practices to increase physical activity: a systematic review. J Physical Activity and Health 2006;3(Supplement 1): S55-S76.

Section III: Interventions and Strategies Addressing NPAO Principal Target Areas—Physical Activity January 2008
52
3. Active living by design--case studies. http://www.activelivingbydesign.org/fileadmin/template/documents/case_studies/Montgomery_Co.pdf
4. Montgomery County Blue Ribbon Panel On Pedestrian and Traffic Safety. Setting safety in motion: recommendations for creating walkable communities in Montgomery County, Maryland. 2002. http://www.montgomerycountymd.gov/mcgtmpl.asp?url=/content/pio/news/pedestriansafety/BlueribbonTxt.asp
5. Capital Improvements Program, Bicycle and Pedestrian Impact. County Council Act, Montgomery County, Maryland 2007. http://www.montgomerycountymd.gov/content/council/pdf/SCANNED_DOCS/20071014_8-07.pdf
Physical Activity Strategy 9: Safe Routes to School
Description Safe Routes to School interventions are designed to increase the number of youth walking or bicycling to school. These interventions are referred to in a number of ways (e.g., Active Transportation to School, KidsWalk, Walk to School, Walking School Bus) and are of particular interest to public health because of their potential to increase physical activity and improve health among a large number of youth (1-7). Central to this intervention is the creation of an action plan to identify strategies and their solutions across the four “E’s”: 1) Education programs that teach motorists, pedestrians and bicyclists about their responsibilities and about traffic rules; 2) Enforcement enlists the help of local law enforcement to focus efforts in problem areas and increase community awareness of school safety issues; 3) Engineering tools include a variety of street design techniques that can reduce traffic volumes, decrease speed, and improve safety; and 4) Encouragement which includes developing awareness and building enthusiasm for walking and biking. Therefore, these interventions include multiple components including those recommended by the Community Guide (i.e., promotional campaigns, urban design and land-use policies and practices at both the street- and community-scale levels.)
Specific examples of components in Safe Routes to School programs include: • Addressing infrastructure (8-10):
o ensuring sidewalk construction or improvements (e.g., continuity of sidewalks)
o increasing the ease and safety of crossing streets o introducing or enhancing traffic-calming and speed-reduction measures
(e.g., speed bumps, traffic circles) o improving street lighting o enhancing aesthetics of the street landscape o addressing safety concerns and issues (e.g., perception of crime,
bullying) o providing and securing bicycle facilities
• Changing policy or practices (11-13): o environmental changes o roadway design standards o zoning regulations o building codes o builders’ practices
Section III: Interventions and Strategies Addressing NPAO Principal Target Areas—Physical Activity January 2008
53
• Promoting and/or changing behavior (13): o safety campaigns o walking and bicycling skill building o active transport campaigns o penalties for disobeying of traffic or pedestrian laws
• Involvement of partners (8,9,11,12,13): o a broad array of community members, disciplines and expertise, such as
students, parents, teachers, school administrators, public-health professionals, urban planners, architects, engineers, and developers.
Safe Routes to School legislation was passed in 2005 as part of SAFETEA-LU (Safe, Accountable, Flexible, Efficient Transportation Equity Act: A Legacy for Users [Public Law 109-59]) (14). The law provides funding for state departments of transportation to create and administer programs to make walking and bicycling to school a safe and viable option for children in grades in grades K–8. Construction and capital improvement projects must be located within approximately two miles of a primary or middle school (grades K - 8). Updates on how states are using these funds are available at the National Center for Safe Routes to School Clearinghouse (15).
Example • Safe Routes to School: Arlington County, Virginia, board spearheaded a county-wide
initiative to increase active transportation (i.e., walking and bicycling to school) at all public schools, joining the national Safe Routes to School effort. Schools across the county have integrated four key components: Engineering—The Department of Public Works conducted an in-depth safety
evaluation of existing conditions at 32 county schools. Design issues that were identified included minor changes such as improving signage and markings at crosswalks and school zones. Major design issues that were identified included new sidewalks and traffic-calming measures, such as pedestrian refuge islands and curb extensions within a quarter mile of schools.
Education—Education occurred on multiple levels: Teachers provided or reviewed safe walking tips by integrating the material into their curriculum, while parents reinforced these lessons at home. Students were provided maps that identified things like stop and yield signs, marked crosswalks, crossing guards, and bus stops. Through local media and messages on utility bills, the public information office disseminated a comprehensive public awareness campaign promoting Safe Routes to School, encouraging residents’ cooperation, and discouraging parents from driving to school to ease traffic congestion.
Enforcement—Police increased their presence during student travel time and also ticketed for violations such as speeding, illegal turns, and crosswalk obstruction. Speed trailers were prominently displayed, and crossguards were given cell phones to report dangerous situations quickly.
Encouragement—The campaign praised the efforts of those walking to school and continually highlighted the health and community benefits of children walking to school.
The case study (link below) on the Arlington County project reported that more than half of the students in Arlington County are now walking to school and some schools report that as many as 95% of students walk every day. See the following description of the

Section III: Interventions and Strategies Addressing NPAO Principal Target Areas—Physical Activity January 2008
54
Arlington County program, Community Rallies Around Safe Routes to School Program, in the Active Living by Design Web site: http://www.activelivingbydesign.org/index.php?id=342
Effectiveness Though the Community Guide did not include these interventions in their review, individual studies suggest that these interventions can be effective (1,4-7). References 1. Boarnet MG, Anderson CL, Day K, McMillan T, Alfonzo, M. Evaluation of the California Safe
Routes to School legislation: urban form changes and children's active transportation to school. Am J Preventive Medicine 2005;28(2 Suppl 2):134-40.
2. CDC. Barriers to children walking and biking to school—United States, 1999. MMWR 2002;51(32): 701-704.
3. CDC. Barriers to children walking to or from school—United States, 2004. MMWR 2005;54:949-52.
4. Cooper AR, Page AS, Foster LJ, Qahwaji D. Commuting to school: are children who walk more physically active? Am J Preventive Medicine 2003;25(4):273-76.
5. Cooper AR, Andersen LB, Wedderkopp N, Page AS, et al. Physical activity levels of children
who walk, cycle, or are driven to school. Am J Preventive Medicine 2005;29(3):179-84. 6. Fulton JE, Shisler JL, Yore MM, Caspersen CJ. 2005. Active transportation to school:
findings from a national survey. Res Quar Exercise & Sport 2005;76(3):352-57. 7. Staunton CE, Hubsmith D, Kallins W. Promoting safe walking and biking to school: the Marin
County success story. Am J Public Health 2003;93(9):1431-34. 8. CDC. guide to preventive services: systematic reviews and evidence-based
recommendations—physical activity. 2005. http://www.thecommunityguide.org/pa/ 9. Heath GW, Brownson RC, Kruger K, Miles R, et al. 2006. The effectiveness of urban design
and land use and transport policies and practices to increase physical activity: a systematic review. J Physical Activity and Health 2006;3(Supplement 1):S55-S76.
10. US Dept of Transportation. Program guidance—safe routes to schools (SRTS). http://safety.fhwa.dot.gov/saferoutes/srtsguidance.htm
11. Martin S, Pullen-Seufert N, Moeti R. 2007. Safe Routes to School: bringing together transportation and public health.) ITE (Institute of Transportation Engineers) J 2007; Accepted for Publication.
12. Martin S, Moeti R, Pullen-Seufert N. Implementing Safe Routes to School: application for the socio-ecological model and issues to consider. Health Promotion Practice 2007; Accepted for Publication.
13. Parisi D, Hondorp B. 2005. Transportation professionals get involved with Safe Routes to School. ITE Journal 2005;75(3):41-46.
14. US Dept of Transportation. Program Legislation - SAFETEA-LU. http://safety.fhwa.dot.gov/saferoutes/legislation.htm
15. National Center for Safe Routes to School. SRTS Program Tracking Brief. http://www.saferoutesinfo.org/resources/tracking-reports.cfm

Target Area: Increased Consumption of Fruits and Vegetables
Background and Rationale
Fruits and vegetables contain essential vitamins, minerals, fiber, and other compounds that may help prevent many chronic diseases. Compared with people who consume a diet with only small amounts of fruits and vegetables, those who eat more generous amounts as part of a healthful diet are likely to have reduced risk of chronic diseases, including stroke and perhaps other cardiovascular diseases, and certain cancers (1-3). Fruits and vegetables are also relatively low in calories per volume of food because of their high fiber and water content; thus, in their natural form they are low in energy density. Substituting fruits and vegetables for higher-energy-dense foods, such as those high in fat and added sugars, can therefore be part of a successful weight management strategy (4,5). The CDC publication, Can eating fruits and vegetables help people to manage their weight? (Research to Practice Series No. 1) examines the evidence from available studies to determine whether or not eating fruits and vegetables can help with weight management (5). Despite evidence supporting the health benefits of consuming fruits and vegetables, very few Americans consume the recommended amounts. The Healthy People 2010 objectives for the nation (6) include increasing to 75% the percentage of persons who eat at least two daily servings of fruit and increasing to 50% the proportion of persons who eat at least three daily servings of vegetables. In 2005, only 1 in 3 adults (32.6%) met the fruit objective and 1 in 4 adults (27.2%) met the vegetable intake (7). The 2005 Dietary Guidelines (8) recommend 2 cups of fruit daily and 2 ½ cups of vegetables per day for many Americans (based on their level of physical activity and caloric needs). However, an assessment of fruit and vegetable intake found that about 1 in 10 Americans consume the recommended amounts and even fewer consume adequate variety including those delivering vital micronutrients such as dark green and orange vegetables (9). In general, Americans with lower consumption include men, younger adults, and those with less education and lower incomes. Public health approaches for eating behavior change in populations have focused on increasing individual knowledge and awareness through educational approaches. The National Fruit and Vegetable Alliance (NFVA) is a national partnership dedicated to coordinating efforts across key public and private organizations to increase the amount of fruits and vegetables consumed by Americans. CDC is the lead federal agency and health authority for the NFVA. The Fruits & Veggies—More Matters® brand1 that was developed by the NFVA is used to promote fruit and vegetable consumption through health education campaigns, printed materials, and consumer Web sites: http://www.fruitsandveggiesmorematters.org/ and http://www.fruitsandveggiesmatter.gov .
Section III: Interventions and Strategies Addressing NPAO Target Areas Increased Consumption of Fruits and Vegetables January 2008
55
1 The Fruits & Veggies—More Matters brand replaced the 5 A Day for Better Health brand in 2007.

Section III: Interventions and Strategies Addressing NPAO Target Areas Increased Consumption of Fruits and Vegetables January 2008
56
Many barriers prevent adequate consumption of fruits and vegetables including lack of knowledge about health benefits, availability, cost, individual taste preferences, social support, preparation skills, and time available for preparing food. Studies also show disparities in access to fruits and vegetables as measured by type of stores, geographic distance, or store concentration (10). Choosing healthy foods is difficult in environments where retail establishments are comprised mainly of convenience and stores and fast food restaurants or for individuals dependent on public transportation for supermarket access.
Overview of Strategies Several multi-component interventions that include behavioral and environmental approaches to increase fruit and vegetable consumption are published. Many of these multi-component interventions to increase fruit and vegetable consumption are included in comprehensive intervention programs to prevent cardiovascular disease or obesity that may include other interventions for dietary or physical activity behaviors. However, the term multi-component is used here to describe the different components included in the interventions to increase consumption of fruits and vegetables such as a curriculum, parent newsletters, or modifications of cafeteria menus and not multiple behaviors that the intervention program may have addressed. Efforts that show evidence of success in increasing fruit and vegetable consumption, at least in short-term assessments, have been reviewed and include interventions in schools (11,12), worksites (13-16), health care settings (14) and other community settings such as faith-based organizations (17) and childcare settings (18). Typical environmental strategies used in these interventions include changes in food availability (physical access or environmental opportunity), price (economic access, incentives), or promotional, advertising, and point-of-purchase information whereas policy strategies include the setting of standards for training of staff or foods served in cafeterias or meetings. Recently, greater attention has been given to the role of environmental influences on food choices and to policies that might increase access and availability to fruits and vegetables. In this manual the term access includes geographic accessibility to a food retailer (e.g., the distance to stores), the type of food retailer in the vicinity (e.g., supermarkets, small stores, or farmers’ markets), and public transportation systems that provide access to food retailers. The term availability includes the number and types of fruits and vegetables offered. Increasing the availability of fruits and vegetables can be achieved through a variety of ways such as training food-service staff on how to make existing menu items more healthful by adding fruits and vegetables and partnering with the food system to provide more fruit and vegetable options. Environmental and policy strategies address local area barriers such as access, availability, and cost of fruits and vegetables. For example, without access to grocery stores that offer a wide variety of quality, nutritious foods at lower prices, poor and minority communities may not have the ability to purchase and consume a variety of healthy food (19). Policies aimed at improving fruit and vegetable consumption should consider the physical environment, economic determinants (cost, income), and promotion strategies (marketing and advertising) with consideration of the many factors influencing decisions on food choice. Decisions related to food choice include biological determinants such as hunger, appetite, and taste; education, skills (e.g., cooking) and

Section III: Interventions and Strategies Addressing NPAO Target Areas Increased Consumption of Fruits and Vegetables January 2008
57
time; social determinants such as culture, family, peers and meal patterns; and, attitudes, beliefs and knowledge about food (20). Therefore, efforts to develop policy and environmental strategies should consider use of a social-marketing approach in the same way that planners of behavioral change strategies do. This approach will help planners understand barriers to and determinants of fruits and vegetable purchases and consumption among different demographic groups; shopping and purchasing behaviors; and how the prices of fruits and vegetables and perceptions of their quality and affordability influence purchases and ultimately consumption. References 1. World Cancer Research Fund, American Institute for Cancer Research. Food, nutrition,
physical activity and the prevention of cancer: a global perspective, November 2007. [Online Access] http://www.dietandcancerreport.org/
2. Van Duyn MA, Pivonka E. Overview of the health benefits of fruit and vegetable consumption for the dietetics professional: selected literature. J Am Diet Assoc 2000;100(12):1511-21.
3. Dauchet L, Amouyel P, Dallongeville J. Fruit and vegetable consumption and risk of stroke: a meta-analysis of cohort studies. Neurol 2005;25;65:1193-7.
4. Rolls BJ, Ello-Martin JA, Tohill BC. What can intervention studies tell us about the relationship between fruit and vegetable consumption and weight management? Nutr Rev 2004;62:1-17.
5. CDC. Can eating fruits and vegetables help people to manage their weight? (Research to Practice Series No. 1) [Online Access] http://www.cdc.gov/nccdphp/dnpa/nutrition/pdf/rtp_practitioner_10_07.pdf
6. US Office of Disease Prevention and Health Promotion, US Department of Health and Human Services. Healthy people 2010. [Online Access] http://www.healthypeople.gov
7. CDC. Fruit and vegetable consumption among adults—United States, 2005. MMWR 2007;56(10);213-17.
8. US Departments of Agriculture and Health and Human Services. Dietary Guidelines for Americans 2005. [Online Access] http://www.health.gov/dietaryguidelines/
9. Guenther PM, Dodd KW, Reedy J, Krebs-Smith SM. Most Americans eat much less than recommended amounts of fruits and vegetables.J Am Diet Assoc. 2006 Sep;106(9):1371-9.
10. Bodor JN, Rose D, Farley TA, et al. Neighbourhood fruit and vegetable availability and consumption: the role of small food stores in an urban environment. Public Health Nutr 2007 Jul 6:1-8 .
11. French SA, Stables G. Environmental interventions to promote vegetable and fruit consumption among youth in school settings. Prev Med 2003;37(6 Pt 1):593-610.
12. Knai C, Pomerleau J, Lock K, McKee M. Getting children to eat more fruit and vegetables: a systematic review. Prev Med 2006;42(2):85-95.
13. Seymour JD, Yaroch AL, Serdula M, et al. Impact of nutrition environmental interventions on point-of-purchase behavior in adults: a review. Prev Med 2004;39(Supp 2):S108-36.
14. Pomerleau J, Lock K, Knai C, McKee M. Interventions designed to increase adult fruit and vegetable intake can be effective: a systematic review of the literature. J Nutr 2005;135:2486-95.
15. Ammerman AS, Lindquist CH, Lohr KN, Hersey J. The efficacy of behavioral interventions to modify dietary fat and fruit and vegetable intake: a review of the evidence. Prev Med 2002;35/1:25-41.
16. Sorensen G, Linnan L, Hunt MK. Worksite-based research and initiatives to increase fruit and vegetable consumption. Prev Med 2004;39(Supp 2):S94-100.
17. Campbell MK, Resnicow K, Carr C, et al. Process evaluation of an effective church-based diet intervention: Body & Soul. Health Educ Behav. 2006 [Online Access] http://heb.sagepub.com/cgi/rapidpdf/1090198106292020v1.pdf

Section III: Interventions and Strategies Addressing NPAO Target Areas Increased Consumption of Fruits and Vegetables January 2008
58
18. National Center for Education Statistics. Child care and early education program participation of infant, toddlers, and preschoolers. Washington: US Department of Education, 1996.
19. Morland K, Wing S, Diez Roux A, Poole C. Neighborhood characteristics associated with the location of food stores and food service places. Am J Prev Med 2002;22(1):23-29.
20. Pearson T, Russell J, Campbell MJ, Barker ME. Do ‘food-deserts’ influence fruit and vegetable consumption—cross-sectional study. Appetite 2005;45:195–97.
Fruit and Vegetable Strategy 1: Multi-component Interventions in Schools
Description
Studies of multi-component interventions to increase consumption of fruits and vegetables in schools have shown that these interventions affect fruit and vegetable consumption among children positively (1). The following are general characteristics of multi-component interventions in schools:
• A classroom curriculum that involves interactive learning through skill-building and problem-solving exercises that familiarize students with fruits and vegetables such as school gardens, exercises that teach them how to prepare these foods, and also how to promote them at home.
• Parental involvement, especially for primary-school-aged children. • Information on recipes, tips on purchasing and preparing fruits and vegetables at
home, and short family assignments. • Training for food service staff on the purchase, preparation, and promotion of
fruits and vegetables. • Training for teachers on nutrition education, fruit and vegetable promotion, and/or
how to integrate the intervention goals into existing curriculum. Examples • Active Programme Promoting Lifestyles Schools Study (APPLES) (2) The
intervention schools received the active programme promoting lifestyle education in schools (APPLES) that consisted of teacher training, modifications of school meals to increase fruits and vegetables, and the development and implementation of school action plans designed to promote healthy eating and physical activity over one academic year. The school action plans that targeted the health curriculum, physical education, tuck shops, and playground activities were developed based on their perceived needs. The intervention targeted the whole school community including parents, teachers, and catering staff. The increase in fruit and vegetable consumption was statistically significant among children in the intervention group compared to the control group (mean difference 0.3 servings/day).
• 5 a Day Power Plus Program (3) consists of four components: behavioral curricula
for the 4th and 5th grades, parental involvement/education, school food service changes, and industry support and involvement. The food service intervention encouraged consumption of fruits and vegetables through four strategies: 1) point-of-purchase promotion of fruits and vegetables, 2) enhancing the attractiveness of fruits

Section III: Interventions and Strategies Addressing NPAO Target Areas Increased Consumption of Fruits and Vegetables January 2008
59
and vegetables, 3) increasing the variety served, and 4) providing an additional fruit item on the days that a baked food was served. The industry component provided the produce, educational materials, and incentive materials. The increase in fruit and vegetable consumption was statistically significant among children in the intervention group compared to the control group (mean difference 0.4 servings/day).
• 5 a Day Power Play! Campaign (4) included two levels of interventions: school only and a more intensive school plus community involvement. The school only included a behavioral curricula for 4th and 5th grades, parental involvement/education, school food service changes, and industry support and involvement. The intensive school plus community involvement intervention group received the school only components plus independent work in classrooms, canteens, and with families, community youth organization activities, point-of-purchase education and promotion in produce markets, public service announcements on local television, and fruit and vegetable competitions sponsored by the fruit and vegetable industry. The increase in fruit and vegetable consumption was statistically significant among children in the intervention group compared to the control group (mean difference 0.7 servings/day).
• Planet Health (5) aims to improve activity and dietary behaviors among 6th, 7th, and 8th grade students. Planet Health uses an interdisciplinary curriculum approach, placing intervention materials in language, arts, math, science, social studies, and physical education classes, using grade-level and subject-appropriate skills and competencies. The Planet Health approach increases the efficiency of program delivery by using classroom teachers with minimal health education training to implement the materials. The program enhances its effectiveness by involving multiple classes and frequent use of different approaches to learning. The lessons on increased consumption of fruits and vegetables resulted in an increase in fruit and vegetable consumption that was statistically significant among children in the intervention group compared to the control group (mean difference 0.32 servings/day). Effectiveness
School-based interventions effectively improve fruit and vegetable consumption among participants. One systematic review of interventions to increase fruit and vegetable consumption found an increase in fruits and vegetables servings that ranged from 0.3 to 0.99 per day (1). The review included 14 school-based interventions. References 1. Knai C, Pomerleau J, Lock K, McKee M. Getting children to eat more fruit and vegetables: a
systematic review Preventive Med 2006;42: 85-95. 2. Sahota,P, Rudlof M, Dixey R, Hill A, Barth J, Cade J. Randomized controlled trial of primary
school based intervention to reduce risk factors for obesity. Br Med J. (Clinical Research edition) 2001;323(7320):1029-32.
3. Perry CL, Bishop DB, Taylor G, et al. Changing fruit and vegetable consumption among children: the 5-a-Day Power Plus program in St. Paul, Minnesota. Am J Public Health 1998;88(4):603-09.
Section III: Interventions and Strategies Addressing NPAO Target Areas Increased Consumption of Fruits and Vegetables January 2008
60
4. Foester S, Gregson J, Beall D, et al. 1998. The California children’s 5 a day power play! campaign: evaluation of large scale social marketing initiative. Fam Comm Health 1998;21:46-64.
5. Gortmaker S., Peterson K., Wiecha J, et al. 1999. Reducing obesity via a school-based interdisciplinary intervention among youth: planet health. Arch Ped. Adolesc Med
Fruit and Vegetable Strategy 2: Multi-component Interventions in Childcare Settings
Description Of the nation’s 21 million preschool-aged children, 13 million spend a substantial part of their day in childcare facilities (1). Given that food and physical activity preferences are formed early in life, childcare settings offer opportunities to develop and evaluate effective strategies to increase the consumption of fruits and vegetables among young children (2). However, few studies have been published. Efforts that may affect fruit and vegetable consumption in childcare settings include:
• Curricula that a) incorporate color, music, and the senses to teach children that healthy food and physical activity are fun and b) hand puppets used to initiate nutrition activities reflecting messages from the food pyramid.
• Parent component including newsletters and homework assignments for parents.
• Parent education with a focus on interactive cooking lessons and recipes that fit the topic of the lesson such as fruits and vegetables and dietary fiber.
• Staff training on the importance of healthy eating and physical activity for young children as well as for staff.
• Self-assessment of the childcare setting’s nutrition and physical activity environments.
Because there are few interventions, there are not general characteristics across interventions for this strategy. Examples • Nutrition and Physical Activity Self-Assessment for Child Care (NAP SACC (3,4) is
an environment and policy intervention that uses self-assessment by childcare centers and technical support provided by local health consultants to effect changes in the policies, practices, and environment for healthy eating and regular physical activity of children in childcare. The nutrition areas of focus included fruits and vegetables; fried food and high-fat meats; beverages; menus and variety; meals and snacks; food items outside of regular meals and snacks; supporting healthful eating; nutrition education for children, parents and staff; and nutrition policy. The center director completes a self-assessment instrument with help from key staff, such as the cook, teacher, or program planner. Based on the assessment the director chooses a key area to improve, such as availability of fruits and vegetables. Local health consultants then provide technical assistance on the key area. Results of this pilot study suggest that the intervention centers improved their scores on the self-

Section III: Interventions and Strategies Addressing NPAO Target Areas Increased Consumption of Fruits and Vegetables January 2008
61
assessment instrument and made tangible nutrition and physical activity environmental improvements, whereas comparison centers demonstrated minimal change. However, given the small sample size for the comparison group, it could not be concluded that the increase in total score on the self-assessment instrument was or was not statistically significant. A larger study is presently underway to test effectiveness of this intervention and look more closely at changes in fruit and vegetable consumption.
• Color Me Healthy (5) is a curriculum designed to promote physical activity and
healthful eating among children ages 4-5 through a variety of fun, interactive learning opportunities. Designed to be used in family daycare homes, Head Start classrooms, and childcare centers, the Color Me Healthy kit contains materials needed to implement the program. In North Carolina where the curriculum was developed by the state cooperative extension program, implementation among the state’s childcare agencies included training of childcare providers by cooperative extension personnel who partnered with county personnel. Childcare providers indicated that using Color Me Healthy increased the children’s knowledge about healthy eating. Of participating providers, 79.0% indicated that the children were more willing to try new foods, and 82.0% reported that the curriculum had improved fruit and vegetable recognition.
Effectiveness
Although childcare education can be a major force in shaping children's diet only a few published studies are available on behavioral and environmental approaches to increase consumption of fruits and vegetables in childcare settings. Additional studies are needed to confirm these positive findings from environmental self assessment tools and curricula. References 1. National Center for Education Statistics. Child care and early education program participation
of infant, toddlers, and preschoolers. Washington: US Department of Education, 1996. 2. Story M, Kaphingst KM, French S. The role of child care settings in obesity prevention. The
Future of Children 2006;16(1):143-68. 3. Ammerman A, Ward DS, Benjamin SE, et al. An intervention to promote healthy weight:
nutrition and physical activity self-assessment for child care (NAP SACC) theory and design. Prev Chron Dis (serial online) July 2007. (http://www.cdc.gov/pcd/issues/2007/jul/toc.htm)
4. Benjamin SE, Ammerman A, Sommers J, Dodds J, Neelon B, Ward DS. Nutrition and physical activity self-assessment for child care (NAP SACC): results from a pilot program. J Nutr Edu Behav 2007;39:142-49.
5. Dunn C, Thomas C, Ward D, Pegram L, Webber K, Cullitan C. Design and implementation of a nutrition and physical activity curriculum for child care settings. Prev Chronic Dis [serial online] 2006 Apr [date cited]. (http://www.cdc.gov/pcd/issues/2006/apr/05_0039.htm)

Section III: Interventions and Strategies Addressing NPAO Target Areas Increased Consumption of Fruits and Vegetables January 2008
62
Fruit and Vegetable Strategy 3: Multi-component Interventions in Worksites
Description Worksites offer access to a large portion of the adult population and serve as a vehicle for delivering interventions across multiple levels of influence (intrapersonal, interpersonal, and environmental) within one setting. Studies show that multi-component worksite interventions increase fruit and vegetable consumption among adults (1). The following are general characteristics of multi-component interventions in worksites:
• Nutrition-education strategies focusing on individuals include nutrition lectures and workshops as well as educational materials such as self-help manuals, personalized feedback, Web-based learning, and newsletters.
• Interpersonal approaches include combining education with social activities such as peer support and family-related activities.
• Environmental supports include nutrition displays, cafeteria point-of-purchase information, healthful food preparation or choices, and exposure to 5 a Day events.
• Environmental strategies to increase access to fruits and vegetables may include increasing healthful offerings in cafeterias, vending machines, and at meetings. Other environmental changes may include providing breakroom facilities for food preparation and storage (refrigerators).
• Polices include setting standards for food at meetings and in cafeterias. • Creation of worker-staffed advisory boards to plan and implement interventions.
Examples
• Treatwell 5 a Day (2) used an advisory board, a core education program (18 sessions), cafeteria point-of-purchase labeling, behavior change strategies, health fairs, taste tests, and food and cooking demonstrations. The Treatwell 5 a Day program has a family-support component, including the use of a family learn-at-home program, family newsletter, and annual family picnic. Outcome measures showed that workers receiving family support fared better than those who did not. The increase in fruit and vegetable consumption was statistically significant among in the intervention group compared to the control group (mean difference 0.48 servings/day).
• Health Works for Women (HWW) (3) was a 5-year worksite promotion intervention that focused on rural, blue-collar women working in small- to medium-size manufacturing industries. The two-pronged intervention included individualized computer-tailored “women’s magazines” that provided 1) personalized feedback, strategies for change and community resource information, and 2) a natural helpers intervention that trained women in the workplace to diffuse information and provide support for healthy behavior changes. The increase in fruit and vegetable
Section III: Interventions and Strategies Addressing NPAO Target Areas Increased Consumption of Fruits and Vegetables January 2008
63
consumption was statistically significant among the intervention group compared to the control group (mean difference 0.7 servings/day).
Effectiveness
Worksite interventions have been shown to effectively increase fruit and vegetable consumption among diverse ethnic groups as well as the general population. These efforts can improve dietary practices with positive effects on dietary fat and fiber as well as fruit and vegetable consumption. One systematic review of interventions to increase fruit and vegetable consumption found an increase in fruits and vegetables servings that ranged from 0.13 to 0.70 per day (1). The review included 11 worksite interventions. References 1. Pomerleau J, Lock K, Knai C, McKee M. Interventions designed to increase adult fruit and
vegetable intake can be effective: a systematic review of the literature. J Nutr 2005;135(10):2486-95.
2. Sorensen G, Stoddard A, Peterson K, et al. Increasing fruit and vegetable consumption through worksites and families in the Treatwell 5-a-day study. Am J Public Health 1999;89:54-60.
3. Campbell MK, Tessaro I, Devellis B, et al. Effects of a tailored health promotion program for female blue-collar workers: Health Works for Women. Prev. Med 2002;34:313-32.
Fruit and Vegetable Strategy 4: Multi-component Interventions in Faith-Based Organizations
Description Studies show that multi-component interventions in faith-based organizations increase fruit and vegetable consumption among adults (1). Faith-based organizations offer access to a large portion of the adult population and serve as a vehicle for delivering interventions across multiple levels of influence. However, few studies have been published. Efforts that may affect fruit and vegetable consumption in faith-based settings include:
• Use of peer education, lay advisors, lectures, workshops, and speakers • Motivational interview phone calls that provide personal counseling and
education • Printed materials such as cookbooks and videos on fruits and vegetables that
use spiritual messages • Nutrition displays and promotions in the cafeteria as well as healthy choices in
the cafeteria • Pastor support and community involvement
Because there are few interventions, there are not general characteristics across

Section III: Interventions and Strategies Addressing NPAO Target Areas Increased Consumption of Fruits and Vegetables January 2008
64
interventions for this strategy.
Examples
• Black Churches United for Better Health (BCUBH) (2) was an intervention trial that aimed at increasing availability of fruits and vegetables at church functions and grocery store promotions; produced computer-tailored newsletters; and provided lay health advisors who conducted education sessions and cooking classes and distributed printed education materials. The pastor also gave support to the project. The increase in fruit and vegetable consumption was statistically significant among the intervention group compared to the control group (increase of 0.85 servings/day).
• Eat for Life (3) was a intervention trial to increase fruit and vegetable consumption
that included Eat for Life self-help (SH group) materials and motivational interview (MI group) phone calls. The self-help materials consisted of an Eat for Life cookbook that contained recipes from church members and the video “ Forgotten Miracles.” The cookbook also included information about the health benefits of fruits and vegetables, tips for shopping and storing fruits and vegetables, and cooking techniques. The video “Forgotten Miracles” promoted fruit and vegetable consumption using both spiritual and secular motivational messages. Dieticians conducted three motivational interview phone calls with each participant. The increase in fruit and vegetable consumption was statistically significant among the intervention group compared to the comparison group. The net difference between the MI group and the comparison group was around 1.2 servings/day and the net difference between the MI and SH groups was around 1.0 servings/day.
• Body and Soul (4) is a intervention that was developed using key components of the
Black Churches United for Better Health and the Eat for Life interventions. The Body and Soul intervention includes churchwide nutrition interventions, self-help materials, and motivational interviewing. The churchwide activities include a kick-off event, development of a project coordination committee, at least three churchwide nutrition events plus one additional event involving the pastor, and at least one policy change. The self-help materials include the Eat for Life cookbook and the video “Forgotten Miracles.” Lay counselors conduct two motivational interview phone calls with each participant. The increase in fruit and vegetable consumption was statistically significant among the intervention group compared to the control group. Post-test differences were 0.7 and 1.4 servings for the 2-item and the 17-item fruit and vegetable frequency measures, respectively.
Effectiveness These three interventions in African American churches produced an increase in fruit and vegetable consumption from 0.7 to 1.4 servings per day (1).

Section III: Interventions and Strategies Addressing NPAO Target Areas Increased Consumption of Fruits and Vegetables January 2008
65
References 1. Pomerleau J, Lock K, Knai C, McKee M. Interventions designed to increase adult fruit and
vegetable intake can be effective: a systematic review of the literature. J Nutr 2005;135(10):2486-95.
2. Campbell MK, Motsinger BM, Ingram A, et al. The North Carolina Black Churches Uniter for Better Health Project: Intervention and process evaluation. Health Educ Behav 2000;27:241-53.
3. Resnicow K, Jackson A, Wang T, Dudley W, Baranowski T. A motivational interviewing intervention to increase fruit and vegetable intake through black churches: results of the Eat for Life Trial. Am J Public Health 2001;91:1686-93.
4. Resnicow K, Campbell MK, Carr C et al. Body and Soul. A dietary intervention conducted through African-American churches. Am J Preventive Med 2002;27(2):97-105.
Fruit and Vegetable Strategy 5: Multi-component Interventions in Health Care Settings
Description
Multi-component interventions in the health care setting can improve fruit and vegetable consumption. This strategy aims to influence dietary behavior primarily on the individual and interpersonal level (1). Nutrition information is often prepared on the basis of theoretical constructs such as stages of change, transtheoretical model, or the health belief model (1). The following are general characteristics of multi-component interventions in healthcare:
• Individual approaches that may consist of dietary assessment followed by tailored counseling, computer-tailored messages, personalized letters, role-playing, teaching self-monitoring, training to overcome barriers to selecting healthful foods, goal-setting, and guidance in food shopping and preparation (1).
• Interpersonal approaches that often include social support via cooking workshops, food demonstrations, lectures, discussion groups, and field trips to grocery stores or farmers’ markets (2).
Examples
• Puget Sound Eating Patterns Study (PEP) (3) was a tailored, multi-component self-help intervention designed to promote lower fat consumption and increase fruit and vegetable consumption among enrollees of a large health maintenance organization. The tailored self-help intervention included a manual that provided information about short- and long-term benefits of increasing fruit and vegetable consumption, information about grocery shopping, dining out, and modifying meals to increase fruit and vegetable consumption. The specialized dietary-change materials included tip sheets, refrigerator magnets, recipe cards, shopping lists, and self-evaluations. Each participant received a dietary analysis and a computer-tailored letter with motivational and behavioral feedback based on the diet analysis as well as one motivational interview phone call. In addition, semi-monthly newsletters were sent to participants.

Section III: Interventions and Strategies Addressing NPAO Target Areas Increased Consumption of Fruits and Vegetables January 2008
66
• Computer-Tailored Print Materials: A study (4) was conducted among healthy adults enrolled in a North Carolina health maintenance organization to determine the effectiveness of different computer-tailored nutrition newsletters to improve the number and variety of fruits and vegetables consumed. The intervention groups received non-tailored nutrition newsletters, tailored nutrition newsletters without a goal-setting component, or tailored nutrition newsletters with a tailored goal-setting component. All newsletters contained strategies for improving fruit and vegetable consumption. Tailored newsletters used computer algorithms to match a person's baseline survey information with the most relevant newsletter messages for promoting dietary change. All three newsletter groups had significantly higher daily intake and variety scores compared with the control group. Although there was a trend of improved intake and variety with each added newsletter element, there were no significant differences at follow-up among the newsletter groups. Effectiveness
Multi-component Interventions based in health care settings have been shown to modestly increase fruit and vegetable intake among adults eligible for primary care. Increases in fruit and vegetable consumption vary with the type of intervention. One systematic review of interventions to increase fruit and vegetable consumption found an increase in fruits and vegetables servings that ranged from 0.1 to 1.4 servings per day (1). The review included nine healthcare interventions. More impact was found with adults at risk for diet-related chronic disease and adults motivated to make dietary changes (2). References 1. Pomerleau J, Lock K, Knai C, McKee M. Interventions designed to increase adult fruit and
vegetable intake can be effective: a systematic review of the literature. J Nutri 2005;135(10):2486-95.
2. Matson-Koffman DM, Brownstein JN, Neiner JA, Greaney ML. A site-specific literature review of policy and environmental interventions that promote physical activity and nutrition for cardiovascular health: what works? Am J Health Promotion 2005;19(3):167-93.
3. Kristal AR, Curry SJ, Shattuck AL, et al. A randomized trial of tailored, self-help dietary intervention: the Puget Sound Eating Patterns study. Prev Med 2000:31:380-89.
4. Lutz SF, Ammerman AS, Atwood JR, et al. Innovative newsletter interventions improve fruit and vegetable consumption in healthy adults. J Am Diet Assoc 1999;99:705-09.

Section III: Interventions and Strategies Addressing NPAO Target Areas Increased Consumption of Fruits and Vegetables January 2008
67
Fruit and Vegetable Strategy 6: Increasing Access to Fruits and Vegetables
Description Increasing access makes it easier for people to obtain fruits and vegetables. To date, research has focused on defining the relationship between where people live and their access to fruits and vegetables. Little research has evaluated the impact of policy and environmental changes designed to increase access to fruits and vegetables. Factors related to access of fruits and vegetables include geographic accessibility (e.g., the distance to stores), the type of food retailer in the vicinity (e.g., supermarkets, small stores, or farmers’ markets), as well as access to homegrown or local produce. In some communities, food access is a transportation problem. Increasing access in these communities includes making sure people can get to food-service outlets that offer fruits and vegetables, either by ensuring that public transportation is available or by bringing food retailers to their neighborhood (1,2). Communities are seeking innovative ways to improve food access through solutions that focus on improving transportation options, supporting urban agriculture and farmers’ markets, and expanding food options at the corner grocery store. However, few studies have been published. Practical strategies that may increase the access to fruits and vegetables include:
• Local Food Policy Committees that represent a wide range of organizations with a stake in the local food system that develop policies to improve access to fruits and vegetables and support local agriculture.
• Economic and urban planning land-use policies that include establishing new grocery stores, improving convenience stores, and promoting community gardens and farmers’ markets.
• Federal and local transportation policies that support walking, bicycling, and public transit to grocery stores and to farmer’s markets.
• Direct marketing of farm-to-plate policies and programs, such as community-supported agriculture, farm-to-work and farm-to-school programs, and farmers’ markets.
Because there are few interventions, there are not general characteristics across interventions for this strategy.
Examples
• Penrith Food Project (1) is a case study of a 10-year evolution of a local intersectoral project designed to improve components of a community’s food system as an approach to improving nutrition. The project established a standing Food Policy Committee, which plans and oversees project implementation and promotes local food system reform consistent with community nutrition objectives. Members of the Food Policy Committee are directors or supervisors representing a wide range of organizations with a stake in the local food system. The five key areas identified by the Food Policy Committee were 1) improving access to food retail outlets and related transportation services, 2) expanding the availability of healthy choices in food outlets and food services, 3) increasing community facilities and support for breastfeeding, 4) promoting local agriculture, and 5) increasing the safety of food
Section III: Interventions and Strategies Addressing NPAO Target Areas Increased Consumption of Fruits and Vegetables January 2008
68
sold. Policies that the Food Policy Committee developed cover food access in planning new housing developments; home-delivery fruit and vegetable services; establishment of fruit stands in business districts; home-delivery of groceries for homebound seniors; and bus route changes to improve access to grocery stores.
• Philadelphia Food Marketing Task Force (3) is a group convened by the city council to research the lack of supermarkets in Philadelphia. The Task Force released a report, "Stimulating Supermarket Development: A New Day for Philadelphia," containing ten recommendations to increase the number of supermarkets in Philadelphia's underserved communities. The Philadelphia Food Marketing Task Force has also inspired two new state-level financing tools for supermarket development and support of local agriculture, the Fresh Food Financing Initiative and First Industries. The Fresh Food Financing Initiative is using a $20-million infusion of public funds to leverage an $80-million financing pool for supermarket development. So far the fund has contributed to the establishment of eight new grocery stores. First Industries is an economic stimulus program that provides grants, loans, and loan guarantees to agriculture-related business.
• Farmers’ Market Salad Bar Program (4) was launched in 1997 by the Santa Monica-
Malibu Unified School District (SMMUSD) at McKinley Elementary School. The program was designed to incorporate fresh locally grown fruits and vegetables into the district's school lunch program. The pilot program had the dual purpose of increasing students' consumption of fresh fruit and vegetables and supporting local farmers by purchasing produce directly from them at local farmers’ markets. On the basis of the 1997 pilot project, the program was expanded in the SMMUSD district by the year 2000 from one to 11 schools—nine elementary schools and two middle schools. As the Santa Monica-Malibu salad bar program progressed, project evaluation showed that the model was economically viable from the district's point of view and provided a consistent income to local farmers.
• The Seniors Farmers' Market Nutrition Program (SFMNP) (5) provides vouchers to
low-income seniors for use at local farmers' markets. The purposes of the vouchers are to 1) provide resources in the form of fresh, nutritious, unprepared, locally grown fruits, vegetables, and herbs; 2) increase the domestic consumption of agricultural commodities by expanding or aiding in the expansion of domestic farmers' markets, roadside stands, and community support agriculture programs; and 3) develop or aid in the development of new and additional farmers' markets, roadside stands, and community support agriculture programs. Farmers reported benefits from the program, have a positive attitude about it, and are willing to make certain accommodations to participate in it again. Effectiveness
Although there is agreement that policy and environmental changes to increase fruit and vegetable consumption are important, few published studies are available to document their effectiveness in changing fruit and vegetable consumption. Policy and environmental interventions to increase fruit and vegetable consumption need to be created and evaluated.

Section III: Interventions and Strategies Addressing NPAO Target Areas Increased Consumption of Fruits and Vegetables January 2008
69
References 1. Webb K, Hawe P, Noort M. Collaborative intersectoral approaches to nutrition in a community
on the urban fringe. Health Educ Behav 2001;28(3):306-19. 2. Robert Wood Johnson Foundation. Community design for healthy eating: how land use and
transportation solutions can help. 2006 [Online Access] www.rwjf.org/pdf/CommunityDesignHealthyEating
3. Burton H, Duane P. Stimulating supermarket development: a new day for Philadelphia. Philadelphia: The Food Trust, 2004. [Online Access] http://www.thefoodtrust.org/catalog/resource.detail.php?product_id=47
4. Mascarenhas M, Gottlieb R. The farmers market salad bar: assessing the first three years of the Santa Monica-Malibu Unified School District program. Los Angeles:Occidental College Community Food Security Project, 2000:14-17.
5. Kunkel M, Luccia B, Moore A. Evaluation of the South Carolina seniors farmers' market nutrition education program. J Am Diet Assoc 2003;103:880-83.
Fruit and Vegetable Strategy 7: Increasing Availability of Fruits and Vegetables
Description Increasing the availability, variety, and convenience of fruits and vegetables are important policy and environmental strategies to increase consumption. Availability focuses on the number and types of fruits and vegetables offered. Increasing the availability of fruits and vegetables can be achieved through a variety of ways such as training food-service staff on how to make existing menu items more healthful by adding fruits and vegetables, and partnering with the food system to provide more fruit and vegetable options such as in retail outlets including restaurants, food courts, cafeterias, lunch wagons, deli counters, take-out food sources, bars and coffee shops that serve food and food service businesses and catering services (1-4). However, few studies have been published. Practical strategies that may increase the availability to fruits and vegetables include:
• Marketing of food products such as bagged, prewashed spinach and salad or “snack-pack” baby carrots and celery sticks, which provide consumers with convenient preparation and take-out options.
• Modifications of school food service menu options to improve the variety and quality of fruits and vegetables including salad bars and a la carte options.
• Modifications of worksite cafeteria menu options and vending machine policies to increase the availability of fruits and vegetables.
• Modification of menu options by restaurants and other food establishments to include more fruits and vegetables in mixed dishes, salad bars, and broth-based soups; and adding more green salads as appetizers and a variety of fruit as dessert options to provide people with healthier choices.
• Promoting more variety of fruits and vegetables in grocery stores including increased placement and shelf space with or without labeling and signage strategies.

Section III: Interventions and Strategies Addressing NPAO Target Areas Increased Consumption of Fruits and Vegetables January 2008
70
• Increasing fruit and vegetable offerings in other retail food markets such as farmers markets.
Because there are few interventions, there are not general characteristics across interventions for this strategy.
Examples
• 5 a Day Power Plus Program (5) consisted of four components: behavioral curricula for the 4th and 5th grades, parental involvement and education, school food service changes, and industry support and involvement. The food service intervention encouraged consumption of fruits and vegetables via four strategies: 1) point-of-purchase promotion of fruits and vegetables, 2) enhancing the attractiveness of fruits and vegetables, 3) increasing the variety served, and 4) providing an additional fruit item on the days that a baked food was served. The industry component provided the produce, educational materials, and incentive materials. The increase in fruit and vegetable consumption was statistically significant among children in the intervention group compared to the control group (mean difference 0.4 servings/day).
• The North Karelia Project (6) was launched in Finland in 1972-1977 in response to
the local petition to get urgent and effective help to reduce the great burden of exceptionally high coronary heart disease mortality rates in the area. The intervention used multiple strategies: from innovative media and communication activities and systematic involvement of primary health care to environmental and policy changes in collaboration with food industry and agriculture. An innovative intervention example was the berry project. Over the years, many people voiced concerns about the dietary aims of the project in the area, which was initially strongly devoted to dairy farming. With people sharply reducing their consumption of butter and fatty dairy products, economic problems emerged for dairy farmers and the dairy industry. People were also unsatisfied with the message promoting the consumption of products that were mostly imported, such as fruit and vegetables. During these discussions, the community and project representatives considered the feasibility of growing berries in the northern climate. This led to a major collaborative project between berry farmers, industry, various commercial sectors and the health authorities, which was financed by the Ministry of Agriculture and the Ministry of Commerce. Sales campaigns, new product development and various supportive activities were also involved, in addition to education. Local berry consumption rose gradually, and many farmers switched from dairy to berry production.
• A supermarket study (7) examined the retail price, newspaper advertising, display
space, and display location quality for selected fruits and vegetables using a fractional factorial research design in four large supermarkets. The resulting impact on rates of sale was analyzed for four classes of items; hard fruit, cooking vegetables, salad vegetables, and soft fruit. The “bonus space” for products in stores increased sales, and improving the quality of the foods' locations significantly increased sales of hard fruit and cooking vegetables.

Section III: Interventions and Strategies Addressing NPAO Target Areas Increased Consumption of Fruits and Vegetables January 2008
71
Effectiveness
Evidence suggests that increasing that availability of healthful food can improve eating habits in a variety of settings and among diverse populations (5-8). In many cases, this strategy has been combined with other healthful-eating strategies, such as point-of-purchase labeling or economic incentives. Additional studies are needed to confirm these positive findings. References 1. Brownson RC, Haire-Joshu D, Luke DA. Shaping the context of health: a review of
environmental and policy approaches in the prevention of chronic diseases. Ann Rev Public Health 2006;27:341-70.
2. French SA, Wechsler H. School-based research and initiatives: fruit and vegetable environment, policy, and pricing workshop. Prev Med 2004;39:S101-S107.
3. Glanz K, Yaroch AL. Strategies for increasing fruit and vegetable intake in grocery stores and communities: policy, pricing, and environmental change. Prev Med 2004;39:S75-S80.
4. NSW Centre for Public Health Nutrition. Best options for promoting healthy weight and preventing weight gain in NSW. March 2005 [Online Access] http://www.health.nsw.gov.au/pubs/2005/pdf/healthyweight.pdf
5. Perry CL, Bishop DB, Taylor G, et al. Changing fruit and vegetable consumption among children: the 5-a-Day Power Plus program in St. Paul, Minnesota. Am J Public Health 1998;8 (4):603-09.
6. Puska P, Pietinen P, Uusitalo U. Part III. Can we turn back the clock or modify the adverse dynamics? Programme and policy issues Influencing public nutrition for non-communicable disease prevention: from community intervention to national programme – experiences from Finland. Public Health Nutrition: 5(1A), 245–251. http://www.cpc.unc.edu/nutrition_transition/private/papers/PHNPekka-Finland.pdf
7. Curhan RC. The effects of merchandising and temporary promotional activities on the sales of fresh fruits and vegetables in supermarkets. J Market Res 1974;11:286–94.
8. Glanz K, Hoelscher D. Increasing fruit and vegetable intake by changing environments, policy, and pricing: restaurant-base research,strategies, and recommendations. Preve Med 2004;39:S88-S93.
Fruit and Vegetable Strategy 8: Economic Incentives
Description The cost or affordability of fruits and vegetables is a commonly cited reason why consumers do not eat more of these healthy foods (1). Economic incentives that consist of pricing policies are strategies that are geared toward increasing the sales and/or consumption of healthful foods such as fruits and vegetables. Economic incentives usually take the form of reduced prices, discount coupons, vouchers redeemable for fruit and vegetable purchases, or bonuses tied to the purchase of fruits and vegetables. Bonuses and voucher approaches used by Food Stamps and WIC are expected to influence food choice through the price effect (effectively lowering the price of fruits and

Section III: Interventions and Strategies Addressing NPAO Target Areas Increased Consumption of Fruits and Vegetables January 2008
72
vegetables) and the income effect (giving the participant additional income to spend on food). Often economic incentives are combined with other healthful-eating strategies, such as point-of-purchase labeling or nutrition education. However, few studies have been published. Practical economic incentive strategies that may affect fruit and vegetable consumption include:
• Price reductions of fruits and vegetables in a worksite cafeteria. • Price reductions of fresh fruits and vegetables in a school cafeteria. • Food Stamp pilot bonus program providing participants with additional financial
bonuses for every $1 of food stamps spent on fresh produce. • WIC and supplemental food program vouchers redeemable for fruit and vegetable
purchases at grocery stores and farmers’ markets. Because there are few interventions, there are not general characteristics across interventions for this strategy.
Examples
• Fruit and Salad Purchases in a Worksite Cafeteria (2): This intervention involved two changes from usual cafeteria service. First, the selection of fruits and salad bar choices was increased. Six fruit choices were made available daily throughout the intervention period rather than three, and three additional fresh vegetables were added to the salad bar. Second, the price of salad and fruit was reduced by 50%, from 50 to 25 cents for a piece of fruit and from four to two dollars per pound for salad. The intervention was advertised by posting signs in the cafeteria daily and by a flyer placed in each employee’s mailbox. Fruit and salad purchases increased threefold in the intervention period compared to those in the nonintervention period.
• Fruit and Salad Purchases in a School Cafeteria (3): The intervention component of
the study of this intervention involved two changes from the usual high school cafeteria service. First, baby carrots were a new item that was offered to students. Second, the prices for fresh fruit, baby carrots, and salad purchases were reduced by 50%. During the low-price period, attractive signs promoting the target items were placed near the area where fruit, carrots, and salad were sold. In addition, public address announcements were made during the first week of the low-price period. Fruit sales increased about fourfold, carrot sales increased about twofold, and there was no significant intervention effect on sales of salad during the low-price period. These intervention results suggest that lower pricing for fruits and vegetables with minimal promotion increases the sales of these items among high schools students.
• Healthy Purchase Program (4) is a pilot bonus program passed by the California
legislation. Under this program, for every $1 of food stamps spent on fresh produce, participants receive a specified portion back as a bonus. These bonus or voucher approaches could be expected to influence food choices through a price effect (they lower the price of the target food) and through an income effect (they give the participant additional income to spend). If price is the barrier to fruit and vegetable consumption, lower prices should result in food stamp households purchasing more

Section III: Interventions and Strategies Addressing NPAO Target Areas Increased Consumption of Fruits and Vegetables January 2008
73
fruits and vegetables. This bonus program includes nutrition education related to fruits and vegetables that may increase the likelihood that food stamp participants will use the additional income to purchase more fruits and vegetables.
• WIC in Los Angeles County (5): The Special Supplemental Nutrition Program for
Women, Infants, and Children (WIC) in Los Angeles conducted a study of the impact of vouchers for purchasing fresh fruits and vegetables among low-income mothers. WIC mothers were issued $10 worth of vouchers per week to buy produce of the participant’s choice at either a supermarket or a year-round farmers’ market. Participants’ consumption of fruits and vegetables and the redemption rates of the vouchers were tracked over the 14-month period of the study. The redemption rates for the farmers’ market and the supermarket were similar, 90.7% and 87.5%, respectively. Overall, participants reported purchasing 27 and 26 different fruits and 34 and 33 different vegetables in the farmers’ market and supermarket, respectively. These high redemption rates and the larger numbers of different produce consumed confirmed that low-income families highly value the ability to purchase and consume a wide variety of fresh produce.
Effectiveness
There is evidence that economic incentives in the form of reduced prices can increase sales and/or consumption of fruits and vegetables (2-5). Additional studies are needed to confirm these positive findings. References 1. Guthrie JF. Understanding fruit and vegetable choices: economic and behavioral influences.
November 2004: USDA, Economic Research Service [Online Access\ http://www.ers.usda.gov/publications/aib792/aib792-1/
2. Jeffery RW, French SA, Raether C, Baxter JE. An environmental intervention to increase fruit and salad purchases in a cafeteria. Preventive Med 1994;23 (6):788-92.
3. French SA, Story M, Jeffery RW, et al. Pricing strategy to promote fruit and vegetable purchase in high school cafeterias. J Am Diet Asso 1997;97(9):1008-10.
4. Guthrie JF, Frazao E, Andrews M, Smallwood D. Improving food choices–can food stamps do more? USDA, Economic Research Service: Amberwaves April 2007. [Online Access]
http://www.ers.usda.gov/AmberWaves/April07/Features/Improving.htm 5. Herman DR, Harrison GG, Jenks E. Choices made by low-income women provided with an
economic supplement for fresh fruit and vegetable purchase. J Am Dietetic Asso 2006;106(5):740-44.
Target Area: Decrease Consumption of Sugar-Sweetened Beverages
Background and Rationale A large proportion of added sugar in the American diet comes from the consumption of sugar-sweetened beverages (SSB). From 1994–1996, approximately one-third of added sugar intake came from regular (non-diet) carbonated soft drinks and 10% came from regular fruit drinks/ades and punches (not 100% juice) (1). Soft drink intake has increased dramatically since the 1970s. The percentage of youth who consumed any carbonated soft drinks (regular and low calorie) increased from 37% in 1977–1978 to 56% in 1994–1998. Among adults, consumption of carbonated soft drinks (regular and low calorie) and fruit drinks/ades (not 100% juice) increased by at least 100% between 1977–1978 and 1994–1995 (1). While restaurants, fast food outlets, and vending machines frequently promote and sell carbonated soft drinks, data from the National Food Consumption Survey (NFCS) show that the home is where most children and youth aged 6-17 years of age obtained carbonated soft drinks. During 1994-1998 34% of youth obtained soft drinks at home. Carbonated soft drinks are also widely available in schools; the 2006 School Health Policies and Programs Study (SHPPS) reported that 12.9% of elementary schools, 28.7% of middle schools, and 58.2% of high schools allowed students to purchase soda, fruits drinks that are not 100% juice, or sports drinks from a vending machine or in a school store, canteen, or snack bar during lunch periods. Beverage companies use extensive advertising and marketing to increase consumption of sugar-sweetened beverages. A 2006 report from the Institute of Medicine concluded that intensive advertising to children and youth influences children’s preferences and their requests for high-calorie and low-nutrient-dense foods and beverages (2). Additionally, other studies have shown that portion sizes of SSB have increased over time, as has access to SSB in restaurants, vending machines, schools and the home (1). Larger portion sizes and increased access to SSB can lead to excessive caloric intake. Furthermore, studies suggest that people do not compensate for the additional calories they consume from SSBs by reducing calorie intake from other foods, and this can also result in excess total calorie intake (3,4). Potential health problems associated with high intake of sugar-sweetened beverages include weight gain, overweight, or obesity as a result of the additional calories in the diet (1); displacement of milk consumption which can contribute to reduced calcium intake with an attendant risk of osteoporosis and fractures (5,6); displacement of other key nutrients (5,6); and dental caries and potential enamel erosion (7). Several longitudinal observational and experimental studies among adults and youth have found a positive association between intake of SSB and body weight or body mass index (1). Decrease Consumption of Sugar-Sweetened Beverages: Intervention Strategies
Description
Section III: Interventions and Strategies Addressing NPAO Target Areas Decrease Consumption of Sugar-Sweetened Beverages January 2008
74
While evidence supports the association between consumption of sugar-sweetened beverages and increased caloric intake and weight gain, the number of published interventions designed to reduce intake of sugar-sweetened beverages is limited, and

Section III: Interventions and Strategies Addressing NPAO Target Areas Decrease Consumption of Sugar-Sweetened Beverages January 2008
75
the interventions have had varying success (1). CDC’s 2006 publication, Does drinking beverages with added sugars increase the risk of overweight? (Research to Practice Series, Number 3) (1) examines the relationship between drinking beverages with added sugar and weight management. Six interventions to reduce the intake of sugar-sweetened beverages are evaluated in this research to practice report. These interventions included changes in the home and school environments, behavioral counseling, a school-based curriculum, a day camp, a family-based intervention, and a after-school program. Environmental changes to reduce the intake of sugar-sweetened beverages in the home-based and school-based interventions include making water and low-calorie beverages the easy choice by ensuring that water and low-calorie beverage options are available and limiting access to sugar-sweetened beverages (8,9). The school-based curriculum, after-school programs, and the day camp program included interactive sessions on decreasing consumption of sugar-sweetened beverages and drinking more water (10-13). The home-based program also included monthly calls to provide motivational counseling (8). In recent years, efforts to limit the availability and sale of sugar-sweetened beverages in schools have ranged from legislation affecting all schools in a particular state to changes in a single school setting. The federal government, beverage companies, parents and schools are working to improve school environments. The American Beverage Association (ABA) is working with the Alliance for Healthier Generation to implement the School Beverage Guidelines that limit the number of calories in beverage products. The ABA and the three companies (Cadbury Schweppes Americas Beverages, Coca-Cola, and PepsiCo) will encourage their bottlers to work with schools and school districts to amend existing contracts to change the product mix to include only beverages included in the policy. The ABA with the Alliance for Healthier Generation will encourage independent food and beverage distributors to adopt this policy by the 2009-2010 school year. Beginning in August 2007 and annually thereafter, the ABA will support an annual analysis that will disclose the status of this initiative. In addition, the recently published IOM report, Nutrition Standards for Foods in Schools: Leading the Way Toward Healthier Youth includes school nutrition standards that limit the availability of low-nutrition, high-calorie competitive foods and beverages (14). The term “competitive foods” refers to all foods and beverages sold outside of the federal school lunch and breakfast programs in venues such as vending machines, a la carte offerings in the cafeteria, snack bars, school stores and fundraisers. The nutrition standards take into account the varying needs and responsibility of children and teens—for example, by limiting the sale of caffeine-free diet soda in high schools after school only, and by recommending smaller juice portions for younger children. Because there are few interventions, there are not general characteristics across interventions for this strategy.
Examples
• A home-based intervention (8) for 13- to 18-year-old adolescents who regularly consumed SSBs was implemented during a 25-week period and included an environmental component to reduce access to sugar-sweetened beverages (soft drinks, juice drinks, punches, lemonades, iced teas, and sports drinks) and provided behavioral counseling. Non-caloric beverages were sent to the participants’ households based on participant selection of bottled water and diet

Section III: Interventions and Strategies Addressing NPAO Target Areas Decrease Consumption of Sugar-Sweetened Beverages January 2008
76
beverages. Participants received motivational counseling to help them reduce their intake of SSBs through monthly phone calls. The home-based intervention reduced the consumption of sugar-sweetened beverages by 82% in the intervention group and there was a significant change in BMI among intervention participants at the upper-baseline BMI tertile.
• A four-year school-based intervention (9) promoted environmental change that
reduced availability of SSBs among Native American high school students. The intervention was designed to enhance students’ knowledge of diabetes, increase their physical activity and their fruit and vegetable intake, and reduce consumption of SSBs. At the study’s outset, sugar-free drinks were not available in school vending machines and palatable drinking water was not available at the school because the water source was high in sulfur and iron. As a result, students relied on soft drinks rather than water as the main source of dietary fluids (15). The intervention provided palatable water in coolers for students; sugar-free drinks were added to vending machines in years 1 and 2; and only sugar-free beverages were available in years 3 and 4. A comparison of the percentage of sugar-sweetened beverages consumed by Zuni youth in year 1 versus year 3 reveals a statistically significant change in consumption patterns. By year 3, students were consuming virtually no sugar-sweetened beverages at school, down from 24 ounces/week/student of sugar-sweetened beverages at the start of the intervention. Sugar-sweetened beverages were replaced by 24 ounces/week/student of water from the water coolers and 7.8 ounces/week/student of diet soda.
• A year-long curriculum intervention (10) in England for children 7-11 years of age provided four one-hour sessions, one in each of four academic terms. The curriculum focused on reducing the intake of “fizzy” drinks (sweetened and unsweetened), and promoting a healthy diet including drinking water. The curriculum incorporated health messages promoting water consumption, demonstrations of the effect of carbonated soft drinks on tooth enamel, a music competition, art activities, and a classroom quiz based on a popular television game. The mean carbonated soft drink (sweetened and unsweetened) intake was reduced over 3 days by 0.6 glasses/3 days in the intervention group and increased by 0.2 glasses/3 days in the control group.
Effectiveness
In four of the six intervention studies (8-13), a statistically significant decrease in consumption of sugar-sweetened beverages was achieved after participating in the interventions. The two studies that did not show a significant decrease in consumption of sugar-sweetened beverages were intervention sites included in the Girl’s Health Enrichment Multi-site Studies (GEMS). The school-based curriculum and home-based interventions reduced the intake of carbonated drinks (sweetened and unsweetened) or decreased the energy intake of sugar-sweetened beverages while the environmental intervention decreased the

Section III: Interventions and Strategies Addressing NPAO Target Areas Decrease Consumption of Sugar-Sweetened Beverages January 2008
77
availability of sugar-sweetened beverages. While the results of these interventions are promising, they are not conclusive and more research is needed. References 1. Division of Nutrition and Physical Activity. Does drinking beverages with added sugars
increase the risk of overweight? (Research to Practice Series No. 3) Atlanta: Centers for Disease Control and Prevention, 2006. [On-line Access] http://www.cdc.gov/nccdphp/dnpa/nutrition/health_professionals/practice/index.htm
2. Institute of Medicine. Food marketing to children and youth: threat or opportunity. Washington, DC: National Academies Press, 2006.
3. Mattes RD. Dietary compensation by humans for supplemental energy provided as ethanol or carbohydrate in fluids. Physiology & Behavior 1996;59(1):179-87.
4. DiMeglio D, Mattes R. Liquid versus solid carbohydrate: effects on food intake and body weight. Int J Obesity & Rel Metab Dis 2000;24(6):794-800.
5. Institute of Medicine. Preventing childhood obesity: health in the balance. Washington, DC: National Academies Press, 2005.
6. American Academy of Pediatrics. Soft drinks in schools. Pediatr. 2004;113(1):152-54. 7. Marshall TA, Levy SM, Broffitt B, et al. Dental caries and beverage consumption in young
children. Pediatr 2003;112:e183-e191. [On-line Access] http://www.pediatrics.rg/cgi/content/full/112/3/e184.
8. Ebbeling CB, Feldman HA, Osganian SK, et al. Effects of decreasing sugar-sweetened beverage consumption on body weight in adolescents: a randomized, controlled pilot study. Pediatr 2006;117(3):673-80.
9. Ritenbaugh, C, Teufel-Shone NI, Aickin MG, et al. A lifestyle intervention improves plasma insulin levels among Native American high school youth. Prev Med 2004;36:309-19.
10. James J, Thomas P, Cavan D, Kerr D. Preventing childhood obesity by reducing consumption of carbonated drinks: cluster randomized controlled trial. Br Med J 2004; 328(7450):1237.
11. Beech B, Klesges R, Kumanyika s, et al. Child- and parent- targeted interventions: the Memphis GEMS Pilot Study. Ethnicity and Disease 2003;13(Suppl 1):S40-S52.
12. Story M, Sherwood N, Himes, J, et al. An after-school obesity prevention program for African-American girls: the Minnesota GEMS pilot study. Ethnicity & Disease 2003;13(Suppl 1):S54-S64.
13. Baranowski T, Baranowski J, Cullen K, et al. The Fun, Food, and Fitness Project (FFFP): the Baylor GEMS pilot study. . Ethnicity & Disease 2003;13(Suppl 1):S30-S39.
14. IOM. Nutrition standards for foods in schools: leading the way toward healthier youth. 2007 [On-line Access] http://www.iom.edu/CMS/3788/30181/42502.aspx
15. Cole SM, Teufel-Shone NI, Ritenbaugh CK, Yzenbaard RA, Cockerham DL. Dietary intake and food patterns of Zuni adolescents. J Am Diet Assoc 2001;101:802-806.

Target Area: Increase Breastfeeding Initiation, Duration, and Exclusivity
Background and Rationale Infants who are not breastfed have a higher risk for ear and respiratory infections, atopic dermatitis, gastroenteritis, necrotizing enterocolitis, type 2 diabetes, and sudden infant death syndrome (SIDS). Benefits of breastfeeding for mothers include decreased risk of breast and ovarian cancer and type 2 diabetes (1). Research shows that the longer a child breastfeeds, the less likely he or she is to be overweight. Three meta-analyses examining the relationship between breastfeeding and pediatric overweight using studies primarily conducted in developed countries suggested that breastfeeding reduced the odds of childhood overweight by 15-30% (2-4). The duration of breastfeeding is inversely related to pediatric overweight (3), and exclusive breastfeeding appears to have a stronger protective effect than breastfeeding combined with formula feeding (4), but more research is needed to understand this relationship. The 2007 CDC publication, Does breastfeeding reduce the risk of pediatric overweight? (Research to Practice Series No. 4), summarizes the evidence for public health practitioners (5). Both Healthy People 2010 (6) and the HHS Blueprint for Action on Breastfeeding (7) recommend an increase in breastfeeding initiation, exclusivity, and duration rates. Despite overwhelming evidence supporting the numerous health benefits of breastfeeding, far too few U.S. infants are breastfed, and durations of exclusive and any breastfeeding are shorter than recommended. Almost a third of newborns are never breastfed and only 42% are breastfed for 6 months. At 3 months, only 31% of infants are exclusively breastfed and this figure drops to 11% by 6 months. Rates of breastfeeding are considerably lower among non-Hispanic African American infants; only 56% have ever been breastfed (8-9). Many barriers make it difficult for mothers to meet their breastfeeding goals. Routine practices in hospitals often interfere with establishment of early breastfeeding. Mothers often do not receive or have access to support from health care professionals when they encounter difficulties with breastfeeding. Mothers encounter social disapproval from society when they choose to breastfeed in public places. When they choose to work outside the home, they encounter rigid schedules, lack of support from employers and coworkers, and difficulties in finding the time to breastfeed or express milk for their infants (10). Overview of Strategies CDC developed The CDC Guide to Breastfeeding Interventions to help states select the most appropriate breastfeeding initiatives for particular settings and populations (10). Information is based on scientific evidence provided through individual peer-reviewed studies as well as systematic reviews from the Cochrane Library, a comprehensive collection of up-to-date information on the effects of health care interventions. The CDC Guide to Breastfeeding Interventions includes effective strategies for increasing breastfeeding initiation, duration, and exclusivity rates, as well as strategies with limited evidence of effectiveness. Decision-makers should consider these strategies in light of
Section III: Interventions and Strategies Addressing NPAO Target Areas Increase Breastfeeding Initiation, Duration, and Exclusivity January 2008
78

Section III: Interventions and Strategies Addressing NPAO Target Areas Increase Breastfeeding Initiation, Duration, and Exclusivity January 2008
79
factors such as community resources, needs, priorities, and constraints. Evidence-based strategies included in The CDC Guide to Breastfeeding Interventions are:
• Maternity-care practices • Support for breastfeeding in the workplace • Peer support • Educating mothers • Professional support • Media and community-wide campaigns
References 1. Ip S, Chung M, Raman G, Chew P, et al. Breastfeeding and maternal and infant health
outcomes in developed countries. Evidence Report/Technology Assessment No. 153 (Prepared by Tufts-New England Medical Center Evidence-based Practice Center, under Contract No. 290-02-0022). AHRQ Publication No. 07-E007. Rockville, MD: Agency for Healthcare Research and Quality. April 2007.
2. Arenz S, Ruckerl R, Koletzko B, von Kries R. Breast-feeding and childhood obesity—a systematic review. International Journal of Obesity 2004;28:1247-56.
3. Harder T, Bergmann R, Kallischnigg G, Plagemann A. Duration of breastfeeding and risk of overweight: a meta-analysis. Am J Epidemiol 2005;162:397-403.
4. Owen CG, Martin RM, Whincup PH, et al. Effect of infant feeding on the risk of obesity across the life course: a quantitative review of published evidence. Pediatrics 2005;115:1367-1377.
5. CDC. Does breastfeeding reduce the risk of pediatric overweight? Research to Practice Series No. 4 July 2007. [Online Access] http://www.cdc.gov/nccdphp/dnpa/nutrition/pdf/breastfeeding_r2p.pdf
6. Office of Disease Prevention and Health Promotion, U.S. Department of Health and Human Services. Healthy people 2010 [Online Access] http://www.healthypeople.gov/
7. U.S. Department of Health and Human Services. HHS blueprint for action on breastfeeding. [Online Access] http://www.womenshealth.gov/breastfeeding/bluprntbk2.pdf
8. CDC. Breastfeeding practices — results from the National Immunization Survey. [Online Access] http://www.cdc.gov/breastfeeding/data/NIS_data/data_2004.htm
9. Scanlon KS, Grummer-Strawn L, Shealy KR, et al. Breastfeeding trends and updated national health objectives for exclusive breastfeeding —United States, birth years 2000—2004. MMWR 2007;56(30):760-63.
10. Shealy KR, Li R, Benton-Davis S, Grummer-Strawn LM. The CDC guide to breastfeeding interventions. Atlanta: Centers for Disease Control and Prevention, 2005. [Online Access] http://www.cdc.gov/breastfeeding/pdf/breastfeeding_interventions.pdf
Breastfeeding Strategy 1: Maternity Care Practices
Description Maternity care practices related to breastfeeding take place during immediate prenatal care, care during labor and birthing, and postpartum care. The mother’s experience during this time influences breastfeeding initiation, exclusivity, and duration (1). Institutional changes supporting breastfeeding can be the initiation of individual, evidence-based interventions such as rooming-in (2), or discontinuing policies that are not evidence-based such as routine supplemental feeds for breastfed infants. These efforts can also be part of a comprehensive set of changes such as those implemented

Section III: Interventions and Strategies Addressing NPAO Target Areas Increase Breastfeeding Initiation, Duration, and Exclusivity January 2008
80
when a hospital is seeking Baby Friendly Hospital Initiative (BFHI) designation. Those with this designation implement the WHO/UNICEF “Ten Steps to Successful Breastfeeding” (10 Steps), which describes maternity-care practices essential to the support of breastfeeding in maternity-care facilities (3, 4). Incremental Steps to BFHI may be more realistic in some cases, by building gradual change in hospitals. Research on the five of the 10 Steps that mothers can report (early initiation of breastfeeding, rooming-in, breastfeeding on demand, no pacifiers, and no supplementation) indicated that mothers participating in these steps were more likely to still be breastfeeding at 6 weeks (5). The “Ten Steps to Successful Breastfeeding” include the following practices:
• Have a written breastfeeding policy that is routinely communicated to all health care staff.
• Train all health care staff in skills necessary to implement this policy. • Inform all pregnant women about the benefits and management of breastfeeding. • Help mothers initiate breastfeeding within one-half hour after birth. • Show mothers how to breastfeed and how to maintain lactation, even if they are
separated from their infants. • Ensure that newborns consume no food or drink other than breast milk, unless
medically indicated. • Allow mothers and infants to remain together 24 hours a day (rooming-in). • Encourage breastfeeding on demand. • Give no artificial teats or pacifiers to breastfeeding infants. • Help form breastfeeding-support groups and refer new mothers to these groups
when they are discharged.
Examples
• Baby-Friendly Hospital Initiative (BFHI) (4) promotes a comprehensive set of changes in hospitals, based on standards set by the World Health Organization/UNICEF, including implementation of the WHO/UNICEF 10 Steps. Boston Medical Center, an inner-city hospital with a high minority and immigrant patient population, showed significant increases in breastfeeding as a result of the changes made to achieve BFHI status. Effectiveness
• A study conducted in the Boston Medical Center showed an increase of both initiation and exclusive breastfeeding when comparing breastfeeding rates before implementation to full implementation of the 10 Steps leading to BFHI designation (4). A study conducted in Scotland among all birthing facilities with at least 50 births per year showed that women who delivered babies between 1995 and 2002 were 28% more likely to be breastfeeding at 7 days postpartum if they delivered in a BFHI designated facility (5). In addition, one study found that mothers experiencing none of the 10 steps during their hospital stay were eight times more likely to stop breastfeeding before 6 weeks than those experiencing all five of the steps that mothers can report (6). A 2001 study of 17,000 dyads in 31 hospitals and clinics found that the 3-month exclusive breastfeeding rate was nearly seven times higher among BFHI sites than in sites without this designation. The BFHI sites also had significantly higher rates of women still breastfeeding at 12 months (7).

Section III: Interventions and Strategies Addressing NPAO Target Areas Increase Breastfeeding Initiation, Duration, and Exclusivity January 2008
81
• A Cochrane review of 3,730 women (8) found a negative effect on exclusive breastfeeding of hospital distribution of infant formula marketing items in the form of bags filled with samples and information known as “discharge packs.” Mothers most affected were those at high risk for early termination of breastfeeding, including first-time mothers and those who were non-white, had less formal education, and were ill postpartum (8). Another study of 547 women demonstrated that even educational materials on breastfeeding produced by manufacturers of infant formula and distributed to pregnant women who were intending to breastfeed without actual product samples substantially reduced breastfeeding exclusivity and duration. Women with uncertain or short breastfeeding goals were those most affected (9).
• A Cochrane review of eight studies (10) looking at early skin-to-skin contact
(SSC)―i.e., laying the naked baby, prone, on the mother’s bare chest immediately or as soon after birth as possible and covering both with a blanket―found that mothers practicing SSC were twice as likely to be breastfeeding at 1-3 months than those who were not practicing SSC, and that their infants breastfed an average of 42 days longer than those who were separated.
References 1. Shealy KR, Li R, Benton-Davis S, Grummer-Strawn LM. The CDC guide to breastfeeding
interventions. Atlanta: Centers for Disease Control and Prevention, 2005. [Online Access] http://www.cdc.gov/breastfeeding/pdf/breastfeeding_interventions.pdf
2. Fairbank L, O’Meara S, Renfrew MH, et al. A systematic review to evaluate the effectiveness of interventions to promote the initiation of breastfeeding. Health Technology Assessment 2000;25):1-171.
3. Department of Child and Adolescent Health and Development. Evidence for the ten steps to successful breastfeeding. Geneva: World Health Organization, 1998. [Online Access] http://www.who.int/child-adolescent-health/New_Publications/NUTRITION/WHO_CHD_98.9.pdf
4. Philipp BL, Merewood A, Miller LW, et al. Baby Friendly Hospital Initiative improves breastfeeding initiation rates in a U.S. hospital setting. Pediatrics 2001;108(3):677-81.
5. Broadfoot M, Britten J, Tappin D, MacKenzie J. The Baby Friendly Hospital Initiative and breast feeding rates in Scotland. Arch Dis Child Fetal Neonatal Ed 2005; 90:F114-F116.
6. DiGirolamo AM, Grummer-Strawn LM, Fein S. Maternity care practices: implications for breastfeeding. Birth 2001;28(2)94-100.
7. Kramer MS, Chalmers B, Hodnet ED, et al. PROBIT Study Group. Promotion of Breastfeeding Intervention Trial (PROBIT): a randomized trial in the Republic of Belarus. JAMA 2001;285:413-20.
8. Donnelly A, Snowden HM, Renfew MJ, Woolridge MW. Commercial hospital discharge packs for breastfeeding women Cochrane Database of Systematic Reviews 2000, Issue 2. Art. No.: CD002075. DOI: 10.1002/14651858.CD002075.pub2.
9. Howard C, Howard F, Lawrence R, et al. Office prenatal formula advertising and its effect on breastfeeding patterns. Ob Gynecol 2000;95(2):296–303.
10. Moore ER, Anderson GC, Bergman N. Early skin-to-skin contact for mothers and their healthy newborn infants. Cochrane Database of Systematic Reviews 2007, Issue 3. Art. No.: CD003519. DOI: 10.1002/14651858.CD003519.pub2.
Section III: Interventions and Strategies Addressing NPAO Target Areas Increase Breastfeeding Initiation, Duration, and Exclusivity January 2008
82
Breastfeeding Strategy 2: Support for Breastfeeding in the Workplace
Description As of July 2007, 13 states had laws requiring employers to accommodate breastfeeding mothers who return to work (1). Essential elements of a successful workplace breastfeeding intervention are space, time, support, and helpful gatekeepers (managers and human resource professionals) (2). Many factors, such as how many women need support and the resources available, help determine the most appropriate program components for a given setting. Employers can use a variety of strategies to ensure time for breastfeeding or milk expression, such as flexible work schedules or job-sharing. CDC has developed a Healthier Worksite Initiative Worksite Lactation Program Toolkit that has examples and instructions on how to create a comprehensive lactation support program for nursing mothers at the worksite. The toolkit was developed by CDC for federal employment worksites as a primary audience; however, it can easily be adapted for use in state and local government worksites, as well as private employment sites http://www.cdc.gov/nccdphp/dnpa/hwi/toolkits/lactation/index.htm (2). The following are general characteristics of interventions that support breastfeeding in the workplace:
• A written workplace policy that clearly states the mother’s rights to express milk or breastfeed at work and lists components approved by the worksite, such as time (paid or unpaid) allowed, space provided, and organizational support available.
• Education for all employees on the policy with a focus on pregnant employees, and support resources available in the community or provided by the organization.
• Facility for expression of breast milk or for breastfeeding. An ideal space for breastfeeding is private; well-lit and ventilated; and has an electrical outlet, sink, and comfortable seating. At a minimum, the space should be private (not in a bathroom), clean, and well-lit.
Examples
• Worksite Lactation Program for WIC Employees (3) implemented in all Los Angeles County WIC sites includes prenatal education, perinatal (in-hospital) lactation assistance, breast pumps, accommodations for staff to pump at work, ongoing individualized support for employees from Trained Lactation Counselors (TLCs), and public (among staff) recognition for achievement of breastfeeding milestones. All employees from clerical staff to dietitians are eligible to participate in the program.
• Mutual of Omaha Lactation Program (4) is an employee lactation program that
includes a series of prenatal breastfeeding classes for employees and their partners/spouses, support for breastfeeding mothers as they transition back from maternity leave to work, and worksite accommodations for mothers to express milk.
Effectiveness
• A 2007 Cochrane Review (5) found no randomized or quasi-randomized controlled trials looking at the effectiveness or impact of lactation programs in the workplace.

Section III: Interventions and Strategies Addressing NPAO Target Areas Increase Breastfeeding Initiation, Duration, and Exclusivity January 2008
83
However, individual program evaluations demonstrate that worksite support for breastfeeding mothers makes it possible for women who work outside the home to meet the American Academy of Pediatrics’ breastfeeding recommendations.
• The effect of worksite lactation programs on breastfeeding behaviors as well as
measures of participant satisfaction and perceptions related to workplace programs have been evaluated. As a result of a worksite intervention for employees of the Los Angeles County WIC sites, nearly 100% of employees who were new mothers initiated breastfeeding, 87.6% breastfed for at least 6 months, and 68.6% for at least 12 months. In addition, more than 48% never provided infant formula to their infants. These rates are all well above Healthy People 2010 goals. The most important factors contributing to high rates of breastfeeding duration and exclusivity, as reported by the employees, were intent to exclusively breastfeed, delayed introduction of formula, presence of breastfeeding support groups at the worksite, and availability of breast pumps at the worksite (3). Participants in the Mutual of Omaha lactation program breastfed an average of 8.26 months, while at the time of the study only 29% of women nationally were still breastfeeding (4). One study of two worksite breastfeeding interventions in California found that approximately 75% of participating mothers continued breastfeeding at least 6 months after they gave birth. Nationally, only 10% of mothers employed full-time were still breastfeeding at six months during that same time (6).
References 1. National Conference of State Legislatures. 50 state summary of breastfeeding laws. 2007.
[Available Online] http://www.ncsl.org/programs/health/breast50.htm 2. Bar-Yam NB. Workplace lactation support, Part II: working with the workplace. J Human
Lactation1998;14(4):321-325. 3. Whaley SE, Meehan K, Lange L, et al. Predictors of breastfeeding duration for employees of
the Special Supplemental Nutrition Program for Women, Infants, and Children (WIC). J Am Diet Asso 2002; 102(9):1290-93.
4. Shealy KR, Li R, Benton-Davis S, Grummer-Strawn LM. The CDC guide to breastfeeding interventions. Atlanta: Centers for Disease Control and Prevention, 2005. [Online Access] http://www.cdc.gov/breastfeeding/pdf/breastfeeding_interventions.pdf
5. Abdulwadud OA, Snow ME. Interventions in the workplace to support breastfeeding for women in employment. Cochrane Database of Systematic Reviews 2007, Issue 3. Art. No.: CD006177. DOI: 10.1002/14651858.CD006177.pub2.
6. Cohen R, Mrtek MB. The impact of two corporate lactation programs on the incidence and duration of breastfeeding by employed mothers. Am J Health Promotion 1994;8(6):436-41.
Breastfeeding Strategy 3: Peer Support
Description
Postpartum hospital stays for women in the United States are short, increasing the need for community-based breastfeeding support. Programs providing one-to-one peer support facilitate access to breastfeeding education and assistance during the perinatal period. Women’s social networks are highly influential in their decision-making processes. New mothers prefer to get child-rearing information from other mothers (1).

Section III: Interventions and Strategies Addressing NPAO Target Areas Increase Breastfeeding Initiation, Duration, and Exclusivity January 2008
84
Mothers provide one another with support and counseling to help address barriers to breastfeeding and prevent and manage breastfeeding problems. Ideally, these “peer mothers” have similar socio-cultural backgrounds as those whom they are supporting (2). One model to ensure peer support for new mothers, which is also a core element of the breastfeeding support provided by WIC, is to set up a network of Peer Counselors (mothers of similar backgrounds who have personal breastfeeding experience) to make available to new mothers who might need support and guidance on breastfeeding. The following are general characteristics of breastfeeding peer support programs:
• Leadership and support from health care facility management, as well as ongoing supervision of the peer counselors.
• Peer support program identified as an integral component of services offered through a health care facility as this seems to contribute to ongoing program maintenance (3).
• Provision of standardized and timely training, continuing education, and ongoing support for the peer counselors.
• Access to International Board Certified Lactation Consultants (IBCLCs) and community partnerships for making and receiving referrals.
• Program offered in a variety of easily accessible settings such as community facilities, clinics, or hospitals.
• Contact by peer counselors with mothers by telephone, in the home, or in the clinical setting.
• Support groups facilitated by peer counselors. Examples
• WIC Peer Counseling Programs are funded by the USDA Food and Nutrition Service in each WIC state agency to establish or expand peer counseling programs. The program is comprehensive, providing a training module, templates for forms, recommended policies, standards for providing support to WIC participants, and requirements for hiring and supervising peer counselors (3,4).
• Hartford Hospital Peer Counseling Program was established in a hospital-based
setting that serves a predominantly Latino population. The hospital has established the peer counseling intervention as a component of existing multifaceted breastfeeding programs (5). The essential elements of the peer counseling program are one prenatal visit, daily visits during perinatal hospitalization, three postpartum home visits, and monthly phone calls through 6 months postpartum from a peer counselor.
Effectiveness
• One systematic review found that peer-support programs effectively increase rates of breastfeeding initiation and duration, especially among women who expressed interest in breastfeeding and requested support from a peer counselor (6). A subsequent Cochrane review reported that not only did peer counseling positively impact overall breastfeeding rates, it also had a significant impact on the duration of

Section III: Interventions and Strategies Addressing NPAO Target Areas Increase Breastfeeding Initiation, Duration, and Exclusivity January 2008
85
exclusive breastfeeding in the first 3 months. This review also found that face-to-face interaction was more effective than telephone-based support (7).
• Multifaceted interventions that include peer support also are effective in increasing
breastfeeding initiation and duration (6). Peer support interventions cover many population groups, including disadvantaged and low-income populations (7). Peer support has been used successfully among middle-income women as well (8). A randomized controlled trial of peer support among low-income Latina women found that women receiving individual peer counseling were more likely to breastfeed at one and three months postpartum than those who received only routine breastfeeding support; in addition, more women in the intervention group initiated breastfeeding (9).
References 1. Shields M. Parenting study gives birth to new media strategy: no media. Media Daily News,
July 22, 2004. 2. Shealy KR, Li R, Benton-Davis S, Grummer-Strawn LM. The CDC guide to breastfeeding
interventions. Atlanta: Centers for Disease Control and Prevention, 2005. [Online Access] http://www.cdc.gov/breastfeeding/pdf/breastfeeding_interventions.pdf
3. Best Start Social Marketing. Using Loving Support to Implement Best Practices in Peer Counseling. Tampa, FL: Best Start Social Marketing, 2004.
4. Grummer-Strawn LM, Rice SP, Dugas K, Clark LD, Benton-Davis S. An evaluation of breastfeeding promotion through peer counseling in Mississippi WIC clinics. Maternal and Child Health J 1997;1(1):35-42.
5. Pérez-Escamilla R. Evidence based breast-feeding promotion: The Baby-Friendly Hospital Initiative. J Nutr 2007;137:484-87.
6. Fairbank L, O’Meara S, Renfrew MJ, et al. A systematic review to evaluate the effectiveness of interventions to promote the initiation of breastfeeding. Health Technology Assessment 2000;4(25):1–171.
7. Britton C,McCormick FM, Renfrew MJ,Wade A, King SE. Support for breastfeeding mothers. CochraneDatabase of Systematic Reviews 2007, Issue 1. Art. No.: CD001141. DOI: 10.1002/14651858.CD001141.pub3.
8. Dennis, C, Hodnett E, Gallop R, et al. The effect of peer supporton breast-feeding duration among primiparous women: a randomized controlled trial. CMAJ 2002; 166(1): 21-28.
9. Chapman DJ, Damio G, Perez-Escamilla R. Differential response to breastfeeding peer counseling within a low-income, predominantly Latina population. J Human Lactation 2004;20(4):389–96.
Breastfeeding Strategy 4: Educating Mothers
Description This strategy aims to improve mothers’ breastfeeding knowledge and skills and to influence their attitudes toward breastfeeding. The following are general characteristics of breastfeeding education programs:
• Usually targets pregnant or breastfeeding women, but may include fathers and others who support the women (1).
• Includes instruction by someone with expertise or training in lactation management.
Section III: Interventions and Strategies Addressing NPAO Target Areas Increase Breastfeeding Initiation, Duration, and Exclusivity January 2008
86
• Typically occurs in a small, informally structured group setting but may be given one-on-one.
• May be provided in a variety of locations such as medical, community, or worksite settings.
Examples
• Early Experiences and Counseling for Effective Lactation (EXCEL) (2), a program in
the Guam WIC Program, is designed to provide consistent and ongoing breastfeeding education to adolescent WIC participants tailored to their individual beliefs and expectations. The intervention addresses the breastfeeding barrier of returning to school. Education using culturally appropriate materials is offered as classes in the high schools and individual education in the WIC clinics. The program also provides breastfeeding support after delivery. The intervention resulted in a significant increase in breastfeeding among the adolescents receiving the intervention compared to a group of adolescents who were not exposed to the intervention but received usual care at WIC and from their physicians.
• The National WIC Breastfeeding Promotion Project (3), a comprehensive program
based on social marketing principles, was implemented and evaluated in 54 WIC state, territorial, and tribal agencies. Program components included breastfeeding promotion, education, and support. Education of WIC participants was based on a 3-step counseling approach designed for the project, resulting in participant-centered education and counseling provided by health professionals.
Effectiveness
A 2003 review by the U.S. Preventive Services Task Force found that maternal education is the single most effective intervention for increasing breastfeeding initiation and short-term duration (4). One of every three to five women who attended such education sessions continued to breastfeed for up to 3 months. The review defined education as including information on the benefits of breastfeeding, principles of lactation, myths, common problems, solutions, and skills training. In addition, a 2005 Cochrane review concluded that breastfeeding education significantly increases breastfeeding initiation among low-income women in the United States (5). References 1. Shealy KR, Li R, Benton-Davis S, Grummer-Strawn LM. The CDC guide to breastfeeding
interventions. Atlanta: Centers for Disease Control and Prevention, 2005. [Online Access] http://www.cdc.gov/breastfeeding/pdf/breastfeeding_interventions.pdf
2. Weimer JP. Breastfeeding promotion research: the ES/WIC Nutrition Education Initiative and economic considerations. 1998. Economic Research Service, U.S. Department of Agriculture. Agriculture Information Bulletin No. 744. [Online Access] http://www.ers.usda.gov/Publications/AIB744/
3. Lindenberger JH, Bryant CA. Promoting breastfeeding in the WIC Program: a social marketing case study. Am J Health Beh 2000;24(1):53-60.
Section III: Interventions and Strategies Addressing NPAO Target Areas Increase Breastfeeding Initiation, Duration, and Exclusivity January 2008
87
4. US Preventive Services Task Force. Counseling to promote breastfeeding. Agency for Healthcare Research and Quality 2003. [Online Access} http://www.ahrq.gov/clinic/uspstf/uspsbrfd.htm
5. Dyson L, McCormick F, Renfrew MJ. Interventions for promoting the initiation of breastfeeding. Cochrane Database of Systematic Reviews 2005, Issue 2. Art. No.: CD001688. DOI: 10.1002/14651858.CD001688.pub2
Breastfeeding Strategy 5: Professional Support
Description
The primary focus of professional support is counseling, encouragement, and managing lactation crises; education is secondary. This strategy includes any breastfeeding counseling or behavioral interventions provided by health professionals to mothers during pregnancy and after they return home from the hospital. General characteristics of interventions that provide professional support are (1):
• Support is rendered in person or over the telephone, in a group or individual setting, or in a clinic or home setting.
• Support is provided during prenatal and postpartum periods and can be given by an International Board Certified Lactation Consultant (IBCLC) or other health professional, depending on the mother’s needs and the availability of services.
• Assistance is provided with infant latch and positioning, management of lactation crises, counseling mothers returning to work or school, and addressing any other concerns from mothers or their families.
Examples
• Carolinas Medical Center Outpatient Clinic Lactation Education and Follow-up Program in Charlotte, North Carolina provides education and follow-up for breastfeeding mothers in an out-patient setting to increase breastfeeding duration. The program provides education and counseling in the early postpartum period, a critical period in which many mothers stop breastfeeding (2).
Effectiveness
• The US Prevention Services Task Force found fair evidence that providing ongoing professional support to mothers through in-person visits or telephone contact increased the proportion of women who continue breastfeeding up to 6 months (2).
• A Cochrane review of 34 studies in 14 countries found that professional support was effective at increasing breastfeeding initiation. When combined with lay support, professional support increased duration and exclusivity of breastfeeding (3).
References 1. Shealy KR, Li R, Benton-Davis S, Grummer-Strawn LM. The CDC guide to breastfeeding
interventions. Atlanta: Centers for Disease Control and Prevention, 2005. [Online Access] http://www.cdc.gov/breastfeeding/pdf/breastfeeding_interventions.pdf

Section III: Interventions and Strategies Addressing NPAO Target Areas Increase Breastfeeding Initiation, Duration, and Exclusivity January 2008
88
2. Guise JM, Palda V, Westhoff C, et al. The effectiveness of primary care-based interventions to promote breastfeeding; systematic evidence review and meta-analysis for the U.S. Preventive Services Task Force. Annals of Family Medicine 2003; 1(2):15-22.
3. Britton C, McCormick FM, Renfrew MJ, Wade A, King SE. Support for breastfeeding mothers. Cochrane Database of Systematic Reviews 2007. 1. art. No.: CD001141. DOW: 10.1002/14651858.CD001141.pub3.
Breastfeeding Strategy 6: Media and Community-Wide Campaigns
Description
Media campaigns, particularly TV campaigns, can improve attitudes toward breastfeeding and also help increase breastfeeding rates. A comprehensive social-marketing approach including interventions to increase public awareness, can increase rates of breastfeeding initiation and duration while also improving community support for breastfeeding. The following are general characteristics of media and community-wide campaigns to support breastfeeding (1):
• Includes marketing, such as promotions and advertising to support and encourage breastfeeding, and uses imagery to strengthen perceptions of breastfeeding as a normal, accepted activity.
• May take a broad approach using traditional advertising methods, or a narrow focus with methods such as professional endorsements, providing items to targeted audiences, and sponsoring events focused on a specific demographic group.
• May use channels such as television, radio, printed materials, or outdoor advertising.
Example
• Loving Support Makes Breastfeeding Work (2-4) is a community-wide campaign for breastfeeding implemented and evaluated in Mississippi that used a social-marketing approach. Results of the Mississippi campaign provided a basis for USDA to provide funding to several states to implement a communitywide version of this campaign. The new campaign, called Using Loving Support to Build a Breastfeeding-Friendly Community, helps states develop strategies in the areas of mobilizing staff, client and family education, public awareness, health provider outreach, and community partnerships.
Effectiveness
A 2000 Cochrane review suggests that media campaigns, particularly TV commercials, improve attitudes toward breastfeeding and increase breastfeeding rates (5). Social marketing is established as an effective behavior-change model for a wide variety of public health issues (6). Evaluations of the Loving Support Makes Breastfeeding Work strategy found that the comprehensive social-marketing approach, including interventions to increase public awareness through media and other outlets, increased rates of breastfeeding initiation and duration while improving perceptions of community support for breastfeeding (2-4).

Section III: Interventions and Strategies Addressing NPAO Target Areas Increase Breastfeeding Initiation, Duration, and Exclusivity January 2008
89
References 1. Shealy KR, Li R, Benton-Davis S, Grummer-Strawn LM. The CDC guide to breastfeeding
interventions. Atlanta: Centers for Disease Control and Prevention, 2005. [Online Access] http://www.cdc.gov/breastfeeding/pdf/breastfeeding_interventions.pdf
2. Mitra AK, Khoury AJ, Carothers C, Foretich C. The loving support breastfeeding campaign: awareness and practices of health care providers in Mississippi. J Obst Gyn Neonatal Nursing 2003;32(6):753-60.
3. Mitra AK, Khoury AJ, Carothers C, Foretich C. Evaluation of a comprehensive loving support program among state Women, Infants, and Children (WIC) program breast-feeding coordinators. S Med J 2003;96(2):168-71.
4. Khoury AJ, Hinton A, Mitra AK, et al. Improving breastfeeding knowledge, attitudes, and practices of WIC clinic staff. Pub Health Rep 2002;117:453-62.
5. Fairbank L, O’Meara S, Renfrew MJ, et al. A systematic review to evaluate the effectiveness of interventions to promote the initiation of breastfeeding. Health Tech Assess 2000;4(25):1–171.
6. Ling JC, Franklin BA, Lindsteadt JF, Gearon SA. Social marketing: its place in public health. Ann Rev Public Health 1992;13:341–46.
Target Area: Reduce the Consumption of High-Energy-Dense Foods
Background and Rationale Research shows that people eat a fairly consistent amount of food on a day-to-day basis. This finding holds true whether the amount of food contains many or few calories. Therefore, the number of calories in a particular amount or weight of food (i.e., the food’s energy density) affects the total number of calories a person consumes (1). Foods with a lower energy density provide fewer calories per gram than foods with higher energy density. In general, foods with a lower energy density (e.g., fruits, vegetables, and broth-based soups) tend to be foods with either a high water content, a high fiber content, or little fat. High-energy-dense foods are often high in refined grains, added sugar and fats, and tend to be palatable, inexpensive, and convenient (2). While the influence of dietary energy density on body weight has not been extensively investigated, several observational studies suggest that a relationship exists between consuming an energy-dense diet and obesity. For example, one cross-sectional study with a nationally representative group of adults found that normal weight individuals consumed diets that were lower in energy density than obese individuals (3). In another cross-sectional study, diets with higher energy density were predictive of higher body mass index (BMI) values and had more added fat and sugar (2). A prospective study found that consumption of high-energy-dense diets was a risk factor for higher BMI in both men and women across five different ethnic groups (4). Analyses of cross-sectional data found that dietary energy density has been identified as a correlate of obesity, elevated fasting insulin levels, and metabolic syndrome in U.S. adults (5). The current food supply contains a significant amount of high-energy-dense foods. Many of these are processed foods that are high in fat and/or sugar and low in nutrients. Portion sizes in this country have also increased over the past two decades in restaurants, grocery stores, and vending machines. Portion sizes for manufactured and restaurant foods in the United States appear to have increased concurrently with obesity prevalence; they began to rise in the 1970s, increased dramatically in the 1980s, and have continued to grow gradually (6). Current portion sizes of French fries, hamburgers and sodas are 2-5 times larger than when they were originally offered in fast food restaurants (7). In addition, the number of eating establishments in the United States increased by 75% between 1977 and 1991. A recent review paper concluded high-energy-dense foods are lower in cost, have high palatability, and are associated with higher energy intakes (8). Overview of Strategies The evidence about what works to decrease consumption of high-energy-dense foods is not definitive, but promising strategies include substituting low-energy-dense foods for high-energy-dense foods, decreasing the portion size of high-energy-dense foods, and limiting the availability of high-energy-dense foods. Encouraging people to eat more foods low in energy density and to substitute these foods for those higher in energy density helps them decrease their caloric intake while eating satisfying portions of food and controlling hunger (9-11). Short-term studies (12-
Section III: Interventions and Strategies Addressing NPAO Target Areas Reduce Consumption of High-Energy-Dense Foods January 2008
90

Section III: Interventions and Strategies Addressing NPAO Target Areas Reduce Consumption of High-Energy-Dense Foods January 2008
91
14) show that controlling portion sizes and decreased consumption of high-energy dense foods helps limit calorie intake. A recent study showed that manipulations that decreased portion size and energy density (i.e., substituting fruits and vegetables or incorporating these low-energy-dense foods into mixed dishes) independently influence energy intake, and that these effects were additive and sustained from meal to meal (15). Although both manipulations influenced energy intake, energy density manipulations were stronger than those of portion size. Understanding how energy density and portion size work together can lead to more effective nutrition education messages than simply encouraging people to eat less. People should be encouraged to meet their caloric needs by eating satisfying portions of foods with a low energy density.
School and worksite environments are important influences on food behavior. Increasing attention has focused on the need to establish school nutrition standards that restrict or limit the availability of low-nutrition, high-calorie competitive foods and beverages that are sold outside of the federal school lunch and breakfast programs such as food in vending machines, a la carte offerings in the cafeteria, snack bars, school stores and fundraisers. Several studies have related the availability of snacks and drinks sold in schools to higher intakes of total energy, total fat and saturated fat, and lower intakes of key nutrients, fruits, vegetables, and milk (16). The Institute of Medicine (IOM) recently published Nutrition Standards for Foods in Schools, which promotes healthful food choices by limiting high-energy-dense foods (17). Worksite environments provide opportunities and exposures that also influence individual food choices. Potential worksite policy and environmental change interventions include limiting the availability of high-energy-dense foods and improving the availability of healthful food choices in vending machines as well as changes in menu options and portion sizes of food in the cafeteria (18). References 1. Rolls BJ, Bell EA, Castellanos VH, et al. Energy density but not fat content of foods affected
energy intake in lean and obese women. Am J Clin Nutr 1999;69:863-71. 2. Kant AK, Graubard BI. Energy density of diets reported by American adults: association with
food group intake, nutrient intake, and body weight. Int J Obes 2005;29:950-56. 3. Ledikwe JH, Blanck HM, Kettel Khan L, et al. Dietary energy density is associated with
energy intake and weight status in US adults. Am J Clin Nutr 2006;83:1362-68. 4. Howarth NC, Murphy SP, Wilkens LR, et al. Dietary energy density is associated with
overweight status among 5 ethnic groups in the Multiethnic Cohort Study. J Nutr 2006;136(8):2243-48.
5. Mendoza JA, Drewnowski A, Christakis DA. Dietary energy is associated with obesity and the metabolic syndrome in US adults. Diabetes Care 2007;30(4):974-9.
6. Young LR, Nestle M. The contribution of expanding portion sizes to the U.S. obesity epidemic. Am J Public Health 2002;92:246-49.
7. CDC. Do increased portion sizes affect how much we eat? Research to Practice Series No. 2. [On-line Access] http://www.cdc.gov/nccdphp/dnpa/nutrition/health_professionals/practice/index.htm
8. Drewnowski A, Spector SE. Poverty and obesity: the role of energy density and energy costs. Am J Clin Nutri 2004;79:6-16.
9. Fitzwater SL, Weinsier RL, Wooldridge NH, et al. Evaluation of long-term weight changes after a multidisciplinary weight control program. J Am Diet Asso 1991;91:421-26, 429.

10. Rolls BJ, Roe LS, Beach AM, Kris-Etherton PM. Provision of foods differing in energy density affects long-term weight loss. Obesity Res 2005;13:1052-60.
11. Ello-Martin JA, Roe LS, Ledikwe JL, et al. Dietary energy density in the treatment of obesity: a year-long trial comparing 2 weight-loss diets. Am J Clin Nutr 2007;85:1465-77.
12. Rolls BJ, Roe LS, Meengs JS. Salad and satiety: energy density and portion size of a first course salad affect energy intake at lunch. J Am Diet Asso 2004;104:1570-76.
13. Kral TVE, Roe LS, Rolls BJ. Combined effects of energy density and portion size on energy intake in women. Am J Clin Nutr 2004;79:962-68.
14. Rolls BJ, Roe LS, Meengs JS. Reducing the energy density and portion size of foods decreases energy intake over two days. Obesity Res 2004;12:A5.
15. Rolls BJ, Roe LS, Meengs JS. Reductions in portion size and energy density of foods are additive and lead to sustained decreases in energy intake. Am J Clin Nutr 2006;83:11-17.
16. Templeton SB, Marlette MA, Panemangalore M. Competitive foods increase the intake of energy and decrease the intake of certain nutrients by adolescents consuming school lunch. J Am Diet Asso 2005;105(2):215-20.
17. IOM. Nutrition standards for foods in schools: leading the way toward healthier youth. [On-line Access] http://www.iom.edu/CMS/3788/30181/42502.aspx
18. Pratt CA, Lemon SC, Fernandez ID, et al. Design characteristics of worksite environmental interventions for obesity prevention. Obesity 2007;15:2171-80.
Reduce Consumption of High-Energy-Dense Foods Strategy 1: Substitute Low-Energy-Dense Foods for High-Energy-Dense Foods
Description
Randomized control trials and a quasi-experimental study (1-3) on lowering energy density for weight control have been reported in the literature. In the quasi-experimental study, participants (1) consumed a reduced-energy diet emphasizing foods that were low in energy density, such as fruits, vegetables, whole grains, and beans. The participants lost an average of 7.3 kg. A randomized control trial (2) examined the effectiveness of incorporating either a low-energy-dense food (broth-based soup) or a high-energy-dense food (dry snack food) into a reduced-energy diet. Participants were provided with one of the following items to incorporate into their daily diet: one serving of soup, two servings of soup, two servings of a dry snack food, or no special food. Participants who consumed two servings per day of low-energy-dense soup experienced 50% greater weight loss than participants who consumed two servings per day of high-energy-dense dry snacks (7.2 kg vs. 4.8 kg). The other randomized control (3) trial examined two strategies to reduce the energy density of the diet without providing the subjects with specific calorie limits. One group of women was advised to decrease the energy density of their diets by increasing their consumption of water-rich foods, such as fruits and vegetables and choosing reduced-fat foods. The other group was counseled only on reducing fat intakes. Both groups lowered the energy density of their diets, and both groups lost weight. The group counseled to eat more fruits and vegetables while also reducing fat intake experienced a greater reduction in the energy density of their diets and lost significantly more weight (7.9 kg vs. 6.4 kg) than the group told just to eat less fat. Even though they lost more weight, those participants eating the lower-energy-dense diet reported consuming more food by weight and experiencing less hunger. In summary, these research studies indicate that consuming a low-energy-dense diet—one that is rich in fruits, vegetables, whole grains, lean meats, and low-fat dairy products—helps people lose weight. At the same time, eating low-energy-dense foods helps people
Section III: Interventions and Strategies Addressing NPAO Target Areas Reduce Consumption of High-Energy-Dense Foods January 2008
92
Section III: Interventions and Strategies Addressing NPAO Target Areas Reduce Consumption of High-Energy-Dense Foods January 2008
93
control their hunger and maintain feelings of satiety, or the feeling of fullness and satisfaction experienced at the end of a meal. Satiety and hunger control are important for long-term satisfaction and compliance with an eating plan (4). Findings from these research studies provide important information for developing population-based interventions. The CDC’s 2007 publication, Low Energy-Density Foods and Weight Management: Cutting Calories While Controlling Hunger (4) includes a comprehensive discussion and summary of the literature related to the impact of eating low-energy-dense foods on calories consumed, satiety, and body weight. Another research-to-practice document included in the CDC Research to Practice Series, Can Eating Fruits and Vegetables Help People to Manage Their Weight? (5) provides information on substituting fruits and vegetables for higher energy dense foods. Effective population-based interventions to substitute low-energy dense foods for high-energy dense foods are not well established; therefore, public health practitioners and researchers should be encouraged to develop and evaluate these interventions. Practical strategies that may facilitate the substitution of low-energy-dense foods for high-energy dense foods at the individual, environment and policy levels include: • Environment and policy levels strategies such as:
o Food establishments can implement food preparation strategies that lower the energy density of foods so people can choose lower energy versions of their favorite foods, for example:
Prepare fruits, vegetables, and other foods without excess fat and sugar.
Lower the energy density of frequently consumed foods by reducing the amount of fat or increasing the amount of water-rich foods; however, the most substantial reductions in energy density are achieved when both of these modifications are used simultaneously.
o Food establishments can offer foods low in energy density such as a broth-based soup or a green salad at the start of the meal or in combination with meals.
o School and worksite cafeterias or vending machines can offer a variety of low-energy-dense foods such as fruits and vegetables so people can choose to substitute these foods for high-energy-dense foods.
• Individual-level behavioral counseling that helps people control their environment (4) such as:
o Providing information on how to avoid large portions of foods that are high in energy density, but encouraging foods low in energy density to be consumed in portions that are appropriate for calorie needs.
Incorporate a large portion of fruits and vegetables into meals. Include broth-based soups and green salads. Round out meals by adding starchy fruits and vegetables, whole
grains, legumes, lean meats, and low-fat dairy food. Limit portion sizes of fried foods including vegetables, refined grains,
full-fat dairy foods, and fatty cuts of meats. Consume infrequently, with particular attention to portion size, foods
with little moisture, such as crackers, cookies, and chips as well as high-fat foods like croissants, margarine, and bacon.

Section III: Interventions and Strategies Addressing NPAO Target Areas Reduce Consumption of High-Energy-Dense Foods January 2008
94
Effectiveness
Research studies (1-3) suggest that an eating pattern that emphasizes foods that are low in energy density is an effective strategy to reduce the energy density of the diet. A benefit of this type of eating plan is that it allows people to eat satisfying amounts of food while restricting their energy intake. Furthermore, this type of eating plan uses positive messages (i.e., eat satisfying portions of low-energy-dense foods), which has been shown to result in greater dietary changes than restrictive messages (i.e., eat small portions of all foods) (6).
References 1. Fitzwater SL, Weinsier RL, Wooldridge NH, et al. Evaluation of long-term weight changes
after a multidisciplinary weight control program. J Am Diet Asso 1991;91:421-26, 429. 2. Rolls BJ, Roe LS, Beach AM, Kris-Etherton PM. Provision of foods differing in energy density
affects long-term weight loss. Obesity Res 2005;13:1052-60. 3. Ello-Martin JA, Roe LS, Ledikwe JL, et al. Dietary energy density in the treatment of obesity:
a year-long trial comparing 2 weight-loss diets. Am J Clin Nutr 2007;85:1465-77. 4. CDC. Low-energy-dense foods and weight management: cutting calories while controlling
hunger. Research to Practice Series No. 4. [On-line Access] http://www.cdc.gov/nccdphp/dnpa/nutrition/health_professionals/practice/index.htm 5. CDC. Can eating fruits and vegetables help people to manage their weight? (Research to
Practice Series No. 1) [Online Access] http://www.cdc.gov/nccdphp/dnpa/nutrition/pdf/rtp_practitioner_10_07.pdf
6. Epstein LH, Gordy CC, Raynor HA, et al. Increasing fruit and vegetable intake and decreasing fat and sugar intake in families at risk for childhood obesity. Obesity Res 2001;9:171-78.
Reduce Consumption of High-Energy-Dense Foods Strategy 2: Decrease the Portion Size of High-Energy-Dense Foods
Description Short-term studies show that controlling portion sizes helps limit calorie intake, particularly when eating high-calorie foods (1-3). The Dietary Guidelines urge Americans to pay special attention to portion sizes, which have increased significantly over the past two decades (4). Portion size is the amount of a single food item served in a single eating occasion, such as a meal or a snack. Many people confuse portion size with serving size, which is a standardized unit of measuring foods. Portion size is the amount offered to a person in a restaurant or in the packaging of prepared foods, or the amount a person chooses to put on his or her plate. For example, a bagel sold in grocery stores or restaurants usually constitutes at least two servings, but is considered only one portion. People eat more when they are confronted with larger portion sizes, and they do not compensate for eating larger portions by eating fewer calories at the following meal or during the rest of the day (5). As the portion size served increases, both the weight of food consumed and energy intake also increase. Only one randomized control trial (6) has been conducted to determine how the effects of portion size and energy density combined influence energy intake and satiety over
Section III: Interventions and Strategies Addressing NPAO Target Areas Reduce Consumption of High-Energy-Dense Foods January 2008
95
several days. Two daily menus were developed consisting of commonly used foods that could be manipulated in energy density. The energy density of the reduced versions of the foods was decreased by 25%, either replacing full-fat ingredients with low-fat alternatives, thereby reducing the amount of fat, or increasing the proportion of fruits or vegetables. The standard portion size of food was selected so that a 25% reduction in portion size would still provide an adequate weight of food. Results of the study indicated that reducing the portion size and energy density of commonly consumed foods led to significant and independent decreases of energy intake when served over multiple days. The effects on energy intake were additive and were sustained from meal to meal, demonstrating that reductions in both portion size and energy density can help to moderate energy intake without increased hunger. The CDC’s publication, Do Increased Portion Sizes Affect How Much We Eat? (7) includes a comprehensive discussion and summary of the literature related to how large portion sizes may have contributed to weight gain among Americans. Effective population-based interventions to decrease the portion size of high-energy-dense foods are not well established; therefore, public health practitioners and researchers should be encouraged to develop and evaluate these interventions. The CDC research-to-practice document and the randomized control trial that examined the impact of decreased portion size of high-energy-dense foods on energy intake provide information to develop practical strategies that may facilitate decreasing the portion size of high-energy-dense foods at the individual, environment and policy levels. These strategies include. • Environment and policy levels strategies such as:
o Food establishments can provide menu options of foods that are reduced in portion size.
o School and worksite vending machines and grocery stores can offer smaller package sizes of high-energy-dense foods so people can choose a more appropriate portion size.
• Individual-level behavioral counseling that helps people control their environment (7) such as:
o Raising awareness of portion distortion by promoting understanding of the differences in portion size and serving size.
o Helping people control calorie intake when faced with large portions by splitting an entrée with a friend at a restaurant or not putting serving dishes on the table at home for second helpings.
o Helping people assess the right amount to eat by promoting food logs, measured portions, and food models.
o Helping people control their environment by purchasing smaller package sizes.
Effectiveness (2)
Only one clinical trial that used both decreased portion size of high-energy-dense foods and substitution of low-energy-dense foods for high-energy-dense foods has been published that found that these effects were additive in reducing energy intake and were

Section III: Interventions and Strategies Addressing NPAO Target Areas Reduce Consumption of High-Energy-Dense Foods January 2008
96
sustained meal to meal (2). Additional studies are needed to confirm these positive findings.
References 1. Rolls BJ, Morris EL, Roe LS. Portion size of food affects energy intake in normal-weight and
overweight men and women. Am J Clin Nutr 2002;76:1207-1213.. 2. Rolls BJ, Roe LS, Meengs JS, Wall DE. Increasing the portion size of a sandwich
increases energy intake. J Am Diet Assoc 2004;104:367-372. 3. Diliberti N, Bordi, PL, Conklin MT, Rolls BR. Increased portion size leads to increased energy
intake in a restaurant meal. Obesity Res 2004;12:562-568. 4. US Departments of Health and Human Services and Agriculture. Dietary Guidelines for
Americans 2005. (http://www.healthierus.gov/dietaryguidelines/) 5. Young LR, Nestle M. The contribution of expanding portion sizes to the U.S. obesity
epidemic. Amer J Pub Health, 2002;92(2):246-249. 6. Rolls BJ, Roe LS, Meengs JS. Reductions in portion size and energy density of foods are
additive and lead to sustained decreases in energy intake. Am J Clin Nutr 2006;83:11-7. 7. CDC. Do increased portion sizes affect how much we eat? [On-line Access]
http://www.cdc.gov/nccdphp/dnpa/nutrition/health_professionals/practice/index.htm Reduce Consumption of High-Energy-Dense Foods Strategy 3: Limit Availability of High-Energy-Dense Foods
Description
To date, most school and worksite interventions that limit high-energy-dense foods have done so by modifying cafeteria menus to decrease the availability of foods high in fat and added sugar (1,2). Although some studies have incorporated these environmental change elements in multi-component interventions, few have focused on environmental interventions as a primary intervention approach. The recent focus on environmental approaches in interventions has highlighted the lack of available measures and criteria that can be used to assess the food environment. Researchers are now beginning to develop criteria and standards the can be used to assess the food environment and develop policy to make environmental changes. The recently published IOM report, Nutrition Standards for Foods in Schools: Leading the Way Toward Healthier Youth includes school nutrition standards that limit the availability of low-nutrition, high-calorie competitive foods and beverages (3). The term “competitive foods” refers to all foods and beverages sold outside of the federal school lunch and breakfast programs in venues such as vending machines, a la carte offerings in the cafeteria, snack bars, school stores and fundraisers. The food items that are allowed to be sold in these venues must meet criteria for total calories, as well as calories from fat and sugar that would in effect limit the sale of high-energy-dense foods. National nutrition standards do not exist for worksites. In worksites, standards and criteria used for policy and environmental changes are often established collaboratively by management and employee advisory committees. One worksite intervention study has developed criteria for low-calorie, low-sugar, and low-fat food products sold in
Section III: Interventions and Strategies Addressing NPAO Target Areas Reduce Consumption of High-Energy-Dense Foods January 2008
97
vending machines (4). This study is one of seven worksite environmental interventions for weight control and obesity prevention funded by the National Heart, Lung, and Blood Institute (NHLBI). The strategy to limit availability of high-energy-dense foods in the NHLBI studies was changes in vending options (5). Because there are few interventions to limit availability of high-energy-dense foods, there are not general characteristics across these interventions.
Examples
• TACOS (Trying Alternative Cafeteria Options in Schools) was a 2-year, group-randomized, school-based environmental nutrition intervention trial (6). The TACOS intervention consisted of two main components that addressed the school food environment: availability of lower-fat a la carte food in the cafeteria and peer influence via peer promotions of lower-fat foods. TACOS staff and food service staff worked closely to increase the availability of lower-fat a la carte food by 30% from baseline. Lower-fat was defined as 5 grams or less fat per serving. The peer promotion intervention addressed peer influences on adolescent food choices and included taste tests, student food choice self-assessments, and media campaigns (posters, newspaper articles, and videos). Student groups were offered financial incentives for completing each promotion. The results of this study showed that changes made in the school environment to increase availability and promotion of lower-fat food choices had a significant positive impact on sales of lower-fat foods to students.
• Route H Study is a worksite environmental intervention designed to prevent weight gain among metropolitan bus drivers in four garages within the major metropolitan Minneapolis-St. Paul area over a two-year period (4). This multi-component intervention provides opportunities for healthful food choices, physical activity, and weight management. The worksite environment measure (WEM instrument) was developed to assess the food, physical activity, and weight-management environment of the bus garages. The WEM instrument includes 18 items to assess the food environment, including the number and type of vending machines, vending machine contents, microwaves, refrigerators, and water coolers. The food intervention includes increasing the availability of healthful vending machine foods and beverages and providing snack packs for drivers to take along on their bus route. Criteria were developed to identify healthful foods that could be sold in vending machines. Items were coded as healthy if they met the following criteria for calories, fat, and sugar. Low-calorie was defined as < 400 calories for entrée, < 150 calories for snacks and sweets, and < 50 calories for beverages; low-sugar was defined as 35% by weight for entrees, snacks, sweets, and beverages; and low-fat was defined as < 30% total calories for entrees, snacks, sweets, and beverage. This multi-component intervention is currently being implemented so evaluation results are not available. Effectiveness (1,2,4,6)
Few studies have focused on environmental interventions that limit the availability of high-energy-dense foods. School and worksite interventions that limit high-energy-

Section III: Interventions and Strategies Addressing NPAO Target Areas Reduce Consumption of High-Energy-Dense Foods January 2008
98
dense foods have done so by modifying cafeteria menus to decrease the availability of foods high in fat and added sugar or developed criteria to limit high-energy-dense foods sold in vending machines (1,2,4,6). The evaluation results of the NHLBI worksite intervention studies could have important implications for the design and implementation of policy and environmental interventions that limit the availability of high-energy-dense foods. References 1. Knai C, Pomerleau J, Lock K, McKee M. Getting children to eat more fruit and vegetables: a
systematic review Preventive Med 2006;42: 85-95. 2. Pomerleau J, Lock K, Knai C, McKee M. Interventions designed to increase adult fruit and
vegetable intake can be effective: a systematic review of the literature. J Nutr 2005;135(10):2486-95.
3. IOM. Nutrition standards for foods in schools: leading the way toward healthier youth. 2007 [On-line Access] http://www.iom.edu/CMS/3788/30181/42502.aspx
4. Shimotsu ST, French SA, Gerlach AF, Hannan PJ. Worksite environment physical activity and healthy food choices: measurement of the worksite food and physical activity environment at four metropolitan bus garages. Int J Behav Nutr and Phys Act 2007;4:17.
5. Pratt CA, Lemon SC, Fernandez ID, et al. Design characteristics of worksite environmental interventions for obesity prevention. Obesity 2007;15:2171-80.
6. French S, Story M, Fulkerson JA, Hannan P. An environmental intervention to promote lower fat food choices in secondary schools: outcomes from the TACOS study. Am J Public Health 2004;94:1507-1.

Target Area: Decrease Television Viewing
Background and Rationale Although the American Academy of Pediatrics (1) recommends no screen time for children under two years of age and no more than 1-2 hours per day for children two and over, watching television (TV) is a common sedentary activity among American children. A recent survey found that 61% of children under age two use screen media and 43% watch TV every day, and 41% of 2- to 3-year-olds and 43% of 4- to 6-year-olds use screen media for 2 hours or more on an average day (2). Children 8-18 years of age watch an average of 3 hours of television every day (3). Fifty-nine percent of U.S. adults report watching more than 2 hours a day of television (4). More time is spent watching television by African American and Hispanic children than white children, and, among children 6 years old and under, by those in households with lower socio-economic status (2-3). Studies have found a positive association between the number of hours children and adults watch television and the prevalence of overweight and obesity (3-5), and a school-based intervention has shown that children who reported a decrease in time watching television also had a decrease in body mass index (BMI) (7). Research also shows a link between TV viewing in childhood and obesity in adulthood (8-9). Proposed mechanisms for the relationship between TV viewing and obesity include a reduction of resting metabolic rate while watching TV, displacement of physical activity, excess energy intake while watching TV, and exposure to marketing of high-energy-dense foods (8-9). The Division of Nutrition, Physical Activity and Obesity has conducted focus groups on TV viewing among children and parents and found that there are numerous barriers to reducing television watching (10). Watching TV is common in most U.S. households, and many children and adults enjoy watching television, not perceiving the amount of time they watch as a problem. There also is substantial confusion as to what television limits would entail and what “counts.” Reducing TV time would require parents to find alternative activities to keep their children safely and quietly engaged, and it could also prevent parents from accomplishing other tasks, could increase conflict between parents and children or between siblings, and would require parents to change their own TV-viewing behavior. Decreasing Television Viewing: Intervention Strategies Description The few published reports on interventions to reduce television viewing have focused primarily on children and youth. Those efforts that do show evidence of success include curricula for childcare settings (11), elementary schools (7, 12), middle schools (13), clinic-based interventions (14-15), and an after-school dance program and home-delivered lessons (16). The childcare intervention was part of a health-promotion curriculum and included classroom activities as well as take-home materials for parents
Section III: Interventions and Strategies Addressing NPAO Target Areas Decrease Television Viewing January 2008
99
Section III: Interventions and Strategies Addressing NPAO Target Areas Decrease Television Viewing January 2008
100
and parent-child activities (11). School-based interventions integrated TV-reduction efforts into existing curricula including math, science, language arts, and social studies (7,12,13). Parental components that involve newsletters for or homework assignments with parents as well as program activities that include campaigns focusing on limiting TV-viewing time such as “My TV Unplugged” or “Power Down” were included in childcare, school-based, and after school interventions (7,11,12,13,16). Self evaluation/assessment of the organization or individual and goal-setting that includes selective TV viewing and time management or budgeting of media time were included in almost all intervention settings. Because there are few interventions, there are not general characteristics across interventions for this strategy. Examples
• Brocodile the Crocodile (11) is a health-promotion childcare curriculum intervention
to reduce television viewing. Each of the intervention’s seven sessions consists of a 30-minute musical activity, a 10-minute snack, and a 20-minute interactive education component. Take-home materials for parents and parent-child activities are also included. Children in the intervention group, compared to children in the control group, had a relative mean reduction by parental report of 4.7 hours/week in their television/video viewing, which is statistically significant.
• A 4-week primary-care intervention for low-income African American families (15) addressed television and video watching and video game-playing. The families were randomized to receive counseling alone or counseling plus a behavioral intervention that included an electronic television time manager. The counseling alone intervention included brief counseling of the family and three brochures from the American Academy of Pediatrics. The counseling plus behavioral intervention received the same brief counseling and brochures plus information on monitoring and setting media budgets, and an electronic media manager. Both intervention groups reported decreases in the amount of time that children spent watching television and videotapes and playing video games (mean changes of -13.7 and
-14.1 hours per week), but they were not statistically significant. • Eat Well and Keep Moving (13) and Planet Health (13) are school-based
interventions to improve activity and dietary behaviors among 4th and 5th grade students and 6th, 7th, and 8th grade students, respectively. The programs are similar in that they focus on four behavioral changes: reducing television viewing to less than 2 hours per day; increasing moderate and vigorous physical activity; decreasing consumption of high-fat foods; and increasing consumption of fruits and vegetables to 5 a day or more. These interventions were designed to provide students with cognitive and behavioral skills to enable change in these behaviors. They differ in their outcome measures. The primary end points for the Eat Well and Keep Moving intervention is changes in television viewing, physical activity and dietary intake. The lesson plans are age-appropriate so they also differ in content. Classroom materials are based on social cognitive theory and include 50-minute lessons and classroom-based campaigns that also include activities at home for

Section III: Interventions and Strategies Addressing NPAO Target Areas Decrease Television Viewing January 2008
101
family members. The intervention is taught by classroom teachers and intervention materials provide links to school food service staff and families. The primary end point for the Planet Health intervention is obesity prevention although measures of television viewing, physical activity, and dietary intake were collected. Television viewing was marginally reduced by -0.55 hours/day, however it was not statistically significant (P=.06) in the Eat Well and Keep Moving intervention. In the Planet Health intervention the reduction of television viewing was statistically significant, girls reduced their television viewing by -0.58 hours per day and boys reduced their television viewing by -0.40 hours per day. The prevalence of obesity among girls participating in the Planet Health intervention was reduced compared to controls and statistically significant; however, there was no differences found among boys.
• The SMART classroom curriculum (7) was developed for 3rd and 4th graders and addressed the children’s screen time (television and video watching, and video game use). The curriculum incorporated eighteen 30-50 minute lessons into an existing curriculum for 6 months. Lessons included self-monitoring and self-reporting of television, videotape, and video game use to motivate children to want to reduce the time they spent in these activities. These lessons were followed by a television turn off during which children were challenged to watch no television or videotapes, and plan no video games for 10 days. After the turnoff, children were encouraged to follow a 7-hour per week budget of television, videotape, and video games. In addition, each participating household was given an electronic television time manager. This device locks onto the power plug of the television set and monitors and budgets viewing time for each member of the household through use of personal identification codes. Parents received newsletters that were designed to motivate them to help their children stay within their time limits. Relative to controls, the intervention group of children had statistically significant decreases in child- and parent-reported television viewing hours per week. Also compared to controls, children in the intervention group had statistically significant relative decreases in body mass index.
• Stanford GEMS (16) was designed to reduce television, videotape, and video-game use among African-American girls aged 8-10 years. The intervention consists of after-school dance classes (GEM) at three community centers and a five-lesson intervention called START (Sisters Taking Action to Reduce Television) delivered in participants’ homes. The GEMs dance classes were offered 5 days a week, and girls were encouraged to attend the dance classes as often as possible over the 3-month study period. Each daily class lasted up to 2.5 hours, starting with a healthful snack, an hour homework period, and 45-60 minutes of moderate-to-vigorous dance. The sessions ended with 30 minutes of GEMS talks exploring the meaning of dance. The START intervention consisted of 5 lessons delivered during home visits. Specific behavioral goals were based on self-monitoring, a 2-week TV turn-off, and budgeting TV viewing. The intervention resulted in reductions of more than 20% in television, videotape, and video game use among the intervention group of girls, and statistically significant reductions in reported household television viewing.

Section III: Interventions and Strategies Addressing NPAO Target Areas Decrease Television Viewing January 2008
102
Effectiveness
Intervention studies to reduce television viewing have shown reductions in the hours of TV viewing that range from 3.1 to 5.5 hours per week.
References
1. American Academy of Pediatrics. Children, adolescents, and television. Ped
2001;107(2):423-26. [On-line Access] http://aappolicy.aappublications.org/cgi/content/full/pediatrics;107/2/423 2. Rideout VJ, Hamel E. The Media family: electronic media in the lives of infants, toddlers,
preschoolers and their parents. Menlo Park: Henry J. Kaiser Family Foundation, 2006. 3. Roberts DF, Foehr UG, Rideout V. Generation M: media in the lives of 8-18 Year-olds.
Menlo Park, CA: Henry J. Kaiser Family Foundation, 2005. 4. Bowman SA. Television-viewing characteristics of adults: correlations to eating practices
and overweight and health status. Prev Chronic Dis 2006;3(2). [Available On-line] http://www.cdc.gov/pcd/issues/2006/apr/05_0139.htm.
5. Marshall SJ, Biddle SJH, Gorely T, et al. Relationships between media use, body fatness, and physical activity in children and youth: a meta-analysis. Int J Obes 2004;28:1238-46.
6. Kaur H, Choi WS, Mayo MS, Harris KJ. Duration of television watching is associated with increased body mass index. J Pediatr 2003;143:506-11.
7. Robinson T. Reducing children’s television viewing to prevent obesity: a randomized controlled trial. JAMA 1999;282:1561-67.
8. Viner RM, Cole TJ. Television viewing in early childhood predicts adult body mass index. J Pediatr 2005;147:429-35.
9. Hancox RJ, Milne BJ, Poulton R. Association between child and adolescent television viewing and adult health: a longitudinal birth cohort study. Lancet 2004;364:257-62.
10. Jordan AB, Hersey JC, McDivitt JA, Heitzler CD. Reducing children’s television-viewing time: a qualitative study of parents and their children. Pediatrics 2006;118(5):1303-10.
11. Dennison BA, Russo RJ, Burdick PA, Jenkins PL. An intervention to reduce television viewing by pre-school children. Arch Pediatr Adolesc Med 2004;158-76.
12. Gortmaker Sl, Cheung, LWY, Peterson, KE, et al. Impact of a school-based interdisciplinary intervention on diet and physical activity among urban primary school children: Eat Well and Keep Moving. Arch Pediatr Adolesc Med 1999;153(9):975-83.
13. Gortmaker SL, Peterson K, Wiecha J, et al. Reducing obesity via a school-based interdisciplinary intervention among youth: Planet Health. Arch Pediatr Adolesc Med 1999; 153(4):409-18.
14. Epstein LH, Paluch RA, Gordy CC, Dorn J. Decreasing sedentary behaviors in treating pediatric obesity. Arch Pediatr Adolesc Med 2000;154:220-26.
15. Ford B, Tiffany BS, McDonald E, et al. Primary care interventions to reduce television viewing in African-American children. Am J Prev Med 2002;22(2):106-09.
16. Robinson TN, Killen JD, Kraemer HC, et al. Dance and reducing television viewing to prevent weight gain in African-American girls: the Stanford GEMS pilot study. Ethnicity & Dis 2003;13( Suppl 1):S65-77.

Section IV: Resources January 2008
103
Section IV:
Resources

Section IV: Resources January 2008
104
Selected National Reports that Support Public Health Efforts in Nutrition, Physical Activity, and Obesity Prevention Numerous national reports and partnerships call for efforts to prevent and control obesity and improve public health. The following are several examples that have relevance to the work of the CDC Division of Nutrition, Physical Activity and Obesity and its state program activities. Surgeon General’s Call to Action to Prevent and Decrease Overweight and Obesity (http://www.surgeongeneral.gov/topics/obesity/) This document identifies 15 activities as national priorities for immediate action; many focus on increasing access to healthy food choices and to safe physical activity options. The report also calls for action across multiple sectors (i.e. business, government, healthcare) and at multiple levels (i.e. individual, family, community, states, and nation). Preventing Childhood Obesity: Health in the Balance by the Institute of Medicine (http://www.iom.edu/CMS/3788/5867/22596.aspx) This report includes the following recommendations for state and local governments to address the problem of childhood obesity (pages 148 and 324):
• Provide coordinated leadership and support for childhood obesity prevention efforts, particularly those focused on high-risk populations, by increasing resources and strengthening policies that promote opportunities for physical activity and healthful eating in communities, neighborhoods, and schools.
• Support public health agencies and community coalitions in their collaborative efforts to promote and evaluate obesity prevention interventions.
• Expand and promote opportunities for physical activity in the community through changes to ordinances, capital improvement programs, and other planning practices.
• Work with communities to support partnerships and networks that expand the availability of and access to healthful foods.
Physical Activity and Health, A Report of the Surgeon General This report (http://www.cdc.gov/nccdphp/sgr/sgr.htm) brings together, for the first time, what has been learned about physical activity and health from decades of research. Among its major findings:
• People who are usually inactive can improve their health and well being by becoming even moderately active on a regular basis.
• Physical activity need not be strenuous to achieve health benefits. • Greater health benefits can be achieved by increasing the amount (duration,
frequency, or intensity) of physical activity.
Guidelines for Comprehensive Programs to Promote Healthy Eating and Physical Activity In 1999, the Nutrition and Physical Activity Work Group (NUPAWG) formulated the above named guidelines for state and local health advocates who want to create their own comprehensive nutrition, physical activity, and obesity control programs. The document identifies seven program components:

Section IV: Resources January 2008
105
1. Leadership, Planning/Management, and Coordination 2. Environmental, Systems, and Policy Change 3. Mass Communication 4. Community Programs and Community Development 5. Programs for Children and Youth 6. Health Care Delivery 7. Surveillance, Epidemiology, and Research
The document is available at http://www.astphnd.org/. Blueprint for Nutrition & Physical Activity, Cornerstones of a Healthy Lifestyle The Association of State and Territorial Public Health Nutrition Directors organized groups of stakeholders to guide and review this Blueprint, which outlines practical, consumer-focused, state and local strategies for improving eating and physical activity that will lead to healthier lives for children, adults and families. The Blueprint provides communities, consumers, organizations, agencies and programs with strategies and potential actions to address priority nutrition and physical activity issues in the context of their own community resources and needs. The suggested strategies and actions are based on the Healthy People 2010 objectives and the Dietary Guidelines for Americans, and reflect the perspectives of a range of public and non-profit sector organizations. The document identifies the following cornerstones:
• Access: Ensure access to healthful foods and locations to engage in physical activity.
• Collaboration: Promote healthful lifestyles by maximizing collaboration and partnerships.
• Science and research: Build the science base and accelerate the transfer of science to practice.
• Workforce: Increase the diversity, capacity, and flexibility of the nutrition and physical activity workforce.
• Communications: Promote health and create awareness of the investment value of nutrition and physical activity through effective communications.
The document is available at http://www.astphnd.org/. Global Strategy on Diet, Physical Activity and Health
In May 2004, the World Health Organization adopted the "Global Strategy on Diet, Physical Activity and Health." The Global Strategy has four main objectives:
• Reduce risk factors for chronic diseases that stem from unhealthy diets and physical inactivity through public health actions.
• Increase awareness and understanding of the influences of diet and physical activity on health and the positive impact of preventive interventions.
• Develop, strengthen and implement global, regional, national policies and action plans to improve diets and increase physical activity that are sustainable, comprehensive and actively engage all sectors.
• Monitor science and promote research on diet and physical activity. The full report is available at http://www.who.int/dietphysicalactivity/goals/en/index.html.

Section IV: Resources January 2008
106
Dietary Guidelines for Americans, 2005 This document has been published jointly every 5 years since 1980. The Guidelines provide authoritative advice for people two years and older about how good dietary habits can promote health and reduce risk for major chronic diseases. They serve as the basis for Federal food and nutrition education programs. The most recent version was published in 2005 by the Department of Health and Human Services (DHHS) and the Department of Agriculture (USDA).The Guidelines can be found at http://www.health.gov/dietaryguidelines/. Healthy People 2010: Understanding and Improving Health Healthy People 2010 provides a framework for prevention for the nation. It is a statement of national health objectives designed to identify the most significant preventable threats to health and to establish national goals to reduce these threats. This document can be accessed at http://www.healthypeople.gov/Document/tableofcontents.htm.

APPENDICES January 2008
107
APPENDICES

APPENDICES January 2008
108
Appendix A
Social Marketing, the Social-Ecological Model, and Evidence-Based Strategies
This appendix describes how social marketing, the Social-Ecological Model, and evidence-based strategies can be used together to develop interventions that have maximum impact on nutrition, physical activity, and obesity. Social Marketing Social marketing has been described as “(t)he application of commercial marketing technologies to the analysis, planning, execution, and evaluation of programs designed to influence the voluntary behavior of target audiences in order to improve their personal welfare and that of their society” (Andreasen, 1995, p. 7). A commercial marketer looks for ways to convince consumers to buy a product. Similarly, a social marketer tries to get a target audience to change how they behave. To accomplish this, the social marketer first conducts strategic, formative research to determine an audience’s wants and needs. Based on that research, the marketer then designs creative, innovative ways based on evidence-based interventions to satisfy those wants and needs while fostering desired behavior changes. Used systematically, social marketing can be an effective tool in all phases of nutrition, physical activity, and obesity-prevention interventions. Social marketing is not only useful for individual or “end-user” behavioral change; it can also be used to create policy and environmental change. Whether an intervention encourages individuals to eat more fruits and vegetables, or school principals to turn off vending machines, or community developers to add sidewalks to new streets, the same principles apply. Foundational Principles of Social Marketing Exchange People operate in a world driven by self-interest. Social marketing determines what an audience needs and how best to meet those needs, given what is available. The audience’s needs are met, and, in exchange, members adopt the desired behavior. Behavior change Social marketing interventions are intended to bring about behavior change, not just changes in awareness, attitudes, or knowledge. An audience is asked to do something, not just know or believe something. Audience orientation A social marketing program must be designed to meet the real needs of an audience, not the needs that planners believe the audience should have.

APPENDICES January 2008
109
Audience segmentation Not every member of the public is alike when it comes to motivations, benefits, and barriers to change. By segmenting an audience, social-marketing programs avoid spreading their resources too thin. Trying to meet everyone’s needs invariably dilutes a product or message, so that, eventually, it meets the needs of no one. Competition Behaviors do not exist in a vacuum. Social marketing attempts to identify competing behaviors and provide audience members with more appealing options. Marketing mix Social marketing strategies address one or more of the “Four Ps of Marketing”:
• Product: The product is the behavior the audience is encouraged to adopt. It can also include the benefits of adopting a particular behavior, or tangible goods or services offered as part of a social marketing program.
• Price: The price is the cost of, or barriers to, adopting a desired behavior. Cost can be tangible, such as money, or intangible ― e.g., time, embarrassment, or loss of social status.
• Place: The place is where target audience members exhibit a desired behavior, or where they receive social marketing messages or materials. The social marketer aims to make the behavior as convenient and accessible as possible.
• Promotion: Promotion refers to any messages, materials, or activities that help reduce barriers to, or increase the benefits of, a desired behavior. A common misperception is that social marketing is only promotion. In fact, an effective social marketing program incorporates all of the Four Ps.
For information on how to use social marketing in nutrition, physical activity, and obesity-prevention interventions, visit DNPAO’s online Social Marketing Resources section: www.cdc.gov/nccdphp/dnpa/socialmarketing/index.htm. Note the links to the University of South Florida’s Obesity Prevention Coordinators’ Social Marketing Guidebook and CDCynergy: Social Marketing Edition Version 2.0, on which the guidebook is based. (The CDCynergy CD-ROM can be ordered online for a small fee.) The Social-Ecological Model An effective strategy to address nutrition, physical activity, and obesity prevention must aim for widespread change in eating and physical-activity behaviors. Research has shown that behavior change is more likely to last when the individual and his or her entire environment undergo change simultaneously (Lasater et al. 1984; Abrams 1991). Thus, interventions that address individual behavior change as well as the social, physical, and environmental contexts of that change have the potential for population-wide impact (Stokals 1996). The Social-Ecological Model, first described by McLeroy, Bibeau, Steckler, & Glanz (1988), provides a framework in which to develop, implement, and evaluate comprehensive interventions. The model stresses that society is composed of interconnected elements—individual, interpersonal, organizational, community, and social—that invariably affect one another. A comprehensive intervention should

APPENDICES January 2008
110
consider how all these levels of influence can be addressed to support long-term, healthful lifestyle choices. Activities based on this model can, for example:
• Teach skills needed to make individual behavior changes related to nutrition, physical activity, and healthful weight—and provide opportunities to practice these skills.
• Create supportive environments, making healthful lifestyle options more accessible and affordable.
• Help influence changes in rules, regulations, or structures of institutions and organizations.
• Establish behavior change programs in communities to increase physical activity and/or reduce caloric intake through healthful eating habits.
• Help influence the creation of policies and standards to support healthful eating and physical activity in communities.
Integrating Social Marketing, the Social-Ecological Model, and Evidence-Based Strategies In addition to using social marketing and the Social-Ecological Model when developing an intervention, evidence-based strategies form the basis of the intervention. This manual has a section (starting on page 34) describing evidence-based strategies that have varying strengths of association to create the desired change in a nutrition or physical activity intervention. When planning an intervention, first use social marketing to conduct formative research on the motivators and barriers related to a specific target audience. Then, look to the evidence-based strategies described in this manual to see which might match up with those particular motivations and barriers. It is important that planners look for effective interventions that are implemented at multiple levels of Social-Ecological Model or implement effective interventions at each level of the model. Once evidence-based strategies are chosen, the results from the social marketing planning process help determine how to implement the chosen strategies. This includes considerations such as message creation and positioning, the packaging of intervention elements, and developing effective partnerships with the right groups. The evidence-based strategies are usually not detailed enough to serve as comprehensive intervention plans on their own. Tailoring strategies based on formative research results ensures their relevance to the target audience. Of course, there is still an element of “art” involved in intervention development; innovation and creativity, problem solving, and critical thinking are all vitally important to the intervention planning process.

APPENDICES January 2008
111
References/Resources Abrams DB. Conceptual models to integrate individual and public health interventions: the example of the workplace. In Proceedings of the International Conference on Promoting Dietary Change in Communities. Seattle: The Fred Hutchinson Cancer Research Center, 1991; pp. 170-190. Andreasen AR. Marketing social change: changing behavior to promote health, social development, and the environment. San Francisco: Jossey-Bass, 1995. CDCynergy Social Marketing Edition. Free copy available at http://www.turningpointprogram.org/. CDC Division of Nutrition, Physical Activity and Obesity. Social Marketing Resources. Available at http://www.cdc.gov/dnpa/socialmarketing Lasater T, Abrams D, Artz L, et al. Lay volunteer delivery of a community-based cardiovascular risk factor change program: the Pawtucket Experiment. In Behavioral Health: A Handbook of Health Enhancement and Disease Prevention. Matarazzo JD, Weiss SM, Herd JA (ed). New York: Wiley, 1984:1166-70. McLeroy KR, Bibeau D, Steckler A, Glanz K. An ecological perspective on health promotion programs. Health Ed Q 1988; Winter;15(4):351-77.
Stokals D. Translating social ecological theory into guidelines for community health promotion. Am J Health Promotion 1996;10(4):282-98. The Robert Wood Johnson Foundation’s National Training Point Initiative Web site has information and resources on social marketing. Available at http://turningpointprogram.org/Pages/socialmkt.html.
APPENDICES January 2008
112
Appendix B
State Implementation Plan Action-Planning Worksheet Instructions
Once objectives are prioritized, fill out an Action-Planning Worksheet for each activity relating to the objectives chosen for the coming year. The following form can be used to develop a one-year implementation plan. • Goals/objectives are taken directly from the published state plan.
• Activities are the specific work or projects that must be completed to achieve the objective. They should be completed in sequential order in which one activity will enable the next.
• Target audience is the specific organizations or population that the activity is
designed to affect.
• Evaluation indicator for the activity is a specific piece of information or data element that indicates whether the activity is being achieved. This could be a process measure.
• What needs to be done to implement the activity are the specific tasks to be
done.
• Deliverables are tangible products or completed actions that result when the task is completed.
• Resources needed are the staff, funds, facilities and materials required to complete
the task. (This item is addressed for each task.) Resources can be existing and/or needed. Information about where the resource is from or being obtained should be included in this column.
• Responsible partners are the organizations or people accountable for the work
involved in the planning and implementation of the task. The state public health department is one partner.
• Timeframe for implementing and completing the activity refers to the beginning of the planning through the completion of the task.

APPENDICES January 2008
113
Appendix B
State Implementation Plan Action-Planning Worksheet
State Plan Work Group or Committee (list all workgroup members here):
Goal: Objective: Activity: Target Audience: Evaluation Indicator: What needs to be
done to implement the activity
Deliverables
Resources Needed
Responsible Partner(s)
Timeframe Date completed
APPENDICES January 2008
114
Appendix C
The Nutrition and Physical Activity Program to Prevent Obesity and Other Chronic Diseases:
Definition of an Intervention I. Introduction
The following is how the Nutrition, Physical Activity and Obesity Program defines “intervention” for the purpose of reporting in the Progress Monitoring Report (PMR).
Broadly speaking, an intervention is a deliberate process by which desired changes are produced in the health and behaviors of targeted populations; specific interventions are defined by program goals and expected outcomes. The Program’s operational definition of an intervention is: “An activity with the main purpose of changing existing obesity-, nutrition-, or physical activity-related behaviors and/or practices.” II. General Characteristics of Interventions At a minimum, an intervention should contain all of the following components:
• It is grounded in theory. • Intervention design decisions can be linked to knowledge and understanding of the target
audience. • It has a defined purpose with clearly stated goals and objectives. • It has expected outcomes (to include BMI/BMI for age when appropriate). • It has defined intervention methodology (where, when, and how). • It has a strategy for implementation (to include collaboration with partners). • Target population(s) segment(s) relate to populations identified in the state plan. • It has defined evaluation design and methodology.
In addition to these requirements, an intervention should address a level of the Social-Ecological Model (individual, interpersonal, organizational, community, society) and be:
• Designed to establish supportive environments, making healthier lifestyle options (i.e., healthy eating and physical activity) in communities more readily accessible, affordable, comfortable, and safe.
• Designed to establish policies and standards to support healthy eating and physical activity in communities.
• Designed to change rules, regulations or structures of institutions and organizations. • Designed to establish programs in communities to increase physical activity and/or
reduce caloric intake through healthy eating habits. • Designed to teach skills needed to make individual behavior changes related to nutrition,
physical activity, and healthy weight, and designed to provide opportunities to practice these skills.
The following projects or activities are not considered interventions:
• Curriculum that has been purchased or designed and not put into use • Curriculum that has been purchased or designed and not tailored to the target audience • Training alone (can be an important part of an intervention) • Conference participation and health fairs • Presentations at conferences and forums • Coalition or task force meetings

APPENDICES January 2008
115
Appendix D University of North Carolina
Center of Excellence for Training and Research Translation
2006 Competencies (revised 7-20-06)
The University of North Carolina, as part of a Prevention Research Center cooperative agreement special interest project, developed the following competencies for the NPAO and Wisewoman Programs regarding state staff capabilities needed to fully implement their state programs. States may find these identified competencies helpful. The competencies were derived from those previously developed for the public health workforce including:
1. Core Competencies for Public Health Professionals (HRSA) 2. MPH Core Competency Development Project (Association of Schools of Public
Health - ASPH) 3. Guidelines for Community Nutrition Supervised Experiences (ADA)
See http://www.center-trt.org/index.cfm for more details on the Center of Excellence for Training and Research Translation.
Analytic Assessment: Identify relevant and appropriate population data and information sources to inform
program planning and evaluation
Identify relevant and appropriate community level environmental and broad statewide policy data and information sources to inform program planning and evaluation.
Determine the appropriate use of qualitative data (e.g. focus groups, opinion surveys) including limitations and relevant inferences from qualitative data
Determine the appropriate use of quantitative data (e.g. vital statistics, surveillance data) including limitations and relevant inferences from quantitative data
Identify economic and societal trends which have implications for the health and nutritional status of the population
Ensure that mechanisms (systems) to monitor and evaluate programs for their effectiveness and quality are established and maintained
Policy Development and Program Planning: Engage critical stakeholders in the planning, implementation and evaluation of statewide
public health programs, policies and interventions
Identify individual, organizational and community concerns, needs, assets, deficits and resources for public health interventions and programs
Specify segments of the population and multiple levels of intervention for program and policy intervention planning and implementation
Use evidence-informed nutrition and physical activity approaches in developing and/or implementing multilevel interventions

APPENDICES January 2008
116
Use evidence-informed nutrition and physical activity policy approaches in developing legislation and standards.
Implement steps and procedures for planning and implementing public health programs, policies and interventions utilizing planning models (MATCH, Precede-Proceed, PATCH)
Develop a plan to monitor and evaluate program, including policy, goals with measurable outcome and process objectives
Public Health Science: Apply basic theories (e.g. Social Cognitive), concepts (e.g. REAIM), and models (e.g.
socioecologic) from a range of social and behavioral disciplines to intervention translation and design.
Identify the biological and physiologic aspects of nutrition and physical activity along with their relation to body weight and chronic disease throughout the life cycle, particularly in vulnerable populations.
Influence factors that impact the food supply system (price, production, processing, distribution and consumption).
Influence factors that impact the accessibility and opportunity for physical activity within the community structure (e.g., local organizations, school system, parks and recreation department).
Communication: Communicate effectively both in writing and orally with diverse audiences
Lead and/or actively participate in collaborative public health groups for planning and problem solving (i.e. coalition, task force, organizational group)
Develop outreach methods to increase client participation in public health programs
Develop retention methods to increase client participation in public health programs
Use principles of media advocacy (using the media to set the agenda and shape the debate) to influence policy makers and public opinion and encourage social change that supports health and reduces risk of chronic disease
Use principles of social marketing (strategy, audience segmentation, consumer orientation) to determine the most effective media strategies and design messages to reach various segments of the population
Communicate federal guidelines, recommendations and intervention strategies relevant to physical activity, nutrition and chronic disease prevention.
Community Dimensions of Practice: Establish and maintain linkages with key community stakeholders
Conduct a community public health assessment that identifies the community’s assets and available resources
Develop participatory and collaborative partnerships with communities using a variety of formal and informal mechanisms to inform program design and implementation
Work with communities to build capacity and infrastructure to address prevention of obesity, cardiovascular disease, and other chronic diseases
APPENDICES January 2008
117
Work with communities to change organizations, policies, and environments for prevention and control of obesity, cardiovascular disease and other chronic diseases
Diversity and Cultural Proficiency: Utilize appropriate methods for interacting sensitively, effectively and professionally with
persons from diverse cultural, socioeconomic, educational, racial and ethnic backgrounds
Identify the diverse cultural values and traditions within a community and their influence on the attitudes and expectations of individuals
Identify the role of cultural, social and behavioral factors in determining the delivery of public health interventions and/or services
Develop and adapt interventions that take cultural differences into account to address obesity, cardiovascular disease, and other chronic diseases
Consider the impact of decisions, programs and policies on health disparities, including unintended consequences
Financial Planning and Management: Apply basic human relation skills, including negotiation and conflict management, to the
management of personnel, programs and organizations
Develop a work plan or business plan (assess health needs, analyze markets, create budgets, design evaluation measures, and mobilize community partners) to sustain program over the long term
Apply principles of financial management of health services, including forecasting of fiscal needs, budget preparation and justification, reimbursement systems, and control of revenues and expenditures
Prepare and manage grants and contracts including preparing requests for proposals, review of proposals, negotiation, monitoring contract budget expenditures and progress, and providing technical assistance
Consider multiple types of cost, scalability and sustainability of interventions, as well as more complex issues such as cost effectiveness when making decisions.
Leadership and Systems Thinking: Create and communicate a shared vision, mission and core values for the
WISEWOMAN or Obesity Prevention program
Champion solutions to organizational and community challenges to health promotion and energize commitment to common goals.
Delegate responsibility, share power (including budgetary control), promote, review and sustain partnerships, and work effectively in teams to achieve program goals
Recognize and influence the dynamic interactions between political, financial, social, and environmental systems and their impact on chronic disease
Lead efforts to change social systems in support of healthy eating, physical activity and chronic disease prevention
APPENDICES January 2008
118
Consider political and ethical implications within and across organizations and communities, and their impact on chronic disease prevention program planning, policy and decision making

APPEJanuary 200
NDICES 8
119
Appendix E Logic Models for NPAO Programs
The next two page of this manual contain two versions of the logic model framework for nutrition and physical activity programs to prevent obesity and chronic diseases.

APPENDICES January 2008
120

APPENDICES January 2008
121
Version: Dec 4, 2003
Activity Programs to Prevent Obesity and Chronic Diseases
Reduce Prevalence of
Chronic Diseases (Including
Diabetes and Cardiovascular
Disease
Master Logic Model Framework for Nutrition and Physical
Reduce Prevalence of
Chronic Diseases (Including
Diabetes and Cardiovascular
Disease
CDC Resources and Investments
Federal Program Funding
Professional Staff
Time Commitment
Internal/External Partners & Stakeholders
Technology (e.g., teleconference bridge;
listserv)
Surveillance Systems
Evidence-based Synthesis of Findings on Nutrition,
Physical Activity & Obesity
CDC Resources and Investments
Federal Program Funding
Professional Staff
Time Commitment
Internal/External Partners & Stakeholders
Technology (e.g., teleconference bridge;
listserv)
Surveillance Systems
Evidence-based Synthesis of Findings on Nutrition,
Physical Activity & Obesity
Consultants(e.g., social marketing; logical
framework)
Consultants(e.g., social marketing; logical
framework)
CDC INPUTSCDC
INPUTS
Establish & Manage State Grant Program Establish & Manage State Grant Program
Establish Communication
Channels with Funded States
Establish Communication
Channels with Funded States
Provide Training and TA to Funded States on Social Marketing, Logic
Modeling, and Other Topics
Provide Training and TA to Funded States on Social Marketing, Logic
Modeling, and Other Topics
Develop a Master Logic Model for Evaluation
Develop a Master Logic Model for Evaluation
CDCACTIVITIES
CDCACTIVITIES
State Resources and Investments
State Program Funding
Professional Staff & Infrastructure
Time Commitment
Surveillance Systems
State Partners & Stakeholders
State Resources and Investments
State Program Funding
Professional Staff & Infrastructure
Time Commitment
Surveillance Systems
State Partners & Stakeholders
STATE CAPACITYSTATE
CAPACITY
CDC-State-Local Communication Linkages:(e.g., CDC Project Officer;
conference calls & site visits; obesity listserv)
CDC-State-Local Communication Linkages:(e.g., CDC Project Officer;
conference calls & site visits; obesity listserv)
State Program Directors and Staff Trained in Social
Marketing, Logic Modeling & Other Topics
State Program Directors and Staff Trained in Social
Marketing, Logic Modeling & Other Topics
State-specific Logic ModelState-specific Logic Model
Conduct Strategic Planning
IdentifyPopulation(s)
Conduct Formative Res. To Assess Existing Efforts
Identify & Involve Internal/External
Partners
Identify Data Sources
STATE ACTIVITIES *
STATE ACTIVITIES *
Develop State Plan for Population(s)
Develop State Plan for Population(s)
Implement and Evaluate Interventions for Target
Population(s)
Implement and Evaluate Interventions for Target
Population(s)
Provide Training and TA to State Health Dept Staff and
Partners & Community Stakeholders**
Provide Training and TA to State Health Dept Staff and
Partners & Community Stakeholders**
Long-term Nutrition and
Physical Activity
Strategies are Established
and Interventions
to Prevent Obesity and
Other Chronic Diseases are Delivered on
a More Widespread
Basis
Increased and
Sustainable Resources
From States and Other
Partners are Mobilized
and Targeted for Nutrition and Physical
Activity
OUTCOMESSHORT TERM MEDIUM TERM LONG TERM
OUTCOMESSHORT TERM MEDIUM TERM LONG TERM
Reduce Prevalence of Obesity
Reduce Prevalence of Obesity
Behavior Change
Increased Physical Activity
Better Dietary Habits
Behavior Change
Increased Physical Activity
Better Dietary Habits
+ +
State andCommunity
Environmental Support
Systems Are Established
State andCommunity Policies Are Established
Interventions Improve BMI
or Allow Maintenance
of Normal BMI Levels
Increased Evidence on
Effective Interventions is Obtained
Interventions Improve
Nutrition and Physical
Activity for Targeted
Population(s)
Short-term outcomesare expected in the funded states.
Achievement of medium- and long-term outcomes is dependent on extended funding and additional resources.
Contextual Influences (e.g., culture; socio-demographics; other related programs) * Basic implementation (BI) states must address secondary, as well as primary prevention. **BI must extend training/TA to local/regional level.