state of california seasonally adjusted employment data · 2020-04-17 · b ÊÄe ÊÄÊî Ý...
TRANSCRIPT

State of California Seasonally Adjusted Employment Data

Contents
State of California 1San Francisco Bay Area: San Francisco (MD) 2San Francisco Bay Area: San Jose (MSA) 3San Francisco Bay Area: Oakland (MD) 4San Francisco Bay Area: Napa County 5San Francisco Bay Area: San Rafael (MD) 6San Francisco Bay Area: Sonoma County 7San Francisco Bay Area: Solano County 8Southern California: Los Angeles (MD) 9Southern California: Orange County 10Southern California: San Diego County 11Southern California: Ventura County 12Southern California: Inland Empire (MSA) 13Southern California: Imperial County 14Central Coast: Santa Cruz County 15Central Coast: Monterey County 16Central Coast: San Luis Obispo County 17Central Coast: Santa Barbara County 18North Central Valley: Sacramento (MSA) 19North Central Valley: San Joaquin County 20North Central Valley: Yuba City (MSA) 21North Central Valley: Bu e County 22North Central Valley: Shasta County 23South Central Valley: Stanislaus County 24South Central Valley: Merced County 25South Central Valley: Madera County 26South Central Valley: Fresno County 27South Central Valley: Kings County 28South Central Valley: Tulare County 29South Central Valley: Bakersfield (MSA) 30
B E
Seasonally Adjusted Employment Es mates 1 March 2020

B E
State of California
State of California Seasonally Adjusted Employment ChangesIndustry Mar-20 Feb-20 MoM (000s) MoM (%) Mar-19 YoY (000s) YoY (%)
Farm 432.2 431.1 1.1 0.3 421.1 11.1 2.6Total Nonfarm 17,505.0 17,604.5 -99.5 -0.6 17,354.6 150.4 0.9
Total Private 14,868.0 14,972.7 -104.7 -0.7 14,757.5 110.5 0.7Construc on 885.3 896.9 -11.6 -1.3 875.5 9.8 1.1NR/Mining 23.0 22.7 0.3 1.3 22.5 0.5 2.2Manufacturing 1,310.4 1,315.7 -5.3 -0.4 1,327.5 -17.1 -1.3Durable Goods 849.9 852.1 -2.2 -0.3 850.5 -0.6 -0.1Non-Durable Goods 460.5 463.6 -3.1 -0.7 477.0 -16.5 -3.5
Trade,Transport,U l. 3,059.3 3,063.9 -4.6 -0.2 3,047.4 11.9 0.4Wholesale Trade 689.0 690.8 -1.8 -0.3 697.1 -8.1 -1.2Retail Trade 1,651.7 1,654.9 -3.2 -0.2 1,664.1 -12.4 -0.7Transport,Warehouse,U l. 718.6 718.2 0.4 0.1 686.2 32.4 4.7
Informa on 590.8 588.2 2.6 0.4 558.5 32.3 5.8Financial Ac vi es 855.7 851.7 4.0 0.5 837.3 18.4 2.2Finance and Insurance 547.4 545.3 2.1 0.4 536.9 10.5 2.0Real Estate 308.3 306.4 1.9 0.6 300.4 7.9 2.6
Professional/Business 2,734.6 2,743.2 -8.6 -0.3 2,709.2 25.4 0.9Prof Sci and Tech 1,347.3 1,351.7 -4.4 -0.3 1,321.6 25.7 1.9Management 253.0 252.6 0.5 0.2 256.1 -3.1 -1.2Admin Support 1,133.6 1,138.4 -4.8 -0.4 1,131.3 2.3 0.2
Educa on/Health 2,855.0 2,853.8 1.2 0.0 2,777.9 77.1 2.8Educa onal Services 392.8 392.9 -0.1 -0.0 380.3 12.5 3.3Health Care 2,462.2 2,460.9 1.3 0.1 2,397.6 64.6 2.7
Leisure and Hospitality 1,988.1 2,055.3 -67.2 -3.3 2,027.4 -39.3 -1.9Arts and Entertainment 310.7 331.8 -21.1 -6.4 327.2 -16.5 -5.0Accommoda on and Food 1,677.4 1,723.5 -46.1 -2.7 1,700.2 -22.8 -1.3
Other Services 565.8 581.3 -15.5 -2.7 574.3 -8.5 -1.5Government 2,637.0 2,631.8 5.2 0.2 2,597.1 39.9 1.5Federal Government 252.1 251.7 0.4 0.2 246.9 5.2 2.1State Government 551.0 550.3 0.7 0.1 539.6 11.4 2.1Local Government 1,833.9 1,829.8 4.1 0.2 1,810.6 23.3 1.3
Labor Force 19,264.2 19,516.0 -251.8 -1.3 19,356.8 -92.6 -0.5Employment 18,244.1 18,756.7 -512.6 -2.7 18,537.8 -293.7 -1.6Unemployment 1,020.1 759.3 260.8 34.3 818.9 201.2 24.6Unemployment Rate 5.3 3.9 1.4 . 4.2 1.1 .Source: California's Employment Development Department and Beacon Economics, LLC
-6
-4
-2
0
2
4
Em
ploy
men
t Gro
wth
(%
, SA
)
14,000
15,000
16,000
17,000
18,000
Em
ploy
men
t (00
0s, S
A)
Jan-00 Jan-05 Jan-10 Jan-15 Jan-20
Nonfarm Employment Employment Growth
Source: California EDD and Beacon Economics, LLC
Jan-00 to Mar-20California Nonfarm Employment
4
6
8
10
12
Une
mpl
oym
ent R
ate
(%, S
A)
16,500
17,000
17,500
18,000
18,500
19,000
19,500
Labo
r F
orce
(00
0s, S
A)
Jan-00 Jan-05 Jan-10 Jan-15 Jan-20
Labor Force Unemployment Rate
Source: California EDD and Beacon Economics, LLC
Jan-00 to Mar-20California Unemployment
Seasonally Adjusted Employment Es mates 1 March 2020

B E
San Francisco Bay Area: San Francisco (MD)
San Francisco (MD) Seasonally Adjusted Employment ChangesIndustry Mar-20 Feb-20 MoM (000s) MoM (%) Mar-19 YoY (000s) YoY (%)
Farm 1.5 1.5 0.0 0.3 1.6 -0.1 -6.5Total Nonfarm 1,184.5 1,198.2 -13.7 -1.1 1,165.9 18.6 1.6
Total Private 1,052.2 1,065.9 -13.7 -1.3 1,034.3 17.9 1.7Construc on 42.8 42.7 0.2 0.4 43.6 -0.8 -1.8NR/Mining 0.1 0.1 -0.0 -0.2 0.1 0.0 1.0Manufacturing 38.9 39.0 -0.1 -0.2 39.2 -0.3 -0.7Durable Goods 19.2 19.3 -0.1 -0.4 18.9 0.3 1.7Non-Durable Goods 19.7 19.7 -0.0 -0.0 20.3 -0.6 -2.9
Trade,Transport,U l. 152.7 153.7 -0.9 -0.6 154.0 -1.2 -0.8Wholesale Trade 25.8 25.9 -0.1 -0.2 26.0 -0.2 -0.7Retail Trade 76.9 77.6 -0.6 -0.8 78.4 -1.4 -1.8Transport,Warehouse,U l. 50.0 50.2 -0.3 -0.5 49.6 0.3 0.7
Informa on 100.1 100.9 -0.8 -0.8 94.1 6.0 6.4Financial Ac vi es 87.9 87.5 0.5 0.5 85.3 2.6 3.1Finance and Insurance 64.1 64.0 0.0 0.1 61.9 2.2 3.5Real Estate 23.9 23.4 0.4 1.8 23.4 0.4 1.8
Professional/Business 295.7 301.3 -5.6 -1.9 285.9 9.8 3.4Prof Sci and Tech 210.8 215.2 -4.3 -2.0 198.4 12.5 6.3Management 26.6 26.7 -0.1 -0.5 28.1 -1.5 -5.2Admin Support 58.2 59.4 -1.1 -1.9 59.4 -1.2 -2.0
Educa on/Health 148.8 149.1 -0.3 -0.2 142.3 6.4 4.5Educa onal Services 32.5 32.5 0.0 0.0 30.1 2.4 8.1Health Care 116.2 116.5 -0.3 -0.3 112.2 4.0 3.6
Leisure and Hospitality 144.1 150.2 -6.1 -4.0 148.4 -4.3 -2.9Arts and Entertainment 20.5 21.6 -1.1 -5.0 21.1 -0.6 -2.8Accommoda on and Food 123.6 128.6 -5.0 -3.9 127.3 -3.7 -2.9
Other Services 41.0 41.6 -0.6 -1.4 41.4 -0.4 -0.9Government 132.3 132.3 0.0 0.0 131.6 0.7 0.6Federal Government 16.5 16.6 -0.1 -0.4 16.6 -0.1 -0.5State Government 38.1 38.3 -0.2 -0.4 38.0 0.1 0.4Local Government 77.6 77.4 0.3 0.3 77.0 0.7 0.9
Labor Force 1,032.7 1,047.5 -14.8 -1.4 1,036.7 -4.0 -0.4Employment 1,003.5 1,025.1 -21.5 -2.1 1,012.9 -9.3 -0.9Unemployment 29.2 22.4 6.7 30.0 23.8 5.4 22.6Unemployment Rate 2.8 2.1 0.7 . 2.3 0.5 .Source: California's Employment Development Department and Beacon Economics, LLC
-10
-5
0
5
Em
ploy
men
t Gro
wth
(%
, SA
)
800
900
1,000
1,100
1,200
Em
ploy
men
t (00
0s, S
A)
Jan-00 Jan-05 Jan-10 Jan-15 Jan-20
Nonfarm Employment Employment Growth
Source: California EDD and Beacon Economics, LLC
Jan-00 to Mar-20San Francisco (MD) Nonfarm Employment
2
4
6
8
10
Une
mpl
oym
ent R
ate
(%, S
A)
750
800
850
900
950
1,000
1,050
Labo
r F
orce
(00
0s, S
A)
Jan-00 Jan-05 Jan-10 Jan-15 Jan-20
Labor Force Unemployment Rate
Source: California EDD and Beacon Economics, LLC
Jan-00 to Mar-20San Francisco (MD) Unemployment
Seasonally Adjusted Employment Es mates 2 March 2020

B E
San Francisco Bay Area: San Jose (MSA)
San Jose (MSA) Seasonally Adjusted Employment ChangesIndustry Mar-20 Feb-20 MoM (000s) MoM (%) Mar-19 YoY (000s) YoY (%)
Farm 5.8 5.7 0.1 1.4 5.4 0.3 6.4Total Nonfarm 1,149.4 1,157.8 -8.4 -0.7 1,143.3 6.1 0.5
Total Private 1,052.3 1,060.1 -7.9 -0.7 1,046.2 6.1 0.6Construc on 51.8 52.2 -0.4 -0.8 52.4 -0.6 -1.2NR/Mining 0.2 0.2 -0.0 -2.4 0.2 -0.0 -0.1Manufacturing 175.6 175.3 0.3 0.2 173.6 2.0 1.1Durable Goods 163.0 162.6 0.4 0.2 160.1 2.9 1.8Non-Durable Goods 12.6 12.7 -0.1 -0.8 13.5 -0.9 -6.7
Trade,Transport,U l. 131.0 131.8 -0.8 -0.6 131.8 -0.8 -0.6Wholesale Trade 31.1 31.0 0.1 0.3 31.8 -0.7 -2.2Retail Trade 83.2 84.0 -0.8 -0.9 84.1 -0.8 -1.0Transport,Warehouse,U l. 16.7 16.8 -0.1 -0.6 15.9 0.7 4.5
Informa on 104.9 105.3 -0.4 -0.4 98.2 6.6 6.8Financial Ac vi es 38.8 38.5 0.3 0.8 37.0 1.8 4.9Finance and Insurance 22.1 21.9 0.2 0.7 21.8 0.3 1.4Real Estate 16.7 16.6 0.2 1.0 15.2 1.5 9.9
Professional/Business 245.7 245.0 0.7 0.3 242.2 3.5 1.4Prof Sci and Tech 167.4 166.7 0.7 0.4 164.1 3.3 2.0Management 14.9 14.8 0.0 0.3 15.7 -0.8 -5.1Admin Support 63.4 63.5 -0.1 -0.1 62.4 1.0 1.7
Educa on/Health 177.2 177.3 -0.1 -0.1 175.4 1.7 1.0Educa onal Services 45.5 45.8 -0.3 -0.7 48.7 -3.2 -6.6Health Care 131.7 131.5 0.2 0.1 126.8 4.9 3.9
Leisure and Hospitality 97.1 104.4 -7.4 -7.1 106.3 -9.2 -8.7Arts and Entertainment 14.5 15.2 -0.7 -4.5 16.2 -1.7 -10.3Accommoda on and Food 82.6 89.3 -6.7 -7.5 90.1 -7.5 -8.4
Other Services 30.1 30.0 0.1 0.3 29.1 1.1 3.7Government 97.1 97.7 -0.5 -0.6 97.1 0.0 0.0Federal Government 10.1 10.1 -0.1 -0.6 9.9 0.2 2.1State Government 7.0 7.0 0.0 0.1 6.9 0.1 1.5Local Government 80.1 80.6 -0.5 -0.6 80.4 -0.3 -0.4
Labor Force 1,072.9 1,084.7 -11.8 -1.1 1,084.3 -11.4 -1.1Employment 1,037.6 1,056.7 -19.1 -1.8 1,054.9 -17.2 -1.6Unemployment 35.3 28.0 7.3 26.2 29.5 5.8 19.8Unemployment Rate 3.3 2.6 0.7 . 2.7 0.6 .Source: California's Employment Development Department and Beacon Economics, LLC
-15
-10
-5
0
5
10
Em
ploy
men
t Gro
wth
(%
, SA
)
850
900
950
1,000
1,050
1,100
1,150
Em
ploy
men
t (00
0s, S
A)
Jan-00 Jan-05 Jan-10 Jan-15 Jan-20
Nonfarm Employment Employment Growth
Source: California EDD and Beacon Economics, LLC
Jan-00 to Mar-20San Jose Nonfarm Employment
2
4
6
8
10
12
Une
mpl
oym
ent R
ate
(%, S
A)
850
900
950
1,000
1,050
1,100
Labo
r F
orce
(00
0s, S
A)
Jan-00 Jan-05 Jan-10 Jan-15 Jan-20
Labor Force Unemployment Rate
Source: California EDD and Beacon Economics, LLC
Jan-00 to Mar-20San Jose Unemployment
Seasonally Adjusted Employment Es mates 3 March 2020

B E
San Francisco Bay Area: Oakland (MD)
Oakland (MD) Seasonally Adjusted Employment ChangesIndustry Mar-20 Feb-20 MoM (000s) MoM (%) Mar-19 YoY (000s) YoY (%)
Farm 1.3 1.4 -0.1 -4.2 1.4 -0.1 -8.3Total Nonfarm 1,182.4 1,185.7 -3.3 -0.3 1,184.7 -2.3 -0.2
Total Private 1,006.7 1,010.4 -3.7 -0.4 1,010.6 -3.8 -0.4Construc on 75.8 76.7 -0.8 -1.1 74.9 1.0 1.3NR/Mining 0.2 0.2 -0.0 -0.3 0.2 -0.0 -0.2Manufacturing 99.8 99.2 0.6 0.6 101.2 -1.4 -1.4Durable Goods 67.2 66.7 0.5 0.8 68.0 -0.8 -1.2Non-Durable Goods 32.6 32.4 0.1 0.4 33.2 -0.6 -1.8
Trade,Transport,U l. 199.4 199.9 -0.5 -0.3 201.3 -1.9 -1.0Wholesale Trade 45.3 45.3 -0.0 -0.0 45.9 -0.6 -1.3Retail Trade 111.8 112.1 -0.3 -0.3 112.2 -0.4 -0.4Transport,Warehouse,U l. 42.4 42.5 -0.2 -0.4 43.2 -0.9 -2.1
Informa on 27.9 27.8 0.1 0.3 27.9 0.0 0.0Financial Ac vi es 55.8 55.2 0.6 1.1 55.0 0.8 1.5Finance and Insurance 37.4 37.2 0.2 0.4 36.7 0.6 1.7Real Estate 18.4 18.0 0.4 2.4 18.2 0.2 1.1
Professional/Business 191.4 191.5 -0.1 -0.1 191.5 -0.1 -0.1Prof Sci and Tech 101.1 101.0 0.1 0.1 99.7 1.4 1.4Management 25.4 25.4 0.1 0.2 25.6 -0.2 -0.7Admin Support 64.9 65.1 -0.3 -0.5 66.1 -1.3 -1.9
Educa on/Health 198.5 198.6 -0.2 -0.1 197.3 1.2 0.6Educa onal Services 24.0 24.0 0.0 0.1 23.9 0.1 0.4Health Care 174.5 174.7 -0.2 -0.1 173.4 1.1 0.6
Leisure and Hospitality 117.2 119.8 -2.6 -2.2 120.3 -3.0 -2.5Arts and Entertainment 19.8 20.2 -0.4 -2.0 19.5 0.3 1.7Accommoda on and Food 97.4 99.7 -2.2 -2.2 100.8 -3.4 -3.3
Other Services 40.8 41.5 -0.8 -1.8 41.1 -0.3 -0.7Government 175.7 175.3 0.4 0.2 174.1 1.5 0.9Federal Government 13.4 13.4 0.1 0.4 13.4 0.0 0.1State Government 40.0 39.8 0.2 0.5 39.3 0.7 1.8Local Government 122.2 122.1 0.1 0.1 121.4 0.8 0.7
Labor Force 1,384.6 1,396.3 -11.7 -0.8 1,406.8 -22.2 -1.6Employment 1,332.1 1,355.0 -22.8 -1.7 1,362.4 -30.2 -2.2Unemployment 52.4 41.3 11.1 26.8 44.4 8.0 18.1Unemployment Rate 3.8 3.0 0.8 . 3.2 0.6 .Source: California's Employment Development Department and Beacon Economics, LLC
-8
-6
-4
-2
0
2
4
Em
ploy
men
t Gro
wth
(%
, SA
)
950
1,000
1,050
1,100
1,150
1,200
Em
ploy
men
t (00
0s, S
A)
Jan-00 Jan-05 Jan-10 Jan-15 Jan-20
Nonfarm Employment Employment Growth
Source: California EDD and Beacon Economics, LLC
Jan-00 to Mar-20Oakland (MD) Nonfarm Employment
2
4
6
8
10
12
Une
mpl
oym
ent R
ate
(%, S
A)
1,200
1,250
1,300
1,350
1,400
Labo
r F
orce
(00
0s, S
A)
Jan-00 Jan-05 Jan-10 Jan-15 Jan-20
Labor Force Unemployment Rate
Source: California EDD and Beacon Economics, LLC
Jan-00 to Mar-20Oakland (MD) Unemployment
Seasonally Adjusted Employment Es mates 4 March 2020
B E
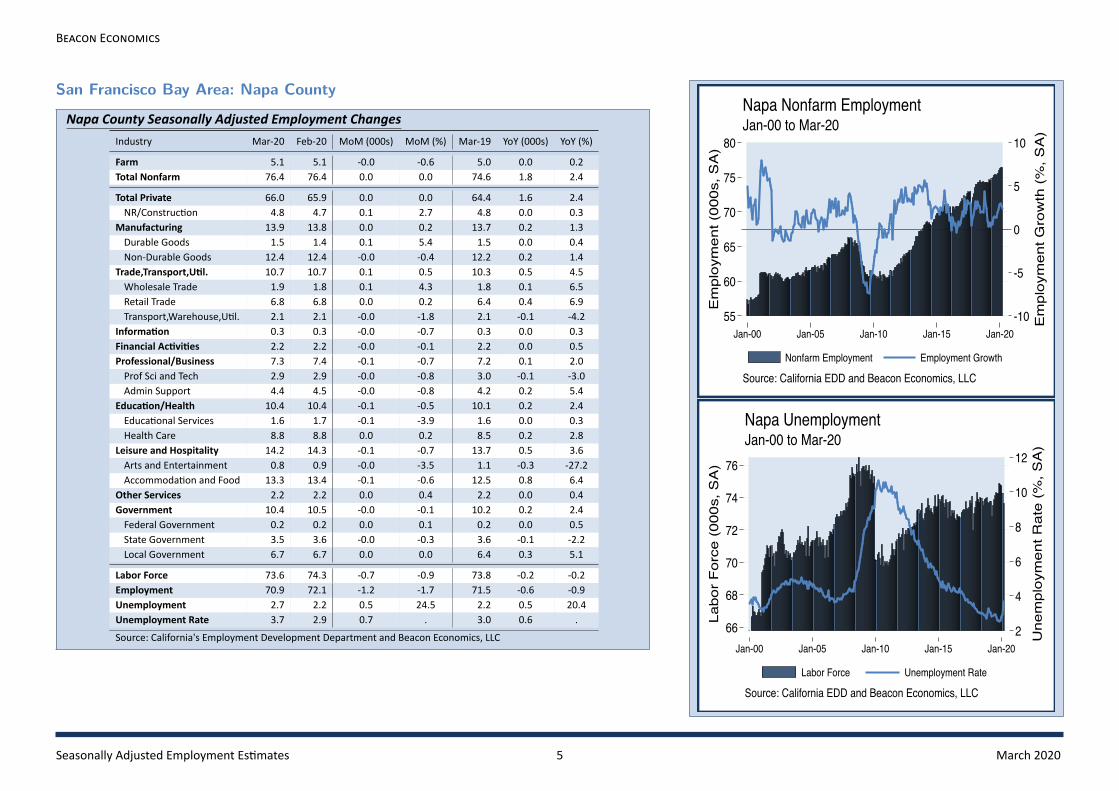
San Francisco Bay Area: Napa County
Napa County Seasonally Adjusted Employment ChangesIndustry Mar-20 Feb-20 MoM (000s) MoM (%) Mar-19 YoY (000s) YoY (%)
Farm 5.1 5.1 -0.0 -0.6 5.0 0.0 0.2Total Nonfarm 76.4 76.4 0.0 0.0 74.6 1.8 2.4
Total Private 66.0 65.9 0.0 0.0 64.4 1.6 2.4NR/Construc on 4.8 4.7 0.1 2.7 4.8 0.0 0.3
Manufacturing 13.9 13.8 0.0 0.2 13.7 0.2 1.3Durable Goods 1.5 1.4 0.1 5.4 1.5 0.0 0.4Non-Durable Goods 12.4 12.4 -0.0 -0.4 12.2 0.2 1.4
Trade,Transport,U l. 10.7 10.7 0.1 0.5 10.3 0.5 4.5Wholesale Trade 1.9 1.8 0.1 4.3 1.8 0.1 6.5Retail Trade 6.8 6.8 0.0 0.2 6.4 0.4 6.9Transport,Warehouse,U l. 2.1 2.1 -0.0 -1.8 2.1 -0.1 -4.2
Informa on 0.3 0.3 -0.0 -0.7 0.3 0.0 0.3Financial Ac vi es 2.2 2.2 -0.0 -0.1 2.2 0.0 0.5Professional/Business 7.3 7.4 -0.1 -0.7 7.2 0.1 2.0Prof Sci and Tech 2.9 2.9 -0.0 -0.8 3.0 -0.1 -3.0Admin Support 4.4 4.5 -0.0 -0.8 4.2 0.2 5.4
Educa on/Health 10.4 10.4 -0.1 -0.5 10.1 0.2 2.4Educa onal Services 1.6 1.7 -0.1 -3.9 1.6 0.0 0.3Health Care 8.8 8.8 0.0 0.2 8.5 0.2 2.8
Leisure and Hospitality 14.2 14.3 -0.1 -0.7 13.7 0.5 3.6Arts and Entertainment 0.8 0.9 -0.0 -3.5 1.1 -0.3 -27.2Accommoda on and Food 13.3 13.4 -0.1 -0.6 12.5 0.8 6.4
Other Services 2.2 2.2 0.0 0.4 2.2 0.0 0.4Government 10.4 10.5 -0.0 -0.1 10.2 0.2 2.4Federal Government 0.2 0.2 0.0 0.1 0.2 0.0 0.5State Government 3.5 3.6 -0.0 -0.3 3.6 -0.1 -2.2Local Government 6.7 6.7 0.0 0.0 6.4 0.3 5.1
Labor Force 73.6 74.3 -0.7 -0.9 73.8 -0.2 -0.2Employment 70.9 72.1 -1.2 -1.7 71.5 -0.6 -0.9Unemployment 2.7 2.2 0.5 24.5 2.2 0.5 20.4Unemployment Rate 3.7 2.9 0.7 . 3.0 0.6 .Source: California's Employment Development Department and Beacon Economics, LLC
-10
-5
0
5
10
Em
ploy
men
t Gro
wth
(%
, SA
)
55
60
65
70
75
80
Em
ploy
men
t (00
0s, S
A)
Jan-00 Jan-05 Jan-10 Jan-15 Jan-20
Nonfarm Employment Employment Growth
Source: California EDD and Beacon Economics, LLC
Jan-00 to Mar-20Napa Nonfarm Employment
2
4
6
8
10
12
Une
mpl
oym
ent R
ate
(%, S
A)
66
68
70
72
74
76
Labo
r F
orce
(00
0s, S
A)
Jan-00 Jan-05 Jan-10 Jan-15 Jan-20
Labor Force Unemployment Rate
Source: California EDD and Beacon Economics, LLC
Jan-00 to Mar-20Napa Unemployment
Seasonally Adjusted Employment Es mates 5 March 2020
B E
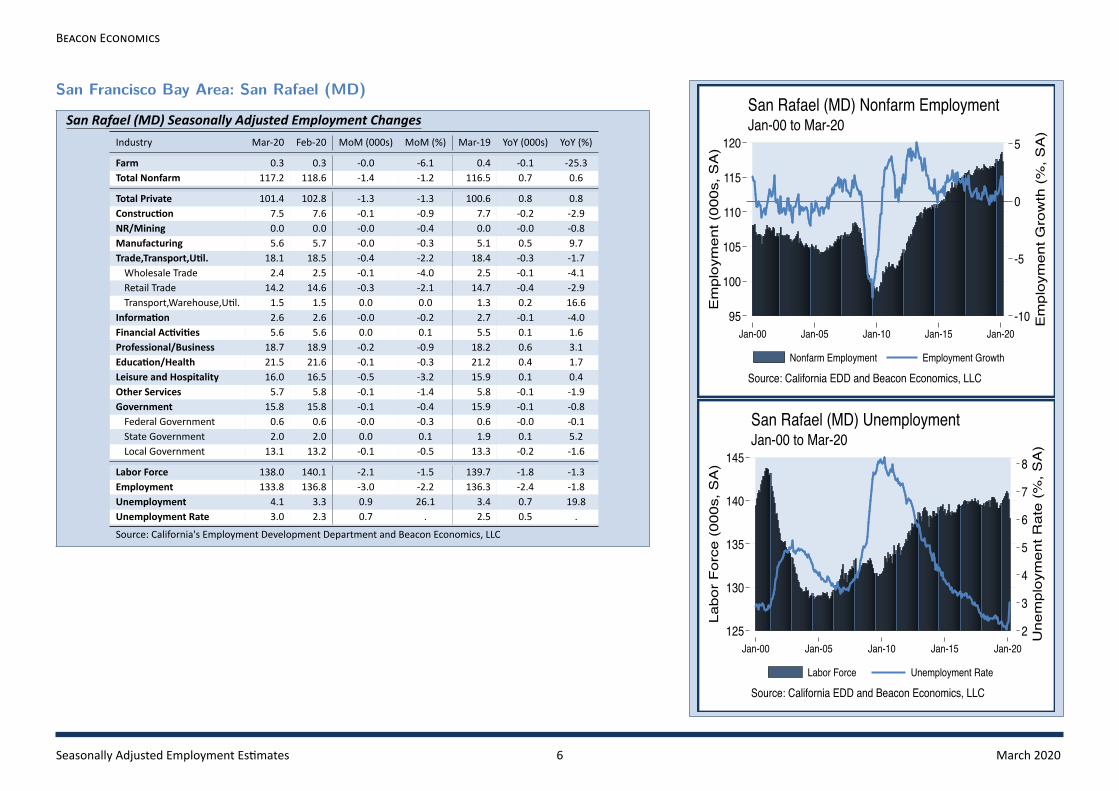
San Francisco Bay Area: San Rafael (MD)
San Rafael (MD) Seasonally Adjusted Employment ChangesIndustry Mar-20 Feb-20 MoM (000s) MoM (%) Mar-19 YoY (000s) YoY (%)
Farm 0.3 0.3 -0.0 -6.1 0.4 -0.1 -25.3Total Nonfarm 117.2 118.6 -1.4 -1.2 116.5 0.7 0.6
Total Private 101.4 102.8 -1.3 -1.3 100.6 0.8 0.8Construc on 7.5 7.6 -0.1 -0.9 7.7 -0.2 -2.9NR/Mining 0.0 0.0 -0.0 -0.4 0.0 -0.0 -0.8Manufacturing 5.6 5.7 -0.0 -0.3 5.1 0.5 9.7Trade,Transport,U l. 18.1 18.5 -0.4 -2.2 18.4 -0.3 -1.7Wholesale Trade 2.4 2.5 -0.1 -4.0 2.5 -0.1 -4.1Retail Trade 14.2 14.6 -0.3 -2.1 14.7 -0.4 -2.9Transport,Warehouse,U l. 1.5 1.5 0.0 0.0 1.3 0.2 16.6
Informa on 2.6 2.6 -0.0 -0.2 2.7 -0.1 -4.0Financial Ac vi es 5.6 5.6 0.0 0.1 5.5 0.1 1.6Professional/Business 18.7 18.9 -0.2 -0.9 18.2 0.6 3.1Educa on/Health 21.5 21.6 -0.1 -0.3 21.2 0.4 1.7Leisure and Hospitality 16.0 16.5 -0.5 -3.2 15.9 0.1 0.4Other Services 5.7 5.8 -0.1 -1.4 5.8 -0.1 -1.9Government 15.8 15.8 -0.1 -0.4 15.9 -0.1 -0.8Federal Government 0.6 0.6 -0.0 -0.3 0.6 -0.0 -0.1State Government 2.0 2.0 0.0 0.1 1.9 0.1 5.2Local Government 13.1 13.2 -0.1 -0.5 13.3 -0.2 -1.6
Labor Force 138.0 140.1 -2.1 -1.5 139.7 -1.8 -1.3Employment 133.8 136.8 -3.0 -2.2 136.3 -2.4 -1.8Unemployment 4.1 3.3 0.9 26.1 3.4 0.7 19.8Unemployment Rate 3.0 2.3 0.7 . 2.5 0.5 .Source: California's Employment Development Department and Beacon Economics, LLC
-10
-5
0
5
Em
ploy
men
t Gro
wth
(%
, SA
)
95
100
105
110
115
120
Em
ploy
men
t (00
0s, S
A)
Jan-00 Jan-05 Jan-10 Jan-15 Jan-20
Nonfarm Employment Employment Growth
Source: California EDD and Beacon Economics, LLC
Jan-00 to Mar-20San Rafael (MD) Nonfarm Employment
2
3
4
5
6
7
8
Une
mpl
oym
ent R
ate
(%, S
A)
125
130
135
140
145
Labo
r F
orce
(00
0s, S
A)
Jan-00 Jan-05 Jan-10 Jan-15 Jan-20
Labor Force Unemployment Rate
Source: California EDD and Beacon Economics, LLC
Jan-00 to Mar-20San Rafael (MD) Unemployment
Seasonally Adjusted Employment Es mates 6 March 2020

B E
San Francisco Bay Area: Sonoma County
Sonoma County Seasonally Adjusted Employment ChangesIndustry Mar-20 Feb-20 MoM (000s) MoM (%) Mar-19 YoY (000s) YoY (%)
Farm 6.5 6.4 0.1 1.4 6.8 -0.3 -4.5Total Nonfarm 211.1 211.5 -0.4 -0.2 208.2 2.9 1.4
Total Private 181.4 181.9 -0.4 -0.2 178.9 2.5 1.4Construc on 17.6 17.7 -0.1 -0.5 16.2 1.5 9.0NR/Mining 0.2 0.2 -0.0 -0.1 0.2 -0.0 -0.3Manufacturing 23.6 23.8 -0.2 -0.8 23.3 0.3 1.3Durable Goods 8.6 8.6 -0.0 -0.2 9.0 -0.4 -4.6Non-Durable Goods 15.1 15.2 -0.2 -1.1 14.3 0.7 5.0
Trade,Transport,U l. 35.8 35.8 -0.0 -0.0 36.4 -0.5 -1.5Wholesale Trade 7.6 7.6 -0.0 -0.3 7.6 -0.0 -0.1Retail Trade 24.1 24.0 0.1 0.3 24.5 -0.4 -1.8Transport,Warehouse,U l. 4.1 4.2 -0.1 -1.5 4.2 -0.1 -2.6
Informa on 2.6 2.6 0.0 0.3 2.6 -0.0 -0.1Financial Ac vi es 8.8 8.8 0.0 0.1 8.7 0.1 1.1Finance and Insurance 4.8 4.8 0.0 0.4 4.7 0.1 2.2Real Estate 4.0 4.0 -0.0 -0.2 4.0 -0.0 -0.1
Professional/Business 24.2 24.1 0.1 0.4 23.4 0.8 3.5Prof Sci and Tech 9.9 9.9 0.0 0.5 9.6 0.3 3.1Management 2.1 2.1 0.0 1.2 2.1 -0.0 -0.1Admin Support 12.1 12.1 0.0 0.2 11.6 0.5 4.4
Educa on/Health 36.1 36.0 0.1 0.3 35.2 0.9 2.6Educa onal Services 2.2 2.1 0.1 5.1 2.3 -0.1 -2.2Health Care 33.9 33.9 -0.0 -0.0 32.9 1.0 2.9
Leisure and Hospitality 25.2 25.5 -0.3 -1.1 25.7 -0.5 -2.0Arts and Entertainment 4.0 3.9 0.0 0.4 4.0 -0.0 -0.1Accommoda on and Food 21.2 21.5 -0.3 -1.3 21.8 -0.5 -2.4
Other Services 7.2 7.3 -0.1 -1.1 7.2 -0.0 -0.0Government 29.7 29.6 0.0 0.2 29.3 0.4 1.3Federal Government 1.4 1.4 0.0 0.3 1.3 0.1 7.6State Government 3.9 3.8 0.0 0.9 3.9 -0.0 -0.0Local Government 24.4 24.4 0.0 0.0 24.1 0.3 1.2
Labor Force 257.7 259.4 -1.7 -0.7 259.3 -1.6 -0.6Employment 248.9 252.6 -3.7 -1.4 251.9 -2.9 -1.2Unemployment 8.8 6.8 1.9 28.2 7.5 1.3 17.4Unemployment Rate 3.4 2.6 0.8 . 2.9 0.5 .Source: California's Employment Development Department and Beacon Economics, LLC
-10
-5
0
5
10
Em
ploy
men
t Gro
wth
(%
, SA
)
170
180
190
200
210
Em
ploy
men
t (00
0s, S
A)
Jan-00 Jan-05 Jan-10 Jan-15 Jan-20
Nonfarm Employment Employment Growth
Source: California EDD and Beacon Economics, LLC
Jan-00 to Mar-20Santa Rosa Nonfarm Employment
2
4
6
8
10
12
Une
mpl
oym
ent R
ate
(%, S
A)
240
245
250
255
260
265
Labo
r F
orce
(00
0s, S
A)
Jan-00 Jan-05 Jan-10 Jan-15 Jan-20
Labor Force Unemployment Rate
Source: California EDD and Beacon Economics, LLC
Jan-00 to Mar-20Santa Rosa Unemployment
Seasonally Adjusted Employment Es mates 7 March 2020

B E
San Francisco Bay Area: Solano County
Solano County Seasonally Adjusted Employment ChangesIndustry Mar-20 Feb-20 MoM (000s) MoM (%) Mar-19 YoY (000s) YoY (%)
Farm 1.5 1.5 -0.0 -2.7 1.3 0.2 18.5Total Nonfarm 144.4 144.4 0.0 0.0 143.1 1.3 0.9
Total Private 120.0 120.2 -0.2 -0.1 118.4 1.7 1.4Construc on 13.0 12.9 0.1 0.5 12.1 0.8 6.8NR/Mining 0.5 0.5 -0.0 -0.7 0.5 -0.0 -0.8Manufacturing 12.5 12.4 0.1 0.7 12.4 0.1 0.5Durable Goods 5.1 5.1 0.1 1.7 4.7 0.4 8.2Non-Durable Goods 7.3 7.3 0.0 0.0 7.7 -0.3 -4.2
Trade,Transport,U l. 27.4 27.4 0.0 0.0 27.3 0.0 0.1Wholesale Trade 4.4 4.4 0.0 0.7 4.3 0.1 2.2Retail Trade 17.9 17.9 0.0 0.0 18.2 -0.3 -1.4Transport,Warehouse,U l. 5.0 5.1 -0.0 -0.7 4.8 0.2 4.1
Informa on 1.1 1.1 0.0 0.1 1.2 -0.1 -8.7Financial Ac vi es 5.2 5.3 -0.0 -0.4 5.1 0.1 1.8Finance and Insurance 3.4 3.4 -0.0 -0.0 3.5 -0.1 -3.1Real Estate 1.8 1.9 -0.0 -1.1 1.6 0.2 12.3
Professional/Business 10.5 10.6 -0.2 -1.6 9.9 0.6 5.8Prof Sci and Tech 4.8 4.9 -0.1 -1.7 4.5 0.3 6.3Admin Support 5.7 5.7 -0.0 -0.4 5.4 0.3 5.5
Educa on/Health 29.1 29.2 -0.1 -0.2 28.9 0.2 0.8Educa onal Services 2.1 2.1 0.1 3.5 2.0 0.1 4.3Health Care 27.0 27.1 -0.1 -0.5 26.9 0.1 0.5
Leisure and Hospitality 15.9 16.0 -0.0 -0.2 16.1 -0.1 -0.9Arts and Entertainment 2.6 2.6 -0.0 -0.9 2.8 -0.2 -7.8Accommoda on and Food 13.3 13.4 -0.0 -0.1 13.3 0.1 0.5
Other Services 4.8 4.8 -0.0 -0.6 4.7 0.1 1.9Government 24.4 24.2 0.2 0.7 24.7 -0.4 -1.4Federal Government 3.6 3.6 0.0 0.0 3.5 0.1 2.5State Government 5.4 5.4 0.1 1.0 5.5 -0.0 -0.4Local Government 15.3 15.2 0.1 0.7 15.8 -0.4 -2.7
Labor Force 208.5 208.7 -0.3 -0.1 209.7 -1.3 -0.6Employment 198.6 201.1 -2.4 -1.2 201.3 -2.7 -1.3Unemployment 9.8 7.7 2.2 28.1 8.4 1.4 16.6Unemployment Rate 4.7 3.7 1.0 . 4.0 0.7 .Source: California's Employment Development Department and Beacon Economics, LLC
-4
-2
0
2
4
6
Em
ploy
men
t Gro
wth
(%
, SA
)
115
120
125
130
135
140
145
Em
ploy
men
t (00
0s, S
A)
Jan-00 Jan-05 Jan-10 Jan-15 Jan-20
Nonfarm Employment Employment Growth
Source: California EDD and Beacon Economics, LLC
Jan-00 to Mar-20Vallejo Nonfarm Employment
4
6
8
10
12
14
Une
mpl
oym
ent R
ate
(%, S
A)
190
195
200
205
210
215
Labo
r F
orce
(00
0s, S
A)
Jan-00 Jan-05 Jan-10 Jan-15 Jan-20
Labor Force Unemployment Rate
Source: California EDD and Beacon Economics, LLC
Jan-00 to Mar-20Vallejo Unemployment
Seasonally Adjusted Employment Es mates 8 March 2020

B E
Southern California: Los Angeles (MD)
Los Angeles (MD) Seasonally Adjusted Employment ChangesIndustry Mar-20 Feb-20 MoM (000s) MoM (%) Mar-19 YoY (000s) YoY (%)
Farm 4.7 4.8 -0.1 -1.4 4.4 0.2 5.4Total Nonfarm 4,593.0 4,632.6 -39.6 -0.9 4,556.9 36.1 0.8
Total Private 3,992.0 4,032.4 -40.4 -1.0 3,964.9 27.2 0.7Construc on 150.7 154.3 -3.6 -2.3 148.6 2.1 1.4NR/Mining 2.0 1.9 0.1 4.4 1.9 0.1 5.2Manufacturing 335.0 336.4 -1.4 -0.4 340.6 -5.6 -1.6Durable Goods 200.6 200.9 -0.3 -0.1 200.7 -0.0 -0.0Non-Durable Goods 134.4 135.5 -1.1 -0.8 139.9 -5.5 -3.9
Trade,Transport,U l. 852.8 861.3 -8.5 -1.0 850.6 2.2 0.3Wholesale Trade 215.6 219.2 -3.6 -1.7 221.9 -6.3 -2.8Retail Trade 420.0 419.8 0.1 0.0 418.4 1.6 0.4Transport,Warehouse,U l. 217.2 222.2 -5.0 -2.2 210.3 6.9 3.3
Informa on 229.4 228.3 1.1 0.5 217.3 12.1 5.6Financial Ac vi es 227.4 225.8 1.6 0.7 223.9 3.5 1.6Finance and Insurance 137.4 137.5 -0.1 -0.0 135.6 1.9 1.4Real Estate 90.0 88.3 1.7 1.9 88.4 1.6 1.8
Professional/Business 650.1 651.7 -1.6 -0.2 647.0 3.2 0.5Prof Sci and Tech 308.4 308.5 -0.0 -0.0 299.1 9.3 3.1Management 63.3 63.1 0.2 0.3 63.8 -0.6 -0.9Admin Support 278.4 280.2 -1.7 -0.6 284.0 -5.6 -2.0
Educa on/Health 860.8 858.5 2.3 0.3 833.2 27.6 3.3Educa onal Services 142.4 141.8 0.6 0.4 132.7 9.7 7.3Health Care 718.4 716.8 1.7 0.2 700.5 17.9 2.6
Leisure and Hospitality 529.1 553.0 -23.9 -4.3 544.0 -14.9 -2.7Arts and Entertainment 92.1 100.5 -8.4 -8.4 96.8 -4.7 -4.9Accommoda on and Food 437.0 452.4 -15.5 -3.4 447.1 -10.1 -2.3
Other Services 154.7 161.2 -6.5 -4.0 157.8 -3.2 -2.0Government 601.0 600.2 0.8 0.1 592.0 8.9 1.5Federal Government 47.5 47.4 0.1 0.2 47.1 0.4 0.8State Government 92.1 92.3 -0.3 -0.3 92.6 -0.5 -0.6Local Government 461.5 460.5 0.9 0.2 452.4 9.1 2.0
Labor Force 5,001.9 5,197.3 -195.4 -3.8 5,108.2 -106.2 -2.1Employment 4,674.4 4,961.0 -286.6 -5.8 4,873.3 -198.9 -4.1Unemployment 327.5 236.3 91.2 38.6 234.9 92.7 39.4Unemployment Rate 6.3 4.3 2.0 . 4.6 1.7 .Source: California's Employment Development Department and Beacon Economics, LLC
-6
-4
-2
0
2
4
Em
ploy
men
t Gro
wth
(%
, SA
)
3,800
4,000
4,200
4,400
4,600
Em
ploy
men
t (00
0s, S
A)
Jan-00 Jan-05 Jan-10 Jan-15 Jan-20
Nonfarm Employment Employment Growth
Source: California EDD and Beacon Economics, LLC
Jan-00 to Mar-20Los Angeles (MD) Nonfarm Employment
4
6
8
10
12
14
Une
mpl
oym
ent R
ate
(%, S
A)
4,600
4,700
4,800
4,900
5,000
5,100
5,200
Labo
r F
orce
(00
0s, S
A)
Jan-00 Jan-05 Jan-10 Jan-15 Jan-20
Labor Force Unemployment Rate
Source: California EDD and Beacon Economics, LLC
Jan-00 to Mar-20Los Angeles (MD) Unemployment
Seasonally Adjusted Employment Es mates 9 March 2020

B E
Southern California: Orange County
Orange County Seasonally Adjusted Employment ChangesIndustry Mar-20 Feb-20 MoM (000s) MoM (%) Mar-19 YoY (000s) YoY (%)
Farm 1.9 1.8 0.0 1.8 1.8 0.1 5.4Total Nonfarm 1,667.6 1,684.1 -16.5 -1.0 1,666.5 1.1 0.1
Total Private 1,502.6 1,519.0 -16.4 -1.1 1,504.4 -1.8 -0.1Construc on 104.5 107.8 -3.2 -3.0 106.4 -1.9 -1.8NR/Mining 0.4 0.4 -0.0 -1.6 0.5 -0.1 -19.9Manufacturing 157.8 158.8 -1.0 -0.6 160.6 -2.8 -1.7Durable Goods 118.5 119.1 -0.6 -0.5 118.9 -0.3 -0.3Non-Durable Goods 39.3 39.7 -0.4 -1.0 41.7 -2.4 -5.9
Trade,Transport,U l. 258.8 260.5 -1.8 -0.7 259.7 -1.0 -0.4Wholesale Trade 78.3 78.3 -0.1 -0.1 79.3 -1.0 -1.3Retail Trade 150.5 152.1 -1.6 -1.0 151.1 -0.5 -0.3Transport,Warehouse,U l. 29.9 30.1 -0.2 -0.5 29.4 0.6 2.0
Informa on 25.9 25.9 0.0 0.0 26.2 -0.3 -1.3Financial Ac vi es 121.6 121.1 0.5 0.4 116.4 5.2 4.5Finance and Insurance 81.4 81.1 0.3 0.4 76.8 4.6 6.0Real Estate 40.2 40.1 0.1 0.3 39.6 0.6 1.6
Professional/Business 323.6 328.3 -4.6 -1.4 325.7 -2.1 -0.6Prof Sci and Tech 133.2 136.1 -2.8 -2.1 131.3 1.9 1.5Management 39.1 39.2 -0.0 -0.1 38.2 1.0 2.5Admin Support 151.3 153.0 -1.8 -1.2 156.2 -5.0 -3.2
Educa on/Health 233.3 233.6 -0.3 -0.1 230.0 3.2 1.4Educa onal Services 33.0 32.9 0.1 0.2 31.0 1.9 6.3Health Care 200.3 200.7 -0.4 -0.2 199.0 1.3 0.7
Leisure and Hospitality 225.9 231.2 -5.3 -2.3 227.2 -1.3 -0.6Arts and Entertainment 53.5 53.9 -0.4 -0.7 54.1 -0.6 -1.1Accommoda on and Food 172.4 177.3 -4.9 -2.8 173.1 -0.7 -0.4
Other Services 50.9 51.4 -0.5 -1.0 51.7 -0.8 -1.5Government 165.0 165.1 -0.1 -0.1 162.1 2.9 1.8Federal Government 10.8 10.9 -0.0 -0.2 11.1 -0.2 -1.9State Government 34.5 34.4 0.1 0.2 32.4 2.1 6.5Local Government 119.7 119.8 -0.1 -0.1 118.7 1.0 0.8
Labor Force 1,599.5 1,615.8 -16.3 -1.0 1,622.0 -22.5 -1.4Employment 1,543.2 1,571.1 -27.9 -1.8 1,573.8 -30.6 -1.9Unemployment 56.3 44.7 11.6 25.9 48.2 8.1 16.8Unemployment Rate 3.5 2.8 0.8 . 3.0 0.5 .Source: California's Employment Development Department and Beacon Economics, LLC
-8
-6
-4
-2
0
2
4
Em
ploy
men
t Gro
wth
(%
, SA
)
1,300
1,400
1,500
1,600
1,700
Em
ploy
men
t (00
0s, S
A)
Jan-00 Jan-05 Jan-10 Jan-15 Jan-20
Nonfarm Employment Employment Growth
Source: California EDD and Beacon Economics, LLC
Jan-00 to Mar-20Orange County (MD) Nonfarm Employment
2
4
6
8
10
Une
mpl
oym
ent R
ate
(%, S
A)
1,450
1,500
1,550
1,600
1,650
Labo
r F
orce
(00
0s, S
A)
Jan-00 Jan-05 Jan-10 Jan-15 Jan-20
Labor Force Unemployment Rate
Source: California EDD and Beacon Economics, LLC
Jan-00 to Mar-20Orange County (MD) Unemployment
Seasonally Adjusted Employment Es mates 10 March 2020

B E
Southern California: San Diego County
San Diego County Seasonally Adjusted Employment ChangesIndustry Mar-20 Feb-20 MoM (000s) MoM (%) Mar-19 YoY (000s) YoY (%)
Farm 9.8 9.9 -0.1 -0.7 9.2 0.6 6.8Total Nonfarm 1,508.4 1,522.9 -14.5 -1.0 1,496.6 11.8 0.8
Total Private 1,259.1 1,273.1 -14.0 -1.1 1,247.3 11.8 0.9Construc on 80.9 84.6 -3.7 -4.3 83.6 -2.7 -3.2NR/Mining 0.4 0.4 0.0 3.7 0.3 0.1 34.5Manufacturing 117.5 117.0 0.5 0.4 114.1 3.4 3.0Durable Goods 88.5 87.9 0.6 0.7 85.2 3.3 3.9Non-Durable Goods 29.0 29.1 -0.1 -0.5 28.9 0.1 0.3
Trade,Transport,U l. 223.4 224.6 -1.2 -0.5 224.2 -0.8 -0.3Wholesale Trade 43.1 43.6 -0.5 -1.2 44.2 -1.1 -2.6Retail Trade 145.7 146.0 -0.3 -0.2 146.2 -0.4 -0.3Transport,Warehouse,U l. 34.6 35.0 -0.4 -1.0 33.8 0.8 2.4
Informa on 23.4 23.4 -0.0 -0.2 23.5 -0.1 -0.5Financial Ac vi es 77.9 77.5 0.4 0.5 75.6 2.3 3.0Finance and Insurance 46.2 46.4 -0.2 -0.3 45.9 0.4 0.8Real Estate 31.6 31.1 0.5 1.8 29.7 1.9 6.4
Professional/Business 261.5 264.4 -3.0 -1.1 253.3 8.1 3.2Prof Sci and Tech 148.5 150.8 -2.2 -1.5 143.9 4.6 3.2Management 24.0 24.0 -0.1 -0.2 23.9 0.1 0.3Admin Support 89.0 89.7 -0.7 -0.8 85.5 3.4 4.0
Educa on/Health 219.5 221.6 -2.1 -1.0 214.3 5.2 2.4Educa onal Services 30.1 30.1 -0.1 -0.2 29.8 0.3 1.1Health Care 189.4 191.5 -2.1 -1.1 184.5 4.9 2.6
Leisure and Hospitality 201.8 203.4 -1.5 -0.7 202.2 -0.4 -0.2Arts and Entertainment 30.8 31.5 -0.8 -2.4 30.7 0.1 0.3Accommoda on and Food 171.1 171.8 -0.8 -0.4 171.6 -0.5 -0.3
Other Services 52.7 56.1 -3.4 -6.1 56.1 -3.4 -6.0Government 249.3 249.8 -0.5 -0.2 249.3 0.0 0.0Federal Government 48.3 48.3 -0.0 -0.0 47.6 0.7 1.4State Government 52.7 52.8 -0.1 -0.2 51.5 1.2 2.4Local Government 148.4 148.7 -0.4 -0.2 150.2 -1.9 -1.2
Labor Force 1,575.2 1,589.3 -14.1 -0.9 1,587.9 -12.8 -0.8Employment 1,511.6 1,539.3 -27.7 -1.8 1,533.7 -22.1 -1.4Unemployment 63.6 50.0 13.6 27.2 54.3 9.4 17.2Unemployment Rate 4.0 3.1 0.9 . 3.4 0.6 .Source: California's Employment Development Department and Beacon Economics, LLC
-6
-4
-2
0
2
4
Em
ploy
men
t Gro
wth
(%
, SA
)
1,200
1,250
1,300
1,350
1,400
1,450
1,500
Em
ploy
men
t (00
0s, S
A)
Jan-00 Jan-05 Jan-10 Jan-15 Jan-20
Nonfarm Employment Employment Growth
Source: California EDD and Beacon Economics, LLC
Jan-00 to Mar-20San Diego Nonfarm Employment
2
4
6
8
10
12
Une
mpl
oym
ent R
ate
(%, S
A)
1,350
1,400
1,450
1,500
1,550
1,600
Labo
r F
orce
(00
0s, S
A)
Jan-00 Jan-05 Jan-10 Jan-15 Jan-20
Labor Force Unemployment Rate
Source: California EDD and Beacon Economics, LLC
Jan-00 to Mar-20San Diego Unemployment
Seasonally Adjusted Employment Es mates 11 March 2020
B E
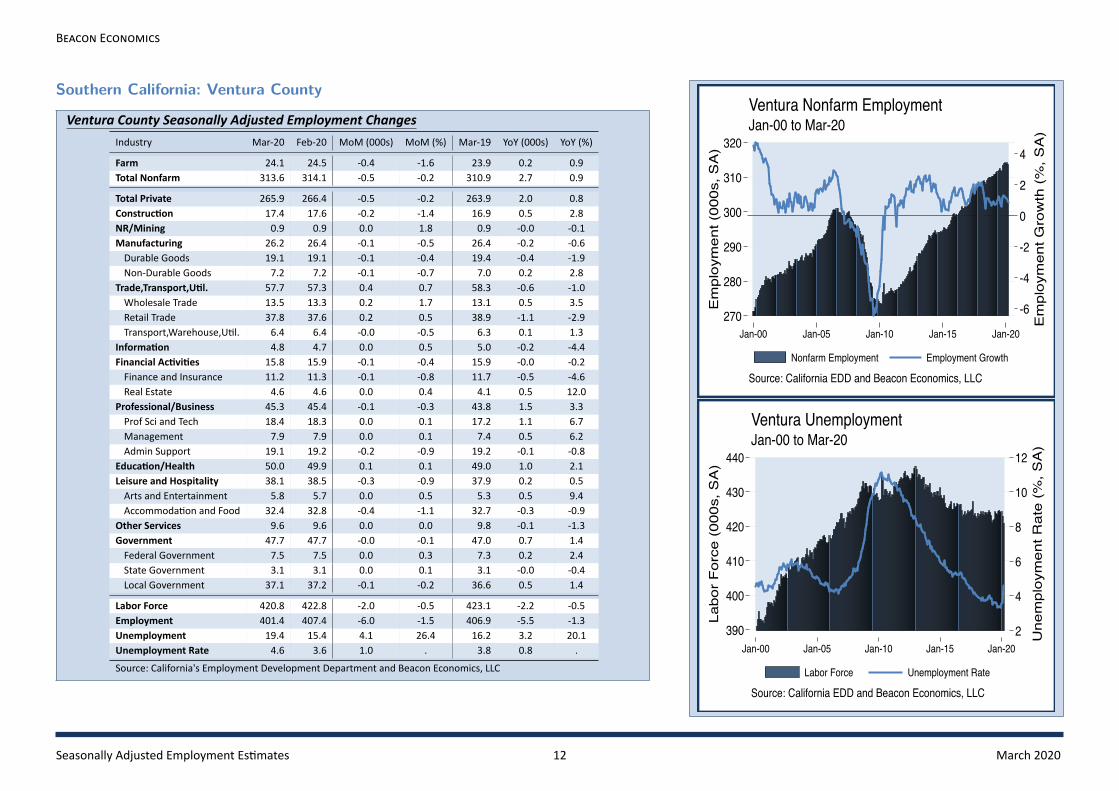
Southern California: Ventura County
Ventura County Seasonally Adjusted Employment ChangesIndustry Mar-20 Feb-20 MoM (000s) MoM (%) Mar-19 YoY (000s) YoY (%)
Farm 24.1 24.5 -0.4 -1.6 23.9 0.2 0.9Total Nonfarm 313.6 314.1 -0.5 -0.2 310.9 2.7 0.9
Total Private 265.9 266.4 -0.5 -0.2 263.9 2.0 0.8Construc on 17.4 17.6 -0.2 -1.4 16.9 0.5 2.8NR/Mining 0.9 0.9 0.0 1.8 0.9 -0.0 -0.1Manufacturing 26.2 26.4 -0.1 -0.5 26.4 -0.2 -0.6Durable Goods 19.1 19.1 -0.1 -0.4 19.4 -0.4 -1.9Non-Durable Goods 7.2 7.2 -0.1 -0.7 7.0 0.2 2.8
Trade,Transport,U l. 57.7 57.3 0.4 0.7 58.3 -0.6 -1.0Wholesale Trade 13.5 13.3 0.2 1.7 13.1 0.5 3.5Retail Trade 37.8 37.6 0.2 0.5 38.9 -1.1 -2.9Transport,Warehouse,U l. 6.4 6.4 -0.0 -0.5 6.3 0.1 1.3
Informa on 4.8 4.7 0.0 0.5 5.0 -0.2 -4.4Financial Ac vi es 15.8 15.9 -0.1 -0.4 15.9 -0.0 -0.2Finance and Insurance 11.2 11.3 -0.1 -0.8 11.7 -0.5 -4.6Real Estate 4.6 4.6 0.0 0.4 4.1 0.5 12.0
Professional/Business 45.3 45.4 -0.1 -0.3 43.8 1.5 3.3Prof Sci and Tech 18.4 18.3 0.0 0.1 17.2 1.1 6.7Management 7.9 7.9 0.0 0.1 7.4 0.5 6.2Admin Support 19.1 19.2 -0.2 -0.9 19.2 -0.1 -0.8
Educa on/Health 50.0 49.9 0.1 0.1 49.0 1.0 2.1Leisure and Hospitality 38.1 38.5 -0.3 -0.9 37.9 0.2 0.5Arts and Entertainment 5.8 5.7 0.0 0.5 5.3 0.5 9.4Accommoda on and Food 32.4 32.8 -0.4 -1.1 32.7 -0.3 -0.9
Other Services 9.6 9.6 0.0 0.0 9.8 -0.1 -1.3Government 47.7 47.7 -0.0 -0.1 47.0 0.7 1.4Federal Government 7.5 7.5 0.0 0.3 7.3 0.2 2.4State Government 3.1 3.1 0.0 0.1 3.1 -0.0 -0.4Local Government 37.1 37.2 -0.1 -0.2 36.6 0.5 1.4
Labor Force 420.8 422.8 -2.0 -0.5 423.1 -2.2 -0.5Employment 401.4 407.4 -6.0 -1.5 406.9 -5.5 -1.3Unemployment 19.4 15.4 4.1 26.4 16.2 3.2 20.1Unemployment Rate 4.6 3.6 1.0 . 3.8 0.8 .Source: California's Employment Development Department and Beacon Economics, LLC
-6
-4
-2
0
2
4
Em
ploy
men
t Gro
wth
(%
, SA
)
270
280
290
300
310
320
Em
ploy
men
t (00
0s, S
A)
Jan-00 Jan-05 Jan-10 Jan-15 Jan-20
Nonfarm Employment Employment Growth
Source: California EDD and Beacon Economics, LLC
Jan-00 to Mar-20Ventura Nonfarm Employment
2
4
6
8
10
12
Une
mpl
oym
ent R
ate
(%, S
A)
390
400
410
420
430
440
Labo
r F
orce
(00
0s, S
A)
Jan-00 Jan-05 Jan-10 Jan-15 Jan-20
Labor Force Unemployment Rate
Source: California EDD and Beacon Economics, LLC
Jan-00 to Mar-20Ventura Unemployment
Seasonally Adjusted Employment Es mates 12 March 2020

B E
Southern California: Inland Empire (MSA)
Inland Empire (MSA) Seasonally Adjusted Employment ChangesIndustry Mar-20 Feb-20 MoM (000s) MoM (%) Mar-19 YoY (000s) YoY (%)
Farm 15.0 14.8 0.2 1.2 15.2 -0.3 -1.8Total Nonfarm 1,545.4 1,549.5 -4.1 -0.3 1,532.1 13.3 0.9
Total Private 1,286.0 1,290.9 -4.8 -0.4 1,271.9 14.1 1.1Construc on 106.8 109.1 -2.2 -2.0 105.7 1.1 1.1NR/Mining 1.2 1.2 0.0 1.7 1.2 0.0 0.1Manufacturing 98.9 98.7 0.2 0.2 101.5 -2.6 -2.6Durable Goods 64.1 63.9 0.2 0.3 65.1 -1.0 -1.6Non-Durable Goods 34.8 34.8 -0.0 -0.1 36.4 -1.6 -4.4
Trade,Transport,U l. 399.4 397.0 2.4 0.6 386.2 13.3 3.4Wholesale Trade 67.0 66.8 0.2 0.3 66.7 0.3 0.4Retail Trade 182.2 181.5 0.7 0.4 181.3 0.9 0.5Transport,Warehouse,U l. 150.2 148.7 1.5 1.0 138.2 12.0 8.7
Informa on 11.4 11.4 -0.0 -0.0 11.5 -0.1 -0.9Financial Ac vi es 44.7 43.6 1.1 2.4 44.0 0.7 1.6Finance and Insurance 23.8 23.4 0.4 1.7 23.9 -0.1 -0.5Real Estate 20.9 20.2 0.7 3.3 20.1 0.8 4.0
Professional/Business 154.0 156.1 -2.1 -1.3 153.8 0.2 0.2Prof Sci and Tech 41.6 41.1 0.5 1.1 42.6 -1.1 -2.5Management 8.8 8.7 0.1 1.1 8.7 0.1 1.2Admin Support 103.6 106.3 -2.6 -2.5 102.4 1.2 1.2
Educa on/Health 257.2 255.9 1.4 0.5 246.6 10.7 4.3Educa onal Services 20.5 20.4 0.2 0.9 19.5 1.0 5.3Health Care 236.7 235.5 1.2 0.5 227.1 9.6 4.2
Leisure and Hospitality 168.4 173.2 -4.8 -2.8 175.7 -7.3 -4.1Arts and Entertainment 18.2 18.8 -0.5 -2.9 20.7 -2.5 -12.0Accommoda on and Food 150.2 154.4 -4.2 -2.7 155.0 -4.8 -3.1
Other Services 44.1 44.9 -0.8 -1.8 46.0 -1.9 -4.1Government 259.4 258.6 0.7 0.3 260.2 -0.8 -0.3Federal Government 21.6 21.2 0.3 1.6 21.0 0.6 2.8State Government 31.7 31.7 -0.0 -0.1 30.8 0.9 2.9Local Government 206.0 205.6 0.4 0.2 208.3 -2.3 -1.1
Labor Force 2,054.1 2,065.3 -11.2 -0.5 2,065.4 -11.2 -0.5Employment 1,950.2 1,983.5 -33.2 -1.7 1,978.3 -28.0 -1.4Unemployment 103.9 81.9 22.0 26.9 87.1 16.8 19.3Unemployment Rate 5.1 4.0 1.1 . 4.2 0.8 .Source: California's Employment Development Department and Beacon Economics, LLC
-10
-5
0
5
10
Em
ploy
men
t Gro
wth
(%
, SA
)
1,000
1,100
1,200
1,300
1,400
1,500
1,600
Em
ploy
men
t (00
0s, S
A)
Jan-00 Jan-05 Jan-10 Jan-15 Jan-20
Nonfarm Employment Employment Growth
Source: California EDD and Beacon Economics, LLC
Jan-00 to Mar-20Inland Empire Nonfarm Employment
4
6
8
10
12
14
Une
mpl
oym
ent R
ate
(%, S
A)
1,400
1,600
1,800
2,000
2,200
Labo
r F
orce
(00
0s, S
A)
Jan-00 Jan-05 Jan-10 Jan-15 Jan-20
Labor Force Unemployment Rate
Source: California EDD and Beacon Economics, LLC
Jan-00 to Mar-20Inland Empire Unemployment
Seasonally Adjusted Employment Es mates 13 March 2020

B E
Southern California: Imperial County
Imperial County Seasonally Adjusted Employment ChangesIndustry Mar-20 Feb-20 MoM (000s) MoM (%) Mar-19 YoY (000s) YoY (%)
Farm 10.8 11.0 -0.1 -1.1 12.5 -1.6 -13.1Total Nonfarm 53.5 53.8 -0.3 -0.6 52.8 0.7 1.3
Total Private 34.2 34.4 -0.2 -0.6 33.8 0.4 1.2NR/Construc on 1.9 2.0 -0.0 -1.8 1.9 -0.0 -0.1
Manufacturing 1.8 1.8 0.0 1.0 1.7 0.1 6.2Durable Goods 0.5 0.5 -0.0 -0.2 0.5 0.0 0.1Non-Durable Goods 1.3 1.3 0.0 1.5 1.2 0.1 8.7
Trade,Transport,U l. 12.0 12.0 -0.0 -0.3 12.2 -0.2 -1.6Wholesale Trade 1.8 1.8 0.0 0.0 1.8 0.0 0.2Retail Trade 7.9 7.9 0.0 0.5 7.9 -0.0 -0.1Transport,Warehouse,U l. 2.3 2.3 -0.1 -3.2 2.5 -0.2 -7.7
Informa on 0.3 0.3 -0.0 -0.1 0.3 -0.0 -0.0Financial Ac vi es 1.2 1.2 -0.0 -0.3 1.2 0.0 0.1Professional/Business 2.6 2.7 -0.1 -2.5 2.5 0.1 4.0Educa on/Health 9.2 9.2 -0.0 -0.1 8.8 0.4 4.6Leisure and Hospitality 4.3 4.4 -0.1 -1.9 4.3 0.0 0.1Other Services 0.9 0.9 0.0 0.1 0.9 -0.0 -0.1Government 19.3 19.4 -0.1 -0.4 19.0 0.3 1.5Federal Government 2.2 2.2 -0.0 -0.2 2.1 0.1 4.7State Government 2.8 2.8 -0.0 -0.0 2.8 -0.0 -0.0Local Government 14.3 14.4 -0.1 -0.5 14.1 0.2 1.3
Labor Force 74.2 71.8 2.4 3.3 71.6 2.6 3.6Employment 57.6 58.2 -0.7 -1.2 58.6 -1.1 -1.8Unemployment 16.6 13.5 3.1 22.7 13.0 3.6 28.0Unemployment Rate 22.4 18.9 3.5 . 18.1 4.3 .Source: California's Employment Development Department and Beacon Economics, LLC
-5
0
5
10
Em
ploy
men
t Gro
wth
(%
, SA
)
35
40
45
50
55
Em
ploy
men
t (00
0s, S
A)
Jan-00 Jan-05 Jan-10 Jan-15 Jan-20
Nonfarm Employment Employment Growth
Source: California EDD and Beacon Economics, LLC
Jan-00 to Mar-20El Centro Nonfarm Employment
15
20
25
30
Une
mpl
oym
ent R
ate
(%, S
A)
55
60
65
70
75
80
Labo
r F
orce
(00
0s, S
A)
Jan-00 Jan-05 Jan-10 Jan-15 Jan-20
Labor Force Unemployment Rate
Source: California EDD and Beacon Economics, LLC
Jan-00 to Mar-20El Centro Unemployment
Seasonally Adjusted Employment Es mates 14 March 2020

B E
Central Coast: Santa Cruz County
Santa Cruz County Seasonally Adjusted Employment ChangesIndustry Mar-20 Feb-20 MoM (000s) MoM (%) Mar-19 YoY (000s) YoY (%)
Farm 8.1 7.9 0.2 2.4 8.1 -0.0 -0.3Total Nonfarm 105.0 105.6 -0.6 -0.6 103.1 1.9 1.8
Total Private 81.4 81.8 -0.4 -0.5 80.9 0.4 0.5NR/Construc on 4.7 4.7 -0.0 -0.2 4.5 0.2 4.9
Manufacturing 7.4 7.3 0.1 1.0 7.1 0.3 4.5Durable Goods 3.9 3.9 -0.0 -0.6 3.7 0.2 5.6Non-Durable Goods 3.5 3.4 0.1 2.9 3.4 0.1 3.3
Trade,Transport,U l. 16.8 16.8 0.0 0.2 16.7 0.1 0.8Wholesale Trade 3.4 3.4 0.0 0.1 3.4 0.0 0.2Retail Trade 11.8 11.8 0.0 0.2 11.7 0.1 1.1Transport,Warehouse,U l. 1.7 1.6 0.0 0.2 1.7 -0.0 -0.1
Informa on 0.6 0.6 -0.0 -0.7 0.6 0.0 0.1Financial Ac vi es 3.7 3.6 0.0 0.4 3.5 0.1 3.1Finance and Insurance 2.0 2.0 0.0 0.3 2.0 0.0 0.2Real Estate 1.6 1.6 0.0 0.5 1.5 0.1 7.0
Professional/Business 11.0 10.9 0.0 0.4 10.7 0.2 2.0Educa on/Health 17.7 17.8 -0.0 -0.3 17.9 -0.2 -0.9Leisure and Hospitality 14.2 14.7 -0.5 -3.3 14.7 -0.5 -3.5Arts and Entertainment 2.6 2.8 -0.2 -5.7 2.6 -0.0 -0.4Accommoda on and Food 11.6 11.9 -0.3 -2.8 12.1 -0.5 -4.2
Other Services 5.3 5.4 -0.0 -0.2 5.2 0.1 2.0Government 23.6 23.8 -0.2 -0.9 22.2 1.5 6.7Federal Government 0.5 0.5 0.0 0.2 0.5 0.0 0.2State Government 10.4 10.5 -0.0 -0.5 8.6 1.8 20.4Local Government 12.7 12.9 -0.2 -1.2 13.0 -0.3 -2.2
Labor Force 141.8 142.3 -0.5 -0.3 141.7 0.1 0.1Employment 133.2 135.2 -2.1 -1.5 134.5 -1.4 -1.0Unemployment 8.6 7.0 1.6 22.6 7.1 1.5 20.9Unemployment Rate 6.1 4.9 1.1 . 5.0 1.0 .Source: California's Employment Development Department and Beacon Economics, LLC
-10
-5
0
5
10
Em
ploy
men
t Gro
wth
(%
, SA
)
85
90
95
100
105
110
Em
ploy
men
t (00
0s, S
A)
Jan-00 Jan-05 Jan-10 Jan-15 Jan-20
Nonfarm Employment Employment Growth
Source: California EDD and Beacon Economics, LLC
Jan-00 to Mar-20Santa Cruz Nonfarm Employment
4
6
8
10
12
14
Une
mpl
oym
ent R
ate
(%, S
A)
135
140
145
150
Labo
r F
orce
(00
0s, S
A)
Jan-00 Jan-05 Jan-10 Jan-15 Jan-20
Labor Force Unemployment Rate
Source: California EDD and Beacon Economics, LLC
Jan-00 to Mar-20Santa Cruz Unemployment
Seasonally Adjusted Employment Es mates 15 March 2020

B E
Central Coast: Monterey County
Monterey County Seasonally Adjusted Employment ChangesIndustry Mar-20 Feb-20 MoM (000s) MoM (%) Mar-19 YoY (000s) YoY (%)
Farm 57.3 57.7 -0.4 -0.7 52.7 4.6 8.7Total Nonfarm 146.6 147.0 -0.4 -0.3 144.9 1.7 1.2
Total Private 112.6 113.0 -0.5 -0.4 110.1 2.4 2.2Construc on 6.8 6.7 0.1 1.0 6.4 0.4 5.9NR/Mining 0.3 0.3 0.0 1.5 0.3 -0.0 -0.4Manufacturing 5.2 5.2 -0.0 -0.4 5.4 -0.2 -4.2Durable Goods 1.9 1.8 0.0 1.0 1.8 0.1 5.5Non-Durable Goods 3.3 3.3 -0.0 -1.1 3.6 -0.3 -8.9
Trade,Transport,U l. 27.6 27.5 0.1 0.4 26.9 0.8 2.8Wholesale Trade 6.1 6.1 -0.0 -0.1 6.0 0.1 1.3Retail Trade 16.8 16.6 0.1 0.8 16.7 0.0 0.2Transport,Warehouse,U l. 4.8 4.8 -0.0 -0.2 4.2 0.6 15.4
Informa on 1.0 1.0 0.0 0.2 1.0 -0.0 -0.5Financial Ac vi es 4.5 4.4 0.0 0.5 4.4 0.1 1.9Professional/Business 15.6 15.3 0.3 2.0 14.4 1.2 8.1Educa on/Health 20.7 20.7 -0.0 -0.1 20.3 0.4 1.9Educa onal Services 2.6 2.4 0.2 7.4 2.1 0.5 22.2Health Care 18.1 18.3 -0.2 -1.1 18.2 -0.1 -0.4
Leisure and Hospitality 25.9 26.9 -1.0 -3.6 25.9 0.0 0.0Arts and Entertainment 2.9 2.9 -0.0 -1.6 2.8 0.1 3.4Accommoda on and Food 23.0 24.0 -0.9 -3.8 23.1 -0.1 -0.4
Other Services 5.0 5.0 0.0 0.7 5.1 -0.1 -2.3Government 34.0 34.0 0.1 0.2 34.8 -0.7 -2.1Federal Government 5.1 5.1 0.0 0.4 5.1 -0.0 -0.4State Government 5.5 5.5 -0.0 -0.5 5.7 -0.2 -3.7Local Government 23.5 23.4 0.1 0.3 24.0 -0.5 -2.1
Labor Force 225.7 226.1 -0.5 -0.2 222.1 3.6 1.6Employment 208.0 211.7 -3.7 -1.8 207.6 0.4 0.2Unemployment 17.7 14.4 3.3 22.7 14.5 3.2 22.4Unemployment Rate 7.9 6.4 1.5 . 6.5 1.3 .Source: California's Employment Development Department and Beacon Economics, LLC
-6
-4
-2
0
2
4
Em
ploy
men
t Gro
wth
(%
, SA
)
120
125
130
135
140
145
Em
ploy
men
t (00
0s, S
A)
Jan-00 Jan-05 Jan-10 Jan-15 Jan-20
Nonfarm Employment Employment Growth
Source: California EDD and Beacon Economics, LLC
Jan-00 to Mar-20Salinas Nonfarm Employment
6
8
10
12
14
Une
mpl
oym
ent R
ate
(%, S
A)
200
205
210
215
220
225
Labo
r F
orce
(00
0s, S
A)
Jan-00 Jan-05 Jan-10 Jan-15 Jan-20
Labor Force Unemployment Rate
Source: California EDD and Beacon Economics, LLC
Jan-00 to Mar-20Salinas Unemployment
Seasonally Adjusted Employment Es mates 16 March 2020

B E
Central Coast: San Luis Obispo County
San Luis Obispo County Seasonally Adjusted Employment ChangesIndustry Mar-20 Feb-20 MoM (000s) MoM (%) Mar-19 YoY (000s) YoY (%)
Farm 4.9 4.9 -0.0 -0.8 5.2 -0.3 -5.7Total Nonfarm 121.7 121.7 0.0 0.0 119.0 2.7 2.3
Total Private 97.1 97.2 -0.1 -0.1 95.1 2.0 2.1NR/Construc on 8.4 8.4 0.0 0.4 8.1 0.3 3.8
Manufacturing 7.9 7.8 0.1 1.4 7.9 -0.0 -0.1Durable Goods 3.2 3.2 0.0 0.8 3.2 0.0 0.1Non-Durable Goods 4.6 4.6 0.1 1.8 4.7 -0.0 -0.2
Trade,Transport,U l. 20.6 20.8 -0.2 -0.8 21.0 -0.3 -1.6Wholesale Trade 2.7 2.7 0.0 0.6 2.7 -0.0 -0.0Retail Trade 14.0 14.1 -0.1 -0.5 14.2 -0.2 -1.5Transport,Warehouse,U l. 3.9 4.0 -0.1 -2.8 4.0 -0.1 -2.9
Informa on 1.3 1.3 0.0 0.6 1.3 0.0 0.1Financial Ac vi es 4.0 3.8 0.1 3.1 3.9 0.1 2.6Finance and Insurance 2.2 2.2 0.0 0.7 2.2 -0.0 -0.1Real Estate 1.8 1.6 0.1 6.3 1.7 0.1 6.2
Professional/Business 11.6 11.6 0.1 0.6 11.0 0.6 5.5Educa on/Health 18.8 18.9 -0.1 -0.4 18.1 0.7 3.8Leisure and Hospitality 20.3 20.4 -0.2 -0.9 19.6 0.6 3.3Arts and Entertainment 2.0 2.0 0.0 0.7 1.7 0.3 20.0Accommoda on and Food 18.2 18.4 -0.2 -1.0 17.9 0.3 1.7
Other Services 4.1 4.2 -0.1 -1.4 4.1 0.0 0.1Government 24.6 24.5 0.1 0.6 23.9 0.7 2.9Federal Government 0.6 0.6 0.0 1.2 0.5 0.1 20.0State Government 11.0 10.9 0.1 0.7 10.6 0.4 3.7Local Government 13.0 13.0 0.1 0.5 12.8 0.2 1.6
Labor Force 140.4 141.4 -0.9 -0.6 140.5 -0.1 -0.1Employment 135.2 137.3 -2.1 -1.5 136.3 -1.0 -0.8Unemployment 5.2 4.1 1.2 28.6 4.3 1.0 22.5Unemployment Rate 3.7 2.9 0.8 . 3.0 0.7 .Source: California's Employment Development Department and Beacon Economics, LLC
-10
-5
0
5
10
Em
ploy
men
t Gro
wth
(%
, SA
)
90
95
100
105
110
115
120
Em
ploy
men
t (00
0s, S
A)
Jan-00 Jan-05 Jan-10 Jan-15 Jan-20
Nonfarm Employment Employment Growth
Source: California EDD and Beacon Economics, LLC
Jan-00 to Mar-20San Luis Obispo Nonfarm Employment
2
4
6
8
10
12
Une
mpl
oym
ent R
ate
(%, S
A)
120
125
130
135
140
145
Labo
r F
orce
(00
0s, S
A)
Jan-00 Jan-05 Jan-10 Jan-15 Jan-20
Labor Force Unemployment Rate
Source: California EDD and Beacon Economics, LLC
Jan-00 to Mar-20San Luis Obispo Unemployment
Seasonally Adjusted Employment Es mates 17 March 2020

B E
Central Coast: Santa Barbara County
Santa Barbara County Seasonally Adjusted Employment ChangesIndustry Mar-20 Feb-20 MoM (000s) MoM (%) Mar-19 YoY (000s) YoY (%)
Farm 22.1 22.9 -0.8 -3.5 22.5 -0.4 -2.0Total Nonfarm 188.6 189.3 -0.7 -0.4 187.0 1.6 0.9
Total Private 149.2 149.9 -0.8 -0.5 147.6 1.6 1.1Construc on 8.8 8.8 -0.1 -0.7 9.0 -0.2 -2.5NR/Mining 1.0 1.0 0.0 0.2 1.1 -0.1 -9.2Manufacturing 13.1 13.2 -0.1 -0.9 13.0 0.1 0.6Durable Goods 9.4 9.4 0.0 0.2 9.3 0.1 0.9Non-Durable Goods 3.7 3.8 -0.1 -3.6 3.7 -0.0 -0.2
Trade,Transport,U l. 27.7 27.7 -0.0 -0.1 27.1 0.6 2.4Wholesale Trade 5.3 5.3 -0.0 -0.6 5.1 0.2 3.8Retail Trade 18.8 18.8 0.0 0.2 18.5 0.4 1.9Transport,Warehouse,U l. 3.6 3.6 -0.0 -0.4 3.5 0.1 2.6
Informa on 4.0 4.0 0.1 1.7 3.9 0.1 2.3Financial Ac vi es 7.2 7.2 -0.0 -0.2 7.2 -0.0 -0.2Finance and Insurance 3.7 3.7 0.0 0.0 3.7 -0.0 -0.2Real Estate 3.5 3.5 -0.0 -0.5 3.5 -0.0 -0.2
Professional/Business 24.0 23.8 0.2 0.8 23.2 0.8 3.3Prof Sci and Tech 12.1 12.0 0.1 0.9 11.5 0.6 5.1Management 2.9 2.9 0.0 1.0 2.7 0.2 7.3Admin Support 9.0 8.9 0.1 0.6 9.0 -0.0 -0.2
Educa on/Health 29.0 28.9 0.1 0.2 28.0 0.9 3.4Educa onal Services 3.4 3.4 0.0 0.9 3.0 0.4 13.2Health Care 25.6 25.5 0.0 0.2 25.0 0.5 2.2
Leisure and Hospitality 27.9 28.8 -0.9 -3.0 28.5 -0.6 -2.0Arts and Entertainment 3.7 3.9 -0.2 -4.3 3.7 -0.0 -0.3Accommoda on and Food 24.2 24.9 -0.7 -2.8 24.8 -0.6 -2.3
Other Services 6.4 6.5 -0.0 -0.8 6.4 -0.0 -0.1Government 39.4 39.4 0.1 0.2 39.4 0.0 0.0Federal Government 3.4 3.4 -0.0 -0.2 3.6 -0.2 -5.9State Government 12.5 12.5 0.1 0.5 12.4 0.2 1.2Local Government 23.5 23.5 0.0 0.2 23.4 0.1 0.3
Labor Force 215.1 217.5 -2.4 -1.1 216.8 -1.7 -0.8Employment 204.9 209.4 -4.5 -2.1 208.2 -3.3 -1.6Unemployment 10.2 8.2 2.1 25.1 8.7 1.6 18.0Unemployment Rate 4.7 3.8 1.0 . 4.0 0.8 .Source: California's Employment Development Department and Beacon Economics, LLC
-6
-4
-2
0
2
4
Em
ploy
men
t Gro
wth
(%
, SA
)
160
165
170
175
180
185
190
Em
ploy
men
t (00
0s, S
A)
Jan-00 Jan-05 Jan-10 Jan-15 Jan-20
Nonfarm Employment Employment Growth
Source: California EDD and Beacon Economics, LLC
Jan-00 to Mar-20Santa Barbara Nonfarm Employment
2
4
6
8
10
Une
mpl
oym
ent R
ate
(%, S
A)
200
205
210
215
220
Labo
r F
orce
(00
0s, S
A)
Jan-00 Jan-05 Jan-10 Jan-15 Jan-20
Labor Force Unemployment Rate
Source: California EDD and Beacon Economics, LLC
Jan-00 to Mar-20Santa Barbara Unemployment
Seasonally Adjusted Employment Es mates 18 March 2020

B E
North Central Valley: Sacramento (MSA)
Sacramento (MSA) Seasonally Adjusted Employment ChangesIndustry Mar-20 Feb-20 MoM (000s) MoM (%) Mar-19 YoY (000s) YoY (%)
Farm 8.9 9.0 -0.0 -0.1 8.8 0.2 1.7Total Nonfarm 1,026.0 1,029.4 -3.4 -0.3 1,014.5 11.5 1.1
Total Private 782.8 786.9 -4.1 -0.5 774.3 8.5 1.1Construc on 69.0 69.3 -0.4 -0.5 69.0 0.0 0.0NR/Mining 0.5 0.5 0.0 0.4 0.5 -0.0 -0.1Manufacturing 37.6 37.4 0.2 0.4 36.5 1.1 3.1Durable Goods 24.5 24.3 0.1 0.6 23.6 0.9 3.9Non-Durable Goods 13.1 13.1 0.0 0.2 12.9 0.2 1.6
Trade,Transport,U l. 165.4 164.4 1.0 0.6 160.8 4.6 2.8Wholesale Trade 28.9 28.5 0.4 1.4 28.9 0.1 0.2Retail Trade 102.0 101.6 0.4 0.4 100.8 1.1 1.1Transport,Warehouse,U l. 34.5 34.3 0.2 0.5 31.1 3.4 10.9
Informa on 11.5 11.5 0.0 0.4 12.0 -0.5 -4.2Financial Ac vi es 53.6 53.2 0.5 0.9 52.1 1.5 2.9Finance and Insurance 35.6 35.6 0.1 0.2 35.1 0.5 1.4Real Estate 18.0 17.6 0.4 2.4 17.0 1.0 5.9
Professional/Business 137.9 138.1 -0.1 -0.1 134.0 3.9 2.9Prof Sci and Tech 60.1 60.0 0.1 0.1 58.5 1.5 2.6Management 13.3 13.4 -0.1 -0.6 13.4 -0.1 -0.8Admin Support 64.6 64.7 -0.1 -0.2 62.1 2.5 4.1
Educa on/Health 167.4 168.4 -1.0 -0.6 165.3 2.0 1.2Health Care 153.8 155.5 -1.7 -1.1 151.9 1.9 1.3
Leisure and Hospitality 105.2 108.7 -3.4 -3.2 108.9 -3.6 -3.3Arts and Entertainment 16.0 16.6 -0.6 -3.4 17.4 -1.3 -7.7Accommoda on and Food 89.2 92.1 -2.9 -3.1 91.5 -2.3 -2.5
Other Services 34.6 35.4 -0.8 -2.2 35.2 -0.5 -1.4Government 243.2 242.5 0.7 0.3 240.2 3.0 1.3Federal Government 14.3 14.1 0.2 1.4 14.1 0.2 1.4State Government 124.3 123.8 0.5 0.4 121.6 2.7 2.2Local Government 104.7 104.6 0.0 0.0 104.5 0.2 0.2
Labor Force 1,093.8 1,100.9 -7.1 -0.6 1,100.1 -6.3 -0.6Employment 1,045.4 1,062.1 -16.6 -1.6 1,058.0 -12.6 -1.2Unemployment 48.3 38.8 9.5 24.4 42.0 6.3 15.0Unemployment Rate 4.4 3.5 0.9 . 3.8 0.6 .Source: California's Employment Development Department and Beacon Economics, LLC
-6
-4
-2
0
2
4
Em
ploy
men
t Gro
wth
(%
, SA
)
800
850
900
950
1,000
1,050
Em
ploy
men
t (00
0s, S
A)
Jan-00 Jan-05 Jan-10 Jan-15 Jan-20
Nonfarm Employment Employment Growth
Source: California EDD and Beacon Economics, LLC
Jan-00 to Mar-20Sacramento Nonfarm Employment
4
6
8
10
12
14
Une
mpl
oym
ent R
ate
(%, S
A)
900
950
1,000
1,050
1,100
Labo
r F
orce
(00
0s, S
A)
Jan-00 Jan-05 Jan-10 Jan-15 Jan-20
Labor Force Unemployment Rate
Source: California EDD and Beacon Economics, LLC
Jan-00 to Mar-20Sacramento Unemployment
Seasonally Adjusted Employment Es mates 19 March 2020

B E
North Central Valley: San Joaquin County
San Joaquin County Seasonally Adjusted Employment ChangesIndustry Mar-20 Feb-20 MoM (000s) MoM (%) Mar-19 YoY (000s) YoY (%)
Farm 14.0 13.5 0.5 4.0 15.4 -1.4 -8.8Total Nonfarm 249.0 249.2 -0.2 -0.1 245.0 4.0 1.6
Total Private 203.6 203.8 -0.3 -0.1 200.2 3.4 1.7Construc on 13.1 13.2 -0.1 -0.8 13.1 -0.0 -0.3NR/Mining 0.1 0.1 -0.0 -0.2 0.1 -0.0 -0.2Manufacturing 19.2 19.3 -0.2 -0.8 19.8 -0.6 -3.2Durable Goods 8.9 8.9 -0.0 -0.4 9.5 -0.6 -6.6Non-Durable Goods 10.3 10.4 -0.1 -1.1 10.3 -0.0 -0.2
Trade,Transport,U l. 71.9 71.8 0.1 0.2 68.9 3.0 4.3Wholesale Trade 12.6 12.7 -0.0 -0.4 12.9 -0.2 -1.8Retail Trade 25.9 25.8 0.0 0.1 26.3 -0.5 -1.8Transport,Warehouse,U l. 33.4 33.3 0.2 0.5 29.7 3.7 12.4
Informa on 1.6 1.6 -0.0 -0.9 1.6 -0.0 -0.1Financial Ac vi es 8.2 8.0 0.1 1.3 7.9 0.3 3.7Finance and Insurance 4.8 4.8 0.0 0.9 4.7 0.1 2.0Real Estate 3.3 3.3 0.1 1.8 3.1 0.2 6.2
Professional/Business 20.4 20.4 -0.1 -0.3 19.2 1.1 5.9Admin Support 13.3 13.4 -0.1 -0.5 12.3 1.0 8.0
Educa on/Health 38.7 38.6 0.2 0.5 39.1 -0.4 -0.9Educa onal Services 4.3 4.4 -0.1 -1.5 4.6 -0.3 -6.1Health Care 34.4 34.2 0.2 0.7 34.5 -0.1 -0.2
Leisure and Hospitality 22.5 22.8 -0.3 -1.4 22.7 -0.2 -0.7Arts and Entertainment 2.6 2.6 -0.0 -0.4 2.5 0.1 3.8Accommoda on and Food 19.9 20.2 -0.3 -1.6 20.1 -0.3 -1.2
Other Services 7.9 7.9 -0.0 -0.0 7.7 0.2 2.4Government 45.4 45.4 0.1 0.1 44.8 0.6 1.3Federal Government 3.3 3.3 0.0 0.3 3.1 0.2 6.1State Government 6.8 6.8 -0.0 -0.0 6.8 -0.0 -0.2Local Government 35.3 35.3 0.0 0.1 34.9 0.4 1.2
Labor Force 328.0 325.9 2.0 0.6 326.7 1.3 0.4Employment 303.9 306.5 -2.7 -0.9 307.2 -3.3 -1.1Unemployment Rate 7.4 5.8 1.6 . 6.1 1.3 .Source: California's Employment Development Department and Beacon Economics, LLC
-6
-4
-2
0
2
4
6
Em
ploy
men
t Gro
wth
(%
, SA
)
180
200
220
240
260
Em
ploy
men
t (00
0s, S
A)
Jan-00 Jan-05 Jan-10 Jan-15 Jan-20
Nonfarm Employment Employment Growth
Source: California EDD and Beacon Economics, LLC
Jan-00 to Mar-20Stockton Nonfarm Employment
6
8
10
12
14
16
18
Une
mpl
oym
ent R
ate
(%, S
A)
240
260
280
300
320
340
Labo
r F
orce
(00
0s, S
A)
Jan-00 Jan-05 Jan-10 Jan-15 Jan-20
Labor Force Unemployment Rate
Source: California EDD and Beacon Economics, LLC
Jan-00 to Mar-20Stockton Unemployment
Seasonally Adjusted Employment Es mates 20 March 2020

B E
North Central Valley: Yuba City (MSA)
Yuba City (MSA) Seasonally Adjusted Employment ChangesIndustry Mar-20 Feb-20 MoM (000s) MoM (%) Mar-19 YoY (000s) YoY (%)
Farm 5.5 5.4 0.1 2.3 5.2 0.3 5.7Total Nonfarm 49.4 49.1 0.3 0.6 45.6 3.8 8.3
Total Private 35.2 35.1 0.1 0.3 33.9 1.3 4.0NR/Construc on 3.2 3.1 0.0 1.5 2.9 0.3 11.3
Manufacturing 2.3 2.3 -0.0 -0.4 2.3 0.0 0.4Trade,Transport,U l. 9.7 9.6 0.1 0.9 9.4 0.3 3.4Wholesale Trade 1.6 1.6 0.0 0.5 1.6 0.0 0.2Retail Trade 6.0 5.9 0.0 0.4 5.9 0.0 0.4Transport,Warehouse,U l. 2.1 2.1 0.1 2.6 1.8 0.3 15.7
Informa on 0.3 0.3 0.0 1.6 0.3 0.0 0.4Financial Ac vi es 1.4 1.4 0.0 0.5 1.4 0.0 0.4Professional/Business 3.3 3.3 0.0 0.5 3.1 0.2 7.1Educa on/Health 8.8 8.8 -0.1 -0.7 8.6 0.1 1.5Leisure and Hospitality 4.9 4.9 -0.0 -0.1 4.7 0.2 4.9Other Services 1.3 1.3 0.0 0.6 1.2 0.1 9.5Government 14.2 14.0 0.2 1.5 11.7 2.5 20.9Federal Government 1.6 1.5 0.1 7.3 1.7 -0.1 -5.8State Government 1.1 1.1 -0.0 -0.3 1.2 -0.1 -8.0Local Government 11.6 11.5 0.1 0.9 8.9 2.6 29.6
Labor Force 78.3 78.1 0.1 0.2 75.1 3.2 4.2Employment 72.0 73.0 -1.0 -1.4 69.7 2.2 3.2Unemployment 6.3 5.2 1.1 22.2 5.4 0.9 17.3Unemployment Rate 8.1 6.6 1.5 . 7.2 0.9 .Source: California's Employment Development Department and Beacon Economics, LLC
-5
0
5
10
Em
ploy
men
t Gro
wth
(%
, SA
)
35
40
45
50
Em
ploy
men
t (00
0s, S
A)
Jan-00 Jan-05 Jan-10 Jan-15 Jan-20
Nonfarm Employment Employment Growth
Source: California EDD and Beacon Economics, LLC
Jan-00 to Mar-20Yuba Nonfarm Employment
6
8
10
12
14
16
18
Une
mpl
oym
ent R
ate
(%, S
A)
60
65
70
75
80
Labo
r F
orce
(00
0s, S
A)
Jan-00 Jan-05 Jan-10 Jan-15 Jan-20
Labor Force Unemployment Rate
Source: California EDD and Beacon Economics, LLC
Jan-00 to Mar-20Yuba Unemployment
Seasonally Adjusted Employment Es mates 21 March 2020

B E
North Central Valley: Butte County
Bu e County Seasonally Adjusted Employment ChangesIndustry Mar-20 Feb-20 MoM (000s) MoM (%) Mar-19 YoY (000s) YoY (%)
Farm 2.8 2.9 -0.0 -1.1 2.8 0.0 0.1Total Nonfarm 81.3 81.1 0.2 0.2 80.8 0.5 0.6
Total Private 64.4 64.4 0.0 0.0 64.2 0.2 0.2NR/Construc on 4.7 4.6 0.0 0.8 4.4 0.2 5.1
Manufacturing 4.1 4.0 0.1 1.7 4.1 0.0 0.1Trade,Transport,U l. 14.2 14.3 -0.0 -0.1 14.7 -0.5 -3.2Wholesale Trade 2.1 2.1 0.0 0.7 2.1 0.0 0.3Retail Trade 10.6 10.6 -0.0 -0.2 10.9 -0.4 -3.5Transport,Warehouse,U l. 1.5 1.6 -0.0 -0.6 1.6 -0.1 -6.0
Informa on 0.8 0.8 0.0 1.1 0.8 0.0 0.4Financial Ac vi es 3.2 3.1 0.0 0.9 3.1 0.0 0.4Finance and Insurance 1.8 1.8 0.0 1.8 1.9 -0.1 -4.9Real Estate 1.3 1.3 -0.0 -0.2 1.2 0.1 8.5
Professional/Business 5.9 6.0 -0.0 -0.0 5.6 0.3 5.7Educa on/Health 18.2 18.3 -0.0 -0.3 18.4 -0.1 -0.8Leisure and Hospitality 9.2 9.2 -0.1 -0.6 9.1 0.0 0.3Other Services 4.1 4.1 -0.0 -0.0 3.9 0.2 4.8Government 16.9 16.7 0.2 1.1 16.6 0.3 2.1Federal Government 0.8 0.7 0.1 16.0 0.5 0.2 40.4State Government 4.5 4.4 0.0 0.6 4.4 0.1 2.4Local Government 11.7 11.6 0.1 0.5 11.7 0.0 0.2
Labor Force 98.2 98.6 -0.4 -0.4 99.9 -1.7 -1.7Employment 92.3 93.9 -1.6 -1.7 94.4 -2.1 -2.2Unemployment 5.9 4.7 1.2 26.2 5.5 0.4 7.6Unemployment Rate 6.0 4.8 1.3 . 5.5 0.5 .Source: California's Employment Development Department and Beacon Economics, LLC
-10
-5
0
5
Em
ploy
men
t Gro
wth
(%
, SA
)
70
75
80
85
Em
ploy
men
t (00
0s, S
A)
Jan-00 Jan-05 Jan-10 Jan-15 Jan-20
Nonfarm Employment Employment Growth
Source: California EDD and Beacon Economics, LLC
Jan-00 to Mar-20Chico Nonfarm Employment
4
6
8
10
12
14
Une
mpl
oym
ent R
ate
(%, S
A)
92
94
96
98
100
102
104
Labo
r F
orce
(00
0s, S
A)
Jan-00 Jan-05 Jan-10 Jan-15 Jan-20
Labor Force Unemployment Rate
Source: California EDD and Beacon Economics, LLC
Jan-00 to Mar-20Chico Unemployment
Seasonally Adjusted Employment Es mates 22 March 2020

B E
North Central Valley: Shasta County
Shasta County Seasonally Adjusted Employment ChangesIndustry Mar-20 Feb-20 MoM (000s) MoM (%) Mar-19 YoY (000s) YoY (%)
Farm 1.1 1.1 0.0 0.6 0.9 0.2 16.8Total Nonfarm 68.1 68.4 -0.3 -0.4 68.2 -0.1 -0.1
Total Private 54.6 54.8 -0.3 -0.5 54.6 -0.1 -0.1NR/Construc on 4.0 4.0 0.0 0.9 3.9 0.1 3.3
Manufacturing 2.5 2.5 0.0 0.0 2.5 0.0 0.5Trade,Transport,U l. 12.7 12.8 -0.1 -0.9 12.8 -0.1 -1.2Wholesale Trade 1.9 2.0 -0.0 -1.5 1.9 0.0 0.2Retail Trade 8.7 8.8 -0.1 -1.1 8.9 -0.3 -2.9Transport,Warehouse,U l. 2.1 2.1 0.0 0.7 2.0 0.1 5.7
Informa on 0.5 0.5 -0.0 -0.9 0.5 0.0 0.3Financial Ac vi es 2.7 2.7 0.0 0.0 2.7 0.0 0.4Professional/Business 7.9 7.9 0.1 0.7 7.5 0.4 5.9Educa on/Health 15.2 15.3 -0.1 -0.7 15.3 -0.0 -0.2Leisure and Hospitality 6.5 6.6 -0.1 -1.8 7.0 -0.5 -6.9Arts and Entertainment 0.9 1.0 -0.0 -4.6 0.9 -0.0 -0.1Accommoda on and Food 5.6 5.6 -0.1 -1.3 6.0 -0.5 -7.9
Other Services 2.5 2.5 -0.0 -0.3 2.4 0.0 0.6Government 13.5 13.6 -0.0 -0.4 13.6 -0.0 -0.3Federal Government 1.3 1.3 -0.0 -0.2 1.3 0.0 0.4State Government 1.9 2.0 -0.0 -0.1 1.9 0.0 0.5Local Government 10.3 10.3 -0.0 -0.4 10.4 -0.1 -0.6
Labor Force 73.4 74.0 -0.6 -0.8 74.6 -1.2 -1.7Employment 69.1 70.6 -1.5 -2.1 70.9 -1.8 -2.6Unemployment 4.3 3.4 0.9 25.2 3.7 0.6 15.8Unemployment Rate 5.8 4.6 1.2 . 4.9 0.9 .Source: California's Employment Development Department and Beacon Economics, LLC
-10
-5
0
5
Em
ploy
men
t Gro
wth
(%
, SA
)
58
60
62
64
66
68
70
Em
ploy
men
t (00
0s, S
A)
Jan-00 Jan-05 Jan-10 Jan-15 Jan-20
Nonfarm Employment Employment Growth
Source: California EDD and Beacon Economics, LLC
Jan-00 to Mar-20Redding Nonfarm Employment
5
10
15
20
Une
mpl
oym
ent R
ate
(%, S
A)
74
76
78
80
82
84
86
Labo
r F
orce
(00
0s, S
A)
Jan-00 Jan-05 Jan-10 Jan-15 Jan-20
Labor Force Unemployment Rate
Source: California EDD and Beacon Economics, LLC
Jan-00 to Mar-20Redding Unemployment
Seasonally Adjusted Employment Es mates 23 March 2020
B E
South Central Valley: Stanislaus County
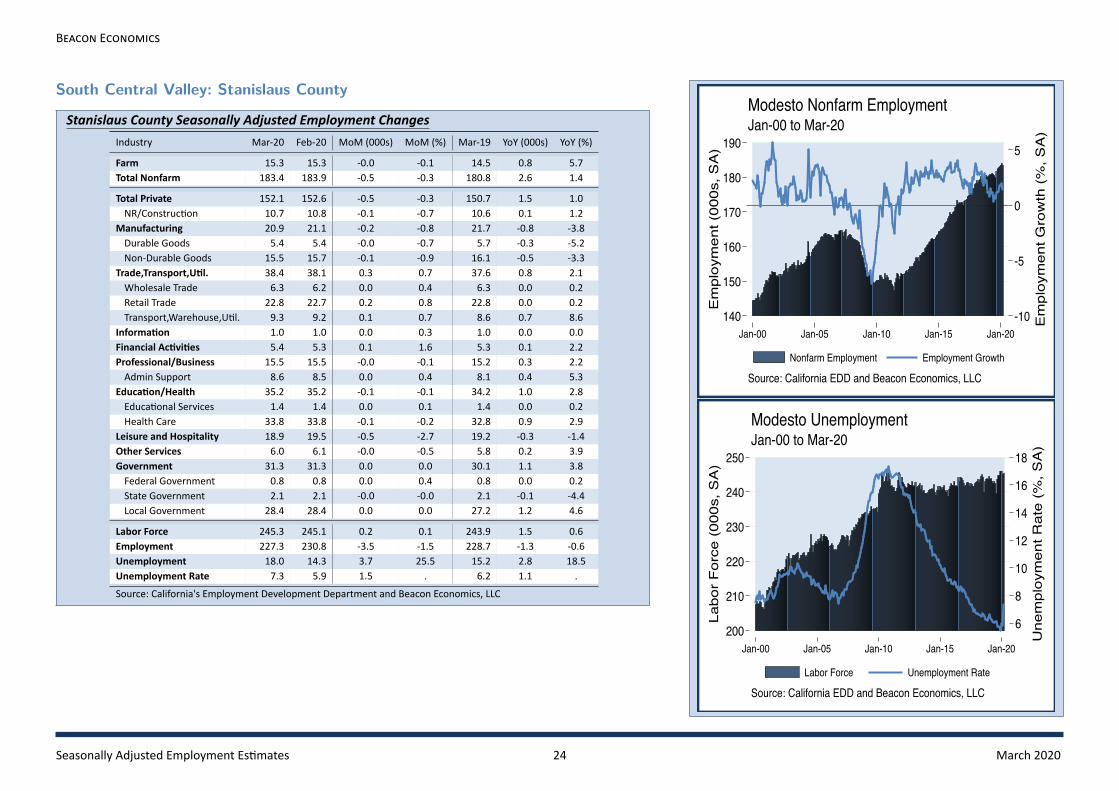
Stanislaus County Seasonally Adjusted Employment ChangesIndustry Mar-20 Feb-20 MoM (000s) MoM (%) Mar-19 YoY (000s) YoY (%)
Farm 15.3 15.3 -0.0 -0.1 14.5 0.8 5.7Total Nonfarm 183.4 183.9 -0.5 -0.3 180.8 2.6 1.4
Total Private 152.1 152.6 -0.5 -0.3 150.7 1.5 1.0NR/Construc on 10.7 10.8 -0.1 -0.7 10.6 0.1 1.2
Manufacturing 20.9 21.1 -0.2 -0.8 21.7 -0.8 -3.8Durable Goods 5.4 5.4 -0.0 -0.7 5.7 -0.3 -5.2Non-Durable Goods 15.5 15.7 -0.1 -0.9 16.1 -0.5 -3.3
Trade,Transport,U l. 38.4 38.1 0.3 0.7 37.6 0.8 2.1Wholesale Trade 6.3 6.2 0.0 0.4 6.3 0.0 0.2Retail Trade 22.8 22.7 0.2 0.8 22.8 0.0 0.2Transport,Warehouse,U l. 9.3 9.2 0.1 0.7 8.6 0.7 8.6
Informa on 1.0 1.0 0.0 0.3 1.0 0.0 0.0Financial Ac vi es 5.4 5.3 0.1 1.6 5.3 0.1 2.2Professional/Business 15.5 15.5 -0.0 -0.1 15.2 0.3 2.2Admin Support 8.6 8.5 0.0 0.4 8.1 0.4 5.3
Educa on/Health 35.2 35.2 -0.1 -0.1 34.2 1.0 2.8Educa onal Services 1.4 1.4 0.0 0.1 1.4 0.0 0.2Health Care 33.8 33.8 -0.1 -0.2 32.8 0.9 2.9
Leisure and Hospitality 18.9 19.5 -0.5 -2.7 19.2 -0.3 -1.4Other Services 6.0 6.1 -0.0 -0.5 5.8 0.2 3.9Government 31.3 31.3 0.0 0.0 30.1 1.1 3.8Federal Government 0.8 0.8 0.0 0.4 0.8 0.0 0.2State Government 2.1 2.1 -0.0 -0.0 2.1 -0.1 -4.4Local Government 28.4 28.4 0.0 0.0 27.2 1.2 4.6
Labor Force 245.3 245.1 0.2 0.1 243.9 1.5 0.6Employment 227.3 230.8 -3.5 -1.5 228.7 -1.3 -0.6Unemployment 18.0 14.3 3.7 25.5 15.2 2.8 18.5Unemployment Rate 7.3 5.9 1.5 . 6.2 1.1 .Source: California's Employment Development Department and Beacon Economics, LLC
-10
-5
0
5
Em
ploy
men
t Gro
wth
(%
, SA
)
140
150
160
170
180
190
Em
ploy
men
t (00
0s, S
A)
Jan-00 Jan-05 Jan-10 Jan-15 Jan-20
Nonfarm Employment Employment Growth
Source: California EDD and Beacon Economics, LLC
Jan-00 to Mar-20Modesto Nonfarm Employment
6
8
10
12
14
16
18
Une
mpl
oym
ent R
ate
(%, S
A)
200
210
220
230
240
250
Labo
r F
orce
(00
0s, S
A)
Jan-00 Jan-05 Jan-10 Jan-15 Jan-20
Labor Force Unemployment Rate
Source: California EDD and Beacon Economics, LLC
Jan-00 to Mar-20Modesto Unemployment
Seasonally Adjusted Employment Es mates 24 March 2020

B E
South Central Valley: Merced County
Merced County Seasonally Adjusted Employment ChangesIndustry Mar-20 Feb-20 MoM (000s) MoM (%) Mar-19 YoY (000s) YoY (%)
Farm 14.0 13.9 0.1 0.6 13.8 0.1 1.0Total Nonfarm 69.7 69.9 -0.2 -0.3 70.3 -0.6 -0.9
Total Private 50.5 50.8 -0.3 -0.6 50.8 -0.3 -0.5NR/Construc on 2.8 2.8 0.0 0.6 2.4 0.3 13.3
Manufacturing 9.3 9.4 -0.1 -0.8 9.9 -0.6 -5.7Durable Goods 1.3 1.3 0.1 4.9 1.4 -0.1 -6.4Non-Durable Goods 8.0 8.1 -0.1 -1.7 8.5 -0.5 -5.6
Trade,Transport,U l. 13.8 13.9 -0.1 -0.7 13.9 -0.1 -0.8Wholesale Trade 1.5 1.6 -0.1 -5.7 1.8 -0.3 -16.8Retail Trade 8.5 8.6 -0.0 -0.4 8.5 0.1 0.8Transport,Warehouse,U l. 3.8 3.7 0.0 0.5 3.6 0.1 3.6
Informa on 0.3 0.3 0.0 0.4 0.3 0.0 0.4Financial Ac vi es 1.9 1.9 0.0 2.5 1.9 0.0 0.7Professional/Business 4.2 4.3 -0.1 -3.0 4.3 -0.2 -3.8Educa on/Health 10.7 10.6 0.0 0.4 10.5 0.2 1.7Leisure and Hospitality 6.0 6.1 -0.1 -1.5 6.0 0.0 0.7Other Services 1.5 1.5 0.0 0.4 1.5 0.0 1.1Government 19.2 19.1 0.1 0.5 19.5 -0.3 -1.7Federal Government 0.7 0.7 -0.0 -0.2 0.7 0.0 0.6State Government 3.5 3.6 -0.1 -1.6 4.0 -0.4 -11.0Local Government 14.9 14.8 0.2 1.0 14.8 0.1 0.7
Labor Force 115.9 115.0 0.9 0.8 116.7 -0.8 -0.7Employment 103.9 105.4 -1.5 -1.4 107.1 -3.2 -3.0Unemployment 11.9 9.6 2.4 24.8 9.6 2.3 24.1Unemployment Rate 10.3 8.3 2.0 . 8.2 2.1 .Source: California's Employment Development Department and Beacon Economics, LLC
-4
-2
0
2
4
6
8
Em
ploy
men
t Gro
wth
(%
, SA
)
50
55
60
65
70
Em
ploy
men
t (00
0s, S
A)
Jan-00 Jan-05 Jan-10 Jan-15 Jan-20
Nonfarm Employment Employment Growth
Source: California EDD and Beacon Economics, LLC
Jan-00 to Mar-20Merced Nonfarm Employment
8
10
12
14
16
18
Une
mpl
oym
ent R
ate
(%, S
A)
90
95
100
105
110
115
120
Labo
r F
orce
(00
0s, S
A)
Jan-00 Jan-05 Jan-10 Jan-15 Jan-20
Labor Force Unemployment Rate
Source: California EDD and Beacon Economics, LLC
Jan-00 to Mar-20Merced Unemployment
Seasonally Adjusted Employment Es mates 25 March 2020

B E
South Central Valley: Madera County
Madera County Seasonally Adjusted Employment ChangesIndustry Mar-20 Feb-20 MoM (000s) MoM (%) Mar-19 YoY (000s) YoY (%)
Farm 12.5 12.6 -0.0 -0.2 12.7 -0.1 -1.0Total Nonfarm 39.9 39.6 0.3 0.8 38.8 1.1 2.8
Total Private 28.5 28.4 0.1 0.3 27.8 0.7 2.6NR/Construc on 2.0 2.0 0.0 0.6 1.9 0.1 4.8
Manufacturing 3.4 3.4 -0.0 -0.4 3.5 -0.1 -3.3Trade,Transport,U l. 6.0 5.9 0.1 1.9 5.8 0.2 3.2Wholesale Trade 1.1 1.0 0.1 12.4 1.0 0.1 9.3Retail Trade 3.8 3.8 -0.0 -0.5 3.9 -0.1 -3.0Transport,Warehouse,U l. 1.1 1.0 0.0 0.4 0.8 0.2 24.1
Informa on 0.3 0.3 0.0 0.0 0.3 -0.0 -0.5Financial Ac vi es 0.8 0.8 -0.0 -3.5 0.8 -0.0 -0.2Professional/Business 2.1 2.1 0.0 0.1 2.0 0.1 4.7Educa on/Health 8.8 8.8 -0.0 -0.2 8.8 0.1 0.7Educa onal Services 0.1 0.1 -0.0 -3.1 0.1 -0.0 -0.6Health Care 8.7 8.8 -0.0 -0.2 8.7 0.1 0.7
Leisure and Hospitality 4.0 4.0 0.0 0.4 3.6 0.4 11.0Other Services 1.0 1.0 0.0 0.2 1.0 -0.0 -0.3Government 11.4 11.2 0.2 1.9 11.0 0.4 3.5Federal Government 0.4 0.3 0.1 47.4 0.3 0.1 49.1State Government 2.6 2.6 0.0 0.3 2.5 0.1 3.6Local Government 8.4 8.3 0.1 1.0 8.3 0.2 2.0
Labor Force 63.0 62.3 0.6 1.0 61.9 1.1 1.7Employment 57.4 58.0 -0.6 -1.1 57.4 -0.1 -0.1Unemployment 5.6 4.3 1.3 29.0 4.4 1.1 25.9Unemployment Rate 8.9 7.0 1.9 . 7.2 1.7 .Source: California's Employment Development Department and Beacon Economics, LLC
-5
0
5
10
15
Em
ploy
men
t Gro
wth
(%
, SA
)
28
30
32
34
36
38
40
Em
ploy
men
t (00
0s, S
A)
Jan-00 Jan-05 Jan-10 Jan-15 Jan-20
Nonfarm Employment Employment Growth
Source: California EDD and Beacon Economics, LLC
Jan-00 to Mar-20Madera Nonfarm Employment
6
8
10
12
14
16
18
Une
mpl
oym
ent R
ate
(%, S
A)
50
55
60
65
70
Labo
r F
orce
(00
0s, S
A)
Jan-00 Jan-05 Jan-10 Jan-15 Jan-20
Labor Force Unemployment Rate
Source: California EDD and Beacon Economics, LLC
Jan-00 to Mar-20Madera Unemployment
Seasonally Adjusted Employment Es mates 26 March 2020

B E
South Central Valley: Fresno County
Fresno County Seasonally Adjusted Employment ChangesIndustry Mar-20 Feb-20 MoM (000s) MoM (%) Mar-19 YoY (000s) YoY (%)
Farm 43.6 43.4 0.3 0.6 43.7 -0.1 -0.2Total Nonfarm 364.8 365.3 -0.5 -0.1 358.5 6.3 1.8
Total Private 290.3 291.0 -0.6 -0.2 283.8 6.5 2.3Construc on 18.8 19.0 -0.2 -1.0 18.7 0.1 0.4NR/Mining 0.3 0.3 0.0 0.2 0.3 -0.0 -0.3Manufacturing 26.9 26.9 -0.0 -0.1 26.1 0.8 2.9Durable Goods 9.2 9.2 0.0 0.1 9.0 0.2 2.0Non-Durable Goods 17.7 17.7 -0.0 -0.2 17.1 0.6 3.4
Trade,Transport,U l. 71.6 71.1 0.5 0.7 69.6 2.0 2.9Wholesale Trade 14.9 15.0 -0.1 -0.5 14.5 0.4 2.6Retail Trade 39.2 39.1 0.2 0.5 38.7 0.5 1.4Transport,Warehouse,U l. 17.4 17.1 0.4 2.2 16.3 1.1 6.9
Informa on 3.4 3.4 0.1 1.8 3.4 -0.0 -0.1Financial Ac vi es 14.8 14.8 -0.0 -0.2 14.3 0.5 3.3Finance and Insurance 9.8 9.7 0.1 0.6 9.5 0.3 2.9Real Estate 5.0 5.1 -0.1 -1.6 4.9 0.2 4.0
Professional/Business 33.9 33.9 0.0 0.1 32.3 1.7 5.1Prof Sci and Tech 11.6 11.5 0.0 0.4 11.4 0.2 1.6Management 2.4 2.3 0.1 3.5 2.2 0.2 9.1Admin Support 20.0 20.1 -0.1 -0.4 18.7 1.3 6.9
Educa on/Health 73.8 74.1 -0.3 -0.4 71.9 1.9 2.6Educa onal Services 3.6 4.2 -0.5 -12.7 3.9 -0.3 -6.8Health Care 70.1 69.9 0.2 0.3 68.0 2.2 3.2
Leisure and Hospitality 35.1 35.5 -0.4 -1.2 35.4 -0.4 -1.0Arts and Entertainment 3.4 3.5 -0.1 -2.2 3.5 -0.1 -2.7Accommoda on and Food 31.6 32.0 -0.3 -1.1 31.9 -0.3 -0.8
Other Services 11.8 12.1 -0.3 -2.2 11.8 -0.0 -0.2Government 74.5 74.3 0.1 0.2 74.7 -0.2 -0.3Federal Government 10.0 10.1 -0.1 -1.0 9.9 0.1 1.1State Government 12.6 12.5 0.1 0.5 12.7 -0.1 -1.0Local Government 51.9 51.7 0.2 0.3 52.1 -0.2 -0.4
Labor Force 454.5 452.8 1.7 0.4 449.0 5.5 1.2Employment 412.9 420.1 -7.3 -1.7 415.1 -2.2 -0.5Unemployment 41.6 32.6 9.0 27.5 33.9 7.6 22.5Unemployment Rate 9.2 7.2 1.9 . 7.6 1.6 .Source: California's Employment Development Department and Beacon Economics, LLC
-6
-4
-2
0
2
4
Em
ploy
men
t Gro
wth
(%
, SA
)
280
300
320
340
360
380
Em
ploy
men
t (00
0s, S
A)
Jan-00 Jan-05 Jan-10 Jan-15 Jan-20
Nonfarm Employment Employment Growth
Source: California EDD and Beacon Economics, LLC
Jan-00 to Mar-20Fresno Nonfarm Employment
6
8
10
12
14
16
18
Une
mpl
oym
ent R
ate
(%, S
A)
380
400
420
440
460
Labo
r F
orce
(00
0s, S
A)
Jan-00 Jan-05 Jan-10 Jan-15 Jan-20
Labor Force Unemployment Rate
Source: California EDD and Beacon Economics, LLC
Jan-00 to Mar-20Fresno Unemployment
Seasonally Adjusted Employment Es mates 27 March 2020

B E
South Central Valley: Kings County
Kings County Seasonally Adjusted Employment ChangesIndustry Mar-20 Feb-20 MoM (000s) MoM (%) Mar-19 YoY (000s) YoY (%)
Farm 7.9 7.9 0.0 0.0 7.2 0.7 10.0Total Nonfarm 41.4 41.5 -0.1 -0.2 41.3 0.1 0.2
Total Private 26.3 26.4 -0.1 -0.3 26.1 0.2 0.6NR/Construc on 1.0 1.0 0.0 0.2 1.0 -0.0 -0.4
Manufacturing 5.2 5.3 -0.0 -0.6 5.0 0.2 4.1Trade,Transport,U l. 7.3 7.3 0.0 0.4 7.3 0.0 0.4Wholesale Trade 0.6 0.6 0.0 0.5 0.6 0.0 0.6Retail Trade 4.2 4.1 0.0 0.4 4.4 -0.2 -4.5Transport,Warehouse,U l. 2.5 2.5 0.0 0.4 2.3 0.2 9.5
Informa on 0.1 0.1 -0.0 -1.6 0.1 -0.0 -0.0Financial Ac vi es 0.9 0.9 0.0 0.0 0.9 0.0 0.2Professional/Business 1.1 1.1 0.0 0.2 1.2 -0.1 -7.8Educa on/Health 6.3 6.4 -0.1 -1.3 6.5 -0.2 -2.9
Leisure and Hospitality 3.7 3.7 -0.0 -0.4 3.6 0.1 3.1Other Services 0.7 0.7 -0.0 -2.3 0.6 0.1 17.1Government 15.1 15.1 -0.0 -0.2 15.2 -0.1 -0.4Federal Government 1.2 1.2 0.0 0.2 1.2 0.0 0.3State Government 5.5 5.5 0.0 0.3 5.5 0.0 0.3Local Government 8.4 8.4 -0.0 -0.5 8.5 -0.1 -0.9
Labor Force 58.4 57.8 0.6 1.1 58.0 0.4 0.7Employment 52.5 53.2 -0.7 -1.3 53.3 -0.8 -1.5Unemployment 5.9 4.6 1.3 28.3 4.7 1.2 25.8Unemployment Rate 10.1 8.0 2.1 . 8.1 2.0 .Source: California's Employment Development Department and Beacon Economics, LLC
-5
0
5
10
Em
ploy
men
t Gro
wth
(%
, SA
)
30
32
34
36
38
40
42
Em
ploy
men
t (00
0s, S
A)
Jan-00 Jan-05 Jan-10 Jan-15 Jan-20
Nonfarm Employment Employment Growth
Source: California EDD and Beacon Economics, LLC
Jan-00 to Mar-20Hanford Nonfarm Employment
8
10
12
14
16
18
Une
mpl
oym
ent R
ate
(%, S
A)
45
50
55
60
Labo
r F
orce
(00
0s, S
A)
Jan-00 Jan-05 Jan-10 Jan-15 Jan-20
Labor Force Unemployment Rate
Source: California EDD and Beacon Economics, LLC
Jan-00 to Mar-20Hanford Unemployment
Seasonally Adjusted Employment Es mates 28 March 2020

B E
South Central Valley: Tulare County
Tulare County Seasonally Adjusted Employment ChangesIndustry Mar-20 Feb-20 MoM (000s) MoM (%) Mar-19 YoY (000s) YoY (%)
Farm 39.4 39.5 -0.1 -0.2 38.3 1.1 3.0Total Nonfarm 129.9 130.0 -0.1 -0.1 127.5 2.4 1.9
Total Private 96.0 96.3 -0.4 -0.4 94.7 1.3 1.3NR/Construc on 6.6 6.6 -0.0 -0.1 6.3 0.3 5.0
Manufacturing 12.8 12.8 0.0 0.0 12.9 -0.1 -0.7Durable Goods 3.3 3.3 0.0 0.2 3.2 0.1 3.1Non-Durable Goods 9.5 9.5 -0.0 -0.1 9.7 -0.2 -2.0
Trade,Transport,U l. 28.1 28.1 -0.0 -0.0 27.6 0.5 1.9Wholesale Trade 4.6 4.7 -0.0 -0.8 4.3 0.3 7.2Retail Trade 16.3 16.2 0.1 0.3 16.2 0.1 0.7Transport,Warehouse,U l. 7.2 7.2 -0.0 -0.4 7.1 0.1 1.5
Informa on 0.9 0.9 -0.0 -0.1 0.9 0.0 0.2Financial Ac vi es 4.1 4.0 0.1 1.8 4.0 0.0 0.1Finance and Insurance 2.7 2.7 -0.0 -0.1 2.7 0.0 0.1Real Estate 1.4 1.3 0.1 5.7 1.4 0.0 0.0
Professional/Business 9.7 9.9 -0.2 -1.9 10.8 -1.1 -10.4Educa on/Health 18.0 18.0 0.0 0.0 16.7 1.3 7.9Leisure and Hospitality 12.2 12.4 -0.3 -2.2 11.9 0.2 2.0Arts and Entertainment 1.1 1.2 -0.0 -1.8 1.0 0.1 12.5Accommoda on and Food 11.0 11.3 -0.3 -2.2 10.9 0.1 1.0
Other Services 3.6 3.6 0.0 0.2 3.5 0.1 3.1Government 33.9 33.7 0.3 0.9 32.8 1.1 3.4Federal Government 1.2 1.1 0.1 9.8 1.0 0.1 11.1State Government 1.6 1.6 -0.0 -0.7 1.6 0.0 0.2Local Government 31.2 31.0 0.2 0.6 30.2 1.0 3.3
Labor Force 207.8 204.2 3.6 1.8 203.6 4.3 2.1Employment 182.6 184.1 -1.5 -0.8 183.4 -0.9 -0.5Unemployment 25.2 20.2 5.1 25.1 20.1 5.1 25.5Unemployment Rate 12.1 9.9 2.3 . 9.9 2.3 .Source: California's Employment Development Department and Beacon Economics, LLC
-6
-4
-2
0
2
4
6
Em
ploy
men
t Gro
wth
(%
, SA
)
100
105
110
115
120
125
130
Em
ploy
men
t (00
0s, S
A)
Jan-00 Jan-05 Jan-10 Jan-15 Jan-20
Nonfarm Employment Employment Growth
Source: California EDD and Beacon Economics, LLC
Jan-00 to Mar-20Visalia Nonfarm Employment
8
10
12
14
16
18
Une
mpl
oym
ent R
ate
(%, S
A)
170
180
190
200
210
Labo
r F
orce
(00
0s, S
A)
Jan-00 Jan-05 Jan-10 Jan-15 Jan-20
Labor Force Unemployment Rate
Source: California EDD and Beacon Economics, LLC
Jan-00 to Mar-20Visalia Unemployment
Seasonally Adjusted Employment Es mates 29 March 2020

B E
South Central Valley: Bakersfield (MSA)
Bakersfield (MSA) Seasonally Adjusted Employment ChangesIndustry Mar-20 Feb-20 MoM (000s) MoM (%) Mar-19 YoY (000s) YoY (%)
Farm 65.6 65.1 0.5 0.7 65.5 0.1 0.2Total Nonfarm 277.7 278.2 -0.5 -0.2 271.5 6.2 2.3
Total Private 207.5 208.5 -0.9 -0.4 204.5 3.0 1.5Construc on 16.5 16.7 -0.2 -0.9 16.2 0.3 2.0NR/Mining 9.2 9.3 -0.0 -0.2 9.5 -0.3 -3.2Manufacturing 12.6 12.5 0.1 0.5 13.1 -0.5 -3.8Durable Goods 4.8 4.8 0.0 0.5 5.0 -0.2 -4.0Non-Durable Goods 7.8 7.7 0.0 0.5 8.1 -0.3 -3.7
Trade,Transport,U l. 53.3 53.5 -0.2 -0.4 52.4 0.9 1.8Wholesale Trade 8.0 8.0 -0.0 -0.2 8.0 0.0 0.1Retail Trade 31.2 31.4 -0.2 -0.8 31.1 0.1 0.4Transport,Warehouse,U l. 14.1 14.1 0.0 0.2 13.3 0.8 6.0
Informa on 1.8 1.8 0.0 0.2 2.0 -0.2 -10.3Financial Ac vi es 7.6 7.5 0.0 0.3 7.5 0.1 1.4Finance and Insurance 4.3 4.3 0.0 0.2 4.3 0.0 0.0Real Estate 3.3 3.2 0.0 0.6 3.1 0.1 3.3
Professional/Business 29.1 29.0 0.1 0.5 28.0 1.1 4.0Prof Sci and Tech 9.8 9.8 0.0 0.2 9.6 0.2 2.1Management 3.3 3.2 0.1 2.3 3.3 -0.0 -0.1Admin Support 16.1 16.0 0.0 0.3 15.1 0.9 6.2
Educa on/Health 41.9 41.7 0.2 0.5 40.1 1.8 4.5Educa onal Services 1.9 1.9 0.0 0.7 1.8 0.1 5.6Health Care 40.0 39.8 0.2 0.5 38.3 1.7 4.5
Leisure and Hospitality 27.0 27.9 -0.9 -3.2 27.4 -0.4 -1.4Arts and Entertainment 2.6 2.7 -0.0 -1.0 2.6 -0.0 -0.2Accommoda on and Food 24.4 25.2 -0.9 -3.5 24.7 -0.4 -1.6
Other Services 8.5 8.5 -0.0 -0.2 8.4 0.1 1.4Government 70.2 69.7 0.4 0.6 67.0 3.2 4.8Federal Government 11.2 11.1 0.1 0.7 10.7 0.5 4.7State Government 10.4 10.3 0.1 1.2 10.1 0.3 3.0Local Government 48.5 48.3 0.2 0.4 46.1 2.4 5.1
Labor Force 398.0 395.7 2.3 0.6 390.6 7.3 1.9Employment 358.8 364.5 -5.8 -1.6 359.8 -1.1 -0.3Unemployment 39.2 31.1 8.1 26.0 30.8 8.4 27.3Unemployment Rate 9.9 7.9 2.0 . 7.9 2.0 .Source: California's Employment Development Department and Beacon Economics, LLC
-6
-4
-2
0
2
4
6
Em
ploy
men
t Gro
wth
(%
, SA
)
180
200
220
240
260
280
Em
ploy
men
t (00
0s, S
A)
Jan-00 Jan-05 Jan-10 Jan-15 Jan-20
Nonfarm Employment Employment Growth
Source: California EDD and Beacon Economics, LLC
Jan-00 to Mar-20Bakersfield Nonfarm Employment
6
8
10
12
14
16
Une
mpl
oym
ent R
ate
(%, S
A)
280
300
320
340
360
380
400
Labo
r F
orce
(00
0s, S
A)
Jan-00 Jan-05 Jan-10 Jan-15 Jan-20
Labor Force Unemployment Rate
Source: California EDD and Beacon Economics, LLC
Jan-00 to Mar-20Bakersfield Unemployment
Seasonally Adjusted Employment Es mates 30 March 2020
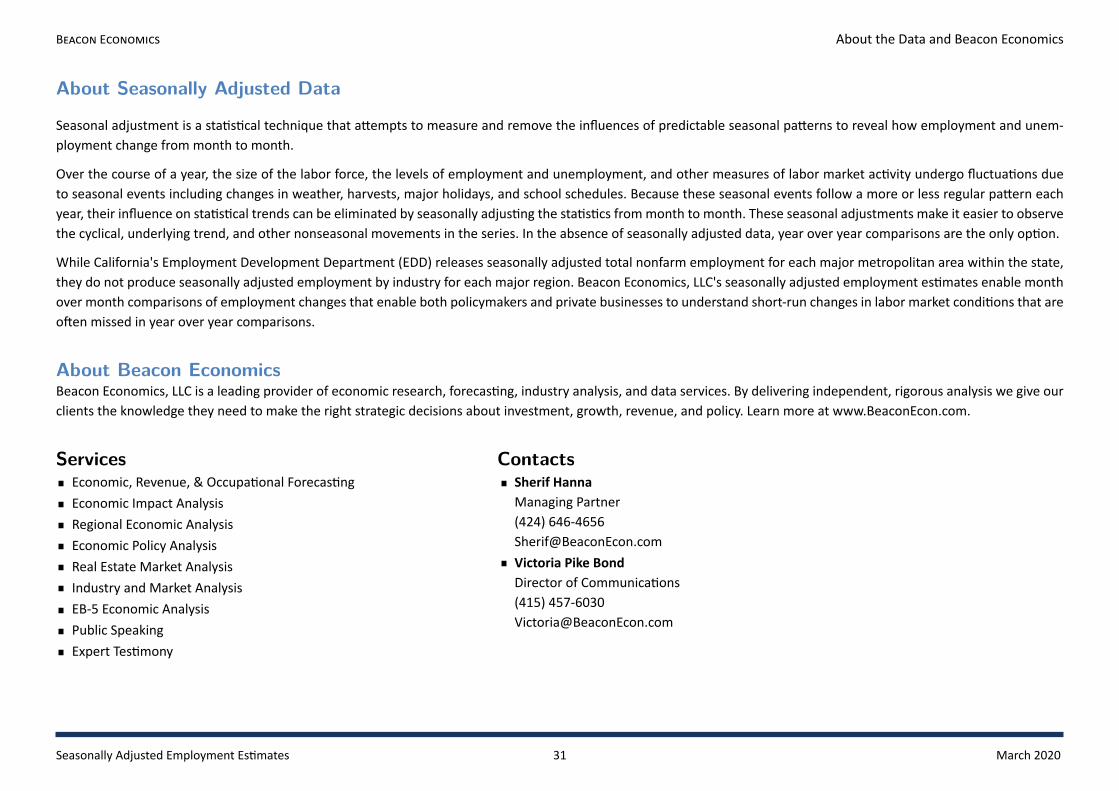
B E About the Data and Beacon Economics
About Seasonally Adjusted Data
Seasonal adjustment is a sta s cal technique that a empts to measure and remove the influences of predictable seasonal pa erns to reveal how employment and unem-ployment change from month to month.
Over the course of a year, the size of the labor force, the levels of employment and unemployment, and other measures of labor market ac vity undergo fluctua ons dueto seasonal events including changes in weather, harvests, major holidays, and school schedules. Because these seasonal events follow a more or less regular pa ern eachyear, their influence on sta s cal trends can be eliminated by seasonally adjus ng the sta s cs frommonth to month. These seasonal adjustments make it easier to observethe cyclical, underlying trend, and other nonseasonal movements in the series. In the absence of seasonally adjusted data, year over year comparisons are the only op on.
While California's Employment Development Department (EDD) releases seasonally adjusted total nonfarm employment for each major metropolitan area within the state,they do not produce seasonally adjusted employment by industry for each major region. Beacon Economics, LLC's seasonally adjusted employment es mates enable monthover month comparisons of employment changes that enable both policymakers and private businesses to understand short-run changes in labor market condi ons that areo en missed in year over year comparisons.
About Beacon EconomicsBeacon Economics, LLC is a leading provider of economic research, forecas ng, industry analysis, and data services. By delivering independent, rigorous analysis we give ourclients the knowledge they need to make the right strategic decisions about investment, growth, revenue, and policy. Learn more at www.BeaconEcon.com.
Services ContactsEconomic, Revenue, & Occupa onal Forecas ngEconomic Impact AnalysisRegional Economic AnalysisEconomic Policy AnalysisReal Estate Market AnalysisIndustry and Market AnalysisEB-5 Economic AnalysisPublic SpeakingExpert Tes mony
Sherif HannaManaging Partner(424) [email protected] Pike BondDirector of Communica ons(415) [email protected]
Seasonally Adjusted Employment Es mates 31 March 2020