state of nebraskadas.nebraska.gov/accounting/cafr/cafr2012.pdf · citizens of the state of nebraska...
TRANSCRIPT

State of NebraskaComprehensive Annual Financial ReportFiscal Year Ended June 30, 2012

State of NebraskaComprehensive Annual Financial Report
Year Ended June 30, 2012
Dave HeinemanGovernor
Administrative Services
Carlos Castillo, Jr.Director
Hari KadavathState Accounting Administrator

State of NebraskaCOMPREHENSIVE ANNUAL FINANCIAL REPORTFor the Year Ended June 30, 2012
1
TABLE OF CONTENTS
INTRODUCTORY SECTION PageSelected State Officials.........................................................................................................................................................................4Transmittal Letter from Administrative Services .................................................................................................................................5Organization Chart................................................................................................................................................................................9Certificate of Achievement.................................................................................................................................................................10
FINANCIAL SECTIONIndependent Auditors’ Report ............................................................................................................................................................12Management’s Discussion and Analysis ............................................................................................................................................15Basic Financial Statements
Government-wide Financial StatementsStatement of Net Assets .......................................................................................................................................................29Statement of Activities .........................................................................................................................................................30
Fund Financial StatementsBalance Sheet – Governmental Funds .................................................................................................................................32Reconciliation of the Balance Sheet – Governmental Funds to the
Statement of Net Assets ................................................................................................................................................33Statement of Revenues, Expenditures, and Changes in Fund Balances
Governmental Funds .....................................................................................................................................................34Reconciliation of the Statement of Revenues, Expenditures, and Changes in
Fund Balances – Governmental Funds to the Statement of Activities .........................................................................35Statement of Net Assets – Proprietary Funds.......................................................................................................................36Statement of Revenues, Expenses, and Changes in Fund Net Assets – Proprietary Funds .................................................37Statement of Cash Flows – Proprietary Funds .....................................................................................................................38Statement of Fiduciary Net Assets – Fiduciary Funds .........................................................................................................40Statement of Changes in Fiduciary Net Assets – Fiduciary Funds ......................................................................................41Statement of Net Assets – Component Units .......................................................................................................................42 Statement of Activities – Component Units.........................................................................................................................43
Notes to the Financial StatementsSummary of Significant Accounting Policies ......................................................................................................................44Deposits and Investments Portfolio......................................................................................................................................48Receivables...........................................................................................................................................................................54Capital Assets .......................................................................................................................................................................55Interfund Balances................................................................................................................................................................56Accounts Payable and Accrued Liabilities...........................................................................................................................57Noncurrent Liabilities ..........................................................................................................................................................57Lease Commitments .............................................................................................................................................................58 Obligations Under Other Financing Arrangements .............................................................................................................59 Contingencies and Commitments.........................................................................................................................................59 Risk Management.................................................................................................................................................................59 Pension Plans........................................................................................................................................................................60 Bonds Payable ......................................................................................................................................................................63
Required Supplementary InformationBudgetary Comparison Schedule – General Fund ......................................................................................................................66Budgetary Comparison Schedule – Cash Funds .........................................................................................................................67 Budgetary Comparison Schedule – Construction Funds.............................................................................................................68 Budgetary Comparison Schedule – Federal Funds .....................................................................................................................69 Budgetary Comparison Schedule – Revolving Funds.................................................................................................................70 Notes to Required Supplementary Information...........................................................................................................................71 Information about Infrastructure Assets Reported using the Modified Approach ......................................................................72
2
TABLE OF CONTENTS (Continued)
FINANCIAL SECTION (Continued)Combining Financial Statements
Nonmajor Governmental FundsCombining Balance Sheet – Nonmajor Governmental Funds .............................................................................................76Combining Statement of Revenues, Expenditures, and Changes in
Fund Balances – Nonmajor Governmental Funds ........................................................................................................77Combining Balance Sheet – Nonmajor Special Revenue Funds .........................................................................................78Combining Statement of Revenues, Expenditures, and Changes in
Fund Balances – Nonmajor Special Revenue Funds ....................................................................................................80 Combining Balance Sheet – Nonmajor Permanent Funds ...................................................................................................82 Combining Statement of Revenues, Expenditures, and Changes in
Fund Balances – Nonmajor Permanent Funds ..............................................................................................................83 Nonmajor Enterprise Funds
Combining Statement of Net Assets – Nonmajor Enterprise Funds ....................................................................................86 Combining Statement of Revenues, Expenses, and Changes in
Fund Net Assets – Nonmajor Enterprise Funds............................................................................................................87 Combining Statement of Cash Flows – Nonmajor Enterprise Funds ..................................................................................88
Internal Service FundsCombining Statement of Net Assets – Internal Service Funds ............................................................................................90Combining Statement of Revenues, Expenses, and Changes in
Fund Net Assets – Internal Service Funds ....................................................................................................................92Combining Statement of Cash Flows – Internal Service Funds...........................................................................................94
Fiduciary FundsCombining Statement of Fiduciary Net Assets – Pension Trust Funds ...............................................................................98 Combining Statement of Changes in Fiduciary Net Assets – Pension Trust Funds ..........................................................100 Combining Statement of Fiduciary Net Assets – Private Purpose Trust Funds.................................................................102 Combining Statement of Changes in Fiduciary Net Assets – Private Purpose Trust Funds..............................................103 Combining Statement of Fiduciary Assets and Liabilities – Agency Funds......................................................................104 Combining Statement of Changes in Assets and Liabilities – Agency Funds ...................................................................105
STATISTICAL SECTIONNet Assets by Component ................................................................................................................................................................109 Changes in Net Assets ......................................................................................................................................................................110Fund Balances - Governmental Funds..............................................................................................................................................115 Changes in Fund Balances - Governmental Funds...........................................................................................................................116 Individual Income Tax Rates............................................................................................................................................................118 Individual Income Tax Liability by Income Level...........................................................................................................................119 Taxable Sales by Industry.................................................................................................................................................................120Ratios of Outstanding Debt ..............................................................................................................................................................121Comparative Unemployment, Nebraska and United States .............................................................................................................122Population, Personal and Per Capita Income, Nebraska and United States .....................................................................................123Ten Largest Employers.....................................................................................................................................................................123Public and State Operated School Enrollment, Prekindergarten-Grade 12......................................................................................124Public Higher Education Institutions Total Fall Headcount Enrollment..........................................................................................124Full Time Equivalent Permanent Employees by Function ...............................................................................................................125Operating Indicators by Function .....................................................................................................................................................126Capital Asset Statistics by Function .................................................................................................................................................127Miscellaneous Data...........................................................................................................................................................................128

3
INTRODUCTORY SECTION

4
State of NebraskaSELECTED STATE OFFICIALSAs of June 30, 2012
EXECUTIVE
Dave HeinemanGovernor
Rick SheehyLieutenant Governor
Jon BruningAttorney General
Mike FoleyAuditor of Public Accounts
John A. GaleSecretary of State
Don StenbergState Treasurer
JUDICIAL
Supreme Court of NebraskaMichael G. Heavican, Chief JusticeWilliam B. Cassel, JusticeWilliam M. Connolly, JusticeMichael McCormack, JusticeLindsey Miller-Lerman, JusticeKenneth C. Stephan, JusticeJohn F. Wright, Justice
LEGISLATIVE
Mike FloodSpeaker of the LegislatureNebraska Unicameral (49 Senators)

Carlos Castillo, Jr. Administrative Services Director Dave Heineman, Governor
State Accounting Division • Hari Kadavath, Administrator Administrative Services • Suite 1309, State Capitol • P.O. Box 94664 • Lincoln, Nebraska 68509-4664 • Phone: 402-471-2581 • Fax: 402-471-2583
An Equal Opportunity/Affirmative Action Employer Printed with soy ink on recycled paper
January 16, 2013 The Honorable Dave Heineman, Governor Members of the Legislature Citizens of the State of Nebraska We are pleased to present the Comprehensive Annual Financial Report (CAFR) of the State of Nebraska (the “State”) for the fiscal year ended June 30, 2012. This report is the primary means of reporting the State government’s financial activities. The State of Nebraska’s financial statements have been audited by the State of Nebraska Auditor of Public Accounts. The goal of the independent audit was to provide reasonable assurance that the financial statements of the State for the fiscal year ended June 30, 2012 are free of material misstatement. The independent audit involved examining, on a test basis, evidence supporting the amounts and disclosures in the financial statements; assessing the accounting principles used and significant estimates made by management; and evaluating the overall financial statement presentation. The independent auditor concluded, based upon the audit, that there was a reasonable basis for rendering an unqualified opinion that the State’s financial statements for the fiscal year ended June 30, 2012 are fairly presented in conformity with Accounting Principles Generally Accepted in the United States of America (GAAP). The independent auditor’s report is presented as the first component of the financial section of this report. The CAFR has been prepared in conformance with Governmental Accounting Standards Board (GASB) statements 34 and 35, and other related statements. This reporting model’s objective is to provide a clear picture of the government as a single, unified entity as well as providing traditional fund based financial statements. The independent audit of the financial statements of the State was part of a broader, federally mandated “Single Audit” designed to meet the special needs of federal grantor agencies. The standards governing Single Audit engagements require the independent auditor to report not only on the fair presentation of the financial statements, but also on the audited government’s internal controls and compliance with legal requirements, with special emphasis on internal controls and legal requirements involving the administration of federal awards. These reports are available in the State’s separately issued Single Audit Report. The CAFR is presented in three sections. (1) The Introductory Section contains this letter of transmittal and some information about the State and its operations. (2) The Financial Section contains Management’s Discussion and Analysis, Government Wide Financial Statements, Fund Financial Statements for Governmental Funds, Proprietary Funds, Fiduciary Funds, and Combining Statements for Major Component Units. The Financial Section also includes the Notes to the Financial Statements, Required Supplementary Information and various combining statements. (3) The Statistical Section contains selected financial and demographic information, generally presented on a multi-year basis.

6
The CAFR consists of management’s representations concerning the finances of the State of Nebraska. The State Accounting Division of Administrative Services assumes full responsibility for the completeness and reliability of all of the information presented in this report. To provide a reasonable basis for making these representations, management of the State has established a comprehensive internal control framework that is designed both to protect the government’s assets from loss, theft, or misuse and to compile sufficient reliable information for the preparation of the State’s financial statements in conformity with GAAP for governments. Because the cost of internal controls should not outweigh their benefits, the State’s comprehensive framework of internal controls has been designed to provide reasonable rather than absolute assurance that the financial statements will be free from material misstatement. As management, we assert that, to the best of our knowledge and belief, this financial report is complete and reliable in all material respects.
GAAP require that management provide a narrative introduction, overview, and analysis to accompany the basic financial statements in the form of Management’s Discussion and Analysis (MD&A). This letter of transmittal is designed to complement MD&A and should be read in conjunction with it. The State’s MD&A can be found immediately following the report of the independent auditors.
PROFILE OF THE GOVERNMENT
The State was admitted to the Union as the thirty-seventh state in 1867. Nebraska’s government is divided into three branches: legislative, executive and judicial. Nebraska is the only state with a Unicameral Legislature, which has 49 non-partisan members. The chief executive is the governor, who is elected for a four-year term. Within the executive branch are various departments and agencies that perform a variety of functions. Since Nebraska’s Constitution generally allows no indebtedness, government expenses of such departments and agencies must be met on a pay-as-you-go basis. The State provides a full range of services including: the construction and maintenance of highways and infrastructure, education, social and health services, public safety, conservation of natural resources, economic development, and recreation facilities and development. An organizational chart of the State is shown on page 9.
The State reporting entity reflected in this CAFR is described more fully in Note 1.B. to the financial statements. It should be noted that the reporting entity includes the familiar government activities plus two component units, the University of Nebraska and the State College System.
Budgetary control of state expenditures is maintained chiefly by three processes. First, a budget is required to be adopted through passage of appropriation bills by the Legislature. Second, the appropriated funds are allocated by program and fund type and are controlled by the executive branch through an allotment process. The Legislature may also enact a supplemental appropriation bill and other appropriation bills as it deems necessary. Finally, the State’s accounting system checks each expenditure to ensure the appropriation and allotment are not exceeded.
Budget-to-actual comparisons are provided in this CAFR for various categories of General Fund revenues and appropriated annual budgets. This comparison is presented on page 66 as part of the Required Supplementary Information to the basic financial statements for the governmental funds. Budget-to-actual comparisons for Cash Funds, Construction Funds, Federal Funds, and Revolving Funds are also presented as Required Supplementary Information on pages 67 through 70.
FACTORS AFFECTING FINANCIAL CONDITION
In order to better understand the information presented in the basic financial statements, such information should be considered from the broader perspective of the specific environment within which the State operates.
Current Revenue Outlook
The General Fund operations of the State are almost entirely dependent upon the income and sales taxes the State receives each year. Such taxes represent over 94 percent of all General Fund revenues. Net revenue from income taxes and sales taxes from all funds for the fiscal year ended June 30, 2012 increased $264 million from the prior year, indicating that the economy is continuing to recover from the national recession.

7
For the fiscal year ending June 30, 2012 the State’s General Fund ended the fiscal year with a cash and investments balance of $998 million. The balance had exceeded $800 million dollars for the prior four years.
The current forecast for fiscal year 2013 anticipates net receipts in the General Fund to increase about $129 million, or approximately a 3.5% increase over fiscal year 2012. No significant changes in revenue are anticipated in the other funds. Economy of the State
The University of Nebraska-Lincoln Bureau of Business Research and the Nebraska Business Forecast Council are cautious in forecasting Nebraska’s economic future. The Council is uncertain about the national economic outlook, due to slowed growth and continued risk of recession. It also concludes that economic growth will be weak to moderate in Nebraska over the next few years. Nebraska’s economy improved in several areas in 2011, but is expected to improve only slightly in 2012. The Council’s January 2012 forecast is shown on the following chart. The agriculture market is a major force in the Nebraska economy and farm income was well above its 10-year average in 2010, due to rising commodity prices and other factors. Job growth returned to Nebraska in 2011, and is projected to be moderate in 2012. Continued growth in employment is expected in the manufacturing, transportation, and services industries over the next few years. Retail sales continue to improve as Nebraska recovers from the recession, resulting in a partial recovery in retail employment. The financial services industry is expected to return to job growth in 2012 and solid growth in 2013, with the trend continuing as the housing sector recovers.
ACTUAL PROJECTED 2008 2009 2010 2011 2012 2013 Nonfarm Employment: Annual Totals 965,000 944,600 939,400 955,600 968,500 985,000 Growth Rates 0.8% -2.1% -0.6% 1.7% 1.4% 1.7% Nonfarm Personal Income: Annual Totals (in millions $) 68,846 66,825 68,932 72,816 75,781 78,226 Growth Rates 6.2% -2.9% 3.2% 5.6% 4.1% 3.2% Net Taxable Retail Sales Growth Rates: Total 1.6% -3.6% 3.8% 5.2% 3.5% 3.4% Motor Vehicle Sales 1.4% -4.9% 8.0% 8.5% 3.5% 4.1% Non-motor Vehicles Sales 1.7% -3.4% 3.3% 4.8% 3.5% 3.3%
Long-term Financial Planning
The State always is looking at least four years out in its analysis of the financial condition of the State in preparing the State’s budgets. Currently, we have a working model of the biennium budget for fiscal years 2016 and 2017. In our analysis, we use forecasting models to forecast revenue and then examine major expenditures, especially those that have a trend of outpacing revenues. Revenues for 2014 and 2015 are projected to increase by 2.5% and 4.0%, respectively. Due to the redirection of one quarter of one percent of the State’s sales tax rate for road construction purposes beginning in 2014, the 2.5% increase in 2014 is lower than it would otherwise be. Revenue growth estimates that adjust for this and other legislated rate and base changes are 4.2% in 2014 and 4.9% in 2015.
Higher than projected individual income tax receipts have recently boosted the state revenue forecast. By operation of law, any revenue above the projection will be used to rebuild the cash reserve, which was used to supplement weak revenue during the recession. Relatively large annual growth in expenditures for school aid, Medicaid, and public assistance presents a challenge in preparing a budget that keeps expenses within projected revenue. To ensure we do have a balanced budget, the State exerts considerable time and effort in reviewing the trends of future revenues and expenditures.
Major Initiatives
The major initiatives were a strong focus on jobs creation, improving the economy, and strengthening education.

8
AWARDS AND ACKNOWLEDGEMENTS
The Government Finance Officers Association (GFOA) awarded a Certificate of Achievement for Excellence in Financial Reporting to the State for its CAFR for the fiscal year ended June 30, 2011. This was the twenty-first consecutive year that the State has received this prestigious award. In order to be awarded a Certificate of Achievement, the State published an easily readable and efficiently organized CAFR. This report satisfied both GAAP and applicable legal requirements.
A Certificate of Achievement is valid for a period of one year only. We believe that our current CAFR continues to meet the Certificate of Achievement Program’s requirements and we are submitting it to the GFOA to determine its eligibility for another certificate.
This report continues our commitment to comprehensive disclosure of the State’s financial condition. We are committed to issuing reports that are informative and meet governmental accounting standards. Reports that meet these standards provide the reader with an opportunity to make more informed judgments about the government’s financial position and results of operations.
The 2012 CAFR represents the continuous effort on our part to fulfill this commitment. We wish to express our appreciation to the accounting staff of the State Accounting Division of Administrative Services and the budget and accounting staff throughout State government for their assistance in the preparation of this report.
Questions or requests for additional information related to this report can be directed to the State Accounting office at (402) 471-2581.
Respectfully submitted,
Carlos Castillo, Jr. Hari KadavathDirector, Administrative Services State Accounting Administrator

9
Board of
Regents
Board of Education
State College Board
Post-Secondary Education
State
Auditor
State Treasurer
Lt.
Governor
Attorney General
Secretary of State
Public Service Comm.
Univ. of Nebraska
Dept. of Education
State Colleges
UNICAMERAL LEGISLATURE
Educa-tional Lands
& Funds
Nebraska State Government Organization Chart
LEGISLATIVE BRANCH
EXECUTIVE BRANCH
JUDICIAL BRANCH
WORKER’S COMP
COURT
CITIZENS
ADMINISTRATIVE AGENCIES (agency heads appointed by Governor)
Administrative Services Health and Human Services Revenue Aeronautics Insurance Roads Agriculture Labor State Patrol Banking & Finance Law Enforcement & Tax Equalization & Correctional Services Criminal Justice Commission Review Commission Economic Development Military Veterans Affairs Energy Office Motor Vehicles Environmental Quality Natural Resources Fire Marshal Parole Board
INDEPENDENT AGENCIES, BOARDS AND COMMISSIONS (agency heads not appointed by Governor)
Abstracters Board of Examiners Electrical Board Mexican-American Commission Accountability & Disclosure Commission Engineers and Architects Board Motor Vehicle Industry Arts Council Equal Opportunity Commission Licensing Board Barber Examiners Board Educational Telecommunications Commission Oil and Gas Conservation Commission Blind & Visually Impaired Commission Ethanol Board Power Review Board Board of Examiners for Land Foster Care Review Board Public Accountancy Board Surveyors Game and Parks Commission Public Advocacy Commission Board of Geologists Grain Sorghum Development, Public Employees Retirement Board Board of Landscape Architects Utilization & Marketing Board Racing Commission Brand Committee Historical Society Real Estate Appraiser Board Corn Development, Utilization, Indian Affairs Commission Real Estate Commission & Marketing Board Industrial Relations Commission Rural Development Commission Dairy Industry Development Board Investment Council Wheat Development, Utilization, Deaf & Hard of Hearing Commission Library Commission & Marketing Board Dry Bean Commission Liquor Control Commission
ADMINISTRATIVE SERVICES State Accounting Materiel State Budget State Personnel State Building Risk Management Office of the CIO Task Force Transportation Services Employee Relations
GOVERNOR
SUPREME COURT
10

11
FINANCIAL SECTION


15
MANAGEMENT’S DISCUSSION AND ANALYSIS
Management of the State of Nebraska provides the following discussion and analysis of the State of Nebraska’s financial performance, as reflected in the Comprehensive Annual Financial Report (CAFR) for the fiscal year ended June 30, 2012. Please read it in conjunction with the additional information furnished in the letter of transmittal at the front of this report, and with the State’s basic financial statements, which follow. Numerical years refer to fiscal years with a June 30 year-end, unless otherwise noted.
There were no new Governmental Accounting Standards Board (GASB) statements required to be implemented by The State of Nebraska (State) in 2012.
A comparative analysis of government-wide data for the last two years is presented in this analysis. Additionally, we are presenting an analysis of activity in the State’s funds for the fiscal year ended June 30, 2012 along with an analysis of the State’s capital assets and long-term debt related to capital assets.
FINANCIAL HIGHLIGHTS
Government-wide:
The assets of the State exceeded its liabilities at June 30, 2012 by $11.5 billion (presented as “net assets” in the CAFR). The majority of the net assets are represented by the investment in the State’s infrastructure and other capital assets, which cannot be used to fund ongoing activities of the State. Of the net assets, unrestricted net assets were reported as $1.0 billion, most of which is available to be used to fund future needs of the State. The primary government’s net revenues exceeded net expenses for 2012 resulting in an increase in net assets of $304 million. This increase in net assets was comparable to the increase in 2011 of $470 million.
Fund Level:
General Fund receipts for 2012 were $105 million above the original budgeted amount and above the final budget by $53 million. Expenditures were $253 million less than the original budget. On a Generally Accepted Accounting Principles (GAAP) basis, the General Fund had $190 million in excess revenues prior to a legislatively mandated property tax relief transfer of $110 million in addition to other financing sources causing an increase in fund balances of $82 million, and thereby increasing the fund balance on June 30, 2012 to $815 million. Other governmental funds revenues exceeded expenditures by $51 million, chiefly due to unrealized market gains. Adding to these operating gains, such other funds received $36 million in net other financing sources. This $87 million net increase resulted in raising such fund balances at June 30, 2012 to $2,201 million.
The $403 million of net assets of the Unemployment Insurance Fund represents 82% of the enterprise funds. Such fund had a $59 million increase in net assets for 2012 compared to a $105 million increase in 2011, a $46 million difference. This was due to business assessment fees collected from employers exceeding the unemployment insurance claims by $55 million, and $11 million in investment income.
Long-term Liabilities:
Long-term liabilities shown on the government-wide financial statements totaled $550 million at June 30, 2012, which is a $49 million increase from the prior year. Most of these liabilities consist of claims payable for workers’ compensation, medical excess liability, litigation, unemployment insurance, employee health insurance, and Medicaid, in addition to the calculated amount for accrued vacation and vested sick leave due to employees when they retire. After a retired employee reaches the age of 65, the State has no further obligation for other post employment benefits, except for a very small number of employees.

16
OVERVIEW OF THE FINANCIAL STATEMENTS
This discussion and analysis is intended to serve as an introduction to the State’s financial statements. The State’s basic financial statements include three components: 1) government-wide financial statements, 2) fund financial statements, and 3) notes to the financial statements. This CAFR also contains other supplementary information (e.g., budgetary schedules and combining financial statements) in addition to the basic financial statements. These components are described below:
Government-wide Financial Statements
These statements provide a broad view of the State’s operations in a manner similar to the private sector, providing both a short-term and a long-term view of the State’s financial position. The statements are prepared using the accrual basis of accounting. This means all revenues and expenses related to the fiscal year are recorded in the statements, even if cash has not been received or paid. If taxes are owed to the State but not yet received, such transaction is recorded as an asset (a receivable) and revenue to the State. Likewise, if the State owes for vacation time, but has not yet paid the worker for such vacation earned, then the liability and payroll expense is recorded. The government-wide financial statements include two statements, the Statement of Net Assets and the Statement of Activities.
The Statement of Net Assets (page 29) presents all the State’s assets and liabilities with the difference between the two reported as “net assets.” Changes in net assets over time may indicate the relative health of the State and this statement will assist users in assessing whether or not the State’s financial position is improving or deteriorating.
The Statement of Activities (pages 30 and 31) presents information showing how the State’s net assets changed during the reported year. All changes in net assets are reported as soon as the underlying events giving rise to the changes occur, regardless of the timing of related cash flows, using the accrual basis of accounting discussed earlier.
Both of these statements have separate sections for three different types of State programs or activities. These sections are Governmental Activities, Business-type Activities, and Discretely Presented Component Units. Governmental Activities and Business-type Activities are combined to report on what is termed Primary Government activities, which is separate and distinct from the activity of the component units. Fiduciary Funds, which include the Pension Funds, are not included in the government-wide financial statements.
Primary GovernmentGOVERNMENTAL ACTIVITIES – Activities in this section are mostly supported by taxes and federal grants. All General Fund activity is included here. Governmental activities represent over 93% of all activity of the primary government. It includes general government; education; health and human services; public safety; transportation; regulatory services; and economic development and assistance.
BUSINESS-TYPE ACTIVITIES – Functions reported in this section include those activities whereby the State charges fees and other charges to external users of the State’s services and purchasers of State’s goods in order to recover all or a significant portion of the State’s operating costs related to these activities, much like a private business. Such activities are unemployment insurance services, lottery tickets, premium surcharges for excess liability coverage, and the sales and services provided by Cornhusker State Industries.
Component UnitsDISCRETELY PRESENTED COMPONENT UNITS – These are separate entities for which the State has financial accountability (in which the State provides over one-fourth of their funding) but such organizations have independent qualities as well. The University of Nebraska and the Nebraska State College System are the State’s only two discretely presented component units. While presented in this report, each of these two units has separate audited financial statements and such audited reports can be obtained from their respective administrative offices.
The government-wide financial statements can be found immediately following this discussion and analysis.

17
Fund Financial Statements
This is the second set of financial statements presented in the CAFR. These statements are different from the government-wide statements in that some of these statements use a different accounting approach and focus on the near-term inflows and outflows of the State’s operations. As previously noted, these Statements are commonly referred to as GAAP Fund Statements, as they are prepared in accordance with generally accepted accounting principles. The Fund Financial Statements (which begin on page 32) provide detailed information about the State’s major funds. A fund is a method of accounting that uses a set of accounts to maintain accountability and control over specific sources of funding and spending for a particular activity or objective. The State’s funds are divided into three categories – Governmental Funds, Proprietary Funds and Fiduciary Funds. It is important to note that each of these three fund categories use different accounting approaches and should be analyzed differently.
Governmental Funds Financial Statements – Most of the basic services provided by the State are reported in the governmental funds. Governmental funds are used to account for essentially the same functions reported as governmental activities in the government-wide financial statements. However, the governmental funds financial statements use modified accrual accounting, which limits assets to cash and all other financial assets that can readily be converted into cash. This is different from the governmental activities recorded in the government-wide financial statements that use full accrual accounting. These fund statements provide a detailed short-term view of the State’s finances that assist the reader in determining whether or not there will be adequate financial resources to meet the current needs of the State.
Because the focus of governmental funds is narrower than that of the government-wide financial statements, it is useful to compare the information presented for governmental funds with similar information presented for governmental activities in the government-wide financial statements. By doing so, the reader can better understand the long-term impact of the State’s near-term financing decisions. To aid the reader in such analysis, reconciliations are provided between the government-wide financial statements and the governmental funds financial statements (see pages 33 and 35).
The State of Nebraska’s governmental funds include five major funds: the General Fund, the Highway Fund, the Federal Fund, the Health and Social Services Fund and the Permanent School Fund. Non-major special revenue, capital project and other permanent funds are also included in the governmental funds.
Proprietary Funds Financial Statements – These funds are used to show activities that operate more like those of commercial enterprises. Thus, when the State charges for the services it provides, these services are generally reported in proprietary funds. Proprietary funds consist of both Enterprise Funds (services provided to outside customers) and Internal Service Funds (services provided to other State agencies). Proprietary funds utilize accrual accounting, the same method used by private businesses. Therefore, the net assets reported in these statements as Enterprise Funds will be identical to the net assets reported in the net assets for business-type activities in the government-wide financial statements. However, because the Internal Service Funds predominantly benefit governmental rather than business-type functions, they have been included within governmental activities in the government-wide financial statements.
Fiduciary Funds Financial Statements – Whenever the State receives funds on behalf of others, it is acting in a fiduciary capacity or trustee of those funds belonging to others. Thus, assets in these funds are restricted as to use and do not represent discretionary assets that the State could use to finance its operations. They are presented in these statements only for the purpose to indicate that the State has responsibility for these assets. For that reason, such assets are not included in the government-wide financial statements. Fiduciary funds are reported on the accrual basis of accounting.
The State’s principal fiduciary fund is the Pension Fund, which contains retirement contributions held by the State for state employees, county employees and public school employees (see Note 12 to the financial statements). There are also Private-Purpose Trust Funds whereby the State has control of unclaimed property and funds held for inmates and clients or wards of the State. The State also has Agency Funds whereby the State holds funds earmarked as aid for other political subdivisions.
Component Units Financial StatementsAs mentioned in the discussion of the government-wide financial statements, the State has included the net assets and activities of the University of Nebraska and the Nebraska State College System in a single column of such statements,

18
labeling them as discretely presented component units. We have provided separate component unit statements to allow the reader to analyze each of these two units separately.
Notes to the Financial Statements
The notes to the financial statements provide additional information that is essential to a full understanding of the data provided in all of the basic financial statements. The notes can be found immediately following the component units’ financial statements beginning on page 44.
Required Supplementary Information
Following the basic financial statements and the accompanying notes thereto, is additional Required Supplementary Information that further explains and supports the information in such financial statements. The required supplementary information includes budgetary comparison schedules reconciling statutory fund balances used for budgetary purposes to the fund balances determined by GAAP used in the Fund Financial Statements for the General Fund, Cash Funds, Construction Funds, Federal Funds, and Revolving Funds. Other information included is the condition and maintenance data regarding certain aspects of the State’s infrastructure.
Other Supplementary Information
Other supplementary information includes the combining statements for non-major governmental, proprietary and fiduciary funds. These funds are summarized by fund type and presented in single columns in the basic financial statements, but are not reported individually, as with major funds, on the Governmental Fund Financial Statements. Also presented is a statistical section providing State data.
FINANCIAL ANALYSIS OF THE STATE AS A WHOLE
Net Assets
The State’s assets totaled $13,229 million at June 30, 2012 as compared to $12,890 million at June 30, 2011. As total liabilities only totaled $1,711 million, net assets amounted to $11,518 million as of June 30, 2012. As of June 30, 2011, these amounts were $1,676 million and $11,214 million, respectively. By far the largest portion of the State of Nebraska’s net assets (70 percent) reflects the State’s investment in capital assets (e.g., land, buildings, equipment and infrastructure – highways, bridges, dams, etc.). The State uses these capital assets to provide services to citizens; thus, these assets are not available for future spending.
Restricted net assets are subject to external restrictions, constitutional provisions, or enabling legislation on how they can be used. They also are not available for future general government spending.
For Governmental Activities other than capital assets, the majority of the restricted net assets consist of the Permanent School Trust, the Tobacco Settlement Trust, the Intergovernmental Trust and the loans to political subdivisions for drinking water and clean water projects.
The net assets for business-type activities chiefly represent cash set aside for future unemployment insurance benefits.

19
STATE OF NEBRASKANet Assets as of June 30
(in millions of dollars) Governmental Business-type Total Primary Activities Activities Government
2012 2011 2012 2011 2012 2011 Current and Other Non-current Assets $ 4,586 $ 4,362 $ 570 $ 511 $ 5,156 $ 4,873 Capital Assets 8,067 8,010 6 7 8,073 8,017 Total Assets 12,653 12,372 576 518 13,229 12,890 Non-current Liabilities 497 428 53 73 550 501 Other Liabilities 1,127 1,148 34 27 1,161 1,175 Total Liabilities 1,624 1,576 87 100 1,711 1,676 Net assets: Invested in Capital Assets, Net of Related Debt 8,041 7,983 6 7 8,047 7,990 Restricted 2,082 2,006 406 345 2,488 2,351 Unrestricted 906 807 77 66 983 873
Total Net Assets $ 11,029 $ 10,796 $ 489 $ 418 $ 11,518 $ 11,214
Over 75% of the State’s non-capital assets consist of cash and investments. It should be noted that $190 million in 2012 and $233 million in 2011 of such assets represent “Securities Lending Collateral,” an amount created by a journal entry required by GASB in order to record a lending transaction. Since the asset is offset by a corresponding equal liability, the net asset is zero and thus the asset cannot be spent. (For more detail, see Note 2 to the financial statements.) Receivables, chiefly from taxes and the federal government, represent 19% of the non-capital assets.
Liabilities largely reflect three groupings which represent 94% of total State liabilities, not including the obligations under securities lending explained in the above paragraph. These are operational payables, which consist of accounts payables and accrued liabilities of $507 million ($514 million in 2011); tax refunds payable of $370 million ($353 million in 2011); and long-term payables explained next.
Since the State’s Constitution generally prohibits the State from incurring debt, the Statement of Net Assets presents few long-term liabilities (shown as noncurrent liabilities), which total only $550 million ($501 million in 2011). The majority of such liabilities are for claims payable for workers’ compensation, medical excess liability, litigation, unemployment insurance, and employee health insurance totaling $118 million for 2012 ($137 million for 2011), Medicaid claims for $252 million ($190 million in 2011), and the calculated amount for vested sick leave due employees when they retire and accrued vacation of $139 million in 2012 ($130 million for 2011). Other minor amounts of long-term liabilities consist chiefly of capital lease obligations (See Note 8 to the Financial Statements), which totaled $25 million at June 30, 2012 and $15 million of obligations under other financing arrangements (See Note 9 to the Financial Statements). There was also a net pension obligation of $1.2 million (See Note 12 to the Financial Statements).
The $233 million increase in net assets of Governmental Activities, was due to the $58 million increase in the net investment in capital assets, the $76 million increase in restricted net assets, and the $99 million increase in unrestricted net assets. The major cause of the increase was a $279 million increase in taxes collected.
At the end of June 30, 2012, the State is able to report positive balances in all of the three categories of net assets.
Changes in Net Assets
The condensed financial information on the following page was derived from the government-wide Statement of Activities and reflects how the State’s net assets changed during the year. Following that table is management’s analysis of the changes in net assets for 2012, analyzing both the governmental activities and the business-type activities.

20
STATE OF NEBRASKACHANGES IN NET ASSETS FOR THE YEAR ENDED JUNE 30
(in millions of dollars) Governmental Business-type Total Primary Activities Activities Government
2012 2011 2012 2011 2012 2011 REVENUES Program Revenues Charges for Services $ 581 $ 554 $ 479 $ 579 $ 1,060 $ 1,133 Operating Grants and Contributions 2,647 2,939 - - 2,647 2,939 Capital Grants and Contributions 16 29 - - 16 29 General Revenues Taxes 4,246 3,967 - - 4,246 3,967 Unrestricted Investment Earnings 92 214 16 16 108 230 Miscellaneous - 3 - - - 3 Total Revenues 7,582 7,706 495 595 8,077 8,301 EXPENSES General Government 461 477 - - 461 477 Conservation of Natural Resources 151 156 - - 151 156 Culture - Recreation 25 29 - - 25 29 Economic Development and Assistance 103 111 - - 103 111 Education 1,570 1,807 - - 1,570 1,807 Higher Education - Colleges and Universities 557 561 - - 557 561 Health and Social Services 3,140 3,069 - - 3,140 3,069 Public Safety 366 362 - - 366 362 Regulation of Business and Professions 122 121 - - 122 121 Transportation 907 697 - - 907 697 Interest on Long-term Debt 1 1 - - 1 1 Unemployment Insurance - - 262 329 262 329 Lottery - - 114 102 114 102 Excess Liability - - 1 20 1 20 Cornhusker State Industries - - 11 13 11 13 Total Expenses 7,403 7,391 388 464 7,791 7,855 Excess (deficiency) Before Transfers and Contributions to Permanent Fund Principal 179 315 107 131 286 446 Transfers 36 32 (36) (32) - - Contributions to Permanent Fund Principal 18 24 - - 18 24 Increase (Decrease) in Net Assets 233 371 71 99 304 470 Net Assets - Beginning 10,796 10,425 418 319 11,214 10,744
Net Assets - Ending $ 11,029 $ 10,796 $ 489 $ 418 $ 11,518 $ 11,214
Governmental Activities
Governmental activities increased the State’s net assets by $233 million in 2012 ($371 million increase in 2011). Governmental activities represent 94% of all the primary government’s revenues. Program revenues of governmental activities were $3,244 million and were used to partially offset program expenses of $7,403 million, leaving net expenses of $4,159 million. Only 6% of total expenses were spent on general government expenses. General taxes, investment earnings, miscellaneous, contributions to the permanent fund principal, and transfers all totaling $4,392 million, were $233 million more than the remaining costs of the governmental activities’ programs as shown below.
Tax revenues were up $279 million compared to an increase of $313 million in 2011. Program revenues decreased 8% from 2011, chiefly due to income from operating grants being down $292 million, some of which was due to reduced income from the American Recovery and Reinvestment Act (ARRA). The decrease in grant income resulted in decreased grant designated expenses. Increases in transportation expenses offset the reduced grant related expense, which resulted in the $12 million increase in program expenses. The increase in tax revenue and the increase in transportation expenses were the chief reasons the change in net assets was $138 million lower in 2012 than the $312 million increase recorded in 2011. While the General Fund has more investments than other programs, it maintains safer investments and actually showed an increase in investment income in 2012 over 2011of $14 million, due to the increased invested balance.

21
Program expenses, net of revenue, decreased by $138 million in 2012, as shown below:
GOVERNMENTAL ACTIVITIES (in millions of dollars) 2012 2011 Program Expenses, Net of Revenue General Government $ (353) $ (373) Conservation of Natural Resources (41) (28) Culture - Recreation 2 (8) Economic Development and Assistance (29) (30) Education (1,183) (1,186) Higher Education - Colleges and University (557) (561) Health and Social Services (1,326) (1,166) Public Safety (235) (217) Regulation of Business and Professions 14 18 Transportation (450) (317) Interest on Long-Term Debt (1) (1) Subtotal (4,159) (3,869) General Revenues Taxes 4,246 3,967 Unrestricted Investment Earnings 92 214 Miscellaneous - 3 Transfers 36 32 Contributions to Permanent Fund Principal 18 24
Increase (Decrease) in Net Assets $ 233 $ 371
Four functional areas of the State comprise 83% of the expenses of all Governmental Activities: Education, Higher Education, Health and Social Services and Transportation. Education expenses were down $237 million chiefly due to the decreased aid from ARRA funds. Health and Social Services was up $71 and Transportation expenses were up $210 million chiefly due to decreased highway construction. All the other functional areas had small variances in net expenses.
Business-type Activities
The business-type activities increased the State’s net assets by $71 million for 2012, which was net of a $36 million transfer to the governmental activities. Most of the $479 million of business-type activities’ program revenues were related to the business assessment fees in the Unemployment Insurance Fund and Lottery Fund revenues. The Unemployment Insurance Fund had operating income of $48 million in 2012. This gain, when combined with the $11 million in investment income, produced a $59 million increase in net assets for the Unemployment Insurance Fund. Lottery revenues of $151 million generated net revenue of $37 million, which was offset by the $36 million transfer to the Governmental Activities. The lottery transfer was used primarily for education and environmental studies.

22
FINANCIAL ANALYSIS OF THE STATE’S FUNDS
As noted earlier, the State uses fund accounting to ensure and demonstrate compliance with finance-related legal requirements.
Governmental Funds
The focus of the State’s Governmental Funds is to provide information on near-term inflows and outflows and the availability of spendable resources. At June 30, 2012, the State’s Governmental Funds reported combined ending fund balances of $3,016 million. Of this amount, $492 million is nonspendable, either due to its form or legal constraints, and $1,600 million is restricted for specific programs by external constraints, constitutional provisions, or contractual obligations. Unspent bond proceeds, revenue restricted by enabling legislation, and public school land lease revenues are included in restricted fund balance. An additional $457 million of total fund balance has been committed to specific purposes. Committed amounts cannot be used for any other purpose unless approved by the Legislature. An additional $37 million of total fund balance has been assigned to specific purposes, as expressed by legislative intent. The remaining $430 million is unassigned and available for appropriations.
General Fund
The General Fund is the chief operating fund of the State. The major General Fund liability is the estimated tax refunds payable of $361 million. However, such refunds payable are $8 million less than the expected taxes owed the State. Other assets of the General Fund available to pay non tax-refund liabilities exceed such liabilities by $807 million.
On June 30, 2011, the General Fund had a positive fund balance of $733 million. Expenditures increased $163 million and revenues increased by $286 million in 2012. This $123 million increase was less than the $155 million increase that occurred in 2011, resulting in an operating increase of the fund balance of $80 million in 2012. This operating increase in 2012 caused the General Fund balance to increase by $82 million, ending with a fund balance of $815 million.
Revenues in 2012, significantly more than anticipated, were up $286 million over 2011 chiefly due to an increase in income tax revenue of $180 million (a 10% increase) over 2011, an increase in sales and use tax revenue of $75 million (a 5% increase) over 2011, and an increase in investment income of $14 million (a 60% increase) over 2011. Expenditures were less than budgeted due to continued efforts by agency heads to be conservative in spending. A net increase in expenditures was caused chiefly in three areas. Health and Social Services expenditures increased $157 million and Public Safety expenditures increased $17 million. These increases were offset by a decrease in General Government expenditures of $12 million.
To compensate for any downturns in revenues, the State has maintained a budgetary basis Cash Reserve Fund. While this Cash Reserve Fund is commingled with General Fund cash in the General Fund financial statements, it is separate and distinct in that, by State Statute, it can only be used (1) when the cash balance of the General Fund is insufficient to meet General Fund current obligations and (2) for legislatively mandated transfers to other funds. Any money transferred in accordance with item one above must be repaid as soon as there is sufficient cash in the General Fund cash account to do so. No such need existed in 2012.
The Cash Reserve Fund was at $467 million at the beginning of 2011. In 2011 there was a statutory transfer from the Fund to the General Fund of $154 million, leaving a Cash Reserve Fund balance at June 30, 2011 of $313 million. In 2012 there was a statutory transfer from the Fund to the General Fund of $37 million, other net transfers in of $144 million, and revenues of $9 million leaving a Fund balance of $429 million at June 30, 2012. The Cash Reserve Fund is reflected as committed to economic stabilization on the governmental funds balance sheet.
Other Governmental Funds
Other governmental fund balances totaled $2,201 million at June 30, 2012. Of this amount, $491 million is nonspendable, either due to its form or legal constraints, and $1,600 million is restricted for specific programs by external constraints, constitutional provisions, or contractual obligations. An additional $73 million of total fund balance has been committed

23
to specific purposes. The remaining $37 million of total fund balance has been assigned to specific purposes, as expressed by legislative intent.
The three major funds presented as special revenue funds are the Highway Fund, the Federal Fund and the Health and Social Services Fund, with total fund balances of $723 million. The non-major special revenue fund balances totaled $790 million.
Governmental funds other than the General Fund saw an increase in fund balances of $87 million. The fund balances of the following funds increased: the Highway Fund ($49 million), the Permanent School Fund ($17 million), and the other Nonmajor Funds ($41 million.) The Health and Social Service Fund decreased by $20 million and the Federal Fund had a slight increase.
The Highway Fund had a $15 million increase in sales and use taxes, a $71 million increase in federal grants revenue and a $107 million increase in operating expenses. These increases are why the Highway Fund had a $49 million increase in its fund balance in 2012 as opposed to a $52 million increase in 2011.
The activity in the Federal Fund represents federal funds received, and each year’s spending should generally approximate grant funds received. In 2012 there was a decrease in federal grants and contracts of $375 million due to the end of the ARRA program, investment income increased $2 million and other revenue decreased $2 million. Expenditures in 2012 decreased by $235 million for Education, $7 million for Conservation of Natural Resources, $11 million for Economic Development and Assistance, $104 million for Health and Social Services, and $12 million for Public Safety. Revenues exceeded expenditures by $6 million before transfers. Transfers out decreased $7 million in 2012 compared to a decrease of $31 million in 2011. At the end of 2012 there was a net increase in the fund of less than $1 million, compared to a $7 million decrease in 2011.
The Health and Social Services Fund consists of the Intergovernmental Trust Fund and the Tobacco Settlement Trust Fund, in addition to various cash funds. Such cash funds receive transfers from such trust funds, income from charges for services and some tax revenue, among other income. The funds had a $75 million decrease in investment income in 2012 (chiefly unrealized losses in the market value of investments) compared to a $38 million increase in 2011, which was the main reason there was a $20 million decrease in fund balance in 2012, as opposed to a $54 million increase in 2011.
The Permanent School Fund had a $72 million decrease in revenue, chiefly due to a $66 million decrease in investment income caused by unrealized losses in the market value of investments in 2012, as opposed to a $27 million investment income increase in 2011 (when compared to 2010). Expenditures decreased $3 million in 2012. There was a $17 million increase in fund balance in 2012, as opposed to an $86 million increase in 2011, a change of $69 million.
The Nonmajor Funds revenues remained about the same between 2011 and 2012. Expenditures had a $17 million decrease in General Government and an $11 million increase in Capital Projects. There were $25 million in net transfers in for the Nonmajor Funds in 2012 versus $30 million in net transfers out for 2011. As a result, the fund balances increased $41 million in 2012 as opposed to a $13 million decrease in 2011.
Proprietary Funds
The State’s proprietary funds provide the same type of information discussed earlier in the government-wide financial statements under Business-type Activities, but in more detail. The State’s one major proprietary fund, the Unemployment Insurance Fund, reported net assets of $403 million at the end of 2012. This fund’s net assets increased $59 million in 2012, because business assessment fees exceeded unemployment claims paid out by $55 million, which was offset by investment earnings of $11 million. Other proprietary or enterprise funds, the Lottery Fund, the Excess Liability Fund (the fund established to provide limited liability for physicians working in Nebraska) and Cornhusker State Industries (an operation that utilizes incarcerated persons to manufacture and sell items) had combined income of $47 million prior to a $36 million transfer from the Lottery’s net income to governmental funds. Such transfer was used primarily for education and environmental studies. The Excess Liability Fund had an operating income of $5 million and earned $5 million in investment earnings for a net asset increase of $10 million.

24
Fiduciary Funds
The Pension Trust Funds represent the majority of the fiduciary funds. Such Pension Trust Fund’s net assets increased $3 million to $9,610 million in 2012 due to a flat market in 2012. Interest and dividend income in 2012 was $129 million versus $138 million in 2011. Benefits, refunds and related administrative expenses exceeded the contributions to the plans by $82 million. In another trust fund recorded in the Private Purpose Trust Funds, contributions from State participants received by the College Savings Plan totaled $313 million. The total net assets in the College Savings Plan now total over two billion dollars.
ANALYSIS OF GENERAL FUND BUDGET VARIATIONS
Even though there is a relatively stable economy in the Midwest, in 2012 the State continued to rebound from the effects of the national recession. Forecasted revenues, upon which the State’s budgeted General Fund expenditures are based, were anticipated to increase in 2012 by $133 million over 2011 net tax revenue of $3,368 million. Because revenues continued to show an increasing trend during 2012, the State’s Forecasting Board made three new forecasts throughout the year. At the end, the forecasted net tax revenues were $52 million above the original forecast. However, that increased forecast was still less than actual tax revenues of $3,606 million by $53 million, leaving the State with actual tax revenues, net of refunds, of $105 million above the original budget on a budgetary basis. Even though tax revenues were starting to increase, they were slightly above pre-recession tax revenues of 2008. To offset this revenue, agencies continued to watch their General Fund expenditures and spent $269 million less than the final appropriated amount. This reduction, when coupled with the increased tax revenues, caused the State to finish 2012 with General Fund revenues of $219 million more than expenditures on a budgetary basis, prior to net transfers out. There was a net $108 million transferred out for specific purposes, causing the fund balance on a budgetary basis to increase from $813 million to $924 million in 2012.
CAPITAL ASSETS AND DEBT ADMINISTRATION
Capital Assets
At the end of fiscal year 2012, the State had invested $8.1 billion, net of accumulated depreciation, in capital assets as reported in the Statement of Net Assets and summarized in the table below. Depreciation expense for 2012 totaled $62 million, compared to $50 million for 2011.
CAPITAL ASSETS AS OF JUNE 30(net of depreciation in millions of dollars)
Governmental Business-type Total Primary Activities Activities Government
2012 2011 2012 2011 2012 2011 Land $ 558 $ 553 $ - $ - $ 558 $ 553 Buildings and Equipment 415 401 6 7 421 408 Infrastructure 7,012 6,986 - - 7,012 6,986 Subtotal 7,985 7,940 6 7 7,991 7,947 Construction in Progress 82 70 - - 82 70
Total $ 8,067 $ 8,010 $ 6 $ 7 $ 8,073 $ 8,017
Infrastructure (roads, bridges, dams, etc.) is by far the largest group of assets owned by the State. GASB Statement No. 34 requires the State to select one of two methods to account for its infrastructure assets. One process is to record depreciation expense on selected infrastructure assets. The State has adopted an alternative process, referred to as the modified approach. Under this alternative method, the State expenses certain maintenance and preservation costs and does not record any depreciation expense. Assets accounted for under the modified approach include approximately 10,000 miles of roads that the State is responsible to maintain.
In assessing the condition of State roads, the State’s goal is to maintain at least an overall system rating of 72 or above using the Nebraska Serviceability Index. The most recent condition assessment, completed for calendar year 2011, indicated an overall system rating of 80, a rating that has been very consistent over the past six years.

25
For 2012, it was estimated that the State needed to spend $288 million to preserve and maintain the roads at the abovementioned level. The State actually spent $278 million on roads in 2012, compared to $218 million in 2011. For 2013, it is estimated that the State needs to spend $313 million, an increase from actual 2012 and an increase from the average of the previous five years.
The State also spent $30 million on capitalized infrastructure and land purchases relating to roads in 2012 ($139 million in 2011), most notably reconstructing (a) Interstate 80 between Omaha and Lincoln, (b) I-80 eastbound bridge over the Missouri River, (c) I-80 10th Street Bridge to Missouri River in Omaha, and (d) US-75 South of Bellevue. Major land purchases included land purchased near four State highways. At June 30, 2012, the State had contractual commitments of $734 million for various highway and building projects. Most of the related expenditures will be expensed and not capitalized. (See Notes 1.J and 4 to the financial statements.) These commitments are $172 million more than at June 30, 2011 as a result of new highway construction and repair work being financed by the federal government.
During 2012, the State added $82 million of new depreciable capital assets, both buildings and equipment. A more detailed analysis of capital assets is shown in Note 4 to the financial statements.
Long-Term Debt
Long-term debt related to capital assets is minimal for reasons previously stated. For further detail and analysis of long-term debt, see Notes 8 and 13 to the financial statements.
CERTAIN LONG-TERM DEBT AS OF JUNE 30 (in millions of dollars) GOVERNMENTAL ACTIVITIES 2012 2011 Capitalized Leases: $ 25 $ 27
There were no new bonds issued or outstanding in 2012 or 2011. Two new capitalized leases were added in 2012 (two leases were added in 2011). Bonds and Certificates of Participation for leases issued on behalf of the State maintain an Aa2 rating from Moody’s. Standard and Poor’s has issued an AAA rating for the State as a whole, and affirmed this rating in December 2012.

26
FACTORS THAT WILL AFFECT THE FUTURE
The national economy is improving, which has resulted in forecasted growth in tax receipts. Tax revenues have improved and have exceeded projections during the last year. Net General Fund revenues for 2013 are currently projected to exceed actual 2012 revenues by $129 million. The State has a low unemployment rate and has had no borrowing or repayment due to the federal government for the State’s Unemployment Insurance Fund. The Legislature has responded to the market effect on defined benefit plans by increasing employer and employee contributions to maintain funded ratios.
The State does face many challenges in the coming years. LB84, which earmarks one quarter of one percent of the State’s sales tax for state, county and municipal road construction starting in 2013 will create future financing challenges for the General Fund. National healthcare policy, including increased participation in the Medicaid program and the ongoing increase in healthcare costs present some additional challenges. Another area of concern is the school finance formula that provides for growth in aid to education for K-12 schools and special education that is greater than growth in historical tax receipts.
To help offset any future economic downturns, as previously explained, the State maintains a Cash Reserve Fund. As of June 30, 2012, this Fund had a $429 million balance. A transfer of $105 million was made from the General Fund in July 2012 as statutorily required. From the Cash Reserve Fund there were $75 million of other statutory disbursements, resulting in a balance of $458 million at November 30, 2012. Future significant statutory disbursements from this fund in the next year include $78 million to be transferred to the General Fund. With the improved revenue forecast, the State currently projects an additional $58 million transfer into the Cash Reserve Fund in July 2013.
CONTACTING THE STATE ACCOUNTING OFFICE
This report is designed to provide our citizens, taxpayers, customers, investors and creditors with a general overview of the State’s finances and to demonstrate the State’s accountability for the money it receives. If you have any questions about this report or need additional information, contact the State Accounting Division of Administrative Services, Suite 1309 State Capitol, Lincoln, NE 68509-4664, (402) 471-2581.
The State’s component units issue their own separately issued audited financial statements. These statements may be obtained by directly contacting the component units or by going online to their websites. For the University of Nebraska, contact the University of Nebraska, Director of University Accounting, 3835 Holdrege, Lincoln, NE 68583, (402) 472-2111 or online at http://www.nebraska.edu/administration/business-and-finance/accounting-and-finance.html. For the State College System, contact the Nebraska State College System, Fiscal and Facilities Management, Box 94605, Lincoln, NE 68509-4605, (402) 471-2505 or online at http://www.nscs.edu/.
27
BASIC FINANCIAL STATEMENTS

28

The accompanying notes are an integral part of the financial statements. 29
State of NebraskaSTATEMENT OF NET ASSETSJune 30, 2012
(Dollars in Thousands) PRIMARY GOVERNMENT GOVERNMENTAL BUSINESS-TYPE COMPONENT ACTIVITIES ACTIVITIES TOTALS UNITSASSETS Cash and Cash Equivalents $ 236,554 $ 368,507 $ 605,061 $ 558,944 Receivables, net of allowance Taxes 421,874 - 421,874 - Due from Federal Government 315,909 - 315,909 - Other 190,294 63,673 253,967 340,975 Internal Balances (533) 533 - - Due from Primary Government - - - 617 Investments 2,930,112 123,138 3,053,250 1,778,527 Loans Receivable 280,010 - 280,010 35,694 Investment in Joint Venture - - - 282,013 Other Assets 16,318 3,696 20,014 52,138 Restricted Assets: Cash and Cash Equivalents 13,941 - 13,941 362,440 Other - 2,381 2,381 33,572 Securities Lending Collateral 182,391 7,225 189,616 - Capital assets: Land 557,614 315 557,929 76,255 Infrastructure 7,011,809 - 7,011,809 - Construction in Progress 82,074 - 82,074 139,629 Land Improvements - - - 186,297 Buildings and Equipment 1,020,548 12,991 1,033,539 2,531,703 Less Accumulated Depreciation (605,537) (6,927) (612,464) (912,397) Total Capital Assets, net of depreciation 8,066,508 6,379 8,072,887 2,021,487 Total Assets $ 12,653,378 $ 575,532 $ 13,228,910 $ 5,466,407 LIABILITIES Accounts Payable and Accrued Liabilities $ 483,466 $ 23,515 $ 506,981 $ 168,240 Tax Refunds Payable 370,233 - 370,233 - Due to Other Governments 23,375 - 23,375 - Deposits 10,048 - 10,048 14,233 Due to Component Units 617 - 617 - Unearned Revenue 57,076 2,579 59,655 120,974 Obligations under Securities Lending 182,391 7,225 189,616 - Noncurrent Liabilities: Due within one year 294,843 32,565 327,408 111,578 Due in more than one year 202,529 20,872 223,401 700,479 Total Liabilities $ 1,624,578 $ 86,756 $ 1,711,334 $ 1,115,504 NET ASSETS Invested in Capital Assets, net of related debt $ 8,041,150 $ 6,379 $ 8,047,529 $ 1,193,428 Restricted for: Education 19,645 - 19,645 1,630,571 Health and Social Services 469,339 - 469,339 - Conservation of Natural Resources 506,970 - 506,970 - Transportation 262,330 - 262,330 - Licensing and Regulation 77,753 - 77,753 - Other Purposes 121,173 2,381 123,554 277,725 Unemployment Insurance Benefits - 402,754 402,754 - Debt Service and Construction 10,703 - 10,703 353,227 Permanent Trusts: Nonexpendable 478,849 - 478,849 - Expendable 135,385 - 135,385 - Unrestricted 905,503 77,262 982,765 895,952
Total Net Assets $ 11,028,800 $ 488,776 $ 11,517,576 $ 4,350,903

The accompanying notes are an integral part of the financial statements. 30
State of NebraskaSTATEMENT OF ACTIVITIESFor the Year Ended June 30, 2012 (Dollars in Thousands) PROGRAM REVENUES
OPERATING CAPITAL CHARGES FOR GRANTS AND GRANTS AND FUNCTIONS/PROGRAMS EXPENSES SERVICES CONTRIBUTIONS CONTRIBUTIONSPRIMARY GOVERNMENT: Governmental Activities: General Government $ 460,612 $ 95,899 $ 10,931 $ 334 Conservation of Natural Resources 151,318 32,804 76,650 618 Culture – Recreation 24,752 22,984 3,879 - Economic Development and Assistance 102,839 4,126 69,884 - Education 1,570,235 36,831 350,349 - Higher Education - Colleges and University 557,162 - - - Health and Social Services 3,139,786 120,745 1,693,494 - Public Safety 366,084 26,322 91,119 14,837 Regulation of Business and Professions 122,211 131,312 4,458 - Transportation 907,173 110,842 346,061 - Interest on Long-term Debt 1,204 - - - Total governmental activities 7,403,376 581,865 2,646,825 15,789 Business-type activities: Unemployment Insurance 261,750 310,188 - - Lottery 113,935 150,612 - - Excess Liability 672 5,509 - - Cornhusker State Industries 11,621 12,053 - - Total business-type activities 387,978 478,362 - -
Total Primary Government $ 7,791,354 $ 1,060,227 $ 2,646,825 $ 15,789 COMPONENT UNITS: University of Nebraska $ 1,826,480 $ 885,258 $ 327,802 $ 9,940 State Colleges 103,403 38,488 16,179 2,097
Total Component Units $ 1,929,883 $ 923,746 $ 343,981 $ 12,037 General revenues: Income Taxes Sales and Use Taxes Petroleum Taxes Excise Taxes Business and Franchise Taxes Other Taxes Unrestricted Investment earnings Miscellaneous Payments from the State of Nebraska Contributions to Permanent Fund Principal Transfers Total General Revenues and Transfers Change in Net Assets Net Assets - Beginning
Net Assets - Ending

The accompanying notes are an integral part of the financial statements. 31
NET (EXPENSE) REVENUE ANDCHANGES IN NET ASSETS
PRIMARY GOVERNMENT GOVERNMENTAL BUSINESS-TYPE COMPONENT
ACTIVITIES ACTIVITIES TOTAL UNITS $ (353,448) $ - $ (353,448) $ - (41,246) - (41,246) - 2,111 - 2,111 - (28,829) - (28,829) - (1,183,055) - (1,183,055) - (557,162) - (557,162) - (1,325,547) - (1,325,547) - (233,806) - (233,806) - 13,559 - 13,559 - (450,270) - (450,270) - (1,204) - (1,204) - (4,158,897) - (4,158,897) - - 48,438 48,438 - - 36,677 36,677 - - 4,837 4,837 - - 432 432 - - 90,384 90,384 -
(4,158,897) 90,384 (4,068,513) - - - - (603,480) - - - (46,639)
- - - (650,119) 2,064,233 - 2,064,233 - 1,638,610 - 1,638,610 - 322,284 - 322,284 - 136,825 - 136,825 - 73,849 - 73,849 - 9,818 - 9,818 - 92,037 16,237 108,274 63,039 - - - 222,098 - - - 557,162 17,719 - 17,719 - 36,075 (36,075) - - 4,391,450 (19,838) 4,371,612 842,299 232,553 70,546 303,099 192,180 10,796,247 418,230 11,214,477 4,158,723
$ 11,028,800 $ 488,776 $ 11,517,576 $ 4,350,903

The accompanying notes are an integral part of the financial statements. 32
State of NebraskaBALANCE SHEETGOVERNMENTAL FUNDSJune 30, 2012 (Dollars in Thousands) HEALTH PERMANENT GENERAL HIGHWAY FEDERAL AND SOCIAL SCHOOL NONMAJOR FUND FUND FUND SERVICES FUND FUNDS TOTALSASSETS: Cash and Cash Equivalents $ 34,074 $ 7,632 $ 2,688 $ 2,354 $ 4,291 $ 31,265 $ 82,304 Cash on Deposit with Fiscal Agents - - - - - 13,941 13,941 Investments 964,295 232,260 87,394 439,628 578,552 627,983 2,930,112 Securities Lending Collateral 62,719 15,106 6,142 26,344 31,861 40,219 182,391 Receivables, net of allowance Taxes 368,445 52,596 - - - 833 421,874 Due from Federal Government 3 49,101 265,565 - - 1,240 315,909 Loans - - 12,166 165 - 267,679 280,010 Other 37,516 9,831 41,455 33,752 49,778 13,666 185,998 Due from Other Funds 60,962 572 227 1,626 - 3,393 66,780 Inventories 945 8,885 2,087 332 - 628 12,877 Prepaid Items 8 8 4 - - 135 155 Other 492 - - - - 1,149 1,641
TOTAL ASSETS $ 1,529,459 $ 375,991 $ 417,728 $ 504,201 $ 664,482 $ 1,002,131 $ 4,493,992 LIABILITIES AND FUND BALANCE LIABILITIES: Accounts Payable and Accrued Liabilities $ 87,315 $ 75,747 $ 155,552 7,267 63,303 35,853 425,037 Tax Refunds Payable 360,733 9,473 - - - 27 370,233 Due to Other Governments 10,878 11,325 - - - 1,172 23,375 Deposits 493 1,007 5,976 266 239 2,067 10,048 Due to Other Funds 35,624 1,161 68,575 506 9 7,030 112,905 Due to Component Units 617 - - - - - 617 Obligations under Securities Lending 62,719 15,106 6,142 26,344 31,861 40,219 182,391 Claims Payable 122,480 - 125,935 - - - 248,415 Deferred Revenue 33,802 - 46,346 18,548 6,559 - 105,255 TOTAL LIABILITIES 714,661 113,819 408,526 52,931 101,971 86,368 1,478,276 FUND BALANCES: Nonspendable: Inventories and Prepaid Items 953 8,893 2,091 332 - 763 13,032 Endowment Principal - - - - 459,334 19,515 478,849 Restricted for: Education - - - - 103,177 22,230 125,407 Health and Social Services - - - 450,297 - 29,335 479,632 Conservation of Natural Resources - - - - - 506,970 506,970 Transportation - 253,279 - - - 9,837 263,116 Licensing and Regulation - - - - - 77,753 77,753 Economic Development - - - - - 33,351 33,351 Public Safety - - - - - 33,527 33,527 Culture – Recreation - - - - - 18,992 18,992 Other Purposes - - 7,111 - - 43,069 50,180 Debt Service - - - - - 10,703 10,703 Committed to: Economic Stabilization 383,379 - - - - - 383,379 Other Purposes - - - - - 73,327 73,327 Assigned to: Education - - - - - 103 103 Health and Social Services - - - 641 - - 641 Conservation of Natural Resources - - - - - 64 64 Licensing and Regulation - - - - - 34,112 34,112 Economic Development - - - - - 55 55 Culture – Recreation - - - - - 64 64 Other Purposes - - - - - 1,993 1,993 Unassigned 430,466 - - - - - 430,466 TOTAL FUND BALANCES 814,798 262,172 9,202 451,270 562,511 915,763 3,015,716 TOTAL LIABILITIES AND FUND BALANCES $ 1,529,459 $ 375,991 $ 417,728 $ 504,201 $ 664,482 $ 1,002,131 $ 4,493,992

The accompanying notes are an integral part of the financial statements. 33
State of NebraskaRECONCILIATION OF THE BALANCE SHEET – GOVERNMENTAL FUNDS TO THE STATEMENT OF NET ASSETSJune 30, 2012 (Dollars in Thousands) Total fund balances for governmental funds $ 3,015,716 Amounts reported for governmental activities in the Statement of Net Assets are different because: Capital assets used in governmental activities are not financial resources and therefore are not reported in the funds. These assets consist of: Land 557,614 Infrastructure 7,011,809 Construction in progress 82,074 Other capital assets 938,244 Accumulated depreciation (550,351) 8,039,390 Certain tax revenues and charges are earned but not available and therefore are deferred in the funds. 49,021 Internal service funds are used by management to charge the costs of certain activities to individual funds. The assets and liabilities of the internal service funds are included in governmental activities in the Statement of Net Assets. 81,283 Certain long-term liabilities are not due and payable in the current period and therefore are not reported in the funds. Those liabilities consist of: Capital leases (3,437) Obligations under other financing arrangements (14,860) Compensated absences (133,127) Net pension obligation (1,170) Claims and judgments (4,016) (156,610) Net assets of governmental activities $ 11,028,800

The accompanying notes are an integral part of the financial statements. 34
State of NebraskaSTATEMENT OF REVENUES, EXPENDITURES, AND CHANGES IN FUND BALANCESGOVERNMENTAL FUNDSFor the Year Ended June 30, 2012 (Dollars in Thousands) HEALTH PERMANENT GENERAL HIGHWAY FEDERAL AND SOCIAL SCHOOL NONMAJOR FUND FUND FUND SERVICES FUND FUNDS TOTALSREVENUES: Income Taxes $ 2,062,125 $ - $ - $ 1,197 $ - $ - $ 2,063,322 Sales and Use Taxes 1,446,594 183,702 - - - 4,050 1,634,346 Petroleum Taxes - 309,261 - - 5,011 13,023 327,295 Excise Taxes 73,687 - - 7,297 - 55,841 136,825 Business and Franchise Taxes 57,412 - - - - 16,437 73,849 Other Taxes 1,147 2,824 - - - 5,847 9,818 Federal Grants and Contracts 842 323,654 2,296,301 133 - 41,675 2,662,605 Licenses, Fees and Permits 19,687 87,535 602 55,677 1,411 130,374 295,286 Charges for Services 2,258 20,792 22,316 25,302 - 31,965 102,633 Investment Income 37,275 7,658 3,582 (692) 17,782 22,343 87,948 Rents and Royalties - 467 16 431 34,686 22,238 57,838 Surcharge - - - - - 52,743 52,743 Other 12,144 2,726 1,695 13,697 11,636 30,332 72,230 TOTAL REVENUES 3,713,171 938,619 2,324,512 103,042 70,526 426,868 7,576,738 EXPENDITURES: Current: General Government 344,034 - 6,502 - - 69,607 420,143 Conservation of Natural Resources 32,066 - 60,777 - - 58,127 150,970 Culture – Recreation 5,408 - 2,973 - - 20,053 28,434 Economic Development and Assistance 7,997 - 70,817 - - 24,088 102,902 Education 1,158,746 - 350,370 - 53,400 19,440 1,581,956 Higher Education - Colleges and University 544,496 - - - - 12,666 557,162 Health and Social Services 1,297,406 - 1,718,717 120,743 - 2,176 3,139,042 Public Safety 239,005 - 103,732 - - 36,245 378,982 Regulation of Business and Professions 3,569 - 4,264 - - 114,192 122,025 Transportation - 907,565 406 - - 24,474 932,445 Capital Projects - - - - - 28,123 28,123 Debt Service: Principal - - - - - 2,865 2,865 Interest - - - - - 684 684 TOTAL EXPENDITURES 3,632,727 907,565 2,318,558 120,743 53,400 412,740 7,445,733 Excess (Deficiency) of Revenues Over (Under) Expenditures 80,444 31,054 5,954 (17,701) 17,126 14,128 131,005 OTHER FINANCING SOURCES (USES): Transfers In 48,117 24,292 - 906 - 97,358 170,673 Transfers Out (47,210) (6,560) (5,400) (3,400) - (72,028) (134,598) Proceeds from Other Financing Arrangements - - - - - 1,505 1,505 TOTAL OTHER FINANCING SOURCES (USES) 907 17,732 (5,400) (2,494) - 26,835 37,580 Net Change in Fund Balances 81,351 48,786 554 (20,195) 17,126 40,963 168,585 FUND BALANCES, JULY 1 733,447 213,386 8,648 471,465 545,385 874,800 2,847,131
FUND BALANCES, JUNE 30 $ 814,798 $ 262,172 $ 9,202 $ 451,270 $ 562,511 $ 915,763 $ 3,015,716

The accompanying notes are an integral part of the financial statements. 35
State of NebraskaRECONCILIATION OF THE STATEMENT OF REVENUES, EXPENDITURES, AND CHANGES IN FUND BALANCES –GOVERNMENTAL FUNDS TO THE STATEMENT OF ACTIVITIESFor the Year Ended June 30, 2012 (Dollars in Thousands) Net change in fund balances–total governmental funds $ 168,585 Amounts reported for governmental activities in the Statement of Activities are different because: Capital outlays are reported as expenditures in governmental funds. Sales of capital assets are reported as revenues. However, in the Statement of Activities, the cost of capital assets is allocated over their estimated useful lives as depreciation expense. In the current period, these amounts are: Capital outlay 116,257 Capital assets sold (5,656) Depreciation expense (52,922) 57,679 Bond proceeds and other financing arrangements provide current financial resources to governmental funds; however, issuing debt increases long-term liabilities in the Statement of Net Assets. In the current period, proceeds were received from: Other financing arrangements (1,505) (1,505) Repayment of long-term debt and other financing arrangements is reported as an expenditure in governmental funds, but the repayment reduces long-term liabilities in the Statement of Net Assets. In the current year these amounts consisted of: Other financing arrangement payments 2,865 Capital lease payments 2,392 5,257 Internal service funds are used by management to charge the costs of certain activities to individual funds. The net revenue of the internal service funds is reported with governmental activities. 6,902 Because some revenues will not be collected in the next year, they are not considered available revenues and are deferred in the governmental funds. Unearned revenues decreased by this amount this year. 5,156 Some items reported in the Statement of Activities do not require the use of current financial resources and therefore are not reported as expenditures in governmental funds. These activities consist of: Increase in compensated absences (8,882) Increase in net pension obligation (1,170) Decrease in claims and judgments 531 (9,521)
Change in net assets of governmental activities $ 232,553

The accompanying notes are an integral part of the financial statements. 36
State of Nebraska STATEMENT OF NET ASSETS PROPRIETARY FUNDS June 30, 2012
(Dollars in Thousands) BUSINESS-TYPE ACTIVITIES - ENTERPRISE FUNDS GOVERNMENTAL ACTIVITIES - NONMAJOR INTERNAL UNEMPLOYMENT ENTERPRISE SERVICE INSURANCE FUNDS TOTALS FUNDSASSETS CURRENT ASSETS: Cash and Cash Equivalents $ 331,670 $ 36,837 $ 368,507 $ 154,919 Receivables, net of allowance 45,157 18,516 63,673 4,231 Due from Other Funds - 637 637 16,433 Inventories - 3,103 3,103 433 Prepaid Items - 100 100 1,212 Other - 493 493 - TOTAL CURRENT ASSETS 376,827 59,686 436,513 177,228 NONCURRENT ASSETS: Restricted Long-Term Deposits - 2,381 2,381 - Long-Term Investments 53,751 69,387 123,138 - Securities Lending Collateral 3,496 3,729 7,225 - Capital Assets: Land - 315 315 - Buildings and Equipment 761 12,230 12,991 82,304 Less Accumulated Depreciation (674) (6,253) (6,927) (55,186) Total Capital Assets, net 87 6,292 6,379 27,118 TOTAL NONCURRENT ASSETS 57,334 81,789 139,123 27,118
TOTAL ASSETS $ 434,161 $ 141,475 $ 575,636 $ 204,346 LIABILITIES AND NET ASSETS CURRENT LIABILITIES: Accounts Payable and Accrued Liabilities $ 1,024 $ 22,491 $ 23,515 $ 29,066 Due to Other Funds - 104 104 808 Capital Lease Obligations - - - 5,247 Claims, Judgments and Compensated Absences 26,794 5,771 32,565 27,827 Unearned Revenue - 2,579 2,579 842 TOTAL CURRENT LIABILITIES 27,818 30,945 58,763 63,790 NONCURRENT LIABILITIES: Capital Lease Obligations - - - 16,674 Claims, Judgments and Compensated Absences 6 20,866 20,872 42,599 Obligations under Securities Lending 3,496 3,729 7,225 - TOTAL NONCURRENT LIABILITIES 3,502 24,595 28,097 59,273 TOTAL LIABILITIES 31,320 55,540 86,860 123,063 NET ASSETS: Invested in Capital Assets, net of related debt 87 6,292 6,379 5,197 Restricted for: Lottery Prizes, Noncurrent - 2,381 2,381 - Unemployment Insurance Benefits 402,754 - 402,754 - Unrestricted - 77,262 77,262 76,086 TOTAL NET ASSETS 402,841 85,935 488,776 81,283 TOTAL LIABILITIES AND NET ASSETS $ 434,161 $ 141,475 $ 575,636 $ 204,346
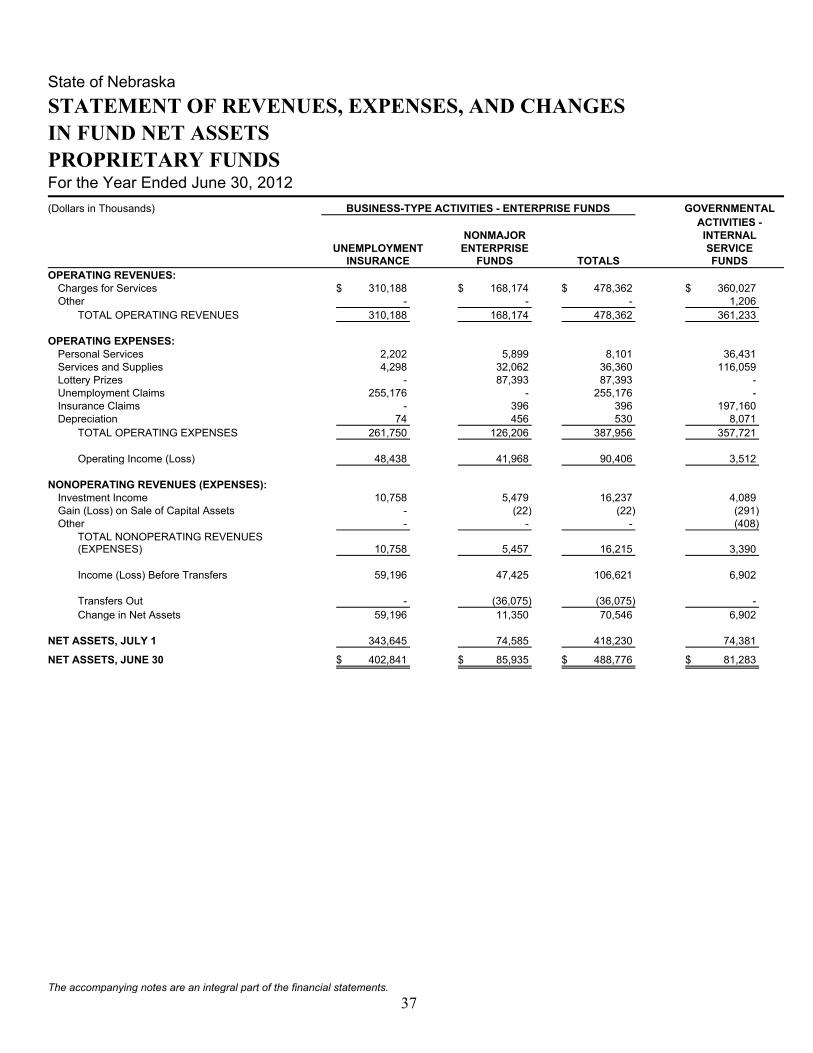
The accompanying notes are an integral part of the financial statements. 37
State of Nebraska STATEMENT OF REVENUES, EXPENSES, AND CHANGES IN FUND NET ASSETS PROPRIETARY FUNDS For the Year Ended June 30, 2012
(Dollars in Thousands) BUSINESS-TYPE ACTIVITIES - ENTERPRISE FUNDS GOVERNMENTAL ACTIVITIES - NONMAJOR INTERNAL UNEMPLOYMENT ENTERPRISE SERVICE INSURANCE FUNDS TOTALS FUNDSOPERATING REVENUES: Charges for Services $ 310,188 $ 168,174 $ 478,362 $ 360,027 Other - - - 1,206 TOTAL OPERATING REVENUES 310,188 168,174 478,362 361,233 OPERATING EXPENSES: Personal Services 2,202 5,899 8,101 36,431 Services and Supplies 4,298 32,062 36,360 116,059 Lottery Prizes - 87,393 87,393 - Unemployment Claims 255,176 - 255,176 - Insurance Claims - 396 396 197,160 Depreciation 74 456 530 8,071 TOTAL OPERATING EXPENSES 261,750 126,206 387,956 357,721 Operating Income (Loss) 48,438 41,968 90,406 3,512 NONOPERATING REVENUES (EXPENSES): Investment Income 10,758 5,479 16,237 4,089 Gain (Loss) on Sale of Capital Assets - (22) (22) (291) Other - - - (408)
TOTAL NONOPERATING REVENUES (EXPENSES) 10,758 5,457 16,215 3,390
Income (Loss) Before Transfers 59,196 47,425 106,621 6,902 Transfers Out - (36,075) (36,075) - Change in Net Assets 59,196 11,350 70,546 6,902 NET ASSETS, JULY 1 343,645 74,585 418,230 74,381
NET ASSETS, JUNE 30 $ 402,841 $ 85,935 $ 488,776 $ 81,283

The accompanying notes are an integral part of the financial statements. 38
State of NebraskaSTATEMENT OF CASH FLOWSPROPRIETARY FUNDSFor the Year Ended June 30, 2012 (Dollars in Thousands) BUSINESS-TYPE ACTIVITIES - ENTERPRISE FUNDS GOVERNMENTAL ACTIVITIES - NONMAJOR INTERNAL
UNEMPLOYMENT ENTERPRISE SERVICE INSURANCE FUNDS TOTALS FUNDS
CASH FLOWS FROM OPERATING ACTIVITIES: Cash Received from Customers $ 317,208 $ 156,913 $ 474,121 $ 20,560 Cash Received from Interfund Charges - 10,816 10,816 336,728 Cash Paid to Employees (2,216) (5,923) (8,139) (36,199) Cash Paid to Suppliers (4,301) (33,152) (37,453) (104,070) Cash Paid for Lottery Prizes - (86,393) (86,393) - Cash Paid for Insurance Claims (265,854) (9,170) (275,024) (198,474) Cash Paid for Interfund Services (6) (1,137) (1,143) (9,512) NET CASH FLOWS FROM OPERATING ACTIVITIES 44,831 31,954 76,785 9,033 CASH FLOWS FROM NONCAPITAL FINANCING ACTIVITIES: Transfers Out - (36,075) (36,075) - NET CASH FLOWS FROM NONCAPITAL FINANCING ACTIVITIES - (36,075) (36,075) - CASH FLOWS FROM CAPITAL AND RELATED FINANCING ACTIVITIES: Acquisition and Construction of Capital Assets - (127) (127) (3,701) Proceeds from Sale of Capital Assets - 5 5 1,804 Principal Paid on Capital Leases - - - (4,723) Interest Paid on Capital Leases - - - (408) NET CASH FLOWS FROM CAPITAL AND RELATED FINANCING ACTIVITIES - (122) (122) (7,028)CASH FLOWS FROM INVESTING ACTIVITIES: Purchase of Investment Securities - (117,425) (117,425) - Proceeds from Sale of Investment Securities 841 118,599 119,440 - Interest and Dividend Income 10,768 3,193 13,961 4,081 NET CASH FLOWS FROM INVESTING ACTIVITIES 11,609 4,367 15,976 4,081 NET INCREASE (DECREASE) IN CASH AND CASH EQUIVALENTS 56,440 124 56,564 6,086 CASH AND CASH EQUIVALENTS, JULY 1 275,230 36,713 311,943 148,833
CASH AND CASH EQUIVALENTS, JUNE 30 $ 331,670 $ 36,837 $ 368,507 $ 154,919
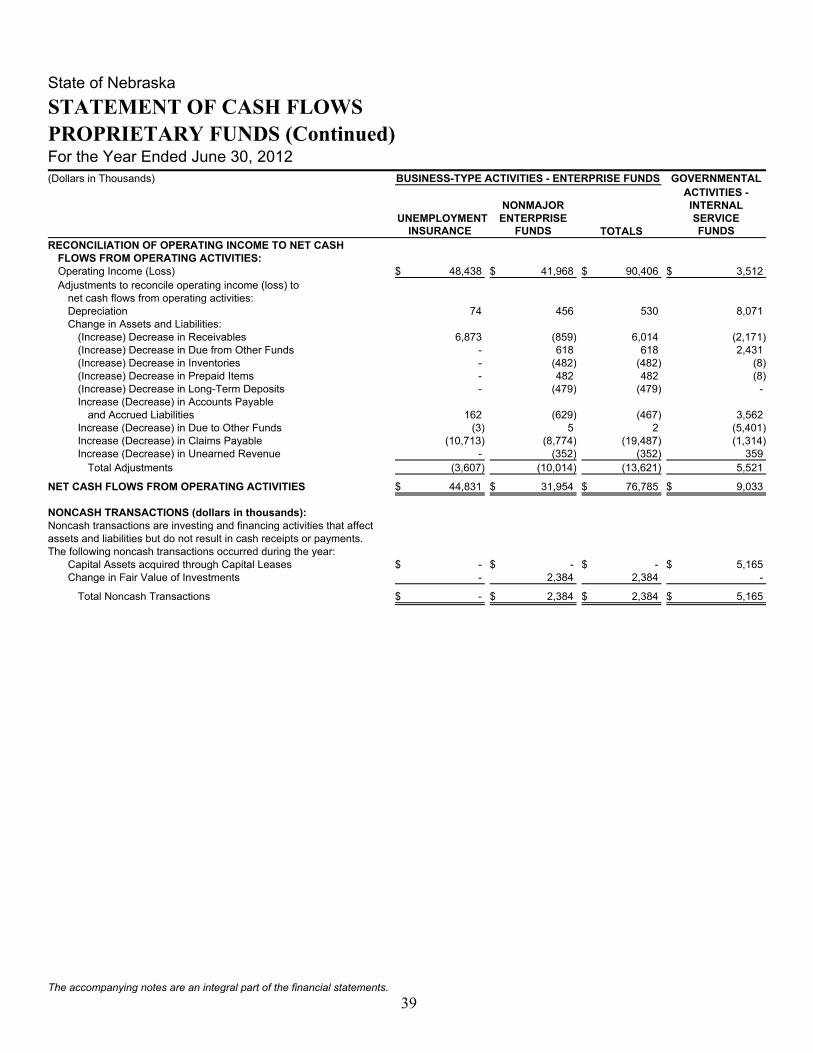
The accompanying notes are an integral part of the financial statements. 39
State of NebraskaSTATEMENT OF CASH FLOWSPROPRIETARY FUNDS (Continued)For the Year Ended June 30, 2012 (Dollars in Thousands) BUSINESS-TYPE ACTIVITIES - ENTERPRISE FUNDS GOVERNMENTAL ACTIVITIES - NONMAJOR INTERNAL
UNEMPLOYMENT ENTERPRISE SERVICE INSURANCE FUNDS TOTALS FUNDS
RECONCILIATION OF OPERATING INCOME TO NET CASH FLOWS FROM OPERATING ACTIVITIES: Operating Income (Loss) $ 48,438 $ 41,968 $ 90,406 $ 3,512 Adjustments to reconcile operating income (loss) to net cash flows from operating activities: Depreciation 74 456 530 8,071 Change in Assets and Liabilities: (Increase) Decrease in Receivables 6,873 (859) 6,014 (2,171) (Increase) Decrease in Due from Other Funds - 618 618 2,431 (Increase) Decrease in Inventories - (482) (482) (8) (Increase) Decrease in Prepaid Items - 482 482 (8) (Increase) Decrease in Long-Term Deposits - (479) (479) - Increase (Decrease) in Accounts Payable and Accrued Liabilities 162 (629) (467) 3,562 Increase (Decrease) in Due to Other Funds (3) 5 2 (5,401) Increase (Decrease) in Claims Payable (10,713) (8,774) (19,487) (1,314) Increase (Decrease) in Unearned Revenue - (352) (352) 359 Total Adjustments (3,607) (10,014) (13,621) 5,521
NET CASH FLOWS FROM OPERATING ACTIVITIES $ 44,831 $ 31,954 $ 76,785 $ 9,033 NONCASH TRANSACTIONS (dollars in thousands): Noncash transactions are investing and financing activities that affect assets and liabilities but do not result in cash receipts or payments. The following noncash transactions occurred during the year: Capital Assets acquired through Capital Leases $ - $ - $ - $ 5,165 Change in Fair Value of Investments - 2,384 2,384 -
Total Noncash Transactions $ - $ 2,384 $ 2,384 $ 5,165

The accompanying notes are an integral part of the financial statements. 40
State of NebraskaSTATEMENT OF FIDUCIARY NET ASSETSFIDUCIARY FUNDSJune 30, 2012
(Dollars in Thousands) PENSION PRIVATE
PURPOSE TRUST TRUST AGENCYASSETS Cash and Cash Equivalents $ 3,448 $ 20,217 $ 91,316 Investments: U.S. Treasury Notes and Bonds 252,619 - - U.S. Treasury Bills 7,286 - - Government Agency Securities 21,782 - - Corporate Bonds 608,572 - - International Bonds 173,548 - - Equity Securities 1,347,932 - - Private Equity 346,126 - - Options (565) - - Mortgages 565,252 - - Private Real Estate 244,282 - - Asset Backed Securities 59,497 - - Municipal Bonds 42,876 - - Commingled Funds 5,698,552 2,474,940 - Guaranteed Investment Contracts 117,990 - - Short Term Investments 189,458 497 - Total Investments 9,675,207 2,475,437 - Securities Lending Collateral 391,719 - - Receivables: Contributions 24,577 - - Interest and Dividends 16,300 536 474 Other 530,838 2 480 Total Receivables 571,715 538 954 Due from Other Funds 30,032 - - Capital Assets: Buildings and Equipment 23,075 - - Less Accumulated Depreciation (22,981) - - Total Capital Assets, net 94 - - Other Assets - 15,921 - TOTAL ASSETS $ 10,672,215 $ 2,512,113 $ 92,270 LIABILITIES Accounts Payable and Accrued Liabilities $ 669,985 $ 2,170 $ 18,989 Due to Other Governments - - 49,202 Deposits - 800 - Due to Other Funds 57 8 - Obligations under Securities Lending 391,719 - - Accrued Compensated Absences 297 - - Other Liabilities - - 24,079 TOTAL LIABILITIES $ 1,062,058 $ 2,978 $ 92,270 NET ASSETS Held in Trust for: Pension Benefits $ 9,610,157 $ - $ - College Savings Plan - 2,473,998 - Other Purposes - 35,137 -
TOTAL NET ASSETS $ 9,610,157 $ 2,509,135 $ -

The accompanying notes are an integral part of the financial statements. 41
State of Nebraska STATEMENT OF CHANGES IN FIDUCIARY NET ASSETS FIDUCIARY FUNDS For the Year Ended June 30, 2012 (Dollars in Thousands) PENSION PRIVATE PURPOSE TRUST TRUSTADDITIONS: Contributions: Participant Contributions $ 207,048 $ 313,368 Client Contributions - 140 State Contributions 100,891 - Political Subdivision Contributions 145,582 - Court Fees 3,490 - Total Contributions 457,011 313,508 Investment Income: Net Appreciation (Depreciation) in Fair Value of Investments (24,854) (5,472) Interest and Dividend Income 129,010 3,751 Securities Lending Income 2,956 - Total Investment Income 107,112 (1,721) Investment Expenses 21,377 12,275 Securities Lending Expenses 656 - Total Investment Expense 22,033 12,275 Net Investment Income 85,079 (13,996) Escheat Revenue - 7,566 Other Additions 63 5,724 TOTAL ADDITIONS 542,153 312,802 DEDUCTIONS: Benefits 514,440 217,663 Refunds 12,354 - Amounts Distributed to Outside Parties - 12,664 Administrative Expenses 6,591 2,063 Other Deductions 5,669 - TOTAL DEDUCTIONS 539,054 232,390 Change in Net Assets Held in Trust for: Pension Benefits 3,099 - College Savings Plan - 81,215 Other Purposes - (803) NET ASSETS-BEGINNING OF YEAR 9,607,058 2,428,723
NET ASSETS-END OF YEAR $ 9,610,157 $ 2,509,135
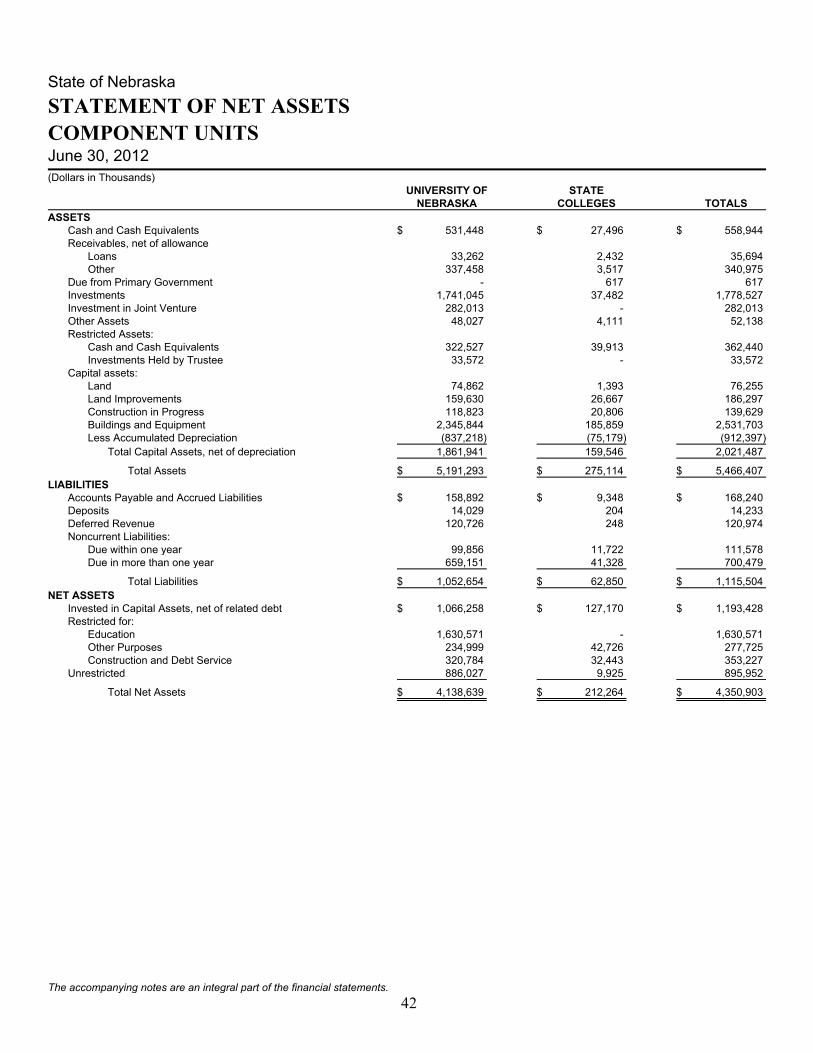
The accompanying notes are an integral part of the financial statements. 42
State of Nebraska
STATEMENT OF NET ASSETS
COMPONENT UNITS
June 30, 2012 (Dollars in Thousands)
UNIVERSITY OF STATE NEBRASKA COLLEGES TOTALSASSETS Cash and Cash Equivalents $ 531,448 $ 27,496 $ 558,944 Receivables, net of allowance Loans 33,262 2,432 35,694 Other 337,458 3,517 340,975 Due from Primary Government - 617 617 Investments 1,741,045 37,482 1,778,527 Investment in Joint Venture 282,013 - 282,013 Other Assets 48,027 4,111 52,138 Restricted Assets: Cash and Cash Equivalents 322,527 39,913 362,440 Investments Held by Trustee 33,572 - 33,572 Capital assets: Land 74,862 1,393 76,255 Land Improvements 159,630 26,667 186,297 Construction in Progress 118,823 20,806 139,629 Buildings and Equipment 2,345,844 185,859 2,531,703 Less Accumulated Depreciation (837,218) (75,179) (912,397) Total Capital Assets, net of depreciation 1,861,941 159,546 2,021,487
Total Assets $ 5,191,293 $ 275,114 $ 5,466,407 LIABILITIES Accounts Payable and Accrued Liabilities $ 158,892 $ 9,348 $ 168,240 Deposits 14,029 204 14,233 Deferred Revenue 120,726 248 120,974 Noncurrent Liabilities: Due within one year 99,856 11,722 111,578 Due in more than one year 659,151 41,328 700,479
Total Liabilities $ 1,052,654 $ 62,850 $ 1,115,504 NET ASSETS Invested in Capital Assets, net of related debt $ 1,066,258 $ 127,170 $ 1,193,428 Restricted for: Education 1,630,571 - 1,630,571 Other Purposes 234,999 42,726 277,725 Construction and Debt Service 320,784 32,443 353,227 Unrestricted 886,027 9,925 895,952
Total Net Assets $ 4,138,639 $ 212,264 $ 4,350,903

The accompanying notes are an integral part of the financial statements. 43
State of Nebraska
STATEMENT OF ACTIVITIES COMPONENT UNITS For the Year Ended June 30, 2012 (Dollars in Thousands) UNIVERSITY OF STATE NEBRASKA COLLEGES TOTALS
Operating Expenses: Compensation and benefits $ 1,140,520 $ 58,977 $ 1,199,497 Supplies and materials 260,324 12,192 272,516 Contractual services 124,265 3,755 128,020 Repairs and maintenance 62,366 1,853 64,219 Utilities 34,984 3,760 38,744 Communications 14,377 758 15,135 Depreciation 105,200 6,604 111,804 Scholarships and fellowships 67,820 5,618 73,438 Other 16,624 9,886 26,510
Total Operating Expenses 1,826,480 103,403 1,929,883
Program Revenues: Charges for Services 885,258 38,488 923,746 Operating Grants and Contributions 327,802 16,179 343,981 Capital Grants and Contributions 9,940 2,097 12,037
Total Program Revenues 1,223,000 56,764 1,279,764
Net (Expense) Revenue (603,480) (46,639) (650,119)
General Revenue: Interest and investment earnings 60,946 2,093 63,039 Miscellaneous 217,960 4,138 222,098 Payments from the State of Nebraska 506,708 50,454 557,162
Total General Revenues 785,614 56,685 842,299
Change in Net Assets 182,134 10,046 192,180
Net Assets - Beginning 3,956,505 202,218 4,158,723
Net Assets - Ending $ 4,138,639 $ 212,264 $ 4,350,903

44
State of NebraskaNOTES TO THE FINANCIAL STATEMENTSFor the Year Ended June 30, 2012 (dollars expressed in thousands)
1. Summary of Significant Accounting PoliciesA. Basis of Presentation. The accompanying financial statements of the State of Nebraska (the “State”) and its component units
have been prepared in conformity with accounting principles generally accepted in the United States of America (GAAP) as applied to governmental units. The Governmental Accounting Standards Board (GASB) is the accepted standard-setting body for establishing governmental accounting and financial reporting principles.
The financial statements have been prepared primarily from accounts maintained by the State Accounting Administrator of Administrative Services. Additional data has been derived from audited financial statements of certain entities and from reports prescribed by the State Accounting Administrator and prepared by various State agencies and departments based on independent or subsidiary accounting systems maintained by them.
B. Reporting Entity. In determining its financial reporting entity, the State has considered all potential component units for which it is financially accountable, and other organizations which are fiscally dependent on the State, or the significance of their relationship with the State are such that exclusion would be misleading or incomplete. The GASB has set forth criteria to be considered in determining financial accountability. These criteria include appointing a voting majority of an organization’s governing body and (1) the ability of the State to impose its will on that organization or (2) the potential for the organization to provide specific financial benefits to, or impose specific financial burdens on, the State.
As required by GAAP, these financial statements present the State and its component units. The component units are included in the State’s reporting entity because of the significance of their operational or financial relationships with the State. Complete financial statements of the individual component units that issue separate financial statements, as noted below, can be obtained from their respective administrative offices.
Discretely Presented Component Units. The following component units are entities that are legally separate from the State, but are financially accountable to the State, or their relationships with the State are such that their exclusion would cause the State’s financial statements to be misleading or incomplete. The component units are reported in a separate column in the government-wide financial statements to emphasize that they are legally separate from the State and governed by separate boards.
Nebraska State College System. The Board of Trustees of the Nebraska State Colleges governs Chadron State College, Peru State College and Wayne State College. The Board of Trustees is also the Board of Directors of the Nebraska State Colleges Facilities Corporation, a nonprofit corporation incorporated in 1983 to finance the repair or construction of buildings or the acquisition of equipment for use by the State Colleges. The Board of Trustees consists of the Commissioner of Education and six members appointed by the Governor. Chadron State, Peru State and Wayne State Foundations are tax-exempt nonprofit corporations whose purpose is to provide financial support for the Nebraska State College System. Audit reports may be found on the State Colleges’ website under Audit Reports.
University of Nebraska. The University of Nebraska consists of the following campuses: University of Nebraska – Lincoln, University of Nebraska at Omaha, University of Nebraska at Kearney, and University of Nebraska Medical Center. The University of Nebraska is governed by an elected eight-member Board of Regents. The University’s financial reporting entity also consists of the following units: the University of Nebraska Facilities Corporation, a nonprofit corporation organized to finance the construction and repair of buildings and hold them in trust for the University of Nebraska; the UNMC Physicians, organized for the purpose of billing medical service fees generated by university clinicians; the University Dental Associates, organized for the purpose of billing dental service fees generated by university dentists; the Nebraska Utility Corporation, formed to purchase, lease, construct and finance activities relating to energy requirements of the University of Nebraska-Lincoln; the University Technology Development Center, formed for the purpose of supporting the research mission of the University and advance technology transfer globally; and the University of Nebraska Foundation, a tax-exempt nonprofit corporation whose purpose is to provide financial support for the University of Nebraska. The University of Nebraska is included as a component unit because it is fiscally dependant on the State, since the Nebraska Legislature controls the budget of the University. Audit reports may be found on the University’s Accounting and Finance website.
The university and colleges are funded chiefly through State appropriations, tuition, federal grants, private donations and grants, and auxiliary operations.
Related Organizations. The State’s officials are responsible for appointing members of boards of other organizations, but the State’s accountability for these organizations does not extend beyond making these appointments. The Governor appoints the

State of Nebraska (dollars expressed in thousands)
45
boards of the following organizations: Nebraska Educational Finance Authority, Nebraska Investment Finance Authority, and Wyuka Cemetery.
C. Government-wide and Fund Financial Statements. The basic financial statements include both government-wide and fund financial statements. The reporting model based on the GASB Statement No. 34 Basic Financial Statements – and Management’s Discussion and Analysis – for State and Local Governments focuses on the State as a whole in the government-wide financial statements and major individual funds in the fund financial statements. The government-wide financial statements (i.e., the Statement of Net Assets and the Statement of Activities) report information on all of the non-fiduciary activities of the primary government and its component units. For the most part, the effect of interfund activity has been removed from these statements. Governmental activities, which normally are supported by taxes and intergovernmental revenues, are reported separately from business-type activities, which rely to a significant extent on fees and charges for support. Likewise, the primary government is reported separately from certain legally separate component units for which the primary government is financially accountable.
The Statement of Net Assets presents the reporting entity’s non-fiduciary assets and liabilities, with the difference reported as net assets. Net assets are reported in three categories:
Investment in Capital Assets, net of related debt. This category reflects the portion of net assets associated with capital assets, net of accumulated depreciation and reduced by outstanding bonds and other debt that are attributed to the acquisition, construction or improvement of those assets.
Restricted Net Assets. This category results when constraints are externally imposed on net asset use by creditors, grantors or contributors, or imposed by law through constitutional provisions or enabling legislation.
It is the policy of the State to spend restricted net assets only when unrestricted net assets are insufficient or unavailable.
The Statement of Net Assets reports $2,487,282 of restricted net assets, of which $1,466,749 is restricted by enabling legislation.
Unrestricted Net Assets. This category represents net assets that do not meet the definition of the preceding two categories. Unrestricted net assets often have constraints on resources that are imposed by management, but those constraints can be removed or modified.
The Statement of Activities demonstrates the degree to which the direct expenses of a given function are offset by program revenues. Direct expenses are those that are clearly identifiable with a specific function. Indirect expenses are reflected in the general government function. Administrative overhead charges of internal service funds are included in direct expenses. Program revenues include 1) charges to customers or applicants who purchase, use, or directly benefit from goods, services, or privileges provided by a given function or segment; 2) grants and contributions that are restricted to meeting the operational or capital requirements of a particular function or segment; and 3) investment earnings of permanent funds that are legally restricted for a specific program. Taxes and other items not meeting the definition of program revenues are instead reported as general revenues.
Separate financial statements are provided for governmental funds, proprietary funds, and fiduciary funds, even though the latter are excluded from the government-wide financial statements. Major individual governmental funds and major individual enterprise funds are reported as separate columns in the fund financial statements, with nonmajor funds being combined into a single column.
D. Basis of Accounting. The government-wide financial statements are reported using the economic resources measurement focus and the accrual basis of accounting, as are the proprietary fund and fiduciary fund financial statements, except agency funds. With the economic resources measurement focus, all assets and all liabilities associated with the operations are included on the statement of net assets. Revenues are recorded when earned and expenses are recorded when a liability is incurred, regardless of the timing of related cash flows. Grants and similar items are recognized as revenue as soon as all eligibility requirements have been met.
Governmental fund financial statements are reported using the current financial resources measurement focus and the modified accrual basis of accounting. Revenues and related receivables are recognized as they become susceptible to accrual; generally when they become both measurable and available, i.e., earned and collected within the next 60 days, except for federal reimbursement grants which use a one year availability period. Revenues are generally considered to be susceptible to accrual when the underlying transaction takes place or when eligibility requirements are met. Major revenues that are determined to be susceptible to accrual include sales taxes, income taxes, other taxpayer-assessed tax revenues, unemployment insurance taxes, federal grants and contracts, charges for services, and investment income. All other revenue items, including estate taxes, are considered to be measurable and available when cash is received by the State. Receivables not expected to be collected in the next 60 days (or 12 months in the case of federal reimbursement grants) are offset by deferred revenue.
Expenditures are generally recorded when a liability is incurred, as under accrual accounting. However, expenditures related to debt service, compensated absences, and claims and judgments are recorded only when payment is due and payable.

State of Nebraska (dollars expressed in thousands)
46
The State reports the following major governmental funds:
General Fund. This is the State’s primary operating fund. It reflects transactions related to resources received and used for those services traditionally provided by a state government, which are not accounted for in any other fund.
Highway Fund. This fund accounts for the maintenance and preservation of State highways financed with sales tax on motor vehicles, gas taxes, federal aid and other highway user fees.
Federal Fund. This fund accounts for substantially all federal monies received by the State, except those received by the Highway Fund.
Health and Social Services Fund. This fund accounts for activities of agencies, boards, and commissions providing health care and social services financed primarily by user fees and tobacco settlement proceeds.
Permanent School Fund. This fund receives proceeds from any sale of the school lands held in trust for public education; payments for easements and rights-of-way over these lands; royalties and severance taxes paid on oil, gas and minerals produced from these lands; escheats; unclaimed property and other items provided by law. Net appreciation on investments is not available for expenditure. Income is distributed to public schools.
The State reports the following major enterprise fund:
Unemployment Insurance Fund. This fund accounts for the State’s unemployment insurance benefits. Revenues consist of taxes assessed on employers to pay benefits to qualified unemployed persons.
The State also reports the following fund types:
Governmental Fund Types:
Special Revenue Funds. Reflect transactions related to resources received and used for restricted or specific purposes.
Capital Projects Fund. Reflects transactions related to resources received and used for the acquisition, construction, or improvement of capital facilities.
Permanent Funds. Reflect transactions related to resources that are legally restricted to the extent that only earnings, and not principal, may be used for purposes that benefit the government or its citizens, such as veterans, state airports and others.
Proprietary Fund Types:
Enterprise Funds. Reflect transactions used to account for those operations that are financed and operated in a manner similar to private business or where the governing body has decided that the determination of revenues earned, expenses incurred and/or net income is necessary for management accountability.
Internal Service Funds. These funds account for fleet management, facilities management, accounting, risk management, communication, information technology, printing, purchasing, and postal services provided to other funds on a cost reimbursement basis.
Fiduciary Fund Types:
Pension Trust Funds. These funds account for State Employee Retirement System, County Employee Retirement System, School Retirement System, Judges Retirement System, State Patrol Retirement System and Deferred Compensation pension benefits.
Private Purpose Trust Funds. These funds account for property escheated to the State held for private individuals, Nebraska College Savings Plan activity held for private individuals, and assets held for clients and inmates.
Agency Funds. These funds account for assets held by the State pending distribution to other governments and individuals.
In reporting the financial activity of its proprietary funds, the State applies all applicable GASB pronouncements as well as the following pronouncements issued on or before November 30, 1989 but not after, unless these pronouncements conflict with or contradict GASB pronouncements: Financial Accounting Standards Board Statements and Interpretations, Accounting Principles Board Opinions, and Accounting Research Bulletins of the Committee on Accounting Procedure.
Proprietary funds distinguish operating revenues and expenses from nonoperating items. Operating revenues and expenses generally result from providing services and producing and delivering goods in connection with a proprietary fund’s principal ongoing operations. The principal operating revenues of the enterprise and internal service funds are charges to customers for sales and services. Operating expenses for enterprise and internal service funds include the cost of sales and services, administrative expenses and depreciation on capital assets. All revenues and expenses not meeting this definition are reported as nonoperating revenues and expenses.

State of Nebraska (dollars expressed in thousands)
47
E. Cash and Cash Equivalents. In addition to bank accounts and petty cash, this classification includes all short-term investments such as certificates of deposit, repurchase agreements, and U.S. treasury bills having original maturities (remaining time to maturity at acquisition) of three months or less. These investments are stated at cost, which at June 30, 2012, approximates market. Banks pledge collateral, as required by law, to guarantee State funds held in time and demand deposits.
Cash and cash equivalents are under the control of the State Treasurer or other administrative bodies as determined by law. All cash deposited with the State Treasurer is initially maintained in a pooled cash account. On a daily basis, the State Treasurer invests cash not needed for current operations with the State’s Investment Council that maintains an operating investment pool for such investments. Interest earned on these investments is allocated to funds based on their percentage of the investment pool.
F. Investments. Investments as reported in the basic financial statements include long-term investments. Law or legal instruments may restrict these investments. All investments of the State and its component units are stated at fair value based on quoted market prices. For investments where no readily ascertainable fair value exists, management has received an estimate of fair value from the investment fund manager based, in part, on real estate appraisals. The State Treasurer is the custodian of all funds for the State; however, investments are under the responsibility of the Nebraska Investment Council or other administrative bodies as determined by law.
G. Receivables. Receivables are stated net of estimated allowances for uncollectible amounts, which are determined based upon past collection experience and current economic conditions.
H. Inventories. Inventories of materials and supplies are determined by both physical counts and through perpetual inventory systems. Significant inventories of governmental funds are valued using weighted average cost. Proprietary Funds’ valuation method is primarily at the lower of cost (first-in, first-out) or market. Expenditures (governmental funds) and expenses (proprietary funds) are recognized using the consumption method (i.e., when used or sold).
Commodities on hand at fiscal year end are reflected as inventories, offset by a like amount of deferred revenue, in the Federal Fund. Commodities are reported at fair values established by the federal government at the date received.
I. Restricted Assets. Assets held by the trustees for the State Revolving Fund and the Master Lease Purchase Program are classified as restricted assets on the Statement of Net Assets because they are maintained in separate bank accounts and their use is limited by applicable bond and lease covenants. These assets are reflected as cash on deposit with fiscal agents in the fund financial statements. The nonmajor enterprise funds reflect long-term deposits with the Multi-State Lottery as restricted assets.
J. Capital Assets. Capital assets, which include property, plant, equipment and infrastructure assets (e.g., roads, bridges, and similar items), are reported in the applicable governmental or business-type activities columns in the Statement of Net Assets. All capital assets are valued at cost where historical records are available and at estimated historical cost where no historical records exist. Donated capital assets are valued at their estimated fair market value on the date received.
The State possesses certain assets that have not been capitalized and depreciated, because the assets cannot be reasonably valued and/or the assets have inexhaustible useful lives. These collections are not capitalized by the State because they are (1) held for public exhibition, education or research in furtherance of public service, rather than financial gain, (2) protected, kept unencumbered, cared for and preserved, and (3) subject to an agency policy that requires the proceeds from sales of collection items to be used to acquire other items for collections. These assets include works of art and historical treasures, such as statues; historical documents; paintings; rare library books; and miscellaneous capitol-related artifacts and furnishings.
Generally, equipment that has a cost in excess of $5 at the date of acquisition and has an expected useful life of more than one year is capitalized. Substantially all initial building costs, land, land improvements, and software costing in excess of $100 are capitalized. Building improvements and renovations in excess of $100 are capitalized if a substantial portion of the life of the asset has expired and if the useful life of the asset has been extended as a result of the renovation or improvement. The costs of normal maintenance and repairs that do not add to the value of the asset or materially extend asset lives are not capitalized.
Buildings and equipment are depreciated using the straight-line method. The following estimated useful lives are used to compute depreciation:
Buildings 40 years
Equipment 3-20 years
The State has elected to use the “modified approach” to account for certain infrastructure assets, as provided in GASB Statement No. 34. Under this process, the State does not record depreciation expense nor are amounts capitalized in connection with improvements to these assets, unless the improvements expand the capacity or efficiency of an asset. Utilization of this approach requires the State to: commit to maintaining and preserving affected assets at or above a condition

State of Nebraska (dollars expressed in thousands)
48
level established by the State; maintain an inventory of the assets and perform periodic condition assessments to ensure that the condition level is being maintained; and make annual estimates of the amounts that must be expended to maintain and preserve assets at the predetermined condition levels. Roads and bridges maintained by the Department of Roads are accounted for using the modified approach. Infrastructure acquired prior to June 30, 1980, is reported.
K. Compensated Employee Absences. All permanent employees earn sick and vacation leave. Temporary and intermittent employees and Board and Commission members are not eligible for paid leave. The liability has been calculated using the vesting method in which leave amounts, for both employees who are currently eligible to receive termination payments and other employees who are expected to become eligible in the future to receive such payments upon termination, are included.
State employees accrue vested vacation leave at a variable rate based on years of service. Generally, accrued vacation leave cannot exceed 35 days at the end of a calendar year. Employees accrue sick leave at a variable rate based on years of service. In general, accrued sick leave cannot exceed 240 days (or 180 days for non-union employees). Sick leave is not vested except upon death or upon reaching the age of 55, at which time, the State is liable for 25 percent of the employee’s accumulated sick leave. In addition, some State agencies permit employees to accumulate compensatory leave rather than paying overtime.
The government-wide, proprietary, and fiduciary fund financial statements recognize the expense and accrued liability when vacation and compensatory leave is earned or when sick leave is expected to be paid as termination payments.
L. Fund Balance. In the governmental fund financial statements, fund balances are classified as nonspendable, restricted or unrestricted (committed, assigned or unassigned). Restricted represents those portions of fund balance where constraints placed on the resources are either externally imposed or imposed by law through constitutional provisions or enabling legislation. Committed fund balance represents amounts that can only be used for specific purposes pursuant to constraints imposed by formal action of the Legislature (the highest level of decision making authority for the State by passing a legislative bill), such as an appropriation or legislation. Assigned fund balance is constrained by the Legislature’s intent to be used for specific purposes, by directive of the Executive Committee of the Legislature or in some cases by legislation. Unrestricted balances are used in the order listed above when expenditures are made which could be used from any of those categories. The State considers restricted balances to have been spent when both restricted and unrestricted fund balance is available.
The State maintains a stabilization fund reported as committed fund balance. The Cash Reserve Fund is part of the General Fund and was established by State Statute to be used as a reserve when the cash balance of the General Fund is insufficient to meet General Fund current obligations and for legislatively mandated transfers to other funds. Additions to the fund are made when actual General Fund revenues exceed certified projections for a fiscal year.
M. Interfund Transactions. Interfund services provided and used are accounted for as revenues, expenditures or expenses in the funds involved. Transactions that constitute reimbursements to a fund for expenditures/expenses initially made from it that are properly applicable to another fund, are recorded as expenditures/expenses in the reimbursing fund and as reductions of expenditures/expenses in the fund that is reimbursed. All other interfund trans�actions are reported as transfers.
The effect of interfund activity has been eliminated from the government-wide financial statements.
N. Use of Estimates. The preparation of financial statements in conformity with accounting principles generally accepted in the United States of America requires management to make estimates and assumptions that affect the reported amounts of assets and liabilities at fiscal year-end and revenues and expenses during the reporting period. Actual results could differ from those estimates.
2. Deposits and Investments PortfolioListed below is a summary of the deposit and investment portfolio that comprises the Cash and Cash Equivalents and Investments on the June 30, 2012 basic financial statements. All securities purchased or held must either be in the custody of the State or deposited with an agent in the State’s name.
Deposits. At June 30, 2012, the carrying amounts of the State’s deposits were $35,590 and the bank balances were $85,683. All bank balances were covered by federal depository insurance or by collateral held by the State’s agent in the State’s name.
State Statutes require that the aggregate amount of collateral securities deposited by a bank with the State Treasurer shall be at least one hundred two percent of the amount of public funds deposited in that bank, less the amount insured by the Federal Deposit Insurance Corporation. The State Treasurer had compensating balance agreements with various banks totaling $22,116 at June 30, 2012.
Investments. State Statute Section 72-1239.01 authorizes the appointed members of the Nebraska Investment Council to act with the care, skill, prudence, and diligence under the circumstances then prevailing that a prudent person acting in like capacity and familiar with such matters would use in the conduct of an enterprise of a like character and with like aims by diversifying the investments of the State. Certain State entities are also allowed by statute to invest in real estate and other investments.

State of Nebraska (dollars expressed in thousands)
49
The investment amounts for some funds presented in the fiduciary fund financial statements reflected audited financial statements for the period ended December 31, 2011. The investment risk disclosures presented below for fiduciary funds represent risks as of June 30, 2012.
The primary government’s investments at June 30, 2012 are presented below. All investments are presented by investment type and debt securities are presented with effective duration presented in years.
PRIMARY GOVERNMENT INVESTMENTS AT JUNE 30, 2012
GOVERNMENTAL AND BUSINESS-TYPE ACTIVITIES FIDUCIARY FUNDS FAIR EFFECTIVE FAIR EFFECTIVE VALUE DURATION VALUE DURATION Debt Securities U.S. Treasury Notes and Bonds $ 767,311 4.71 $ 252,619 7.25 U.S. Treasury Bills 7,666 0.80 7,286 0.55 Government Agency Securities 935,989 2.31 21,782 5.58 Corporate Bonds 1,186,990 4.15 608,572 4.73 International Bonds 4,683 5.51 173,548 8.63 Mortgages 79,109 2.77 565,252 3.64 Asset Backed Securities 1,716 2.62 59,497 4.77 Commingled Funds 150,881 4.40 886,431 4.30 Municipal Bonds 9,351 12.00 42,876 11.50 Guaranteed Investment Contracts 7,254 2.75 117,990 2.75 Short Term Investments 202,550 0.27 189,955 0.09 3,353,500 2,925,808 Other Investments Equity Securities 63,963 1,347,932 Private Equity 35,244 346,126 Commingled Funds 603,466 7,287,061 Options (140) (565) Private Real Estate 16,556 244,282 U.S. Treasury Investment Pool 325,522 - Less: Component Unit Investment in State Investment Pool (646,468) -
Total Investments 3,751,643 12,150,644 Securities Lending Short-term Collateral Investment Pool 189,616 391,719
Total $ 3,941,259 $ 12,542,363
Interest Rate Risk. Interest rate risk is the risk that changes in interest rates will adversely affect the fair value of an investment. Duration is a measure of a debt investment’s exposure to fair value changes arising from changes in interest rates. It uses the present value of cash flows, weighted for those cash flows as a percentage of the investments full price. The State has contracts with investment managers that limit the effective duration to within one year of the effective duration of the benchmark.
Credit Risk of Debt Securities. Credit risk is the risk that an issuer or other counterparty to an investment will not fulfill its obligations. The State has contracts with investment managers that set minimum average quality ratings for its core fixed income accounts at an A and BB- for its high yield fixed income account. The primary government’s rated debt investments as of June 30, 2012 were rated by Standard and Poor’s and/or an equivalent national rating organization and the ratings are presented below using the Standard and Poor’s rating scale.

State of Nebraska (dollars expressed in thousands)
50
GOVERNMENTAL AND BUSINESS-TYPE ACTIVITIES INVESTMENTS AT JUNE 30, 2012 FAIR QUALITY RATINGS VALUE AAA AA A BBB BB B UNRATEDGovt Agency Securities $ 935,989 $ - $ 884,549 $ - $ - $ - $ - $ 51,440 Corporate Bonds 1,186,990 84,443 315,815 691,223 70,372 6,823 4,641 13,673 International Bonds 4,683 1,789 967 445 1,356 126 - - Mortgages 79,109 6,794 61,990 3,400 961 308 474 5,182 Asset Backed Securities 1,716 17 1,182 16 149 - 352 - Commingled Funds 150,881 - - - - - - 150,881 Short Term Investments 202,550 - - 3,081 - - - 199,469 Municipal Bonds 9,351 1,184 2,734 4,461 - 819 153 -
FIDUCIARY FUND INVESTMENTS AT JUNE 30, 2012 FAIR QUALITY RATINGS VALUE AAA AA A BBB BB B UNRATEDGovt Agency Securities $ 21,953 $ 331 $ 14,024 $ 5,374 $ - $ - $ 489 $ 1,735 Corporate Bonds 618,563 56,972 63,495 206,404 131,243 74,678 62,345 23,426 International Bonds 186,919 89,874 31,980 33,613 23,196 5,915 1,058 1,283 Mortgages 563,809 50,325 392,777 17,938 4,987 2,276 1,896 93,610 Asset Backed Securities 59,300 31,196 10,713 5,640 5,352 229 2,231 3,939 Commingled Funds 909,491 - - - - - - 909,491 Short Term Investments 194,641 - - - - - - 194,641 Municipal Bonds 42,665 10,314 10,737 19,162 1,186 1,266 - -
Concentration of Credit Risk. Concentration of credit risk is the risk of loss attributed to the magnitude of a government’s investment in a single issuer. The State has contracts with investment managers that limit the maximum amount for an issuer, excluding U.S. Treasury, U.S. Agency, mortgages and non-U.S. sovereign issuers, to 5 percent of the total account.
At June 30, 2012, the primary government, except fiduciary funds, had debt securities investments with more than 5 percent of total investments in Federal Farm Credit Bank (10 percent) and Federal Home Loan Bank (10 percent). At June 30, 2012, fiduciary funds had no investments that exceeded 5 percent or more of total investments.
Securities Lending Transactions. The State participates in securities lending transactions, where securities are loaned to broker-dealers and banks with a simultaneous agreement to return the collateral for the same securities in the future. The State’s primary custodial bank administers the securities lending program and receives collateral in the form of cash, United States government or government agency obligations, sovereign debt rated A or better, or convertible bonds at least equal in value to the market value of the loaned securities. Securities on loan at year end consisted of United States government obligations, equity securities, corporate bonds, and non-US fixed income. At year-end, the State had no credit risk exposure to borrowers because the amounts the State owes the borrowers exceed the amounts the borrowers owe the State. The collateral securities cannot be pledged or sold by the State unless the borrower defaults. There are no restrictions on the amount of securities that can be loaned, and there were no losses resulting from borrower default during the year. Either the State or the borrowers can terminate all securities loans on demand. Cash collateral is invested in one of the lending agent’s short-term investment pools that had average durations from 26 to 40 days. Because loans were terminable at will, their duration did not generally match the duration of the investments made with cash collateral. The custodian indemnifies the State against default by the borrower of securities, but does not indemnify against the default by an issuer of a security held in the short term investment funds where cash collateral is invested.
Foreign Currency Risk. Foreign currency risk is the risk that changes in exchange rates will adversely affect the fair value of an investment or a deposit. The State does not have a formal policy to limit foreign currency risk. Primary Government exposure to foreign currency risk is presented on the following tables.

State of Nebraska (dollars expressed in thousands)
51
GOVERNMENTAL AND BUSINESS-TYPE ACTIVITIES FOREIGN CURRENCY AT JUNE 30, 2012 SHORT TERM EQUITY DEBT Currency INVESTMENTS SECURITIES SECURITIES Australian Dollar $ 9 $ 305 $ 301 Brazilian Real 293 99 502 Canadian Dollar 2 632 1,788 Columbian Peso - - 98 Czech Koruna - 59 - Danish Krone - 90 - Euro Currency 31 7,212 1,028 Hong Kong Dollar 11 625 - Indonesian Rupiah 2 95 - Japanese Yen 44 3,553 - Mexican Peso 156 427 501 New Zeland Dollar - - 180 Norwegian Krone 2 93 - Philippine Peso 1 66 - Polish Zloty - 118 - Pound Sterling 14 3,595 - Singapore Dollar 10 597 - South African Rand 1 30 - South Korean Won 4 759 - Swedish Krona - 378 - Swiss Franc 2 2,081 - Thailand Baht 1 190 -
Total $ 583 $ 21,004 $ 4,398
FIDUCIARY FUND FOREIGN CURRENCY AT JUNE 30, 2012
SHORT TERM EQUITY DEBT Currency INVESTMENTS SECURITIES SECURITIES Australian Dollar $ 618 $ 15,739 $ 7,232 Brazilian Real 1,064 5,337 3,515 Canadian Dollar 584 24,821 32,975 Chilean Peso - - 476 Columbian Peso - - 650 Czech Koruna - 1,244 - Danish Krone - 4,050 - Euro Currency 6,289 226,561 116,649 Hong Kong Dollar 263 27,519 - Indonesian Rupiah - 2,318 - Japanese Yen 1,822 100,215 25,567 Malaysian Ringgit 110 - 5,350 Mexican Peso 1,129 4,586 15,722 New Zealand Dollar - - 1,182 Norwegian Krone 73 2,114 - Philippine Peso 36 - 1,272 Polish Zloty 270 2,450 - Pound Sterling 1,187 125,604 27,672 Singapore Dollar 77 11,098 - South African Rand 74 3,387 - South Korean Won 14 30,353 - Swedish Krona 219 13,813 8,879 Swiss Franc 17 56,307 - Thailand Baht 17 13,303 -
Total $ 13,863 $ 670,819 $ 247,141

State of Nebraska (dollars expressed in thousands)
52
Derivative Financial Instruments. Derivative instruments are financial contracts whose underlying values depend on the values of one or more underlying assets, reference rates or financial indices. These instruments are used primarily to enhance performance and reduce the volatility of the portfolio, in accordance with the Investment Council-approved Derivatives Policy. The State invests in futures contracts, options and swaps. Futures represent commitments to purchase or sell securities or money market instruments at a future date and at a specific price. Options represent the right, but not the obligation, to purchase or sell securities at a future date and at a specific price. The State invests in these contracts related to securities of the U.S. Government or Government Agency obligations based on reference notes, which are traded on organized exchanges, thereby minimizing the State’s credit risk. The net change in the contract value is settled daily in cash with the exchanges. Swaps represent an exchange of streams of payments over time according to specified terms. All changes in fair value of derivatives are reflected in Investment Income and the fair value of derivatives at June 30, 2012 is reflected in Investments. The fair value balances and notional amounts of investment derivative instruments outstanding at June 30, 2012, classified by type, and the changes in fair value of such derivative instruments for the year then ended are as follows:
DERIVATIVE INVESTMENTS AT JUNE 30, 2012
GOVERNMENTAL AND BUSINESS-TYPE ACTIVITIES
Change in Derivative Fair Value Fair Value Notional
Credit Default Swap $ 75 $ (244) $ 11,913 Fixed Income Futures - 1,093 8,400 Fixed Income Options (139) 253 (21,800) Futures Options - 28 - FX Forwards 101 548 23,401 Interest Rate Swap 991 (1,621) 21,722 Warrants - - 1
DERIVATIVE INVESTMENTS AT JUNE 30, 2012
FIDUCIARY FUND
Change in Derivative Fair Value Fair Value Notional
Credit Default Swap $ 222 $ (1,333) $ 24,751 Fixed Income Futures - 3,636 32,704 Fixed Income Options (587) 1,097 (97,400) Futures Options - 113 - FX Forwards (146) 8,066 250,138 Interest Rate Swap 3,387 (7,303) 85,963 Rights - 1 - Warrants 1 - 6
The change in fair value denotes the net realized and unrealized gains and losses recognized during the period. The fair value of the derivative instruments at June 30, 2012, denotes the market value, with the exception of FX Forwards, which denotes the net realized and unrealized gains and losses recognized during the period. Furthermore, the notional amount for Futures and Options was calculated as contract size times the number of contracts. The State is exposed to credit risk on derivative instruments that are in asset positions. To minimize its exposure to loss related to credit risk, it is the Nebraska Investment Council’s policy to require counterparty collateral posting provisions in its non-exchange-traded derivative instruments. These terms require full collateralization of the fair value of derivative instruments in asset positions. Collateral posted is to be in the form of U.S. Treasury securities held by a third-party custodian. The Plans have never failed to access collateral when required.
The aggregate fair value of derivative instruments in asset positions at June 30, 2012, was $1,089 for Governmental and Business-Type Activities and $5,471 for the Fiduciary Fund. This represents the maximum loss that would be recognized at the reporting date if all counterparties failed to perform as contracted. There is no collateral held or liabilities included in netting arrangements with those counterparties; therefore, the net exposure to credit risk is $6,560. Although the State executes derivative instruments with various counterparties, there is net exposure to credit risk of approximately 63 percent for the Governmental and Business-Type Activities and 47 percent for the Fiduciary Fund, held with three counterparties. The counterparties are rated A or AA.
The State is exposed to interest rate risk on its interest rate swaps. Interest rate swaps are agreements between two counterparties to exchange future cash flows. These are generally fixed versus variable flows, and can be either received or paid. These swaps are used to adjust interest rate and yield curve exposure and substitute for physical securities. Long swap positions (receive fixed)

State of Nebraska (dollars expressed in thousands)
53
increase exposure to long-term interest rates; short positions (pay fixed) decrease exposure. Counterparty risk is limited to monthly exchanged or netted cash flows. All of the State’s interest rate swaps were fixed with a LIBOR (London Interbank Offered Rate) or SIFMA (Securities Industry and Financial Markets Association) reference rate. Foreign currency risk for derivative instruments at June 30, 2012 are as follows:
DERIVATIVES FOREIGN CURRENCY AT JUNE 30, 2012 GOVERNMENTAL AND BUSINESS-TYPE ACTIVITIES Forward Fixed Income Currency Swaps Contracts Options Brazilian Real $ 293 $ 43 $ - Canadian Dollar - 7 - Yuan Renminbi - (19) - Euro Currency 191 62 - Pound Sterling 363 4 - Mexican Peso 144 (6) - Norwegian Krone - 12 -
Total $ 991 $ 103 $ -
DERIVATIVES FOREIGN CURRENCY AT JUNE 30, 2012 FIDUCIARY FUND Forward Fixed Income Currency Swaps Contracts Options Australian Dollar $ - $ 169 $ - Brazilian Real 1,064 130 - Canadian Dollar - (106) - Swiss Franc - 42 - Yuan Ranminbi - 71 - Danish Krone - (55) - Euro Currency 489 683 - Pound Sterling 1,521 26 - Japanese Yen - (822) - South Korean Won - 90 - Mexican Peso 590 (490) - Norwegian Krone - 132 - New Zealand Dollar - 27 - Polish Zloty - 40 - Swedish Krona - (115) - Singapore Dollar - 31 - Thailand Baht - 1 -
Total $ 3,664 $ (146) $ -
Synthetic Guaranteed Investment Contracts (SGICs). In the fiduciary fund, Defined Contribution Plans, employees are eligible to participate in SGICs. The contracts provided an average crediting rate of 3.40 percent during fiscal year 2012. The fair value of these contracts is $120,637, and the contract value is $115,717. The fair value of the wrap contract was $0. The effective duration and credit rating for the investments underlying the SGICs are presented below. There was no foreign currency risk for the underlying investments.
EFFECTIVE FAIR Investments Underlying SGICs Quality Ratings at June 30, 2012
DURATION VALUE AAA AA A BBB BB UNRATED Asset Backed Securities 1.87 $ 13,021 $ 12,893 $ 5 $ 118 $ 5 $ - $ - Corporate Bonds 3.98 48,002 2,772 8,884 21,836 13,802 304 404 Government Agency Securities 4.04 12,616 - 10,184 409 - - 2,023 International Bonds 2.58 2,792 1,215 835 742 - - - Mortgages 1.87 27,666 4,601 21,084 773 - - 1,208 Short Term Investments - 1,501 - - - - - 1,501 US Treasury Notes 5.08 15,039 - - - - - 15,039
$ 120,637

State of Nebraska (dollars expressed in thousands)
54
A reconciliation of deposits and investments for the State to the basic financial statements at June 30, 2012 is as follows:
Disclosure Regarding Deposits and Investments: Total Investments $ 16,483,622 Carrying amount of Deposits 35,590
Total $ 16,519,212 Statement of Net Assets: Cash and Cash Equivalents $ 605,061 Investments 3,053,250 Restricted Cash and Cash Equivalents 13,941 Securities Lending Collateral 189,616 Statement of Fiduciary Net Assets: Cash and Cash Equivalents 114,981 Investments 12,150,644 Securities Lending Collateral 391,719
Total $ 16,519,212
3. ReceivablesReceivables are reflected net of allowances for doubtful accounts. The following are such related allowances listed by major fund at June 30, 2012:
Governmental Activities: General Fund $ 89,780 Federal Fund 9,025 Health and Social Services Fund 3,810
Total Governmental Activities $ 102,615
Business-type Activities: Unemployment Insurance $ 6,812
Total Business-type Activities $ 6,812
Of the taxes and other receivables, $30,494 and $18,527, respectively, is not expected to be collected within 60 days of the fiscal year end. These amounts have been offset by deferred revenue in the General Fund and the Health and Social Services Fund. The majority of the loans receivable balance is not expected to be collected in the next year.

State of Nebraska (dollars expressed in thousands)
55
4. Capital AssetsCapital asset activity for the year ended June 30, 2012 was as follows:
BEGINNING ENDING BALANCE INCREASES DECREASES BALANCE Governmental activities: Capital assets, not being depreciated: Land $ 553,391 $ 4,223 $ - $ 557,614 Infrastructure 6,985,740 26,069 - 7,011,809 Construction in progress 69,763 15,702 3,391 82,074 Total capital assets, not being depreciated 7,608,894 45,994 3,391 7,651,497 Capital assets, being depreciated: Buildings and improvements 538,163 36,349 11,099 563,413 Equipment 435,284 45,505 23,654 457,135 Total capital assets, being depreciated 973,447 81,854 34,753 1,020,548 Less accumulated depreciation for: Buildings and improvements 246,889 15,806 5,694 257,001 Equipment 325,323 45,187 21,974 348,536 Total accumulated depreciation 572,212 60,993 27,668 605,537 Total capital assets, being depreciated, net 401,235 20,861 7,085 415,011
Governmental activities capital assets, net $ 8,010,129 $ 66,855 $ 10,476 $ 8,066,508 Business-type activities: Unemployment Insurance Equipment, being depreciated $ 1,067 $ - $ 306 $ 761 Less accumulated depreciation 906 74 306 674 Total Unemployment Insurance, net 161 (74) - 87 Nonmajor Enterprise Funds Capital assets, not being depreciated: Land 315 - - 315 Total capital assets, not being depreciated 315 - - 315 Capital assets, being depreciated: Buildings and improvements 6,945 - - 6,945 Equipment 5,229 135 79 5,285 Total capital assets, being depreciated 12,174 135 79 12,230 Less accumulated depreciation for: Buildings and improvements 1,848 174 - 2,022 Equipment 3,993 282 44 4,231 Total accumulated depreciation 5,841 456 44 6,253 Total capital assets, being depreciated, net 6,333 (321) 35 5,977 Total Nonmajor Enterprise, net 6,648 (321) 35 6,292
Business-type activities capital assets, net $ 6,809 $ (395) $ 35 $ 6,379
Current period depreciation expense was charged to functions of the primary government as follows:
Governmental activities: General Government $ 17,752 Conservation of Natural Resources 1,305 Culture – Recreation 2,158 Economic Development and Assistance 279 Education 11,685 Health and Social Services 1,315 Public Safety 10,286 Regulation of Business and Professions 867 Transportation 15,346
Total depreciation expense - Governmental activities $ 60,993

State of Nebraska (dollars expressed in thousands)
56
Construction Commitments. At June 30, 2012, the State had contractual commitments of approximately $734,435 for various highway and building projects. Funding of these future expenditures is expected to be provided as follows:
Federal funds $ 365,372 State funds 356,999 Local funds 12,064
$ 734,435
Most of these commitments will not be reflected as capital asset increases when they are paid because the State is using the modified approach to account for infrastructure. Under this method, capital asset additions are only reflected when improvements expand the capacity or efficiency of an asset.
5. Interfund BalancesDue To/From Other Funds at June 30, 2012 consists of the following:
DUE TO Health Nonmajor Nonmajor Internal General Highway Federal and Social Governmental Enterprise Service Pension DUE FROM Fund Fund Fund Services Funds Funds Funds Trust TOTALSGeneral Fund $ - $ 219 $ 42 $ 152 $ 487 $ 166 $ 4,529 $ 30,029 $ 35,624 Highway Fund - - 109 2 131 314 605 - 1,161 Federal Fund 60,171 236 - 1,465 2,659 67 3,974 3 68,575 Health and Social Services - 4 - - 1 18 483 - 506 Permanent School Fund - - - - - - 9 - 9 Nonmajor Governmental Funds 791 47 76 7 52 21 6,036 - 7,030 Nonmajor Enterprise Funds - 11 - - - - 93 - 104 Internal Service Funds - 55 - - 62 50 641 - 808 Pension Trust - - - - - - 57 - 57 Private Purpose Trust - - - - 1 1 6 - 8
TOTALS $ 60,962 $ 572 $ 227 $ 1,626 $ 3,393 $ 637 $ 16,433 $ 30,032 $ 113,882
Interfund receivables and payables are recorded for: (1) short term borrowings, (2) billing for services provided between agencies, (3) pension liabilities, and (4) risk management liabilities. All interfund receivables and payables are considered short term in nature.
Interfund transfers at June 30, 2012 consist of the following:
TRANSFERRED TO: Health Nonmajor General Highway and Social Governmental Fund Fund Services Funds TOTALS TRANSFERRED FROM: General Fund $ - $ - $ - $ 47,210 $ 47,210 Highway Fund - - - 6,560 6,560 Federal Fund - - - 5,400 5,400 Health & Social Services Fund 3,400 - - - 3,400 Nonmajor Governmental Funds 44,717 24,292 50 2,969 72,028 Nonmajor Enterprise Funds - - 856 35,219 36,075
TOTALS $ 48,117 $ 24,292 $ 906 $ 97,358 $ 170,673
Transfers are used to (1) move revenues from the fund that statutes require to collect them to the fund that statutes require to expend them, (2) use unrestricted revenues collected in the General Fund to finance various programs accounted for in other funds in accordance with budgetary authorizations, and (3) move profits from the State Lottery Fund as required by law.
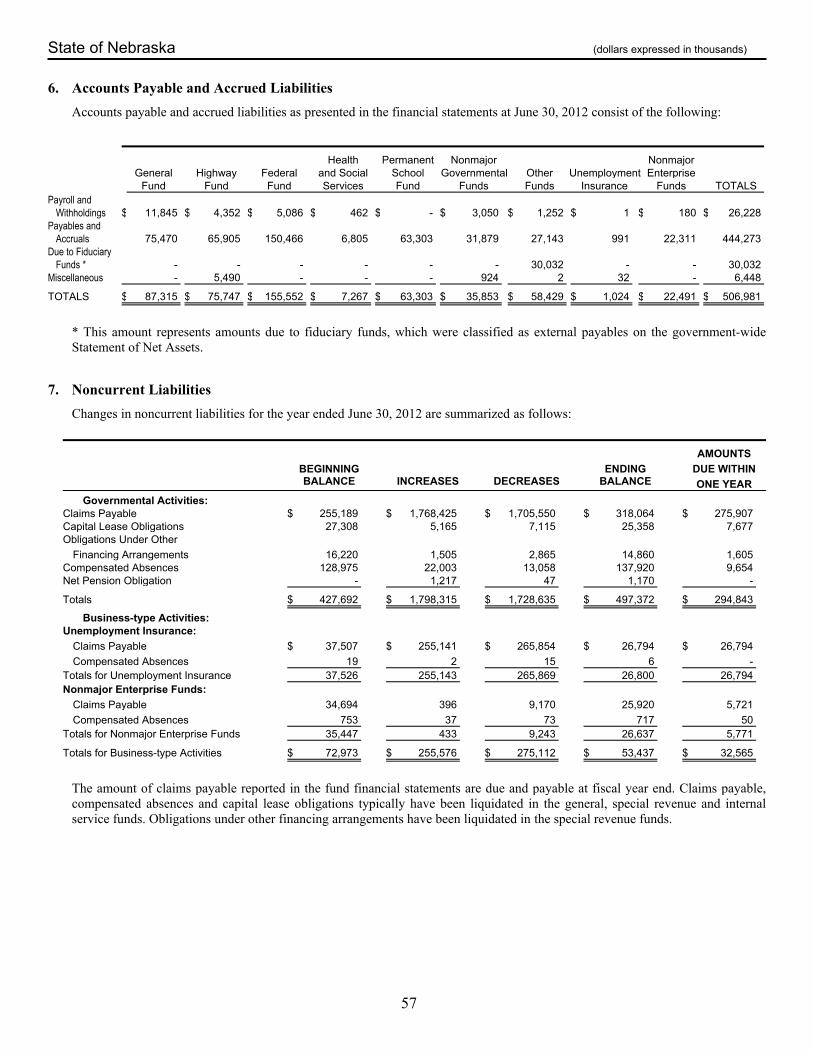
State of Nebraska (dollars expressed in thousands)
57
6. Accounts Payable and Accrued LiabilitiesAccounts payable and accrued liabilities as presented in the financial statements at June 30, 2012 consist of the following:
Health Permanent Nonmajor Nonmajor General Highway Federal and Social School Governmental Other Unemployment Enterprise Fund Fund Fund Services Fund Funds Funds Insurance Funds TOTALSPayroll and Withholdings $ 11,845 $ 4,352 $ 5,086 $ 462 $ - $ 3,050 $ 1,252 $ 1 $ 180 $ 26,228 Payables and Accruals 75,470 65,905 150,466 6,805 63,303 31,879 27,143 991 22,311 444,273 Due to Fiduciary Funds * - - - - - - 30,032 - - 30,032 Miscellaneous - 5,490 - - - 924 2 32 - 6,448
TOTALS $ 87,315 $ 75,747 $ 155,552 $ 7,267 $ 63,303 $ 35,853 $ 58,429 $ 1,024 $ 22,491 $ 506,981
* This amount represents amounts due to fiduciary funds, which were classified as external payables on the government-wide Statement of Net Assets.
7. Noncurrent LiabilitiesChanges in noncurrent liabilities for the year ended June 30, 2012 are summarized as follows:
AMOUNTS BEGINNING ENDING DUE WITHIN BALANCE INCREASES DECREASES BALANCE ONE YEAR Governmental Activities: Claims Payable $ 255,189 $ 1,768,425 $ 1,705,550 $ 318,064 $ 275,907 Capital Lease Obligations 27,308 5,165 7,115 25,358 7,677 Obligations Under Other Financing Arrangements 16,220 1,505 2,865 14,860 1,605 Compensated Absences 128,975 22,003 13,058 137,920 9,654 Net Pension Obligation - 1,217 47 1,170 -
Totals $ 427,692 $ 1,798,315 $ 1,728,635 $ 497,372 $ 294,843
Business-type Activities: Unemployment Insurance: Claims Payable $ 37,507 $ 255,141 $ 265,854 $ 26,794 $ 26,794 Compensated Absences 19 2 15 6 - Totals for Unemployment Insurance 37,526 255,143 265,869 26,800 26,794 Nonmajor Enterprise Funds: Claims Payable 34,694 396 9,170 25,920 5,721 Compensated Absences 753 37 73 717 50 Totals for Nonmajor Enterprise Funds 35,447 433 9,243 26,637 5,771
Totals for Business-type Activities $ 72,973 $ 255,576 $ 275,112 $ 53,437 $ 32,565
The amount of claims payable reported in the fund financial statements are due and payable at fiscal year end. Claims payable, compensated absences and capital lease obligations typically have been liquidated in the general, special revenue and internal service funds. Obligations under other financing arrangements have been liquidated in the special revenue funds.

State of Nebraska (dollars expressed in thousands)
58
8. Lease CommitmentsCapital and Operating Leases. The State leases land, office facilities, equipment, and other assets under both capital and operating leases. Although the lease terms may vary, all leases are subject to annual appropriation by the Legislature.
The minimum annual lease payments (principal and interest) and the present value of future minimum payments for capital leases as of June 30, 2012 are as follows:
GOVERNMENTAL YEAR ACTIVITIES 2013 $ 8,088 2014 6,382 2015 4,753 2016 3,684 2017 2,232 2018-2022 1,263 Total Minimum Payments 26,402 Less: Interest and executory costs 1,044 Present value of net minimum payments $ 25,358
Capital leases have been recorded at the present value of the future minimum lease payments as of the date of their inception. The following is an analysis of property and equipment under capital leases as of June 30, 2012:
GOVERNMENTAL ACTIVITIES Equipment $ 36,624 Less: accumulated depreciation (16,481)
Carrying value $ 20,143
The minimum annual lease payments for operating leases as of June 30, 2012 are as follows:
GOVERNMENTAL YEAR ACTIVITIES 2013 $ 6,737 2014 2,136 2015 1,684 2016 1,473 2017 1,012 2018-2022 3,904 2023-2027 865 2028-2032 365
Total $ 18,176
Primary Government operating lease payments for the year ended June 30, 2012 totaled $13,800.
Lessor Transactions. The State also is a lessor of property, primarily farm land leased by the Board of Educational Lands and Funds to farmers and ranchers. At June 30, 2012, the State owned approximately 1.3 million acres of land that was under lease. Under the terms of the leases, the annual payments are subject to change based on annual market analysis. Total rents of $38,960 were received under these and other lease agreements for the year ended June 30, 2012.

State of Nebraska (dollars expressed in thousands)
59
9. Obligations Under Other Financing ArrangementsThe State has entered into special financing arrangements with certain public benefit corporations to fund certain grant programs. Under these arrangements, the State enters into an agreement with a public benefit corporation, the Nebraska Investment Finance Authority (NIFA), whereby NIFA issues bonds, the proceeds of which, along with federal capitalization grants, are used to provide loans to various municipalities and local units of government in Nebraska that qualify for such loans. Such loans are used for improvements to wastewater and drinking water treatment facilities. Funds to repay NIFA come from the municipalities and units of government to which the loans are given.
A summary of the future minimum contractual obligations including interest at rates from 0.90 percent to 5.70 percent is as follows:
YEAR PRINCIPAL INTEREST TOTAL 2013 $ 1,605 $ 610 $ 2,215 2014 1,665 545 2,210 2015 1,715 476 2,191 2016 2,530 386 2,916 2017 1,395 294 1,689 2018-2022 4,750 749 5,499 2023-2027 1,200 92 1,292
Total $ 14,860 $ 3,152 $ 18,012
10. Contingencies and CommitmentsGrants and Contracts. The State participates in various federally assisted grant programs that are subject to review and audit by the grantor agencies. Entitlements to these resources are generally conditional upon compliance with the terms and conditions of grant agreements and applicable federal regulations, including the expenditure of resources for allowable purposes. Any disallowance resulting from a federal audit may become a liability of the State.
All State agencies including institutions of higher education are required to comply with various federal regulations issued by the U.S. Office of Management and Budget if such agency or institution is a recipient of federal grants, contracts, or other sponsored agreements. Certain agencies or institutions may not be in total compliance with these regulations. Failure to comply may result in questions concerning the allowability of related direct and indirect charges pursuant to such agreements. Management believes that the ultimate disallowance pertaining to these regulations, if any, will not be material to the overall financial condition of the State.
Litigation. The State is named as a party in legal proceedings that occur in the normal course of governmental operations. Such litigation includes, but is not limited to, claims asserted against the State arising from alleged torts, alleged breaches of contract, condemnation proceedings and other alleged violations of State and Federal laws. It is not possible at the present time to estimate ultimate outcome or liability, if any, of the State for these proceedings. It is the State’s opinion that the ultimate liability for these and other proceedings is not expected to have a material adverse effect on the State’s financial position.
The State also has been named as a party in legal proceedings that occur outside of the normal course of governmental operations. It is not possible at the present time to estimate the ultimate outcome or liability, if any, of the State for all of these proceedings. The effects of this litigation, if any, will be reflected in future years, as the uncertainties regarding the litigation are determined.
The State is in non–binding arbitration with Kansas and Colorado relating to water usage in the Republican River Basin. It is alleged that Nebraska is consuming more water than is allowed under the Republican River Compact of 1942. The Special Master issued a preliminary report on January 9, 2013 that recommended judgment be entered against Nebraska and in favor of Kansas in the amount of $5,000.
The State is being sued involving a $12,000 gain on sale of investments that was received in a prior fiscal year. It is not possible at the present time to determine the outcome of this proceeding.
11. Risk ManagementThrough Administrative Services, the State maintains insurance and self-insurance programs. Workers’ compensation, employee health care, general liability and employee indemnification are generally self-insured. However, the State does carry surety bonds for constitutional officers. Motor vehicle liability is insured with a $5,000 limit and a $300 retention per occurrence (the self-insured retention for vehicular pursuit is $1,000) and employee dishonesty is insured with a $11,000 limit with a $25 deduction per loss. The State insures against property damage, maintaining a policy with a $250,000 limit and a $200 deductible per occurrence. The State also carries some insurance for personal property damage. Settled claims have not exceeded this commercial insurance coverage in any of the past three years. Administrative Services provides life insurance for eligible State employees. These activities are reported in the Risk Management Internal Service Fund.

State of Nebraska (dollars expressed in thousands)
60
Claims liabilities are reported when it is probable that a loss has occurred and the amount of that loss can be reasonably estimated. Liabilities include an amount for claims that have been incurred but not reported. The balance of claims liabilities is determined by an analysis of past, current, and future estimated loss experience. Because actual claims liabilities depend on such factors as inflation, changes in legal doctrines and damage awards, the process used in computing claims liability may not result in an exact amount. Claims liabilities are evaluated periodically to take into consideration recently settled claims, the frequency of claims, and other economic and social factors, but do not include non- incremental claims adjustment expenses.
The liability for workers’ compensation is recorded as a claims payable of $52,873 at a discounted rate of 2.0 percent ($6,493).
Changes in the balances of claims liabilities of the Risk Management Internal Service Fund during the years ended June 30, 2012, and 2011, were as follows:
Fiscal Year 2012 2011 Beginning Balance $ 64,947 $ 63,730 Current Year Claims and Changes in Estimates (197,788) (188,747) Claim Payments 198,474 189,964
Ending Balance $ 65,633 $ 64,947
12. Pension Plans
Plans Administered by the Public Employees Retirement BoardThe Public Employees Retirement Board (the Board), which consists of eight members, was created in 1971 to administer the Nebraska retirement plans then in existence. Those plans were the School, State Employees’, Judges’ and State Patrol plans. In October of 1973, the Board assumed the administration of the Nebraska Counties Retirement System. The plans have been created in accordance with Internal Revenue Code, Sections 401(a) and 414(h). Contribution and benefit provisions are established by State law and may only be amended by the State Legislature.
The Board prepares separate reports for the defined contribution plans and for the defined benefit plans. Copies of these reports that include financial statements and required supplementary information for the plans may be obtained by writing to Public Employees Retirement Systems, P.O. Box 94816, Lincoln, NE 68509-4816, or by calling 402-471-2053.
Basis of Accounting. The financial statements of the plans are prepared using the accrual basis of accounting, and are included as pension trust funds in the accompanying financial statements. Plan member and employer contributions are recognized in the period in which the contributions are due. Benefits and refunds are recognized when due and payable in accordance with the terms of each plan.
Plan Description and Funding Policy. By State law, there is to be an equitable allocation of expenses among the retirement systems administered by the Board, and all expenses shall be provided from the investment income earned by the various retirement funds. Following is a summary of each of these plans:
State Employees’ Retirement. The single-employer plan became effective by statute on January 1, 1964. Prior to January 1, 2003, the plan consisted of a defined contribution plan that covered employees of the State. Effective January 1, 2003, a cash balance benefit was added to the State Employees Retirement Act. The cash balance benefit is a type of defined benefit plan. Each member employed and participating in the retirement system prior to January 1, 2003, elected to either continue participation in the defined contribution option or begin participation in the cash balance benefit. All new members of the plan on and after January 1, 2003, become members of the cash balance benefit. Under the cash balance benefit, a member upon attainment of age 55, regardless of service, receives a retirement allowance equal to the accumulated employee and employer cash balance accounts, including interest credits, annuitized for payment. Members have options on how to receive the payment. The amounts presented in the accompanying financial statements for the State Employees’ Retirement System are for the year ended December 31, 2011.
Participation in the plan is required for all permanent full-time employees upon employment. Each member contributes 4.8 percent of their compensation. The State matches a member’s contribution at a rate of 156 percent.
As of December 31, 2011, there were 16,119 active members, 4,878 inactive members, and 737 retirees or beneficiaries receiving benefits. Members contributed $31,225 and the State contributed $48,686 during the year ended December 31, 2011, which was equal to required contributions.
County Employees’ Retirement. In 1973, the State Legislature brought the County Employees’ Retirement System under the administration of the Board. This cost-sharing multiple-employer plan covers employees of 91 of the 93 counties and several county health districts. Douglas and Lancaster counties have separate retirement plans for their employees by State law. Prior to January 1, 2003, the plan consisted of a defined contribution plan. Effective January 1, 2003, a cash balance benefit was

State of Nebraska (dollars expressed in thousands)
61
added to the County Employees Retirement Act. The cash balance benefit is a type of defined benefit plan. Each member employed and participating in the retirement system prior to January 1, 2003 elected to either continue participation in the defined contribution option or begin participation in the cash balance benefit. All new members of the Plan on and after January 1, 2003 become members of the cash balance benefit. Under the cash balance benefit, a member upon attainment of age 55, regardless of service, receives a retirement allowance equal to the accumulated employee and employer cash balance accounts, including interest credits, annuitized for payment. Members have options on how to receive the payment. The amounts presented in the accompanying financial statements for the County Employees’ Retirement System are for the year ended December 31, 2011.
Participation in the plan is required of all full-time employees upon employment and of all full-time elected officials upon taking office. Part-time employees may elect voluntary participation upon reaching age 20. Effective April 2011, the age requirement for permanent part time employees decreased to age 18. Part-time elected officials may exercise the option to join. County employees and elected officials contribute four and one half percent of their total compensation. Commissioned law enforcement personnel in participating counties with less than 85,000 inhabitants contribute an extra one percent, or a total of five and one half percent of their total compensation. Commissioned law enforcement personnel in participating counties with a population in excess of 85,000 inhabitants contribute an extra two percent, or a total of six and one half percent of their total compensation. The counties match a member’s contribution at a rate of 150 percent for the first four and one half percent and 100 percent for the extra one and two percent.
As of December 31, 2011, there were 7,652 active members, 2,099 inactive members, and 315 retirees or beneficiaries receiving benefits. Members contributed $11,499 and counties contributed $17,007 during the year ended December 31, 2011, which was equal to required contributions.
School Retirement. The School Retirement System is a cost-sharing multiple-employer defined benefit pension plan with 271 participating school districts.
All regular public school employees in Nebraska, other than those who have their own retirement plan, are members of the system. The benefits are based on both service and contributions or salary.
The State’s contribution is based on an annual actuarial valuation. The employees’ contribution was 8.28% of their compensation through August 31, 2011, increasing to 8.88% from September 1, 2011 through August 31, 2012. On September 1, 2012 the rate increased to 9.78%. The school district’s contribution is 101 percent of the employees’ contribution.
Judges’ Retirement. The Judges’ Retirement System is a single-employer defined benefit pension system. The membership includes judges and associate judges employed by the State for the Supreme Court, Court of Appeals, District Courts, Workers’ Compensation Court, County Courts, and Juvenile Courts. Benefits are based on both service and final average salary. Benefits vest when the judge takes office.
Members’ contributions, a portion of court fees collected, and the State’s contribution, which is based on an annual actuarial valuation, fund the plan. The judges contribute between one and nine percent of their salary.
State Patrol Retirement. The State Patrol Retirement System is a single-employer defined benefit pension system for officers of the patrol. The benefits are based on a percentage of the final average salary multiplied by years of service, not to exceed 75 percent of the average salary. Participation is mandated upon employment.
Members are required to contribute nineteen percent of their monthly salary, and State Patrol contributes nineteen percent. The State’s contribution is based on an annual actuarial valuation.
The following tables provide the schedules of funding progress, which present multi-year trend information about whether the actuarial values of plan assets are increasing or decreasing over time relative to the actuarial accrued liability for benefits, and the primary actuarial assumptions used in the most recent actuarial reports for the defined benefit plans. Information presented for the cost-sharing plans is for the plan as a whole.

State of Nebraska (dollars expressed in thousands)
62
SCHEDULES OF FUNDING PROGRESS (a) (b) (b-a) (a/b) (c) ((b-a)/c) Unfunded UAAL (Excess of Actuarial Actuarial Actuarial AAL (UAAL) Assets over AAL) Valuation Value of Accrued (Excess of Assets Funded Covered as a Percentage Date Assets Liability (AAL) over AAL) Ratio Payroll of Covered PayrollState Cash Balance 12/31/2011 $ 743,971 $ 813,286 $ 69,315 91.5% $ 458,827 15.1% 12/31/2010 714,132 762,680 48,548 93.6 449,206 10.8 12/31/2009 670,592 714,409 43,817 93.9 454,776 9.6 County Cash Balance 12/31/2011 $ 220,663 $ 240,195 $ 19,532 91.9% $ 193,269 10.1% 12/31/2010 206,036 221,080 15,044 93.2 183,968 8.2 12/31/2009 187,110 196,773 9,663 95.1 177,732 5.4 School 6/30/2012 $ 7,358,964 $ 9,609,157 $ 2,250,193 76.6% $ 1,593,185 141.2% 6/30/2011 7,267,497 9,039,745 1,772,248 80.4 1,590,226 111.4 6/30/2010 7,040,909 8,542,119 1,501,210 82.4 1,543,931 97.2 Judges' 6/30/2012 $ 125,928 $ 137,465 $ 11,537 91.6% $ 19,005 60.7% 6/30/2011 125,191 128,265 3,074 97.6 18,182 16.9 6/30/2010 121,406 121,309 (97) 100.1 18,773 (0.5) State Patrol 6/30/2012 $ 282,811 $ 362,299 $ 79,488 78.1% $ 25,794 308.2% 6/30/2011 279,193 339,554 60,361 82.2 26,195 230.4 6/30/2010 273,307 321,901 48,594 84.9 26,766 181.6
STATE COUNTY STATE CASH CASH SCHOOL JUDGES' PATROL BALANCE BALANCE RETIREMENT RETIREMENT RETIREMENTActuarial Valuation Date 12/31/2011 12/31/2011 6/30/2012 6/30/2012 6/30/2012 Actuarial Cost Method Entry Age Entry Age Entry Age Entry Age Entry Age Amortization Method Level dollar Level dollar Level dollar Level dollar Level dollar amount, closed amount, closed amount, closed amount, closed amount, closed Amortization Period 23 years 24 years 27 years 30 years 28 years Asset Valuation Method 5 year 5 year 5 year 5 year 5 year smoothed market smoothed market smoothed market smoothed market smoothed market Actuarial Assumptions: Investment Rate of Return ** 7.75% 7.75% 8.0% 8.0% 8.0% Projected Salary Increases ** 4.5% to 5.9% 5.5% to 15.0% 4.0% to 9.0% 4.0% 4.0% to 9.5% ** Includes assumed inflation of 3.25% per year for School, Judges', Patrol and 3.5% for State and County

State of Nebraska (dollars expressed in thousands)
63
THREE - YEAR TREND INFORMATION ANNUAL PENSION COST (APC) PERCENTAGE NET YEAR COUNTIES OF APC PENSION ENDED AND SCHOOLS STATE TOTAL CONTRIBUTED OBLIGATION State Cash Balance 12/31/2011 $ - $ 31,188 $ 31,188 - 100% $ - 12/31/2010 - 30,837 30,837 100% - 12/31/2009 - 30,327 30,327 100% - County Cash Balance 12/31/2011 $ 11,908 $ - $ 11,908 100% $ - 12/31/2010 11,379 - 11,379 100% - 12/31/2009 10,559 - 10,559 100% - School 6/30/2012 $ 145,582 $ 46,896 $ 192,478 88% $ - 6/30/2011 135,328 41,747 177,075 89% - 6/30/2010 128,845 21,380 150,225 100% - Judges' 6/30/2012 $ - $ 3,484 $ 3,484 100% $ - 6/30/2011 - 3,580 3,580 100% - 6/30/2010 - 3,615 3,615 100% - State Patrol 6/30/2012 $ - $ 7,730 $ 7,730 100% $ 1,170 6/30/2011 - 7,173 7,173 83% 1,217 6/30/2010 - 6,260 6,260 100% -
The Net Pension Obligation for the State Patrol Retirement plan decreased by $47 in 2012. The Annual Pension Cost for the State Patrol Retirement plan was calculated by taking the Annual Required Contribution of $7,775, adding $97 interest calculated on the Net Pension Obligation, and subtracting the $142 adjustment to the Annual Required Contribution.
Equal Retirement Benefit Fund. On January 1, 1984, the Equal Retirement Benefit Fund (ERBF) was created for the State and County Retirement Plans. Each State agency and county participating in the retirement system makes contributions to the fund at least annually, in addition to regular retirement contributions.
Upon retirement, any member with an accumulated account balance based on contributions made prior to January 1, 1984, has the option to convert to an annuity, at which time they are eligible to receive a benefit from the fund. The ERBF benefit is included in the member’s regular retirement annuity and is included in the benefit payments reported in the financial statements. The balances of the funds are not included in the financial statements. As of December 31, 2011, there was a balance of $483 in the State ERBF and a balance of $288 in the County ERBF.
13. Bonds PayableArticle XIII of the State's Constitution prohibits the State from incurring debt in excess of one hundred thousand dollars. However, there is a provision in the State’s Constitution that permits the issuance of revenue bonds for: (1) construction of highways; and (2) construction of water conservation and management structures. At June 30, 2012, there was no outstanding debt for either of these purposes.
The component units issue bonds for various purposes including student housing, parking facilities and special event centers. Net revenues from student housing and dining facilities, special student fees and parking facilities fees are pledged to secure the appropriate issues.
All outstanding bond issues of the University of Nebraska Facilities Corporation and the Nebraska State College Facilities Corporation are general obligations of these corporations. They are separate legal entities that are not subject to State constitutional restrictions on the incurrence of debt, which may apply to the State itself.
BALANCE INTEREST JUNE 30, BONDS PAYABLE RATES 2012 COMPONENT UNITS University of Nebraska 1.00%-6.00% $ 671,305 Nebraska State Colleges 0.30%-5.05% 49,128
Component Units Total $ 720,433

State of Nebraska (dollars expressed in thousands)
64
COMPONENT UNITS DEBT SERVICE REQUIREMENTS TO MATURITY YEAR PRINCIPAL INTEREST TOTAL 2013 $ 43,565 $ 30,237 $ 73,802 2014 56,611 29,542 86,153 2015 42,512 27,811 70,323 2016 43,033 26,137 69,170 2017 40,838 23,675 64,513 2018 - 2022 198,874 91,466 290,340 2023 - 2027 103,840 59,522 163,362 2028 - 2032 82,390 37,155 119,545 2033 - 2037 65,025 19,775 84,800 2038 - 2042 39,650 4,915 44,565 2043 - 2047 4,095 102 4,197
Total $ 720,433 $ 350,337 $ 1,070,770

65
REQUIRED SUPPLEMENTARY INFORMATION

See independent auditors' report 66
State of NebraskaREQUIRED SUPPLEMENTARY INFORMATIONBUDGETARY COMPARISON SCHEDULEGENERAL FUNDFor the Year Ended June 30, 2012 (Dollars in Thousands) GENERAL FUND ORIGINAL FINAL VARIANCE WITH BUDGET BUDGET ACTUAL FINAL BUDGETREVENUES: Taxes $ 3,501,539 $ 3,553,440 $ 3,606,329 $ 52,889 Federal Grants and Contracts 850 850 850 - Sales and Charges 21,460 21,460 21,460 - Other 35,616 35,616 35,616 - TOTAL REVENUES 3,559,465 3,611,366 3,664,255 52,889 EXPENDITURES: Current: General Government 257,724 256,757 239,160 17,597 Conservation of Natural Resources 46,072 48,123 31,897 16,226 Culture – Recreation 6,008 6,067 5,305 762 Economic Development and Assistance 14,689 14,689 7,231 7,458 Education 1,712,543 1,711,254 1,676,787 34,467 Health and Social Services 1,389,873 1,397,343 1,245,105 152,238 Public Safety 262,205 270,678 236,603 34,075 Regulation of Business and Professions 4,457 4,467 3,620 847 Transportation - - - - Capital Projects 5,463 5,463 - 5,463 TOTAL EXPENDITURES 3,699,034 3,714,841 3,445,708 269,133
Excess (Deficiency) of Revenues Over (Under) Expenditures (139,569) (103,475) 218,547 322,022 OTHER FINANCING SOURCES (USES): Transfers In 231,584 231,584 231,584 - Transfers Out (339,366) (339,366) (339,366) - Other 188 188 188 - TOTAL OTHER FINANCING SOURCES (USES) (107,594) (107,594) (107,594) - Net Change in Fund Balance (247,163) (211,069) 110,953 322,022 FUND BALANCES, JULY 1 813,487 813,487 813,487 -
FUND BALANCES, JUNE 30 $ 566,324 $ 602,418 $ 924,440 $ 322,022 A reconciliation of the budgetary basis versus GAAP fund balance for the General Fund as of June 30, 2012, follows (dollars in thousands): Actual Fund Balances, budgetary basis, June 30, 2012 General $ 495,562 Cash Reserve 428,878 Budgetary fund balances 924,440 DIFFERENCES DUE TO BASIS OF ACCOUNTING: Record taxes receivable 368,445 Record tax refund liability (360,733) Record State contributions due pension funds (29,991) Record claims payable (122,480) Record other net accrued receivables and liabilities 35,117
GAAP fund balance, June 30, 2012 $ 814,798

See independent auditors' report 67
State of NebraskaREQUIRED SUPPLEMENTARY INFORMATIONBUDGETARY COMPARISON SCHEDULECASH FUNDSFor the Year Ended June 30, 2012 (Dollars in Thousands) CASH FUNDS ORIGINAL FINAL VARIANCE WITH BUDGET BUDGET ACTUAL FINAL BUDGETREVENUES: Taxes $ 107,341 $ 107,341 $ 107,341 $ - Federal Grants and Contracts 390,920 390,920 390,920 - Sales and Charges 533,298 533,298 533,298 - Other 199,401 199,401 199,401 - TOTAL REVENUES 1,230,960 1,230,960 1,230,960 - EXPENDITURES: Current: General Government 189,789 193,943 182,722 11,221 Conservation of Natural Resources 118,012 120,573 55,096 65,477 Culture – Recreation 28,992 29,236 19,933 9,303 Economic Development and Assistance 52,999 54,146 23,300 30,846 Education 688,065 704,934 441,966 262,968 Health and Social Services 173,871 174,150 121,248 52,902 Public Safety 51,039 51,059 34,524 16,535 Regulation of Business and Professions 150,073 148,673 115,287 33,386 Transportation 800,036 808,851 720,005 88,846 Capital Projects 75,424 75,423 24,347 51,076 TOTAL EXPENDITURES 2,328,300 2,360,988 1,738,428 622,560
Excess (Deficiency) of Revenues Over (Under) Expenditures (1,097,340) (1,130,028) (507,468) 622,560 OTHER FINANCING SOURCES (USES): Transfers In 1,153,958 1,153,958 1,153,958 - Transfers Out (577,530) (577,530) (577,530) - Other 3,937 3,937 3,937 - TOTAL OTHER FINANCING SOURCES (USES) 580,365 580,365 580,365 - Net Change in Fund Balance (516,975) (549,663) 72,897 622,560 FUND BALANCES, JULY 1 899,524 899,524 899,524 -
FUND BALANCES, JUNE 30 $ 382,549 $ 349,861 $ 972,421 $ 622,560 A reconciliation of the budgetary basis versus GAAP fund balance for the Major Funds as of June 30, 2012, follows (dollars in thousands): Actual Fund Balances, budgetary basis, June 30, 2012 Cash $ 972,421 Construction 33,027 Federal 91,577 Revolving 332,948 Budgetary fund balances 1,429,973 Unbudgeted fund balances 1,612,573 Non-major fund balances (1,208,086) Differences due to basis of accounting (549,305)
GAAP fund balance, June 30, 2012 $ 1,285,155 Actual Fund Balances of Major Funds, June 30, 2012 Highway $ 262,172 Federal 9,202 Health and Social Services 451,270 Permanent School 562,511
GAAP fund balance, June 30, 2012 $ 1,285,155

See independent auditors' report 68
State of NebraskaREQUIRED SUPPLEMENTARY INFORMATIONBUDGETARY COMPARISON SCHEDULECONSTRUCTION FUNDSFor the Year Ended June 30, 2012 (Dollars in Thousands) CONSTRUCTION FUNDS ORIGINAL FINAL VARIANCE WITH BUDGET BUDGET ACTUAL FINAL BUDGETREVENUES: Taxes $ - $ - $ - $ - Federal Grants and Contracts - - - - Sales and Charges - - - - Other 431 431 431 - TOTAL REVENUES 431 431 431 - EXPENDITURES: Current: General Government - - - - Conservation of Natural Resources - - - - Culture – Recreation - - - - Economic Development and Assistance - - - - Education 18,298 18,298 802 17,496 Health and Social Services - - - - Public Safety - - - - Regulation of Business and Professions - - - - Transportation - - - - Capital Projects 19,136 19,685 12,850 6,835 TOTAL EXPENDITURES 37,434 37,983 13,652 24,331
Excess (Deficiency) of Revenues Over (Under) Expenditures (37,003) (37,552) (13,221) 24,331 OTHER FINANCING SOURCES (USES): Transfers In 25,000 25,000 25,000 - Transfers Out - - - - Other - - - - TOTAL OTHER FINANCING SOURCES (USES) 25,000 25,000 25,000 - Net Change in Fund Balance (12,003) (12,552) 11,779 24,331 FUND BALANCES, JULY 1 21,248 21,248 21,248 -
FUND BALANCES, JUNE 30 $ 9,245 $ 8,696 $ 33,027 $ 24,331

See independent auditors' report 69
State of NebraskaREQUIRED SUPPLEMENTARY INFORMATIONBUDGETARY COMPARISON SCHEDULEFEDERAL FUNDSFor the Year Ended June 30, 2012 (Dollars in Thousands) FEDERAL FUNDS ORIGINAL FINAL VARIANCE WITH BUDGET BUDGET ACTUAL FINAL BUDGETREVENUES: Taxes $ - $ - $ - $ - Federal Grants and Contracts 2,658,853 2,658,853 2,658,853 - Sales and Charges 18,709 18,709 18,709 - Other 5,892 5,892 5,892 - TOTAL REVENUES 2,683,454 2,683,454 2,683,454 - EXPENDITURES: Current: General Government 7,872 9,642 7,837 1,805 Conservation of Natural Resources 107,475 110,818 71,806 39,012 Culture – Recreation 5,433 7,796 3,003 4,793 Economic Development and Assistance 96,628 110,562 72,327 38,235 Education 1,196,443 1,202,149 974,093 228,056 Health and Social Services 1,689,875 1,696,946 1,446,819 250,127 Public Safety 180,691 195,578 106,069 89,509 Regulation of Business and Professions 5,021 11,433 4,246 7,187 Transportation - - - - Capital Projects 144 144 - 144 TOTAL EXPENDITURES 3,289,582 3,345,068 2,686,200 658,868
Excess (Deficiency) of Revenues Over (Under) Expenditures (606,128) (661,614) (2,746) 658,868 OTHER FINANCING SOURCES (USES): Transfers In 33,166 33,166 33,166 - Transfers Out (33,376) (33,376) (33,376) - Other 5,017 5,017 5,017 - TOTAL OTHER FINANCING SOURCES (USES) 4,807 4,807 4,807 - Net Change in Fund Balance (601,321) (656,807) 2,061 658,868 FUND BALANCES, JULY 1 89,516 89,516 89,516 -
FUND BALANCES, JUNE 30 $ (511,805) $ (567,291) $ 91,577 $ 658,868

See independent auditors' report 70
State of NebraskaREQUIRED SUPPLEMENTARY INFORMATIONBUDGETARY COMPARISON SCHEDULEREVOLVING FUNDSFor the Year Ended June 30, 2012 (Dollars in Thousands) REVOLVING FUNDS ORIGINAL FINAL VARIANCE WITH BUDGET BUDGET ACTUAL FINAL BUDGETREVENUES: Taxes $ - $ - $ - $ - Federal Grants and Contracts 1,999 1,999 1,999 - Sales and Charges 554,554 554,554 554,554 - Other 174,581 174,581 174,581 - TOTAL REVENUES 731,134 731,134 731,134 - EXPENDITURES: Current: General Government 221,645 221,872 176,239 45,633 Conservation of Natural Resources - - - - Culture – Recreation - - - - Economic Development and Assistance 555 555 497 58 Education 850,475 917,325 503,918 413,407 Health and Social Services - - - - Public Safety 20,407 20,407 14,450 5,957 Regulation of Business and Professions - - - - Transportation - - - - Capital Projects - - - - TOTAL EXPENDITURES 1,093,082 1,160,159 695,104 465,055
Excess (Deficiency) of Revenues Over (Under) Expenditures (361,948) (429,025) 36,030 465,055 OTHER FINANCING SOURCES (USES): Transfers In 50,951 50,951 50,951 - Transfers Out (50,808) (50,808) (50,808) - Other 2,157 2,157 2,157 - TOTAL OTHER FINANCING SOURCES (USES) 2,300 2,300 2,300 - Net Change in Fund Balance (359,648) (426,725) 38,330 465,055 FUND BALANCES, JULY 1 294,618 294,618 294,618 -
FUND BALANCES, JUNE 30 $ (65,030) $ (132,107) $ 332,948 $ 465,055

71
State of NebraskaNOTES TO REQUIRED SUPPLEMENTARY INFORMATIONFor the Year Ended June 30, 2012
Budgetary ProcessThe State’s biennial budget cycle ends on June 30 of the odd-numbered years. By September 15, prior to a biennium, all State agencies, including the university and colleges, must submit their budget requests for the biennium beginning the following July 1. The requests are submitted on forms that show estimated funding requirements by programs, subprograms, and activities. The Governor reviews the agency requests, establishes priorities, and presents the Legislature with one or more pieces of legislation covering the biennium. The Legislature holds hearings on the Governor’s proposed budget, adopts changes and presents final legislation to the Governor. The Governor can either: a) approve the appropriation bill in its entirety, b) veto the bill, or c) line item veto certain sections of the bill. Any vetoed bill or line item can be overridden by a three-fifths majority of the Legislature.
The approved appropriations set spending limits by fund type for programs within each agency. These limits may include up to five budgetary fund types. Thus, the legal level of control is fund type within program within agency. The central accounting system maintains this control. A separate publication titled “Annual Budgetary Report” shows the detail of this legal level of control. This publication is available from the State Accounting Division of Administrative Services.
Appropriations are made for each fiscal year of the biennium; balances at the end of the first fiscal year are carried over into the second fiscal year, unless directed otherwise by the Legislature. For most appropriations, balances lapse at the end of the biennium.
The budgetary fund types used by the State differ from those presented in the basic financial statements. The budgetary funds, which are listed below, are generally segregated by revenue sources. Of these seven fund types, only the first five are subject to the spending limits set by the appropriations bills. The General Fund is the only major fund that corresponds to a budgetary fund type, so the General Fund is the only major fund that has a budget.
General Fund. To account for activities funded by general tax dollars, primarily sales and income taxes.
Cash Reserve Fund. This is part of the General Fund, and is used to account for financial resources to be used as a reserve for the General Fund if the General Fund balance should become inadequate to meet current obligations. The Cash Reserve Fund is part of the budgetary basis fund balance.
Cash Funds. To account for the financing of goods or services provided by a State agency to individuals or entities outside State government on a cost-reimbursement basis, and to account for the revenues and expenditures related to highway construction.
Construction Funds. To account for financial resources to be used for the acquisition or construction of major capital facilities.
Federal Funds. To account for the financial resources related to the receipt and disbursement of funds generated from the federal government as a result of grants and contracts, except for federal highway monies accounted for in the Cash Funds.
Revolving Funds. To account for the financing of goods or services provided by one State agency to another State agency on a cost-reimbursement basis.
Trust Funds. To account for assets held in a trustee capacity.
Distributive Funds. To account for assets held as an agent for individuals, private organizations, and other governments and/or other funds.
The accompanying basic financial statements were prepared by converting budgetary fund data into the fund format required by GAAP. The cash basis of accounting is used for all budgetary fund types.
All State budgetary expenditures for the general, cash, construction, federal and revolving fund types are made pursuant to appropriations that may be amended by the Legislature, upon approval by the Governor. State agencies may allocate appropriations between object of expenditure accounts, except that personal service expenditures that exceed limitations contained in the appropriations bill require Legislative amendment. Any changes in appropriations are made through an annual deficit bill or other legislation. Appropriations from the federal fund type are considered to be estimated and the Legislature has approved an administrative procedure for changing them. During fiscal year 2012, the Legislature passed deficit appropriation bills that increased the allowable expenditure level in several of the programs.
For the year ended June 30, 2012, there were no budgetary programs in which expenditures exceeded appropriations. Revenues are not budgeted for any funds except for General Fund tax revenues.

See independent auditors' report 72
State of NebraskaREQUIRED SUPPLEMENTARY INFORMATIONINFORMATION ABOUT INFRASTRUCTURE ASSETS REPORTED USING THE MODIFIED APPROACH For the Year Ended June 30, 2012
As allowed by GASB Statement No. 34, Basic Financial Statements – and Management’s Discussion and Analysis for State and Local Governments, the State has adopted an alternative process for recording depreciation expense on selected infrastructure assets. Under this alternative method, referred to as the modified approach, the State expenses certain maintenance and preservation costs and does not report depreciation expense. Assets accounted for under the modified approach include approximately 10,000 miles of highway and bridges the State is responsible to maintain.
In order to utilize the modified approach, the State is required to: Maintain an asset management system that includes an up-to-date inventory of eligible infrastructure assets. Perform condition assessments of eligible assets and summarize the results using a measurement scale. Estimate each year the annual amount to maintain and preserve the assets at the condition level established and disclosed by
the State. Document that the assets are being preserved approximately at, or above, the established condition level.
Measurement Scale
The Nebraska Department of Roads uses the Nebraska Serviceability Index (NSI) to measure and monitor pavement conditions. The NSI is a numerical pavement rating scale used to monitor the condition on a scale ranging from 0 to 100 with 0 being the worst and 100 being the best. NSI represents the condition of the pavement at the time of measurement and is based on pavement’s surface distresses. Surface distresses include cracking, patching, roughness, rutting, and faulting.
Established Condition Level
It is the policy of the Nebraska Department of Roads to maintain at least an overall NSI system rating of 72 or above.
Assessed Condition
The State assesses conditions on a calendar year basis. The following table reports the percentage of pavements meeting ratings of “Very Good”, “Good”, “Fair”, and “Poor”. This condition index is used to classify roads in very good (90-100), good (70-89), fair (50-69), and poor (0-49).
Calendar Year 2011 2010 2009 2008 2007 2006 Very Good 33% 31% 32% 32% 33% 42% Good 41% 44% 47% 47% 49% 38% Fair 23% 22% 19% 19% 17% 19% Poor 3% 3% 2% 2% 1% 1%
Overall System Rating 80 80 81 82 82 83
Estimated and Actual Costs to Maintain
The following table presents the State’s estimate of spending necessary to preserve and maintain the roads at, or above, the established condition level cited above, and the actual amount spent during the past fiscal years (amounts in millions). The actual cost of system preservation is greater than estimated as a result of maintaining the system at a NSI level higher than the base level established for GASB-34 purposes (72 base versus 80 actual).
Fiscal Year 2013 2012 2011 2010 2009 2008 Estimated $ 313 $ 288 $ 267 $ 211 $ 206 $ 155 Actual 278 218 270 239 208 Difference (10) (49) 59 33 53

73
COMBINING FINANCIAL STATEMENTS

74

75
NONMAJOR GOVERNMENTAL FUNDS
SPECIAL REVENUE FUNDSSpecial revenue funds are used to account for specific revenues that are legally restricted to expenditure for particular purposes.
Licensing and Regulation. This fund accounts for all activities of agencies, boards, and commissions whose primary function is licensing individuals and regulating industry and professions. This includes a diverse group of professions such as abstracters, medical professions, barbers, engineers, architects and accountants.
Economic Development. This fund accounts for activities to develop and promote the growth of industry, agriculture, commerce and tourism, and utilization of resources within Nebraska.
Airport Development. This fund accounts for the activities relating to aircraft fuels tax, which is administered by the Department of Aeronautics for the support and maintenance of public airports.
Game and Parks. This fund accounts for the activities related to the Nebraska Game and Parks Commission, which is responsible for the development and preservation of the fish and wildlife resources of Nebraska, and operation and administration of the State park system.
Environmental Quality. This fund accounts for the activities related to the Department of Environmental Quality, which is responsible for the protection of Nebraska’s air, land, and water resources.
Energy Conservation. This fund accounts for activities relating to the oil and gas severance taxes as well as energy conservation and development activities. The State Energy Office is responsible for providing technical assistance on energy conservation and development, distributing funds for the school weatherization program, and administering and distributing federal funds provided to the State in the area of energy efficiency.
Other Special Revenue. This fund accounts for various other revenues that must be used for specific purposes.
CAPITAL PROJECTS FUNDThe Capital Projects Fund is used to account for construction of buildings financed with tax dollars.
PERMANENT FUNDSPermanent funds are used to report resources that are legally restricted to the extent that only earnings, not principal, may be used for purposes that support the reporting government’s programs.
Aeronautics Trust Fund. This fund receives proceeds from the sale of state-owned airfields. Investment income is used to pay for expenses of the Department of Aeronautics.
Nebraska Veterans’ Aid Fund. This fund accounts for the investment activity of a General Fund contribution made in a prior year. Earnings on the investment are used to provide emergency financial assistance to eligible veterans and dependents.
Permanent Endowment Fund. This fund receives the proceeds of sales of land and investments endowed to the University by the Federal Government. This fund is under the control of the Board of Educational Lands and Funds, which is a part of the primary government. Income on these funds is used for support and maintenance of the University.
Agriculture Endowment Fund. This fund receives the proceeds of sales of land and investments endowed to the University’s Agriculture College by the Federal Government. This fund is under the control of the Board of Educational Lands and Funds, which is a part of the primary government. Income from this fund is used for support and maintenance of the College of Agriculture and Natural Resources.
Other Permanent Funds. Normal School Endowment, J.J. Soukup, and Miscellaneous Permanent Trust.
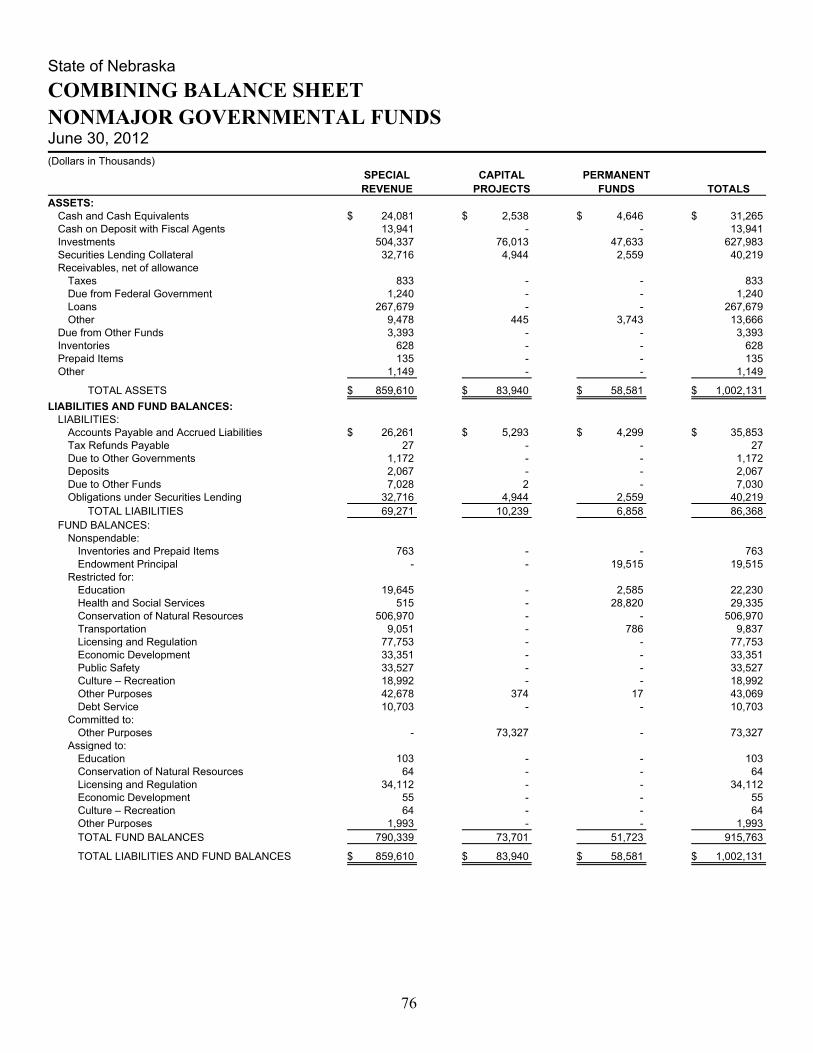
76
State of NebraskaCOMBINING BALANCE SHEETNONMAJOR GOVERNMENTAL FUNDSJune 30, 2012 (Dollars in Thousands) SPECIAL CAPITAL PERMANENT REVENUE PROJECTS FUNDS TOTALSASSETS: Cash and Cash Equivalents $ 24,081 $ 2,538 $ 4,646 $ 31,265 Cash on Deposit with Fiscal Agents 13,941 - - 13,941 Investments 504,337 76,013 47,633 627,983 Securities Lending Collateral 32,716 4,944 2,559 40,219 Receivables, net of allowance Taxes 833 - - 833 Due from Federal Government 1,240 - - 1,240 Loans 267,679 - - 267,679 Other 9,478 445 3,743 13,666 Due from Other Funds 3,393 - - 3,393 Inventories 628 - - 628 Prepaid Items 135 - - 135 Other 1,149 - - 1,149
TOTAL ASSETS $ 859,610 $ 83,940 $ 58,581 $ 1,002,131 LIABILITIES AND FUND BALANCES: LIABILITIES: Accounts Payable and Accrued Liabilities $ 26,261 $ 5,293 $ 4,299 $ 35,853 Tax Refunds Payable 27 - - 27 Due to Other Governments 1,172 - - 1,172 Deposits 2,067 - - 2,067 Due to Other Funds 7,028 2 - 7,030 Obligations under Securities Lending 32,716 4,944 2,559 40,219 TOTAL LIABILITIES 69,271 10,239 6,858 86,368 FUND BALANCES: Nonspendable: Inventories and Prepaid Items 763 - - 763 Endowment Principal - - 19,515 19,515 Restricted for: Education 19,645 - 2,585 22,230 Health and Social Services 515 - 28,820 29,335 Conservation of Natural Resources 506,970 - - 506,970 Transportation 9,051 - 786 9,837 Licensing and Regulation 77,753 - - 77,753 Economic Development 33,351 - - 33,351 Public Safety 33,527 - - 33,527 Culture – Recreation 18,992 - - 18,992 Other Purposes 42,678 374 17 43,069 Debt Service 10,703 - - 10,703 Committed to: Other Purposes - 73,327 - 73,327 Assigned to: Education 103 - - 103 Conservation of Natural Resources 64 - - 64 Licensing and Regulation 34,112 - - 34,112 Economic Development 55 - - 55 Culture – Recreation 64 - - 64 Other Purposes 1,993 - - 1,993 TOTAL FUND BALANCES 790,339 73,701 51,723 915,763
TOTAL LIABILITIES AND FUND BALANCES $ 859,610 $ 83,940 $ 58,581 $ 1,002,131

77
State of NebraskaCOMBINING STATEMENT OF REVENUES, EXPENDITURES, AND CHANGES IN FUND BALANCESNONMAJOR GOVERNMENTAL FUNDSFor the Year Ended June 30, 2012 (Dollars in Thousands) SPECIAL CAPITAL PERMANENT REVENUE PROJECTS FUNDS TOTALSREVENUES: Sales and Use Taxes $ 4,050 $ - $ - $ 4,050 Petroleum Taxes 13,023 - - 13,023 Excise Taxes 46,678 9,163 - 55,841 Business and Franchise Taxes 16,437 - - 16,437 Other Taxes 5,847 - - 5,847 Federal Grants and Contracts 41,675 - - 41,675 Licenses, Fees and Permits 130,374 - - 130,374 Charges for Services 31,956 9 - 31,965 Investment Income 17,991 2,432 1,920 22,343 Rents and Royalties 14,335 7,903 - 22,238 Surcharge 52,743 - - 52,743 Other 30,332 - - 30,332 TOTAL REVENUES 405,441 19,507 1,920 426,868 EXPENDITURES: Current: General Government 69,605 - 2 69,607 Conservation of Natural Resources 58,127 - - 58,127 Culture – Recreation 20,053 - - 20,053 Economic Development and Assistance 24,088 - - 24,088 Education 19,342 - 98 19,440 Higher Education - Colleges and University - 12,666 - 12,666 Health and Social Services 1,382 - 794 2,176 Public Safety 36,245 - - 36,245 Regulation of Business and Professions 114,192 - - 114,192 Transportation 24,471 - 3 24,474 Capital Projects - 28,123 - 28,123 Debt Service: Principal 2,865 - - 2,865 Interest 684 - - 684 TOTAL EXPENDITURES 371,054 40,789 897 412,740 Excess (Deficiency) of Revenues Over (Under) Expenditures 34,387 (21,282) 1,023 14,128 OTHER FINANCING SOURCES (USES): Transfers In 72,358 25,000 - 97,358 Transfers Out (71,455) - (573) (72,028) Proceeds from Other Financing Arrangements 1,505 - - 1,505 TOTAL OTHER FINANCING SOURCES (USES) 2,408 25,000 (573) 26,835 Net Change in Fund Balances 36,795 3,718 450 40,963 FUND BALANCES, JULY 1 753,544 69,983 51,273 874,800
FUND BALANCES, JUNE 30 $ 790,339 $ 73,701 $ 51,723 $ 915,763

78
State of Nebraska
COMBINING BALANCE SHEET NONMAJOR SPECIAL REVENUE FUNDS June 30, 2012 (Dollars in Thousands) LICENSING AND ECONOMIC AIRPORT REGULATION DEVELOPMENT DEVELOPMENTASSETS: Cash and Cash Equivalents $ 3,605 $ 1,007 $ 6,939 Cash on Deposit with Fiscal Agents - - - Investments 109,794 31,817 - Securities Lending Collateral 7,141 2,069 - Receivables, net of allowance: Taxes 698 - 128 Due from Federal Government - - - Loans - 144 1,947 Other 3,083 1,146 134 Due from Other Funds 20 - 41 Inventories - - - Prepaid Items 2 - 3 Other - 1,130 -
TOTAL ASSETS $ 124,343 $ 37,313 $ 9,192 LIABILITIES AND FUND BALANCES LIABILITIES: Accounts Payable and Accrued Liabilities $ 5,650 $ 1,260 $ 123 Tax Refunds Payable 27 - - Due to Other Governments 9 - - Deposits 930 1,130 - Due to Other Funds 213 33 15 Obligations under Securities Lending 7,141 2,069 - TOTAL LIABILITIES 13,970 4,492 138 FUND BALANCES: Nonspendable: Inventories and Prepaid Items 2 - 3 Restricted for: Education - - - Health and Social Services - - - Conservation of Natural Resources - - - Transportation - - 9,051 Licensing and Regulation 77,649 - - Economic Development - 32,766 - Public Safety - - - Culture – Recreation - - - Other Purposes - - - Debt Service - - - Assigned to: Education - - - Conservation of Natural Resources - - - Licensing and Regulation 32,722 - - Economic Development - 55 - Culture – Recreation - - - Other Purposes - - - TOTAL FUND BALANCES 110,373 32,821 9,054 TOTAL LIABILITIES AND FUND BALANCES $ 124,343 $ 37,313 $ 9,192

79
OTHER
GAME AND ENVIRONMENTAL ENERGY SPECIAL PARKS QUALITY CONSERVATION REVENUE TOTALS
$ 3,186 $ 3,867 $ 651 $ 4,826 $ 24,081 - 10,703 - 3,238 13,941 93,427 122,141 20,628 126,530 504,337 6,065 7,944 1,342 8,155 32,716 - 7 - - 833 1,154 - - 86 1,240 - 245,189 15,349 5,050 267,679 2,121 996 174 1,824 9,478 1,163 - - 2,169 3,393 - - - 628 628 41 - - 89 135 - - - 19 1,149
$ 107,157 $ 390,847 $ 38,144 $ 152,614 $ 859,610 $ 8,266 $ 240 $ 4 $ 10,718 $ 26,261 - - - - 27 8 - 1,000 155 1,172 - - - 7 2,067 244 28 6 6,489 7,028 6,065 7,944 1,342 8,155 32,716 14,583 8,212 2,352 25,524 69,271 41 - - 717 763 - - - 19,645 19,645 - - - 515 515 80,799 371,868 35,792 18,511 506,970 - - - - 9,051 - - - 104 77,753 - - - 585 33,351 - - - 33,527 33,527 11,734 - - 7,258 18,992 - - - 42,678 42,678 - 10,703 - - 10,703 - - - 103 103 - 64 - - 64 - - - 1,390 34,112 - - - - 55 - - - 64 64 - - - 1,993 1,993 92,574 382,635 35,792 127,090 790,339 $ 107,157 $ 390,847 $ 38,144 $ 152,614 $ 859,610

80
State of Nebraska
COMBINING STATEMENT OF REVENUES, EXPENDITURES, AND CHANGES IN FUND BALANCES NONMAJOR SPECIAL REVENUE FUNDS For the Year Ended June 30, 2012 (Dollars in Thousands) LICENSING AND ECONOMIC AIRPORT REGULATION DEVELOPMENT DEVELOPMENTREVENUES: Sales and Use Taxes $ - $ 4,050 $ - Petroleum Taxes 10,699 551 1,422 Excise Taxes 11,180 26,605 - Business and Franchise Taxes 4,852 152 - Other Taxes - - - Federal Grants and Contracts 215 5 22,002 Licenses, Fees and Permits 64,706 155 7 Charges for Services 2,472 201 719 Investment Income 4,261 1,120 169 Rents and Royalties - - 705 Surcharge 52,743 - - Other 10,093 451 11 TOTAL REVENUES 161,221 33,290 25,035 EXPENDITURES: Current: General Government - - - Conservation of Natural Resources - - - Culture – Recreation - - - Economic Development and Assistance - 20,858 - Education - - - Health and Social Services - - - Public Safety - - - Regulation of Business and Professions 113,423 - - Transportation - - 24,471 Debt Service Principal - - - Interest - - - TOTAL EXPENDITURES 113,423 20,858 24,471 Excess (Deficiency) of Revenues Over (Under) Expenditures 47,798 12,432 564 OTHER FINANCING SOURCES (USES): Transfers In 1,700 15,498 231 Transfers Out (33,550) (28,915) - Proceeds from Other Financing Arrangements - - - TOTAL OTHER FINANCING SOURCES (USES) (31,850) (13,417) 231 Net Change in Fund Balances 15,948 (985) 795 FUND BALANCES, JULY 1 94,425 33,806 8,259
FUND BALANCES, JUNE 30 $ 110,373 $ 32,821 $ 9,054

81
OTHER
GAME AND ENVIRONMENTAL ENERGY SPECIAL PARKS QUALITY CONSERVATION REVENUE TOTALS
$ - $ - $ - $ - $ 4,050 - - 300 51 13,023 1,309 2,521 - 5,063 46,678 - 1,869 - 9,564 16,437 - - - 5,847 5,847 9,562 - - 9,891 41,675 26,845 5,229 - 33,432 130,374 2,148 - 40 26,376 31,956 3,358 4,161 658 4,264 17,991 12,300 - - 1,330 14,335 - - - - 52,743 2,572 2,564 490 14,151 30,332 58,094 16,344 1,488 109,969 405,441 - - - 69,605 69,605 46,415 9,169 722 1,821 58,127 18,427 - - 1,626 20,053 - - - 3,230 24,088 - - - 19,342 19,342 - - - 1,382 1,382 - - - 36,245 36,245 - - - 769 114,192 - - - - 24,471 - 2,865 - - 2,865 - 684 - - 684 64,842 12,718 722 134,020 371,054 (6,748) 3,626 766 (24,051) 34,387 15,831 5,400 - 33,698 72,358 - (140) - (8,850) (71,455) - 1,505 - - 1,505 15,831 6,765 - 24,848 2,408 9,083 10,391 766 797 36,795 83,491 372,244 35,026 126,293 753,544
$ 92,574 $ 382,635 $ 35,792 $ 127,090 $ 790,339

82
State of NebraskaCOMBINING BALANCE SHEETNONMAJOR PERMANENT FUNDSJune 30, 2012 (Dollars in Thousands) NEBRASKA
AERONAUTICS VETERANS PERMANENT AGRICULTURE TRUST AID ENDOWMENT ENDOWMENT OTHER TOTALSASSETS: Cash and Cash Equivalents $ - $ 4,169 $ 360 $ 105 $ 12 $ 4,646 Investments 6,927 37,186 1,018 2,241 261 47,633 Securities Lending Collateral 337 2,030 56 122 14 2,559 Other Receivables, net of allowance 54 3,370 94 202 23 3,743
TOTAL ASSETS $ 7,318 $ 46,755 $ 1,528 $ 2,670 $ 310 $ 58,581 LIABILITIES AND FUND BALANCES LIABILITIES: Accounts Payable and Accrued Liabilities $ - $ 3,905 $ 114 $ 251 $ 29 $ 4,299 Obligations under Securities Lending 337 2,030 56 122 14 2,559 TOTAL LIABILITIES 337 5,935 170 373 43 6,858 FUND BALANCES: Nonspendable: Endowment Principal 6,195 12,000 503 722 95 19,515 Restricted for: Education - - 855 1,575 155 2,585 Health and Social Services - 28,820 - - - 28,820 Transportation 786 - - - - 786 Other Purposes - - - - 17 17 TOTAL FUND BALANCES 6,981 40,820 1,358 2,297 267 51,723 TOTAL LIABILITIES AND FUND BALANCES $ 7,318 $ 46,755 $ 1,528 $ 2,670 $ 310 $ 58,581

83
State of NebraskaCOMBINING STATEMENT OF REVENUES, EXPENDITURES, AND CHANGES IN FUND BALANCESNONMAJOR PERMANENT FUNDSFor the Year Ended June 30, 2012 (Dollars in Thousands) NEBRASKA AERONAUTICS VETERANS PERMANENT AGRICULTURE TRUST AID ENDOWMENT ENDOWMENT OTHER TOTALSREVENUES: Investment Income $ 613 $ 1,192 $ 39 $ 68 $ 8 $ 1,920 TOTAL REVENUES 613 1,192 39 68 8 1,920 EXPENDITURES: General Government - - - - 2 2 Education - - 29 62 7 98 Health and Social Services - 794 - - - 794 Transportation 3 - - - - 3 TOTAL EXPENDITURES 3 794 29 62 9 897
Excess (Deficiency) of Revenues Over (Under) Expenditures 610 398 10 6 (1) 1,023 OTHER FINANCING SOURCES (USES): Transfers Out (231) - - - (342) (573) Net Change in Fund Balances 379 398 10 6 (343) 450 FUND BALANCES, JULY 1 6,602 40,422 1,348 2,291 610 51,273
FUND BALANCES, JUNE 30 $ 6,981 $ 40,820 $ 1,358 $ 2,297 $ 267 $ 51,723

84

85
NONMAJOR ENTERPRISE FUNDS
Enterprise Funds are maintained to account for operations that are financed and operated in a manner similar to private business enterprises—where the costs of providing goods and services to the general public are financed primarily through user charges.
Lottery Fund. This fund accounts for all receipts and expenses from the operations of the State Lottery.
Excess Liability Fund. This fund accounts for the activity resulting from implementation of the Nebraska Hospital-Medical Liability Act. Revenues are primarily insurance premiums from certain health care providers and a surcharge levied on all participating health care providers in Nebraska. Expenses from the fund are used to pay judgments against participating health care providers, up to a limit of $1,750,000 per occurrence.
Cornhusker State Industries. The activities of Cornhusker State Industries in the Department of Correctional Services are accounted for in this fund. One of the main activities is making furniture.

86
State of Nebraska COMBINING STATEMENT OF NET ASSETS
NONMAJOR ENTERPRISE FUNDS
June 30, 2012 (Dollars in Thousands)
CORNHUSKER EXCESS STATE LOTTERY LIABILITY INDUSTRIES TOTALSASSETS CURRENT ASSETS: Cash and Cash Equivalents $ 5,460 $ 21,873 $ 9,504 $ 36,837 Receivables, net of allowance 5,690 12,503 323 18,516 Due from Other Funds - - 637 637 Inventories - - 3,103 3,103 Prepaid Items 100 - - 100 Other 493 - - 493 TOTAL CURRENT ASSETS 11,743 34,376 13,567 59,686 NONCURRENT ASSETS: Restricted Long-Term Deposits 2,381 - - 2,381 Long-Term Investments - 69,387 - 69,387 Securities Lending Collateral - 3,729 - 3,729 Capital Assets: Land - - 315 315 Buildings and Equipment 357 - 11,873 12,230 Less Accumulated Depreciation (336) - (5,917) (6,253) Total Capital Assets, net 21 - 6,271 6,292 TOTAL NONCURRENT ASSETS 2,402 73,116 6,271 81,789 TOTAL ASSETS $ 14,145 $ 107,492 $ 19,838 $ 141,475 LIABILITIES AND NET ASSETS CURRENT LIABILITIES: Accounts Payable and Accrued Liabilities $ 7,686 $ 14,444 $ 361 $ 22,491 Due to Other Funds 33 - 71 104 Claims, Judgments and Compensated Absences 17 5,721 33 5,771 Unearned Revenue - 2,579 - 2,579 TOTAL CURRENT LIABILITIES 7,736 22,744 465 30,945 NONCURRENT LIABILITIES: Claims, Judgments and Compensated Absences 220 20,199 447 20,866 Obligations under Securities Lending - 3,729 - 3,729 TOTAL NONCURRENT LIABILITIES 220 23,928 447 24,595 TOTAL LIABILITIES 7,956 46,672 912 55,540 NET ASSETS: Invested in Capital Assets, net of related debt 21 - 6,271 6,292 Restricted for: Lottery Prizes, Noncurrent 2,381 - - 2,381 Unrestricted 3,787 60,820 12,655 77,262 TOTAL NET ASSETS 6,189 60,820 18,926 85,935 TOTAL LIABILITIES AND NET ASSETS $ 14,145 $ 107,492 $ 19,838 $ 141,475
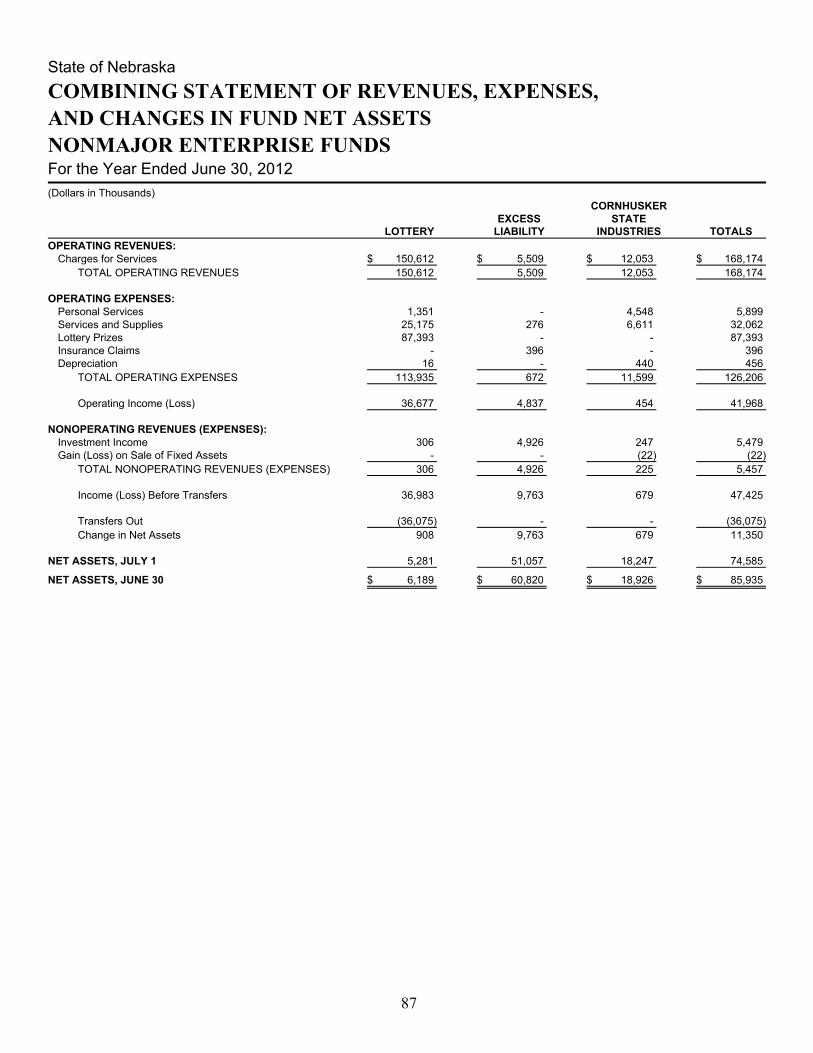
87
State of NebraskaCOMBINING STATEMENT OF REVENUES, EXPENSES, AND CHANGES IN FUND NET ASSETSNONMAJOR ENTERPRISE FUNDSFor the Year Ended June 30, 2012 (Dollars in Thousands)
CORNHUSKER EXCESS STATE LOTTERY LIABILITY INDUSTRIES TOTALSOPERATING REVENUES: Charges for Services $ 150,612 $ 5,509 $ 12,053 $ 168,174 TOTAL OPERATING REVENUES 150,612 5,509 12,053 168,174 OPERATING EXPENSES: Personal Services 1,351 - 4,548 5,899 Services and Supplies 25,175 276 6,611 32,062 Lottery Prizes 87,393 - - 87,393 Insurance Claims - 396 - 396 Depreciation 16 - 440 456 TOTAL OPERATING EXPENSES 113,935 672 11,599 126,206 Operating Income (Loss) 36,677 4,837 454 41,968 NONOPERATING REVENUES (EXPENSES): Investment Income 306 4,926 247 5,479 Gain (Loss) on Sale of Fixed Assets - - (22) (22) TOTAL NONOPERATING REVENUES (EXPENSES) 306 4,926 225 5,457 Income (Loss) Before Transfers 36,983 9,763 679 47,425 Transfers Out (36,075) - - (36,075) Change in Net Assets 908 9,763 679 11,350 NET ASSETS, JULY 1 5,281 51,057 18,247 74,585
NET ASSETS, JUNE 30 $ 6,189 $ 60,820 $ 18,926 $ 85,935

88
State of NebraskaCOMBINING STATEMENT OF CASH FLOWSNONMAJOR ENTERPRISE FUNDSFor the Year Ended June 30, 2012 (Dollars in Thousands) CORNHUSKER EXCESS STATE LOTTERY LIABILITY INDUSTRIES TOTALSCASH FLOWS FROM OPERATING ACTIVITIES: Cash Received from Customers $ 149,813 $ 5,157 $ 1,943 $ 156,913 Cash Received from Interfund Charges - - 10,816 10,816 Cash Paid to Employees (1,393) - (4,530) (5,923) Cash Paid to Suppliers (25,814) (125) (7,213) (33,152) Cash Paid for Lottery Prizes (86,393) - - (86,393) Cash Paid for Insurance Claims - (9,170) - (9,170) Cash Paid for Interfund Services (357) (172) (608) (1,137) NET CASH FLOWS FROM OPERATING ACTIVITIES 35,856 (4,310) 408 31,954 CASH FLOWS FROM NONCAPITAL FINANCING ACTIVITIES: Transfers Out (36,075) - - (36,075)CASH FLOWS FROM CAPITAL AND RELATED FINANCING: Acquisition and Construction of Capital Assets - - (127) (127) Proceeds from Sale of Fixed Assets 1 - 4 5 NET CASH FLOWS FROM CAPITAL AND RELATED FINANCING ACTIVITIES 1 - (123) (122)CASH FLOWS FROM INVESTING ACTIVITIES: Purchase of Investment Securities - (117,425) - (117,425) Proceeds from Sale of Investment Securities - 118,599 - 118,599 Interest and Dividend Income 306 2,641 246 3,193 NET CASH FLOWS FROM INVESTING ACTIVITIES 306 3,815 246 4,367 NET INCREASE (DECREASE) IN CASH AND CASH EQUIVALENTS 88 (495) 531 124 CASH AND CASH EQUIVALENTS, JULY 1 5,372 22,368 8,973 36,713
CASH AND CASH EQUIVALENTS, JUNE 30 $ 5,460 $ 21,873 $ 9,504 $ 36,837 RECONCILIATION OF OPERATING INCOME TO NET CASH FLOWS FROM OPERATING ACTIVITIES: Operating Income (Loss) $ 36,677 $ 4,837 $ 454 $ 41,968 Adjustments to reconcile operating income to net cash flows from operating activities: Depreciation 16 - 440 456 Change in Assets and Liabilities: (Increase) Decrease in Receivables (947) - 88 (859) (Increase) Decrease in Due from Other Funds - - 618 618 (Increase) Decrease in Inventories - - (482) (482) (Increase) Decrease in Prepaid Items 482 - - 482 (Increase) Decrease in Long-Term Deposits (479) - - (479) Increase (Decrease) in Accounts Payable and Accrued Liabilities 106 (21) (714) (629) Increase (Decrease) in Due to Other Funds 1 - 4 5 Increase (Decrease) in Claims Payable - (8,774) - (8,774) Increase (Decrease) in Unearned Revenue - (352) - (352) Total adjustments (821) (9,147) (46) (10,014)
NET CASH FLOWS FROM OPERATING ACTIVITIES $ 35,856 $ (4,310) $ 408 $ 31,954 NONCASH TRANSACTIONS (dollars in thousands): Noncash transactions are investing and financing activities that affect assets and liabilities but do not result in cash receipts or payments. The following noncash transactions occurred during the year: Change in Fair Value of Investments $ - $ 2,384 $ - $ 2,384

89
INTERNAL SERVICE FUNDS
Internal Service Funds are used to account for the operations of State agencies that provide goods and services to other departments or agencies within State government on a cost-reimbursement basis. The State has the following internal service funds:
Buildings and Grounds. The activities of Administrative Services, State Building Division, for space rental, office and storage, and operating the parking areas are accounted for in this fund.
General Services. This fund accounts for the operations of central services provided by the Administrative Services, Materiel Division. These operations are the central mailroom, printing, central stores, purchasing services, surplus State property, and other miscellaneous office services.
Office of the CIO. This fund accounts for the activities of the central communications network and central data processing operations maintained by Administrative Services, Office of the Chief Information Officer.
Transportation Services Bureau. This fund accounts for the operations of the central motor pool, which is under Administrative Services, Transportation Services Bureau.
Risk Management. The activities of Administrative Services, Division of Risk Management, which include workers’ compensation and general liability claims, and of the State Employees Insurance Fund, which include life and health insurance programs, are accounted for in this fund.
Accounting Services. The accounting operations maintained by Administrative Services, State Accounting Division, are accounted for in this fund.
Other Internal Service Funds. This fund accounts for the micrographics services and warehousing of records by the Records Management Division of the Secretary of State, the activities of the Investment Council, and the temporary employee pool maintained by Administrative Services, Division of State Personnel.

90
State of NebraskaCOMBINING STATEMENT OF NET ASSETSINTERNAL SERVICE FUNDSJune 30, 2012 (Dollars in Thousands) BUILDINGS AND GENERAL OFFICE OF GROUNDS SERVICES THE CIOASSETS CURRENT ASSETS: Cash and Cash Equivalents $ 13,162 $ 5,860 $ 25,766 Receivables, net of allowance Accounts 48 46 2,679 Accrued Interest 123 54 202 Due from Other Funds 130 2,214 12,707 Inventories - 357 76 Prepaid Items 1,108 104 - TOTAL CURRENT ASSETS 14,571 8,635 41,430 NONCURRENT ASSETS: Capital Assets: Buildings and Equipment 588 9,422 52,866 Less Accumulated Depreciation (492) (6,333) (37,238) Total Capital Assets, net 96 3,089 15,628 TOTAL ASSETS $ 14,667 $ 11,724 $ 57,058 LIABILITIES AND NET ASSETS CURRENT LIABILITIES: Accounts Payable and Accrued Liabilities $ 1,631 $ 2,334 $ 9,110 Due to Other Funds 151 43 432 Capital Lease Obligations - - 5,247 Claims, Judgments and Compensated Absences 41 37 213 Unearned Revenue - - 842 TOTAL CURRENT LIABILITIES 1,823 2,414 15,844 NONCURRENT LIABILITIES: Capital Lease Obligations - - 16,674 Claims, Judgments and Compensated Absences 546 490 2,831 TOTAL NONCURRENT LIABILITIES 546 490 19,505 TOTAL LIABILITIES 2,369 2,904 35,349 NET ASSETS: Invested in Capital Assets, net of related debt 96 3,089 (6,293) Unrestricted 12,202 5,731 28,002 TOTAL NET ASSETS 12,298 8,820 21,709 TOTAL LIABILITIES AND NET ASSETS $ 14,667 $ 11,724 $ 57,058

91
OTHER
TRANSPORTATION RISK ACCOUNTING INTERNAL SERVICES MANAGEMENT SERVICES SERVICE TOTALS
$ 6,087 $ 97,401 $ 2,654 $ 3,989 $ 154,919 - 3 2 137 2,915 50 785 76 26 1,316 697 6 5 674 16,433 - - - - 433 - - - - 1,212 6,834 98,195 2,737 4,826 177,228 17,257 - 1,445 726 82,304 (9,045) - (1,441) (637) (55,186) 8,212 - 4 89 27,118
$ 15,046 $ 98,195 $ 2,741 $ 4,915 $ 204,346
$ 1,084 $ 13,847 $ 113 $ 947 $ 29,066 56 29 84 13 808 - - - - 5,247 8 27,493 22 13 27,827 - - - - 842 1,148 41,369 219 973 63,790 - - - - 16,674 112 38,151 296 173 42,599 112 38,151 296 173 59,273 1,260 79,520 515 1,146 123,063 8,212 - 4 89 5,197 5,574 18,675 2,222 3,680 76,086 13,786 18,675 2,226 3,769 81,283
$ 15,046 $ 98,195 $ 2,741 $ 4,915 $ 204,346

92
State of Nebraska COMBINING STATEMENT OF REVENUES, EXPENSES, AND CHANGES IN FUND NET ASSETS INTERNAL SERVICE FUNDS For the Year Ended June 30, 2012 (Dollars in Thousands) BUILDINGS AND GENERAL OFFICE OF GROUNDS SERVICES THE CIOOPERATING REVENUES: Charges for Services $ 33,444 $ 17,828 $ 88,507 Other 837 - - TOTAL OPERATING REVENUES 34,281 17,828 88,507 OPERATING EXPENSES: Personal Services 4,227 3,101 18,574 Services and Supplies 29,542 13,330 61,394 Insurance Claims - - - Depreciation 13 1,075 4,848 TOTAL OPERATING EXPENSES 33,782 17,506 84,816 Operating Income (Loss) 499 322 3,691 NONOPERATING REVENUES (EXPENSES): Investment Income 360 166 475 Gain (Loss) on Sale of Capital Assets (221) (2) 16 Other - - (400) TOTAL NONOPERATING REVENUES (EXPENSES) 139 164 91 Income (Loss) Before Transfers 638 486 3,782 Change in Net Assets 638 486 3,782 NET ASSETS, JULY 1 11,660 8,334 17,927
NET ASSETS, JUNE 30 $ 12,298 $ 8,820 $ 21,709
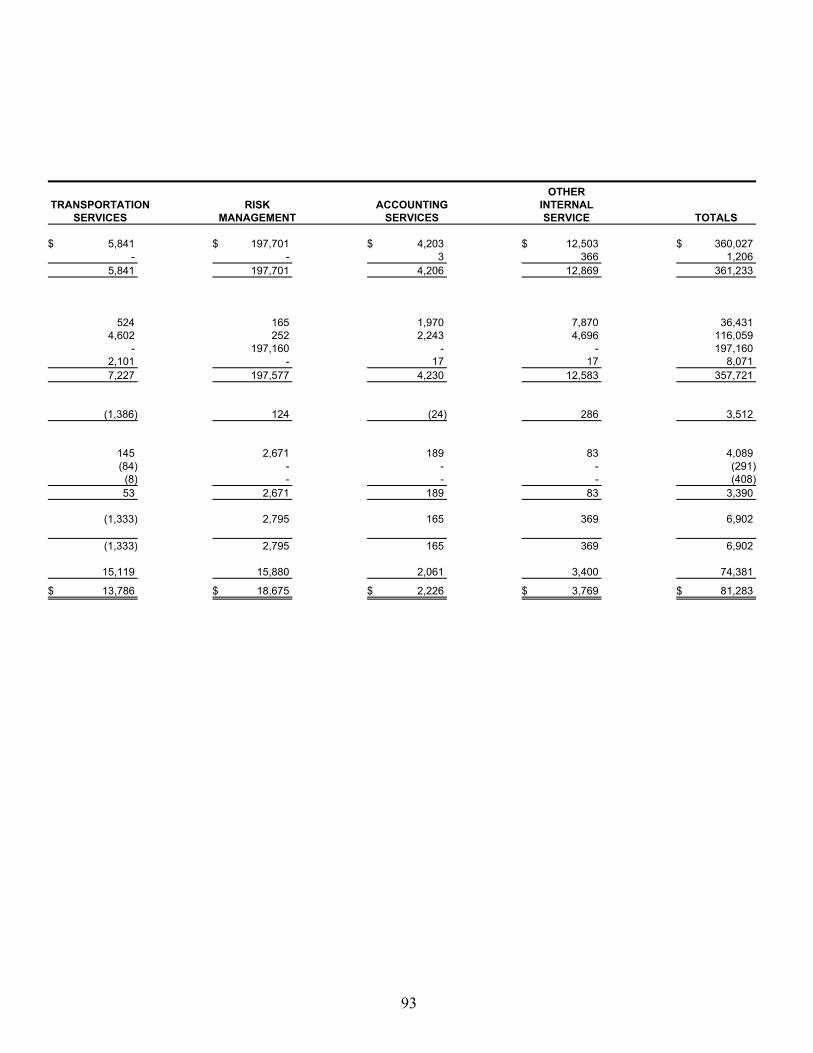
93
OTHER TRANSPORTATION RISK ACCOUNTING INTERNAL
SERVICES MANAGEMENT SERVICES SERVICE TOTALS $ 5,841 $ 197,701 $ 4,203 $ 12,503 $ 360,027 - - 3 366 1,206 5,841 197,701 4,206 12,869 361,233 524 165 1,970 7,870 36,431 4,602 252 2,243 4,696 116,059 - 197,160 - - 197,160 2,101 - 17 17 8,071 7,227 197,577 4,230 12,583 357,721 (1,386) 124 (24) 286 3,512 145 2,671 189 83 4,089 (84) - - - (291) (8) - - - (408) 53 2,671 189 83 3,390 (1,333) 2,795 165 369 6,902 (1,333) 2,795 165 369 6,902 15,119 15,880 2,061 3,400 74,381
$ 13,786 $ 18,675 $ 2,226 $ 3,769 $ 81,283

94
State of NebraskaCOMBINING STATEMENT OF CASH FLOWSINTERNAL SERVICE FUNDSFor the Year Ended June 30, 2012 (Dollars in Thousands) BUILDINGS AND GENERAL OFFICE OF GROUNDS SERVICES THE CIOCASH FLOWS FROM OPERATING ACTIVITIES: Cash Received from Customers $ 303 $ 231 $ 4,586 Cash Received from Interfund Charges 33,959 17,755 83,353 Cash Paid to Employees (4,193) (3,068) (18,537) Cash Paid to Suppliers (28,217) (13,952) (53,706) Cash Paid for Insurance Claims - - - Cash Paid for Interfund Services (1,845) (138) (4,577) NET CASH FLOWS FROM OPERATING ACTIVITIES 7 828 11,119 CASH FLOWS FROM CAPITAL AND RELATED FINANCING ACTIVITIES: Acquisition and Construction of Capital Assets (29) (1,274) - Proceeds from Sale of Capital Assets 14 6 699 Principal Paid on Capital Leases - - (4,007) Interest Paid on Capital Leases - - (400) NET CASH FLOWS FROM CAPITAL AND RELATED FINANCING ACTIVITIES (15) (1,268) (3,708) CASH FLOWS FROM INVESTING ACTIVITIES: Investment Income 354 166 422 NET CASH FLOWS FROM INVESTING ACTIVITIES 354 166 422 NET INCREASE (DECREASE) IN CASH AND CASH EQUIVALENTS 346 (274) 7,833 CASH AND CASH EQUIVALENTS, JULY 1 12,816 6,134 17,933
CASH AND CASH EQUIVALENTS, JUNE 30 $ 13,162 $ 5,860 $ 25,766 RECONCILIATION OF OPERATING INCOME TO NET CASH FLOWS FROM OPERATING ACTIVITIES: Operating Income (Loss) $ 499 $ 322 $ 3,691 Adjustments to reconcile operating income (loss) to net cash flows from operating activities: Depreciation 13 1,075 4,848 Change in Assets and Liabilities: (Increase) Decrease in Receivables (19) (4) (2,130) (Increase) Decrease in Due from Other Funds - 162 1,203 (Increase) Decrease in Inventories - 5 (13) (Increase) Decrease in Prepaid Items (58) 50 - Increase (Decrease) in Accounts Payable and Accrued Liabilities (445) 237 3,036 Increase (Decrease) in Due to Other Funds 17 (1,019) 125 Increase (Decrease) in Claims Payable - - - Increase (Decrease) in Unearned Revenue - - 359 Total Adjustments (492) 506 7,428 NET CASH FLOWS FROM OPERATING ACTIVITIES $ 7 $ 828 $ 11,119 NONCASH TRANSACTIONS (dollars in thousands): Noncash transactions are investing and financing activities that affect assets and liabilities but do not result in cash receipts or payments. The following noncash transactions occurred during the year: Capital Assets acquired through Capital Leases $ - $ - $ 5,165
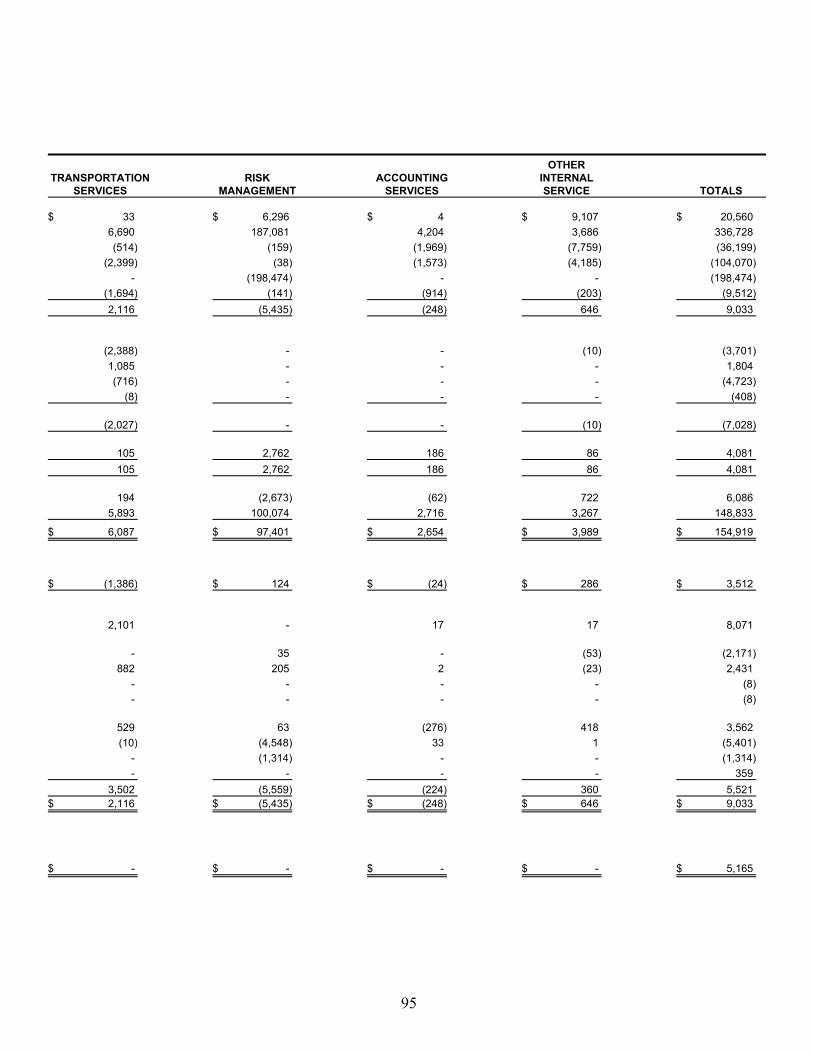
95
OTHER TRANSPORTATION RISK ACCOUNTING INTERNAL
SERVICES MANAGEMENT SERVICES SERVICE TOTALS $ 33 $ 6,296 $ 4 $ 9,107 $ 20,560 6,690 187,081 4,204 3,686 336,728 (514) (159) (1,969) (7,759) (36,199) (2,399) (38) (1,573) (4,185) (104,070) - (198,474) - - (198,474) (1,694) (141) (914) (203) (9,512) 2,116 (5,435) (248) 646 9,033 (2,388) - - (10) (3,701) 1,085 - - - 1,804 (716) - - - (4,723) (8) - - - (408) (2,027) - - (10) (7,028) 105 2,762 186 86 4,081 105 2,762 186 86 4,081 194 (2,673) (62) 722 6,086 5,893 100,074 2,716 3,267 148,833 $ 6,087 $ 97,401 $ 2,654 $ 3,989 $ 154,919 $ (1,386) $ 124 $ (24) $ 286 $ 3,512 2,101 - 17 17 8,071 - 35 - (53) (2,171) 882 205 2 (23) 2,431 - - - - (8) - - - - (8) 529 63 (276) 418 3,562 (10) (4,548) 33 1 (5,401) - (1,314) - - (1,314) - - - - 359 3,502 (5,559) (224) 360 5,521 $ 2,116 $ (5,435) $ (248) $ 646 $ 9,033 $ - $ - $ - $ - $ 5,165

96

97
FIDUCIARY FUNDS
Fiduciary funds are used to account for assets held by the State of Nebraska in a fiduciary capacity. The State has the following fiduciary funds:
PENSION TRUST FUNDS
Deferred Compensation, State Employees’ Retirement, County Employees’ Retirement, Judges’ Retirement, State Patrol Retirement, and School Retirement Systems.
PRIVATE PURPOSE TRUST FUNDS
Vocational Rehabilitation Fund. This fund provides rehabilitation services to outside persons to restore the person to gainful employment. Funding comes from assessments to insurance companies and self-insurers. This is not a State program.
Canteen and Welfare Fund. This fund provides entertainment activities and equipment at correctional facilities for youth and adult offenders. Such expenditures are not in the context of the State’s responsibility for prisoner care and welfare. Revenues are from vending sales, canteen sales and interest earned. Such sales are 100% from inmate purchases. This is not a State program and uses no State funds.
Escheat Trust Fund. This fund makes payments to rightful owners for financial assets turned over to the State Treasurer because the assets were left unclaimed at corporations, business associations, banking and financial organizations, insurance companies, utilities and public authorities. If the rightful owners cannot be located, excess funds are transferred to the Permanent School Fund. However, the only funds shown in this trust are those funds determined to be paid at a future date to rightful owners of those funds.
College Savings Plan. This fund accounts for the Nebraska savings plan qualified under section 529 of the Internal Revenue Code.
Other Private Purpose Trust Funds. Amos Trust, Agriculture and University Land Lease, Public Service Commission Trust Account, and Miscellaneous Private Purpose Trust.
AGENCY FUNDS
Local Government Fund. This fund receives money for redistribution to counties and other political subdivisions.
Other Agency Funds. Ohio College Library Service, Severance Tax Fund, Court Ordered Settlement, County Court Trust Funds, Comprehensive Health Insurance Pool, the Department of Correctional Services Inmate Trust Funds, and the Health and Human Services System Trust Funds.

98
State of NebraskaCOMBINING STATEMENT OF FIDUCIARY NET ASSETSPENSION TRUST FUNDSJune 30, 2012 (Dollars in Thousands) STATE EMPLOYEES RETIREMENT DEFERRED DEFINED CASH COMPENSATION CONTRIBUTION BALANCEASSETS Cash and Cash Equivalents $ 30 $ 12 $ 1,225 Investments: U.S. Treasury Notes and Bonds - - 20,583 U.S. Treasury Bills - - - Government Agency Securities - - 1,781 Corporate Bonds - - 46,171 International Bonds - - 5,966 Equity Securities - - 128,673 Private Equity - - 25,738 Options - - (34) Mortgages - - 50,198 Private Real Estate - - 1,492 Asset Backed Securities - - 5,317 Municipal Bonds - - 3,879 Commingled Funds 164,105 597,210 394,382 Guaranteed Investment Contracts - 95,765 - Short Term Investments - 11,532 18,835 Total Investments 164,105 704,507 702,981 Securities Lending Collateral - 14,275 31,682 Receivables: Contributions - 852 1,658 Interest and Dividends - 256 1,288 Other - - 37,737 Total Receivables - 1,108 40,683 Due from Other Funds - 41 - Capital Assets: Buildings and Equipment 135 1,640 2,577 Less Accumulated Depreciation (135) (1,610) (2,551) Total Capital Assets, net - 30 26 TOTAL ASSETS $ 164,135 $ 719,973 $ 776,597 LIABILITIES Accounts Payable and Accrued Liabilities $ 2 $ 591 $ 42,385 Due to Other Funds 2 2 5 Obligations under Securities Lending - 14,275 31,682 Accrued Compensated Absences 5 15 30 TOTAL LIABILITIES 9 14,883 74,102 NET ASSETS
Held in Trust for Pension Benefits $ 164,126 $ 705,090 $ 702,495

99
COUNTY EMPLOYEES RETIREMENT STATE DEFINED CASH SCHOOL JUDGES PATROL
CONTRIBUTION BALANCE RETIREMENT RETIREMENT RETIREMENT TOTALS $ 211 $ 30 $ 1,764 $ 69 $ 107 $ 3,448 - 6,097 214,202 3,673 8,064 252,619 - - 6,908 118 260 7,286 - 527 18,462 317 695 21,782 - 13,677 520,218 8,921 19,585 608,572 - 1,767 157,201 2,696 5,918 173,548 - 38,116 1,119,784 19,203 42,156 1,347,932 - 7,624 296,516 5,085 11,163 346,126 - (10) (494) (8) (19) (565) - 14,870 474,200 8,132 17,852 565,252 - 442 229,758 3,940 8,650 244,282 - 1,575 49,872 855 1,878 59,497 - 1,149 35,882 615 1,351 42,876 156,255 116,825 4,044,930 69,365 155,480 5,698,552 21,355 - - - 870 117,990 3,162 6,413 141,242 2,422 5,852 189,458 180,772 209,072 7,308,681 125,334 279,755 9,675,207 3,184 9,385 315,884 5,417 11,892 391,719 247 677 20,848 295 - 24,577 57 381 13,576 233 509 16,300 - 11,178 456,888 7,835 17,200 530,838 304 12,236 491,312 8,363 17,709 571,715 - - 27,349 72 2,570 30,032 772 1,377 12,410 2,104 2,060 23,075 (757) (1,362) (12,402) (2,104) (2,060) (22,981) 15 15 8 - - 94 $ 184,486 $ 230,738 $ 8,144,998 $ 139,255 $ 312,033 $ 10,672,215 $ 141 12,599 582,551 9,928 21,788 669,985 2 4 42 - - 57 3,184 9,385 315,884 5,417 11,892 391,719 9 21 211 3 3 297 $ 3,336 $ 22,009 $ 898,688 $ 15,348 $ 33,683 $ 1,062,058 $ 181,150 $ 208,729 $ 7,246,310 $ 123,907 $ 278,350 $ 9,610,157

100
State of NebraskaCOMBINING STATEMENT OF CHANGES IN FIDUCIARY NET ASSETSPENSION TRUST FUNDSFor the Year Ended June 30, 2012 (Dollars in Thousands) STATE EMPLOYEES RETIREMENT DEFERRED DEFINED CASH COMPENSATION CONTRIBUTION BALANCEADDITIONS: Contributions: Participant Contributions $ 10,749 $ 11,227 $ 19,998 State Contributions - 17,498 31,188 Political Subdivision Contributions - - - Court Fees - - - Total Contributions 10,749 28,725 51,186 Investment Income: Net Appreciation (Depreciation) in Fair Value of Investments 1,052 8,996 (6,852) Interest and Dividend Income 2 3,740 11,185 Securities Lending Income - 52 219 Total Investment Income 1,054 12,788 4,552 Investment Expenses - 396 1,826 Securities Lending Expenses - 16 52 Total Investment Expense - 412 1,878 Net Investment Income 1,054 12,376 2,674 Other Additions - 4 7 TOTAL ADDITIONS 11,803 41,105 53,867 DEDUCTIONS: Benefits 12,571 35,117 46,220 Refunds - - - Administrative Expenses 174 536 900 Other Deductions - 142 95 TOTAL DEDUCTIONS 12,745 35,795 47,215 TRANSFERS: Transfers In (Out) - (6,681) 6,681 Change in Net Assets (942) (1,371) 13,333 NET ASSETS-BEGINNING OF YEAR 165,068 706,461 689,162
NET ASSETS-END OF YEAR $ 164,126 $ 705,090 $ 702,495
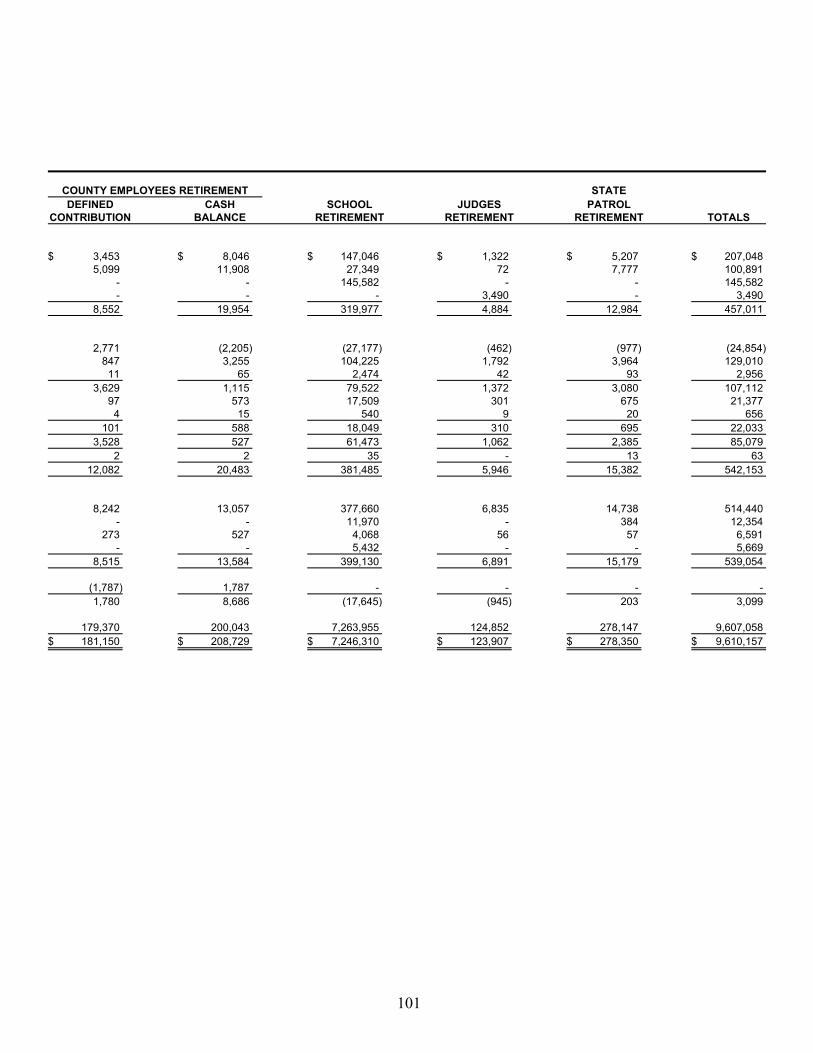
101
COUNTY EMPLOYEES RETIREMENT STATE DEFINED CASH SCHOOL JUDGES PATROL
CONTRIBUTION BALANCE RETIREMENT RETIREMENT RETIREMENT TOTALS $ 3,453 $ 8,046 $ 147,046 $ 1,322 $ 5,207 $ 207,048 5,099 11,908 27,349 72 7,777 100,891 - - 145,582 - - 145,582 - - - 3,490 - 3,490 8,552 19,954 319,977 4,884 12,984 457,011 2,771 (2,205) (27,177) (462) (977) (24,854) 847 3,255 104,225 1,792 3,964 129,010 11 65 2,474 42 93 2,956 3,629 1,115 79,522 1,372 3,080 107,112 97 573 17,509 301 675 21,377 4 15 540 9 20 656 101 588 18,049 310 695 22,033 3,528 527 61,473 1,062 2,385 85,079 2 2 35 - 13 63 12,082 20,483 381,485 5,946 15,382 542,153 8,242 13,057 377,660 6,835 14,738 514,440 - - 11,970 - 384 12,354 273 527 4,068 56 57 6,591 - - 5,432 - - 5,669 8,515 13,584 399,130 6,891 15,179 539,054 (1,787) 1,787 - - - - 1,780 8,686 (17,645) (945) 203 3,099 179,370 200,043 7,263,955 124,852 278,147 9,607,058 $ 181,150 $ 208,729 $ 7,246,310 $ 123,907 $ 278,350 $ 9,610,157
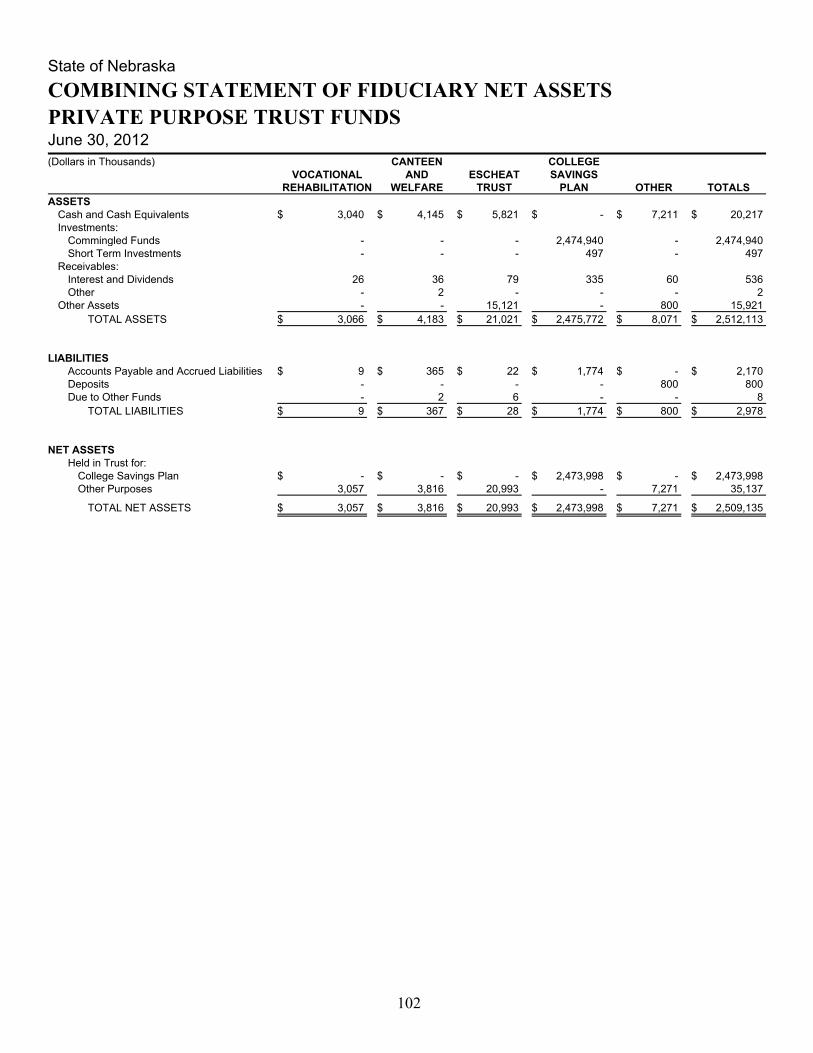
102
State of NebraskaCOMBINING STATEMENT OF FIDUCIARY NET ASSETSPRIVATE PURPOSE TRUST FUNDSJune 30, 2012 (Dollars in Thousands) CANTEEN COLLEGE VOCATIONAL AND ESCHEAT SAVINGS REHABILITATION WELFARE TRUST PLAN OTHER TOTALSASSETS Cash and Cash Equivalents $ 3,040 $ 4,145 $ 5,821 $ - $ 7,211 $ 20,217 Investments: Commingled Funds - - - 2,474,940 - 2,474,940 Short Term Investments - - - 497 - 497 Receivables: Interest and Dividends 26 36 79 335 60 536 Other - 2 - - - 2 Other Assets - - 15,121 - 800 15,921 TOTAL ASSETS $ 3,066 $ 4,183 $ 21,021 $ 2,475,772 $ 8,071 $ 2,512,113 LIABILITIES Accounts Payable and Accrued Liabilities $ 9 $ 365 $ 22 $ 1,774 $ - $ 2,170 Deposits - - - - 800 800 Due to Other Funds - 2 6 - - 8 TOTAL LIABILITIES $ 9 $ 367 $ 28 $ 1,774 $ 800 $ 2,978 NET ASSETS Held in Trust for: College Savings Plan $ - $ - $ - $ 2,473,998 $ - $ 2,473,998 Other Purposes 3,057 3,816 20,993 - 7,271 35,137
TOTAL NET ASSETS $ 3,057 $ 3,816 $ 20,993 $ 2,473,998 $ 7,271 $ 2,509,135

103
State of NebraskaCOMBINING STATEMENT OF CHANGES IN FIDUCIARY NET ASSETSPRIVATE PURPOSE TRUST FUNDSFor the Year Ended June 30, 2012 (Dollars in Thousands) CANTEEN COLLEGE VOCATIONAL AND ESCHEAT SAVINGS REHABILITATION WELFARE TRUST PLAN OTHER TOTALSADDITIONS: Contributions: Participant Contributions $ - $ - $ - $ 313,368 $ - $ 313,368 Client Contributions - 140 - - - 140 Investment Income: Net Appreciation (Depreciation) in Fair Value of Investments - - - (5,472) - (5,472) Interest and Dividend Income 95 112 279 3,090 175 3,751 Investment Expenses - - - 12,275 - 12,275 Total Investment Income 95 112 279 (14,657) 175 (13,996) Escheat Revenue - - 7,566 - - 7,566 Other Additions - 5,151 - 167 406 5,724 TOTAL ADDITIONS 95 5,403 7,845 298,878 581 312,802 DEDUCTIONS: Benefits - - - 217,663 - 217,663 Amounts Distributed to Outside Parties 1,104 4,243 7,195 - 122 12,664 Administrative Expenses - 1,084 801 - 178 2,063 TOTAL DEDUCTIONS 1,104 5,327 7,996 217,663 300 232,390 Change in Net Assets Held in Trust for: College Savings Plan - - - 81,215 - 81,215 Other Purposes (1,009) 76 (151) - 281 (803) NET ASSETS-BEGINNING OF YEAR 4,066 3,740 21,144 2,392,783 6,990 2,428,723
NET ASSETS-END OF YEAR $ 3,057 $ 3,816 $ 20,993 $ 2,473,998 $ 7,271 $ 2,509,135
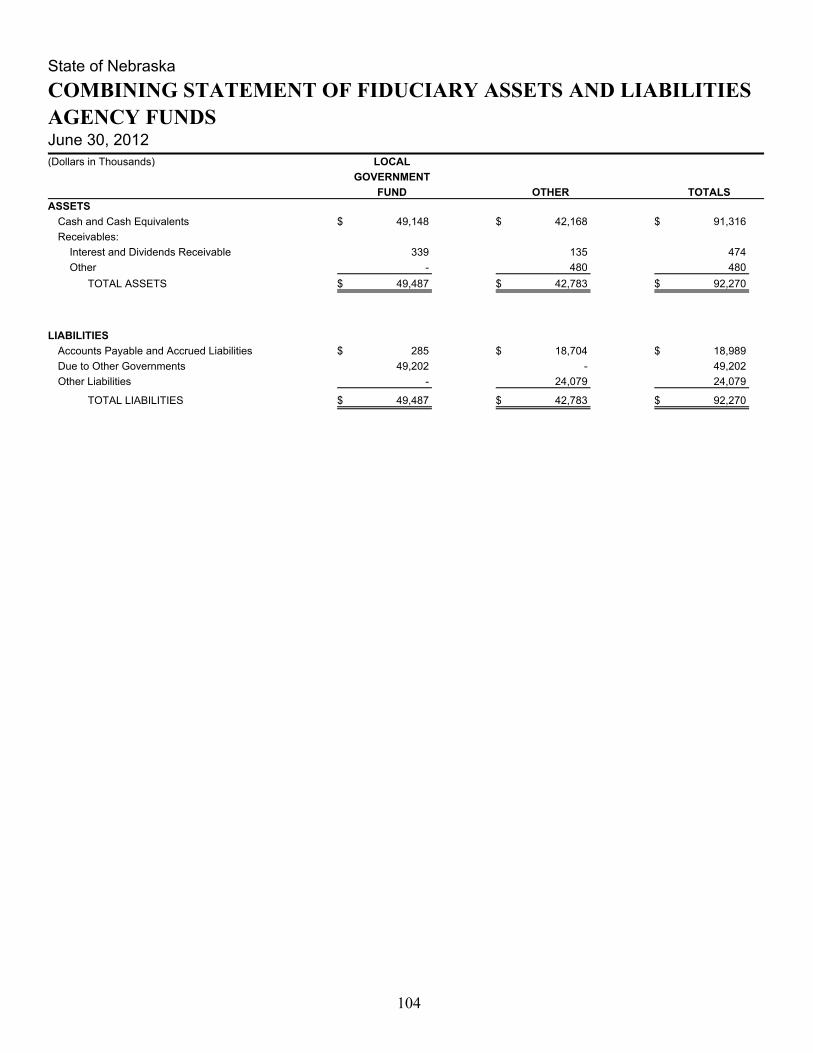
104
State of NebraskaCOMBINING STATEMENT OF FIDUCIARY ASSETS AND LIABILITIESAGENCY FUNDSJune 30, 2012 (Dollars in Thousands) LOCAL GOVERNMENT FUND OTHER TOTALSASSETS Cash and Cash Equivalents $ 49,148 $ 42,168 $ 91,316 Receivables: Interest and Dividends Receivable 339 135 474 Other - 480 480 TOTAL ASSETS $ 49,487 $ 42,783 $ 92,270 LIABILITIES Accounts Payable and Accrued Liabilities $ 285 $ 18,704 $ 18,989 Due to Other Governments 49,202 - 49,202 Other Liabilities - 24,079 24,079 TOTAL LIABILITIES $ 49,487 $ 42,783 $ 92,270

105
State of Nebraska
COMBINING STATEMENT OF CHANGES IN ASSETS AND LIABILITIESAGENCY FUNDSFor the Year Ended June 30, 2012 (Dollars in Thousands) BALANCE BALANCE JULY 1, 2011 ADDITIONS REDUCTIONS JUNE 30, 2012LOCAL GOVERNMENT FUND ASSETS Cash and Cash Equivalents $ 52,326 $ 547,863 $ 551,041 $ 49,148 Receivables: Interest and Dividends Receivable 364 824 849 339 Other - 250 250 - TOTAL ASSETS $ 52,690 $ 548,937 $ 552,140 $ 49,487 LIABILITIES Accounts Payable and Accrued Liabilities $ 715 $ 255,834 $ 256,264 $ 285 Due to Other Governments 51,975 293,103 295,876 49,202 TOTAL LIABILITIES $ 52,690 $ 548,937 $ 552,140 $ 49,487 OTHER ASSETS Cash and Cash Equivalents $ 30,306 $ 475,748 $ 463,886 $ 42,168 Receivables: Interest and Dividends Receivable 90 343 298 135 Other 461 14,555 14,536 480 TOTAL ASSETS $ 30,857 $ 490,646 $ 478,720 $ 42,783 LIABILITIES Accounts Payable and Accrued Liabilities $ 9,608 $ 73,962 $ 64,866 $ 18,704 Other Liabilities 21,249 416,684 413,854 24,079 TOTAL LIABILITIES $ 30,857 $ 490,646 $ 478,720 $ 42,783 TOTALS ASSETS Cash and Cash Equivalents $ 82,632 $ 1,023,611 $ 1,014,927 $ 91,316 Receivables: Interest and Dividends Receivable 454 1,167 1,147 474 Other 461 14,805 14,786 480 TOTAL ASSETS $ 83,547 $ 1,039,583 $ 1,030,860 $ 92,270 LIABILITIES Accounts Payable and Accrued Liabilities $ 10,323 $ 329,796 $ 321,130 $ 18,989 Due to Other Governments 51,975 293,103 295,876 49,202 Other Liabilities 21,249 416,684 413,854 24,079 TOTAL LIABILITIES $ 83,547 $ 1,039,583 $ 1,030,860 $ 92,270

106

107
STATISTICAL SECTION

108
State of NebraskaSTATISTICAL SECTION TABLE OF CONTENTSFor the Year Ended June 30, 2012
Page
This part of the State of Nebraska’s comprehensive annual financial report presents detailed information as a context for understanding what the information in the financial statements, note disclosures and required supplementary information says about the State’s overall financial health.
FINANCIAL TRENDS INFORMATIONThese schedules contain trend information to help the reader understand how the State’s financial performance and well-being have changed over time.
Net Assets by Component......................................................................................................................................................109Changes in Net Assets ...........................................................................................................................................................110Fund Balances - Governmental Funds...................................................................................................................................115Changes in Fund Balances - Governmental Funds ................................................................................................................116
REVENUE CAPACITY INFORMATIONThese schedules present revenue capacity information for the two largest own-source revenues – individual income tax and sales and use tax. Individual income tax and sales and use tax are the primary sources of general fund revenue.
Individual Income Tax Rates .................................................................................................................................................118Individual Income Tax Liability by Income Level ................................................................................................................119Taxable Sales by Industry......................................................................................................................................................120
DEBT CAPACITY INFORMATIONThe State has no debt because the Nebraska State Constitution prohibits the State’s debt from exceeding, in the aggregate, one hundred thousand dollars. However, the State does have leasing arrangements; such information is provided in this section.
Ratios of Outstanding Debt....................................................................................................................................................121
DEMOGRAPHIC AND ECONOMIC INFORMATIONThese schedules offer demographic and economic indicators to help the reader understand the environment within which the State’s financial activities take place and to help make comparisons over time and with other governments.
Comparative Unemployment, Nebraska and United States...................................................................................................122Population, Personal and Per Capita Income, Nebraska and United States...........................................................................123Ten Largest Employers ..........................................................................................................................................................123Public and State Operated School Enrollment, Prekindergarten-Grade 12 ...........................................................................124Public Higher Education Institutions Total Fall Headcount Enrollment ...............................................................................124
OPERATING INFORMATIONThese schedules contain information about the State’s operations and resources to help the reader understand how the State’s financial information relates to the activities it performs.
Full Time Equivalent Permanent Employees by Function ....................................................................................................125Operating Indicators by Function ..........................................................................................................................................126Capital Asset Statistics by Function ......................................................................................................................................127
MISCELLANEOUS DATA .......................................................................................................................................................128
Sources: Unless otherwise noted, the information in these schedules is derived from the comprehensive annual financial reports for the relevant year.

109
State of Nebraska
NET ASSETS BY COMPONENT 2003 - 2012 (Dollars in Thousands) 2003 2004 2005 2006 2007 Governmental activities Invested in capital assets, net of related debt $ 6,909,470 $ 6,980,310 $ 7,110,299 $ 7,269,102 $ 7,428,729 Restricted 933,033 1,050,902 1,099,437 1,566,634 1,762,849 Unrestricted 134,471 425,811 804,266 681,330 966,918 Total governmental activities net assets $ 7,976,974 $ 8,457,023 $ 9,014,002 $ 9,517,066 $ 10,158,496
Business-type activities Invested in capital assets, net of related debt $ 6,563 $ 6,424 $ 6,235 $ 6,066 $ 5,763 Restricted 195,802 184,665 213,058 274,537 321,396 Unrestricted 14,358 12,592 26,070 30,144 31,019 Total business-type activities net assets $ 216,723 $ 203,681 $ 245,363 $ 310,747 $ 358,178
Primary government Invested in capital assets, net of related debt $ 6,916,033 $ 6,986,734 $ 7,116,534 $ 7,275,168 $ 7,434,492 Restricted 1,128,835 1,235,567 1,312,495 1,841,171 2,084,245 Unrestricted 148,829 438,403 830,336 711,474 997,937 Total primary government net assets $ 8,193,697 $ 8,660,704 $ 9,259,365 $ 9,827,813 $ 10,516,674
(Dollars in Thousands) 2008 2009 2010 2011 2012
Governmental activities
Invested in capital assets, net of related debt $ 7,587,729 $ 7,718,610 $ 7,820,246 $ 7,982,821 $ 8,041,150 Restricted 1,789,943 1,631,962 1,754,186 2,006,750 2,082,147 Unrestricted 1,078,546 1,015,196 850,757 806,676 905,503 Total governmental activities net assets $ 10,456,218 $ 10,365,768 $ 10,425,189 $ 10,796,247 $ 11,028,800
Business-type activities Invested in capital assets, net of related debt $ 6,426 $ 6,283 $ 5,848 $ 6,809 $ 6,379 Restricted 344,186 270,394 240,878 345,731 405,135 Unrestricted 47,777 47,082 72,173 65,690 77,262 Total business-type activities net assets $ 398,389 $ 323,759 $ 318,899 $ 418,230 $ 488,776 Primary government Invested in capital assets, net of related debt $ 7,594,155 $ 7,724,893 $ 7,826,094 $ 7,989,630 $ 8,047,529 Restricted 2,134,129 1,902,356 1,995,064 2,352,481 2,487,282 Unrestricted 1,126,323 1,062,278 922,930 872,366 982,765 Total primary government net assets $ 10,854,607 $ 10,689,527 $ 10,744,088 $ 11,214,477 $ 11,517,576
NOTE: In 2006, restricted net assets increased significantly due to the implementation of GASB Statement No. 46.

110
State of NebraskaCHANGES IN NET ASSETS2003 - 2012 (Dollars in Thousands) 2003 2004 2005 2006
Governmental Activities: Expenses General Government $ 404,682 $ 293,586 $ 320,608 $ 308,567 Conservation of Natural Resources 87,746 91,996 95,589 100,476 Culture - Recreation 28,083 20,352 28,524 27,174 Economic Development and Assistance 83,974 80,417 79,618 87,299 Education 1,215,793 1,201,349 1,224,973 1,318,123 Higher Education - Colleges and University 461,325 438,225 451,404 482,229 Health and Social Services 2,219,649 2,329,940 2,494,782 2,593,692 Public Safety 237,538 254,085 282,474 288,659 Regulation of Business and Professions 117,235 126,978 139,248 151,853 Transportation 626,550 715,553 716,259 697,210 Interest on Long-term Debt 3,808 3,018 2,800 2,556 Total expenses 5,486,383 5,555,499 5,836,279 6,057,838 Program Revenues Charges for Services: General Government 57,497 63,919 64,746 73,624 Conservation of Natural Resources 27,644 31,909 22,049 24,332 Culture - Recreation 16,441 15,544 16,700 15,977 Economic Development and Assistance 2,221 3,551 3,600 3,195 Education 34,810 35,140 27,470 23,346 Health and Social Services 130,487 152,240 147,720 120,526 Public Safety 23,275 26,077 27,614 26,183 Regulation of Business and Professions 112,754 116,772 122,536 113,418 Transportation 82,414 77,630 95,322 90,951 Operating grants and contributions 1,801,023 2,146,719 2,121,384 2,151,817 Capital grants and contributions 5,354 6,422 12,245 4,461 Total program revenues 2,293,920 2,675,923 2,661,386 2,647,830 Total Governmental Activities Net Program Expense (3,192,463) (2,879,576) (3,174,893) (3,410,008) General Revenues and Other Changes in Net Assets Taxes Income taxes 1,236,845 1,400,161 1,612,683 1,803,670 Sales and use taxes 1,218,045 1,284,260 1,376,100 1,410,980 Petroleum taxes 311,198 313,539 311,231 312,809 Excise taxes 108,788 122,462 126,593 134,406 Business and franchise taxes 59,490 67,322 70,344 79,723 Other taxes 25,187 33,089 68,885 35,369 Total taxes 2,959,553 3,220,833 3,565,836 3,776,957 Unrestricted investment earnings 73,888 86,502 117,977 92,892 Miscellaneous - 1,055 5,106 39 Contributions to permanent fund principal 12,395 11,715 16,581 15,582 Transfers 20,230 20,591 26,372 27,602 Total general revenues and other changes in net assets 3,066,066 3,340,696 3,731,872 3,913,072 Total Governmental Activities Change in Net Assets $ (126,397) $ 461,120 $ 556,979 $ 503,064

111
2007 2008 2009 2010 2011 2012
$ 354,737 $ 437,830 $ 468,433 $ 471,614 $ 476,622 $ 460,612 119,286 112,936 127,677 148,452 155,692 151,318 27,031 26,073 29,272 24,228 28,837 24,752 89,310 84,852 88,520 95,228 111,096 102,839 1,369,110 1,450,085 1,562,662 1,712,705 1,807,170 1,570,235 528,861 558,282 571,268 571,288 561,090 557,162 2,649,535 2,744,217 2,912,708 3,010,299 3,069,195 3,139,786 359,755 372,677 351,673 372,813 361,921 366,084 155,692 130,603 123,579 132,094 121,616 122,211 614,919 714,032 797,462 736,449 696,727 907,173 2,337 2,241 1,828 1,400 1,153 1,204 6,270,573 6,633,828 7,035,082 7,276,570 7,391,119 7,403,376 86,746 86,869 87,575 100,501 88,550 95,899 34,578 34,439 35,324 35,483 36,263 32,804 16,823 17,072 18,153 18,550 18,657 22,984 5,043 4,808 2,259 2,171 1,007 4,126 26,180 25,807 30,402 34,166 36,545 36,831 115,036 126,075 148,971 109,333 112,145 120,745 24,348 25,118 25,363 25,320 26,973 26,322 118,119 122,667 132,771 131,814 135,820 131,312 89,358 105,748 112,493 95,950 98,151 110,842 2,217,531 2,235,104 2,490,255 2,841,557 2,939,166 2,646,825 8,137 21,258 25,252 24,680 29,234 15,789 2,741,899 2,804,965 3,108,818 3,419,525 3,522,511 3,244,479 (3,528,674) (3,828,863) (3,926,264) (3,857,045) (3,868,608) (4,158,897) 1,859,467 1,956,656 1,787,950 1,676,829 1,889,796 2,064,233 1,441,743 1,481,067 1,476,995 1,447,865 1,545,494 1,638,610 326,795 290,721 305,793 303,865 321,919 322,284 137,525 141,012 134,877 132,779 135,250 136,825 68,771 80,925 70,270 79,115 65,630 73,849 36,832 15,269 10,863 13,436 9,243 9,818 3,871,133 3,965,650 3,786,748 3,653,889 3,967,332 4,245,619 250,175 114,252 14,582 216,190 214,054 92,037 730 3,374 401 (1,927) 2,590 - 18,800 12,301 3,838 16,314 23,635 17,719 29,266 31,008 30,245 32,000 32,055 36,075 4,170,104 4,126,585 3,835,814 3,916,466 4,239,666 4,391,450
$ 641,430 $ 297,722 $ (90,450) $ 59,421 $ 371,058 $ 232,553
(continued)

112
State of NebraskaCHANGES IN NET ASSETS (Continued)2003 - 2012 (Dollars in Thousands) 2003 2004 2005 2006
Business-type Activities: Expenses Unemployment Insurance $ 160,664 $ 156,172 $ 114,496 $ 101,433 Lottery 61,455 73,264 77,128 83,440 Excess Liability 13,796 14,595 1,984 12,551 Cornhusker State Industries 6,103 7,868 10,509 10,552 Total expenses 242,018 251,899 204,117 207,976 Revenues Charges for services: Unemployment Insurance 123,393 132,379 133,840 154,413 Lottery 80,919 92,608 100,658 113,108 Excess Liability 6,686 9,683 10,949 12,903 Cornhusker State Industries 5,196 9,598 13,022 10,851 Total revenues 216,194 244,268 258,469 291,275 Total Business-type Activities Net Program Expense (25,824) (7,631) 54,352 83,299 Other Changes in Net Assets Unrestricted investment earnings 16,679 15,183 13,705 10,110 Miscellaneous - (3) (3) (423) Transfers (20,230) (20,591) (26,372) (27,602)Total other changes in net assets (3,551) (5,411) (12,670) (17,915)Total Business-type Activities Change in Net Assets $ (29,375) $ (13,042) $ 41,682 $ 65,384
Total Primary Government Change in Net Assets $ (155,772) $ 448,078 $ 598,661 $ 568,448
NOTE: The increases in taxes and change in net assets from 2004 to 2008 for governmental activities were primarily due to a strengthening economy. The decreases in taxes in 2009 and 2010 and change in net assets in 2009 were primarily due to the economic recession.

113
2007 2008 2009 2010 2011 2012
$ 93,939 $ 98,365 $ 242,201 $ 431,836 $ 329,576 $ 261,750 85,895 91,653 94,676 98,948 101,625 113,935 13,731 (2,707) 12,430 7,220 19,623 672 11,690 10,435 10,221 11,847 13,451 11,621 205,255 197,746 359,528 549,851 464,275 387,978 127,340 102,881 149,937 391,067 422,977 310,188 114,489 121,910 123,251 130,580 131,919 150,612 12,474 10,947 9,267 21,475 8,943 5,509 9,341 9,880 9,412 13,549 15,568 12,053 263,644 245,618 291,867 556,671 579,407 478,362 58,389 47,872 (67,661) 6,820 115,132 90,384 18,308 23,347 23,276 20,293 16,254 16,237 - - - 27 - - (29,266) (31,008) (30,245) (32,000) (32,055) (36,075) (10,958) (7,661) (6,969) (11,680) (15,801) (19,838)
$ 47,431 $ 40,211 $ (74,630) $ (4,860) $ 99,331 $ 70,546
$ 688,861 $ 337,933 $ (165,080) $ 54,561 $ 470,389 $ 303,099

114

115
State of NebraskaFUND BALANCESGOVERNMENTAL FUNDS2003 - 2012 (Dollars in thousands) 2003 2004 2005 2006 2007
General Fund Reserved $ 274 $ 525 $ 532 $ 482 $ 438 Unreserved (17,319) 207,282 408,771 691,757 971,205 Total general fund $ (17,045) $ 207,807 $ 409,303 $ 692,239 $ 971,643 All Other Governmental Funds Reserved $ 333,228 $ 347,660 $ 377,818 $ 619,319 $ 659,349 Unreserved Special revenue funds 765,310 879,041 936,316 893,536 1,014,579 Permanent funds 197,586 224,869 250,127 77,768 115,901 Other funds 30,030 32,206 34,295 47,071 51,784 Total all other governmental funds $ 1,326,154 $ 1,483,776 $ 1,598,556 $ 1,637,694 $ 1,841,613 (Dollars in thousands) 2008 2009 2010 2011 2012
General Fund Reserved $ 1,368 $ 1,062 $ 894 $ - $ - Unreserved 972,307 855,542 715,530 - - Nonspendable - - - 785 953 Committed - - - 313,202 383,379 Unassigned - - - 419,460 430,466 Total general fund $ 973,675 $ 856,604 $ 716,424 $ 733,447 $ 814,798 All Other Governmental Funds Reserved $ 687,095 $ 694,503 $ 729,377 $ - $ - Unreserved Special revenue funds 1,065,392 997,377 1,062,679 - - Permanent funds 91,759 23,073 67,754 - - Other funds 121,686 118,933 82,371 - - Nonspendable - - - 468,363 490,928 Restricted - - - 1,543,263 1,599,631 Committed - - - 69,619 73,327 Assigned - - - 32,439 37,032 Total all other governmental funds $ 1,965,932 $ 1,833,886 $ 1,942,181 $ 2,113,684 $ 2,200,918 NOTE: The classification of fund balances changed in 2011 with the implementation of GASB Statement No. 54.

116
State of NebraskaCHANGES IN FUND BALANCESGOVERNMENTAL FUNDS2003 - 2012 (Dollars in Thousands) 2003 2004 2005 2006 REVENUES: Taxes: Income $ 1,237,075 $ 1,402,371 $ 1,610,008 $ 1,802,161 Sales and Use 1,215,621 1,283,592 1,376,675 1,411,152 Petroleum 311,198 313,539 311,231 312,809 Excise 107,227 122,320 124,525 132,348 Business and Franchise 59,490 67,322 70,344 79,723 Other 25,187 33,089 68,885 35,369 Total Taxes 2,955,798 3,222,233 3,561,668 3,773,562 Federal Grants and Contracts 1,806,377 2,153,141 2,133,629 2,156,278 Licenses, Fees and Permits 177,317 183,314 198,970 196,966 Charges for Services 74,470 82,320 93,654 82,132 Investment Income 71,225 83,702 115,540 89,888 Rents and Royalties 44,561 39,845 41,437 45,951 Other 196,148 222,577 201,814 172,545 TOTAL REVENUES 5,325,896 5,987,132 6,346,712 6,517,322 EXPENDITURES: Current: General Government 252,230 240,354 405,798 296,209 Conservation of Natural Resources 88,716 92,682 98,067 104,118 Culture – Recreation 26,844 26,081 28,313 26,392 Economic Development and Assistance 83,378 80,531 81,172 87,462 Education 1,208,046 1,203,430 1,223,461 1,318,785 Higher Education - Colleges and University 461,325 438,225 451,404 482,229 Health and Social Services 2,219,154 2,337,338 2,475,952 2,605,402 Public Safety 236,277 262,344 285,732 287,735 Regulation of Business and Professions 116,560 127,079 139,086 151,850 Transportation 752,810 794,342 844,709 837,796 Capital Projects 27,773 19,162 19,048 25,101 Debt Service Principal 3,830 4,145 5,525 4,660 Interest 1,934 1,971 1,852 1,742 TOTAL EXPENDITURES 5,478,877 5,627,684 6,060,119 6,229,481 EXCESS (DEFICIENCY) OF REVENUES OVER (UNDER) EXPENDITURES (152,981) 359,448 286,593 287,841 OTHER FINANCING SOURCES (USES) Transfers In 147,825 126,343 152,721 171,981 Transfers Out (126,721) (104,664) (126,349) (144,379) Other 5,013 1,347 3,311 6,631 NET CHANGE IN FUND BALANCE (126,864) 382,474 316,276 322,074 BEGINNING FUND BALANCE 1,435,973 1,309,109 1,691,583 2,007,859 ENDING FUND BALANCE $ 1,309,109 $ 1,691,583 $ 2,007,859 $ 2,329,933
DEBT SERVICE AS A PERCENTAGE OF NONCAPITAL EXPENDITURES <1% <1% <1% <1% NOTE: The increases in taxes and fund balances from 2004 to 2008 were primarily due to a strengthening economy. The increase of general government expenditures in 2005 was due to settling a low-level radioactive waste lawsuit. The decreases in taxes and fund balances in 2009 and 2010 were primarily due to the economic recession.

117
2007 2008 2009 2010 2011 2012 $ 1,860,712 $ 1,950,363 $ 1,790,025 $ 1,675,922 $ 1,889,223 $ 2,063,322 1,437,994 1,474,251 1,475,234 1,452,362 1,544,303 1,634,346 329,490 295,321 309,626 307,005 326,016 327,295 135,449 138,799 134,877 132,779 135,250 136,825 68,771 80,925 70,270 79,115 65,630 73,849 36,832 15,269 10,863 13,436 9,243 9,818 3,869,248 3,954,928 3,790,895 3,660,619 3,969,665 4,245,455 2,225,668 2,256,362 2,514,288 2,865,989 2,967,939 2,662,605 211,167 259,000 268,817 266,899 282,078 295,286 92,370 108,301 137,234 96,165 96,779 102,633 246,753 110,716 10,508 212,353 209,509 87,948 49,968 51,809 54,549 49,286 55,158 57,838 173,948 129,861 123,953 146,216 123,754 124,973 6,869,122 6,870,977 6,900,244 7,297,527 7,704,882 7,576,738 311,324 430,310 439,614 439,330 450,474 420,143 119,533 112,333 127,562 149,556 156,268 150,970 26,250 26,226 28,305 30,183 30,290 28,434 89,440 85,807 88,824 96,584 113,506 102,902 1,366,330 1,448,170 1,565,692 1,710,935 1,810,806 1,581,956 528,861 558,282 571,268 571,288 561,090 557,162 2,659,210 2,715,383 2,920,472 3,004,678 3,079,889 3,139,042 359,514 383,156 370,605 351,084 375,334 378,982 155,195 130,330 123,476 131,884 122,852 122,025 763,907 853,521 915,980 842,583 832,394 932,445 27,494 27,289 25,333 30,584 16,676 28,123 6,575 6,215 7,625 6,105 3,380 2,865 1,666 1,459 1,256 976 647 684 6,415,299 6,778,481 7,186,012 7,365,770 7,553,606 7,445,733 453,823 92,496 (285,768) (68,243) 151,276 131,005 155,268 253,986 171,202 226,156 175,684 170,673 (126,002) (222,978) (140,957) (194,156) (143,629) (134,598) 234 2,847 6,406 4,358 5,195 1,505 483,323 126,351 (249,117) (31,885) 188,526 168,585 2,329,933 2,813,256 2,939,607 2,690,490 2,658,605 2,847,131 $ 2,813,256 $ 2,939,607 $ 2,690,490 $ 2,658,605 $ 2,847,131 $ 3,015,716
<1% <1% <1% <1% <1% <1%

118
State of NebraskaINDIVIDUAL INCOME TAX RATES2003 - 2012 Tax Brackets Bracket 1 Bracket 2 Bracket 3 Bracket 4 Single 2003 - 2005 Income Range $0-2,400 $2,400-17,000 $17,000-26,500 Over $26,5002006 - 2012 Income Range $0-2,400 $2,400-17,500 $17,500-27,000 Over $27,0002003 - 2012 Rates 2.56% 3.57% 5.12% 6.84% Heads of Household 2003 - 2005 Income Range $0-3,800 $3,800-24,000 $24,000-35,000 Over $35,0002006 Income Range $0-3,800 $3,800-25,000 $25,000-35,000 Over $35,0002007 - 2012 Income Range $0-4,500 $4,500-28,000 $28,000-40,000 Over $40,0002003 - 2012 Rates 2.56% 3.57% 5.12% 6.84% Married Filing Joint 2003 - 2005 Income Range $0-4,000 $4,000-30,000 $30,000-46,750 Over $46,7502006 Income Range $0-4,000 $4,000-31,000 $31,000-50,000 Over $50,0002007 - 2012 Income Range $0-4,800 $4,800-35,000 $35,000-54,000 Over $54,0002003 - 2012 Rates 2.56% 3.57% 5.12% 6.84% Married Filing Separate 2003 - 2005 Income Range $0-2,000 $2,000-15,000 $15,000-23,375 Over $23,3752006 Income Range $0-2,000 $2,000-15,500 $15,500-25,000 Over $25,0002007 - 2012 Income Range $0-2,400 $2,400-17,500 $17,500-27,000 Over $27,0002003 - 2012 Rates 2.56% 3.57% 5.12% 6.84% SOURCE: Nebraska Department of Revenue

119
State of NebraskaINDIVIDUAL INCOME TAX LIABILITY BY INCOME LEVELTax Years 2001 and 2010
2001 Federal Adjusted Net Liability After Number of Gross Income Number of Nonrefundable Returns With Net LiabilityLevel Returns Credits Liability Percent Less Than $10,000 198,354 $ 5,955,885 56,951 0.48%$10,000 - 24,999 189,920 $ 69,375,403 183,668 5.57%$25,000 - 49,999 222,387 $ 226,556,024 220,839 18.20%$50,000 - 99,999 181,173 $ 444,860,698 180,098 35.72%$100,000 and Over 57,461 $ 498,491,127 55,778 40.03%State Total 849,295 $ 1,245,239,137 697,334 100.00%
2010 Federal Adjusted Net Liability After Number of Gross Income Number of Nonrefundable Returns With Net LiabilityLevel Returns Credits Liability Percent Less Than $10,000 144,292 $ 3,456,783 50,266 0.21%$10,000 - 24,999 198,378 $ 31,203,820 183,564 1.89%$25,000 - 49,999 226,644 $ 166,671,067 221,663 10.07%$50,000 - 99,999 224,158 $ 470,874,014 221,085 28.46%$100,000 and Over 121,945 $ 982,269,847 117,872 59.37%State Total 915,417 $ 1,654,475,531 794,450 100.00% SOURCE: Department of Revenue 2001 and 2010 Annual Reports NOTE: Due to confidentiality issues, the names of the ten largest revenue payers are not available. The categories presented are intended to provide alternative information regarding the sources of the state's revenue. Tax year 2010 is the most recent year for which data is available.

120
State of NebraskaTAXABLE SALES BY INDUSTRYCalendar Years 2002 and 2011 2002 2011 Agriculture, Forestry, Fishing & Hunting $ 52,550,800 $ 76,211,151 Mining 35,370,917 51,250,770 Utilities 1,497,042,498 2,223,128,012 Construction 288,544,394 518,678,399 Manufacturing 500,828,094 501,826,765 Wholesale Trade 1,077,158,381 1,635,203,615 Retail Trade 7,839,422,786 9,446,715,571 Transportation 70,177,193 91,161,436 Warehousing Services 656,465 41,131,138 Information 804,499,303 845,406,183 Finance & Insurance 74,880,401 27,289,357 Real Estate, Rental & Leasing Services 121,692,432 217,679,895 Professional, Scientific & Technical Services 309,673,729 313,763,339 Management of Companies & Enterprises Services 283,502 4,961,437 Administration, Support, Waste Management, Remedial Services 342,678,318 490,073,874 Educational Services 59,154,826 26,190,076 Health Care & Social Assistance Services 32,058,754 40,486,540 Arts, Entertainment & Recreation Services 274,088,457 316,715,014 Accommodation & Food Services 1,930,357,368 2,820,677,755 Other Services 704,108,445 882,524,778 Public Administration 108,668,267 219,179,228 Unclassified 16,946,403 4,553,074 Nebraska Total 16,140,841,733 20,794,807,407 Non-Nebraska (1) 2,359,053,663 4,124,104,270
Nebraska - Total Sales $ 18,499,895,396 $ 24,918,911,677 Direct sales tax rate Jan. 1 - Sept 30 Jan. 1 - Dec. 31 5.0% 5.5% Oct. 1 - Dec 31 5.5% SOURCE: Nebraska Department of Revenue - Annual Report Sales Tax Statistics by Nebraska Business Classification NOTES: (1) Sales made by non-Nebraska vendors, goods delivered to Nebraska, sales tax remitted to Nebraska.

121
State of NebraskaRATIOS OF OUTSTANDING DEBT 2003 – 2012 (Dollars in thousands) 2003 2004 2005 2006 2007 2008 2009 2010 2011 2012
Governmental Activities Lease rental bonds (blended component units) $ 30,960 $ 27,265 $ 23,430 $ 19,435 $ 15,240 $ 10,835 $ 4,850 $ - $ - $ - Capital leases under certificates of participation 29,836 27,235 24,927 22,965 22,072 19,509 22,182 23,181 27,308 25,358 Obligations under other financing arrangements 10,555 11,230 11,430 16,185 13,805 14,785 15,660 14,405 16,220 14,860 Total Primary Government $ 71,351 $ 65,730 $ 59,787 $ 58,585 $ 51,117 $ 45,129 $ 42,692 $ 37,586 $ 43,528 $ 40,218
Debt as a Percentage of Personal Income 0.13% 0.12% 0.10% 0.10% 0.08% 0.07% 0.06% 0.05% 0.06% 0.05% Amount of Debt per Capita $ 41 $ 38 $ 34 $ 33 $ 29 $ 25 $ 24 $ 21 $ 24 $ 22 NOTE: Details regarding Lease Commitments, Obligations Under Other Financing Arrangements, and Bonds Payable can be found in Notes 8, 9 & 13 of the financial statements. Population figures from the Population, Personal and Per Capita Income schedule. * 2012 figures were computed using 2011 census information as 2012 census data is not available.

122
State of Nebraska
COMPARATIVE UNEMPLOYMENT NEBRASKA AND UNITED STATES 2002 - 2011 NEBRASKA UNITED STATES NEBRASKA UNEMPLOYMENT UNEMPLOYMENT TOTAL TOTAL AS PERCENT OF AS PERCENT OFYEAR LABOR FORCE EMPLOYMENT UNEMPLOYMENT LABOR FORCE LABOR FORCE2002 954,013 920,662 33,351 3.5 % 5.8 %2003 976,034 936,664 39,370 4.0 6.0 2004 985,340 947,882 37,458 3.8 5.5 2005 986,296 949,070 37,226 3.8 5.1 2006 974,476 945,270 29,206 3.0 4.6 2007 983,438 953,769 29,669 3.0 4.6 2008 995,635 962,418 33,217 3.3 5.8 2009 983,517 938,080 45,437 4.6 9.3 2010 976,859 931,414 45,445 4.7 9.6 2011 1,005,455 960,830 44,625 4.4 8.9 SOURCE: Nebraska Statistics - Nebraska Department of Labor, Labor Market Info United States Unemployment – U.S. Department of Labor, Bureau of Labor Statistics

123
State of NebraskaPOPULATION, PERSONAL AND PER CAPITA INCOMENEBRASKA AND UNITED STATES Calendar Years 2002 – 2011 NEBRASKA UNITED STATES POPULATION PERSONAL INCOME PER CAPITA POPULATION PERSONAL INCOME PER CAPITAYEAR (IN MILLIONS) INCOME (IN MILLIONS) INCOME2002 1,726,753 50,390 29,182 287,984,799 8,872,521 30,809 2003 1,738,013 53,388 30,718 290,850,005 9,150,108 31,460 2004 1,747,704 55,858 31,961 293,656,842 9,717,173 33,090 2005 1,758,787 58,019 32,988 296,410,404 10,224,761 34,495 2006 1,768,331 60,826 34,397 299,398,484 10,860,917 36,276 2007 1,774,571 64,220 36,189 301,621,157 11,631,571 38,564 2008 1,783,432 69,820 39,150 304,059,724 12,225,589 40,208 2009 1,796,619 70,565 39,277 307,006,550 12,165,474 39,626 2010 1,830,429 72,620 39,674 309,349,689 12,357,113 39,945 2011 1,842,641 78,220 42,450 311,591,917 12,949,905 41,560 SOURCE: U.S. Department of Commerce, Bureau of Economic Analysis.
State of NebraskaTEN LARGEST EMPLOYERS2005 and 1995 December 2005 December 1995 Total Employment 949,070 Total Employment 874,357 NAME OF COMPANY RANK NUMBER OF
EMPLOYEES% OF TOTAL
EMPLOYMENT RANK NUMBER OF EMPLOYEES
% OF TOTAL EMPLOYMENT
State of Nebraska (excluding University) 1 18,653 1.965 1 17,700 2.024 US Government (excluding Department of Defense) 2 15,403 1.623 2 16,000 1.830 Offutt Air Force Base 3 11,137 1.173 4 11,000 1.258 Tyson Foods, Inc. (1995-IBP) 4 11,000 1.159 5 9,400 1.075 University of Nebraska * 5 10,547 1.111 3 14,900 1.704 Walmart 6 9,755 1.028 12 4,800 0.549 Omaha Public Schools 7 8,073 0.851 6 8,600 0.984 Union Pacific Corporation 8 7,200 0.759 8 6,300 0.721 Alegent Health ** 9 6,675 0.703 11 5,100 0.583 First Data Corp. 10 6,300 0.664 7 8,000 0.915 Mutual of Omaha Ins. Co. 9 6,000 0.686 ConAgra 10 5,900 0.675 SOURCES: 2005 -Nebraska Databook published by the Department of Economic Development, Research Division 1995- Nebraska Blue Book 1996-97 NOTES: * University of Nebraska - Medical Center, University of Nebraska - Lincoln, University of Nebraska at Omaha, University of Nebraska at Kearney** Alegent was formed from the 1995 employers Bergan Mercy Hospital and Immanual Medical Center Calendar year 2005 is the most recent year for which data is available.

124
State of Nebraska PUBLIC AND STATE OPERATED SCHOOL ENROLLMENT PREKINDERGARTEN – GRADE 12 2002/03 – 2011/12 ACADEMIC PRE KDG. GRADES GRADES GRADES GRADES TOTAL
YEAR AND KDG. 1 – 3 4 – 6 7 – 9 10 – 12 ALL GRADES2002 – 2003 25,931 60,645 64,003 68,546 66,257 285,382 2003 – 2004 26,639 60,673 63,120 69,359 65,751 285,542 2004 – 2005 26,848 61,011 62,210 69,253 65,237 284,559 2005 – 2006 28,028 61,593 61,478 68,325 66,124 285,548 2006 – 2007 29,013 62,781 61,358 67,008 66,975 287,135 2007 – 2008 32,666 63,964 61,471 65,729 67,281 291,111 2008 – 2009 33,835 65,227 62,079 64,839 66,517 292,497 2009 – 2010 35,525 66,401 63,340 64,349 65,737 295,352 2010 – 2011 36,171 67,702 64,688 64,429 65,560 298,550 2011 – 2012 36,682 68,470 65,974 64,341 65,850 301,317
SOURCE: Statistics and Facts About Nebraska Schools, Nebraska Department of Education.
State of NebraskaPUBLIC HIGHER EDUCATION INSTITUTIONSTOTAL FALL HEADCOUNT ENROLLMENT2002 - 2011 2002 2003 2004 2005 2006 2007 2008 2009 2010 2011 COLLEGES AND UNIVERSITIES: Chadron State College 2,712 2,667 2,569 2,472 2,577 2,660 2,649 2,712 2,759 2,851 Peru State College 1,687 1,618 1,683 1,959 2,124 2,307 2,328 2,492 2,518 2,358 Wayne State College 3,220 3,305 3,398 3,322 3,407 3,527 3,566 3,631 3,569 3,517 University of Nebraska Lincoln (1) 23,241 22,734 22,012 21,937 22,378 22,877 23,862 24,525 24,993 24,926 Omaha 14,451 13,931 13,824 14,093 13,906 14,156 14,213 14,620 14,665 14,712 Kearney 6,395 6,311 6,382 6,445 6,468 6,478 6,543 6,650 6,753 7,100 Medical Center 2,819 2,865 2,904 2,995 3,067 2,206 3,194 3,237 3,494 3,625 TOTAL COLLEGES AND UNIVERSITIES 54,525 53,431 52,772 53,223 53,927 54,211 56,355 57,867 58,751 59,089
COMMUNITY COLLEGES Central CC (2) 6,417 6,364 6,524 6,564 6,543 6,531 6,885 7,320 7,527 7,521 Metropolitan CC 12,253 12,177 12,961 13,237 14,098 14,804 15,055 17,003 18,523 18,518 Mid-Plains CC 3,020 3,001 2,957 2,607 3,030 2,715 2,708 2,765 2,988 2,623 Northeast CC 4,832 4,805 5,053 5,101 5,261 5,149 5,140 5,205 5,377 5,161 Southeast CC 8,912 8,451 10,079 10,059 9,594 9,603 10,419 11,556 12,242 11,479 Western CC 2,152 2,420 2,659 2,283 1,918 2,233 2,939 2,304 2,395 2,240 TOTAL COMMUNITY COLLEGES 37,586 37,218 40,233 39,851 40,444 41,035 43,146 46,153 49,052 47,542 TOTAL ALL INSTITUTIONS 92,111 90,649 93,005 93,074 94,371 95,246 99,501 104,020 107,803 106,631
NOTE: (1) University of Nebraska-Lincoln count includes Nebraska College of Technical Agriculture - Curtis for all years. (2) Central CC reporting under continuous enrollment practice abandoned in 1996. Enrollment numbers have been retroactively changed to the reporting practice consistent with that of the other Community Colleges. SOURCE: Nebraska Coordinating Commission for Postsecondary Education

125
State of NebraskaFULL TIME EQUIVALENT PERMANENTEMPLOYEES BY FUNCTION2002 - 2011 FUNCTION 2002 2003 2004 2005 2006 2007 2008 2009 2010 2011 Conservation 305 308 316 313 313 318 309 318 329 323 Regulation 351 345 355 358 372 362 364 358 357 350 Economic Development 537 528 542 526 532 525 452 478 441 459 Culture and Recreation 584 580 569 579 579 564 556 542 519 495 Education 575 578 587 597 601 590 593 606 598 586 Transportation 2,201 2,182 2,193 2,175 2,163 2,137 2,153 2,175 2,147 2,118 General Government 2,853 2,624 2,687 2,718 2,769 2,765 2,723 2,777 2,692 2,706 Public Safety 3,199 3,285 3,260 3,303 3,349 3,380 3,414 3,457 3,409 3,369 Health & Social Services 5,834 6,076 6,056 6,115 6,044 5,802 5,665 5,738 5,524 5,433
16,439 16,506 16,565 16,684 16,722 16,443 16,229 16,449 16,016 15,839 SOURCE: Nebraska State Government - State Personnel Division - 2011 Almanac

126
State of Nebraska OPERATING INDICATORS BY FUNCTION 2003 - 2012 2003 2004 2005 2006 2007 2008 2009 2010 2011 2012 General Government Department of Revenue Percentage of returns filed electronically N/A N/A 53.6% 57.6% 62.5% 66.0% 70.0% 78.0% 85.0% 88.0% Percentage of direct deposit refunds N/A N/A 39.7% 43.9% 54.5% 75.0% 77.0% 72.0% 71.0% 80.5% Department of Roads Percentage of Roads in very good or good condition (1) 84% 85% 85% 80% 79% 81% 79% 75% 74% N/AConservation of Natural Resources Department of Environmental Quality Inspections by field office staff Air Quality N/A N/A N/A 82 186 129 129 133 148 139 Water Quality N/A N/A N/A 543 999 1,158 1,147 1,384 1,502 1,591 Waste Management N/A N/A N/A 110 179 137 140 141 146 153 Culture - Recreation Game and Parks Commission Park visitors (1,2) 9,885,628 10,085,789 10,293,381 9,997,632 10,193,030 9,910,097 8,780,619 10,441,504 9,703,332 N/A Hatchery fish raised (in millions) (1) 5.2 14.2 6.8 15.6 25.6 22.8 35.6 46.4 35.5 N/AEducation Department of Education Fall Enrollment Pre-K to 12th grade 285,542 284,559 285,548 287,135 291,111 292,497 295,352 298,550 301,317 N/A State Colleges and Universities 53,431 52,772 53,223 53,927 54,211 56,355 57,867 58,751 59,089 N/A Public Community Colleges 37,218 40,233 39,851 40,444 41,035 43,146 46,153 49,052 47,542 N/AHealth and Social Services Health and Human Services Child Support Payments Number of Payments Received N/A 1,266,853 1,316,154 1,344,778 1,383,619 1,444,202 1,471,974 1,483,868 1,486,397 1,517,767 Number of Payments Disbursed N/A 1,111,672 1,127,651 1,153,771 1,202,635 1,156,102 1,312,748 1,332,638 1,362,598 1,387,684 Medicaid (average monthly) Medicaid recipients 201,534 197,152 198,757 200,670 201,009 203,513 208,696 224,459 235,353 237,543 Percentage of Nebraska population 11.6% 11.3% 11.3% 11.3% 11.3% 11.4% 11.6% 12.3% 12.8% N/A Food Stamps (average monthly) Number of households 41,620 47,292 49,726 51,146 51,915 52,162 55,178 68,098 75,460 76,776 Percentage of Nebraska households 6.2% 6.9% 7.1% 7.3% 7.3% 7.3% 7.7% 9.3% 10.2% N/APublic Safety Department of Correctional Services Inmate population (average monthly) (1) 4,871 4,938 5,010 5,145 5,222 5,289 5,395 5,469 5,602 N/A Percentage of Nebraska population 0.28% 0.28% 0.29% 0.29% 0.29% 0.30% 0.30% 0.30% 0.30% N/A Total Admissions (1) 2,753 2,662 2,924 3,039 2,902 2,801 2,709 2,648 2,956 N/A Total Releases (1) 2,643 2,902 2,800 2,969 3,092 2,789 2,598 2,544 2,861 N/A State Patrol Miles Patrolled (1) 10,198,444 10,395,505 10,087,966 10,130,500 10,348,580 10,489,515 10,161,183 10,119,800 9,360,000 N/A Accidents Investigated (1) 2,557 2,228 2,960 2,315 2,392 1,963 2,331 2,430 2,293 N/ATransportation Department of Motor Vehicles Motor Vehicle Registrations (1) Automobiles 1,081,868 1,088,620 1,106,684 1,112,320 1,122,877 1,140,386 1,147,354 1,148,305 1,158,374 N/A Trucks Farm 147,571 148,278 148,625 147,509 157,282 160,264 162,778 165,760 171,458 N/A Commercial / Other 378,615 383,024 389,947 392,589 388,098 389,686 392,120 396,004 400,746 N/A Motorcycles 29,794 32,916 36,622 40,065 43,387 49,191 50,322 51,359 53,773 N/A NOTES: (1) Data is provided on a calendar basis. (2) Park visitation is counted in daily visits. N/A - Not Available SOURCE: State Agencies: Department of Revenue, Department of Roads, Department of Environmental Quality, Game and Parks Commission, Department of Education, Health and Human Services, Department of Correctional Services, Nebraska State Patrol, Department of Motor Vehicles

127
State of Nebraska
CAPITAL ASSET STATISTICS BY FUNCTION
2003 - 2012 2003 2004 2005 2006 2007 2008 2009 2010 2011 2012 General Government Department of Administrative Services Buildings 285 285 285 285 283 291 288 283 278 277 Vehicles 1,264 1,182 1,006 1,034 1,371 1,093 1,134 1,075 1,077 1,083 Conservation of Natural Resources Game and Parks Commission Acres of state park and wildlife land (in thousands) 140 143 146 148 149 149 149 150 150 151 Culture - Recreation Game and Parks Commission State Parks 8 8 8 8 8 8 8 8 8 8 Historical Parks 10 10 10 10 10 10 10 10 10 10 Recreation and wildlife areas 320 320 322 322 322 325 327 328 323 321 Fish hatcheries 5 5 5 5 5 5 5 5 5 5 Education NETV Commission Towers, antennas and transmitters 60 60 60 56 60 60 42 42 42 42 Public Safety State Patrol Pursuit Vehicles 429 479 442 364 351 474 474 432 384 436 Department of Corrections Buildings 126 126 124 129 126 143 135 131 134 135 Transportation Department of Roads Highway miles (calendar year) 9,959 9,959 9,953 9,950 9,949 9,949 9,949 9,950 9,945 N/A Heavy trucks, plows and graders 1,087 1,085 1,083 1,068 1,072 1,053 1,120 1,095 1,109 1,063 NOTE: Other agencies, including those in the Economic Development, Health and Social Services and Regulation functional areas are not capital asset intensive. SOURCE: State Agencies: Department of Administrative Services, Game and Parks Commission, NETV Commission, Nebraska State Patrol, Department of Correctional Services, and Department of Roads

128
State of Nebraska
MISCELLANEOUS DATA June 30, 2012 Date Entered Union March 1, 1867 (37th State) Form of Government Legislative – Executive – Judicial Land Area 77,358 square miles (16th largest in U.S.) Elevation 840 to 5,424 feet above sea level Capital Lincoln Largest City Omaha Origin of Name From Oto Indian word "Nebrathka" meaning "flat water" Nickname Cornhusker State (from method of harvesting or "husking" corn by hand) SOURCE: Nebraska Blue Book, 2010-2011.

Acknowledgments
The State Accounting Division of Administrative Services prepared the Comprehensive Annual Financial Report. The following State Accounting Division staff were key members in the preparation of the report:
Bruce Snyder, CPA, CGFMAmy Wilson, CPA, CGFMSheryl HesseltineLauren DyerKaty Steffensmeier, student intern
Special acknowledgment goes to:
All fiscal and accounting staff throughout the State whose cooperation and efforts contributed to the compilation of the financial information.
Report produced by:
State Accounting DivisionSuite 1309, State CapitolLincoln, NE 68509-4664
Report located on our website: www.das.nebraska.gov/accounting/