state of general aviation -...
TRANSCRIPT

State of General Aviation 2019
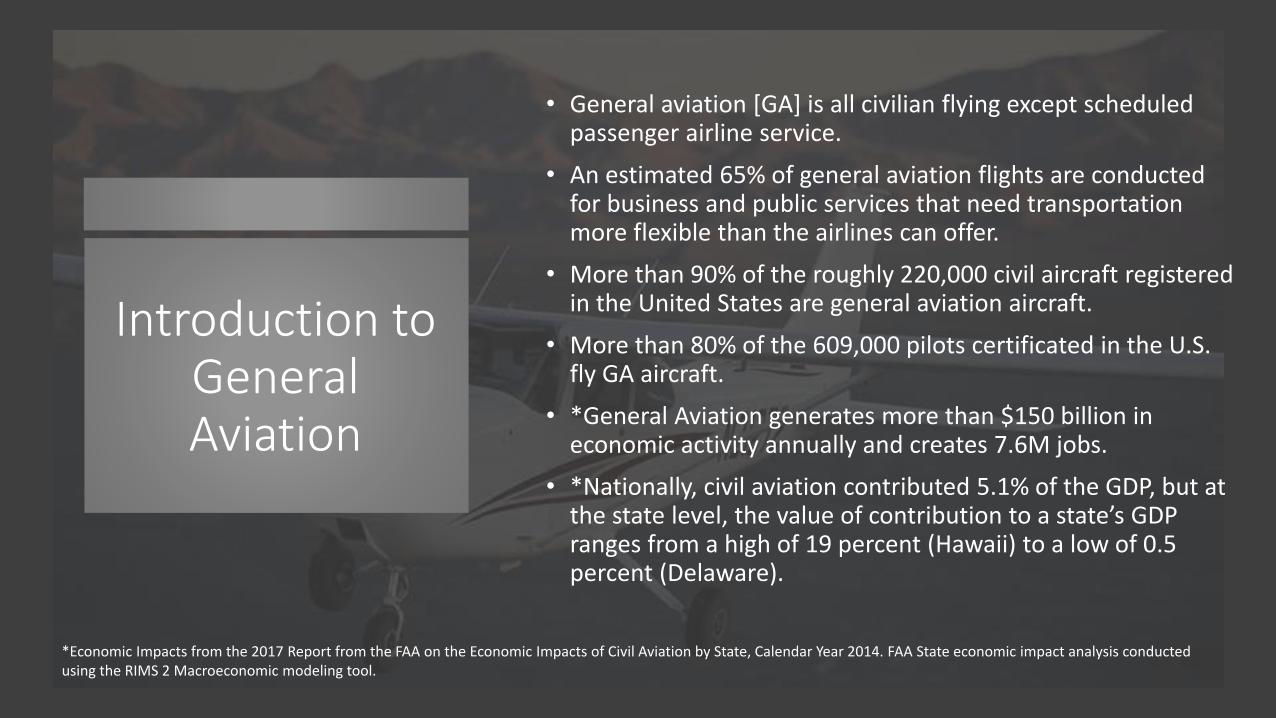
Introduction to General Aviation
• General aviation [GA] is all civilian flying except scheduled passenger airline service.
• An estimated 65% of general aviation flights are conducted for business and public services that need transportation more flexible than the airlines can offer.
• More than 90% of the roughly 220,000 civil aircraft registered in the United States are general aviation aircraft.
• More than 80% of the 609,000 pilots certificated in the U.S. fly GA aircraft.
• *General Aviation generates more than $150 billion in economic activity annually and creates 7.6M jobs.
• *Nationally, civil aviation contributed 5.1% of the GDP, but at the state level, the value of contribution to a state’s GDP ranges from a high of 19 percent (Hawaii) to a low of 0.5 percent (Delaware).
*Economic Impacts from the 2017 Report from the FAA on the Economic Impacts of Civil Aviation by State, Calendar Year 2014. FAA State economic impact analysis conducted using the RIMS 2 Macroeconomic modeling tool.

Executive Summary
General Aviation [GA] activity increased in 2017; the number of aircraft handled by ATC was up nearly 2%, the number of hours flown was up more than 2%, and number of tower operations increased by 1%.
GA generates $39B in direct economic output and 7.6M jobs according to the latest FAA analysis
Student, Private, and Commercial certificate issuances were up about 4% in 2017, but ATP certificate issuances were down 53% to 4,449
CFI rating issuances increased more than 5%
Instrument rating issuances were up 5%
GA shipments (aircraft) were up 2.5% in 2017
GA fatal accidents were down 14.5% in 2017
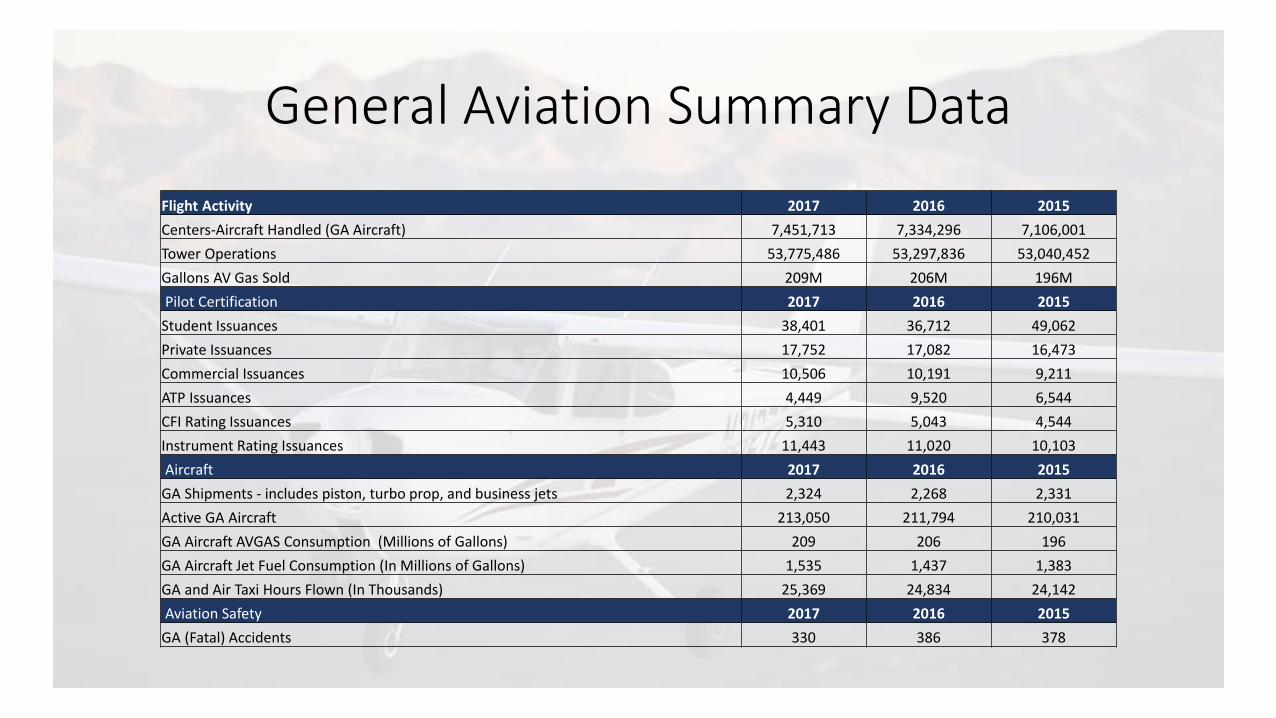
General Aviation Summary Data
Flight Activity 2017 2016 2015
Centers-Aircraft Handled (GA Aircraft) 7,451,713 7,334,296 7,106,001
Tower Operations 53,775,486 53,297,836 53,040,452
Gallons AV Gas Sold 209M 206M 196M
Pilot Certification 2017 2016 2015
Student Issuances 38,401 36,712 49,062
Private Issuances 17,752 17,082 16,473
Commercial Issuances 10,506 10,191 9,211
ATP Issuances 4,449 9,520 6,544
CFI Rating Issuances 5,310 5,043 4,544
Instrument Rating Issuances 11,443 11,020 10,103
Aircraft 2017 2016 2015
GA Shipments - includes piston, turbo prop, and business jets 2,324 2,268 2,331
Active GA Aircraft 213,050 211,794 210,031
GA Aircraft AVGAS Consumption (Millions of Gallons) 209 206 196
GA Aircraft Jet Fuel Consumption (In Millions of Gallons) 1,535 1,437 1,383
GA and Air Taxi Hours Flown (In Thousands) 25,369 24,834 24,142
Aviation Safety 2017 2016 2015
GA (Fatal) Accidents 330 386 378
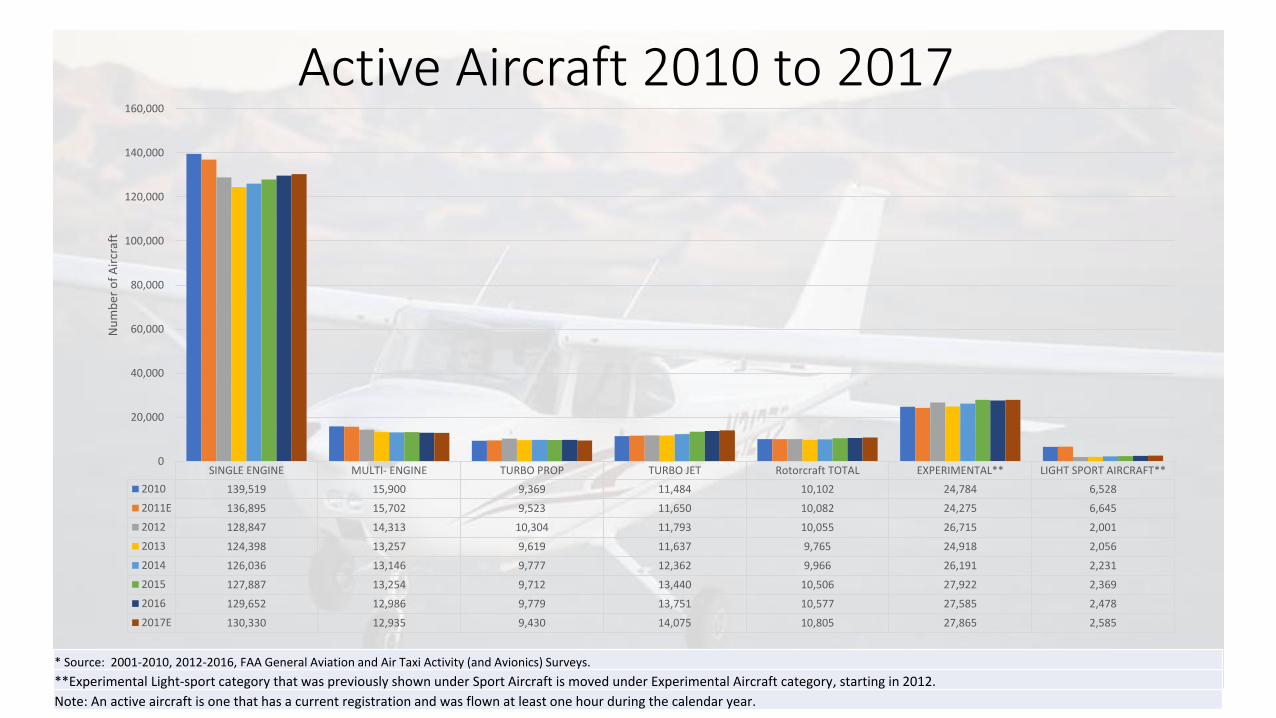
Active Aircraft 2010 to 2017
SINGLE ENGINE MULTI- ENGINE TURBO PROP TURBO JET Rotorcraft TOTAL EXPERIMENTAL** LIGHT SPORT AIRCRAFT**
2010 139,519 15,900 9,369 11,484 10,102 24,784 6,528
2011E 136,895 15,702 9,523 11,650 10,082 24,275 6,645
2012 128,847 14,313 10,304 11,793 10,055 26,715 2,001
2013 124,398 13,257 9,619 11,637 9,765 24,918 2,056
2014 126,036 13,146 9,777 12,362 9,966 26,191 2,231
2015 127,887 13,254 9,712 13,440 10,506 27,922 2,369
2016 129,652 12,986 9,779 13,751 10,577 27,585 2,478
2017E 130,330 12,935 9,430 14,075 10,805 27,865 2,585
0
20,000
40,000
60,000
80,000
100,000
120,000
140,000
160,000N
um
ber
of
Air
craf
t
* Source: 2001-2010, 2012-2016, FAA General Aviation and Air Taxi Activity (and Avionics) Surveys.
**Experimental Light-sport category that was previously shown under Sport Aircraft is moved under Experimental Aircraft category, starting in 2012.
Note: An active aircraft is one that has a current registration and was flown at least one hour during the calendar year.
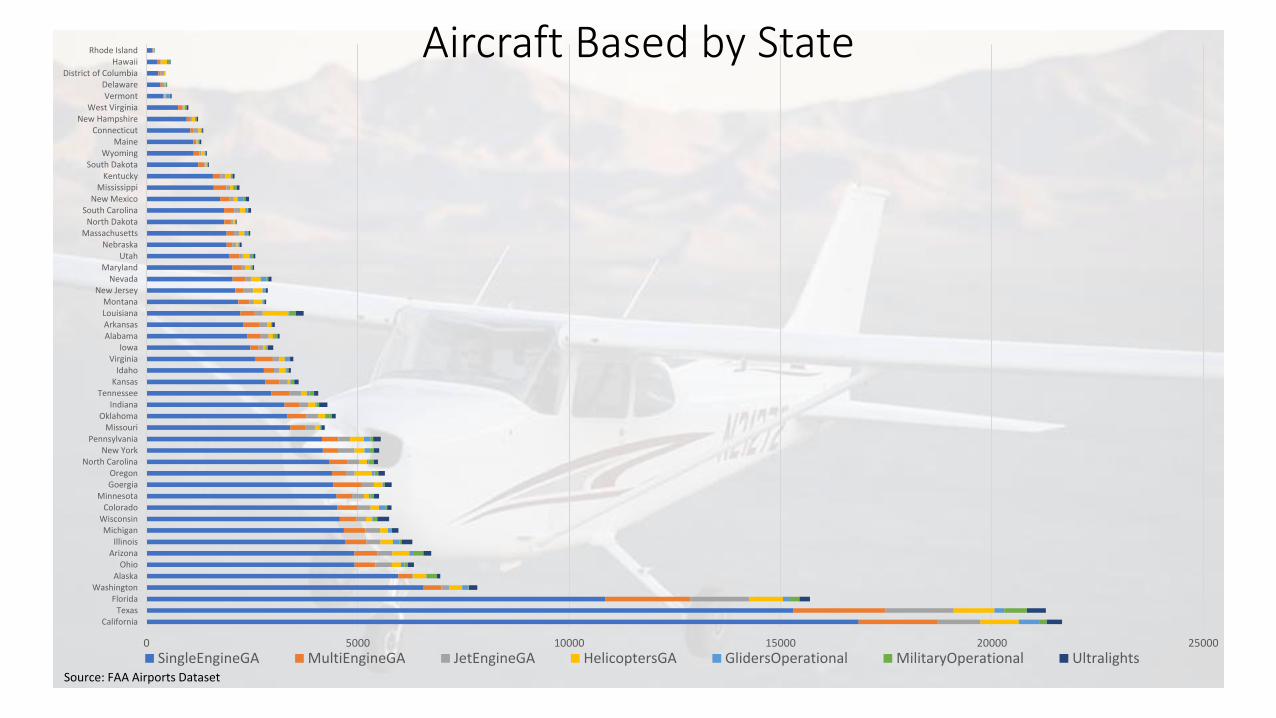
Aircraft Based by State
0 5000 10000 15000 20000 25000
CaliforniaTexas
FloridaWashington
AlaskaOhio
ArizonaIllinois
MichiganWisconsinColorado
MinnesotaGoergiaOregon
North CarolinaNew York
PennsylvaniaMissouri
OklahomaIndiana
TennesseeKansas
IdahoVirginia
IowaAlabamaArkansasLouisianaMontana
New JerseyNevada
MarylandUtah
NebraskaMassachusetts
North DakotaSouth Carolina
New MexicoMississippi
KentuckySouth Dakota
WyomingMaine
ConnecticutNew Hampshire
West VirginiaVermont
DelawareDistrict of Columbia
HawaiiRhode Island
SingleEngineGA MultiEngineGA JetEngineGA HelicoptersGA GlidersOperational MilitaryOperational UltralightsSource: FAA Airports Dataset

Total Operations (Takeoffs and Landings) Trending Down 2000 to 2018 2,878,030 2,802,065
3,037,939 3,124,604 3,038,5292,719,671 2,536,030 2,570,244 2,610,457 2,480,627
3,694,212 3,677,6353,605,868 3,313,773
3,961,546
3,546,734
2,706,1962,891,362
2,084,5782,101,019
1,588,2621,386,528
1,412,3151,396,256
1,429,311
1,328,375
1,239,0241,290,027
1,247,5491,232,347
2000 2001 2002 2003 2004 2005 2006 2007 2008 2009 2010 2011 2012 2013 2014 2015 2016 2017 2018
Jet Piston Turbo Prop
Source: FAA TFMSC data 2000-2018

General Aviation and Air Taxi Hours Flown (In Thousands)
12,161 11,844 11,441 10,706 10,39511,217 11,865 11,878
1,818 1,7821,766
1,646 1,5731,608
1,683 1,666
2,325 2,463 2,7332,587 2,613
2,5382,708 2,674
3,375 3,407 3,4183,488 3,881
3,8373,847 4,274
3,405 3,411 3,454
2,949 3,242 3,294
3,128 3,237
1,226 1,203 1,243
1,191 1,2441,295
1,2241,248311 278 169
173 165191
187197
-4,000
1,000
6,000
11,000
16,000
21,000
26,000
2010 2011E 2012 2013 2014 2015 2016 2017E
SINGLE ENGINE MULTI- ENGINE TURBO PROP TURBO JET TOTAL EXPERI- MENTAL** LIGHT SPORT AIRCRAFT**
* Source: 2001-2010, 2012-2016, FAA General Aviation and Air Taxi Activity (and Avionics) Surveys.
**Experimental Light-sport category that was previously shown under Sport Aircraft is moved under Experimental Aircraft category, starting in 2012.
Note: An active aircraft is one that has a current registration and was flown at least one hour during the calendar year.

General Aviation Annual Fuel Consumption (in millions of gallons)
0
200
400
600
800
1,000
1,200
1,400
1,600
1,800
2010 2011E 2012 2013 2014 2015 2016 2017E
SINGLE ENGINE MULTI- ENGINE TURBO PROP TURBO JET
Total AVGAS Consumed by GA in 2017 = 209M gallons Total Jet Fuel Consumed by GA in 2017 = 1.8B gallons
Source: FAA historical data tables 28-31

Top 10 Busiest GA Airports
Airport Name Location ID
Operations Commercial (Air Carrier)
Operations Air Taxi
Operations GA Local
Operations GA Itinerant
Operations Military
Total GA (Local + Itinerant)
Ops
VAN NUYS VNY 0 16,408 155,420 332,117 557 487,537
PHOENIX DEER VALLEY DVT 12 4,670 130,886 243,075 134 373,961
CENTENNIAL APA 0 28,361 153,744 133,098 6,366 286,842
ERNEST A LOVE FIELD PRC 10 3,017 177,233 85,290 648 262,523
LONG BEACH /DAUGHERTY
FIELD/ LGB 34,962 6,708 151,912 101,734 860 253,646
PORTLAND-HILLSBORO HIO 0 9,561 160,261 83,381 644 243,642
PHOENIX-MESA GATEWAY IWA 11,503 38,200 166,519 66,727 7,503 233,246
FALCON FLD FFZ 9 67,638 175,051 53,307 4,196 228,358
GRAND FORKS INTL GFK 1,029 105,715 212,325 12,634 182 224,959
GILLESPIE FIELD SEE 0 345 140,189 68,061 101 208,250
Source: FAA OPSNet Data
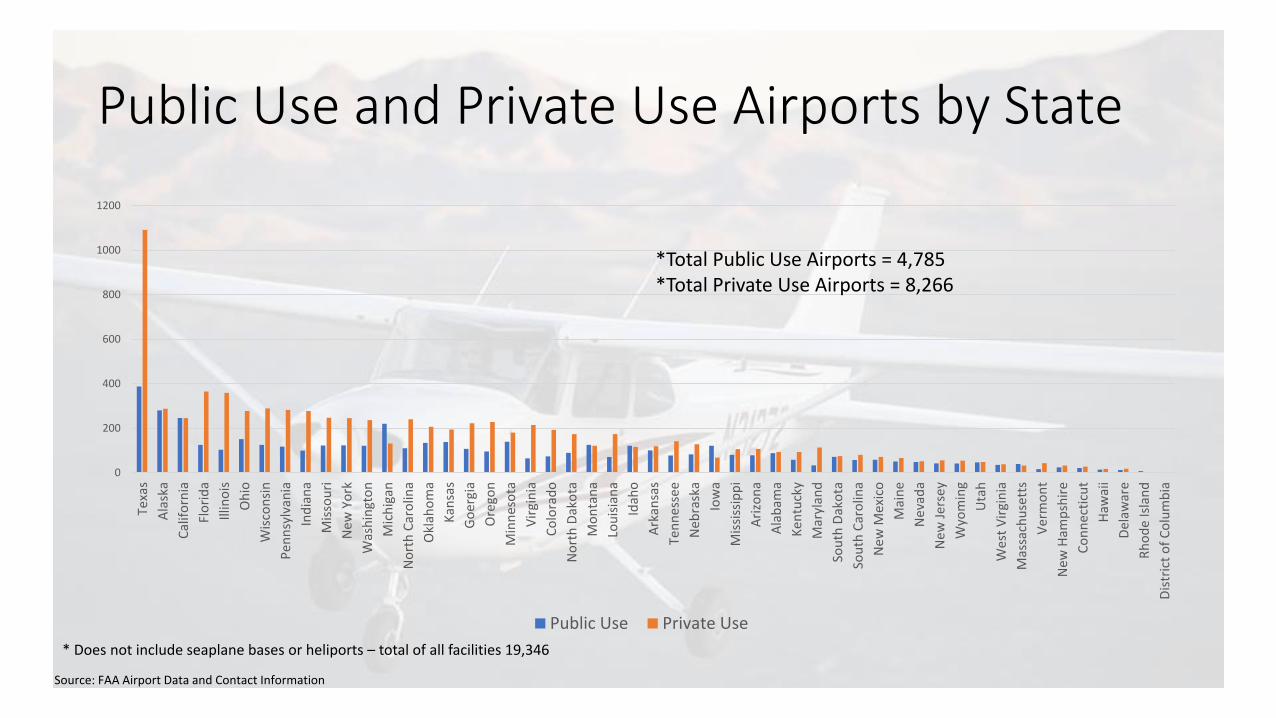
Public Use and Private Use Airports by State
0
200
400
600
800
1000
1200
Texa
s
Ala
ska
Cal
ifo
rnia
Flo
rid
a
Illin
ois
Oh
io
Wis
con
sin
Pen
nsy
lvan
ia
Ind
ian
a
Mis
sou
ri
Ne
w Y
ork
Was
hin
gto
n
Mic
hig
an
No
rth
Car
olin
a
Okl
aho
ma
Kan
sas
Go
erg
ia
Ore
gon
Min
nes
ota
Vir
gin
ia
Co
lora
do
No
rth
Dak
ota
Mo
nta
na
Lou
isia
na
Idah
o
Ark
ansa
s
Ten
ne
ssee
Ne
bra
ska
Iow
a
Mis
siss
ipp
i
Ari
zon
a
Ala
bam
a
Ke
ntu
cky
Mar
ylan
d
Sou
th D
ako
ta
Sou
th C
aro
lina
Ne
w M
exic
o
Mai
ne
Ne
vad
a
Ne
w J
erse
y
Wyo
min
g
Uta
h
Wes
t V
irgi
nia
Mas
sach
use
tts
Ver
mo
nt
Ne
w H
amp
shir
e
Co
nn
ecti
cut
Haw
aii
Del
awar
e
Rh
od
e Is
lan
d
Dis
tric
t o
f C
olu
mb
ia
Public Use Private Use
*Total Public Use Airports = 4,785*Total Private Use Airports = 8,266
* Does not include seaplane bases or heliports – total of all facilities 19,346
Source: FAA Airport Data and Contact Information
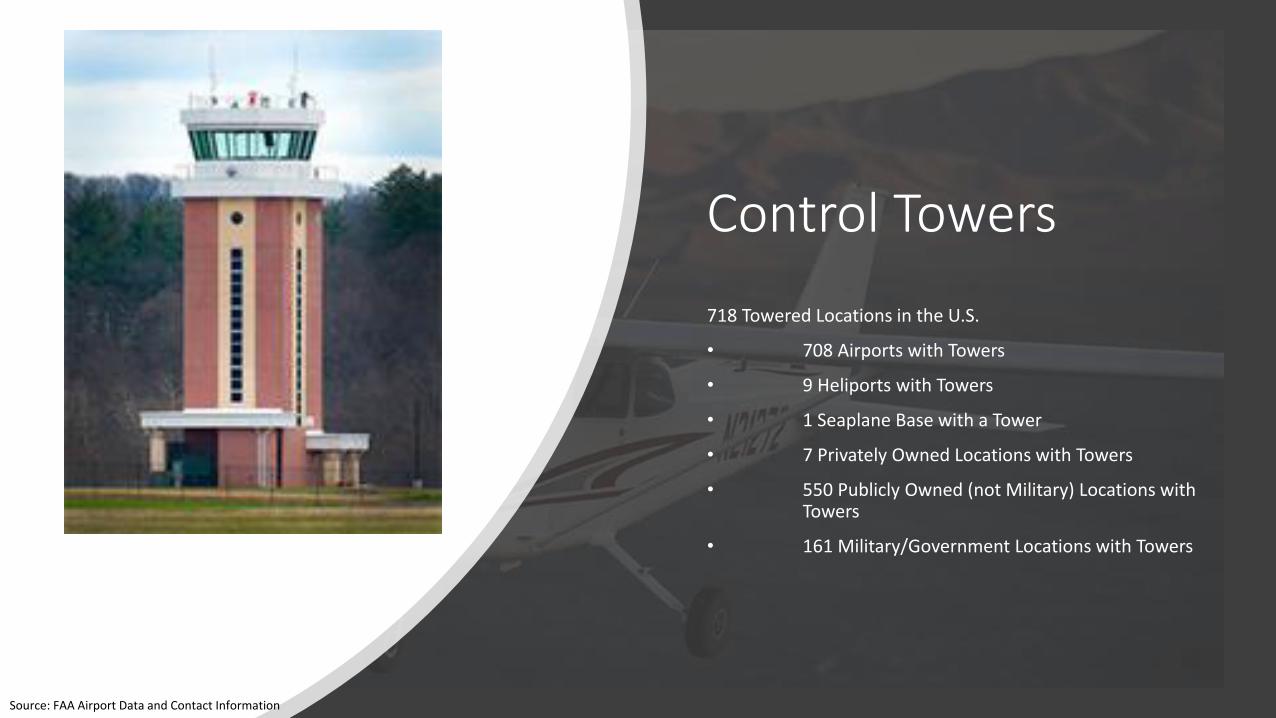
Control Towers
718 Towered Locations in the U.S.
• 708 Airports with Towers
• 9 Heliports with Towers
• 1 Seaplane Base with a Tower
• 7 Privately Owned Locations with Towers
• 550 Publicly Owned (not Military) Locations with Towers
• 161 Military/Government Locations with Towers
Source: FAA Airport Data and Contact Information

GA Aircraft Shipments by Year
Source: General Aviation Manufacturers Association
889 898 908933
1129
1056
1019
1085
368
526
584
645
603
557582
563
763
696672 678
722 718
667 676
CY2010 CY2011 CY2012 CY2013 CY2014 CY2015 CY2016 CY2017
Piston Turbo Prop Business Jet

Original Airmen Certificates Issued Each Year by Category 2008 to 2017
CY 2013 CY 2014 CY 2015 CY 2016 CY 2017
Pilot--Total 85,353 89,022 84,905 76,978 74,130
Student 49,566 49,261 49,062 36,712 38,401
Private 15,776 17,795 16,473 17,082 17,752
Commercial 8,140 9,803 9,211 10,191 10,506
Airline Transport 8,346 7,749 6,544 9,520 4,449
Rotorcraft (only) 2,888 3,754 2,999 2,759 2,552
0
10,000
20,000
30,000
40,000
50,000
60,000
70,000
80,000
90,000
100,000
Ce
rtif
icat
es Is
sued
Source: FAA Airman Statistics

Estimated Active Airmen by Certificate 2008 to 2017
162,455 162,313 170,718 174,883 180,214 188,001 194,441 202,020 211,619 222,596
98,161 96,081101,164 104,322 108,206
116,400 120,865 123,705125,738
124,746
159,825 157,894154,730 152,933 149,824
145,590 142,511142,198
144,600146,83815,355 15,518
15,566 15,511 15,11415,126 15,220
15,37715,298
14,647
18,139 17,99119,460 19,927 20,381
20,802 21,14121,275
21,26821,055
CY 2017 CY 2016 CY 2015 CY 2014 CY 2013 CY 2012 CY 2011 CY 2010 CY 2009 CY 2008
Private Commercial Airline Transport Rotorcraft (only) 3/ Glider (only ) 4,5/
Source: FAA Airman Statistics
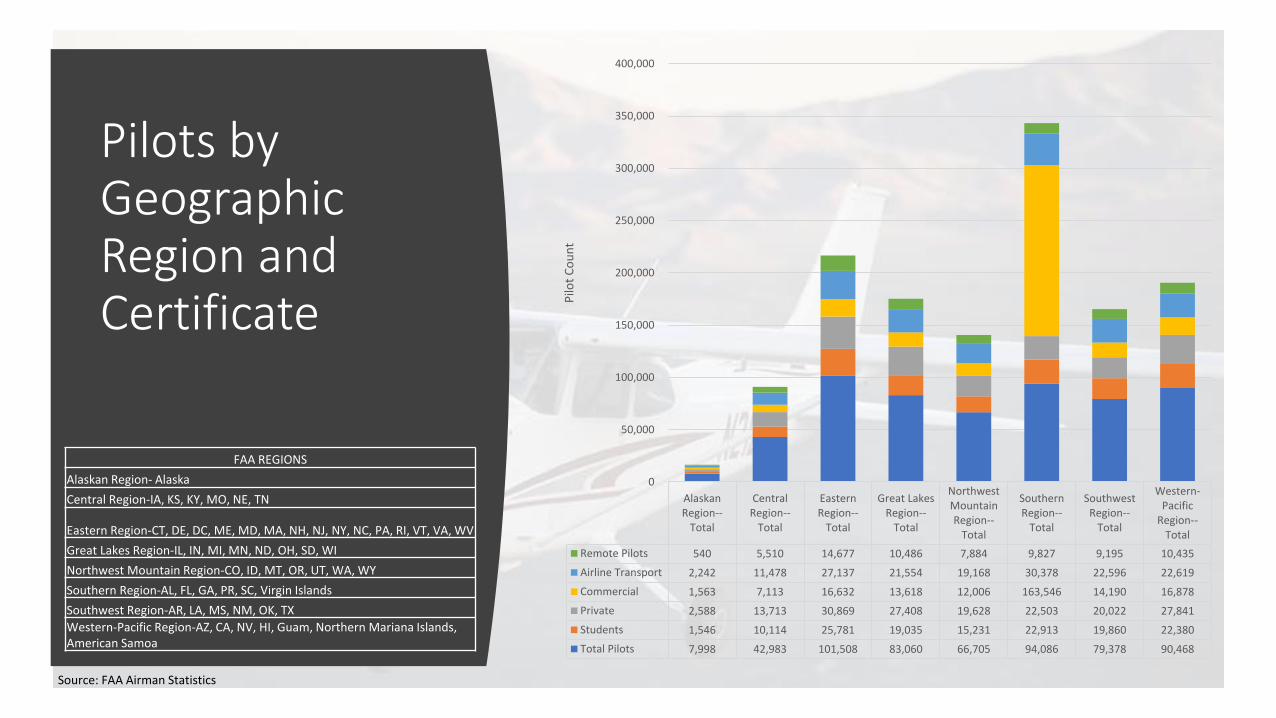
Pilots by Geographic Region and Certificate
AlaskanRegion--
Total
CentralRegion--
Total
EasternRegion--
Total
Great LakesRegion--
Total
NorthwestMountainRegion--
Total
SouthernRegion--
Total
SouthwestRegion--
Total
Western-Pacific
Region--Total
Remote Pilots 540 5,510 14,677 10,486 7,884 9,827 9,195 10,435
Airline Transport 2,242 11,478 27,137 21,554 19,168 30,378 22,596 22,619
Commercial 1,563 7,113 16,632 13,618 12,006 163,546 14,190 16,878
Private 2,588 13,713 30,869 27,408 19,628 22,503 20,022 27,841
Students 1,546 10,114 25,781 19,035 15,231 22,913 19,860 22,380
Total Pilots 7,998 42,983 101,508 83,060 66,705 94,086 79,378 90,468
0
50,000
100,000
150,000
200,000
250,000
300,000
350,000
400,000
Pilo
t C
ou
nt
FAA REGIONS
Alaskan Region- Alaska
Central Region-IA, KS, KY, MO, NE, TN
Eastern Region-CT, DE, DC, ME, MD, MA, NH, NJ, NY, NC, PA, RI, VT, VA, WV
Great Lakes Region-IL, IN, MI, MN, ND, OH, SD, WI
Northwest Mountain Region-CO, ID, MT, OR, UT, WA, WY
Southern Region-AL, FL, GA, PR, SC, Virgin Islands
Southwest Region-AR, LA, MS, NM, OK, TX
Western-Pacific Region-AZ, CA, NV, HI, Guam, Northern Mariana Islands, American Samoa
Source: FAA Airman Statistics

Jobs Created by General Aviation in Each State
0
200,000
400,000
600,000
800,000
1,000,000
1,200,000
Source: U.S. DOT , The Economic Impact of Civil Aviation on the U.S. Economy 2017
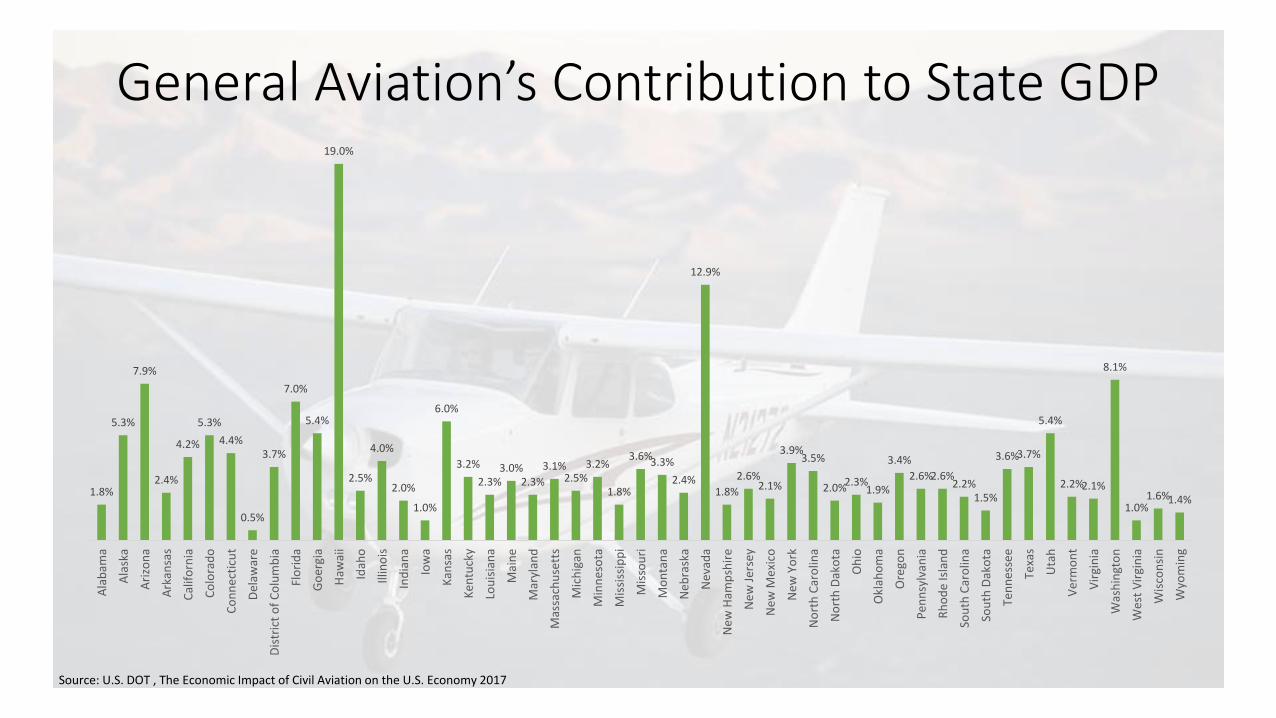
General Aviation’s Contribution to State GDP
1.8%
5.3%
7.9%
2.4%
4.2%
5.3%
4.4%
0.5%
3.7%
7.0%
5.4%
19.0%
2.5%
4.0%
2.0%
1.0%
6.0%
3.2%
2.3%3.0%
2.3%
3.1%2.5%
3.2%
1.8%
3.6%3.3%
2.4%
12.9%
1.8%
2.6%2.1%
3.9%3.5%
2.0%2.3%1.9%
3.4%
2.6%2.6%2.2%
1.5%
3.6%3.7%
5.4%
2.2%2.1%
8.1%
1.0%1.6%1.4%
Ala
bam
a
Ala
ska
Ari
zon
a
Ark
ansa
s
Cal
ifo
rnia
Co
lora
do
Co
nn
ecti
cut
Del
awar
e
Dis
tric
t o
f C
olu
mb
ia
Flo
rid
a
Go
ergi
a
Haw
aii
Idah
o
Illin
ois
Ind
ian
a
Iow
a
Kan
sas
Ken
tuck
y
Lou
isia
na
Mai
ne
Mar
ylan
d
Mas
sach
use
tts
Mic
hig
an
Min
nes
ota
Mis
siss
ipp
i
Mis
sou
ri
Mo
nta
na
Neb
rask
a
Nev
ada
New
Ham
psh
ire
New
Jer
sey
New
Mex
ico
New
Yo
rk
No
rth
Car
olin
a
No
rth
Dak
ota
Oh
io
Okl
aho
ma
Ore
gon
Pen
nsy
lvan
ia
Rh
od
e Is
lan
d
Sou
th C
aro
lina
Sou
th D
ako
ta
Ten
nes
see
Texa
s
Uta
h
Ver
mo
nt
Vir
gin
ia
Was
hin
gto
n
Wes
t V
irgi
nia
Wis
con
sin
Wyo
min
g
Source: U.S. DOT , The Economic Impact of Civil Aviation on the U.S. Economy 2017