state of illinois comprehensive opioid data...
TRANSCRIPT
State of Illinois Comprehensive
Opioid Data Report
December 4, 2017
2017 State of Illinois Comprehensive Opioid Data Report 2
Contents
Executive Summary ................................................................................................................................... 3
Introduction .................................................................................................................................................. 4
Opioid-Related Overdose Deaths ............................................................................................................ 5
Demographic Analysis of Opioid Overdose Deaths ................................................................................... 7
Drugs involved in fatal opioid overdose .................................................................................................. 10
Opioid-Related Emergency Department Visits and Inpatient Hospitalizations ............................... 11
Statewide ................................................................................................................................................ 11
County Level Patterns ............................................................................................................................. 12
Naloxone Administration by EMS Providers ........................................................................................ 19
Neonatal Abstinence Syndrome ............................................................................................................ 20
Opioid Prescribing .................................................................................................................................... 22
Patients Under 18 ................................................................................................................................... 25
“3-3-1” Prescriptions ............................................................................................................................... 25
Benzodiazepines and Opioids .................................................................................................................. 26
Electronic Health Record Integration ...................................................................................................... 29
Infectious Diseases .................................................................................................................................. 30
HIV ........................................................................................................................................................... 30
Hepatitis C ............................................................................................................................................... 33
Harm Reduction Sites .............................................................................................................................. 37
Conclusion ................................................................................................................................................. 38
2017 State of Illinois Comprehensive Opioid Data Report 3
Executive Summary
Illinois is in the midst of an unprecedented opioid epidemic. In 2016, opioid-related overdoses
claimed the lives of 1,946 Illinoisans, more than one and half times the number of homicides
and nearly twice the number of fatal car accidents. In response, state agencies began meeting
to develop a comprehensive plan to address the crisis. On September 6, 2017, the State of
Illinois Opioid Action Plan (SOAP) was released pursuant to Executive Order 2017-05.
The SOAP sets an overall goal of reducing projected opioid-related deaths by one-third in three
years. To help understand the complex dynamics of this crisis, we are releasing this
Comprehensive Opioid Data Report. It is a compilation of existing state epidemiological data
regarding the causes and consequences of this crisis. The purpose of this report is to present a
landscape analysis of the Illinois opioid epidemic that will serve to inform statewide efforts to
implement the SOAP.
This report contains a variety of opioid-related epidemiological data from multiple state
agencies. Below is a summary of four key trends in the data:
1. Opioid overdoses have been increasing in recent years. As noted above, there were
1,946 opioid overdose fatalities in 2016, an 82% increase since 2013. Nonfatal opioid
overdoses, as tracked by emergency department visits and hospitalizations, have likewise
been rising dramatically statewide (Figures 4-5).
2. Synthetic opioids such as fentanyl and its analogues are disproportionately
contributing to the rise in both fatal and nonfatal overdoses. Over the past three years,
deaths due to synthetic opioids have increased tenfold, from 87 in 2013 to nearly 900 in
2016. The growing problem of synthetic opioids is also reflected in emergency medical
service (EMS) data. These data reported a significant increase in multiple administrations of
the opioid overdose reversal drug naloxone - an indicator of a synthetic opioid overdose
(Figure 12).
3. Opioid overdoses are an urban, suburban, and rural problem. While the highest
absolute number of opioid overdoses are in Cook County and the collar counties, many of
the highest per population overdose rates are seen in pockets of rural counties statewide
(Figures 6-11).
4. Opioid prescribing activity has been decreasing. Since 2013, the total number of opioid
prescriptions reported to the Illinois Prescription Monitoring Program has decreased by
9.8%. This is consistent with an overall national trend toward reduced opioid prescribing in
recent years as compared to peak prescribing in the late 2000s and early 2010s.
Nevertheless, opioid prescribing activity remains signficantly higher today as compared to
the late 1990s (Figures 16-17).
The data presented in this report are a snapshot of the impact of opioids on our state today. As
statewide efforts to combat the opioid epidemic and implementation of the SOAP progress in
the upcoming months and years, it will be critical to continue collecting and analyzing all data
available to identify and respond to emerging trends and inform our work.
2017 State of Illinois Comprehensive Opioid Data Report 4
Introduction
Opioids are a class of drugs that include heroin, common prescription pain relievers such as
oxycodone and hydrocodone (i.e., Vicodin, Percocet, Oxycontin), and synthetically
manufactured analogues such as fentanyl. Prescription opioids are important pain medications
that can provide much-needed relief for patients with acute and chronic pain. However, physical
tolerance to opioids can develop in as few as two to three days of continuous use,1 increasing
an individual’s risk of developing opioid use disorder (OUD) and suffering an overdose. Opioids
affect respiratory regulation in the brain, and an overdose can cause someone to stop
breathing, resulting in death.
The opioid epidemic currently gripping the nation represents the deadliest drug crisis in United
States history. The Centers for Disease Control and Prevention (CDC) estimates that nearly half
a million people in the U.S. died of an opioid-related drug overdose between 2000-2014.2 In
Illinois, opioid overdoses have led to more than 11,000 fatalities since 2008. Dangerously potent
and poisonous synthetic opioids such as fentanyl are increasingly making their way into the illicit
drug supply, and opioid-related deaths have been rising exponentially in recent years. Beyond
the number of deaths is the broader impact of the opioid crisis on individuals, families, and
communities. An estimated one in three Illinoisans have been affected by the crisis,3 either
suffering from OUD themselves or knowing someone with OUD or who has overdosed.
On September 6, 2017, Governor Bruce Rauner signed Executive Order 2017-05, directing
state agencies to develop a comprehensive plan to address the opioid crisis in Illinois, as well
as accomplish a number of action items within 90 days. The State of Illinois Opioid Action Plan,
developed in collaboration with 10 state agencies, was released that day, and is available here:
http://dph.illinois.gov/sites/default/files/publications/Illinois-Opioid-Action-Plan-Sept-6-2017-
FINAL.pdf.
Pursuant to Executive Order 2017-05, the Illinois Department of Public Health (IDPH) is
releasing this State of Illinois Comprehensive Opioid Data Report. In this report, IDPH has
compiled data from a variety of sources across state agencies to provide a comprehensive
epidemiological view of the impact of opioids on our state.
1 Shah, A., Hayes, C., Martin, B., (2017). Characteristics of initial prescription episodes and likelihood of long-term opioid use – United States, 2006-2015. MMWR Morbidity and Mortality Weekly Report, 66, 265-269. 2 Rudd, Rose A., et al. Increases in Drug and Opioid Overdose Deaths — United States, 2000–2014. Centers for
Disease Control and Prevention. 2016. pp. 1378-82, Morbidity and Mortality Weekly Report. 3 National Safety Council. (2017). Prescription Opioid Painkiller Public Opinion Poll.
2017 State of Illinois Comprehensive Opioid Data Report 5
Opioid-Related Overdose Deaths
IDPH used death records of Illinois residents where drug overdose was reported as the
underlying cause of death (International Classification of Disease, Tenth Revision (ICD-10)
codes X40-X44 (unintentional), X60-X64 (suicide), X85 (homicide), and Y10-Y14 (undetermined
intent)) to identify opioid overdose deaths. Among these death records, the type of opioid
involved is indicated by the following ICD-10 multiple cause-of-death codes: T40.0 (opium),
T40.1 (heroin), T40.2 (natural (e.g., morphine and codeine) and semisynthetic opioids (e.g.,
oxycodone, hydrocodone, hydromorphone, oxymorphone), T40.3 (methadone), T40.4 (synthetic
opioids other than methadone (e.g., fentanyl and tramadol)), and T40.6 (other and unspecified
narcotics).
IDPH classifies opioid overdose deaths into three categories:
Overdose deaths involving heroin
“Opioid analgesics,” which includes drug overdose deaths in which any opioid analgesic was
reported as a contributing cause of death (ICD-10 codes T40.2, T40.3, and T40.4)
o Death certificates do not include information regarding whether opioid analgesics were
obtained legally (i.e., prescribed by a physician) or illicitly, and thus, it is not possible to
definitively categorize a death involving an opioid analgesic as caused by a “legitimate”
prescription.
“Any opioid,” which includes deaths due to heroin, opioid analgesics, and other and
unspecified narcotics.
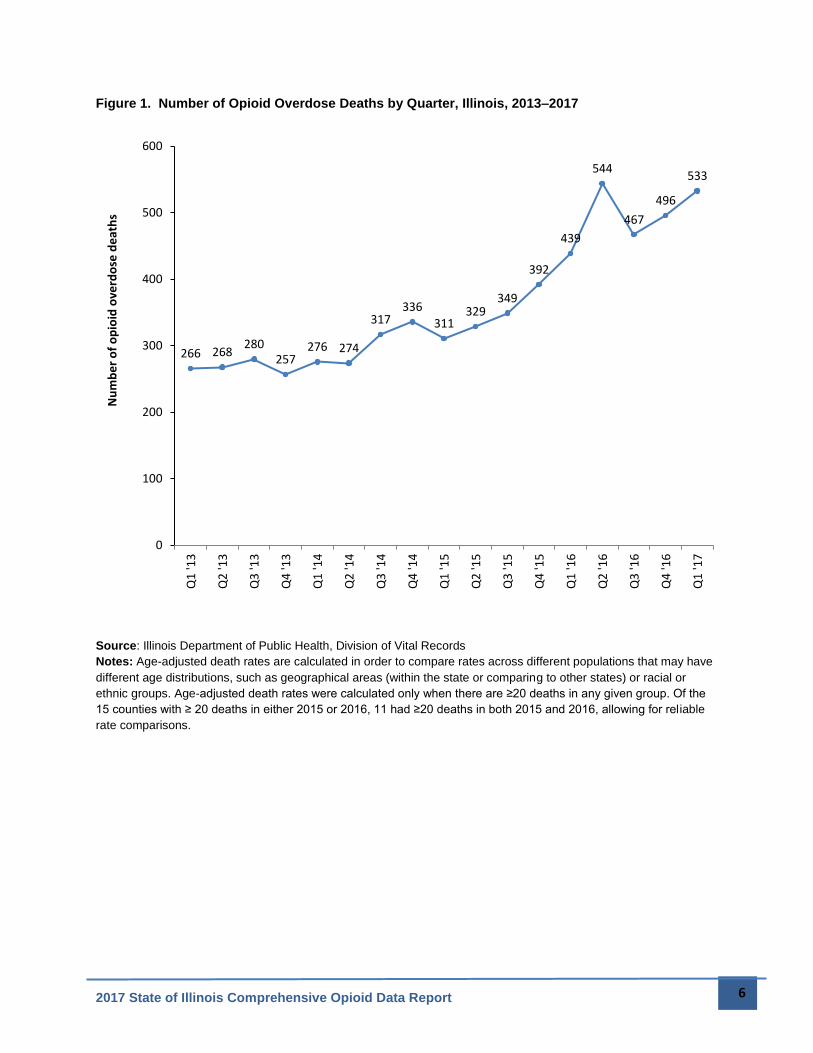
As seen in Figure 1, opioid overdose deaths have been rising dramatically in Illinois. According
to 2016 provisional data (as of November 2017), there were 1,946 opioid deaths among Illinois
residents, a continuous and substantial increase over 1,072 deaths in 2013. Furthermore, there
were 1,203 deaths in 2014 and 1,382 deaths in 2015. Much of this increase is due to deaths
from synthetic opioids such as fentanyl and other analogues, as well as opioid analgesics,
which include prescription drugs such as oxycodone and hydrocodone.
2017 State of Illinois Comprehensive Opioid Data Report 6
Figure 1. Number of Opioid Overdose Deaths by Quarter, Illinois, 2013–2017
Source: Illinois Department of Public Health, Division of Vital Records Notes: Age-adjusted death rates are calculated in order to compare rates across different populations that may have
different age distributions, such as geographical areas (within the state or comparing to other states) or racial or
ethnic groups. Age-adjusted death rates were calculated only when there are ≥20 deaths in any given group. Of the
15 counties with ≥ 20 deaths in either 2015 or 2016, 11 had ≥20 deaths in both 2015 and 2016, allowing for reliable
rate comparisons.
266 268280
257276 274
317336
311329
349
392
439
544
467
496
533
0
100
200
300
400
500
600
Q1
'13
Q2
'13
Q3
'13
Q4
'13
Q1
'14
Q2
'14
Q3
'14
Q4
'14
Q1
'15
Q2
'15
Q3
'15
Q4
'15
Q1
'16
Q2
'16
Q3
'16
Q4
'16
Q1
'17
Nu
mb
er
of
op
ioid
ove
rdo
se d
eat
hs
2017 State of Illinois Comprehensive Opioid Data Report 7
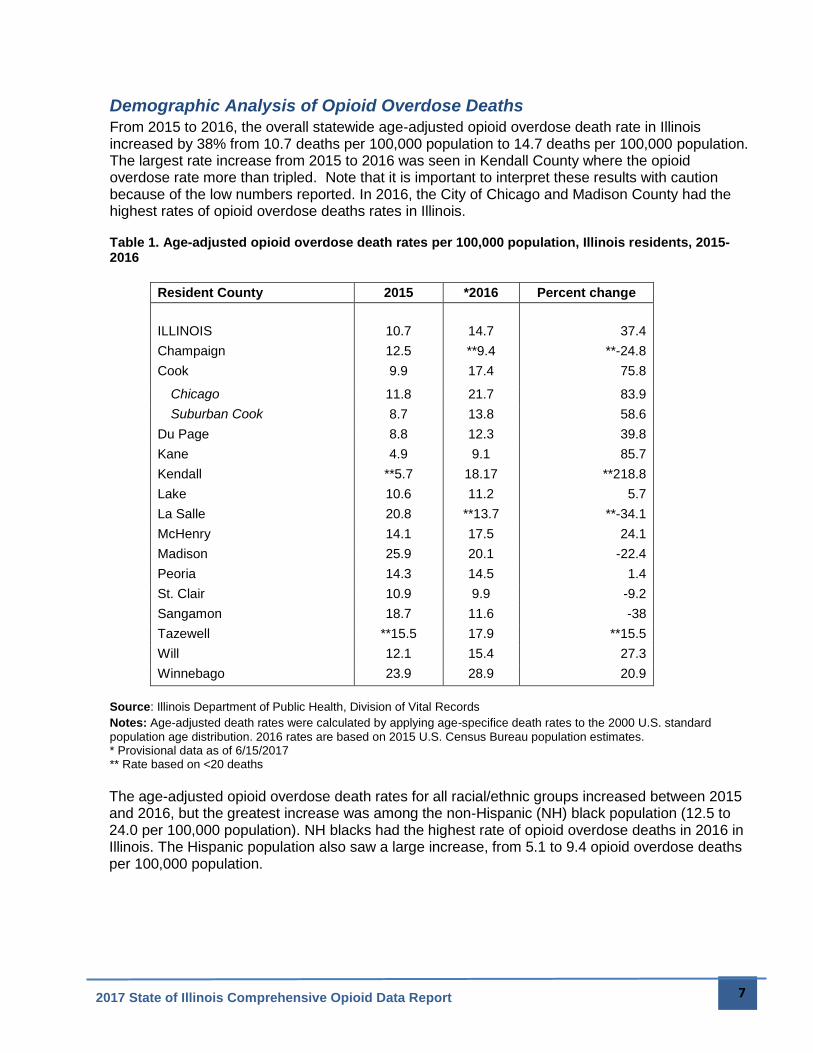
Demographic Analysis of Opioid Overdose Deaths
From 2015 to 2016, the overall statewide age-adjusted opioid overdose death rate in Illinois increased by 38% from 10.7 deaths per 100,000 population to 14.7 deaths per 100,000 population. The largest rate increase from 2015 to 2016 was seen in Kendall County where the opioid overdose rate more than tripled. Note that it is important to interpret these results with caution because of the low numbers reported. In 2016, the City of Chicago and Madison County had the highest rates of opioid overdose deaths rates in Illinois. Table 1. Age-adjusted opioid overdose death rates per 100,000 population, Illinois residents, 2015-2016
Resident County 2015 *2016 Percent change
ILLINOIS 10.7 14.7 37.4
Champaign 12.5 **9.4 **-24.8
Cook 9.9 17.4 75.8
Chicago 11.8 21.7 83.9
Suburban Cook 8.7 13.8 58.6
Du Page 8.8 12.3 39.8
Kane 4.9 9.1 85.7
Kendall **5.7 18.17 **218.8
Lake 10.6 11.2 5.7
La Salle 20.8 **13.7 **-34.1
McHenry 14.1 17.5 24.1
Madison 25.9 20.1 -22.4
Peoria 14.3 14.5 1.4
St. Clair 10.9 9.9 -9.2
Sangamon 18.7 11.6 -38
Tazewell **15.5 17.9 **15.5
Will 12.1 15.4 27.3
Winnebago 23.9 28.9 20.9
Source: Illinois Department of Public Health, Division of Vital Records Notes: Age-adjusted death rates were calculated by applying age-specifice death rates to the 2000 U.S. standard
population age distribution. 2016 rates are based on 2015 U.S. Census Bureau population estimates. * Provisional data as of 6/15/2017 ** Rate based on <20 deaths
The age-adjusted opioid overdose death rates for all racial/ethnic groups increased between 2015 and 2016, but the greatest increase was among the non-Hispanic (NH) black population (12.5 to 24.0 per 100,000 population). NH blacks had the highest rate of opioid overdose deaths in 2016 in Illinois. The Hispanic population also saw a large increase, from 5.1 to 9.4 opioid overdose deaths per 100,000 population.
2017 State of Illinois Comprehensive Opioid Data Report 8
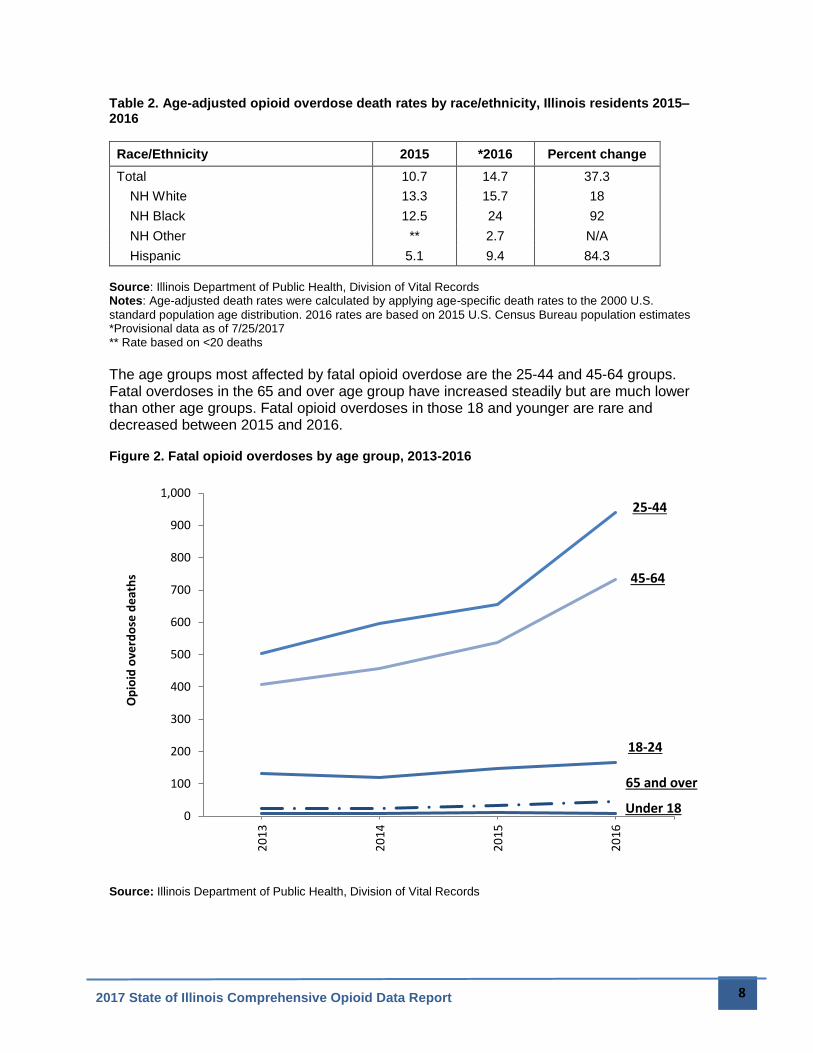
Table 2. Age-adjusted opioid overdose death rates by race/ethnicity, Illinois residents 2015–2016
Race/Ethnicity 2015 *2016 Percent change
Total 10.7 14.7 37.3
NH White 13.3 15.7 18
NH Black 12.5 24 92
NH Other ** 2.7 N/A
Hispanic 5.1 9.4 84.3
Source: Illinois Department of Public Health, Division of Vital Records Notes: Age-adjusted death rates were calculated by applying age-specific death rates to the 2000 U.S.
standard population age distribution. 2016 rates are based on 2015 U.S. Census Bureau population estimates *Provisional data as of 7/25/2017 ** Rate based on <20 deaths The age groups most affected by fatal opioid overdose are the 25-44 and 45-64 groups. Fatal overdoses in the 65 and over age group have increased steadily but are much lower than other age groups. Fatal opioid overdoses in those 18 and younger are rare and decreased between 2015 and 2016. Figure 2. Fatal opioid overdoses by age group, 2013-2016
Source: Illinois Department of Public Health, Division of Vital Records
0
100
200
300
400
500
600
700
800
900
1,000
20
13
20
14
20
15
20
16
Op
ioid
ove
rdo
se d
eat
hs
65 and over
18-24
45-64
25-44
Under 18
2017 State of Illinois Comprehensive Opioid Data Report 9
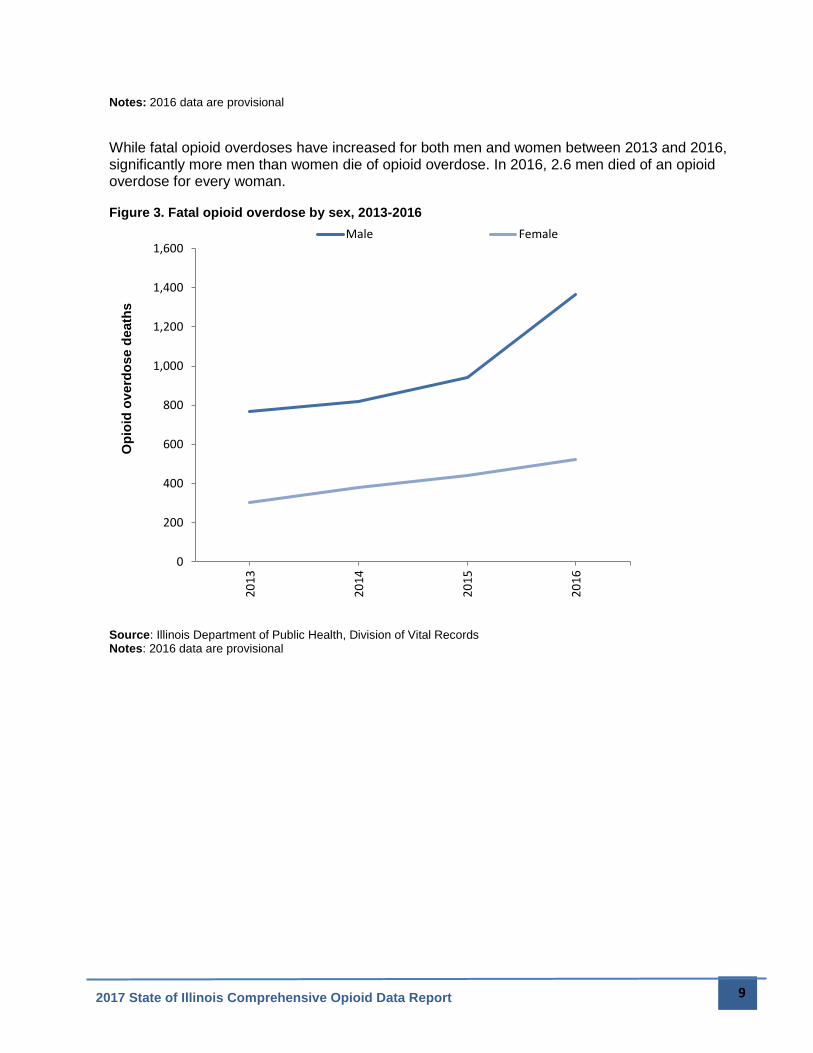
Notes: 2016 data are provisional
While fatal opioid overdoses have increased for both men and women between 2013 and 2016, significantly more men than women die of opioid overdose. In 2016, 2.6 men died of an opioid overdose for every woman. Figure 3. Fatal opioid overdose by sex, 2013-2016
Source: Illinois Department of Public Health, Division of Vital Records Notes: 2016 data are provisional
0
200
400
600
800
1,000
1,200
1,400
1,6002
01
3
20
14
20
15
20
16
Op
ioid
ov
erd
ose d
eath
s
Male Female
2017 State of Illinois Comprehensive Opioid Data Report 10
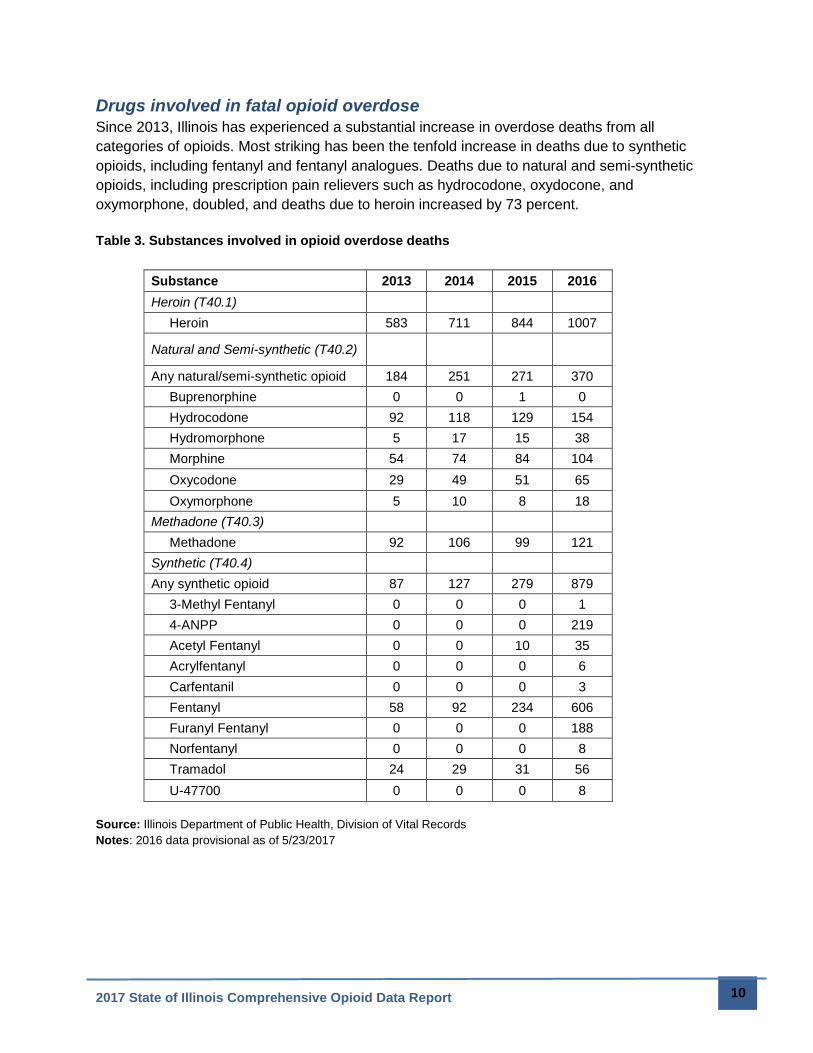
Drugs involved in fatal opioid overdose
Since 2013, Illinois has experienced a substantial increase in overdose deaths from all
categories of opioids. Most striking has been the tenfold increase in deaths due to synthetic
opioids, including fentanyl and fentanyl analogues. Deaths due to natural and semi-synthetic
opioids, including prescription pain relievers such as hydrocodone, oxydocone, and
oxymorphone, doubled, and deaths due to heroin increased by 73 percent.
Table 3. Substances involved in opioid overdose deaths
Substance 2013 2014 2015 2016
Heroin (T40.1)
Heroin 583 711 844 1007
Natural and Semi-synthetic (T40.2)
Any natural/semi-synthetic opioid 184 251 271 370
Buprenorphine 0 0 1 0
Hydrocodone 92 118 129 154
Hydromorphone 5 17 15 38
Morphine 54 74 84 104
Oxycodone 29 49 51 65
Oxymorphone 5 10 8 18
Methadone (T40.3)
Methadone 92 106 99 121
Synthetic (T40.4)
Any synthetic opioid 87 127 279 879
3-Methyl Fentanyl 0 0 0 1
4-ANPP 0 0 0 219
Acetyl Fentanyl 0 0 10 35
Acrylfentanyl 0 0 0 6
Carfentanil 0 0 0 3
Fentanyl 58 92 234 606
Furanyl Fentanyl 0 0 0 188
Norfentanyl 0 0 0 8
Tramadol 24 29 31 56
U-47700 0 0 0 8
Source: Illinois Department of Public Health, Division of Vital Records
Notes: 2016 data provisional as of 5/23/2017
2017 State of Illinois Comprehensive Opioid Data Report 11
Opioid-Related Emergency Department Visits and Inpatient
Hospitalizations
IDPH collects data on all emergency department (ED) visits and inpatient hospitalizations in
Illinois. These data provide insight into trends in health care utilization for opioid overdose in
Illinois. As with opioid deaths, ED visits and inpatient hospitalizations related to opioid overdose
have increased significantly in recent years.
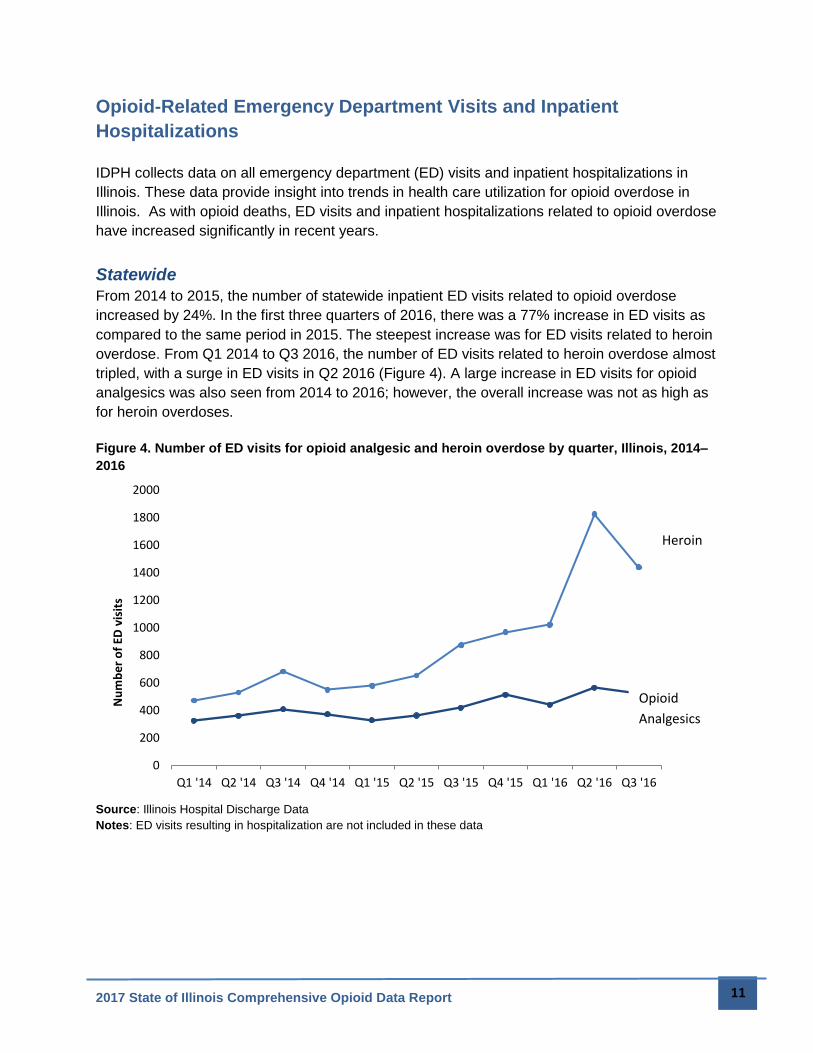
Statewide
From 2014 to 2015, the number of statewide inpatient ED visits related to opioid overdose
increased by 24%. In the first three quarters of 2016, there was a 77% increase in ED visits as
compared to the same period in 2015. The steepest increase was for ED visits related to heroin
overdose. From Q1 2014 to Q3 2016, the number of ED visits related to heroin overdose almost
tripled, with a surge in ED visits in Q2 2016 (Figure 4). A large increase in ED visits for opioid
analgesics was also seen from 2014 to 2016; however, the overall increase was not as high as
for heroin overdoses.
Figure 4. Number of ED visits for opioid analgesic and heroin overdose by quarter, Illinois, 2014–
2016
Source: Illinois Hospital Discharge Data
Notes: ED visits resulting in hospitalization are not included in these data
0
200
400
600
800
1000
1200
1400
1600
1800
2000
Q1 '14 Q2 '14 Q3 '14 Q4 '14 Q1 '15 Q2 '15 Q3 '15 Q4 '15 Q1 '16 Q2 '16 Q3 '16
Nu
mb
er
of
ED v
isit
s
Heroin
Opioid
Analgesics
2017 State of Illinois Comprehensive Opioid Data Report 12
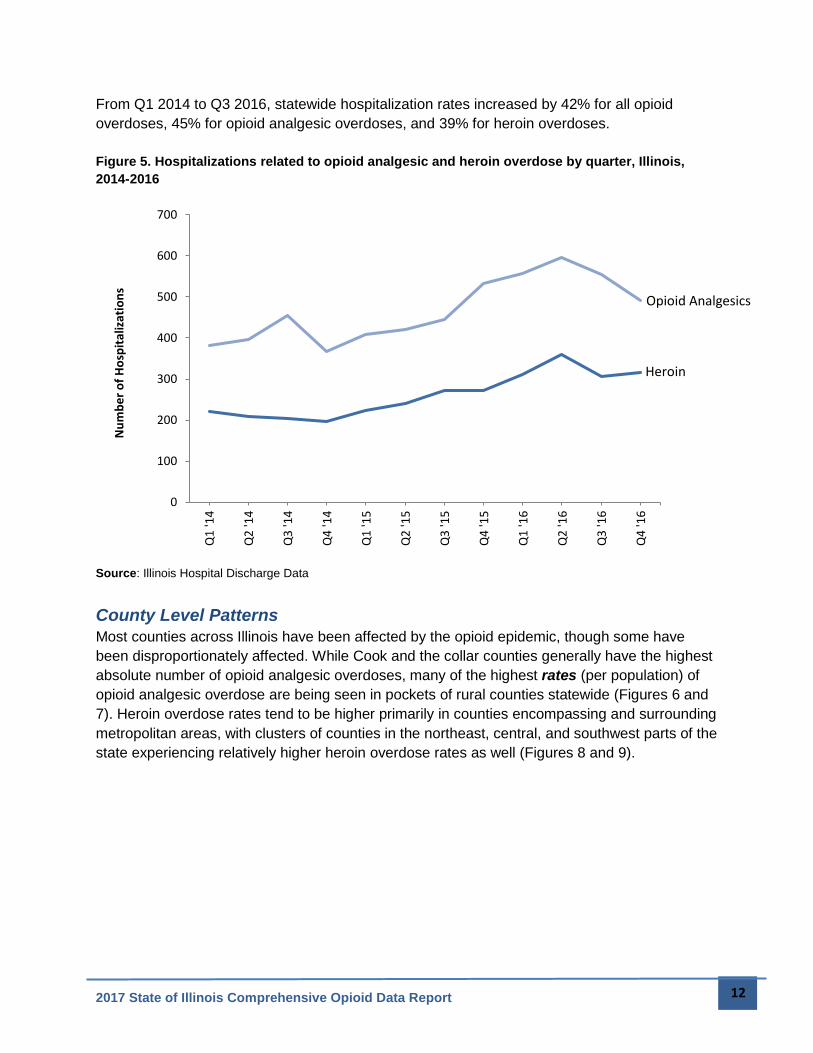
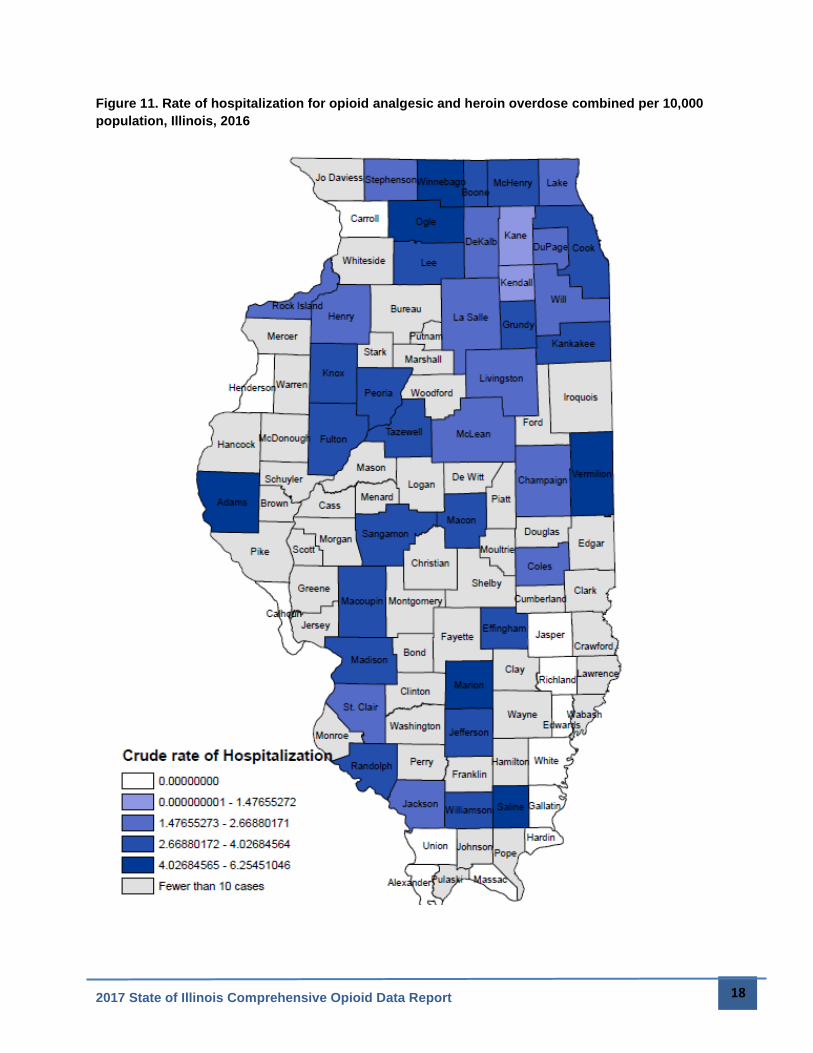
From Q1 2014 to Q3 2016, statewide hospitalization rates increased by 42% for all opioid
overdoses, 45% for opioid analgesic overdoses, and 39% for heroin overdoses.
Figure 5. Hospitalizations related to opioid analgesic and heroin overdose by quarter, Illinois,
2014-2016
Source: Illinois Hospital Discharge Data
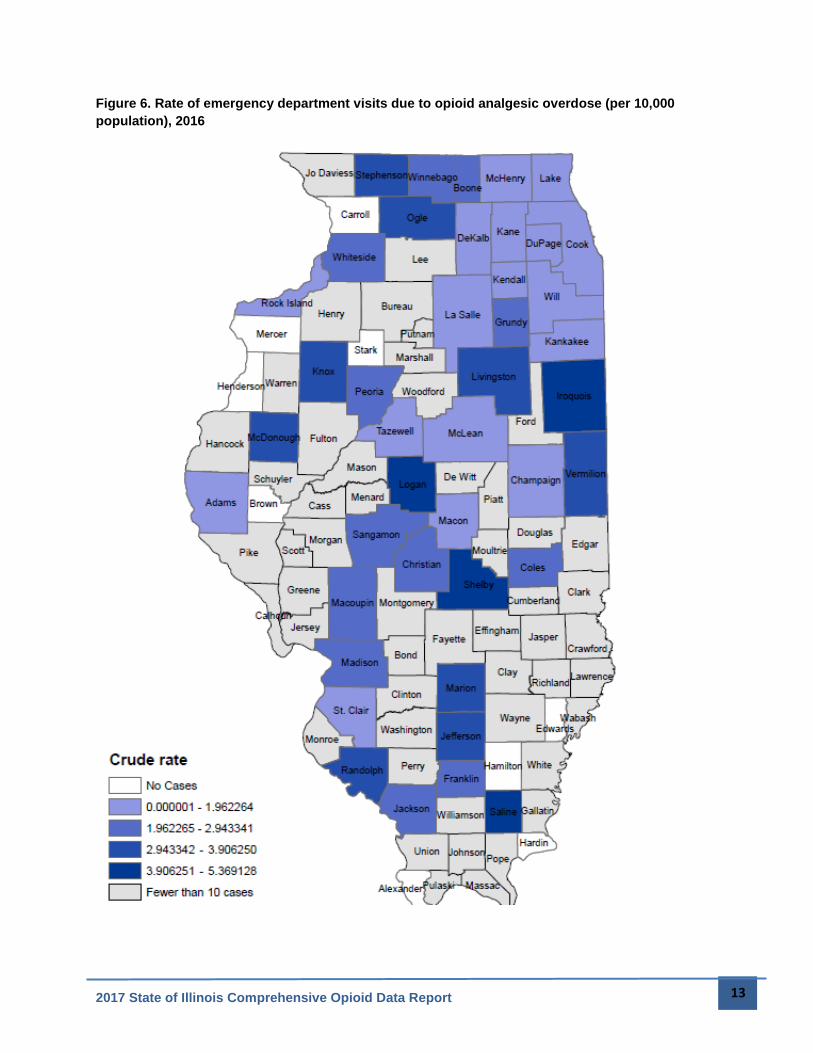
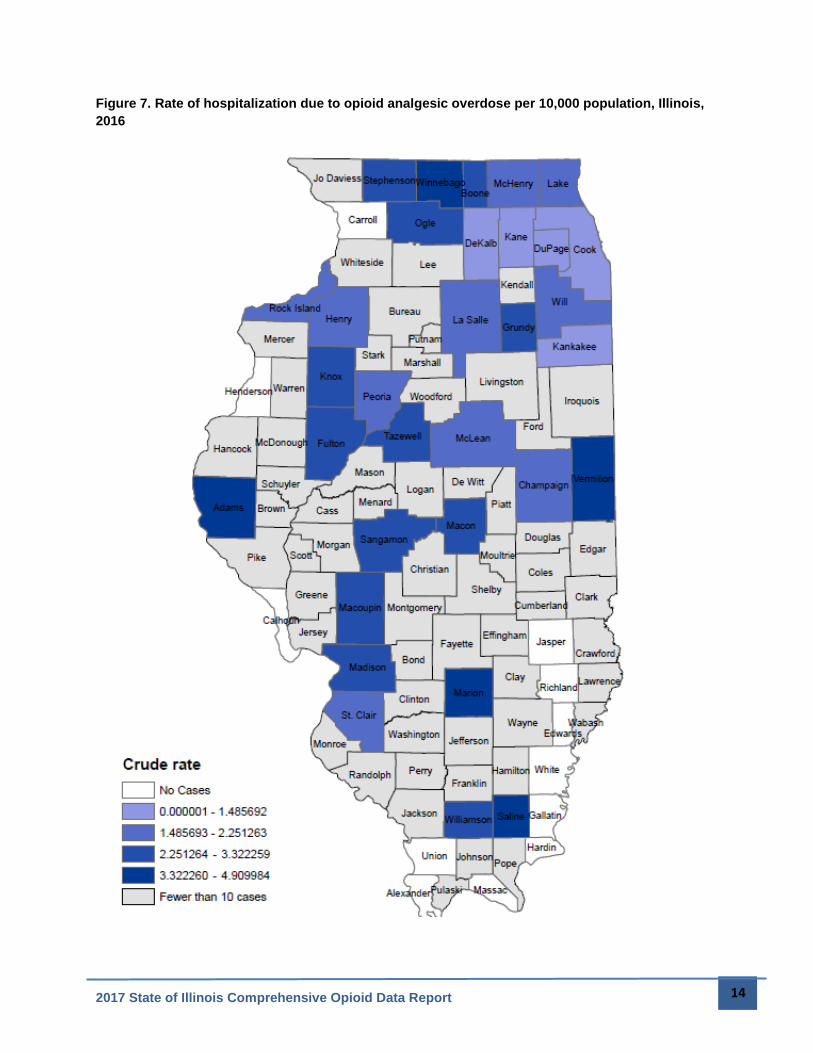
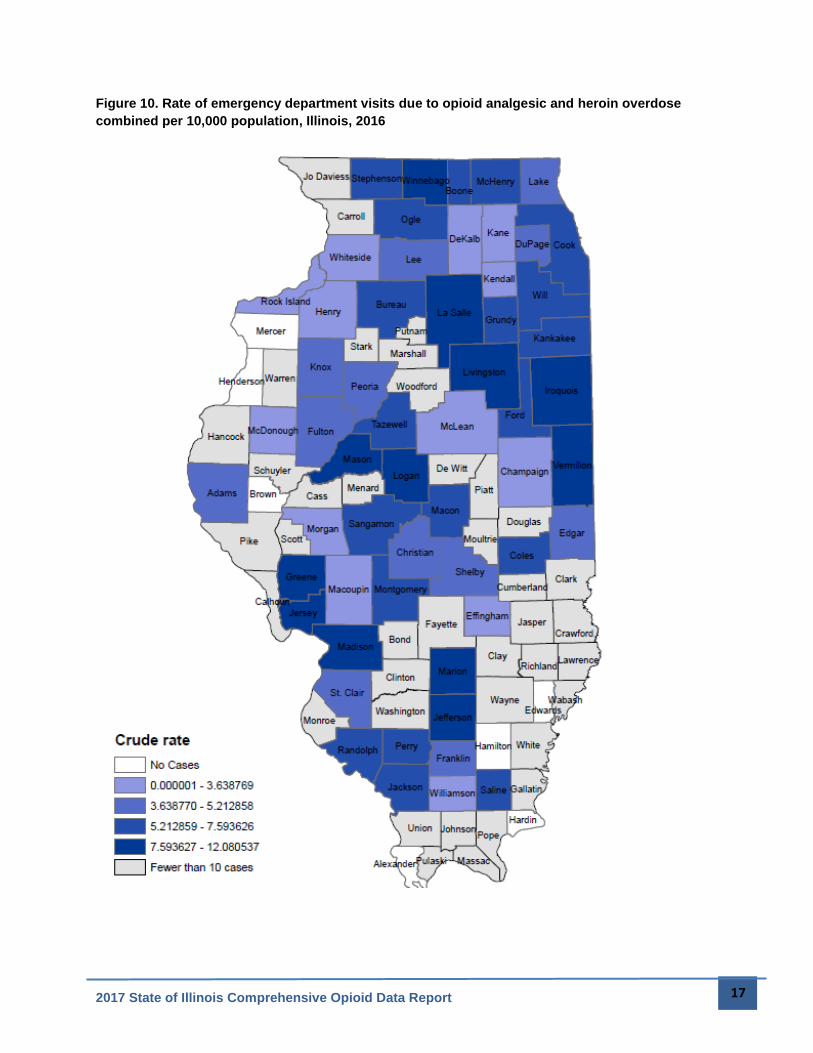
County Level Patterns
Most counties across Illinois have been affected by the opioid epidemic, though some have
been disproportionately affected. While Cook and the collar counties generally have the highest
absolute number of opioid analgesic overdoses, many of the highest rates (per population) of
opioid analgesic overdose are being seen in pockets of rural counties statewide (Figures 6 and
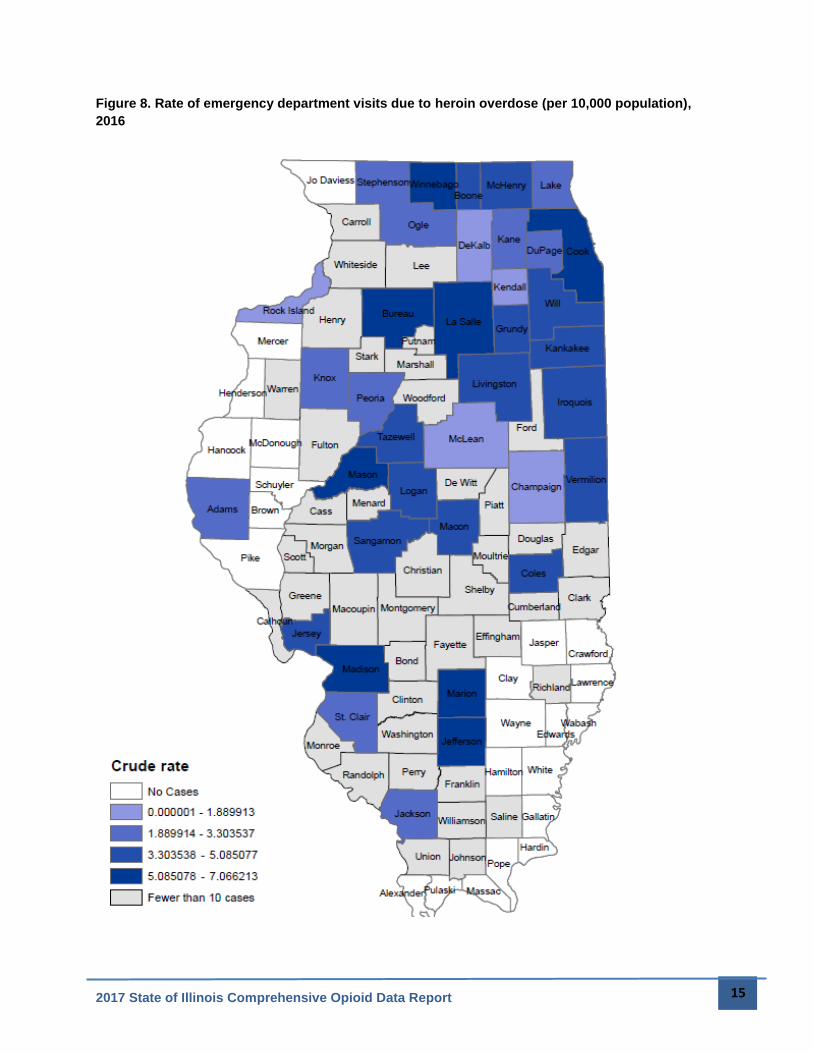
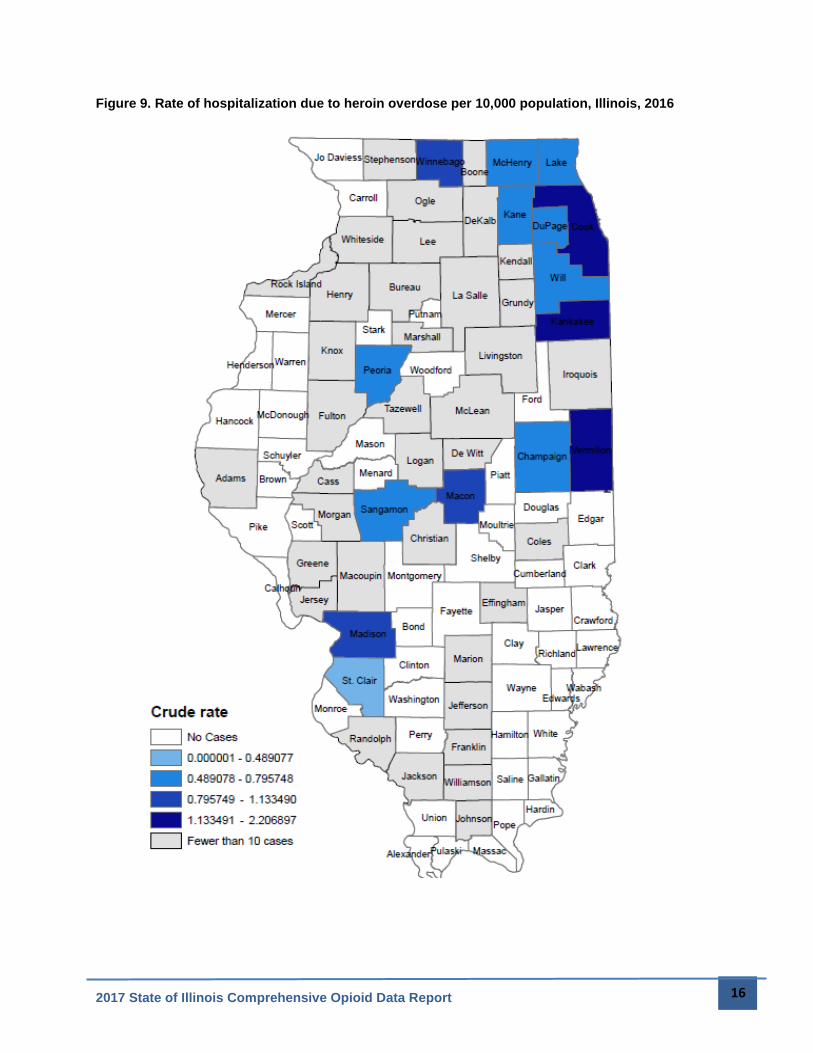
7). Heroin overdose rates tend to be higher primarily in counties encompassing and surrounding
metropolitan areas, with clusters of counties in the northeast, central, and southwest parts of the
state experiencing relatively higher heroin overdose rates as well (Figures 8 and 9).
0
100
200
300
400
500
600
700Q
1 '1
4
Q2
'14
Q3
'14
Q4
'14
Q1
'15
Q2
'15
Q3
'15
Q4
'15
Q1
'16
Q2
'16
Q3
'16
Q4
'16
Nu
mb
er
of
Ho
spit
aliz
atio
ns
Opioid Analgesics
Heroin
2017 State of Illinois Comprehensive Opioid Data Report 13
Figure 6. Rate of emergency department visits due to opioid analgesic overdose (per 10,000
population), 2016
2017 State of Illinois Comprehensive Opioid Data Report 14
Figure 7. Rate of hospitalization due to opioid analgesic overdose per 10,000 population, Illinois,
2016
2017 State of Illinois Comprehensive Opioid Data Report 15
Figure 8. Rate of emergency department visits due to heroin overdose (per 10,000 population),
2016
2017 State of Illinois Comprehensive Opioid Data Report 16
Figure 9. Rate of hospitalization due to heroin overdose per 10,000 population, Illinois, 2016
2017 State of Illinois Comprehensive Opioid Data Report 17
Figure 10. Rate of emergency department visits due to opioid analgesic and heroin overdose
combined per 10,000 population, Illinois, 2016
2017 State of Illinois Comprehensive Opioid Data Report 18
Figure 11. Rate of hospitalization for opioid analgesic and heroin overdose combined per 10,000
population, Illinois, 2016
2017 State of Illinois Comprehensive Opioid Data Report 19
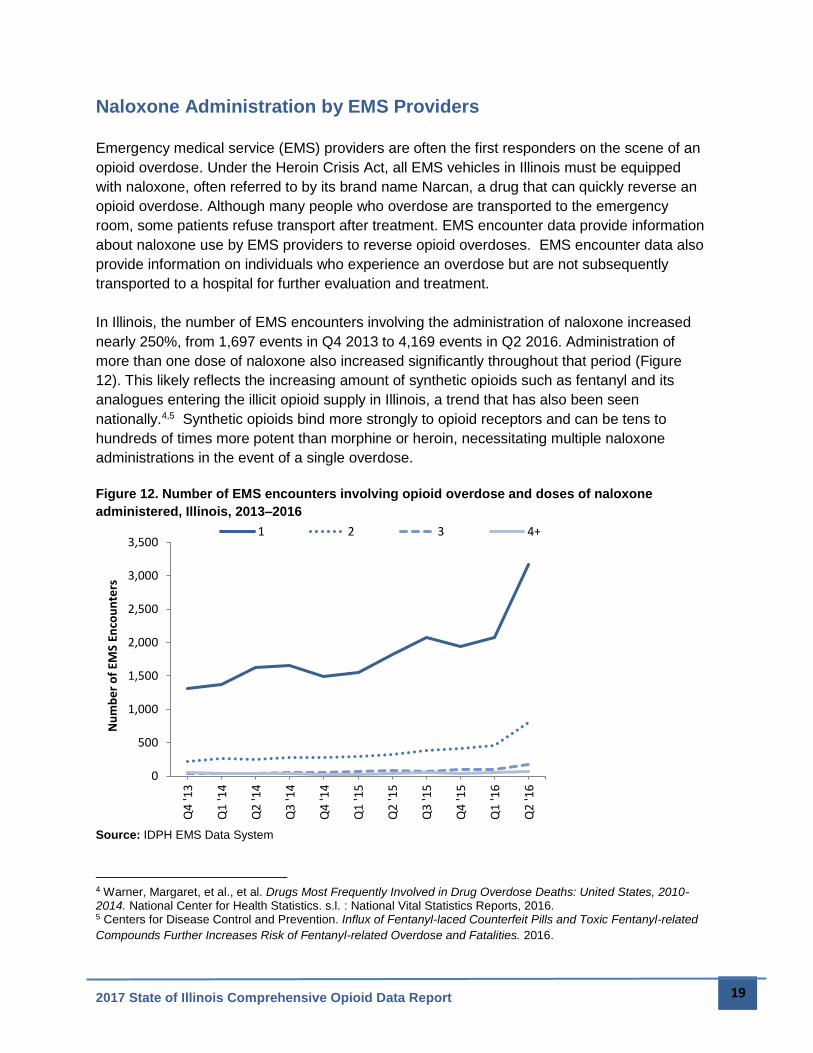
Naloxone Administration by EMS Providers
Emergency medical service (EMS) providers are often the first responders on the scene of an
opioid overdose. Under the Heroin Crisis Act, all EMS vehicles in Illinois must be equipped
with naloxone, often referred to by its brand name Narcan, a drug that can quickly reverse an
opioid overdose. Although many people who overdose are transported to the emergency
room, some patients refuse transport after treatment. EMS encounter data provide information
about naloxone use by EMS providers to reverse opioid overdoses. EMS encounter data also
provide information on individuals who experience an overdose but are not subsequently
transported to a hospital for further evaluation and treatment.
In Illinois, the number of EMS encounters involving the administration of naloxone increased
nearly 250%, from 1,697 events in Q4 2013 to 4,169 events in Q2 2016. Administration of
more than one dose of naloxone also increased significantly throughout that period (Figure
12). This likely reflects the increasing amount of synthetic opioids such as fentanyl and its
analogues entering the illicit opioid supply in Illinois, a trend that has also been seen
nationally.4,5 Synthetic opioids bind more strongly to opioid receptors and can be tens to
hundreds of times more potent than morphine or heroin, necessitating multiple naloxone
administrations in the event of a single overdose.
Figure 12. Number of EMS encounters involving opioid overdose and doses of naloxone
administered, Illinois, 2013–2016
Source: IDPH EMS Data System
4 Warner, Margaret, et al., et al. Drugs Most Frequently Involved in Drug Overdose Deaths: United States, 2010-2014. National Center for Health Statistics. s.l. : National Vital Statistics Reports, 2016. 5 Centers for Disease Control and Prevention. Influx of Fentanyl-laced Counterfeit Pills and Toxic Fentanyl-related
Compounds Further Increases Risk of Fentanyl-related Overdose and Fatalities. 2016.
0
500
1,000
1,500
2,000
2,500
3,000
3,500
Q4
'13
Q1
'14
Q2
'14
Q3
'14
Q4
'14
Q1
'15
Q2
'15
Q3
'15
Q4
'15
Q1
'16
Q2
'16
Nu
mb
er
of
EMS
Enco
un
ters
1 2 3 4+
2017 State of Illinois Comprehensive Opioid Data Report 20
Neonatal Abstinence Syndrome
Neonatal Abstinence Syndrome (NAS) refers to the collection of signs and symptoms that occur
when a newborn prenatally exposed to prescribed, diverted, or illicit opioids experiences opioid
withdrawal. Symptoms of NAS include irritability, tremors, feeding problems, vomiting, diarrhea,
sweating, and, in some cases, seizures. In addition to the direct symptoms of NAS, infants with
NAS are more likely to experience other adverse outcomes and complications at birth, including
low birth weight, respiratory problems, jaundice, feeding difficulties, and sepsis.6
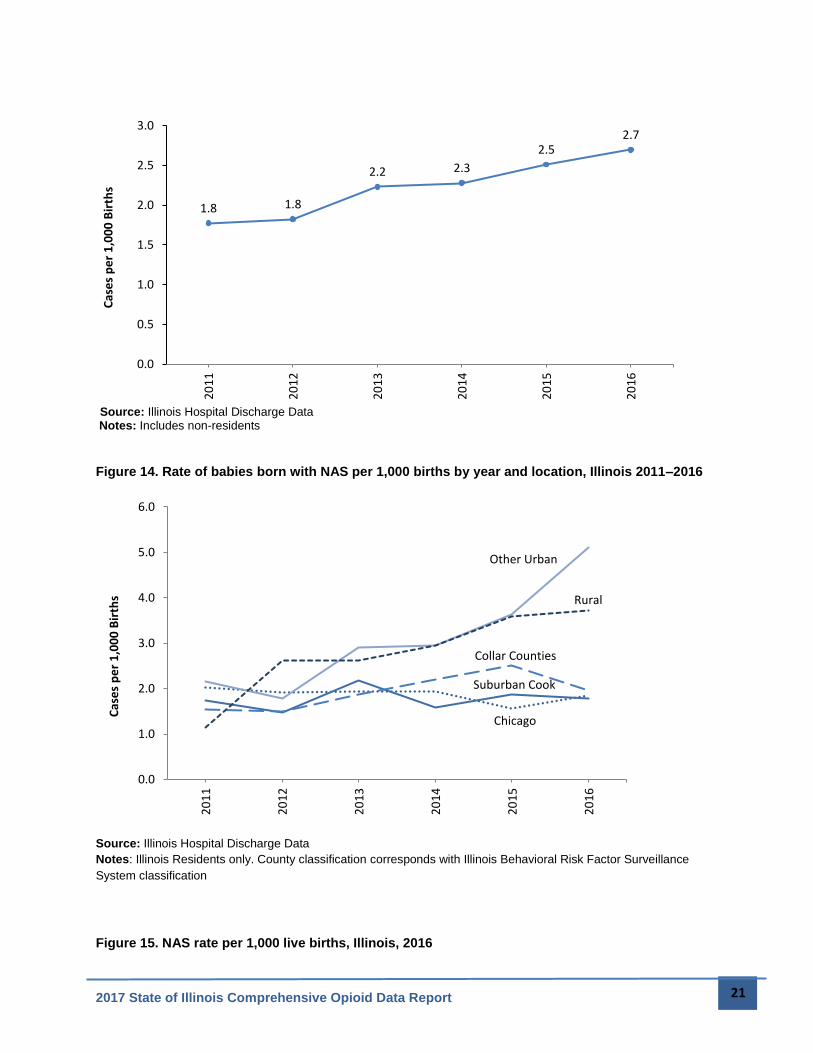
Between 2011 and 2016, there was a 53% increase in the NAS rate in Illinois. In 2016, the rate
of NAS in Illinois was 2.7 cases per 1,000 live births, affecting 391 newborn infants born in
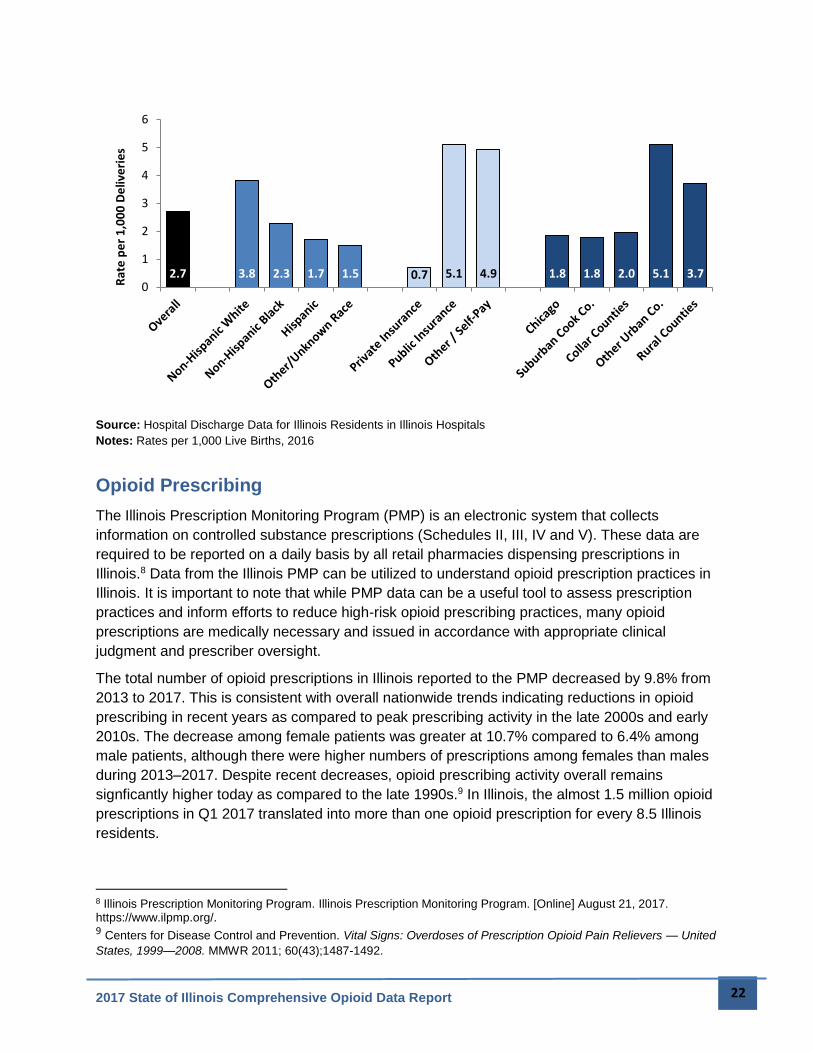
Illinois that year. NAS rates were highest among non-Hispanic whites, mothers on public
insurance, and in rural and urban counties outside of Cook and the Collar Counties (Figure 15).
Other urban counties outside of Cook County also had the steepest increase in NAS rates from
2015 to 2016.
In addition to the biological effects of NAS, there are substantial costs associated with these
births. Infants born in Illinois with NAS have longer hospital stays and much higher hospital
charges than infants without NAS. In 2015, the median length of hospital stay after birth was 13
days longer for infants with NAS compared to infants without NAS. Median hospital charges for
infants with NAS was more than ten times higher than for infants without NAS ($46,200
compared to $4,200). Overall, in 2015, the charges to care for infants born with NAS were $22
million higher than what would have been expected if they had been born without NAS.7
Figure 13. Rate of babies born with NAS per 1,000 births by year, Illinois 2011–2016
6 Illinois Department of Public Health. Neonatal Abstinence Syndrome. [Online] [Cited: August 21, 2017.] http://dph.illinois.gov/topics-services/prevention-wellness/prescription-opioids-and-heroin/neonatal-abstinence-syndrome. 7 Illinois Department of Public Health, (n.d.)
2017 State of Illinois Comprehensive Opioid Data Report 21
Source: Illinois Hospital Discharge Data Notes: Includes non-residents
Figure 14. Rate of babies born with NAS per 1,000 births by year and location, Illinois 2011–2016
Source: Illinois Hospital Discharge Data
Notes: Illinois Residents only. County classification corresponds with Illinois Behavioral Risk Factor Surveillance
System classification
Figure 15. NAS rate per 1,000 live births, Illinois, 2016
1.8 1.8
2.2 2.3
2.52.7
0.0
0.5
1.0
1.5
2.0
2.5
3.0
20
11
20
12
20
13
20
14
20
15
20
16
Cas
es
pe
r 1
,00
0 B
irth
s
Chicago
Suburban Cook
Collar Counties
Other Urban
Rural
0.0
1.0
2.0
3.0
4.0
5.0
6.0
20
11
20
12
20
13
20
14
20
15
20
16
Cas
es
pe
r 1
,00
0 B
irth
s
2017 State of Illinois Comprehensive Opioid Data Report 22
Source: Hospital Discharge Data for Illinois Residents in Illinois Hospitals
Notes: Rates per 1,000 Live Births, 2016
Opioid Prescribing
The Illinois Prescription Monitoring Program (PMP) is an electronic system that collects
information on controlled substance prescriptions (Schedules II, III, IV and V). These data are
required to be reported on a daily basis by all retail pharmacies dispensing prescriptions in
Illinois.8 Data from the Illinois PMP can be utilized to understand opioid prescription practices in
Illinois. It is important to note that while PMP data can be a useful tool to assess prescription
practices and inform efforts to reduce high-risk opioid prescribing practices, many opioid
prescriptions are medically necessary and issued in accordance with appropriate clinical
judgment and prescriber oversight.
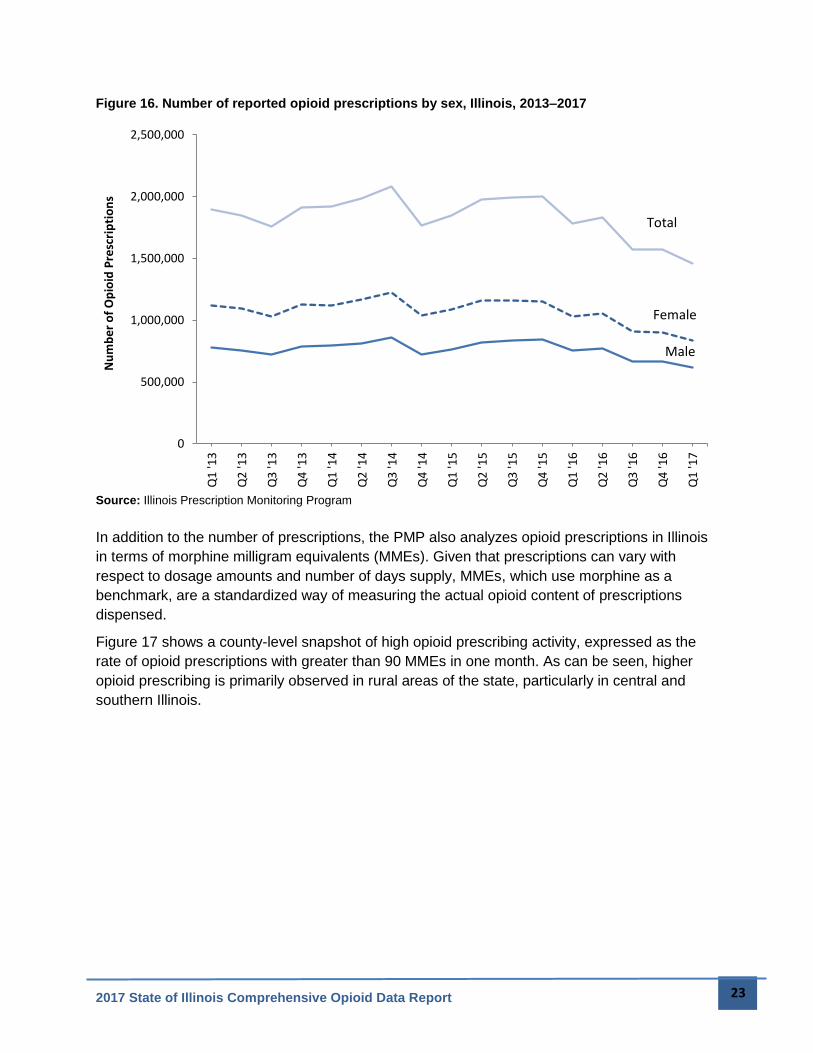
The total number of opioid prescriptions in Illinois reported to the PMP decreased by 9.8% from
2013 to 2017. This is consistent with overall nationwide trends indicating reductions in opioid
prescribing in recent years as compared to peak prescribing activity in the late 2000s and early
2010s. The decrease among female patients was greater at 10.7% compared to 6.4% among
male patients, although there were higher numbers of prescriptions among females than males
during 2013–2017. Despite recent decreases, opioid prescribing activity overall remains
signficantly higher today as compared to the late 1990s.9 In Illinois, the almost 1.5 million opioid
prescriptions in Q1 2017 translated into more than one opioid prescription for every 8.5 Illinois
residents.
8 Illinois Prescription Monitoring Program. Illinois Prescription Monitoring Program. [Online] August 21, 2017. https://www.ilpmp.org/. 9 Centers for Disease Control and Prevention. Vital Signs: Overdoses of Prescription Opioid Pain Relievers — United
States, 1999—2008. MMWR 2011; 60(43);1487-1492.
2.7 3.8 2.3 1.7 1.5 0.7 5.1 4.9 1.8 1.8 2.0 5.1 3.70
1
2
3
4
5
6R
ate
pe
r 1
,00
0 D
eliv
eri
es
2017 State of Illinois Comprehensive Opioid Data Report 23
Figure 16. Number of reported opioid prescriptions by sex, Illinois, 2013–2017
Source: Illinois Prescription Monitoring Program
In addition to the number of prescriptions, the PMP also analyzes opioid prescriptions in Illinois
in terms of morphine milligram equivalents (MMEs). Given that prescriptions can vary with
respect to dosage amounts and number of days supply, MMEs, which use morphine as a
benchmark, are a standardized way of measuring the actual opioid content of prescriptions
dispensed.
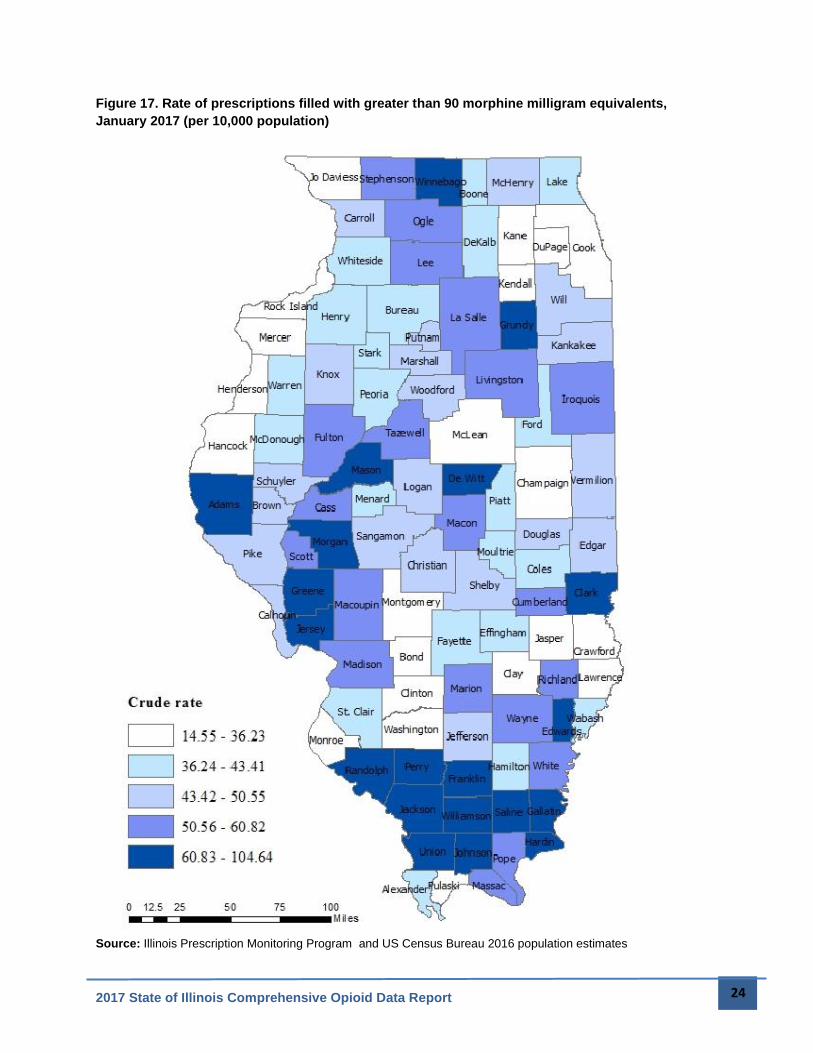
Figure 17 shows a county-level snapshot of high opioid prescribing activity, expressed as the
rate of opioid prescriptions with greater than 90 MMEs in one month. As can be seen, higher
opioid prescribing is primarily observed in rural areas of the state, particularly in central and
southern Illinois.
0
500,000
1,000,000
1,500,000
2,000,000
2,500,000
Q1
'13
Q2
'13
Q3
'13
Q4
'13
Q1
'14
Q2
'14
Q3
'14
Q4
'14
Q1
'15
Q2
'15
Q3
'15
Q4
'15
Q1
'16
Q2
'16
Q3
'16
Q4
'16
Q1
'17
Nu
mb
er
of
Op
ioid
Pre
scri
pti
on
s
Female
Male
Total
2017 State of Illinois Comprehensive Opioid Data Report 24
Figure 17. Rate of prescriptions filled with greater than 90 morphine milligram equivalents,
January 2017 (per 10,000 population)
Source: Illinois Prescription Monitoring Program and US Census Bureau 2016 population estimates
2017 State of Illinois Comprehensive Opioid Data Report 25
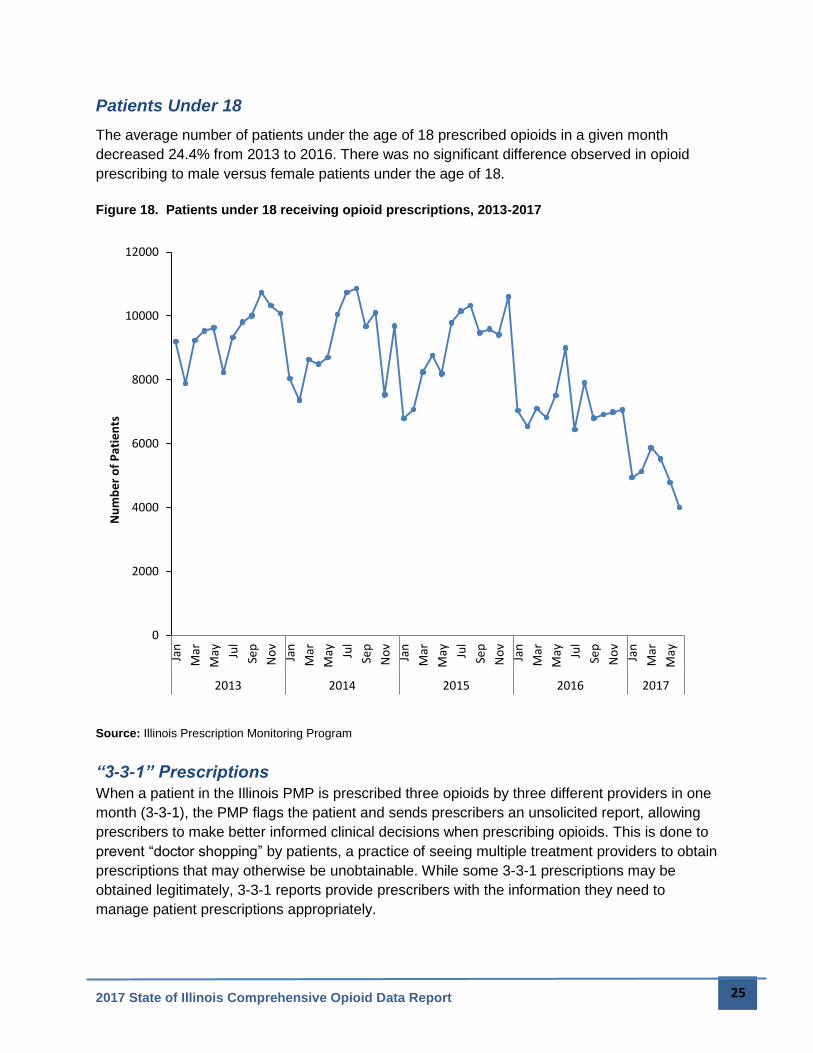
Patients Under 18
The average number of patients under the age of 18 prescribed opioids in a given month
decreased 24.4% from 2013 to 2016. There was no significant difference observed in opioid
prescribing to male versus female patients under the age of 18.
Figure 18. Patients under 18 receiving opioid prescriptions, 2013-2017
Source: Illinois Prescription Monitoring Program
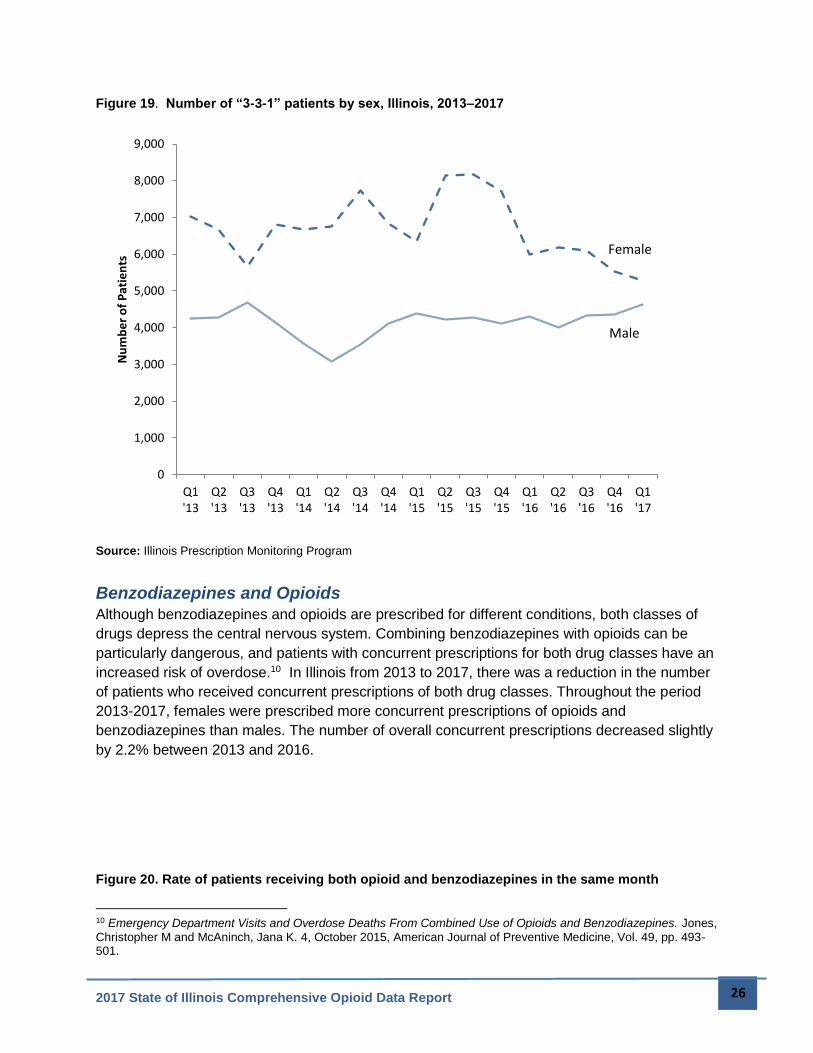
“3-3-1” Prescriptions
When a patient in the Illinois PMP is prescribed three opioids by three different providers in one
month (3-3-1), the PMP flags the patient and sends prescribers an unsolicited report, allowing
prescribers to make better informed clinical decisions when prescribing opioids. This is done to
prevent “doctor shopping” by patients, a practice of seeing multiple treatment providers to obtain
prescriptions that may otherwise be unobtainable. While some 3-3-1 prescriptions may be
obtained legitimately, 3-3-1 reports provide prescribers with the information they need to
manage patient prescriptions appropriately.
0
2000
4000
6000
8000
10000
12000
Jan
Mar
May Ju
l
Sep
No
v
Jan
Mar
May Ju
l
Sep
No
v
Jan
Mar
May Ju
l
Sep
No
v
Jan
Mar
May Ju
l
Sep
No
v
Jan
Mar
May
2013 2014 2015 2016 2017
Nu
mb
er
of
Pat
ien
ts
2017 State of Illinois Comprehensive Opioid Data Report 26
Figure 19. Number of “3-3-1” patients by sex, Illinois, 2013–2017
Source: Illinois Prescription Monitoring Program
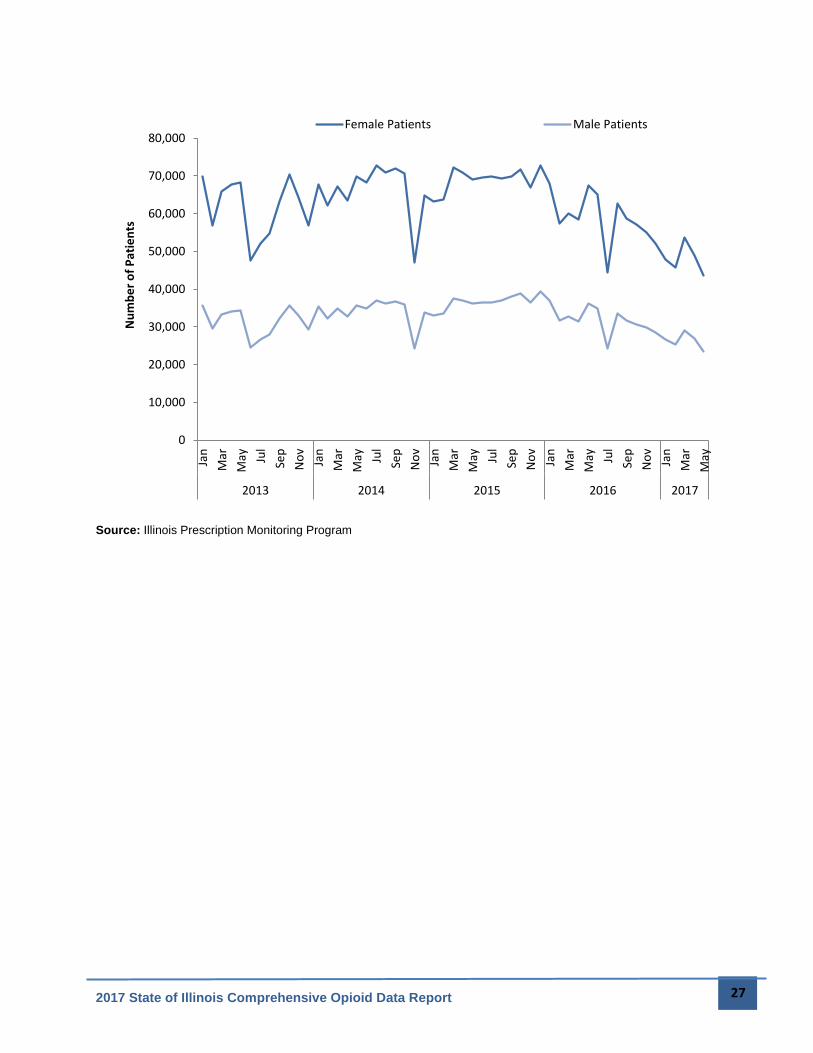
Benzodiazepines and Opioids
Although benzodiazepines and opioids are prescribed for different conditions, both classes of
drugs depress the central nervous system. Combining benzodiazepines with opioids can be
particularly dangerous, and patients with concurrent prescriptions for both drug classes have an
increased risk of overdose.10 In Illinois from 2013 to 2017, there was a reduction in the number
of patients who received concurrent prescriptions of both drug classes. Throughout the period
2013-2017, females were prescribed more concurrent prescriptions of opioids and
benzodiazepines than males. The number of overall concurrent prescriptions decreased slightly
by 2.2% between 2013 and 2016.
Figure 20. Rate of patients receiving both opioid and benzodiazepines in the same month
10 Emergency Department Visits and Overdose Deaths From Combined Use of Opioids and Benzodiazepines. Jones,
Christopher M and McAninch, Jana K. 4, October 2015, American Journal of Preventive Medicine, Vol. 49, pp. 493-501.
0
1,000
2,000
3,000
4,000
5,000
6,000
7,000
8,000
9,000
Q1'13
Q2'13
Q3'13
Q4'13
Q1'14
Q2'14
Q3'14
Q4'14
Q1'15
Q2'15
Q3'15
Q4'15
Q1'16
Q2'16
Q3'16
Q4'16
Q1'17
Nu
mb
er
of
Pat
ien
ts
Female
Male
2017 State of Illinois Comprehensive Opioid Data Report 27
Source: Illinois Prescription Monitoring Program
0
10,000
20,000
30,000
40,000
50,000
60,000
70,000
80,000
Jan
Mar
May Ju
l
Sep
No
v
Jan
Mar
May Ju
l
Sep
No
v
Jan
Mar
May Ju
l
Sep
No
v
Jan
Mar
May Ju
l
Sep
No
v
Jan
Mar
May
2013 2014 2015 2016 2017
Nu
mb
er
of
Pat
ien
tsFemale Patients Male Patients
2017 State of Illinois Comprehensive Opioid Data Report 28
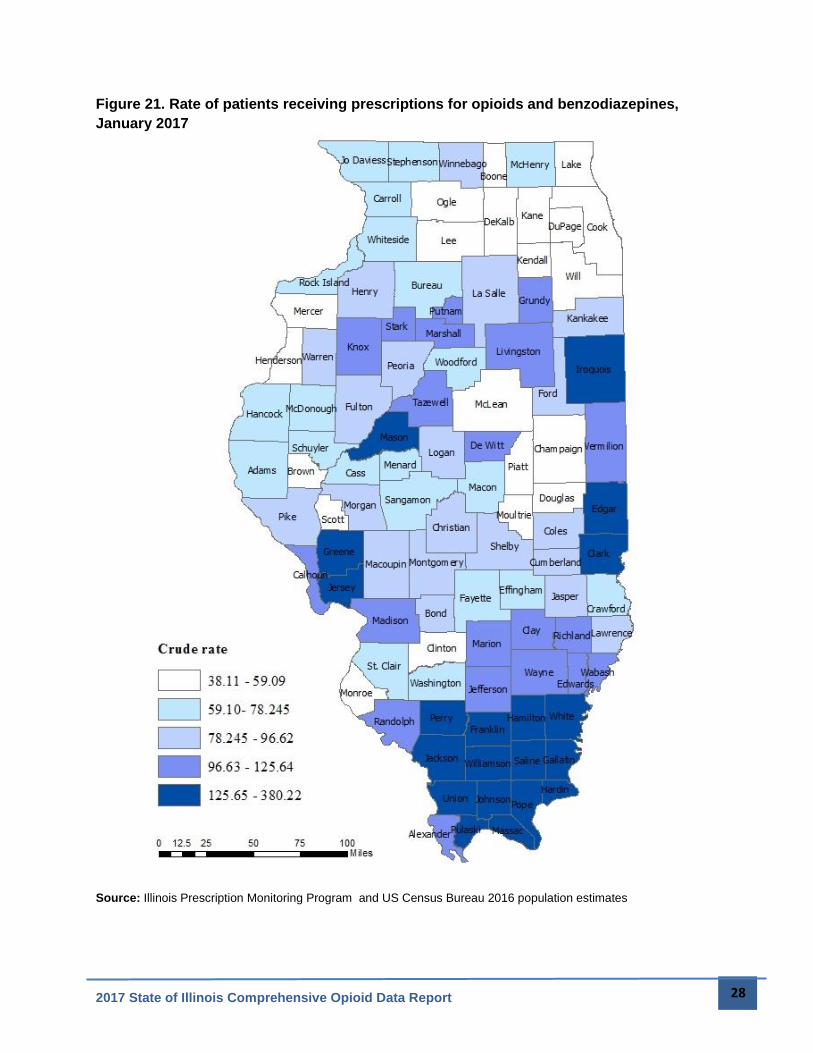
Figure 21. Rate of patients receiving prescriptions for opioids and benzodiazepines,
January 2017
Source: Illinois Prescription Monitoring Program and US Census Bureau 2016 population estimates
2017 State of Illinois Comprehensive Opioid Data Report 29
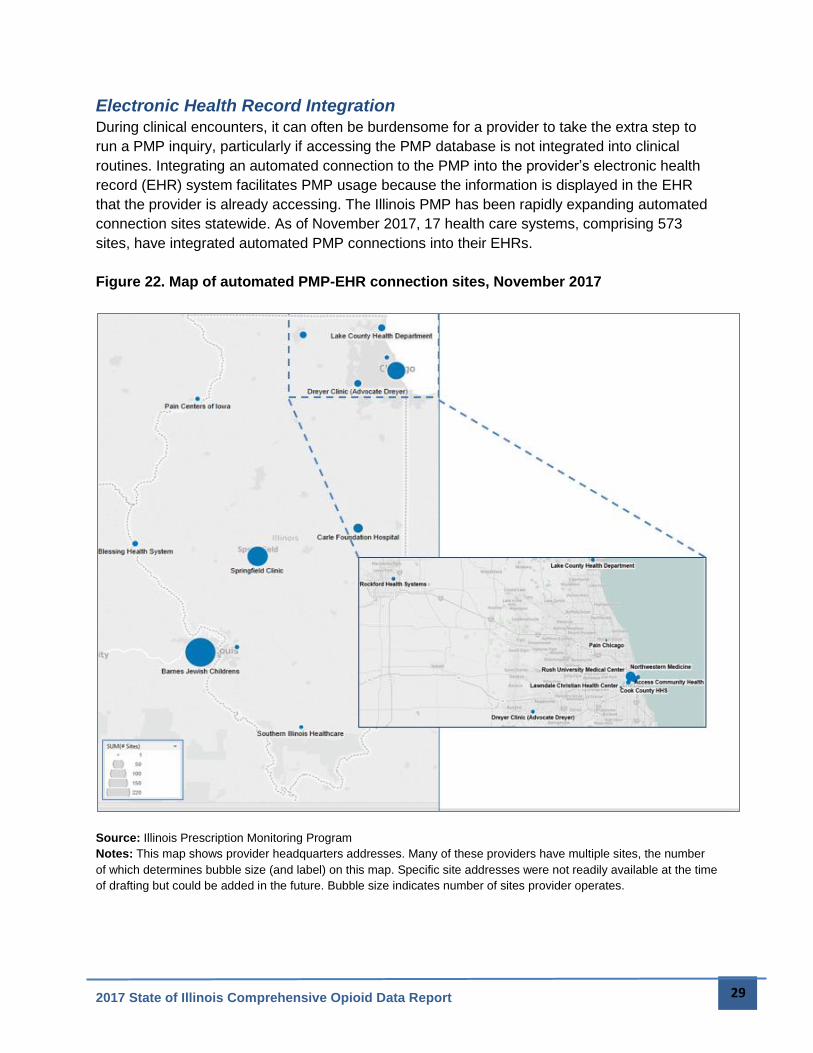
Electronic Health Record Integration
During clinical encounters, it can often be burdensome for a provider to take the extra step to
run a PMP inquiry, particularly if accessing the PMP database is not integrated into clinical
routines. Integrating an automated connection to the PMP into the provider’s electronic health
record (EHR) system facilitates PMP usage because the information is displayed in the EHR
that the provider is already accessing. The Illinois PMP has been rapidly expanding automated
connection sites statewide. As of November 2017, 17 health care systems, comprising 573
sites, have integrated automated PMP connections into their EHRs.
Figure 22. Map of automated PMP-EHR connection sites, November 2017
Source: Illinois Prescription Monitoring Program
Notes: This map shows provider headquarters addresses. Many of these providers have multiple sites, the number
of which determines bubble size (and label) on this map. Specific site addresses were not readily available at the time
of drafting but could be added in the future. Bubble size indicates number of sites provider operates.
2017 State of Illinois Comprehensive Opioid Data Report 30
Infectious Diseases
HIV
People who inject drugs (PWID) are at high risk of contracting HIV. Fortunately, advancements
in HIV treatment have led to suppression of HIV viral activity among many persons living with
HIV/AIDS (PLWHA) engaged in medical care and compliant with HIV medication regimens. As a
result, there has been a decrease in the spread of HIV among most groups, including drug-
using communities. In addition to HIV treatment and virologic suppression, PWID have greatly
benefited from prevention activities and harm reduction programs providing syringe exchange
services, targeted HIV testing, and timely linkage to culturally-responsive medical care. Illinois
has seen steep declines in HIV diagnoses among PWID in the past decade, in part due to
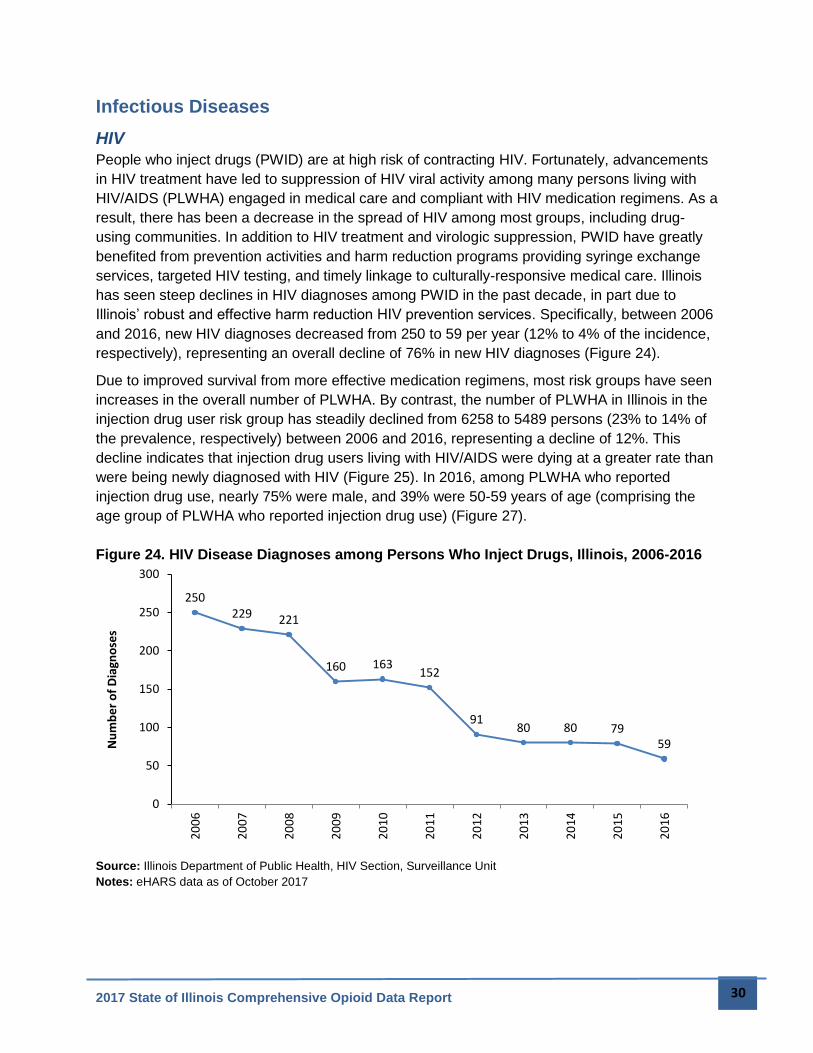
Illinois’ robust and effective harm reduction HIV prevention services. Specifically, between 2006
and 2016, new HIV diagnoses decreased from 250 to 59 per year (12% to 4% of the incidence,
respectively), representing an overall decline of 76% in new HIV diagnoses (Figure 24).
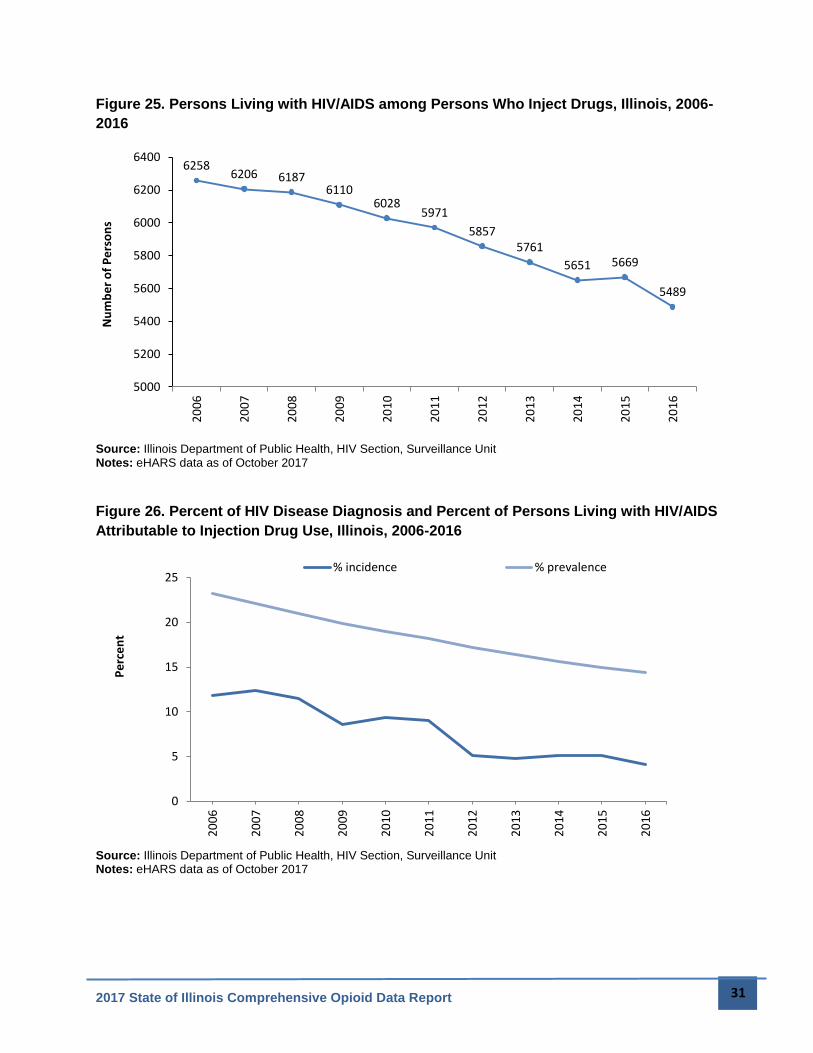
Due to improved survival from more effective medication regimens, most risk groups have seen
increases in the overall number of PLWHA. By contrast, the number of PLWHA in Illinois in the
injection drug user risk group has steadily declined from 6258 to 5489 persons (23% to 14% of
the prevalence, respectively) between 2006 and 2016, representing a decline of 12%. This
decline indicates that injection drug users living with HIV/AIDS were dying at a greater rate than
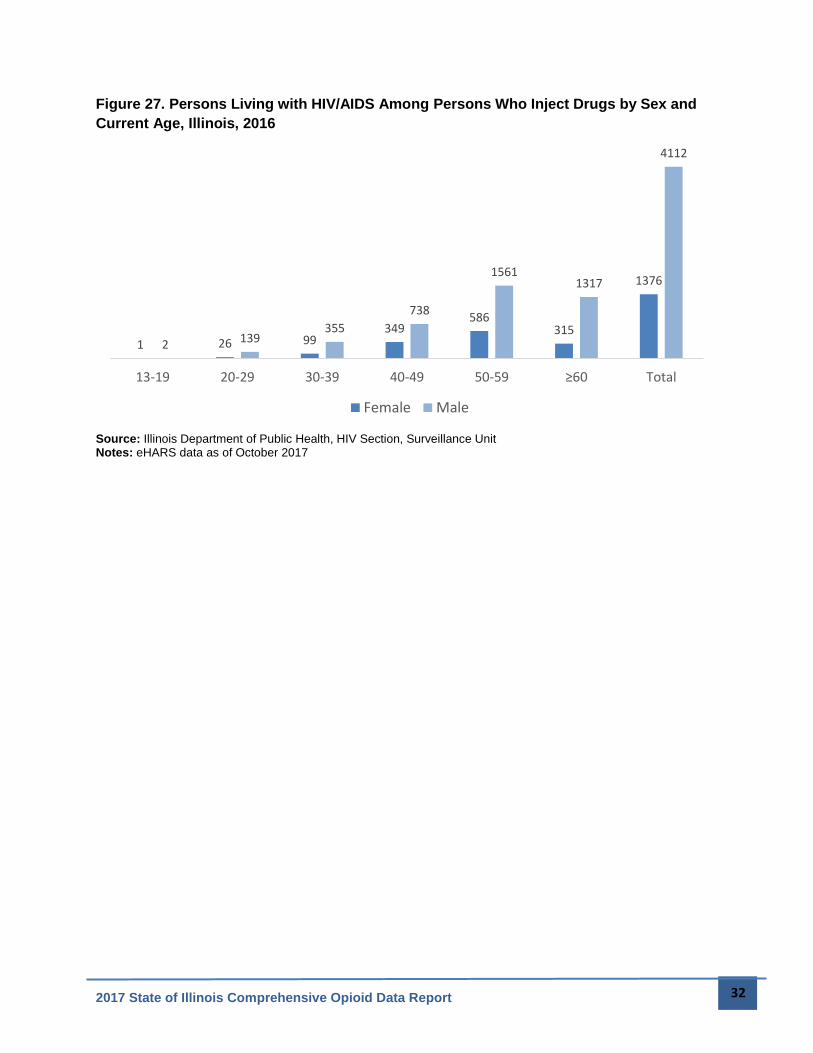
were being newly diagnosed with HIV (Figure 25). In 2016, among PLWHA who reported
injection drug use, nearly 75% were male, and 39% were 50-59 years of age (comprising the
age group of PLWHA who reported injection drug use) (Figure 27).
Figure 24. HIV Disease Diagnoses among Persons Who Inject Drugs, Illinois, 2006-2016
Source: Illinois Department of Public Health, HIV Section, Surveillance Unit Notes: eHARS data as of October 2017
250229 221
160 163152
9180 80 79
59
0
50
100
150
200
250
300
20
06
20
07
20
08
20
09
20
10
20
11
20
12
20
13
20
14
20
15
20
16
Nu
mb
er
of
Dia
gno
ses
2017 State of Illinois Comprehensive Opioid Data Report 31
Figure 25. Persons Living with HIV/AIDS among Persons Who Inject Drugs, Illinois, 2006-
2016
Source: Illinois Department of Public Health, HIV Section, Surveillance Unit Notes: eHARS data as of October 2017
Figure 26. Percent of HIV Disease Diagnosis and Percent of Persons Living with HIV/AIDS
Attributable to Injection Drug Use, Illinois, 2006-2016
Source: Illinois Department of Public Health, HIV Section, Surveillance Unit Notes: eHARS data as of October 2017
62586206 6187
61106028
5971
58575761
5651 5669
5489
5000
5200
5400
5600
5800
6000
6200
6400
20
06
20
07
20
08
20
09
20
10
20
11
20
12
20
13
20
14
20
15
20
16
Nu
mb
er
of
Pe
rso
ns
0
5
10
15
20
25
20
06
20
07
20
08
20
09
20
10
20
11
20
12
20
13
20
14
20
15
20
16
Pe
rce
nt
% incidence % prevalence
2017 State of Illinois Comprehensive Opioid Data Report 32
Figure 27. Persons Living with HIV/AIDS Among Persons Who Inject Drugs by Sex and
Current Age, Illinois, 2016
Source: Illinois Department of Public Health, HIV Section, Surveillance Unit Notes: eHARS data as of October 2017
1 26 99349
586315
1376
2 139355
738
15611317
4112
13-19 20-29 30-39 40-49 50-59 ≥60 Total
Female Male
2017 State of Illinois Comprehensive Opioid Data Report 33
Hepatitis C
Similar to HIV, intravenous drug users have a particularly high risk of contracting Hepatitis C
Virus (HCV), resulting in a high prevalence of the disease among individuals who use opioids.11
HCV infection is a disease transmitted through blood that affects the liver. Acute HCV infection
is a short-term illness that, for most people, develops into chronic HCV infection. Chronic HCV
infection can last a lifetime and lead to serious liver problems, including cirrhosis and liver
cancer. Both acute and chronic HCV infection can be treated with medication, including new
treatments that are more effective and have fewer side effects than previously available
medications.
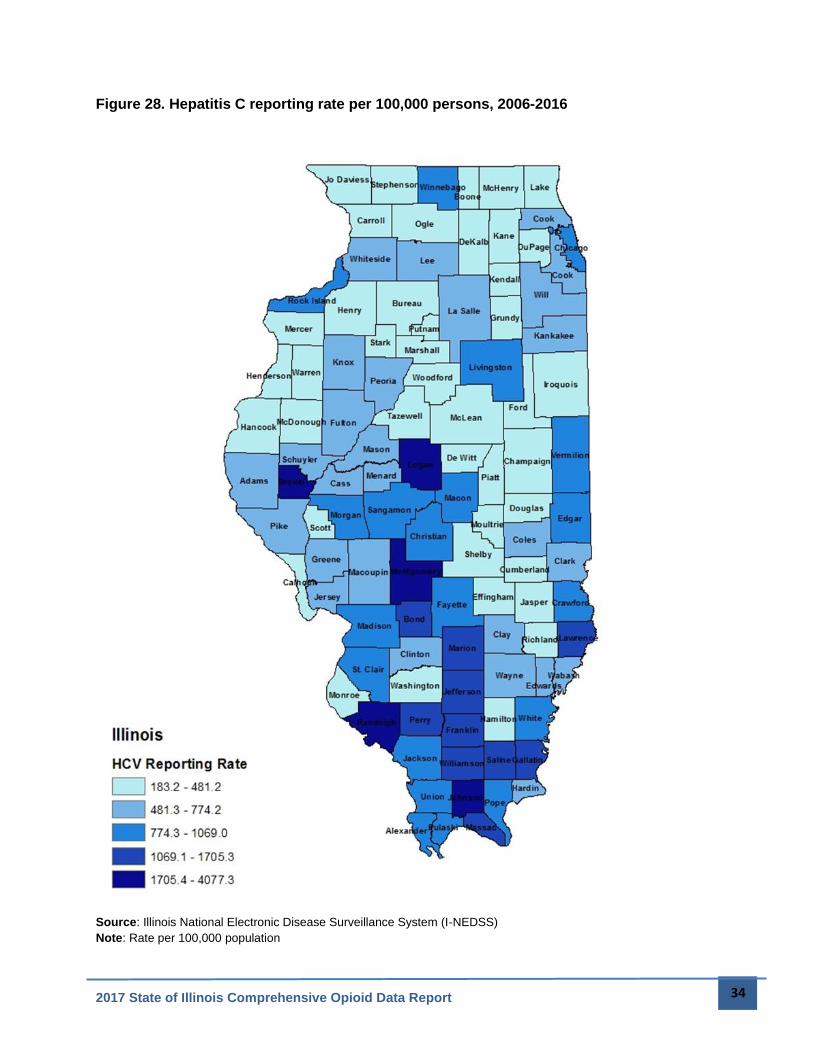
Nationally, rates of HCV increased 167 percent between 2000 and 2015 with the highest rates
among people who inject drugs.12 In Illinois, both chronic and acute HCV are reportable. Acute
HCV infections that are very recently acquired cause minimal symptoms and are difficult to
distinguish from chronic HCV. Reporting rates of HCV are highest in the central and southern
regions of the state (Figure 28), while the overall HCV disease burden by absolute number
counts remain highest in northeastern Illinois.
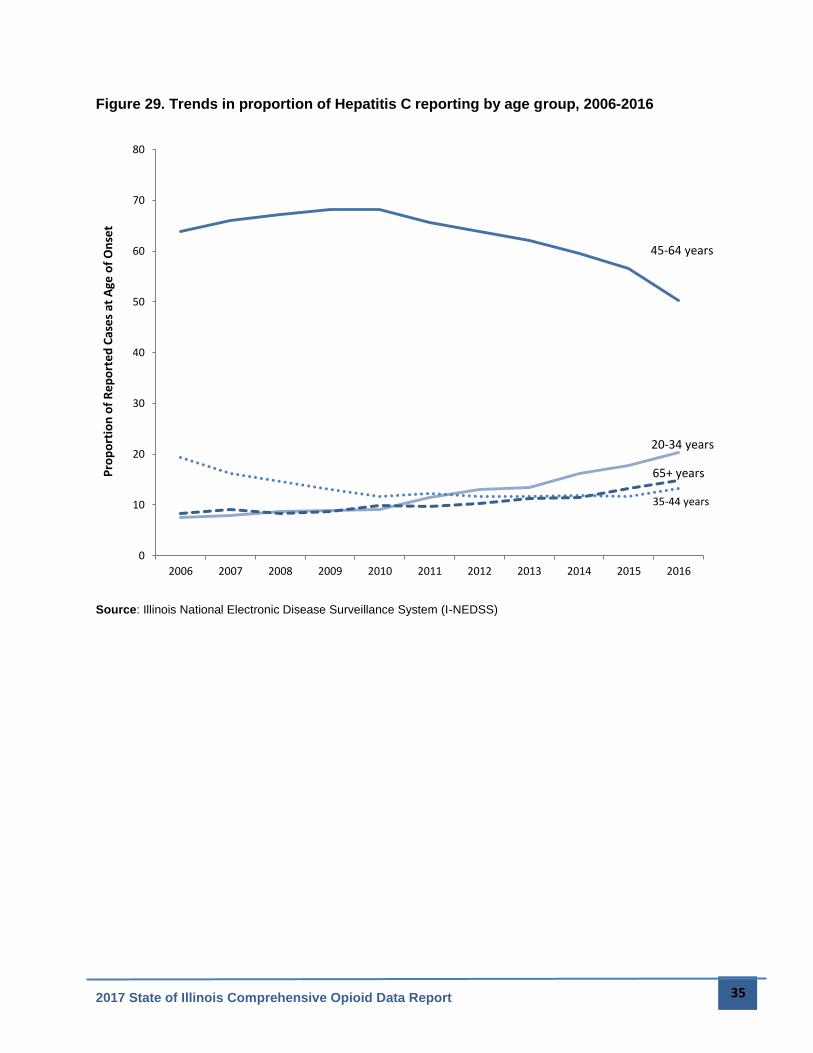
Baby boomers, born between 1945-1965, are at higher risk of having an HCV infection. As this
cohort ages, disease reporting trends over time are expected to show decreases in rates
amongst the 45-65 year old age group and an increase in the 65 and older age group. Figure 29
also shows an increasing trend in reported HCV among younger populations, particularly the
20-34 year old cohort, increasing from 7.54% of reported cases in 2006 to 20.31% of cases in
2016.
11 Centers for Disease Control and Prevention. Viral Hepatitis. Viral Hepatitis and Young Persons Who Inject Drugs. [Online] April 17, 2017. https://www.cdc.gov/hepatitis/featuredtopics/youngpwid.htm. 12 MMWR Morbidity and Mortality Weekly Report. Hepatitis Awareness Month and Testing Day — May 2017. s.l. : Centers for Disease Control and Prevention, 2017.
2017 State of Illinois Comprehensive Opioid Data Report 34
Figure 28. Hepatitis C reporting rate per 100,000 persons, 2006-2016
Source: Illinois National Electronic Disease Surveillance System (I-NEDSS)
Note: Rate per 100,000 population
2017 State of Illinois Comprehensive Opioid Data Report 35
Figure 29. Trends in proportion of Hepatitis C reporting by age group, 2006-2016
Source: Illinois National Electronic Disease Surveillance System (I-NEDSS)
20-34 years
35-44 years
45-64 years
65+ years
0
10
20
30
40
50
60
70
80
2006 2007 2008 2009 2010 2011 2012 2013 2014 2015 2016
Pro
po
rtio
n o
f R
ep
ort
ed
Cas
es
at A
ge o
f O
nse
t
2017 State of Illinois Comprehensive Opioid Data Report 36
2017 State of Illinois Comprehensive Opioid Data Report 37
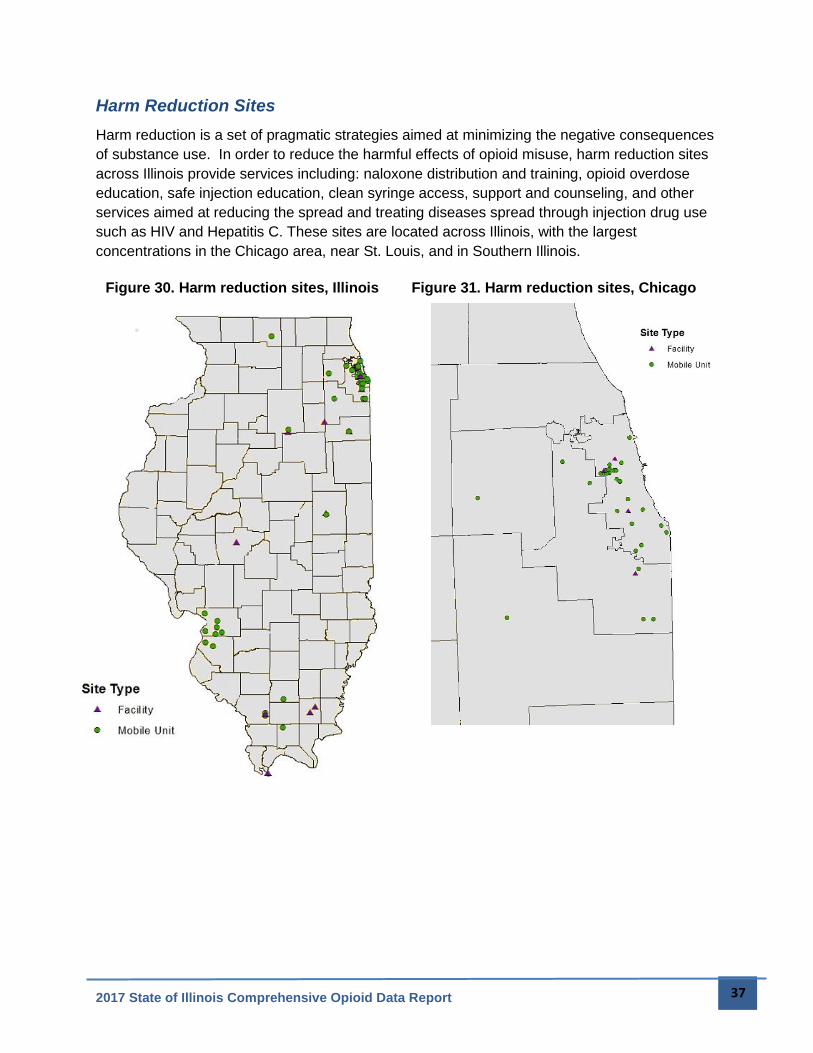
Harm Reduction Sites
Harm reduction is a set of pragmatic strategies aimed at minimizing the negative consequences
of substance use. In order to reduce the harmful effects of opioid misuse, harm reduction sites
across Illinois provide services including: naloxone distribution and training, opioid overdose
education, safe injection education, clean syringe access, support and counseling, and other
services aimed at reducing the spread and treating diseases spread through injection drug use
such as HIV and Hepatitis C. These sites are located across Illinois, with the largest
concentrations in the Chicago area, near St. Louis, and in Southern Illinois.
Figure 30. Harm reduction sites, Illinois Figure 31. Harm reduction sites, Chicago
2017 State of Illinois Comprehensive Opioid Data Report 38
Conclusion
This report is a compilation of existing opioid data currently being collected by state agencies. It
is meant to inform statewide efforts to combat the opioid epidemic and implement the State of
Illinois Opioid Action Plan. The report provides an initial understanding of opioid misuse,
overdose, and overdose deaths on Illinois. Efforts are underway to expand and analyze these
existing data and to strengthen data collection and analysis statewide. It is important to
remember that any individual dataset cannot tell the entire story of opioid use—or indeed any
other public health issue—and data must always be put into context to be understood fully.
The data in this report show that no group is unaffected by the opioid crisis in Illinois. Rather,
different groups are affected differently when it comes to prescribing, nonfatal overdose, fatal
overdose, infectious disease, and other aspects of opioid use. This understanding will help
shape future research, interventions, and policies as we target interventions appropriately,
culturally competently, and effectively.