state of illinois · illinois non-farm employment by industry1 fortune 500 companies headquartered...
TRANSCRIPT

State of Illinois General Obligation Bonds Rating Agency Presentation Information Summary October 2 and 3, 2017

1. Illinois’ Strong and Diverse Economy 3
2. FY 2018 Budget Update 9
3. Pensions 14
4. Debt Overview 18
5. Bill Backlog and Plan of Finance 23
Table of Contents

Kim Fowler
Chief Legal Counsel
Alexis Sturm
Chief of Staff
Kelly Hutchinson
Director of Capital Markets
Scott Harry
Director
Presentation Participants – Governor’s Office of Management and Budget
1
Charlie Weikel
Director – Governor's Office of
Policy & Operations

Passage of fiscal year 2018 Budget
Permanent increase in personal income tax and corporate income tax rates to 4.95% and 7.00% respectively
Passage of Tier 3 Pension Plan and funding changes
Passage of Senate Bill 1947 remedied education funding disparities
Reauthorization of Edge Tax Credits to allow the State to compete for major economic development projects
Reduced risk to swap counterparties by renegotiating rating triggers
Sovereign State with significant revenue flexibility
Illinois’ economy is the 5th largest in the United States and 18th largest worldwide
Statutory provisions gives priority to debt service over other State expenditures
GO Bond debt service has a continuing appropriation
Debt service is limited to no more than 7% of General Funds and Road Fund Appropriations, without a waiver from the Treasurer and Comptroller
Debt service requirements decline by over $978 million after FY 2019 due to pension bonds maturing, providing significant flexibility
Issuance of the General Obligation Bonds will pay off approximately $6.0 billion of outstanding bills and is
expected to result in the receipt of additional federal funds
By the end of fiscal year 2018, the bill backlog is expected to be approximately $7.5 billion, a nearly 50%
reduction
Recent Developments Inherent Credit Strengths
Note: Amounts related to the plan of finance and bill backlog are estimates
The State’s Credit Fundamentals Have Improved Significantly
2

1. Illinois’ Strong and Diverse Economy

Illinois is home to 36 Fortune 500 companies
– Only New York, California and Texas have more
The City of Chicago was named “top metro for corporate relocation(s)” for the 4th year in a row3
– Recent major relocations to Illinois include Mars and Conagra
Chicago’s diversified economy is a major attraction for workers and recent graduates across the nation, bringing educated and skilled workers into the State
Illinois has a strong economy with a diverse workforce
similar to the nation
Broad employment base with no industry accounting for
more than 20%
The State is well-positioned for long-term stability
through economic cycles
Fortune 500 Companies Headquartered in Illinois2 Illinois Non-Farm Employment by Industry1
1. U.S. Department of Labor, Bureau of Labor Statistics 2. Fortune.com 3. Site Selection Magazine.
2016
Rank
2015
Rank Company Industry Category
17 19 Walgreens Boots Alliance Food and Drug Stores
24 24 Boeing Aerrospace & Defense
33 35 State Farm Insurance Cos. Insurance: Property and Casualty (Mutual)
45 41 Archer Daniels Midland Food Production
74 59 Caterpillar Construction and Farm Machinery
83 80 United Continental Holdings Arlines
84 81 Allstate Insurance: Property and Casualty (Stock)
89 95 Exelon Utilities: Gas and Electric
105 97 Deere Construction and Farm Machinery
109 94 Mondelez International Food Consumer Products
111 123 AbbVie Health Care
112 109 McDonald's Food Services
124 122 US Foods Wholesalers: Food and Grocery
127 111 Sears Holdings General Merchandisers
135 138 Abbott Laboratories Medical Products and Equipment
197 173 Conagra Brands Food Consumer Products
199 220 CDW Information Technology Services
202 211 Illinois Tool Works Industrial Machinery
277 283 Discover Financial Services Commercial Banks
281 286 Baxter International Medical Products and Equipment
283 285 W.W. Grainger Wholesalers: Diversified
304 369 LKQ Wholesalers: Diversified
322 334 Tenneco Motor Vehicles & Parts
337 281 Navistar International Construction and Farm Machinery
338 315 Univar Wholesalers: Diversified
359 391 Anixter International Wholesalers: Electronics and Office Equipment
388 258 R.R. Donnelly & Sons Publishing, Printing
391 436 Jones Lang LaSalle Real Estate
392 377 Dover Industrial Machinery
427 767 TreeHouse Foods Food Consumer Products
433 451 Motorola Solutions Network and Other Communications Equipment
439 442 Old Republic International Insurance: Property and Casualty (Stock)
450 446 Packaging Corp. of America Packaging, Containers
456 456 Ingredion Food Production
462 471 Arthur J. Gallagher Diversified Financials
487 477 Essendant Wholesalers: Electronics and Office Equipment
Trade,
Transportation
and Utilities
20%
Professional and
Business
Services
16%
Education and
Health Services
15%
Government
14%
Leisure and
Hospitality
10%
Manufacturing
9%
Financial
Activities
6%
Mining, Logging,
Information and
Other Services
6%
Construction
3%
Illinois’ Strong and Diverse Economy
3 Illinois’ Strong and Diverse Economy

0.0
2.0
4.0
6.0
8.0
10.0
12.0
5,300
5,400
5,500
5,600
5,700
5,800
5,900
6,000
6,100
6,200
6,300
IL Employment IL Unemployment Rate National Unemployment Rate
$620,000
$630,000
$640,000
$650,000
$660,000
$670,000
$680,000
$690,000
$700,000
2006 2007 2008 2009 2010 2011 2012 2013 2014 2015 2016 1Q17
Median Household Income
Illinois MHI has grown 4.5% annually on average since 2011, outpacing the
US (3.1%) and neighboring states (3.1%). Income as measured by both PCI and
MHI remains well above national averages.
Source: U.S. Department of Commerce, Bureau of Economic Analysis; Bureau of Labor Statistics 1. YTD averages 2. As of August 2017, not seasonally-adjusted and
preliminary and subject to change 3. Bureau of Economic Analysis 2017, data as of 7/2017.
Per Capita Personal Income1
Illinois’ Per Capita income is ranked 4th among the 10 largest states.
Upward Trend in IL Real GDP3
In Q1 of 2017 Illinois’ economy ranked 5th in the nation and 18th in the
world at $804 Billion (behind Florida and ahead of The Netherlands).
Average Non-farm Employment and Unemployment1,2
Employment increased with jobs exceeding 6.0 million in 2016.
Mil
lion
s of
Ch
ain
ed
2009 D
oll
ars
Un
em
plo
ym
en
t Rate
(%) E
mp
loym
en
t (T
hou
san
ds)
$48,000
$50,000
$52,000
$54,000
$56,000
$58,000
$60,000
$62,000
2012 2013 2014 2015 2016Illinois National
$36,000
$38,000
$40,000
$42,000
$44,000
$46,000
$48,000
$50,000
$52,000
$54,000
2011 2012 2013 2014 2015 2016 1H2017
Illinois United States Great Lakes
Illinois’ Robust Economic Indicators
4 Illinois’ Strong and Diverse Economy

Demographics by Age The State’s population mix by age mirrors the US but has a lower
percentage of people over 65.
Source: US Census, US Bureau of Labor Statistics.
Population Illinois is the 5th most populous state in the nation and has grown
each decade through 2010 with a modest YoY decline in 2016.
Highly Educated Population Illinois is home to top ranked universities bringing talented and educated individuals to the State. Illinois residents with college degrees is
32.3%, well above the US at 29.8% and the Great Lakes States at 26.2%.
0% 5% 10% 15% 20% 25% 30%
> 65 yrs
45 to 64
25 to 44
18 to 24
under 18
U.S. Illinois
10.0
10.5
11.0
11.5
12.0
12.5
13.0
1970 1980 1990 2000 2010 2016
mil
lio
ns
Demographic Analysis
5 Illinois’ Strong and Diverse Economy
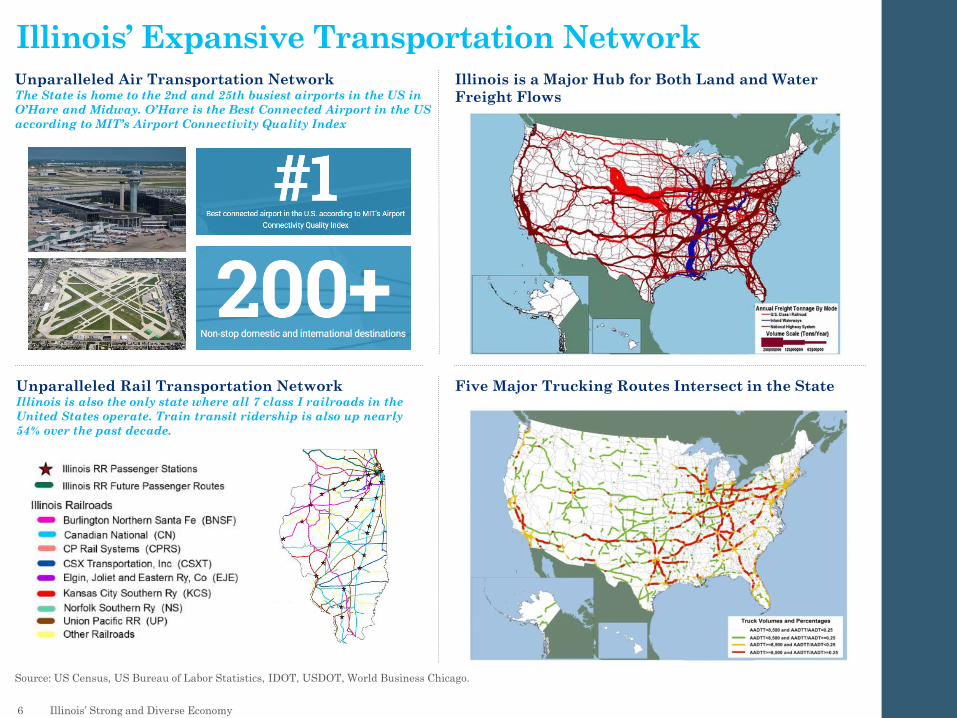
Illinois is a Major Hub for Both Land and Water
Freight Flows
Source: US Census, US Bureau of Labor Statistics, IDOT, USDOT, World Business Chicago.
Unparalleled Air Transportation Network The State is home to the 2nd and 25th busiest airports in the US in
O’Hare and Midway. O’Hare is the Best Connected Airport in the US
according to MIT’s Airport Connectivity Quality Index
Unparalleled Rail Transportation Network Illinois is also the only state where all 7 class I railroads in the
United States operate. Train transit ridership is also up nearly
54% over the past decade.
Five Major Trucking Routes Intersect in the State
Illinois’ Expansive Transportation Network
6 Illinois’ Strong and Diverse Economy

2. FY 2018 Budget Update

FY 2017 Budget Review
7 FY 2018 Budget Update
A full FY 2017 General Funds budget was not
enacted prior to the end of the fiscal year
All payments for General Obligation and Build
Illinois bond debt service were made
Final FY 2017 General Funds revenue totaled
$29.405 billion
For the General Funds budget, certain
appropriations were enacted and spending
occurred through statutory transfers, statutory
continuing appropriations, court orders and
consent decrees. Such spending is estimated to
total $34.0 billion in categories such as:
– Elementary and secondary education
– Medicaid and certain social service grant
programs covered by consent decree
– State employee payrolls by court order
– Pension contributions
– Transfers to other State funds, including for
debt service
– FY 2017 Appropriations in some cases were
used to pay FY 2016 obligations
Approximately $2.8 billion in State General
Funds operational liabilities were not
appropriated in FY 2017, but these may be paid
from future year appropriations
1. Cash basis. Does not include transfers in from Budget Stabilization Fund. 2. Estimated expenditures based on FY 2017 spending as of 10/4/17, does not reflect IOC
budgetary adjustments. Estimated expenditures are only those processed by Comptroller via appropriation, continuing appropriation or court order/consent decree during FY
2017 and FY 2017 lapse period. 3. GOMB estimate of FY 2017 General Funds liabilities not appropriated.
General Funds Estimated Results ($millions)
FY 2017
Estimated
Base Resources
State Sources $25,380
Transfers In1 $1,542
Total State Sources $26,922
Federal Sources $2,483
Total Resources $29,405
Estimated Budgetary Expenditures2 $29,400
Statutory Transfers Out $2,400
Debt Service $2,235
Total Transfers $4,635
Total Expenditures $34,035
Estimated General Funds Surplus (Deficit) (4,630)
Estimated FY 2017 Operational Liabilities Not Paid3 2,800

FY 2018 Budget Update
8 FY 2018 Budget Update
As of May 31, 2017, no appropriations bills for spending for Fiscal Year 2018 had passed both chambers of
the General Assembly. After this date, the Illinois Constitution requires that changes in law and
appropriations may be immediately effective only with the approval of 3/5ths of the members of each
chamber rather than a simple majority
In early July, the General Assembly passed a Fiscal Year 2018 budget package, including appropriations and
revenue increases
– The Governor vetoed the bills related to the budget package on July 4, 2017, citing imbalances in the
proposed Fiscal Year 2018 General Funds budget
– The Senate and the House of Representatives overrode the Governor’s veto of the budget package
Three budget-related Public Acts went into effect on July 6, 2017 – PA 100-21 (appropriations), PA 100-22
(revenues) and PA 100-23 (the budget implementation statutory changes)
Included in PA 100-22 were permanent increases in the individual income tax rate from 3.75 percent to
4.95 percent and in the corporate income tax rate from 5.25 percent to 7.0 percent, effective July 1, 2017
Other revenue changes included revisions to certain tax credits and corporate income tax deductions

FY 2018 Budget Update (continued)
9 FY 2018 Budget Update
PA 100-23, the statutory budget implementation bill, included several legislative changes:
The General Assembly enacted pension funding reforms with the expectation that the revisions would
reduce the amount of contributions the State is required to make during Fiscal Year 2018
For Fiscal Year 2018, there is a 10% reduction in State income and sales tax revenue sharing with local
governments and transit districts, and also a shifting of this revenue sharing from a legislative transfer from
the General Revenue Fund after income and sales taxes are deposited into the fund to a direct deposit
Authorization for the State to issue up to $6 billion in Section 7.6 Bonds (which includes the Bonds and the
Series of November 2017D Bonds) to be used to reduce the State’s accumulated unpaid bills by paying State
vouchers incurred prior to July 1, 2017
Authorization for the Comptroller to reallocate in Fiscal Year 2018 up to $292.8 million from specific funds
Authorization for the Comptroller to temporarily transfer balances in other State funds in State Treasury to
General Funds or the Health Insurance Reserve Fund prior to December 31, 2018
– Any such interfund borrowing amounts are required to be paid back within 24 months of the borrowing
under current statute
– Outstanding interfund borrowing cannot at any time exceed $1.2 billion
As of September 30, 2017, the Comptroller had processed fund reallocations totaling $126 million and
interfund borrowing of $150 million for deposit into the General Revenue Fund

FY 2018 Estimated General Funds Revenues
10 FY 2018 Budget Update
Under current law, General Funds revenues are estimated to total $35.899 billion for FY 2018, a $6.494
billion increase, or 22.1%, from FY 2017 actual revenues
– When compared to the same group of 7 funds in the revised definition, the FY 2018 revenue estimate is
$5.566 billion, or 18.4% higher than in FY 2017
– The FY 2018 numbers also reflect the impact of the direct deposit of income tax and sales tax revenue
sharing with local governments and transit districts, estimated to total $1.558 billion
– Does not include potential revenues from interfund borrowing or fund reallocations
Federal revenue receipts will depend on the amount of reimbursable Medicaid spending and the timing of
the payments by the State, but payments are expected to be more timely in FY 2018. If the Bonds are used
to pay Medicaid bills, additional federal revenues may be received
$millions
FY 2016 FY 2017 FY 2018
$ increase % increase Actual Actual Forecast
(Previous) (Previous) (Sept 2017)
State Sources: Revenues
Net Individual Income Taxes $12,890 $12,737 $17,250 $4,513 35.4%
Net Corporate Income Taxes 1,972 1,328 1,882 554 41.7%
Sales Taxes 8,063 8,043 7,970 (73) -0.9%
Total, Income and Sales Taxes 22,925 22,108 27,102 4,994 22.6%
Other State Revenues and Transfers 3,202 3,272 3,528 256 7.8%
Transfers In1 1,581 1,542 1,713 171 11.1%
Total State Sources 27,708 26,922 32,343 5,421 20.1%
Federal Sources 2,665 2,483 3,556 1,073 43.2%
Total Resources $30,373 $29,405 $35,899 $6,494 22.1%
1. Cash Basis. Does not include transfers from Budget Stabilization Fund or for FY 2018 interfund borrowing or fund reallocations. Note: General Funds in FY 2018 was
expanded to include 3 additional funds (the Commitment to Human Services Fund, Fund for the Advancement of Education, and the Budget Stabilization Fund) to a
total of 7 funds. FY 2017 and earlier reflects the original definition.

Estimated Spending for FY 2018 Budget Outlook
11 FY 2018 Budget Update
The estimated spending for the enacted FY 2018 General Funds budget is $37.4 billion
– Estimated spending from appropriations of $33.9 billion
– Debt service transfers to the GOBRI fund, including amounts needed for the Bonds, is estimated to total $2.9 billion
– Transfers to other State Funds is $573 million, significantly below previous year due to the direct deposit of local governments revenue sharing
The State’s base spending commitments are expected to exceed forecasted revenues by approximately
$1.5 billion
The FY 2018 General Funds budget will likely show a surplus reporting on a reporting basis due to:
– The transfer of a portion of the Bonds to the General Revenue Fund after issuance
– Potential additional federal revenues above the current federal revenue estimate if a portion of the Bonds are used to pay Medicaid bills
– Utilization of interfund borrowing and fund reallocations by the Comptroller in FY 2018
General Funds Expenditures1 ($billions)
FY 2018 Projected
Operating Budget (from Appropriations) $33.9
GO Bond Debt Service Transfers 2.9
Other Statutory Transfers 0.6
Estimated Total $37.4
1. Expenditures are GOMB estimates.

3. Pensions

Actuarial Assets as of June 30, 2016 were $81.5 billion and the Asset Market Value was $78.2
billion
The State Retirement Systems, in aggregate, were funded at 39.2% as of FY 2016 based on the
asset smoothing method and 37.6% using asset market value; individual percentages for each
fund vary
FY 2016 valuations show the impact of a reduction in funding levels due to actual returns
performing at lower than assumed rates of return in FY 2016 and the reduction in the assumed
investment rates of return by TRS and SERS and other SERS assumption changes
FY 2017 valuations and FY 2019 contributions will be available from the systems by November
1st. By statute, actuarial reports must be approved by each of the five systems’ boards before
then and forwarded to the State Actuary
SURS: October 19th
JRS and GARS: October 20th
TRS: October 26th
SERS: October 31st
End of Fiscal Year 2016 Pension Status
12 Pensions
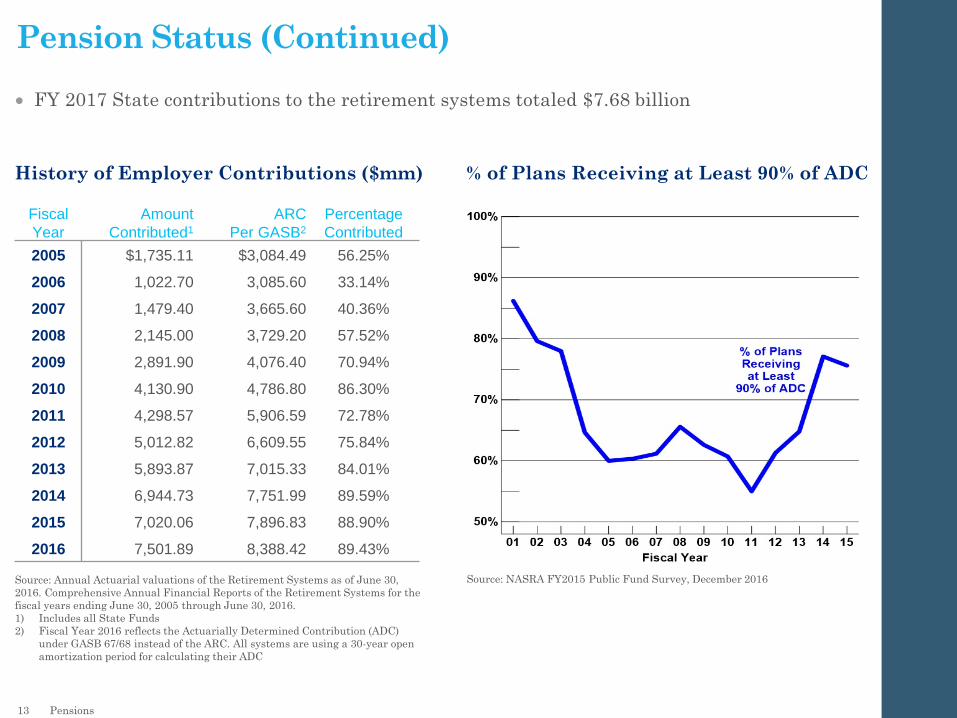
Pension Status (Continued)
History of Employer Contributions ($mm)
Source: Annual Actuarial valuations of the Retirement Systems as of June 30,
2016. Comprehensive Annual Financial Reports of the Retirement Systems for the
fiscal years ending June 30, 2005 through June 30, 2016.
1) Includes all State Funds
2) Fiscal Year 2016 reflects the Actuarially Determined Contribution (ADC)
under GASB 67/68 instead of the ARC. All systems are using a 30-year open
amortization period for calculating their ADC
Fiscal
Year
Amount
Contributed1
ARC
Per GASB2
Percentage
Contributed
2005 $1,735.11 $3,084.49 56.25%
2006 1,022.70 3,085.60 33.14%
2007 1,479.40 3,665.60 40.36%
2008 2,145.00 3,729.20 57.52%
2009 2,891.90 4,076.40 70.94%
2010 4,130.90 4,786.80 86.30%
2011 4,298.57 5,906.59 72.78%
2012 5,012.82 6,609.55 75.84%
2013 5,893.87 7,015.33 84.01%
2014 6,944.73 7,751.99 89.59%
2015 7,020.06 7,896.83 88.90%
2016 7,501.89 8,388.42 89.43%
% of Plans Receiving at Least 90% of ADC
Source: NASRA FY2015 Public Fund Survey, December 2016
FY 2017 State contributions to the retirement systems totaled $7.68 billion
13 Pensions

Pension Assumptions
Investment Rate of Return Assumptions Used by
the Retirement Systems
2009 2016
TRS 8.50% 7.00%
SURS 8.50% 7.25%
SERS 8.50% 7.00%
GARS 8.00% 6.75%
JRS 8.00% 6.75%
Source: Comprehensive Annual Financial Reports, Fiscal Year 2016; NASRA Issue Brief: Public Pension Plan Investment Return Assumptions, February 2017
Change in Distribution of Public Pension
Investment Return Assumptions, FY 2001-2015
14 Pensions

Senate Bill 42 (P.A. 100-0023) Includes Several Reforms to Illinois’ Pension Systems
Introduction of Tier 3 Optional Hybrid Plan - Tier 3 will offer a hybrid DB and DC plan
The small defined benefit has a multiplier of 1.25% of pensionable salary per years of service
In addition to the defined benefit, members of Tier 3 will get a defined contribution plan
Employees are to contribute a minimum of 4% of their salary and employers are to contribute no less than 2%, but no more than 6% of salary
The systems do not expect to implement the Tier 3 plan within FY 2018 and are not projecting an implementation date
Local Cost Shift - One key aspect of Tier 3 reforms is that school districts, universities and community colleges will assume the normal costs of benefits for their new hires upon implementation of a Tier 3 plan, regardless of whether the employee chooses a Tier 3 Optional Hybrid benefit or a more traditional Tier 2 defined benefit plan
To smooth the transition to Tier 3, the State will supplement the costs of local employers by paying 2% of employee payroll through fiscal year 2020 for all members of Tier 3
Additionally, starting July 1, 2017 local employers in SURS and TRS will also assume the normal cost of benefits for the portion of benefits attributable to all members’ salaries that exceed the Governor’s salary
5-Year Smoothing of Contributions - If systems change their actuarial assumptions, P.A. 100-0023 also contains reforms to how the State realizes those changes in its contributions
Beginning in FY 2018, the impact on the State's contributions from any changes each year in actuarial assumptions is smoothed over 5 years. Smoothing in FY 2018 reflects the impact of changes from FY 2014-FY 2017
The State’s FY 2018 original certified contributions in January 2017 totaled $8.843 billion of all funds, of which $7.813 billion was general funds
As required by SB42, the systems will recertify the State’s FY 2018 contributions taking into account the changes made in the new legislation
The recertified FY 2018 State contributions is expected to total $7.910 billion of all funds, of which $6.983 billion is general funds
Pension Update
15 Pensions

4. Debt Overview

General Obligation bonds are backed by the full faith and credit of the State
There is a continuing appropriation in place to ensure bond repayment without action by the General Assembly
Statutory provisions give priority to debt service over other State expenditures
GOBRI is a separate fund in the Treasury that can be applied to debt service payable on GO bonds and short-
term debt
Segregation of funds for debt service begins 12 months in advance for principal payments and 6 months in
advance for interest payments
Average life of all outstanding GO Bonds is approximately nine years
General Obligation Debt Service2
0.0
0.5
1.0
1.5
2.0
2.5
3.0
3.5
$B
illi
on
s
Principal Interest
Current Par Outstanding
Capital Improvement Bonds $13.7 billion
Pension Bonds $11.0 billion
Total $24.7 billion
Fixed
Rate
98%
1. Waiver expected prior to posting POS. 2. As of 6/30/2017
Debt service declines
by $978 million once
pension bonds are
paid off in 2019
General Obligation Bond Overview
Hedged
Variable
Rate
2%
16 Debt Overview

Monies are transferred monthly to the GOBRI Fund and, by law, are used for the payment of GO Bonds issued under the Bond Act
and for the payment of Short-Term Debt
The Bond Act constitutes an irrevocable and continuing authority for and direction to the Treasurer and Comptroller to make the
necessary transfers to the GOBRI Fund
Approximately $2.816 billion in transfers from General Funds to GOBRI are estimated for FY 2018 with the balance expected to come
from other State funds
– In FY18, the State transfers will average approximately $250 million a month from General Funds to GOBRI after the issuance of the
Bonds and the capital projects bonds
– General Funds State Source Revenues available to make General Revenue Fund debt service total approximately $2.6 billion per
month on average and provide approximately 10.4x coverage on the amount required to be transferred into GOBRI each month for
General Funds share of debt service, after the issuance of the Bonds
As of September 30, 2017, $1.387 billion was available in GOBRI
Transfers to the GOBRI Fund ($Millions)2
Fiscal Year All Fund Cash Balances1
2013 2014 2015 2016 2017
General Revenue Fund
Capital Bonds $ 548.8 $ 602.9 $ 591.6 $ 556.5 $626.4
Pension Bonds 1,554.6 1,655.4 1,502.2 1,422.6 1,608.7
Road Fund 359.3 358.7 346.7 333.7 305.2
School Infra Fund 209.5 208.8 192.8 211.8 115.2
Capital Projects Fund 310.1 344.2 388.0 532.5 477.0
TOTAL $2,982.3 $3,170.0 $3,021.4 $3,057.1 $3,132.5
0.0
2.0
4.0
6.0
8.0
10.0
12.0
2012 2013 2014 2015 2016 2017
$B
illi
on
s
1. Does not include Federal Trust Funds. Includes GOBRI. June 30, 2016 balances show an increase from FY 2015 due in part to the late enactment of FY 2016 appropriations for many State
funds.
2. Does not include debt service transfers on short-term debt as may have been from time to time outstanding
Strength of the State’s GO Pledge
17 Debt Overview

Interest Rate Swap Agreements
In 2003, the State executed five separate interest rate exchange agreements to hedge the variable rate of all $600 million of the Series 2003B Bonds at an effective fixed rate. The State pays a fixed interest rate of 3.89% and receives variable rates as shown below
In 2017, the State negotiated with the counterparties to change the agreements to have terms more favorable to the State, inc luding lowering the ratings triggers on all of its swaps
Interest Rate Exchange Agreements
Swap Counterparty Current Aggregate
Notional Amount
Fixed Rate
Paid Variable Rate Received
Additional Termination
Event Against Illinois
Mark-to-Market
as of 6/30/2017
Barclays Bank PLC1 $54,000,000 3.89% 82.7% of 1M LIBOR Below Ba1 or BB+ $(9,322,425)
Barclays Bank PLC2 54,000,000 3.89% 80.82% of 1M LIBOR Below Ba1 or BB+ (9,499,002)
Bank of America, N.A. 54,000,000 3.89% SIFMA3 Below Ba1 or BB+ (10,071,330)
JP Morgan Chase Bank, N.A. 54,000,000 3.89% SIFMA3 Below Ba1 or BB+ (10,071,330)
Deutsche Bank AG 384,000,000 3.89% SIFMA3 Below Ba1 or BB+ (71,618,343)
Total $600,000,000 $(110,582,430)
Variable Rate Bonds
The letters of credit expired in November 2016. To replace those letters of credit, the State entered into direct placements
The Series October 2003B Bonds were purchased on November 7, 2016 by four banks. The direct placements have a term of two years
and will expire on November 7, 2018. There is no acceleration risk as a result of a downgrade, only an increase in rates
Series 2003B Bonds
Owner Principal Amount Interest Rate Mode Sub-series
DNT Asset Trust4 $226,000,000 LIBOR 2003B-1
PNC Bank, National Association 224,000,000 LIBOR 2003B-2
State Street Public Lending Corporation5 75,000,000 LIBOR 2003B-3
RBC Municipal Products, LLC6 75,000,000 SIFMA 2003B-4
Total $600,000,000
1. Transaction was novated from AIG Financial Products to Barclays Bank on August 23, 2016. As part of the novation, the LIBOR barrier option was removed 2. Transaction was novated from Merrill Lynch Capital Services to Barclays Bank on
September 12, 2016. As part of the novation, the LIBOR barrier option was removed. 3. The variable rate received is 67% of 1 month LIBOR when 1 month LIBOR is ≥ 2.5%, or SIFMA, when 1 month LIBOR is < 2.5%. 4. An affiliate of JPMorgan Chase
Bank, National Association 5. An Affiliate of State Street Bank and Trust Company 6. An Affiliate of Royal Bank of Canada
The State Has Actively Managed Its Debt Obligations
18 Debt Overview

Debt Service - Illinois limits debt service expenditures to no more than 7 percent of General Funds and Road Fund appropriations, unless the transaction is specifically exempted by statute
Capital Expenditures - The State annually forecasts and analyzes revenues available for capital expenditures
The State conducts a formal capital planning process to rank projects based on specific criteria and evaluates the impact of new capital spending on the operating budget
The State performs facility management and condition assessments in order to provide information and recommendations for current and future capital expenditures
Strategic Fiscal Policies - the State has developed a series of fiscal priorities to help achieve a balanced budget. These include:
Reducing the State's pension liabilities
Maintaining debt affordability processes for capital programs
Funding key priorities
Implementing new revenue streams that reflect the State’s economic base
Investing in the economy and the State’s infrastructure
Containing costs and improving efficiency of State operations, IT efficiencies, and structural changes to grow the economy
Financial Management Policies
19 Debt Overview
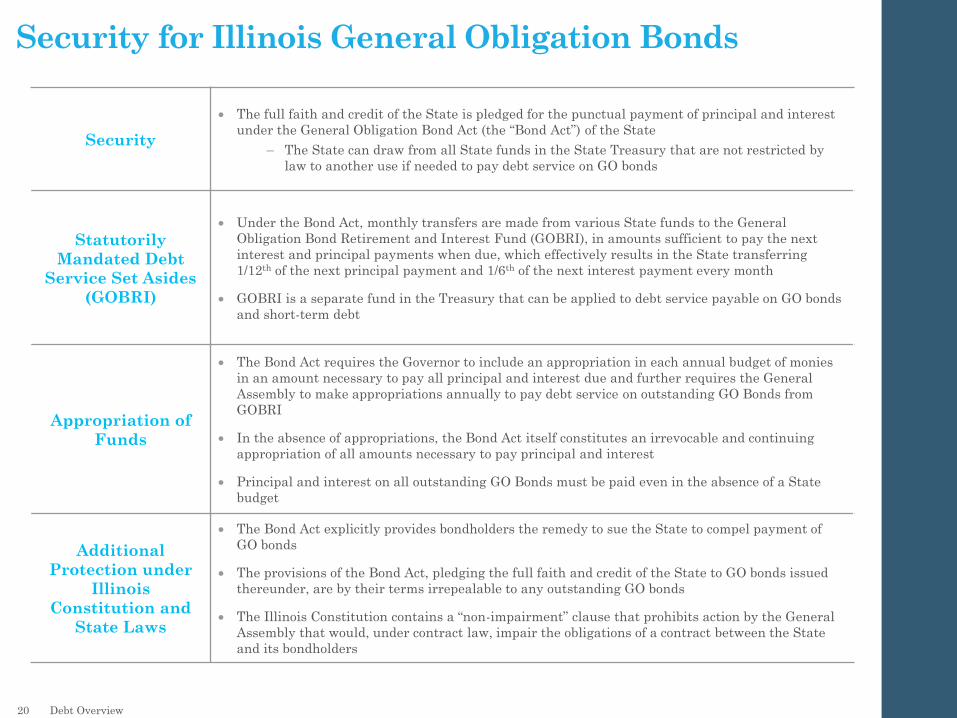
Security
The full faith and credit of the State is pledged for the punctual payment of principal and interest
under the General Obligation Bond Act (the “Bond Act”) of the State
– The State can draw from all State funds in the State Treasury that are not restricted by
law to another use if needed to pay debt service on GO bonds
Statutorily
Mandated Debt
Service Set Asides
(GOBRI)
Under the Bond Act, monthly transfers are made from various State funds to the General
Obligation Bond Retirement and Interest Fund (GOBRI), in amounts sufficient to pay the next
interest and principal payments when due, which effectively results in the State transferring
1/12th of the next principal payment and 1/6th of the next interest payment every month
GOBRI is a separate fund in the Treasury that can be applied to debt service payable on GO bonds
and short-term debt
Appropriation of
Funds
The Bond Act requires the Governor to include an appropriation in each annual budget of monies
in an amount necessary to pay all principal and interest due and further requires the General
Assembly to make appropriations annually to pay debt service on outstanding GO Bonds from
GOBRI
In the absence of appropriations, the Bond Act itself constitutes an irrevocable and continuing
appropriation of all amounts necessary to pay principal and interest
Principal and interest on all outstanding GO Bonds must be paid even in the absence of a State
budget
Additional
Protection under
Illinois
Constitution and
State Laws
The Bond Act explicitly provides bondholders the remedy to sue the State to compel payment of
GO bonds
The provisions of the Bond Act, pledging the full faith and credit of the State to GO bonds issued
thereunder, are by their terms irrepealable to any outstanding GO bonds
The Illinois Constitution contains a “non-impairment” clause that prohibits action by the General
Assembly that would, under contract law, impair the obligations of a contract between the State
and its bondholders
Security for Illinois General Obligation Bonds
20 Debt Overview
5. Bill Backlog and Plan of Finance

Medicaid
23.6%
State Employee
Health Insurance
35.1%
All Other
41.3%
0
2
4
6
8
10
12
14
16
Estimated Sept-17 Projected June-18
Estimated Bill Backlog ($billions)
Impact of the Financing on the Bill Backlog
21 Debt Overview and Plan of Finance
$15.1 billion1
$7.5 billion3
GOMB Estimate Composition of the Bill Backlog
(August 2017)
Source: State’s Office of the Comptroller and GOMB Estimates; 1. Comprised of $9.06 billion at the State Comptroller’s office and Comptroller estimate of $6.1 billion held at
State Agencies as of September 30, 2017. 2. Takes into account Comptroller estimates from December 31 and June 30 of each year when calculating the average. 3. GOMB
estimates.
The State is taking prudent and meaningful steps to reduce the amount of outstanding bills
The State’s bill backlog has increased from approximately $5 billion at the end of FY 2015 to approximately $15.1 billion as of September 30, 20171
– Estimated balance of the backlog at the end of FY 2018, as a result of the financing and application of federal funds, will be $7.5 billion, a nearly 50% reduction in the outstanding payables
December
2010-June
2015 Average2
= $7.1 billion

Competitive Transaction Overview
*Preliminary, subject to change.
The State is selling the $1.5 billion Series of November 2017ABC Bonds on a competitive basis
– The 2017ABC Bonds will be concurrently marketed with the $4.5 billion* 2017D Bonds to be sold on a negotiated
basis during the week of October 23rd
Future Financings
– The State plans to price one or more
series of General Obligation Bonds
for capital projects and information
technology projects, estimated at
$750 million, before December 31,
2017
22 Debt Overview and Plan of Finance
Preliminary Amortization ($000s)
Maturity
(November 1st)
November
2017ABC
(Competitive)
2018 $ 500,000
2019 500,000
2029 500,000
Total $1,500,000
General Obligation Bonds, Series of November 2017ABC*
Estimated Size
Series A (2018): 500,000,000
Series B (2019): 500,000,000
Series C (2029): 500,000,000
Total: $1,500,000,000
Method of Sale Competitive
Use of Proceeds To provide funds to pay vouchers previously incurred by the State and to pay costs of issuance
Tax Status Federally Tax-Exempt, State of Illinois Taxable
Coupon Fixed Rate
Amortization Serial bonds due on November 1, 2018-2019, and November 1, 2029
Interest Payment Dates May 1 and November 1, commencing May 1, 2018
Redemption Features 10-Year Par Call (Series C)
Security and
Repayment Source
Direct, full faith and credit general obligations of the State pursuant to the General Obligation Bond Act (the “Bond Act”). The provisions of the Bond Act are irrepealable until all bonds issued under the Bond Act, including the Bonds, are paid in full as to both principal and interest.
Ratings Receive ratings on October 6th & 10th
Sale Date October 17, 2017
Closing Date November 8, 2017
Financial Advisor PFM and PRAG

Preliminary Amortization ($000s)
Maturity
(November 1st)
November
2017D
(Negotiated)
2020 $ 500,000
2021 500,000
2022 500,000
2023 500,000
2024 500,000
2025 500,000
2026 500,000
2027 500,000
2028 500,000
Total $4,500,000
Negotiated Transaction Overview
*Preliminary, subject to change.
Future Financings
– The State plans to price one or more series of General Obligation Bonds for capital projects and information
technology projects, estimated at $750 million, before December 31, 2017
23 Debt Overview and Plan of Finance
General Obligation Bonds, Series of November 2017D*
Estimated Size $4,500,000,000
Method of Sale Negotiated
Use of Proceeds To provide funds to pay vouchers previously incurred by the State and to pay costs of issuance
Tax Status Federally Tax-Exempt, State of Illinois Taxable
Final Maturity November 1, 2028
Coupon Fixed Rate
Amortization Serial bonds due on November 1, 2020-28
Interest Payment Dates May 1 and November 1, commencing May 1, 2018
Redemption Features 10-Year Par Call
Security and
Repayment Source
Direct, full faith and credit general obligations of the State pursuant to the General Obligation Bond Act (the “Bond Act”). The provisions of the Bond Act are irrepealable until all bonds issued under the Bond Act, including the Bonds, are paid in full as to both principal and interest.
Ratings Receive ratings on October 6th & 10th
Sale Date Week of October 23, 2017
Closing Date November 8, 2017
Financial Advisor PFM and PRAG
The State is selling the $4.5 billion Series of November 2017D Bonds on a negotiated basis
– The 2017D Bonds will be concurrently marketed with the $1.5 billion 2017ABC Bonds to be sold on a competitive
basis on October 17th

Financing Overview
Use of
Proceeds
The Bonds are being issued to provide funds to finance capital projects under the State’s capital program, information technology and to pay costs of issuance of the Bonds.
Security
The Bonds are direct, general obligations of the State and, pursuant to Section 9(a) of Article IX of the Illinois Constitution and the General Obligation Bond Act of the State of Illinois, as amended (the “Bond Act”), the full faith and credit of the State is pledged for the punctual payment of interest on all bonds issued under the Bond Act, including the Bonds, as it comes due and for the punctual payment of the principal of all bonds issued under the Bond Act, including the Bonds, at maturity, or on any earlier redemption date, and redemption premium, if any. These provisions are irrepealable until all bonds issued under the Bond Act, including the Bonds, are paid in full as to both principal and interest.
Interest
Payment
Dates
June 1 and December 1, commencing June 1, 2018
Mode Fixed Rate Bonds
Ratings Receive ratings on October 6th & 10th
Pricing* Mid-November
Closing* Early December
*Preliminary, subject to change.
Capital Projects & IT Bonds - Issuance Terms and Schedule
Amortization*
Dec 1 Capital IT
2018 $26,000,000 $9,500,000
2019 26,000,000 9,500,000
2020 26,000,000 9,500,000
2021 26,000,000 9,500,000
2022 26,000,000 9,500,000
2023 26,000,000 9,500,000
2024 26,000,000 9,500,000
2025 26,000,000 9,500,000
2026 26,000,000 9,500,000
2027 26,000,000 9,500,000
2028 26,000,000 -
2029 26,000,000 -
2030 26,000,000 -
2031 26,000,000 -
2032 26,000,000 -
2033 26,000,000 -
2034 26,000,000 -
2035 26,000,000 -
2036 26,000,000 -
2037 26,000,000 -
2038 26,000,000 -
2039 26,000,000 -
2040 26,000,000 -
2041 26,000,000 -
2042 26,000,000 -
Total $655,000,000 $95,000,000
24 Bill Backlog and Plan of Finance

Date Event
October 2nd & 3rd Rating Meetings
October 6th & 10th Receive Ratings
October 6th Post Competitive Bill Backlog POS
October 10th Post Negotiated Backlog POS
October 17th Competitive Bill Backlog Sale
Week of October 23rd Negotiated Bill Backlog Sale
November 8th Bill Backlog Closing
Mid-November Capital Projects Bonds Sale
Early December Capital Projects Bonds Closing
September 2017 October 2017 November 2017
Sun Mon Tue Wed Thu Fri Sat Sun Mon Tue Wed Thu Fri Sat Sun Mon Tue Wed Thu Fri Sat
1 2 1 2 3 4 5 6 7 1 2 3 4
3 4 5 6 7 8 9 8 9 10 11 12 13 14 5 6 7 8 9 10 11
10 11 12 13 14 15 16 15 16 17 18 19 20 21 12 13 14 15 16 17 18
17 18 19 20 21 22 23 22 23 24 25 26 27 28 19 20 21 22 23 24 25
24 25 26 27 28 29 30 29 30 31 26 27 28 29 30
Transaction Timeline
25 Bill Backlog and Plan of Finance