state of local government finances and financial ... · lp limpopo metro metropolitan municipality...
TRANSCRIPT
THE STATEOF LOCAL
GOVERNMENT FINANCES
AND FINANCIALMANAGEMENT
AS AT 30 JUNE 2017Fourth Quarter of the 2016/17 financial year
A N A L Y S I S D O C U M E N T

CONTACT PERSON:
Jan Hattingh
Chief Director: Local Government Budget Analysis
Intergovernmental Relations
Tel.: (012) 315-5009 | Fax: (012) 395 6553 | E-mail: [email protected]
THE STATE OF LOCAL GOVERNMENT FINANCES
AND FINANCIAL MANAGEMENTAS AT 30 JUNE 2017
Fourth Quarter of the 2016/17 financial year
A N A L Y S I S D O C U M E N T

THE STATE OF LOCAL GOVERNMENT FINANCES AND FINANCIAL MANAGEMENTAS AT 30 JUNE 2017
TABLE OF CONTENTS
ABBREVIATIONS 1
EXECUTIVE SUMMARY 3
INTRODUCTION 4
A BROADER PERSPECTIVE LOCAL GOVERNMENTPERFORMANCE IN SOUTH AFRICA 5
THE FISCAL FRAMEWORK FOR LOCAL GOVERNMENT IN SOUTH AFRICA 5
INTERNATIONAL BENCHMARKS OF LOCAL GOVERNMENT FINANCE IN SOUTH AFRICA 5
DCOG: REPORT ON THE STATE OF LOCAL GOVERNMENT IN SOUTH AFRICAAS AT 30 JUNE 2016 6
ASSESSMENT OF THE FINANCIAL HEALTH OF MUNICIPALITIES 8
MEASUREMENT OF THE FINANCIAL HEALTH OF MUNICIPALITIES 8
INDICATORS 1 & 2: ASSESSING THE VULNERABILITY OF MUNICIPALITIES’ CASH POSITION 9
(A) PERSISTENT NEGATIVE CASH BALANCES 9
(B) CASH COVERAGE POSITION OF MUNICIPALITIES 12
INDICATOR 3: OVERSPENDING OF OPERATIONAL EXPENDITURE BUDGETS 15
INDICATOR 4: UNDER-SPENDING OF CAPITAL BUDGETS 18
INDICATORS 5 AND 6: LEVELS OF GROWTH IN CONSUMER DEBTORS 21
INDICATOR 7: OUTSTANDING CREDITORS 27
INDICATOR 8: RELIANCE ON NATIONAL AND PROVINCIAL CONDITIONAL GRANTS 30
OTHER ISSUES IMPACTING ON THE FINANCIAL HEALTH OF A MUNICIPALITY 34
AUDIT OUTCOMES: 2015/16 FINANCIAL YEAR 34
GOVERNANCE: ACTING MUNICIPAL MANAGER AND CHIEF FINANCIAL OFFICER POSITIONS 36
SIGNIFICANT ELECTRICITY AND WATER LOSSES 40

THE STATE OF LOCAL GOVERNMENT FINANCES AND FINANCIAL MANAGEMENTAS AT 30 JUNE 2017
TABLE OF CONTENTS
INADEQUATE BUDGETS FOR REPAIRS AND MAINTENANCE AND ASSET MANAGEMENT 41
UNDER-SPENDING OF CONDITIONAL GRANTS 49
SUMMARY OF MUNICIPALITIES IN FINANCIAL DISTRESS 51
SUPPORT PROVIDED BY GOVERNMENT TO IMPROVE FINANCIAL MANAGEMENT 53
IMPLEMENTING MINIMUM COMPETENCY LEVELS 53
CAPACITY BUILDING GRANTS 56
MUNICIPAL FINANCE IMPROVEMENT PROGRAMME 58
STANDARD CHART OF ACCOUNTS FOR MUNICIPALITIES (mSCOA) 59
CITIES SUPPORT PROGRAMME (CSP) 60
THE BACK TO BASICS (B2B) APPROACH 62
A COORDINATED APPROACH TO MUNICIPAL SUPPORT 63
SHORT TERM MEASURES 65
MEDIUM TERM MEASURES 65
LONG TERM MEASURE 66
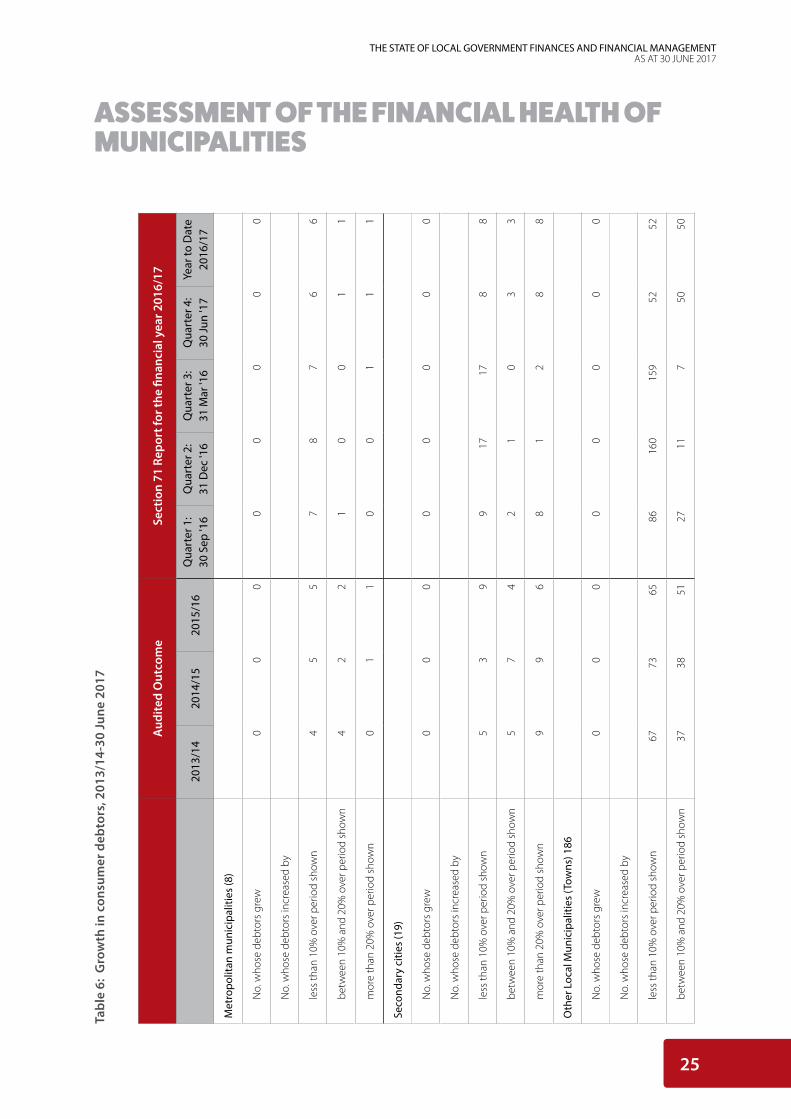
CONCLUDING REMARKS 67
ANNEXURE A1 70
ANNEXURE A2 90
ANNEXURE B 110
SUMMARY ASSESSMENT RESULTS: METROPOLITAN MUNICIPALITIES 110
1. CASH PERFORMANCE 111
2. OVER-SPENDING OF OPERATIONAL BUDGETS 112
3. UNDER-SPENDING OF CAPITAL BUDGET 112
4. GROWTH IN CONSUMER DEBTORS 113
5. CREDITOR MANAGEMENT 114


1
THE STATE OF LOCAL GOVERNMENT FINANCES AND FINANCIAL MANAGEMENTAS AT 30 JUNE 2017
ABBREVIATIONS
AG Auditor-General
ASB Accounting Standards Board
B2B Back to Basics
CEO Chief Executive Officer
CFO Chief Financial Officer
CIDMS City Infrastructure Development Management System
CIGFARO Chartered Institute of Government, Financial and Risk Officers
CSIP City Support Implementation Plan
CSP Cities Support Programme
DCoG Department of Cooperative Governance
DoRA Division of Revenue Act
EC Eastern Cape
EU European Union
FAQ Frequently asked question
FM Financial management
FMCMM Financial Management Capability Maturity Model
FMG Financial Management Grant
FMIP Financial Management Improvement Programme
FS Free State
GT Gauteng
IDP Integrated Development Plan
IT Information technology
KZN KwaZulu-Natal
LGSETA Local Government Sector and Education Training Authority
LP Limpopo
Metro Metropolitan municipality
MFIP Municipal Finance Improvement Programme
MFMA Municipal Finance Management Act
MIG Municipal Infrastructure Grant
MinMEC Ministers and Members of Executive Councils
MM Municipal Manager
MP Mpumalanga
MSA Municipal Structures Act
mSCOA Municipal Standard Chart of Accounts
MTREF Medium Term Revenue and Expenditure Framework
NC Northern Cape
2
THE STATE OF LOCAL GOVERNMENT FINANCES AND FINANCIAL MANAGEMENTAS AT 30 JUNE 2017
NW North West
RIPOA Rapid Integrated Project Options Assessment
SALGA South African Local Government Association
SAQA South African Qualifications Authority
SARS South African Revenue Service
SCM Supply Chain Management
SoLGF State of Local Government Finances
SOP Standard operating procedure
TCF Technical Committee on Finance
WC Western Cape
ABBREVIATIONS
3
THE STATE OF LOCAL GOVERNMENT FINANCES AND FINANCIAL MANAGEMENTAS AT 30 JUNE 2017
The State of Local Government and Financial Management Report comprehensively discusses the financial health of all 257 of the
country’s municipalities. The conclusion of the assessment is that municipalities in financial distress are characterised by poor cash
flow management and an increase in outstanding debtors and creditors based on the assessment of the following financial health
indicators:
• 64 municipalities had negative cash balances at 30 June 2017. Throughout the 2016/17 financial year, none of the metropolitan
municipalities (metros) recorded negative cash balances. This is a strong indication that, in general, they have a solid cash
base and comply with cash flow management procedures.
• At an aggregate level, 74 (68 in 2015/2016) municipalities in 2016/17 (28.8 per cent) recorded cash coverage exceeding
three months of operational expenditure, which is within the acceptable norm. Of concern is the fact that the number of
municipalities with cash coverage of less than one month of operational expenditure increased from 116 in 2015/16 to 137 in
2016/17.
• The total number of municipalities that overspent on their operational budgets decreased from 163 in 2015/16 to 33 in
2016/17.
• The total number of municipalities that have underspend on their capital budget by more than 30 per cent have increased
from 90 in 2015/16 to 122 in 2016/17.
• At the end of the fourth quarter of 2016/17 (as per the Section 71 results), total debtors amounted to R128.5 billion, a R14.9
billion increase from the 2015/16 financial year and total creditors amounted to R43.8 billion, a R4.9 billion increase from the
2015/16 financial year.
• There is a decrease in the reliance on conditional grants in municipalities where more than 75 per cent of transfers of revenue
on national transfers.
• In 2016/17, 17 district municipalities were identified as financially distressed, an increase from the 16 of the previous year. It
is cause for concern that district municipalities are financially distressed, given the role they have to play in empowering and
capacitating local municipalities.
Other analysis and data confirm these findings. The Auditor-General (AG) highlighted the fact that municipal audit outcomes had
shown little improvement. Recorded water and electricity losses remain high. There is on-going instability in senior municipal
management positions with an increase in the number of acting Municipal Managers (104) and acting Chief Financial officers (88), a
total increase in both acting positions from 18 to 20 per cent has a negative impact on service delivery to communities.
Annexure A1 lists the municipalities in financial distress in 2016/17 (128). Annexure A2 provides a consolidated analysis of the 257
municipalities’ audit outcomes, capital budget performance, current interventions, vacancies in key positions, those identified as
financially distressed and trends for the 2016/17 financial year. Annexure B provides the consolidated assessment results for the
metros as at 30 June 2017.
This report also discusses capacity building initiatives adopted by the government in recent years and has provided an overview
of the recently introduced municipal development programmes. To address capacity challenges, government has channelled very
substantial funding towards these initiatives; the results, however, remain unsatisfactory.
EXECUTIVE SUMMARY

4
THE STATE OF LOCAL GOVERNMENT FINANCES AND FINANCIAL MANAGEMENTAS AT 30 JUNE 2017
1. This is the sixth (of nine reports prepared) annual State of Local Government Finances and Financial Management Report
(SoLGF), covering the period to the end of the 2016/17 municipal financial year (30 June 2017).
2. The purpose of the report is to identify areas of risk in local government finances so that appropriate policy responses can
be developed. In particular, the report enables the recognition of those municipalities that are in financial distress1 so that
processes can be initiated to determine the full extent of their financial problems, the extent of support that a municipality
may require, or if an intervention is required in a municipality due to a crisis in its finances (as provided for in Section 139 of
the Constitution). Annexure A provides a list of municipalities in financial distress as at 30 June 2017.
3. The report reviews the state of municipal budgets taking into account both the revenue and expenditure as well as municipal
governance related issues at the end of a particular financial year. It is based on the information contained in the audited
annual financial statements, the current Medium-term Revenue and Expenditure Budget Framework (MTREF) and Section 71
reports (as verified annually by both National and Provincial Treasuries).
4. National government continues to invest considerable resources and effort in assisting municipalities to address the
immediate and underlying causes of poor institutional performance and inadequate service delivery. The impact of these
initiatives varies, and there are examples of sustained performance improvement as well as ongoing concerns.
5. The report is structured as follows:
• A broader perspective on local government finance in South Africa, including a summary of the fiscal framework for
local government, international benchmarks on local government, and a summary of the Department of Cooperative
Governance (DCoG’s) report on the state of local government in South Africa as at 30 June 2016.
• An assessment of the financial health of municipalities, using eight indicators, as well as a review of other issues and
indicators impacting on financial health.
• An overview of the support provided by improve financial management in municipalities.
6. As was the case with previous reports, the summarised version of this review was presented to the Technical Committee on
Finance (TCF), the Budget Forum and the Budget Council in different formats and parts. The full report is also circulated to the
Presidency, the Department of Cooperative Governance (DCoG), and provincial treasuries.
INTRODUCTION
1 The term ‘financial distress’ is used very deliberately instead of the words ‘financial crisis’ (which appear in Section 139 of the Constitution and Section
139 of the Municipal Finance Management Act (MFMA)) because this report is only intended to provide an initial indication of which municipalities
may be approaching ‘financial crisis’.

5
THE STATE OF LOCAL GOVERNMENT FINANCES AND FINANCIAL MANAGEMENTAS AT 30 JUNE 2017
A BROADER PERSPECTIVE LOCAL GOVERNMENT PERFORMANCE IN SOUTH AFRICA
THE FISCAL FRAMEWORK FOR LOCAL GOVERNMENT IN SOUTH AFRICA
7. South Africa has an internationally well-regarded fiscal framework for local governance. The fiscal framework is built on a clear
set of functional (expenditure) assignments for basic local infrastructure services delivery such as water services, electricity
distribution, solid waste, and local roads and transport in addition to important regulatory authority over spatial planning and
development control.
8. These functions are financed predominately through locally controlled revenue sources, such as user fees and the property
tax. This is supplemented by a Constitutionally guaranteed, unconditional equitable share of nationally raised revenues and
various conditional transfers to support national development priorities, such as for infrastructure investment that benefits
poor households. Municipalities also have broad powers to borrow money for infrastructure investment, without national
government approval or guarantees.
9. The distribution of national revenues to local government (the division of revenue) is designed achieved a substantial
redistribution of revenues raised through national taxes in relatively wealthy (mainly urban) areas to areas where the demand
for subsidised public services are the highest. As a result, the most rural municipalities receive around twice the allocation per
household than metros.
10. Notwithstanding its relative efficacy the local government fiscal framework faces a number of pressures:
• Public housing and transport functions continue to be exercised concurrently between provincial and local governments,
and also with national government in the case of commuter rail services. This weakens coordination in the management
of the built environment, ultimately weakening both accountability for performance and municipal fiscal sustainability,
particularly in larger urban areas.
• The rapid growth in national transfers may have had an unintended consequence of reducing local revenue efforts,
muting local level accountability, and reducing incentives for creditworthy municipalities to borrow to finance long term
capital investment programmes. The equitable share, grants and subsidies allocated to municipalities has increased in
the municipal election period 2000/01 to 2016/17 from R14.2 billion to R93.7 billion or 559.9 per cent. The future growth
in national transfers is now being reduced as part of the national programme of fiscal consolidation.
INTERNATIONAL BENCHMARKS OF LOCAL GOVERNMENT FINANCE IN SOUTH AFRICA
11. The principal of transparency, as outlined in the Constitution, is a fundamental pillar on which the system of public finance
in South Africa continues to be built. The National Treasury, in partnership with Code4SA, launched the Municipal Money
website and data portal (www.municipalmoney.gov.za) in 2016 to encourage citizen oversight of municipal finances. More
recently, on 20 February 2018, the new “Vulekamali” portal (www.vulekamali.gov.za) was launched in partnership with IMALI
YETHU, to provide complementary data on provincial budgets.
12. In addition, the equivalent of the Open Budget Index (OBI) for Metros are in the process to be developed.
6
THE STATE OF LOCAL GOVERNMENT FINANCES AND FINANCIAL MANAGEMENTAS AT 30 JUNE 2017
13. South Africa’s efforts to deepen transparency in public financial management processes have been extensively recognised
internationally:
• In the 2017 Open Budget Index (OBI) survey, out of 115 countries, South Africa has been ranked first – a position shared
with New Zealand. South Africa has consistently been rated in the top three since it held the first position in the 2010
Open Budget Index. The OBI survey assesses the availability and comprehensiveness of eight key budget documents
and examines the extent of effective oversight provided by legislatures, independent fiscal institutions and the supreme
audit authorities, and the opportunities available to the public to participate in national budget processes. An Open
Budget Index (OBI) for Metropolitan Municipalities is currently being piloted in partnership with the International Budget
Partnership (https://www.internationalbudget.org/)
• The 2017 by the Mo Ibrahim Index of African Governance (IIAG) ranked South Africa sixth overall in Africa from fourth in
the year 2015, fourth in Sustainable Economic Opportunity and first in the category of Public Management. The IIAG is
a tool that measures and monitors governance performance in African countries, measured across four key components
of safety and rule of law, participation and human rights, sustainable economic opportunity and human development.
• The World Economic Forum’s Global Competitiveness Report 2016-2017 ranked South Africa 47th out of 138 countries.
It noted areas of excellence in local government as the strength of auditing and reporting standards (1st) and quality
of roads (29th). However, the World Economic Forum’s report highlighted areas of poorer performance, including
wastefulness of government expenditure (88th), public trust in politicians (109th), perceived favoritism in decisions of
government officials (115th), quality of electricity supply (112th) and the burden of government regulation (106th).
DCOG: REPORT ON THE STATE OF LOCAL GOVERNMENT IN SOUTH AFRICA AS AT 30 JUNE 2016
14. The Department of Cooperative Governance (DCoG) uses twenty-five indicators to assess progress made and challenges
experienced by municipalities. The latest report on the state of local government in South Africa as at June 2016, was issued
in October 2017. It focusses on issues of service delivery, governance, legislative compliance, implementation challenges, as
well as support initiatives and their impact.
15. The report notes that, access to basic services for households has increased from 70 per cent to 85 per cent between Census
2001 and Census, 2011. Over the same period, access to energy increased from 72 per cent to 85 per cent, access to water
from 64 per cent to 73 per cent, and access to flush, chemical or ventilated pit toilets and refuse removal from 55 per to 62 per
cent.
16. Broad observations emanating from this Report can be summarized as follows:
• The number of households in South Africa increased from 14.5 million in 2011 (StatsSa Census 2011) to 16.9 million in
2016 (StatsSa Community Survey). Gauteng province experienced the highest household population growth between
2011 and 2016 (20.9 per cent), followed by Western Cape (18.3 per cent).
• Households with access to the electricity grid has increased to 90.2 per cent and households with access to piped water
has increased from 85.1 per cent (2011) to 89.9 per cent (2016) which is close to the National Development Goal of 90 per
cent by 2019 for both electricity and water.
• The capacity to provide households with access to chemical and flush toilets has increased from 59 per cent (2011)
municipalities to 84 per cent (2016).
A BROADER PERSPECTIVE LOCAL GOVERNMENT PERFORMANCE IN SOUTH AFRICA
7
THE STATE OF LOCAL GOVERNMENT FINANCES AND FINANCIAL MANAGEMENTAS AT 30 JUNE 2017
• The provision for refuse removal services remains a challenge, especially in rural areas. 201 municipalities reported on
the provision of refuse removal, 39 (19.4 per cent) were able to serve 80 per cent or more of their households with refuse
removal services on a weekly or less often than a weekly basis.
• The Auditor General reports that the financial health of municipalities is on a steady decline, and that only 35 per cent of
municipalities (93 of 278) are financial healthy.
• 66 municipalities (23.7 per cent of all municipalities) collected less than 80 per cent of the revenue owed to them as per
their adjustments budgets. Municipalities are especially struggling in the Eastern Cape, Northern Cape and Limpopo
Provinces.
• Almost a quarter of municipalities underspent on conditional grants with a majority of these municipalities in the
Limpopo Province.
• The average number of ward committee meetings per ward was 4.6 in 2015/16, which was a slight increase from 4.3
in 2014/15. The most meetings per ward were held in municipalities in Limpopo, KwaZulu-Natal, North West and
Mpumalanga.
• In the 2015/16 period, 2 135 protests were recorded by municipalities, mainly in Gauteng and the Western Cape Provinces.
• Challenges are mainly still experienced across the infrastructure development life cycle in municipalities from project
identification, infrastructure planning, financing, construction to operations and maintenance. Some of the root
causes remain weak institutional capacity and shortage of skills that all impact on the ability to plan for operations and
maintenance of infrastructure.
A BROADER PERSPECTIVE LOCAL GOVERNMENT PERFORMANCE IN SOUTH AFRICA
8
THE STATE OF LOCAL GOVERNMENT FINANCES AND FINANCIAL MANAGEMENTAS AT 30 JUNE 2017
ASSESSMENT OF THE FINANCIAL HEALTH OF MUNICIPALITIES
MEASUREMENT OF THE FINANCIAL HEALTH OF MUNICIPALITIES
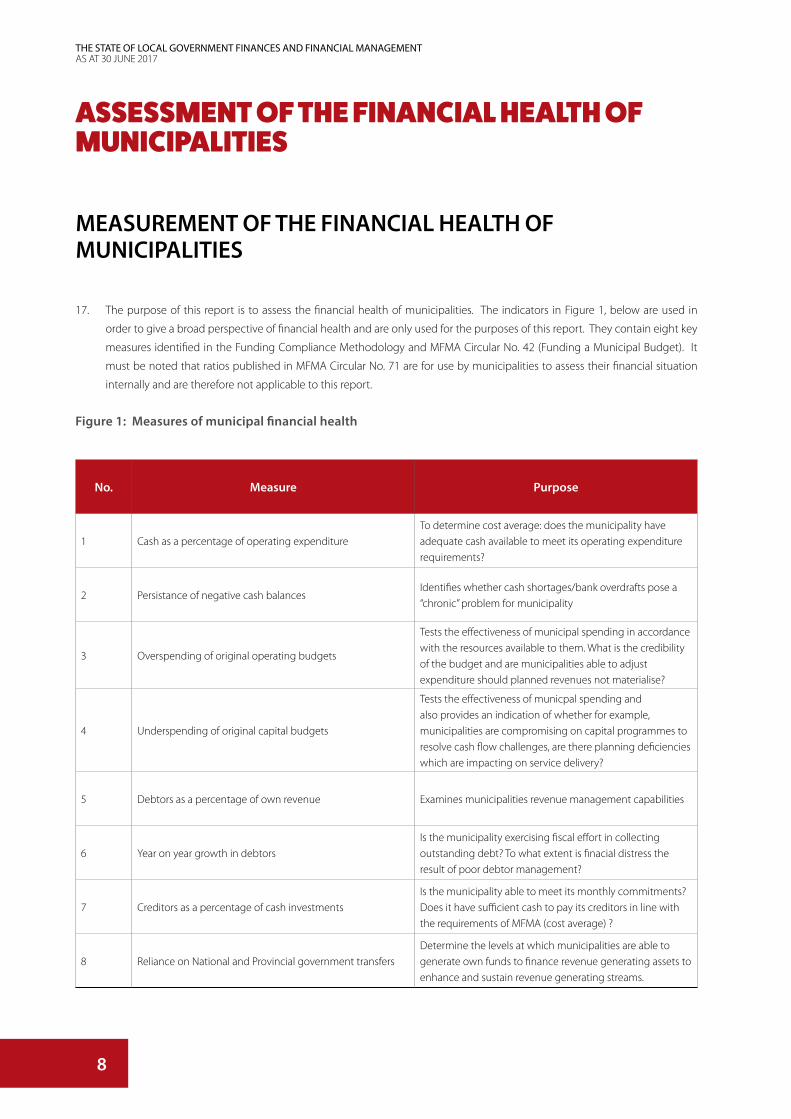
17. The purpose of this report is to assess the financial health of municipalities. The indicators in Figure 1, below are used in
order to give a broad perspective of financial health and are only used for the purposes of this report. They contain eight key
measures identified in the Funding Compliance Methodology and MFMA Circular No. 42 (Funding a Municipal Budget). It
must be noted that ratios published in MFMA Circular No. 71 are for use by municipalities to assess their financial situation
internally and are therefore not applicable to this report.
Figure 1: Measures of municipal financial health
No. Measure Purpose
1 Cash as a percentage of operating expenditureTo determine cost average: does the municipality have adequate cash available to meet its operating expenditure requirements?
2 Persistance of negative cash balancesIdentifies whether cash shortages/bank overdrafts pose a “chronic” problem for municipality
3 Overspending of original operating budgets
Tests the effectiveness of municipal spending in accordance with the resources available to them. What is the credibility of the budget and are municipalities able to adjust expenditure should planned revenues not materialise?
4 Underspending of original capital budgets
Tests the effectiveness of municpal spending and also provides an indication of whether for example, municipalities are compromising on capital programmes to resolve cash flow challenges, are there planning deficiencies which are impacting on service delivery?
5 Debtors as a percentage of own revenue Examines municipalities revenue management capabilities
6 Year on year growth in debtorsIs the municipality exercising fiscal effort in collecting outstanding debt? To what extent is finacial distress the result of poor debtor management?
7 Creditors as a percentage of cash investmentsIs the municipality able to meet its monthly commitments? Does it have sufficient cash to pay its creditors in line with the requirements of MFMA (cost average) ?
8 Reliance on National and Provincial government transfersDetermine the levels at which municipalities are able to generate own funds to finance revenue generating assets to enhance and sustain revenue generating streams.
9
THE STATE OF LOCAL GOVERNMENT FINANCES AND FINANCIAL MANAGEMENTAS AT 30 JUNE 2017
ASSESSMENT OF THE FINANCIAL HEALTH OF MUNICIPALITIES
INDICATORS 1 & 2: ASSESSING THE VULNERABILITY OF MUNICIPALITIES’ CASH POSITION
18. In terms of Section 45 of the MFMA, municipalities are not permitted to close the financial year with any short-term borrowing
or overdraft. The fact that some municipalities were not able to close the 2016/17 financial year with positive cash positions
is considered a very strong indicator that they were in financial distress at that date.
19. An additional condition for approval of roll-over applications was introduced in the 2011/12 financial year: roll-over requests
from municipalities reporting negative cash balances were not considered for approval.
20. At a minimum, a municipality should maintain a positive cash position. Failure to do this is the first indicator of financial
distress. Three sub-indicators are used to provide a more holistic view of municipalities’ cash position:
• Did the municipality end the financial year with a positive or negative cash balance?
• Are negative cash balances persistent: is the negative cash balance temporary or does it indicate deeper-rooted financial
problems in the municipality?
• Even if a municipality has a positive cash balance, is the revenue base under threat? For how many months will the
municipality be able to continue funding its monthly operational expenditure? In other words, what is the cash coverage
ratio of the municipality?
(A) PERSISTENT NEGATIVE CASH BALANCES
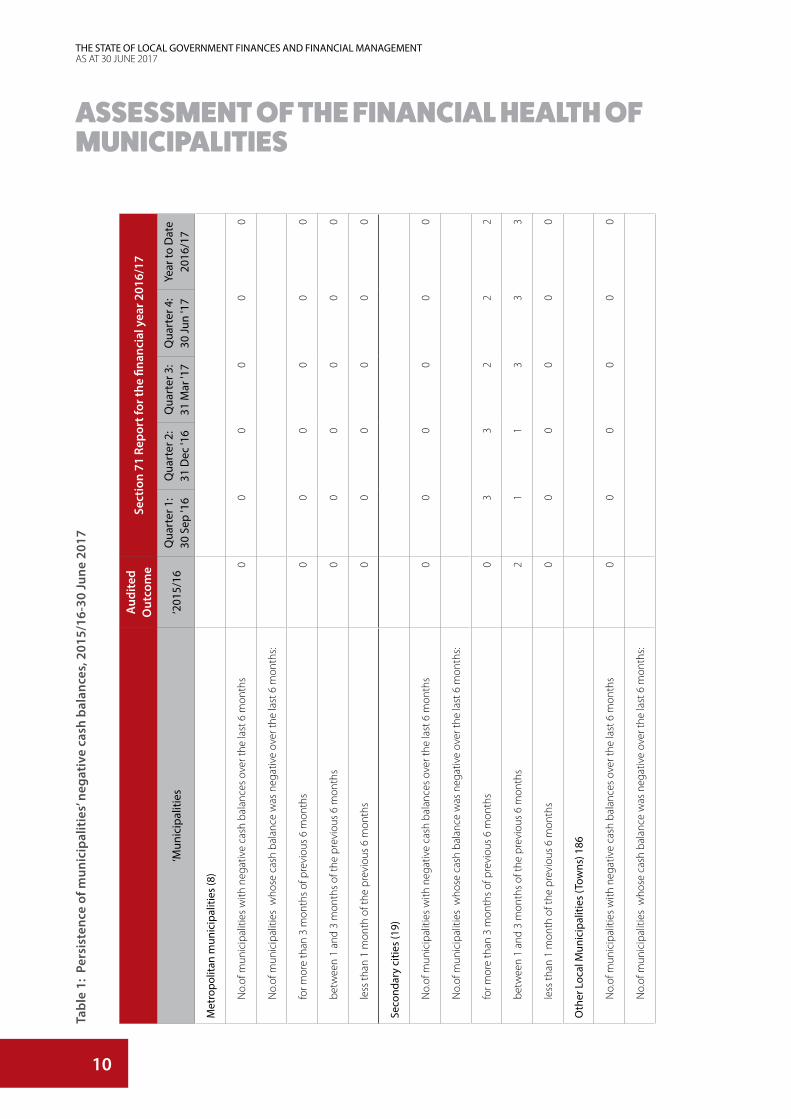
21. Many municipalities experience temporary cash-flow problems. Where these persist over a number of months, this is a strong
indicator that there are severe underlying financial problems. Table 1 below shows for how many months in the preceding six
months’ municipalities reported negative cash balances at the end of the month or failed to report credible cash information.
The aim is to identify those municipalities that are persistently in a vulnerable cash-flow position or which generate unreliable
information.
10
THE STATE OF LOCAL GOVERNMENT FINANCES AND FINANCIAL MANAGEMENTAS AT 30 JUNE 2017
Tabl
e 1:
Per
sist
ence
of m
unic
ipal
itie
s’ ne
gati
ve c
ash
bala
nces
, 201
5/16
-30
June
201
7
Aud
ited
Out
com
eSe
ctio
n 71
Rep
ort f
or th
e fin
anci
al y
ear 2
016/
17
‘Mun
icip
aliti
es‘2
015/
16Q
uart
er 1
: 30
Sep
'16
Qua
rter
2:
31 D
ec '1
6Q
uart
er 3
: 31
Mar
'17
Qua
rter
4:
30 Ju
n '1
7Ye
ar to
Dat
e 20
16/1
7
Met
ropo
litan
mun
icip
aliti
es (8
)
No.
of m
unic
ipal
ities
with
neg
ativ
e ca
sh b
alan
ces
over
the
last
6 m
onth
s0
00
00
0
No.
of m
unic
ipal
ities
who
se c
ash
bala
nce
was
neg
ativ
e ov
er th
e la
st 6
mon
ths:
for m
ore
than
3 m
onth
s of
pre
viou
s 6
mon
ths
00
00
00
betw
een
1 an
d 3
mon
ths
of th
e pr
evio
us 6
mon
ths
00
00
00
less
than
1 m
onth
of t
he p
revi
ous
6 m
onth
s0
00
00
0
Seco
ndar
y ci
ties
(19)
No.
of m
unic
ipal
ities
with
neg
ativ
e ca
sh b
alan
ces
over
the
last
6 m
onth
s0
00
00
0
No.
of m
unic
ipal
ities
who
se c
ash
bala
nce
was
neg
ativ
e ov
er th
e la
st 6
mon
ths:
for m
ore
than
3 m
onth
s of
pre
viou
s 6
mon
ths
03
32
22
betw
een
1 an
d 3
mon
ths
of th
e pr
evio
us 6
mon
ths
21
13
33
less
than
1 m
onth
of t
he p
revi
ous
6 m
onth
s0
00
00
0
Oth
er L
ocal
Mun
icip
aliti
es (T
owns
) 186
No.
of m
unic
ipal
ities
with
neg
ativ
e ca
sh b
alan
ces
over
the
last
6 m
onth
s0
00
00
0
No.
of m
unic
ipal
ities
who
se c
ash
bala
nce
was
neg
ativ
e ov
er th
e la
st 6
mon
ths:
ASSESSMENT OF THE FINANCIAL HEALTH OF MUNICIPALITIES

11
THE STATE OF LOCAL GOVERNMENT FINANCES AND FINANCIAL MANAGEMENTAS AT 30 JUNE 2017
Tabl
e 1:
Per
sist
ence
of m
unic
ipal
itie
s’ ne
gati
ve c
ash
bala
nces
, 201
5/16
-30
June
201
7
Aud
ited
Out
com
eSe
ctio
n 71
Rep
ort f
or th
e fin
anci
al y
ear 2
016/
17
‘Mun
icip
aliti
es‘2
015/
16Q
uart
er 1
: 30
Sep
'16
Qua
rter
2:
31 D
ec '1
6Q
uart
er 3
: 31
Mar
'17
Qua
rter
4:
30 Ju
n '1
7Ye
ar to
Dat
e 20
16/1
7
for m
ore
than
3 m
onth
s of
pre
viou
s 6
mon
ths
07
1624
2223
betw
een
1 an
d 3
mon
ths
of th
e pr
evio
us 6
mon
ths
639
2421
2826
less
than
1 m
onth
of t
he p
revi
ous
6 m
onth
s0
00
00
0
Dis
tric
t mun
icip
aliti
es (4
4)
No.
of m
unic
ipal
ities
with
neg
ativ
e ca
sh b
alan
ces
over
the
last
6 m
onth
s0
00
00
0
No.
of m
unic
ipal
ities
who
se c
ash
bala
nce
was
neg
ativ
e ov
er th
e la
st 6
mon
ths:
for m
ore
than
3 m
onth
s of
pre
viou
s 6
mon
ths
03
56
66
betw
een
1 an
d 3
mon
ths
of th
e pr
evio
us 6
mon
ths
25
43
44
less
than
1 m
onth
of t
he p
revi
ous
6 m
onth
s0
00
00
0
All
mun
icip
aliti
es (2
57)
No.
of m
unic
ipal
ities
with
neg
ativ
e ca
sh b
alan
ces
over
the
last
6 m
onth
s0
00
00
0
No.
of m
unic
ipal
ities
who
se c
ash
bala
nce
was
neg
ativ
e ov
er th
e la
st 6
mon
ths:
for m
ore
than
3 m
onth
s of
pre
viou
s 6
mon
ths
013
24
32
30
31
betw
een
1 an
d 3
mon
ths
of th
e pr
evio
us 6
mon
ths
1045
29
27
35
33
less
than
1 m
onth
of t
he p
revi
ous
6 m
onth
s0
00
00
0
Sour
ce: N
atio
nal T
reas
ury
- Loc
al G
over
nmen
t Dat
abas
e
ASSESSMENT OF THE FINANCIAL HEALTH OF MUNICIPALITIES

12
THE STATE OF LOCAL GOVERNMENT FINANCES AND FINANCIAL MANAGEMENTAS AT 30 JUNE 2017
ASSESSMENT OF THE FINANCIAL HEALTH OF MUNICIPALITIES
22. The table above shows that 64 municipalities had negative cash balances at 30 June 2017. Throughout the 2016/17 financial
year, none of the metropolitan municipalities (metros) recorded negative cash balances. This is a strong indication that, in
general, they have a solid cash base and comply with cash flow management procedures.
23. Two secondary cities reported negative balances for more than three months of the last six months during the 2016/17
financial year while they reported no negative cash balances during the 2015/16 financial year. This implies that the two
secondary cities’ ability to manage their cash balances has deteriorated.
24. Among local municipalities, 49 (26 per cent) reported negative cash balances in 2016/17. This was an increase of 43 or 717
per cent compared with the 2015/16 financial year. The huge difference in information received between the audited results
for 2015/16 and S71 information for 2016/17 is a clear indication that municipalities do not report credible quarterly S71
information to Provincial and National Treasury.
25. Ten district municipalities reported negative cash balances for more than three months and four operated an overdraft
between one to three months in 2016/17.
(B) CASH COVERAGE POSITION OF MUNICIPALITIES
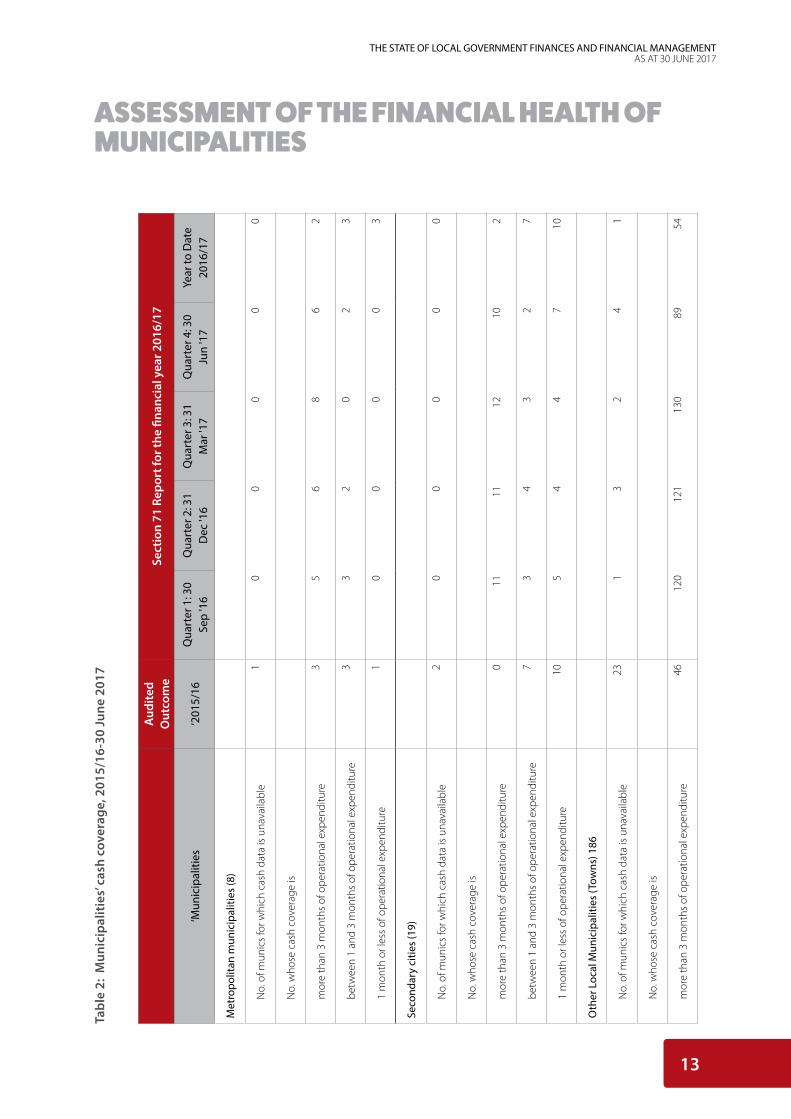
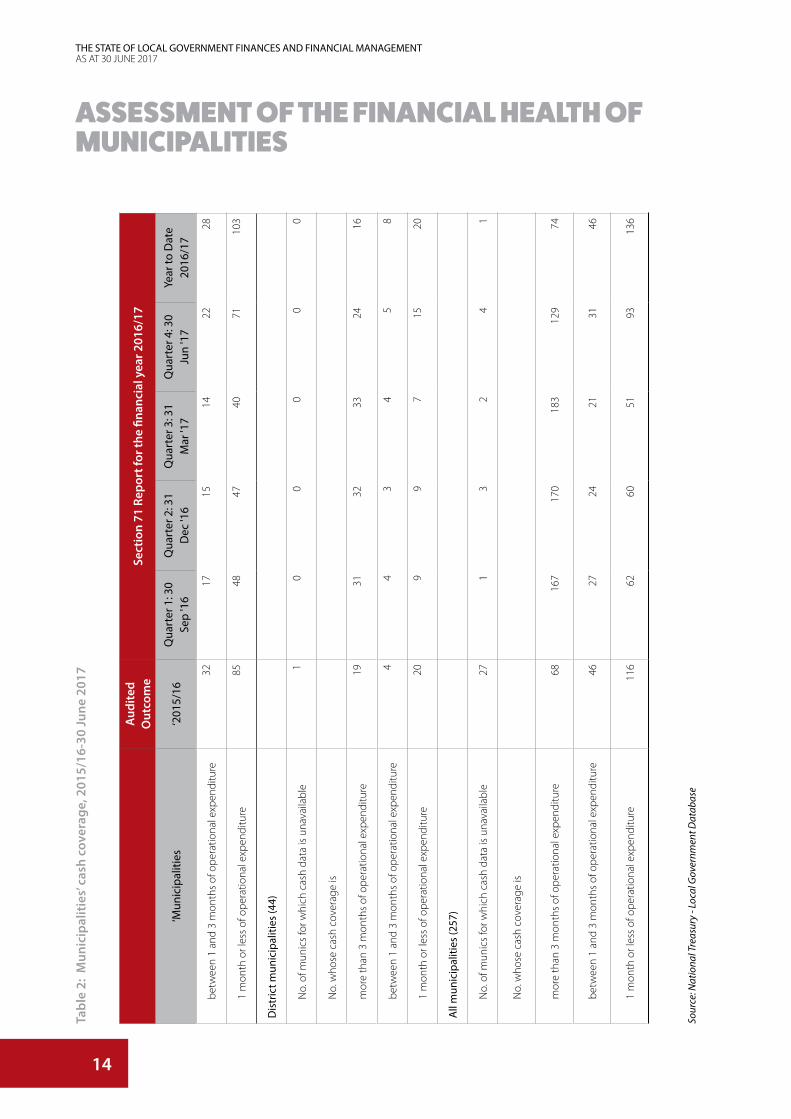
26. A municipality needs to have enough cash on hand to meet its monthly financial commitments when they fall due. Calculating
the level of cash coverage in a municipality is especially important when its revenue collection is threatened. It is generally
accepted that a prudent level of cash coverage is one month of average operational expenditure for metros and three months
for other municipalities. Table 5 below shows the number of municipalities that, at the end of June 2017, had less than the
required cash coverage.
13
THE STATE OF LOCAL GOVERNMENT FINANCES AND FINANCIAL MANAGEMENTAS AT 30 JUNE 2017
ASSESSMENT OF THE FINANCIAL HEALTH OF MUNICIPALITIES
Tabl
e 2:
Mun
icip
alit
ies’
cash
cov
erag
e, 2
015/
16-3
0 Ju
ne 2
017
Aud
ited
Out
com
eSe
ctio
n 71
Rep
ort f
or th
e fin
anci
al y
ear 2
016/
17
‘Mun
icip
aliti
es‘2
015/
16Q
uart
er 1
: 30
Sep
'16
Qua
rter
2: 3
1 D
ec '1
6Q
uart
er 3
: 31
Mar
'17
Qua
rter
4: 3
0 Ju
n '1
7Ye
ar to
Dat
e 20
16/1
7
Met
ropo
litan
mun
icip
aliti
es (8
)
No.
of m
unic
s fo
r whi
ch c
ash
data
is u
nava
ilabl
e1
00
00
0
No.
who
se c
ash
cove
rage
is
mor
e th
an 3
mon
ths
of o
pera
tiona
l exp
endi
ture
35
68
62
betw
een
1 an
d 3
mon
ths
of o
pera
tiona
l exp
endi
ture
33
20
23
1 m
onth
or l
ess
of o
pera
tiona
l exp
endi
ture
10
00
03
Seco
ndar
y ci
ties
(19)
No.
of m
unic
s fo
r whi
ch c
ash
data
is u
nava
ilabl
e2
00
00
0
No.
who
se c
ash
cove
rage
is
mor
e th
an 3
mon
ths
of o
pera
tiona
l exp
endi
ture
011
1112
102
betw
een
1 an
d 3
mon
ths
of o
pera
tiona
l exp
endi
ture
73
43
27
1 m
onth
or l
ess
of o
pera
tiona
l exp
endi
ture
105
44
710
Oth
er L
ocal
Mun
icip
aliti
es (T
owns
) 186
No.
of m
unic
s fo
r whi
ch c
ash
data
is u
nava
ilabl
e23
13
24
1
No.
who
se c
ash
cove
rage
is
mor
e th
an 3
mon
ths
of o
pera
tiona
l exp
endi
ture
4612
012
113
089
54
14
THE STATE OF LOCAL GOVERNMENT FINANCES AND FINANCIAL MANAGEMENTAS AT 30 JUNE 2017
ASSESSMENT OF THE FINANCIAL HEALTH OF MUNICIPALITIES
Aud
ited
Out
com
eSe
ctio
n 71
Rep
ort f
or th
e fin
anci
al y
ear 2
016/
17
‘Mun
icip
aliti
es‘2
015/
16Q
uart
er 1
: 30
Sep
'16
Qua
rter
2: 3
1 D
ec '1
6Q
uart
er 3
: 31
Mar
'17
Qua
rter
4: 3
0 Ju
n '1
7Ye
ar to
Dat
e 20
16/1
7
betw
een
1 an
d 3
mon
ths
of o
pera
tiona
l exp
endi
ture
3217
1514
2228
1 m
onth
or l
ess
of o
pera
tiona
l exp
endi
ture
8548
4740
7110
3
Dis
tric
t mun
icip
aliti
es (4
4)
No.
of m
unic
s fo
r whi
ch c
ash
data
is u
nava
ilabl
e1
00
00
0
No.
who
se c
ash
cove
rage
is
mor
e th
an 3
mon
ths
of o
pera
tiona
l exp
endi
ture
1931
3233
2416
betw
een
1 an
d 3
mon
ths
of o
pera
tiona
l exp
endi
ture
44
34
58
1 m
onth
or l
ess
of o
pera
tiona
l exp
endi
ture
209
97
1520
All
mun
icip
aliti
es (2
57)
No.
of m
unic
s fo
r whi
ch c
ash
data
is u
nava
ilabl
e 2
7 1
3
2
4
1
No.
who
se c
ash
cove
rage
is
mor
e th
an 3
mon
ths
of o
pera
tiona
l exp
endi
ture
68
167
1
70
183
1
29
74
betw
een
1 an
d 3
mon
ths
of o
pera
tiona
l exp
endi
ture
46
27
24
21
31
46
1 m
onth
or l
ess
of o
pera
tiona
l exp
endi
ture
116
6
2 6
0 5
1 9
3 1
36
Tabl
e 2:
Mun
icip
alit
ies’
cash
cov
erag
e, 2
015/
16-3
0 Ju
ne 2
017
Sour
ce: N
atio
nal T
reas
ury
- Loc
al G
over
nmen
t Dat
abas
e

15
THE STATE OF LOCAL GOVERNMENT FINANCES AND FINANCIAL MANAGEMENTAS AT 30 JUNE 2017
27. Over the years, municipalities have become accustomed to reporting cash information. However, 27 municipalities did not
report cash data for 2015/16 and only one on 30 June 2017.
28. The metros have reported a decrease in cash coverage of more than three months of operational expenditure from 3 in
2015/16 to 2 in 2016/17.
29. Among the secondary cities, two municipalities in the 2016/17 financial year compared to zero in 2015/16 had a cash coverage
in excess of three months of operational expenditure. In addition to the 2 metros and the 2 secondary cities, 54 municipalities
and 16 district municipalities had cash coverage of more than three months of operational expenditure.
30. At an aggregate level, 74 (68 in 2015/2016) municipalities in 2016/17 (28.8 per cent) recorded cash coverage exceeding three
months of operational expenditure, which is within the acceptable norm.
31. Of concern is the fact that the number of municipalities with cash coverage of less than one month of operational expenditure
increased from 116 in 2015/16 to 136 in 2016/17.
32. It seems clear that municipalities continue to struggle to understand and action the critical concept that budgeting for
surpluses is necessary to avoid cash and liquidity problems. There was a decline in the compliance with these two indicators
in the 2016/17 financial year compared with 2015/16.
33. Sustained effort is required to address these weak cash positions. National and provincial treasuries will continue to engage
with municipalities on improving their cash flows during the mid-year budget and performance and annual budget
benchmark engagements in January/February and April/May each year. These two annual strategic engagements have been
institutionalised by National Treasury to improve and strengthen the quality and oversight of municipal performance.
34. As cited in previous publications, any of the following events could result in a municipality with a very low (vulnerable) cash
coverage ratio ending up with a negative cash position:
• A deterioration in revenue collection due to the impact of the economic slowdown and the rising rates and tariffs which
affect household budgets
• Emergencies and disasters such as floods and drought
• The cash flow time difference between paying for the increased cost of bulk electricity/water and the collection of
revenues from customers
• Any major breakdown in service delivery resulting in non-supply (especially of water and electricity) and therefore loss of
revenue
• A rate-payers/consumers boycott
• Ineffective cash flow management on a monthly basis
• Non-implementation of debt collection and credit control policies.
INDICATOR 3: OVERSPENDING OF OPERATIONAL EXPENDITURE BUDGETS
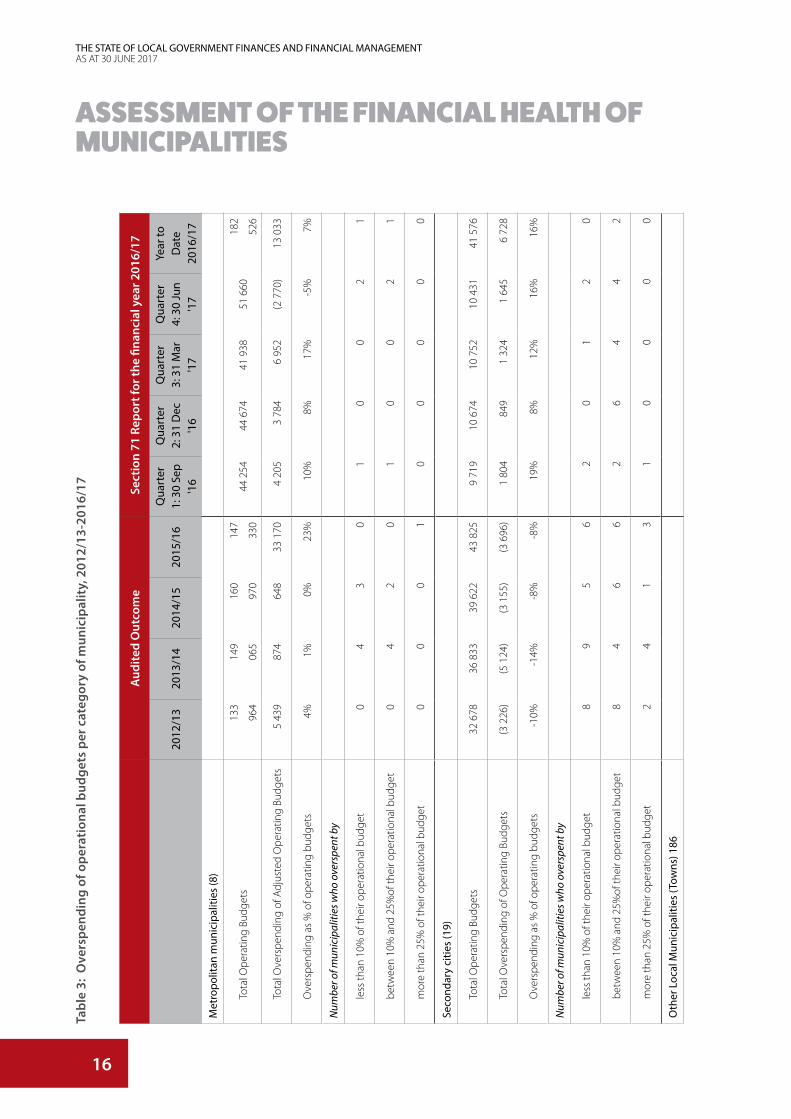
35. If a credible long or medium term financial strategy is not in place, it may be difficult to compile effective operational budgets
or to spend in line with available financial resources. In cases where either of these failures occurs in the context of limited
cash resources and poor rates of revenue collection, the financial risk is greatly magnified.
36. Table 3 below shows the overspending of operational expenditure budgets from 2012/13 to 2016/17 per category of
municipality.
ASSESSMENT OF THE FINANCIAL HEALTH OF MUNICIPALITIES
16
THE STATE OF LOCAL GOVERNMENT FINANCES AND FINANCIAL MANAGEMENTAS AT 30 JUNE 2017
ASSESSMENT OF THE FINANCIAL HEALTH OF MUNICIPALITIES
Tabl
e 3:
Ove
rspe
ndin
g of
ope
rati
onal
bud
gets
per
cat
egor
y of
mun
icip
alit
y, 2
012/
13-2
016/
17
Aud
ited
Out
com
eSe
ctio
n 71
Rep
ort f
or th
e fin
anci
al y
ear 2
016/
17
2012
/13
2013
/14
2014
/15
2015
/16
Qua
rter
1:
30
Sep
'16
Qua
rter
2:
31
Dec
'1
6
Qua
rter
3:
31
Mar
'1
7
Qua
rter
4:
30
Jun
'17
Year
to
Dat
e 20
16/1
7
Met
ropo
litan
mun
icip
aliti
es (8
)
Tota
l Ope
ratin
g Bu
dget
s 1
33
964
149
065
160
970
147
330
44
254
44
674
41
938
51
660
182
526
Tota
l Ove
rspe
ndin
g of
Adj
uste
d O
pera
ting
Budg
ets
5 4
39
874
6
48
33
170
4 2
05
3 7
84
6 9
52
(2 7
70)
13
033
Ove
rspe
ndin
g as
% o
f ope
ratin
g bu
dget
s4%
1%0%
23%
10%
8%17
%-5
%7%
Num
ber o
f mun
icip
aliti
es w
ho o
vers
pent
by
less
than
10%
of t
heir
oper
atio
nal b
udge
t0
43
01
00
21
betw
een
10%
and
25%
of th
eir o
pera
tiona
l bud
get
04
20
10
02
1
mor
e th
an 2
5% o
f the
ir op
erat
iona
l bud
get
00
01
00
00
0
Seco
ndar
y ci
ties
(19)
Tota
l Ope
ratin
g Bu
dget
s 3
2 67
8 3
6 83
3 3
9 62
2 4
3 82
5 9
719
1
0 67
4 1
0 75
2 1
0 43
1 4
1 57
6
Tota
l Ove
rspe
ndin
g of
Ope
ratin
g Bu
dget
s (3
226
) (5
124
) (3
155
) (3
696
) 1
804
8
49
1 3
24
1 6
45
6 7
28
Ove
rspe
ndin
g as
% o
f ope
ratin
g bu
dget
s-1
0%-1
4%-8
%-8
%19
%8%
12%
16%
16%
Num
ber o
f mun
icip
aliti
es w
ho o
vers
pent
by
less
than
10%
of t
heir
oper
atio
nal b
udge
t8
95
62
01
20
betw
een
10%
and
25%
of th
eir o
pera
tiona
l bud
get
84
66
26
44
2
mor
e th
an 2
5% o
f the
ir op
erat
iona
l bud
get
24
13
10
00
0
Oth
er L
ocal
Mun
icip
aliti
es (T
owns
) 186

17
THE STATE OF LOCAL GOVERNMENT FINANCES AND FINANCIAL MANAGEMENTAS AT 30 JUNE 2017
ASSESSMENT OF THE FINANCIAL HEALTH OF MUNICIPALITIES
Tabl
e 3:
Ove
rspe
ndin
g of
ope
rati
onal
bud
gets
per
cat
egor
y of
mun
icip
alit
y, 2
012/
13-2
016/
17
Aud
ited
Out
com
eSe
ctio
n 71
Rep
ort f
or th
e fin
anci
al y
ear 2
016/
17
2012
/13
2013
/14
2014
/15
2015
/16
Qua
rter
1:
30
Sep
'16
Qua
rter
2:
31
Dec
'1
6
Qua
rter
3:
31
Mar
'1
7
Qua
rter
4:
30
Jun
'17
Year
to
Dat
e 20
16/1
7
Tota
l Ope
ratin
g Bu
dget
s 4
4 52
5 4
9 12
0 5
4 67
6 5
7 58
2 1
2 04
3 1
4 10
2 1
3 06
6 1
3 97
8 5
3 18
8
Tota
l Ove
rspe
ndin
g of
Ope
ratin
g Bu
dget
s (5
246
) (4
022
) (4
888
) (1
097
) 4
449
2
390
3
867
2
955
1
4 54
5
Ove
rspe
ndin
g as
% o
f ope
ratin
g bu
dget
s-1
2%-8
%-9
%-2
%37
%17
%30
%21
%27
%
Num
ber o
f mun
icip
aliti
es w
ho o
vers
pent
by
less
than
10%
of t
heir
oper
atio
nal b
udge
t85
7675
5911
2210
297
betw
een
10%
and
25%
of th
eir o
pera
tiona
l bud
get
4142
4336
514
913
8
mor
e th
an 2
5% o
f the
ir op
erat
iona
l bud
get
5038
4421
512
511
4
Dis
tric
t mun
icip
aliti
es (4
4)
Tota
l Ope
ratin
g Bu
dget
s 1
5 85
9 1
8 02
7 1
8 04
4 2
0 38
9 3
548
4
404
4
507
4
453
1
6 91
2
Tota
l Ove
rspe
ndin
g of
Ope
ratin
g Bu
dget
s (1
539
) (2
500
) (4
71)
(1 2
60)
1 2
45
390
3
67
420
2
583
Ove
rspe
ndin
g as
% o
f ope
ratin
g bu
dget
s-1
0%-1
4%-3
%-6
%35
%9%
8%9%
15%
Num
ber o
f mun
icip
aliti
es w
ho o
vers
pent
by
less
than
10%
of t
heir
oper
atio
nal b
udge
t20
1917
171
107
62
betw
een
10%
and
25%
of th
eir o
pera
tiona
l bud
get
710
99
511
54
7
mor
e th
an 2
5% o
f the
ir op
erat
iona
l bud
get
1412
65
03
34
1
Sour
ce: N
atio
nal T
reas
ury
- Loc
al G
over
nmen
t Dat
abas
e

18
THE STATE OF LOCAL GOVERNMENT FINANCES AND FINANCIAL MANAGEMENTAS AT 30 JUNE 2017
ASSESSMENT OF THE FINANCIAL HEALTH OF MUNICIPALITIES
37. The table shows that 1 metro, 7 local municipalities and 2 district municipality had overspent their adjusted operational
budgets by less than 10 per cent at the end of 2016/17.
38. Only five municipalities overspent their operational budgets by more than 25 per cent. This is a result of incorrect budgeting
which will be addressed through the implementation of each provincial treasury’s strategies to address municipal performance
failures specific to their provinces.
39. The total number of municipalities that overspent decreased from 163 in 2015/16 to 33 in 2016/17. This is a great achievement
and it is commendable.
40. The above analysis suggests that municipalities are still not properly forecasting expenditure patterns or that there is a serious
problem of not spending according to expenditure plans. This may be attributed to a failure to table and adopt funded
budgets, as in some cases the underspending does not translate to the equivalent amount of cash in the bank.
41. The above analysis also suggests that municipalities do not always make adequate provision for debt impairment and
depreciation.
INDICATOR 4: UNDER-SPENDING OF CAPITAL BUDGETS
42. The total allocation to the local government capital infrastructure programme for the 2016/17 financial year was R54.4 billion.

19
THE STATE OF LOCAL GOVERNMENT FINANCES AND FINANCIAL MANAGEMENTAS AT 30 JUNE 2017
Tabl
e 4:
Und
er-s
pend
ing
of m
unic
ipal
itie
s’ ca
pita
l bud
gets
, 201
2/13
-30
June
201
7
Aud
ited
Out
com
eSe
ctio
n 71
Rep
ort f
or th
e fin
anci
al y
ear 2
016/
17
2012
/13
2013
/14
2014
/15
2015
/16
Qua
rter
1:
30
Sep
'16
Qua
rter
2:
31
Dec
'1
6
Qua
rter
3:
31
Mar
'1
7
Qua
rter
4:
30
Jun
'17
Year
to
Dat
e 20
16/1
7
Met
ropo
litan
mun
icip
aliti
es (8
)
Tota
l Cap
ital B
udge
t 2
2 96
4 2
6 99
0 2
9 87
6 2
8 09
4 4
334
7
055
5
995
1
2 93
6 3
0 32
0
Tota
l Und
ersp
endi
ng o
f Cap
ital B
udge
t 2
118
1
643
4
683
6
904
5
021
2
300
3
039
(3
902
) 5
815
Und
ersp
endi
ng a
s %
of C
apita
l Bud
get
9%6%
16%
25%
116%
33%
51%
-30%
19%
Num
ber o
f mun
icip
aliti
es w
ho u
nder
spen
t by
less
than
10%
of t
heir
capi
tal b
udge
t5
13
50
21
02
betw
een
10 a
nd 3
0% o
f the
ir ca
pita
l bud
get
22
32
04
20
6
mor
e th
an 3
0% o
f the
ir ca
pita
l bud
get
11
01
82
50
0
Seco
ndar
y ci
ties
(19)
Tota
l Cap
ital B
udge
t 4
179
4
911
5
376
5
970
6
76
1 4
06
1 2
02
2 5
64
5 8
48
Tota
l Und
ersp
endi
ng o
f Cap
ital B
udge
t 8
06
843
6
13
368
1
110
3
80
771
(5
92)
2 0
43
Und
ersp
endi
ng a
s %
of C
apita
l Bud
get
19%
17%
11%
6%16
4%27
%64
%-2
3%35
%
Num
ber o
f mun
icip
aliti
es w
ho u
nder
spen
t by
less
than
10%
of t
heir
capi
tal b
udge
t5
11
20
22
22
betw
een
10 a
nd 3
0% o
f the
ir ca
pita
l bud
get
45
116
14
31
11
mor
e th
an 3
0% o
f the
ir ca
pita
l bud
get
106
04
1810
142
6
Oth
er L
ocal
Mun
icip
aliti
es (T
owns
) 186
ASSESSMENT OF THE FINANCIAL HEALTH OF MUNICIPALITIES

20
THE STATE OF LOCAL GOVERNMENT FINANCES AND FINANCIAL MANAGEMENTAS AT 30 JUNE 2017
ASSESSMENT OF THE FINANCIAL HEALTH OF MUNICIPALITIES
Aud
ited
Out
com
eSe
ctio
n 71
Rep
ort f
or th
e fin
anci
al y
ear 2
016/
17
2012
/13
2013
/14
2014
/15
2015
/16
Qua
rter
1:
30
Sep
'16
Qua
rter
2:
31
Dec
'1
6
Qua
rter
3:
31
Mar
'1
7
Qua
rter
4:
30
Jun
'17
Year
to
Dat
e 20
16/1
7
Tota
l Cap
ital B
udge
t 8
993
1
2 01
6 1
1 71
6 1
3 48
3 2
376
3
123
2
121
3
666
1
1 28
6
Tota
l Und
ersp
endi
ng o
f Cap
ital B
udge
t 2
602
2
29
545
3
12
1 2
78
531
1
648
1
04
3 7
93
Und
ersp
endi
ng a
s %
of C
apita
l Bud
get
29%
2%5%
2%54
%17
%78
%3%
34%
Num
ber o
f mun
icip
aliti
es w
ho u
nder
spen
t by
less
than
10%
of t
heir
capi
tal b
udge
t13
1525
2414
83
1216
betw
een
10 a
nd 3
0% o
f the
ir ca
pita
l bud
get
4634
3427
2539
3130
72
mor
e th
an 3
0% o
f the
ir ca
pita
l bud
get
7379
5066
108
7612
869
74
Dis
tric
t mun
icip
aliti
es (4
4)
Tota
l Cap
ital B
udge
t 5
260
7
147
5
877
7
665
1
574
2
058
1
384
1
940
6
957
Tota
l Und
ersp
endi
ng o
f Cap
ital B
udge
t 2
917
6
30
3 1
67
2 3
75
988
5
04
1 0
52
496
2
788
Und
ersp
endi
ng a
s %
of C
apita
l Bud
get
55%
9%54
%31
%63
%24
%76
%26
%40
%
Num
ber o
f mun
icip
aliti
es w
ho u
nder
spen
t by
less
than
10%
of t
heir
capi
tal b
udge
t3
26
23
53
37
betw
een
10 a
nd 3
0% o
f the
ir ca
pita
l bud
get
49
410
06
78
11
mor
e th
an 3
0% o
f the
ir ca
pita
l bud
get
2617
2019
3219
3019
21
Sour
ce: N
atio
nal T
reas
ury
- Loc
al G
over
nmen
t Dat
abas
e
Tabl
e 4:
Und
er-s
pend
ing
of m
unic
ipal
itie
s’ ca
pita
l bud
gets
, 201
2/13
-30
June
201
7
21
THE STATE OF LOCAL GOVERNMENT FINANCES AND FINANCIAL MANAGEMENTAS AT 30 JUNE 2017
ASSESSMENT OF THE FINANCIAL HEALTH OF MUNICIPALITIES
43. Table 4 above shows total underspending of metros’ adjusted capital budgets of R5.8 billion. It also shows that all metros
underspent their original capital budgets during the 2016/17 financial year. In 2015/16, underspending by 8 metros amounted
to R6.9 billion, with the number of metros underspending their capital budgets by between 10 and 30 per cent rising from 2
in 2015/16 to 6 in 2016/17. However, none of the metros underspent their budgets by more than 30 per cent in the 2016/17
financial year.
44. Secondary cities in 2016/17 underspent their capital budgets by R2 billion, an increase of R1.7 billion from the 2015/16 financial
year. The number of these cities that underspent their budgets by less than 10 per cent remain at 2. Those that underspent
by between 10 and 30 per cent increased from 6 to 11. Six secondary cities underspent their 2016/17 budgets by more than
30 per cent compared to four in 2015/16.
45. Local municipalities underspent their capital budgets by R3.8 billion in the 2016/17 financial year. The number of municipalities
underspending by 10 per cent decreased from 24 in 2015/16 to 16 in 2016/17, while 45 more than in the previous financial year
underspent their capital budgets by between 10 and 30 per cent. However, the number of local municipalities underspending
their capital budgets by more than 30 per cent increased from 66 to 74.
46. The total capital budget underspending among district municipalities (39) was R2.8 billion.
47. It is observable over the years that municipalities tend to struggle with implementing their capital budgets. Contributing
factors include but are not limited to the following:
• Weak multi-year budgeting
• Limited planning, project preparation and project management
• SCM inefficiencies
• Poor asset management
• Poor contract management.
INDICATORS 5 AND 6: LEVELS OF GROWTH IN CONSUMER DEBTORS
48. Consumer debtors as a percentage of own revenue provides a useful and easily calculated indicator of the state of
municipalities’ debtor management capabilities. Municipalities whose debtors are greater than 30 per cent of their own
revenue face a serious financial risk and should work to correct the situation as soon as possible.
49. The table below shows that, at 30 June 2017, 152 municipalities had debtor levels higher than 30 per cent of own revenue, an
increase from 138 as at June 2015/16.
50. Debt impairment as a percentage of billable revenue is a complementary measure of the cost to a municipality of providing
for non-collection/writing off of billable revenue.

22
THE STATE OF LOCAL GOVERNMENT FINANCES AND FINANCIAL MANAGEMENTAS AT 30 JUNE 2017
Tabl
e 5:
Deb
tors
as
perc
enta
ge o
f ow
n re
venu
e, 2
013/
14-3
0 Ju
ne 2
017
Aud
ited
Out
com
eSe
ctio
n 71
Rep
ort f
or th
e fin
anci
al y
ear 2
016/
17
2013
/14
2014
/15
2015
/16
Qua
rter
1:
30 S
ep '1
6Q
uart
er 2
: 31
Dec
'16
Qua
rter
3:
31 M
ar '1
6Q
uart
er 4
: 30
Jun
'17
Year
to D
ate
2016
/17
Met
ropo
litan
mun
icip
aliti
es (8
)
Tota
l Ow
n Re
venu
e 1
44 1
51
155
777
1
47 2
46
49
440
47
812
45
922
51
960
195
134
Tota
l Deb
tors
64
546
64
573
61
459
56
921
57
013
65
701
64
912
64
912
Deb
tors
as
a %
of t
otal
ow
n re
venu
e45
%41
%42
%11
5%11
9%14
3%12
5%33
%
No.
who
se to
tal d
ebto
rs a
re
less
than
15%
of t
heir
tota
l ow
n re
venu
e0
00
01
00
0
betw
een
15 a
nd 3
0% o
f the
ir to
tal o
wn
reve
nue
21
21
00
02
mor
e th
an 3
0% o
f the
ir to
tal o
wn
reve
nue
67
57
78
86
Seco
ndar
y ci
ties
(19)
Tota
l Ow
n Re
venu
e 3
0 98
7 3
3 49
6 3
6 61
1 1
1 17
2 1
0 23
2 9
790
1
1 42
4 4
2 61
7
Tota
l Deb
tors
14
297
19
364
20
670
25
204
25
944
26
434
27
171
27
171
Deb
tors
as
a %
of t
otal
ow
n re
venu
e46
%58
%56
%22
6%25
4%27
0%23
8%64
%
No.
who
se to
tal d
ebto
rs a
re
less
than
15%
of t
heir
tota
l ow
n re
venu
e5
45
11
11
6
betw
een
15 a
nd 3
0% o
f the
ir to
tal o
wn
reve
nue
12
20
10
01
mor
e th
an 3
0% o
f the
ir to
tal o
wn
reve
nue
1111
1018
1718
1812
Oth
er L
ocal
Mun
icip
aliti
es (T
owns
) 186
ASSESSMENT OF THE FINANCIAL HEALTH OF MUNICIPALITIES

23
THE STATE OF LOCAL GOVERNMENT FINANCES AND FINANCIAL MANAGEMENTAS AT 30 JUNE 2017
Tabl
e 5:
Deb
tors
as
perc
enta
ge o
f ow
n re
venu
e, 2
013/
14-3
0 Ju
ne 2
017
Aud
ited
Out
com
eSe
ctio
n 71
Rep
ort f
or th
e fin
anci
al y
ear 2
016/
17
2013
/14
2014
/15
2015
/16
Qua
rter
1:
30 S
ep '1
6Q
uart
er 2
: 31
Dec
'16
Qua
rter
3:
31 M
ar '1
6Q
uart
er 4
: 30
Jun
'17
Year
to D
ate
2016
/17
Tota
l Ow
n Re
venu
e 3
7 11
5 4
0 85
3 4
3 50
7 1
3 48
2 1
2 25
6 1
0 55
9 1
2 29
2 4
8 59
0
Tota
l Deb
tors
17
628
21
441
25
070
31
355
33
603
32
777
31
909
31
909
Deb
tors
as
a %
of t
otal
ow
n re
venu
e47
%52
%58
%23
3%27
4%31
0%26
0%66
%
No.
who
se to
tal d
ebto
rs a
re
less
than
15%
of t
heir
tota
l ow
n re
venu
e35
3331
118
1525
42
betw
een
15 a
nd 3
0% o
f the
ir to
tal o
wn
reve
nue
4035
322
22
629
mor
e th
an 3
0% o
f the
ir to
tal o
wn
reve
nue
9910
610
217
217
616
915
311
5
Dis
tric
t mun
icip
aliti
es (4
4)
Tota
l Ow
n Re
venu
e 1
0 60
2 1
1 34
1 1
3 28
4 2
493
3
192
2
348
3
033
1
1 06
7
Tota
l Deb
tors
3 7
74
4 5
81
5 7
69
5 4
10
4 5
03
5 6
80
4 3
58
4 3
58
Deb
tors
as
a %
of t
otal
ow
n re
venu
e36
%40
%43
%21
7%14
1%24
2%14
4%39
%
No.
who
se to
tal d
ebto
rs a
re
less
than
15%
of t
heir
tota
l ow
n re
venu
e21
1715
814
1618
21
betw
een
15 a
nd 3
0% o
f the
ir to
tal o
wn
reve
nue
610
73
22
04
mor
e th
an 3
0% o
f the
ir to
tal o
wn
reve
nue
1716
2133
2826
2619
Sour
ce: N
atio
nal T
reas
ury
- Loc
al G
over
nmen
t Dat
abas
e
ASSESSMENT OF THE FINANCIAL HEALTH OF MUNICIPALITIES
24
THE STATE OF LOCAL GOVERNMENT FINANCES AND FINANCIAL MANAGEMENTAS AT 30 JUNE 2017
ASSESSMENT OF THE FINANCIAL HEALTH OF MUNICIPALITIES
51. At the end of the fourth quarter of 2016/17 (as per the Section 71 results), total debtors amounted to R128.4 billion, a R15.7
billion increase from the 2015/16 financial year. Households made up the bulk of total debtors at 64.8 per cent.
52. Table 5 above shows that, as at June 2017, debtors against own revenue of 6 (5 in 2015/16) metros, 12 secondary cities (10 in
2015/16), 115 local municipalities (102 in 2015/16) and 19 district municipalities (21 in 2015/16) was above 30 per cent.
53. Unbundling of outstanding debtors began in earnest in the 2016/17 financial year and has resulted in identifying interest on
debtors amounting to R13.1 billion and outstanding government debt of R7.4 billion.
54. National Treasury has undertaken revenue management programmes and workshops to train provincial treasury officials to
assist municipalities in strengthening their billing and revenue collection capacity.
55. Table 6 below shows the growth in consumer debtors between the 2013/14 and 2016/17 financial years.
25
THE STATE OF LOCAL GOVERNMENT FINANCES AND FINANCIAL MANAGEMENTAS AT 30 JUNE 2017
Tabl
e 6:
Gro
wth
in c
onsu
mer
deb
tors
, 201
3/14
-30
June
201
7
Aud
ited
Out
com
eSe
ctio
n 71
Rep
ort f
or th
e fin
anci
al y
ear 2
016/
17
2013
/14
2014
/15
2015
/16
Qua
rter
1:
30 S
ep '1
6Q
uart
er 2
: 31
Dec
'16
Qua
rter
3:
31 M
ar '1
6Q
uart
er 4
: 30
Jun
'17
Year
to D
ate
2016
/17
Met
ropo
litan
mun
icip
aliti
es (8
)
No.
who
se d
ebto
rs g
rew
00
00
00
00
No.
who
se d
ebto
rs in
crea
sed
by
less
than
10%
ove
r per
iod
show
n4
55
78
76
6
betw
een
10%
and
20%
ove
r per
iod
show
n4
22
10
01
1
mor
e th
an 2
0% o
ver p
erio
d sh
own
01
10
01
11
Seco
ndar
y ci
ties
(19)
No.
who
se d
ebto
rs g
rew
00
00
00
00
No.
who
se d
ebto
rs in
crea
sed
by
less
than
10%
ove
r per
iod
show
n5
39
917
178
8
betw
een
10%
and
20%
ove
r per
iod
show
n5
74
21
03
3
mor
e th
an 2
0% o
ver p
erio
d sh
own
99
68
12
88
Oth
er L
ocal
Mun
icip
aliti
es (T
owns
) 186
No.
who
se d
ebto
rs g
rew
00
00
00
00
No.
who
se d
ebto
rs in
crea
sed
by
less
than
10%
ove
r per
iod
show
n67
7365
8616
015
952
52
betw
een
10%
and
20%
ove
r per
iod
show
n37
3851
2711
750
50
ASSESSMENT OF THE FINANCIAL HEALTH OF MUNICIPALITIES

26
THE STATE OF LOCAL GOVERNMENT FINANCES AND FINANCIAL MANAGEMENTAS AT 30 JUNE 2017
ASSESSMENT OF THE FINANCIAL HEALTH OF MUNICIPALITIES
Aud
ited
Out
com
eSe
ctio
n 71
Rep
ort f
or th
e fin
anci
al y
ear 2
016/
17
2013
/14
2014
/15
2015
/16
Qua
rter
1:
30 S
ep '1
6Q
uart
er 2
: 31
Dec
'16
Qua
rter
3:
31 M
ar '1
6Q
uart
er 4
: 30
Jun
'17
Year
to D
ate
2016
/17
mor
e th
an 2
0% o
ver p
erio
d sh
own
8275
7073
1520
8484
Dis
tric
t mun
icip
aliti
es (4
4)
No.
who
se d
ebto
rs g
rew
00
00
00
00
No.
who
se d
ebto
rs in
crea
sed
by
less
than
10%
ove
r per
iod
show
n18
1617
2629
3017
17
betw
een
10%
and
20%
ove
r per
iod
show
n8
77
45
45
5
mor
e th
an 2
0% o
ver p
erio
d sh
own
1821
2014
1010
2222
All
mun
icip
aliti
es (2
57)
No.
who
se d
ebto
rs g
rew
- -
- -
- -
- -
No.
who
se d
ebto
rs in
crea
sed
by
less
than
10%
ove
r per
iod
show
n 9
4 9
7 9
6 1
28
214
2
13
83
83
betw
een
10%
and
20%
ove
r per
iod
show
n 5
4 5
4 6
4 3
4 1
7 1
1 5
9 5
9
mor
e th
an 2
0% o
ver p
erio
d sh
own
109
1
06
97
95
26
33
115
1
15
Sour
ce: N
atio
nal T
reas
ury
- Loc
al G
over
nmen
t Dat
abas
e
Tabl
e 6:
Gro
wth
in c
onsu
mer
deb
tors
, 201
3/14
-30
June
201
7
27
THE STATE OF LOCAL GOVERNMENT FINANCES AND FINANCIAL MANAGEMENTAS AT 30 JUNE 2017
ASSESSMENT OF THE FINANCIAL HEALTH OF MUNICIPALITIES
56. The table above shows an increase in debtors from 97 in 2015/16 to 115 in 2016/17 in the number of municipalities whose
debtors grew by more than 20 per cent.
INDICATOR 7: OUTSTANDING CREDITORS
57. Section 65(2)(e) of the MFMA provides that a municipality’s accounting officer must take all reasonable steps to ensure “that
all money owing by the municipality be paid within 30 days of receiving the relevant invoice or statement, unless prescribed
otherwise for certain categories of expenditure. In addition, Section 65(2)(h) provides that the accounting officer must take
all reasonable steps to ensure that the municipality’s available working capital is managed effectively and economically”. At a
minimum, this involves ensuring that the timing of the municipality’s expenditures is matched by its flow of income.
58. The following table shows creditors as a percentage of cash and investments between 2013/14 and June 2017. This indicates
the extent to which municipalities had working capital to settle their outstanding creditors.

28
THE STATE OF LOCAL GOVERNMENT FINANCES AND FINANCIAL MANAGEMENTAS AT 30 JUNE 2017
Tabl
e 7:
Cre
dito
rs a
s pe
rcen
tage
of c
ash
and
inve
stm
ents
, 201
3/14
-30
June
201
7
Aud
ited
Out
com
eSe
ctio
n 71
Rep
ort f
or th
e fin
anci
al y
ear 2
016/
17
2013
/14
2014
/15
2015
/16
Qua
rter
1:
30 S
ep '1
6Q
uart
er 2
: 31
Dec
'16
Qua
rter
3:
31 M
ar '1
6Q
uart
er 4
: 30
Jun
'17
Year
to D
ate
2016
/17
Met
ropo
litan
mun
icip
aliti
es (8
)
Tota
l Cas
hflow
25
793
27
100
28
269
24
585
27
459
34
947
24
885
24
885
Tota
l Cre
dito
rs 1
9 35
1 2
7 15
5 5
5 71
0 1
3 13
2 1
3 02
7 1
2 78
9 1
8 54
4 1
8 54
4
Cre
dito
rs a
s a
% o
f Tot
al C
ash
75%
100%
197%
53%
47%
37%
75%
75%
No.
who
se To
tal C
redi
tors
are
less
than
25%
of t
heir
Cash
22
12
33
11
betw
een
25 a
nd 5
0% o
f the
ir Ca
sh2
01
33
33
3
betw
een
50 a
nd 7
5% o
f the
ir Ca
sh1
20
10
12
2
mor
e th
an 7
5% o
f the
ir Ca
sh3
46
22
12
2
Seco
ndar
y ci
ties
(19)
Tota
l Cas
hflow
4 1
12
4 4
83
3 2
29
4 9
77
5 1
37
6 5
70
4 6
50
4 6
50
Tota
l Cre
dito
rs 5
022
7
822
9
637
8
048
7
301
7
657
9
587
9
587
Cre
dito
rs a
s a
% o
f Tot
al C
ashfl
ow12
2%17
4%29
8%16
2%14
2%11
7%20
6%20
6%
No.
who
se To
tal C
redi
tors
are
less
than
25%
of t
heir
Cash
53
39
88
88
betw
een
25 a
nd 5
0% o
f the
ir Ca
sh2
32
32
42
2
betw
een
50 a
nd 7
5% o
f the
ir Ca
sh1
02
12
01
1
mor
e th
an 7
5% o
f the
ir Ca
sh9
1110
67
78
8
Oth
er L
ocal
Mun
icip
aliti
es (T
owns
) 186
ASSESSMENT OF THE FINANCIAL HEALTH OF MUNICIPALITIES
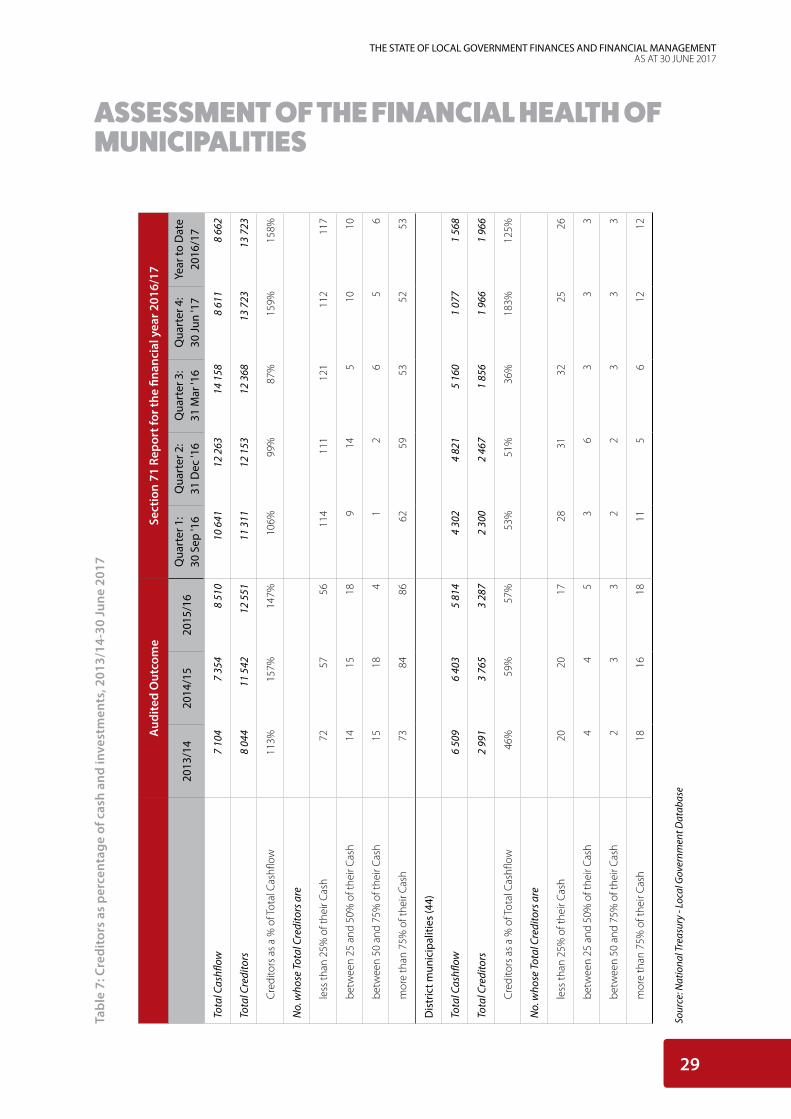
29
THE STATE OF LOCAL GOVERNMENT FINANCES AND FINANCIAL MANAGEMENTAS AT 30 JUNE 2017
Tabl
e 7:
Cre
dito
rs a
s pe
rcen
tage
of c
ash
and
inve
stm
ents
, 201
3/14
-30
June
201
7
Aud
ited
Out
com
eSe
ctio
n 71
Rep
ort f
or th
e fin
anci
al y
ear 2
016/
17
2013
/14
2014
/15
2015
/16
Qua
rter
1:
30 S
ep '1
6Q
uart
er 2
: 31
Dec
'16
Qua
rter
3:
31 M
ar '1
6Q
uart
er 4
: 30
Jun
'17
Year
to D
ate
2016
/17
Tota
l Cas
hflow
7 1
04
7 3
54
8 5
10
10
641
12
263
14
158
8 6
11
8 6
62
Tota
l Cre
dito
rs 8
044
1
1 54
2 1
2 55
1 1
1 31
1 1
2 15
3 1
2 36
8 1
3 72
3 1
3 72
3
Cre
dito
rs a
s a
% o
f Tot
al C
ashfl
ow11
3%15
7%14
7%10
6%99
%87
%15
9%15
8%
No.
who
se To
tal C
redi
tors
are
less
than
25%
of t
heir
Cash
7257
5611
411
112
111
211
7
betw
een
25 a
nd 5
0% o
f the
ir Ca
sh14
1518
914
510
10
betw
een
50 a
nd 7
5% o
f the
ir Ca
sh15
184
12
65
6
mor
e th
an 7
5% o
f the
ir Ca
sh73
8486
6259
5352
53
Dis
tric
t mun
icip
aliti
es (4
4)
Tota
l Cas
hflow
6 5
09
6 4
03
5 8
14
4 3
02
4 8
21
5 1
60
1 0
77
1 5
68
Tota
l Cre
dito
rs 2
991
3
765
3
287
2
300
2
467
1
856
1
966
1
966
Cre
dito
rs a
s a
% o
f Tot
al C
ashfl
ow46
%59
%57
%53
%51
%36
%18
3%12
5%
No.
who
se To
tal C
redi
tors
are
less
than
25%
of t
heir
Cash
2020
1728
3132
2526
betw
een
25 a
nd 5
0% o
f the
ir Ca
sh4
45
36
33
3
betw
een
50 a
nd 7
5% o
f the
ir Ca
sh2
33
22
33
3
mor
e th
an 7
5% o
f the
ir Ca
sh18
1618
115
612
12
Sour
ce: N
atio
nal T
reas
ury
- Loc
al G
over
nmen
t Dat
abas
e
ASSESSMENT OF THE FINANCIAL HEALTH OF MUNICIPALITIES
30
THE STATE OF LOCAL GOVERNMENT FINANCES AND FINANCIAL MANAGEMENTAS AT 30 JUNE 2017
59. At the end of the fourth quarter of 2016/17 (as per the Section 71 results), total creditors amounted to R43.8 billion, a R14.9
billion increase from the 2015/16 financial year. Bulk electricity made up the bulk of total creditors at 36.6 per cent.
60. Table 7 shows that the creditors of 2 (6 in 2015/16) of the 8 metros in 2016/17 and 8 (10 in 2015/16) secondary cities reported
creditors exceeding 75 per cent of their available cash.
61. As at 30 June 2017, local municipalities only had cash available of R8.7 billion to repay outstanding creditors of R13.7 billion,
leaving a deficit of R5 billion to honour the financial commitments. The situation is the same for the secondary cities where
total creditors in 2016/17 amounted to R9.6 billion while the available cash was R4.7 billion; creditors were thus owed 104 per
cent of the available cash. This shows that some municipalities are not complying with Section 65 (2)(e) of the MFMA and that
their cash flow management is weak. This has serious implications for the financial viability of SMMEs and other suppliers that
provide services to municipalities.
62. Municipalities in the Free State have the highest percentage of outstanding creditors greater than 90 days at 84.9 per cent,
followed by North West at 76.4 per cent, Limpopo at 68.7 per cent and Mpumalanga at 68.6 per cent. The year-on-year
increase in outstanding creditors could be an indication that municipalities are experiencing liquidity and cash challenges and
consequently are delaying the settlement of outstanding debt owed.
63. These findings are consistent with the trends observed in the past, with municipalities delaying payments to creditors at the
end of the financial year in order to report a ‘favourable cash position’ and thereby ostensibly comply with Section 65 of the
MFMA.
64. National Treasury has made efforts to ensure that municipalities pay their long outstanding creditors. Methods used have
included withholding equitable share tranche payments to 59 municipalities and obtaining settlement agreements with
those municipalities owing monies to Eskom and the country’s water boards.
INDICATOR 8: RELIANCE ON NATIONAL AND PROVINCIAL CONDITIONAL GRANTS
65. Conditional grants are allocated to municipalities to fund projects of national priority and not necessarily capital programmes
that are revenue raising.
66. It is widely accepted that cities are the growth engines of the economy and that, as well as providing for asset renewal; they
must invest in new infrastructure. This requires appropriate funding of their capital budgets.
67. Table 8 below indicates local governments’ reliance on national government transfers (capital grants/capital budget).
ASSESSMENT OF THE FINANCIAL HEALTH OF MUNICIPALITIES

31
THE STATE OF LOCAL GOVERNMENT FINANCES AND FINANCIAL MANAGEMENTAS AT 30 JUNE 2017
Tabl
e 8:
Loc
al g
over
nmen
ts’ r
elia
nce
on c
ondi
tion
al g
rant
s, 2
013/
14-3
0 Ju
ne 2
017
Aud
ited
Out
com
eSe
ctio
n 71
Rep
ort f
or th
e fin
anci
al y
ear 2
016/
17
2013
/14
2014
/15
2015
/16
Qua
rter
1:
30 S
ep '1
6Q
uart
er 2
: 31
Dec
'16
Qua
rter
3:
31 M
ar '1
6Q
uart
er 4
: 30
Jun
'17
Year
to D
ate
2016
/17
Met
ropo
litan
mun
icip
aliti
es (8
)
No.
of m
unic
s for
whi
ch d
ata
is u
nava
ilabl
e0
01
00
00
0
No.
who
rece
ive
less
than
30%
of r
even
ue fr
om n
atio
nal
tran
sfer
s0
00
20
03
2
betw
een
30%
and
75%
reve
nue
from
na
tiona
l tra
nsfe
rs2
24
56
75
6
mor
e th
an 7
5% o
f rev
enue
from
nat
iona
l tr
ansf
ers
66
31
21
00
Seco
ndar
y ci
ties
(19)
No.
of m
unic
s for
whi
ch d
ata
is u
nava
ilabl
e2
22
00
00
0
No.
who
rece
ive
mor
e th
an
less
than
30%
of r
even
ue fr
om n
atio
nal
tran
sfer
s1
33
118
1114
10
betw
een
30%
and
75%
reve
nue
from
na
tiona
l tra
nsfe
rs4
35
45
23
5
mor
e th
an 7
5% o
f rev
enue
from
nat
iona
l tr
ansf
ers
1211
94
66
24
Oth
er L
ocal
Mun
icip
aliti
es (T
owns
) 186
No.
of m
unic
s for
whi
ch d
ata
is u
nava
ilabl
e16
1527
54
77
1
No.
who
rece
ive
mor
e th
an
less
than
30%
of r
even
ue fr
om n
atio
nal
tran
sfer
s21
1223
8167
8211
760
ASSESSMENT OF THE FINANCIAL HEALTH OF MUNICIPALITIES
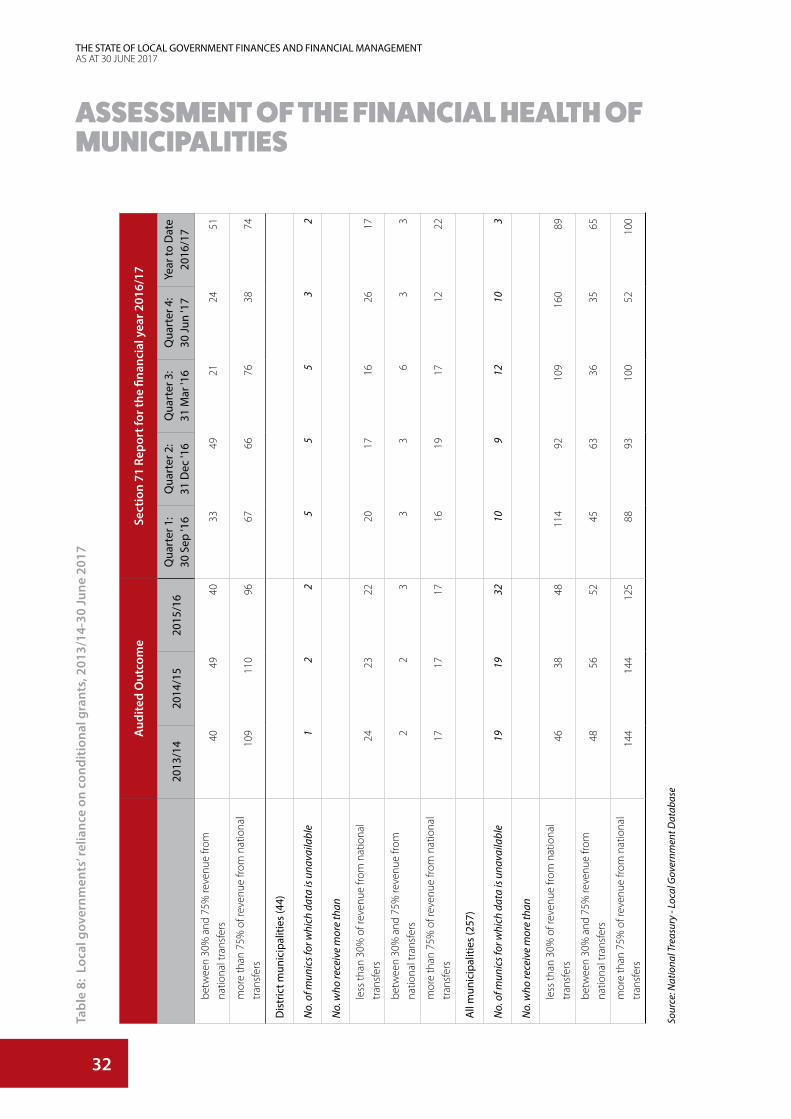
32
THE STATE OF LOCAL GOVERNMENT FINANCES AND FINANCIAL MANAGEMENTAS AT 30 JUNE 2017
Tabl
e 8:
Loc
al g
over
nmen
ts’ r
elia
nce
on c
ondi
tion
al g
rant
s, 2
013/
14-3
0 Ju
ne 2
017
Aud
ited
Out
com
eSe
ctio
n 71
Rep
ort f
or th
e fin
anci
al y
ear 2
016/
17
2013
/14
2014
/15
2015
/16
Qua
rter
1:
30 S
ep '1
6Q
uart
er 2
: 31
Dec
'16
Qua
rter
3:
31 M
ar '1
6Q
uart
er 4
: 30
Jun
'17
Year
to D
ate
2016
/17
betw
een
30%
and
75%
reve
nue
from
na
tiona
l tra
nsfe
rs40
4940
3349
2124
51
mor
e th
an 7
5% o
f rev
enue
from
nat
iona
l tr
ansf
ers
109
110
9667
6676
3874
Dis
tric
t mun
icip
aliti
es (4
4)
No.
of m
unic
s for
whi
ch d
ata
is u
nava
ilabl
e1
22
55
53
2
No.
who
rece
ive
mor
e th
an
less
than
30%
of r
even
ue fr
om n
atio
nal
tran
sfer
s24
2322
2017
1626
17
betw
een
30%
and
75%
reve
nue
from
na
tiona
l tra
nsfe
rs2
23
33
63
3
mor
e th
an 7
5% o
f rev
enue
from
nat
iona
l tr
ansf
ers
1717
1716
1917
1222
All
mun
icip
aliti
es (2
57)
No.
of m
unic
s for
whi
ch d
ata
is u
nava
ilabl
e 1
9 1
9 3
2 1
0 9
1
2 1
0 3
No.
who
rece
ive
mor
e th
an
less
than
30%
of r
even
ue fr
om n
atio
nal
tran
sfer
s 4
6 3
8 4
8 1
14
92
109
1
60
89
betw
een
30%
and
75%
reve
nue
from
na
tiona
l tra
nsfe
rs 4
8 5
6 5
2 4
5 6
3 3
6 3
5 6
5
mor
e th
an 7
5% o
f rev
enue
from
nat
iona
l tr
ansf
ers
144
1
44
125
8
8 9
3 1
00
52
100
Sour
ce: N
atio
nal T
reas
ury
- Loc
al G
over
nmen
t Dat
abas
e
ASSESSMENT OF THE FINANCIAL HEALTH OF MUNICIPALITIES
33
THE STATE OF LOCAL GOVERNMENT FINANCES AND FINANCIAL MANAGEMENTAS AT 30 JUNE 2017
68. Among metros, two have a reliance of less than 30 per cent on national transfers for their budgets. The number of metros
whose revenue is grant-financed by more than 75 per cent has decreased from 3 in 2015/16 to 0 in 2016/17.
69. Among the secondary cities, the revenue of 10 municipalities is less than 30 per cent financed by national transfers; 4
municipalities’ revenue is more than 75 per cent financed from this source.
70. In 2016/17 159 local municipalities, compared with 225 in 2015/16, increased their reliance on national transfers.
71. Among district municipalities, an additional 5 in 2016/17 were more than 75 per cent reliant on national transfers.
72. The total number of municipalities failing to disclose conditional grant information decreased from 32 in 2015/16 to 3 in
2016/17. There was an increase of 13 in the number of municipalities whose grant reliance is between 30 and 75 per cent of
total revenue, mainly because of their lack of fiscal effort to raise more own revenue. A more significant decrease is the 100 in
the 2016/17 financial year from the 125 in 2015/16 in the number of municipalities whose revenue is 75 per cent financed by
national transfers.
ASSESSMENT OF THE FINANCIAL HEALTH OF MUNICIPALITIES
34
THE STATE OF LOCAL GOVERNMENT FINANCES AND FINANCIAL MANAGEMENTAS AT 30 JUNE 2017
OTHER ISSUES IMPACTING ON THE FINANCIAL HEALTH OF A MUNICIPALITY
AUDIT OUTCOMES: 2015/16 FINANCIAL YEAR
73. In the 2015/16 report2 on local government audit outcomes, the Auditor-General (AG) highlighted the fact that municipal
audit outcomes had shown little improvement. The deadline for submission of annual financial statements to the AG had
been met by 94 per cent of municipalities.
74. According to the AG, the amount of irregular3 expenditure had increased from R11.1 billion by 232 municipalities in 2014/15
to R16.8 billion by 236 municipalities in 2015/16. This increase was the highest since the AG has been tracking the values and
largely as a result of municipalities’ failure to address prior year qualifications and of poor supply chain management (SCM)
practices.
75. Fruitless and wasteful expenditure incurred by municipalities decreased from R1.1 billion by 216 municipalities in 2014/15
to R901 million by 218 municipalities in 2015/16. The main reason for the fruitless and wasteful expenditure is on interest,
penalties on overdue accounts and late payments.
76. In 190 municipalities unauthorised expenditure increased from R12.7 billion in 2014/15 to R12.8 billion with 181 municipalities
in 2015/16. The reasons for unauthorised expenditure was 99 per cent for overspending of the budget. Poorly prepared
budgets, inadequate budget control and lack of monitoring and oversight were some of the reasons for the overspending.
Municipal budgets also make provision for non-cash items which includes accounting entries such as reducing the value at
which assets are reflected in the financial statements (assets impairment) and provision for other types of potential financial
losses.
77. The AG once again expressed his concern about the lack of follow-up on previous audit recommendations and inadequate
consequence management for financial misconduct in terms of the MFMA, with councils seldom investigating unauthorised,
irregular, fruitless or wasteful expenditure to determine if officials were liable for the expenditure. The councils of 112
municipalities (compared with 118 in 2014/15) did not conduct investigations in 2014/15 and again did not do so on 2015/16.
To deal with matters of financial misconduct and to give effect to the concept of consequence management, the Municipal
Regulations on Financial Misconduct Procedures and Criminal Proceedings were promulgated on 31 May 2014.
78. The AG highlighted four main risk areas that need to be addressed: (i) supply chain management processes; ((ii) human
resource management; (iii) the quality of submitted financial statements; and (iv) financial health.
79. As part of the audit process, the AG found that among the root causes of poor audit findings were inadequate internal control
measures. The following were reported as contributing to persistently poor audit outcomes at local government level:
• Ineffective political and administrative leadership
• Slow response in improving internal controls and addressing key risk areas
• Instability or vacancies in key positions or key officials lacking appropriate competencies
• Inadequate consequences for poor performance and transgression.
80. The following table presents a summary of audit opinions for all municipalities between 2011/12 and 2015/16 (refer to
Annexure B2 for the 2015/16 audit outcomes per municipality).
2 The 2015/16 AG report was used for the purpose of this report as it was the most recent report available.3 Irregular, unauthorised and wasteful expenditure is defined in Section 1 of the MFMA.

35
THE STATE OF LOCAL GOVERNMENT FINANCES AND FINANCIAL MANAGEMENTAS AT 30 JUNE 2017
OTHER ISSUES IMPACTING ON THE FINANCIAL HEALTH OF A MUNICIPALITY
Table 9: Summary of audit opinions for all municipalities, 2011-12 to 2015-16
2011/12 2012/13 2013/14 2014/15 2015/16
No. % No. % No. % No. % No %
Adverse 4 1% 9 3% 3 1% 4 1% 4 1%
Disclaimer 90 32% 66 24% 55 20% 33 12% 25 9%
Qualified 68 24% 83 30% 71 26% 76 27% 63 23%
Unqualified 116 42% 120 43% 149 54% 165 59% 171 62%
Audits Outstanding 0 0% 0 0% 0 0% 0 0% 15 5%
Total 278 100% 278 100% 278 100% 278 100% 278 100%
Consolidated general report on the audit outcomes of local government MFMA 2015-16
81. In the 2015/16 financial year, 49 municipalities (18 per cent) obtained unqualified opinions without findings. This was a
decrease of 2 municipalities against 2014/15. The bulk of the clean audits were achieved by municipalities in the Western
Cape, KwaZulu-Natal and the Eastern Cape Provinces. In the 2015/16 reporting period, 1 metropolitan municipality (metro),
14 district municipalities and 34 local municipalities received clean audits.
82. The number of unqualified audit opinions with findings has increased from 111 in 2014/15 to 122 (44 per cent) in 2015/16.
However, qualified audit opinions have decreased from 76 to 63 over the same period, with municipalities relying heavily on
consultants to correct material mistakes identified during the audit.
83. On a positive note, the number of municipalities receiving disclaimers significantly declined from 90 in 2011/12 to 25 in
2015/16 with the number of adverse opinions remaining the same at 4 over the same period. The percentage of municipalities
receiving disclaimers or adverse audit opinions decreased from 33.8 per cent in 2011/12 to 10.5 per cent in 2015/16.
84. By the legislative audit deadline of 31 August 2016, fifteen reports for 2015/16 were outstanding.
85. A concerted effort was made with the Section 71 monthly budget statements and Back to Basics (B2B) reports to ensure
that municipalities that failed to comply with audit requirements put in place internal controls and early-warning systems to
minimise the risk of future non-compliance.
86. The number of unqualified audit opinions increased by 47 per cent from 116 in 2011/12 to 171 in 2015/16. Throughout the
past five financial years, municipalities have continued to struggle to correctly measure and disclose on property, infrastructure
and equipment, revenue and irregular expenditure. However, there has been improvement in all three of these audit areas,
most notably in the area of property, infrastructure and equipment.
36
THE STATE OF LOCAL GOVERNMENT FINANCES AND FINANCIAL MANAGEMENTAS AT 30 JUNE 2017
87. The AG’s findings on the financial health, based on ten indicators, of 263 municipalities audited revealed the following
challenges:
• The financial health of 86 (33 per cent) of the municipalities was found to be of concern
• 84 (32 per cent) of municipalities were found to be in a particularly poor financial position, with doubts about their going
concern which required an intervention
• There had been a slight improvement in the number of municipalities of 88 (90 in 2014/15) that spent more than
their available financial resources (resulting in a net deficit), while those current liabilities exceeded their current assets
increased to 116 (102 in 2014/15)
• 8 (11 in 2014/15) municipalities had bank overdrafts at year end, a decrease in comparison with the previous financial
year
• 245 municipalities, the same as the 2014/15 financial year same, estimated that they might not recover 10 per cent of the
outstanding debts owed to them
• 139 (129 in 2014/15) municipalities had an average debt collection period of over 90 days
• 218 (217 in 2014/15) municipalities had creditors outstanding for more than 30 days
• 127 (126 in 2014/15) municipalities had creditors outstanding for more than 90.
88. There are weaknesses in municipalities’ effective utilisation of conditional grants, with 35 found not to have complied with the
Division of Revenue Act (DoRA) requirements.
89. In 2015/16, 93 per cent of 234 municipalities audited has spent the Municipal Infrastructure Grant (MIG) allocation, an
improvement from 87 per cent in 2014/15. In total 105 (123 in 2014/15) municipalities has underspent on their MIG, of which
53 underspent by more than 10 per cent.
90. The quality of the annual performance reports has improved, with the number of municipalities with no material findings
increasing from 38 per cent between 2014/15 to 47 per cent in 2015/16. The usefulness of the information has decreased
from 45 per cent (114 municipalities) in 2014/15 to 38 per cent (96 municipalities) in 2015/16.
91. The audit outcomes of municipalities in the Eastern Cape, Limpopo and Mpumalanga showed momentum in the right
direction, with the Eastern Cape showing the greatest improvement. The Western Cape continued with setting the pace by
increasing their clean unqualified opinions without emphasis of matters to 80 per cent of their municipalities. After a notable
improvement in 2014-15, the audit outcomes of KwaZulu-Natal showed a significant regression this year. The provinces with
the poorest outcomes (based on the number of municipalities with disclaimed and adverse opinions or outstanding audits)
were North West, the Northern Cape and the Free State.
GOVERNANCE: ACTING MUNICIPAL MANAGER AND CHIEF FINANCIAL OFFICER POSITIONS
92. Section 82 of the Municipal Structures Act (MSA) obliges a municipal council to appoint a Municipal Manager (MM) with
relevant skills and expertise to perform the relevant functions of the position. The MM is the accounting officer of a municipality
and is responsible for all major operations, and overall accountability for the administration of the municipality vests with her
or him.
OTHER ISSUES IMPACTING ON THE FINANCIAL HEALTH OF A MUNICIPALITY
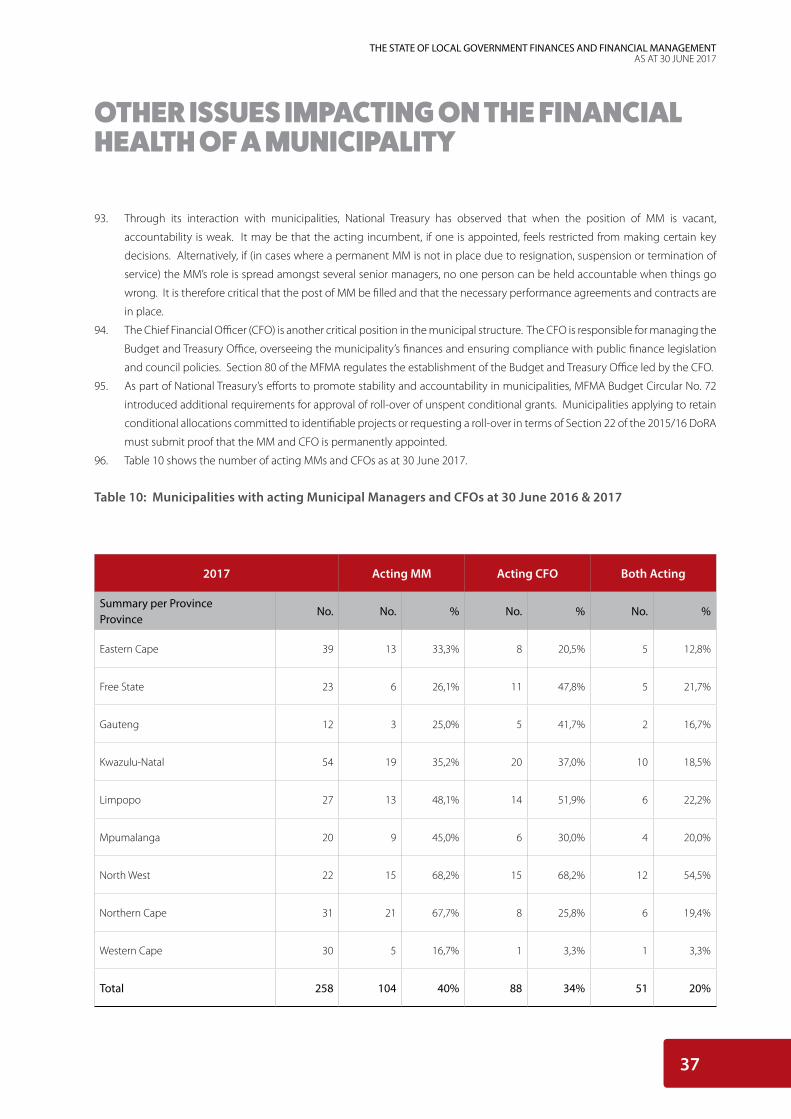
37
THE STATE OF LOCAL GOVERNMENT FINANCES AND FINANCIAL MANAGEMENTAS AT 30 JUNE 2017
93. Through its interaction with municipalities, National Treasury has observed that when the position of MM is vacant,
accountability is weak. It may be that the acting incumbent, if one is appointed, feels restricted from making certain key
decisions. Alternatively, if (in cases where a permanent MM is not in place due to resignation, suspension or termination of
service) the MM’s role is spread amongst several senior managers, no one person can be held accountable when things go
wrong. It is therefore critical that the post of MM be filled and that the necessary performance agreements and contracts are
in place.
94. The Chief Financial Officer (CFO) is another critical position in the municipal structure. The CFO is responsible for managing the
Budget and Treasury Office, overseeing the municipality’s finances and ensuring compliance with public finance legislation
and council policies. Section 80 of the MFMA regulates the establishment of the Budget and Treasury Office led by the CFO.
95. As part of National Treasury’s efforts to promote stability and accountability in municipalities, MFMA Budget Circular No. 72
introduced additional requirements for approval of roll-over of unspent conditional grants. Municipalities applying to retain
conditional allocations committed to identifiable projects or requesting a roll-over in terms of Section 22 of the 2015/16 DoRA
must submit proof that the MM and CFO is permanently appointed.
96. Table 10 shows the number of acting MMs and CFOs as at 30 June 2017.
Table 10: Municipalities with acting Municipal Managers and CFOs at 30 June 2016 & 2017
OTHER ISSUES IMPACTING ON THE FINANCIAL HEALTH OF A MUNICIPALITY
2017 Acting MM Acting CFO Both Acting
Summary per ProvinceProvince
No. No. % No. % No. %
Eastern Cape 39 13 33,3% 8 20,5% 5 12,8%
Free State 23 6 26,1% 11 47,8% 5 21,7%
Gauteng 12 3 25,0% 5 41,7% 2 16,7%
Kwazulu-Natal 54 19 35,2% 20 37,0% 10 18,5%
Limpopo 27 13 48,1% 14 51,9% 6 22,2%
Mpumalanga 20 9 45,0% 6 30,0% 4 20,0%
North West 22 15 68,2% 15 68,2% 12 54,5%
Northern Cape 31 21 67,7% 8 25,8% 6 19,4%
Western Cape 30 5 16,7% 1 3,3% 1 3,3%
Total 258 104 40% 88 34% 51 20%

38
THE STATE OF LOCAL GOVERNMENT FINANCES AND FINANCIAL MANAGEMENTAS AT 30 JUNE 2017
2016 Acting MM Acting CFO Both Acting
Summary per ProvinceProvince
No. No. % No. % No. %
Eastern Cape 45 13 28,9% 14 31,1% 10 22,2%
Free State 24 4 16,7% 5 20,8% 1 4,2%
Gauteng 12 4 33,3% 3 25,0% 2 16,7%
Kwazulu-Natal 61 19 31,1% 16 26,2% 9 14,8%
Limpopo 30 10 33,3% 10 33,3% 6 20,0%
Mpumalanga 21 5 23,8% 7 33,3% 2 9,5%
North West 23 11 47,8% 14 60,9% 10 43,5%
Northern Cape 32 11 34,4% 12 37,5% 7 21,9%
Western Cape 30 11 36,7% 4 13,3% 3 10,0%
Total 278 88 32% 85 31% 50 18%
97. Table 10 shows that 104 municipalities (40 per cent) had acting MMs in place at the end of June 2017 and 88 (32 per cent) had
acting CFOs.
98. The table also shows, as at the same month, the largest percentages of acting MMs in North West Province (68.2 per cent
acting), Northern Cape Province (67.7 per cent acting) and Limpopo Province (48.1 per cent acting).
99. Between June 2016 and June 2017, the number of acting MMs increased from 88 to 104. The increase was especially
noticeable in the Northern Cape, North West and Mpumalanga provinces where the number of acting MMs increased by 10
(from 11), 4 (from 11) and 4 (from 5) in that period.
100. This trend in relation to CFOs was observed in the same period, with the number of acting CFOs increasing from 85 (31 per
cent) to 88 (34 per cent).
101. The number in Free State increased by 6 (from 5), in Limpopo by 4 (from 10) and in Kwazulu-Natal by 4 (from 16). Instances
where both MM and CFO were in an acting capacity increased over the same period from 50 to 51.
102. This on-going instability in senior municipal management positions has a negative impact on service delivery to communities.
This manifests in a number of ways including the inability to make basic managerial decisions such as the appointment of
service providers and financial sustainability. This often delays project implementation and affects the municipality’s ability to
spend its capital budget.
103. The lack of stability at senior management level has been amplified since 2011/12.
OTHER ISSUES IMPACTING ON THE FINANCIAL HEALTH OF A MUNICIPALITY
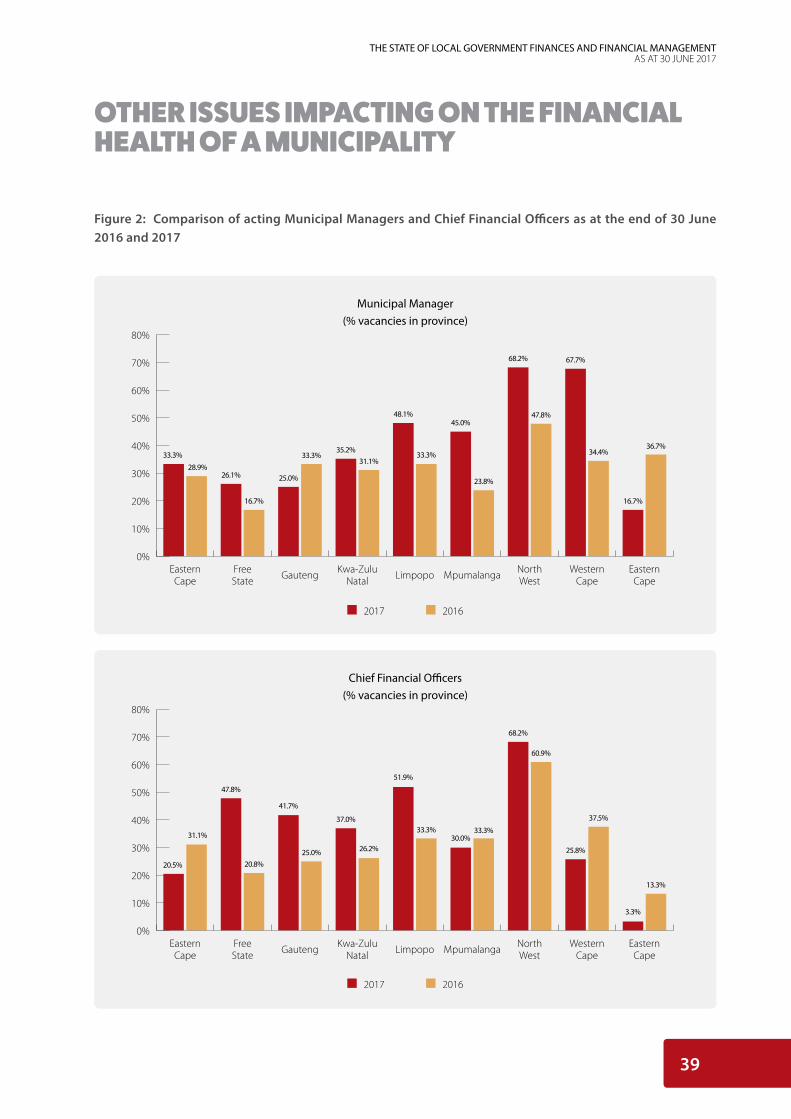
39
THE STATE OF LOCAL GOVERNMENT FINANCES AND FINANCIAL MANAGEMENTAS AT 30 JUNE 2017
Figure 2: Comparison of acting Municipal Managers and Chief Financial Officers as at the end of 30 June 2016 and 2017
Municipal Manager (% vacancies in province)
Chief Financial Officers(% vacancies in province)
EasternCape
EasternCape
EasternCape
33.3%
20.5%
28.9%
31.1%
26.1%
47.8%
26.1%
16.7%
20.8%
25.0%
41.7%
25.0%
33.3%
25.0%
35.2%
37.0%
31.1%
26.2%
48.1%
51.9%
33.3%
33.3%
45.0%
30.0%
23.8%
33.3%
23.8%
68.2%
68.2%
47.8%
60.9%
47.8%
67.7%
25.8%
34.4%
37.5%
16.7%
3.3%
36.7%
13.3%
EasternCape
80%
80%
0%
0%
10%
10%
20%
20%
30%
30%
40%
40%
50%
50%
60%
60%
70%
70%
FreeState
FreeState
Gauteng
Gauteng
Kwa-ZuluNatal
Kwa-ZuluNatal
Limpopo
2017 2016
2017 2016
Limpopo
Mpumalanga
Mpumalanga
NorthWest
NorthWest
WesternCape
WesternCape
OTHER ISSUES IMPACTING ON THE FINANCIAL HEALTH OF A MUNICIPALITY

40
THE STATE OF LOCAL GOVERNMENT FINANCES AND FINANCIAL MANAGEMENTAS AT 30 JUNE 2017
104. The figure above shows that at 30 June 2017, the percentage of acting MMs had increased in the Eastern Cape, Free State,
Kwazulu-Natal, Limpopo, Mpumalanga, North West and Northern Cape. The percentage of acting CFOs decreased in the
Eastern Cape, Mpumalanga, Northern Cape and Western Cape.
105. Although there is no proven correlation between the number of CFO vacancies and the use of consultants, the AG’s 2015/16
report notes the following:
• Local Government has spent an estimated R3.5 billion on consultancy services
• 230 municipalities (87 per cent) used consultants to assist them either with financial reporting or the preparation of
performance information. The use of consultants services was most common in Limpopo, Northern Cape and North
West Province
• R838 million was spent on consultants, an increase from R823 million in 2014/15. This included expenditure by provincial
treasuries and CoGTA on behalf of municipalities. The most common reason why consultants were appointed was a lack
of skills (60 per cent), a combination of a lack of skills and vacancies (34 per cent) and vacancies only 5 per cent
• Only 146 municipalities (63 per cent) that were assisted received financially unqualified audit opinions, although this was
an improvement from the 60 per cent of 2014/15
• In 178 (70 per cent) municipalities assisted, there were weaknesses in the management of consultants ranging from a lack
of skills transfer to poor management and monitoring, and inadequate planning and appointment processes.
106. It is evident that the lack of stability and institutional knowledge in administrative leadership can threaten the financial health
of a municipality. Local government complexities and the challenges of running a municipality require that key personnel are
appointed and have the necessary skills, experience and capacity to fulfil their responsibilities and exercise their functions and
powers.
SIGNIFICANT ELECTRICITY AND WATER LOSSES
107. Table 11 below shows the extent of water and electricity losses by metros at 30 June 2016.
108. On 30 June 2016, metropolitan municipalities recorded water and electricity losses amounting to R2.8 billion and R7.2 billion
respectively. During the 2015/16 financial year, water losses decreased significantly, by R1.1 billion. Water losses are also
affected by the level of municipalities’ spending on repairs and maintenance; this was discussed under Indicator 9 above.
Electricity losses increased significantly with R1.7 billion, from R5.5 billion in 2014/15 to R7.2 billion in 2015/16. There are
always technical losses due to normal transmission and distribution; however, the increase in electricity losses is similar
to water services and also affected by the level of municipalities’ spending on repairs and maintenance and in increase in
electricity theft.
109. Table 11 shows that, in nominal terms, the City of Johannesburg reported the highest losses on water (R895.5 million) and
electricity (R2.2 billion). At R98.9 million (water) and R496.2 million (electricity), the lowest losses were reported by Cape Town
metro.
OTHER ISSUES IMPACTING ON THE FINANCIAL HEALTH OF A MUNICIPALITY
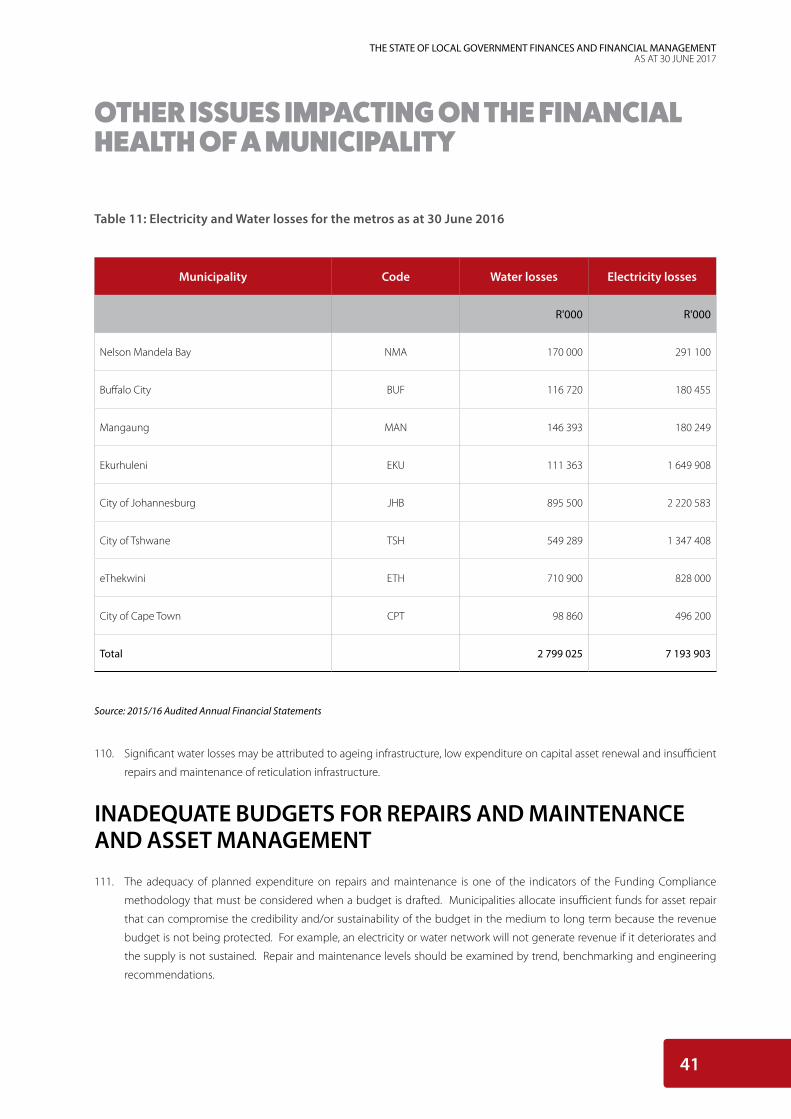
41
THE STATE OF LOCAL GOVERNMENT FINANCES AND FINANCIAL MANAGEMENTAS AT 30 JUNE 2017
OTHER ISSUES IMPACTING ON THE FINANCIAL HEALTH OF A MUNICIPALITY
Municipality Code Water losses Electricity losses
R'000 R'000
Nelson Mandela Bay NMA 170 000 291 100
Buffalo City BUF 116 720 180 455
Mangaung MAN 146 393 180 249
Ekurhuleni EKU 111 363 1 649 908
City of Johannesburg JHB 895 500 2 220 583
City of Tshwane TSH 549 289 1 347 408
eThekwini ETH 710 900 828 000
City of Cape Town CPT 98 860 496 200
Total 2 799 025 7 193 903
Table 11: Electricity and Water losses for the metros as at 30 June 2016
Source: 2015/16 Audited Annual Financial Statements
110. Significant water losses may be attributed to ageing infrastructure, low expenditure on capital asset renewal and insufficient
repairs and maintenance of reticulation infrastructure.
INADEQUATE BUDGETS FOR REPAIRS AND MAINTENANCE AND ASSET MANAGEMENT
111. The adequacy of planned expenditure on repairs and maintenance is one of the indicators of the Funding Compliance
methodology that must be considered when a budget is drafted. Municipalities allocate insufficient funds for asset repair
that can compromise the credibility and/or sustainability of the budget in the medium to long term because the revenue
budget is not being protected. For example, an electricity or water network will not generate revenue if it deteriorates and
the supply is not sustained. Repair and maintenance levels should be examined by trend, benchmarking and engineering
recommendations.

42
THE STATE OF LOCAL GOVERNMENT FINANCES AND FINANCIAL MANAGEMENTAS AT 30 JUNE 2017
OTHER ISSUES IMPACTING ON THE FINANCIAL HEALTH OF A MUNICIPALITY
112. It is frequently the case that, when a municipality experiences financial stress, the first category of expenditure to be
cut is repairs and maintenance as the impact of not spending on this category is not immediately obvious. It is also less
politically sensitive than cutting the capital expenditure programme. However, the medium to long term consequences of
underspending on repairs and maintenance include:
• Deteriorating reliability and quality of services
• A move to more expensive crisis maintenance rather than planned maintenance
• Increased future cost of maintenance and refurbishment
• Shortened useful lifespan of assets, requiring earlier replacement than would otherwise have been the case.
113. Asset management must be considered a key spending priority for municipalities as infrastructure is pivotal to sustainable
and continuous service delivery. Asset management consists of two distinct categories of expenditure: asset renewal as part
of the capital programme, and operational repairs and maintenance of infrastructure.
114. Table 12 below shows the national aggregate, metros and secondary cities’ spending patterns on repairs and maintenance
as a percentage of expenditure on property, plant and equipment for the financial years 2013/14 to 2019/20. This is an
appropriate indicator of spending on repairs and maintenance as it measures spending against the value of the assets for
which such spending was incurred.

43
THE STATE OF LOCAL GOVERNMENT FINANCES AND FINANCIAL MANAGEMENTAS AT 30 JUNE 2017
OTHER ISSUES IMPACTING ON THE FINANCIAL HEALTH OF A MUNICIPALITY
Des
crip
tion
2013
/14
2014
/15
2015
/16
Curr
ent y
ear 2
016/
1720
17/1
8 M
ediu
m T
erm
Rev
enue
&
Expe
nditu
re F
ram
ewor
k
R th
ousa
nds
Audi
ted
Out
com
eAu
dite
d O
utco
me
Audi
ted
Out
com
eO
rigin
al
Budg
etAd
just
ed
Budg
etFu
ll Ye
ar
Fore
cast
Budg
et Y
ear
2017
/18
Budg
et Y
ear
2018
/19
Budg
et Y
ear
2019
/20
Repa
irs a
nd M
aint
enan
ce b
y A
sset
Cla
ss 1
5 48
1 47
2 1
7 82
4 45
0 1
5 89
3 01
6 2
4 25
9 07
7 2
2 67
2 49
2 2
2 67
2 49
2 1
8 86
5 23
5 2
0 35
9 41
7 2
2 04
2 64
2
Infra
stru
ctur
e - R
oad
Tran
spor
t 3
160
950
3
155
817
2
422
293
4
918
158
4
215
776
4
215
776
3
747
066
3
957
762
4
245
775
Infra
stru
ctur
e - E
lect
ricity
3 1
32 9
16
3 2
50 8
97
2 2
49 6
18
4 9
01 5
20
4 7
08 9
61
4 7
08 9
61
4 0
23 0
54
4 4
09 1
55
4 7
73 8
34
Infra
stru
ctur
e - W
ater
2 0
05 4
56
2 6
84 0
00
1 5
29 5
13
3 2
04 8
41
2 8
19 9
11
2 8
19 9
11
2 8
57 0
24
3 0
98 0
46
3 4
62 5
91
Infra
stru
ctur
e - S
anita
tion
1 4
94 2
06
1 5
69 6
62
783
167
2
179
951
1
709
321
1
709
321
1
783
738
1
985
587
2
128
051
Infra
stru
ctur
e - O
ther
1 0
15 7
10
1 0
32 0
42
693
665
1
077
366
6
60 6
65
660
665
5
81 2
45
624
733
6
63 4
45
Infra
stru
ctur
e 1
0 80
9
237
11
692
419
7 6
78 2
56
16
281
836
14
114
635
14
114
635
12
992
127
14
075
284
15
273
696
Com
mun
ity 1
171
798
1
692
620
6
23 5
85
1 9
30 9
70
1 2
91 7
21
1 2
91 7
21
1 2
54 8
39
1 3
54 2
07
1 4
35 7
37
Her
itage
ass
ets
110
772
1
59 3
71
21
922
254
605
1
5 22
6 1
5 22
6 1
2 95
1 1
3 81
3 1
4 70
3
Inve
stm
ent p
rope
rtie
s 2
6 77
2 2
5 00
3 5
4 55
7 3
4 05
6 6
2 69
8 6
2 69
8 5
9 27
3 6
5 61
9 7
0 01
7
Oth
er a
sset
s 3
362
894
4
255
037
7
514
695
5
757
610
7
188
213
7
188
213
4
546
046
4
850
495
5
248
489
TOTA
L EX
PEN
DIT
URE
OTH
ER
ITEM
S 4
1 11
4 79
9 4
4 19
4 43
8 4
2 04
3 25
6 5
0 85
8 19
8 4
9 99
1 28
6 4
9 99
1 28
6 4
6 26
5 80
1 4
9 05
6 97
5 5
2 45
5 61
4
Tabl
e 12
: N
atio
nal a
ggre
gate
repa
ir a
nd m
aint
enan
ce, 2
013/
14- 2
019/
20

44
THE STATE OF LOCAL GOVERNMENT FINANCES AND FINANCIAL MANAGEMENTAS AT 30 JUNE 2017
Des
crip
tion
2013
/14
2014
/15
2015
/16
Curr
ent y
ear 2
016/
1720
17/1
8 M
ediu
m T
erm
Rev
enue
&
Expe
nditu
re F
ram
ewor
k
R th
ousa
nds
Audi
ted
Out
com
eAu
dite
d O
utco
me
Audi
ted
Out
com
eO
rigin
al
Budg
etAd
just
ed
Budg
etFu
ll Ye
ar
Fore
cast
Budg
et Y
ear
2017
/18
Budg
et Y
ear
2018
/19
Budg
et Y
ear
2019
/20
% o
f cap
ital e
xp o
n re
new
al o
f as
sets
38,0
%41
,9%
34,0
%40
,8%
39,3
%39
,3%
67,8
%64
,3%
62,5
%
Rene
wal
of E
xist
ing
Asse
ts a
s %
of d
epre
cn54
,9%
59,2
%53
,6%
75,6
%71
,0%
71,0
%90
,2%
83,6
%80
,2%
R&M
as a
% o
f PPE
3,3%
3,4%
3,1%
4,2%
3,9%
3,9%
3,8%
3,9%
4,0%
Rene
wal
and
R&M
as a
% o
f PPE
6,0%
6,0%
6,0%
8,0%
7,0%
7,0%
9,0%
8,0%
8,0%
Tabl
e 12
: N
atio
nal a
ggre
gate
repa
ir a
nd m
aint
enan
ce, 2
013/
14- 2
019/
20
Sour
ce: 2
015/
16 A
udite
d An
nual
Fin
anci
al S
tate
men
ts
115.
N
atio
nal a
ggre
gate
spe
ndin
g on
repa
irs a
nd m
aint
enan
ce a
s a
perc
enta
ge o
f pro
pert
y, p
lant
and
equ
ipm
ent a
vera
ges
3.4
per c
ent a
s sh
own
in th
e ta
ble
abov
e. T
he
natio
nal n
orm
acc
ordi
ng to
Nat
iona
l Tre
asur
y’s
finan
cial
indi
cato
rs is
8 p
er c
ent.
OTHER ISSUES IMPACTING ON THE FINANCIAL HEALTH OF A MUNICIPALITY
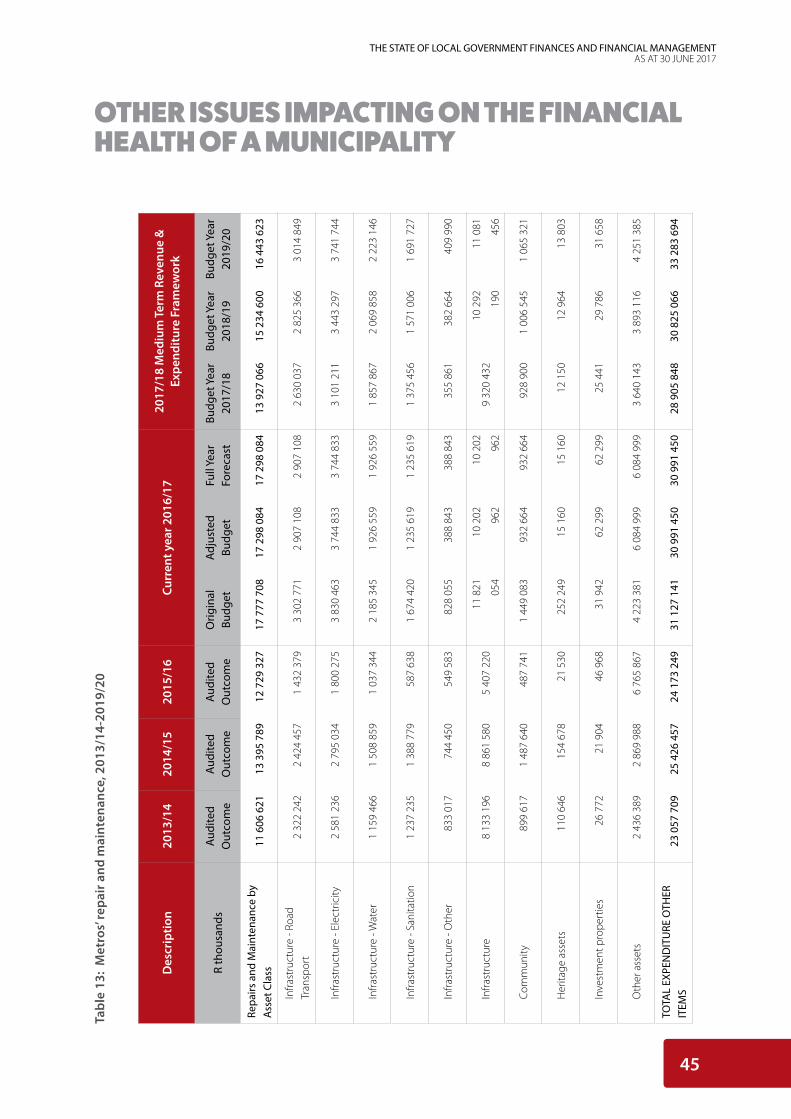
45
THE STATE OF LOCAL GOVERNMENT FINANCES AND FINANCIAL MANAGEMENTAS AT 30 JUNE 2017
OTHER ISSUES IMPACTING ON THE FINANCIAL HEALTH OF A MUNICIPALITY
Tabl
e 13
: M
etro
s’ re
pair
and
mai
nten
ance
, 201
3/14
-201
9/20
Des
crip
tion
2013
/14
2014
/15
2015
/16
Curr
ent y
ear 2
016/
1720
17/1
8 M
ediu
m T
erm
Rev
enue
&
Expe
nditu
re F
ram
ewor
k
R th
ousa
nds
Audi
ted
Out
com
eAu
dite
d O
utco
me
Audi
ted
Out
com
eO
rigin
al
Budg
etAd
just
ed
Budg
etFu
ll Ye
ar
Fore
cast
Budg
et Y
ear
2017
/18
Budg
et Y
ear
2018
/19
Budg
et Y
ear
2019
/20
Repa
irs a
nd M
aint
enan
ce b
y A
sset
Cla
ss 1
1 60
6 62
1 1
3 39
5 78
9 1
2 72
9 32
7 1
7 77
7 70
8 1
7 29
8 08
4 1
7 29
8 08
4 1
3 92
7 06
6 1
5 23
4 60
0 1
6 44
3 62
3
Infra
stru
ctur
e - R
oad
Tran
spor
t 2
322
242
2
424
457
1
432
379
3
302
771
2
907
108
2
907
108
2
630
037
2
825
366
3
014
849
Infra
stru
ctur
e - E
lect
ricity
2 5
81 2
36
2 7
95 0
34
1 8
00 2
75
3 8
30 4
63
3 7
44 8
33
3 7
44 8
33
3 1
01 2
11
3 4
43 2
97
3 7
41 7
44
Infra
stru
ctur
e - W
ater
1 1
59 4
66
1 5
08 8
59
1 0
37 3
44
2 1
85 3
45
1 9
26 5
59
1 9
26 5
59
1 8
57 8
67
2 0
69 8
58
2 2
23 1
46
Infra
stru
ctur
e - S
anita
tion
1 2
37 2
35
1 3
88 7
79
587
638
1
674
420
1
235
619
1
235
619
1
375
456
1
571
006
1
691
727
Infra
stru
ctur
e - O
ther
833
017
7
44 4
50
549
583
8
28 0
55
388
843
3
88 8
43
355
861
3
82 6
64
409
990
Infra
stru
ctur
e 8
133
196
8
861
580
5
407
220
1
1 82
1
054
10
202
962
10
202
962
9 3
20 4
32
10
292
190
11
081
456
Com
mun
ity 8
99 6
17
1 4
87 6
40
487
741
1
449
083
9
32 6
64
932
664
9
28 9
00
1 0
06 5
45
1 0
65 3
21
Her
itage
ass
ets
110
646
1
54 6
78
21
530
252
249
1
5 16
0 1
5 16
0 1
2 15
0 1
2 96
4 1
3 80
3
Inve
stm
ent p
rope
rtie
s 2
6 77
2 2
1 90
4 4
6 96
8 3
1 94
2 6
2 29
9 6
2 29
9 2
5 44
1 2
9 78
6 3
1 65
8
Oth
er a
sset
s 2
436
389
2
869
988
6
765
867
4
223
381
6
084
999
6
084
999
3
640
143
3
893
116
4
251
385
TOTA
L EX
PEN
DIT
URE
OTH
ER
ITEM
S23
057
709
2
5 42
6 45
7 24
173
249
3
1 12
7 14
1 3
0 99
1 45
0 3
0 99
1 45
0 2
8 90
5 84
8 3
0 82
5 06
6 3
3 28
3 69
4

46
THE STATE OF LOCAL GOVERNMENT FINANCES AND FINANCIAL MANAGEMENTAS AT 30 JUNE 2017
Sour
ce: 2
015/
16 A
udite
d An
nual
Fin
anci
al S
tate
men
ts
116.
Ta
ble
13 a
bove
sho
ws,
spen
ding
by
met
ropo
litan
mun
icip
aliti
es o
n re
pairs
and
mai
nten
ance
as
a pe
rcen
tage
of e
xpen
ditu
re o
n pr
oper
ty, p
lant
and
equ
ipm
ent f
rom
2013
/14
to 2
015/
16 in
crea
sed,
at a
n av
erag
e of
5.2
per
cen
t. It
is b
road
ly a
ckno
wle
dged
that
ther
e is
a li
nk b
etw
een
the
num
ber o
f pot
hole
s, un
atte
nded
bur
st p
ipes
and
sew
erag
e sp
ills
in m
unic
ipal
are
as a
nd n
on-p
aym
ent o
f rat
es a
nd s
ervi
ce c
harg
es w
hich
affe
cts
the
reve
nue
of th
e m
unic
ipal
ity.
OTHER ISSUES IMPACTING ON THE FINANCIAL HEALTH OF A MUNICIPALITY
Tabl
e 13
: M
etro
s’ re
pair
and
mai
nten
ance
, 201
3/14
-201
9/20
Des
crip
tion
2013
/14
2014
/15
2015
/16
Curr
ent y
ear 2
016/
1720
17/1
8 M
ediu
m T
erm
Rev
enue
&
Expe
nditu
re F
ram
ewor
k
R th
ousa
nds
Audi
ted
Out
com
eAu
dite
d O
utco
me
Audi
ted
Out
com
eO
rigin
al
Budg
etAd
just
ed
Budg
etFu
ll Ye
ar
Fore
cast
Budg
et Y
ear
2017
/18
Budg
et Y
ear
2018
/19
Budg
et Y
ear
2019
/20
% o
f cap
ital e
xp o
n re
new
al o
f as
sets
77,2
%78
,6%
66,2
%61
,0%
63,7
%63
,7%
120,
3%10
8,4%
103,
9%
Rene
wal
of E
xist
ing
Asse
ts a
s %
of d
epre
cn10
2,7%
109,
3%97
,8%
106,
3%10
2,7%
102,
7%13
2,0%
126,
3%11
9,5%
R&M
as a
% o
f PPE
5,0%
5,3%
5,4%
6,0%
5,9%
5,9%
4,9%
5,0%
5,1%
Rene
wal
and
R&M
as a
% o
f PPE
10,0
%10
,0%
10,0
%11
,0%
11,0
%11
,0%
12,0
%12
,0%
11,0
%
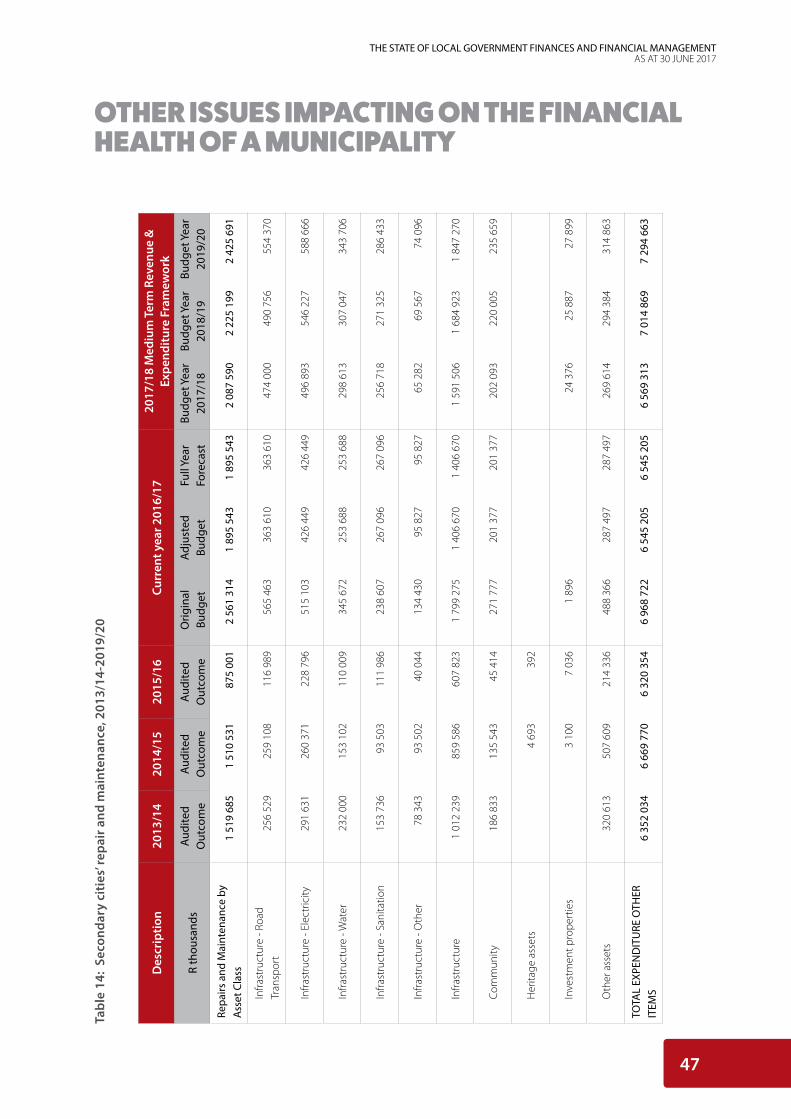
47
THE STATE OF LOCAL GOVERNMENT FINANCES AND FINANCIAL MANAGEMENTAS AT 30 JUNE 2017
OTHER ISSUES IMPACTING ON THE FINANCIAL HEALTH OF A MUNICIPALITY
Tabl
e 14
: Se
cond
ary
citi
es’ r
epai
r and
mai
nten
ance
, 201
3/14
-201
9/20
Des
crip
tion
2013
/14
2014
/15
2015
/16
Curr
ent y
ear 2
016/
1720
17/1
8 M
ediu
m T
erm
Rev
enue
&
Expe
nditu
re F
ram
ewor
k
R th
ousa
nds
Audi
ted
Out
com
eAu
dite
d O
utco
me
Audi
ted
Out
com
eO
rigin
al
Budg
etAd
just
ed
Budg
etFu
ll Ye
ar
Fore
cast
Budg
et Y
ear
2017
/18
Budg
et Y
ear
2018
/19
Budg
et Y
ear
2019
/20
Repa
irs a
nd M
aint
enan
ce b
y A
sset
Cla
ss 1
519
685
1
510
531
8
75 0
01
2 5
61 3
14
1 8
95 5
43
1 8
95 5
43
2 0
87 5
90
2 2
25 1
99
2 4
25 6
91
Infra
stru
ctur
e - R
oad
Tran
spor
t 2
56 5
29
259
108
1
16 9
89
565
463
3
63 6
10
363
610
4
74 0
00
490
756
5
54 3
70
Infra
stru
ctur
e - E
lect
ricity
291
631
2
60 3
71
228
796
5
15 1
03
426
449
4
26 4
49
496
893
5
46 2
27
588
666
Infra
stru
ctur
e - W
ater
232
000
1
53 1
02
110
009
3
45 6
72
253
688
2
53 6
88
298
613
3
07 0
47
343
706
Infra
stru
ctur
e - S
anita
tion
153
736
9
3 50
3 1
11 9
86
238
607
2
67 0
96
267
096
2
56 7
18
271
325
2
86 4
33
Infra
stru
ctur
e - O
ther
78
343
93
502
40
044
134
430
9
5 82
7 9
5 82
7 6
5 28
2 6
9 56
7 7
4 09
6
Infra
stru
ctur
e 1
012
239
8
59 5
86
607
823
1
799
275
1
406
670
1
406
670
1
591
506
1
684
923
1
847
270
Com
mun
ity 1
86 8
33
135
543
4
5 41
4 2
71 7
77
201
377
2
01 3
77
202
093
2
20 0
05
235
659
Her
itage
ass
ets
4 6
93
392
Inve
stm
ent p
rope
rtie
s 3
100
7
036
1
896
2
4 37
6 2
5 88
7 2
7 89
9
Oth
er a
sset
s 3
20 6
13
507
609
2
14 3
36
488
366
2
87 4
97
287
497
2
69 6
14
294
384
3
14 8
63
TOTA
L EX
PEN
DIT
URE
OTH
ER
ITEM
S 6
352
034
6
669
770
6
320
354
6
968
722
6
545
205
6
545
205
6
569
313
7
014
869
7
294
663

48
THE STATE OF LOCAL GOVERNMENT FINANCES AND FINANCIAL MANAGEMENTAS AT 30 JUNE 2017
Des
crip
tion
2013
/14
2014
/15
2015
/16
Curr
ent y
ear 2
016/
1720
17/1
8 M
ediu
m T
erm
Rev
enue
&
Expe
nditu
re F
ram
ewor
k
R th
ousa
nds
Audi
ted
Out
com
eAu
dite
d O
utco
me
Audi
ted
Out
com
eO
rigin
al
Budg
etAd
just
ed
Budg
etFu
ll Ye
ar
Fore
cast
Budg
et Y
ear
2017
/18
Budg
et Y
ear
2018
/19
Budg
et Y
ear
2019
/20
% o
f cap
ital e
xp o
n re
new
al o
f as
sets
29,1
%34
,4%
35,7
%49
,4%
40,2
%40
,2%
45,0
%39
,1%
32,1
%
Rene
wal
of E
xist
ing
Asse
ts a
s %
of d
epre
cn22
,9%
26,7
%28
,8%
53,6
%48
,7%
48,7
%46
,9%
36,8
%33
,9%
R&M
as a
% o
f PPE
1,8%
1,5%
0,9%
2,5%
1,7%
1,7%
2,5%
2,6%
2,8%
Rene
wal
and
R&M
as a
% o
f PPE
3,0%
3,0%
2,0%
5,0%
4,0%
4,0%
5,0%
5,0%
5,0%
Tabl
e 14
: Se
cond
ary
citi
es’ r
epai
r and
mai
nten
ance
, 201
3/14
-201
9/20
Sour
ce: N
atio
nal T
reas
ury
Loca
l Gov
ernm
ent D
atab
ase
OTHER ISSUES IMPACTING ON THE FINANCIAL HEALTH OF A MUNICIPALITY

49
THE STATE OF LOCAL GOVERNMENT FINANCES AND FINANCIAL MANAGEMENTAS AT 30 JUNE 2017
117. Table 14 above shows, secondary cities’ spending from 2013/14 to 2015/16 on this indicator falls far short of the expected
norm. On average, secondary cities budgeted 2.5 per cent for repairs and maintenance and spent only 1.4 per cent on this
item. This poor allocation for repairs and maintenance is sustained over the 2017/18 MTREF with an average of 2.6 per cent.
Secondary cities need to take the necessary action to reverse the impact of inadequate budgeting and spending on repairs
and maintenance. During the budget benchmark engagements, National Treasury and the provincial treasuries should
emphasise the need for all municipalities to increase their repairs and maintenance budgets.
118. Overall, municipalities are not sufficiently prioritising expenditure on asset management. As a result, these strategic spending
areas receive limited allocations.
UNDER-SPENDING OF CONDITIONAL GRANTS
119. Table 15 below shows conditional grants performance as at 30 June 2017.
OTHER ISSUES IMPACTING ON THE FINANCIAL HEALTH OF A MUNICIPALITY

50
THE STATE OF LOCAL GOVERNMENT FINANCES AND FINANCIAL MANAGEMENTAS AT 30 JUNE 2017
OTHER ISSUES IMPACTING ON THE FINANCIAL HEALTH OF A MUNICIPALITY
Tabl
e 15
: Co
ndit
iona
l gra
nts
tran
sfer
red
from
nat
iona
l dep
artm
ents
to m
unic
ipal
itie
s in
201
6/17
Gra
nt T
ype
Div
isio
n of
re
venu
e A
ct N
o.
1 of
201
5
Tota
l Ava
ilabl
e 20
16/1
7
App
rove
d pa
ymen
t sc
hedu
le
Act
ual
expe
nditu
re
Nat
iona
l D
epar
tmen
t
Act
ual
expe
nditu
re b
y m
unic
ipal
ities
Exp
as %
of
Allo
catio
n N
atio
nal
Dep
artm
ent
Exp
as %
of
Allo
catio
n by
m
unic
ipal
ities
Dire
ct T
rans
fers
30
010
142
30
062
341
29
798
391
24
785
126
26
073
153
82,4
%86
,7%
Infra
stru
ctur
e 2
8 23
3 35
6 2
8 28
5 55
5 2
8 01
8 75
0 2
3 27
5 04
7 2
4 55
2 62
1 82
,3%
86,8
%
Capa
city
and
Oth
ers
1 7
76 7
86
1 7
76 7
86
1 7
79 6
41
1 5
10 0
79
1 5
20 5
32
85,0
%85
,6%
Gra
nts
excl
uded
from
th
e pu
blic
atio
n 1
0 83
9 46
8 1
0 83
9 46
8 -
- 9
686
998
-
89,4
%
Urb
an S
ettle
men
t D
evel
opm
ent G
rant
10
839
468
10
839
468
- -
9 6
86 9
98
- 89
,4%
48
941
849
49
116
648
38
013
230
24
785
126
35
760
151
50,5
%72
,8%

51
THE STATE OF LOCAL GOVERNMENT FINANCES AND FINANCIAL MANAGEMENTAS AT 30 JUNE 2017
OTHER ISSUES IMPACTING ON THE FINANCIAL HEALTH OF A MUNICIPALITY
120. In the 2016/17 financial year, in terms of the DoRA R49.1 billion was allocated in the form of direct and indirect grants to local
government.
121. In aggregate, municipalities spent R35.8 billion or 72.8 per cent of the total direct conditional grants: Infrastructure, Capacity
and Urban Settlement Development grants at R24.6 billion (68.9 per cent, R1.5 billion (4.2 per cent) and R9.6 billion (26.9 per
cent) respectively. The administering departments reported these figures as R24.8 billion or 50.4 per cent as at 30 June 2017.
The misalignment is due to the fact that municipalities report to treasuries by the 10th of a month but national transferring
officer’s report to National Treasury on the 20th.
SUMMARY OF MUNICIPALITIES IN FINANCIAL DISTRESS
122. There is a group of municipalities that have liquidity challenges and are failing at effectively delivering services, billing for
services and collecting the revenue due; consequently, outstanding debtors are increasing and they are not able to maintain
positive cash flows to pay creditors within the thirty days’ timeframe as legally prescribed.
123. Annexure A1 lists the municipalities in financial distress in 2016/17 (128) based on the financial health assessment. Annexure A2
provides a consolidated analysis of the 257 municipalities’ audit outcomes, capital budget performance, current interventions,
vacancies in key positions, those identified as financially distressed and trends for the 2016/17 financial year. This list shows
that 57 municipalities classified as financially distressed received unqualified audit report with findings. This suggests that the
result of the audit outcome is not on its own a reflection of good financial health. Ten financially distressed municipalities
obtained disclaimers, while 36 financially distressed municipalities obtained qualified audit opinions. Annexure B provides the
consolidated assessment results for the metros as at 30 June 2017.
124. When diagnosing the reasons that contribute to the municipal liquidity challenges it is prudent to holistically examine the
organisational and operational management inefficiencies. Among the audit issues raised with respect to municipal financial
management inefficiencies are weak internal controls; weaknesses and non-compliance to policies and procedures; fruitless
and wasteful, unauthorised and irregular expenditure.
125. The increase in municipal debt is predominantly prevalent in smaller municipalities that have struggled with capacity,
governance, institutional and operational inefficiencies. At the core of this is that these municipalities do not prepare funded
and implementable budgets, despite the allocations and receipt of conditional and unconditional grants.
126. National Treasury in collaboration with other stakeholders has introduced changes to the local government equitable share
formula, announcements of multi-year allocations, and other reforms to bring predictability and certainty into the fiscal
system, despite current economic climate, but as long as municipalities fail to practice sound financial discipline they will
always argue that funding is inadequate.
127. Despite all efforts the trend analysis of outstanding debt owed to municipalities, as reported in terms of s71 of the MFMA,
show that it has increased uncontrollably since 2011. Currently, the outstanding municipal debt (R128.4 billion, fourth quarter,
2017/18) exceeds the total amount allocated to local government through direct and indirect grants from the national fiscus
(R111 billion).
128. While households continue to be the largest contributor to outstanding municipal debt comprising 64.8 per cent of the total,
there is wide-spread non-payment across all customer segments (s71, fourth quarter, 2016/17).

52
THE STATE OF LOCAL GOVERNMENT FINANCES AND FINANCIAL MANAGEMENTAS AT 30 JUNE 2017
OTHER ISSUES IMPACTING ON THE FINANCIAL HEALTH OF A MUNICIPALITY
129. Municipalities in turn owe creditors R43.8 billion (s71, fourth quarter, 2017/18); these include all categories of creditors,
however, it is the monies owed to Eskom and Water Boards that has sparked political interest to resolve the issues of non-
payment. There are also cases of municipal non-payment of other creditors and suppliers that resulted in attachment of
municipal assets and sale if execution of such assets by the courts. This cannot be allowed to continue as it will erode
the gains made in the democratic system of governance as more and more communities face service delivery failures and
communities vent their frustration through destructive protest actions as a result of the inability of municipalities to attend to
basic service needs.
130. It is evident that, non-compliance to the thirty day payment period of the MFMA and Public Finance Management Act,
1999, (Act No. 29 of 1999)(PFMA) (as amended) is endemic across the spheres of government. Municipalities are not paying
creditors within the 30 days period as required in terms of sections 65(1) and (2)(e) of the MFMA which stipulates that “the
accounting officer of a municipality is responsible for the management of the expenditure of the municipality and must take
all reasonable steps to account for the creditors of the municipality and ensure that all money owing by the municipality be
paid within 30 days of receiving the relevant invoice, unless prescribed otherwise for certain categories of expenditure”. This
has resulted in some municipalities facing litigations due to non-payment of creditors.
131. When National Treasury engaged the defaulting municipalities the following issues were tabled for consideration as the root
causes that impact on their ability to operate:
• Several municipalities with poor cash flows have adopted unfunded budgets
• Tariffs, billings and credit control measures were not aligned to indigent policies
• Inefficient management of electricity demand means that penalty charges are unnecessarily incurred (fruitless and
wasteful expenditure)
• Unrealistic budgeted revenue collection levels are not realised while operating costs (such as employee related costs)
remain high with no effort made to contain expenditure
• The local government equitable share is mainly used to fund operating costs rather than utilised for the purpose of
service delivery targeting the poorest of the poor
• Payment arrangements are not provided for in the municipal budget; consequently, it may be argued that the signed
payment arrangements are merely a case of malicious compliance
• Weak municipal leadership, including ineffective councils and governance structures contribute to weak fiscal discipline;
and consequent financial mismanagement
• Notably accountability is weaker at municipalities where the position of municipal manager is vacant or occupied by an
“acting” incumbent, as an “acting” municipal manager is less inclined to take decisions. Essentially, the first indicator of
managerial failure is evident in the operational matters on the ground, for example, if the streets in a municipality are
littered and there are unsightly heaps of rubble or the robots do not work and there are inadequately serviced public
ablution facilities. The second indicator of managerial failure is the tendency of senior managers to polarize themselves
with political factions while the third indicator is generally incompetence of the staff complement
• The absence of a suitably competent Chief Financial Officer presents a risk to sound financial management as it provides
opportunities for the flouting of internal controls, non-compliance to the legal framework and general mismanagement
of public funds. The filling of vacancies with regard to the two key positions in a municipality needs to be fast-tracked
with competent managers. If there is no leadership in these positions, it should be no surprise that service delivery
failures are eminent
• Weak management of the overall revenue value chain, including tariff setting of trading services and administering the
property transfer process

53
THE STATE OF LOCAL GOVERNMENT FINANCES AND FINANCIAL MANAGEMENTAS AT 30 JUNE 2017
OTHER ISSUES IMPACTING ON THE FINANCIAL HEALTH OF A MUNICIPALITY
• Ineffective budget planning and implementation; inability to maximise the capital budget spending while overspending
on the operating budget, increasing non-priority spending and persistent negative cash balances
• Historic inadequate budget allocation for repairs and maintenance and asset management
• Limited evidence based financial management such as cash flow management
• Weak internal controls, risk management and supply chain management (SCM) inefficiencies resulting in poor audit
outcomes and wasteful expenditure.
132. These studies and initiatives as well as the engagements with municipalities highlighted the fact that political instability, poor
administrative governance and weak financial management was the common denominator and at the heart of the problem
impacting on the municipality’s ability to deliver services as per their mandate. If, however the political economy issues which
consist of the lack of leadership, political will and decisive decision making capability are not addressed as a matter of urgency,
the interface between executive and administrative functions within a municipality will continue to translate into financial
distress and service delivery failures.
133. In order to address the “culture of non-payment” it is imperative that the broader scope of remedial action required is
recognised and that all spheres of government are informed of their required contribution to the rehabilitation process.
134. Therefore, a multi-pronged approach that includes addressing operational inefficiencies, incompetence and governance
failures is required to ensure sound fiscal discipline in the longer term.
SUPPORT PROVIDED BY GOVERNMENT TO IMPROVE FINANCIAL MANAGEMENT
135. South Africa’s local government financial management system has undergone a number of reforms and there has been
considerable progress. However, there is still a long way to go before all 257 municipalities are fully functional and sustainable.
It is internationally acknowledged that South Africa has some exceptional financial management legislation and practices but
these must be institutionalized by all municipalities if overall performance objectives are to be achieved in local government.
136. The financial management reform agenda for local government is an evolutionary process and needs to be nurtured to
maturity. Government has initiated a number of capacity building initiatives to support municipalities in achieving this.
IMPLEMENTING MINIMUM COMPETENCY LEVELS
137. It has been ten years since the introduction of this reform aimed to build the financial management capacity of municipal
officials to implement the MFMA reforms and the other legislative framework impacting on LG finances. There has been a
positive acceptance by municipal officials, as per the table below, to embrace this reform as an enabler to achieving sound
financial management governance across the respective municipalities and municipal entities, where they exist.
138. The latest reform through the issuance of another MFMA Exemption Notice, Gazette 40593 of 03 February 2017, after extensive
consultations with the relevant stakeholders such as the TCF, LG MinMEC, Technical MinMEC to relax the fourth requirement
on FM and SCM competency levels and thus enable municipalities to attract officials coming from the private sector and other
spheres of government promises to inject a fresh approach to professionalism, ethics and ethos across municipalities if used
correctly.

54
THE STATE OF LOCAL GOVERNMENT FINANCES AND FINANCIAL MANAGEMENTAS AT 30 JUNE 2017
OTHER ISSUES IMPACTING ON THE FINANCIAL HEALTH OF A MUNICIPALITY
139. The issued exemption notice which is a precursor to the amended Municipal Regulations on Minimum Competency levels
once ratified by Parliament, allows the current officials employed before 03 February 2017 a further 18 months to comply with
the issued requirements for their positions. Furthermore, any new official appointed after the 03 February 2017, will have their
18 months to comply with the FM and SCM competency levels for their positions.
140. This also implies that the other requirements such as higher education qualifications for the position, work related
experience and performance agreement if needed, are not negotiable for the respective positions. The capacity building
chief directorate is monitoring the implementation of this exemption notice using the required municipal monthly
progress reports.
141. Municipal Councils as employers have been guided through this exemption notice on how to manage non-compliance
beyond the given timelines whilst following all the related labour relations provisions of the country, among others. It also
envisaged that the current graduate internship programme also funded primarily from the FMG allocation will continue to be
utilised by municipalities as a talent pipeline to mitigate current and future capacity needs within their Budget and Treasury
Offices. This necessitates that trained interns are retained within municipal BTO structures at appropriate levels to build the
needed capacity in a sustainable manner.
142. The current and future municipal fiscal landscape in the medium term, promises to remain sticky downward in the backdrop
of the latest economic downgrade to junk status by the rating agencies and the resultant retrenchments from the mining and
retail sectors, among others.
143. Table 16 below summarises the provincial patterns of enrolment in the Minimum Competency Levels programme across
the regulated positions, i.e. Municipal Managers, CFOs and CEOs of municipal entities where they exist, Senior Managers,
SCM managers and Middle Managers including other officials dealing with financial management (FM) and supply chain
management (SCM).

55
THE STATE OF LOCAL GOVERNMENT FINANCES AND FINANCIAL MANAGEMENTAS AT 30 JUNE 2017
OTHER ISSUES IMPACTING ON THE FINANCIAL HEALTH OF A MUNICIPALITY
Tabl
e 16
: M
inim
um c
ompe
tenc
y le
vels
am
ong
seni
or m
unic
ipal
offi
cial
s as
at 3
0 Ju
ne 2
017
Province
Number of Municipalities
Accounting Officers
Meet Minimum Competencies
Chief Financial Officers
Meet Minimum Competencies
Senior Managers
Meet Minimum Competencies
Head of Supply Chain Management unit
Meet Minimum Competencies
Supply Chain Management Managers
Meet Minimum Competencies
Middle Managers
Meet Minimum Competency
Other Officials with Statement of Results (SoR)
Total Officials with SOR:
EC
3939
1139
786
387
216
721
577
1601
1743
FS
2323
723
788
151
013
618
143
902
980
GT
1111
511
632
110
011
759
3510
2545
216
0322
08
KZN
54
5413
5415
139
417
238
1440
213
114
0216
18
LIM
27
275
271
6411
82
147
122
4112
9713
64
MP
2020
1020
410
826
53
179
183
9813
9315
43
NC
31
319
318
8619
74
112
119
3314
0314
78
NW
22
226
223
6916
40
135
194
6090
299
2
WC
30
3013
3012
8247
1810
4322
382
199
2010
2313
TOTA
L25
725
779
257
6310
4331
368
3022
410
728
2311
3412
513
1423
9

56
THE STATE OF LOCAL GOVERNMENT FINANCES AND FINANCIAL MANAGEMENTAS AT 30 JUNE 2017
144. A total of 14 239 officials received a Statement of Results as proof of compliance with Financial Management and Supply Chain
Management competency levels. This includes officials not immediately affected by the minimum competency levels such
as clerks and interns but who have undertaken the programme as part of their financial management responsibilities and to
enhance their career progression within their municipalities.
CAPACITY BUILDING GRANTS
145. In response to the scarcity of suitably skilled and experienced municipal finance staff, especially in rural areas, National Treasury
introduced the Financial Management Grant (FMG) in 2004. This funds are utilized for inter alia, the appointment of financial
management and accounting graduates as interns in municipalities. The interns are sourced from a pool of unemployed
regionally-based Accounting, Economics, Finance and Risk Management graduates who are appointed for 24 to 36 month
periods.
146. In 2016/17, R465 million in FMG funding was transferred to municipalities, against which the following expenditure was
reported:
• 38 per cent on the appointment of at least five interns per municipality
• 20 per cent on upgrading and maintenance of financial management systems
• 15 per cent on training municipal officials to attain minimum competencies
• 14 per cent on the preparation and timely submission of Annual Financial Statements.
OTHER ISSUES IMPACTING ON THE FINANCIAL HEALTH OF A MUNICIPALITY
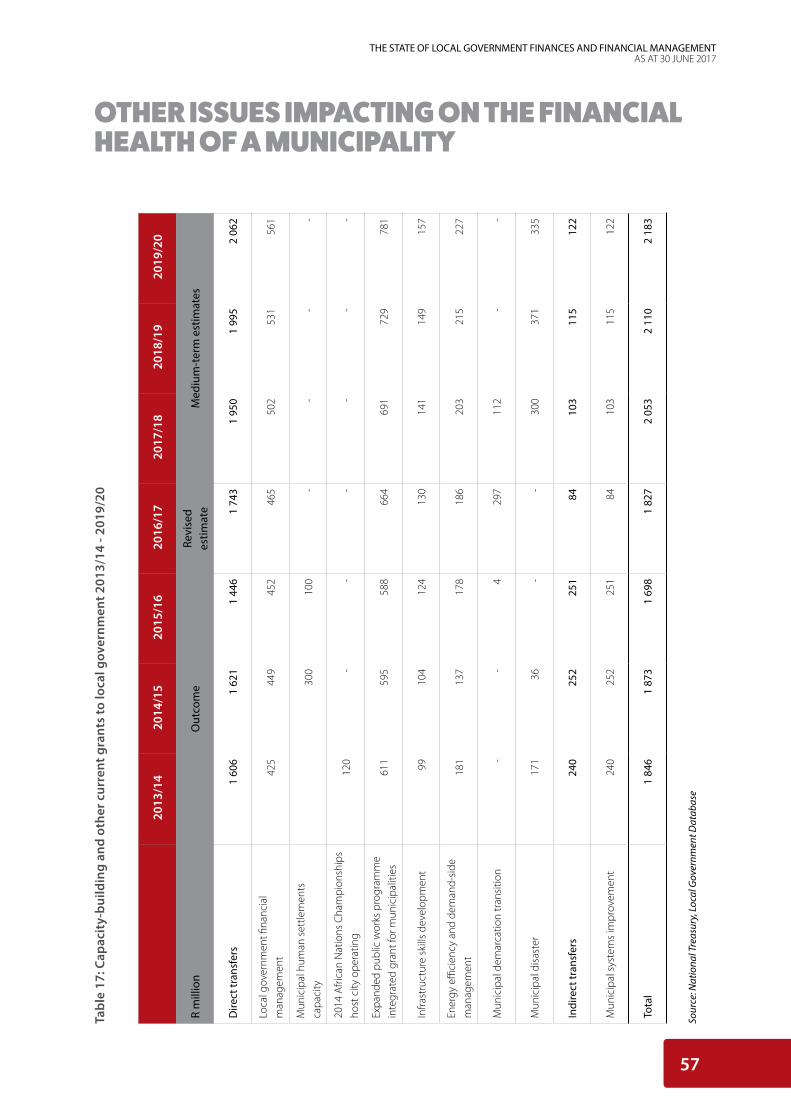
57
THE STATE OF LOCAL GOVERNMENT FINANCES AND FINANCIAL MANAGEMENTAS AT 30 JUNE 2017
OTHER ISSUES IMPACTING ON THE FINANCIAL HEALTH OF A MUNICIPALITY
Tabl
e 17
: Cap
acit
y-bu
ildin
g an
d ot
her c
urre
nt g
rant
s to
loca
l gov
ernm
ent 2
013/
14 -
2019
/20
201
3/14
2
014/
15
201
5/16
2
016/
17
201
7/18
2
018/
19
201
9/20
R m
illio
nO
utco
me
Revi
sed
estim
ate
Med
ium
-ter
m e
stim
ates
Dire
ct tr
ansf
ers
1 6
06
1 6
21
1 4
46
1 7
43
1 9
50
1 9
95
2 0
62
Loca
l gov
ernm
ent fi
nanc
ial
man
agem
ent
425
4
49
452
4
65
502
5
31
561
Mun
icip
al h
uman
set
tlem
ents
ca
paci
ty 3
00
100
-
--
-
2014
Afri
can
Nat
ions
Cha
mpi
onsh
ips
host
city
ope
ratin
g 1
20
--
--
--
Expa
nded
pub
lic w
orks
pro
gram
me
inte
grat
ed g
rant
for m
unic
ipal
ities
611
5
95
588
6
64
691
7
29
781
Infra
stru
ctur
e sk
ills
deve
lopm
ent
99
104
1
24
130
1
41
149
1
57
Ener
gy e
ffici
ency
and
dem
and-
side
m
anag
emen
t 1
81
137
1
78
186
2
03
215
2
27
Mun
icip
al d
emar
catio
n tr
ansi
tion
--
4
297
1
12
--
Mun
icip
al d
isas
ter
171
3
6 -
- 3
00
371
3
35
Indi
rect
tran
sfer
s 2
40
252
2
51
84
103
1
15
122
Mun
icip
al s
yste
ms
impr
ovem
ent
240
2
52
251
8
4 1
03
115
1
22
Tota
l 1
846
1
873
1
698
1
827
2
053
2
110
2
183
Sour
ce: N
atio
nal T
reas
ury,
Loca
l Gov
ernm
ent D
atab
ase
58
THE STATE OF LOCAL GOVERNMENT FINANCES AND FINANCIAL MANAGEMENTAS AT 30 JUNE 2017
OTHER ISSUES IMPACTING ON THE FINANCIAL HEALTH OF A MUNICIPALITY
147. Despite the amount of funding assigned to capacity building in municipalities to improve financial management (R7.2 billion
from 2013/14 to 2016/17 as shown in the table above), the audit outcomes of 160 municipalities in 2014/15 remained the
same as in 2015/16, with 8 municipalities progressing.
MUNICIPAL FINANCE IMPROVEMENT PROGRAMME
148. The main objectives of the MFIP are to facilitate improved municipal financial management capacity, enhanced budget and
financial management practices and improved outcomes through the provision of technical capacity support. Phase II of the
MFIP was a three-year support initiative that came to an end in March 2017 and was followed by a new phase (Phase III) which
commenced in April 2017 and will be implemented until the end of March 2020.
149. The MFIP is based on two specific intervention strategies that include:
• Direct capacity support to the National Treasury and Provincial Treasuries;
• Direct capacity support to identified municipalities through long-term advisors and short term specialists; and
150. In the 2016/17 financial year a total of 37 municipalities were supported through the placement of MFIP Technical Advisors
on a long-term basis. A further 8 advisors were based at the NT providing specialist support to municipalities and PTs in key
financial management disciplines and 7 advisors provided programme management services within the PMU.
151. In the case of the MFIP II support provided to PTs, the Budget Council Lekgotla resolved on 8 November 2014 that a
differentiated approach, based on the individual capacity of each PT, was required in order to strengthen PTs so that they are
better equipped to monitor and support their respective municipalities on financial management and budgeting issues.
152. As at 31 March 2017, four PT Advisors had been placed in the EC, GP, LP and NC. Support plans in these PTs were signed off
by the MECs for Finance and HODs of the respective provinces. The implementation commenced on 04 January 2016 and
concluded on 31 March 2017.
• With 1 July 2017 being the legislative compliance date for all 257 municipalities to comply with the mSCOA chart, eight
MFIP Advisors were appointed to to provide support to the 17 non-delegated municipalities and the following PTs EC,
FS, GT, LP, NC and NW.
153. As at 31 March 2017, a total of 80 per cent of technical activities in MFIP II supported municipalities had been completed, with
3 per cent in progress and 2 per cent not yet started, the remaining 14 per cent is either outsourced or not on the support
plans. MFIP II Support on Revenue Management was 82 per cent complete, Budgeting was at 84 per cent, Cash Management
was at 86 per cent, Asset Management, 72 per cent and Supply Chain Management had 79 per cent completion statuses.
154. A total of 7 378 training sessions were completed, with 1 063 officials trained for the duration of the MFIP II programme. In the
year under review, municipalities received a total of 3 937 training sessions from Advisors located in the various municipalities,
compared to 2 553 sessions in the previous year. The increase in the number of training sessions and number of officials
trained is mainly due to the increase in the number of municipalities supported during 2016/17.
155. Further to the direct Advisor support at municipalities regarding Asset Management, the PSC approved an Integrated
Infrastructure and Asset Management System Project to be piloted in 10 municipalities identified by the respective PTs.
Following the required procurement processes, 3 service providers were appointed during March 2015 to assist 9 municipalities
with the following required deliverables:
Integrated Infrastructure and Asset Management system that provides the following outputs:
• Fully satisfy the requirements regarding asset management as stipulated in the MFMA
• Comply with the prevailing GRAP 17 and any accounting standard(s) issued

59
THE STATE OF LOCAL GOVERNMENT FINANCES AND FINANCIAL MANAGEMENTAS AT 30 JUNE 2017
OTHER ISSUES IMPACTING ON THE FINANCIAL HEALTH OF A MUNICIPALITY
• Comply with the Standard Chart of Accounts (mSCOA) requirements as per Government Gazette 37577 dated 22 April
2014
• Provide reporting capabilities on all lifecycle aspects of Assets in order to support financial, operational and planning
Managers in line with the Local Government Systems Act and appropriate sector guidelines
• Update the scope of assets to include all immovable and moveable assets.
156. The Asset Management Project was officially concluded on 31 January 2017. 24 Municipalities were supported through
three appointed service providers. The audit reports indicate issues in certain municipalities which continue to contribute to
qualified audit opinions. 14 municipalities under the MFIP II Support were unqualified in respect of assets while another 10
only had issues contributing to qualifications on matters such as valuations and insufficient supporting documentation for
the audit which were out of scope of the MFIP II Support Program attention.
157. The August 2016, TCF resolved that the current phase III of the MFIP must be restructured and further strengthened and
aligned to the six adopted local government financial management game changers, namely funded budgets, revenue
management, mSCOA, asset management, supply chain management and audit outcomes. This resulted in significant shifts
in the operating modalities of the programme compared to previous phases whereby all technical advisory support deployed
to NT, PTs and Municipalities aims to bolster the implementation of the game changers in order to facilitate sustainable
improvements in the management of municipal financial affairs.
158. In this regard the bulk of the support provided under MFIP III will be targeted at the municipal finance units of PTs to further
enhance their institutional and technical capacity to better monitor, support and oversee the financial management affairs of
delegated municipalities in line with their approved province specific strategies.
STANDARD CHART OF ACCOUNTS FOR MUNICIPALITIES (mSCOA)
159. The Minister of Finance approved publication of the Municipal Regulation on a Standard Chart of Accounts (Notice No. 37577)
on 22 April 2014.
160. This has been by far the biggest reform in the history of Local Government. It is not only a financial classification system or
standard at a transactional level across all 257 municipalities, but also a business reform that affects every part of the operations
of a municipality. The Regulation provided for a three-year preparation and readiness window and all 257 municipalities had
to be compliant to the mSCOA classification framework by 1 July 2017.
161. Twenty-six municipalities (including three metros) across ten system platforms piloted mSCOA, of which 20 were able to go live
early on 1 July 2015. During the piloting process, which officially concluded on 5 December 2015, a total of 32 municipalities
(including official pilots and voluntary early adopters) received continued support from the ‘piloting work stream’, resulting in
an additional seven municipalities going live on 01 July 2016. The final mSCOA Version (6.1) for implementation by 1 July 2017,
was released on 7 December 2016 after extensive consultation with relevant stakeholders.
162. Seven system vendors with mSCOA enabling software solutions were appointed on a transversal panel for a period of three
years (August 2016 to July 2019). The purpose of the transversal tender is to support municipalities with limited skills to draft
and evaluate a technical specification, and to reduce the time spent on onerous tender processes and price negotiations,
should a municipality decide to change its current financial system to comply with mSCOA.
60
THE STATE OF LOCAL GOVERNMENT FINANCES AND FINANCIAL MANAGEMENTAS AT 30 JUNE 2017
163. Technical guidance was provided to municipalities in the form of Circulars (mSCOA Circulars No. 1 to 6 provided guidance
on mSCOA implementation, while MFMA Circular No. 80 and its addendum set out the proposed minimum ICT and business
process functionality to enable transacting against mSCOA with effect 1 July 2017 and technical support.
164. Stakeholder management, empowerment and communication took place to ensure a common understanding of the project
objectives (change management, training and technical guidance) and milestones to be achieved, including:
• Attending and presenting at the Provincial Municipal Manager and Chief Financial Officer’s Forums
• Incorporating the Provincial Treasuries into the National mSCOA Integrated Consultative Forum (ICF)
• Presentations and engagements at the CIGFARO (IMFO) Conferences in Gauteng (11th to 12th July 2016) and Durban
(2nd to 6th October 2016) and a mSCOA Workshop on the 22nd to 23rd September 2016 in Pretoria
• Ongoing engagements with all system vendors, including facilitating vendor discussion forums on 3 to 6 June 2014, 24
November 2014 and 30 to 31 January 2016.
165. The mSCOA Frequently Asked Questions (FAQ) Database was established to address queries. A total of 3 935 queries have
been resolved to date, of which 3 628 were received and processed in the lead up to the final chart release in November 2016.
166. Development, roll-out and facilitation of non-accredited mSCOA training to a total of 5 821 officials from all three spheres of
government and other relevant stakeholders across the affected environment.
167. During the period 01 April to 30 June 2017, the national and provincial treasuries, with the support of three mSCOA advisors,
pursued the submission of the data strings and correction of the segment and trial balance errors. Extensive engagements
were also held with system vendors to ensure that all system errors are resolved timeously.
168. On 02 July 2017, 99 per cent of municipalities had successfully uploaded their tabled MTREF budget data strings (TABB) and
98 per cent their adopted MTREF budget data strings (ORGB) for 2017/18. Also, 96 per cent of municipalities submitted their
adopted budget data strings without any segment test or trial balance errors.
CITIES SUPPORT PROGRAMME (CSP)
169. The Cities Support Programme works with metropolitan municipalities, national departments, provincial governments and
other stakeholders to facilitate faster and more inclusive urban economic growth. Effective urban governance is a key pre-
requisite for building more productive, inclusive and sustainable cities. In particular, effective urban planning is essential to
restructuring the spatial form of cities over time to capture the agglomeration benefits of urbanisation.
170. The CSP has coordinated the introduction of Built Environment Performance Plans (BEPPs) in metropolitan municipalities.
The focus of the BEPPs has progressed over the last three years from spatial planning, to the identification of Integration
Zones and catalytic projects, to alignment with the budgeting process and urban management practices. All 8 metropolitan
municipalities submitted their final, council approved BEPPs on time, indicative of the buy in and support from the metro’s.
The 2016/17 BEPPs focussed on progress with the establishment and measurement of built environment outcome indicators,
the alignment of plans, the preparation of catalytic investment programmes and projects within the Urban Network Strategy.
171. At a high level the 2016/17 BEPP processes highlighted the progress in adopting a spatial planning approach and identifying
the Integration Zones by cities, the challenges in trying to take the leap from the old focus on outputs to now beginning to
focus on outcomes, the lack of a clearly identified a pipeline of catalytic projects within Integration Zones and weaknesses in
identifying support needs in relation to programme preparation and implementation requirements outlined in the BEPPs.
OTHER ISSUES IMPACTING ON THE FINANCIAL HEALTH OF A MUNICIPALITY
61
THE STATE OF LOCAL GOVERNMENT FINANCES AND FINANCIAL MANAGEMENTAS AT 30 JUNE 2017
OTHER ISSUES IMPACTING ON THE FINANCIAL HEALTH OF A MUNICIPALITY
172. As part of the Governance Component, the CIDMS (Cities Infrastructure Delivery Management System) toolkit was developed
and finalised in the reporting period to support cities to identify the need for infrastructure over multiple planning horizons,
to evaluate the merits of infrastructure investment proposals, to support procurement and delivery of infrastructure, and to
undertake the above in a sustainable integrated infrastructure asset management framework.
173. The CIDMS Toolkit presents cities with a customized system incorporating best practice processes, techniques and tools for
optimizing performance right across the urban infrastructure value chain while responding to the long term strategies of
cities (i.e., spatial transformation strategies). The scope of the CIDMS Toolkit clearly extends beyond infrastructure delivery. It
encompasses the full ambit of infrastructure management as appropriate to a public sector asset-intense organization that
must remain financially viable and achieve equitable outcomes for society.
174. The implementation of the CIDMS toolkit will be rolled out in 2017/18. It will initially be piloted in 3 metros (eThekwini, Cape
Town and Johannesburg) and full implementation to all metros in the subsequent financial years.
175. The benchmark Sub-National Doing Business survey – Doing Business SA 2015 – was launched in 12 June 2015. In 2016/17, a
new round of engagements with city governments was initiated, aimed at seeking continuous improvements in city processes
and performance. Cities prepared a Doing Business Reform Action Plans that identified key interventions to improve their
Doing Business score in the 3 indicators that are within the city government sphere of management – that is, dealing with
Construction Permits, Getting Electricity and Registering Property. The reform plans were submitted to National Treasury and
progress on the plans are reported at the City Budget Forum meetings.
176. The CSP provided support to cities in long term planning for their public transport networks, in creating credible full network
plans for their areas. This included hosting a series of technical workshops on integrated transport network planning. A peer
review mechanism with local and international experts was established to test for various aspects of the city plans.
177. The project addressing the BRT operations, provided support to the City of Johannesburg and Tshwane in diagnosing and
follow up action to moderate costs and enhance revenues for their BRT systems. The lessons learnt from this work were shared
through a series of technical workshops on bus operations, Intelligent Transport systems and Station Management.
178. The ELP (Executive Leadership Programme) is an annual CSP event. The 2017 ELP was hosted in partnership with the Gordon
Institute of Business (GIBS) and was run as a 5-day executive leadership programme for the senior political and administrative
leaders of the 8 metros.
179. The theme was Accelerating City Transformation for Inclusion, Growth and Sustainability. The course was designed to (i)
provide a concise overview of urban development challenges and opportunities in SA cities; (ii) consider and develop
strategies for intervention to support inclusive growth; (iii) develop the leadership teams with the agency to implement these
strategies.
180. In October 2016 ‘Municipal Money’ (https://municipalmoney.gov.za/ ) was launched. The National Treasury’s Local Government
Budget Analysis Unit, the Cities Support Programme and the Economies of Regions Learning Network, have worked together
to develop ‘Municipal Money”, an open local government budget data portal which provides citizens and other stakeholders
with access to comparable, verified information on the financial performance of each municipality. Municipal Money aims to
promote transparency and citizen engagement through the visualization and ‘demystification’ of information about municipal
spending.
181. The creation of this portal is in line with international best practice, where governments are increasingly opening up their data,
specifically budget and expenditure data, to the public - to promote oversight, transparency and accountability. Municipal
Money is a user-friendly website that utilises a variety of media and tools to present key municipal financial information, and
also to explain the related financial concepts and their relevance to citizens.

62
THE STATE OF LOCAL GOVERNMENT FINANCES AND FINANCIAL MANAGEMENTAS AT 30 JUNE 2017
OTHER ISSUES IMPACTING ON THE FINANCIAL HEALTH OF A MUNICIPALITY
182. There are also two key housing projects that are implemented being the understanding of Residential Property markets and
a Programme Management Toolkit for scaling up formalisation and upgrading of informal settlements. The tool has been
developed and applied in three metros (eThekwini, Cape Town and Mangaung) to help them generate and analyse data that
will assist them to understand the dynamics and trends (performance, size and transactions) in the residential markets in
their cities. This project is aimed at making cities to better plan for improving and stabilising residential property markets in a
holistic matter, thus contributing amongst others in improving delivery of affordable housing and revenue collection.
183. The CSP has also partnered with the National Department of Human Settlements / National Upgrading Support Programme
(NUSP) to develop a Programme Management Toolkit for scaling up participatory and city wide incremental upgrading of
informal settlements. The toolkit is near completion and has been workshopped with all metros.
THE BACK TO BASICS (B2B) APPROACH
184. The first phase of the B2B focused on laying the foundation for a developmental local government by doing the basics right.
This means that the pillars of the first phase of Back to Basics will now become the foundation on which we need to build
further.
185. The second phase of B2B is conceptually predicated on the theme “Managing Municipal Spaces for Radical Social and
Economic Transformation”. The second phase requires a government-wide paradigm shift in perceptions of the role of
Local Government, and will require a reorientation of the approach to implementation of the B2B Programme. However,
municipalities that are not achieving the basics yet, will still need to first concentrate on getting the foundational pillars right
in order to stabilise such municipalities.
186. The B2B ten-point has been updated and tightened after the inputs of the Third Presidential Local Government Summit to
reflect the five pillars as foundational areas and the focus areas of Spatial and Integrated Development Planning, LED, Disaster
Risk Planning and the Strengthening of the IGR.
187. By the end of the 2016/17 financial year, 95 per cent of ward committees were established. The average rate of ward
committee meetings in the 2016/17 year per municipality, was 7, 2 meetings per month, which was lower than in 2015/16
(12, 5 meetings). It must however be remembered that ward committees first had to be established after the 3 August 2016
local government elections, with the result that the average rate of meetings per month would be lower in 2016/17.
188. In terms of the Municipal Structures Act, 117 of 1998, Section 18(2), a municipal council must meet at least quarterly. The
national average was indicative of a trend towards monthly council meetings with an average of 0.83 meetings per month in
2016/17 rather than having meetings only once per quarter4. Reporting by municipalities in the Western Cape had averages
of more than one meeting per month in 2016/17, namely 1.09 followed by Mpumalanga (0,96) and Limpopo (0,93). The
lowest averages of meetings per month in 2016/17 were reported by municipalities in North West, 0.57, Eastern Cape, 0.64
and Free State, 0,73.
189. The expectations of communities that remain unfulfilled with regard to quality service delivery is evidenced in increasing
service delivery protests. In this regard Municipal IQ reported early in October that major service delivery protests, are likely
to eclipse all other tallies by the end of 2017, other than perhaps 2012 and 2015.
4 This overall average as reported by municipalities was a bit higher previously with an average of 1 meeting per month in 2014/15 and 0,9 in 2015/16.4 Calculated by dividing the total number of water stoppages reported in 2016/17 by the number of responses/templates provided.
63
THE STATE OF LOCAL GOVERNMENT FINANCES AND FINANCIAL MANAGEMENTAS AT 30 JUNE 2017
OTHER ISSUES IMPACTING ON THE FINANCIAL HEALTH OF A MUNICIPALITY
190. Analysis indicates that the increase in service delivery protests occurred irrespective of the public participatory type meetings
(such as ward committee meetings) held as prescribed or expected. One must therefore be cautious to assume that it is
merely as a result of the public participation mechanisms not being effective or functional enough, that service delivery
protests have been increasing. The phenomenon of protests is complex, with many cases, of which the effectiveness of public
participation mechanisms is but one. The highest average number of water service interruptions per month5 was reported by
Gauteng municipalities, followed by Western Cape and Limpopo.
A COORDINATED APPROACH TO MUNICIPAL SUPPORT
191. A collective programmatic effort is needed to enhance treasuries to drive their core mandates as well as provide leadership to
coordinate with other stakeholders such as DCoG and SALGA to address the failures encountered at the municipalities.
192. It is therefore essential to align the province specific strategy to that of the “Game Changers” as decided by Budget Council and
alluded to by the Minister of Finance in the budget speech of 2017.
193. The National and provincial treasuries have agreed to focus on “Game Changers” in their efforts to improve the capacity and
financial performance of municipalities, and these are:
• A new Municipal Standard Chart of Accounts (mSCOA) will be implemented across all 257 municipalities from 1 July
2017. This is a major reform seeks to improve integration between the municipality’s IDP and the budget and standardise
financial reporting and annual performance plans against pre-determined service delivery targets as articulated in the
SDBIP
• An improved supply chain management system to reduce irregular expenditure and generate significant savings, led by
the OCPO
• An improved revenue management framework for municipalities that targets improving the internal controls, cash flow
management and operational efficiencies in municipalities and reduce unnecessary and wasteful expenditure
• Improved asset management for continuous delivery of services and to generate associated revenue
• Ensure that budgets adopted by the municipal councils are funded
• Support to address audit outcomes, especially those related to adverse and disclaimers;
• Support in implementing consequence management in municipalities by training and advising on municipal processes
and oversight structures.
194. It is imperative that the provincial treasuries strengthen their monitoring and oversight of municipal finances in terms of the
“early warning” reporting so that the incidence of financial crisis or distress is minimized. This requires proactive efforts and
preventative measures within a coordinated framework as shown below:

64
THE STATE OF LOCAL GOVERNMENT FINANCES AND FINANCIAL MANAGEMENTAS AT 30 JUNE 2017
OTHER ISSUES IMPACTING ON THE FINANCIAL HEALTH OF A MUNICIPALITY
PROPOSED RESPONSE TO ADDRESS THE CULTURE OF NON-PAYMENT
FOCUS ON MUNICIPALITIES WITH DIRE LIQUIDITY CHALLENGES
SUPPORT OF SALGA
OVERSIGHT AND MONITORING - PARLIAMENT SCOPA, IMC(E), SeCOA
Immediate next 6 Months
Support - MISA, MSIG
6 to 12 Months
NT/PT• MFCA• TCF• Lekgotla
resolution
CoGTA• MSA
Game Changers• Funded Budgets
• Robust assessment of the 2017/18 budget
• Adequate surpluses - guide affordable payment arrangements reduced expenditure
• Revenue Management• Asset Management
• Government debt• Turnaround plan
• Back to basics - governance - no acting MMs and CFOs - instability
• Ensure effective functioning of councils• Ensure debt collection and credit control
policies are structured in the best interest of the minicipality
• Review of indigent policy• Governement debt
Aligned to the provincial specific strategy
Supoprt from MFIP
• Possibility of invoking S139 of the Constitution
• Financial recovery plans
If necessary invoking of S216 for failure to adhere to short term initiatives or S139 of the MFMA
Finalisation of the MoU
Eliminate “GREY” areas in the two MFMA and MSA that are confusing roles and responsibilities and to avoid duplications

65
THE STATE OF LOCAL GOVERNMENT FINANCES AND FINANCIAL MANAGEMENTAS AT 30 JUNE 2017
OTHER ISSUES IMPACTING ON THE FINANCIAL HEALTH OF A MUNICIPALITY
SHORT TERM MEASURES
195. Initial focus on the top creditors (per the s71 report) which includes in all probability Eskom and water boards debt but is
limited to those municipalities with liquidity challenges. This means each province will identify municipalities in financial crisis
to prioritise for support.
196. Provincial treasuries, in collaboration with the National Treasury, should undertake a robust budget assessment of the adjusted
2017/18 and tabled and adopted 2018/19 budgets for prioritised municipalities to ensure that:
• The budgets are funded
• That the budget includes adequate provision for realistic payment arrangements entered into with any creditors, in this way
the municipality will be in a better position to structure affordable payment arrangement that will be honoured.
197. This must be a pre-requisite before the budget is adopted by the respective Councils:
• National Treasury will facilitate discussions with the government departments that owe these municipalities so that settlement
can be linked to DPW debt verification process
• It is proposed that a committee comprising National Treasury and the relevant provincial treasuries (including other relevant
stake holders) will be constituted for each province to support these municipalities to implement financial turnaround
strategies (action plan) until there is measurable cash flow improvement. The current debt forums in the province may
provide a platform for monitoring
• This initiative should be formalised by its inclusion in updated and prioritised provincial specific municipal support strategies
of the provincial treasuries
• To ensure success of this approach resilient monitoring and oversight of the 2017/18 budget implementation by provincial
treasuries will be required
• National Treasury will work jointly with Provincial Treasury to implement other initiatives to assist municipalities to address
weaknesses in specific financial management discipline including budgets and revenue management. This will include
engaging with other stakeholders such as DCoG to address matters of governance, service delivery, institutional and human
resources challenges that are eminent in these municipalities
• National Treasury emphasises the need to improve revenue and to reduce expenditure not aligned to core services through
an introduction of an action plan that will culminate into a holistic financial recovery plan in the longer term.
MEDIUM TERM MEASURES
198. In cases of failure of the municipality to honour this arrangement National Treasury will support PT to enforce financial recovery
measures in terms of chapter 13 of the MFMA by invoking section 216(2) of the Constitution against any defaulting municipality
for consistently failing to honour its credit obligations thereby undermining the measures prescribed in section 215(1) of the
Constitution. Alternatively, provinces can also choose to invoke section 139 of the MFMA in the failing municipalities.
199. In addition, invoking section 216(2) will also send a strong message to defaulting municipalities that maladministration,
financial mismanagement, corruption and fraud will not be condoned at the expense of service delivery.

66
THE STATE OF LOCAL GOVERNMENT FINANCES AND FINANCIAL MANAGEMENTAS AT 30 JUNE 2017
OTHER ISSUES IMPACTING ON THE FINANCIAL HEALTH OF A MUNICIPALITY
LONG TERM MEASURE
200. Since there are existing areas in the MFMA and MSA that are not clear and these areas pose confusion on the roles and
responsibilities and duplication of effort in certain instance during the implementation of the Acts, National Treasury and
DCoG must endeavour to resolve these differences for a more conducive operational environment.
201. An opportunity to bring alignment by clarifying roles, responsibilities and accountability and enabling these changes into
legislation will require ongoing engagements at provincial and national department level as well as legislature levels. The
strengthening of collaboration, coordination and sharing of information between the departments will form a basis to which
the above changes can be practically implemented. Such forums and engagements must be regularized to ensure coherent
actions.
202. The financial recovery services of National Treasury will participate to prepare a recovery plan that incorporates the action plan
for finance mentioned above.
203. Reports will be prepared and presented to Parliament and Legislatures by National Treasury and Provincial Treasuries, such
reports will be enhanced with measures that will be included arising from the alignment and amendment of the MFMA and
MSA.
204. Provinces and National Treasury will report to the SeCOA on progress on a quarterly basis and when required.
67
THE STATE OF LOCAL GOVERNMENT FINANCES AND FINANCIAL MANAGEMENTAS AT 30 JUNE 2017
CONCLUDING REMARKS
205. The State of Local Government and Financial Management Reports comprehensively discusses the financial health of all
257 of the country’s municipalities. Annexure A1 lists the municipalities in financial distress in 2016/17 (128). Annexure A2
provides a consolidated analysis of the 257 municipalities’ audit outcomes, capital budget performance, current interventions,
vacancies in key positions, those identified as financially distressed and trends for the 2016/17 financial year. Annexure B
provides the consolidated assessment results for the metros as at 30 June 2017.
206. Municipalities in financial distress are characterised by poor cash flow management and an increase in outstanding
debtors and creditors. This assessment is based on the following financial health indicators:
• 64 municipalities had negative cash balances at 30 June 2017. Throughout the 2016/17 financial year, none of the
metropolitan municipalities (metros) recorded negative cash balances. This is a strong indication that, in general, they
have a solid cash base and comply with cash flow management procedures.
• At an aggregate level, 74 (68 in 2015/2016) municipalities in 2016/17 (28.8 per cent) recorded cash coverage exceeding
three months of operational expenditure, which is within the acceptable norm. Of concern is the fact that the number
of municipalities with cash coverage of less than one month of operational expenditure increased from 116 in 2015/16
to 137 in 2016/17.
• The total number of municipalities that overspent on their operational budgets decreased from 163 in 2015/16 to 33 in
2016/17.
• The total number of municipalities that have underspent on their capital budget by more than 30 per cent increased
from 90 in 2015/16 to 122 in 2016/17.
• At the end of the fourth quarter of 2016/17 (as per the Section 71 results), total debtors amounted to R128.5 billion, a
R14.9 billion increase from the 2015/16 financial year. Total creditors amounted to R43.8 billion, a R4.9 billion increase
from the 2015/16 financial year.
• Local Municipalities only had R8.7 billion cash available to repay outstanding creditors of R13.7 billion, leaving a deficit
of R5 billion to honour financial commitments. The situation is the same for the secondary cities where total creditors
in 2016/17 amounted to R9.6 billion while available cash was R4.7 billion; creditors were thus owed 104 per cent of the
available cash.
• There is a decrease in the reliance on conditional grants in municipalities where revenue is financed by national transfers
of 75 per cent and more, from 125 in 2015/16 to 100 in the 2016/17 financial year.
• In 2016/17, 17 district municipalities were identified as financially distressed, an increase from the 16 of the previous year.
It is cause for concern that district municipalities are financially distressed, given the role they have to play in empowering
and capacitating local municipalities.
207. The Auditor-General (AG) has highlighted the fact that the municipal audit outcomes have shown little improvement. The
audit outcomes of municipalities in the Eastern Cape, Limpopo and Mpumalanga showed momentum in the right direction,
with the Eastern Cape showing the greatest improvement. The Western Cape continued to set the pace by increasing their
clean unqualified audit opinions without emphasis of matters to 80 per cent of their municipalities. The on-going instability in
senior municipal management positions has a negative impact on both audit outcomes and service delivery to communities.
The number of acting Municipal Managers (104) and acting Chief Financial officers (88) represents a total increase in both
acting positions from 18 to 20 per cent.
208. Overall, municipalities are not sufficiently prioritising expenditure on asset management. National aggregate spending
on repairs and maintenance as a percentage of property, plant and equipment averages 3.4 per cent while the norm is 8 per
cent. On 30 June 2016, metropolitan municipalities recorded water and electricity losses amounting to R2.8 billion and R7.2
billion respectively. During the 2015/16 financial year, water losses decreased significantly, by R1.1 billion. Water losses are
affected by the level of municipalities’ spending on repairs and maintenance. Electricity losses increased significantly with
R1.7 billion, from R5.5 billion in 2014/15 to R7.2 billion in 2015/16.

68
THE STATE OF LOCAL GOVERNMENT FINANCES AND FINANCIAL MANAGEMENTAS AT 30 JUNE 2017
209. To address capacity challenges, government has channelled very substantial funding towards capacity building
initiatives. In the 2016/17 financial year, in terms of DoRA R49.1 billion was allocated in the form of direct and indirect grants
to local government of which municipalities spent R35.8 billion or 72.8 per cent. Selected activities have included:
• A total of 7 378 training sessions were completed, with 1 063 officials trained for the duration of the Municipal Finance
Improvement Program (MFIP II) programme. In the year under review, municipalities received a total of 3 937 training
sessions from Advisors located in the various municipalities, compared to 2 553 sessions in the previous year.
• It has been ten years since the introduction of the implementation of the minimum competency level reform aimed to
build the financial management capacity of municipal officials to implement the MFMA reforms and the other legislative
framework impacting on LG finances. A total of 14 239 officials received a Statement of Results as proof of compliance
with Financial Management and Supply Chain Management competency levels.
• With the implementation of mSCOA, on 02 July 2017, 99 per cent of municipalities had successfully uploaded their tabled
MTREF budget data strings (TABB) and 98 per cent their adopted MTREF budget data strings (ORGB) for 2017/18. Also, 96
per cent of municipalities submitted their adopted budget data strings without any segment test or trial balance errors.
• In October 2016 ‘Municipal Money’ (https://municipalmoney.gov.za/ ) was launched. The National Treasury’s Local
Government Budget Analysis Unit, the Cities Support Programme and the Economies of Regions Learning Network,
have worked together to develop ‘Municipal Money”, an open local government budget data portal which provides
citizens and other stakeholders with access to comparable, verified information on the financial performance of each
municipality. Municipal Money aims to promote transparency and citizen engagement through the visualization and
‘demystification’ of information about municipal spending.
• A Cities Infrastructure Delivery and Management System (CIDMS) toolkit has been developed and finalised in the
reporting period to support cities to identify the need for infrastructure over multiple planning horizons, to evaluate the
merits of infrastructure investment proposals, to support procurement and delivery of infrastructure, and to undertake
the above in a sustainable integrated infrastructure asset management framework.
210. The adoption of the Integrated Urban Development Framework (IUDF) has led to greater coordination and focussing of
support to different categories of municipalities, in order to enable them to respond more effectively to their development
challenges and align their performance with our national development goals.
• the Cities Support Programme (CSP), which is coordinated by the National Treasury, is working closely with our
metropolitan municipalities in IUDF implementation. The CSP has a number of key capacity building activities underway
for metropolitan municipalities in areas of governance, human settlements, urban public transport, climate resilience and
economic development. This includes initiatives such as analytical reviews of residential property markets, and toolkits to
scale up upgrading of informal settlements.
• The Department of Cooperative Governance (DCoG) has begun to rollout out a complementary programme for
Intermediate Cities, while the design of a small towns programme is being finalised in consultation with the SA Local
Government Association. These programmes strongly complement the systemic support and reform programmes such
as Back to Basics (B2B) and Municipal Financial Management reforms.
211. The National and provincial treasuries have agreed to focus on “Game Changers” in their efforts to improve the capacity
and financial performance of municipalities. National Treasury and Department of Cooperative Governance (DCoG) are
collaborating to prioritise municipalities that are in financial distress and failing to deliver services for support and intervention
to restore them to sustainability, working in collaboration with provinces.
CONCLUDING REMARKS

69
THE STATE OF LOCAL GOVERNMENT FINANCES AND FINANCIAL MANAGEMENTAS AT 30 JUNE 2017
212. The Minister of Finance, in his October 2017 Medium Term Budget Policy Statement (MTBPS), announced the introduction
of a funding mechanism to support the recovery plans for municipalities that face a financial crisis, as provided for in
section 139(5) of The Constitution. The DoRA published in February 2018 provides a brief background to the proposed
funding mechanism namely, the Municipal Restructuring Grant (MRG). The purpose of this grant, as described in the DoRA,
is “to be a short term intervention that will fund the turnaround of struggling municipalities”. This will provide some financial
relief to municipalities that require financial support to improve their current situation. It is important to note that this grant
allocation is not intended to fund the complete financial recovery plan but rather to contribute to the implementation of
corrective action that demonstrates sufficient alignment to NT’s “game changers”.
213. It is envisaged that municipalities will utilise the information in this report for their benefit and will seek ways of mitigating
financial risk.
CONCLUDING REMARKS
70
THE STATE OF LOCAL GOVERNMENT FINANCES AND FINANCIAL MANAGEMENTAS AT 30 JUNE 2017
ANNEXURE A1
Municipalities in financial distress as at 30 June 2017 (municipalities identified as being in financial distress are highlighted)
1. Good
2. Fair
3. Poor
≥16 - a municipality shows signs of distress (receiving a score of 3 in more than 4 of the 8 indicators listed in the tables below).
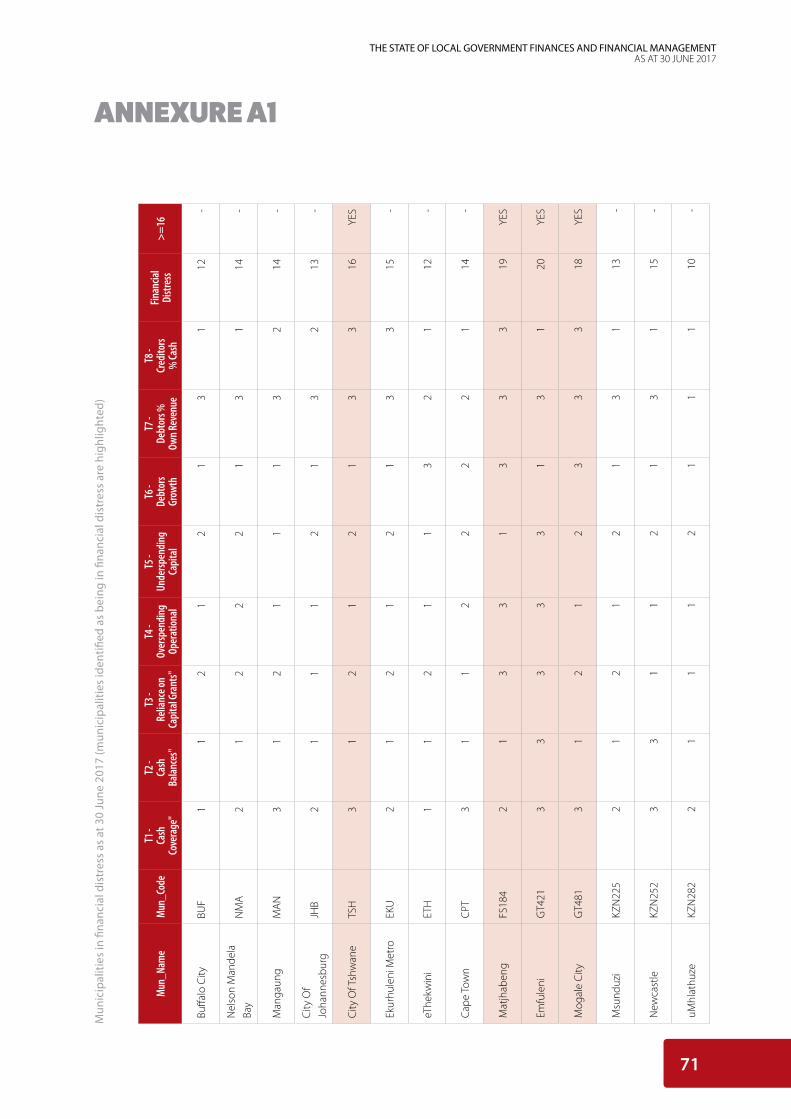
71
THE STATE OF LOCAL GOVERNMENT FINANCES AND FINANCIAL MANAGEMENTAS AT 30 JUNE 2017
ANNEXURE A1
Mun
_Nam
eM
un_C
ode
T1 -
Cash
Co
vera
ge"
T2 -
Cash
Ba
lance
s"
T3 -
Relia
nce o
n Ca
pita
l Gra
nts"
T4 -
Over
spen
ding
Op
erat
ional
T5 -
Unde
rspen
ding
Ca
pita
l
T6 -
Debt
ors
Grow
th
T7 -
Debt
ors %
Ow
n Rev
enue
T8 -
Cred
itors
% Ca
sh
Finan
cial
Distr
ess
>=16
Buffa
lo C
ityBU
F1
12
12
13
112
-
Nel
son
Man
dela
Ba
yN
MA
21
22
21
31
14-
Man
gaun
gM
AN
31
21
11
32
14-
City
Of
Joha
nnes
burg
JHB
21
11
21
32
13-
City
Of T
shw
ane
TSH
31
21
21
33
16YE
S
Ekur
hule
ni M
etro
EKU
21
21
21
33
15-
eThe
kwin
iET
H1
12
11
32
112
-
Cape
Tow
nC
PT3
11
22
22
114
-
Mat
jhab
eng
FS18
42
13
31
33
319
YES
Emfu
leni
GT4
213
33
33
13
120
YES
Mog
ale
City
GT4
813
12
12
33
318
YES
Msu
nduz
iKZ
N22
52
12
12
13
113
-
New
cast
leKZ
N25
23
31
12
13
115
-
uMhl
athu
zeKZ
N28
22
11
12
11
110
-
Mun
icip
aliti
es in
fina
ncia
l dis
tres
s as
at 3
0 Ju
ne 2
017
(mun
icip
aliti
es id
entifi
ed a
s be
ing
in fi
nanc
ial d
istr
ess
are
high
light
ed)
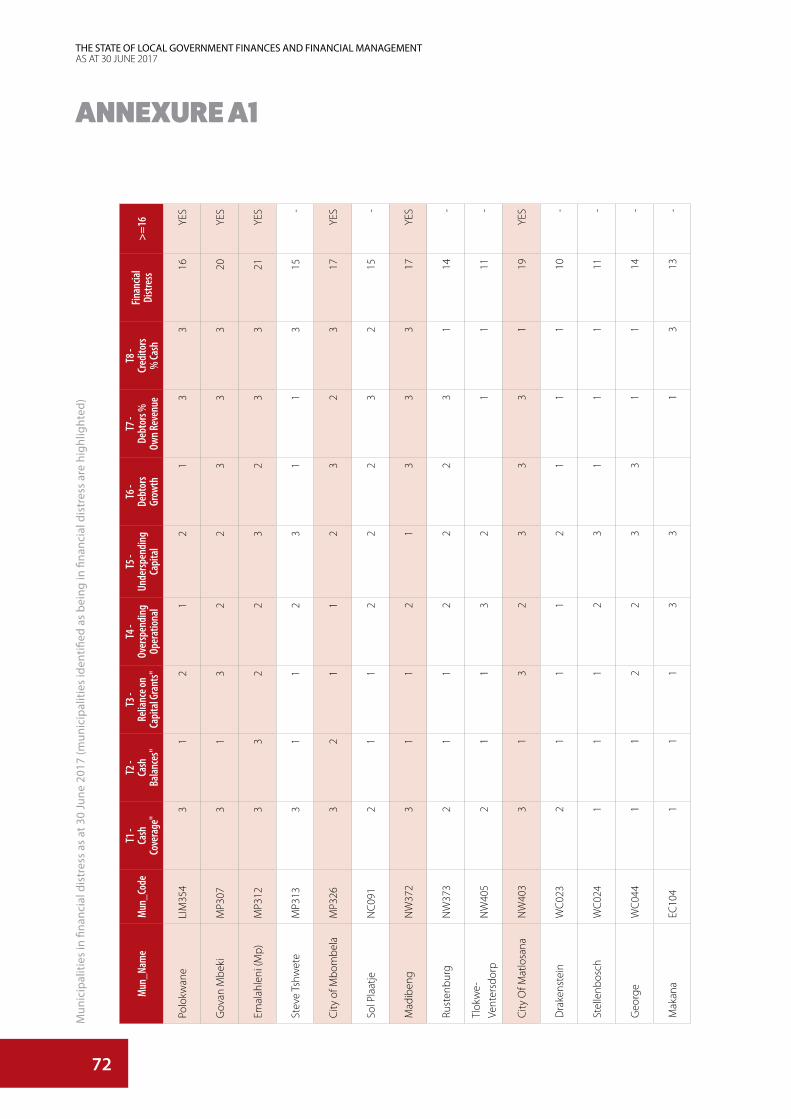
72
THE STATE OF LOCAL GOVERNMENT FINANCES AND FINANCIAL MANAGEMENTAS AT 30 JUNE 2017
ANNEXURE A1M
un_N
ame
Mun
_Cod
eT1
- Ca
sh
Cove
rage
"
T2 -
Cash
Ba
lance
s"
T3 -
Relia
nce o
n Ca
pita
l Gra
nts"
T4 -
Over
spen
ding
Op
erat
ional
T5 -
Unde
rspen
ding
Ca
pita
l
T6 -
Debt
ors
Grow
th
T7 -
Debt
ors %
Ow
n Rev
enue
T8 -
Cred
itors
% Ca
sh
Finan
cial
Distr
ess
>=16
Polo
kwan
eLI
M35
43
12
12
13
316
YES
Gov
an M
beki
MP3
073
13
22
33
320
YES
Emal
ahle
ni (M
p)M
P312
33
22
32
33
21YE
S
Stev
e Ts
hwet
eM
P313
31
12
31
13
15-
City
of M
bom
bela
MP3
263
21
12
32
317
YES
Sol P
laat
jeN
C09
12
11
22
23
215
-
Mad
iben
gN
W37
23
11
21
33
317
YES
Rust
enbu
rgN
W37
32
11
22
23
114
-
Tlok
we-
Vent
ersd
orp
NW
405
21
13
21
111
-
City
Of M
atlo
sana
NW
403
31
32
33
31
19YE
S
Dra
kens
tein
WC
023
21
11
21
11
10-
Stel
lenb
osch
WC
024
11
12
31
11
11-
Geo
rge
WC
044
11
22
33
11
14-
Mak
ana
EC10
41
11
33
13
13-
Mun
icip
aliti
es in
fina
ncia
l dis
tres
s as
at 3
0 Ju
ne 2
017
(mun
icip
aliti
es id
entifi
ed a
s be
ing
in fi
nanc
ial d
istr
ess
are
high
light
ed)

73
THE STATE OF LOCAL GOVERNMENT FINANCES AND FINANCIAL MANAGEMENTAS AT 30 JUNE 2017
Mun
icip
aliti
es in
fina
ncia
l dis
tres
s as
at 3
0 Ju
ne 2
017
(mun
icip
aliti
es id
entifi
ed a
s be
ing
in fi
nanc
ial d
istr
ess
are
high
light
ed)
ANNEXURE A1
Mun
_Nam
eM
un_C
ode
T1 -
Cash
Co
vera
ge"
T2 -
Cash
Ba
lance
s"
T3 -
Relia
nce o
n Ca
pita
l Gra
nts"
T4 -
Over
spen
ding
Op
erat
ional
T5 -
Unde
rspen
ding
Ca
pita
l
T6 -
Debt
ors
Grow
th
T7 -
Debt
ors %
Ow
n Rev
enue
T8 -
Cred
itors
% Ca
sh
Finan
cial
Distr
ess
>=16
Blue
Cra
ne R
oute
EC10
23
13
12
23
116
YES
Dr B
eyer
s N
aude
EC10
13
13
33
33
120
YES
Kou-
Kam
ma
EC10
93
11
32
33
319
YES
Koug
aEC
108
31
21
21
23
15-
Ndl
ambe
EC10
53
32
22
23
219
YES
Sund
ays
Rive
r Va
lley
EC10
63
13
33
23
119
YES
Raym
ond
Mhl
aba
EC12
91
13
31
11
11-
Am
ahla
thi
EC12
42
12
12
33
115
-
Gre
at K
eiEC
123
33
33
33
33
24YE
S
Mbh
ashe
EC12
13
12
12
11
112
-
Mnq
uma
EC12
23
33
23
11
16YE
S
Ngq
ushw
aEC
126
31
33
22
31
18YE
S
Enoc
h M
gijim
aEC
139
31
23
33
32
20YE
S
Inxu
ba Y
ethe
mba
EC13
13
31
33
11
15-
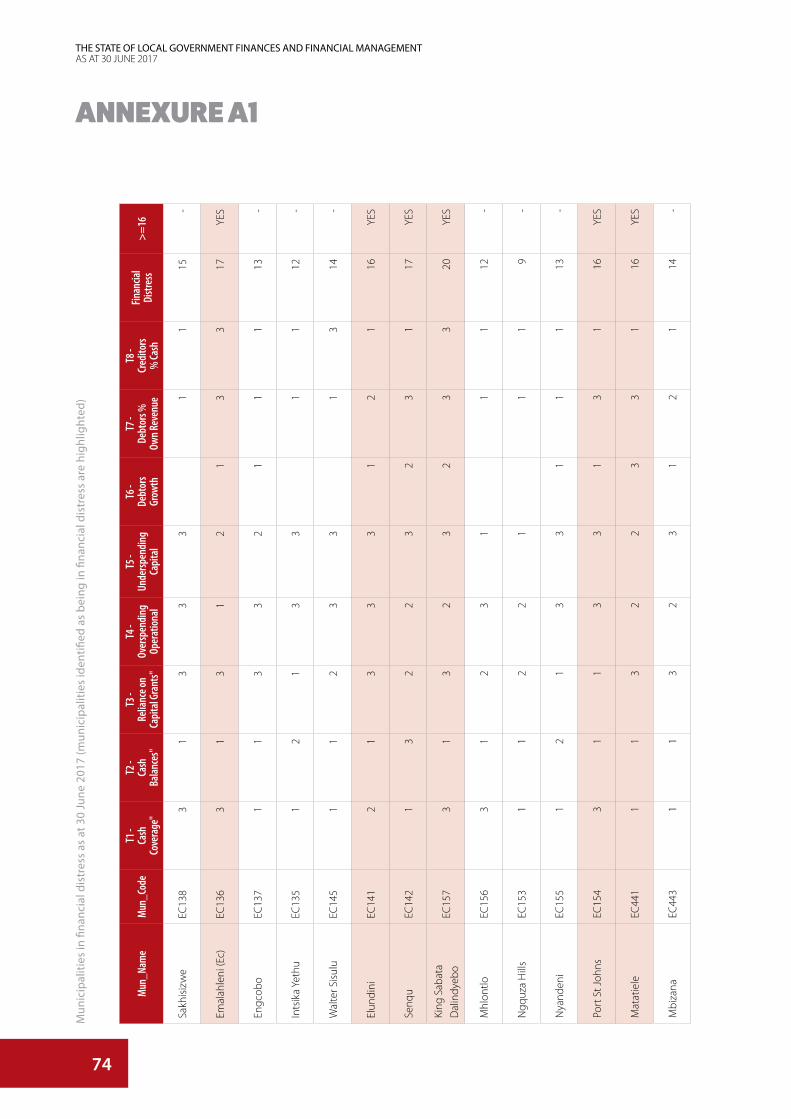
74
THE STATE OF LOCAL GOVERNMENT FINANCES AND FINANCIAL MANAGEMENTAS AT 30 JUNE 2017
ANNEXURE A1M
un_N
ame
Mun
_Cod
eT1
- Ca
sh
Cove
rage
"
T2 -
Cash
Ba
lance
s"
T3 -
Relia
nce o
n Ca
pita
l Gra
nts"
T4 -
Over
spen
ding
Op
erat
ional
T5 -
Unde
rspen
ding
Ca
pita
l
T6 -
Debt
ors
Grow
th
T7 -
Debt
ors %
Ow
n Rev
enue
T8 -
Cred
itors
% Ca
sh
Finan
cial
Distr
ess
>=16
Sakh
isiz
we
EC13
83
13
33
11
15-
Emal
ahle
ni (E
c)EC
136
31
31
21
33
17YE
S
Engc
obo
EC13
71
13
32
11
113
-
Ints
ika
Yeth
uEC
135
12
13
31
112
-
Wal
ter S
isul
uEC
145
11
23
31
314
-
Elun
dini
EC14
12
13
33
12
116
YES
Senq
uEC
142
13
22
32
31
17YE
S
King
Sab
ata
Dal
indy
ebo
EC15
73
13
23
23
320
YES
Mhl
ontlo
EC15
63
12
31
11
12-
Ngq
uza
Hill
sEC
153
11
22
11
19
-
Nya
nden
iEC
155
12
13
31
11
13-
Port
St J
ohns
EC15
43
11
33
13
116
YES
Mat
atie
leEC
441
11
32
23
31
16YE
S
Mbi
zana
EC44
31
13
23
12
114
-
Mun
icip
aliti
es in
fina
ncia
l dis
tres
s as
at 3
0 Ju
ne 2
017
(mun
icip
aliti
es id
entifi
ed a
s be
ing
in fi
nanc
ial d
istr
ess
are
high
light
ed)

75
THE STATE OF LOCAL GOVERNMENT FINANCES AND FINANCIAL MANAGEMENTAS AT 30 JUNE 2017
ANNEXURE A1
Mun
_Nam
eM
un_C
ode
T1 -
Cash
Co
vera
ge"
T2 -
Cash
Ba
lance
s"
T3 -
Relia
nce o
n Ca
pita
l Gra
nts"
T4 -
Over
spen
ding
Op
erat
ional
T5 -
Unde
rspen
ding
Ca
pita
l
T6 -
Debt
ors
Grow
th
T7 -
Debt
ors %
Ow
n Rev
enue
T8 -
Cred
itors
% Ca
sh
Finan
cial
Distr
ess
>=16
Nta
bank
ulu
EC44
41
13
13
12
113
-
Um
zim
vubu
EC44
21
12
31
22
113
-
Kopa
nong
FS16
22
11
33
13
14-
Lets
emen
gFS
161
31
33
33
32
21YE
S
Moh
okar
eFS
163
31
33
31
115
-
Mas
ilony
ana
FS18
13
13
33
23
321
YES
Nal
aFS
185
31
12
13
33
17YE
S
Toko
logo
FS18
23
31
11
33
116
YES
Tsw
elop
ele
FS18
33
23
13
23
118
YES
Dih
labe
ngFS
192
11
32
23
33
18YE
S
Mal
uti-a
-Pho
fung
FS19
43
33
32
33
121
YES
Man
tsop
aFS
196
31
22
31
113
-
Nke
toan
aFS
193
33
31
33
31
20YE
S
Phum
elel
aFS
195
11
11
21
18
-
Mun
icip
aliti
es in
fina
ncia
l dis
tres
s as
at 3
0 Ju
ne 2
017
(mun
icip
aliti
es id
entifi
ed a
s be
ing
in fi
nanc
ial d
istr
ess
are
high
light
ed)
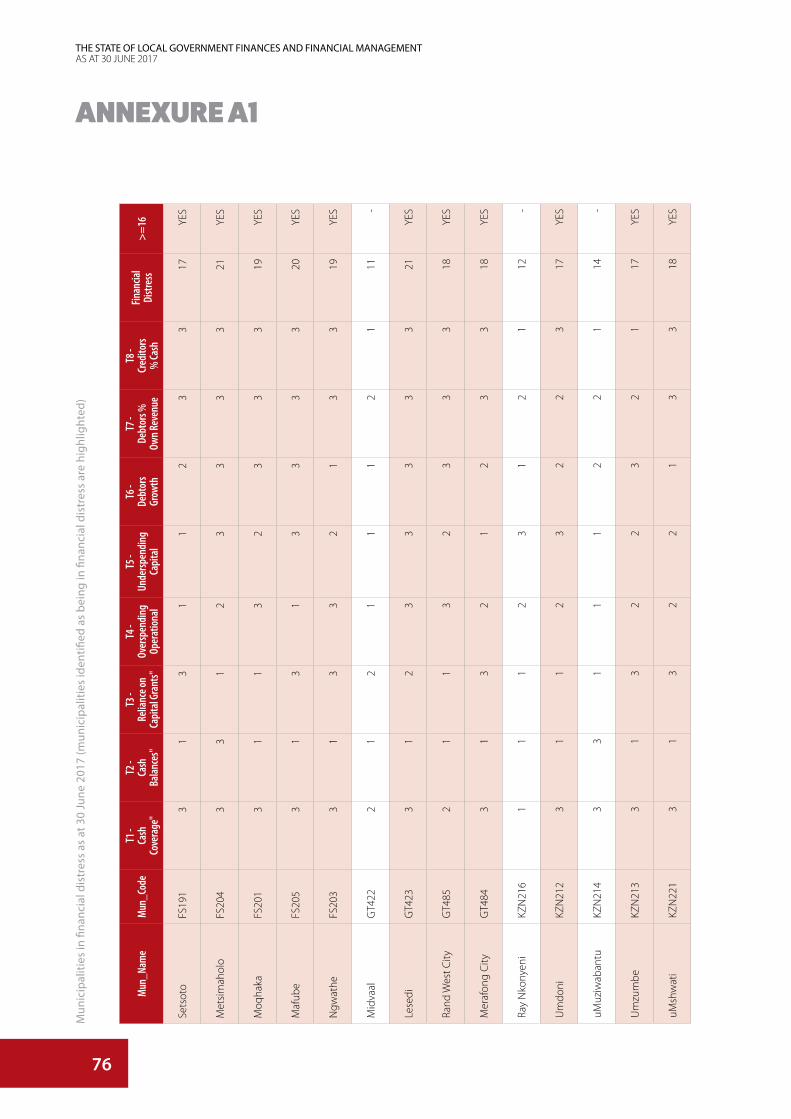
76
THE STATE OF LOCAL GOVERNMENT FINANCES AND FINANCIAL MANAGEMENTAS AT 30 JUNE 2017
ANNEXURE A1M
un_N
ame
Mun
_Cod
eT1
- Ca
sh
Cove
rage
"
T2 -
Cash
Ba
lance
s"
T3 -
Relia
nce o
n Ca
pita
l Gra
nts"
T4 -
Over
spen
ding
Op
erat
ional
T5 -
Unde
rspen
ding
Ca
pita
l
T6 -
Debt
ors
Grow
th
T7 -
Debt
ors %
Ow
n Rev
enue
T8 -
Cred
itors
% Ca
sh
Finan
cial
Distr
ess
>=16
Sets
oto
FS19
13
13
11
23
317
YES
Met
sim
ahol
oFS
204
33
12
33
33
21YE
S
Moq
haka
FS20
13
11
32
33
319
YES
Maf
ube
FS20
53
13
13
33
320
YES
Ngw
athe
FS20
33
13
32
13
319
YES
Mid
vaal
GT4
222
12
11
12
111
-
Lese
diG
T423
31
23
33
33
21YE
S
Rand
Wes
t City
GT4
852
11
32
33
318
YES
Mer
afon
g C
ityG
T484
31
32
12
33
18YE
S
Ray
Nko
nyen
iKZ
N21
61
11
23
12
112
-
Um
doni
KZN
212
31
12
32
23
17YE
S
uMuz
iwab
antu
KZN
214
33
11
12
21
14-
Um
zum
beKZ
N21
33
13
22
32
117
YES
uMsh
wat
iKZ
N22
13
13
22
13
318
YES
Mun
icip
aliti
es in
fina
ncia
l dis
tres
s as
at 3
0 Ju
ne 2
017
(mun
icip
aliti
es id
entifi
ed a
s be
ing
in fi
nanc
ial d
istr
ess
are
high
light
ed)
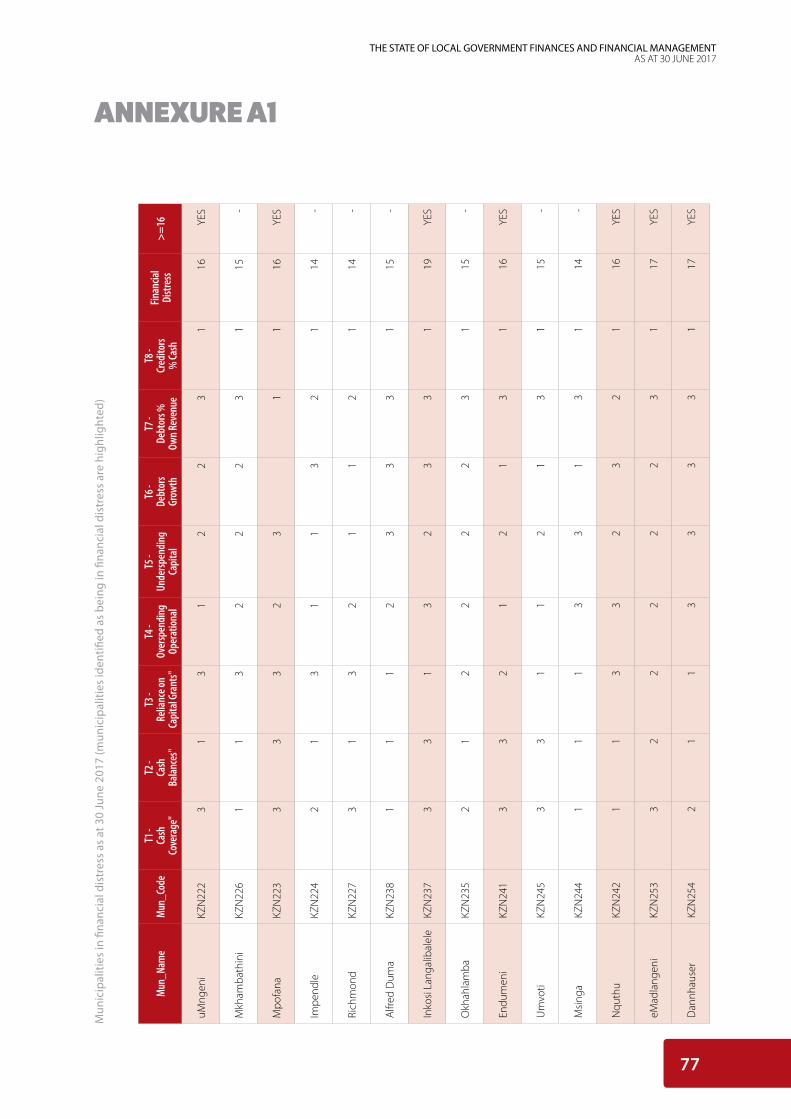
77
THE STATE OF LOCAL GOVERNMENT FINANCES AND FINANCIAL MANAGEMENTAS AT 30 JUNE 2017
ANNEXURE A1
Mun
_Nam
eM
un_C
ode
T1 -
Cash
Co
vera
ge"
T2 -
Cash
Ba
lance
s"
T3 -
Relia
nce o
n Ca
pita
l Gra
nts"
T4 -
Over
spen
ding
Op
erat
ional
T5 -
Unde
rspen
ding
Ca
pita
l
T6 -
Debt
ors
Grow
th
T7 -
Debt
ors %
Ow
n Rev
enue
T8 -
Cred
itors
% Ca
sh
Finan
cial
Distr
ess
>=16
uMng
eni
KZN
222
31
31
22
31
16YE
S
Mkh
amba
thin
iKZ
N22
61
13
22
23
115
-
Mpo
fana
KZN
223
33
32
31
116
YES
Impe
ndle
KZN
224
21
31
13
21
14-
Rich
mon
dKZ
N22
73
13
21
12
114
-
Alfr
ed D
uma
KZN
238
11
12
33
31
15-
Inko
si L
anga
libal
ele
KZN
237
33
13
23
31
19YE
S
Okh
ahla
mba
KZN
235
21
22
22
31
15-
Endu
men
iKZ
N24
13
32
12
13
116
YES
Um
voti
KZN
245
33
11
21
31
15-
Msi
nga
KZN
244
11
13
31
31
14-
Nqu
thu
KZN
242
11
33
23
21
16YE
S
eMad
lang
eni
KZN
253
32
22
22
31
17YE
S
Dan
nhau
ser
KZN
254
21
13
33
31
17YE
S
Mun
icip
aliti
es in
fina
ncia
l dis
tres
s as
at 3
0 Ju
ne 2
017
(mun
icip
aliti
es id
entifi
ed a
s be
ing
in fi
nanc
ial d
istr
ess
are
high
light
ed)
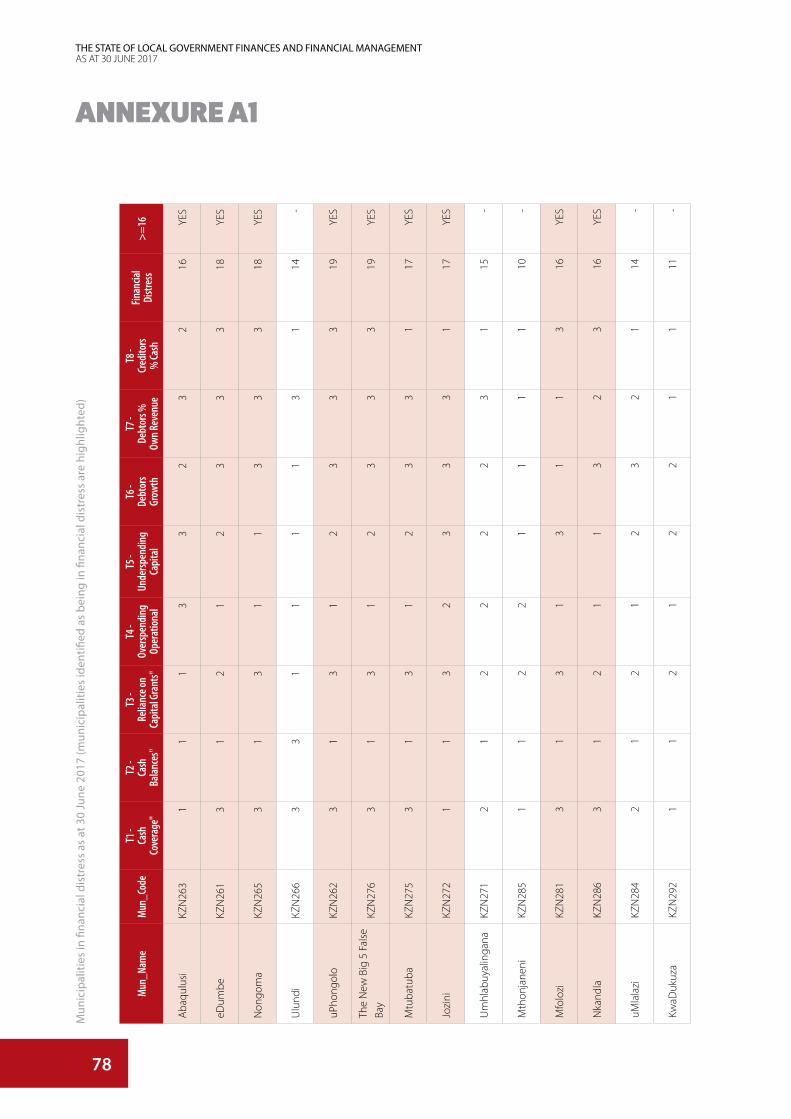
78
THE STATE OF LOCAL GOVERNMENT FINANCES AND FINANCIAL MANAGEMENTAS AT 30 JUNE 2017
ANNEXURE A1M
un_N
ame
Mun
_Cod
eT1
- Ca
sh
Cove
rage
"
T2 -
Cash
Ba
lance
s"
T3 -
Relia
nce o
n Ca
pita
l Gra
nts"
T4 -
Over
spen
ding
Op
erat
ional
T5 -
Unde
rspen
ding
Ca
pita
l
T6 -
Debt
ors
Grow
th
T7 -
Debt
ors %
Ow
n Rev
enue
T8 -
Cred
itors
% Ca
sh
Finan
cial
Distr
ess
>=16
Aba
qulu
siKZ
N26
31
11
33
23
216
YES
eDum
beKZ
N26
13
12
12
33
318
YES
Non
gom
aKZ
N26
53
13
11
33
318
YES
Ulu
ndi
KZN
266
33
11
11
31
14-
uPho
ngol
oKZ
N26
23
13
12
33
319
YES
The
New
Big
5 F
alse
Ba
yKZ
N27
63
13
12
33
319
YES
Mtu
batu
baKZ
N27
53
13
12
33
117
YES
Jozi
niKZ
N27
21
13
23
33
117
YES
Um
hlab
uyal
inga
naKZ
N27
12
12
22
23
115
-
Mth
onja
neni
KZN
285
11
22
11
11
10-
Mfo
lozi
KZN
281
31
31
31
13
16YE
S
Nka
ndla
KZN
286
31
21
13
23
16YE
S
uMla
lazi
KZN
284
21
21
23
21
14-
KwaD
ukuz
aKZ
N29
21
12
12
21
111
-
Mun
icip
aliti
es in
fina
ncia
l dis
tres
s as
at 3
0 Ju
ne 2
017
(mun
icip
aliti
es id
entifi
ed a
s be
ing
in fi
nanc
ial d
istr
ess
are
high
light
ed)
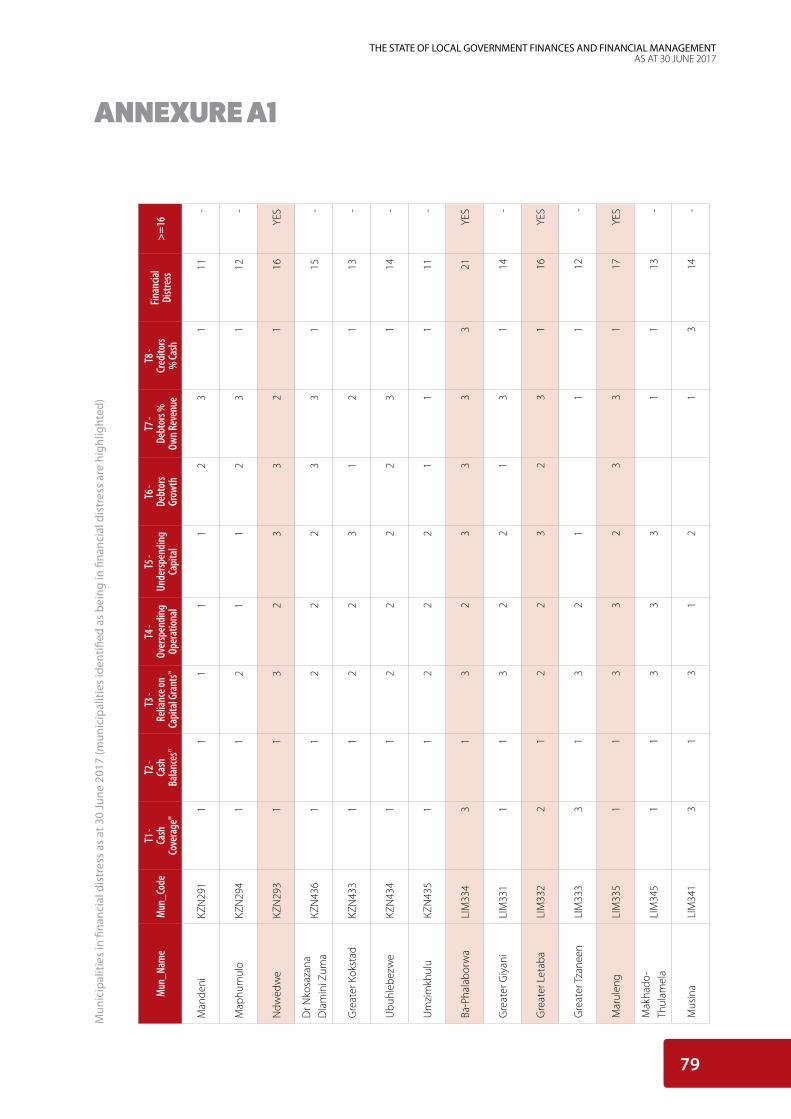
79
THE STATE OF LOCAL GOVERNMENT FINANCES AND FINANCIAL MANAGEMENTAS AT 30 JUNE 2017
ANNEXURE A1
Mun
_Nam
eM
un_C
ode
T1 -
Cash
Co
vera
ge"
T2 -
Cash
Ba
lance
s"
T3 -
Relia
nce o
n Ca
pita
l Gra
nts"
T4 -
Over
spen
ding
Op
erat
ional
T5 -
Unde
rspen
ding
Ca
pita
l
T6 -
Debt
ors
Grow
th
T7 -
Debt
ors %
Ow
n Rev
enue
T8 -
Cred
itors
% Ca
sh
Finan
cial
Distr
ess
>=16
Man
deni
KZN
291
11
11
12
31
11-
Map
hum
ulo
KZN
294
11
21
12
31
12-
Ndw
edw
eKZ
N29
31
13
23
32
116
YES
Dr N
kosa
zana
D
lam
ini Z
uma
KZN
436
11
22
23
31
15-
Gre
ater
Kok
stad
KZN
433
11
22
31
21
13-
Ubu
hleb
ezw
eKZ
N43
41
12
22
23
114
-
Um
zim
khul
uKZ
N43
51
12
22
11
111
-
Ba-P
hala
borw
aLI
M33
43
13
23
33
321
YES
Gre
ater
Giy
ani
LIM
331
11
32
21
31
14-
Gre
ater
Let
aba
LIM
332
21
22
32
31
16YE
S
Gre
ater
Tza
neen
LIM
333
31
32
11
112
-
Mar
ulen
gLI
M33
51
13
32
33
117
YES
Mak
hado
-Th
ulam
ela
LIM
345
11
33
31
113
-
Mus
ina
LIM
341
31
31
21
314
-
Mun
icip
aliti
es in
fina
ncia
l dis
tres
s as
at 3
0 Ju
ne 2
017
(mun
icip
aliti
es id
entifi
ed a
s be
ing
in fi
nanc
ial d
istr
ess
are
high
light
ed)
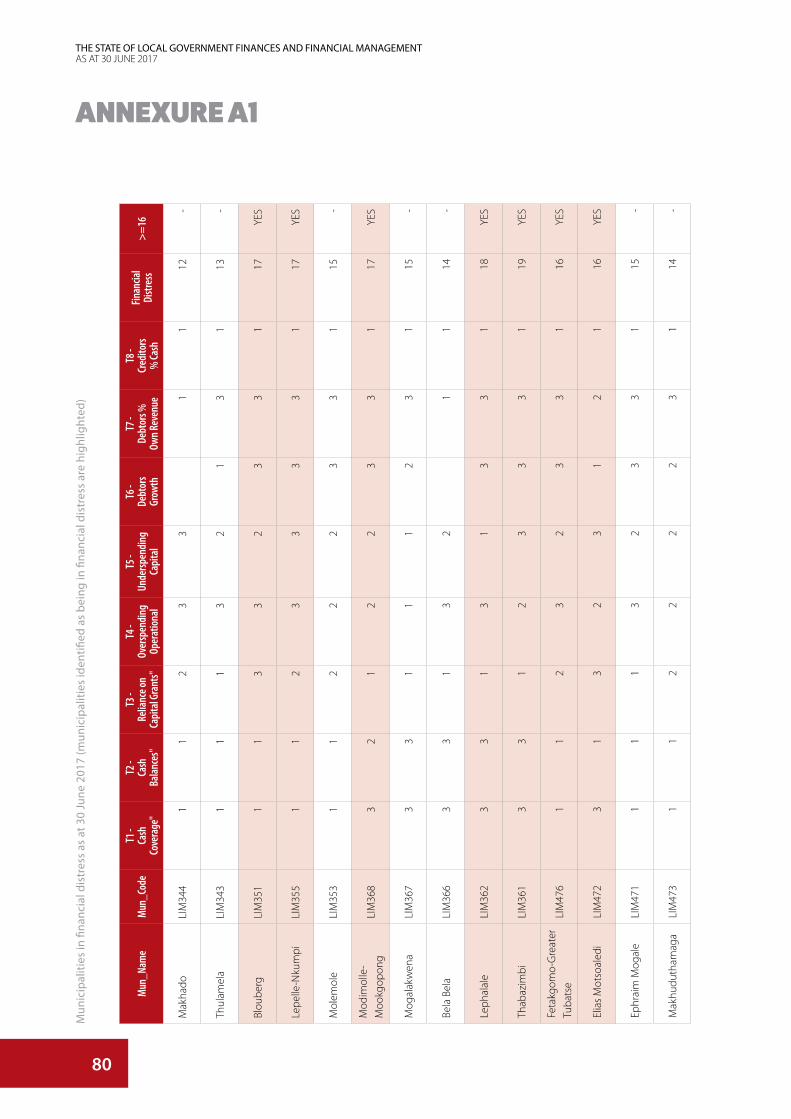
80
THE STATE OF LOCAL GOVERNMENT FINANCES AND FINANCIAL MANAGEMENTAS AT 30 JUNE 2017
ANNEXURE A1M
un_N
ame
Mun
_Cod
eT1
- Ca
sh
Cove
rage
"
T2 -
Cash
Ba
lance
s"
T3 -
Relia
nce o
n Ca
pita
l Gra
nts"
T4 -
Over
spen
ding
Op
erat
ional
T5 -
Unde
rspen
ding
Ca
pita
l
T6 -
Debt
ors
Grow
th
T7 -
Debt
ors %
Ow
n Rev
enue
T8 -
Cred
itors
% Ca
sh
Finan
cial
Distr
ess
>=16
Mak
hado
LIM
344
11
23
31
112
-
Thul
amel
aLI
M34
31
11
32
13
113
-
Blou
berg
LIM
351
11
33
23
31
17YE
S
Lepe
lle-N
kum
piLI
M35
51
12
33
33
117
YES
Mol
emol
eLI
M35
31
12
22
33
115
-
Mod
imol
le-
Moo
kgop
ong
LIM
368
32
12
23
31
17YE
S
Mog
alak
wen
aLI
M36
73
31
11
23
115
-
Bela
Bel
aLI
M36
63
31
32
11
14-
Leph
alal
eLI
M36
23
31
31
33
118
YES
Thab
azim
biLI
M36
13
31
23
33
119
YES
Feta
kgom
o-G
reat
er
Tuba
tse
LIM
476
11
23
23
31
16YE
S
Elia
s M
otso
aled
iLI
M47
23
13
23
12
116
YES
Ephr
aim
Mog
ale
LIM
471
11
13
23
31
15-
Mak
hudu
tham
aga
LIM
473
11
22
22
31
14-
Mun
icip
aliti
es in
fina
ncia
l dis
tres
s as
at 3
0 Ju
ne 2
017
(mun
icip
aliti
es id
entifi
ed a
s be
ing
in fi
nanc
ial d
istr
ess
are
high
light
ed)
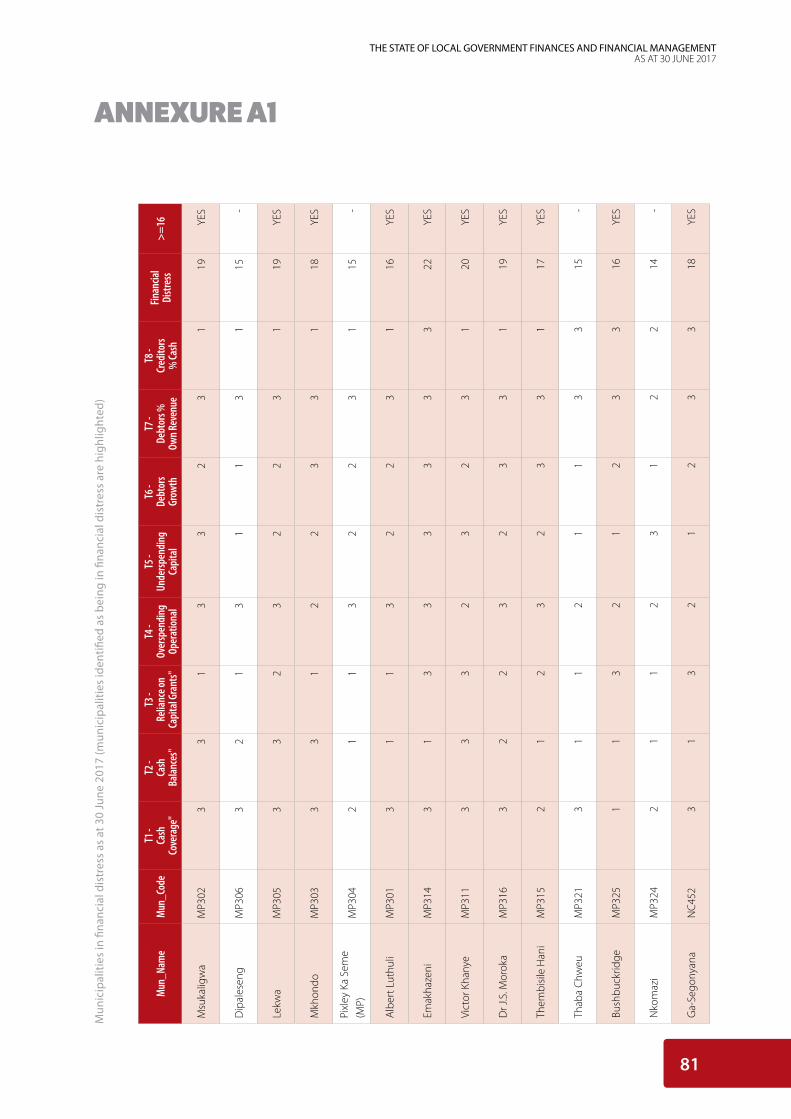
81
THE STATE OF LOCAL GOVERNMENT FINANCES AND FINANCIAL MANAGEMENTAS AT 30 JUNE 2017
ANNEXURE A1
Mun
_Nam
eM
un_C
ode
T1 -
Cash
Co
vera
ge"
T2 -
Cash
Ba
lance
s"
T3 -
Relia
nce o
n Ca
pita
l Gra
nts"
T4 -
Over
spen
ding
Op
erat
ional
T5 -
Unde
rspen
ding
Ca
pita
l
T6 -
Debt
ors
Grow
th
T7 -
Debt
ors %
Ow
n Rev
enue
T8 -
Cred
itors
% Ca
sh
Finan
cial
Distr
ess
>=16
Msu
kalig
wa
MP3
023
31
33
23
119
YES
Dip
ales
eng
MP3
063
21
31
13
115
-
Lekw
aM
P305
33
23
22
31
19YE
S
Mkh
ondo
MP3
033
31
22
33
118
YES
Pixl
ey K
a Se
me
(MP)
MP3
042
11
32
23
115
-
Alb
ert L
uthu
liM
P301
31
13
22
31
16YE
S
Emak
haze
niM
P314
31
33
33
33
22YE
S
Vict
or K
hany
eM
P311
33
32
32
31
20YE
S
Dr J
.S. M
orok
aM
P316
32
23
23
31
19YE
S
Them
bisi
le H
ani
MP3
152
12
32
33
117
YES
Thab
a C
hweu
MP3
213
11
21
13
315
-
Bush
buck
ridge
MP3
251
13
21
23
316
YES
Nko
maz
iM
P324
21
12
31
22
14-
Ga-
Sego
nyan
aN
C45
23
13
21
23
318
YES
Mun
icip
aliti
es in
fina
ncia
l dis
tres
s as
at 3
0 Ju
ne 2
017
(mun
icip
aliti
es id
entifi
ed a
s be
ing
in fi
nanc
ial d
istr
ess
are
high
light
ed)
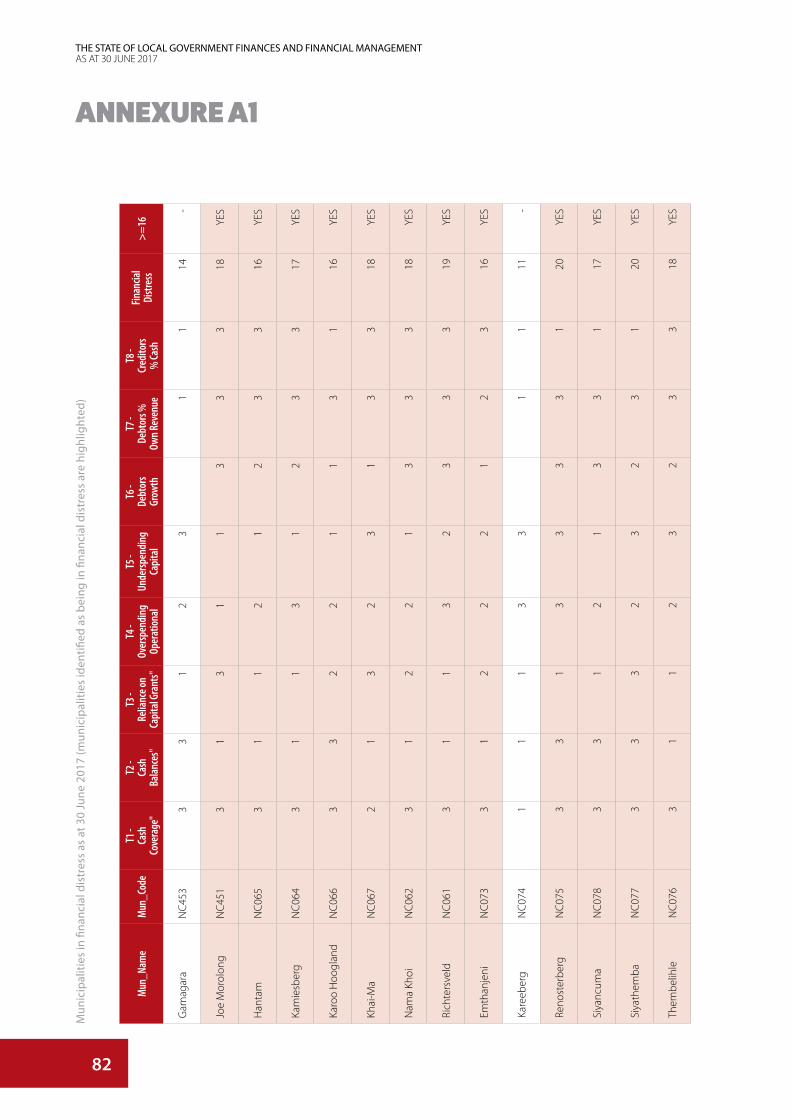
82
THE STATE OF LOCAL GOVERNMENT FINANCES AND FINANCIAL MANAGEMENTAS AT 30 JUNE 2017
ANNEXURE A1M
un_N
ame
Mun
_Cod
eT1
- Ca
sh
Cove
rage
"
T2 -
Cash
Ba
lance
s"
T3 -
Relia
nce o
n Ca
pita
l Gra
nts"
T4 -
Over
spen
ding
Op
erat
ional
T5 -
Unde
rspen
ding
Ca
pita
l
T6 -
Debt
ors
Grow
th
T7 -
Debt
ors %
Ow
n Rev
enue
T8 -
Cred
itors
% Ca
sh
Finan
cial
Distr
ess
>=16
Gam
agar
aN
C45
33
31
23
11
14-
Joe
Mor
olon
gN
C45
13
13
11
33
318
YES
Han
tam
NC
065
31
12
12
33
16YE
S
Kam
iesb
erg
NC
064
31
13
12
33
17YE
S
Karo
o H
oogl
and
NC
066
33
22
11
31
16YE
S
Khai
-Ma
NC
067
21
32
31
33
18YE
S
Nam
a Kh
oiN
C06
23
12
21
33
318
YES
Rich
ters
veld
NC
061
31
13
23
33
19YE
S
Emth
anje
niN
C07
33
12
22
12
316
YES
Kare
eber
gN
C07
41
11
33
11
11-
Reno
ster
berg
NC
075
33
13
33
31
20YE
S
Siya
ncum
aN
C07
83
31
21
33
117
YES
Siya
them
baN
C07
73
33
23
23
120
YES
Them
belih
leN
C07
63
11
23
23
318
YES
Mun
icip
aliti
es in
fina
ncia
l dis
tres
s as
at 3
0 Ju
ne 2
017
(mun
icip
aliti
es id
entifi
ed a
s be
ing
in fi
nanc
ial d
istr
ess
are
high
light
ed)
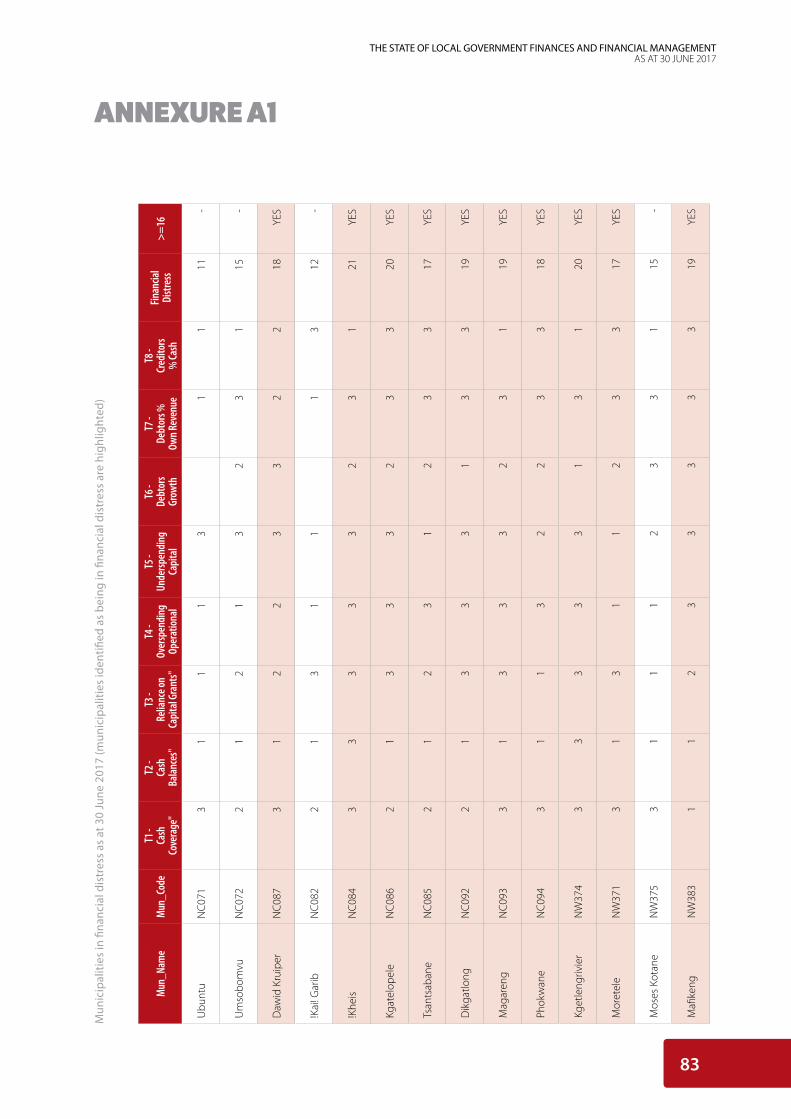
83
THE STATE OF LOCAL GOVERNMENT FINANCES AND FINANCIAL MANAGEMENTAS AT 30 JUNE 2017
ANNEXURE A1
Mun
_Nam
eM
un_C
ode
T1 -
Cash
Co
vera
ge"
T2 -
Cash
Ba
lance
s"
T3 -
Relia
nce o
n Ca
pita
l Gra
nts"
T4 -
Over
spen
ding
Op
erat
ional
T5 -
Unde
rspen
ding
Ca
pita
l
T6 -
Debt
ors
Grow
th
T7 -
Debt
ors %
Ow
n Rev
enue
T8 -
Cred
itors
% Ca
sh
Finan
cial
Distr
ess
>=16
Ubu
ntu
NC
071
31
11
31
111
-
Um
sobo
mvu
NC
072
21
21
32
31
15-
Daw
id K
ruip
erN
C08
73
12
23
32
218
YES
!Kai
! Gar
ibN
C08
22
13
11
13
12-
!Khe
isN
C08
43
33
33
23
121
YES
Kgat
elop
ele
NC
086
21
33
32
33
20YE
S
Tsan
tsab
ane
NC
085
21
23
12
33
17YE
S
Dik
gatlo
ngN
C09
22
13
33
13
319
YES
Mag
aren
gN
C09
33
13
33
23
119
YES
Phok
wan
eN
C09
43
11
32
23
318
YES
Kget
leng
rivie
rN
W37
43
33
33
13
120
YES
Mor
etel
eN
W37
13
13
11
23
317
YES
Mos
es K
otan
eN
W37
53
11
12
33
115
-
Mafi
keng
NW
383
11
23
33
33
19YE
S
Mun
icip
aliti
es in
fina
ncia
l dis
tres
s as
at 3
0 Ju
ne 2
017
(mun
icip
aliti
es id
entifi
ed a
s be
ing
in fi
nanc
ial d
istr
ess
are
high
light
ed)
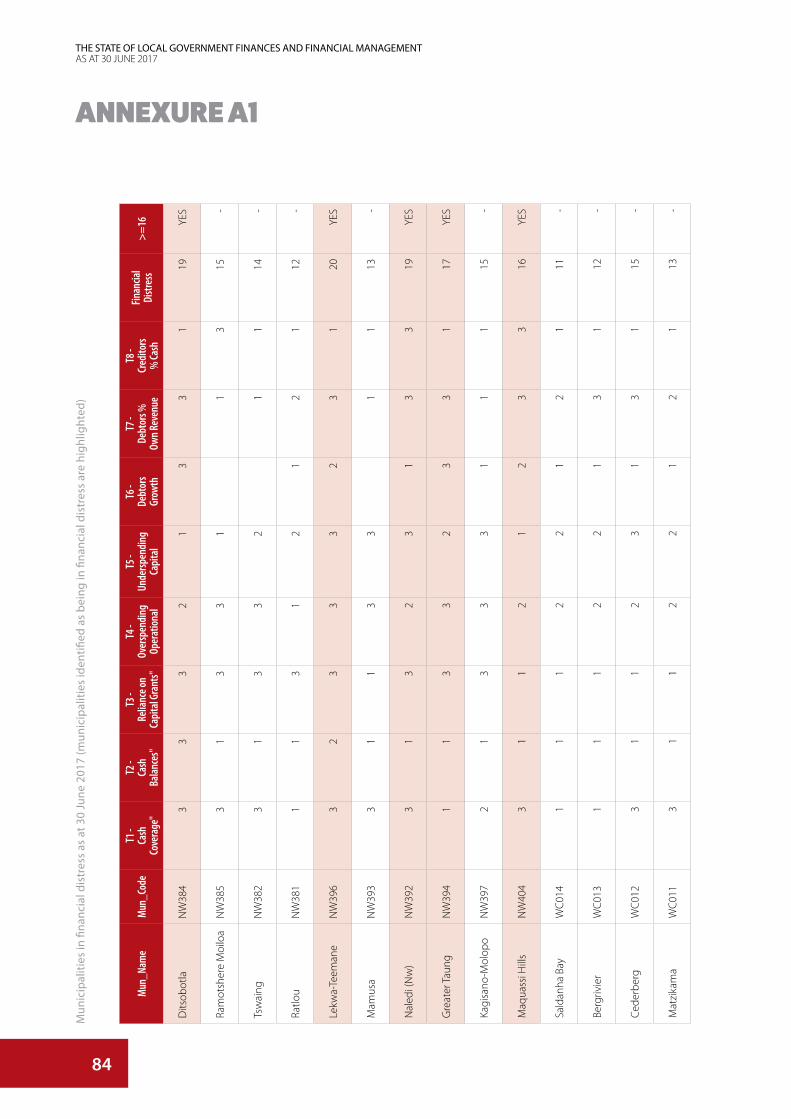
84
THE STATE OF LOCAL GOVERNMENT FINANCES AND FINANCIAL MANAGEMENTAS AT 30 JUNE 2017
ANNEXURE A1M
un_N
ame
Mun
_Cod
eT1
- Ca
sh
Cove
rage
"
T2 -
Cash
Ba
lance
s"
T3 -
Relia
nce o
n Ca
pita
l Gra
nts"
T4 -
Over
spen
ding
Op
erat
ional
T5 -
Unde
rspen
ding
Ca
pita
l
T6 -
Debt
ors
Grow
th
T7 -
Debt
ors %
Ow
n Rev
enue
T8 -
Cred
itors
% Ca
sh
Finan
cial
Distr
ess
>=16
Dits
obot
laN
W38
43
33
21
33
119
YES
Ram
otsh
ere
Moi
loa
NW
385
31
33
11
315
-
Tsw
aing
NW
382
31
33
21
114
-
Ratlo
uN
W38
11
13
12
12
112
-
Lekw
a-Te
eman
eN
W39
63
23
33
23
120
YES
Mam
usa
NW
393
31
13
31
113
-
Nal
edi (
Nw
)N
W39
23
13
23
13
319
YES
Gre
ater
Tau
ngN
W39
41
13
32
33
117
YES
Kagi
sano
-Mol
opo
NW
397
21
33
31
11
15-
Maq
uass
i Hill
sN
W40
43
11
21
23
316
YES
Sald
anha
Bay
WC
014
11
12
21
21
11-
Berg
rivie
rW
C01
31
11
22
13
112
-
Cede
rber
gW
C01
23
11
23
13
115
-
Mat
zika
ma
WC
011
31
12
21
21
13-
Mun
icip
aliti
es in
fina
ncia
l dis
tres
s as
at 3
0 Ju
ne 2
017
(mun
icip
aliti
es id
entifi
ed a
s be
ing
in fi
nanc
ial d
istr
ess
are
high
light
ed)

85
THE STATE OF LOCAL GOVERNMENT FINANCES AND FINANCIAL MANAGEMENTAS AT 30 JUNE 2017
ANNEXURE A1
Mun
_Nam
eM
un_C
ode
T1 -
Cash
Co
vera
ge"
T2 -
Cash
Ba
lance
s"
T3 -
Relia
nce o
n Ca
pita
l Gra
nts"
T4 -
Over
spen
ding
Op
erat
ional
T5 -
Unde
rspen
ding
Ca
pita
l
T6 -
Debt
ors
Grow
th
T7 -
Debt
ors %
Ow
n Rev
enue
T8 -
Cred
itors
% Ca
sh
Finan
cial
Distr
ess
>=16
Swar
tland
WC
015
11
12
21
11
10-
Bree
de V
alle
yW
C02
52
11
13
12
112
-
Lang
eber
gW
C02
62
12
22
11
112
-
Witz
enbe
rgW
C02
22
12
21
23
114
-
Ove
rstr
and
WC
032
21
21
11
11
10-
Cape
Agu
lhas
WC
033
21
22
11
11
11-
Swel
lend
amW
C03
41
12
33
12
114
-
Thee
wat
ersk
loof
WC
031
21
12
21
31
13-
Knys
naW
C04
82
12
22
12
113
-
Mos
sel B
ayW
C04
31
11
22
21
111
-
Oud
tsho
orn
WC
045
31
31
21
23
16YE
S
Bito
uW
C04
71
13
22
22
114
-
Hes
sequ
aW
C04
21
12
23
11
112
-
Kann
alan
dW
C04
11
11
33
23
317
YES
Mun
icip
aliti
es in
fina
ncia
l dis
tres
s as
at 3
0 Ju
ne 2
017
(mun
icip
aliti
es id
entifi
ed a
s be
ing
in fi
nanc
ial d
istr
ess
are
high
light
ed)

86
THE STATE OF LOCAL GOVERNMENT FINANCES AND FINANCIAL MANAGEMENTAS AT 30 JUNE 2017
ANNEXURE A1M
un_N
ame
Mun
_Cod
eT1
- Ca
sh
Cove
rage
"
T2 -
Cash
Ba
lance
s"
T3 -
Relia
nce o
n Ca
pita
l Gra
nts"
T4 -
Over
spen
ding
Op
erat
ional
T5 -
Unde
rspen
ding
Ca
pita
l
T6 -
Debt
ors
Grow
th
T7 -
Debt
ors %
Ow
n Rev
enue
T8 -
Cred
itors
% Ca
sh
Finan
cial
Distr
ess
>=16
Beau
fort
Wes
tW
C05
33
13
22
13
116
YES
Lain
gsbu
rgW
C05
13
12
22
11
113
-
Prin
ce A
lber
tW
C05
21
13
13
31
114
-
Sara
h Ba
artm
anD
C10
12
12
11
11
10-
Am
atho
leD
C12
21
33
32
31
18YE
S
Chr
is H
ani
DC
133
13
32
11
14-
Joe
Gqa
biD
C14
33
32
31
33
21YE
S
O .R
. Tam
boD
C15
11
32
22
31
15-
Alfr
ed N
zoD
C44
33
33
21
21
18YE
S
Xhar
iep
DC
163
13
13
33
320
YES
Lejw
elep
utsw
aD
C18
11
12
33
21
14-
Thab
o M
ofut
sany
ana
DC
193
11
11
33
316
YES
Fezi
le D
abi
DC
201
11
23
11
10-
Sedi
beng
DC
423
11
13
32
317
YES
Mun
icip
aliti
es in
fina
ncia
l dis
tres
s as
at 3
0 Ju
ne 2
017
(mun
icip
aliti
es id
entifi
ed a
s be
ing
in fi
nanc
ial d
istr
ess
are
high
light
ed)

87
THE STATE OF LOCAL GOVERNMENT FINANCES AND FINANCIAL MANAGEMENTAS AT 30 JUNE 2017
ANNEXURE A1
Mun
_Nam
eM
un_C
ode
T1 -
Cash
Co
vera
ge"
T2 -
Cash
Ba
lance
s"
T3 -
Relia
nce o
n Ca
pita
l Gra
nts"
T4 -
Over
spen
ding
Op
erat
ional
T5 -
Unde
rspen
ding
Ca
pita
l
T6 -
Debt
ors
Grow
th
T7 -
Debt
ors %
Ow
n Rev
enue
T8 -
Cred
itors
% Ca
sh
Finan
cial
Distr
ess
>=16
Wes
t Ran
dD
C48
31
31
31
33
18YE
S
Ugu
DC
212
13
11
33
115
-
uMgu
ngun
dlov
uD
C22
33
21
13
31
17YE
S
Uth
ukel
aD
C23
32
31
23
31
18YE
S
Um
ziny
athi
DC
242
13
12
13
114
-
Am
ajub
aD
C25
21
11
23
33
16YE
S
Zulu
land
DC
263
33
11
22
116
YES
Um
khan
yaku
deD
C27
21
31
33
33
19YE
S
King
Cet
shw
ayo
DC
281
13
12
11
111
-
iLem
beD
C29
31
31
11
33
16YE
S
Har
ry G
wal
aD
C43
21
32
31
113
-
Mop
ani
DC
333
32
13
11
14-
Vhem
beD
C34
11
13
31
111
-
Capr
icor
nD
C35
11
31
11
33
14-
Mun
icip
aliti
es in
fina
ncia
l dis
tres
s as
at 3
0 Ju
ne 2
017
(mun
icip
aliti
es id
entifi
ed a
s be
ing
in fi
nanc
ial d
istr
ess
are
high
light
ed)
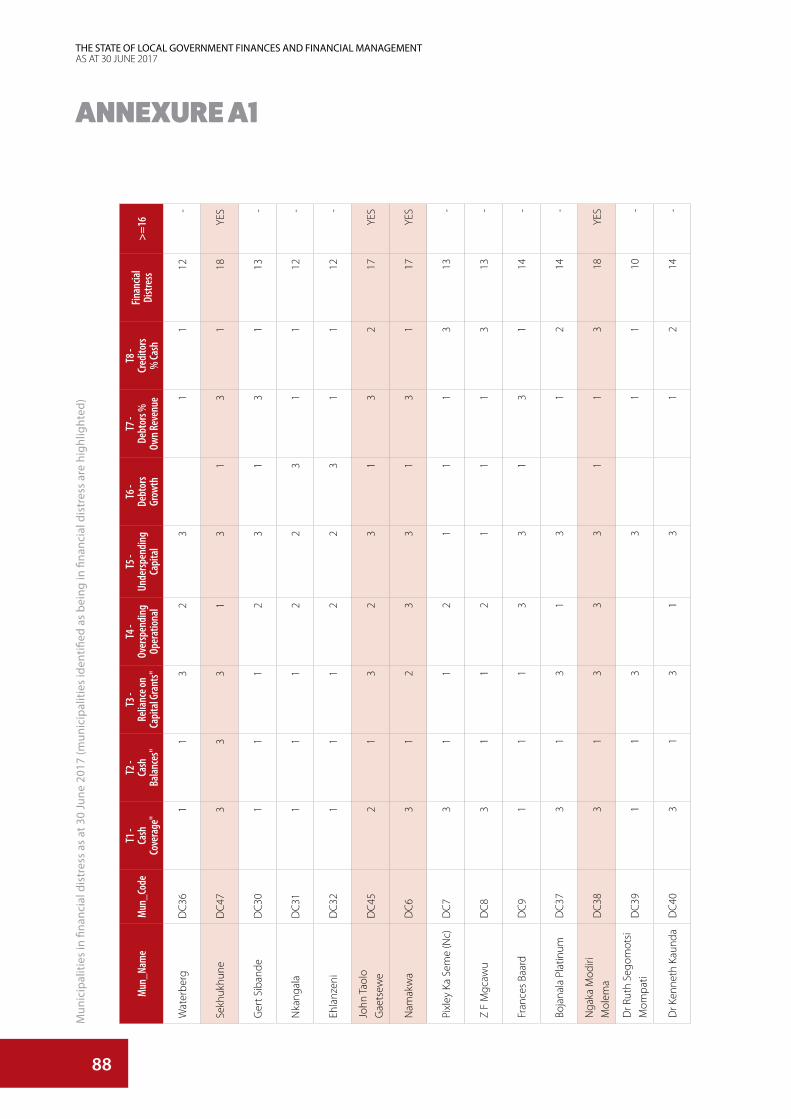
88
THE STATE OF LOCAL GOVERNMENT FINANCES AND FINANCIAL MANAGEMENTAS AT 30 JUNE 2017
ANNEXURE A1M
un_N
ame
Mun
_Cod
eT1
- Ca
sh
Cove
rage
"
T2 -
Cash
Ba
lance
s"
T3 -
Relia
nce o
n Ca
pita
l Gra
nts"
T4 -
Over
spen
ding
Op
erat
ional
T5 -
Unde
rspen
ding
Ca
pita
l
T6 -
Debt
ors
Grow
th
T7 -
Debt
ors %
Ow
n Rev
enue
T8 -
Cred
itors
% Ca
sh
Finan
cial
Distr
ess
>=16
Wat
erbe
rgD
C36
11
32
31
112
-
Sekh
ukhu
neD
C47
33
31
31
31
18YE
S
Ger
t Sib
ande
DC
301
11
23
13
113
-
Nka
ngal
aD
C31
11
12
23
11
12-
Ehla
nzen
iD
C32
11
12
23
11
12-
John
Tao
lo
Gae
tsew
eD
C45
21
32
31
32
17YE
S
Nam
akw
aD
C6
31
23
31
31
17YE
S
Pixl
ey K
a Se
me
(Nc)
DC
73
11
21
11
313
-
Z F
Mgc
awu
DC
83
11
21
11
313
-
Fran
ces
Baar
dD
C9
11
13
31
31
14-
Boja
nala
Pla
tinum
DC
373
13
13
12
14-
Nga
ka M
odiri
M
olem
aD
C38
31
33
31
13
18YE
S
Dr R
uth
Sego
mot
si
Mom
pati
DC
391
13
31
110
-
Dr K
enne
th K
aund
aD
C40
31
31
31
214
-
Mun
icip
aliti
es in
fina
ncia
l dis
tres
s as
at 3
0 Ju
ne 2
017
(mun
icip
aliti
es id
entifi
ed a
s be
ing
in fi
nanc
ial d
istr
ess
are
high
light
ed)

89
THE STATE OF LOCAL GOVERNMENT FINANCES AND FINANCIAL MANAGEMENTAS AT 30 JUNE 2017
ANNEXURE A1M
unic
ipal
ities
in fi
nanc
ial d
istr
ess
as a
t 30
June
201
7 (m
unic
ipal
ities
iden
tified
as
bein
g in
fina
ncia
l dis
tres
s ar
e hi
ghlig
hted
)
Mun
_Nam
eM
un_C
ode
T1 -
Cash
Co
vera
ge"
T2 -
Cash
Ba
lance
s"
T3 -
Relia
nce o
n Ca
pita
l Gra
nts"
T4 -
Over
spen
ding
Op
erat
ional
T5 -
Unde
rspen
ding
Ca
pita
l
T6 -
Debt
ors
Grow
th
T7 -
Debt
ors %
Ow
n Rev
enue
T8 -
Cred
itors
% Ca
sh
Finan
cial
Distr
ess
>=16
Wes
t Coa
stD
C1
11
12
12
11
10-
Cape
Win
elan
ds
DM
DC
21
11
21
21
110
-
Ove
rber
gD
C3
21
11
21
11
10-
Eden
DC
41
11
11
31
110
-
Cent
ral K
aroo
DC
53
13
12
31
115
-

90
THE STATE OF LOCAL GOVERNMENT FINANCES AND FINANCIAL MANAGEMENTAS AT 30 JUNE 2017
ANNEXURE A2Ca
tego
ryM
unici
palit
y Nam
eM
uni
Code
Finan
cial
Distr
ess
2016
/17
Audi
t Out
com
e 201
5/16
Persi
siten
t Ca
pita
l Un
dersp
endi
ng
2015
-17
MM
vaca
ncy
CFO
vaca
ncy
Sect
ion 1
39
Inte
rven
tions
M
arch
2017
MFIP
Su
ppor
t Pe
rsiste
nt D
istre
ss
ABu
ffalo
City
BUF
-Q
ualifi
edYE
SPe
rman
ent
Perm
anen
t
AN
elso
n M
ande
la
Bay
NM
A-
Qua
lified
YES
Perm
anen
tPe
rman
ent
AM
anga
ung
MA
N-
Out
stan
ding
-Pe
rman
ent
Perm
anen
t
AC
ity O
f Jo
hann
esbu
rgJH
B-
Unq
ualifi
ed w
ith
findi
ngs
-Pe
rman
ent
Act
ing
AC
ity O
f Tsh
wan
eTS
HYE
SU
nqua
lified
with
fin
ding
s-
Perm
anen
tA
ctin
g
AEk
urhu
leni
Met
roEK
U-
Unq
ualifi
ed w
ith
findi
ngs
YES
Perm
anen
tPe
rman
ent
AeT
hekw
ini
ETH
-U
nqua
lified
with
fin
ding
s-
Perm
anen
tPe
rman
ent
ACa
pe T
own
CPT
-U
nqua
lified
- N
o fin
ding
s-
Perm
anen
tPe
rman
ent
B1M
atjh
aben
gFS
184
YES
Out
stan
ding
-Pe
rman
ent
Act
ing
B1Em
fule
niG
T421
YES
Unq
ualifi
ed w
ith
findi
ngs
YES
Act
ing
Act
ing
B1M
ogal
e C
ityG
T481
YES
Unq
ualifi
ed w
ith
findi
ngs
-Pe
rman
ent
Perm
anen
t
B1M
sund
uzi
KZN
225
-Q
ualifi
edYE
SA
ctin
gPe
rman
ent
B1N
ewca
stle
KZN
252
-U
nqua
lified
with
fin
ding
sYE
SPe
rman
ent
Act
ing
0 0 3 0 2 1 0 0 4 6 2 3 1
Cons
olid
ated
sud
it o
utco
mes
, int
erve
ntio
ns, v
acan
cies
and
dis
tres
s lis
t

91
THE STATE OF LOCAL GOVERNMENT FINANCES AND FINANCIAL MANAGEMENTAS AT 30 JUNE 2017
ANNEXURE A2Co
nsol
idat
ed s
udit
out
com
es, i
nter
vent
ions
, vac
anci
es a
nd d
istr
ess
list
Cate
gory
Mun
icipa
lity N
ame
Mun
i Co
de
Finan
cial
Distr
ess
2016
/17
Audi
t Out
com
e 201
5/16
Persi
siten
t Ca
pita
l Un
dersp
endi
ng
2015
-17
MM
vaca
ncy
CFO
vaca
ncy
Sect
ion 1
39
Inte
rven
tions
M
arch
2017
MFIP
Su
ppor
t Pe
rsiste
nt D
istre
ss
B1uM
hlat
huze
KZN
282
-U
nqua
lified
- N
o fin
ding
sYE
SPe
rman
ent
Perm
anen
t
B1Po
lokw
ane
LIM
354
YES
Unq
ualifi
ed w
ith
findi
ngs
YES
Perm
anen
tPe
rman
ent
B1G
ovan
Mbe
kiM
P307
YES
Unq
ualifi
ed w
ith
findi
ngs
YES
Act
ing
Act
ing
B1Em
alah
leni
(Mp)
MP3
12YE
SD
iscl
aim
er o
f opi
nion
YES
Act
ing
Perm
anen
t
B1St
eve
Tshw
ete
MP3
13-
Unq
ualifi
ed -
No
findi
ngs
YES
Act
ing
Perm
anen
t
B1C
ity o
f Mbo
mbe
laM
P326
YES
N/A
-A
ctin
gA
ctin
g
B1So
l Pla
atje
NC
091
-U
nqua
lified
with
fin
ding
sYE
SPe
rman
ent
Perm
anen
t
B1M
adib
eng
NW
372
YES
Dis
clai
mer
of o
pini
on-
Act
ing
Act
ing
B1Ru
sten
burg
NW
373
-Q
ualifi
edYE
SA
ctin
gA
ctin
g
B1Tl
okw
e-Ve
nter
sdor
pN
W40
5-
N/A
-Pe
rman
ent
Act
ing
B1C
ity O
f Mat
losa
naN
W40
3YE
SQ
ualifi
edYE
SA
ctin
gA
ctin
g
B1D
rake
nste
inW
C02
3-
Unq
ualifi
ed -
No
findi
ngs
-Pe
rman
ent
Perm
anen
t
B1St
elle
nbos
chW
C02
4-
Unq
ualifi
ed -
No
findi
ngs
YES
Perm
anen
tPe
rman
ent
0 3 3 7 0 1 0 5 0 0 4 0 0
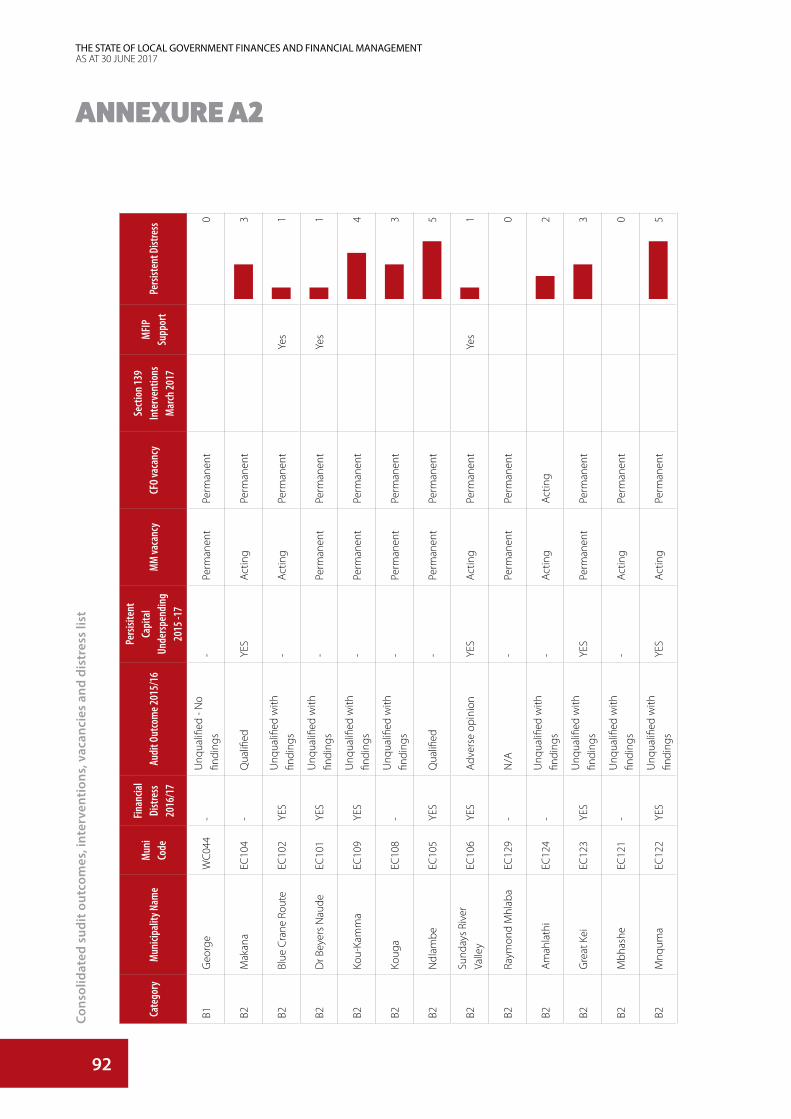
92
THE STATE OF LOCAL GOVERNMENT FINANCES AND FINANCIAL MANAGEMENTAS AT 30 JUNE 2017
ANNEXURE A2Ca
tego
ryM
unici
palit
y Nam
eM
uni
Code
Finan
cial
Distr
ess
2016
/17
Audi
t Out
com
e 201
5/16
Persi
siten
t Ca
pita
l Un
dersp
endi
ng
2015
-17
MM
vaca
ncy
CFO
vaca
ncy
Sect
ion 1
39
Inte
rven
tions
M
arch
2017
MFIP
Su
ppor
t Pe
rsiste
nt D
istre
ss
B1G
eorg
eW
C04
4-
Unq
ualifi
ed -
No
findi
ngs
-Pe
rman
ent
Perm
anen
t
B2M
akan
aEC
104
-Q
ualifi
edYE
SA
ctin
gPe
rman
ent
B2Bl
ue C
rane
Rou
teEC
102
YES
Unq
ualifi
ed w
ith
findi
ngs
-A
ctin
gPe
rman
ent
Yes
B2D
r Bey
ers
Nau
deEC
101
YES
Unq
ualifi
ed w
ith
findi
ngs
-Pe
rman
ent
Perm
anen
tYe
s
B2Ko
u-Ka
mm
aEC
109
YES
Unq
ualifi
ed w
ith
findi
ngs
-Pe
rman
ent
Perm
anen
t
B2Ko
uga
EC10
8-
Unq
ualifi
ed w
ith
findi
ngs
-Pe
rman
ent
Perm
anen
t
B2N
dlam
beEC
105
YES
Qua
lified
-Pe
rman
ent
Perm
anen
t
B2Su
nday
s Ri
ver
Valle
yEC
106
YES
Adv
erse
opi
nion
YES
Act
ing
Perm
anen
tYe
s
B2Ra
ymon
d M
hlab
aEC
129
-N
/A-
Perm
anen
tPe
rman
ent
B2A
mah
lath
iEC
124
-U
nqua
lified
with
fin
ding
s-
Act
ing
Act
ing
B2G
reat
Kei
EC12
3YE
SU
nqua
lified
with
fin
ding
sYE
SPe
rman
ent
Perm
anen
t
B2M
bhas
heEC
121
-U
nqua
lified
with
fin
ding
s-
Act
ing
Perm
anen
t
B2M
nqum
aEC
122
YES
Unq
ualifi
ed w
ith
findi
ngs
YES
Act
ing
Perm
anen
t
Cons
olid
ated
sud
it o
utco
mes
, int
erve
ntio
ns, v
acan
cies
and
dis
tres
s lis
t
0 3 1 1 4 3 5 1 0 2 3 0 5

93
THE STATE OF LOCAL GOVERNMENT FINANCES AND FINANCIAL MANAGEMENTAS AT 30 JUNE 2017
ANNEXURE A2
Cate
gory
Mun
icipa
lity N
ame
Mun
i Co
de
Finan
cial
Distr
ess
2016
/17
Audi
t Out
com
e 201
5/16
Persi
siten
t Ca
pita
l Un
dersp
endi
ng
2015
-17
MM
vaca
ncy
CFO
vaca
ncy
Sect
ion 1
39
Inte
rven
tions
M
arch
2017
MFIP
Su
ppor
t Pe
rsiste
nt D
istre
ss
B2N
gqus
hwa
EC12
6YE
SQ
ualifi
edYE
SA
ctin
gPe
rman
ent
B2En
och
Mgi
jima
EC13
9YE
SN
/A-
Act
ing
Act
ing
Yes
B2In
xuba
Yet
hem
baEC
131
-D
iscl
aim
er o
f opi
nion
-Pe
rman
ent
Perm
anen
t
B2Sa
khis
izw
eEC
138
-U
nqua
lified
with
fin
ding
sYE
SPe
rman
ent
Perm
anen
t
B2Em
alah
leni
(Ec)
EC13
6YE
SU
nqua
lified
with
fin
ding
s-
Perm
anen
tPe
rman
ent
B2En
gcob
oEC
137
-U
nqua
lified
- N
o fin
ding
s-
Perm
anen
tPe
rman
ent
B2In
tsik
a Ye
thu
EC13
5-
Unq
ualifi
ed w
ith
findi
ngs
-A
ctin
gPe
rman
ent
B2W
alte
r Sis
ulu
EC14
5-
N/A
-Pe
rman
ent
Act
ing
Yes
B2El
undi
niEC
141
YES
Unq
ualifi
ed w
ith
findi
ngs
-Pe
rman
ent
Perm
anen
t
B2Se
nqu
EC14
2YE
SU
nqua
lified
- N
o fin
ding
sYE
SPe
rman
ent
Act
ing
B2Ki
ng S
abat
a D
alin
dyeb
oEC
157
YES
Qua
lified
-Pe
rman
ent
Perm
anen
t
B2M
hlon
tloEC
156
-U
nqua
lified
with
fin
ding
s-
Perm
anen
tPe
rman
ent
Yes
B2N
gquz
a H
ills
EC15
3-
Unq
ualifi
ed -
No
findi
ngs
-Pe
rman
ent
Perm
anen
t
Cons
olid
ated
sud
it o
utco
mes
, int
erve
ntio
ns, v
acan
cies
and
dis
tres
s lis
t
2 1 2 0 2 1 2 0 2 2 7 4 0

94
THE STATE OF LOCAL GOVERNMENT FINANCES AND FINANCIAL MANAGEMENTAS AT 30 JUNE 2017
ANNEXURE A2Ca
tego
ryM
unici
palit
y Nam
eM
uni
Code
Finan
cial
Distr
ess
2016
/17
Audi
t Out
com
e 201
5/16
Persi
siten
t Ca
pita
l Un
dersp
endi
ng
2015
-17
MM
vaca
ncy
CFO
vaca
ncy
Sect
ion 1
39
Inte
rven
tions
M
arch
2017
MFIP
Su
ppor
t Pe
rsiste
nt D
istre
ss
B2N
yand
eni
EC15
5-
Unq
ualifi
ed -
No
findi
ngs
YES
Perm
anen
tPe
rman
ent
B2Po
rt S
t Joh
nsEC
154
YES
Qua
lified
-Pe
rman
ent
Perm
anen
t
B2M
atat
iele
EC44
1YE
SU
nqua
lified
- N
o fin
ding
s-
Act
ing
Perm
anen
t
B2M
biza
naEC
443
-U
nqua
lified
with
fin
ding
s-
Perm
anen
tPe
rman
ent
B2N
taba
nkul
uEC
444
-Q
ualifi
ed-
Act
ing
Act
ing
B2U
mzi
mvu
buEC
442
-U
nqua
lified
- N
o fin
ding
s-
Act
ing
Act
ing
B2Ko
pano
ngFS
162
-U
nqua
lified
with
fin
ding
sYE
SA
ctin
gA
ctin
gYe
s
B2Le
tsem
eng
FS16
1YE
SQ
ualifi
edYE
SA
ctin
gA
ctin
g
B2M
ohok
are
FS16
3-
Unq
ualifi
ed w
ith
findi
ngs
YES
Act
ing
Act
ing
Yes
B2M
asilo
nyan
aFS
181
YES
Dis
clai
mer
of o
pini
onYE
SPe
rman
ent
Perm
anen
tYe
s
B2N
ala
FS18
5YE
SU
nqua
lified
with
fin
ding
s-
Perm
anen
tPe
rman
ent
B2To
kolo
goFS
182
YES
Unq
ualifi
ed w
ith
findi
ngs
-Pe
rman
ent
Act
ing
Yes
B2Ts
wel
opel
eFS
183
YES
Unq
ualifi
ed w
ith
findi
ngs
-Pe
rman
ent
Perm
anen
tYe
s
Cons
olid
ated
sud
it o
utco
mes
, int
erve
ntio
ns, v
acan
cies
and
dis
tres
s lis
t
0 1 4 0 3 1 4 2 5 5 5 4 3
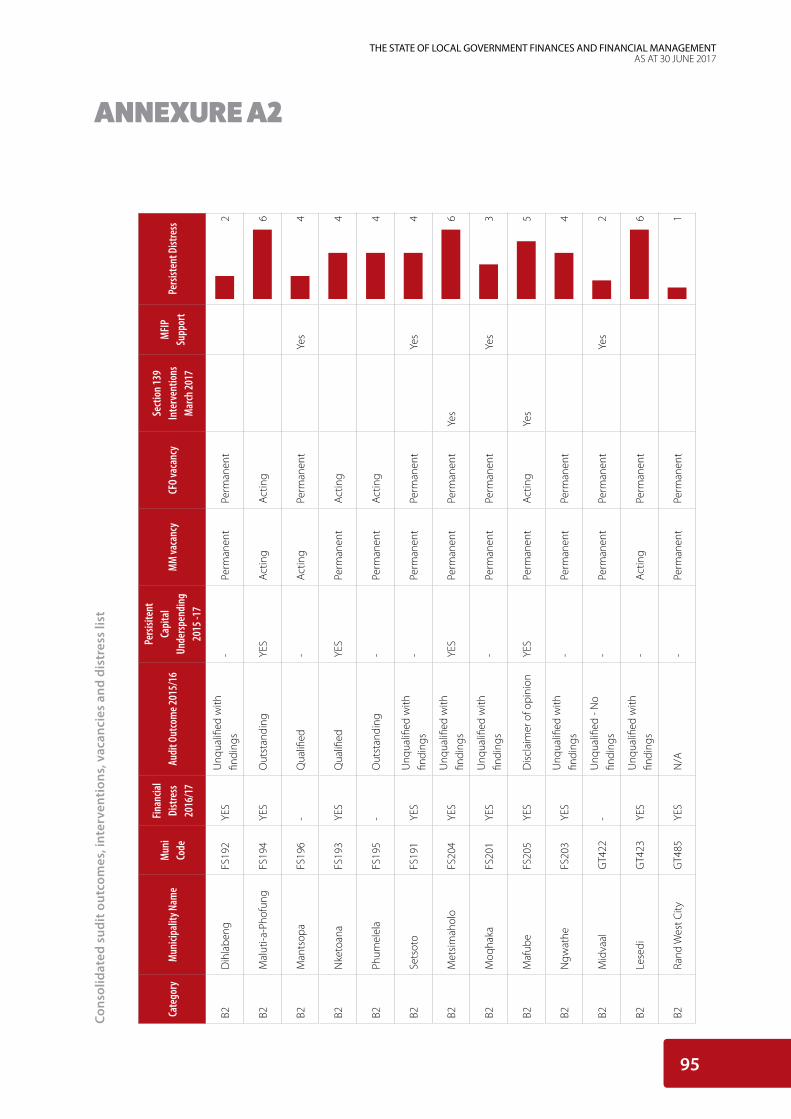
95
THE STATE OF LOCAL GOVERNMENT FINANCES AND FINANCIAL MANAGEMENTAS AT 30 JUNE 2017
ANNEXURE A2
Cate
gory
Mun
icipa
lity N
ame
Mun
i Co
de
Finan
cial
Distr
ess
2016
/17
Audi
t Out
com
e 201
5/16
Persi
siten
t Ca
pita
l Un
dersp
endi
ng
2015
-17
MM
vaca
ncy
CFO
vaca
ncy
Sect
ion 1
39
Inte
rven
tions
M
arch
2017
MFIP
Su
ppor
t Pe
rsiste
nt D
istre
ss
B2D
ihla
beng
FS19
2YE
SU
nqua
lified
with
fin
ding
s-
Perm
anen
tPe
rman
ent
B2M
alut
i-a-P
hofu
ngFS
194
YES
Out
stan
ding
YES
Act
ing
Act
ing
B2M
ants
opa
FS19
6-
Qua
lified
-A
ctin
gPe
rman
ent
Yes
B2N
keto
ana
FS19
3YE
SQ
ualifi
edYE
SPe
rman
ent
Act
ing
B2Ph
umel
ela
FS19
5-
Out
stan
ding
-Pe
rman
ent
Act
ing
B2Se
tsot
oFS
191
YES
Unq
ualifi
ed w
ith
findi
ngs
-Pe
rman
ent
Perm
anen
tYe
s
B2M
etsi
mah
olo
FS20
4YE
SU
nqua
lified
with
fin
ding
sYE
SPe
rman
ent
Perm
anen
tYe
s
B2M
oqha
kaFS
201
YES
Unq
ualifi
ed w
ith
findi
ngs
-Pe
rman
ent
Perm
anen
tYe
s
B2M
afub
eFS
205
YES
Dis
clai
mer
of o
pini
onYE
SPe
rman
ent
Act
ing
Yes
B2N
gwat
heFS
203
YES
Unq
ualifi
ed w
ith
findi
ngs
-Pe
rman
ent
Perm
anen
t
B2M
idva
alG
T422
-U
nqua
lified
- N
o fin
ding
s-
Perm
anen
tPe
rman
ent
Yes
B2Le
sedi
GT4
23YE
SU
nqua
lified
with
fin
ding
s-
Act
ing
Perm
anen
t
B2Ra
nd W
est C
ityG
T485
YES
N/A
-Pe
rman
ent
Perm
anen
t
Cons
olid
ated
sud
it o
utco
mes
, int
erve
ntio
ns, v
acan
cies
and
dis
tres
s lis
t
2 6 4 4 4 4 6 3 5 4 2 6 1

96
THE STATE OF LOCAL GOVERNMENT FINANCES AND FINANCIAL MANAGEMENTAS AT 30 JUNE 2017
ANNEXURE A2Ca
tego
ryM
unici
palit
y Nam
eM
uni
Code
Finan
cial
Distr
ess
2016
/17
Audi
t Out
com
e 201
5/16
Persi
siten
t Ca
pita
l Un
dersp
endi
ng
2015
-17
MM
vaca
ncy
CFO
vaca
ncy
Sect
ion 1
39
Inte
rven
tions
M
arch
2017
MFIP
Su
ppor
t Pe
rsiste
nt D
istre
ss
B2M
eraf
ong
City
GT4
84YE
SU
nqua
lified
with
fin
ding
s-
Act
ing
Act
ing
B2Ra
y N
kony
eni
KZN
216
-U
nqua
lified
with
fin
ding
sYE
SPe
rman
ent
Perm
anen
t
B2U
mdo
niKZ
N21
2YE
SU
nqua
lified
with
fin
ding
sYE
SA
ctin
gA
ctin
g
B2uM
uziw
aban
tuKZ
N21
4-
Unq
ualifi
ed -
No
findi
ngs
-Pe
rman
ent
Act
ing
B2U
mzu
mbe
KZN
213
YES
Unq
ualifi
ed -
No
findi
ngs
-Pe
rman
ent
Perm
anen
t
B2uM
shw
ati
KZN
221
YES
Unq
ualifi
ed w
ith
findi
ngs
-Pe
rman
ent
Perm
anen
t
B2uM
ngen
iKZ
N22
2YE
SU
nqua
lified
with
fin
ding
s-
Act
ing
Perm
anen
t
B2M
kham
bath
ini
KZN
226
-U
nqua
lified
with
fin
ding
s-
Perm
anen
tPe
rman
ent
B2M
pofa
naKZ
N22
3YE
SD
iscl
aim
er o
f opi
nion
-Pe
rman
ent
Act
ing
B2Im
pend
leKZ
N22
4-
Unq
ualifi
ed w
ith
findi
ngs
-A
ctin
gA
ctin
g
B2Ri
chm
ond
KZN
227
-U
nqua
lified
with
fin
ding
s-
Perm
anen
tPe
rman
ent
B2A
lfred
Dum
aKZ
N23
8-
N/A
-Pe
rman
ent
Perm
anen
t
B2In
kosi
Lan
galib
alel
eKZ
N23
7YE
SN
/A-
Act
ing
Perm
anen
t
Cons
olid
ated
sud
it o
utco
mes
, int
erve
ntio
ns, v
acan
cies
and
dis
tres
s lis
t
3 0 4 3 1 5 5 0 1 2 2 0 1

97
THE STATE OF LOCAL GOVERNMENT FINANCES AND FINANCIAL MANAGEMENTAS AT 30 JUNE 2017
ANNEXURE A2
Cate
gory
Mun
icipa
lity N
ame
Mun
i Co
de
Finan
cial
Distr
ess
2016
/17
Audi
t Out
com
e 201
5/16
Persi
siten
t Ca
pita
l Un
dersp
endi
ng
2015
-17
MM
vaca
ncy
CFO
vaca
ncy
Sect
ion 1
39
Inte
rven
tions
M
arch
2017
MFIP
Su
ppor
t Pe
rsiste
nt D
istre
ss
B2O
khah
lam
baKZ
N23
5-
Unq
ualifi
ed -
No
findi
ngs
-Pe
rman
ent
Perm
anen
t
B2En
dum
eni
KZN
241
YES
Unq
ualifi
ed -
No
findi
ngs
YES
Act
ing
Act
ing
B2U
mvo
tiKZ
N24
5-
Unq
ualifi
ed w
ith
findi
ngs
YES
Act
ing
Act
ing
B2M
sing
aKZ
N24
4-
Unq
ualifi
ed w
ith
findi
ngs
-Pe
rman
ent
Act
ing
B2N
quth
uKZ
N24
2YE
SU
nqua
lified
with
fin
ding
sYE
SPe
rman
ent
Perm
anen
t
B2eM
adla
ngen
iKZ
N25
3YE
SU
nqua
lified
with
fin
ding
s-
Act
ing
Act
ing
B2D
annh
ause
rKZ
N25
4YE
SU
nqua
lified
with
fin
ding
s-
Perm
anen
tPe
rman
ent
B2A
baqu
lusi
KZN
263
YES
Unq
ualifi
ed w
ith
findi
ngs
-Pe
rman
ent
Perm
anen
t
B2eD
umbe
KZN
261
YES
Unq
ualifi
ed w
ith
findi
ngs
-A
ctin
gPe
rman
ent
Yes
B2N
ongo
ma
KZN
265
YES
Unq
ualifi
ed w
ith
findi
ngs
-A
ctin
gA
ctin
g
B2U
lund
iKZ
N26
6-
Unq
ualifi
ed w
ith
findi
ngs
-Pe
rman
ent
Perm
anen
t
B2uP
hong
olo
KZN
262
YES
Qua
lified
-A
ctin
gA
ctin
g
B2Th
e N
ew B
ig 5
Fal
se
Bay
KZN
276
YES
N/A
-Pe
rman
ent
Act
ing
Cons
olid
ated
sud
it o
utco
mes
, int
erve
ntio
ns, v
acan
cies
and
dis
tres
s lis
t
0 7 0 0 1 3 3 4 4 4 3 3 1

98
THE STATE OF LOCAL GOVERNMENT FINANCES AND FINANCIAL MANAGEMENTAS AT 30 JUNE 2017
ANNEXURE A2
4 1 1 0 4 2 2 0 0 0 2 0 0
Cate
gory
Mun
icipa
lity N
ame
Mun
i Co
de
Finan
cial
Distr
ess
2016
/17
Audi
t Out
com
e 201
5/16
Persi
siten
t Ca
pita
l Un
dersp
endi
ng
2015
-17
MM
vaca
ncy
CFO
vaca
ncy
Sect
ion 1
39
Inte
rven
tions
M
arch
2017
MFIP
Su
ppor
t Pe
rsiste
nt D
istre
ss
B2M
tuba
tuba
KZN
275
YES
Unq
ualifi
ed w
ith
findi
ngs
-Pe
rman
ent
Act
ing
B2Jo
zini
KZN
272
YES
Unq
ualifi
ed w
ith
findi
ngs
YES
Perm
anen
tA
ctin
g
B2U
mhl
abuy
alin
gana
KZN
271
-U
nqua
lified
- N
o fin
ding
s-
Act
ing
Perm
anen
t
B2M
thon
jane
niKZ
N28
5-
Unq
ualifi
ed w
ith
findi
ngs
-Pe
rman
ent
Perm
anen
t
B2M
folo
ziKZ
N28
1YE
SU
nqua
lified
with
fin
ding
s-
Perm
anen
tPe
rman
ent
B2N
kand
laKZ
N28
6YE
SU
nqua
lified
with
fin
ding
s-
Perm
anen
tPe
rman
ent
B2uM
lala
ziKZ
N28
4-
Unq
ualifi
ed w
ith
findi
ngs
-A
ctin
gPe
rman
ent
B2Kw
aDuk
uza
KZN
292
-U
nqua
lified
with
fin
ding
s-
Perm
anen
tPe
rman
ent
B2M
ande
niKZ
N29
1-
Unq
ualifi
ed -
No
findi
ngs
-A
ctin
gPe
rman
ent
B2M
aphu
mul
oKZ
N29
4-
Unq
ualifi
ed w
ith
findi
ngs
-A
ctin
gA
ctin
g
B2N
dwed
we
KZN
293
YES
Unq
ualifi
ed w
ith
findi
ngs
YES
Perm
anen
tPe
rman
ent
B2D
r Nko
saza
na
Dla
min
i Zum
aKZ
N43
6-
N/A
-Pe
rman
ent
Perm
anen
t
B2G
reat
er K
okst
adKZ
N43
3-
Unq
ualifi
ed w
ith
findi
ngs
-Pe
rman
ent
Perm
anen
t
Cons
olid
ated
sud
it o
utco
mes
, int
erve
ntio
ns, v
acan
cies
and
dis
tres
s lis
t
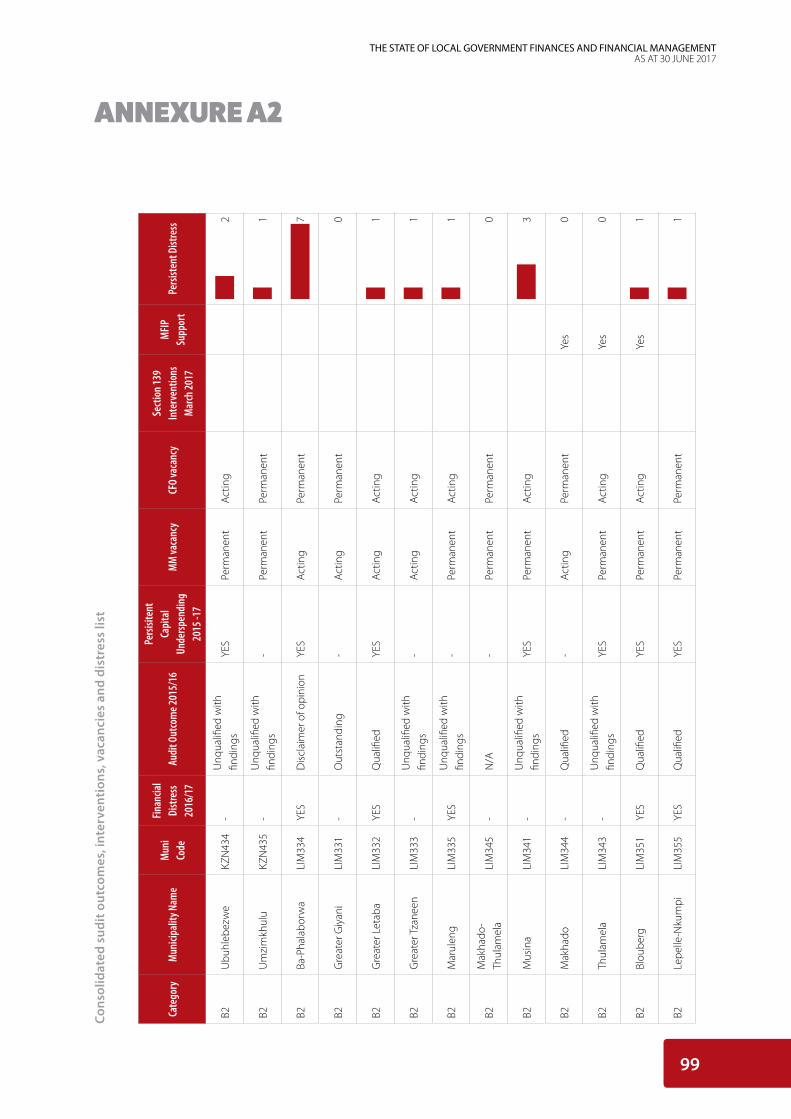
99
THE STATE OF LOCAL GOVERNMENT FINANCES AND FINANCIAL MANAGEMENTAS AT 30 JUNE 2017
ANNEXURE A2
2 1 7 0 1 1 1 0 3 0 0 1 1
Cate
gory
Mun
icipa
lity N
ame
Mun
i Co
de
Finan
cial
Distr
ess
2016
/17
Audi
t Out
com
e 201
5/16
Persi
siten
t Ca
pita
l Un
dersp
endi
ng
2015
-17
MM
vaca
ncy
CFO
vaca
ncy
Sect
ion 1
39
Inte
rven
tions
M
arch
2017
MFIP
Su
ppor
t Pe
rsiste
nt D
istre
ss
B2U
buhl
ebez
we
KZN
434
-U
nqua
lified
with
fin
ding
sYE
SPe
rman
ent
Act
ing
B2U
mzi
mkh
ulu
KZN
435
-U
nqua
lified
with
fin
ding
s-
Perm
anen
tPe
rman
ent
B2Ba
-Pha
labo
rwa
LIM
334
YES
Dis
clai
mer
of o
pini
onYE
SA
ctin
gPe
rman
ent
B2G
reat
er G
iyan
iLI
M33
1-
Out
stan
ding
-A
ctin
gPe
rman
ent
B2G
reat
er L
etab
aLI
M33
2YE
SQ
ualifi
edYE
SA
ctin
gA
ctin
g
B2G
reat
er T
zane
enLI
M33
3-
Unq
ualifi
ed w
ith
findi
ngs
-A
ctin
gA
ctin
g
B2M
arul
eng
LIM
335
YES
Unq
ualifi
ed w
ith
findi
ngs
-Pe
rman
ent
Act
ing
B2M
akha
do-
Thul
amel
aLI
M34
5-
N/A
-Pe
rman
ent
Perm
anen
t
B2M
usin
aLI
M34
1-
Unq
ualifi
ed w
ith
findi
ngs
YES
Perm
anen
tA
ctin
g
B2M
akha
doLI
M34
4-
Qua
lified
-A
ctin
gPe
rman
ent
Yes
B2Th
ulam
ela
LIM
343
-U
nqua
lified
with
fin
ding
sYE
SPe
rman
ent
Act
ing
Yes
B2Bl
oube
rgLI
M35
1YE
SQ
ualifi
edYE
SPe
rman
ent
Act
ing
Yes
B2Le
pelle
-Nku
mpi
LIM
355
YES
Qua
lified
YES
Perm
anen
tPe
rman
ent
Cons
olid
ated
sud
it o
utco
mes
, int
erve
ntio
ns, v
acan
cies
and
dis
tres
s lis
t
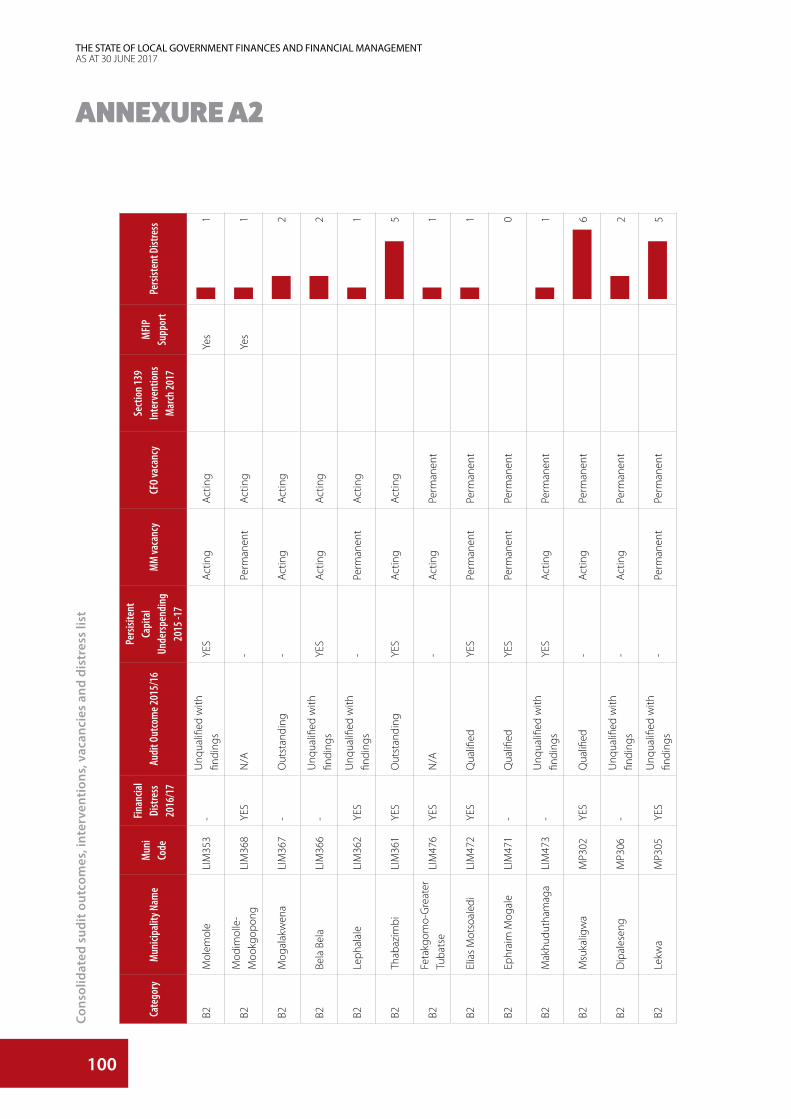
100
THE STATE OF LOCAL GOVERNMENT FINANCES AND FINANCIAL MANAGEMENTAS AT 30 JUNE 2017
ANNEXURE A2
1 1 2 2 1 5 1 1 0 1 6 2 5
Cate
gory
Mun
icipa
lity N
ame
Mun
i Co
de
Finan
cial
Distr
ess
2016
/17
Audi
t Out
com
e 201
5/16
Persi
siten
t Ca
pita
l Un
dersp
endi
ng
2015
-17
MM
vaca
ncy
CFO
vaca
ncy
Sect
ion 1
39
Inte
rven
tions
M
arch
2017
MFIP
Su
ppor
t Pe
rsiste
nt D
istre
ss
B2M
olem
ole
LIM
353
-U
nqua
lified
with
fin
ding
sYE
SA
ctin
gA
ctin
gYe
s
B2M
odim
olle
-M
ookg
opon
gLI
M36
8YE
SN
/A-
Perm
anen
tA
ctin
gYe
s
B2M
ogal
akw
ena
LIM
367
-O
utst
andi
ng-
Act
ing
Act
ing
B2Be
la B
ela
LIM
366
-U
nqua
lified
with
fin
ding
sYE
SA
ctin
gA
ctin
g
B2Le
phal
ale
LIM
362
YES
Unq
ualifi
ed w
ith
findi
ngs
-Pe
rman
ent
Act
ing
B2Th
abaz
imbi
LIM
361
YES
Out
stan
ding
YES
Act
ing
Act
ing
B2Fe
takg
omo-
Gre
ater
Tu
bats
eLI
M47
6YE
SN
/A-
Act
ing
Perm
anen
t
B2El
ias
Mot
soal
edi
LIM
472
YES
Qua
lified
YES
Perm
anen
tPe
rman
ent
B2Ep
hrai
m M
ogal
eLI
M47
1-
Qua
lified
YES
Perm
anen
tPe
rman
ent
B2M
akhu
duth
amag
aLI
M47
3-
Unq
ualifi
ed w
ith
findi
ngs
YES
Act
ing
Perm
anen
t
B2M
suka
ligw
aM
P302
YES
Qua
lified
-A
ctin
gPe
rman
ent
B2D
ipal
esen
gM
P306
-U
nqua
lified
with
fin
ding
s-
Act
ing
Perm
anen
t
B2Le
kwa
MP3
05YE
SU
nqua
lified
with
fin
ding
s-
Perm
anen
tPe
rman
ent
Cons
olid
ated
sud
it o
utco
mes
, int
erve
ntio
ns, v
acan
cies
and
dis
tres
s lis
t

101
THE STATE OF LOCAL GOVERNMENT FINANCES AND FINANCIAL MANAGEMENTAS AT 30 JUNE 2017
ANNEXURE A2
2 1 1 1 1 2 1 6 2 5 2 4 3
Cate
gory
Mun
icipa
lity N
ame
Mun
i Co
de
Finan
cial
Distr
ess
2016
/17
Audi
t Out
com
e 201
5/16
Persi
siten
t Ca
pita
l Un
dersp
endi
ng
2015
-17
MM
vaca
ncy
CFO
vaca
ncy
Sect
ion 1
39
Inte
rven
tions
M
arch
2017
MFIP
Su
ppor
t Pe
rsiste
nt D
istre
ss
B2M
khon
doM
P303
YES
Qua
lified
-Pe
rman
ent
Perm
anen
tYe
s
B2Pi
xley
Ka
Sem
e (M
P)M
P304
-U
nqua
lified
with
fin
ding
s-
Perm
anen
tPe
rman
ent
B2A
lber
t Lut
huli
MP3
01YE
SQ
ualifi
ed-
Perm
anen
tA
ctin
g
B2Em
akha
zeni
MP3
14YE
SQ
ualifi
ed-
Act
ing
Act
ing
Yes
B2Vi
ctor
Kha
nye
MP3
11YE
SQ
ualifi
ed-
Perm
anen
tPe
rman
ent
B2D
r J.S
. Mor
oka
MP3
16YE
SQ
ualifi
ed-
Act
ing
Perm
anen
t
B2Th
embi
sile
Han
iM
P315
YES
Qua
lified
YES
Perm
anen
tPe
rman
ent
Yes
B2Th
aba
Chw
euM
P321
-D
iscl
aim
er o
f opi
nion
-Pe
rman
ent
Perm
anen
t
B2Bu
shbu
ckrid
geM
P325
YES
Unq
ualifi
ed w
ith
findi
ngs
-Pe
rman
ent
Perm
anen
t
B2N
kom
azi
MP3
24-
Unq
ualifi
ed w
ith
findi
ngs
YES
Perm
anen
tPe
rman
ent
B2G
a-Se
gony
ana
NC
452
YES
Dis
clai
mer
of o
pini
on-
Act
ing
Perm
anen
t
B2G
amag
ara
NC
453
-O
utst
andi
ngYE
SA
ctin
gPe
rman
ent
B2Jo
e M
orol
ong
NC
451
YES
Dis
clai
mer
of o
pini
on-
Act
ing
Act
ing
Cons
olid
ated
sud
it o
utco
mes
, int
erve
ntio
ns, v
acan
cies
and
dis
tres
s lis
t

102
THE STATE OF LOCAL GOVERNMENT FINANCES AND FINANCIAL MANAGEMENTAS AT 30 JUNE 2017
ANNEXURE A2Ca
tego
ryM
unici
palit
y Nam
eM
uni
Code
Finan
cial
Distr
ess
2016
/17
Audi
t Out
com
e 201
5/16
Persi
siten
t Ca
pita
l Un
dersp
endi
ng
2015
-17
MM
vaca
ncy
CFO
vaca
ncy
Sect
ion 1
39
Inte
rven
tions
M
arch
2017
MFIP
Su
ppor
t Pe
rsiste
nt D
istre
ss
B2H
anta
mN
C06
5YE
SQ
ualifi
ed-
Act
ing
Act
ing
B2Ka
mie
sber
gN
C06
4YE
SQ
ualifi
ed-
Act
ing
Perm
anen
tYe
s
B2Ka
roo
Hoo
glan
dN
C06
6YE
SQ
ualifi
ed-
Act
ing
Perm
anen
t
B2Kh
ai-M
aN
C06
7YE
SU
nqua
lified
with
fin
ding
s-
Act
ing
Perm
anen
t
B2N
ama
Khoi
NC
062
YES
Qua
lified
-Pe
rman
ent
Act
ing
B2Ri
chte
rsve
ldN
C06
1YE
SQ
ualifi
ed-
Act
ing
Perm
anen
t
B2Em
than
jeni
NC
073
YES
Unq
ualifi
ed w
ith
findi
ngs
YES
Act
ing
Perm
anen
t
B2Ka
reeb
erg
NC
074
-U
nqua
lified
with
fin
ding
sYE
SA
ctin
gA
ctin
g
B2Re
nost
erbe
rgN
C07
5YE
SO
utst
andi
ng-
Act
ing
Act
ing
B2Si
yanc
uma
NC
078
YES
Qua
lified
-A
ctin
gPe
rman
ent
Yes
B2Si
yath
emba
NC
077
YES
Dis
clai
mer
of o
pini
onYE
SA
ctin
gPe
rman
ent
B2Th
embe
lihle
NC
076
YES
Qua
lified
-A
ctin
gA
ctin
gYe
s
B2U
bunt
uN
C07
1-
Dis
clai
mer
of o
pini
onYE
SPe
rman
ent
Perm
anen
tYe
s
Cons
olid
ated
sud
it o
utco
mes
, int
erve
ntio
ns, v
acan
cies
and
dis
tres
s lis
t
5 5 5 5 3 4 1 3 2 4 3 3 4
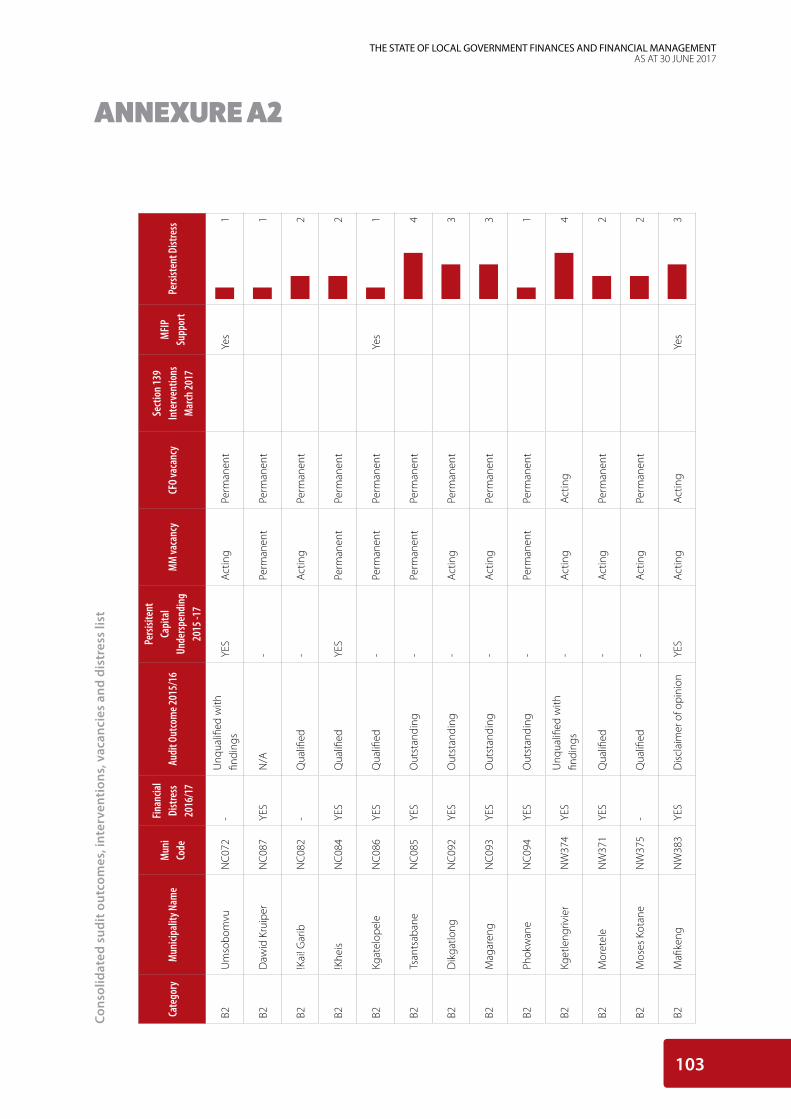
103
THE STATE OF LOCAL GOVERNMENT FINANCES AND FINANCIAL MANAGEMENTAS AT 30 JUNE 2017
ANNEXURE A2
Cate
gory
Mun
icipa
lity N
ame
Mun
i Co
de
Finan
cial
Distr
ess
2016
/17
Audi
t Out
com
e 201
5/16
Persi
siten
t Ca
pita
l Un
dersp
endi
ng
2015
-17
MM
vaca
ncy
CFO
vaca
ncy
Sect
ion 1
39
Inte
rven
tions
M
arch
2017
MFIP
Su
ppor
t Pe
rsiste
nt D
istre
ss
B2U
mso
bom
vuN
C07
2-
Unq
ualifi
ed w
ith
findi
ngs
YES
Act
ing
Perm
anen
tYe
s
B2D
awid
Kru
iper
NC
087
YES
N/A
-Pe
rman
ent
Perm
anen
t
B2!K
ai! G
arib
NC
082
-Q
ualifi
ed-
Act
ing
Perm
anen
t
B2!K
heis
NC
084
YES
Qua
lified
YES
Perm
anen
tPe
rman
ent
B2Kg
atel
opel
eN
C08
6YE
SQ
ualifi
ed-
Perm
anen
tPe
rman
ent
Yes
B2Ts
ants
aban
eN
C08
5YE
SO
utst
andi
ng-
Perm
anen
tPe
rman
ent
B2D
ikga
tlong
NC
092
YES
Out
stan
ding
-A
ctin
gPe
rman
ent
B2M
agar
eng
NC
093
YES
Out
stan
ding
-A
ctin
gPe
rman
ent
B2Ph
okw
ane
NC
094
YES
Out
stan
ding
-Pe
rman
ent
Perm
anen
t
B2Kg
etle
ngriv
ier
NW
374
YES
Unq
ualifi
ed w
ith
findi
ngs
-A
ctin
gA
ctin
g
B2M
oret
ele
NW
371
YES
Qua
lified
-A
ctin
gPe
rman
ent
B2M
oses
Kot
ane
NW
375
-Q
ualifi
ed-
Act
ing
Perm
anen
t
B2M
afike
ngN
W38
3YE
SD
iscl
aim
er o
f opi
nion
YES
Act
ing
Act
ing
Yes
Cons
olid
ated
sud
it o
utco
mes
, int
erve
ntio
ns, v
acan
cies
and
dis
tres
s lis
t
1 1 2 2 1 4 3 3 1 4 2 2 3

104
THE STATE OF LOCAL GOVERNMENT FINANCES AND FINANCIAL MANAGEMENTAS AT 30 JUNE 2017
ANNEXURE A2Ca
tego
ryM
unici
palit
y Nam
eM
uni
Code
Finan
cial
Distr
ess
2016
/17
Audi
t Out
com
e 201
5/16
Persi
siten
t Ca
pita
l Un
dersp
endi
ng
2015
-17
MM
vaca
ncy
CFO
vaca
ncy
Sect
ion 1
39
Inte
rven
tions
M
arch
2017
MFIP
Su
ppor
t Pe
rsiste
nt D
istre
ss
B2D
itsob
otla
NW
384
YES
Qua
lified
-A
ctin
gPe
rman
ent
B2Ra
mot
sher
e M
oilo
aN
W38
5-
Qua
lified
-A
ctin
gA
ctin
g
B2Ts
wai
ngN
W38
2-
Qua
lified
-A
ctin
gA
ctin
g
B2Ra
tlou
NW
381
-Q
ualifi
ed-
Perm
anen
tPe
rman
ent
B2Le
kwa-
Teem
ane
NW
396
YES
Dis
clai
mer
of o
pini
onYE
SA
ctin
gA
ctin
gYe
s
B2M
amus
aN
W39
3-
Dis
clai
mer
of o
pini
on-
Act
ing
Act
ing
B2N
aled
i (N
w)
NW
392
YES
Unq
ualifi
ed w
ith
findi
ngs
-A
ctin
gA
ctin
g
B2G
reat
er T
aung
NW
394
YES
Qua
lified
-Pe
rman
ent
Perm
anen
t
B2Ka
gisa
no-M
olop
oN
W39
7-
Unq
ualifi
ed w
ith
findi
ngs
YES
Perm
anen
tA
ctin
g
B2M
aqua
ssi H
ills
NW
404
YES
Qua
lified
-Pe
rman
ent
Act
ing
Yes
B2Sa
ldan
ha B
ayW
C01
4-
Unq
ualifi
ed -
No
findi
ngs
YES
Perm
anen
tPe
rman
ent
B2Be
rgriv
ier
WC
013
-U
nqua
lified
- N
o fin
ding
s-
Perm
anen
tPe
rman
ent
B2Ce
derb
erg
WC
012
-U
nqua
lified
with
fin
ding
sYE
SA
ctin
gPe
rman
ent
Cons
olid
ated
sud
it o
utco
mes
, int
erve
ntio
ns, v
acan
cies
and
dis
tres
s lis
t
4 4 1 0 6 5 4 4 1 3 0 0 2

105
THE STATE OF LOCAL GOVERNMENT FINANCES AND FINANCIAL MANAGEMENTAS AT 30 JUNE 2017
ANNEXURE A2
Cate
gory
Mun
icipa
lity N
ame
Mun
i Co
de
Finan
cial
Distr
ess
2016
/17
Audi
t Out
com
e 201
5/16
Persi
siten
t Ca
pita
l Un
dersp
endi
ng
2015
-17
MM
vaca
ncy
CFO
vaca
ncy
Sect
ion 1
39
Inte
rven
tions
M
arch
2017
MFIP
Su
ppor
t Pe
rsiste
nt D
istre
ss
B2M
atzi
kam
aW
C01
1-
Unq
ualifi
ed -
No
findi
ngs
-Pe
rman
ent
Perm
anen
t
B2Sw
artla
ndW
C01
5-
Unq
ualifi
ed -
No
findi
ngs
-Pe
rman
ent
Perm
anen
t
B2Br
eede
Val
ley
WC
025
-U
nqua
lified
- N
o fin
ding
s-
Perm
anen
tPe
rman
ent
B2La
ngeb
erg
WC
026
-U
nqua
lified
- N
o fin
ding
s-
Perm
anen
tPe
rman
ent
B2W
itzen
berg
WC
022
-U
nqua
lified
- N
o fin
ding
s-
Perm
anen
tPe
rman
ent
B2O
vers
tran
dW
C03
2-
Unq
ualifi
ed -
No
findi
ngs
-Pe
rman
ent
Perm
anen
t
B2Ca
pe A
gulh
asW
C03
3-
Unq
ualifi
ed -
No
findi
ngs
-Pe
rman
ent
Perm
anen
t
B2Sw
elle
ndam
WC
034
-U
nqua
lified
- N
o fin
ding
sYE
SA
ctin
gPe
rman
ent
B2Th
eew
ater
sklo
ofW
C03
1-
Unq
ualifi
ed -
No
findi
ngs
-A
ctin
gPe
rman
ent
B2Kn
ysna
WC
048
-U
nqua
lified
- N
o fin
ding
s-
Perm
anen
tPe
rman
ent
B2M
osse
l Bay
WC
043
-U
nqua
lified
- N
o fin
ding
s-
Perm
anen
tPe
rman
ent
B2O
udts
hoor
nW
C04
5YE
SQ
ualifi
ed-
Perm
anen
tPe
rman
ent
Yes
B2Bi
tou
WC
047
-U
nqua
lified
- N
o fin
ding
s-
Perm
anen
tPe
rman
ent
Cons
olid
ated
sud
it o
utco
mes
, int
erve
ntio
ns, v
acan
cies
and
dis
tres
s lis
t
0 0 0 0 2 0 0 2 0 0 0 1 0
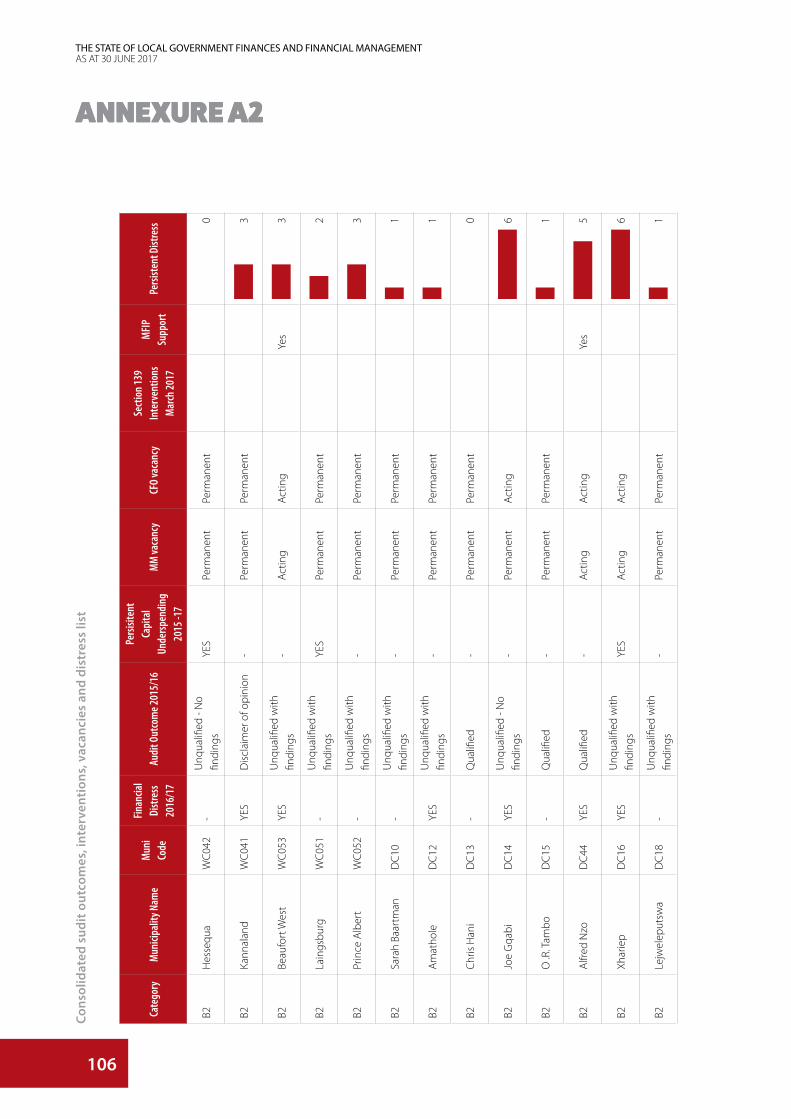
106
THE STATE OF LOCAL GOVERNMENT FINANCES AND FINANCIAL MANAGEMENTAS AT 30 JUNE 2017
ANNEXURE A2ANNEXURE A2Ca
tego
ryM
unici
palit
y Nam
eM
uni
Code
Finan
cial
Distr
ess
2016
/17
Audi
t Out
com
e 201
5/16
Persi
siten
t Ca
pita
l Un
dersp
endi
ng
2015
-17
MM
vaca
ncy
CFO
vaca
ncy
Sect
ion 1
39
Inte
rven
tions
M
arch
2017
MFIP
Su
ppor
t Pe
rsiste
nt D
istre
ss
B2H
esse
qua
WC
042
-U
nqua
lified
- N
o fin
ding
sYE
SPe
rman
ent
Perm
anen
t
B2Ka
nnal
and
WC
041
YES
Dis
clai
mer
of o
pini
on-
Perm
anen
tPe
rman
ent
B2Be
aufo
rt W
est
WC
053
YES
Unq
ualifi
ed w
ith
findi
ngs
-A
ctin
gA
ctin
gYe
s
B2La
ings
burg
WC
051
-U
nqua
lified
with
fin
ding
sYE
SPe
rman
ent
Perm
anen
t
B2Pr
ince
Alb
ert
WC
052
-U
nqua
lified
with
fin
ding
s-
Perm
anen
tPe
rman
ent
B2Sa
rah
Baar
tman
DC
10-
Unq
ualifi
ed w
ith
findi
ngs
-Pe
rman
ent
Perm
anen
t
B2A
mat
hole
DC
12YE
SU
nqua
lified
with
fin
ding
s-
Perm
anen
tPe
rman
ent
B2C
hris
Han
iD
C13
-Q
ualifi
ed-
Perm
anen
tPe
rman
ent
B2Jo
e G
qabi
DC
14YE
SU
nqua
lified
- N
o fin
ding
s-
Perm
anen
tA
ctin
g
B2O
.R. T
ambo
DC
15-
Qua
lified
-Pe
rman
ent
Perm
anen
t
B2A
lfred
Nzo
DC
44YE
SQ
ualifi
ed-
Act
ing
Act
ing
Yes
B2Xh
arie
pD
C16
YES
Unq
ualifi
ed w
ith
findi
ngs
YES
Act
ing
Act
ing
B2Le
jwel
eput
swa
DC
18-
Unq
ualifi
ed w
ith
findi
ngs
-Pe
rman
ent
Perm
anen
t
Cons
olid
ated
sud
it o
utco
mes
, int
erve
ntio
ns, v
acan
cies
and
dis
tres
s lis
t
0 3 3 2 3 1 1 0 6 1 5 6 1
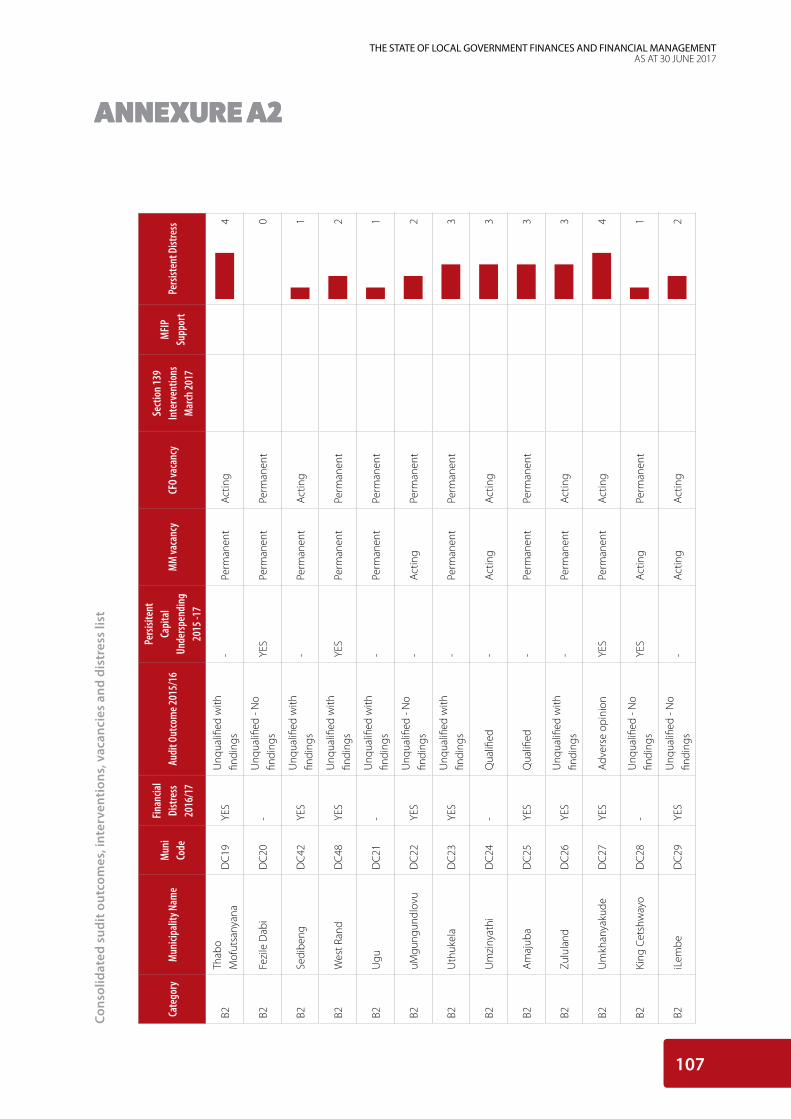
107
THE STATE OF LOCAL GOVERNMENT FINANCES AND FINANCIAL MANAGEMENTAS AT 30 JUNE 2017
ANNEXURE A2ANNEXURE A2
Cate
gory
Mun
icipa
lity N
ame
Mun
i Co
de
Finan
cial
Distr
ess
2016
/17
Audi
t Out
com
e 201
5/16
Persi
siten
t Ca
pita
l Un
dersp
endi
ng
2015
-17
MM
vaca
ncy
CFO
vaca
ncy
Sect
ion 1
39
Inte
rven
tions
M
arch
2017
MFIP
Su
ppor
t Pe
rsiste
nt D
istre
ss
B2Th
abo
Mof
utsa
nyan
aD
C19
YES
Unq
ualifi
ed w
ith
findi
ngs
-Pe
rman
ent
Act
ing
B2Fe
zile
Dab
iD
C20
-U
nqua
lified
- N
o fin
ding
sYE
SPe
rman
ent
Perm
anen
t
B2Se
dibe
ngD
C42
YES
Unq
ualifi
ed w
ith
findi
ngs
-Pe
rman
ent
Act
ing
B2W
est R
and
DC
48YE
SU
nqua
lified
with
fin
ding
sYE
SPe
rman
ent
Perm
anen
t
B2U
guD
C21
-U
nqua
lified
with
fin
ding
s-
Perm
anen
tPe
rman
ent
B2uM
gung
undl
ovu
DC
22YE
SU
nqua
lified
- N
o fin
ding
s-
Act
ing
Perm
anen
t
B2U
thuk
ela
DC
23YE
SU
nqua
lified
with
fin
ding
s-
Perm
anen
tPe
rman
ent
B2U
mzi
nyat
hiD
C24
-Q
ualifi
ed-
Act
ing
Act
ing
B2A
maj
uba
DC
25YE
SQ
ualifi
ed-
Perm
anen
tPe
rman
ent
B2Zu
lula
ndD
C26
YES
Unq
ualifi
ed w
ith
findi
ngs
-Pe
rman
ent
Act
ing
B2U
mkh
anya
kude
DC
27YE
SA
dver
se o
pini
onYE
SPe
rman
ent
Act
ing
B2Ki
ng C
etsh
way
oD
C28
-U
nqua
lified
- N
o fin
ding
sYE
SA
ctin
gPe
rman
ent
B2iL
embe
DC
29YE
SU
nqua
lified
- N
o fin
ding
s-
Act
ing
Act
ing
Cons
olid
ated
sud
it o
utco
mes
, int
erve
ntio
ns, v
acan
cies
and
dis
tres
s lis
t
4 0 1 2 1 2 3 3 3 3 4 1 2
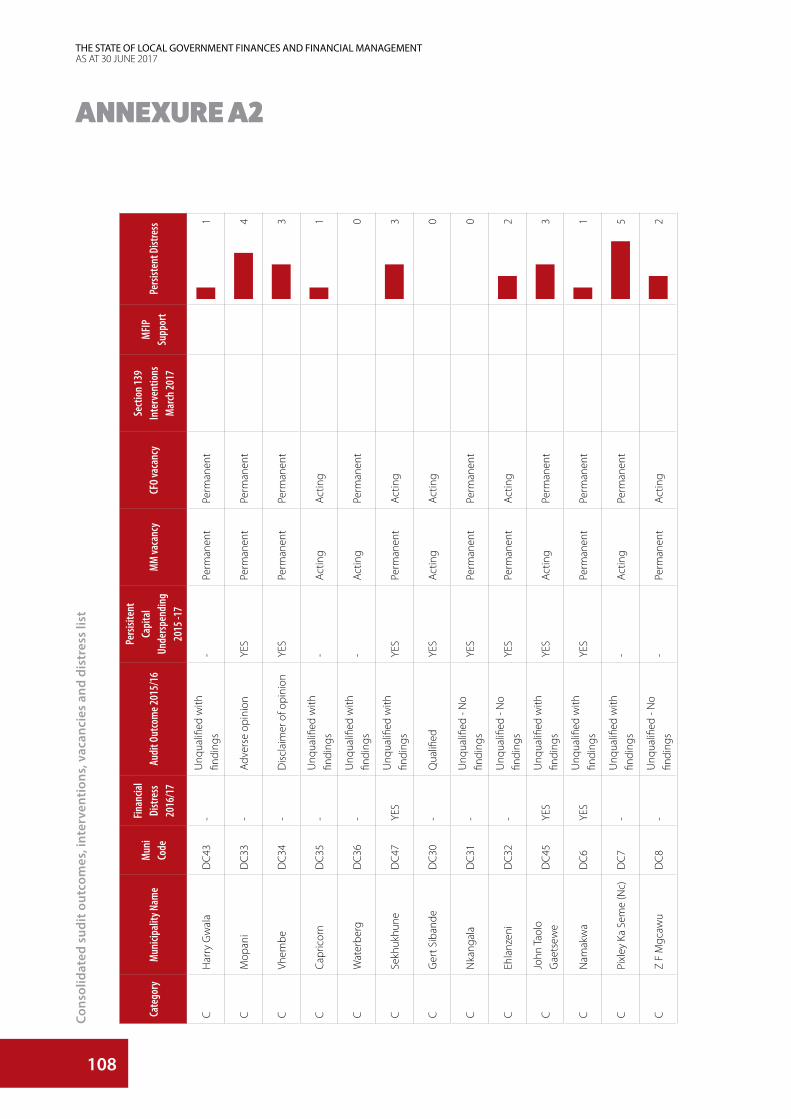
108
THE STATE OF LOCAL GOVERNMENT FINANCES AND FINANCIAL MANAGEMENTAS AT 30 JUNE 2017
ANNEXURE A2Ca
tego
ryM
unici
palit
y Nam
eM
uni
Code
Finan
cial
Distr
ess
2016
/17
Audi
t Out
com
e 201
5/16
Persi
siten
t Ca
pita
l Un
dersp
endi
ng
2015
-17
MM
vaca
ncy
CFO
vaca
ncy
Sect
ion 1
39
Inte
rven
tions
M
arch
2017
MFIP
Su
ppor
t Pe
rsiste
nt D
istre
ss
CH
arry
Gw
ala
DC
43-
Unq
ualifi
ed w
ith
findi
ngs
-Pe
rman
ent
Perm
anen
t
CM
opan
iD
C33
-A
dver
se o
pini
onYE
SPe
rman
ent
Perm
anen
t
CVh
embe
DC
34-
Dis
clai
mer
of o
pini
onYE
SPe
rman
ent
Perm
anen
t
CCa
pric
orn
DC
35-
Unq
ualifi
ed w
ith
findi
ngs
-A
ctin
gA
ctin
g
CW
ater
berg
DC
36-
Unq
ualifi
ed w
ith
findi
ngs
-A
ctin
gPe
rman
ent
CSe
khuk
hune
DC
47YE
SU
nqua
lified
with
fin
ding
sYE
SPe
rman
ent
Act
ing
CG
ert S
iban
deD
C30
-Q
ualifi
edYE
SA
ctin
gA
ctin
g
CN
kang
ala
DC
31-
Unq
ualifi
ed -
No
findi
ngs
YES
Perm
anen
tPe
rman
ent
CEh
lanz
eni
DC
32-
Unq
ualifi
ed -
No
findi
ngs
YES
Perm
anen
tA
ctin
g
CJo
hn T
aolo
G
aets
ewe
DC
45YE
SU
nqua
lified
with
fin
ding
sYE
SA
ctin
gPe
rman
ent
CN
amak
wa
DC
6YE
SU
nqua
lified
with
fin
ding
sYE
SPe
rman
ent
Perm
anen
t
CPi
xley
Ka
Sem
e (N
c)D
C7
-U
nqua
lified
with
fin
ding
s-
Act
ing
Perm
anen
t
CZ
F M
gcaw
uD
C8
-U
nqua
lified
- N
o fin
ding
s-
Perm
anen
tA
ctin
g
Cons
olid
ated
sud
it o
utco
mes
, int
erve
ntio
ns, v
acan
cies
and
dis
tres
s lis
t
1 4 3 1 0 3 0 0 2 3 1 5 2
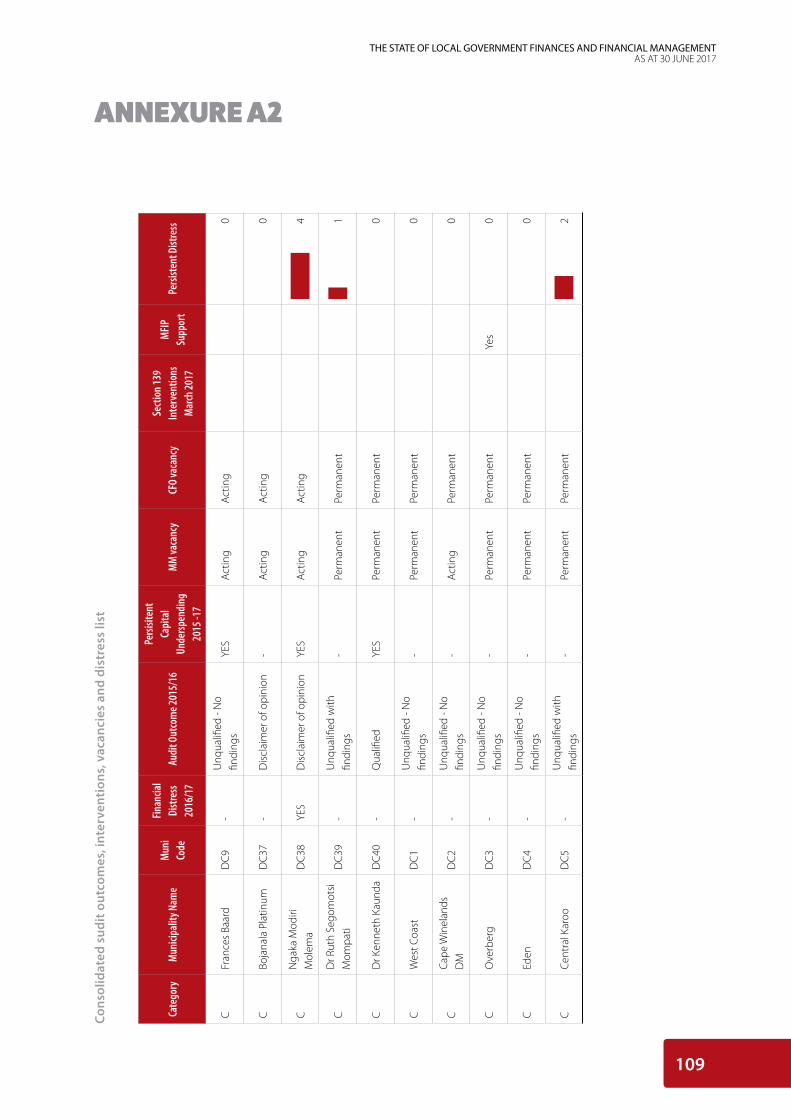
109
THE STATE OF LOCAL GOVERNMENT FINANCES AND FINANCIAL MANAGEMENTAS AT 30 JUNE 2017
ANNEXURE A2
Cate
gory
Mun
icipa
lity N
ame
Mun
i Co
de
Finan
cial
Distr
ess
2016
/17
Audi
t Out
com
e 201
5/16
Persi
siten
t Ca
pita
l Un
dersp
endi
ng
2015
-17
MM
vaca
ncy
CFO
vaca
ncy
Sect
ion 1
39
Inte
rven
tions
M
arch
2017
MFIP
Su
ppor
t Pe
rsiste
nt D
istre
ss
CFr
ance
s Ba
ard
DC
9-
Unq
ualifi
ed -
No
findi
ngs
YES
Act
ing
Act
ing
CBo
jana
la P
latin
umD
C37
-D
iscl
aim
er o
f opi
nion
-A
ctin
gA
ctin
g
CN
gaka
Mod
iri
Mol
ema
DC
38YE
SD
iscl
aim
er o
f opi
nion
YES
Act
ing
Act
ing
CD
r Rut
h Se
gom
otsi
M
ompa
tiD
C39
-U
nqua
lified
with
fin
ding
s-
Perm
anen
tPe
rman
ent
CD
r Ken
neth
Kau
nda
DC
40-
Qua
lified
YES
Perm
anen
tPe
rman
ent
CW
est C
oast
DC
1-
Unq
ualifi
ed -
No
findi
ngs
-Pe
rman
ent
Perm
anen
t
CCa
pe W
inel
ands
D
MD
C2
-U
nqua
lified
- N
o fin
ding
s-
Act
ing
Perm
anen
t
CO
verb
erg
DC
3-
Unq
ualifi
ed -
No
findi
ngs
-Pe
rman
ent
Perm
anen
tYe
s
CEd
enD
C4
-U
nqua
lified
- N
o fin
ding
s-
Perm
anen
tPe
rman
ent
CCe
ntra
l Kar
ooD
C5
-U
nqua
lified
with
fin
ding
s-
Perm
anen
tPe
rman
ent
Cons
olid
ated
sud
it o
utco
mes
, int
erve
ntio
ns, v
acan
cies
and
dis
tres
s lis
t
0 0 4 1 0 0 0 0 0 2
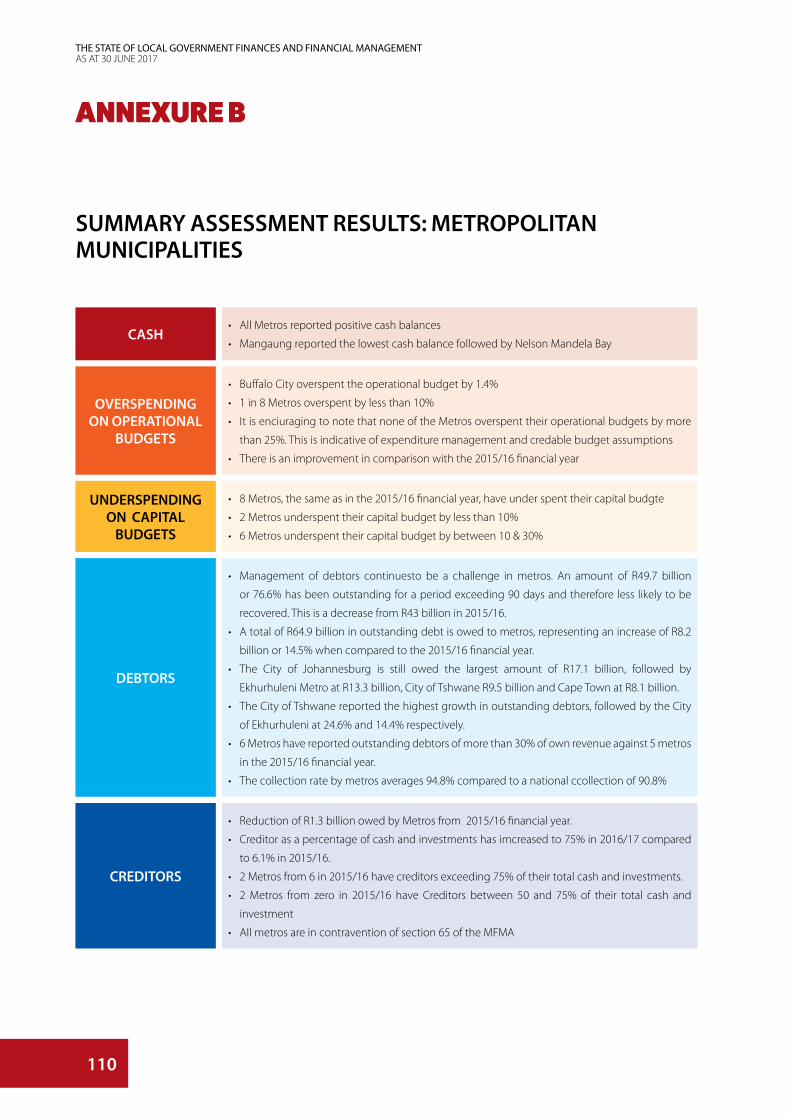
110
THE STATE OF LOCAL GOVERNMENT FINANCES AND FINANCIAL MANAGEMENTAS AT 30 JUNE 2017
ANNEXURE B
SUMMARY ASSESSMENT RESULTS: METROPOLITAN MUNICIPALITIES
CASH• All Metros reported positive cash balances
• Mangaung reported the lowest cash balance followed by Nelson Mandela Bay
• Buffalo City overspent the operational budget by 1.4%
• 1 in 8 Metros overspent by less than 10%
• It is enciuraging to note that none of the Metros overspent their operational budgets by more
than 25%. This is indicative of expenditure management and credable budget assumptions
• There is an improvement in comparison with the 2015/16 financial year
• 8 Metros, the same as in the 2015/16 financial year, have under spent their capital budgte
• 2 Metros underspent their capital budget by less than 10%
• 6 Metros underspent their capital budget by between 10 & 30%
• Management of debtors continuesto be a challenge in metros. An amount of R49.7 billion
or 76.6% has been outstanding for a period exceeding 90 days and therefore less likely to be
recovered. This is a decrease from R43 billion in 2015/16.
• A total of R64.9 billion in outstanding debt is owed to metros, representing an increase of R8.2
billion or 14.5% when compared to the 2015/16 financial year.
• The City of Johannesburg is still owed the largest amount of R17.1 billion, followed by
Ekhurhuleni Metro at R13.3 billion, City of Tshwane R9.5 billion and Cape Town at R8.1 billion.
• The City of Tshwane reported the highest growth in outstanding debtors, followed by the City
of Ekhurhuleni at 24.6% and 14.4% respectively.
• 6 Metros have reported outstanding debtors of more than 30% of own revenue against 5 metros
in the 2015/16 financial year.
• The collection rate by metros averages 94.8% compared to a national ccollection of 90.8%
• Reduction of R1.3 billion owed by Metros from 2015/16 financial year.
• Creditor as a percentage of cash and investments has imcreased to 75% in 2016/17 compared
to 6.1% in 2015/16.
• 2 Metros from 6 in 2015/16 have creditors exceeding 75% of their total cash and investments.
• 2 Metros from zero in 2015/16 have Creditors between 50 and 75% of their total cash and
investment
• All metros are in contravention of section 65 of the MFMA
OVERSPENDING ON OPERATIONAL
BUDGETS
UNDERSPENDINGON CAPITAL
BUDGETS
DEBTORS
CREDITORS

111
THE STATE OF LOCAL GOVERNMENT FINANCES AND FINANCIAL MANAGEMENTAS AT 30 JUNE 2017
ANNEXURE B
1. CASH PERFORMANCE
2013/14 2014/15 2015/16 2016/17Overall Trend
Municipality Risk Action
Positive Cash balance: 30 June 2017
8 8 8 8All metro recorded positive cash balances
LowNone required
Negative Cash balances (assessed as the number of months over the previous 6 months)
For more than 3 months
0 0 0 0 None LowNone required
Between 1 and 3 months
0 0 0 0 None LowNone required
Less than 1 months
0 0 0 0 None LowNone required
Cash Coverage (ability of municipality to cover monthly operational expenditure):
More than 3 months of operational expenditure
1 3 3 2 Buffalo City, eThekwini Low
Between 1-3 months
6 4 3 3City of Johannesburg, Ekurhuleni, Nelson Mandela Bay
Low
1 month or less 1 1 1 3City Of Tshwane, Mangaung, Cape Town
Moderate to high
Requires monthly monitoring
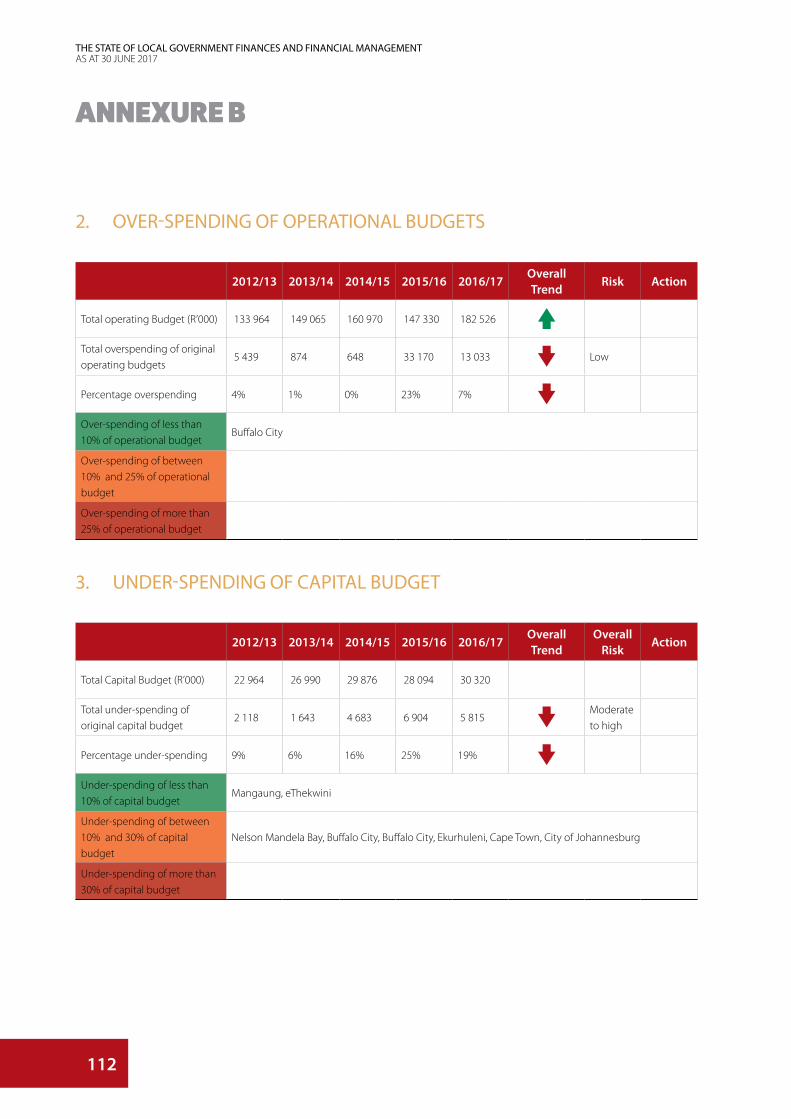
112
THE STATE OF LOCAL GOVERNMENT FINANCES AND FINANCIAL MANAGEMENTAS AT 30 JUNE 2017
ANNEXURE B
2. OVER-SPENDING OF OPERATIONAL BUDGETS
3. UNDER-SPENDING OF CAPITAL BUDGET
2012/13 2013/14 2014/15 2015/16 2016/17Overall Trend
Risk Action
Total operating Budget (R’000) 133 964 149 065 160 970 147 330 182 526
Total overspending of original operating budgets
5 439 874 648 33 170 13 033 Low
Percentage overspending 4% 1% 0% 23% 7%
Over-spending of less than 10% of operational budget
Buffalo City
Over-spending of between 10% and 25% of operational budget
Over-spending of more than 25% of operational budget
2012/13 2013/14 2014/15 2015/16 2016/17Overall Trend
Overall Risk
Action
Total Capital Budget (R’000) 22 964 26 990 29 876 28 094 30 320
Total under-spending of original capital budget
2 118 1 643 4 683 6 904 5 815 Moderate to high
Percentage under-spending 9% 6% 16% 25% 19%
Under-spending of less than 10% of capital budget
Mangaung, eThekwini
Under-spending of between 10% and 30% of capital budget
Nelson Mandela Bay, Buffalo City, Buffalo City, Ekurhuleni, Cape Town, City of Johannesburg
Under-spending of more than 30% of capital budget
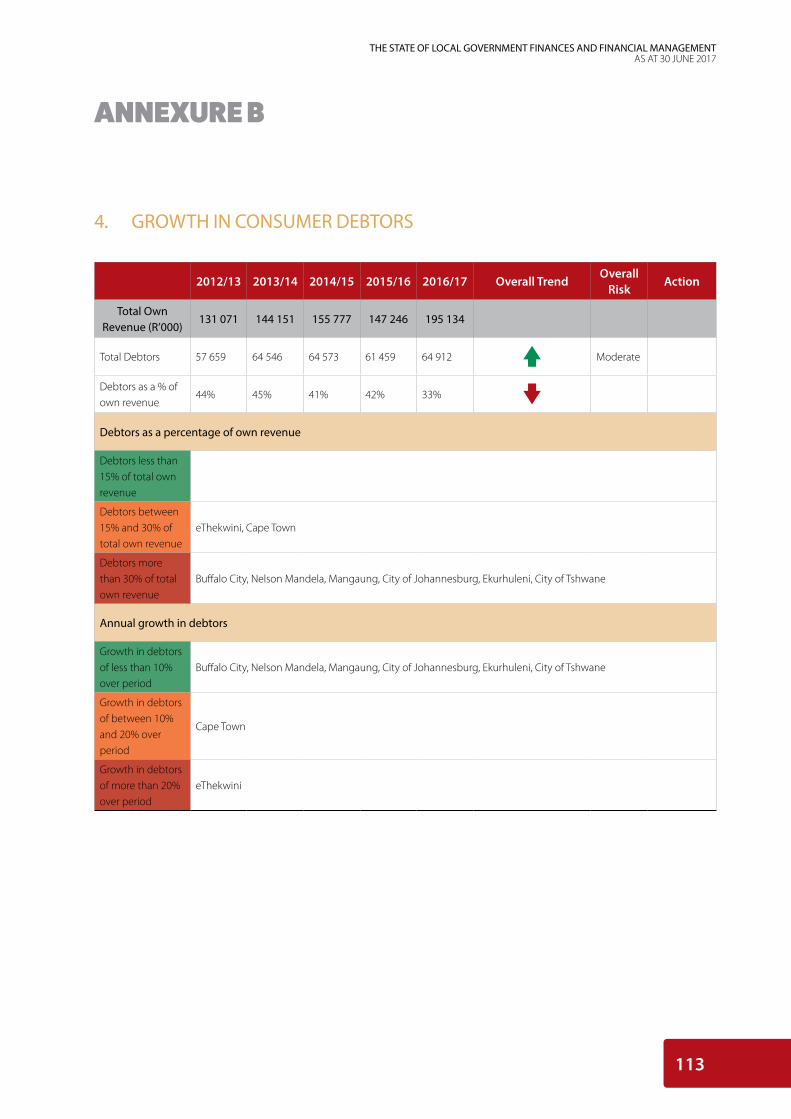
113
THE STATE OF LOCAL GOVERNMENT FINANCES AND FINANCIAL MANAGEMENTAS AT 30 JUNE 2017
ANNEXURE B
4. GROWTH IN CONSUMER DEBTORS
2012/13 2013/14 2014/15 2015/16 2016/17 Overall TrendOverall
RiskAction
Total Own Revenue (R’000)
131 071 144 151 155 777 147 246 195 134
Total Debtors 57 659 64 546 64 573 61 459 64 912 Moderate
Debtors as a % of own revenue
44% 45% 41% 42% 33%
Debtors as a percentage of own revenue
Debtors less than 15% of total own revenue
Debtors between 15% and 30% of total own revenue
eThekwini, Cape Town
Debtors more than 30% of total own revenue
Buffalo City, Nelson Mandela, Mangaung, City of Johannesburg, Ekurhuleni, City of Tshwane
Annual growth in debtors
Growth in debtors of less than 10% over period
Buffalo City, Nelson Mandela, Mangaung, City of Johannesburg, Ekurhuleni, City of Tshwane
Growth in debtors of between 10% and 20% over period
Cape Town
Growth in debtors of more than 20% over period
eThekwini

114
THE STATE OF LOCAL GOVERNMENT FINANCES AND FINANCIAL MANAGEMENTAS AT 30 JUNE 2017
ANNEXURE B
5. CREDITOR MANAGEMENT
2012/13 2013/14 2014/15 2015/16 2016/17 Overall TrendOverall
RiskAction
Total Own Revenue (R’000)
131 071 144 151 155 777 147 246 195 134
Total Cash (R’000) 28 839 25 793 27 100 28 269 24 885
Total Creditors 19 107 19 351 27 155 55 710 18 544 Moderate
Creditors as a % of total cash
66% 75% 100% 197% 75%
Creditors less than 25% of total cash
Nelson Mandela Bay
Creditors between 25% and 50% of total cash
Buffalo City, eThekwini, Cape Town
Creditors between 50% and 75% of total cash
Mangaung, City of Johannesburg
Creditors more than 75% of total cash
City of Tshwane, Ekurhuleni

THE STATE OF LOCAL GOVERNMENT FINANCES AND FINANCIAL MANAGEMENTAS AT 30 JUNE 2017
NOTES

THE STATE OF LOCAL GOVERNMENT FINANCES AND FINANCIAL MANAGEMENTAS AT 30 JUNE 2017
NOTES

THE STATE OF LOCAL GOVERNMENT FINANCES AND FINANCIAL MANAGEMENTAS AT 30 JUNE 2017
NOTES
40 Church Square, Pretoria, 0002Private Bag X115, Pretoria, 0001 | T (012) 315 5757, F (012) 406 9055
THE STATEOF LOCAL
GOVERNMENT FINANCES
AND FINANCIALMANAGEMENT
AS AT 30 JUNE 2017