state of maryland mass transit … of maryland mass transit administrationmass transit...
TRANSCRIPT

STATE OF MARYLANDMASS TRANSIT ADMINISTRATIONMASS TRANSIT ADMINISTRATION
BALTIMORE CENTRAL LIGHT RAIL LINETEST PROGRAMTEST PROGRAM
To EvaluateRide Quality for Higher Unbalance Speeds Q y g p
on Curves
Narayana SundaramENSCO, Inc.
August 31, 2010
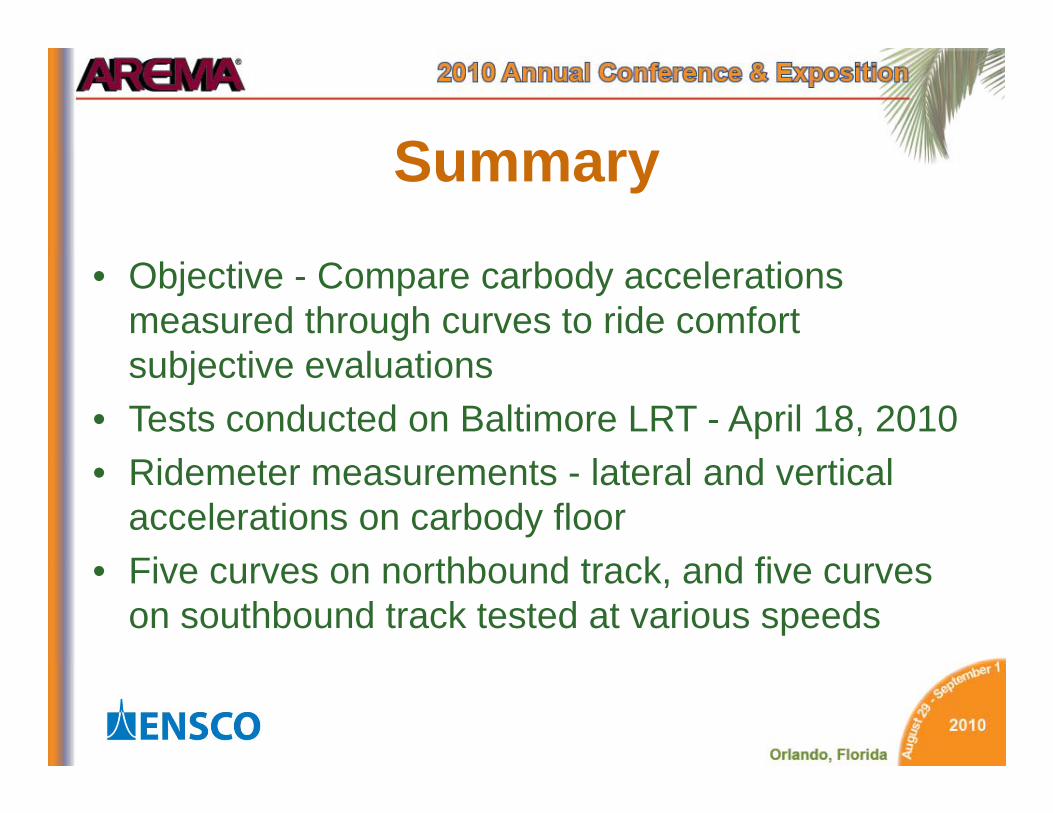
S mmarSummary
• Objective - Compare carbody accelerations measured through curves to ride comfort
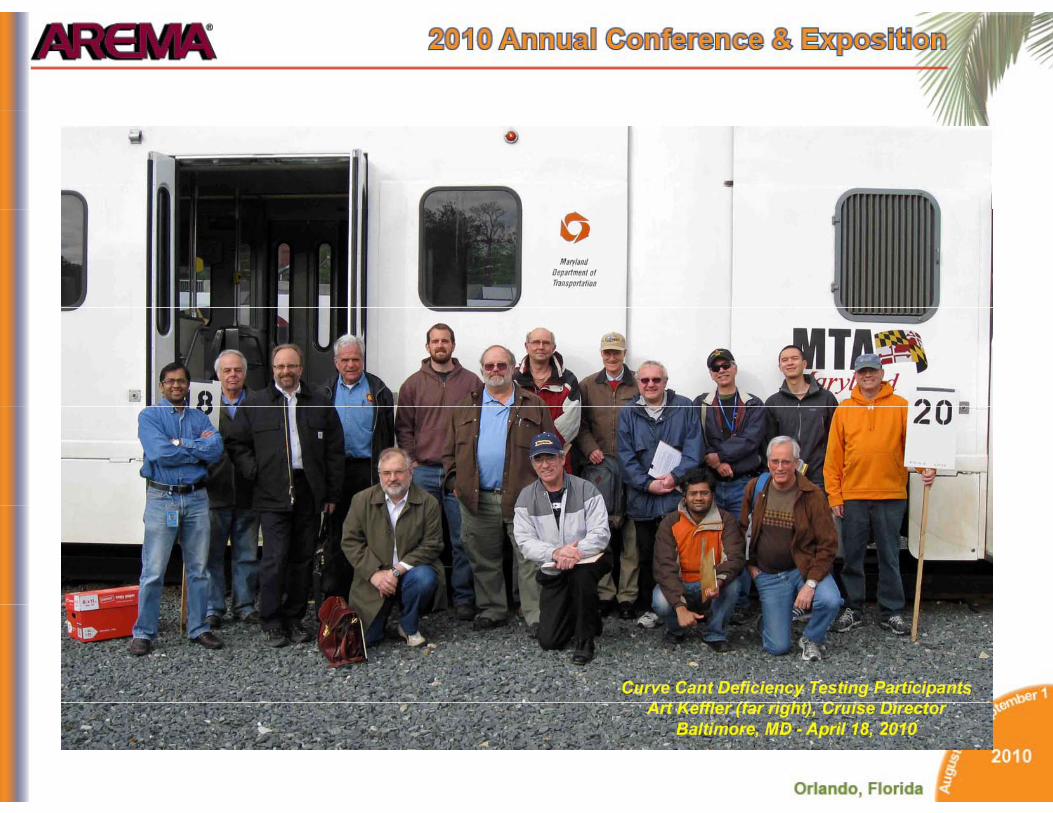
bj ti l tisubjective evaluations• Tests conducted on Baltimore LRT - April 18, 2010 • Ridemeter measurements - lateral and vertical
accelerations on carbody floorFi thb d t k d fi• Five curves on northbound track, and five curves on southbound track tested at various speeds

Test RouteTest Route
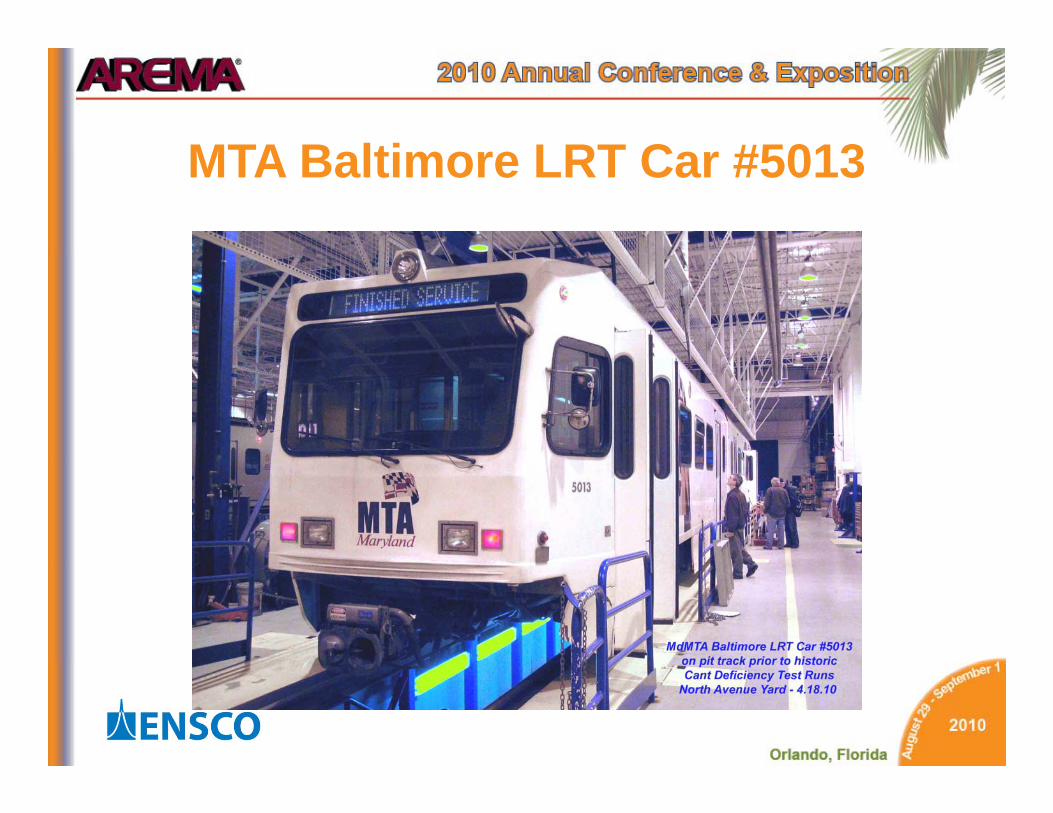
MTA B lti LRT C #5013MTA Baltimore LRT Car #5013
4
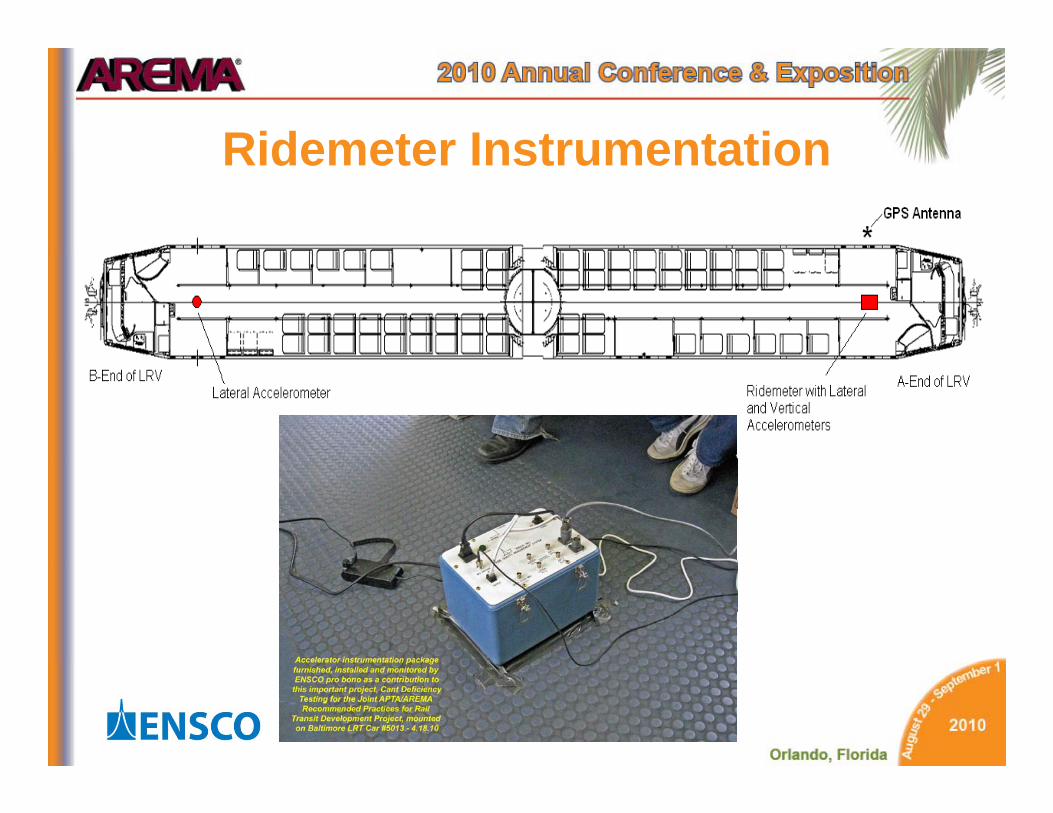
Ridemeter InstrumentationRidemeter Instrumentation
5
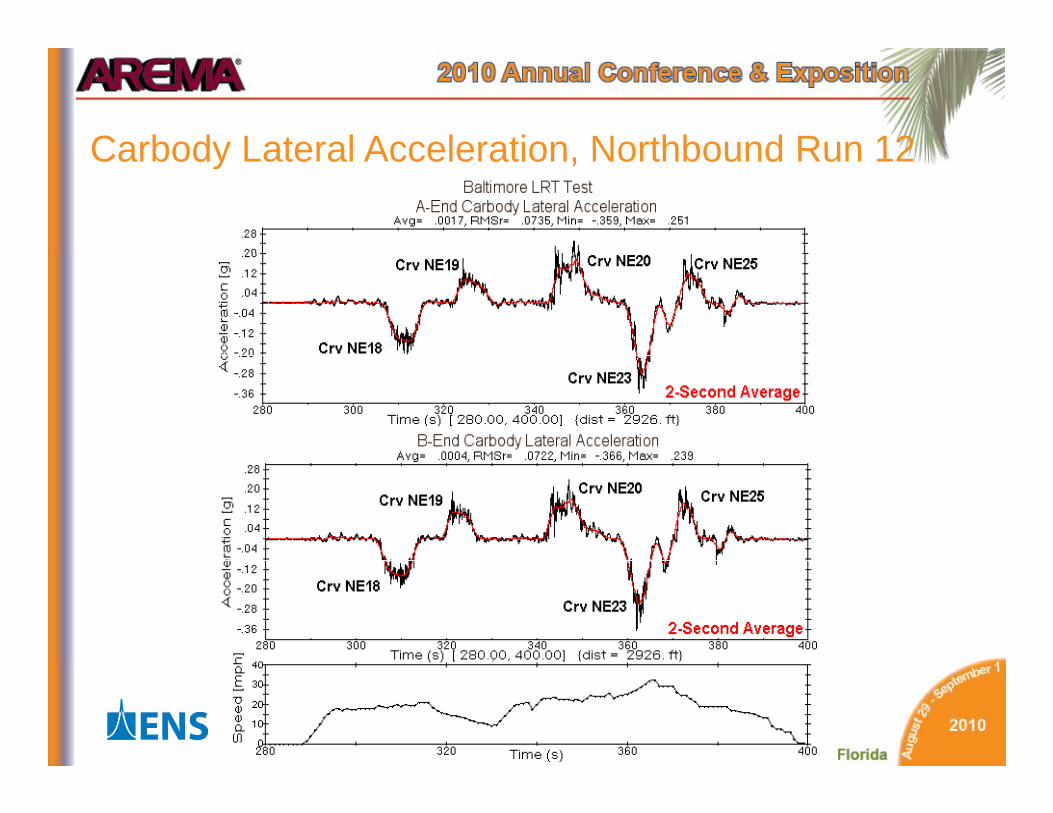
Carbody Lateral Acceleration Northbound Run 12Carbody Lateral Acceleration, Northbound Run 12

Carbody Lateral Acceleration Southbound Run 14Carbody Lateral Acceleration, Southbound Run 14
7
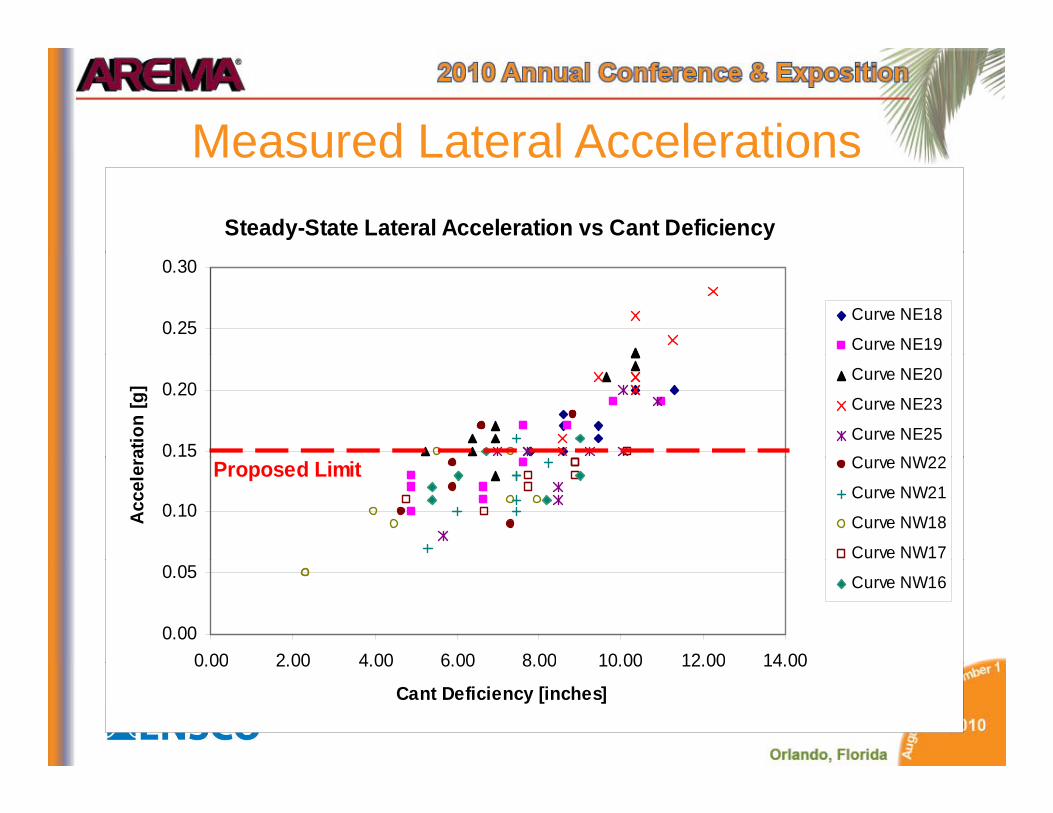
Measured Lateral AccelerationsMeasured Lateral AccelerationsSteady-State Lateral Acceleration vs Cant Deficiency
0.25
0.30
Curve NE18
Curve NE19
0.15
0.20
atio
n [g
] Curve NE20
Curve NE23
Curve NE25C NW22
0.10Acce
ler Curve NW22
Curve NW21
Curve NW18
Curve NW17
Proposed Limit
0.00
0.05
0 00 2 00 4 00 6 00 8 00 10 00 12 00 14 00
Curve NW16
0.00 2.00 4.00 6.00 8.00 10.00 12.00 14.00
Cant Deficiency [inches]
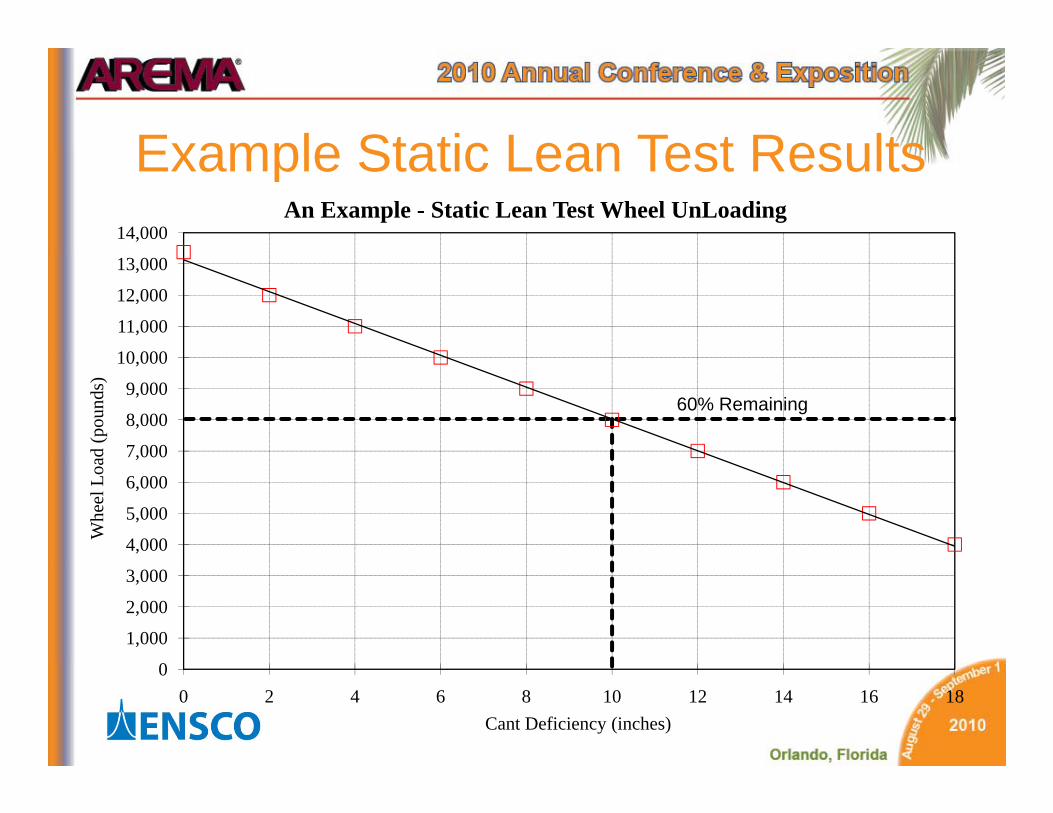
Example Static Lean Test ResultsExample Static Lean Test Results14,000
An Example - Static Lean Test Wheel UnLoading
10 000
11,000
12,000
13,000
7,000
8,000
9,000
10,000
ad (p
ound
s)
60% Remaining
4,000
5,000
6,000
,
Whe
el L
oa
0
1,000
2,000
3,000
00 2 4 6 8 10 12 14 16 18
Cant Deficiency (inches)

Example Static Lean Test ResultsExample Static Lean Test ResultsCorresponding Example Axle and Carbody Steady State
Lateral Accelerations
0.30
0.35
Acceleration Expected on Axles
Acceleration Expected on the Carbody
0.20
0.25
atio
n (g
)
p y
0.10
0.15
Acc
eler
a
0 00
0.05
10
0.000 2 4 6 8 10 12 14
Cant Deficiency (inches)

Measured Lateral Accelerations
Steady-State Lateral Acceleration vs Cant Deficiency
0.25
0.30
Curve NE18
Curve NE19
0 15
0.20
atio
n [g
]
Curve NE19
Curve NE20
Curve NE23
Curve NE25
0.10
0.15
Acce
lera
Curve NW22
Curve NW21
Curve NW18
Proposed Limit
0.00
0.05
0 00 2 00 4 00 6 00 8 00 10 00 12 00 14 00
Curve NW17
Curve NW16
11
0.00 2.00 4.00 6.00 8.00 10.00 12.00 14.00
Cant Deficiency [inches]

Conclusions
• Maximum Steady State lateralMaximum Steady State lateral acceleration measured was 0.28 g.
• More research needs to be conducted in this area to confirm use of higherthis area to confirm use of higher speeds in curves
Th k f tt ti !Thank you for your attention!
Questions, please?
B lti M l dBaltimore, MarylandCentral Light Rail LineCentral Light Rail Line
Lateral Acceleration T iTesting

Test ObjectiveEvaluate lateral acceleration
vs.id fride comfort
• Current standard: 0 10g max (6” Eu)• Current standard: 0.10g max (6 Eu)• Proposed: 0.15g max (9” Eu) For
Embedded Track
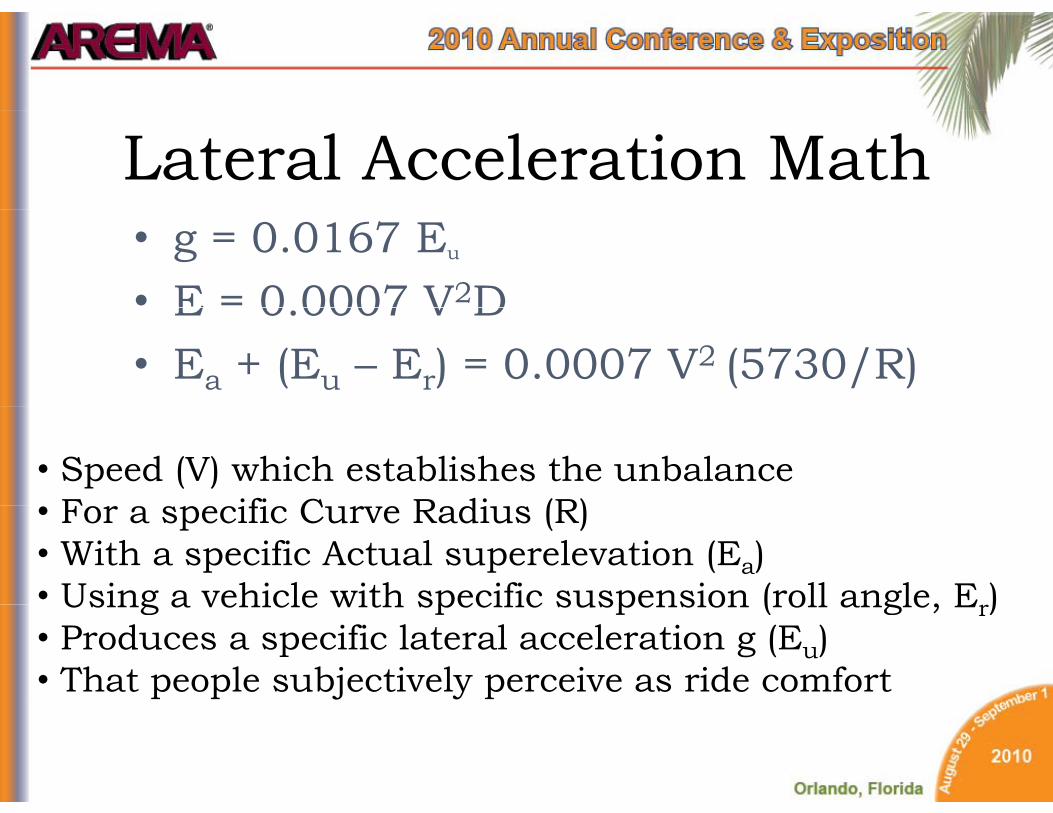
Lateral Acceleration Math• g = 0.0167 Eu
• E = 0 0007 V2DE 0.0007 V D• Ea + (Eu – Er) = 0.0007 V2 (5730/R)
• Speed (V) which establishes the unbalanceF ifi C R di (R)• For a specific Curve Radius (R)
• With a specific Actual superelevation (Ea)• Using a vehicle with specific suspension (roll angle, E )Using a vehicle with specific suspension (roll angle, Er)• Produces a specific lateral acceleration g (Eu)• That people subjectively perceive as ride comfort
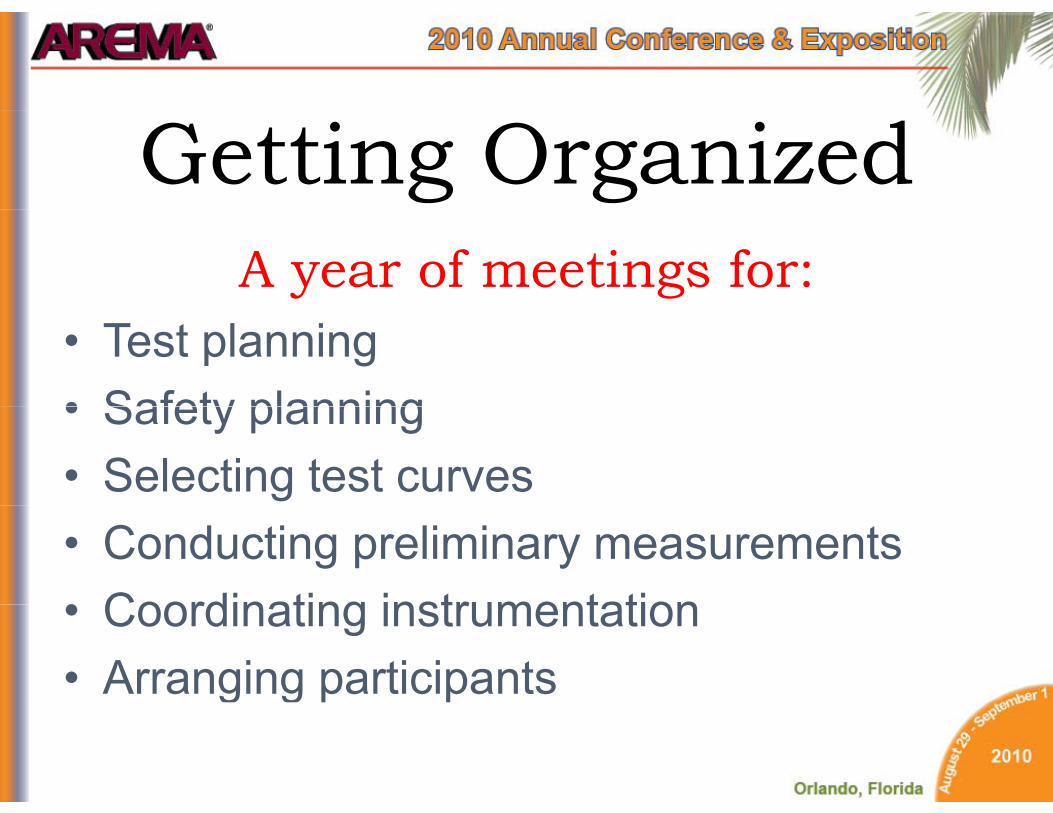
Getting OrganizedA year of meetings for:
• Test planning• Safety planning• Safety planning• Selecting test curves• Conducting preliminary measurements• Coordinating instrumentation• Coordinating instrumentation• Arranging participantsg g p p
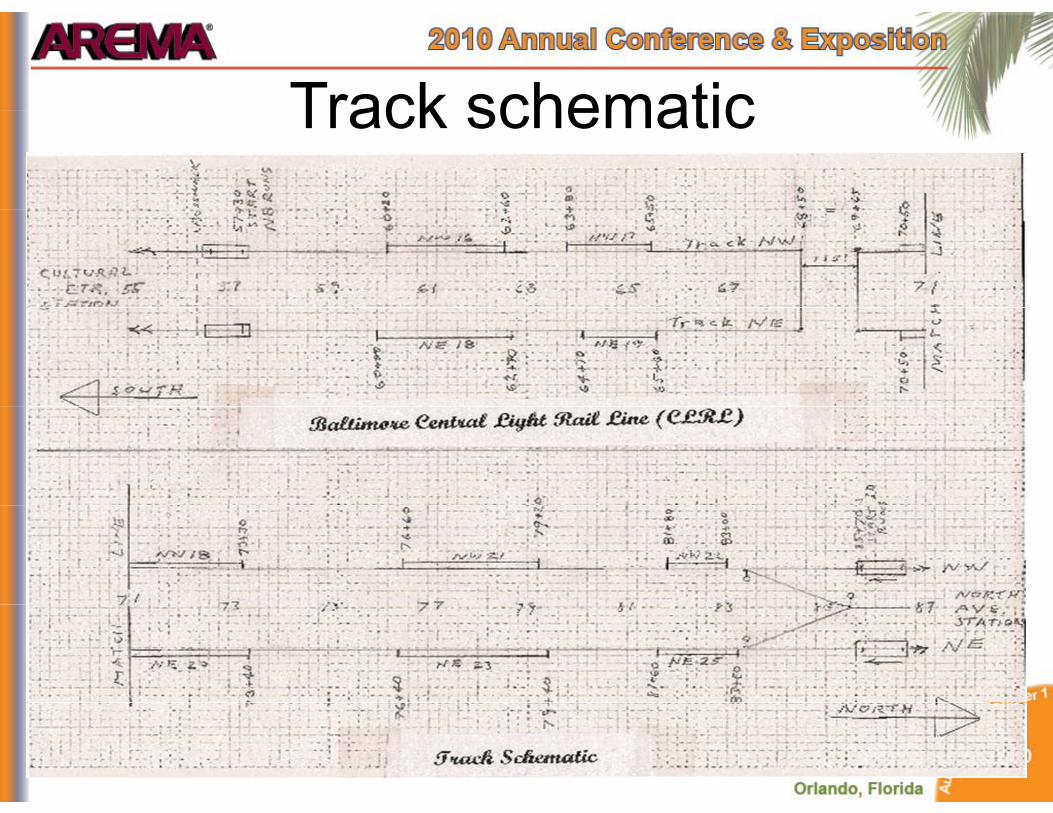
Track schematicTrack schematic

Northbound Starting Point

Curve NW 16 and NE 18
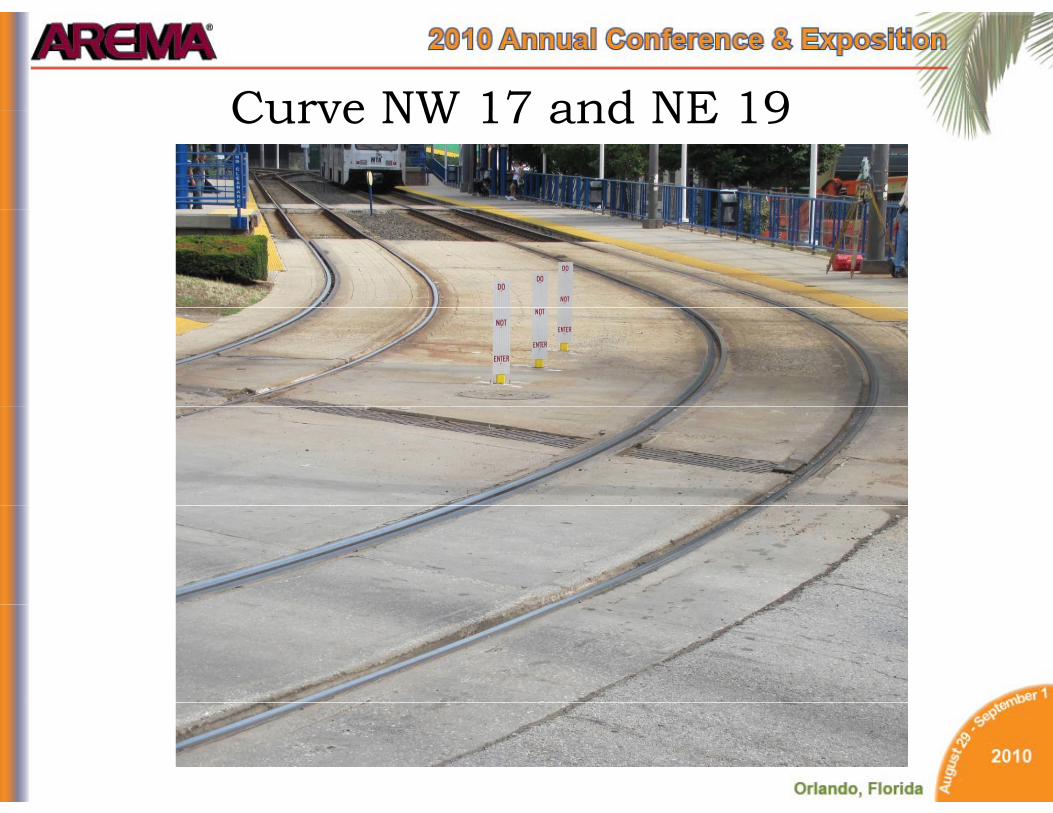
Curve NW 17 and NE 19Curve NW 17 and NE 19
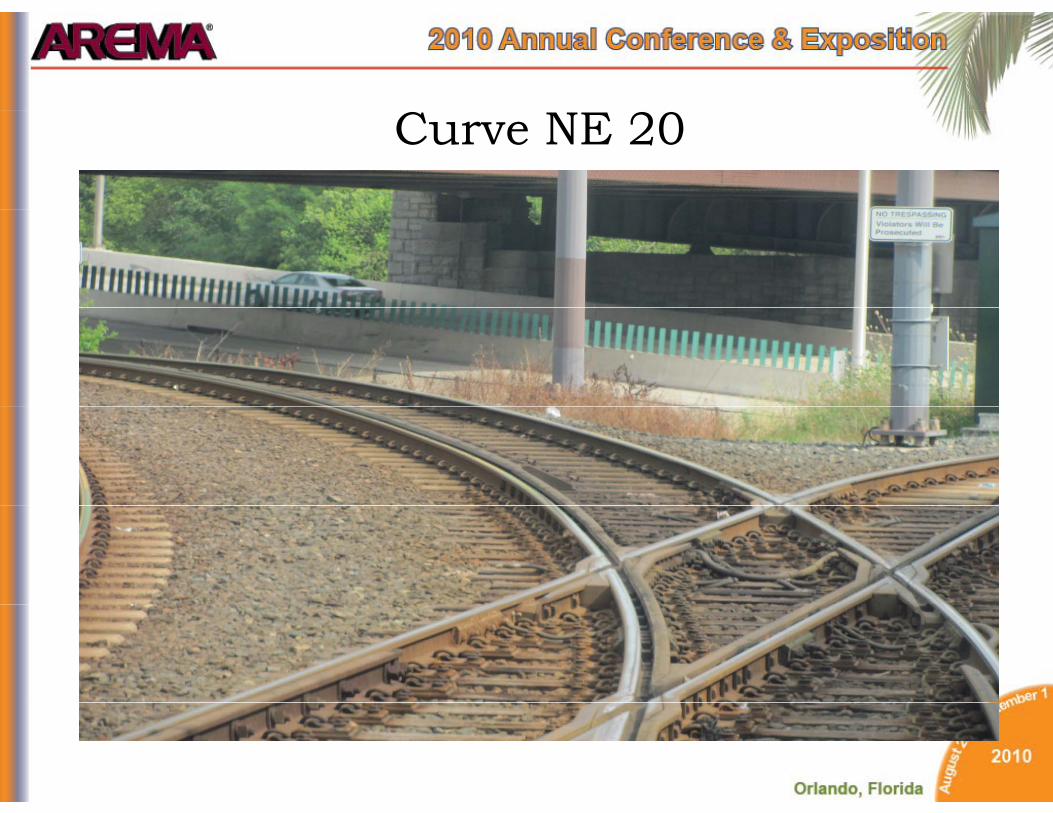
Curve NE 20
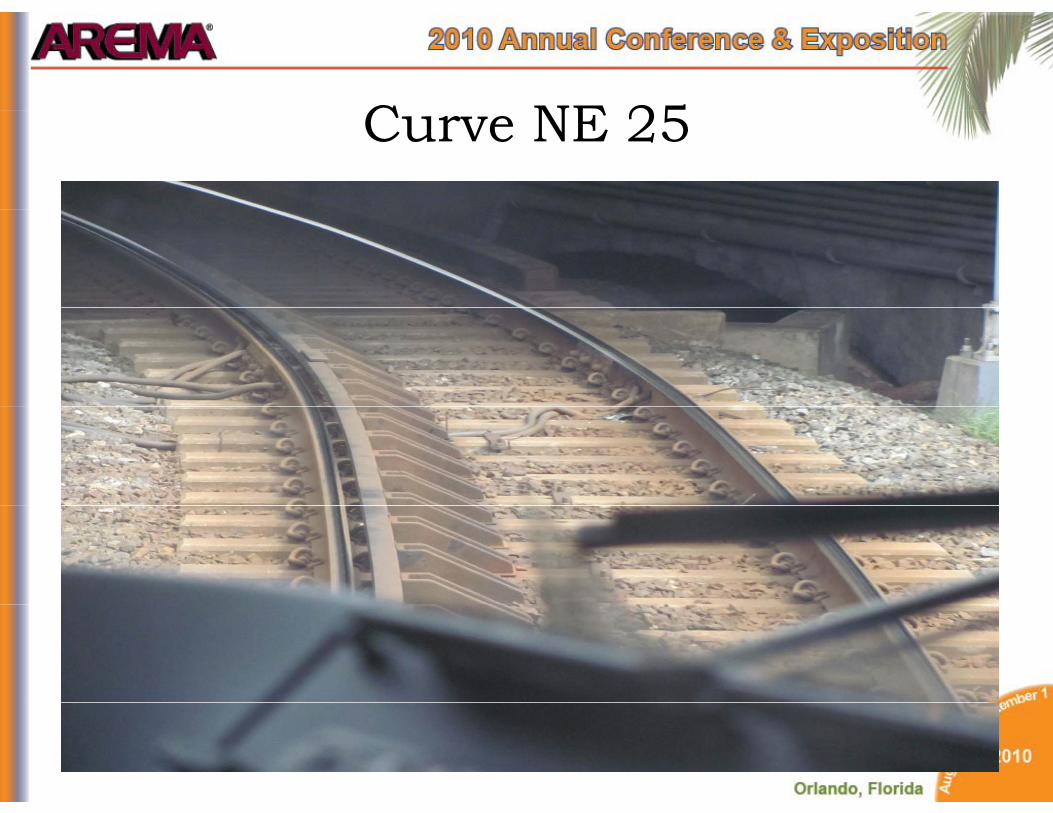
C NE 25Curve NE 25
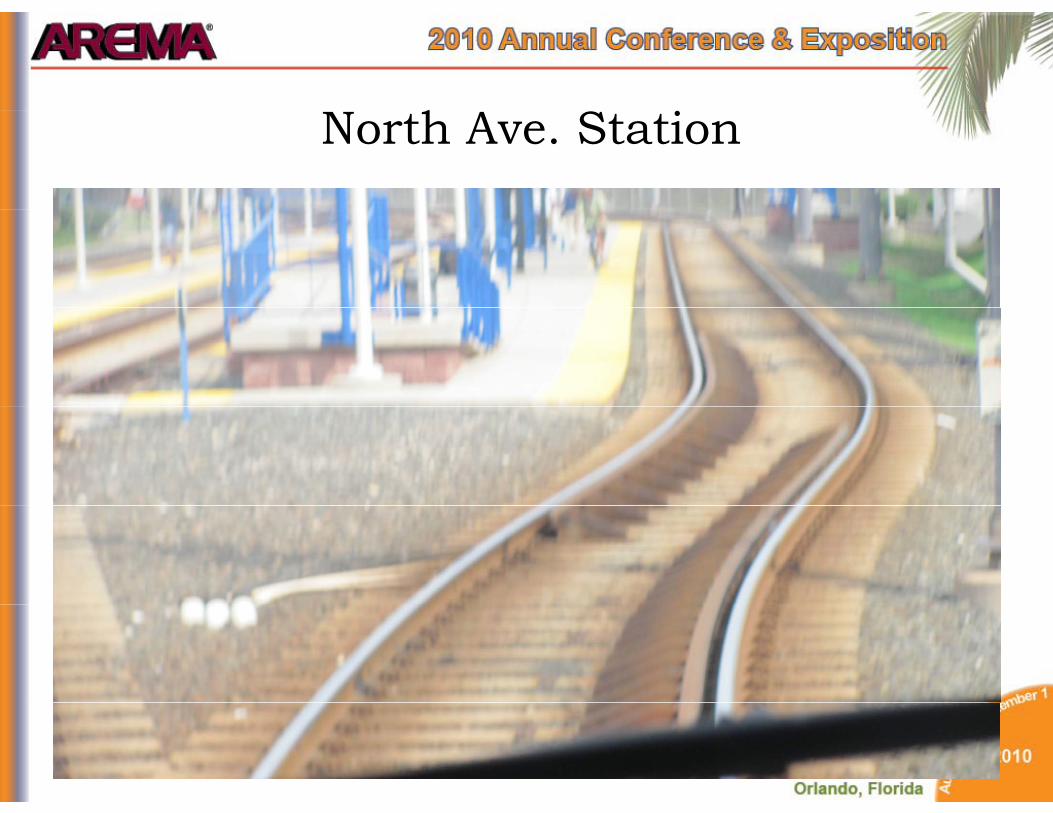
hNorth Ave. Station

Preliminary Measurementsy
• Actual superelevation, Ea
• Vehicle roll angle, ErVehicle roll angle, Er
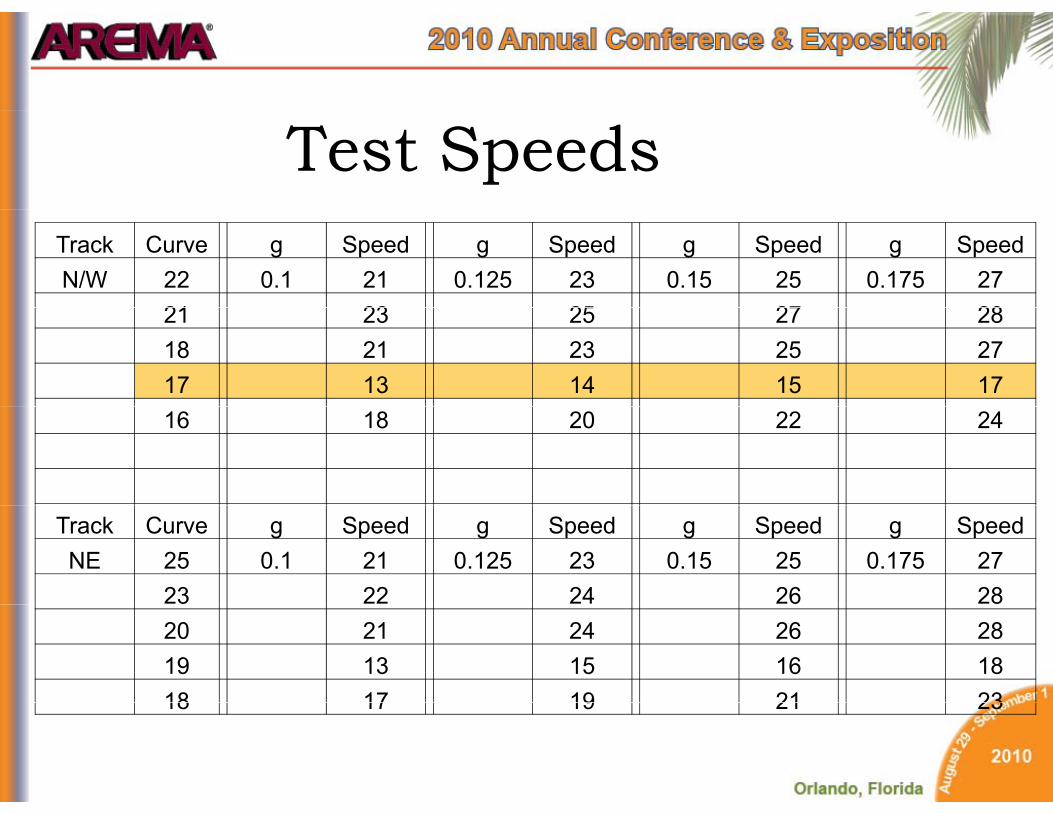
Test SpeedsTrack Curve g Speed g Speed g Speed g SpeedN/W 22 0.1 21 0.125 23 0.15 25 0.175 27
21 23 25 27 2821 23 25 27 2818 21 23 25 2717 13 14 15 1716 18 20 22 24
Track Curve g Speed g Speed g Speed g SpeedNE 25 0.1 21 0.125 23 0.15 25 0.175 27
23 22 24 26 2820 21 24 26 2819 13 15 16 1818 17 19 21 2318 17 19 21 23

S d SiSpeed Signs
FRONT BACK COVER

Ride Quality Rating Scale
• 0Nothing Noticeable• 1 Just Noticeable• 2 Noticeable2 Noticeable• 3 Pronounced• 4 Very pronounced – but not
uncomfortableuncomfortable• 5 Strong & Slightly Uncomfortable• 6 Rather Uncomfortable

Ride Quality DataData Collection Form
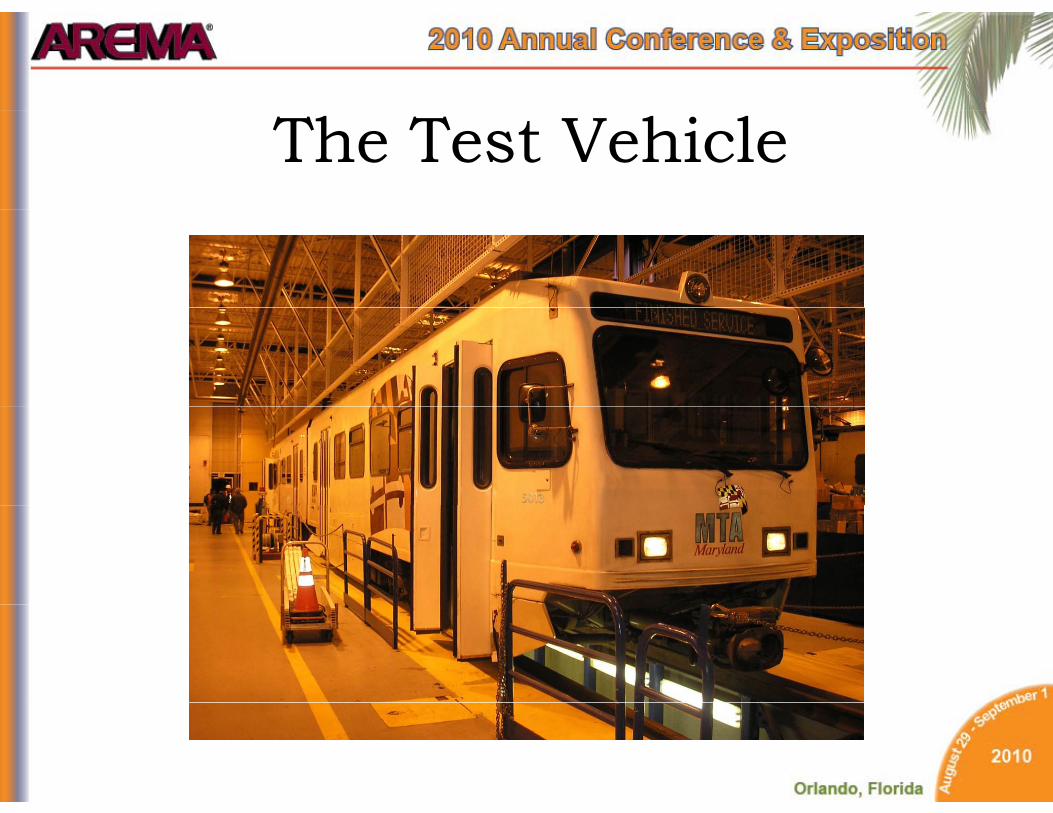
The Test Vehicle

Car Interior

Recording Ride Quality
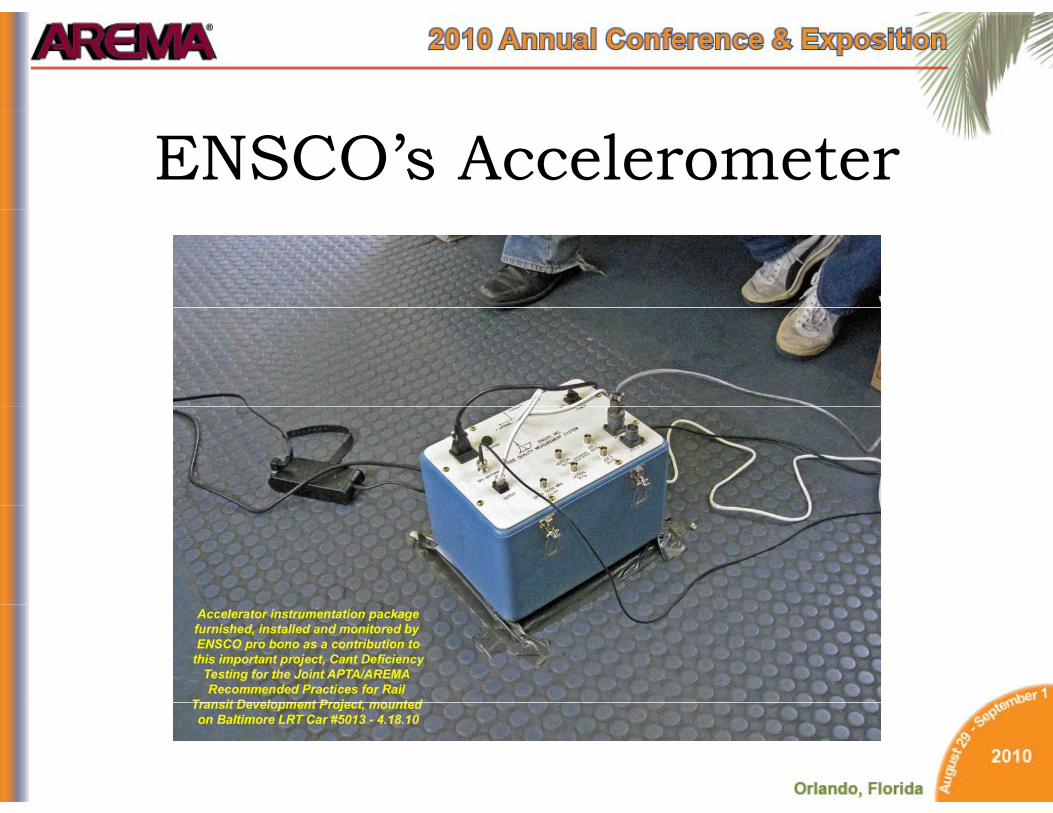
ENSCO’s Accelerometer

Onboard RecordingRecording Equipment
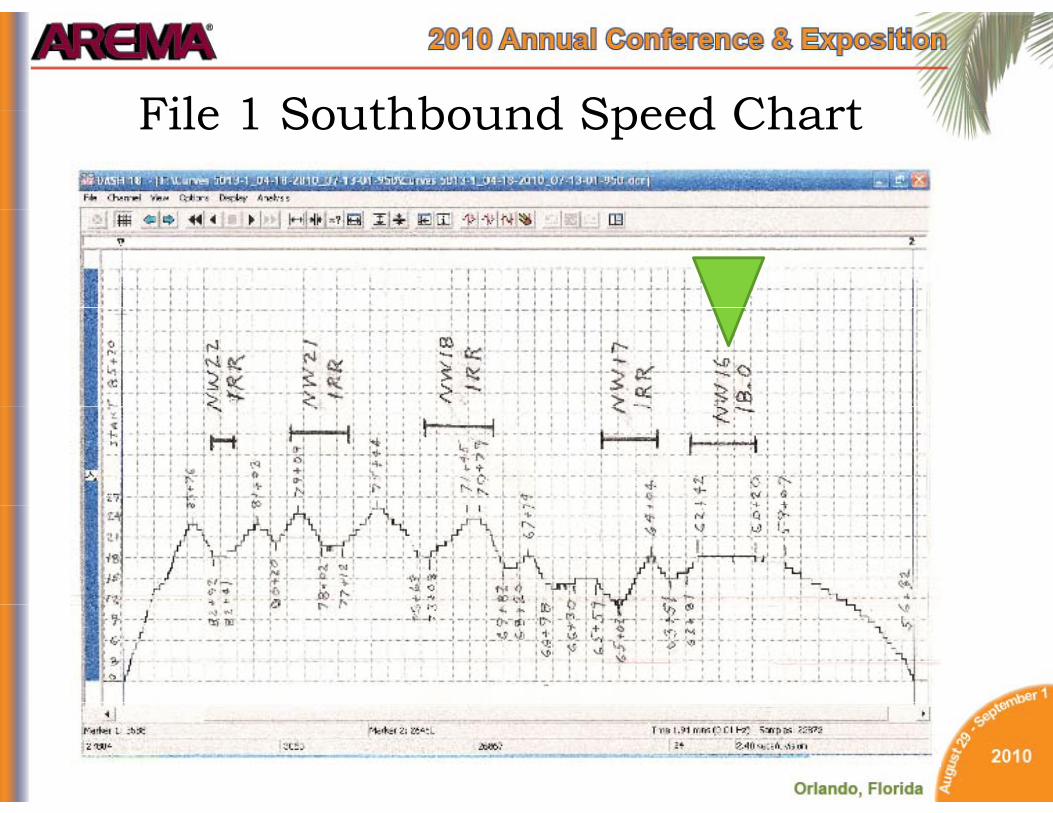
File 1 Southbound Speed ChartFile 1 Southbound Speed Chart
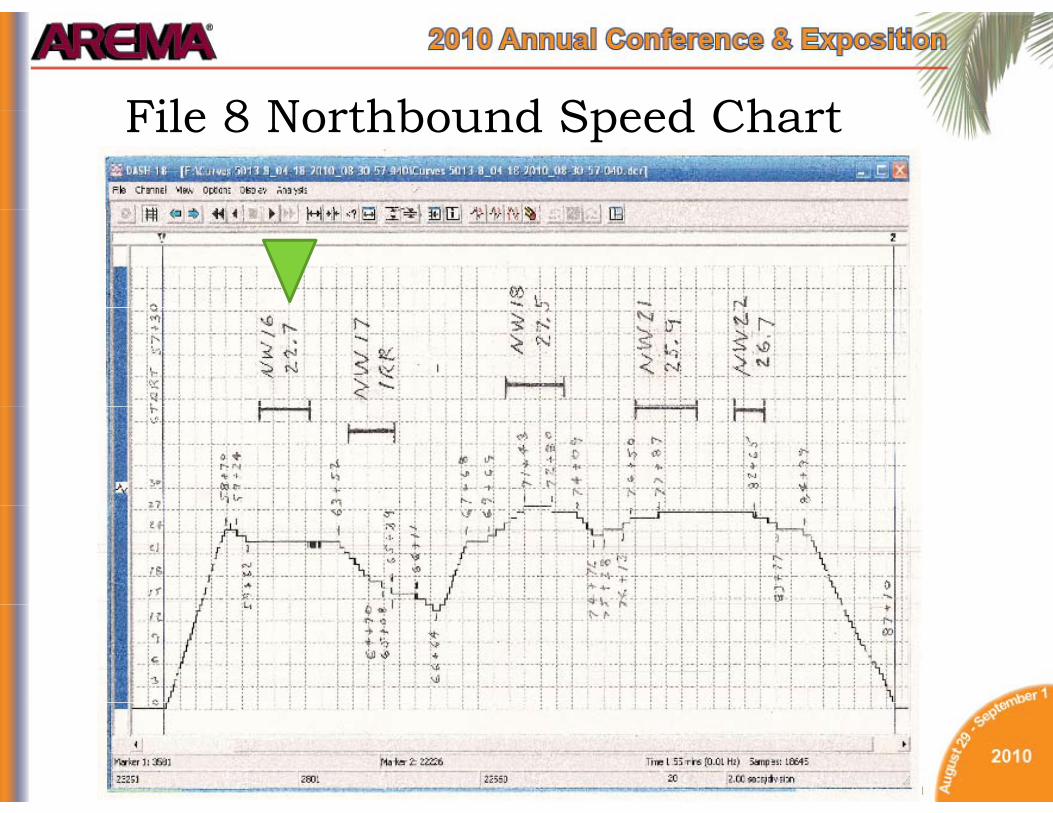
File 8 Northbound Speed ChartFile 8 Northbound Speed Chart

Ride Quality RatingsRun No. 4
Nominal Lateral Accleration: 0.175g
Ride Quality Ratings
Curve Number
Rater NW22 NW21 NW18 NW17 NW16 NE25 NE23 NE20 NE19 NE18
2D 4 3 5 3 5 3 3 5 4 33D 3 3 5 5 45D 3 4 3 3 5 5 5 46D 4 3 4 2 4 5 27D 5 5 59D 4 4 5 3 4 3 5 5 4 3
10D 3 3 4 3 3 3 3 4 311D 3 4 5 4 4 3 4 5 4 312D 4 4 5 3 3 3 5 5 313D 4 5 5 3 4 1 4 5 4 413D 4 5 5 3 4 1 4 5 4 414D 4 3 5 3 4 3 3 5 4 315D 5 4 5 5 3 3 5 5 416D 5 5 5 4 4 3 5 5 4 317D 4 4 4 3 4 2 3 4 3 3
Avg. 4.0 3.8 4.8 3.3 3.8 2.7 4.1 4.9 4.2 3.2

Lateral Acceleration vs Ride QualityFile 1
appx 0.1g File 2
appx 0.125g File 7
appx 0.15g File 8
appx 0.175g
Lateral Acceleration vs. Ride Quality
Curve No. Design Radius
Actual Ea Actual
Computed Avg Actual
Computed Avg Actual
Computed Avg Actual
Computed Avg
Ea (Avg'd) V g RQ V g RQ V g RQ V g RQ
NW22 1 250 1 1 IRR 23 3 0 1271 2 4 24 2 0 1385 3 8 26 7 0 1726 4 0NW22 1 250 1.1 IRR 23.3 0.1271 2.4 24.2 0.1385 3.8 26.7 0.1726 4.0
NW21 2.5 250 1.7 IRR IRR IRR 25.9 0.1513 3.8
NW18 0 287 0 IRR 23.5 0.1289 2.6 17.7 0.0731 2.5 27.5 0.1765 4.8
NW17 0 104 0 IRR IRR 14.9 0.1430 2.6 IRR
NW16 0 214 0 18.0 0.1014 2.2 19.6 0.1202 2.4 IRR 22.7 0.1613 3.8
File 3 File 4 File 5 File 6
NE25 1 250 0.7 22.0 0.1180 2.2 IRR 24.4 0.1478 3.9 IRR
NE23 2.5 235 2 22.7 0.1135 2.2 23.6 0.1254 4.4 25.1 0.1462 2.6 IRR
NE20 0 297 0.1 IRR IRR IRR 26.3 0.1543 4.9
NE19 0 120 0 13 3 0 0987 1 5 IRR 14 1 0 1110 2 5 17 3 0 1671 4 2NE19 0 120 0 13.3 0.0987 1.5 IRR 14.1 0.1110 2.5 17.3 0.1671 4.2
NE18 0 200 0.2 17.2 0.0957 1.6 18.8 0.1150 2.2 18.1 0.1064 2.6 22.7 0.1692 3.2Curves marked IRR had irregular speeds through the curve and no avg speed could be assignedCComputed g values are based on speed and do not include vehicle roll angle effectRide Quality values are average of 15 to 18 riders judgments with high and low values excluded from average
What’s Next• Further Research on Lateral Acceleration
• Research on SpiralsResearch on Spirals

h kMany Thanks to:
• Maryland Transit Administration• William Parks Chief Tk & Str Engrg MTA• William Parks, Chief, Tk & Str Engrg, MTA• Fletcher Hamilton, CLRL Dir of LRT operations, MTA
Mik Wi d k P j M LRT O MTA• Mike Wiedecker, Proj Mgr, LRT Opns, MTA• Stan Snead and Earl Lewis, Safety Office, MTA
M i S h d Chi f E APTA• Martin Schroeder, Chief Engr. APTA• Bill Moorhead, Chair, APTA/AREMA Embedded Track
W k G d ll th V l t P ti i tWork Group and all the Volunteer Participants• ENSCO (accelerometer instrumentation)
d• Narayana Sundaram, ENSCO