state of mobile event technology guidebook 2014 · message attendees during the event. ... why an...
TRANSCRIPT
State of Mobile Event Technology
Annual Report 2014

Table of contents
Chapter 7 - Methodology and demographics .................... 31
Chapter 6 - Event planner concerns .................................... 28
Chapter 5 - Event app adoption ............................................ 22
Chapter 4 - New technologies ............................................... 16
Chapter 3 - Going green ........................................................... 11
Chapter 2 - Event app cost ..................................................... 07
Introduction - What we did .................................................... 01
Summary - Key findings .......................................................... 02
Chapter 1 - Event app benefits .............................................. 03

What we did
Over 500 event app administrators, primarily based in the
U.S. and U.K., completed this in-depth survey. The results
illuminate broad and industry-specific trends in app ROI,
event pros’ priorities and goals, the emergence of new
tech, app promotion methodology, and the true costs of
moving to mobile.
In the summer of 2014, Guidebook surveyed hundreds of
event professionals who use event apps year-round for
many kinds of events: ranging from 10-person meetings to
130,000-attendee conventions.
01 www.guidebook.com
Key findings
The top three benefits of going with an event app:
planners can make last minute changes to the app, they
save money on printing and shipping, and they can
message attendees during the event.
Eco-friendly events are a focus for most planners, and
cutting back on printing and shipping is the best way
to ‘go green’. 70% of respondents said it’s important for
their organization to go green. 82% of those said the #1
way to go green is by reducing printing and shipping.
Planners are getting a return from event apps. Of
respondents to whom the question applied, 91% said
that their adoption of mobile event apps has produced
a positive return on investment.
On average, the real cost of an event app is 1.2% of the
budget for each attendee. Paper printing is twice
as expensive.
Event apps are making planners better at their jobs.
The #1 most important success metric for event
planners – attendee satisfaction - is also the #1 value
event apps deliver.
02 www.guidebook.com

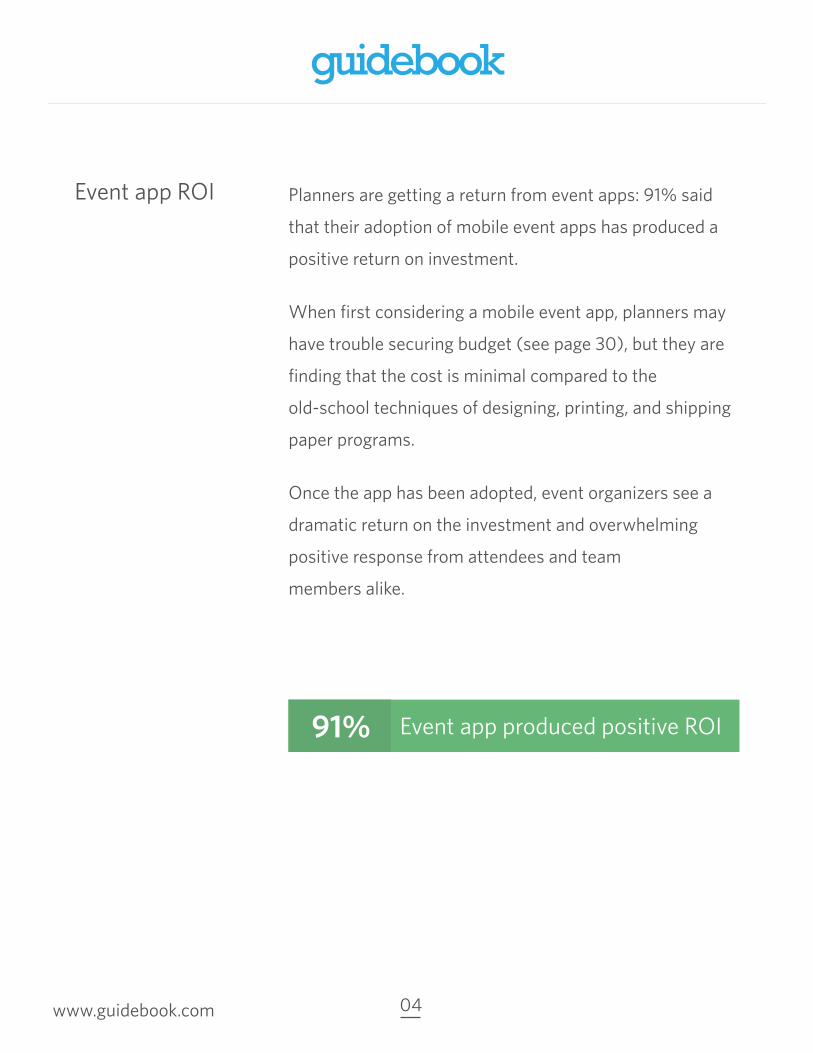
Event app ROI Planners are getting a return from event apps: 91% said
that their adoption of mobile event apps has produced a
positive return on investment.
When first considering a mobile event app, planners may
have trouble securing budget (see page 30), but they are
finding that the cost is minimal compared to the
old-school techniques of designing, printing, and shipping
paper programs.
Once the app has been adopted, event organizers see a
dramatic return on the investment and overwhelming
positive response from attendees and team
members alike.
Event app produced positive ROI91%
04 www.guidebook.com

Successful events
And that success is directly tied to having an event app:
Attendee satisfaction is the #1 element most-reported as
being positively affected by a mobile event app.
Event apps are making planners better at their jobs.
Attendee satisfaction tops the list of metrics event
organizers use to gauge the success of an event, with 86%
of respondents choosing it as a ‘top three’.
Funds raised
Sponsorship renewals
19%22%
37%41%
73%
86%
8%
Gauges of event success
14%
Social sharing
Return on investment
RevenueNumber of registrants
Number of attendees
Attendeesatisfaction
S
88% positive effect
11% no effect
1% negative effect
Event app’s effect on attendee satisfaction
05 www.guidebook.com
State of Mobile Event Technology Annual Report | Guidebook 2014

Why an app?
The #3 reason (a tie): 60% of planners like that they can
save money on printing, shipping and layout, and that
apps increases attendee interaction.
The #2 reason to move to an app? 62% of organizers say
they use event apps so they can message attendees
during the event.
Mobile app users say that making last minute changes to
guides is the #1 reason to go with a mobile event app, with
83% citing it as a benefit.
It’s eco-friendly
56%It increases
attendee interaction
60%It’s more user
friendly than printing
59%
We save money on printing, shipping
We can make last-minute changes
I can instantly message attendees
It elevates our brand
53%Our attendees
expect it
40%The in-app
feedback is valuable
36%
It’s just easier than the alternatives
30%Everyone else
has one
26%I can sell dynamic sponsor banners
26%
06 www.guidebook.com
83% 62% 60%
Event app cost
2
We asked event app administrators to state their most
recent event size, cost-per-attendee, their app costs, and
their printing costs – the amount they would spend on
printing if they weren’t using an app at all.
07 www.guidebook.com

How much does an event app cost?
In contrast, printed programs are more than twice as
expensive.
On average, an app costs 1.2% of the average budget for a
single attendee.
08 www.guidebook.com
State of Mobile Event Technology Annual Report | Guidebook 2014
Site rental
Catering
Swag/gifts
Administration
Event app
1.2%
Entertainment
Marketing

By event type Fan conventions, trade shows and education industry
events have the largest disparity between app and
printing costs, per-attendee.
0.0
0.5
1.0
1.5
2.0
2.5
3.0
3.5%
Fan co
nventio
ns
Trade sh
ows (I s
end marke
ting/s
ales)
Trade sh
ows (I m
anage them
)
Educatio
n industr
y events
Festi
vals
Profess
ional deve
lopment e
vents/
user c
onference
s
Associa
tion eve
nts
Other
Intern
al corp
orate
meetin
gs
Custom
er-facin
g corp
orate
events
Small p
ersonal e
vents
(as a % of total per-attendee cost)Printing costs
(as a % of total per-attendee cost)Mobile app budget
Percent of costs vs. event type
09 www.guidebook.com
State of Mobile Event Technology Annual Report | Guidebook 2014
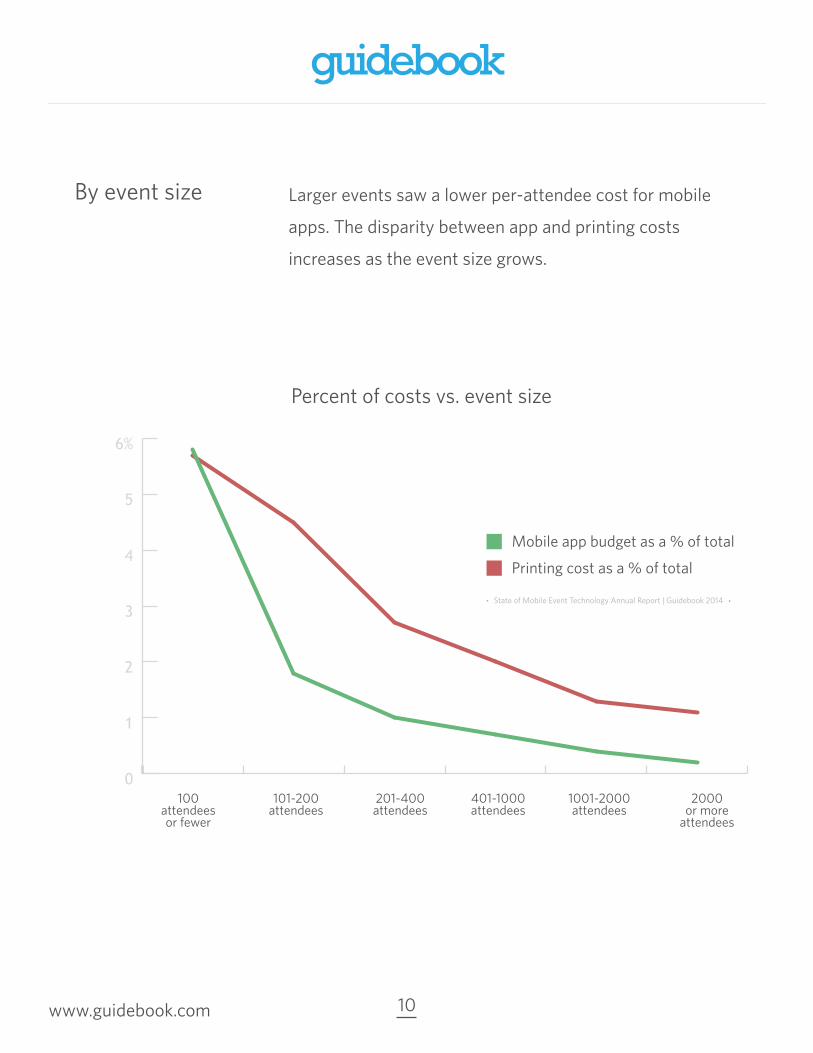
By event size Larger events saw a lower per-attendee cost for mobile
apps. The disparity between app and printing costs
increases as the event size grows.
0
1
2
3
4
5
6%
Mobile app budget as a % of total
Printing cost as a % of total
Percent of costs vs. event size
100attendeesor fewer
101-200attendees
201-400attendees
401-1000 attendees
1001-2000 attendees
2000 or more
attendees
10 www.guidebook.com
State of Mobile Event Technology Annual Report | Guidebook 2014
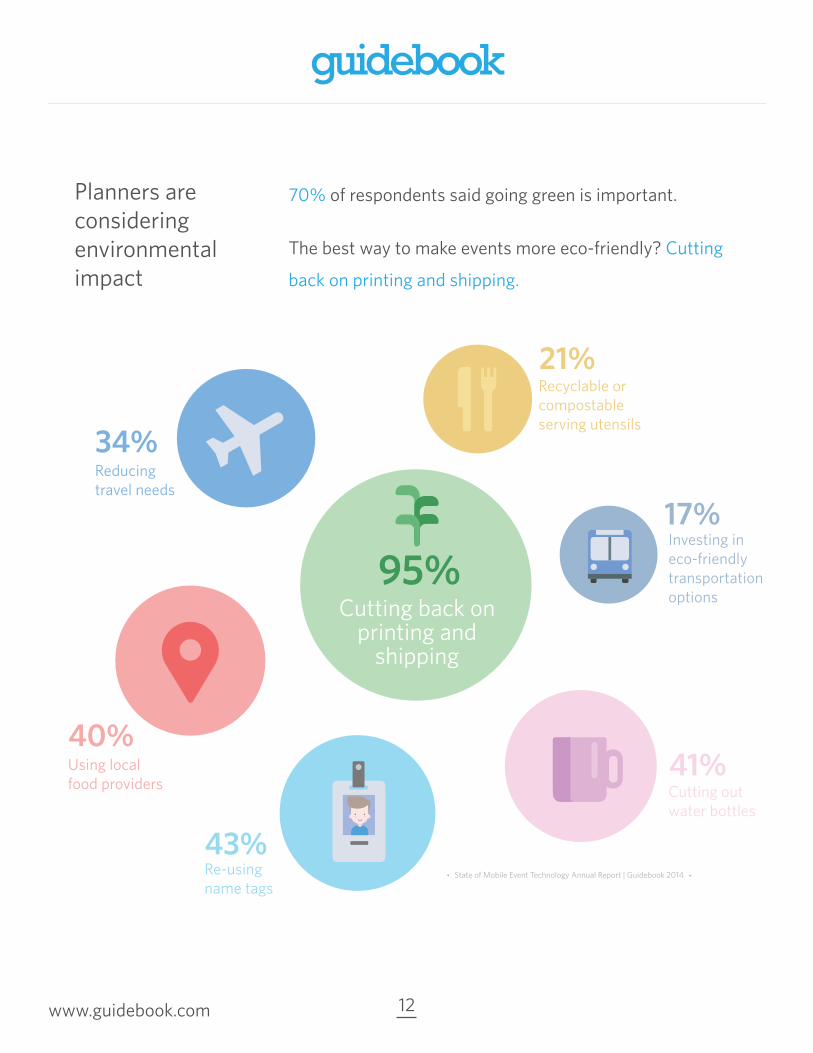
Planners are considering environmental impact
The best way to make events more eco-friendly? Cutting
back on printing and shipping.
70% of respondents said going green is important.
Cutting back on printing and
shipping
Re-using name tags
Cutting out water bottles
Using local food providers
95%
43%
41%40%
34%
21%
17%
12 www.guidebook.com
State of Mobile Event Technology Annual Report | Guidebook 2014
Recyclable or compostable serving utensils
Investing in eco-friendly transportation options
Reducing travel needs

Cut out printing Event apps allow you to reduce and remove printing. If
you’re looking to cut back on printing, talk to the 82% of
respondents who were able to do so by moving to mobile!
Reduced or removed paper printing by
switching to a mobile app
82%
13 www.guidebook.com
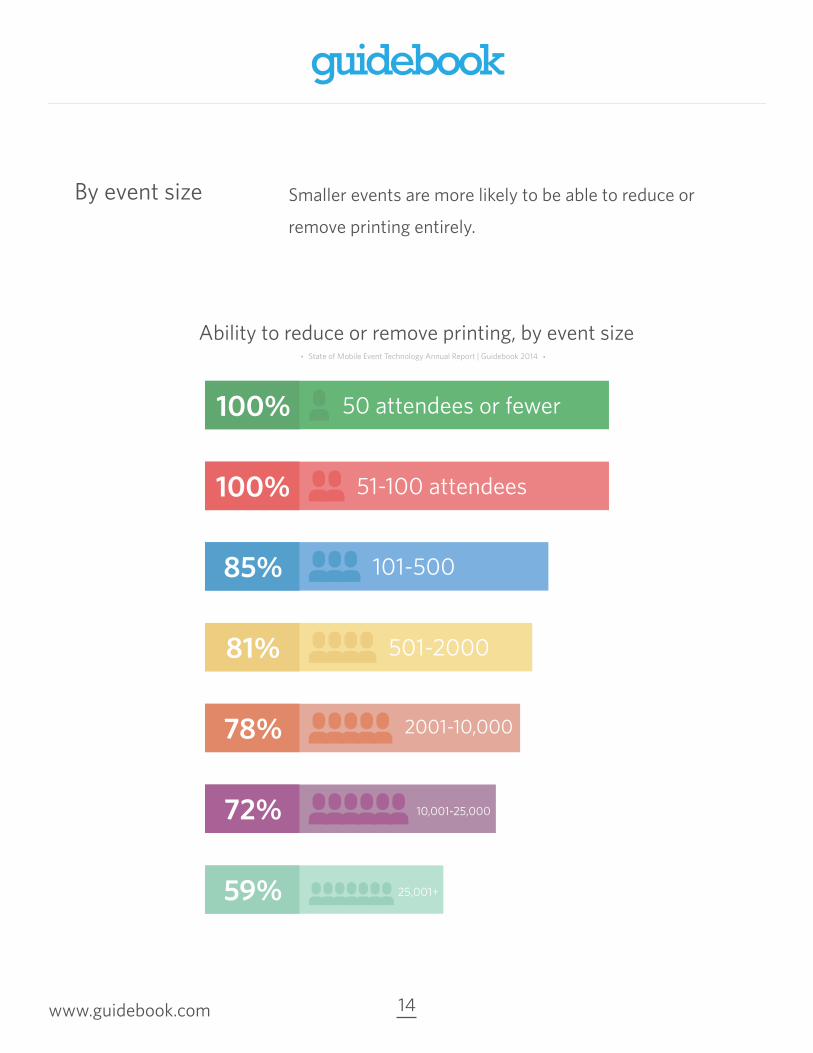
By event size Smaller events are more likely to be able to reduce or
remove printing entirely.
Ability to reduce or remove printing, by event size
59% 25,001+
72% 10,001-25,000
78% 2001-10,000
81% 501-2000
85% 101-500
100% 51-100 attendees
100% 50 attendees or fewer
14 www.guidebook.com
State of Mobile Event Technology Annual Report | Guidebook 2014

By event type 91% of internal corporate meetings report being able to
reduce or entirely remove printing. Small personal events,
user conferences, education industry events and
customer-facing corporate events are above average in
printing reduction.
Ability to reduce or remove printing, by event type
0
20
40
60
80
100
Other
Small p
ersonal e
vents
Educatio
n industr
y events
Profess
ional deve
lopment e
vents
/use
r confere
nces
Custom
er-facin
g corp
orate
events
Intern
al corp
orate
meetin
gs
Trade sh
ows (I s
end team
s)
Trade sh
ows (I m
anage)
Fan co
nventio
ns
Festi
vals
Associa
tion eve
nts
15 www.guidebook.com
45
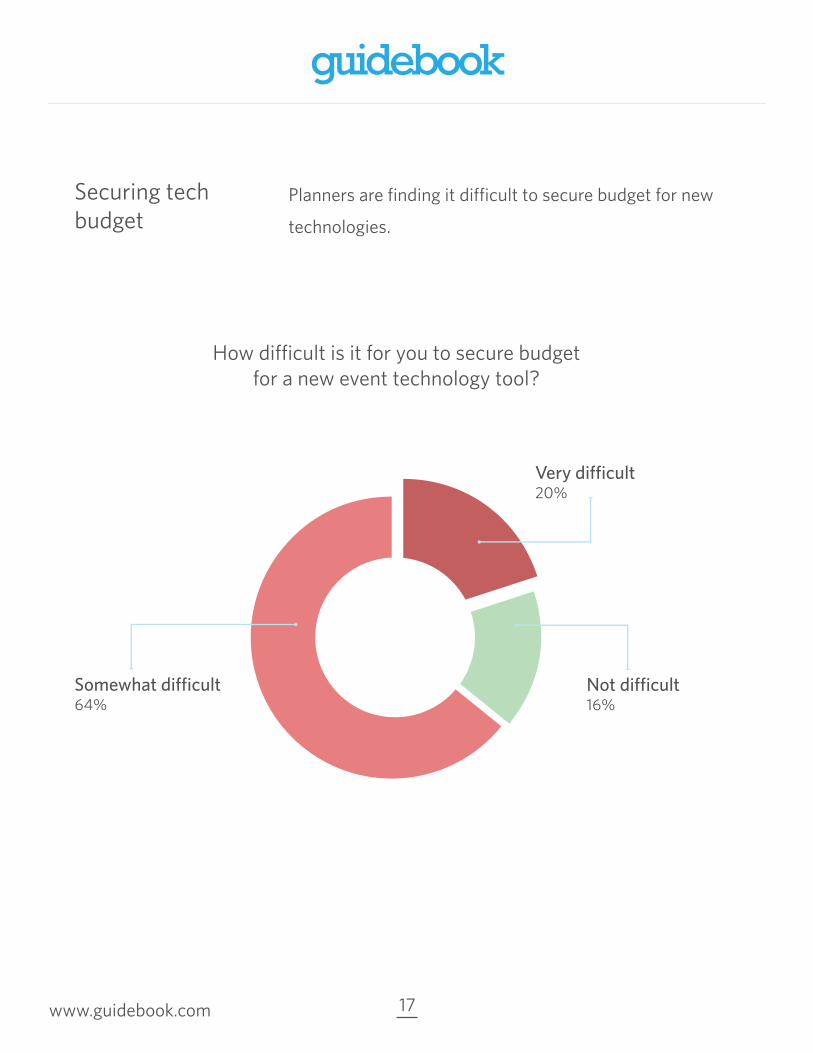
Securing tech budget
Planners are finding it difficult to secure budget for new
technologies.
How difficult is it for you to secure budget for a new event technology tool?
Somewhat difficult64%
Very difficult20%
Not difficult16%
17 www.guidebook.com

Non-profit vs. for-profit budgets
Ability to secure tech budget is minimally more difficult in
the non-profit world, and the majority of entities still need
to fight for budget.
How difficult is it for you to secure budget for a new event technology tool?
Very difficult
Somewhat difficult
Not difficult
Non-profits & associations
For-profit entities
65%
64% 13%
19%23%
16%
18 www.guidebook.com

Event tech trends
These breakdowns are generally consistent across
industries.
Smart walls, RFID tech, NFC and beacons are still under
the radar in 2014 for most planners.
1/3 of planners are using cloud-based presentation tools,
badge scanning and phone charging stations.
0
20
40
60
80
100%
Cloud-based presentation
tools
Badge scanning
Phone charging stations
‘Smart’ walls
RFID technology
NFC (near field
communication)
Beacons/ geofencing
I use this I don’t use this I’m not familiar with this
Event technology use
19 www.guidebook.com

Get the skinny Planners are primarily looking at industry blogs and
publications for info about new event technologies – and
they learn from colleagues and other events, too.
16%
43%46%47%56%
64%
11%
Where do you go for information about new event technology?
Books/e
Books
Linke
dIn groups
Social m
edia
Industry eve
nts
Competin
g events
Consulta
nts/Colle
agues
Industry blogs &
publicatio
ns
20 www.guidebook.com
State of Mobile Event Technology Annual Report | Guidebook 2014

First adoption The majority of event app administrators began using
event guides in 2012 and 2013.
What year did your organization build their first mobile event app?
than 2009Earlier
2009
2010
2011
2012
2013
2014
23%
21%
35%
13%
4%
1%
2%
21 www.guidebook.com


App guide promotion
Over half of mobile event app administrators know they’re
not doing enough to promote their guides.
Guide promotion is most effective when it's part of a
planned, multi-channel marketing-style effort over time;
before the event launches and on-site. And guide
promotion is directly tied to ROI – the more downloads,
the more worthwhile the cost and effort.
Do you believe you’re doing everything you can to promote your guides?
47% Yes
53% No
23 www.guidebook.com
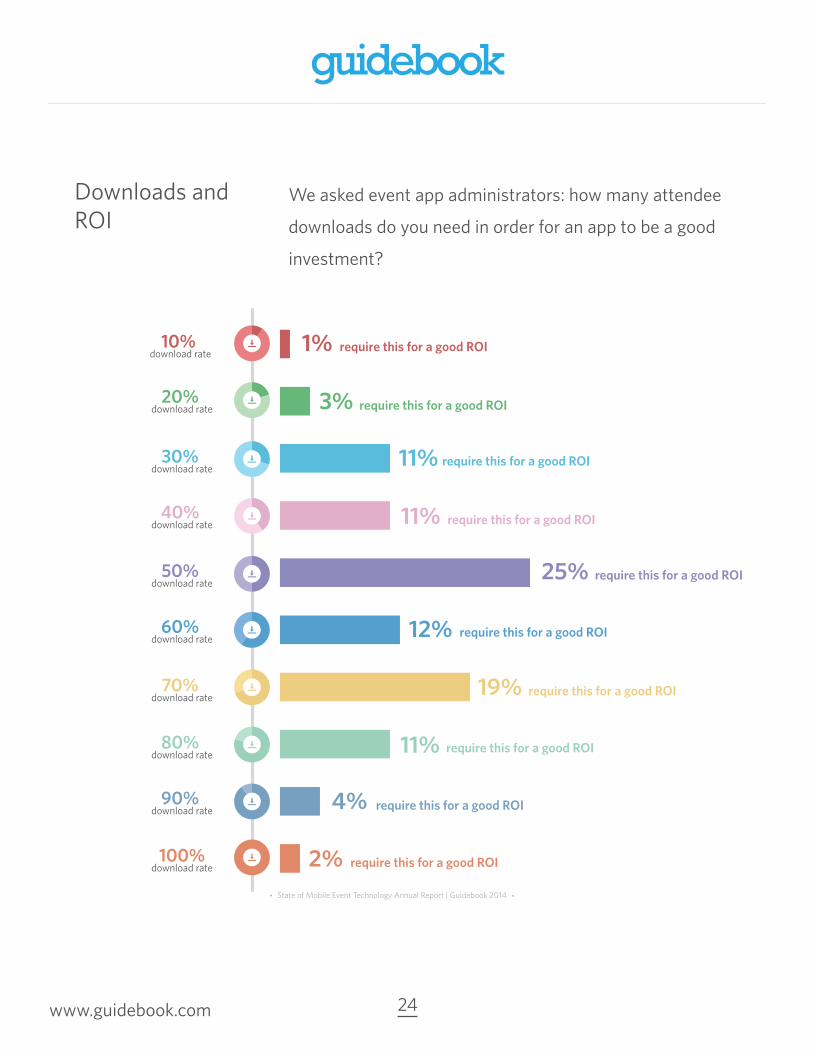
Downloads and ROI
We asked event app administrators: how many attendee
downloads do you need in order for an app to be a good
investment?
3%
require this for a good ROI1%
11%
11%
25%
12%
19%
download rate10%
11%
4%
2%
require this for a good ROI
require this for a good ROI
require this for a good ROI
require this for a good ROI
download rate100%
download rate90%
download rate80%
download rate70%
download rate60%
download rate50%
download rate40%
download rate30%
download rate20%
require this for a good ROI
require this for a good ROI
require this for a good ROI
require this for a good ROI
require this for a good ROI
24 www.guidebook.com
State of Mobile Event Technology Annual Report | Guidebook 2014

Adoption rate by event size
Smaller events tend to require a higher adoption rate to
get a return. This graph shows the average adoption rate
(percent of total attendees who used the mobile app)
planners say is required to get a positive ROI.
0
20
40
60
80
100
50%
50 attendeesor fewer
51-100attendees
101-500 attendees
501-2000 attendees
2001-10,000 attendees
10,001-25,000 attendees
25,001 attendeesor more
82%
60% 56% 54%48%
41%
Average required adoption rate for positive ROI, by event size
25 www.guidebook.com

App promotion methods
Email marketing and on-site signage rank as the most
effective ways to increase app downloads.
Removing printed materials entirely
A link on the registration thank-you page
Embedding the web-based guide on my website
Social media posts with the download link
On-site signageEmail marketing about the app
Effectiveness at driving downloads
I don’t do thisNot effectiveSomewhat effectiveVery effective
36%
13%2%
50%
34%
16%
4%
46%
24% 26%
6%
44%
23%34%
3%40%
15%
54%
3%
28%
9%
57%
12%
22%
26 www.guidebook.com
State of Mobile Event Technology Annual Report | Guidebook 2014
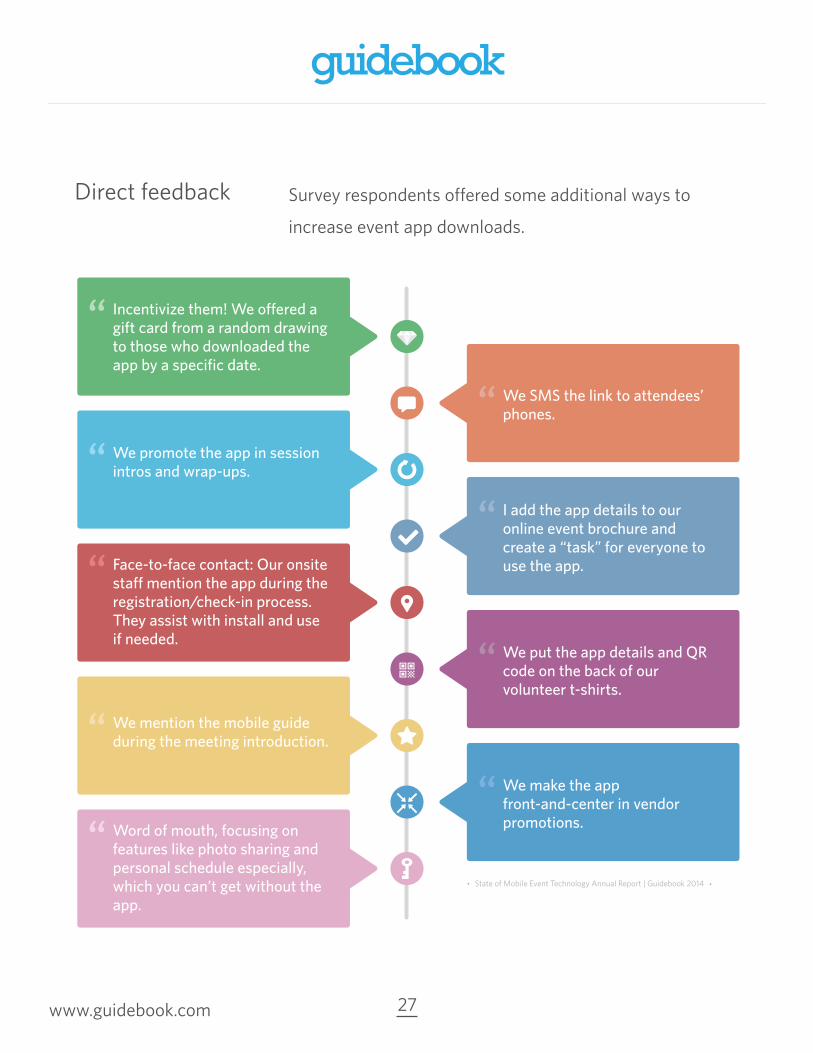
Direct feedback Survey respondents offered some additional ways to
increase event app downloads.
Incentivize them! We offered a gift card from a random drawing to those who downloaded the app by a specific date.
“
We promote the app in session intros and wrap-ups.“
Face-to-face contact: Our onsite staff mention the app during the registration/check-in process. They assist with install and use if needed.
“
We mention the mobile guide during the meeting introduction.“
Word of mouth, focusing on features like photo sharing and personal schedule especially, which you can’t get without the app.
“
We SMS the link to attendees’ phones.“
I add the app details to our online event brochure and create a “task” for everyone to use the app.
“
We put the app details and QR code on the back of our volunteer t-shirts.
“
We make the app front-and-center in vendor promotions.
“
27 www.guidebook.com
State of Mobile Event Technology Annual Report | Guidebook 2014
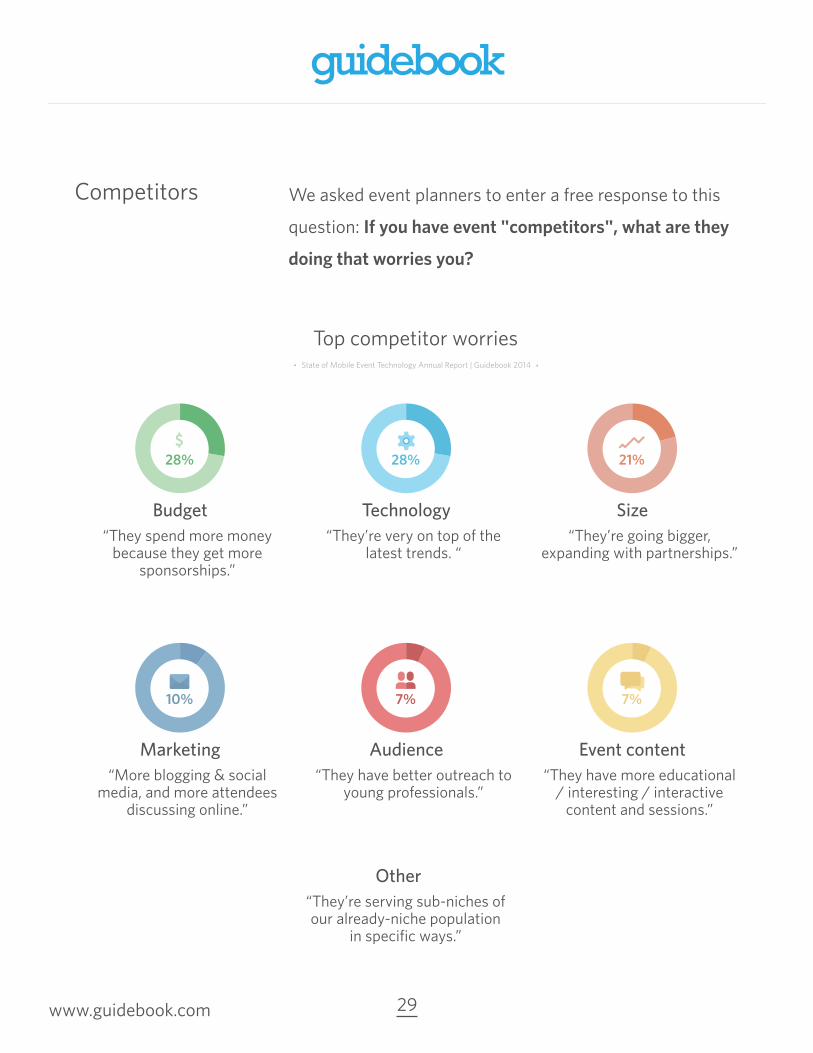
Competitors We asked event planners to enter a free response to this
question: If you have event "competitors", what are they
doing that worries you?
Event content“They have more educational
/ interesting / interactive content and sessions.”
7%
Audience“They have better outreach to
young professionals.”
7%
Marketing“More blogging & social
media, and more attendees discussing online.”
10%
Size“They’re going bigger,
expanding with partnerships.”
21%
Technology“They’re very on top of the
latest trends. “
28%
Budget“They spend more money
because they get more sponsorships.”
28%
Other“They’re serving sub-niches of our already-niche population
in specific ways.”
S
Top competitor worries
29 www.guidebook.com
State of Mobile Event Technology Annual Report | Guidebook 2014

Biggest challenges
We asked event planners to enter a free response to this
question: What are the biggest challenges you faced as
an event/meeting planner this year?
Top challenges
We're dealing with astronomical increases in hotel, meeting space, food, and speaker travel expenses.
“Budget
45%
Personnel turnover.“Staff
9%
Social event planning for a conference abroad.
“Other
13%
9%
5%
8%
8%
Transferring registration data into printing of badges, tracking payments.
“Registration
Refreshing each year... there's definitely a push to top ourselves every time!
“Content
2% VenueWill never use this hotel again.“
Getting word out. You can only do so much and people will only listen/ read so much.
“Marketing
Low attendance compared to previous years.
“Growth
30 www.guidebook.com
State of Mobile Event Technology Annual Report | Guidebook 2014
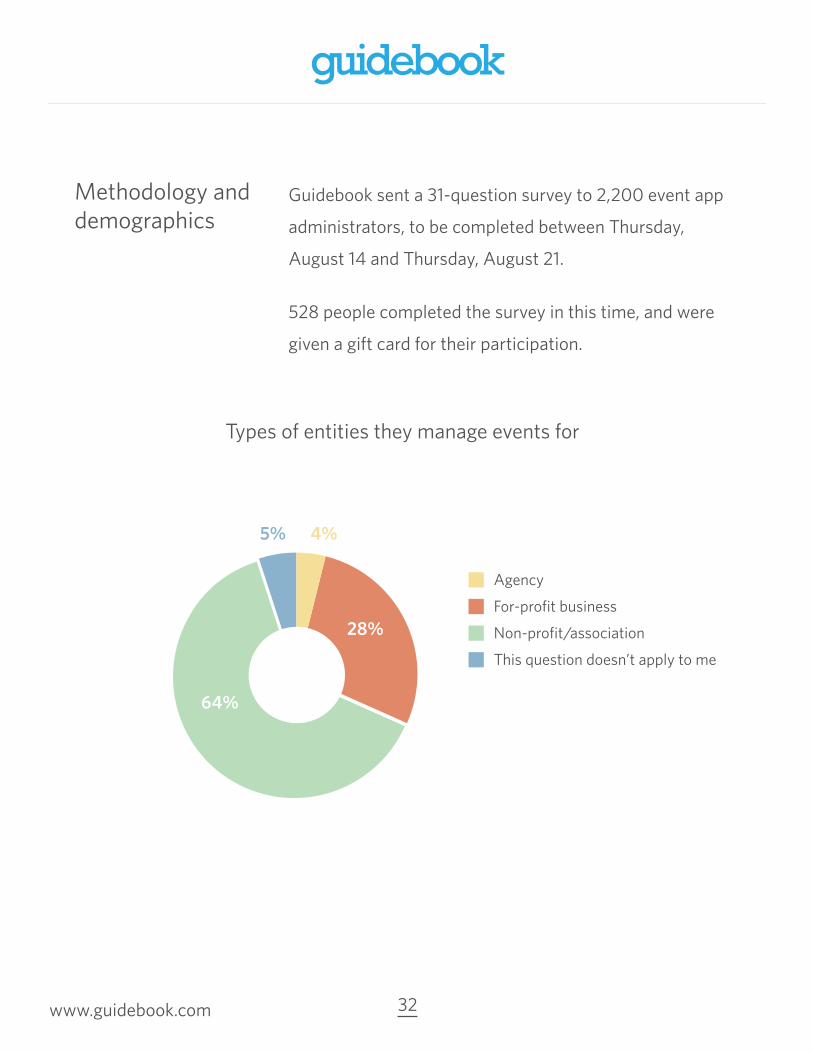
Methodology and demographics
Guidebook sent a 31-question survey to 2,200 event app
administrators, to be completed between Thursday,
August 14 and Thursday, August 21.
528 people completed the survey in this time, and were
given a gift card for their participation.
Types of entities they manage events for
28%
64%
5% 4%
Agency
For-profit business
Non-profit/association
This question doesn’t apply to me
32 www.guidebook.com

Methodology and demographics
Number of events in a year (of any size) they help organize 2-3
events
1event
4-10events
More than 11events
Noevents
33%
13%
34%
18%
1%
Types of events they manage
Other
Small p
ersonal e
vents
Educatio
n industr
y events
Profess
ional deve
lopment e
vents
/use
r confere
nces
Custom
er-facin
g corp
orate
events
Intern
al corp
orate
meetin
gs
Trade sh
ows (I s
end team
s)
Trade sh
ows (I m
anage)
Fan co
nventio
ns
Festi
vals
Associa
tion eve
nts
45%
8% 7%
20%
9%
24%
13%
43%
24%
14%16%
33 www.guidebook.com
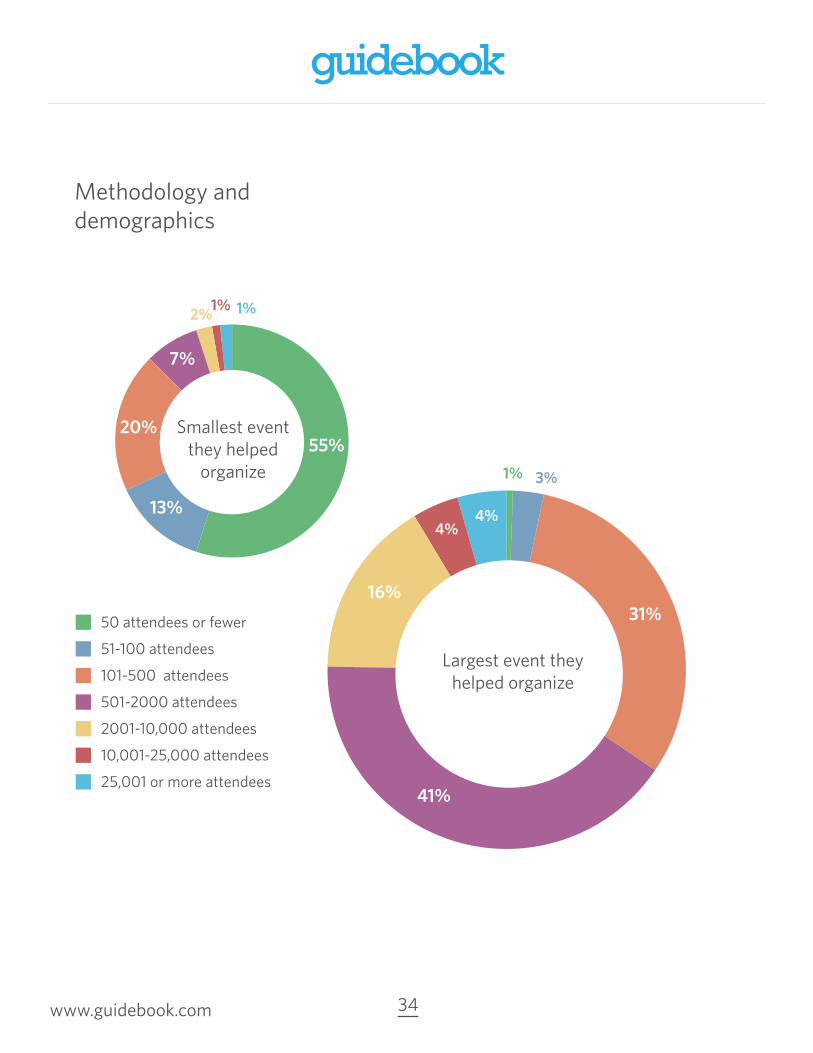
Methodology and demographics
Smallest event they helped
organize
Largest event they helped organize
50 attendees or fewer
51-100 attendees
101-500 attendees
501-2000 attendees
2001-10,000 attendees
10,001-25,000 attendees
25,001 or more attendees
1% 3%
31%
41%
16%
4%4%
2%1% 1%
55%
13%
20%
7%
34 www.guidebook.com