state of new york - thomas dinapoli
TRANSCRIPT
STA
TE
OF N
EW
YO
RK
C
OM
PR
EH
EN
SIV
E A
NN
UA
L F
INA
NC
IAL R
EP
OR
T
2013
COMPREHENSIVE ANNUAL FINANCIAL REPORT
For Fiscal Year Ended March 31, 2013
STATE OF
NEW YORK
Thomas P. DiNapoli, State Comptroller
CPrinted on Recycled Paper
STATE OF NEW YORK
COMPREHENSIVEANNUAL
FINANCIAL REPORT
For Fiscal Year EndedMarch 31,2013
Prepared by the Office of theState Comptroller
Thomas P. DiNapoli
Table of ContentsINTRODUCTORY SECTION
Letter from the Comptroller . . . . . . . . . . . . . . . . . . . . . . . . . . . . . . . . . . . . . . . . . . . . . . . . . . . . . . . . . 7
Financial Overview . . . . . . . . . . . . . . . . . . . . . . . . . . . . . . . . . . . . . . . . . . . . . . . . . . . . . . . . . . . . . . . . . 9
Certificate of Achievement . . . . . . . . . . . . . . . . . . . . . . . . . . . . . . . . . . . . . . . . . . . . . . . . . . . . . . . . . . 12
New York State Organization Chart . . . . . . . . . . . . . . . . . . . . . . . . . . . . . . . . . . . . . . . . . . . . . . . . . . . 13
Selected State Officials . . . . . . . . . . . . . . . . . . . . . . . . . . . . . . . . . . . . . . . . . . . . . . . . . . . . . . . . . . . . . . 13
FINANCIAL SECTIONIndependent Auditors’ Report . . . . . . . . . . . . . . . . . . . . . . . . . . . . . . . . . . . . . . . . . . . . . . . . . . . . . . . 16
MANAGEMENT’S DISCUSSION AND ANALYSIS (unaudited) . . . . . . . . . . . . . . 19
BASIC FINANCIAL STATEMENTSStatement of Net Position . . . . . . . . . . . . . . . . . . . . . . . . . . . . . . . . . . . . . . . . . . . . . . . . . . . . . . . . . . . 31
Statement of Activities . . . . . . . . . . . . . . . . . . . . . . . . . . . . . . . . . . . . . . . . . . . . . . . . . . . . . . . . . . . . . . 32
Balance Sheet—Governmental Funds . . . . . . . . . . . . . . . . . . . . . . . . . . . . . . . . . . . . . . . . . . . . . . . . . 34
Reconciliation of the Balance Sheet—Governmental Funds to the Statement of Net Position . . . 35
Statement of Revenues, Expenditures and Changes in Fund Balances (Deficits)—Governmental Funds . . . . . . . . . . . . . . . . . . . . . . . . . . . . . . . . . . . . . . . . . . . . . . . . . . . . . . . . . . . . . 36
Reconciliation of the Statement of Revenues, Expenditures and Changes in Fund Balances (Deficits)—Governmental Funds to the Statement of Activities . . . . . . . . . . . . . . . . . . 38
Statement of Net Position—Enterprise Funds . . . . . . . . . . . . . . . . . . . . . . . . . . . . . . . . . . . . . . . . . . . 39
Statement of Revenues, Expenses and Changes in Fund Net Position—Enterprise Funds . . . . . . 41
Statement of Cash Flows—Enterprise Funds . . . . . . . . . . . . . . . . . . . . . . . . . . . . . . . . . . . . . . . . . . . . 42
Statement of Fiduciary Net Position—Fiduciary Funds . . . . . . . . . . . . . . . . . . . . . . . . . . . . . . . . . . . 44
Statement of Changes in Fiduciary Net Position—Fiduciary Funds . . . . . . . . . . . . . . . . . . . . . . . . . 45
Combining Statement of Net Position—Discretely Presented Component Units . . . . . . . . . . . . . . . 46
Combining Statement of Activities—Discretely Presented Component Units . . . . . . . . . . . . . . . . . 48
Notes to the Basic Financial Statements . . . . . . . . . . . . . . . . . . . . . . . . . . . . . . . . . . . . . . . . . . . . . . . . 51
REQUIRED SUPPLEMENTARY INFORMATION (unaudited)Budgetary Basis—Financial Plan and Actual—Combined Schedule
of Cash Receipts and Disbursements—Major Funds—General Fund and Federal Special Revenue Fund . . . . . . . . . . . . . . . . . . . . . . . . . . . . . . . . . . . . . 104
Notes to Budgetary Basis Reporting . . . . . . . . . . . . . . . . . . . . . . . . . . . . . . . . . . . . . . . . . . . . . . . . . . . 106
Infrastructure Assets Using the Modified Approach . . . . . . . . . . . . . . . . . . . . . . . . . . . . . . . . . . . . . . 108
Schedule of Funding Progress—Other Postemployment Benefits . . . . . . . . . . . . . . . . . . . . . . . . . . 110
2 • STATE OF NEW YORK _______________________________________________________________________________________________
OTHER SUPPLEMENTARY INFORMATIONGeneral Fund
Narrative . . . . . . . . . . . . . . . . . . . . . . . . . . . . . . . . . . . . . . . . . . . . . . . . . . . . . . . . . . . . . . . . . . . . . . . 113
Combining Schedule of Balance Sheet Accounts . . . . . . . . . . . . . . . . . . . . . . . . . . . . . . . . . . . . . . 114
Combining Schedule of Revenues, Expenditures and Changes in Fund Balance (Deficit) Accounts . . . . . . . . . . . . . . . . . . . . . . . . . . . . . . . . . . . . . . . . . . . . . . . . . . . . . . . . . . . . . . 116
Federal Special Revenue Fund
Narrative . . . . . . . . . . . . . . . . . . . . . . . . . . . . . . . . . . . . . . . . . . . . . . . . . . . . . . . . . . . . . . . . . . . . . . . 119
Combining Schedule of Balance Sheet Accounts . . . . . . . . . . . . . . . . . . . . . . . . . . . . . . . . . . . . . . 120
Combining Schedule of Revenues, Expenditures and Changes in Fund Balance Accounts . . . . 122
General Debt Service Fund
Narrative . . . . . . . . . . . . . . . . . . . . . . . . . . . . . . . . . . . . . . . . . . . . . . . . . . . . . . . . . . . . . . . . . . . . . . . 125
Combining Schedule of Balance Sheet Accounts . . . . . . . . . . . . . . . . . . . . . . . . . . . . . . . . . . . . . . 126
Combining Schedule of Revenues, Expenditures and Changes in Fund Balance Accounts . . . . 127
Schedule of Cash Receipts and Disbursements—Budgetary Basis—Financial Plan and Actual . . . . . . . . . . . . . . . . . . . . . . . . . . . . . . . . . . . . . . . . . . . . . . . . . . . . . . . . 128
Other Governmental Funds
Combining Balance Sheet . . . . . . . . . . . . . . . . . . . . . . . . . . . . . . . . . . . . . . . . . . . . . . . . . . . . . . . . . 130
Combining Statement of Revenues, Expenditures and Changes in Fund Balances . . . . . . . . . . 131
Combining Schedule of Cash Receipts and Disbursements—Budgetary Basis—Financial Plan and Actual . . . . . . . . . . . . . . . . . . . . . . . . . . . . . . . . . . . . . . . . . . . . . . . . . . . . . . . . 132
Special Revenue Funds
Narrative . . . . . . . . . . . . . . . . . . . . . . . . . . . . . . . . . . . . . . . . . . . . . . . . . . . . . . . . . . . . . . . . . . . . . . . 135
Combining Balance Sheet—Other Governmental Funds . . . . . . . . . . . . . . . . . . . . . . . . . . . . . . . 136
Combining Statement of Revenues, Expenditures and Changes in Fund Balances (Deficits)—Other Governmental Funds . . . . . . . . . . . . . . . . . . . . . . . . . . . . . . . . . . . . . . . . . . . . . . . . . . . . . . 138
Combining Schedule of Cash Receipts and Disbursements—Budgetary Basis—Financial Plan and Actual—Other Governmental Funds . . . . . . . . . . . . . . . . . . . . . . . . . . . . . . 140
Debt Service Funds
Narrative . . . . . . . . . . . . . . . . . . . . . . . . . . . . . . . . . . . . . . . . . . . . . . . . . . . . . . . . . . . . . . . . . . . . . . . 143
Combining Balance Sheet—Other Governmental Funds . . . . . . . . . . . . . . . . . . . . . . . . . . . . . . . 144
Combining Statement of Revenues, Expenditures and Changes in Fund Balances—Other Governmental Funds . . . . . . . . . . . . . . . . . . . . . . . . . . . . . . . . . . . . . . . . . . . . . . . . . . . . . . 145
Combining Schedule of Cash Receipts and Disbursements—Budgetary Basis—Financial Plan and Actual—Other Governmental Funds . . . . . . . . . . . . . . . . . . . . . . . . . . . . . . 146
Capital Projects Funds
Narrative . . . . . . . . . . . . . . . . . . . . . . . . . . . . . . . . . . . . . . . . . . . . . . . . . . . . . . . . . . . . . . . . . . . . . . . 149
Combining Balance Sheet—Other Governmental Funds . . . . . . . . . . . . . . . . . . . . . . . . . . . . . . . 150
Combining Statement of Revenues, Expenditures and Changes in Fund Balances (Deficits)—Other Governmental Funds . . . . . . . . . . . . . . . . . . . . . . . . . . . . . . . . . . . . . . . . . . . . 152
Combining Schedule of Cash Receipts and Disbursements—Budgetary Basis—Financial Plan and Actual—Other Governmental Funds . . . . . . . . . . . . . . . . . . . . . . . . . . . . . . 154
_______________________________________________________________________________________________ STATE OF NEW YORK • 3
Fiduciary Funds
Narrative . . . . . . . . . . . . . . . . . . . . . . . . . . . . . . . . . . . . . . . . . . . . . . . . . . . . . . . . . . . . . . . . . . . . . . . 159
Combining Statement of Fiduciary Net Position—Private Purpose Trusts . . . . . . . . . . . . . . . . . . 160
Combining Statement of Changes in Fiduciary Net Position—Private Purpose Trusts . . . . . . . . 161
Combining Statement of Fiduciary Net Position—Agency Funds . . . . . . . . . . . . . . . . . . . . . . . . . 162
Combining Statement of Changes in Assets and Liabilities—Agency Funds . . . . . . . . . . . . . . . . 164
Non-Major Component Units
Narrative . . . . . . . . . . . . . . . . . . . . . . . . . . . . . . . . . . . . . . . . . . . . . . . . . . . . . . . . . . . . . . . . . . . . . . . 169
Combining Statement of Net Position—Discretely Presented Non-Major Component Units . . . 170
Combining Statement of Activities—Discretely Presented Non-Major Component Units . . . . . . 172
STATISTICAL SECTIONChanges in Fund Balances—Governmental Funds—Last Ten Fiscal Years . . . . . . . . . . . . . . . . . . . 176
Net Position by Component—Last Ten Fiscal Years . . . . . . . . . . . . . . . . . . . . . . . . . . . . . . . . . . . . . . 178
Changes in Net Position—Last Ten Fiscal Years . . . . . . . . . . . . . . . . . . . . . . . . . . . . . . . . . . . . . . . . . 180
Fund Balances—Governmental Funds—Last Ten Fiscal Years . . . . . . . . . . . . . . . . . . . . . . . . . . . . . 184
Tax Receipts by Source—Governmental Funds—Last Ten Fiscal Years . . . . . . . . . . . . . . . . . . . . . . 184
Program Revenues by Function/Program—Last Ten Fiscal Years . . . . . . . . . . . . . . . . . . . . . . . . . . . 186
New York State and Local Retirement System—Changes in Net Position—Last Ten Fiscal Years . . . . . . . . . . . . . . . . . . . . . . . . . . . . . . . . . . . . . . . . . . . . . . . . . . . . . . . . . . . . . . 186
Personal Income Tax Filers and Liability by Income Level—For Ten Years Stated . . . . . . . . . . . . . 188
Personal Income by Industry—Last Ten Calendar Years . . . . . . . . . . . . . . . . . . . . . . . . . . . . . . . . . . 190
Personal Income Tax Rates—Last Ten Calendar Years . . . . . . . . . . . . . . . . . . . . . . . . . . . . . . . . . . . . 192
Ratios of Outstanding Debt by Type—Last Ten Fiscal Years . . . . . . . . . . . . . . . . . . . . . . . . . . . . . . . . 193
Legal Debt Margin Information—Last Ten Fiscal Years . . . . . . . . . . . . . . . . . . . . . . . . . . . . . . . . . . . 194
Ratios of General Obligation Debt Outstanding and Legal Debt Margin—Last Ten Fiscal Years . . . . . . . . . . . . . . . . . . . . . . . . . . . . . . . . . . . . . . . . . . . . . . . . . . . . . . . . . . . . . . 196
Pledged Revenue Coverage—Ten Fiscal Years Stated . . . . . . . . . . . . . . . . . . . . . . . . . . . . . . . . . . . . . 198
Ratios of General Bonded Debt Outstanding—Last Ten Fiscal Years . . . . . . . . . . . . . . . . . . . . . . . . 199
Government Employees by Level of Government—New York State 2002–2011 . . . . . . . . . . . . . . . 199
Demographic and Economic Statistics I—Last Ten Calendar Years . . . . . . . . . . . . . . . . . . . . . . . . . 200
Demographic and Economic Statistics II—Last Ten Calendar Years . . . . . . . . . . . . . . . . . . . . . . . . . 200
Employment by Industry—Ten Years Stated . . . . . . . . . . . . . . . . . . . . . . . . . . . . . . . . . . . . . . . . . . . . 202
Select State Agency Employment—March 2013 . . . . . . . . . . . . . . . . . . . . . . . . . . . . . . . . . . . . . . . . . 204
Operating Indicators—Last Ten Years . . . . . . . . . . . . . . . . . . . . . . . . . . . . . . . . . . . . . . . . . . . . . . . . . 204
Capital Asset Balances by Function—Last Ten Fiscal Years . . . . . . . . . . . . . . . . . . . . . . . . . . . . . . . . 206
Membership by Type of Benefit Plan—As of March 31, 2013 . . . . . . . . . . . . . . . . . . . . . . . . . . . . . . 208
Principal Participating Employers—Ten Most Recent Fiscal Years . . . . . . . . . . . . . . . . . . . . . . . . . . 208
4 • STATE OF NEW YORK _______________________________________________________________________________________________

Introductory Section
THOMAS P. DINAPOLI
State Comptroller
I
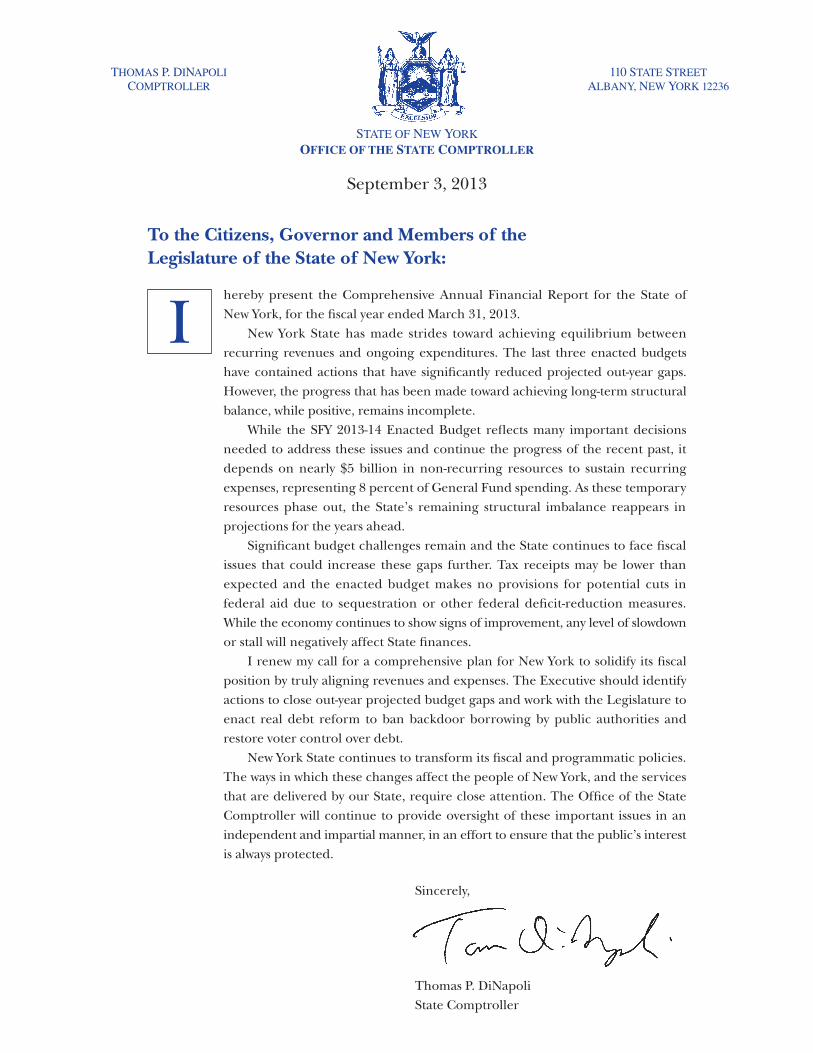
THOMAS P. DINAPOLICOMPTROLLER
110 STATE STREETALBANY, NEW YORK 12236
STATE OF NEW YORKOFFICE OF THE STATE COMPTROLLER
September 3, 2013
To the Citizens, Governor and Members of the Legislature of the State of New York:
hereby present the Comprehensive Annual Financial Report for the State ofNew York, for the fiscal year ended March 31, 2013.
New York State has made strides toward achieving equilibrium betweenrecurring revenues and ongoing expenditures. The last three enacted budgetshave contained actions that have significantly reduced projected out-year gaps.However, the progress that has been made toward achieving long-term structuralbalance, while positive, remains incomplete.
While the SFY 2013-14 Enacted Budget reflects many important decisionsneeded to address these issues and continue the progress of the recent past, itdepends on nearly $5 billion in non-recurring resources to sustain recurringexpenses, representing 8 percent of General Fund spending. As these temporaryresources phase out, the State’s remaining structural imbalance reappears inprojections for the years ahead.
Significant budget challenges remain and the State continues to face fiscalissues that could increase these gaps further. Tax receipts may be lower thanexpected and the enacted budget makes no provisions for potential cuts infederal aid due to sequestration or other federal deficit-reduction measures.While the economy continues to show signs of improvement, any level of slowdownor stall will negatively affect State finances.
I renew my call for a comprehensive plan for New York to solidify its fiscalposition by truly aligning revenues and expenses. The Executive should identifyactions to close out-year projected budget gaps and work with the Legislature toenact real debt reform to ban backdoor borrowing by public authorities andrestore voter control over debt.
New York State continues to transform its fiscal and programmatic policies.The ways in which these changes affect the people of New York, and the servicesthat are delivered by our State, require close attention. The Office of the StateComptroller will continue to provide oversight of these important issues in anindependent and impartial manner, in an effort to ensure that the public’s interestis always protected.
Sincerely,
Thomas P. DiNapoliState Comptroller

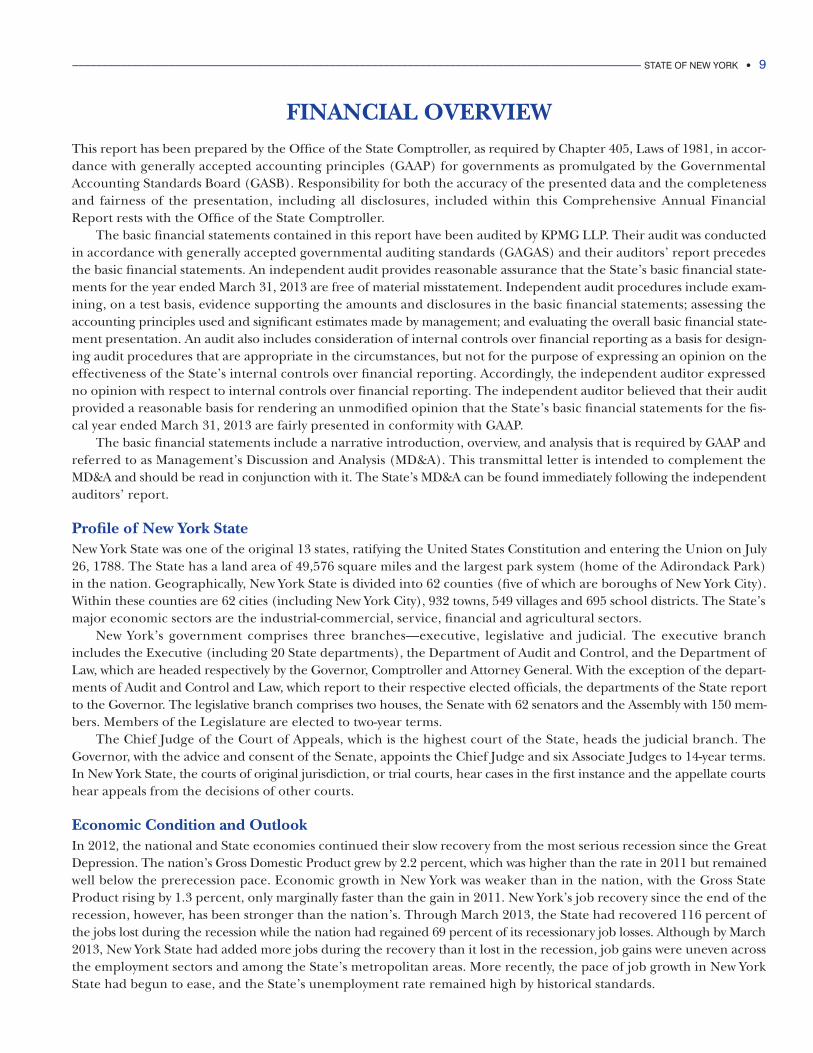
FINANCIAL OVERVIEWThis report has been prepared by the Office of the State Comptroller, as required by Chapter 405, Laws of 1981, in accor-dance with generally accepted accounting principles (GAAP) for governments as promulgated by the GovernmentalAccounting Standards Board (GASB). Responsibility for both the accuracy of the presented data and the completenessand fairness of the presentation, including all disclosures, included within this Comprehensive Annual FinancialReport rests with the Office of the State Comptroller.
The basic financial statements contained in this report have been audited by KPMG LLP. Their audit was conductedin accordance with generally accepted governmental auditing standards (GAGAS) and their auditors’ report precedesthe basic financial statements. An independent audit provides reasonable assurance that the State’s basic financial state-ments for the year ended March 31, 2013 are free of material misstatement. Independent audit procedures include exam-ining, on a test basis, evidence supporting the amounts and disclosures in the basic financial statements; assessing theaccounting principles used and significant estimates made by management; and evaluating the overall basic financial state-ment presentation. An audit also includes consideration of internal controls over financial reporting as a basis for design-ing audit procedures that are appropriate in the circumstances, but not for the purpose of expressing an opinion on theeffectiveness of the State’s internal controls over financial reporting. Accordingly, the independent auditor expressedno opinion with respect to internal controls over financial reporting. The independent auditor believed that their auditprovided a reasonable basis for rendering an unmodified opinion that the State’s basic financial statements for the fis-cal year ended March 31, 2013 are fairly presented in conformity with GAAP.
The basic financial statements include a narrative introduction, overview, and analysis that is required by GAAP andreferred to as Management’s Discussion and Analysis (MD&A). This transmittal letter is intended to complement theMD&A and should be read in conjunction with it. The State’s MD&A can be found immediately following the independentauditors’ report.
Profile of New York StateNew York State was one of the original 13 states, ratifying the United States Constitution and entering the Union on July26, 1788. The State has a land area of 49,576 square miles and the largest park system (home of the Adirondack Park)in the nation. Geographically, New York State is divided into 62 counties (five of which are boroughs of New York City).Within these counties are 62 cities (including New York City), 932 towns, 549 villages and 695 school districts. The State’smajor economic sectors are the industrial-commercial, service, financial and agricultural sectors.
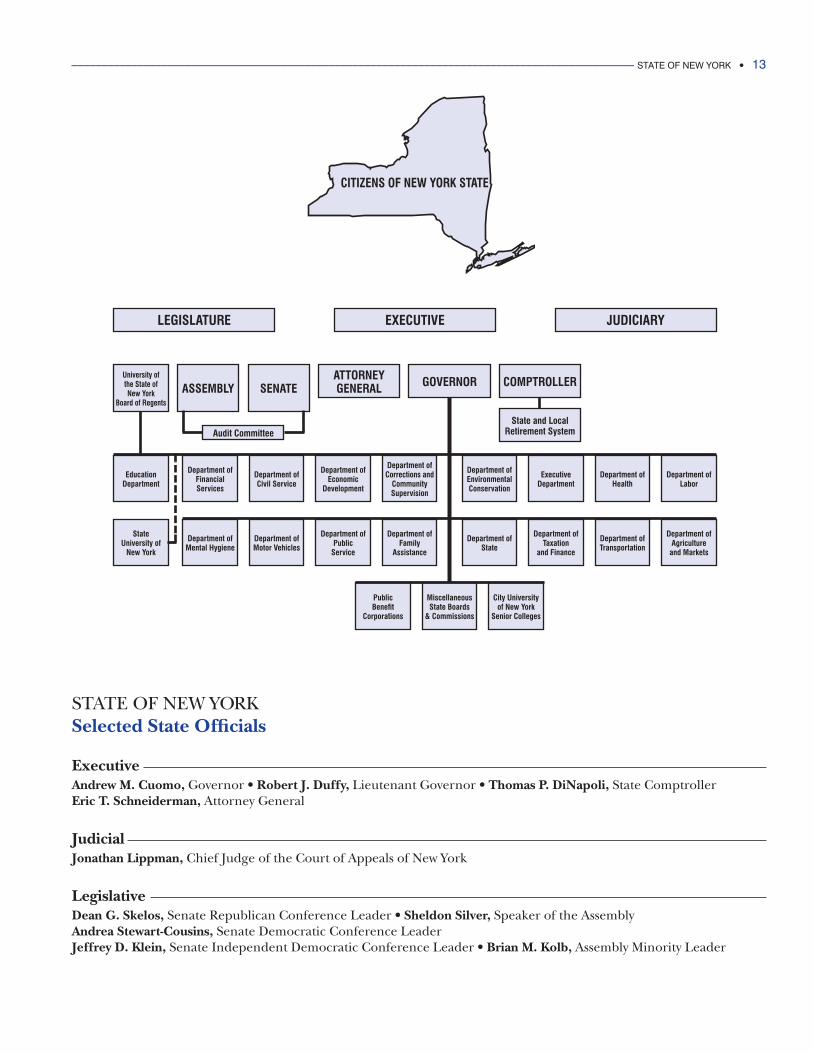
New York’s government comprises three branches—executive, legislative and judicial. The executive branchincludes the Executive (including 20 State departments), the Department of Audit and Control, and the Department ofLaw, which are headed respectively by the Governor, Comptroller and Attorney General. With the exception of the depart-ments of Audit and Control and Law, which report to their respective elected officials, the departments of the State reportto the Governor. The legislative branch comprises two houses, the Senate with 62 senators and the Assembly with 150 mem-bers. Members of the Legislature are elected to two-year terms.
The Chief Judge of the Court of Appeals, which is the highest court of the State, heads the judicial branch. TheGovernor, with the advice and consent of the Senate, appoints the Chief Judge and six Associate Judges to 14-year terms.In New York State, the courts of original jurisdiction, or trial courts, hear cases in the first instance and the appellate courtshear appeals from the decisions of other courts.
Economic Condition and OutlookIn 2012, the national and State economies continued their slow recovery from the most serious recession since the GreatDepression. The nation’s Gross Domestic Product grew by 2.2 percent, which was higher than the rate in 2011 but remainedwell below the prerecession pace. Economic growth in New York was weaker than in the nation, with the Gross StateProduct rising by 1.3 percent, only marginally faster than the gain in 2011. New York’s job recovery since the end of therecession, however, has been stronger than the nation’s. Through March 2013, the State had recovered 116 percent ofthe jobs lost during the recession while the nation had regained 69 percent of its recessionary job losses. Although by March2013, New York State had added more jobs during the recovery than it lost in the recession, job gains were uneven acrossthe employment sectors and among the State’s metropolitan areas. More recently, the pace of job growth in New YorkState had begun to ease, and the State’s unemployment rate remained high by historical standards.
_______________________________________________________________________________________________ STATE OF NEW YORK • 9
Even as Wall Street continued to work its way through the fallout from the financial crisis and a new regulatory envi-ronment, the securities industry remained an important component of the State’s economy, providing 12 percent of allwages paid in the State and generating about 14 percent of State tax revenues. While profitability in the industry reboundedin 2012, with the broker/dealer operations of New York Stock Exchange member firms reporting $23.9 billion in profits(three times the level in 2011), the industry regained slightly less than 20 percent of the jobs it lost during the financialcrisis, a much weaker recovery than at comparable points after earlier downturns. The Office of the State Comptroller esti-mated that the industry’s cash bonuses for the 2012 bonus season grew by 8 percent, driven in part by bonuses deferredfrom prior years.
The Reporting Entity and Its ServicesThe funds and entities included in this Comprehensive Annual Financial Report are those for which the State is account-able, based on criteria for defining the financial reporting entity prescribed by the GASB. The criteria include: legal stand-ing, fiscal dependency and financial accountability. Based on these criteria, the various funds and entities shown in thisreport are considered as part of the reporting entity (see Notes 1 and 14 of the Notes to the Basic Financial Statements).
The State provides a range of governmental services in such areas as education, public health, public welfare, pub-lic safety, and transportation, among others, and also administers the New York State and Local Retirement System.
Component UnitsComponent units are discretely presented and reported as public benefit corporations (Corporations), which includesPublic Authorities, and are legally separate entities that are not operating departments of the State. Corporations havebeen established for a variety of purposes such as economic development, capital construction, financing, and public trans-portation. The powers of the Corporations generally are vested in their governing boards. The Governor, with the approvalof the State Senate, appoints a majority of the members of the Board of most major Corporations, and either the Governoror the Board selects the chairperson and chief operating officer. Corporations are not subject to the State constitutionalrestrictions on the incurrence of debt which apply to the State, and may issue bonds and notes within legislatively autho-rized amounts.
Corporations submit annual reports on their operations and finances accompanied by an independent auditors’ reportto the Governor, the Legislature and the State Comptroller. Corporations are generally supported by revenues derivedfrom their activities, although in recent years the State has provided financial assistance, in some cases of a recurring nature,to certain Corporations for operating and other expenses, and in fulfillment of its commitments on moral obligationindebtedness. The Corporations have been presented in the accompanying financial statements as component units ofthe State. The amounts presented in this report were derived from the Corporations’ most recent audited financial state-ments. At year-end these entities reported net position of $38.7 billion. For further information, refer to Note 14 of theNotes to the Basic Financial Statements.
Budgetary and Other Control SystemsThe State Constitution requires the Governor to submit a cash basis balanced Executive Budget that contains a completeplan of expenditures for the ensuing fiscal year, and identifies the anticipated revenues sufficient to meet the proposedexpenditures. Included in the proposed budget are provisions for spending authority for unanticipated revenues or unfore-seen emergencies in accordance with statutory requirements. The Executive Budget also includes both cash basis andGAAP basis financial plans for the ensuing fiscal year, as well as a three-year financial projection for governmental fundsand a five-year capital plan. The accounting policies used in developing the GAAP basis financial plans are generally con-sistent with those used in preparing the annual GAAP financial statements. Generally, the financial plans are updated quar-terly. The Legislature enacts appropriation bills and revenue measures embodying those parts of the Executive Budgetit has approved. Expenditures are controlled at the major object level (e.g., personal service, grants to local governments)within each program or project of each State agency in accordance with the underlying approved appropriation bills.
In developing the State’s accounting system, consideration was given to the adequacy of internal controls. Internalaccounting controls are designed to provide reasonable, but not absolute, assurance regarding the safeguarding of assetsagainst loss from unauthorized use or disposition and the reliability of financial records for preparing financial statementsand maintaining accountability for assets. The concept of reasonable assurance recognizes that the cost of control shouldnot exceed the benefits derived. The State’s internal accounting controls are periodically tested to ensure adherence tointernal control policies and procedures.
10 • STATE OF NEW YORK ______________________________________________________________________________________________
In 1987 the Legislature passed the New York State Governmental Accountability, Audit and Internal Control Act, whichcommits the State to enhancing existing systems of internal controls in all State governmental entities. As a result,there is now a requirement for managers in all branches and components of government to maintain comprehensive inter-nal control systems and to regularly evaluate the effectiveness and adequacy of these systems by internal reviews and exter-nal audits. Finally, the legislation promotes accountability by assuring that all external audits are made available to the public.
General Governmental ResultsAn operating surplus of $ 1.1 billion is reported in the General Fund for the fiscal year ended March 31, 2013. As a result,the General Fund now has an accumulated fund deficit of $739 million. The State completed its fiscal year ended March31, 2013 with a combined Governmental Funds operating surplus of $136 million as compared to a combinedGovernmental Funds operating surplus in the preceding fiscal year of $619 million. The combined operating surplus of$136 million for the fiscal year ended March 31, 2013 included an operating surplus in the General Fund of $1.1 billionand in the General Debt Service Fund of $40 million, offset by an operating deficit in the Federal Special Revenue Fundof $27 million and $1 billion in Other Governmental Funds. For further information, refer to the MD&A which imme-diately follows the independent auditors’ report.
The State’s financial position as shown in its Governmental Funds Balance Sheet as of March 31, 2013 includes a fundbalance of $6.5 billion comprised of $33.2 billion of assets available to liquidate liabilities of $26.7 billion. TheGovernmental Funds fund balance includes a $739 million accumulated deficit General Fund balance.
Certificate of AchievementThe Office of the State Comptroller was honored for the 24th consecutive year to receive the Certificate of Achievementfor Excellence in Financial Reporting from the Government Finance Officers Association for the State’s 2012Comprehensive Annual Financial Report. This prestigious award represents the highest form of recognition in the areaof governmental financial reporting, and reflects a commitment by the Office of the State Comptroller to communicatethe State’s financial results and position clearly to the taxpayers through public disclosure.
AcknowledgmentsThis report could not have been prepared without the cooperation of all State agencies, the Legislature, and the Judiciary.I especially appreciate the professionalism and dedication demonstrated by my staff in the preparation of this report.
______________________________________________________________________________________________ STATE OF NEW YORK • 11
Certificate of
Presented to
For its Comprehensive Annual
March 31, 2012
Executive Director/CEO
Financial Reportfor the Fiscal Year Ended
Reportingin Financial
for ExcellenceAchievement
State of New York
Government Finance Officers Association
______________________________________________________________________________________________ STATE OF NEW YORK • 13
JUDICIARYLEGISLATURE EXECUTIVE
ASSEMBLY SENATEATTORNEYGENERAL GOVERNOR COMPTROLLER
State and LocalRetirement SystemAudit Committee
Department ofFinancialServices
Department ofCivil Service
Department ofEconomic
Development
Department ofCorrections and
CommunitySupervision
Department ofEnvironmentalConservation
ExecutiveDepartment
Department ofHealth
Department ofLabor
Department ofMental Hygiene
Department ofMotor Vehicles
Department ofPublic
Service
Department ofFamily
Assistance
Department ofState
Department ofTaxation
and Finance
Department ofTransportation
Department ofAgriculture
and Markets
PublicBenefit
Corporations
MiscellaneousState Boards
& Commissions
City Universityof New York
Senior Colleges
STATE OF NEW YORKSelected State Officials
ExecutiveAndrew M. Cuomo, Governor • Robert J. Duffy, Lieutenant Governor • Thomas P. DiNapoli, State ComptrollerEric T. Schneiderman, Attorney General
JudicialJonathan Lippman, Chief Judge of the Court of Appeals of New York
LegislativeDean G. Skelos, Senate Republican Conference Leader • Sheldon Silver, Speaker of the AssemblyAndrea Stewart-Cousins, Senate Democratic Conference LeaderJeffrey D. Klein, Senate Independent Democratic Conference Leader • Brian M. Kolb, Assembly Minority Leader
CITIZENS OF NEW YORK STATE
University of the State of New York
Board of Regents
EducationDepartment
StateUniversity of
New York


Financial Section
Independent Auditors’ Report
The Audit Committee New York State Legislature:
Report on the Financial Statements
We have audited the accompanying financial statements of the governmental activities, the business-type activities, the aggregate discretely presented component units, each major fund, and the aggregate remaining fund information of the State of New York (the State), as of and for the year ended March 31,2013, and the related notes to the basic financial statements, which collectively comprise the State’s basic financial statements as listed in the table of contents.
Management’s Responsibility for the Financial Statements
Management is responsible for the preparation and fair presentation of these financial statements in accordance with U.S. generally accepted accounting principles; this includes the design, implementation, and maintenance of internal control relevant to the preparation and fair presentation of financial statements that are free from material misstatement, whether due to fraud or error.
Auditors’ Responsibility
Our responsibility is to express opinions on these financial statements based on our audit. We did not audit the financial statements of the New York Local Government Assistance Corporation, the Tuition Savings Program, and certain organizations included within the SUNY enterprise fund and certain of the discretely presented component units as identified in note 14 to the basic financial statements. The New York Local Government Assistance Corporation represents less than 1 percent of the assets of the governmental activities and the aggregate remaining fund information, and 2 percent and 6 percent, respectively, of the revenues of the governmental activities and the aggregate remaining fund information. The Tuition Savings Program represents 7 percent of the assets and the revenues of the aggregate remaining fund information. The certain organizations included within the SUNY enterprise fund identified in note 14 of the basic financial statements represent 8 percent and 14 percent, respectively, of the assets of the business-type activities and the SUNY enterprise fund, and 5 percent and 18 percent, respectively, of the revenues of the business-type activities and the SUNY enterprise fund. The certain discretely presented component units identified in note 14 of the basic financial statements represent 59 percent and 66 percent, respectively, of the assets and the revenues of the aggregate discretely presented component units. The financial statements of these entities were audited by other auditors whose reports have been furnished to us, and our opinions, insofar as they relate to the amounts included for the New York Local Government Assistance Corporation, the Tuition Savings Program, and the certain organizations included within the SUNY enterprise fund and certain discretely presented component units identified in note 14 of the basic financial statements, arebased solely on the reports of the other auditors.
KPMG LLP 515 Broadway Albany, NY 12207-2974
KPMG LLP is a Delaware limited liability partnership, the U.S. member firm of KPMG International Cooperative (“KPMG International”), a Swiss entity.
We conducted our audit in accordance with auditing standards generally accepted in the United States of America and the standards applicable to financial audits contained in Government Auditing Standards, issued by the Comptroller General of the United States. Those standards require that we plan and perform the audit to obtain reasonable assurance about whether the financial statements are free from material misstatement. The financial statements of the Lottery enterprise fund and of certain discretely presented component units as identified in note 14 of the basic financial statements were not audited in accordance with Government Auditing Standards.
An audit involves performing procedures to obtain audit evidence about the amounts and disclosures in the financial statements. The procedures selected depend on the auditors’ judgment, including the assessment of the risks of material misstatement of the financial statements, whether due to fraud or error. In making those risk assessments, the auditor considers internal control relevant to the entity’s preparation and fair presentation of the financial statements in order to design audit procedures that are appropriate in the circumstances, but not for the purpose of expressing an opinion on the effectiveness of the entity’s internal control. Accordingly, we express no such opinion. An audit also includes evaluating the appropriateness of accounting policies used and the reasonableness of significant accounting estimates made by management, as well as evaluating the overall presentation of the financial statements.
We believe that the audit evidence we have obtained is sufficient and appropriate to provide a basis for our audit opinions.
Opinions
In our opinion, based on our audit and the reports of the other auditors, the financial statements referred to above present fairly, in all material respects, the respective financial position of the governmental activities, the business-type activities, the aggregate discretely presented component units, each major fund, and the aggregate remaining fund information of the State of New York, as of March 31, 2013, and the respectivechanges in financial position and, where applicable, cash flows thereof for the year then ended in accordance with U.S. generally accepted accounting principles.
Emphasis of Matter
As discussed in Note 1(s) to the basic financial statements, the State has elected to change its method of accounting for escheat property in the fiscal year ended March 31, 2013. Our opinion is not modified with respect to this matter.
Other Matters
Required Supplementary Information
U.S. generally accepted accounting principles require that the management’s discussion and analysis and required supplementary information listed in the accompanying table of contents be presented to supplement the basic financial statements. Such information, although not a part of the basic financial statements, is required by the Governmental Accounting Standards Board who considers it to be an essential part of financial reporting for placing the basic financial statements in an appropriate operational, economic, or historical context. We have applied certain limited procedures to the management’s discussion and analysis and required supplementary information in accordance with auditing standards generally accepted in the United States of America, which consisted of inquiries of management about the methods of preparing the information and comparing the information for consistency with management’s responses to our inquiries, the basic financial statements, and other knowledge we obtained during our audit of the basic financial statements. We do not express an opinion or provide any assurance on the information because the limited procedures do not provide us with sufficient evidence to express an opinion or provide any assurance.
Supplementary and Other Information
Our audit was conducted for the purpose of forming opinions on the financial statements that collectively comprise the State’s basic financial statements. The other supplementary information listed in the accompanying table of contents, and the introductory and statistical sections are presented for purposes of additional analysis and are not a required part of the basic financial statements.
The other supplementary information is the responsibility of management and was derived from and relate directly to the underlying accounting and other records used to prepare the basic financial statements. Such information has been subjected to the auditing procedures applied in the audit of the basic financial statements and certain additional procedures, including comparing and reconciling such information directly to the underlying accounting and other records used to prepare the basic financial statements or to the basic financial statements themselves, and other additional procedures in accordance with auditing standards generally accepted in the United States of America by us and the other auditors. In our opinion, based on our audit, the procedures performed as described above, and the reports of the other auditors, the other supplementary information is fairly stated, in all material respects, in relation to the basic financial statements as a whole.
The introductory and statistical sections have not been subjected to the auditing procedures applied in the audit of the basic financial statements, and accordingly, we do not express an opinion or provide any assurance on them.
Other Reporting Required by Government Auditing Standards
In accordance with Government Auditing Standards, we have also issued our report dated July 25, 2013 onour consideration of the State’s internal control over financial reporting and on our tests of its compliance with certain provisions of laws, regulations, contracts, and grant agreements and other matters. The purpose of that report is to describe the scope of our testing of internal control over financial reporting and compliance and the results of that testing, and not to provide an opinion on internal control over financial reporting or on compliance. That report is an integral part of an audit performed in accordance with Government Auditing Standards in considering the State’s internal control over financial reporting and compliance.
Albany, New York July 25, 2013
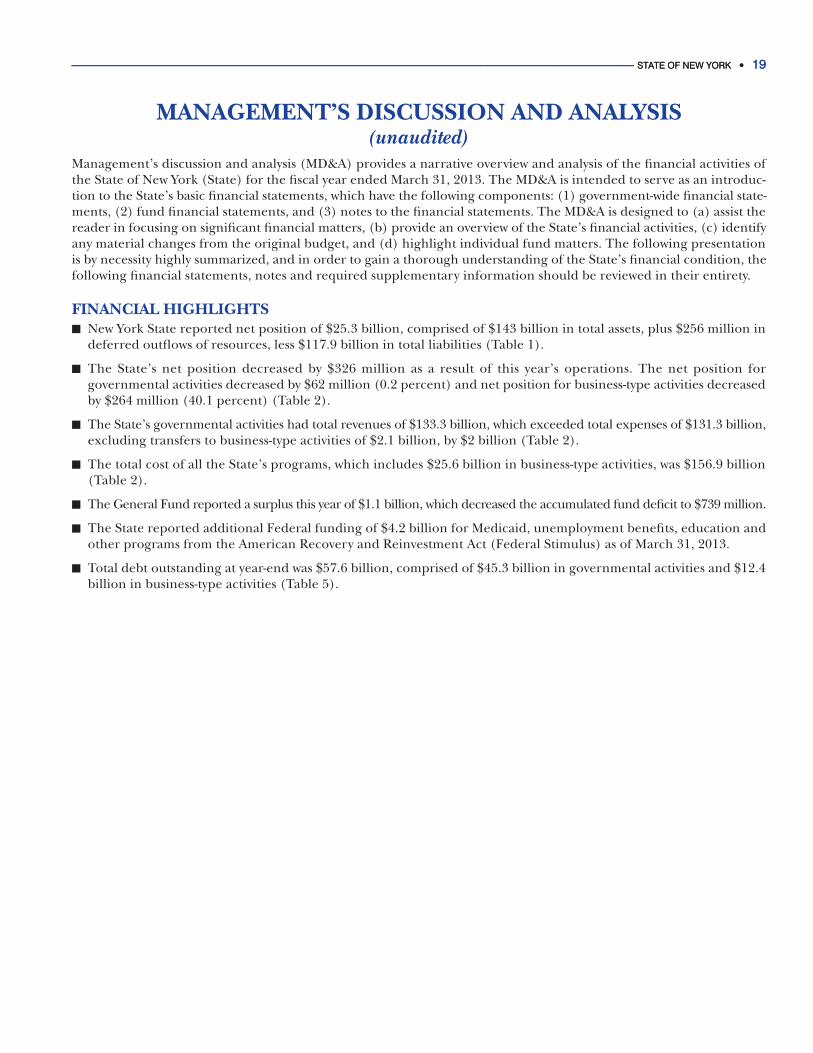
MANAGEMENT’S DISCUSSION AND ANALYSIS(unaudited)
Management’s discussion and analysis (MD&A) provides a narrative overview and analysis of the financial activities ofthe State of New York (State) for the fiscal year ended March 31, 2013. The MD&A is intended to serve as an introduc-tion to the State’s basic financial statements, which have the following components: (1) government-wide financial state-ments, (2) fund financial statements, and (3) notes to the financial statements. The MD&A is designed to (a) assist thereader in focusing on significant financial matters, (b) provide an overview of the State’s financial activities, (c) identifyany material changes from the original budget, and (d) highlight individual fund matters. The following presentationis by necessity highly summarized, and in order to gain a thorough understanding of the State’s financial condition, thefollowing financial statements, notes and required supplementary information should be reviewed in their entirety.
FINANCIAL HIGHLIGHTSy New York State reported net position of $25.3 billion, comprised of $143 billion in total assets, plus $256 million in
deferred outflows of resources, less $117.9 billion in total liabilities (Table 1).
y The State’s net position decreased by $326 million as a result of this year’s operations. The net position forgovernmental activities decreased by $62 million (0.2 percent) and net position for business-type activities decreasedby $264 million (40.1 percent) (Table 2).
y The State’s governmental activities had total revenues of $133.3 billion, which exceeded total expenses of $131.3 billion,excluding transfers to business-type activities of $2.1 billion, by $2 billion (Table 2).
y The total cost of all the State’s programs, which includes $25.6 billion in business-type activities, was $156.9 billion(Table 2).
y The General Fund reported a surplus this year of $1.1 billion, which decreased the accumulated fund deficit to $739 million.
y The State reported additional Federal funding of $4.2 billion for Medicaid, unemployment benefits, education andother programs from the American Recovery and Reinvestment Act (Federal Stimulus) as of March 31, 2013.
y Total debt outstanding at year-end was $57.6 billion, comprised of $45.3 billion in governmental activities and $12.4billion in business-type activities (Table 5).
______________________________________________________________________________________________ STATE OF NEW YORK • 19______________________________________________________________________________________________ STATE OF NEW YORK • 19
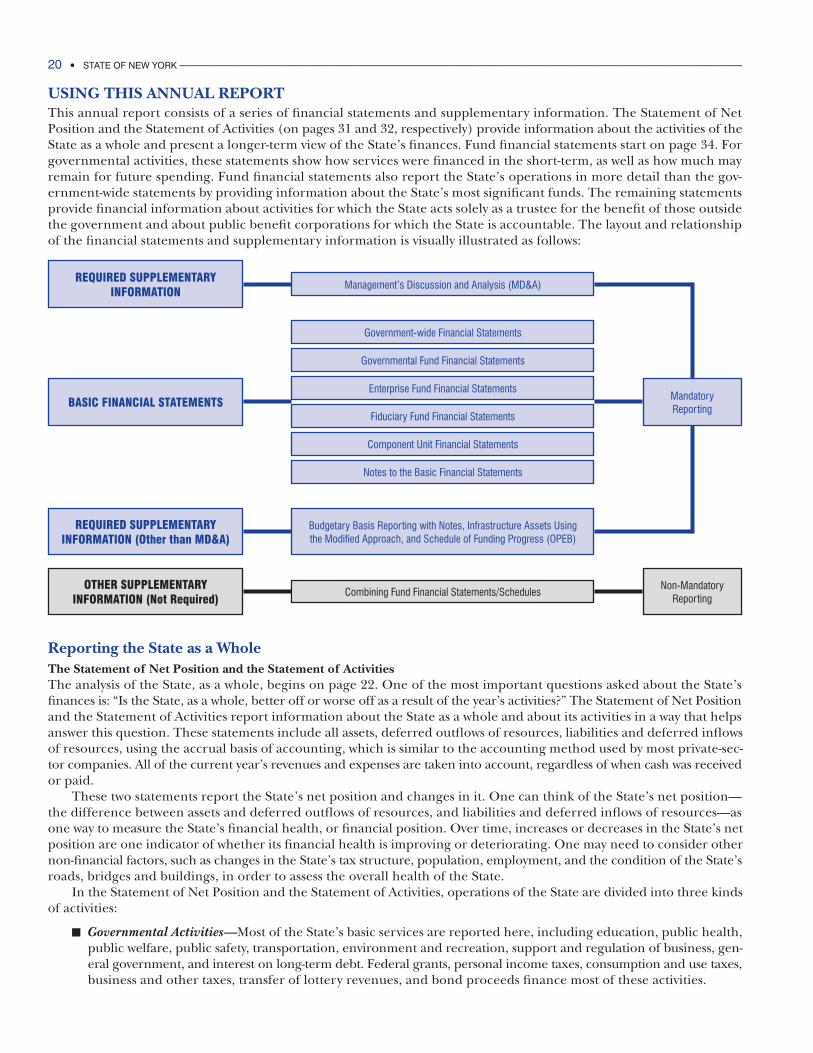
USING THIS ANNUAL REPORTThis annual report consists of a series of financial statements and supplementary information. The Statement of NetPosition and the Statement of Activities (on pages 31 and 32, respectively) provide information about the activities of theState as a whole and present a longer-term view of the State’s finances. Fund financial statements start on page 34. Forgovernmental activities, these statements show how services were financed in the short-term, as well as how much mayremain for future spending. Fund financial statements also report the State’s operations in more detail than the gov-ernment-wide statements by providing information about the State’s most significant funds. The remaining statementsprovide financial information about activities for which the State acts solely as a trustee for the benefit of those outsidethe government and about public benefit corporations for which the State is accountable. The layout and relationshipof the financial statements and supplementary information is visually illustrated as follows:
Reporting the State as a WholeThe Statement of Net Position and the Statement of ActivitiesThe analysis of the State, as a whole, begins on page 22. One of the most important questions asked about the State’sfinances is: “Is the State, as a whole, better off or worse off as a result of the year’s activities?” The Statement of Net Positionand the Statement of Activities report information about the State as a whole and about its activities in a way that helpsanswer this question. These statements include all assets, deferred outflows of resources, liabilities and deferred inflowsof resources, using the accrual basis of accounting, which is similar to the accounting method used by most private-sec-tor companies. All of the current year’s revenues and expenses are taken into account, regardless of when cash was receivedor paid.
These two statements report the State’s net position and changes in it. One can think of the State’s net position—the difference between assets and deferred outflows of resources, and liabilities and deferred inflows of resources—asone way to measure the State’s financial health, or financial position. Over time, increases or decreases in the State’s netposition are one indicator of whether its financial health is improving or deteriorating. One may need to consider othernon-financial factors, such as changes in the State’s tax structure, population, employment, and the condition of the State’sroads, bridges and buildings, in order to assess the overall health of the State.
In the Statement of Net Position and the Statement of Activities, operations of the State are divided into three kindsof activities:
y Governmental Activities—Most of the State’s basic services are reported here, including education, public health,public welfare, public safety, transportation, environment and recreation, support and regulation of business, gen-eral government, and interest on long-term debt. Federal grants, personal income taxes, consumption and use taxes,business and other taxes, transfer of lottery revenues, and bond proceeds finance most of these activities.
20 • STATE OF NEW YORK ______________________________________________________________________________________________
REQUIRED SUPPLEMENTARYINFORMATION
Management’s Discussion and Analysis (MD&A)
REQUIRED SUPPLEMENTARYINFORMATION (Other than MD&A)
Budgetary Basis Reporting with Notes, Infrastructure Assets Using the Modified Approach, and Schedule of Funding Progress (OPEB)
OTHER SUPPLEMENTARY INFORMATION (Not Required)
Combining Fund Financial Statements/SchedulesNon-Mandatory
Reporting
BASIC FINANCIAL STATEMENTS
Government-wide Financial Statements
Governmental Fund Financial Statements
Enterprise Fund Financial Statements
Fiduciary Fund Financial Statements
Component Unit Financial Statements
Notes to the Basic Financial Statements
Mandatory Reporting
y Business-type Activities—The State charges a fee to customers to help it cover all or part of the cost of certain ser-vices it provides. The State’s Lottery Fund, Unemployment Insurance Benefit Fund, the State University of NewYork (SUNY) and the City University of New York (CUNY) Senior Colleges are reported here.
y Component Units—The State includes 42 separate legal entities in its report, as disclosed in Notes 1 and 14 of theNotes to the Basic Financial Statements. Although legally separate, these “component units” are importantbecause the State is financially accountable for them and may be affected by their financial well-being. In addi-tion, the State blends two other component units in the governmental activities because they provide services exclu-sively to the State.
Reporting the State’s Most Significant FundsFund Financial StatementsFinancial statements prepared at the fund level provide additional details about the State’s financial position andactivities. By definition, funds are accounting entities with a self-balancing set of accounts created for the purpose of car-rying on specific activities or achieving specific goals. Information presented in the fund financial statements differs fromthe information presented in the government-wide statements because the perspective and basis of accounting used toprepare the fund financial statements are different than the perspective and basis of accounting used to prepare the gov-ernment-wide statements. The State’s governmental and proprietary fund types use different perspectives and account-ing bases. The funds presented in the fund financial statements are categorized as either major or non-major funds asrequired by generally accepted accounting principles (GAAP). The State uses three fund types for operations—gov-ernmental, proprietary and fiduciary. The analysis of the State’s major funds begins on page 24. The fund financial state-ments begin on page 34 and provide detailed information about the most significant funds, not the State as a whole.
y Governmental Funds—Most of the State’s basic services and expenditures are reported in governmental funds, whichfocus on how money flows into and out of those funds and the balances remaining at year-end that are availablefor spending. Governmental fund financial statements are prepared using the current financial resources mea-surement focus and the modified accrual basis of accounting, which measures cash and all other financial assetsthat can readily be converted to cash. Assets and liabilities that do not impact current financial resources within12 months after fiscal year-end, such as capital assets and long-term liabilities, are not recognized in the govern-mental funds statements. The governmental funds statements provide a detailed short-term view of the State’s gen-eral government operations and the basic services the State provides. Governmental funds information helpsdetermine whether there are more or fewer financial resources that can be spent in the near future to finance theState’s programs. The relationships (or differences) between governmental activities (reported in the Statementof Net Position and Statement of Activities) and governmental funds are presented in the reconciliations followingthe fund financial statements.
y Proprietary Funds—These funds are utilized when the State charges customers to recover its costs of providing ser-vices. Proprietary funds report on business-type activities, which include enterprise type funds and internal ser-vice type funds. The State has no internal service type funds on a GAAP basis and, therefore, has only oneproprietary fund type—Enterprise. The State’s enterprise funds are the same as the business-type activitiesreported in the government-wide statements. Proprietary Funds statements are prepared using the economicresources measurement focus and the accrual basis of accounting. In addition to a Statement of Net Position anda Statement of Revenues, Expenses and Changes in Fund Net Position, Proprietary Funds are also required to reporta Statement of Cash Flows (page 42).
Reporting the State’s Fiduciary ResponsibilitiesThe State is the trustee, or fiduciary, for its employees’ pension plans. It is also responsible for other assets that,because of a trust arrangement, can be used only for the trust beneficiaries. All the State’s fiduciary activities are reportedin separate Statements of Fiduciary Net Position and Changes in Fiduciary Net Position on pages 44 and 45, respectively.We exclude these activities from the State’s government-wide financial statements because the State cannot use these assetsto finance its operations. The State is responsible for ensuring that the assets reported in these funds are used for theirintended purposes.
______________________________________________________________________________________________ STATE OF NEW YORK • 21
Component Units of the StateThe State has created numerous public benefit corporations—two of which provide services exclusively to the State gov-ernment itself, the New York Local Government Assistance Corporation (LGAC) and the Tobacco Settlement FinancingCorporation (TSFC), and the rest of which also provide services directly to citizens. The financial position and activitiesof the LGAC and the TSFC have been blended within the Statement of Net Position and Statement of Activities in thegovernmental activities column and in the governmental funds. The financial position and activities of the public ben-efit corporations that provide services directly to citizens have been presented in the Statement of Net Position andStatement of Activities under the component units’ column and also in more detail in the component units’ CombiningStatement of Net Position and component units’ Combining Statement of Activities. These component units have beendiscretely presented in the State’s financial statements because their nature and significance to the State cause them tohave an effect on the fiscal condition of the State and the State is accountable for them.
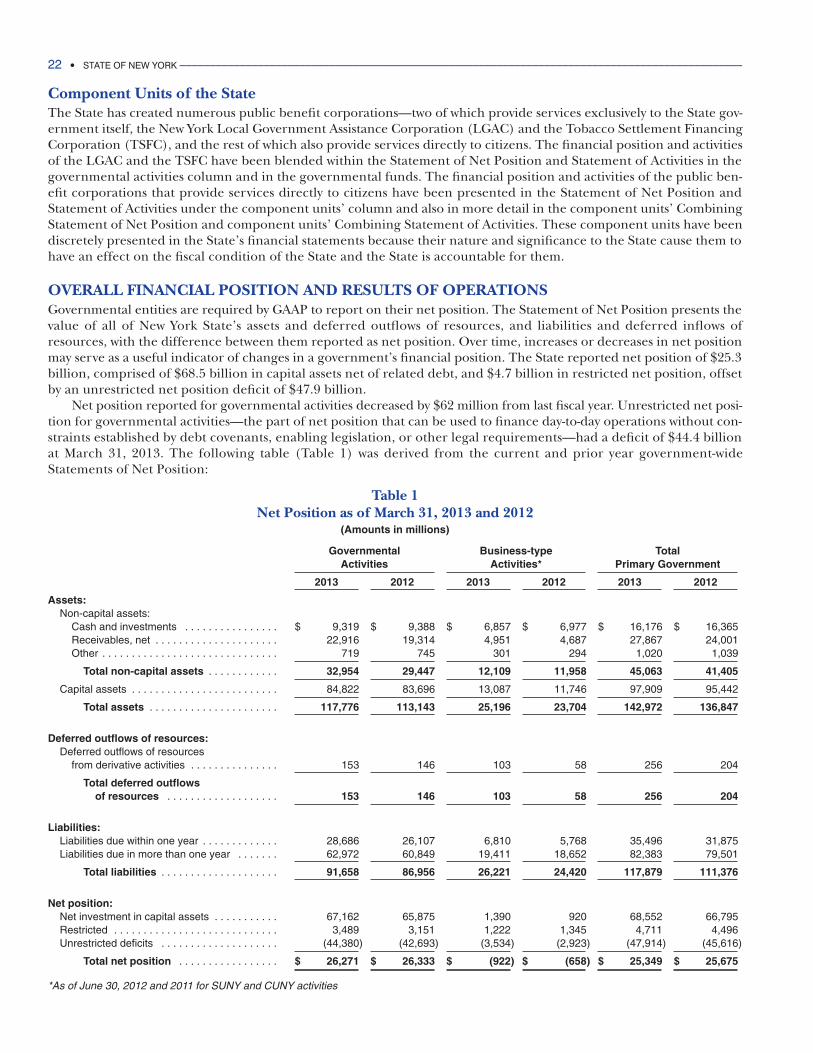
OVERALL FINANCIAL POSITION AND RESULTS OF OPERATIONSGovernmental entities are required by GAAP to report on their net position. The Statement of Net Position presents thevalue of all of New York State’s assets and deferred outflows of resources, and liabilities and deferred inflows ofresources, with the difference between them reported as net position. Over time, increases or decreases in net positionmay serve as a useful indicator of changes in a government’s financial position. The State reported net position of $25.3billion, comprised of $68.5 billion in capital assets net of related debt, and $4.7 billion in restricted net position, offsetby an unrestricted net position deficit of $47.9 billion.
Net position reported for governmental activities decreased by $62 million from last fiscal year. Unrestricted net posi-tion for governmental activities—the part of net position that can be used to finance day-to-day operations without con-straints established by debt covenants, enabling legislation, or other legal requirements—had a deficit of $44.4 billionat March 31, 2013. The following table (Table 1) was derived from the current and prior year government-wideStatements of Net Position:
Table 1Net Position as of March 31, 2013 and 2012
(Amounts in millions)
Governmental Business-type TotalActivities Activities* Primary Government
2013 2012 2013 2012 2013 2012
Assets:Non-capital assets:
Cash and investments . . . . . . . . . . . . . . . . $ 9,319 $ 9,388 $ 6,857 $ 6,977 $ 16,176 $ 16,365Receivables, net . . . . . . . . . . . . . . . . . . . . . 22,916 19,314 4,951 4,687 27,867 24,001Other . . . . . . . . . . . . . . . . . . . . . . . . . . . . . . 719 745 301 294 1,020 1,039
Total non-capital assets . . . . . . . . . . . . 32,954 29,447 12,109 11,958 45,063 41,405
Capital assets . . . . . . . . . . . . . . . . . . . . . . . . . 84,822 83,696 13,087 11,746 97,909 95,442
Total assets . . . . . . . . . . . . . . . . . . . . . . 117,776 113,143 25,196 23,704 142,972 136,847
Deferred outflows of resources:Deferred outflows of resources
from derivative activities . . . . . . . . . . . . . . . 153 146 103 58 256 204
Total deferred outflows of resources . . . . . . . . . . . . . . . . . . . 153 146 103 58 256 204
Liabilities:Liabilities due within one year . . . . . . . . . . . . . 28,686 26,107 6,810 5,768 35,496 31,875Liabilities due in more than one year . . . . . . . 62,972 60,849 19,411 18,652 82,383 79,501
Total liabilities . . . . . . . . . . . . . . . . . . . . 91,658 86,956 26,221 24,420 117,879 111,376
Net position:Net investment in capital assets . . . . . . . . . . . 67,162 65,875 1,390 920 68,552 66,795Restricted . . . . . . . . . . . . . . . . . . . . . . . . . . . . 3,489 3,151 1,222 1,345 4,711 4,496Unrestricted deficits . . . . . . . . . . . . . . . . . . . . (44,380) (42,693) (3,534) (2,923) (47,914) (45,616)
Total net position . . . . . . . . . . . . . . . . . $ 26,271 $ 26,333 $ (922) $ (658) $ 25,349 $ 25,675
*As of June 30, 2012 and 2011 for SUNY and CUNY activities
22 • STATE OF NEW YORK ______________________________________________________________________________________________
The deficit in unrestricted governmental net position, which increased by $1.7 billion in 2013, exists primarily becausethe State has issued debt for purposes not resulting in a capital asset related to State governmental activities and the oblig-ation related to other postemployment benefits ($10.1 billion). Such outstanding debt included: securitizing theState’s future tobacco settlement receipts ($2.4 billion); eliminating the need for seasonal borrowing by the LGAC ($2.8billion); and borrowing for local highway and bridge projects ($3.9 billion), local mass transit projects ($1.8 billion), anda wide variety of grants and other expenditures not resulting in State capital assets ($13.7 billion). This deficit in unre-stricted net position of governmental activities can be expected to continue for as long as the State continues to have oblig-ations outstanding for purposes other than the acquisition of State governmental capital assets.
The net position for business-type activities decreased by $264 million (40.1 percent) to a deficit of $922 million in2013 as compared to a deficit of $658 million in 2012. The decrease in net position for business-type activities was causedprimarily by SUNY and CUNY Senior Colleges expenses exceeding revenues and State support ($375 million and $33 mil-lion, respectively). This was partially offset by increases in net position reported by Lottery and the Unemployment InsuranceFund. Lottery revenues exceeded expenses, including education aid transfers ($82 million); and employer contributionsand other income for the Unemployment Insurance Fund exceeded unemployment benefit payments ($62 million).
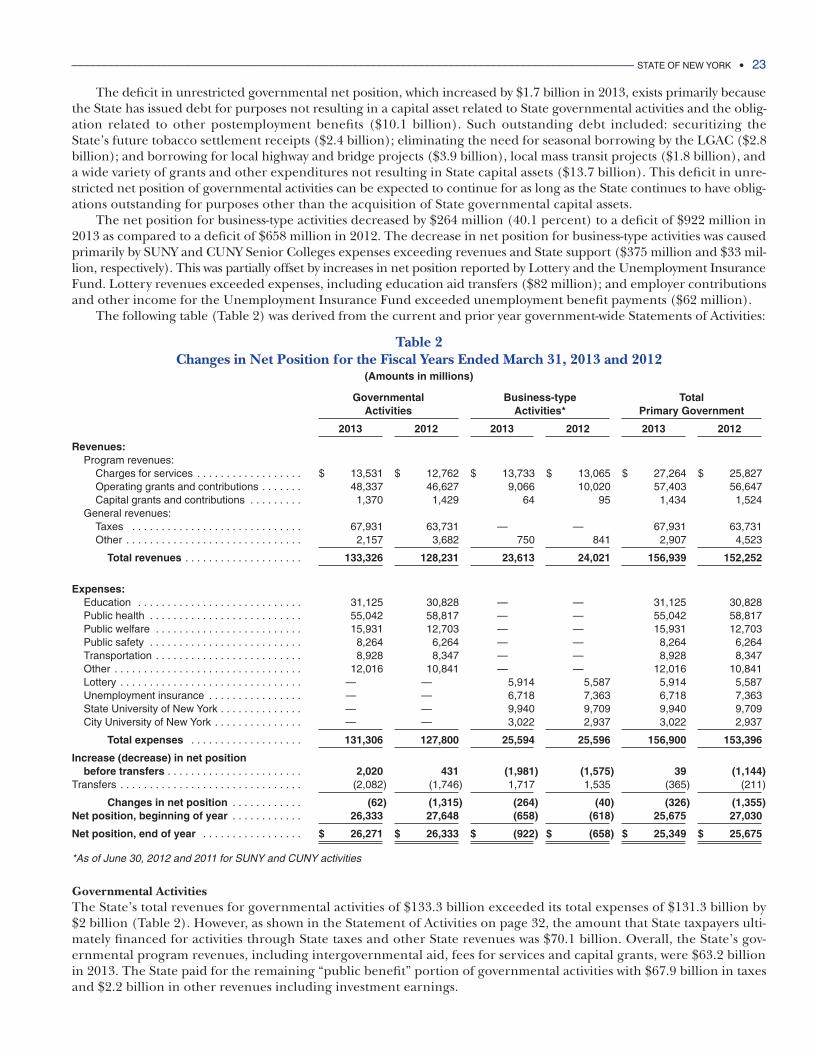
The following table (Table 2) was derived from the current and prior year government-wide Statements of Activities:
Table 2Changes in Net Position for the Fiscal Years Ended March 31, 2013 and 2012
(Amounts in millions)
Governmental Business-type TotalActivities Activities* Primary Government
2013 2012 2013 2012 2013 2012
Revenues:Program revenues:
Charges for services . . . . . . . . . . . . . . . . . . $ 13,531 $ 12,762 $ 13,733 $ 13,065 $ 27,264 $ 25,827Operating grants and contributions . . . . . . . 48,337 46,627 9,066 10,020 57,403 56,647Capital grants and contributions . . . . . . . . . 1,370 1,429 64 95 1,434 1,524
General revenues:Taxes . . . . . . . . . . . . . . . . . . . . . . . . . . . . . 67,931 63,731 —00000 —00000 67,931 63,731Other . . . . . . . . . . . . . . . . . . . . . . . . . . . . . . 2,157 3,682 750 841 2,907 4,523
Total revenues . . . . . . . . . . . . . . . . . . . . 133,326 128,231 23,613 24,021 156,939 152,252
Expenses:Education . . . . . . . . . . . . . . . . . . . . . . . . . . . . 31,125 30,828 —00000 —00000 31,125 30,828Public health . . . . . . . . . . . . . . . . . . . . . . . . . . 55,042 58,817 —00000 —00000 55,042 58,817Public welfare . . . . . . . . . . . . . . . . . . . . . . . . . 15,931 12,703 —00000 —00000 15,931 12,703Public safety . . . . . . . . . . . . . . . . . . . . . . . . . . 8,264 6,264 —00000 —00000 8,264 6,264Transportation . . . . . . . . . . . . . . . . . . . . . . . . . 8,928 8,347 —00000 —00000 8,928 8,347Other . . . . . . . . . . . . . . . . . . . . . . . . . . . . . . . . 12,016 10,841 —00000 —00000 12,016 10,841Lottery . . . . . . . . . . . . . . . . . . . . . . . . . . . . . . . —00000 —00000 5,914 5,587 5,914 5,587Unemployment insurance . . . . . . . . . . . . . . . . —00000 —00000 6,718 7,363 6,718 7,363State University of New York . . . . . . . . . . . . . . —00000 —00000 9,940 9,709 9,940 9,709City University of New York . . . . . . . . . . . . . . . —00000 —00000 3,022 2,937 3,022 2,937
Total expenses . . . . . . . . . . . . . . . . . . . 131,306 127,800 25,594 25,596 156,900 153,396
Increase (decrease) in net position before transfers . . . . . . . . . . . . . . . . . . . . . . . 2,020 431 (1,981) (1,575) 39 (1,144)
Transfers . . . . . . . . . . . . . . . . . . . . . . . . . . . . . . . (2,082) (1,746) 1,717 1,535 (365) (211)
Changes in net position . . . . . . . . . . . . (62) (1,315) (264) (40) (326) (1,355)Net position, beginning of year . . . . . . . . . . . . 26,333 27,648 (658) (618) 25,675 27,030
Net position, end of year . . . . . . . . . . . . . . . . . $ 26,271 $ 26,333 $ (922) $ (658) $ 25,349 $ 25,675
*As of June 30, 2012 and 2011 for SUNY and CUNY activities
Governmental ActivitiesThe State’s total revenues for governmental activities of $133.3 billion exceeded its total expenses of $131.3 billion by$2 billion (Table 2). However, as shown in the Statement of Activities on page 32, the amount that State taxpayers ulti-mately financed for activities through State taxes and other State revenues was $70.1 billion. Overall, the State’s gov-ernmental program revenues, including intergovernmental aid, fees for services and capital grants, were $63.2 billionin 2013. The State paid for the remaining “public benefit” portion of governmental activities with $67.9 billion in taxesand $2.2 billion in other revenues including investment earnings.
______________________________________________________________________________________________ STATE OF NEW YORK • 23
24 • STATE OF NEW YORK ______________________________________________________________________________________________
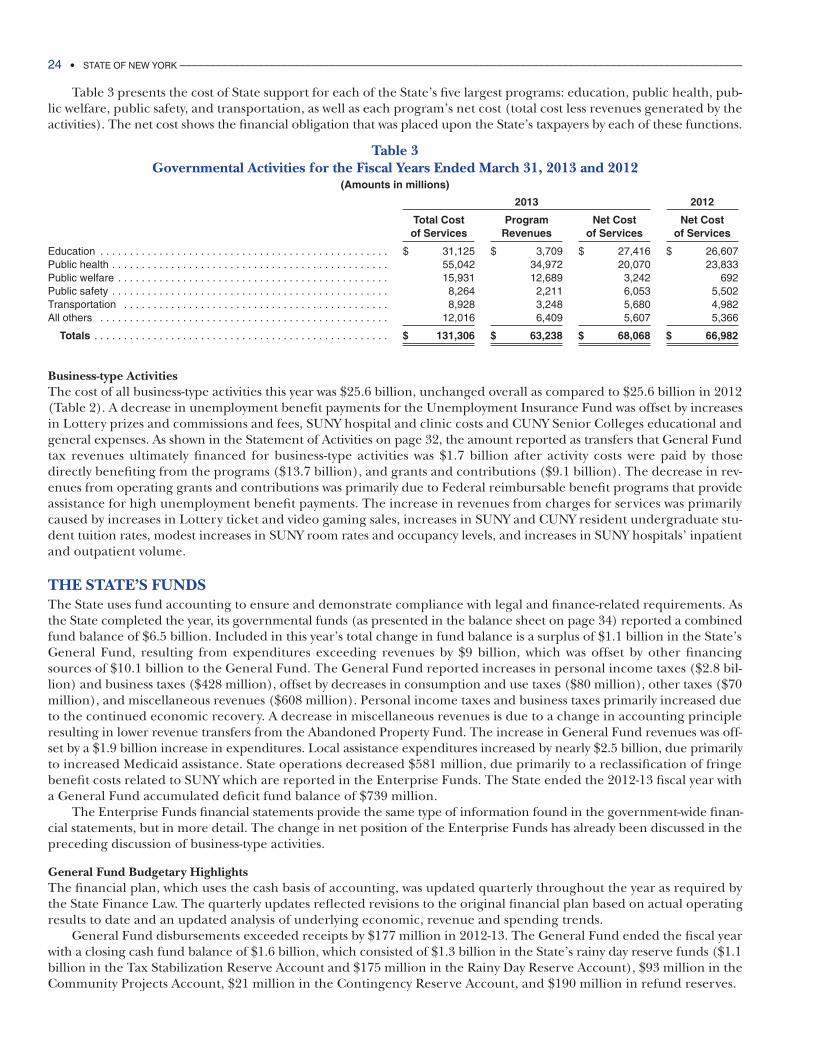
Table 3 presents the cost of State support for each of the State’s five largest programs: education, public health, pub-lic welfare, public safety, and transportation, as well as each program’s net cost (total cost less revenues generated by theactivities). The net cost shows the financial obligation that was placed upon the State’s taxpayers by each of these functions.
Table 3Governmental Activities for the Fiscal Years Ended March 31, 2013 and 2012
(Amounts in millions)
2013 2012
Total Cost Program Net Cost Net Costof Services Revenues of Services of Services
Education . . . . . . . . . . . . . . . . . . . . . . . . . . . . . . . . . . . . . . . . . . . . . . . . . $ 31,125 $ 3,709 $ 27,416 $ 26,607Public health . . . . . . . . . . . . . . . . . . . . . . . . . . . . . . . . . . . . . . . . . . . . . . . 55,042 34,972 20,070 23,833Public welfare . . . . . . . . . . . . . . . . . . . . . . . . . . . . . . . . . . . . . . . . . . . . . . 15,931 12,689 3,242 692Public safety . . . . . . . . . . . . . . . . . . . . . . . . . . . . . . . . . . . . . . . . . . . . . . . 8,264 2,211 6,053 5,502Transportation . . . . . . . . . . . . . . . . . . . . . . . . . . . . . . . . . . . . . . . . . . . . . 8,928 3,248 5,680 4,982All others . . . . . . . . . . . . . . . . . . . . . . . . . . . . . . . . . . . . . . . . . . . . . . . . . 12,016 6,409 5,607 5,366
Totals . . . . . . . . . . . . . . . . . . . . . . . . . . . . . . . . . . . . . . . . . . . . . . . . . . $ 131,306 $ 63,238 $ 68,068 $ 66,982
Business-type ActivitiesThe cost of all business-type activities this year was $25.6 billion, unchanged overall as compared to $25.6 billion in 2012(Table 2). A decrease in unemployment benefit payments for the Unemployment Insurance Fund was offset by increasesin Lottery prizes and commissions and fees, SUNY hospital and clinic costs and CUNY Senior Colleges educational andgeneral expenses. As shown in the Statement of Activities on page 32, the amount reported as transfers that General Fundtax revenues ultimately financed for business-type activities was $1.7 billion after activity costs were paid by thosedirectly benefiting from the programs ($13.7 billion), and grants and contributions ($9.1 billion). The decrease in rev-enues from operating grants and contributions was primarily due to Federal reimbursable benefit programs that provideassistance for high unemployment benefit payments. The increase in revenues from charges for services was primarilycaused by increases in Lottery ticket and video gaming sales, increases in SUNY and CUNY resident undergraduate stu-dent tuition rates, modest increases in SUNY room rates and occupancy levels, and increases in SUNY hospitals’ inpatientand outpatient volume.
THE STATE’S FUNDSThe State uses fund accounting to ensure and demonstrate compliance with legal and finance-related requirements. Asthe State completed the year, its governmental funds (as presented in the balance sheet on page 34) reported a combinedfund balance of $6.5 billion. Included in this year’s total change in fund balance is a surplus of $1.1 billion in the State’sGeneral Fund, resulting from expenditures exceeding revenues by $9 billion, which was offset by other financingsources of $10.1 billion to the General Fund. The General Fund reported increases in personal income taxes ($2.8 bil-lion) and business taxes ($428 million), offset by decreases in consumption and use taxes ($80 million), other taxes ($70million), and miscellaneous revenues ($608 million). Personal income taxes and business taxes primarily increased dueto the continued economic recovery. A decrease in miscellaneous revenues is due to a change in accounting principleresulting in lower revenue transfers from the Abandoned Property Fund. The increase in General Fund revenues was off-set by a $1.9 billion increase in expenditures. Local assistance expenditures increased by nearly $2.5 billion, due primarilyto increased Medicaid assistance. State operations decreased $581 million, due primarily to a reclassification of fringebenefit costs related to SUNY which are reported in the Enterprise Funds. The State ended the 2012-13 fiscal year witha General Fund accumulated deficit fund balance of $739 million.
The Enterprise Funds financial statements provide the same type of information found in the government-wide finan-cial statements, but in more detail. The change in net position of the Enterprise Funds has already been discussed in thepreceding discussion of business-type activities.
General Fund Budgetary HighlightsThe financial plan, which uses the cash basis of accounting, was updated quarterly throughout the year as required bythe State Finance Law. The quarterly updates reflected revisions to the original financial plan based on actual operatingresults to date and an updated analysis of underlying economic, revenue and spending trends.
General Fund disbursements exceeded receipts by $177 million in 2012-13. The General Fund ended the fiscal yearwith a closing cash fund balance of $1.6 billion, which consisted of $1.3 billion in the State’s rainy day reserve funds ($1.1billion in the Tax Stabilization Reserve Account and $175 million in the Rainy Day Reserve Account), $93 million in theCommunity Projects Account, $21 million in the Contingency Reserve Account, and $190 million in refund reserves.
Actual net operating results, which reflect the difference between receipts and disbursements, were $209 million lessfavorable than anticipated in the original financial plan, but were above the projections in the final financial plan by $136million. The original financial plan projected that receipts would exceed disbursements by $32 million in 2012-13. Duringthe fiscal year, actual receipts were higher than forecasted in the original financial plan, while disbursements were higherthan initially projected. The 2012-13 Enacted Budget plan assumed base tax growth of 6.2 percent. Actual base tax growthfor 2012-13, at 5.8 percent, finished close to the initial estimate. Based on the financial plan, higher than anticipated busi-ness tax collections due to higher gross receipts and audit collections were nearly offset by lower than planned user taxesresulting from slower than expected growth in taxable consumption. The variance in non-tax receipts represents: a $340million settlement payment to the State from Standard Chartered Bank based on claims that the bank did not complywith financial regulations; $75 million from the Manhattan District Attorney due to increased settlement activity; and lowerthan anticipated collections for abandoned property and licenses and fees. Total disbursements and transfers to otherfunds for 2012-13 were $91 million higher than projected in the original financial plan, attributable to higher local aidspending including health care, and education, and higher spending for personal service expenses through the use ofbudgetary reserves designated for prior-year labor agreements. This higher spending was partially offset by lowertransfers to other funds for capital projects costs, and Mental Hygiene State share Medicaid costs.
The final financial plan (issued on February 28, 2013) projected an excess of General Fund disbursements to receiptsof $313 million. Actual net operating results were $136 million above the projection primarily due to actual disbursementsthat were lower than the final financial plan forecast. Receipts and transfers from other funds were $280 million lowerthan the final forecast, including collections in user and other taxes, receipts and grants and lower transfers from otherfunds, most notably due to low collections in licenses and fees and the decision to delay certain transfers until FY 2014.These lower receipts were partially offset by higher than expected business and personal income tax receipts. Total dis-bursements and transfers to other funds for 2012-13 were $416 million lower than projected in the final financial plan,attributable to lower local aid, personal and non-personal service expenses, and lower than expected transfers to otherfunds for Mental Hygiene State share Medicaid costs.
The State’s current year General Fund GAAP surplus of $1.1 billion reported on page 36 differs from the GeneralFund’s budgetary basis excess of disbursements to receipts, funded from the operating balance, of $177 millionreported in the reconciliation found under Budgetary Basis Reporting on page 104. This variation results from differ-ences in basis of accounting, entity and perspective differences between budgetary reporting versus those established asGAAP and followed in preparation of this financial statement.
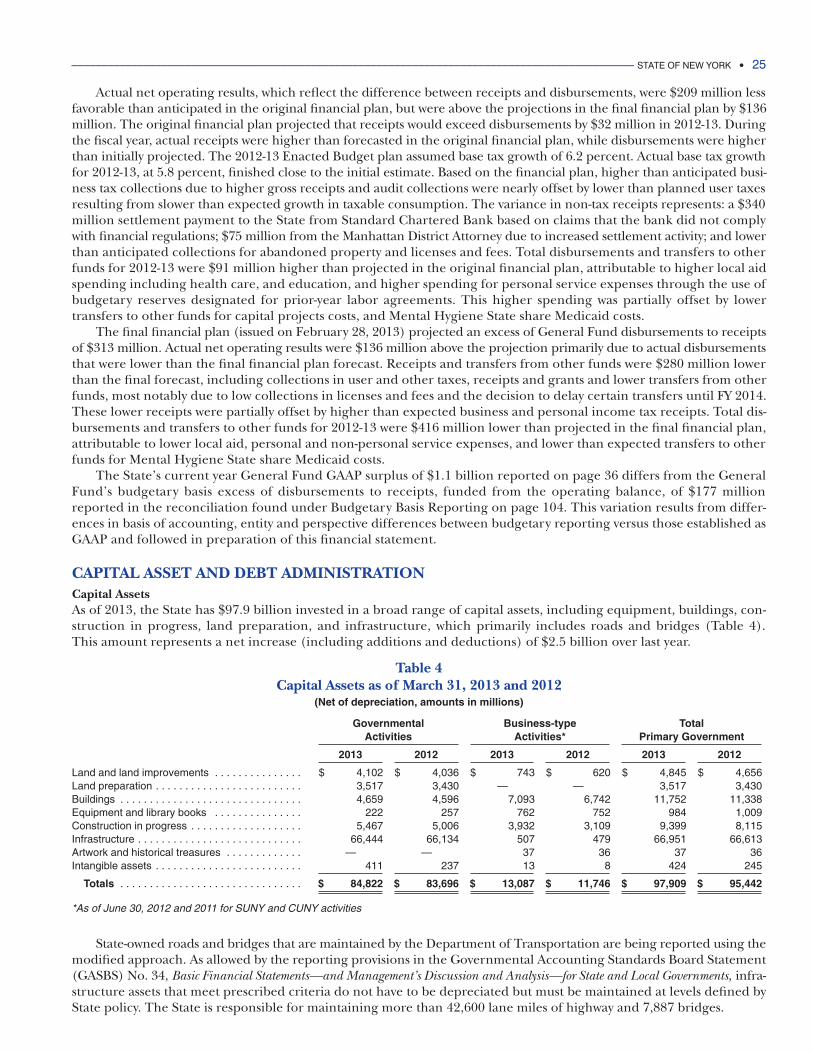
CAPITAL ASSET AND DEBT ADMINISTRATIONCapital AssetsAs of 2013, the State has $97.9 billion invested in a broad range of capital assets, including equipment, buildings, con-struction in progress, land preparation, and infrastructure, which primarily includes roads and bridges (Table 4).This amount represents a net increase (including additions and deductions) of $2.5 billion over last year.
Table 4Capital Assets as of March 31, 2013 and 2012
(Net of depreciation, amounts in millions)
Governmental Business-type TotalActivities Activities* Primary Government
2013 2012 2013 2012 2013 2012
Land and land improvements . . . . . . . . . . . . . . . $ 4,102 $ 4,036 $ 743 $ 620 $ 4,845 $ 4,656Land preparation . . . . . . . . . . . . . . . . . . . . . . . . . 3,517 3,430 —00000 —00000 3,517 3,430Buildings . . . . . . . . . . . . . . . . . . . . . . . . . . . . . . . 4,659 4,596 7,093 6,742 11,752 11,338Equipment and library books . . . . . . . . . . . . . . . 222 257 762 752 984 1,009Construction in progress . . . . . . . . . . . . . . . . . . . 5,467 5,006 3,932 3,109 9,399 8,115Infrastructure . . . . . . . . . . . . . . . . . . . . . . . . . . . . 66,444 66,134 507 479 66,951 66,613Artwork and historical treasures . . . . . . . . . . . . . —00000 —00000 37 36 37 36Intangible assets . . . . . . . . . . . . . . . . . . . . . . . . . 411 237 13 8 424 245
Totals . . . . . . . . . . . . . . . . . . . . . . . . . . . . . . . $ 84,822 $ 83,696 $ 13,087 $ 11,746 $ 97,909 $ 95,442
*As of June 30, 2012 and 2011 for SUNY and CUNY activities
State-owned roads and bridges that are maintained by the Department of Transportation are being reported using themodified approach. As allowed by the reporting provisions in the Governmental Accounting Standards Board Statement(GASBS) No. 34, Basic Financial Statements—and Management’s Discussion and Analysis—for State and Local Governments, infra-structure assets that meet prescribed criteria do not have to be depreciated but must be maintained at levels defined byState policy. The State is responsible for maintaining more than 42,600 lane miles of highway and 7,887 bridges.
______________________________________________________________________________________________ STATE OF NEW YORK • 25
Highway condition is rated using a scale of 1 (very poor) to 10 (excellent) based on the prevalence of surface-relatedpavement distress. For bridges, a rating of 6 to 7 is excellent, which indicates that no repairs are necessary. A rating of3 to 5 is fair to good, which indicates that minor repairs are required. A rating of 1 to 2 is deficient, which indicates majorrepairs or replacements are necessary. Refer to Required Supplementary Information (RSI) for additional informationregarding infrastructure assets using the modified approach. Pavement condition rating parameters for the current yearare between 6.7 and 7.2, while bridge pavement condition parameters are between 5.3 and 5.6. Capital spending for high-way and bridge maintenance and preservation projects was approximately $1.3 billion in 2013.
The State’s 2013-14 fiscal year capital budget calls for it to spend $9.4 billion for capital projects, of which $4.7 bil-lion is for transportation projects. To pay for these capital projects, the State plans to use $300 million in general oblig-ation bond proceeds, $5 billion in other financing arrangements with public authorities, $1.8 billion in Federal funds,and $2.3 billion in funds on hand or received during the year. More detailed information about the State’s capitalizationpolicy for capital assets is presented in Note 1 of the Notes to the Basic Financial Statements.
Debt AdministrationThe State has obtained long-term financing in the form of voter-approved General Obligation debt (voter-approved debt)and other obligations that are authorized by legislation but not approved by the voters (non-voter-approved debt), includ-ing lease purchase and contractual obligations where the State’s legal obligation to make payments is subject to and paidfrom annual appropriations made by the Legislature or from assignment of revenue in the case of Tobacco SettlementRevenue Bonds. Equipment and Building Capital Leases, and Mortgage Loan Commitments, which represent $405 mil-lion as of March 31, 2013, do not require legislative or voter approval. Other obligations include certain bonds issuedthrough State public authorities, certificates of participation, and capital leases obtained through vendors. The State admin-isters its long-term financing needs as a single portfolio of State-supported debt that includes general obligation bondsand other obligations of both its governmental activities and business-type activities. Most of the debt reported under busi-ness-type activities, all of which was issued for capital assets used in those activities, is supported by payments from resourcesgenerated by the State’s governmental activities—thus it is not expected to be repaid from resources generated by busi-ness-type activities. The State Finance Law allows the bonded portion of this single combined debt portfolio, which includesdebt reported in both governmental and business-type activities, to include debt instruments which result in a net vari-able rate exposure in an amount that does not exceed 15 percent of total outstanding State-supported debt, and inter-est rate exchange agreements (swaps) that do not exceed 15 percent of total outstanding State-supported debt. At March31, 2013, the State had $214 million in State-supported (net) variable rate bonds outstanding and $2.1 billion in inter-est rate exchange agreements, in which the State issues variable rate bonds and enters into a swap agreement that effec-tively converts the rate to a fixed rate. Risks related to these transactions are explained in Note 7.
In addition, the State has $258 million of convertible bonds due in fiscal year 2014 which are expected to be refundedwith fixed rate bonds, instead of converting to a variable rate mode. This will eliminate all remaining convertible bondsfrom the State’s portfolio.
At March 31, 2013, variable rate bonds, net of those subject to the fixed rate swaps, were equal to 0.4 percent of theState-supported debt portfolio. Variable rate bonds that were converted to a synthetic fixed rate through swap agreementsof $2.1 billion were equal to 4 percent of the total State-supported debt portfolio.
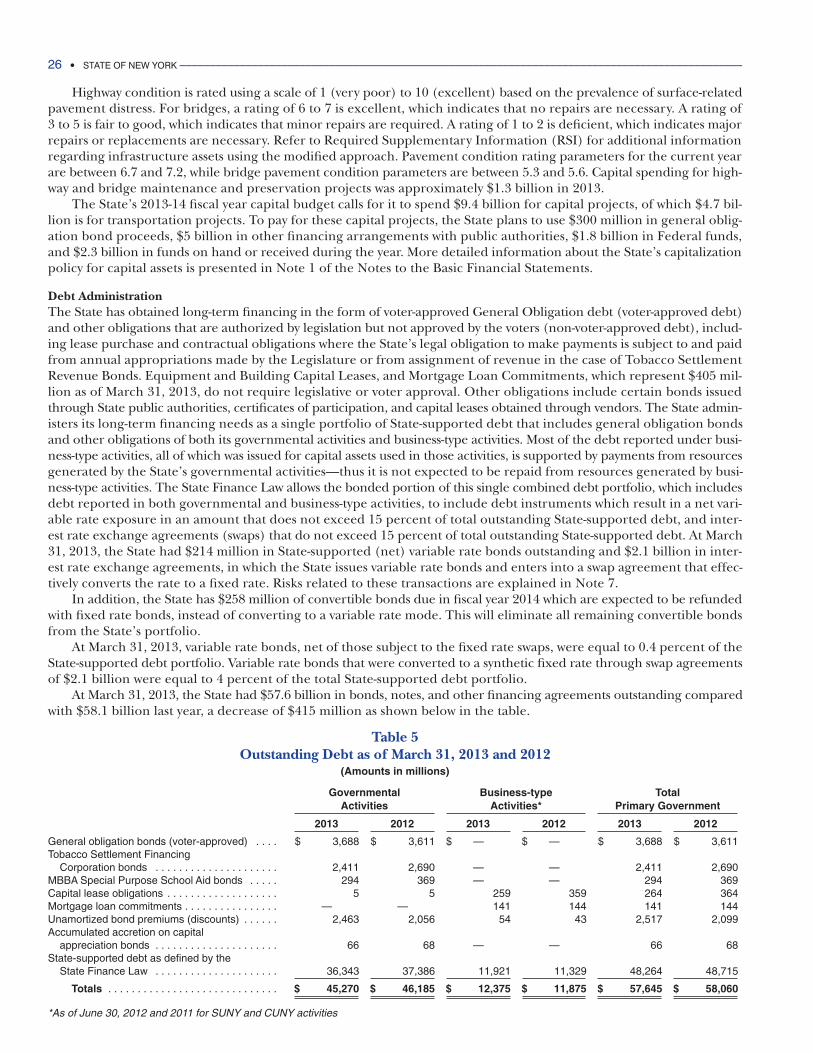
At March 31, 2013, the State had $57.6 billion in bonds, notes, and other financing agreements outstanding comparedwith $58.1 billion last year, a decrease of $415 million as shown below in the table.
Table 5Outstanding Debt as of March 31, 2013 and 2012
(Amounts in millions)
Governmental Business-type TotalActivities Activities* Primary Government
2013 2012 2013 2012 2013 2012
General obligation bonds (voter-approved) . . . . $ 3,688 $ 3,611 $ —00000 $ —00000 $ 3,688 $ 3,611Tobacco Settlement Financing
Corporation bonds . . . . . . . . . . . . . . . . . . . . . 2,411 2,690 —00000 —00000 2,411 2,690MBBA Special Purpose School Aid bonds . . . . . 294 369 —00000 —00000 294 369Capital lease obligations . . . . . . . . . . . . . . . . . . . 5 5 259 359 264 364Mortgage loan commitments . . . . . . . . . . . . . . . . —00000 —00000 141 144 141 144Unamortized bond premiums (discounts) . . . . . . 2,463 2,056 54 43 2,517 2,099Accumulated accretion on capital
appreciation bonds . . . . . . . . . . . . . . . . . . . . . 66 68 —00000 —00000 66 68State-supported debt as defined by the
State Finance Law . . . . . . . . . . . . . . . . . . . . . 36,343 37,386 11,921 11,329 48,264 48,715
Totals . . . . . . . . . . . . . . . . . . . . . . . . . . . . . $ 45,270 $ 46,185 $ 12,375 $ 11,875 $ 57,645 $ 58,060
*As of June 30, 2012 and 2011 for SUNY and CUNY activities
26 • STATE OF NEW YORK ______________________________________________________________________________________________
In addition to the debt outlined above, the State has $86 million in collateralized borrowing for which specific rev-enues have been pledged. See Note 7 for additional information.
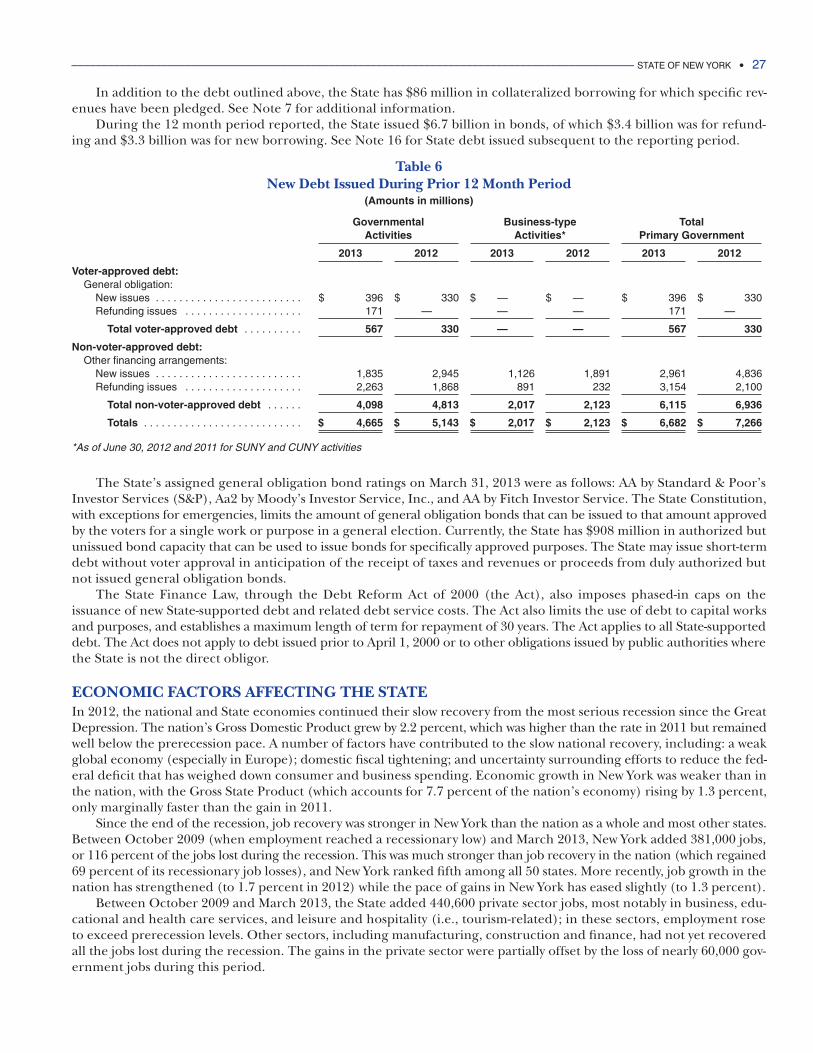
During the 12 month period reported, the State issued $6.7 billion in bonds, of which $3.4 billion was for refund-ing and $3.3 billion was for new borrowing. See Note 16 for State debt issued subsequent to the reporting period.
Table 6New Debt Issued During Prior 12 Month Period
(Amounts in millions)
Governmental Business-type TotalActivities Activities* Primary Government
2013 2012 2013 2012 2013 2012
Voter-approved debt:General obligation:
New issues . . . . . . . . . . . . . . . . . . . . . . . . . $ 396 $ 330 $ —00000 $ —00000 $ 396 $ 330Refunding issues . . . . . . . . . . . . . . . . . . . . 171 —00000 —00000 —00000 171 —00000
Total voter-approved debt . . . . . . . . . . 567 330 —00000 —00000 567 330
Non-voter-approved debt:Other financing arrangements:
New issues . . . . . . . . . . . . . . . . . . . . . . . . . 1,835 2,945 1,126 1,891 2,961 4,836Refunding issues . . . . . . . . . . . . . . . . . . . . 2,263 1,868 891 232 3,154 2,100
Total non-voter-approved debt . . . . . . 4,098 4,813 2,017 2,123 6,115 6,936
Totals . . . . . . . . . . . . . . . . . . . . . . . . . . . $ 4,665 $ 5,143 $ 2,017 $ 2,123 $ 6,682 $ 7,266
*As of June 30, 2012 and 2011 for SUNY and CUNY activities
The State’s assigned general obligation bond ratings on March 31, 2013 were as follows: AA by Standard & Poor’sInvestor Services (S&P), Aa2 by Moody’s Investor Service, Inc., and AA by Fitch Investor Service. The State Constitution,with exceptions for emergencies, limits the amount of general obligation bonds that can be issued to that amount approvedby the voters for a single work or purpose in a general election. Currently, the State has $908 million in authorized butunissued bond capacity that can be used to issue bonds for specifically approved purposes. The State may issue short-termdebt without voter approval in anticipation of the receipt of taxes and revenues or proceeds from duly authorized butnot issued general obligation bonds.
The State Finance Law, through the Debt Reform Act of 2000 (the Act), also imposes phased-in caps on theissuance of new State-supported debt and related debt service costs. The Act also limits the use of debt to capital worksand purposes, and establishes a maximum length of term for repayment of 30 years. The Act applies to all State-supporteddebt. The Act does not apply to debt issued prior to April 1, 2000 or to other obligations issued by public authorities wherethe State is not the direct obligor.
ECONOMIC FACTORS AFFECTING THE STATEIn 2012, the national and State economies continued their slow recovery from the most serious recession since the GreatDepression. The nation’s Gross Domestic Product grew by 2.2 percent, which was higher than the rate in 2011 but remainedwell below the prerecession pace. A number of factors have contributed to the slow national recovery, including: a weakglobal economy (especially in Europe); domestic fiscal tightening; and uncertainty surrounding efforts to reduce the fed-eral deficit that has weighed down consumer and business spending. Economic growth in New York was weaker than inthe nation, with the Gross State Product (which accounts for 7.7 percent of the nation’s economy) rising by 1.3 percent,only marginally faster than the gain in 2011.
Since the end of the recession, job recovery was stronger in New York than the nation as a whole and most other states.Between October 2009 (when employment reached a recessionary low) and March 2013, New York added 381,000 jobs,or 116 percent of the jobs lost during the recession. This was much stronger than job recovery in the nation (which regained69 percent of its recessionary job losses), and New York ranked fifth among all 50 states. More recently, job growth in thenation has strengthened (to 1.7 percent in 2012) while the pace of gains in New York has eased slightly (to 1.3 percent).
Between October 2009 and March 2013, the State added 440,600 private sector jobs, most notably in business, edu-cational and health care services, and leisure and hospitality (i.e., tourism-related); in these sectors, employment roseto exceed prerecession levels. Other sectors, including manufacturing, construction and finance, had not yet recoveredall the jobs lost during the recession. The gains in the private sector were partially offset by the loss of nearly 60,000 gov-ernment jobs during this period.
______________________________________________________________________________________________ STATE OF NEW YORK • 27
28 • STATE OF NEW YORK ______________________________________________________________________________________________
Although New York State has added more jobs during the recovery than it lost in the recession, employment gainshave been uneven across the State’s metropolitan areas. Through March 2013, New York City added nearly twice as manyjobs as it lost in the recession. Long Island and the Ithaca metropolitan area also added more jobs than were lost in therecession, but the recovery has progressed more slowly in many upstate areas.
New York State’s unemployment rate has also remained high by historical standards. The rate had initially begun todecline from the recessionary peak of 8.9 percent reached in December 2009, but then the rate began to rise again inlate 2011 and early 2012 as more people began looking for work and the State’s labor force expanded. The unemploy-ment rate resumed its decline during the summer of 2012, and fell to 8.2 percent in March 2013.
The securities industry is an important component of the State’s economy, providing 12 percent of all wages paidin the State (even though it accounts for less than 3 percent of all jobs) and generating about 14 percent of State tax rev-enues. Wall Street is also continuing to work its way through the fallout from the financial crisis and a new regulatory envi-ronment and as of March 2013 had regained slightly less than 20 percent of the jobs it lost during the financial crisis, amuch weaker recovery than at comparable points after earlier downturns. In 2012, profitability in the industryrebounded, with the broker/dealer operations of New York Stock Exchange member firms reporting $23.9 billion in prof-its, which were three times the level in 2011 and made 2012 one of the most profitable years on record. Firms also recordedstrong profits of $6.6 billion during the first quarter of 2013. The Office of the State Comptroller estimated that the indus-try’s cash bonuses for the 2012 bonus season grew by 8 percent, driven in part by bonuses deferred from prior years.
CONTACTING THE STATE’S FINANCIAL MANAGEMENTThis financial report is designed to provide our citizens, taxpayers, customers, investors and creditors with a generaloverview of the State’s finances and to show the State’s accountability for the money it receives. If you have any questionsabout this report or need additional financial information, contact the State Comptroller’s Communications Office at110 State Street, 15th Floor, Albany, New York 12236 or visit our website at www.osc.state.ny.us.
Basic Financial
Statements

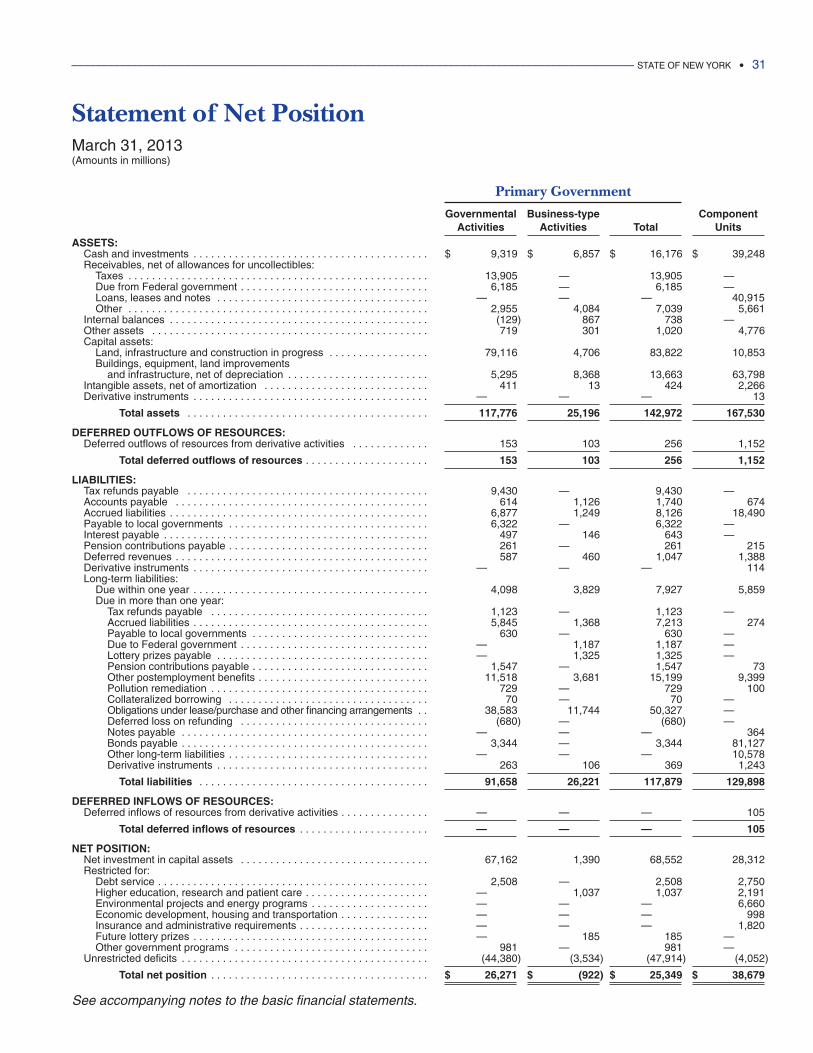
______________________________________________________________________________________________ STATE OF NEW YORK • 31
See accompanying notes to the basic financial statements.
Statement of Net PositionMarch 31, 2013(Amounts in millions)
Primary Government
Governmental Business-type ComponentActivities Activities Total Units
ASSETS:Cash and investments . . . . . . . . . . . . . . . . . . . . . . . . . . . . . . . . . . . . . . . . $ 9,319 $ 6,857 $ 16,176 $ 39,248Receivables, net of allowances for uncollectibles:
Taxes . . . . . . . . . . . . . . . . . . . . . . . . . . . . . . . . . . . . . . . . . . . . . . . . . . . 13,905 —00000 13,905 —00000Due from Federal government . . . . . . . . . . . . . . . . . . . . . . . . . . . . . . . . 6,185 —00000 6,185 —00000Loans, leases and notes . . . . . . . . . . . . . . . . . . . . . . . . . . . . . . . . . . . . —00000 —00000 —00000 40,915Other . . . . . . . . . . . . . . . . . . . . . . . . . . . . . . . . . . . . . . . . . . . . . . . . . . . 2,955 4,084 7,039 5,661
Internal balances . . . . . . . . . . . . . . . . . . . . . . . . . . . . . . . . . . . . . . . . . . . . (129) 867 738 —00000Other assets . . . . . . . . . . . . . . . . . . . . . . . . . . . . . . . . . . . . . . . . . . . . . . . 719 301 1,020 4,776Capital assets:
Land, infrastructure and construction in progress . . . . . . . . . . . . . . . . . 79,116 4,706 83,822 10,853Buildings, equipment, land improvements
and infrastructure, net of depreciation . . . . . . . . . . . . . . . . . . . . . . . . 5,295 8,368 13,663 63,798Intangible assets, net of amortization . . . . . . . . . . . . . . . . . . . . . . . . . . . . 411 13 424 2,266Derivative instruments . . . . . . . . . . . . . . . . . . . . . . . . . . . . . . . . . . . . . . . . —00000 —00000 —00000 13
Total assets . . . . . . . . . . . . . . . . . . . . . . . . . . . . . . . . . . . . . . . . . 117,776 25,196 142,972 167,530
DEFERRED OUTFLOWS OF RESOURCES:Deferred outflows of resources from derivative activities . . . . . . . . . . . . . 153 103 256 1,152
Total deferred outflows of resources . . . . . . . . . . . . . . . . . . . . . 153 103 256 1,152
LIABILITIES:Tax refunds payable . . . . . . . . . . . . . . . . . . . . . . . . . . . . . . . . . . . . . . . . . 9,430 —00000 9,430 —00000Accounts payable . . . . . . . . . . . . . . . . . . . . . . . . . . . . . . . . . . . . . . . . . . . 614 1,126 1,740 674Accrued liabilities . . . . . . . . . . . . . . . . . . . . . . . . . . . . . . . . . . . . . . . . . . . . 6,877 1,249 8,126 18,490Payable to local governments . . . . . . . . . . . . . . . . . . . . . . . . . . . . . . . . . . 6,322 —00000 6,322 —00000Interest payable . . . . . . . . . . . . . . . . . . . . . . . . . . . . . . . . . . . . . . . . . . . . . 497 146 643 —00000Pension contributions payable . . . . . . . . . . . . . . . . . . . . . . . . . . . . . . . . . . 261 —00000 261 215Deferred revenues . . . . . . . . . . . . . . . . . . . . . . . . . . . . . . . . . . . . . . . . . . . 587 460 1,047 1,388Derivative instruments . . . . . . . . . . . . . . . . . . . . . . . . . . . . . . . . . . . . . . . . —00000 —00000 —00000 114Long-term liabilities:
Due within one year . . . . . . . . . . . . . . . . . . . . . . . . . . . . . . . . . . . . . . . . 4,098 3,829 7,927 5,859Due in more than one year:
Tax refunds payable . . . . . . . . . . . . . . . . . . . . . . . . . . . . . . . . . . . . . 1,123 —00000 1,123 —00000Accrued liabilities . . . . . . . . . . . . . . . . . . . . . . . . . . . . . . . . . . . . . . . . 5,845 1,368 7,213 274Payable to local governments . . . . . . . . . . . . . . . . . . . . . . . . . . . . . . 630 —00000 630 —00000Due to Federal government . . . . . . . . . . . . . . . . . . . . . . . . . . . . . . . . —00000 1,187 1,187 —00000Lottery prizes payable . . . . . . . . . . . . . . . . . . . . . . . . . . . . . . . . . . . . —00000 1,325 1,325 —00000Pension contributions payable . . . . . . . . . . . . . . . . . . . . . . . . . . . . . . 1,547 —00000 1,547 73Other postemployment benefits . . . . . . . . . . . . . . . . . . . . . . . . . . . . . 11,518 3,681 15,199 9,399Pollution remediation . . . . . . . . . . . . . . . . . . . . . . . . . . . . . . . . . . . . . 729 —00000 729 100Collateralized borrowing . . . . . . . . . . . . . . . . . . . . . . . . . . . . . . . . . . 70 —00000 70 —00000Obligations under lease/purchase and other financing arrangements . . 38,583 11,744 50,327 —00000Deferred loss on refunding . . . . . . . . . . . . . . . . . . . . . . . . . . . . . . . . (680) —00000 (680) —00000Notes payable . . . . . . . . . . . . . . . . . . . . . . . . . . . . . . . . . . . . . . . . . . —00000 —00000 —00000 364Bonds payable . . . . . . . . . . . . . . . . . . . . . . . . . . . . . . . . . . . . . . . . . . 3,344 —00000 3,344 81,127Other long-term liabilities . . . . . . . . . . . . . . . . . . . . . . . . . . . . . . . . . . —00000 —00000 —00000 10,578Derivative instruments . . . . . . . . . . . . . . . . . . . . . . . . . . . . . . . . . . . . 263 106 369 1,243
Total liabilities . . . . . . . . . . . . . . . . . . . . . . . . . . . . . . . . . . . . . . . 91,658 26,221 117,879 129,898
DEFERRED INFLOWS OF RESOURCES:Deferred inflows of resources from derivative activities . . . . . . . . . . . . . . . —00000 —00000 —00000 105
Total deferred inflows of resources . . . . . . . . . . . . . . . . . . . . . . —00000 —00000 —00000 105
NET POSITION:Net investment in capital assets . . . . . . . . . . . . . . . . . . . . . . . . . . . . . . . . 67,162 1,390 68,552 28,312Restricted for:
Debt service . . . . . . . . . . . . . . . . . . . . . . . . . . . . . . . . . . . . . . . . . . . . . . 2,508 —00000 2,508 2,750Higher education, research and patient care . . . . . . . . . . . . . . . . . . . . . —00000 1,037 1,037 2,191Environmental projects and energy programs . . . . . . . . . . . . . . . . . . . . —00000 —00000 —00000 6,660Economic development, housing and transportation . . . . . . . . . . . . . . . —00000 —00000 —00000 998Insurance and administrative requirements . . . . . . . . . . . . . . . . . . . . . . —00000 —00000 —00000 1,820Future lottery prizes . . . . . . . . . . . . . . . . . . . . . . . . . . . . . . . . . . . . . . . . —00000 185 185 —00000Other government programs . . . . . . . . . . . . . . . . . . . . . . . . . . . . . . . . . 981 —00000 981 —00000
Unrestricted deficits . . . . . . . . . . . . . . . . . . . . . . . . . . . . . . . . . . . . . . . . . . (44,380) (3,534) (47,914) (4,052)
Total net position . . . . . . . . . . . . . . . . . . . . . . . . . . . . . . . . . . . . . $ 26,271 $ (922) $ 25,349 $ 38,679
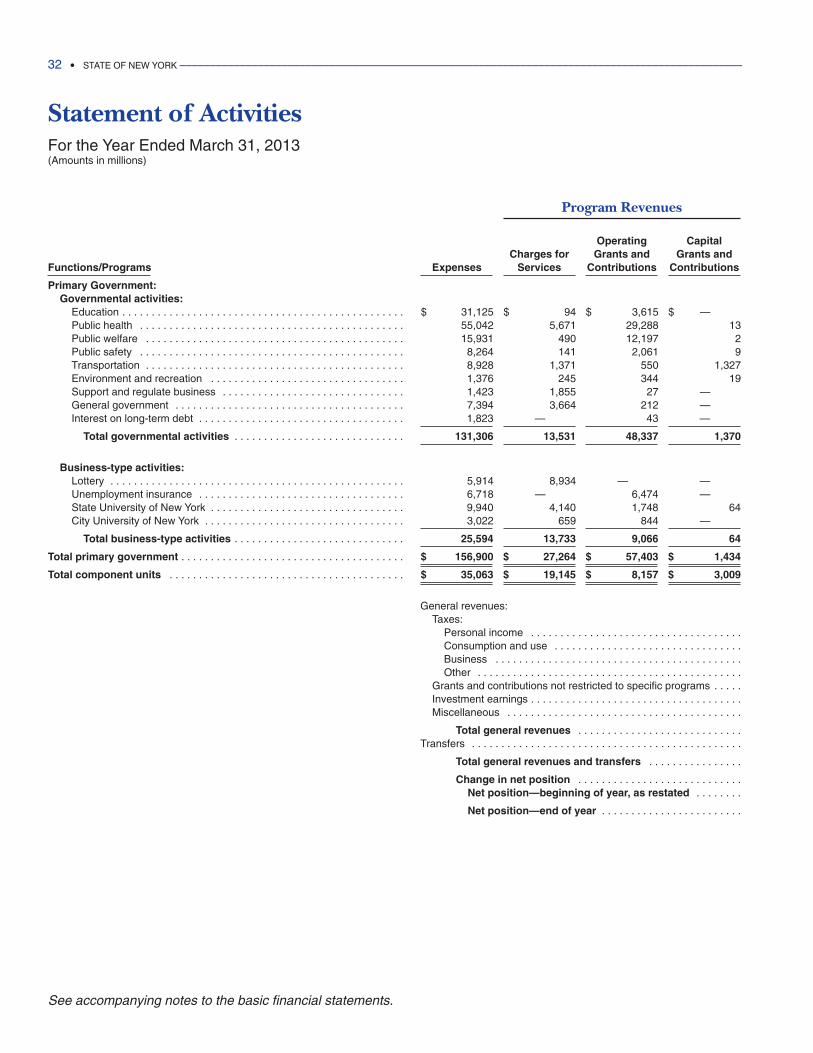
32 • STATE OF NEW YORK ______________________________________________________________________________________________
See accompanying notes to the basic financial statements.
Statement of ActivitiesFor the Year Ended March 31, 2013(Amounts in millions)
Program Revenues
Operating CapitalCharges for Grants and Grants and
Functions/Programs Expenses Services Contributions Contributions
Primary Government:Governmental activities:
Education . . . . . . . . . . . . . . . . . . . . . . . . . . . . . . . . . . . . . . . . . . . . . . . . $ 31,125 $ 94 $ 3,615 $ —00000Public health . . . . . . . . . . . . . . . . . . . . . . . . . . . . . . . . . . . . . . . . . . . . . 55,042 5,671 29,288 13Public welfare . . . . . . . . . . . . . . . . . . . . . . . . . . . . . . . . . . . . . . . . . . . . 15,931 490 12,197 2Public safety . . . . . . . . . . . . . . . . . . . . . . . . . . . . . . . . . . . . . . . . . . . . . 8,264 141 2,061 9Transportation . . . . . . . . . . . . . . . . . . . . . . . . . . . . . . . . . . . . . . . . . . . . 8,928 1,371 550 1,327Environment and recreation . . . . . . . . . . . . . . . . . . . . . . . . . . . . . . . . . 1,376 245 344 19Support and regulate business . . . . . . . . . . . . . . . . . . . . . . . . . . . . . . . 1,423 1,855 27 —00000General government . . . . . . . . . . . . . . . . . . . . . . . . . . . . . . . . . . . . . . . 7,394 3,664 212 —00000Interest on long-term debt . . . . . . . . . . . . . . . . . . . . . . . . . . . . . . . . . . . 1,823 —00000 43 —00000
Total governmental activities . . . . . . . . . . . . . . . . . . . . . . . . . . . . . 131,306 13,531 48,337 1,370
Business-type activities:Lottery . . . . . . . . . . . . . . . . . . . . . . . . . . . . . . . . . . . . . . . . . . . . . . . . . . 5,914 8,934 —00000 —00000Unemployment insurance . . . . . . . . . . . . . . . . . . . . . . . . . . . . . . . . . . . 6,718 —00000 6,474 —00000State University of New York . . . . . . . . . . . . . . . . . . . . . . . . . . . . . . . . . 9,940 4,140 1,748 64City University of New York . . . . . . . . . . . . . . . . . . . . . . . . . . . . . . . . . . 3,022 659 844 —00000
Total business-type activities . . . . . . . . . . . . . . . . . . . . . . . . . . . . . 25,594 13,733 9,066 64
Total primary government . . . . . . . . . . . . . . . . . . . . . . . . . . . . . . . . . . . . . . $ 156,900 $ 27,264 $ 57,403 $ 1,434
Total component units . . . . . . . . . . . . . . . . . . . . . . . . . . . . . . . . . . . . . . . . $ 35,063 $ 19,145 $ 8,157 $ 3,009
General revenues:Taxes:
Personal income . . . . . . . . . . . . . . . . . . . . . . . . . . . . . . . . . . . .Consumption and use . . . . . . . . . . . . . . . . . . . . . . . . . . . . . . . .Business . . . . . . . . . . . . . . . . . . . . . . . . . . . . . . . . . . . . . . . . . .Other . . . . . . . . . . . . . . . . . . . . . . . . . . . . . . . . . . . . . . . . . . . . .
Grants and contributions not restricted to specific programs . . . . .Investment earnings . . . . . . . . . . . . . . . . . . . . . . . . . . . . . . . . . . . .Miscellaneous . . . . . . . . . . . . . . . . . . . . . . . . . . . . . . . . . . . . . . . .
Total general revenues . . . . . . . . . . . . . . . . . . . . . . . . . . . .Transfers . . . . . . . . . . . . . . . . . . . . . . . . . . . . . . . . . . . . . . . . . . . . . .
Total general revenues and transfers . . . . . . . . . . . . . . . .
Change in net position . . . . . . . . . . . . . . . . . . . . . . . . . . . .Net position—beginning of year, as restated . . . . . . . .
Net position—end of year . . . . . . . . . . . . . . . . . . . . . . . .
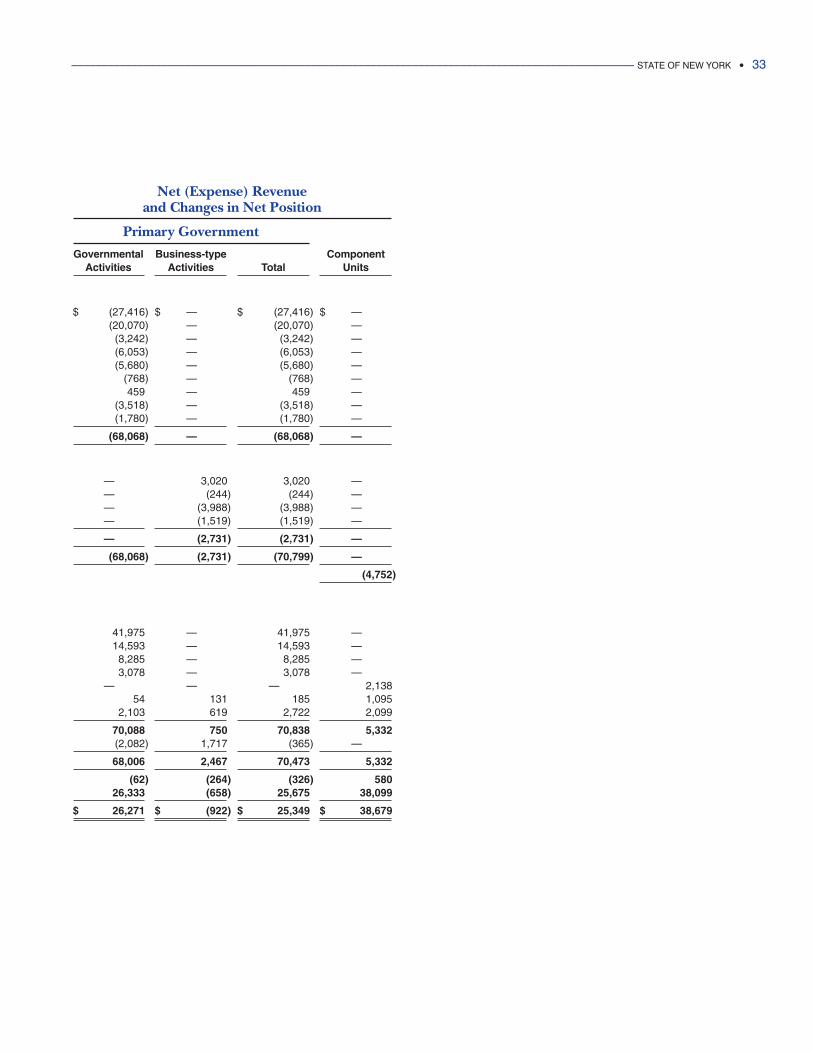
______________________________________________________________________________________________ STATE OF NEW YORK • 33
Net (Expense) Revenue and Changes in Net Position
Primary Government
Governmental Business-type ComponentActivities Activities Total Units
$ (27,416) $ —00000 $ (27,416) $ —00000(20,070) —00000 (20,070) —00000(3,242) —00000 (3,242) —00000(6,053) —00000 (6,053) —00000(5,680) —00000 (5,680) —00000
(768) —00000 (768) —00000459 —00000 459 —00000
(3,518) —00000 (3,518) —00000(1,780) —00000 (1,780) —00000
(68,068) —00000 (68,068) —00000
—00000 3,020 3,020 —00000—00000 (244) (244) —00000—00000 (3,988) (3,988) —00000—00000 (1,519) (1,519) —00000
—00000 (2,731) (2,731) —00000
(68,068) (2,731) (70,799) —00000
(4,752)
41,975 —00000 41,975 —0000014,593 —00000 14,593 —000008,285 —00000 8,285 —000003,078 —00000 3,078 —00000
—00000 —00000 —00000 2,13854 131 185 1,095
2,103 619 2,722 2,099
70,088 750 70,838 5,332(2,082) 1,717 (365) —00000
68,006 2,467 70,473 5,332
(62) (264) (326) 58026,333 (658) 25,675 38,099
$ 26,271 $ (922) $ 25,349 $ 38,679
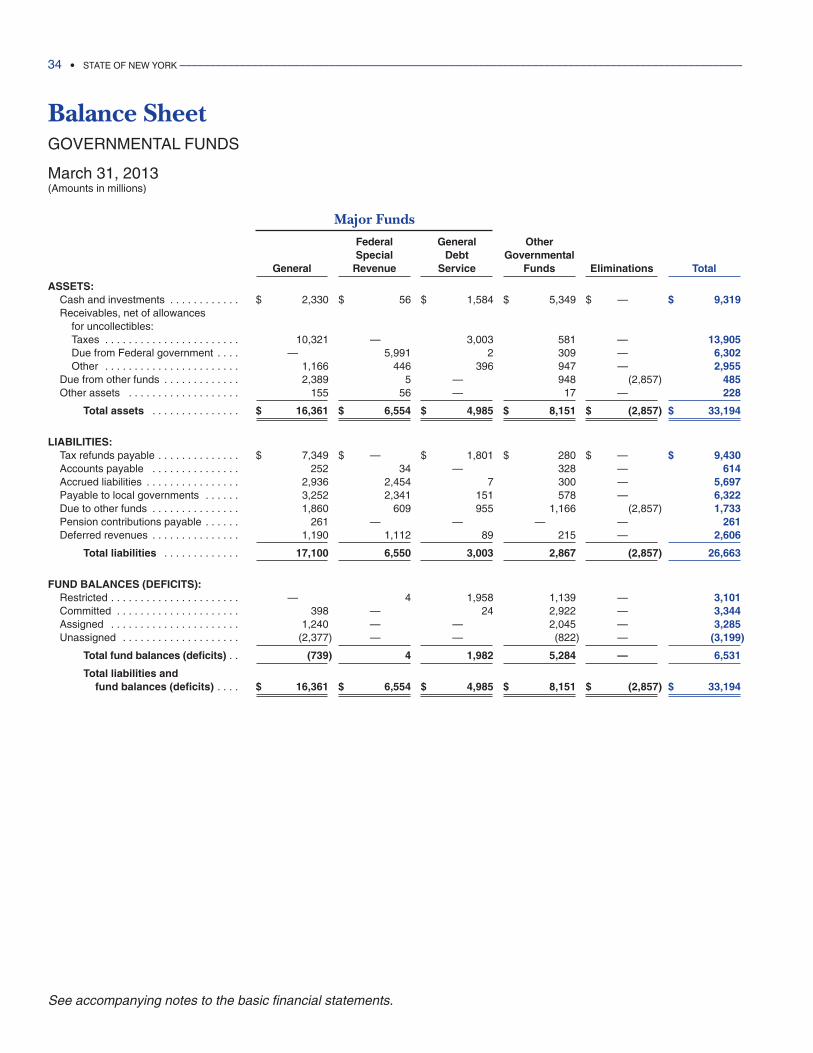
34 • STATE OF NEW YORK ______________________________________________________________________________________________
See accompanying notes to the basic financial statements.
Balance SheetGOVERNMENTAL FUNDS
March 31, 2013(Amounts in millions)
Major Funds
Federal General OtherSpecial Debt Governmental
General Revenue Service Funds Eliminations Total
ASSETS:Cash and investments . . . . . . . . . . . . $ 2,330 $ 56 $ 1,584 $ 5,349 $ —00000 $ 9,319Receivables, net of allowances
for uncollectibles:Taxes . . . . . . . . . . . . . . . . . . . . . . . 10,321 —00000 3,003 581 —00000 13,905Due from Federal government . . . . —00000 5,991 2 309 —00000 6,302Other . . . . . . . . . . . . . . . . . . . . . . . 1,166 446 396 947 —00000 2,955
Due from other funds . . . . . . . . . . . . . 2,389 5 —00000 948 (2,857) 485Other assets . . . . . . . . . . . . . . . . . . . 155 56 —00000 17 —00000 228
Total assets . . . . . . . . . . . . . . . $ 16,361 $ 6,554 $ 4,985 $ 8,151 $ (2,857) $ 33,194
LIABILITIES:Tax refunds payable . . . . . . . . . . . . . . $ 7,349 $ —00000 $ 1,801 $ 280 $ —00000 $ 9,430Accounts payable . . . . . . . . . . . . . . . 252 34 —00000 328 —00000 614Accrued liabilities . . . . . . . . . . . . . . . . 2,936 2,454 7 300 —00000 5,697Payable to local governments . . . . . . 3,252 2,341 151 578 —00000 6,322Due to other funds . . . . . . . . . . . . . . . 1,860 609 955 1,166 (2,857) 1,733Pension contributions payable . . . . . . 261 —00000 —00000 —00000 —00000 261Deferred revenues . . . . . . . . . . . . . . . 1,190 1,112 89 215 —00000 2,606
Total liabilities . . . . . . . . . . . . . 17,100 6,550 3,003 2,867 (2,857) 26,663
FUND BALANCES (DEFICITS):Restricted . . . . . . . . . . . . . . . . . . . . . . —00000 4 1,958 1,139 —00000 3,101Committed . . . . . . . . . . . . . . . . . . . . . 398 —00000 24 2,922 —00000 3,344Assigned . . . . . . . . . . . . . . . . . . . . . . 1,240 —00000 —00000 2,045 —00000 3,285Unassigned . . . . . . . . . . . . . . . . . . . . (2,377) —00000 —00000 (822) —00000 (3,199)
Total fund balances (deficits) . . (739) 4 1,982 5,284 —00000 6,531
Total liabilities and fund balances (deficits) . . . . $ 16,361 $ 6,554 $ 4,985 $ 8,151 $ (2,857) $ 33,194
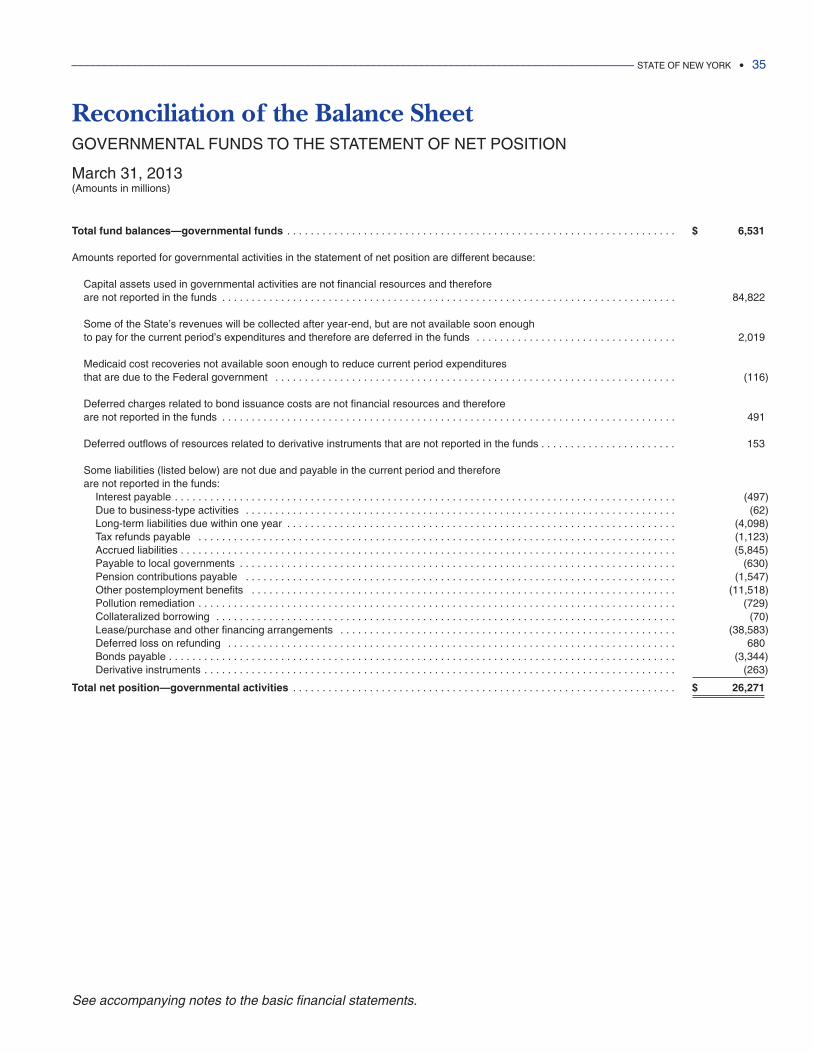
Reconciliation of the Balance SheetGOVERNMENTAL FUNDS TO THE STATEMENT OF NET POSITION
March 31, 2013(Amounts in millions)
Total fund balances—governmental funds . . . . . . . . . . . . . . . . . . . . . . . . . . . . . . . . . . . . . . . . . . . . . . . . . . . . . . . . . . . . . . . . . . $ 6,531
Amounts reported for governmental activities in the statement of net position are different because:
Capital assets used in governmental activities are not financial resources and therefore are not reported in the funds . . . . . . . . . . . . . . . . . . . . . . . . . . . . . . . . . . . . . . . . . . . . . . . . . . . . . . . . . . . . . . . . . . . . . . . . . . . . . 84,822
Some of the State’s revenues will be collected after year-end, but are not available soon enough to pay for the current period’s expenditures and therefore are deferred in the funds . . . . . . . . . . . . . . . . . . . . . . . . . . . . . . . . . . 2,019
Medicaid cost recoveries not available soon enough to reduce current period expenditures that are due to the Federal government . . . . . . . . . . . . . . . . . . . . . . . . . . . . . . . . . . . . . . . . . . . . . . . . . . . . . . . . . . . . . . . . . . . . (116)
Deferred charges related to bond issuance costs are not financial resources and therefore are not reported in the funds . . . . . . . . . . . . . . . . . . . . . . . . . . . . . . . . . . . . . . . . . . . . . . . . . . . . . . . . . . . . . . . . . . . . . . . . . . . . . 491
Deferred outflows of resources related to derivative instruments that are not reported in the funds . . . . . . . . . . . . . . . . . . . . . . . 153
Some liabilities (listed below) are not due and payable in the current period and therefore are not reported in the funds:
Interest payable . . . . . . . . . . . . . . . . . . . . . . . . . . . . . . . . . . . . . . . . . . . . . . . . . . . . . . . . . . . . . . . . . . . . . . . . . . . . . . . . . . . . . (497)Due to business-type activities . . . . . . . . . . . . . . . . . . . . . . . . . . . . . . . . . . . . . . . . . . . . . . . . . . . . . . . . . . . . . . . . . . . . . . . . . (62)Long-term liabilities due within one year . . . . . . . . . . . . . . . . . . . . . . . . . . . . . . . . . . . . . . . . . . . . . . . . . . . . . . . . . . . . . . . . . . (4,098)Tax refunds payable . . . . . . . . . . . . . . . . . . . . . . . . . . . . . . . . . . . . . . . . . . . . . . . . . . . . . . . . . . . . . . . . . . . . . . . . . . . . . . . . . (1,123)Accrued liabilities . . . . . . . . . . . . . . . . . . . . . . . . . . . . . . . . . . . . . . . . . . . . . . . . . . . . . . . . . . . . . . . . . . . . . . . . . . . . . . . . . . . . (5,845)Payable to local governments . . . . . . . . . . . . . . . . . . . . . . . . . . . . . . . . . . . . . . . . . . . . . . . . . . . . . . . . . . . . . . . . . . . . . . . . . . (630)Pension contributions payable . . . . . . . . . . . . . . . . . . . . . . . . . . . . . . . . . . . . . . . . . . . . . . . . . . . . . . . . . . . . . . . . . . . . . . . . . (1,547)Other postemployment benefits . . . . . . . . . . . . . . . . . . . . . . . . . . . . . . . . . . . . . . . . . . . . . . . . . . . . . . . . . . . . . . . . . . . . . . . . (11,518)Pollution remediation . . . . . . . . . . . . . . . . . . . . . . . . . . . . . . . . . . . . . . . . . . . . . . . . . . . . . . . . . . . . . . . . . . . . . . . . . . . . . . . . . (729)Collateralized borrowing . . . . . . . . . . . . . . . . . . . . . . . . . . . . . . . . . . . . . . . . . . . . . . . . . . . . . . . . . . . . . . . . . . . . . . . . . . . . . . (70)Lease/purchase and other financing arrangements . . . . . . . . . . . . . . . . . . . . . . . . . . . . . . . . . . . . . . . . . . . . . . . . . . . . . . . . . (38,583)Deferred loss on refunding . . . . . . . . . . . . . . . . . . . . . . . . . . . . . . . . . . . . . . . . . . . . . . . . . . . . . . . . . . . . . . . . . . . . . . . . . . . . 680Bonds payable . . . . . . . . . . . . . . . . . . . . . . . . . . . . . . . . . . . . . . . . . . . . . . . . . . . . . . . . . . . . . . . . . . . . . . . . . . . . . . . . . . . . . . (3,344)Derivative instruments . . . . . . . . . . . . . . . . . . . . . . . . . . . . . . . . . . . . . . . . . . . . . . . . . . . . . . . . . . . . . . . . . . . . . . . . . . . . . . . . (263)
Total net position—governmental activities . . . . . . . . . . . . . . . . . . . . . . . . . . . . . . . . . . . . . . . . . . . . . . . . . . . . . . . . . . . . . . . . . $ 26,271
______________________________________________________________________________________________ STATE OF NEW YORK • 35
See accompanying notes to the basic financial statements.
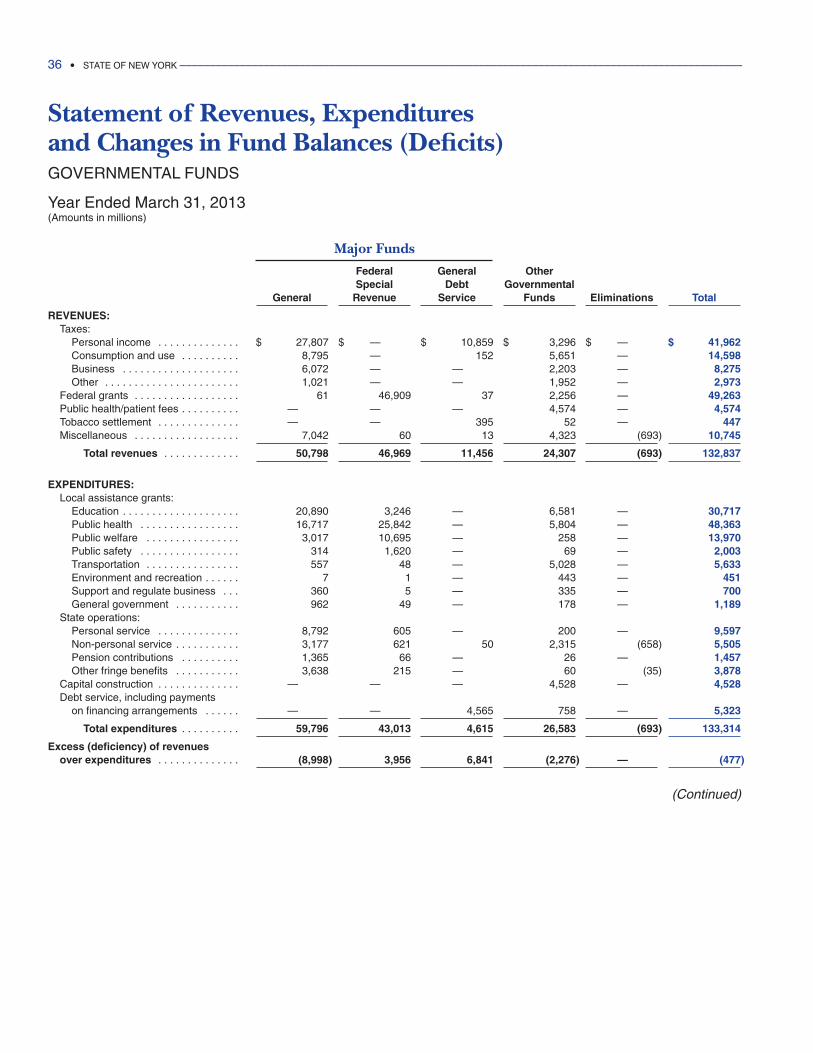
Statement of Revenues, Expenditures and Changes in Fund Balances (Deficits)GOVERNMENTAL FUNDS
Year Ended March 31, 2013(Amounts in millions)
Major Funds
Federal General OtherSpecial Debt Governmental
General Revenue Service Funds Eliminations Total
REVENUES:Taxes:
Personal income . . . . . . . . . . . . . . $ 27,807 $ —00000 $ 10,859 $ 3,296 $ —00000 $ 41,962Consumption and use . . . . . . . . . . 8,795 —00000 152 5,651 —00000 14,598Business . . . . . . . . . . . . . . . . . . . . 6,072 —00000 —00000 2,203 —00000 8,275Other . . . . . . . . . . . . . . . . . . . . . . . 1,021 —00000 —00000 1,952 —00000 2,973
Federal grants . . . . . . . . . . . . . . . . . . 61 46,909 37 2,256 —00000 49,263Public health/patient fees . . . . . . . . . . —00000 —00000 —00000 4,574 —00000 4,574Tobacco settlement . . . . . . . . . . . . . . —00000 —00000 395 52 —00000 447Miscellaneous . . . . . . . . . . . . . . . . . . 7,042 60 13 4,323 (693) 10,745
Total revenues . . . . . . . . . . . . . 50,798 46,969 11,456 24,307 (693) 132,837
EXPENDITURES:Local assistance grants:
Education . . . . . . . . . . . . . . . . . . . . 20,890 3,246 —00000 6,581 —00000 30,717Public health . . . . . . . . . . . . . . . . . 16,717 25,842 —00000 5,804 —00000 48,363Public welfare . . . . . . . . . . . . . . . . 3,017 10,695 —00000 258 —00000 13,970Public safety . . . . . . . . . . . . . . . . . 314 1,620 —00000 69 —00000 2,003Transportation . . . . . . . . . . . . . . . . 557 48 —00000 5,028 —00000 5,633Environment and recreation . . . . . . 7 1 —00000 443 —00000 451Support and regulate business . . . 360 5 —00000 335 —00000 700General government . . . . . . . . . . . 962 49 —00000 178 —00000 1,189
State operations:Personal service . . . . . . . . . . . . . . 8,792 605 —00000 200 —00000 9,597Non-personal service . . . . . . . . . . . 3,177 621 50 2,315 (658) 5,505Pension contributions . . . . . . . . . . 1,365 66 —00000 26 —00000 1,457Other fringe benefits . . . . . . . . . . . 3,638 215 —00000 60 (35) 3,878
Capital construction . . . . . . . . . . . . . . —00000 —00000 —00000 4,528 —00000 4,528Debt service, including payments
on financing arrangements . . . . . . —00000 —00000 4,565 758 —00000 5,323
Total expenditures . . . . . . . . . . 59,796 43,013 4,615 26,583 (693) 133,314
Excess (deficiency) of revenues over expenditures . . . . . . . . . . . . . . (8,998) 3,956 6,841 (2,276) —00000 (477)
(Continued)
36 • STATE OF NEW YORK ______________________________________________________________________________________________
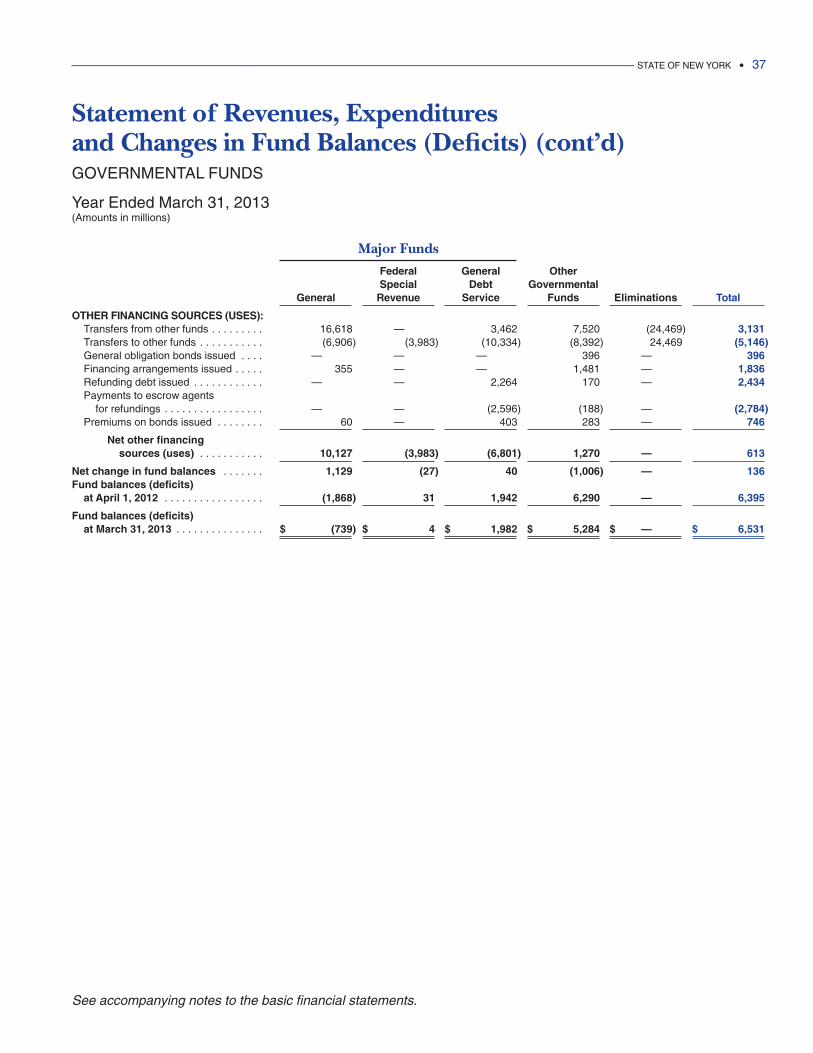
Statement of Revenues, Expenditures and Changes in Fund Balances (Deficits) (cont’d)GOVERNMENTAL FUNDS
Year Ended March 31, 2013(Amounts in millions)
Major Funds
Federal General OtherSpecial Debt Governmental
General Revenue Service Funds Eliminations Total
OTHER FINANCING SOURCES (USES):Transfers from other funds . . . . . . . . . 16,618 —00000 3,462 7,520 (24,469) 3,131Transfers to other funds . . . . . . . . . . . (6,906) (3,983) (10,334) (8,392) 24,469 (5,146)General obligation bonds issued . . . . —00000 —00000 —00000 396 —00000 396Financing arrangements issued . . . . . 355 —00000 —00000 1,481 —00000 1,836Refunding debt issued . . . . . . . . . . . . —00000 —00000 2,264 170 —00000 2,434Payments to escrow agents
for refundings . . . . . . . . . . . . . . . . . —00000 —00000 (2,596) (188) —00000 (2,784)Premiums on bonds issued . . . . . . . . 60 —00000 403 283 —00000 746
Net other financing sources (uses) . . . . . . . . . . . 10,127 (3,983) (6,801) 1,270 —00000 613
Net change in fund balances . . . . . . . 1,129 (27) 40 (1,006) —00000 136Fund balances (deficits)
at April 1, 2012 . . . . . . . . . . . . . . . . . (1,868) 31 1,942 6,290 —00000 6,395
Fund balances (deficits) at March 31, 2013 . . . . . . . . . . . . . . . $ (739) $ 4 $ 1,982 $ 5,284 $ —00000 $ 6,531
______________________________________________________________________________________________ STATE OF NEW YORK • 37
See accompanying notes to the basic financial statements.
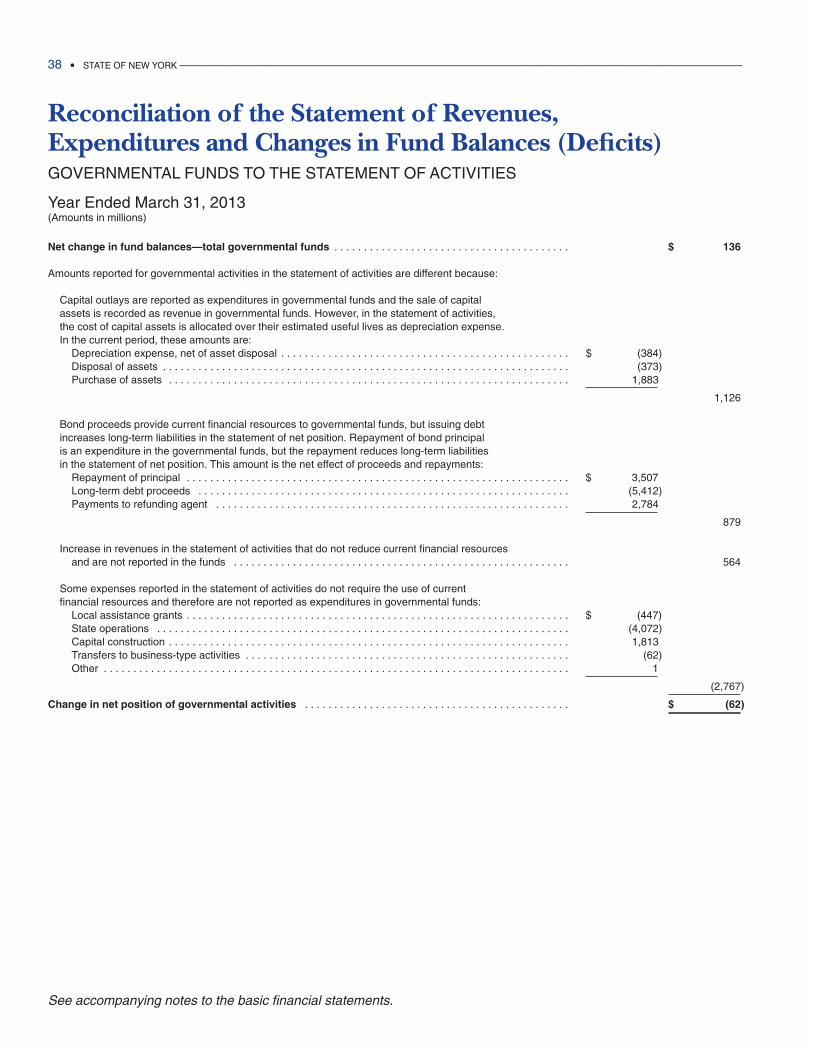
Reconciliation of the Statement of Revenues, Expenditures and Changes in Fund Balances (Deficits)GOVERNMENTAL FUNDS TO THE STATEMENT OF ACTIVITIES
Year Ended March 31, 2013(Amounts in millions)
Net change in fund balances—total governmental funds . . . . . . . . . . . . . . . . . . . . . . . . . . . . . . . . . . . . . . . . $ 136
Amounts reported for governmental activities in the statement of activities are different because:
Capital outlays are reported as expenditures in governmental funds and the sale of capital assets is recorded as revenue in governmental funds. However, in the statement of activities, the cost of capital assets is allocated over their estimated useful lives as depreciation expense. In the current period, these amounts are:
Depreciation expense, net of asset disposal . . . . . . . . . . . . . . . . . . . . . . . . . . . . . . . . . . . . . . . . . . . . . . . . . $ (384)Disposal of assets . . . . . . . . . . . . . . . . . . . . . . . . . . . . . . . . . . . . . . . . . . . . . . . . . . . . . . . . . . . . . . . . . . . . . (373)Purchase of assets . . . . . . . . . . . . . . . . . . . . . . . . . . . . . . . . . . . . . . . . . . . . . . . . . . . . . . . . . . . . . . . . . . . . 1,883
1,126
Bond proceeds provide current financial resources to governmental funds, but issuing debt increases long-term liabilities in the statement of net position. Repayment of bond principal is an expenditure in the governmental funds, but the repayment reduces long-term liabilities in the statement of net position. This amount is the net effect of proceeds and repayments:
Repayment of principal . . . . . . . . . . . . . . . . . . . . . . . . . . . . . . . . . . . . . . . . . . . . . . . . . . . . . . . . . . . . . . . . . $ 3,507Long-term debt proceeds . . . . . . . . . . . . . . . . . . . . . . . . . . . . . . . . . . . . . . . . . . . . . . . . . . . . . . . . . . . . . . . (5,412)Payments to refunding agent . . . . . . . . . . . . . . . . . . . . . . . . . . . . . . . . . . . . . . . . . . . . . . . . . . . . . . . . . . . . 2,784
879
Increase in revenues in the statement of activities that do not reduce current financial resources and are not reported in the funds . . . . . . . . . . . . . . . . . . . . . . . . . . . . . . . . . . . . . . . . . . . . . . . . . . . . . . . . . 564
Some expenses reported in the statement of activities do not require the use of current financial resources and therefore are not reported as expenditures in governmental funds:
Local assistance grants . . . . . . . . . . . . . . . . . . . . . . . . . . . . . . . . . . . . . . . . . . . . . . . . . . . . . . . . . . . . . . . . . $ (447)State operations . . . . . . . . . . . . . . . . . . . . . . . . . . . . . . . . . . . . . . . . . . . . . . . . . . . . . . . . . . . . . . . . . . . . . . (4,072)Capital construction . . . . . . . . . . . . . . . . . . . . . . . . . . . . . . . . . . . . . . . . . . . . . . . . . . . . . . . . . . . . . . . . . . . . 1,813Transfers to business-type activities . . . . . . . . . . . . . . . . . . . . . . . . . . . . . . . . . . . . . . . . . . . . . . . . . . . . . . . (62)Other . . . . . . . . . . . . . . . . . . . . . . . . . . . . . . . . . . . . . . . . . . . . . . . . . . . . . . . . . . . . . . . . . . . . . . . . . . . . . . . 1
(2,767)
Change in net position of governmental activities . . . . . . . . . . . . . . . . . . . . . . . . . . . . . . . . . . . . . . . . . . . . . $ (62)
38 • STATE OF NEW YORK ______________________________________________________________________________________________
See accompanying notes to the basic financial statements.
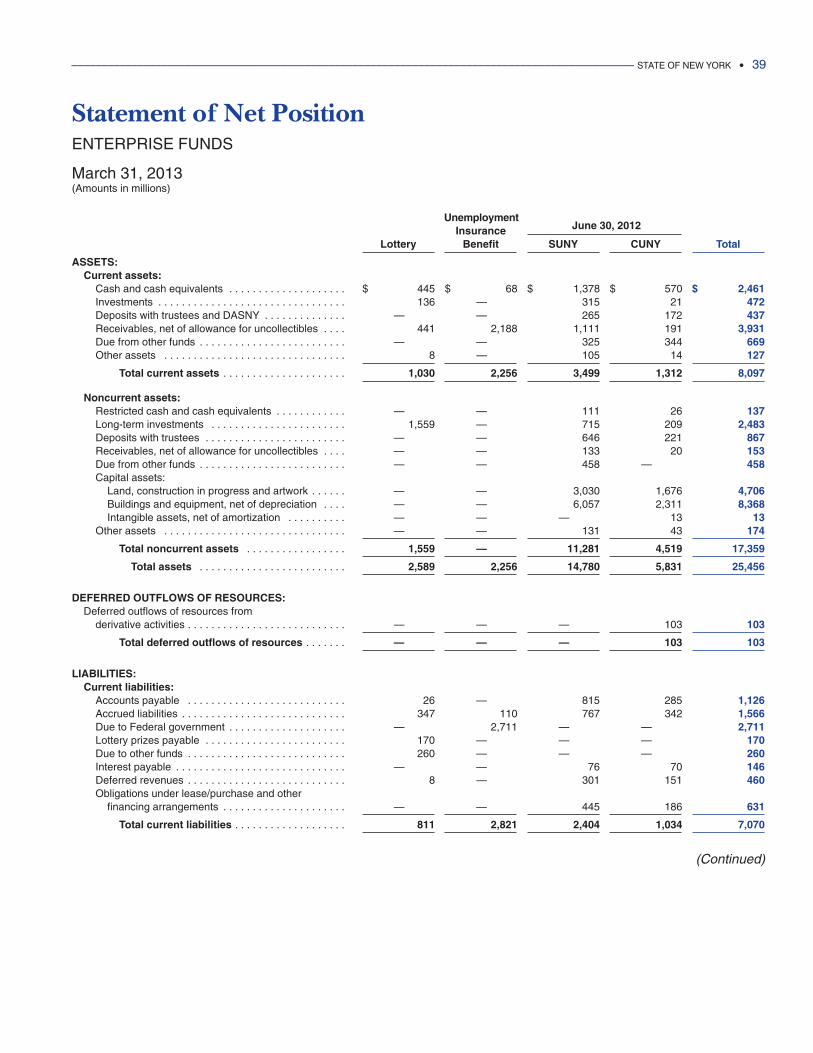
Statement of Net PositionENTERPRISE FUNDS
March 31, 2013(Amounts in millions)
UnemploymentJune 30, 2012Insurance
Lottery Benefit SUNY CUNY Total
ASSETS:Current assets:
Cash and cash equivalents . . . . . . . . . . . . . . . . . . . . $ 445 $ 68 $ 1,378 $ 570 $ 2,461Investments . . . . . . . . . . . . . . . . . . . . . . . . . . . . . . . . 136 —00000 315 21 472Deposits with trustees and DASNY . . . . . . . . . . . . . . —00000 —00000 265 172 437Receivables, net of allowance for uncollectibles . . . . 441 2,188 1,111 191 3,931Due from other funds . . . . . . . . . . . . . . . . . . . . . . . . . —00000 —00000 325 344 669Other assets . . . . . . . . . . . . . . . . . . . . . . . . . . . . . . . 8 —00000 105 14 127
Total current assets . . . . . . . . . . . . . . . . . . . . . 1,030 2,256 3,499 1,312 8,097
Noncurrent assets:Restricted cash and cash equivalents . . . . . . . . . . . . —00000 —00000 111 26 137Long-term investments . . . . . . . . . . . . . . . . . . . . . . . 1,559 —00000 715 209 2,483Deposits with trustees . . . . . . . . . . . . . . . . . . . . . . . . —00000 —00000 646 221 867Receivables, net of allowance for uncollectibles . . . . —00000 —00000 133 20 153Due from other funds . . . . . . . . . . . . . . . . . . . . . . . . . —00000 —00000 458 —00000 458Capital assets:
Land, construction in progress and artwork . . . . . . —00000 —00000 3,030 1,676 4,706Buildings and equipment, net of depreciation . . . . —00000 —00000 6,057 2,311 8,368Intangible assets, net of amortization . . . . . . . . . . —00000 —00000 —00000 13 13
Other assets . . . . . . . . . . . . . . . . . . . . . . . . . . . . . . . —00000 —00000 131 43 174
Total noncurrent assets . . . . . . . . . . . . . . . . . 1,559 —00000 11,281 4,519 17,359
Total assets . . . . . . . . . . . . . . . . . . . . . . . . . 2,589 2,256 14,780 5,831 25,456
DEFERRED OUTFLOWS OF RESOURCES:Deferred outflows of resources from
derivative activities . . . . . . . . . . . . . . . . . . . . . . . . . . . —00000 —00000 —00000 103 103
Total deferred outflows of resources . . . . . . . —00000 —00000 —00000 103 103
LIABILITIES:Current liabilities:
Accounts payable . . . . . . . . . . . . . . . . . . . . . . . . . . . 26 —00000 815 285 1,126Accrued liabilities . . . . . . . . . . . . . . . . . . . . . . . . . . . . 347 110 767 342 1,566Due to Federal government . . . . . . . . . . . . . . . . . . . . —00000 2,711 —00000 —00000 2,711Lottery prizes payable . . . . . . . . . . . . . . . . . . . . . . . . 170 —00000 —00000 —00000 170Due to other funds . . . . . . . . . . . . . . . . . . . . . . . . . . . 260 —00000 —00000 —00000 260Interest payable . . . . . . . . . . . . . . . . . . . . . . . . . . . . . —00000 —00000 76 70 146Deferred revenues . . . . . . . . . . . . . . . . . . . . . . . . . . . 8 —00000 301 151 460Obligations under lease/purchase and other
financing arrangements . . . . . . . . . . . . . . . . . . . . . —00000 —00000 445 186 631
Total current liabilities . . . . . . . . . . . . . . . . . . . 811 2,821 2,404 1,034 7,070
(Continued)
______________________________________________________________________________________________ STATE OF NEW YORK • 39
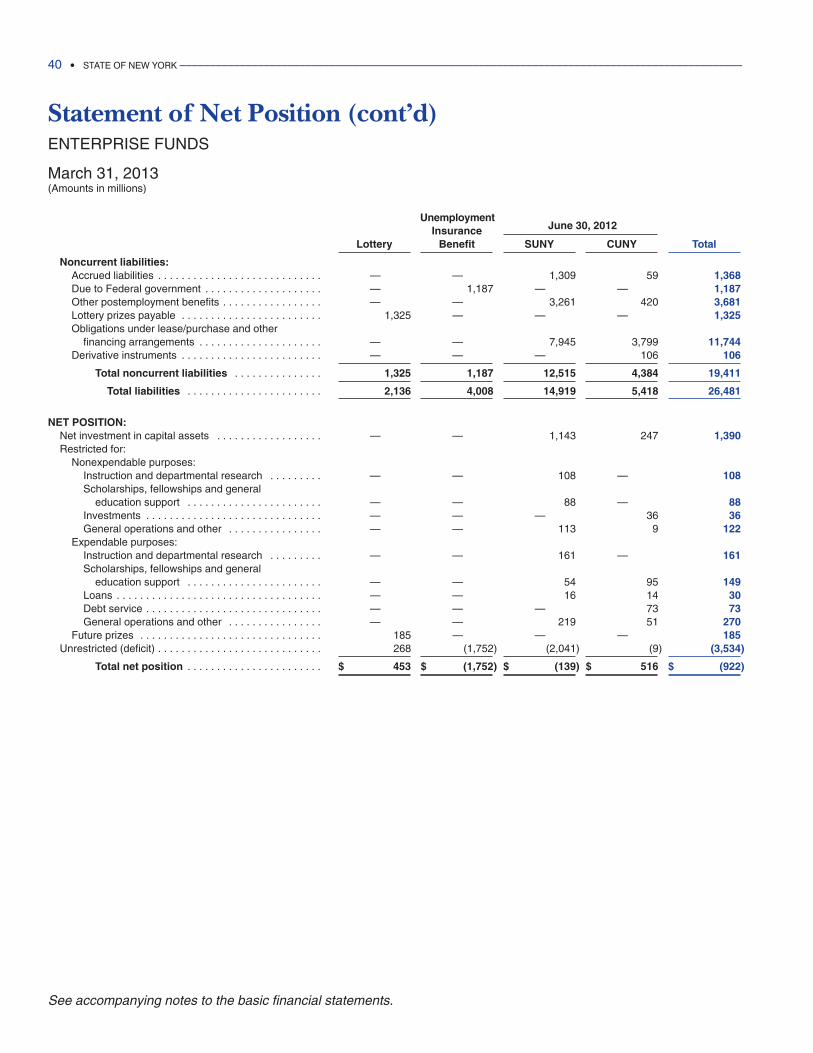
Statement of Net Position (cont’d)ENTERPRISE FUNDS
March 31, 2013(Amounts in millions)
UnemploymentJune 30, 2012Insurance
Lottery Benefit SUNY CUNY Total
Noncurrent liabilities:Accrued liabilities . . . . . . . . . . . . . . . . . . . . . . . . . . . . —00000 —00000 1,309 59 1,368Due to Federal government . . . . . . . . . . . . . . . . . . . . —00000 1,187 —00000 —00000 1,187Other postemployment benefits . . . . . . . . . . . . . . . . . —00000 —00000 3,261 420 3,681Lottery prizes payable . . . . . . . . . . . . . . . . . . . . . . . . 1,325 —00000 —00000 —00000 1,325Obligations under lease/purchase and other
financing arrangements . . . . . . . . . . . . . . . . . . . . . —00000 —00000 7,945 3,799 11,744Derivative instruments . . . . . . . . . . . . . . . . . . . . . . . . —00000 —00000 —00000 106 106
Total noncurrent liabilities . . . . . . . . . . . . . . . 1,325 1,187 12,515 4,384 19,411
Total liabilities . . . . . . . . . . . . . . . . . . . . . . . 2,136 4,008 14,919 5,418 26,481
NET POSITION:Net investment in capital assets . . . . . . . . . . . . . . . . . . —00000 —00000 1,143 247 1,390Restricted for:
Nonexpendable purposes:Instruction and departmental research . . . . . . . . . —00000 —00000 108 —00000 108Scholarships, fellowships and general
education support . . . . . . . . . . . . . . . . . . . . . . . —00000 —00000 88 —00000 88Investments . . . . . . . . . . . . . . . . . . . . . . . . . . . . . . —00000 —00000 —00000 36 36General operations and other . . . . . . . . . . . . . . . . —00000 —00000 113 9 122
Expendable purposes:Instruction and departmental research . . . . . . . . . —00000 —00000 161 —00000 161Scholarships, fellowships and general
education support . . . . . . . . . . . . . . . . . . . . . . . —00000 —00000 54 95 149Loans . . . . . . . . . . . . . . . . . . . . . . . . . . . . . . . . . . . —00000 —00000 16 14 30Debt service . . . . . . . . . . . . . . . . . . . . . . . . . . . . . . —00000 —00000 —00000 73 73General operations and other . . . . . . . . . . . . . . . . —00000 —00000 219 51 270
Future prizes . . . . . . . . . . . . . . . . . . . . . . . . . . . . . . . 185 —00000 —00000 —00000 185Unrestricted (deficit) . . . . . . . . . . . . . . . . . . . . . . . . . . . . 268 (1,752) (2,041) (9) (3,534)
Total net position . . . . . . . . . . . . . . . . . . . . . . . $ 453 $ (1,752) $ (139) $ 516 $ (922)
40 • STATE OF NEW YORK ______________________________________________________________________________________________
See accompanying notes to the basic financial statements.
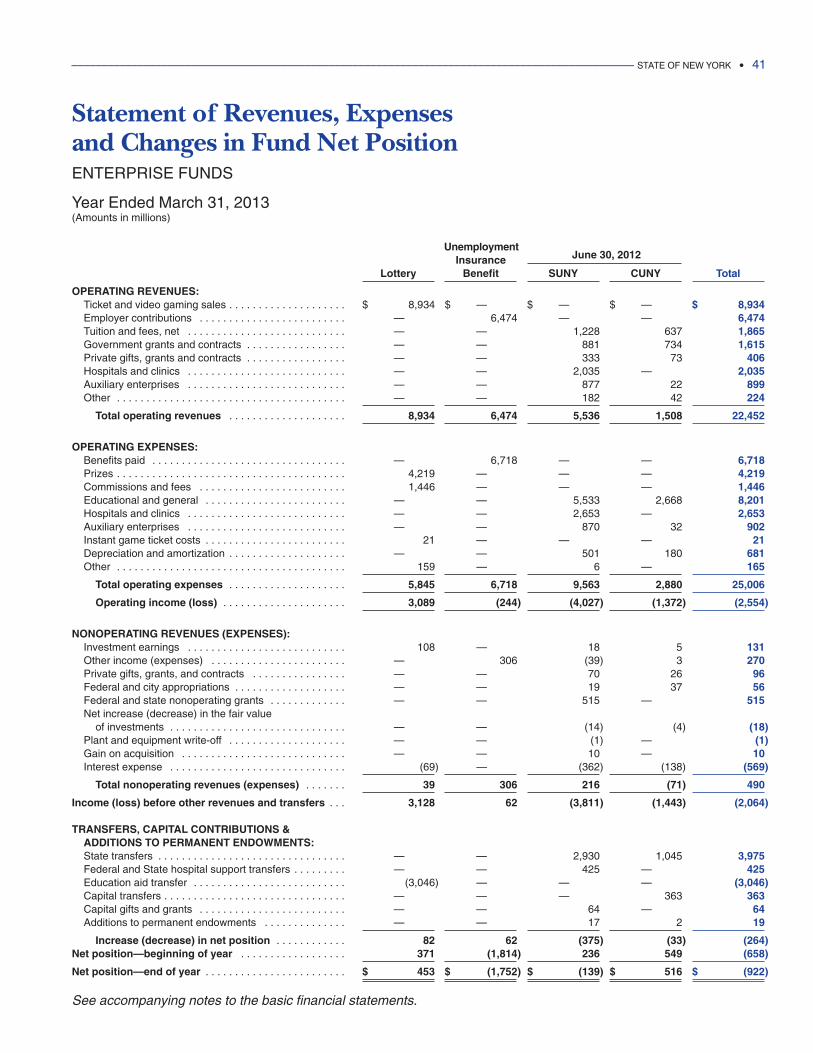
Statement of Revenues, Expenses and Changes in Fund Net PositionENTERPRISE FUNDS
Year Ended March 31, 2013(Amounts in millions)
UnemploymentJune 30, 2012Insurance
Lottery Benefit SUNY CUNY Total
OPERATING REVENUES:Ticket and video gaming sales . . . . . . . . . . . . . . . . . . . . $ 8,934 $ —00000 $ —00000 $ —00000 $ 8,934Employer contributions . . . . . . . . . . . . . . . . . . . . . . . . . —00000 6,474 —00000 —00000 6,474Tuition and fees, net . . . . . . . . . . . . . . . . . . . . . . . . . . . —00000 —00000 1,228 637 1,865Government grants and contracts . . . . . . . . . . . . . . . . . —00000 —00000 881 734 1,615Private gifts, grants and contracts . . . . . . . . . . . . . . . . . —00000 —00000 333 73 406Hospitals and clinics . . . . . . . . . . . . . . . . . . . . . . . . . . . —00000 —00000 2,035 —00000 2,035Auxiliary enterprises . . . . . . . . . . . . . . . . . . . . . . . . . . . —00000 —00000 877 22 899Other . . . . . . . . . . . . . . . . . . . . . . . . . . . . . . . . . . . . . . . —00000 —00000 182 42 224
Total operating revenues . . . . . . . . . . . . . . . . . . . . 8,934 6,474 5,536 1,508 22,452
OPERATING EXPENSES:Benefits paid . . . . . . . . . . . . . . . . . . . . . . . . . . . . . . . . . —00000 6,718 —00000 —00000 6,718Prizes . . . . . . . . . . . . . . . . . . . . . . . . . . . . . . . . . . . . . . . 4,219 —00000 —00000 —00000 4,219Commissions and fees . . . . . . . . . . . . . . . . . . . . . . . . . 1,446 —00000 —00000 —00000 1,446Educational and general . . . . . . . . . . . . . . . . . . . . . . . . —00000 —00000 5,533 2,668 8,201Hospitals and clinics . . . . . . . . . . . . . . . . . . . . . . . . . . . —00000 —00000 2,653 —00000 2,653Auxiliary enterprises . . . . . . . . . . . . . . . . . . . . . . . . . . . —00000 —00000 870 32 902Instant game ticket costs . . . . . . . . . . . . . . . . . . . . . . . . 21 —00000 —00000 —00000 21Depreciation and amortization . . . . . . . . . . . . . . . . . . . . —00000 —00000 501 180 681Other . . . . . . . . . . . . . . . . . . . . . . . . . . . . . . . . . . . . . . . 159 —00000 6 —00000 165
Total operating expenses . . . . . . . . . . . . . . . . . . . . 5,845 6,718 9,563 2,880 25,006
Operating income (loss) . . . . . . . . . . . . . . . . . . . . . 3,089 (244) (4,027) (1,372) (2,554)
NONOPERATING REVENUES (EXPENSES):Investment earnings . . . . . . . . . . . . . . . . . . . . . . . . . . . 108 —00000 18 5 131Other income (expenses) . . . . . . . . . . . . . . . . . . . . . . . —00000 306 (39) 3 270Private gifts, grants, and contracts . . . . . . . . . . . . . . . . —00000 —00000 70 26 96Federal and city appropriations . . . . . . . . . . . . . . . . . . . —00000 —00000 19 37 56Federal and state nonoperating grants . . . . . . . . . . . . . —00000 —00000 515 —00000 515Net increase (decrease) in the fair value
of investments . . . . . . . . . . . . . . . . . . . . . . . . . . . . . . —00000 —00000 (14) (4) (18)Plant and equipment write-off . . . . . . . . . . . . . . . . . . . . —00000 —00000 (1) —00000 (1)Gain on acquisition . . . . . . . . . . . . . . . . . . . . . . . . . . . . —00000 —00000 10 —00000 10Interest expense . . . . . . . . . . . . . . . . . . . . . . . . . . . . . . (69) —00000 (362) (138) (569)
Total nonoperating revenues (expenses) . . . . . . . 39 306 216 (71) 490
Income (loss) before other revenues and transfers . . . 3,128 62 (3,811) (1,443) (2,064)
TRANSFERS, CAPITAL CONTRIBUTIONS & ADDITIONS TO PERMANENT ENDOWMENTS:State transfers . . . . . . . . . . . . . . . . . . . . . . . . . . . . . . . . —00000 —00000 2,930 1,045 3,975Federal and State hospital support transfers . . . . . . . . . —00000 —00000 425 —00000 425Education aid transfer . . . . . . . . . . . . . . . . . . . . . . . . . . (3,046) —00000 —00000 —00000 (3,046)Capital transfers . . . . . . . . . . . . . . . . . . . . . . . . . . . . . . . —00000 —00000 —00000 363 363Capital gifts and grants . . . . . . . . . . . . . . . . . . . . . . . . . —00000 —00000 64 —00000 64Additions to permanent endowments . . . . . . . . . . . . . . —00000 —00000 17 2 19
Increase (decrease) in net position . . . . . . . . . . . . 82 62 (375) (33) (264)Net position—beginning of year . . . . . . . . . . . . . . . . . . 371 (1,814) 236 549 (658)
Net position—end of year . . . . . . . . . . . . . . . . . . . . . . . . $ 453 $ (1,752) $ (139) $ 516 $ (922)
______________________________________________________________________________________________ STATE OF NEW YORK • 41
See accompanying notes to the basic financial statements.
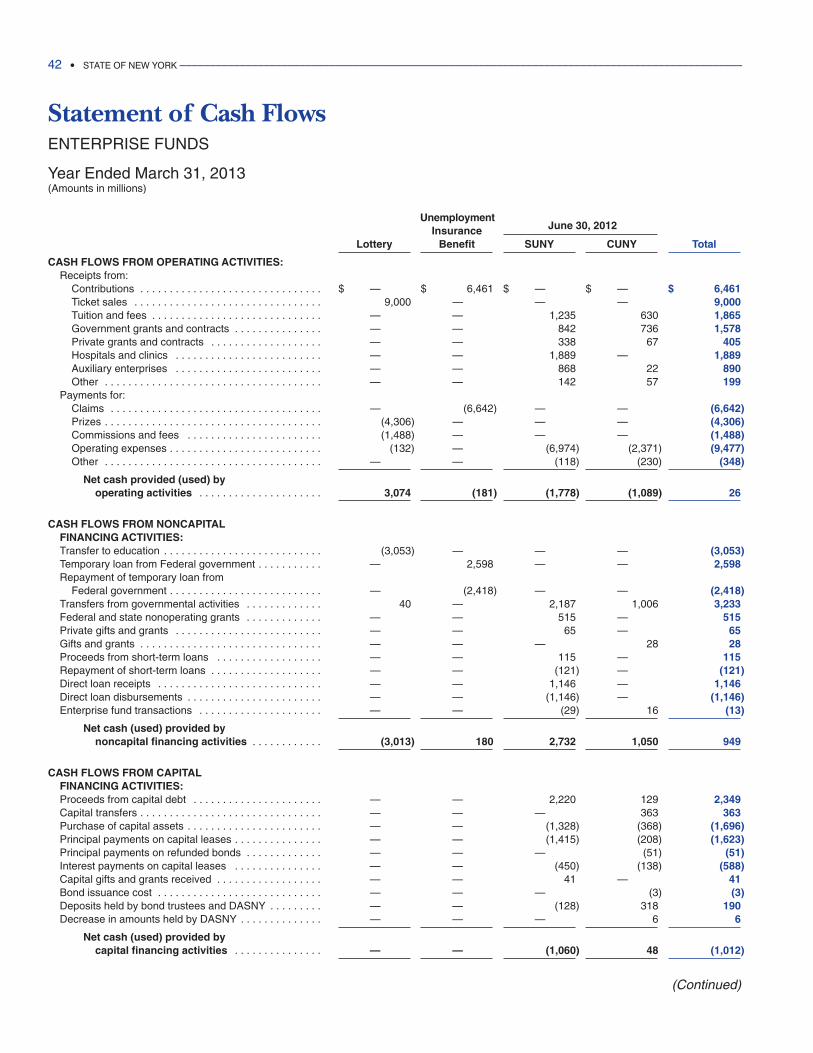
Statement of Cash FlowsENTERPRISE FUNDS
Year Ended March 31, 2013(Amounts in millions)
UnemploymentJune 30, 2012Insurance
Lottery Benefit SUNY CUNY Total
CASH FLOWS FROM OPERATING ACTIVITIES:Receipts from:
Contributions . . . . . . . . . . . . . . . . . . . . . . . . . . . . . . . $ —00000 $ 6,461 $ —00000 $ —00000 $ 6,461Ticket sales . . . . . . . . . . . . . . . . . . . . . . . . . . . . . . . . 9,000 —00000 —00000 —00000 9,000Tuition and fees . . . . . . . . . . . . . . . . . . . . . . . . . . . . . —00000 —00000 1,235 630 1,865Government grants and contracts . . . . . . . . . . . . . . . —00000 —00000 842 736 1,578Private grants and contracts . . . . . . . . . . . . . . . . . . . —00000 —00000 338 67 405Hospitals and clinics . . . . . . . . . . . . . . . . . . . . . . . . . —00000 —00000 1,889 —00000 1,889Auxiliary enterprises . . . . . . . . . . . . . . . . . . . . . . . . . —00000 —00000 868 22 890Other . . . . . . . . . . . . . . . . . . . . . . . . . . . . . . . . . . . . . —00000 —00000 142 57 199
Payments for:Claims . . . . . . . . . . . . . . . . . . . . . . . . . . . . . . . . . . . . —00000 (6,642) —00000 —00000 (6,642)Prizes . . . . . . . . . . . . . . . . . . . . . . . . . . . . . . . . . . . . . (4,306) —00000 —00000 —00000 (4,306)Commissions and fees . . . . . . . . . . . . . . . . . . . . . . . (1,488) —00000 —00000 —00000 (1,488)Operating expenses . . . . . . . . . . . . . . . . . . . . . . . . . . (132) —00000 (6,974) (2,371) (9,477)Other . . . . . . . . . . . . . . . . . . . . . . . . . . . . . . . . . . . . . —00000 —00000 (118) (230) (348)
Net cash provided (used) by operating activities . . . . . . . . . . . . . . . . . . . . . 3,074 (181) (1,778) (1,089) 26
CASH FLOWS FROM NONCAPITALFINANCING ACTIVITIES:Transfer to education . . . . . . . . . . . . . . . . . . . . . . . . . . . (3,053) —00000 —00000 —00000 (3,053)Temporary loan from Federal government . . . . . . . . . . . —00000 2,598 —00000 —00000 2,598Repayment of temporary loan from
Federal government . . . . . . . . . . . . . . . . . . . . . . . . . . —00000 (2,418) —00000 —00000 (2,418)Transfers from governmental activities . . . . . . . . . . . . . 40 —00000 2,187 1,006 3,233Federal and state nonoperating grants . . . . . . . . . . . . . —00000 —00000 515 —00000 515Private gifts and grants . . . . . . . . . . . . . . . . . . . . . . . . . —00000 —00000 65 —00000 65Gifts and grants . . . . . . . . . . . . . . . . . . . . . . . . . . . . . . . —00000 —00000 —00000 28 28Proceeds from short-term loans . . . . . . . . . . . . . . . . . . —00000 —00000 115 —00000 115Repayment of short-term loans . . . . . . . . . . . . . . . . . . . —00000 —00000 (121) —00000 (121)Direct loan receipts . . . . . . . . . . . . . . . . . . . . . . . . . . . . —00000 —00000 1,146 —00000 1,146Direct loan disbursements . . . . . . . . . . . . . . . . . . . . . . . —00000 —00000 (1,146) —00000 (1,146)Enterprise fund transactions . . . . . . . . . . . . . . . . . . . . . —00000 —00000 (29) 16 (13)
Net cash (used) provided by noncapital financing activities . . . . . . . . . . . . (3,013) 180 2,732 1,050 949
CASH FLOWS FROM CAPITALFINANCING ACTIVITIES:Proceeds from capital debt . . . . . . . . . . . . . . . . . . . . . . —00000 —00000 2,220 129 2,349Capital transfers . . . . . . . . . . . . . . . . . . . . . . . . . . . . . . . —00000 —00000 —00000 363 363Purchase of capital assets . . . . . . . . . . . . . . . . . . . . . . . —00000 —00000 (1,328) (368) (1,696)Principal payments on capital leases . . . . . . . . . . . . . . . —00000 —00000 (1,415) (208) (1,623)Principal payments on refunded bonds . . . . . . . . . . . . . —00000 —00000 —00000 (51) (51)Interest payments on capital leases . . . . . . . . . . . . . . . —00000 —00000 (450) (138) (588)Capital gifts and grants received . . . . . . . . . . . . . . . . . . —00000 —00000 41 —00000 41Bond issuance cost . . . . . . . . . . . . . . . . . . . . . . . . . . . . —00000 —00000 —00000 (3) (3)Deposits held by bond trustees and DASNY . . . . . . . . . —00000 —00000 (128) 318 190Decrease in amounts held by DASNY . . . . . . . . . . . . . . —00000 —00000 —00000 6 6
Net cash (used) provided by capital financing activities . . . . . . . . . . . . . . . —00000 —00000 (1,060) 48 (1,012)
(Continued)
42 • STATE OF NEW YORK ______________________________________________________________________________________________
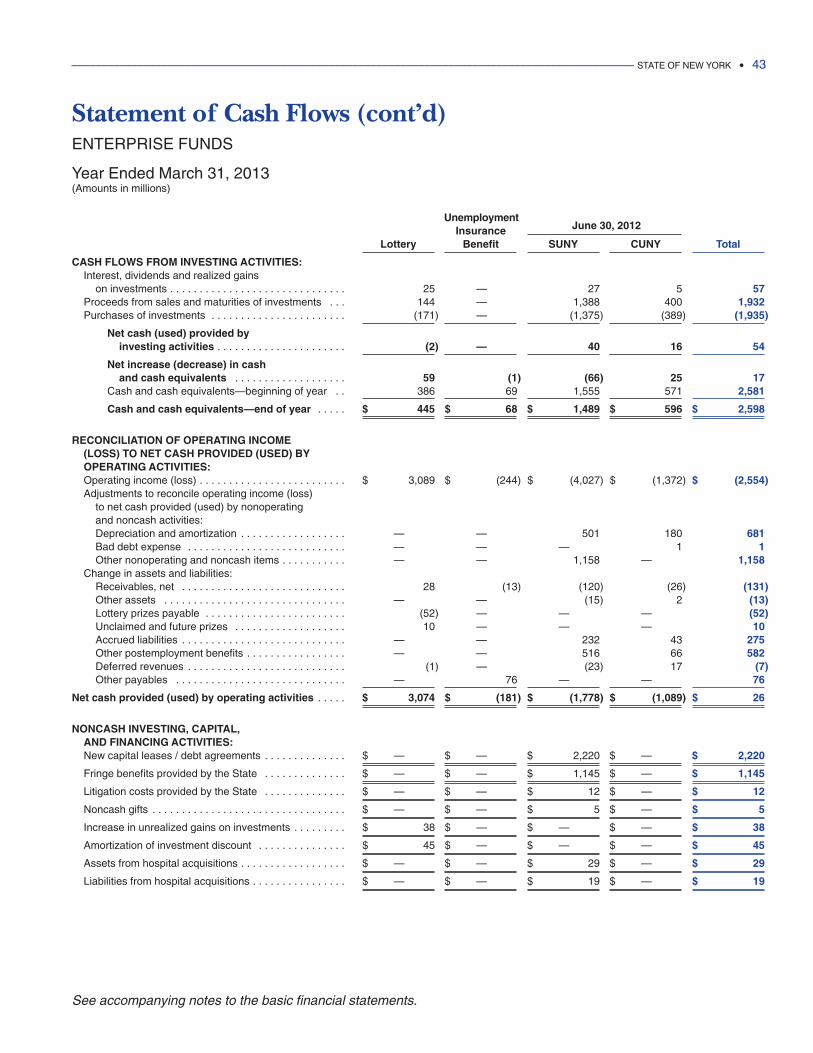
Statement of Cash Flows (cont’d)ENTERPRISE FUNDS
Year Ended March 31, 2013(Amounts in millions)
UnemploymentJune 30, 2012Insurance
Lottery Benefit SUNY CUNY Total
CASH FLOWS FROM INVESTING ACTIVITIES:Interest, dividends and realized gains
on investments . . . . . . . . . . . . . . . . . . . . . . . . . . . . . . 25 —00000 27 5 57Proceeds from sales and maturities of investments . . . 144 —00000 1,388 400 1,932Purchases of investments . . . . . . . . . . . . . . . . . . . . . . . (171) —00000 (1,375) (389) (1,935)
Net cash (used) provided by investing activities . . . . . . . . . . . . . . . . . . . . . . (2) —00000 40 16 54
Net increase (decrease) in cash and cash equivalents . . . . . . . . . . . . . . . . . . . 59 (1) (66) 25 17
Cash and cash equivalents—beginning of year . . 386 69 1,555 571 2,581
Cash and cash equivalents—end of year . . . . . $ 445 $ 68 $ 1,489 $ 596 $ 2,598
RECONCILIATION OF OPERATING INCOME (LOSS) TO NET CASH PROVIDED (USED) BYOPERATING ACTIVITIES:Operating income (loss) . . . . . . . . . . . . . . . . . . . . . . . . . $ 3,089 $ (244) $ (4,027) $ (1,372) $ (2,554)Adjustments to reconcile operating income (loss)
to net cash provided (used) by nonoperating and noncash activities:Depreciation and amortization . . . . . . . . . . . . . . . . . . —00000 —00000 501 180 681Bad debt expense . . . . . . . . . . . . . . . . . . . . . . . . . . . —00000 —00000 —00000 1 1Other nonoperating and noncash items . . . . . . . . . . . —00000 —00000 1,158 —00000 1,158
Change in assets and liabilities:Receivables, net . . . . . . . . . . . . . . . . . . . . . . . . . . . . 28 (13) (120) (26) (131)Other assets . . . . . . . . . . . . . . . . . . . . . . . . . . . . . . . —00000 —00000 (15) 2 (13)Lottery prizes payable . . . . . . . . . . . . . . . . . . . . . . . . (52) —00000 —00000 —00000 (52)Unclaimed and future prizes . . . . . . . . . . . . . . . . . . . 10 —00000 —00000 —00000 10Accrued liabilities . . . . . . . . . . . . . . . . . . . . . . . . . . . . —00000 —00000 232 43 275Other postemployment benefits . . . . . . . . . . . . . . . . . —00000 —00000 516 66 582Deferred revenues . . . . . . . . . . . . . . . . . . . . . . . . . . . (1) —00000 (23) 17 (7)Other payables . . . . . . . . . . . . . . . . . . . . . . . . . . . . . —00000 76 —00000 —00000 76
Net cash provided (used) by operating activities . . . . . $ 3,074 $ (181) $ (1,778) $ (1,089) $ 26
NONCASH INVESTING, CAPITAL, AND FINANCING ACTIVITIES:New capital leases / debt agreements . . . . . . . . . . . . . . $ —00000 $ —00000 $ 2,220 $ —00000 $ 2,220
Fringe benefits provided by the State . . . . . . . . . . . . . . $ —00000 $ —00000 $ 1,145 $ —00000 $ 1,145
Litigation costs provided by the State . . . . . . . . . . . . . . $ —00000 $ —00000 $ 12 $ —00000 $ 12
Noncash gifts . . . . . . . . . . . . . . . . . . . . . . . . . . . . . . . . . $ —00000 $ —00000 $ 5 $ —00000 $ 5
Increase in unrealized gains on investments . . . . . . . . . $ 38 $ —00000 $ —00000 $ —00000 $ 38
Amortization of investment discount . . . . . . . . . . . . . . . $ 45 $ —00000 $ —00000 $ —00000 $ 45
Assets from hospital acquisitions . . . . . . . . . . . . . . . . . . $ —00000 $ —00000 $ 29 $ —00000 $ 29
Liabilities from hospital acquisitions . . . . . . . . . . . . . . . . $ —00000 $ —00000 $ 19 $ —00000 $ 19
______________________________________________________________________________________________ STATE OF NEW YORK • 43
See accompanying notes to the basic financial statements.
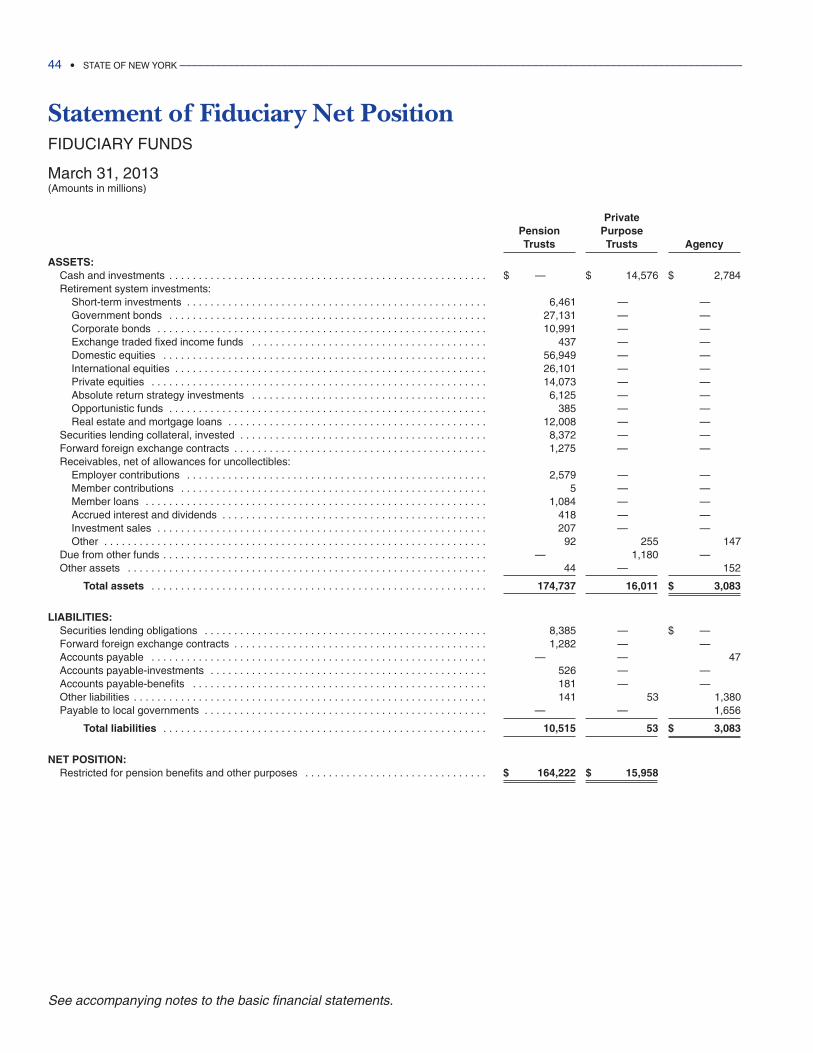
Statement of Fiduciary Net PositionFIDUCIARY FUNDS
March 31, 2013(Amounts in millions)
PrivatePension PurposeTrusts Trusts Agency
ASSETS:Cash and investments . . . . . . . . . . . . . . . . . . . . . . . . . . . . . . . . . . . . . . . . . . . . . . . . . . . . . . $ —00000 $ 14,576 $ 2,784Retirement system investments:
Short-term investments . . . . . . . . . . . . . . . . . . . . . . . . . . . . . . . . . . . . . . . . . . . . . . . . . . . 6,461 —00000 —00000Government bonds . . . . . . . . . . . . . . . . . . . . . . . . . . . . . . . . . . . . . . . . . . . . . . . . . . . . . . 27,131 —00000 —00000Corporate bonds . . . . . . . . . . . . . . . . . . . . . . . . . . . . . . . . . . . . . . . . . . . . . . . . . . . . . . . . 10,991 —00000 —00000Exchange traded fixed income funds . . . . . . . . . . . . . . . . . . . . . . . . . . . . . . . . . . . . . . . . 437 —00000 —00000Domestic equities . . . . . . . . . . . . . . . . . . . . . . . . . . . . . . . . . . . . . . . . . . . . . . . . . . . . . . . 56,949 —00000 —00000International equities . . . . . . . . . . . . . . . . . . . . . . . . . . . . . . . . . . . . . . . . . . . . . . . . . . . . . 26,101 —00000 —00000Private equities . . . . . . . . . . . . . . . . . . . . . . . . . . . . . . . . . . . . . . . . . . . . . . . . . . . . . . . . . 14,073 —00000 —00000Absolute return strategy investments . . . . . . . . . . . . . . . . . . . . . . . . . . . . . . . . . . . . . . . . 6,125 —00000 —00000Opportunistic funds . . . . . . . . . . . . . . . . . . . . . . . . . . . . . . . . . . . . . . . . . . . . . . . . . . . . . . 385 —00000 —00000Real estate and mortgage loans . . . . . . . . . . . . . . . . . . . . . . . . . . . . . . . . . . . . . . . . . . . . 12,008 —00000 —00000
Securities lending collateral, invested . . . . . . . . . . . . . . . . . . . . . . . . . . . . . . . . . . . . . . . . . . 8,372 —00000 —00000Forward foreign exchange contracts . . . . . . . . . . . . . . . . . . . . . . . . . . . . . . . . . . . . . . . . . . . 1,275 —00000 —00000Receivables, net of allowances for uncollectibles:
Employer contributions . . . . . . . . . . . . . . . . . . . . . . . . . . . . . . . . . . . . . . . . . . . . . . . . . . . 2,579 —00000 —00000Member contributions . . . . . . . . . . . . . . . . . . . . . . . . . . . . . . . . . . . . . . . . . . . . . . . . . . . . 5 —00000 —00000Member loans . . . . . . . . . . . . . . . . . . . . . . . . . . . . . . . . . . . . . . . . . . . . . . . . . . . . . . . . . . 1,084 —00000 —00000Accrued interest and dividends . . . . . . . . . . . . . . . . . . . . . . . . . . . . . . . . . . . . . . . . . . . . . 418 —00000 —00000Investment sales . . . . . . . . . . . . . . . . . . . . . . . . . . . . . . . . . . . . . . . . . . . . . . . . . . . . . . . . 207 —00000 —00000Other . . . . . . . . . . . . . . . . . . . . . . . . . . . . . . . . . . . . . . . . . . . . . . . . . . . . . . . . . . . . . . . . . 92 255 147
Due from other funds . . . . . . . . . . . . . . . . . . . . . . . . . . . . . . . . . . . . . . . . . . . . . . . . . . . . . . . —00000 1,180 —00000Other assets . . . . . . . . . . . . . . . . . . . . . . . . . . . . . . . . . . . . . . . . . . . . . . . . . . . . . . . . . . . . . 44 —00000 152
Total assets . . . . . . . . . . . . . . . . . . . . . . . . . . . . . . . . . . . . . . . . . . . . . . . . . . . . . . . . . 174,737 16,011 $ 3,083
LIABILITIES:Securities lending obligations . . . . . . . . . . . . . . . . . . . . . . . . . . . . . . . . . . . . . . . . . . . . . . . . 8,385 —00000 $ —00000Forward foreign exchange contracts . . . . . . . . . . . . . . . . . . . . . . . . . . . . . . . . . . . . . . . . . . . 1,282 —00000 —00000Accounts payable . . . . . . . . . . . . . . . . . . . . . . . . . . . . . . . . . . . . . . . . . . . . . . . . . . . . . . . . . —00000 —00000 47Accounts payable-investments . . . . . . . . . . . . . . . . . . . . . . . . . . . . . . . . . . . . . . . . . . . . . . . 526 —00000 —00000Accounts payable-benefits . . . . . . . . . . . . . . . . . . . . . . . . . . . . . . . . . . . . . . . . . . . . . . . . . . 181 —00000 —00000Other liabilities . . . . . . . . . . . . . . . . . . . . . . . . . . . . . . . . . . . . . . . . . . . . . . . . . . . . . . . . . . . . 141 53 1,380Payable to local governments . . . . . . . . . . . . . . . . . . . . . . . . . . . . . . . . . . . . . . . . . . . . . . . . —00000 —00000 1,656
Total liabilities . . . . . . . . . . . . . . . . . . . . . . . . . . . . . . . . . . . . . . . . . . . . . . . . . . . . . . . 10,515 53 $ 3,083
NET POSITION:Restricted for pension benefits and other purposes . . . . . . . . . . . . . . . . . . . . . . . . . . . . . . . $ 164,222 $ 15,958
44 • STATE OF NEW YORK ______________________________________________________________________________________________
See accompanying notes to the basic financial statements.
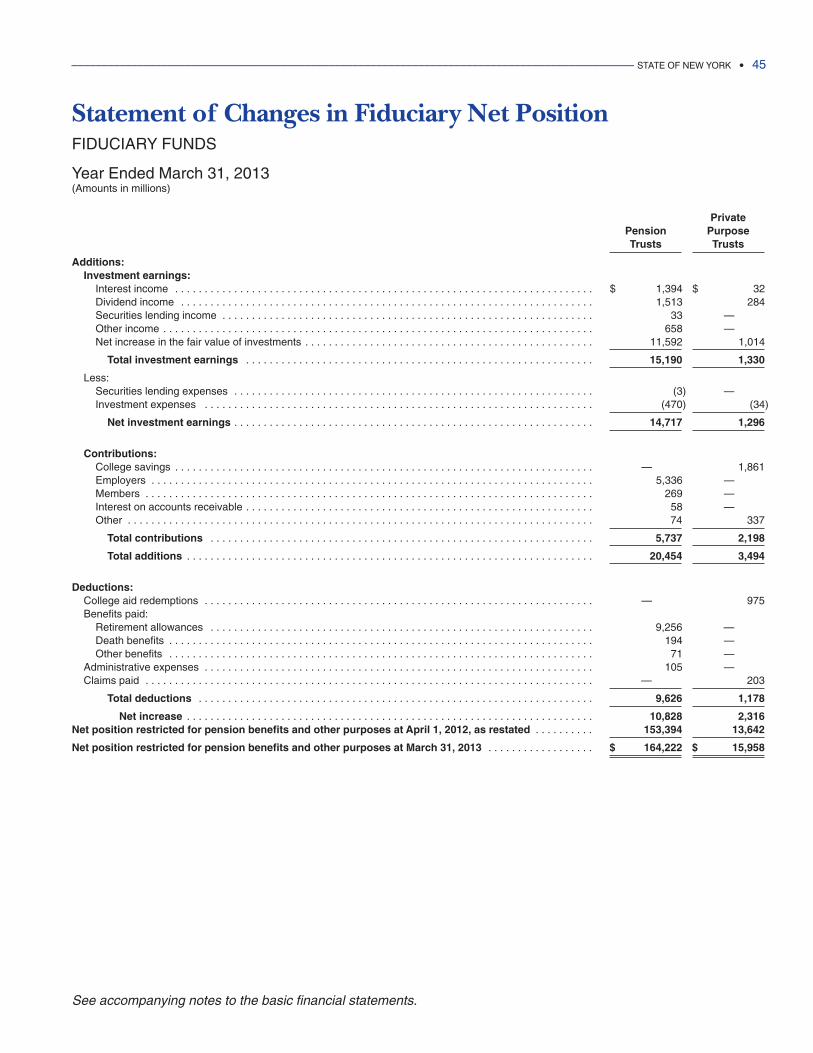
Statement of Changes in Fiduciary Net PositionFIDUCIARY FUNDS
Year Ended March 31, 2013(Amounts in millions)
PrivatePension PurposeTrusts Trusts
Additions:Investment earnings:
Interest income . . . . . . . . . . . . . . . . . . . . . . . . . . . . . . . . . . . . . . . . . . . . . . . . . . . . . . . . . . . . . . . . . . . . . . . $ 1,394 $ 32Dividend income . . . . . . . . . . . . . . . . . . . . . . . . . . . . . . . . . . . . . . . . . . . . . . . . . . . . . . . . . . . . . . . . . . . . . . 1,513 284Securities lending income . . . . . . . . . . . . . . . . . . . . . . . . . . . . . . . . . . . . . . . . . . . . . . . . . . . . . . . . . . . . . . . 33 —00000Other income . . . . . . . . . . . . . . . . . . . . . . . . . . . . . . . . . . . . . . . . . . . . . . . . . . . . . . . . . . . . . . . . . . . . . . . . . 658 —00000Net increase in the fair value of investments . . . . . . . . . . . . . . . . . . . . . . . . . . . . . . . . . . . . . . . . . . . . . . . . . 11,592 1,014
Total investment earnings . . . . . . . . . . . . . . . . . . . . . . . . . . . . . . . . . . . . . . . . . . . . . . . . . . . . . . . . . . . 15,190 1,330
Less:Securities lending expenses . . . . . . . . . . . . . . . . . . . . . . . . . . . . . . . . . . . . . . . . . . . . . . . . . . . . . . . . . . . . . (3) —00000Investment expenses . . . . . . . . . . . . . . . . . . . . . . . . . . . . . . . . . . . . . . . . . . . . . . . . . . . . . . . . . . . . . . . . . . (470) (34)
Net investment earnings . . . . . . . . . . . . . . . . . . . . . . . . . . . . . . . . . . . . . . . . . . . . . . . . . . . . . . . . . . . . . 14,717 1,296
Contributions:College savings . . . . . . . . . . . . . . . . . . . . . . . . . . . . . . . . . . . . . . . . . . . . . . . . . . . . . . . . . . . . . . . . . . . . . . . —00000 1,861Employers . . . . . . . . . . . . . . . . . . . . . . . . . . . . . . . . . . . . . . . . . . . . . . . . . . . . . . . . . . . . . . . . . . . . . . . . . . . 5,336 —00000Members . . . . . . . . . . . . . . . . . . . . . . . . . . . . . . . . . . . . . . . . . . . . . . . . . . . . . . . . . . . . . . . . . . . . . . . . . . . . 269 —00000Interest on accounts receivable . . . . . . . . . . . . . . . . . . . . . . . . . . . . . . . . . . . . . . . . . . . . . . . . . . . . . . . . . . . 58 —00000Other . . . . . . . . . . . . . . . . . . . . . . . . . . . . . . . . . . . . . . . . . . . . . . . . . . . . . . . . . . . . . . . . . . . . . . . . . . . . . . . 74 337
Total contributions . . . . . . . . . . . . . . . . . . . . . . . . . . . . . . . . . . . . . . . . . . . . . . . . . . . . . . . . . . . . . . . . . 5,737 2,198
Total additions . . . . . . . . . . . . . . . . . . . . . . . . . . . . . . . . . . . . . . . . . . . . . . . . . . . . . . . . . . . . . . . . . . . . . 20,454 3,494
Deductions:College aid redemptions . . . . . . . . . . . . . . . . . . . . . . . . . . . . . . . . . . . . . . . . . . . . . . . . . . . . . . . . . . . . . . . . . . —00000 975Benefits paid:
Retirement allowances . . . . . . . . . . . . . . . . . . . . . . . . . . . . . . . . . . . . . . . . . . . . . . . . . . . . . . . . . . . . . . . . . 9,256 —00000Death benefits . . . . . . . . . . . . . . . . . . . . . . . . . . . . . . . . . . . . . . . . . . . . . . . . . . . . . . . . . . . . . . . . . . . . . . . . 194 —00000Other benefits . . . . . . . . . . . . . . . . . . . . . . . . . . . . . . . . . . . . . . . . . . . . . . . . . . . . . . . . . . . . . . . . . . . . . . . . 71 —00000
Administrative expenses . . . . . . . . . . . . . . . . . . . . . . . . . . . . . . . . . . . . . . . . . . . . . . . . . . . . . . . . . . . . . . . . . . 105 —00000Claims paid . . . . . . . . . . . . . . . . . . . . . . . . . . . . . . . . . . . . . . . . . . . . . . . . . . . . . . . . . . . . . . . . . . . . . . . . . . . . —00000 203
Total deductions . . . . . . . . . . . . . . . . . . . . . . . . . . . . . . . . . . . . . . . . . . . . . . . . . . . . . . . . . . . . . . . . . . . 9,626 1,178
Net increase . . . . . . . . . . . . . . . . . . . . . . . . . . . . . . . . . . . . . . . . . . . . . . . . . . . . . . . . . . . . . . . . . . . . . 10,828 2,316Net position restricted for pension benefits and other purposes at April 1, 2012, as restated . . . . . . . . . . 153,394 13,642
Net position restricted for pension benefits and other purposes at March 31, 2013 . . . . . . . . . . . . . . . . . . $ 164,222 $ 15,958
______________________________________________________________________________________________ STATE OF NEW YORK • 45
See accompanying notes to the basic financial statements.
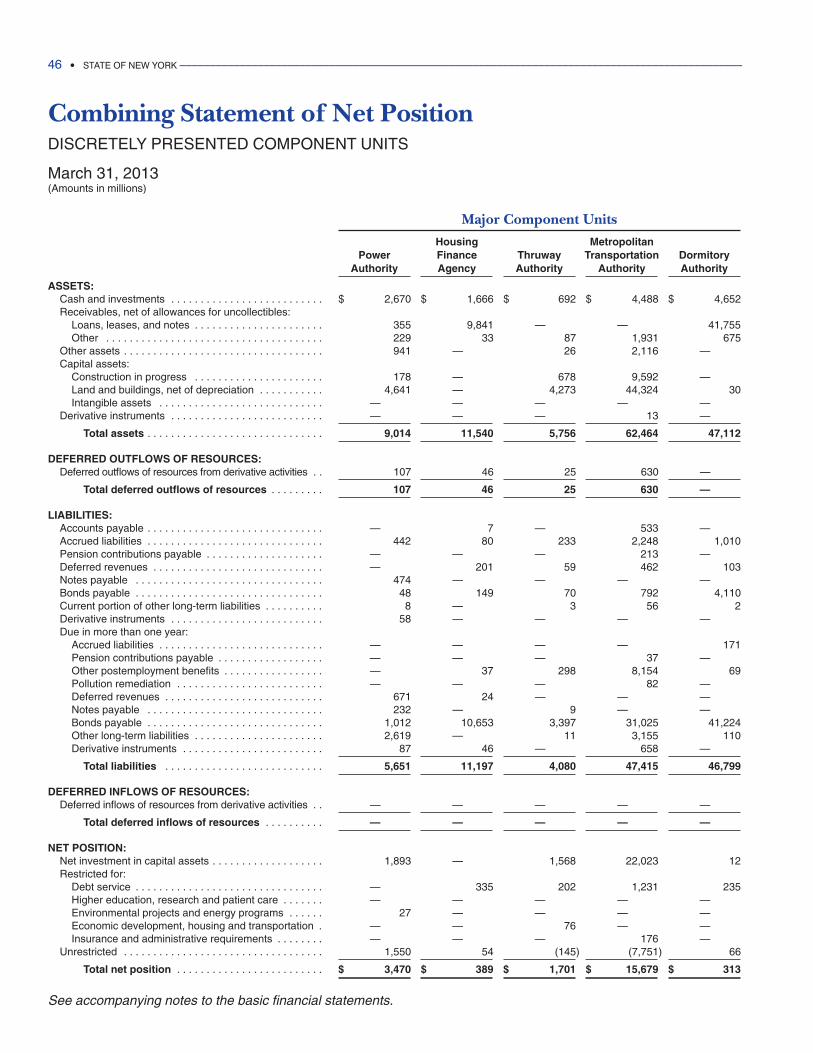
Combining Statement of Net PositionDISCRETELY PRESENTED COMPONENT UNITS
March 31, 2013(Amounts in millions)
Major Component Units
Housing MetropolitanPower Finance Thruway Transportation Dormitory
Authority Agency Authority Authority Authority
ASSETS:Cash and investments . . . . . . . . . . . . . . . . . . . . . . . . . . $ 2,670 $ 1,666 $ 692 $ 4,488 $ 4,652Receivables, net of allowances for uncollectibles:
Loans, leases, and notes . . . . . . . . . . . . . . . . . . . . . . 355 9,841 —00000 —00000 41,755Other . . . . . . . . . . . . . . . . . . . . . . . . . . . . . . . . . . . . . 229 33 87 1,931 675
Other assets . . . . . . . . . . . . . . . . . . . . . . . . . . . . . . . . . . 941 —00000 26 2,116 —00000Capital assets:
Construction in progress . . . . . . . . . . . . . . . . . . . . . . 178 —00000 678 9,592 —00000Land and buildings, net of depreciation . . . . . . . . . . . 4,641 —00000 4,273 44,324 30Intangible assets . . . . . . . . . . . . . . . . . . . . . . . . . . . . —00000 —00000 —00000 —00000 —00000
Derivative instruments . . . . . . . . . . . . . . . . . . . . . . . . . . —00000 —00000 —00000 13 —00000
Total assets . . . . . . . . . . . . . . . . . . . . . . . . . . . . . . 9,014 11,540 5,756 62,464 47,112
DEFERRED OUTFLOWS OF RESOURCES:Deferred outflows of resources from derivative activities . . 107 46 25 630 —00000
Total deferred outflows of resources . . . . . . . . . 107 46 25 630 —00000
LIABILITIES:Accounts payable . . . . . . . . . . . . . . . . . . . . . . . . . . . . . . —00000 7 —00000 533 —00000Accrued liabilities . . . . . . . . . . . . . . . . . . . . . . . . . . . . . . 442 80 233 2,248 1,010Pension contributions payable . . . . . . . . . . . . . . . . . . . . —00000 —00000 —00000 213 —00000Deferred revenues . . . . . . . . . . . . . . . . . . . . . . . . . . . . . —00000 201 59 462 103Notes payable . . . . . . . . . . . . . . . . . . . . . . . . . . . . . . . . 474 —00000 —00000 —00000 —00000Bonds payable . . . . . . . . . . . . . . . . . . . . . . . . . . . . . . . . 48 149 70 792 4,110Current portion of other long-term liabilities . . . . . . . . . . 8 —00000 3 56 2Derivative instruments . . . . . . . . . . . . . . . . . . . . . . . . . . 58 —00000 —00000 —00000 —00000Due in more than one year:
Accrued liabilities . . . . . . . . . . . . . . . . . . . . . . . . . . . . —00000 —00000 —00000 —00000 171Pension contributions payable . . . . . . . . . . . . . . . . . . —00000 —00000 —00000 37 —00000Other postemployment benefits . . . . . . . . . . . . . . . . . —00000 37 298 8,154 69Pollution remediation . . . . . . . . . . . . . . . . . . . . . . . . . —00000 —00000 —00000 82 —00000Deferred revenues . . . . . . . . . . . . . . . . . . . . . . . . . . . 671 24 —00000 —00000 —00000Notes payable . . . . . . . . . . . . . . . . . . . . . . . . . . . . . . 232 —00000 9 —00000 —00000Bonds payable . . . . . . . . . . . . . . . . . . . . . . . . . . . . . . 1,012 10,653 3,397 31,025 41,224Other long-term liabilities . . . . . . . . . . . . . . . . . . . . . . 2,619 —00000 11 3,155 110Derivative instruments . . . . . . . . . . . . . . . . . . . . . . . . 87 46 —00000 658 —00000
Total liabilities . . . . . . . . . . . . . . . . . . . . . . . . . . . 5,651 11,197 4,080 47,415 46,799
DEFERRED INFLOWS OF RESOURCES:Deferred inflows of resources from derivative activities . . —00000 —00000 —00000 —00000 —00000
Total deferred inflows of resources . . . . . . . . . . —00000 —00000 —00000 —00000 —00000
NET POSITION:Net investment in capital assets . . . . . . . . . . . . . . . . . . . 1,893 —00000 1,568 22,023 12Restricted for:
Debt service . . . . . . . . . . . . . . . . . . . . . . . . . . . . . . . . —00000 335 202 1,231 235Higher education, research and patient care . . . . . . . —00000 —00000 —00000 —00000 —00000Environmental projects and energy programs . . . . . . 27 —00000 —00000 —00000 —00000Economic development, housing and transportation . —00000 —00000 76 —00000 —00000Insurance and administrative requirements . . . . . . . . —00000 —00000 —00000 176 —00000
Unrestricted . . . . . . . . . . . . . . . . . . . . . . . . . . . . . . . . . . 1,550 54 (145) (7,751) 66
Total net position . . . . . . . . . . . . . . . . . . . . . . . . . $ 3,470 $ 389 $ 1,701 $ 15,679 $ 313
46 • STATE OF NEW YORK ______________________________________________________________________________________________
See accompanying notes to the basic financial statements.
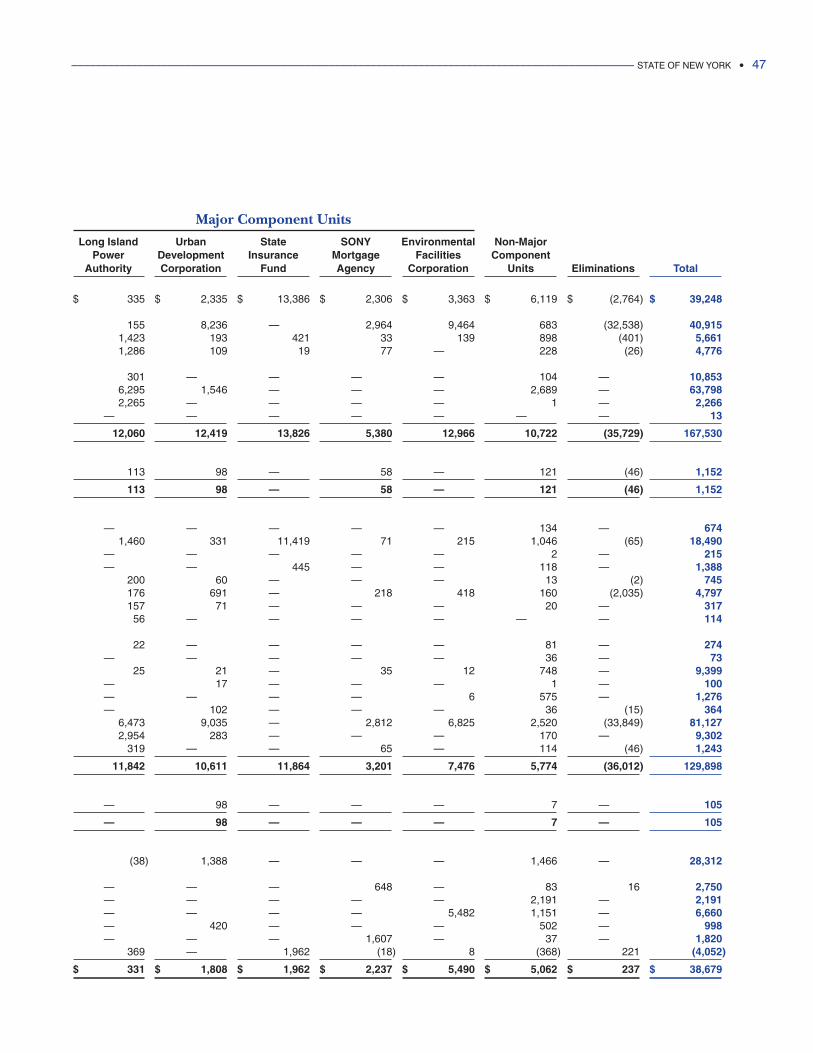
Major Component Units
Long Island Urban State SONY Environmental Non-MajorPower Development Insurance Mortgage Facilities Component
Authority Corporation Fund Agency Corporation Units Eliminations Total
$ 335 $ 2,335 $ 13,386 $ 2,306 $ 3,363 $ 6,119 $ (2,764) $ 39,248
155 8,236 —00000 2,964 9,464 683 (32,538) 40,9151,423 193 421 33 139 898 (401) 5,6611,286 109 19 77 —00000 228 (26) 4,776
301 —00000 —00000 —00000 —00000 104 —00000 10,8536,295 1,546 —00000 —00000 —00000 2,689 —00000 63,7982,265 —00000 —00000 —00000 —00000 1 —00000 2,266
—00000 —00000 —00000 —00000 —00000 —00000 —00000 13
12,060 12,419 13,826 5,380 12,966 10,722 (35,729) 167,530
113 98 —00000 58 —00000 121 (46) 1,152
113 98 —00000 58 —00000 121 (46) 1,152
—00000 —00000 —00000 —00000 —00000 134 —00000 6741,460 331 11,419 71 215 1,046 (65) 18,490
—00000 —00000 —00000 —00000 —00000 2 —00000 215—00000 —00000 445 —00000 —00000 118 —00000 1,388
200 60 —00000 —00000 —00000 13 (2) 745176 691 —00000 218 418 160 (2,035) 4,797157 71 —00000 —00000 —00000 20 —00000 31756 —00000 —00000 —00000 —00000 —00000 —00000 114
22 —00000 —00000 —00000 —00000 81 —00000 274—00000 —00000 —00000 —00000 —00000 36 —00000 73
25 21 —00000 35 12 748 —00000 9,399—00000 17 —00000 —00000 —00000 1 —00000 100—00000 —00000 —00000 —00000 6 575 —00000 1,276—00000 102 —00000 —00000 —00000 36 (15) 364
6,473 9,035 —00000 2,812 6,825 2,520 (33,849) 81,1272,954 283 —00000 —00000 —00000 170 —00000 9,302
319 —00000 —00000 65 —00000 114 (46) 1,243
11,842 10,611 11,864 3,201 7,476 5,774 (36,012) 129,898
—00000 98 —00000 —00000 —00000 7 —00000 105
—00000 98 —00000 —00000 —00000 7 —00000 105
(38) 1,388 —00000 —00000 —00000 1,466 —00000 28,312
—00000 —00000 —00000 648 —00000 83 16 2,750—00000 —00000 —00000 —00000 —00000 2,191 —00000 2,191—00000 —00000 —00000 —00000 5,482 1,151 —00000 6,660—00000 420 —00000 —00000 —00000 502 —00000 998—00000 —00000 —00000 1,607 —00000 37 —00000 1,820
369 —00000 1,962 (18) 8 (368) 221 (4,052)
$ 331 $ 1,808 $ 1,962 $ 2,237 $ 5,490 $ 5,062 $ 237 $ 38,679
______________________________________________________________________________________________ STATE OF NEW YORK • 47
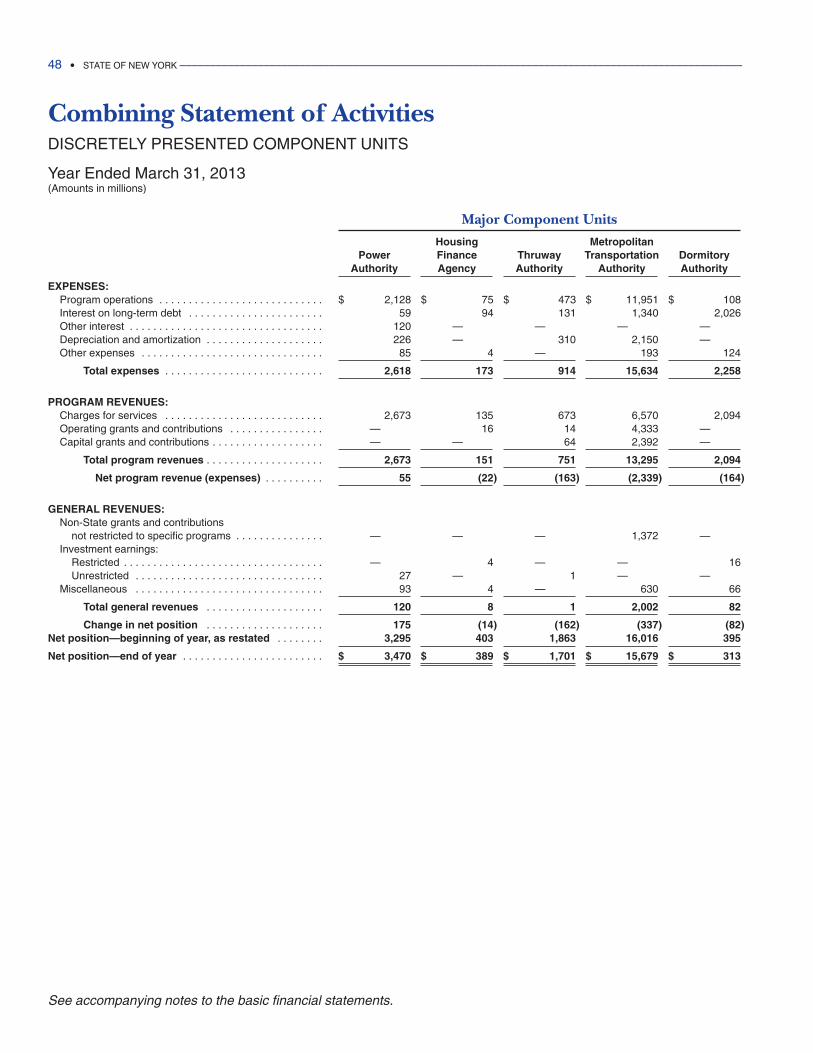
Combining Statement of ActivitiesDISCRETELY PRESENTED COMPONENT UNITS
Year Ended March 31, 2013(Amounts in millions)
Major Component Units
Housing MetropolitanPower Finance Thruway Transportation Dormitory
Authority Agency Authority Authority Authority
EXPENSES:Program operations . . . . . . . . . . . . . . . . . . . . . . . . . . . . $ 2,128 $ 75 $ 473 $ 11,951 $ 108Interest on long-term debt . . . . . . . . . . . . . . . . . . . . . . . 59 94 131 1,340 2,026Other interest . . . . . . . . . . . . . . . . . . . . . . . . . . . . . . . . . 120 —00000 —00000 —00000 —00000Depreciation and amortization . . . . . . . . . . . . . . . . . . . . 226 —00000 310 2,150 —00000Other expenses . . . . . . . . . . . . . . . . . . . . . . . . . . . . . . . 85 4 —00000 193 124
Total expenses . . . . . . . . . . . . . . . . . . . . . . . . . . . 2,618 173 914 15,634 2,258
PROGRAM REVENUES:Charges for services . . . . . . . . . . . . . . . . . . . . . . . . . . . 2,673 135 673 6,570 2,094Operating grants and contributions . . . . . . . . . . . . . . . . —00000 16 14 4,333 —00000Capital grants and contributions . . . . . . . . . . . . . . . . . . . —00000 —00000 64 2,392 —00000
Total program revenues . . . . . . . . . . . . . . . . . . . . 2,673 151 751 13,295 2,094
Net program revenue (expenses) . . . . . . . . . . 55 (22) (163) (2,339) (164)
GENERAL REVENUES:Non-State grants and contributions
not restricted to specific programs . . . . . . . . . . . . . . . —00000 —00000 —00000 1,372 —00000Investment earnings:
Restricted . . . . . . . . . . . . . . . . . . . . . . . . . . . . . . . . . . —00000 4 —00000 —00000 16Unrestricted . . . . . . . . . . . . . . . . . . . . . . . . . . . . . . . . 27 —00000 1 —00000 —00000
Miscellaneous . . . . . . . . . . . . . . . . . . . . . . . . . . . . . . . . 93 4 —00000 630 66
Total general revenues . . . . . . . . . . . . . . . . . . . . 120 8 1 2,002 82
Change in net position . . . . . . . . . . . . . . . . . . . . 175 (14) (162) (337) (82)Net position—beginning of year, as restated . . . . . . . . 3,295 403 1,863 16,016 395
Net position—end of year . . . . . . . . . . . . . . . . . . . . . . . . $ 3,470 $ 389 $ 1,701 $ 15,679 $ 313
48 • STATE OF NEW YORK ______________________________________________________________________________________________
See accompanying notes to the basic financial statements.
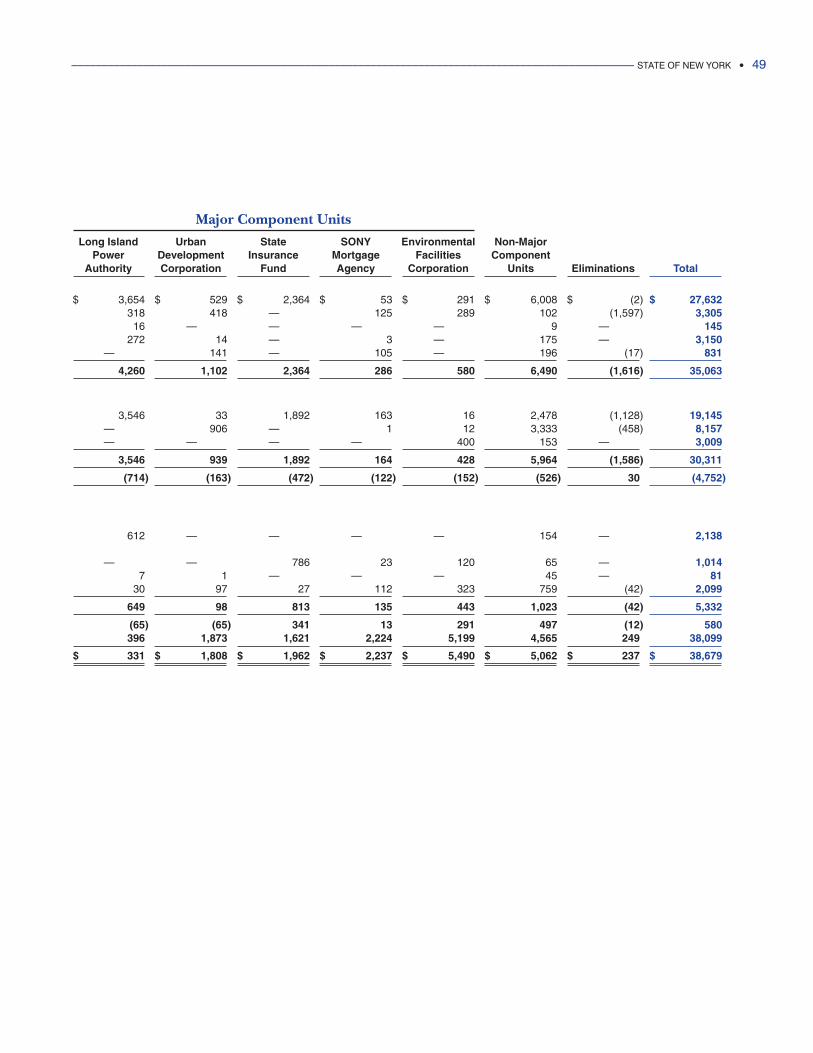
Major Component Units
Long Island Urban State SONY Environmental Non-MajorPower Development Insurance Mortgage Facilities Component
Authority Corporation Fund Agency Corporation Units Eliminations Total
$ 3,654 $ 529 $ 2,364 $ 53 $ 291 $ 6,008 $ (2) $ 27,632318 418 —00000 125 289 102 (1,597) 3,305
16 —00000 —00000 —00000 —00000 9 —00000 145272 14 —00000 3 —00000 175 —00000 3,150
—00000 141 —00000 105 —00000 196 (17) 831
4,260 1,102 2,364 286 580 6,490 (1,616) 35,063
3,546 33 1,892 163 16 2,478 (1,128) 19,145—00000 906 —00000 1 12 3,333 (458) 8,157—00000 —00000 —00000 —00000 400 153 —00000 3,009
3,546 939 1,892 164 428 5,964 (1,586) 30,311
(714) (163) (472) (122) (152) (526) 30 (4,752)
612 —00000 —00000 —00000 —00000 154 —00000 2,138
—00000 —00000 786 23 120 65 —00000 1,0147 1 —00000 —00000 —00000 45 —00000 81
30 97 27 112 323 759 (42) 2,099
649 98 813 135 443 1,023 (42) 5,332
(65) (65) 341 13 291 497 (12) 580396 1,873 1,621 2,224 5,199 4,565 249 38,099
$ 331 $ 1,808 $ 1,962 $ 2,237 $ 5,490 $ 5,062 $ 237 $ 38,679
______________________________________________________________________________________________ STATE OF NEW YORK • 49

______________________________________________________________________________________________ STATE OF NEW YORK • 51
The accompanying basic financial statements of theState of New York (State) have been prepared inconformity with generally accepted accountingprinciples (GAAP) for governments. Such principles areprescribed by the Governmental Accounting StandardsBoard (GASB), which is the standard-setting body forestablishing governmental accounting and financialreporting principles in the United States of America.
The basic financial statements have been preparedprimarily from accounts maintained by the State Comp-troller. Additional data has been derived from reportsprescribed by the State Comptroller and prepared byState departments, agencies, public benefit corpora-tions and other entities based on independent or sub-sidiary accounting systems maintained by them.
a. Reporting EntityThe basic financial statements include all funds of theprimary government, which is the State, as well as thecomponent units and other organizational entitiesdetermined to be included in the State’s financialreporting entity.
The decision to include a component unit in theState’s reporting entity is based on several criteria,including legal standing, fiscal dependency andfinancial accountability. Based on the application ofthese criteria, the following is a brief review of certainentities included in the State’s reporting entity.
Blended Component UnitsThe New York Local Government Assistance Cor-poration (LGAC) was created by Chapter 220 of theLaws of 1990. LGAC is administered by seven directorsconsisting of the State Comptroller and the Director ofthe Division of the Budget, serving ex-officio, and fivedirectors appointed by the Governor. LGAC was createdto issue long-term debt on behalf of the State to financecertain local assistance aid payments plus amountsnecessary to fund a capital reserve fund and otherissuance costs. LGAC is legally separate but providesservices exclusively to the State and therefore isreported as part of the primary government as ablended component unit.
The Tobacco Settlement Financing Corporation(TSFC) was created by Part D3 of Chapter 62 of theLaws of 2003. TSFC was created as a subsidiary of theState of New York Municipal Bond Bank Agency(Agency). The directors of the Agency are members ofTSFC. TSFC is governed by a seven member board,consisting of: the Chairman of the Agency, theSecretary of State, the Director of the Budget, the
State Comptroller or his appointee, and three directorsappointed by the Governor. TSFC was created to issuelong-term debt on behalf of the State to finance Stateoperations plus amounts necessary to fund a capitalreserve fund and other issuance costs. TSFC is legallyseparate but provides services exclusively to the Stateand therefore is reported as part of the primarygovernment as a blended component unit.
Discretely Presented Component UnitsThe public benefit corporations (Corporations) listedin Note 14 were established by State statute with fullcorporate powers. The Governor, with the approval ofthe State Senate, appoints most members of the boardof directors of most Corporations and either theGovernor or the board of directors selects the chairmanand chief executive officer. Corporations generallysubmit annual reports to the Governor, the Legislatureand the State Comptroller on their operations andfinances, accompanied by an independent auditors’report thereon. Corporations also submit to theGovernor and the Legislature annual budgetinformation on operations and capital construction.The State Comptroller is empowered to conductfinancial and management audits of the Corporations.Financial assistance was provided in the fiscal yearended March 31, 2013 to certain Corporations andsuch assistance is expected to be required in futureyears. Accordingly, the fiscal condition of the State isrelated to the fiscal stability of the Corporations. Sincethe Corporations are legally separate organizations forwhich the Governor and Legislature are financiallyaccountable, they are discretely presented as componentunits of the State.
Related Organizations and Joint VenturesThe State’s officials are also responsible for appointingthe members of the boards of various relatedorganizations (e.g., the Nassau County Interim FinanceAuthority), but the State’s accountability for theseorganizations does not extend beyond making theappointments. As discussed in more detail in Note 15,the State participates in several joint ventures but onlyreports on one due to materiality.
b. Government-Wide and Fund Financial Statements
The government-wide financial statements (i.e., theStatement of Net Position and the Statement ofActivities) report information on all of the non-fiduciary activities of the primary government and its
NOTES TO THE BASIC FINANCIAL STATEMENTSMarch 31, 2013
Note 1 Summary of Significant Accounting Policies
component units. For the most part, the effect ofinterfund activity within governmental and business-type activities has been eliminated from thesestatements. However, balances due and resource flowsbetween governmental and business-type activities havenot been eliminated. Governmental activities, whichnormally are supported by taxes and intergovernmentalrevenues, are reported separately from business-typeactivities, which rely to a significant extent on fees andcharges for support. Likewise, the primary governmentis reported separately from certain legally separatecomponent units for which the primary government isfinancially accountable.
The Statement of Activities demonstrates thedegree to which the direct expenses of a given functionor program are offset by program revenues. Directexpenses are those that are clearly identifiable with aspecific function or segment. Certain indirect costshave been allocated and are reported as direct programexpenses of individual functions or programs. Programrevenues include: charges to customers or applicantswho purchase, use, or directly benefit from goods,services, or privileges provided by a given function orsegment; grants and contributions that are restricted tomeeting the operational requirements of a particularfunction or segment; and capital grants and con-tributions, including special assessments. Internallydedicated resources are reported as general revenuesrather than as program revenues. Taxes and otheritems not included as program revenues are reportedas general revenues, as required.
Separate financial statements are provided forGovernmental Funds, Enterprise Funds and FiduciaryFunds, even though the latter are excluded from thegovernment-wide financial statements. Major individualGovernmental Funds and major individual EnterpriseFunds are reported as separate columns in the fundfinancial statements.
c. Measurement Focus, Basis of Accountingand Financial Statement Presentation
The government-wide financial statements are preparedusing the economic resources measurement focus andthe accrual basis of accounting, as are the EnterpriseFunds, Component Units and the Fiduciary Fundsfinancial statements. Revenues are recorded whenearned and expenses are recorded when a liability isincurred, regardless of the timing of related cash flows.Taxes are recognized as revenues in the year in whichthey are earned. Grants, entitlements and donations arerecognized as revenues as soon as all eligibilityrequirements have been met.
Governmental fund financial statements areprepared using the current financial resourcesmeasurement focus and the modified accrual basisof accounting. Revenues are recognized as soon asthey are both measurable and available. Revenues areconsidered available when they are collected within the
current period or collectible within 12 months of theend of the current fiscal period. Tax revenues arerecorded by the State as taxpayers earn income(personal income, general business and other taxes),as sales are made (consumption and use taxes) and asthe taxable event occurs (miscellaneous taxes), net ofestimated overpayments (refunds). Receivables notexpected to be collected within the next 12 months areoffset by deferred revenues. Expenditures and relatedliabilities are generally recorded in the accountingperiod the liability is incurred to the extent it isexpected to be paid within the next 12 months, withthe exception of items covered by GASB Interpretation6 (GASBI 6), Recognition and Measurement of CertainLiabilities and Expenditures in Governmental FundFinancial Statements. GASBI 6 modified the recognitioncriteria of certain expenditures and liabilities. GASBI6 requires that expenditures and liabilities such asdebt service, compensated absences, and claims andjudgments be recorded in the governmental fundstatements only when they mature or become due forpayment within the period. Expenditure-driven grantsare recognized as revenues when the qualifyingexpenditures have been incurred and all other grantrequirements have been met. Nonexchange grantsand subsidies, such as local assistance grants and publicbenefit corporation subsidies, are recognized asexpenditures when all requirements of the grantand/or subsidy have been satisfied.
Effective this reporting period is GASB StatementNo. 62, Codification of Accounting and Financial ReportingGuidance Contained in Pre-November 30, 1989 FASB andAICPA Pronouncements (GASBS 62). This statementbrings the authoritative accounting and financialreporting literature for state and local governmentstogether in a single source, with the FASB and AICPAguidance modified as necessary to appropriatelyrecognize the governmental environment and theneeds of governmental financial statement users.GASBS 62 will result in a more consistent application ofapplicable guidance in financial statements of stateand local governments. This statement also supersedesGASB Statement No. 20, Accounting and FinancialReporting for Proprietary Funds and Other GovernmentalEntities That Use Proprietary Fund Accounting, therebyeliminating the election provided in that Statement forenterprise funds and business-type activities to applypost-November 30, 1989 FASB Statements andInterpretations that do not conflict with or contradictGASB pronouncements. However, those entities cancontinue to apply, as other accounting literature, post-November 30, 1989 FASB pronouncements that donot conflict with or contradict GASB pronouncements,including this Statement.
In addition, the State Insurance Fund preparesfinancial statements in conformity with accountingpractices prescribed or permitted by the New York StateDepartment of Financial Services. The Department of
52 • Notes to Basic Financial Statements ____________________________________________________________________________
Financial Services recognizes only New York StatutoryAccounting Practices for determining and reportingthe financial condition and results of operations of aninsurance company and for determining its solvencyunder New York State Insurance Law.
The State reports the following major and othergovernmental funds:
General Fund—is the primary operating fund ofthe State and is used to account for all financialtransactions not required to be accounted for inanother fund.
Federal Special Revenue Fund—accounts for Federalgrants received by the State that are earmarked forspecific programs. In order to comply with Federalaccounting and reporting requirements, certainFederal grants are accounted for in a number ofaccounts that are combined and reported as theFederal Special Revenue Fund. Accounts that arecombined include the Federal USDA-Food andNutrition Services Account, the Federal Health andHuman Services Account, the Federal EducationAccount, the Federal Operating Grants Account, theUnemployment Insurance Administration Account,the Unemployment Insurance OccupationalTraining Account and the Federal Employmentand Training Grants Account.
General Debt Service Fund—accounts for thepayment of principal and interest on the State’sgeneral debt, the payments on certain lease/purchase or other contractual obligations, andtransactions related to the Tobacco SettlementFinancing Corporation.
Other Governmental Funds—is a summarization ofall the non-major governmental funds.
The governmental fund financial statementsinclude a reconciliation between the fund statementsand the government-wide statements. Differences thatmake a reconciliation necessary include the differingmeasurement focuses and bases of accounting betweenthe statements. The Statement of Activities reflects thenet costs of each major function of State operations,which differs from the presentation of expendituresin the Statement of Revenues, Expenditures andChanges in Fund Balances—Governmental Funds,which closely matches the State’s budgetary (financialplan) presentation.
The State reports the following major EnterpriseFunds:
Lottery Fund—accounts for lottery revenues thatare earmarked for education assistance to localschool districts, lottery administrative costs of theNew York State Gaming Commission and paymentof lottery prizes.
Unemployment Insurance Benefit Fund—accountsfor employer unemployment contributions utilizedfor the payment of unemployment compensationbenefits.
SUNY Fund—accounts for the operation of theState University of New York (SUNY). Informationreported in this fund is obtained from the auditedfinancial statements prepared by SUNY for thefiscal year ended June 30, 2012.
CUNY Fund—accounts for the operation of theCity University of New York (CUNY) SeniorColleges. Information reported in this fund isobtained from the audited financial statementsprepared by CUNY for the fiscal year ended June30, 2012.
Enterprise Funds distinguish operating revenuesand expenses from non-operating items. Operatingrevenues and expenses generally result from providingservices in connection with an Enterprise Fund’sprincipal ongoing operations. Operating expenses forEnterprise Funds include the cost of sales and services,administrative expenses and depreciation on capitalassets. All revenues and expenses not meeting thisdefinition are reported as non-operating revenuesand expenses.
Fiduciary Funds are used to report assets held in atrustee or agency capacity for others and thereforecannot be used to support the government’s ownprograms. The Fiduciary Fund types of the State consistof the following:
Pension Trust Fund—accounts for the activities ofthe New York State and Local Retirement System,which accumulates resources for pension benefitpayments to qualified public employees.
Private Purpose Trust Funds—are used to accountfor resources legally held in trust as escheatproperty and resources held in trust to facilitatesavings for higher education expenses, pursuantto the New York State tuition savings program.There is no requirement that any portion of theseresources be preserved as capital. Informationreported for the tuition savings program isobtained from the audited financial statementsprepared by the program for the fiscal year endedDecember 31, 2012.
Agency Funds—report those resources held by theState in a purely custodial capacity (assets equalliabilities).
Additionally, the State includes discretely presentedcomponent units:
Component Units—the public benefit corporations’financial statements, except for the State InsuranceFund, are prepared using the economic resourcesmeasurement focus and are accounted for on theaccrual basis of accounting.
______________________________________________________________________________________________ STATE OF NEW YORK • 53
d. Cash and InvestmentsCash balances of funds held in the State Treasury arecommingled in a general checking account and severalspecial purpose bank accounts. The available cashbalance in the general checking account beyondimmediate need is pooled for short-term investmentpurposes. The balances pooled are limited to legallystipulated investments, which are reported at cost,including accrued interest, which approximates fairvalue. Non-interest-bearing compensating balances of$2.3 billion are included in cash and investments atMarch 31, 2013. At various times during the year,compensating balances could be substantially higher.Cash balances not held in the State Treasury andcontrolled by various State officials are generallydeposited in interest-bearing accounts or other legallystipulated investments. Additional information aboutthe State’s cash and investments is provided in Note 2.
Generally, for purposes of reporting cash flows,cash includes cash and cash equivalents. Cash equiva-lents are composed of liquid assets with maturities of 90days or less. The Enterprise Funds Statement of CashFlows uses the direct method of reporting cash flows.
All investments with a maturity of more than ayear are recorded on the Statement of Net Position andthe balance sheet at fair value and all investmentincome, including changes in the fair value ofinvestments, is reported as revenue. Investments ofthe short-term investment pool have a maturity of oneyear or less and are recorded at cost. Fair values weredetermined using market values at the applicableentities’ year-end.
e. ReceivablesReceivables are stated net of estimated allowances foruncollectible amounts, which are determined basedupon past collection experience and current economicconditions. Due from Federal government representsamounts owed to the State to reimburse it forexpenditures incurred pursuant to federally fundedprograms. Other receivables represent amounts owedto the State, including lottery revenues, Medicaid drugrebates, student loans, tobacco settlements, and patientfees of SUNY and Health Department hospitals andvarious mental hygiene facilities. Additional informationabout receivables is provided in Note 4.
f. Internal BalancesAll outstanding balances between funds at the end ofthe fiscal year are referred to as “due to/from otherfunds” on the governmental fund financial statements.Generally, the effect of interfund activity within thegovernmental funds has been removed. Any residualbalances outstanding between the governmentalactivities and business-type activities are reported in thegovernment-wide financial statements as “internalbalances.” For the most part, the remaining difference
is a result of different year-ends between the State andSUNY and CUNY.
g. Other AssetsOther assets in governmental activities includepayments for costs applicable to future accountingperiods, and other types of assets not reported onother lines. Inventories reported by the governmentalfunds are recorded as expenditures when they arepurchased. Inventories reported by the EnterpriseFunds are valued at cost using the first-in/first-out(FIFO) method.
h. Capital AssetsCapital assets are reported in the government-wideStatement of Net Position and further disclosed inNote 5. Capital assets include: land in urban centers,rural areas and forest preserves; land improvements;land preparation-roads; buildings which house Stateoffices, correctional facilities, hospitals and educationalfacilities; equipment used in construction work, hos-pitals, offices, etc.; construction in progress; intangibleassets (i.e., easements and internally generatedsoftware); and infrastructure assets such as roads andbridges. Capital assets are reported at historical cost orestimated historical cost and donated capital assetsare valued at their estimated fair market value at thedate of donation.
Equipment that has a cost in excess of $40 thousandat the date of acquisition and has an expected useful lifeof two or more years is capitalized. All initial buildingcosts and building improvements and land and landimprovements in excess of $100 thousand are cap-italized. Infrastructure assets in excess of $1 millionare also capitalized. Software is capitalized when thecosts exceed $1 million. The State chose the option inGASBS No. 34, Basic Financial Statements—and Man-agement’s Discussion and Analysis—for State and LocalGovernments, of not recording non-major infrastructureassets at transition except for Department of Trans-portation (DOT) infrastructure assets. Therefore, non-DOT infrastructure assets acquired prior to April 1,2002 were deemed to be non-major relative to totalinfrastructure and are not reported. However, pros-pective reporting of non-DOT depreciable infrastructureacquired subsequent to April 1, 2002 is included inthe capital asset balances at March 31, 2013.
The costs of normal repairs and maintenance thatdo not add to the value or extend lives of assetsmaterially are not capitalized, but are reported asexpenses in the year incurred. Expenses relating toroads and bridges that add to the capacity andefficiency of the road and bridge networks are notexpensed but are capitalized. All maintenance andpreservation costs relating to roads and bridges will beexpensed and not capitalized.
54 • Notes to Basic Financial Statements ____________________________________________________________________________
Buildings, land improvements, equipment andintangible assets of the primary government aredepreciated or amortized using the straight-line methodover the following estimated useful lives:
Governmental Business-typeActivities Activities
Assets (Years) (Years)
Buildings and building improvements . . . . . . . . . 12-60 3-50
Equipment and vehicles . . . 4-30 3-50Land improvements . . . . . . 12-30 3-50Intangibles—easements . . . 20 3-50Intangibles—computer
software . . . . . . . . . . . . . 10-12 3-50
Land preparation reflects the costs of preparing theland for the construction of roads. Since landpreparation has an indefinite life, associated costs arenot depreciated.
The State has elected to use the modified approachfor reporting and accounting for its highways andbridges reported by DOT. The modified approachrequires the State to commit to preser ving andmaintaining these infrastructure assets at levelsestablished by DOT. No depreciation expense isreported for these assets and no amounts are capitalizedin connection with improvements that lengthen thelives of such assets, unless the improvements alsoincrease their service potential. DOT maintains aninventory of these assets and performs periodiccondition assessments to ensure that the predeterminedcondition level is maintained. Refer to the RequiredSupplementary Information (RSI) for additionalinformation regarding infrastructure using themodified approach.
Capital asset reporting does not include historicalartifacts, artwork and collections that are maintained byvarious State agencies, the State Archives, State Museumand State Library. These items are protected andpreserved, held for public exhibition and educationalpurposes, and the proceeds from the sale of items areused to acquire new items for the collection.
Capital assets in business-type activities andEnterprise Funds are from SUNY and CUNY. Thesecapital assets are stated at cost, or in the case of gifts, fairvalue at the date of receipt. SUNY capitalizes buildingrenovations and additions costing over $100 thousand,equipment items with a unit cost of $5 thousand ormore, intangible assets for internally generatedcomputer software costing $1 million or more andother intangible assets costing over $100 thousand.SUNY reports all artwork, historical treasures andlibrary books. CUNY capitalizes renovations andimprovements that significantly increase the value orextends the useful lives of the structures and equipmentwith a cost of more than $5 thousand and useful lives oftwo or more years. CUNY reports intangible assets,
artwork, historical treasures and library books with aunit cost of more than $5 thousand. SUNY and CUNYcapital assets, with the exception of land, constructionin progress and works of art and historical treasures, aredepreciated or amortized on a straight-line basis overtheir estimated useful lives ranging from 3 to 50 years.
i. Long-Term ObligationsIn the government-wide financial statements andEnterprise Funds financial statements, long-term debtand other long-term obligations are reported asliabilities in the applicable governmental activities’ orbusiness-type activities’ Statement of Net Position.Bond premiums, discounts, issuance costs and deferredlosses on refunding are deferred and amortized overthe life of the bonds using the straight-line method forgovernmental activities.
In the fund financial statements, governmentalfund types recognize bond premiums and discounts, aswell as bond issuance costs, during the current period.The face amount of debt issued is reported as otherfinancing sources. Premiums received on debt issuancesare reported as other financing sources, while discountson debt issuances are reported as other financing uses.Issuance costs, whether or not withheld from the actualdebt proceeds received, are reported as non-personalservice expenditures.
j. Compensated AbsencesThe estimated vacation leave liability for Stateemployees at March 31, 2013 is $905 million andrepresents an increase of $44 million over the prioryear. State employees accrue vacation leave basedprimarily on the number of years employed up to amaximum rate of 25 days per year, but may accumulateno more than a maximum of 40 days.
SUNY employees accrue vacation leave basedprimarily on the number of years employed up to amaximum rate of 21 days per year and may accumulateno more than a maximum of 40 days. CUNY employeesaccrue vacation leave based upon the number of yearsemployed, with the maximum accumulation generallyranging from 45 to 50 days. The liability for vacationleave approximated $261 million and $72 million forSUNY and CUNY, respectively, at June 30, 2012.
CUNY employees may receive payments of up to 50percent of the value of their accumulated sick leave asof the date of retirement from CUNY. CUNY reporteda liability of $24 million for sick leave credits in accruedliabilities as of June 30, 2012.
Lottery’s employees, upon termination, may receivevacation pay benefits up to a maximum of 30 days.Lottery recognizes employees’ compensated absencebenefits when earned. The liability for employees’compensated absences was approximately $1.9 millionas of March 31, 2013.
______________________________________________________________________________________________ STATE OF NEW YORK • 55
k. Accounting for Lease/Purchase and Other Financing Arrangements
The construction of certain State office buildings,campus facilities and other public facilities has beenfinanced through bonds and notes issued by publicbenefit corporations pursuant to lease/purchase andother financing arrangements with the State. The Statehas also entered into financing arrangements withpublic benefit corporations that have issued bonds tofinance past State budgetary deficits and grants tolocal governments for both capital and operatingpurposes (see Note 7).
These lease/purchase and other financing arrange-ments, which the State will repay over the duration ofthe agreements, constitute long-term liabilities. Theamount included in obligations under lease/purchaseand other financing arrangements consists of totalfuture principal payments and equals the outstandingbalance of the related bonds and notes. Reportingrelative to capitalized interest is not included for leasedcapital assets.
l. State LotteryThe State Lottery is accounted for within an EnterpriseFund. The revenues, administrative costs, aid toeducation and expenses for amounts allocated to prizesare reported, and uncollected ticket sales at March 31,2013 are accrued. Prize monies to meet long-term prizepayments are invested in United States government-backed obligations, New York City Transitional FinanceAuthority municipal bonds and Agency for InternationalDevelopment (AID) Bonds, and are recorded at fairvalue. Lottery prize liabilities are recorded at a dis-counted value equivalent to the related investments. AtMarch 31, 2013, the prize liabilities of approximately$2.3 billion were reported at a discounted value ofapproximately $1.5 billion (at interest rates rangingfrom 0.02 percent to 8.49 percent).
m. Net PositionNet position is reported as restricted when constraintsplaced on net position use are either:
a. Externally imposed by creditors (such as debtcovenants), grantors, contributors, laws orregulations of other governments; or
b. Imposed by law through constitutional provisionsor enabling legislation.
Enabling legislation authorizes the State to assess,levy, charge or otherwise mandate payment of resources(from resource providers) and includes a legallyenforceable requirement that those resources be usedonly for the specific purposes stipulated in thelegislation. A legally enforceable requirement is onethat an outside party (such as citizens, public interestgroups or the judiciary) can compel the government to
honor. When both restricted and unrestricted resourcesare available for use, it is the State’s policy to userestricted resources first, then unrestricted resources asthey are needed.
At March 31, 2013, the Governmental Activitiesreported restricted net position of $3.5 billion due torestrictions externally imposed by creditors or enablinglegislation. This included $2.5 billion restricted fordebt service payments from various capital reservefunds, and $981 million restricted for other governmentprograms (details of fund balance classification areavailable in section n of Note 1).
The following terms are used in the reporting ofnet position:
Net Investment in Capital AssetsNet investment in capital assets consists of capital assets,including restricted capital assets, net of accumulateddepreciation and reduced by the outstanding balancesof any bonds, mortgages, notes, or other borrowingsthat are attributable to the acquisition, construction, orimprovement of those assets.
Debt ServiceNet position restricted for the payment of future debtservice payments from various capital reserve funds.
Higher Education, Research and Patient CareNet position restricted for funding of various highereducation instruction, research, scholarships, andoperations, as well as medical research and patient care.
Environmental Projects and Energy ProgramsNet position restricted for funding of various environ-mental projects and energy programs.
Economic Development, Housing and TransportationNet position restricted for funding of various economicdevelopment, housing-related and transportation-related programs.
Insurance and Administrative RequirementsNet position restricted for funding certain insurancepayments and administrative costs.
Future Lottery PrizesNet position restricted for future lottery prize payments.
Other Government ProgramsNet position restricted for the funding of various masstransportation projects, environmental remediationprojects, and various other legally restricted funds.
Unrestricted Net PositionUnrestricted net position is the net amount of the assets,deferred outflows of resources, liabilities, and deferredinflows of resources that are not included in thedetermination of net investment in capital assets or therestricted components of net position described above.
56 • Notes to Basic Financial Statements ____________________________________________________________________________
n. Fund BalanceThe difference between fund assets and deferredoutflows of resources, and liabilities and deferredinflows of resources is “Net Position” on government-wide, proprietary fund, component units and fiduciaryfund financial statements and “Fund Balance” ongovernmental fund financial statements.
Fund Balance HierarchyFund balance for governmental funds is reported in thefollowing classifications which describe the relativestrength of the constraints that control how specificamounts in the funds can be spent:
The nonspendable fund balance includes amountsthat cannot be spent because (a) they are either notin spendable form or (b) are legally or contractuallyrequired to remain intact.
Restricted fund balances have constraints placed onthe use of resources that are either (a) externallyimposed by creditors, grantors, contributors, orlaws or regulations of other governments; or (b)imposed by law through constitutional provisionsor enabling legislation.
Committed fund balances can only be used forspecific purposes pursuant to constraints imposed byformal action of the State’s highest level of decision-making authority, which includes establishmentof laws of the State, and by bills passed by theLegislature and approved by the Governor of theState of New York, or any contracts approved byauthorized State Officials that are known to havetheir liability satisfied with the current fund balance.Commitments may be changed or lifted only bythe State’s highest level of decision-making authoritytaking the same formal action that originallyimposed the constraint.
Assigned fund balances are constrained by theintent to use amounts for specific purposes, but areneither restricted nor committed. The Directorof the Budget is authorized to assign amounts to aspecific purpose through the approval of budgetcertificates as required by statute.
Unassigned fund balance is the residual classifi-cation for the General Fund. Other governmentalfunds cannot report a positive unassigned fundbalance but can report negative unassigned fundbalance if expenditures incurred for specific pur-poses exceed the amounts restricted or committedto those purposes.
For classification of governmental fund balances,the State considers expenditures to be made from themost restricted resources first, then in the followingorder: committed, assigned, and unassigned resources.
Reserve Accounts
Tax Stabilization Reserve AccountThe authority for establishing the Tax StabilizationReserve Account is in State Finance Law Section 92.The account was established in 1984.
At the close of each fiscal year, any surplus funds upto 0.2 percent of one percent of the “norm” shall betransferred to the Tax Stabilization Reserve Account, upto 2 percent of the “norm”. The norm is the aggregateamount disbursed from the State Purposes Accountduring the fiscal year.
In any given fiscal year, when receipts fall belowthe norm, funds shall be transferred from the TaxStabilization Reserve Account to the State PurposesAccount, in an amount equal to the difference betweenthe norm and the receipts, to the extent that funds areavailable in the Tax Stabilization Reserve Account.Money in the Tax Stabilization Reserve Account may betemporarily loaned to the State Purposes Accountduring the year in anticipation of the receipt ofrevenues, but these funds must be repaid within thesame fiscal year.
The balance in the Tax Stabilization ReserveAccount at March 31, 2013 is $1.1 billion, and isincluded in the unassigned fund balance of theGeneral Fund.
Rainy Day Reserve AccountThe authority for establishing the Rainy Day ReserveAccount is in State Finance Law Section 92-cc. Theaccount was established in 2007.
Funds deposited to this account are transferredfrom the State Purposes Account. The maximumbalance in this account will not exceed 3 percent of theaggregate amount projected to be disbursed fromthe State Purposes Account during the fiscal yearimmediately following the current fiscal year.
The amounts in this account can be spent for tworeasons:
a. In the event of an economic downturn, asevidenced by a composite index of businesscycle indicators prepared by the Commissionerof Labor. If the index declines for five con-secutive months, the Commissioner of Laborshall notify the Governor, the Speaker of theAssembly, the Temporary President of theSenate and the minority leaders of the Assemblyand the Senate. Upon such notification, theDirector of Budget may authorize the Comp-troller to transfer funds from the Rainy DayReserve Account.
b. A catastrophic event, i.e. the need to repelinvasion, suppress insurrection, defend theState in war, or to respond to any other emer-gency resulting from a disaster, including butnot limited to a disaster caused by an act ofterrorism.
______________________________________________________________________________________________ STATE OF NEW YORK • 57
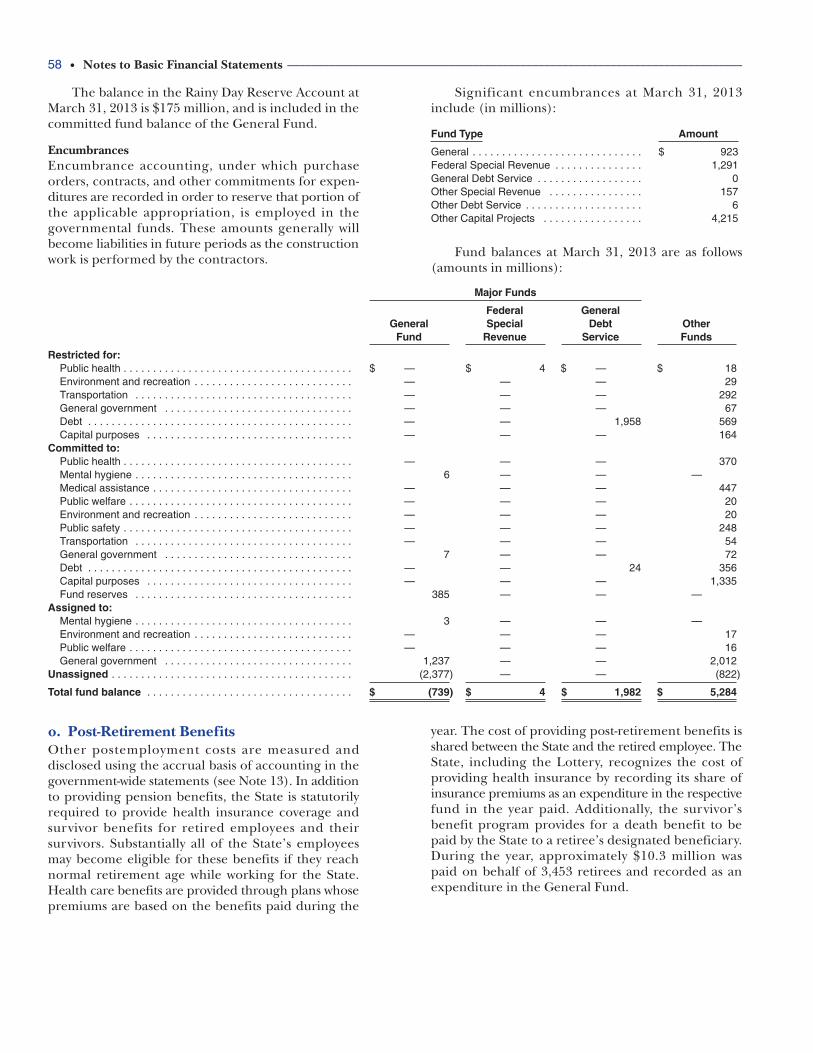
o. Post-Retirement BenefitsOther postemployment costs are measured anddisclosed using the accrual basis of accounting in thegovernment-wide statements (see Note 13). In additionto providing pension benefits, the State is statutorilyrequired to provide health insurance coverage andsurvivor benefits for retired employees and theirsurvivors. Substantially all of the State’s employeesmay become eligible for these benefits if they reachnormal retirement age while working for the State.Health care benefits are provided through plans whosepremiums are based on the benefits paid during the
year. The cost of providing post-retirement benefits isshared between the State and the retired employee. TheState, including the Lottery, recognizes the cost ofproviding health insurance by recording its share ofinsurance premiums as an expenditure in the respectivefund in the year paid. Additionally, the survivor’sbenefit program provides for a death benefit to bepaid by the State to a retiree’s designated beneficiary.During the year, approximately $10.3 million waspaid on behalf of 3,453 retirees and recorded as anexpenditure in the General Fund.
The balance in the Rainy Day Reserve Account atMarch 31, 2013 is $175 million, and is included in thecommitted fund balance of the General Fund.
EncumbrancesEncumbrance accounting, under which purchaseorders, contracts, and other commitments for expen-ditures are recorded in order to reserve that portion ofthe applicable appropriation, is employed in thegovernmental funds. These amounts generally willbecome liabilities in future periods as the constructionwork is performed by the contractors.
Significant encumbrances at March 31, 2013include (in millions):
Fund Type Amount
General . . . . . . . . . . . . . . . . . . . . . . . . . . . . . $ 923Federal Special Revenue . . . . . . . . . . . . . . . 1,291General Debt Service . . . . . . . . . . . . . . . . . . 0Other Special Revenue . . . . . . . . . . . . . . . . 157Other Debt Service . . . . . . . . . . . . . . . . . . . . 6Other Capital Projects . . . . . . . . . . . . . . . . . 4,215
Fund balances at March 31, 2013 are as follows(amounts in millions):
58 • Notes to Basic Financial Statements ____________________________________________________________________________
Major Funds
Federal GeneralGeneral Special Debt Other
Fund Revenue Service Funds
Restricted for:Public health . . . . . . . . . . . . . . . . . . . . . . . . . . . . . . . . . . . . . . . $ —0 0 000 $ 4 $ —0 0 000 $ 18Environment and recreation . . . . . . . . . . . . . . . . . . . . . . . . . . . —0 0 000 —0 0 000 —0 0 000 29Transportation . . . . . . . . . . . . . . . . . . . . . . . . . . . . . . . . . . . . . —0 0 000 —0 0 000 —0 0 000 292General government . . . . . . . . . . . . . . . . . . . . . . . . . . . . . . . . —0 0 000 —0 0 000 —0 0 000 67Debt . . . . . . . . . . . . . . . . . . . . . . . . . . . . . . . . . . . . . . . . . . . . . —0 0 000 —0 0 000 1,958 569Capital purposes . . . . . . . . . . . . . . . . . . . . . . . . . . . . . . . . . . . —0 0 000 —0 0 000 —0 0 000 164
Committed to:Public health . . . . . . . . . . . . . . . . . . . . . . . . . . . . . . . . . . . . . . . —0 0 000 —0 0 000 —0 0 000 370Mental hygiene . . . . . . . . . . . . . . . . . . . . . . . . . . . . . . . . . . . . . 6 —0 0 000 —0 0 000 —0 0 000Medical assistance . . . . . . . . . . . . . . . . . . . . . . . . . . . . . . . . . . —0 0 000 —0 0 000 —0 0 000 447Public welfare . . . . . . . . . . . . . . . . . . . . . . . . . . . . . . . . . . . . . . —0 0 000 —0 0 000 —0 0 000 20Environment and recreation . . . . . . . . . . . . . . . . . . . . . . . . . . . —0 0 000 —0 0 000 —0 0 000 20Public safety . . . . . . . . . . . . . . . . . . . . . . . . . . . . . . . . . . . . . . . —0 0 000 —0 0 000 —0 0 000 248Transportation . . . . . . . . . . . . . . . . . . . . . . . . . . . . . . . . . . . . . —0 0 000 —0 0 000 —0 0 000 54General government . . . . . . . . . . . . . . . . . . . . . . . . . . . . . . . . 7 —0 0 000 —0 0 000 72Debt . . . . . . . . . . . . . . . . . . . . . . . . . . . . . . . . . . . . . . . . . . . . . —0 0 000 —0 0 000 24 356Capital purposes . . . . . . . . . . . . . . . . . . . . . . . . . . . . . . . . . . . —0 0 000 —0 0 000 —0 0 000 1,335Fund reserves . . . . . . . . . . . . . . . . . . . . . . . . . . . . . . . . . . . . . 385 —0 0 000 —0 0 000 —0 0 000
Assigned to:Mental hygiene . . . . . . . . . . . . . . . . . . . . . . . . . . . . . . . . . . . . . 3 —0 0 000 —0 0 000 —0 0 000Environment and recreation . . . . . . . . . . . . . . . . . . . . . . . . . . . —0 0 000 —0 0 000 —0 0 000 17Public welfare . . . . . . . . . . . . . . . . . . . . . . . . . . . . . . . . . . . . . . —0 0 000 —0 0 000 —0 0 000 16General government . . . . . . . . . . . . . . . . . . . . . . . . . . . . . . . . 1,237 —0 0 000 —0 0 000 2,012
Unassigned . . . . . . . . . . . . . . . . . . . . . . . . . . . . . . . . . . . . . . . . . (2,377) —0 0 000 —0 0 000 (822)
Total fund balance . . . . . . . . . . . . . . . . . . . . . . . . . . . . . . . . . . . $ (739) $ 4 $ 1,982 $ 5,284
______________________________________________________________________________________________ STATE OF NEW YORK • 59
p. Deficit Fund BalancesAs of March 31, 2013, fund deficits were reported in thefollowing Capital Projects Funds: the DedicatedHighway and Bridge Trust Fund ($297 million), theHazardous Waste Remedial Fund ($115 million), andthe Housing Program Fund ($110 million). The deficitsrelated to the Capital Projects Funds are the result ofdifferences in cash flow timing relating to the reim-bursement of capital project costs and contractualcommitments from bond proceeds, and are routinelyresolved during subsequent fiscal years. The ENCONSpecial Revenue Fund ($34 million) and the MassTransportation Operating Assistance Fund ($87million), both of which are Special Revenue Funds, alsohad fund deficits. The deficits are the result of timingdifferences between the receipt of cash and the transferof funds to finance operating expenditures.
q. EstimatesThe preparation of the basic financial statements inconformity with GAAP requires management to makeestimates and assumptions that affect the reportedamounts of assets, deferred outflows of resources,liabilities and deferred inflows of resources, anddisclosure of contingent assets and liabilities at thedate of the basic financial statements. Estimates alsoaffect the reported amounts of revenues and expen-ditures during the reporting period. Actual resultscould differ from those estimates.
r. Adoption of New Accounting Pronouncements
During the fiscal year ended March 31, 2013, the Stateadopted the following new accounting standards issuedby the GASB:
GASBS No. 57, OPEB Measurements by AgentEmployers and Agent Multiple-Employer Plans, (GASBS57) amends GASBS No. 45, Accounting andFinancial Reporting by Employers for PostemploymentBenefits Other Than Pensions, and GASBS No. 43,Financial Reporting for Postemployment Benefit PlansOther Than Pension Plans. GASBS 57 clarifiesactuarially determined OPEB measures reported byan agent multiple-employer OPEB plan and itsparticipating employers. Those measures should bedetermined by a common date and at a minimumfrequency to satisfy the agent multiple-employerOPEB plan’s financial reporting requirement.Adoption of GASBS 57 did not require modifi-cation to the financial statements.
GASBS No. 60, Accounting and Financial Reporting forService Concession Arrangements (SCAs), (GASBS 60)establishes recognition, measurement and disclo-sure requirements for SCAs for both transferorsand governmental operators. GASBS 60 requiresgovernments to account for and report SCAs in thesame manner, which improves the comparabilityof financial statements. The implementation ofGASBS 60 did not have an impact on the financialstatements.
GASBS No. 62, Codification of Accounting and FinancialReporting Guidance Contained in Pre-November 30, 1989FASB and AICPA (American Institute of Certified PublicAccountants) Pronouncements, (GASBS 62) improvesfinancial reporting by incorporating into the GASB’sauthoritative literature certain accounting andfinancial reporting guidance that is included inFASB and AICPA pronouncements issued on orbefore November 30, 1989, which does not conflictor contradict GASB pronouncements. GASBS 62superseded GASBS No. 20, Accounting and FinancialReporting for Proprietary Funds and Other GovernmentalEntities That Use Proprietary Fund Accounting. Adoptionof GASBS 62 did not require modification to thefinancial statements.
GASBS No. 63, Financial Reporting of DeferredOutflows of Resources, Deferred Inflows of Resources,and Net Position, (GASBS 63) provides guidancefor reporting deferred outflows of resources,deferred inflows of resources, and net position ina statement of financial position. Amounts requiredto be reported as deferred outflows of resourcesshould be reported in a statement of financialposition in a separate section following assets.Similarly, amounts required to be reported asdeferred inflows of resources should be reportedin a separate section following liabilities. Thestatement of net position should report the residualamount as net position, rather than net assets.The provisions of GASBS 63 required thesechanges and replaces the statement of net assetswith the statement of net position for accrual basisfinancial statements.
GASBS No. 64, Derivative Instruments: Application ofHedge Accounting Termination Provisions, (GASBS 64)clarifies the circumstances in which hedge account-ing continues to be applied when a swap coun-terparty, or a swap counterparty’s credit supportprovider, is replaced. Adoption of GASBS 64 didnot require modification to the financial statements.
s. RestatementsDuring the fiscal year ended March 31, 2013, the Statemade a change in accounting principle related to thepresentation of liabilities in the Abandoned PropertyTrust Fund which is included in the Private PurposeTrust Fund financial statements. This necessitated a
restatement of beginning net position in the AbandonedProperty Trust Fund as follows (amounts in millions):
Net position at March 31, 2012 . . . . . . . . . . . $ —0 0 000Claimant liability . . . . . . . . . . . . . . . . . . . . . . 1,542
Total net position at April 1, 2012 . . . . . $ 1,542
60 • Notes to Basic Financial Statements ____________________________________________________________________________
Note 2 Cash and InvestmentsInformation on cash and investments of the PensionTrust Fund is presented in Note 12.
Governmental Activities, Private Purpose and Agency FundsDepositsThe State maintains approximately 3,000 bank accountsfor various purposes at locations throughout the State.Cash deposits in the State Treasury are under the jointcustody of the State Comptroller and the Commissionerof Taxation and Finance. Cash balances not required forimmediate use are invested in a short-term investmentpool (STIP) administered by the State Comptroller orby the fund custodian to maximize interest earnings.Cash is invested in repurchase agreements involvingUnited States Treasury obligations, United States Trea-sury bills, commercial paper, government sponsoredagencies, and certificates of deposit. Cash deposits notheld in the State Treasury are under the sole custody ofa specified State official and are generally held ininterest-bearing accounts. Both the State Comptrollerand the Commissioner of Taxation and Finance aresole custodians of certain accounts.
The custodial credit risk is the risk that, in theevent of the failure of a depository financial institution,the State will not be able to recover deposits or will notbe able to recover collateral securities that are in thepossession of an outside party.
For demand accounts, checking accounts andcertificates of deposit, the State requires that itsdepository banks pledge collateral or provide a suretybond based on actual and average daily available bankbalances. All securities pledged as collateral are held bythe State’s fiscal agent in the name of the State and arevalued on a monthly basis. Surety bonds will be acceptedonly from AAA rated insurance companies. The use
of average daily available balances to determinecollateral requirements may result in the availablebalances being under-collateralized at various timesduring the fiscal year. The State’s cash managementpolicy is to invest all major revenues as soon as themonies are available within the banking system, whichlimits under-collateralization. The State’s cash depositswith financial institutions had a book and bank balanceof $6.3 billion and were fully collateralized at fiscalyear-end. Included in these balances were certificates ofdeposit held in the STIP with a book and bank balanceof $3.1 billion. Additional deposits, with a book andbank balance of $9.5 million, were held by the State’sfiscal agent and were fully collateralized except for $8.7million in deposits that were exposed to custodial creditrisk because they were uninsured and uncollateralized.
For the fiscal year ended March 31, 2013, theaverage daily balance of the STIP was $6.5 billion, withan average yield of 0.2 percent and total investmentincome of $10.9 million.
InvestmentsThe State holds investments both for its own benefitand as an agent for other parties. Major investmentprograms conducted for the direct benefit of the Stateinclude STIP, which is used for the temporary invest-ment of funds not required for immediate payments,and sole custody funds administered by the Departmentof Taxation and Finance.
Investments are made in accordance with StateFinance Law and vary by fund but generally include:obligations of, or guaranteed by, the United States;obligations of New York State and its political sub-divisions; certificates of deposit; savings bank trustcompany notes; bankers’ acceptances; repurchaseagreements; corporate bonds; and commercial paper.
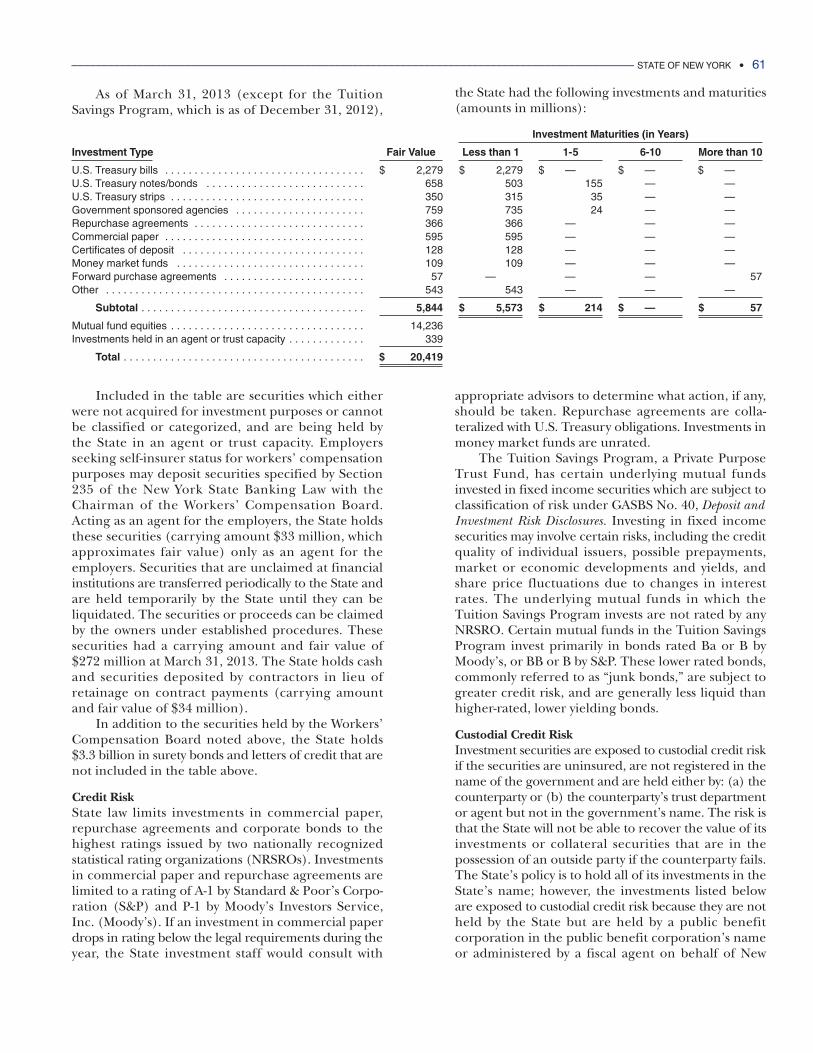
______________________________________________________________________________________________ STATE OF NEW YORK • 61
Investment Maturities (in Years)
Investment Type Fair Value Less than 1 1-5 6-10 More than 10
U.S. Treasury bills . . . . . . . . . . . . . . . . . . . . . . . . . . . . . . . . . . $ 2,279 $ 2,279 $ —0000 $ —0000 $ —0000U.S. Treasury notes/bonds . . . . . . . . . . . . . . . . . . . . . . . . . . . 658 503 155 —0000 —0000U.S. Treasury strips . . . . . . . . . . . . . . . . . . . . . . . . . . . . . . . . . 350 315 35 —0000 —0000Government sponsored agencies . . . . . . . . . . . . . . . . . . . . . . 759 735 24 —0000 —0000Repurchase agreements . . . . . . . . . . . . . . . . . . . . . . . . . . . . . 366 366 —0000 —0000 —0000Commercial paper . . . . . . . . . . . . . . . . . . . . . . . . . . . . . . . . . . 595 595 —0000 —0000 —0000Certificates of deposit . . . . . . . . . . . . . . . . . . . . . . . . . . . . . . . 128 128 —0000 —0000 —0000Money market funds . . . . . . . . . . . . . . . . . . . . . . . . . . . . . . . . 109 109 —0000 —0000 —0000Forward purchase agreements . . . . . . . . . . . . . . . . . . . . . . . . 57 —0000 —0000 —0000 57Other . . . . . . . . . . . . . . . . . . . . . . . . . . . . . . . . . . . . . . . . . . . . 543 543 —0000 —0000 —0000
Subtotal . . . . . . . . . . . . . . . . . . . . . . . . . . . . . . . . . . . . . . 5,844 $ 5,573 $ 214 $ —0000 $ 57
Mutual fund equities . . . . . . . . . . . . . . . . . . . . . . . . . . . . . . . . . 14,236Investments held in an agent or trust capacity . . . . . . . . . . . . . 339
Total . . . . . . . . . . . . . . . . . . . . . . . . . . . . . . . . . . . . . . . . . $ 20,419
As of March 31, 2013 (except for the TuitionSavings Program, which is as of December 31, 2012),
the State had the following investments and maturities(amounts in millions):
Included in the table are securities which eitherwere not acquired for investment purposes or cannotbe classified or categorized, and are being held bythe State in an agent or trust capacity. Employersseeking self-insurer status for workers’ compensationpurposes may deposit securities specified by Section235 of the New York State Banking Law with theChairman of the Workers’ Compensation Board.Acting as an agent for the employers, the State holdsthese securities (carrying amount $33 million, whichapproximates fair value) only as an agent for theemployers. Securities that are unclaimed at financialinstitutions are transferred periodically to the State andare held temporarily by the State until they can beliquidated. The securities or proceeds can be claimedby the owners under established procedures. Thesesecurities had a carrying amount and fair value of$272 million at March 31, 2013. The State holds cashand securities deposited by contractors in lieu ofretainage on contract payments (carrying amountand fair value of $34 million).
In addition to the securities held by the Workers’Compensation Board noted above, the State holds$3.3 billion in surety bonds and letters of credit that arenot included in the table above.
Credit RiskState law limits investments in commercial paper,repurchase agreements and corporate bonds to thehighest ratings issued by two nationally recognizedstatistical rating organizations (NRSROs). Investmentsin commercial paper and repurchase agreements arelimited to a rating of A-1 by Standard & Poor’s Corpo-ration (S&P) and P-1 by Moody’s Investors Service,Inc. (Moody’s). If an investment in commercial paperdrops in rating below the legal requirements during theyear, the State investment staff would consult with
appropriate advisors to determine what action, if any,should be taken. Repurchase agreements are colla-teralized with U.S. Treasury obligations. Investments inmoney market funds are unrated.
The Tuition Savings Program, a Private PurposeTrust Fund, has certain underlying mutual fundsinvested in fixed income securities which are subject toclassification of risk under GASBS No. 40, Deposit andInvestment Risk Disclosures. Investing in fixed incomesecurities may involve certain risks, including the creditquality of individual issuers, possible prepayments,market or economic developments and yields, andshare price fluctuations due to changes in interestrates. The underlying mutual funds in which theTuition Savings Program invests are not rated by anyNRSRO. Certain mutual funds in the Tuition SavingsProgram invest primarily in bonds rated Ba or B byMoody’s, or BB or B by S&P. These lower rated bonds,commonly referred to as “junk bonds,” are subject togreater credit risk, and are generally less liquid thanhigher-rated, lower yielding bonds.
Custodial Credit RiskInvestment securities are exposed to custodial credit riskif the securities are uninsured, are not registered in thename of the government and are held either by: (a) thecounterparty or (b) the counterparty’s trust departmentor agent but not in the government’s name. The risk isthat the State will not be able to recover the value of itsinvestments or collateral securities that are in thepossession of an outside party if the counterparty fails.The State’s policy is to hold all of its investments in theState’s name; however, the investments listed beloware exposed to custodial credit risk because they are notheld by the State but are held by a public benefitcorporation in the public benefit corporation’s nameor administered by a fiscal agent on behalf of New
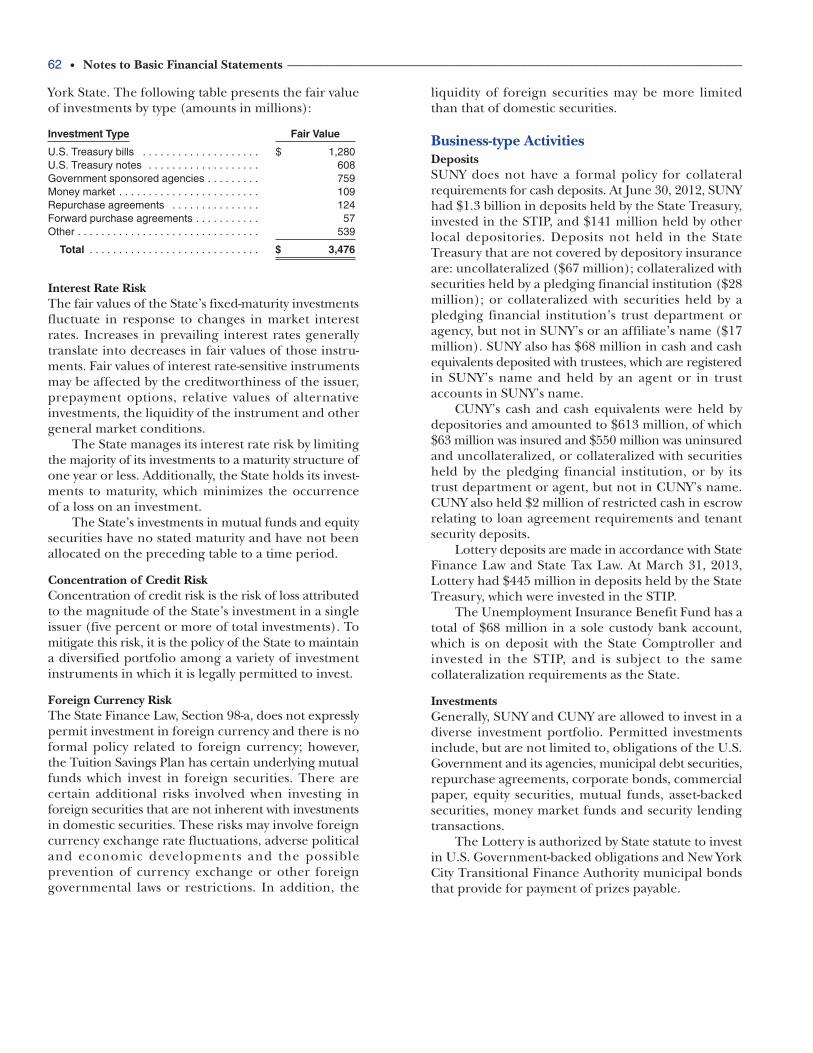
York State. The following table presents the fair valueof investments by type (amounts in millions):
Investment Type Fair Value
U.S. Treasury bills . . . . . . . . . . . . . . . . . . . . $ 1,280U.S. Treasury notes . . . . . . . . . . . . . . . . . . . 608Government sponsored agencies . . . . . . . . . 759Money market . . . . . . . . . . . . . . . . . . . . . . . . 109Repurchase agreements . . . . . . . . . . . . . . . 124Forward purchase agreements . . . . . . . . . . . 57Other . . . . . . . . . . . . . . . . . . . . . . . . . . . . . . . 539
Total . . . . . . . . . . . . . . . . . . . . . . . . . . . . . $ 3,476
Interest Rate RiskThe fair values of the State’s fixed-maturity investmentsfluctuate in response to changes in market interestrates. Increases in prevailing interest rates generallytranslate into decreases in fair values of those instru-ments. Fair values of interest rate-sensitive instrumentsmay be affected by the creditworthiness of the issuer,prepayment options, relative values of alternativeinvestments, the liquidity of the instrument and othergeneral market conditions.
The State manages its interest rate risk by limitingthe majority of its investments to a maturity structure ofone year or less. Additionally, the State holds its invest-ments to maturity, which minimizes the occurrenceof a loss on an investment.
The State’s investments in mutual funds and equitysecurities have no stated maturity and have not beenallocated on the preceding table to a time period.
Concentration of Credit RiskConcentration of credit risk is the risk of loss attributedto the magnitude of the State’s investment in a singleissuer (five percent or more of total investments). Tomitigate this risk, it is the policy of the State to maintaina diversified portfolio among a variety of investmentinstruments in which it is legally permitted to invest.
Foreign Currency RiskThe State Finance Law, Section 98-a, does not expresslypermit investment in foreign currency and there is noformal policy related to foreign currency; however,the Tuition Savings Plan has certain underlying mutualfunds which invest in foreign securities. There arecertain additional risks involved when investing inforeign securities that are not inherent with investmentsin domestic securities. These risks may involve foreigncurrency exchange rate fluctuations, adverse politicaland economic developments and the possibleprevention of currency exchange or other foreigngovernmental laws or restrictions. In addition, the
liquidity of foreign securities may be more limitedthan that of domestic securities.
Business-type ActivitiesDepositsSUNY does not have a formal policy for collateralrequirements for cash deposits. At June 30, 2012, SUNYhad $1.3 billion in deposits held by the State Treasury,invested in the STIP, and $141 million held by otherlocal depositories. Deposits not held in the StateTreasury that are not covered by depository insuranceare: uncollateralized ($67 million); collateralized withsecurities held by a pledging financial institution ($28million); or collateralized with securities held by apledging financial institution’s trust department oragency, but not in SUNY’s or an affiliate’s name ($17million). SUNY also has $68 million in cash and cashequivalents deposited with trustees, which are registeredin SUNY’s name and held by an agent or in trustaccounts in SUNY’s name.
CUNY’s cash and cash equivalents were held bydepositories and amounted to $613 million, of which$63 million was insured and $550 million was uninsuredand uncollateralized, or collateralized with securitiesheld by the pledging financial institution, or by itstrust department or agent, but not in CUNY’s name.CUNY also held $2 million of restricted cash in escrowrelating to loan agreement requirements and tenantsecurity deposits.
Lottery deposits are made in accordance with StateFinance Law and State Tax Law. At March 31, 2013,Lottery had $445 million in deposits held by the StateTreasury, which were invested in the STIP.
The Unemployment Insurance Benefit Fund has atotal of $68 million in a sole custody bank account,which is on deposit with the State Comptroller andinvested in the STIP, and is subject to the samecollateralization requirements as the State.
InvestmentsGenerally, SUNY and CUNY are allowed to invest in adiverse investment portfolio. Permitted investmentsinclude, but are not limited to, obligations of the U.S.Government and its agencies, municipal debt securities,repurchase agreements, corporate bonds, commercialpaper, equity securities, mutual funds, asset-backedsecurities, money market funds and security lendingtransactions.
The Lottery is authorized by State statute to investin U.S. Government-backed obligations and New YorkCity Transitional Finance Authority municipal bondsthat provide for payment of prizes payable.
62 • Notes to Basic Financial Statements ____________________________________________________________________________
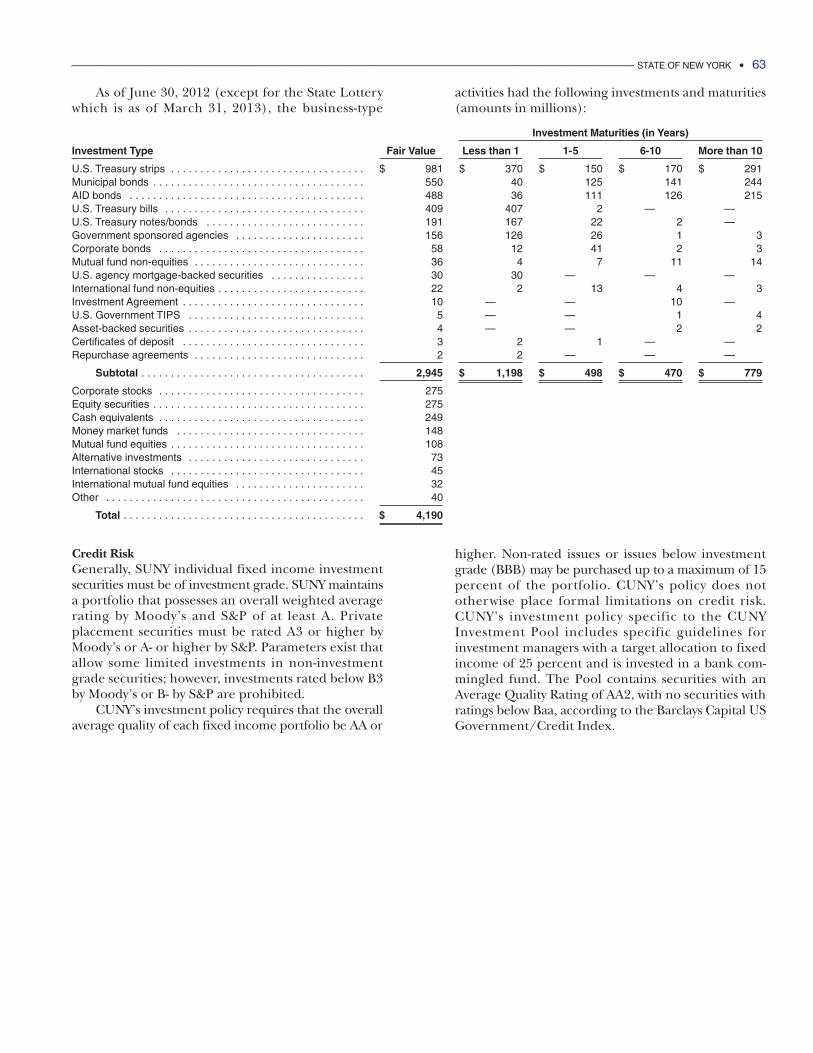
As of June 30, 2012 (except for the State Lotterywhich is as of March 31, 2013), the business-type
activities had the following investments and maturities(amounts in millions):
______________________________________________________________________________________________ STATE OF NEW YORK • 63
Investment Maturities (in Years)
Investment Type Fair Value Less than 1 1-5 6-10 More than 10
U.S. Treasury strips . . . . . . . . . . . . . . . . . . . . . . . . . . . . . . . . . $ 981 $ 370 $ 150 $ 170 $ 291Municipal bonds . . . . . . . . . . . . . . . . . . . . . . . . . . . . . . . . . . . . 550 40 125 141 244AID bonds . . . . . . . . . . . . . . . . . . . . . . . . . . . . . . . . . . . . . . . . 488 36 111 126 215U.S. Treasury bills . . . . . . . . . . . . . . . . . . . . . . . . . . . . . . . . . . 409 407 2 —0000 —0000U.S. Treasury notes/bonds . . . . . . . . . . . . . . . . . . . . . . . . . . . 191 167 22 2 —0000Government sponsored agencies . . . . . . . . . . . . . . . . . . . . . . 156 126 26 1 3Corporate bonds . . . . . . . . . . . . . . . . . . . . . . . . . . . . . . . . . . . 58 12 41 2 3Mutual fund non-equities . . . . . . . . . . . . . . . . . . . . . . . . . . . . . 36 4 7 11 14U.S. agency mortgage-backed securities . . . . . . . . . . . . . . . . 30 30 —0000 —0000 —0000International fund non-equities . . . . . . . . . . . . . . . . . . . . . . . . . 22 2 13 4 3Investment Agreement . . . . . . . . . . . . . . . . . . . . . . . . . . . . . . . 10 —0000 —0000 10 —0000U.S. Government TIPS . . . . . . . . . . . . . . . . . . . . . . . . . . . . . . 5 —0000 —0000 1 4Asset-backed securities . . . . . . . . . . . . . . . . . . . . . . . . . . . . . . 4 —0000 —0000 2 2Certificates of deposit . . . . . . . . . . . . . . . . . . . . . . . . . . . . . . . 3 2 1 —0000 —0000Repurchase agreements . . . . . . . . . . . . . . . . . . . . . . . . . . . . . 2 2 —0000 —0000 —0000
Subtotal . . . . . . . . . . . . . . . . . . . . . . . . . . . . . . . . . . . . . . 2,945 $ 1,198 $ 498 $ 470 $ 779
Corporate stocks . . . . . . . . . . . . . . . . . . . . . . . . . . . . . . . . . . . 275Equity securities . . . . . . . . . . . . . . . . . . . . . . . . . . . . . . . . . . . . 275Cash equivalents . . . . . . . . . . . . . . . . . . . . . . . . . . . . . . . . . . . 249Money market funds . . . . . . . . . . . . . . . . . . . . . . . . . . . . . . . . 148Mutual fund equities . . . . . . . . . . . . . . . . . . . . . . . . . . . . . . . . . 108Alternative investments . . . . . . . . . . . . . . . . . . . . . . . . . . . . . . 73International stocks . . . . . . . . . . . . . . . . . . . . . . . . . . . . . . . . . 45International mutual fund equities . . . . . . . . . . . . . . . . . . . . . . 32Other . . . . . . . . . . . . . . . . . . . . . . . . . . . . . . . . . . . . . . . . . . . . 40
Total . . . . . . . . . . . . . . . . . . . . . . . . . . . . . . . . . . . . . . . . . $ 4,190
Credit RiskGenerally, SUNY individual fixed income investmentsecurities must be of investment grade. SUNY maintainsa portfolio that possesses an overall weighted averagerating by Moody’s and S&P of at least A. Privateplacement securities must be rated A3 or higher byMoody’s or A- or higher by S&P. Parameters exist thatallow some limited investments in non-investmentgrade securities; however, investments rated below B3by Moody’s or B- by S&P are prohibited.
CUNY’s investment policy requires that the overallaverage quality of each fixed income portfolio be AA or
higher. Non-rated issues or issues below investmentgrade (BBB) may be purchased up to a maximum of 15percent of the portfolio. CUNY’s policy does nototherwise place formal limitations on credit risk.CUNY’s investment policy specific to the CUNYInvestment Pool includes specific guidelines forinvestment managers with a target allocation to fixedincome of 25 percent and is invested in a bank com-mingled fund. The Pool contains securities with anAverage Quality Rating of AA2, with no securities withratings below Baa, according to the Barclays Capital USGovernment/Credit Index.
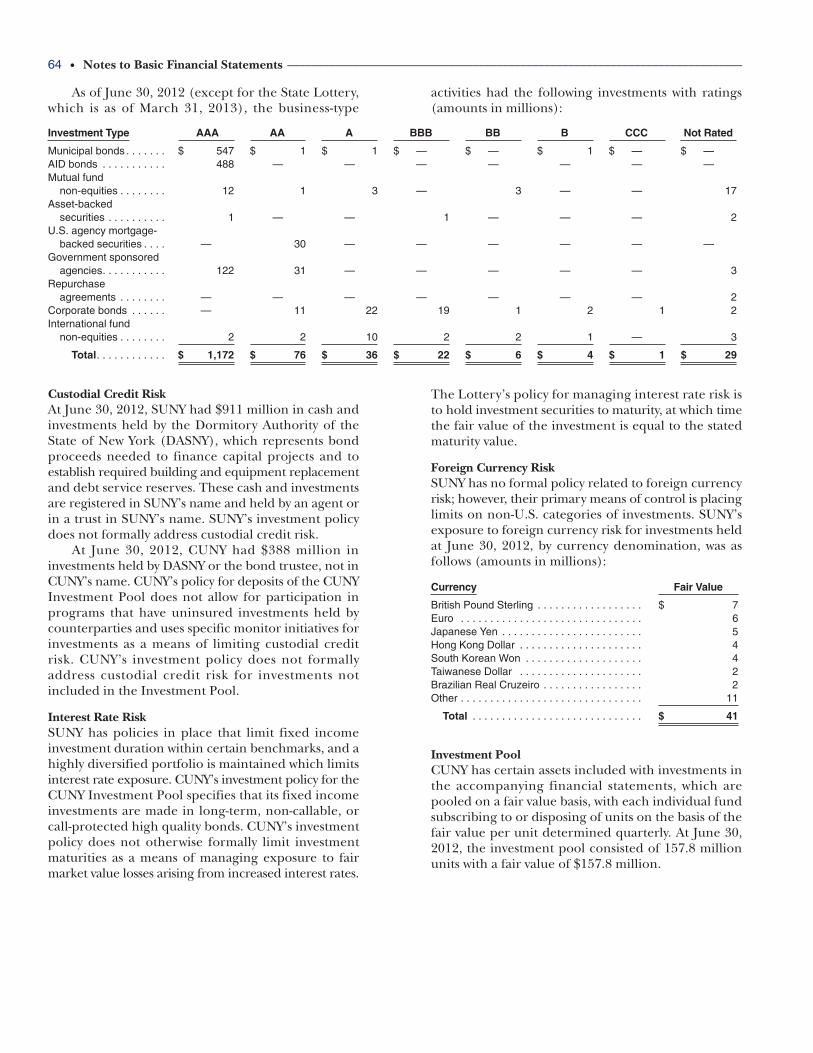
64 • Notes to Basic Financial Statements ____________________________________________________________________________
As of June 30, 2012 (except for the State Lottery,which is as of March 31, 2013), the business-type
activities had the following investments with ratings(amounts in millions):
Custodial Credit RiskAt June 30, 2012, SUNY had $911 million in cash andinvestments held by the Dormitory Authority of theState of New York (DASNY), which represents bondproceeds needed to finance capital projects and toestablish required building and equipment replacementand debt service reserves. These cash and investmentsare registered in SUNY’s name and held by an agent orin a trust in SUNY’s name. SUNY’s investment policydoes not formally address custodial credit risk.
At June 30, 2012, CUNY had $388 million ininvestments held by DASNY or the bond trustee, not inCUNY’s name. CUNY’s policy for deposits of the CUNYInvestment Pool does not allow for participation inprograms that have uninsured investments held bycounterparties and uses specific monitor initiatives forinvestments as a means of limiting custodial creditrisk. CUNY’s investment policy does not formallyaddress custodial credit risk for investments notincluded in the Investment Pool.
Interest Rate Risk SUNY has policies in place that limit fixed incomeinvestment duration within certain benchmarks, and ahighly diversified portfolio is maintained which limitsinterest rate exposure. CUNY’s investment policy for theCUNY Investment Pool specifies that its fixed incomeinvestments are made in long-term, non-callable, orcall-protected high quality bonds. CUNY’s investmentpolicy does not otherwise formally limit investmentmaturities as a means of managing exposure to fairmarket value losses arising from increased interest rates.
The Lottery’s policy for managing interest rate risk isto hold investment securities to maturity, at which timethe fair value of the investment is equal to the statedmaturity value.
Foreign Currency RiskSUNY has no formal policy related to foreign currencyrisk; however, their primary means of control is placinglimits on non-U.S. categories of investments. SUNY’sexposure to foreign currency risk for investments heldat June 30, 2012, by currency denomination, was asfollows (amounts in millions):
Currency Fair Value
British Pound Sterling . . . . . . . . . . . . . . . . . . $ 7Euro . . . . . . . . . . . . . . . . . . . . . . . . . . . . . . . 6Japanese Yen . . . . . . . . . . . . . . . . . . . . . . . . 5Hong Kong Dollar . . . . . . . . . . . . . . . . . . . . . 4South Korean Won . . . . . . . . . . . . . . . . . . . . 4Taiwanese Dollar . . . . . . . . . . . . . . . . . . . . . 2Brazilian Real Cruzeiro . . . . . . . . . . . . . . . . . 2Other . . . . . . . . . . . . . . . . . . . . . . . . . . . . . . . 11
Total . . . . . . . . . . . . . . . . . . . . . . . . . . . . . $ 41
Investment PoolCUNY has certain assets included with investments inthe accompanying financial statements, which arepooled on a fair value basis, with each individual fundsubscribing to or disposing of units on the basis of thefair value per unit determined quarterly. At June 30,2012, the investment pool consisted of 157.8 millionunits with a fair value of $157.8 million.
Investment Type AAA AA A BBB BB B CCC Not Rated
Municipal bonds . . . . . . . $ 547 $ 1 $ 1 $ —0000 $ —0000 $ 1 $ —0000 $ —0000AID bonds . . . . . . . . . . . 488 —0000 —0000 —0000 —0000 —0000 —0000 —0000Mutual fund
non-equities . . . . . . . . 12 1 3 —0000 3 —0000 —0000 17Asset-backed
securities . . . . . . . . . . 1 —0000 —0000 1 —0000 11—0000 —0000 2U.S. agency mortgage-
backed securities . . . . —0000 30 —0000 —0000 —0000 —0000 —0000 —0000Government sponsored
agencies. . . . . . . . . . . 122 31 —0000 —0000 —0000 —0000 —0000 3Repurchase
agreements . . . . . . . . —0000 —0000 —0000 —0000 —0000 —0000 —0000 2Corporate bonds . . . . . . —0000 11 22 19 1 2 1 2International fund
non-equities . . . . . . . . 2 2 10 2 2 1 —0000 3
Total. . . . . . . . . . . . $ 1,172 $ 76 $ 36 $ 22 $ 6 $ 4 $ 1 $ 29
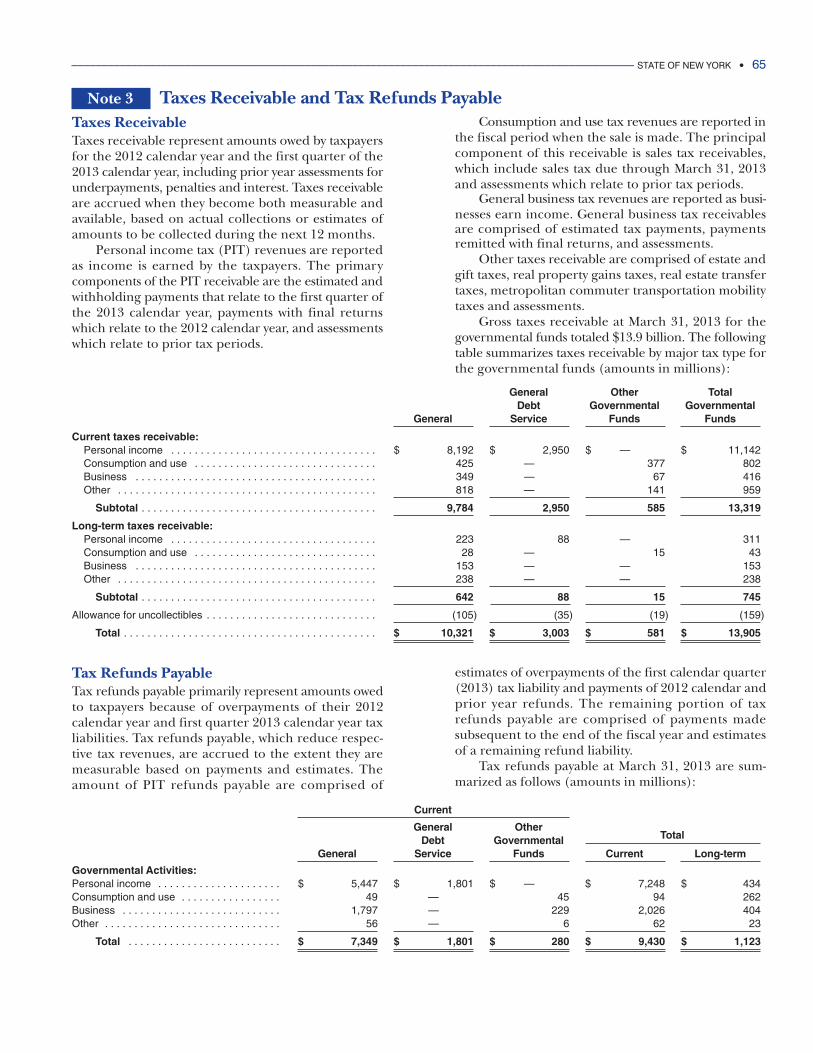
______________________________________________________________________________________________ STATE OF NEW YORK • 65
Note 3 Taxes Receivable and Tax Refunds PayableTaxes ReceivableTaxes receivable represent amounts owed by taxpayersfor the 2012 calendar year and the first quarter of the2013 calendar year, including prior year assessments forunderpayments, penalties and interest. Taxes receivableare accrued when they become both measurable andavailable, based on actual collections or estimates ofamounts to be collected during the next 12 months.
Personal income tax (PIT) revenues are reportedas income is earned by the taxpayers. The primarycomponents of the PIT receivable are the estimated andwithholding payments that relate to the first quarter ofthe 2013 calendar year, payments with final returnswhich relate to the 2012 calendar year, and assessmentswhich relate to prior tax periods.
Consumption and use tax revenues are reported inthe fiscal period when the sale is made. The principalcomponent of this receivable is sales tax receivables,which include sales tax due through March 31, 2013and assessments which relate to prior tax periods.
General business tax revenues are reported as busi-nesses earn income. General business tax receivablesare comprised of estimated tax payments, paymentsremitted with final returns, and assessments.
Other taxes receivable are comprised of estate andgift taxes, real property gains taxes, real estate transfertaxes, metropolitan commuter transportation mobilitytaxes and assessments.
Gross taxes receivable at March 31, 2013 for thegovernmental funds totaled $13.9 billion. The followingtable summarizes taxes receivable by major tax type forthe governmental funds (amounts in millions):
General Other TotalDebt Governmental Governmental
General Service Funds Funds
Current taxes receivable:Personal income . . . . . . . . . . . . . . . . . . . . . . . . . . . . . . . . . . . $ 8,192 $ 2,950 $ —0 0 000 $ 11,142Consumption and use . . . . . . . . . . . . . . . . . . . . . . . . . . . . . . . 425 —0 0 000 377 802Business . . . . . . . . . . . . . . . . . . . . . . . . . . . . . . . . . . . . . . . . . 349 —0 0 000 67 416Other . . . . . . . . . . . . . . . . . . . . . . . . . . . . . . . . . . . . . . . . . . . . 818 —0 0 000 141 959
Subtotal . . . . . . . . . . . . . . . . . . . . . . . . . . . . . . . . . . . . . . . . 9,784 2,950 585 13,319
Long-term taxes receivable:Personal income . . . . . . . . . . . . . . . . . . . . . . . . . . . . . . . . . . . 223 88 —0 0 000 311Consumption and use . . . . . . . . . . . . . . . . . . . . . . . . . . . . . . . 28 —0 0 000 15 43Business . . . . . . . . . . . . . . . . . . . . . . . . . . . . . . . . . . . . . . . . . 153 —0 0 000 —0 0 000 153Other . . . . . . . . . . . . . . . . . . . . . . . . . . . . . . . . . . . . . . . . . . . . 238 —0 0 000 —0 0 000 238
Subtotal . . . . . . . . . . . . . . . . . . . . . . . . . . . . . . . . . . . . . . . . 642 88 15 745
Allowance for uncollectibles . . . . . . . . . . . . . . . . . . . . . . . . . . . . . (105) (35) (19) (159)
Total . . . . . . . . . . . . . . . . . . . . . . . . . . . . . . . . . . . . . . . . . . . $ 10,321 $ 3,003 $ 581 $ 13,905
Tax Refunds PayableTax refunds payable primarily represent amounts owedto taxpayers because of overpayments of their 2012calendar year and first quarter 2013 calendar year taxliabilities. Tax refunds payable, which reduce respec-tive tax revenues, are accrued to the extent they aremeasurable based on payments and estimates. Theamount of PIT refunds payable are comprised of
estimates of overpayments of the first calendar quarter(2013) tax liability and payments of 2012 calendar andprior year refunds. The remaining portion of taxrefunds payable are comprised of payments madesubsequent to the end of the fiscal year and estimatesof a remaining refund liability.
Tax refunds payable at March 31, 2013 are sum-marized as follows (amounts in millions):
Current
General OtherTotalDebt Governmental
General Service Funds Current Long-term
Governmental Activities:Personal income . . . . . . . . . . . . . . . . . . . . . $ 5,447 $ 1,801 $ —0 0 000 $ 7,248 $ 434Consumption and use . . . . . . . . . . . . . . . . . 49 —0 0 000 45 94 262Business . . . . . . . . . . . . . . . . . . . . . . . . . . . 1,797 —0 0 000 229 2,026 404Other . . . . . . . . . . . . . . . . . . . . . . . . . . . . . . 56 —0 0 000 6 62 23
Total . . . . . . . . . . . . . . . . . . . . . . . . . . $ 7,349 $ 1,801 $ 280 $ 9,430 $ 1,123
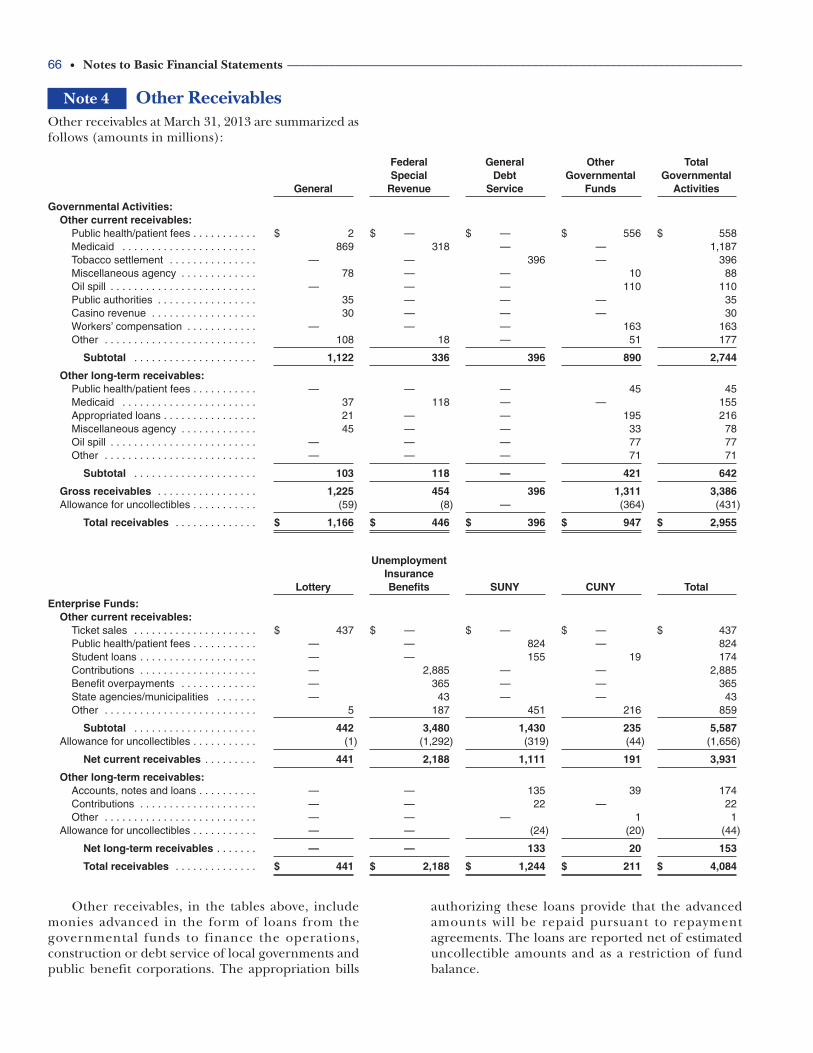
66 • Notes to Basic Financial Statements ____________________________________________________________________________
Note 4 Other ReceivablesOther receivables at March 31, 2013 are summarized asfollows (amounts in millions):
Federal General Other TotalSpecial Debt Governmental Governmental
General Revenue Service Funds Activities
Governmental Activities:Other current receivables:
Public health/patient fees . . . . . . . . . . . $ 2 $ —0 0 000 $ —0 0 000 $ 556 $ 558Medicaid . . . . . . . . . . . . . . . . . . . . . . . 869 318 —0 0 000 —0 0 000 1,187Tobacco settlement . . . . . . . . . . . . . . . —0 0 000 —0 0 000 396 —0 0 000 396Miscellaneous agency . . . . . . . . . . . . . 78 —0 0 000 —0 0 000 10 88Oil spill . . . . . . . . . . . . . . . . . . . . . . . . . —0 0 000 —0 0 000 —0 0 000 110 110Public authorities . . . . . . . . . . . . . . . . . 35 —0 0 000 —0 0 000 —0 0 000 35Casino revenue . . . . . . . . . . . . . . . . . . 30 —0 0 000 —0 0 000 —0 0 000 30Workers’ compensation . . . . . . . . . . . . —0 0 000 —0 0 000 —0 0 000 163 163Other . . . . . . . . . . . . . . . . . . . . . . . . . . 108 18 —0 0 000 51 177
Subtotal . . . . . . . . . . . . . . . . . . . . . 1,122 336 396 890 2,744
Other long-term receivables:Public health/patient fees . . . . . . . . . . . —0 0 000 —0 0 000 —0 0 000 45 45Medicaid . . . . . . . . . . . . . . . . . . . . . . . 37 118 —0 0 000 —0 0 000 155Appropriated loans . . . . . . . . . . . . . . . . 21 —0 0 000 —0 0 000 195 216Miscellaneous agency . . . . . . . . . . . . . 45 —0 0 000 —0 0 000 33 78Oil spill . . . . . . . . . . . . . . . . . . . . . . . . . —0 0 000 —0 0 000 —0 0 000 77 77Other . . . . . . . . . . . . . . . . . . . . . . . . . . —0 0 000 —0 0 000 —0 0 000 71 71
Subtotal . . . . . . . . . . . . . . . . . . . . . 103 118 —0 0 000 421 642
Gross receivables . . . . . . . . . . . . . . . . . 1,225 454 396 1,311 3,386Allowance for uncollectibles . . . . . . . . . . . (59) (8) —0 0 000 (364) (431)
Total receivables . . . . . . . . . . . . . . $ 1,166 $ 446 $ 396 $ 947 $ 2,955
UnemploymentInsurance
Lottery Benefits SUNY CUNY Total
Enterprise Funds:Other current receivables:
Ticket sales . . . . . . . . . . . . . . . . . . . . . $ 437 $ —0 0 000 $ —0 0 000 $ —0 0 000 $ 437Public health/patient fees . . . . . . . . . . . —0 0 000 —0 0 000 824 —0 0 000 824Student loans . . . . . . . . . . . . . . . . . . . . —0 0 000 —0 0 000 155 19 174Contributions . . . . . . . . . . . . . . . . . . . . —0 0 000 2,885 —0 0 000 —0 0 000 2,885Benefit overpayments . . . . . . . . . . . . . —0 0 000 365 —0 0 000 —0 0 000 365State agencies/municipalities . . . . . . . —0 0 000 43 —0 0 000 —0 0 000 43Other . . . . . . . . . . . . . . . . . . . . . . . . . . 5 187 451 216 859
Subtotal . . . . . . . . . . . . . . . . . . . . . 442 3,480 1,430 235 5,587Allowance for uncollectibles . . . . . . . . . . . (1) (1,292) (319) (44) (1,656)
Net current receivables . . . . . . . . . 441 2,188 1,111 191 3,931
Other long-term receivables:Accounts, notes and loans . . . . . . . . . . —0 0 000 —0 0 000 135 39 174Contributions . . . . . . . . . . . . . . . . . . . . —0 0 000 —0 0 000 22 —0 0 000 22Other . . . . . . . . . . . . . . . . . . . . . . . . . . —0 0 000 —0 0 000 —0 0 000 1 1
Allowance for uncollectibles . . . . . . . . . . . —0 0 000 —0 0 000 (24) (20) (44)
Net long-term receivables . . . . . . . —0 0 000 —0 0 000 133 20 153
Total receivables . . . . . . . . . . . . . . $ 441 $ 2,188 $ 1,244 $ 211 $ 4,084
Other receivables, in the tables above, includemonies advanced in the form of loans from thegovernmental funds to finance the operations,construction or debt service of local governments andpublic benefit corporations. The appropriation bills
authorizing these loans provide that the advancedamounts will be repaid pursuant to repaymentagreements. The loans are reported net of estimateduncollectible amounts and as a restriction of fundbalance.
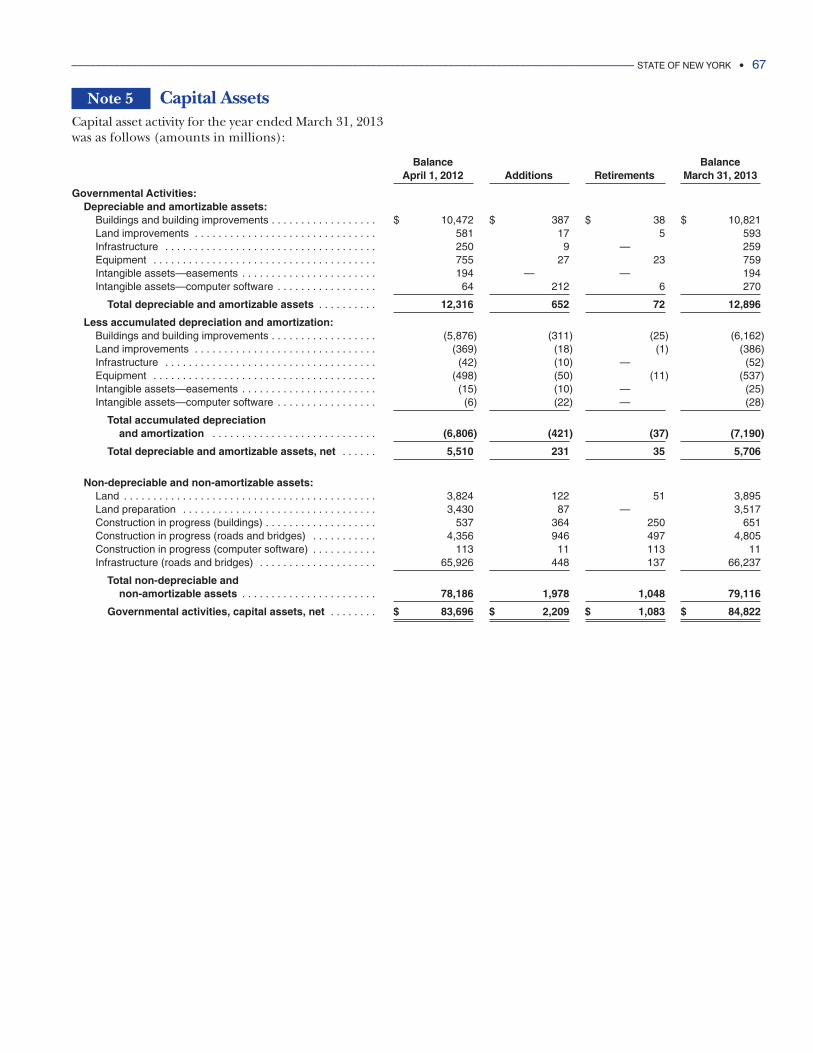
______________________________________________________________________________________________ STATE OF NEW YORK • 67
Note 5 Capital AssetsCapital asset activity for the year ended March 31, 2013was as follows (amounts in millions):
Balance BalanceApril 1, 2012 Additions Retirements March 31, 2013
Governmental Activities:Depreciable and amortizable assets:
Buildings and building improvements . . . . . . . . . . . . . . . . . . $ 10,472 $ 387 $ 38 $ 10,821Land improvements . . . . . . . . . . . . . . . . . . . . . . . . . . . . . . . 581 17 5 593Infrastructure . . . . . . . . . . . . . . . . . . . . . . . . . . . . . . . . . . . . 250 9 —0 0 000 259Equipment . . . . . . . . . . . . . . . . . . . . . . . . . . . . . . . . . . . . . . 755 27 23 759Intangible assets—easements . . . . . . . . . . . . . . . . . . . . . . . 194 —0 0 000 —0 0 000 194Intangible assets—computer software . . . . . . . . . . . . . . . . . 64 212 6 270
Total depreciable and amortizable assets . . . . . . . . . . 12,316 652 72 12,896
Less accumulated depreciation and amortization:Buildings and building improvements . . . . . . . . . . . . . . . . . . (5,876) (311) (25) (6,162)Land improvements . . . . . . . . . . . . . . . . . . . . . . . . . . . . . . . (369) (18) (1) (386)Infrastructure . . . . . . . . . . . . . . . . . . . . . . . . . . . . . . . . . . . . (42) (10) —0 0 000 (52)Equipment . . . . . . . . . . . . . . . . . . . . . . . . . . . . . . . . . . . . . . (498) (50) (11)(0 (537)Intangible assets—easements . . . . . . . . . . . . . . . . . . . . . . . (15) (10) —0 0 000 (25)Intangible assets—computer software . . . . . . . . . . . . . . . . . (6) (22) —0 0 000 (28)
Total accumulated depreciation and amortization . . . . . . . . . . . . . . . . . . . . . . . . . . . . (6,806) (421) (37) (7,190)
Total depreciable and amortizable assets, net . . . . . . 5,510 231 35 5,706
Non-depreciable and non-amortizable assets:Land . . . . . . . . . . . . . . . . . . . . . . . . . . . . . . . . . . . . . . . . . . . 3,824 122 51 3,895Land preparation . . . . . . . . . . . . . . . . . . . . . . . . . . . . . . . . . 3,430 87 —0 0 000 3,517Construction in progress (buildings) . . . . . . . . . . . . . . . . . . . 537 364 250 651Construction in progress (roads and bridges) . . . . . . . . . . . 4,356 946 497 4,805Construction in progress (computer software) . . . . . . . . . . . 113 11 113 11Infrastructure (roads and bridges) . . . . . . . . . . . . . . . . . . . . 65,926 448 137 66,237
Total non-depreciable and non-amortizable assets . . . . . . . . . . . . . . . . . . . . . . . 78,186 1,978 1,048 79,116
Governmental activities, capital assets, net . . . . . . . . $ 83,696 $ 2,209 $ 1,083 $ 84,822
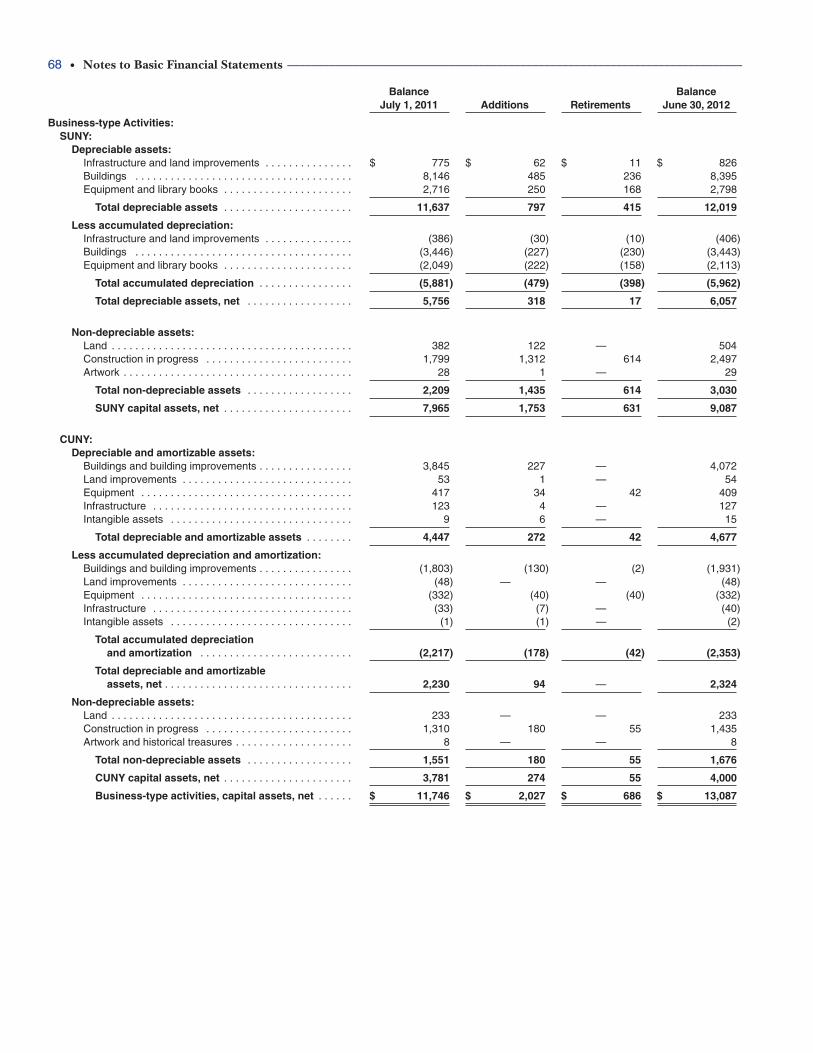
68 • Notes to Basic Financial Statements ____________________________________________________________________________
Balance BalanceJuly 1, 2011 Additions Retirements June 30, 2012
Business-type Activities:SUNY:
Depreciable assets:Infrastructure and land improvements . . . . . . . . . . . . . . . $ 775 $ 62 $ 11 $ 826Buildings . . . . . . . . . . . . . . . . . . . . . . . . . . . . . . . . . . . . . 8,146 485 236 8,395Equipment and library books . . . . . . . . . . . . . . . . . . . . . . 2,716 250 168 2,798
Total depreciable assets . . . . . . . . . . . . . . . . . . . . . . 11,637 797 415 12,019
Less accumulated depreciation:Infrastructure and land improvements . . . . . . . . . . . . . . . (386) (30) (10) (406)Buildings . . . . . . . . . . . . . . . . . . . . . . . . . . . . . . . . . . . . . (3,446) (227) (230) (3,443)Equipment and library books . . . . . . . . . . . . . . . . . . . . . . (2,049) (222) (158) (2,113)
Total accumulated depreciation . . . . . . . . . . . . . . . . (5,881) (479) (398) (5,962)
Total depreciable assets, net . . . . . . . . . . . . . . . . . . 5,756 318 17 6,057
Non-depreciable assets:Land . . . . . . . . . . . . . . . . . . . . . . . . . . . . . . . . . . . . . . . . . 382 122 —0 0 000 504Construction in progress . . . . . . . . . . . . . . . . . . . . . . . . . 1,799 1,312 614 2,497Artwork . . . . . . . . . . . . . . . . . . . . . . . . . . . . . . . . . . . . . . . 28 1 —0 0 000 29
Total non-depreciable assets . . . . . . . . . . . . . . . . . . 2,209 1,435 614 3,030
SUNY capital assets, net . . . . . . . . . . . . . . . . . . . . . . 7,965 1,753 631 9,087
CUNY:Depreciable and amortizable assets:
Buildings and building improvements . . . . . . . . . . . . . . . . 3,845 227 —0 0 000 4,072Land improvements . . . . . . . . . . . . . . . . . . . . . . . . . . . . . 53 1 —0 0 000 54Equipment . . . . . . . . . . . . . . . . . . . . . . . . . . . . . . . . . . . . 417 34 42 409Infrastructure . . . . . . . . . . . . . . . . . . . . . . . . . . . . . . . . . . 123 4 —0 0 000 127Intangible assets . . . . . . . . . . . . . . . . . . . . . . . . . . . . . . . 9 6 —0 0 000 15
Total depreciable and amortizable assets . . . . . . . . 4,447 272 42 4,677
Less accumulated depreciation and amortization:Buildings and building improvements . . . . . . . . . . . . . . . . (1,803) (130) (2) (1,931)Land improvements . . . . . . . . . . . . . . . . . . . . . . . . . . . . . (48) —0 0 000 —0 0 000 (48)Equipment . . . . . . . . . . . . . . . . . . . . . . . . . . . . . . . . . . . . (332) (40) (40) (332)Infrastructure . . . . . . . . . . . . . . . . . . . . . . . . . . . . . . . . . . (33) (7) —0 0 000 (40)Intangible assets . . . . . . . . . . . . . . . . . . . . . . . . . . . . . . . (1) (1) —0 0 000 (2)
Total accumulated depreciation and amortization . . . . . . . . . . . . . . . . . . . . . . . . . . (2,217) (178) (42) (2,353)
Total depreciable and amortizableassets, net . . . . . . . . . . . . . . . . . . . . . . . . . . . . . . . . 2,230 94 —0 0 000 2,324
Non-depreciable assets:Land . . . . . . . . . . . . . . . . . . . . . . . . . . . . . . . . . . . . . . . . . 233 —0 0 000 —0 0 000 233Construction in progress . . . . . . . . . . . . . . . . . . . . . . . . . 1,310 180 55 1,435Artwork and historical treasures . . . . . . . . . . . . . . . . . . . . 8 —0 0 000 —0 0 000 8
Total non-depreciable assets . . . . . . . . . . . . . . . . . . 1,551 180 55 1,676
CUNY capital assets, net . . . . . . . . . . . . . . . . . . . . . . 3,781 274 55 4,000
Business-type activities, capital assets, net . . . . . . $ 11,746 $ 2,027 $ 686 $ 13,087
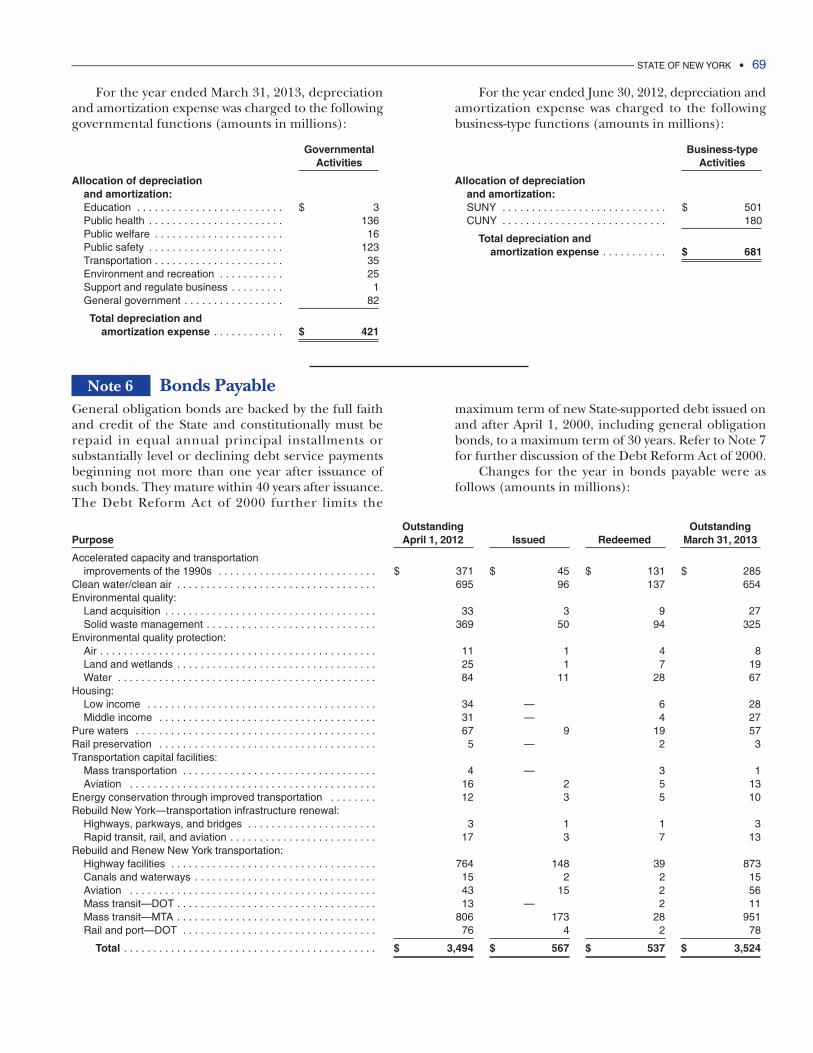
______________________________________________________________________________________________ STATE OF NEW YORK • 69
For the year ended March 31, 2013, depreciationand amortization expense was charged to the followinggovernmental functions (amounts in millions):
Governmental Activities
Allocation of depreciation and amortization:Education . . . . . . . . . . . . . . . . . . . . . . . . . $ 3Public health . . . . . . . . . . . . . . . . . . . . . . . 136Public welfare . . . . . . . . . . . . . . . . . . . . . . 16Public safety . . . . . . . . . . . . . . . . . . . . . . . 123Transportation . . . . . . . . . . . . . . . . . . . . . . 35Environment and recreation . . . . . . . . . . . 25Support and regulate business . . . . . . . . . 1General government . . . . . . . . . . . . . . . . . 82
Total depreciation andamortization expense . . . . . . . . . . . . $ 421
For the year ended June 30, 2012, depreciation andamortization expense was charged to the followingbusiness-type functions (amounts in millions):
Business-type Activities
Allocation of depreciation and amortization:SUNY . . . . . . . . . . . . . . . . . . . . . . . . . . . . $ 501CUNY . . . . . . . . . . . . . . . . . . . . . . . . . . . . 180
Total depreciation andamortization expense . . . . . . . . . . . $ 681
Note 6 Bonds PayableGeneral obligation bonds are backed by the full faithand credit of the State and constitutionally must berepaid in equal annual principal installments orsubstantially level or declining debt service paymentsbeginning not more than one year after issuance ofsuch bonds. They mature within 40 years after issuance.The Debt Reform Act of 2000 further limits the
maximum term of new State-supported debt issued onand after April 1, 2000, including general obligationbonds, to a maximum term of 30 years. Refer to Note 7for further discussion of the Debt Reform Act of 2000.
Changes for the year in bonds payable were asfollows (amounts in millions):
Outstanding OutstandingPurpose April 1, 2012 Issued Redeemed March 31, 2013
Accelerated capacity and transportationimprovements of the 1990s . . . . . . . . . . . . . . . . . . . . . . . . . . . $ 371 $ 45 $ 131 $ 285
Clean water/clean air . . . . . . . . . . . . . . . . . . . . . . . . . . . . . . . . . . 695 96 137 654Environmental quality:
Land acquisition . . . . . . . . . . . . . . . . . . . . . . . . . . . . . . . . . . . . 33 3 9 27Solid waste management . . . . . . . . . . . . . . . . . . . . . . . . . . . . . 369 50 94 325
Environmental quality protection:Air . . . . . . . . . . . . . . . . . . . . . . . . . . . . . . . . . . . . . . . . . . . . . . . 11 1 4 8Land and wetlands . . . . . . . . . . . . . . . . . . . . . . . . . . . . . . . . . . 25 1 7 19Water . . . . . . . . . . . . . . . . . . . . . . . . . . . . . . . . . . . . . . . . . . . . 84 11 28 67
Housing:Low income . . . . . . . . . . . . . . . . . . . . . . . . . . . . . . . . . . . . . . . 34 —0 0 000 6 28Middle income . . . . . . . . . . . . . . . . . . . . . . . . . . . . . . . . . . . . . 31 —0 0 000 4 27
Pure waters . . . . . . . . . . . . . . . . . . . . . . . . . . . . . . . . . . . . . . . . . 67 9 19 57Rail preservation . . . . . . . . . . . . . . . . . . . . . . . . . . . . . . . . . . . . . 5 —0 0 000 2 3Transportation capital facilities:
Mass transportation . . . . . . . . . . . . . . . . . . . . . . . . . . . . . . . . . 4 —0 0 000 3 1Aviation . . . . . . . . . . . . . . . . . . . . . . . . . . . . . . . . . . . . . . . . . . 16 2 5 13
Energy conservation through improved transportation . . . . . . . . 12 3 5 10Rebuild New York—transportation infrastructure renewal:
Highways, parkways, and bridges . . . . . . . . . . . . . . . . . . . . . . 3 11 1 3Rapid transit, rail, and aviation . . . . . . . . . . . . . . . . . . . . . . . . . 17 3 7 13
Rebuild and Renew New York transportation:Highway facilities . . . . . . . . . . . . . . . . . . . . . . . . . . . . . . . . . . . 764 148 39 873Canals and waterways . . . . . . . . . . . . . . . . . . . . . . . . . . . . . . . 15 2 2 15Aviation . . . . . . . . . . . . . . . . . . . . . . . . . . . . . . . . . . . . . . . . . . 43 15 102 56Mass transit—DOT . . . . . . . . . . . . . . . . . . . . . . . . . . . . . . . . . . 13 —0 0 000 2 11Mass transit—MTA . . . . . . . . . . . . . . . . . . . . . . . . . . . . . . . . . . 806 173 28 951Rail and port—DOT . . . . . . . . . . . . . . . . . . . . . . . . . . . . . . . . . 76 4 2 78
Total . . . . . . . . . . . . . . . . . . . . . . . . . . . . . . . . . . . . . . . . . . . $ 3,494 $ 567 $ 537 $ 3,524
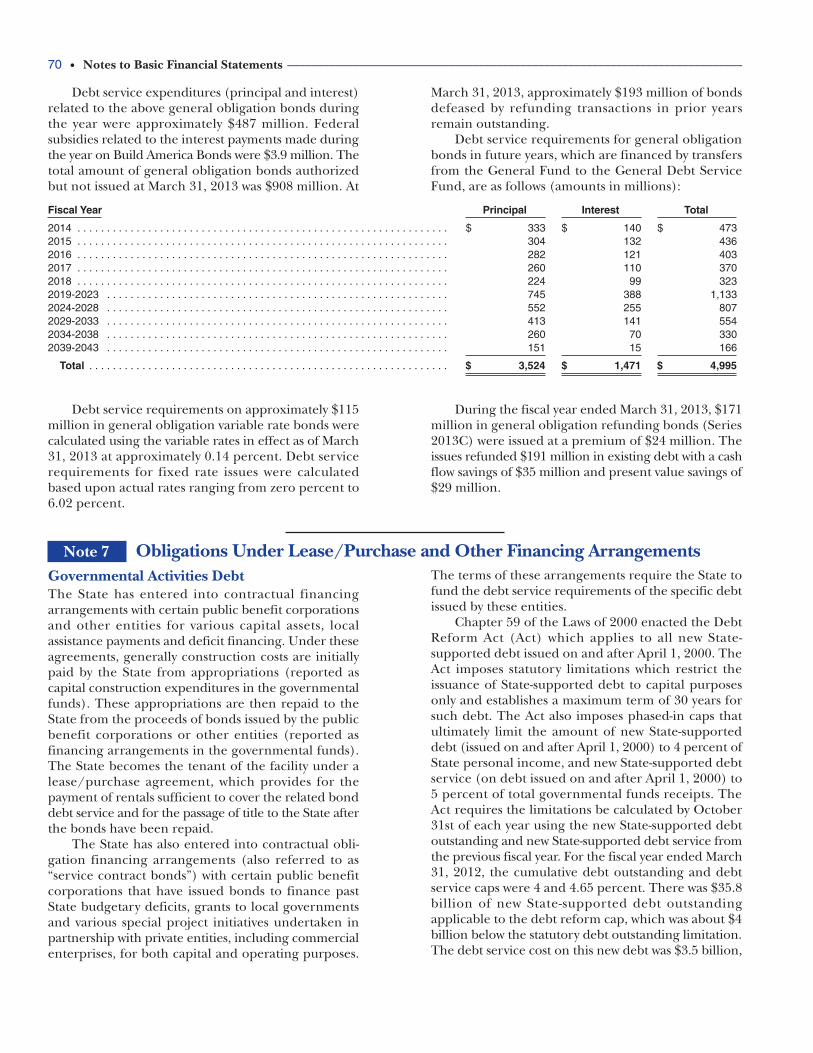
70 • Notes to Basic Financial Statements ____________________________________________________________________________
Fiscal Year Principal Interest Total
2014 . . . . . . . . . . . . . . . . . . . . . . . . . . . . . . . . . . . . . . . . . . . . . . . . . . . . . . . . . . . . . . . $ 333 $ 140 $ 4732015 . . . . . . . . . . . . . . . . . . . . . . . . . . . . . . . . . . . . . . . . . . . . . . . . . . . . . . . . . . . . . . . 304 132 4362016 . . . . . . . . . . . . . . . . . . . . . . . . . . . . . . . . . . . . . . . . . . . . . . . . . . . . . . . . . . . . . . . 282 121 4032017 . . . . . . . . . . . . . . . . . . . . . . . . . . . . . . . . . . . . . . . . . . . . . . . . . . . . . . . . . . . . . . . 260 110 3702018 . . . . . . . . . . . . . . . . . . . . . . . . . . . . . . . . . . . . . . . . . . . . . . . . . . . . . . . . . . . . . . . 224 99 3232019-2023 . . . . . . . . . . . . . . . . . . . . . . . . . . . . . . . . . . . . . . . . . . . . . . . . . . . . . . . . . . 745 388 1,1332024-2028 . . . . . . . . . . . . . . . . . . . . . . . . . . . . . . . . . . . . . . . . . . . . . . . . . . . . . . . . . . 552 255 8072029-2033 . . . . . . . . . . . . . . . . . . . . . . . . . . . . . . . . . . . . . . . . . . . . . . . . . . . . . . . . . . 413 141 5542034-2038 . . . . . . . . . . . . . . . . . . . . . . . . . . . . . . . . . . . . . . . . . . . . . . . . . . . . . . . . . . 260 70 3302039-2043 . . . . . . . . . . . . . . . . . . . . . . . . . . . . . . . . . . . . . . . . . . . . . . . . . . . . . . . . . . 151 15 166
Total . . . . . . . . . . . . . . . . . . . . . . . . . . . . . . . . . . . . . . . . . . . . . . . . . . . . . . . . . . . . . $ 3,524 $ 1,471 $ 4,995
Note 7 Obligations Under Lease/Purchase and Other Financing ArrangementsGovernmental Activities DebtThe State has entered into contractual financingarrangements with certain public benefit corporationsand other entities for various capital assets, localassistance payments and deficit financing. Under theseagreements, generally construction costs are initiallypaid by the State from appropriations (reported ascapital construction expenditures in the governmentalfunds). These appropriations are then repaid to theState from the proceeds of bonds issued by the publicbenefit corporations or other entities (reported asfinancing arrangements in the governmental funds).The State becomes the tenant of the facility under alease/purchase agreement, which provides for thepayment of rentals sufficient to cover the related bonddebt service and for the passage of title to the State afterthe bonds have been repaid.
The State has also entered into contractual obli-gation financing arrangements (also referred to as“service contract bonds”) with certain public benefitcorporations that have issued bonds to finance pastState budgetary deficits, grants to local governmentsand various special project initiatives undertaken inpartnership with private entities, including commercialenterprises, for both capital and operating purposes.
The terms of these arrangements require the State tofund the debt service requirements of the specific debtissued by these entities.
Chapter 59 of the Laws of 2000 enacted the DebtReform Act (Act) which applies to all new State-supported debt issued on and after April 1, 2000. TheAct imposes statutory limitations which restrict theissuance of State-supported debt to capital purposesonly and establishes a maximum term of 30 years forsuch debt. The Act also imposes phased-in caps thatultimately limit the amount of new State-supporteddebt (issued on and after April 1, 2000) to 4 percent ofState personal income, and new State-supported debtservice (on debt issued on and after April 1, 2000) to5 percent of total governmental funds receipts. TheAct requires the limitations be calculated by October31st of each year using the new State-supported debtoutstanding and new State-supported debt service fromthe previous fiscal year. For the fiscal year ended March31, 2012, the cumulative debt outstanding and debtservice caps were 4 and 4.65 percent. There was $35.8billion of new State-supported debt outstandingapplicable to the debt reform cap, which was about $4billion below the statutory debt outstanding limitation.The debt service cost on this new debt was $3.5 billion,
Debt service requirements on approximately $115million in general obligation variable rate bonds werecalculated using the variable rates in effect as of March31, 2013 at approximately 0.14 percent. Debt servicerequirements for fixed rate issues were calculatedbased upon actual rates ranging from zero percent to6.02 percent.
During the fiscal year ended March 31, 2013, $171million in general obligation refunding bonds (Series2013C) were issued at a premium of $24 million. Theissues refunded $191 million in existing debt with a cashflow savings of $35 million and present value savings of$29 million.
Debt service expenditures (principal and interest)related to the above general obligation bonds duringthe year were approximately $487 million. Federalsubsidies related to the interest payments made duringthe year on Build America Bonds were $3.9 million. Thetotal amount of general obligation bonds authorizedbut not issued at March 31, 2013 was $908 million. At
March 31, 2013, approximately $193 million of bondsdefeased by refunding transactions in prior yearsremain outstanding.
Debt service requirements for general obligationbonds in future years, which are financed by transfersfrom the General Fund to the General Debt ServiceFund, are as follows (amounts in millions):
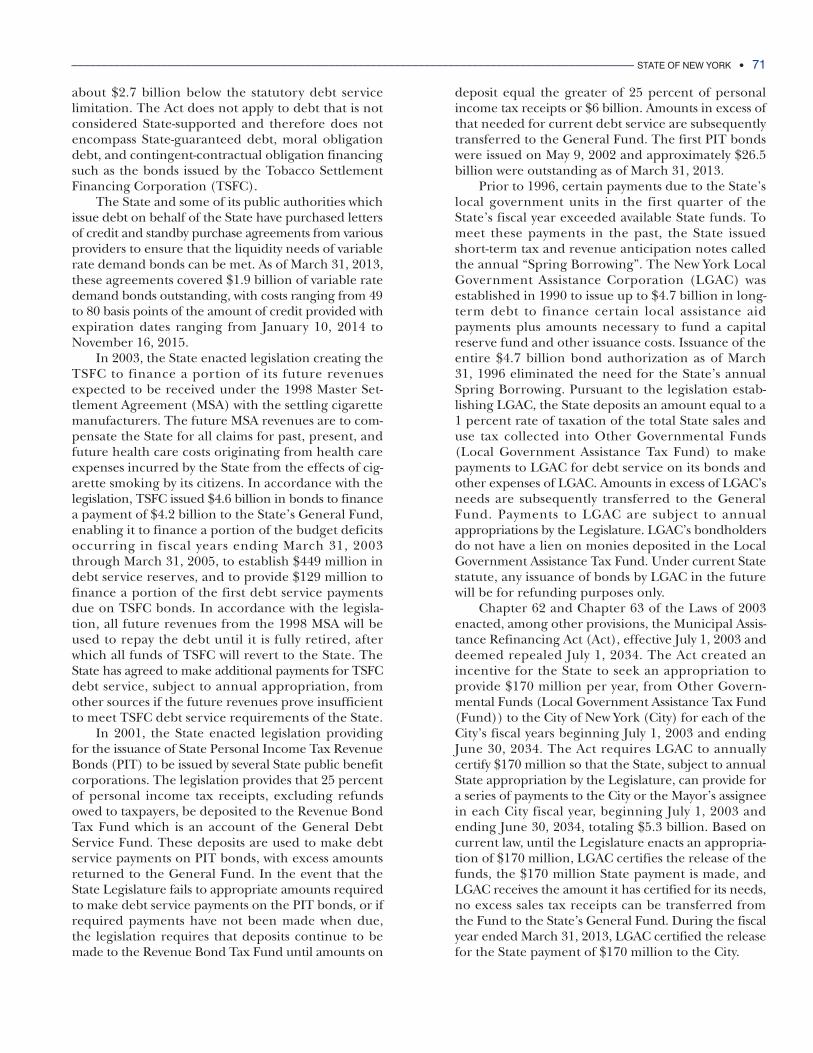
______________________________________________________________________________________________ STATE OF NEW YORK • 71
about $2.7 billion below the statutory debt servicelimitation. The Act does not apply to debt that is notconsidered State-supported and therefore does notencompass State-guaranteed debt, moral obligationdebt, and contingent-contractual obligation financingsuch as the bonds issued by the Tobacco SettlementFinancing Corporation (TSFC).
The State and some of its public authorities whichissue debt on behalf of the State have purchased lettersof credit and standby purchase agreements from variousproviders to ensure that the liquidity needs of variablerate demand bonds can be met. As of March 31, 2013,these agreements covered $1.9 billion of variable ratedemand bonds outstanding, with costs ranging from 49to 80 basis points of the amount of credit provided withexpiration dates ranging from January 10, 2014 toNovember 16, 2015.
In 2003, the State enacted legislation creating theTSFC to finance a portion of its future revenuesexpected to be received under the 1998 Master Set-tlement Agreement (MSA) with the settling cigarettemanufacturers. The future MSA revenues are to com-pensate the State for all claims for past, present, andfuture health care costs originating from health careexpenses incurred by the State from the effects of cig-arette smoking by its citizens. In accordance with thelegislation, TSFC issued $4.6 billion in bonds to financea payment of $4.2 billion to the State’s General Fund,enabling it to finance a portion of the budget deficitsoccurring in fiscal years ending March 31, 2003through March 31, 2005, to establish $449 million indebt service reserves, and to provide $129 million tofinance a portion of the first debt service paymentsdue on TSFC bonds. In accordance with the legisla-tion, all future revenues from the 1998 MSA will beused to repay the debt until it is fully retired, afterwhich all funds of TSFC will revert to the State. TheState has agreed to make additional payments for TSFCdebt service, subject to annual appropriation, fromother sources if the future revenues prove insufficientto meet TSFC debt service requirements of the State.
In 2001, the State enacted legislation providingfor the issuance of State Personal Income Tax RevenueBonds (PIT) to be issued by several State public benefitcorporations. The legislation provides that 25 percentof personal income tax receipts, excluding refundsowed to taxpayers, be deposited to the Revenue BondTax Fund which is an account of the General DebtService Fund. These deposits are used to make debtservice payments on PIT bonds, with excess amountsreturned to the General Fund. In the event that theState Legislature fails to appropriate amounts requiredto make debt service payments on the PIT bonds, or ifrequired payments have not been made when due,the legislation requires that deposits continue to bemade to the Revenue Bond Tax Fund until amounts on
deposit equal the greater of 25 percent of personalincome tax receipts or $6 billion. Amounts in excess ofthat needed for current debt service are subsequentlytransferred to the General Fund. The first PIT bondswere issued on May 9, 2002 and approximately $26.5billion were outstanding as of March 31, 2013.
Prior to 1996, certain payments due to the State’slocal government units in the first quarter of theState’s fiscal year exceeded available State funds. Tomeet these payments in the past, the State issuedshort-term tax and revenue anticipation notes calledthe annual “Spring Borrowing”. The New York LocalGovernment Assistance Corporation (LGAC) wasestablished in 1990 to issue up to $4.7 billion in long-term debt to finance certain local assistance aidpayments plus amounts necessary to fund a capitalreserve fund and other issuance costs. Issuance of theentire $4.7 billion bond authorization as of March31, 1996 eliminated the need for the State’s annualSpring Borrowing. Pursuant to the legislation estab-lishing LGAC, the State deposits an amount equal to a1 percent rate of taxation of the total State sales anduse tax collected into Other Governmental Funds(Local Government Assistance Tax Fund) to makepayments to LGAC for debt service on its bonds andother expenses of LGAC. Amounts in excess of LGAC’sneeds are subsequently transferred to the GeneralFund. Payments to LGAC are subject to annualappropriations by the Legislature. LGAC’s bondholdersdo not have a lien on monies deposited in the LocalGovernment Assistance Tax Fund. Under current Statestatute, any issuance of bonds by LGAC in the futurewill be for refunding purposes only.
Chapter 62 and Chapter 63 of the Laws of 2003enacted, among other provisions, the Municipal Assis-tance Refinancing Act (Act), effective July 1, 2003 anddeemed repealed July 1, 2034. The Act created anincentive for the State to seek an appropriation toprovide $170 million per year, from Other Govern-mental Funds (Local Government Assistance Tax Fund(Fund)) to the City of New York (City) for each of theCity’s fiscal years beginning July 1, 2003 and endingJune 30, 2034. The Act requires LGAC to annuallycertify $170 million so that the State, subject to annualState appropriation by the Legislature, can provide fora series of payments to the City or the Mayor’s assigneein each City fiscal year, beginning July 1, 2003 andending June 30, 2034, totaling $5.3 billion. Based oncurrent law, until the Legislature enacts an appropria-tion of $170 million, LGAC certifies the release of thefunds, the $170 million State payment is made, andLGAC receives the amount it has certified for its needs,no excess sales tax receipts can be transferred fromthe Fund to the State’s General Fund. During the fiscalyear ended March 31, 2013, LGAC certified the releasefor the State payment of $170 million to the City.
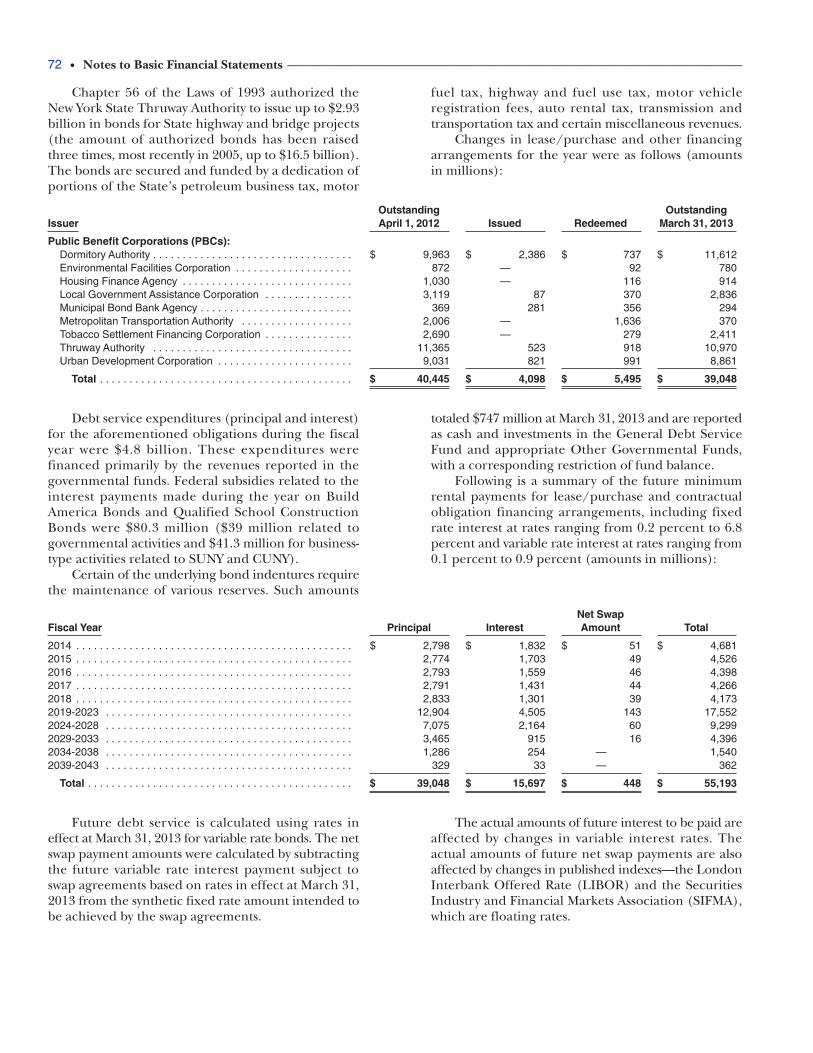
72 • Notes to Basic Financial Statements ____________________________________________________________________________
Debt service expenditures (principal and interest)for the aforementioned obligations during the fiscalyear were $4.8 billion. These expenditures werefinanced primarily by the revenues reported in thegovernmental funds. Federal subsidies related to theinterest payments made during the year on BuildAmerica Bonds and Qualified School ConstructionBonds were $80.3 million ($39 million related togovernmental activities and $41.3 million for business-type activities related to SUNY and CUNY).
Certain of the underlying bond indentures requirethe maintenance of various reserves. Such amounts
totaled $747 million at March 31, 2013 and are reportedas cash and investments in the General Debt ServiceFund and appropriate Other Governmental Funds,with a corresponding restriction of fund balance.
Following is a summary of the future minimumrental payments for lease/purchase and contractualobligation financing arrangements, including fixedrate interest at rates ranging from 0.2 percent to 6.8percent and variable rate interest at rates ranging from0.1 percent to 0.9 percent (amounts in millions):
Outstanding OutstandingIssuer April 1, 2012 Issued Redeemed March 31, 2013
Public Benefit Corporations (PBCs):Dormitory Authority . . . . . . . . . . . . . . . . . . . . . . . . . . . . . . . . . . $ 9,963 $ 2,386 $ 737 $ 11,612Environmental Facilities Corporation . . . . . . . . . . . . . . . . . . . . 872 —0 0 000 92 780Housing Finance Agency . . . . . . . . . . . . . . . . . . . . . . . . . . . . . 1,030 —0 0 000 116 914Local Government Assistance Corporation . . . . . . . . . . . . . . . 3,119 87 370 2,836Municipal Bond Bank Agency . . . . . . . . . . . . . . . . . . . . . . . . . . 369 281 356 294Metropolitan Transportation Authority . . . . . . . . . . . . . . . . . . . 2,006 —0 0 000 1,636 370Tobacco Settlement Financing Corporation . . . . . . . . . . . . . . . 2,690 —0 0 000 279 2,411Thruway Authority . . . . . . . . . . . . . . . . . . . . . . . . . . . . . . . . . . 11,365 523 918 10,970Urban Development Corporation . . . . . . . . . . . . . . . . . . . . . . . 9,031 821 991 8,861
Total . . . . . . . . . . . . . . . . . . . . . . . . . . . . . . . . . . . . . . . . . . . $ 40,445 $ 4,098 $ 5,495 $ 39,048
Future debt service is calculated using rates ineffect at March 31, 2013 for variable rate bonds. The netswap payment amounts were calculated by subtractingthe future variable rate interest payment subject toswap agreements based on rates in effect at March 31,2013 from the synthetic fixed rate amount intended tobe achieved by the swap agreements.
The actual amounts of future interest to be paid areaffected by changes in variable interest rates. Theactual amounts of future net swap payments are alsoaffected by changes in published indexes—the LondonInterbank Offered Rate (LIBOR) and the SecuritiesIndustry and Financial Markets Association (SIFMA),which are floating rates.
Net SwapFiscal Year Principal Interest Amount Total
2014 . . . . . . . . . . . . . . . . . . . . . . . . . . . . . . . . . . . . . . . . . . . . . . . $ 2,798 $ 1,832 $ 51 $ 4,6812015 . . . . . . . . . . . . . . . . . . . . . . . . . . . . . . . . . . . . . . . . . . . . . . . 2,774 1,703 49 4,5262016 . . . . . . . . . . . . . . . . . . . . . . . . . . . . . . . . . . . . . . . . . . . . . . . 2,793 1,559 46 4,3982017 . . . . . . . . . . . . . . . . . . . . . . . . . . . . . . . . . . . . . . . . . . . . . . . 2,791 1,431 44 4,2662018 . . . . . . . . . . . . . . . . . . . . . . . . . . . . . . . . . . . . . . . . . . . . . . . 2,833 1,301 39 4,1732019-2023 . . . . . . . . . . . . . . . . . . . . . . . . . . . . . . . . . . . . . . . . . . 12,904 4,505 143 17,5522024-2028 . . . . . . . . . . . . . . . . . . . . . . . . . . . . . . . . . . . . . . . . . . 7,075 2,164 60 9,2992029-2033 . . . . . . . . . . . . . . . . . . . . . . . . . . . . . . . . . . . . . . . . . . 3,465 915 16 4,3962034-2038 . . . . . . . . . . . . . . . . . . . . . . . . . . . . . . . . . . . . . . . . . . 1,286 254 —0 0 000 1,5402039-2043 . . . . . . . . . . . . . . . . . . . . . . . . . . . . . . . . . . . . . . . . . . 329 33 —0 0 000 362
Total . . . . . . . . . . . . . . . . . . . . . . . . . . . . . . . . . . . . . . . . . . . . . $ 39,048 $ 15,697 $ 448 $ 55,193
Chapter 56 of the Laws of 1993 authorized theNew York State Thruway Authority to issue up to $2.93billion in bonds for State highway and bridge projects(the amount of authorized bonds has been raisedthree times, most recently in 2005, up to $16.5 billion).The bonds are secured and funded by a dedication ofportions of the State’s petroleum business tax, motor
fuel tax, highway and fuel use tax, motor vehicleregistration fees, auto rental tax, transmission andtransportation tax and certain miscellaneous revenues.
Changes in lease/purchase and other financingarrangements for the year were as follows (amountsin millions):
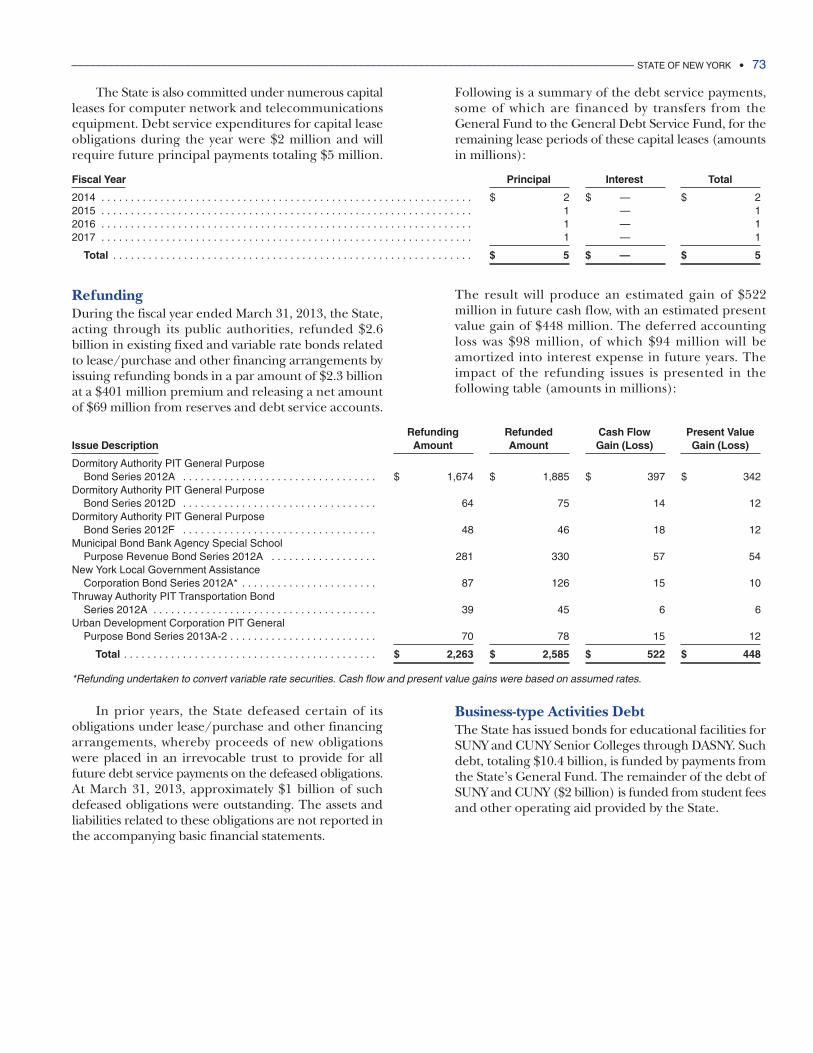
______________________________________________________________________________________________ STATE OF NEW YORK • 73
The State is also committed under numerous capitalleases for computer network and telecommunicationsequipment. Debt service expenditures for capital leaseobligations during the year were $2 million and willrequire future principal payments totaling $5 million.
Following is a summary of the debt service payments,some of which are financed by transfers from theGeneral Fund to the General Debt Service Fund, for theremaining lease periods of these capital leases (amountsin millions):
Fiscal Year Principal Interest Total
2014 . . . . . . . . . . . . . . . . . . . . . . . . . . . . . . . . . . . . . . . . . . . . . . . . . . . . . . . . . . . . . . . $ 2 $ —0 0 000 $ 22015 . . . . . . . . . . . . . . . . . . . . . . . . . . . . . . . . . . . . . . . . . . . . . . . . . . . . . . . . . . . . . . . 1 —0 0 000 12016 . . . . . . . . . . . . . . . . . . . . . . . . . . . . . . . . . . . . . . . . . . . . . . . . . . . . . . . . . . . . . . . 1 —0 0 000 12017 . . . . . . . . . . . . . . . . . . . . . . . . . . . . . . . . . . . . . . . . . . . . . . . . . . . . . . . . . . . . . . . 1 —0 0 000 1
Total . . . . . . . . . . . . . . . . . . . . . . . . . . . . . . . . . . . . . . . . . . . . . . . . . . . . . . . . . . . . . $ 5 $ —0 0 000 $ 5
RefundingDuring the fiscal year ended March 31, 2013, the State,acting through its public authorities, refunded $2.6billion in existing fixed and variable rate bonds relatedto lease/purchase and other financing arrangements byissuing refunding bonds in a par amount of $2.3 billionat a $401 million premium and releasing a net amountof $69 million from reserves and debt service accounts.
The result will produce an estimated gain of $522million in future cash flow, with an estimated presentvalue gain of $448 million. The deferred accountingloss was $98 million, of which $94 million will beamortized into interest expense in future years. Theimpact of the refunding issues is presented in thefollowing table (amounts in millions):
Refunding Refunded Cash Flow Present Value Issue Description Amount Amount Gain (Loss) Gain (Loss)
Dormitory Authority PIT General Purpose Bond Series 2012A . . . . . . . . . . . . . . . . . . . . . . . . . . . . . . . . . $ 1,674 $ 1,885 $ 397 $ 342
Dormitory Authority PIT General Purpose Bond Series 2012D . . . . . . . . . . . . . . . . . . . . . . . . . . . . . . . . . 64 75 14 12
Dormitory Authority PIT General Purpose Bond Series 2012F . . . . . . . . . . . . . . . . . . . . . . . . . . . . . . . . . 48 46 18 12
Municipal Bond Bank Agency Special SchoolPurpose Revenue Bond Series 2012A . . . . . . . . . . . . . . . . . . 281 330 57 54
New York Local Government AssistanceCorporation Bond Series 2012A* . . . . . . . . . . . . . . . . . . . . . . . 87 126 15 10
Thruway Authority PIT Transportation BondSeries 2012A . . . . . . . . . . . . . . . . . . . . . . . . . . . . . . . . . . . . . . 39 45 6 6
Urban Development Corporation PIT GeneralPurpose Bond Series 2013A-2 . . . . . . . . . . . . . . . . . . . . . . . . . 70 78 15 12
Total . . . . . . . . . . . . . . . . . . . . . . . . . . . . . . . . . . . . . . . . . . . $ 2,263 $ 2,585 $ 522 $ 448
*Refunding undertaken to convert variable rate securities. Cash flow and present value gains were based on assumed rates.
In prior years, the State defeased certain of itsobligations under lease/purchase and other financingarrangements, whereby proceeds of new obligationswere placed in an irrevocable trust to provide for allfuture debt service payments on the defeased obligations.At March 31, 2013, approximately $1 billion of suchdefeased obligations were outstanding. The assets andliabilities related to these obligations are not reported inthe accompanying basic financial statements.
Business-type Activities DebtThe State has issued bonds for educational facilities forSUNY and CUNY Senior Colleges through DASNY. Suchdebt, totaling $10.4 billion, is funded by payments fromthe State’s General Fund. The remainder of the debt ofSUNY and CUNY ($2 billion) is funded from student feesand other operating aid provided by the State.
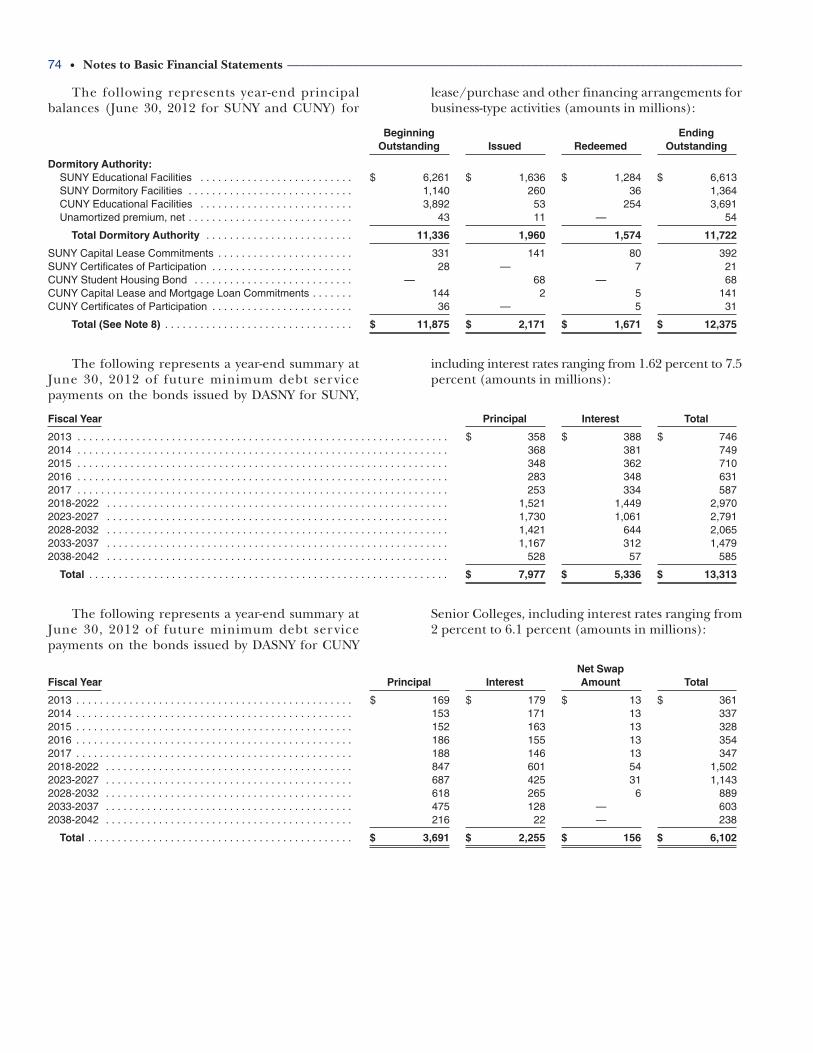
74 • Notes to Basic Financial Statements ____________________________________________________________________________
The following represents a year-end summary atJune 30, 2012 of future minimum debt ser vicepayments on the bonds issued by DASNY for CUNY
Senior Colleges, including interest rates ranging from2 percent to 6.1 percent (amounts in millions):
Beginning EndingOutstanding Issued Redeemed Outstanding
Dormitory Authority:SUNY Educational Facilities . . . . . . . . . . . . . . . . . . . . . . . . . . $ 6,261 $ 1,636 $ 1,284 $ 6,613SUNY Dormitory Facilities . . . . . . . . . . . . . . . . . . . . . . . . . . . . 1,140 260 36 1,364CUNY Educational Facilities . . . . . . . . . . . . . . . . . . . . . . . . . . 3,892 53 254 3,691Unamortized premium, net . . . . . . . . . . . . . . . . . . . . . . . . . . . . 43 11 —0 0 000 54
Total Dormitory Authority . . . . . . . . . . . . . . . . . . . . . . . . . 11,336 1,960 1,574 11,722
SUNY Capital Lease Commitments . . . . . . . . . . . . . . . . . . . . . . . 331 141 80 392SUNY Certificates of Participation . . . . . . . . . . . . . . . . . . . . . . . . 28 —0 0 000 7 21CUNY Student Housing Bond . . . . . . . . . . . . . . . . . . . . . . . . . . . —0 0 000 68 —0 0 000 68CUNY Capital Lease and Mortgage Loan Commitments . . . . . . . 144 2 5 141CUNY Certificates of Participation . . . . . . . . . . . . . . . . . . . . . . . . 36 —0 0 000 5 31
Total (See Note 8) . . . . . . . . . . . . . . . . . . . . . . . . . . . . . . . . $ 11,875 $ 2,171 $ 1,671 $ 12,375
Fiscal Year Principal Interest Total
2013 . . . . . . . . . . . . . . . . . . . . . . . . . . . . . . . . . . . . . . . . . . . . . . . . . . . . . . . . . . . . . . . $ 358 $ 388 $ 7462014 . . . . . . . . . . . . . . . . . . . . . . . . . . . . . . . . . . . . . . . . . . . . . . . . . . . . . . . . . . . . . . . 368 381 7492015 . . . . . . . . . . . . . . . . . . . . . . . . . . . . . . . . . . . . . . . . . . . . . . . . . . . . . . . . . . . . . . . 348 362 7102016 . . . . . . . . . . . . . . . . . . . . . . . . . . . . . . . . . . . . . . . . . . . . . . . . . . . . . . . . . . . . . . . 283 348 6312017 . . . . . . . . . . . . . . . . . . . . . . . . . . . . . . . . . . . . . . . . . . . . . . . . . . . . . . . . . . . . . . . 253 334 5872018-2022 . . . . . . . . . . . . . . . . . . . . . . . . . . . . . . . . . . . . . . . . . . . . . . . . . . . . . . . . . . 1,521 1,449 2,9702023-2027 . . . . . . . . . . . . . . . . . . . . . . . . . . . . . . . . . . . . . . . . . . . . . . . . . . . . . . . . . . 1,730 1,061 2,7912028-2032 . . . . . . . . . . . . . . . . . . . . . . . . . . . . . . . . . . . . . . . . . . . . . . . . . . . . . . . . . . 1,421 644 2,0652033-2037 . . . . . . . . . . . . . . . . . . . . . . . . . . . . . . . . . . . . . . . . . . . . . . . . . . . . . . . . . . 1,167 312 1,4792038-2042 . . . . . . . . . . . . . . . . . . . . . . . . . . . . . . . . . . . . . . . . . . . . . . . . . . . . . . . . . . 528 57 585
Total . . . . . . . . . . . . . . . . . . . . . . . . . . . . . . . . . . . . . . . . . . . . . . . . . . . . . . . . . . . . . $ 7,977 $ 5,336 $ 13,313
Net Swap Fiscal Year Principal Interest Amount Total
2013 . . . . . . . . . . . . . . . . . . . . . . . . . . . . . . . . . . . . . . . . . . . . . . . $ 169 $ 179 $ 13 $ 3612014 . . . . . . . . . . . . . . . . . . . . . . . . . . . . . . . . . . . . . . . . . . . . . . . 153 171 13 3372015 . . . . . . . . . . . . . . . . . . . . . . . . . . . . . . . . . . . . . . . . . . . . . . . 152 163 13 3282016 . . . . . . . . . . . . . . . . . . . . . . . . . . . . . . . . . . . . . . . . . . . . . . . 186 155 13 3542017 . . . . . . . . . . . . . . . . . . . . . . . . . . . . . . . . . . . . . . . . . . . . . . . 188 146 13 3472018-2022 . . . . . . . . . . . . . . . . . . . . . . . . . . . . . . . . . . . . . . . . . . 847 601 54 1,5022023-2027 . . . . . . . . . . . . . . . . . . . . . . . . . . . . . . . . . . . . . . . . . . 687 425 31 1,1432028-2032 . . . . . . . . . . . . . . . . . . . . . . . . . . . . . . . . . . . . . . . . . . 618 265 6 8892033-2037 . . . . . . . . . . . . . . . . . . . . . . . . . . . . . . . . . . . . . . . . . . 475 128 —0 0 000 6032038-2042 . . . . . . . . . . . . . . . . . . . . . . . . . . . . . . . . . . . . . . . . . . 216 22 —0 0 000 238
Total . . . . . . . . . . . . . . . . . . . . . . . . . . . . . . . . . . . . . . . . . . . . . $ 3,691 $ 2,255 $ 156 $ 6,102
The following represents year-end principalbalances (June 30, 2012 for SUNY and CUNY) for
lease/purchase and other financing arrangements forbusiness-type activities (amounts in millions):
The following represents a year-end summary atJune 30, 2012 of future minimum debt ser vicepayments on the bonds issued by DASNY for SUNY,
including interest rates ranging from 1.62 percent to 7.5percent (amounts in millions):
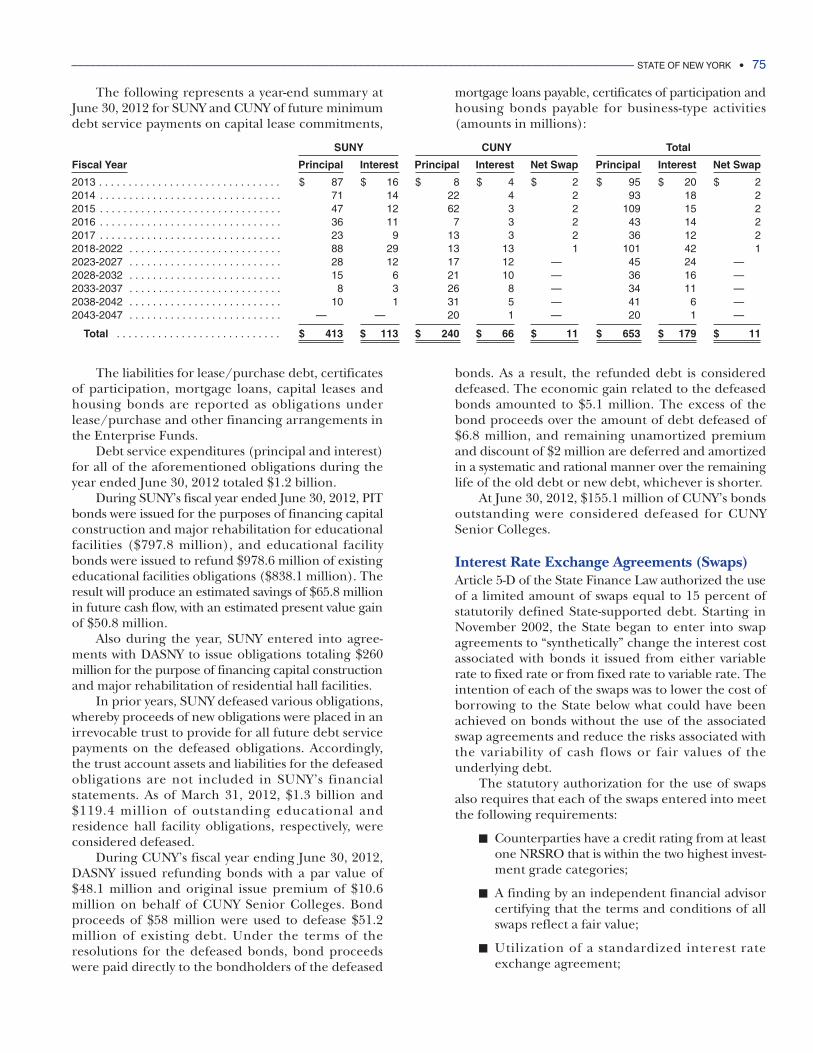
______________________________________________________________________________________________ STATE OF NEW YORK • 75
The following represents a year-end summary atJune 30, 2012 for SUNY and CUNY of future minimumdebt service payments on capital lease commitments,
mortgage loans payable, certificates of participation andhousing bonds payable for business-type activities(amounts in millions):
Fiscal Year Principal Interest Principal Interest Net Swap Principal Interest Net Swap
2013 . . . . . . . . . . . . . . . . . . . . . . . . . . . . . . . $ 87 $ 16 $ 8 $ 4 $ 2 $ 95 $ 20 $ 22014 . . . . . . . . . . . . . . . . . . . . . . . . . . . . . . . 71 14 22 4 2 93 18 22015 . . . . . . . . . . . . . . . . . . . . . . . . . . . . . . . 47 12 62 3 2 109 15 22016 . . . . . . . . . . . . . . . . . . . . . . . . . . . . . . . 36 11 7 3 2 43 14 22017 . . . . . . . . . . . . . . . . . . . . . . . . . . . . . . . 23 9 13 3 2 36 12 22018-2022 . . . . . . . . . . . . . . . . . . . . . . . . . . 88 29 13 13 1 101 42 12023-2027 . . . . . . . . . . . . . . . . . . . . . . . . . . 28 12 17 12 —000 45 24 —0002028-2032 . . . . . . . . . . . . . . . . . . . . . . . . . . 15 6 21 10 —000 36 16 —0002033-2037 . . . . . . . . . . . . . . . . . . . . . . . . . . 8 3 26 8 —000 34 11 —0002038-2042 . . . . . . . . . . . . . . . . . . . . . . . . . . 10 1 31 5 —000 41 6 —0002043-2047 . . . . . . . . . . . . . . . . . . . . . . . . . . —000 —00 20 1 —000 20 1 —000
Total . . . . . . . . . . . . . . . . . . . . . . . . . . . . $ 413 $ 113 $ 240 $ 66 $ 11 $ 653 $ 179 $ 11
SUNY CUNY Total
The liabilities for lease/purchase debt, certificatesof participation, mortgage loans, capital leases andhousing bonds are reported as obligations underlease/purchase and other financing arrangements inthe Enterprise Funds.
Debt service expenditures (principal and interest)for all of the aforementioned obligations during theyear ended June 30, 2012 totaled $1.2 billion.
During SUNY’s fiscal year ended June 30, 2012, PITbonds were issued for the purposes of financing capitalconstruction and major rehabilitation for educationalfacilities ($797.8 million), and educational facilitybonds were issued to refund $978.6 million of existingeducational facilities obligations ($838.1 million). Theresult will produce an estimated savings of $65.8 millionin future cash flow, with an estimated present value gainof $50.8 million.
Also during the year, SUNY entered into agree-ments with DASNY to issue obligations totaling $260million for the purpose of financing capital constructionand major rehabilitation of residential hall facilities.
In prior years, SUNY defeased various obligations,whereby proceeds of new obligations were placed in anirrevocable trust to provide for all future debt servicepayments on the defeased obligations. Accordingly,the trust account assets and liabilities for the defeasedobligations are not included in SUNY’s financialstatements. As of March 31, 2012, $1.3 billion and$119.4 million of outstanding educational andresidence hall facility obligations, respectively, wereconsidered defeased.
During CUNY’s fiscal year ending June 30, 2012,DASNY issued refunding bonds with a par value of$48.1 million and original issue premium of $10.6million on behalf of CUNY Senior Colleges. Bondproceeds of $58 million were used to defease $51.2million of existing debt. Under the terms of theresolutions for the defeased bonds, bond proceedswere paid directly to the bondholders of the defeased
bonds. As a result, the refunded debt is considereddefeased. The economic gain related to the defeasedbonds amounted to $5.1 million. The excess of thebond proceeds over the amount of debt defeased of$6.8 million, and remaining unamortized premiumand discount of $2 million are deferred and amortizedin a systematic and rational manner over the remaininglife of the old debt or new debt, whichever is shorter.
At June 30, 2012, $155.1 million of CUNY’s bondsoutstanding were considered defeased for CUNYSenior Colleges.
Interest Rate Exchange Agreements (Swaps)Article 5-D of the State Finance Law authorized the useof a limited amount of swaps equal to 15 percent ofstatutorily defined State-supported debt. Starting inNovember 2002, the State began to enter into swapagreements to “synthetically” change the interest costassociated with bonds it issued from either variablerate to fixed rate or from fixed rate to variable rate. Theintention of each of the swaps was to lower the cost ofborrowing to the State below what could have beenachieved on bonds without the use of the associatedswap agreements and reduce the risks associated withthe variability of cash flows or fair values of theunderlying debt.
The statutory authorization for the use of swapsalso requires that each of the swaps entered into meetthe following requirements:
y Counterparties have a credit rating from at leastone NRSRO that is within the two highest invest-ment grade categories;
y A finding by an independent financial advisorcertifying that the terms and conditions of allswaps reflect a fair value;
y Utilization of a standardized interest rateexchange agreement;
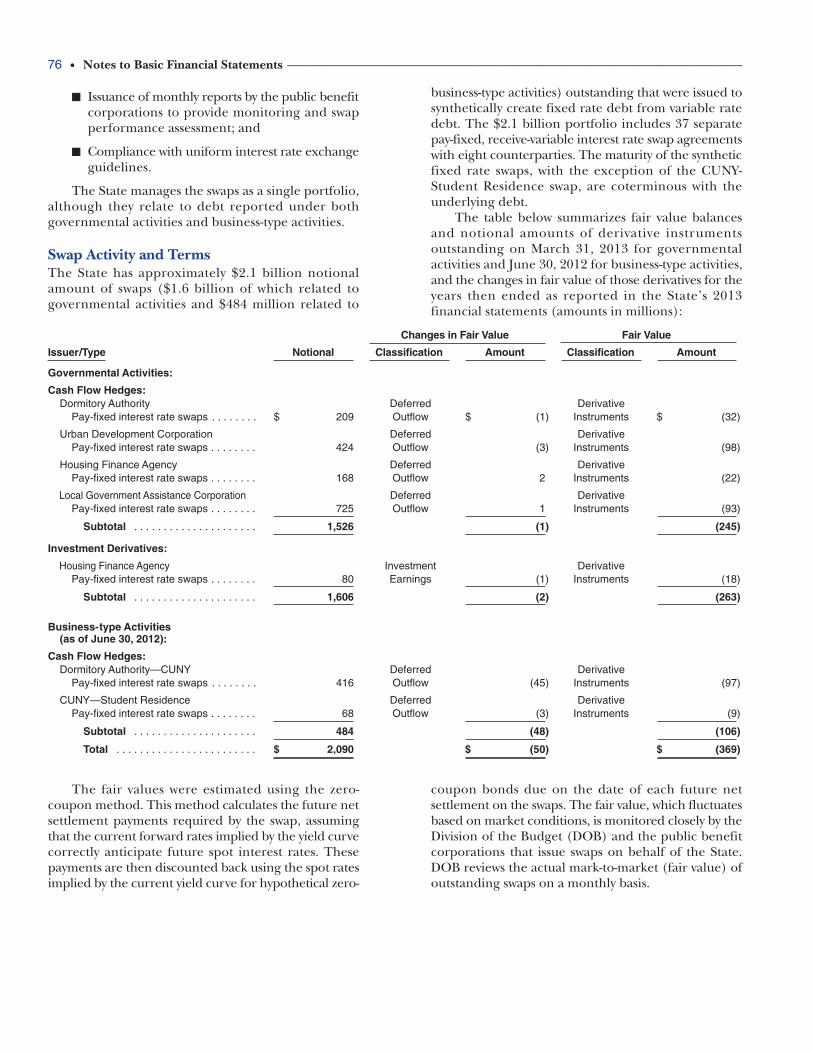
76 • Notes to Basic Financial Statements ____________________________________________________________________________
Changes in Fair Value Fair Value
Issuer/Type Notional Classification Amount Classification Amount
Governmental Activities:
Cash Flow Hedges:Dormitory Authority Deferred Derivative
Pay-fixed interest rate swaps . . . . . . . . $ 209 Outflow $ (1)0 0 Instruments $ (32)
Urban Development Corporation Deferred DerivativePay-fixed interest rate swaps . . . . . . . . 424 Outflow (3) Instruments (98)
Housing Finance Agency Deferred DerivativePay-fixed interest rate swaps . . . . . . . . 168 Outflow 2 Instruments (22)
Local Government Assistance Corporation Deferred DerivativePay-fixed interest rate swaps . . . . . . . . 725 Outflow 1 Instruments (93)
Subtotal . . . . . . . . . . . . . . . . . . . . . 1,526 (1) (245)
Investment Derivatives:
Housing Finance Agency Investment DerivativePay-fixed interest rate swaps . . . . . . . . 80 Earnings (1) Instruments (18)
Subtotal . . . . . . . . . . . . . . . . . . . . . 1,606 (2) (263)
Business-type Activities(as of June 30, 2012):
Cash Flow Hedges:Dormitory Authority—CUNY Deferred Derivative
Pay-fixed interest rate swaps . . . . . . . . 416 Outflow (45) Instruments (97)
CUNY—Student Residence Deferred DerivativePay-fixed interest rate swaps . . . . . . . . 68 Outflow (3) Instruments (9)
Subtotal . . . . . . . . . . . . . . . . . . . . . 484 (48) (106)
Total . . . . . . . . . . . . . . . . . . . . . . . . $ 2,090 $ (50) $ (369)
y Issuance of monthly reports by the public benefitcorporations to provide monitoring and swapperformance assessment; and
y Compliance with uniform interest rate exchangeguidelines.
The State manages the swaps as a single portfolio,although they relate to debt reported under bothgovernmental activities and business-type activities.
Swap Activity and TermsThe State has approximately $2.1 billion notionalamount of swaps ($1.6 billion of which related togovernmental activities and $484 million related to
business-type activities) outstanding that were issued tosynthetically create fixed rate debt from variable ratedebt. The $2.1 billion portfolio includes 37 separatepay-fixed, receive-variable interest rate swap agreementswith eight counterparties. The maturity of the syntheticfixed rate swaps, with the exception of the CUNY-Student Residence swap, are coterminous with theunderlying debt.
The table below summarizes fair value balancesand notional amounts of derivative instrumentsoutstanding on March 31, 2013 for governmentalactivities and June 30, 2012 for business-type activities,and the changes in fair value of those derivatives for theyears then ended as reported in the State’s 2013financial statements (amounts in millions):
The fair values were estimated using the zero-coupon method. This method calculates the future netsettlement payments required by the swap, assumingthat the current forward rates implied by the yield curvecorrectly anticipate future spot interest rates. Thesepayments are then discounted back using the spot ratesimplied by the current yield curve for hypothetical zero-
coupon bonds due on the date of each future netsettlement on the swaps. The fair value, which fluctuatesbased on market conditions, is monitored closely by theDivision of the Budget (DOB) and the public benefitcorporations that issue swaps on behalf of the State.DOB reviews the actual mark-to-market (fair value) ofoutstanding swaps on a monthly basis.
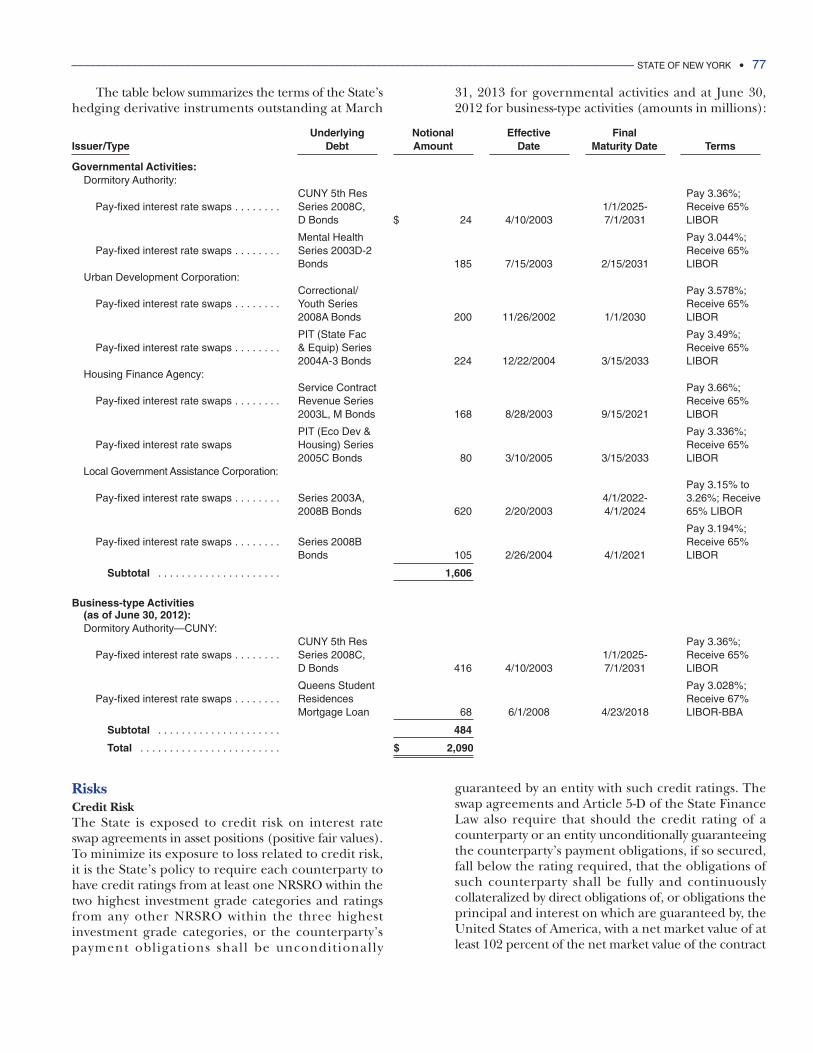
______________________________________________________________________________________________ STATE OF NEW YORK • 77
The table below summarizes the terms of the State’shedging derivative instruments outstanding at March
31, 2013 for governmental activities and at June 30,2012 for business-type activities (amounts in millions):
Underlying Notional Effective FinalIssuer/Type Debt Amount Date Maturity Date Terms
Governmental Activities:Dormitory Authority:
CUNY 5th Res Pay 3.36%;Pay-fixed interest rate swaps . . . . . . . . Series 2008C, 0 0 1/1/2025- Receive 65%
D Bonds $ 24 4/10/2003 7/1/2031 LIBOR
Mental Health Pay 3.044%;Pay-fixed interest rate swaps . . . . . . . . Series 2003D-2 0 0 Receive 65%
Bonds 185 7/15/2003 2/15/2031 LIBORUrban Development Corporation:
Correctional/ Pay 3.578%;Pay-fixed interest rate swaps . . . . . . . . Youth Series 0 0 Receive 65%
2008A Bonds 200 11/26/2002 1/1/2030 LIBOR
PIT (State Fac Pay 3.49%;Pay-fixed interest rate swaps . . . . . . . . & Equip) Series 0 0 Receive 65%
2004A-3 Bonds 224 12/22/2004 3/15/2033 LIBORHousing Finance Agency:
Service Contract Pay 3.66%;Pay-fixed interest rate swaps . . . . . . . . Revenue Series 0 0 Receive 65%
2003L, M Bonds 168 8/28/2003 9/15/2021 LIBOR
PIT (Eco Dev & Pay 3.336%;Pay-fixed interest rate swaps Housing) Series 0 0 Receive 65%
2005C Bonds 80 3/10/2005 3/15/2033 LIBORLocal Government Assistance Corporation:
Pay 3.15% toPay-fixed interest rate swaps . . . . . . . . Series 2003A, 0 0 4/1/2022- 3.26%; Receive
2008B Bonds 620 2/20/2003 4/1/2024 65% LIBOR
Pay 3.194%;Pay-fixed interest rate swaps . . . . . . . . Series 2008B 0 0 Receive 65%
Bonds 105 2/26/2004 4/1/2021 LIBOR
Subtotal . . . . . . . . . . . . . . . . . . . . . 1,606
Business-type Activities (as of June 30, 2012):Dormitory Authority—CUNY:
CUNY 5th Res Pay 3.36%;Pay-fixed interest rate swaps . . . . . . . . Series 2008C, 0 0 1/1/2025- Receive 65%
D Bonds 416 4/10/2003 7/1/2031 LIBOR
Queens Student Pay 3.028%;Pay-fixed interest rate swaps . . . . . . . . Residences 0 0 Receive 67%
Mortgage Loan 68 6/1/2008 4/23/2018 LIBOR-BBA
Subtotal . . . . . . . . . . . . . . . . . . . . . 484
Total . . . . . . . . . . . . . . . . . . . . . . . . $ 2,090
RisksCredit RiskThe State is exposed to credit risk on interest rateswap agreements in asset positions (positive fair values).To minimize its exposure to loss related to credit risk,it is the State’s policy to require each counterparty tohave credit ratings from at least one NRSRO within thetwo highest investment grade categories and ratingsfrom any other NRSRO within the three highestinvestment grade categories, or the counterparty’spayment obligations shall be unconditionally
guaranteed by an entity with such credit ratings. Theswap agreements and Article 5-D of the State FinanceLaw also require that should the credit rating of acounterparty or an entity unconditionally guaranteeingthe counterparty’s payment obligations, if so secured,fall below the rating required, that the obligations ofsuch counterparty shall be fully and continuouslycollateralized by direct obligations of, or obligations theprincipal and interest on which are guaranteed by, theUnited States of America, with a net market value of atleast 102 percent of the net market value of the contract
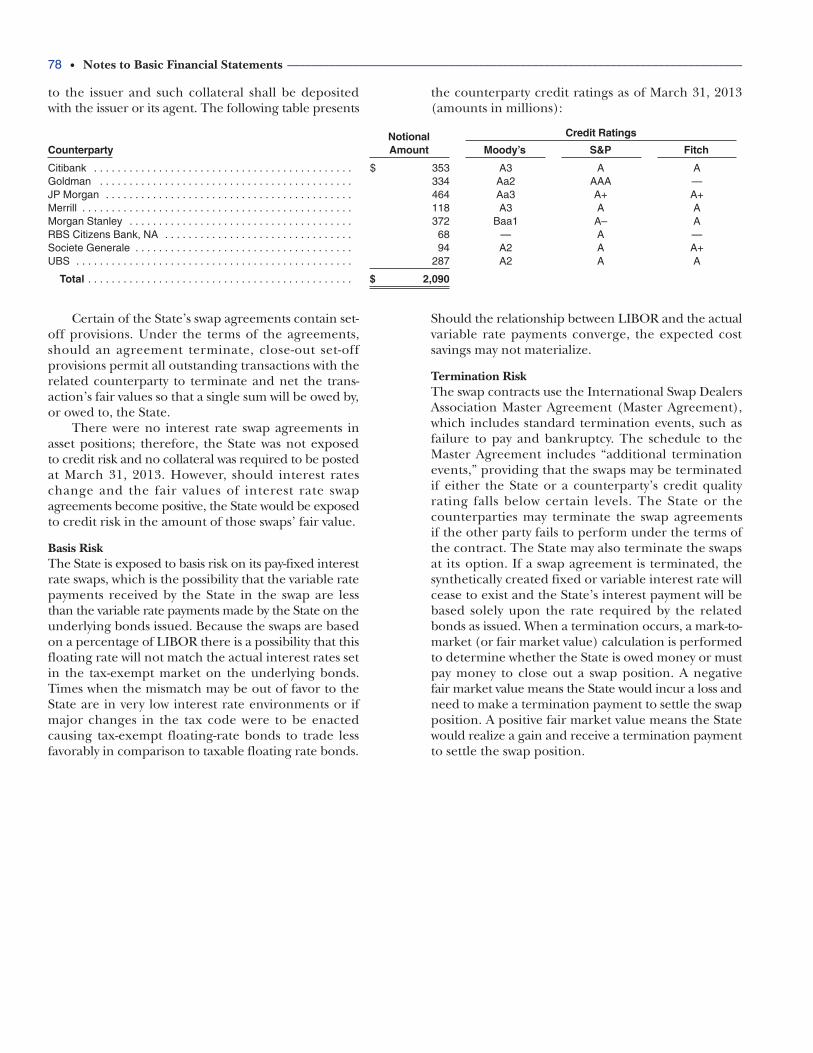
78 • Notes to Basic Financial Statements ____________________________________________________________________________
NotionalCounterparty Amount Moody’s S&P Fitch
Citibank . . . . . . . . . . . . . . . . . . . . . . . . . . . . . . . . . . . . . . . . . . . . $ 353 A3 A AGoldman . . . . . . . . . . . . . . . . . . . . . . . . . . . . . . . . . . . . . . . . . . . 334 Aa2 AAA —JP Morgan . . . . . . . . . . . . . . . . . . . . . . . . . . . . . . . . . . . . . . . . . . 464 Aa3 A+ A+Merrill . . . . . . . . . . . . . . . . . . . . . . . . . . . . . . . . . . . . . . . . . . . . . . 118 A3 A AMorgan Stanley . . . . . . . . . . . . . . . . . . . . . . . . . . . . . . . . . . . . . . 372 Baa1 A– ARBS Citizens Bank, NA . . . . . . . . . . . . . . . . . . . . . . . . . . . . . . . . 68 — A —Societe Generale . . . . . . . . . . . . . . . . . . . . . . . . . . . . . . . . . . . . . 94 A2 A A+UBS . . . . . . . . . . . . . . . . . . . . . . . . . . . . . . . . . . . . . . . . . . . . . . . 287 A2 A A
Total . . . . . . . . . . . . . . . . . . . . . . . . . . . . . . . . . . . . . . . . . . . . . $ 2,090
Credit Ratings
to the issuer and such collateral shall be depositedwith the issuer or its agent. The following table presents
the counterparty credit ratings as of March 31, 2013(amounts in millions):
Certain of the State’s swap agreements contain set-off provisions. Under the terms of the agreements,should an agreement terminate, close-out set-offprovisions permit all outstanding transactions with therelated counterparty to terminate and net the trans-action’s fair values so that a single sum will be owed by,or owed to, the State.
There were no interest rate swap agreements inasset positions; therefore, the State was not exposedto credit risk and no collateral was required to be postedat March 31, 2013. However, should interest rateschange and the fair values of interest rate swapagreements become positive, the State would be exposedto credit risk in the amount of those swaps’ fair value.
Basis RiskThe State is exposed to basis risk on its pay-fixed interestrate swaps, which is the possibility that the variable ratepayments received by the State in the swap are lessthan the variable rate payments made by the State on theunderlying bonds issued. Because the swaps are basedon a percentage of LIBOR there is a possibility that thisfloating rate will not match the actual interest rates setin the tax-exempt market on the underlying bonds.Times when the mismatch may be out of favor to theState are in very low interest rate environments or ifmajor changes in the tax code were to be enactedcausing tax-exempt floating-rate bonds to trade lessfavorably in comparison to taxable floating rate bonds.
Should the relationship between LIBOR and the actualvariable rate payments converge, the expected costsavings may not materialize.
Termination RiskThe swap contracts use the International Swap DealersAssociation Master Agreement (Master Agreement),which includes standard termination events, such asfailure to pay and bankruptcy. The schedule to theMaster Agreement includes “additional terminationevents,” providing that the swaps may be terminatedif either the State or a counterparty’s credit qualityrating falls below certain levels. The State or thecounterparties may terminate the swap agreementsif the other party fails to perform under the terms ofthe contract. The State may also terminate the swapsat its option. If a swap agreement is terminated, thesynthetically created fixed or variable interest rate willcease to exist and the State’s interest payment will bebased solely upon the rate required by the relatedbonds as issued. When a termination occurs, a mark-to-market (or fair market value) calculation is performedto determine whether the State is owed money or mustpay money to close out a swap position. A negativefair market value means the State would incur a loss andneed to make a termination payment to settle the swapposition. A positive fair market value means the Statewould realize a gain and receive a termination paymentto settle the swap position.
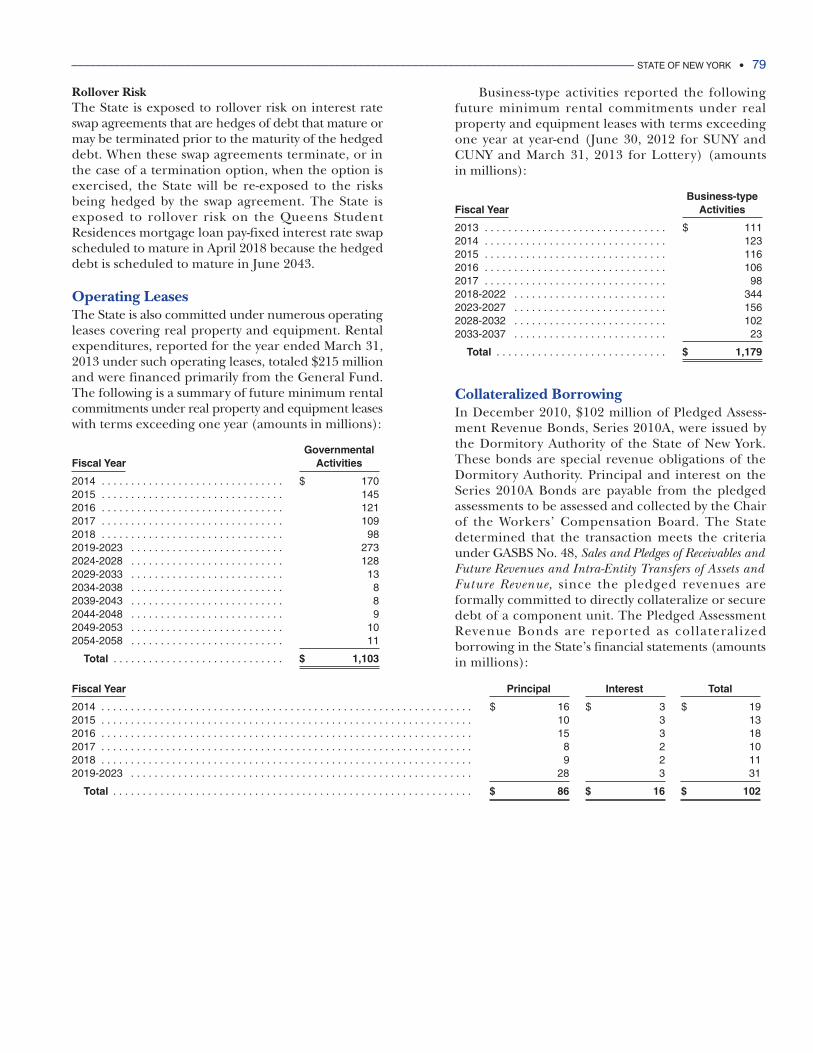
______________________________________________________________________________________________ STATE OF NEW YORK • 79
Rollover RiskThe State is exposed to rollover risk on interest rateswap agreements that are hedges of debt that mature ormay be terminated prior to the maturity of the hedgeddebt. When these swap agreements terminate, or inthe case of a termination option, when the option isexercised, the State will be re-exposed to the risksbeing hedged by the swap agreement. The State isexposed to rollover risk on the Queens StudentResidences mortgage loan pay-fixed interest rate swapscheduled to mature in April 2018 because the hedgeddebt is scheduled to mature in June 2043.
Operating LeasesThe State is also committed under numerous operatingleases covering real property and equipment. Rentalexpenditures, reported for the year ended March 31,2013 under such operating leases, totaled $215 millionand were financed primarily from the General Fund.The following is a summary of future minimum rentalcommitments under real property and equipment leaseswith terms exceeding one year (amounts in millions):
GovernmentalFiscal Year Activities
2014 . . . . . . . . . . . . . . . . . . . . . . . . . . . . . . . $ 1702015 . . . . . . . . . . . . . . . . . . . . . . . . . . . . . . . 1452016 . . . . . . . . . . . . . . . . . . . . . . . . . . . . . . . 1212017 . . . . . . . . . . . . . . . . . . . . . . . . . . . . . . . 1092018 . . . . . . . . . . . . . . . . . . . . . . . . . . . . . . . 982019-2023 . . . . . . . . . . . . . . . . . . . . . . . . . . 2732024-2028 . . . . . . . . . . . . . . . . . . . . . . . . . . 1282029-2033 . . . . . . . . . . . . . . . . . . . . . . . . . . 132034-2038 . . . . . . . . . . . . . . . . . . . . . . . . . . 82039-2043 . . . . . . . . . . . . . . . . . . . . . . . . . . 82044-2048 . . . . . . . . . . . . . . . . . . . . . . . . . . 92049-2053 . . . . . . . . . . . . . . . . . . . . . . . . . . 102054-2058 . . . . . . . . . . . . . . . . . . . . . . . . . . 11
Total . . . . . . . . . . . . . . . . . . . . . . . . . . . . . $ 1,103
Business-type activities reported the followingfuture minimum rental commitments under realproperty and equipment leases with terms exceedingone year at year-end (June 30, 2012 for SUNY andCUNY and March 31, 2013 for Lottery) (amountsin millions):
Business-type Fiscal Year Activities
2013 . . . . . . . . . . . . . . . . . . . . . . . . . . . . . . . $ 1112014 . . . . . . . . . . . . . . . . . . . . . . . . . . . . . . . 1232015 . . . . . . . . . . . . . . . . . . . . . . . . . . . . . . . 1162016 . . . . . . . . . . . . . . . . . . . . . . . . . . . . . . . 1062017 . . . . . . . . . . . . . . . . . . . . . . . . . . . . . . . 982018-2022 . . . . . . . . . . . . . . . . . . . . . . . . . . 3442023-2027 . . . . . . . . . . . . . . . . . . . . . . . . . . 1562028-2032 . . . . . . . . . . . . . . . . . . . . . . . . . . 1022033-2037 . . . . . . . . . . . . . . . . . . . . . . . . . . 23
Total . . . . . . . . . . . . . . . . . . . . . . . . . . . . . $ 1,179
Collateralized BorrowingIn December 2010, $102 million of Pledged Assess-ment Revenue Bonds, Series 2010A, were issued bythe Dormitory Authority of the State of New York.These bonds are special revenue obligations of theDormitory Authority. Principal and interest on theSeries 2010A Bonds are payable from the pledgedassessments to be assessed and collected by the Chairof the Workers’ Compensation Board. The Statedetermined that the transaction meets the criteriaunder GASBS No. 48, Sales and Pledges of Receivables andFuture Revenues and Intra-Entity Transfers of Assets andFuture Revenue, since the pledged revenues areformally committed to directly collateralize or securedebt of a component unit. The Pledged AssessmentRevenue Bonds are reported as collateralizedborrowing in the State’s financial statements (amountsin millions):
Fiscal Year Principal Interest Total
2014 . . . . . . . . . . . . . . . . . . . . . . . . . . . . . . . . . . . . . . . . . . . . . . . . . . . . . . . . . . . . . . . $ 16 $ 3 $ 192015 . . . . . . . . . . . . . . . . . . . . . . . . . . . . . . . . . . . . . . . . . . . . . . . . . . . . . . . . . . . . . . . 10 3 132016 . . . . . . . . . . . . . . . . . . . . . . . . . . . . . . . . . . . . . . . . . . . . . . . . . . . . . . . . . . . . . . . 15 3 182017 . . . . . . . . . . . . . . . . . . . . . . . . . . . . . . . . . . . . . . . . . . . . . . . . . . . . . . . . . . . . . . . 8 2 102018 . . . . . . . . . . . . . . . . . . . . . . . . . . . . . . . . . . . . . . . . . . . . . . . . . . . . . . . . . . . . . . . 9 2 112019-2023 . . . . . . . . . . . . . . . . . . . . . . . . . . . . . . . . . . . . . . . . . . . . . . . . . . . . . . . . . . 28 3 31
Total . . . . . . . . . . . . . . . . . . . . . . . . . . . . . . . . . . . . . . . . . . . . . . . . . . . . . . . . . . . . . $ 86 $ 16 $ 102
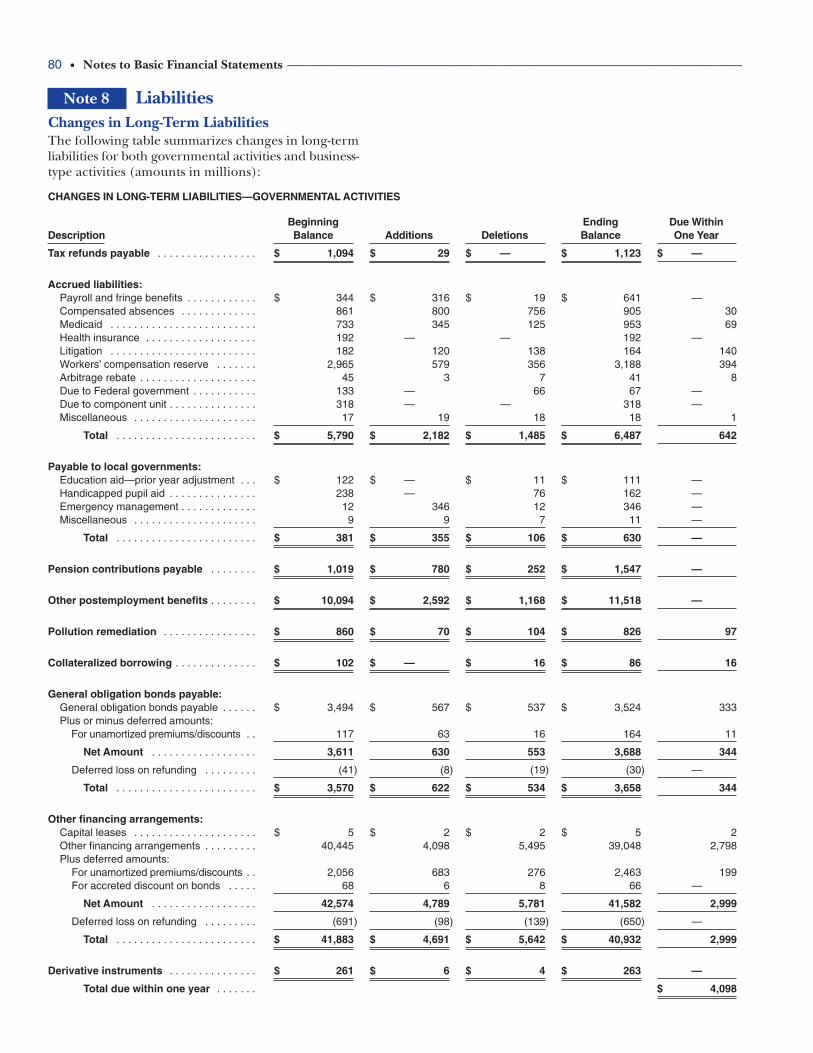
80 • Notes to Basic Financial Statements ____________________________________________________________________________
Changes in Long-Term LiabilitiesThe following table summarizes changes in long-termliabilities for both governmental activities and business-type activities (amounts in millions):
Note 8 Liabilities
CHANGES IN LONG-TERM LIABILITIES—GOVERNMENTAL ACTIVITIES
Beginning Ending Due Within Description Balance Additions Deletions Balance One Year
Tax refunds payable . . . . . . . . . . . . . . . . . $ 1,094 $ 29 $ —0 0 000 $ 1,123 $ —0 0 000
Accrued liabilities:Payroll and fringe benefits . . . . . . . . . . . . $ 344 $ 316 $ 19 $ 641 —0 0 000Compensated absences . . . . . . . . . . . . . 861 800 756 905 30Medicaid . . . . . . . . . . . . . . . . . . . . . . . . . 733 345 125 953 69Health insurance . . . . . . . . . . . . . . . . . . . 192 —0 0 000 —0 0 000 192 —0 0 000Litigation . . . . . . . . . . . . . . . . . . . . . . . . . 182 120 138 164 140Workers’ compensation reserve . . . . . . . 2,965 579 356 3,188 394Arbitrage rebate . . . . . . . . . . . . . . . . . . . . 45 3 7 41 8Due to Federal government . . . . . . . . . . . 133 —0 0 000 66 67 —0 0 000Due to component unit . . . . . . . . . . . . . . . 318 —0 0 000 —0 0 000 318 —0 0 000Miscellaneous . . . . . . . . . . . . . . . . . . . . . 17 19 18 18 1
Total . . . . . . . . . . . . . . . . . . . . . . . . $ 5,790 $ 2,182 $ 1,485 $ 6,487 642
Payable to local governments:Education aid—prior year adjustment . . . $ 122 $ —0 0 000 $ 11 $ 111 —0 0 000Handicapped pupil aid . . . . . . . . . . . . . . . 238 —0 0 000 76 162 —0 0 000Emergency management . . . . . . . . . . . . . 12 346 12 346 —0 0 000Miscellaneous . . . . . . . . . . . . . . . . . . . . . 9 9 7 11 —0 0 000
Total . . . . . . . . . . . . . . . . . . . . . . . . $ 381 $ 355 $ 106 $ 630 —0 0 000
Pension contributions payable . . . . . . . . $ 1,019 $ 780 $ 252 $ 1,547 —0 0 000
Other postemployment benefits . . . . . . . . $ 10,094 $ 2,592 $ 1,168 $ 11,518 —0 0 000
Pollution remediation . . . . . . . . . . . . . . . . $ 860 $ 70 $ 104 $ 826 97
Collateralized borrowing . . . . . . . . . . . . . . $ 102 $ —0 0 000 $ 16 $ 86 16
General obligation bonds payable:General obligation bonds payable . . . . . . $ 3,494 $ 567 $ 537 $ 3,524 333Plus or minus deferred amounts:
For unamortized premiums/discounts . . 117 63 16 164 11
Net Amount . . . . . . . . . . . . . . . . . . 3,611 630 553 3,688 344
Deferred loss on refunding . . . . . . . . . (41) (8) (19) (30) —0 0 000
Total . . . . . . . . . . . . . . . . . . . . . . . . $ 3,570 $ 622 $ 534 $ 3,658 344
Other financing arrangements:Capital leases . . . . . . . . . . . . . . . . . . . . . $ 5 $ 2 $ 2 $ 5 2Other financing arrangements . . . . . . . . . 40,445 4,098 5,495 39,048 2,798Plus deferred amounts:
For unamortized premiums/discounts . . 2,056 683 276 2,463 199For accreted discount on bonds . . . . . 68 6 8 66 —0 0 000
Net Amount . . . . . . . . . . . . . . . . . . 42,574 4,789 5,781 41,582 2,999
Deferred loss on refunding . . . . . . . . . (691) (98) (139) (650) —0 0 000
Total . . . . . . . . . . . . . . . . . . . . . . . . $ 41,883 $ 4,691 $ 5,642 $ 40,932 2,999
Derivative instruments . . . . . . . . . . . . . . . $ 261 $ 6 $ 4 $ 263 —0 0 000
Total due within one year . . . . . . . $ 4,098
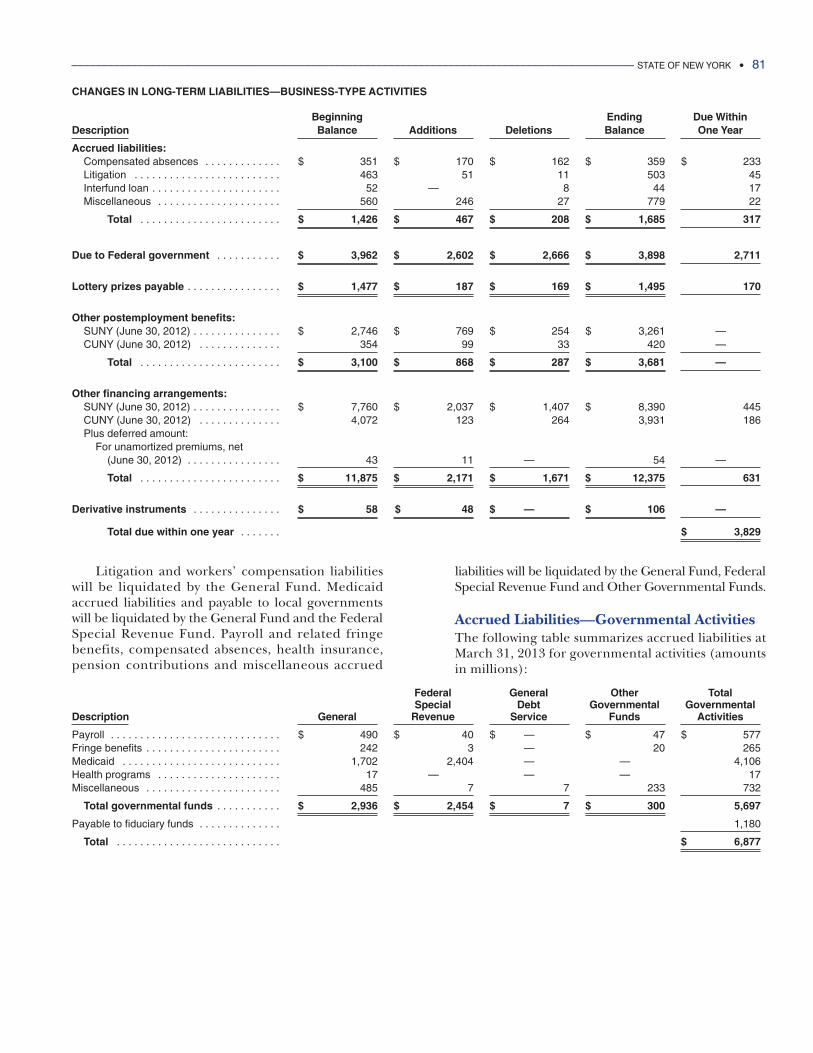
______________________________________________________________________________________________ STATE OF NEW YORK • 81
CHANGES IN LONG-TERM LIABILITIES—BUSINESS-TYPE ACTIVITIES
Beginning Ending Due Within Description Balance Additions Deletions Balance One Year
Accrued liabilities:Compensated absences . . . . . . . . . . . . . $ 351 $ 170 $ 162 $ 359 $ 233Litigation . . . . . . . . . . . . . . . . . . . . . . . . . 463 51 11 503 45Interfund loan . . . . . . . . . . . . . . . . . . . . . . 52 —0 0 000 8 44 17Miscellaneous . . . . . . . . . . . . . . . . . . . . . 560 246 27 779 22
Total . . . . . . . . . . . . . . . . . . . . . . . . $ 1,426 $ 467 $ 208 $ 1,685 317
Due to Federal government . . . . . . . . . . . $ 3,962 $ 2,602 $ 2,666 $ 3,898 2,711
Lottery prizes payable . . . . . . . . . . . . . . . . $ 1,477 $ 187 $ 169 $ 1,495 170
Other postemployment benefits:SUNY (June 30, 2012) . . . . . . . . . . . . . . . $ 2,746 $ 769 $ 254 $ 3,261 —0 0 000CUNY (June 30, 2012) . . . . . . . . . . . . . . 354 99 33 420 —0 0 000
Total . . . . . . . . . . . . . . . . . . . . . . . . $ 3,100 $ 868 $ 287 $ 3,681 —0 0 000
Other financing arrangements:SUNY (June 30, 2012) . . . . . . . . . . . . . . . $ 7,760 $ 2,037 $ 1,407 $ 8,390 445CUNY (June 30, 2012) . . . . . . . . . . . . . . 4,072 123 264 3,931 186Plus deferred amount:
For unamortized premiums, net (June 30, 2012) . . . . . . . . . . . . . . . . 43 11 —0 0 000 54 —0 0 000
Total . . . . . . . . . . . . . . . . . . . . . . . . $ 11,875 $ 2,171 $ 1,671 $ 12,375 631
Derivative instruments . . . . . . . . . . . . . . . $ 58 $ 48 $ —0 0 000 $ 106 —0 0 000
Total due within one year . . . . . . . $ 3,829
Litigation and workers’ compensation liabilitieswill be liquidated by the General Fund. Medicaidaccrued liabilities and payable to local governmentswill be liquidated by the General Fund and the FederalSpecial Revenue Fund. Payroll and related fringebenefits, compensated absences, health insurance,pension contributions and miscellaneous accrued
liabilities will be liquidated by the General Fund, FederalSpecial Revenue Fund and Other Governmental Funds.
Accrued Liabilities—Governmental ActivitiesThe following table summarizes accrued liabilities atMarch 31, 2013 for governmental activities (amountsin millions):
Federal General Other TotalSpecial Debt Governmental Governmental
Description General Revenue Service Funds Activities
Payroll . . . . . . . . . . . . . . . . . . . . . . . . . . . . . $ 490 $ 40 $ —0 0 000 $ 47 $ 577Fringe benefits . . . . . . . . . . . . . . . . . . . . . . . 242 3 —0 0 000 20 265Medicaid . . . . . . . . . . . . . . . . . . . . . . . . . . . 1,702 2,404 —0 0 000 —0 0 000 4,106Health programs . . . . . . . . . . . . . . . . . . . . . 17 —0 0 000 —0 0 000 —0 0 000 17Miscellaneous . . . . . . . . . . . . . . . . . . . . . . . 485 7 7 233 732
Total governmental funds . . . . . . . . . . . $ 2,936 $ 2,454 $ 7 $ 300 5,697
Payable to fiduciary funds . . . . . . . . . . . . . . 1,180
Total . . . . . . . . . . . . . . . . . . . . . . . . . . . . $ 6,877
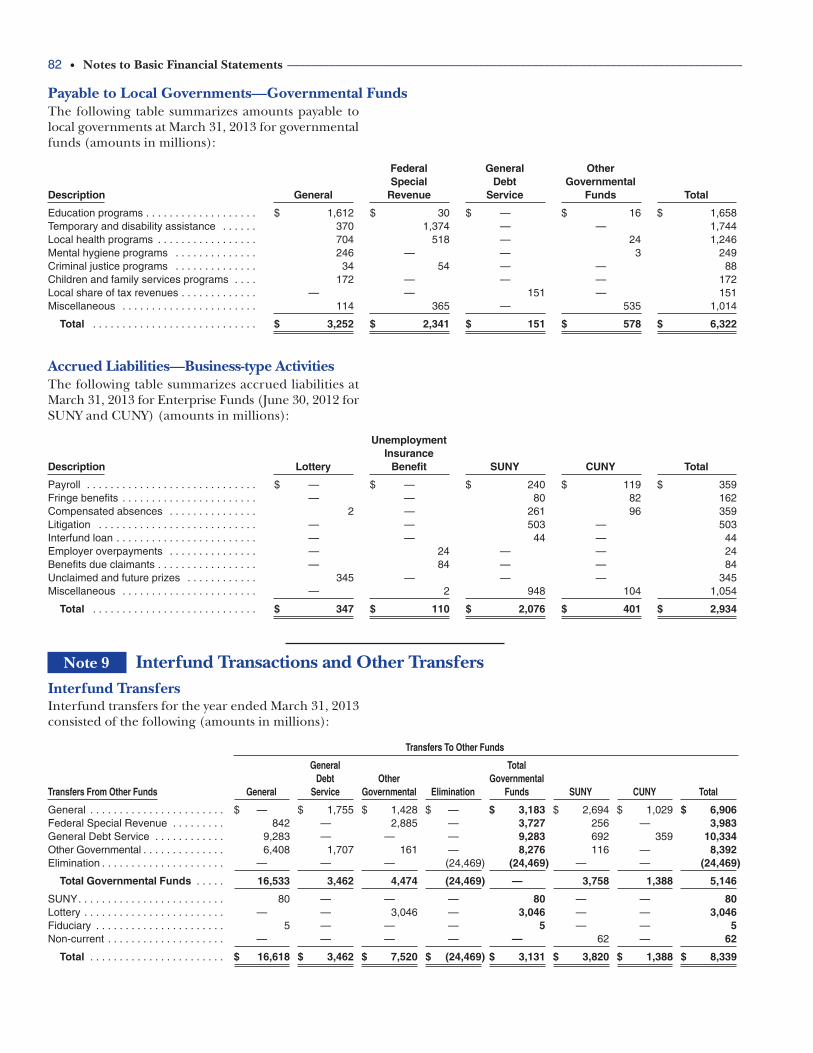
82 • Notes to Basic Financial Statements ____________________________________________________________________________
Payable to Local Governments—Governmental FundsThe following table summarizes amounts payable tolocal governments at March 31, 2013 for governmentalfunds (amounts in millions):
Federal General OtherSpecial Debt Governmental
Description General Revenue Service Funds Total
Education programs . . . . . . . . . . . . . . . . . . . $ 1,612 $ 30 $ —0 0 000 $ 16 $ 1,658Temporary and disability assistance . . . . . . 370 1,374 —0 0 000 —0 0 000 1,744Local health programs . . . . . . . . . . . . . . . . . 704 518 —0 0 000 24 1,246Mental hygiene programs . . . . . . . . . . . . . . 246 —0 0 000 —0 0 000 3 249Criminal justice programs . . . . . . . . . . . . . . 34 54 —0 0 000 —0 0 000 88Children and family services programs . . . . 172 —0 0 000 —0 0 000 —0 0 000 172Local share of tax revenues . . . . . . . . . . . . . —0 0 000 —0 0 000 151 —0 0 000 151Miscellaneous . . . . . . . . . . . . . . . . . . . . . . . 114 365 —0 0 000 535 1,014
Total . . . . . . . . . . . . . . . . . . . . . . . . . . . . $ 3,252 $ 2,341 $ 151 $ 578 $ 6,322
Accrued Liabilities—Business-type Activities The following table summarizes accrued liabilities atMarch 31, 2013 for Enterprise Funds (June 30, 2012 forSUNY and CUNY) (amounts in millions):
UnemploymentInsurance
Description Lottery Benefit SUNY CUNY Total
Payroll . . . . . . . . . . . . . . . . . . . . . . . . . . . . . $ —0 0 000 $ —0 0 000 $ 240 $ 119 $ 359Fringe benefits . . . . . . . . . . . . . . . . . . . . . . . —0 0 000 —0 0 000 80 82 162Compensated absences . . . . . . . . . . . . . . . 2 —0 0 000 261 96 359Litigation . . . . . . . . . . . . . . . . . . . . . . . . . . . —0 0 000 —0 0 000 503 —0 0 000 503Interfund loan . . . . . . . . . . . . . . . . . . . . . . . . —0 0 000 —0 0 000 44 —0 0 000 44Employer overpayments . . . . . . . . . . . . . . . —0 0 000 24 —0 0 000 —0 0 000 24Benefits due claimants . . . . . . . . . . . . . . . . . —0 0 000 84 —0 0 000 —0 0 000 84Unclaimed and future prizes . . . . . . . . . . . . 345 —0 0 000 —0 0 000 —0 0 000 345Miscellaneous . . . . . . . . . . . . . . . . . . . . . . . —0 0 000 2 948 104 1,054
Total . . . . . . . . . . . . . . . . . . . . . . . . . . . . $ 347 $ 110 $ 2,076 $ 401 $ 2,934
Note 9 Interfund Transactions and Other TransfersInterfund Transfers Interfund transfers for the year ended March 31, 2013consisted of the following (amounts in millions):
Transfers To Other Funds
General TotalDebt Other Governmental
Transfers From Other Funds General Service Governmental Elimination Funds SUNY CUNY Total
General . . . . . . . . . . . . . . . . . . . . . . . $ —0000 $ 1,755 $ 1,428 $ —0000 $ 3,183 $ 2,694 $ 1,029 $ 6,906Federal Special Revenue . . . . . . . . . 842 —0000 2,885 —0000 3,727 256 —0000 3,983General Debt Service . . . . . . . . . . . . 9,283 —0000 —0000 —0000 9,283 692 359 10,334Other Governmental . . . . . . . . . . . . . . 6,408 1,707 161 —0000 8,276 116 —0000 8,392Elimination . . . . . . . . . . . . . . . . . . . . . —0000 —0000 —0000 (24,469) (24,469) —0000 —0000 (24,469)
Total Governmental Funds . . . . . 16,533 3,462 4,474 (24,469) —0000 3,758 1,388 5,146
SUNY. . . . . . . . . . . . . . . . . . . . . . . . . 80 —0000 —0000 —0000 80 —0000 —0000 80Lottery . . . . . . . . . . . . . . . . . . . . . . . . —0000 —0000 3,046 —0000 3,046 —0000 —0000 3,046Fiduciary . . . . . . . . . . . . . . . . . . . . . . 5 —0000 —0000 —0000 5 —0000 —0000 5Non-current . . . . . . . . . . . . . . . . . . . . —0000 —0000 —0000 —0000 —0000 62 —0000 62
Total . . . . . . . . . . . . . . . . . . . . . . . $ 16,618 $ 3,462 $ 7,520 $ (24,469) $ 3,131 $ 3,820 $ 1,388 $ 8,339
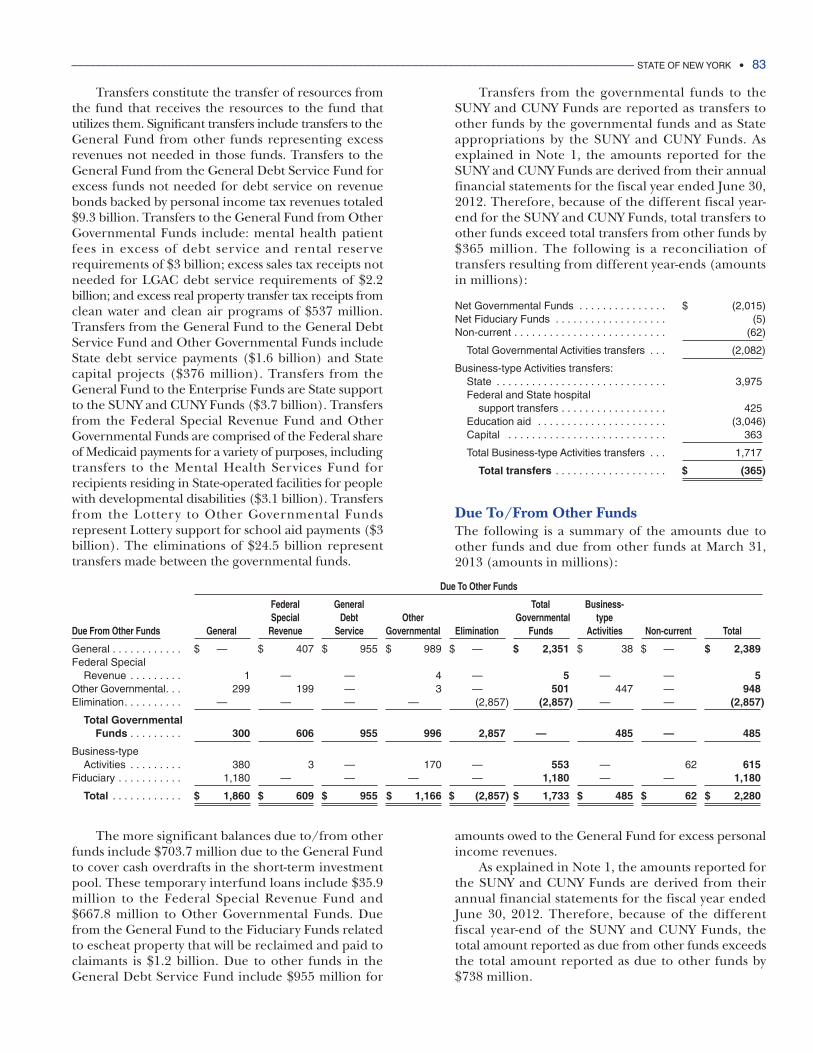
______________________________________________________________________________________________ STATE OF NEW YORK • 83
Transfers constitute the transfer of resources fromthe fund that receives the resources to the fund thatutilizes them. Significant transfers include transfers to theGeneral Fund from other funds representing excessrevenues not needed in those funds. Transfers to theGeneral Fund from the General Debt Service Fund forexcess funds not needed for debt service on revenuebonds backed by personal income tax revenues totaled$9.3 billion. Transfers to the General Fund from OtherGovernmental Funds include: mental health patientfees in excess of debt service and rental reserverequirements of $3 billion; excess sales tax receipts notneeded for LGAC debt service requirements of $2.2billion; and excess real property transfer tax receipts fromclean water and clean air programs of $537 million.Transfers from the General Fund to the General DebtService Fund and Other Governmental Funds includeState debt service payments ($1.6 billion) and Statecapital projects ($376 million). Transfers from theGeneral Fund to the Enterprise Funds are State supportto the SUNY and CUNY Funds ($3.7 billion). Transfersfrom the Federal Special Revenue Fund and OtherGovernmental Funds are comprised of the Federal shareof Medicaid payments for a variety of purposes, includingtransfers to the Mental Health Services Fund forrecipients residing in State-operated facilities for peoplewith developmental disabilities ($3.1 billion). Transfersfrom the Lottery to Other Governmental Fundsrepresent Lottery support for school aid payments ($3billion). The eliminations of $24.5 billion representtransfers made between the governmental funds.
Transfers from the governmental funds to theSUNY and CUNY Funds are reported as transfers toother funds by the governmental funds and as Stateappropriations by the SUNY and CUNY Funds. Asexplained in Note 1, the amounts reported for theSUNY and CUNY Funds are derived from their annualfinancial statements for the fiscal year ended June 30,2012. Therefore, because of the different fiscal year-end for the SUNY and CUNY Funds, total transfers toother funds exceed total transfers from other funds by$365 million. The following is a reconciliation oftransfers resulting from different year-ends (amountsin millions):
Net Governmental Funds . . . . . . . . . . . . . . . $ (2,015)Net Fiduciary Funds . . . . . . . . . . . . . . . . . . . (5)Non-current . . . . . . . . . . . . . . . . . . . . . . . . . . (62)
Total Governmental Activities transfers . . . (2,082)
Business-type Activities transfers:State . . . . . . . . . . . . . . . . . . . . . . . . . . . . . 3,975Federal and State hospital
support transfers . . . . . . . . . . . . . . . . . . 425Education aid . . . . . . . . . . . . . . . . . . . . . . (3,046)Capital . . . . . . . . . . . . . . . . . . . . . . . . . . . 363
Total Business-type Activities transfers . . . 1,717
Total transfers . . . . . . . . . . . . . . . . . . . $ (365)
Due To/From Other FundsThe following is a summary of the amounts due toother funds and due from other funds at March 31,2013 (amounts in millions):
The more significant balances due to/from otherfunds include $703.7 million due to the General Fundto cover cash overdrafts in the short-term investmentpool. These temporary interfund loans include $35.9million to the Federal Special Revenue Fund and$667.8 million to Other Governmental Funds. Duefrom the General Fund to the Fiduciary Funds relatedto escheat property that will be reclaimed and paid toclaimants is $1.2 billion. Due to other funds in theGeneral Debt Service Fund include $955 million for
amounts owed to the General Fund for excess personalincome revenues.
As explained in Note 1, the amounts reported forthe SUNY and CUNY Funds are derived from theirannual financial statements for the fiscal year endedJune 30, 2012. Therefore, because of the differentfiscal year-end of the SUNY and CUNY Funds, thetotal amount reported as due from other funds exceedsthe total amount reported as due to other funds by$738 million.
Due To Other Funds
Federal General Total Business-Special Debt Other Governmental type
Due From Other Funds General Revenue Service Governmental Elimination Funds Activities Non-current Total
General . . . . . . . . . . . . $ —0000 $ 407 $ 955 $ 989 $ —0000 $ 2,351 $ 38 $ —0000 $ 2,389Federal Special
Revenue . . . . . . . . . 1 —0000 —0000 4 —0000 5 —0000 —0000 5Other Governmental. . . 299 199 —0000 3 —0000 501 447 —0000 948Elimination. . . . . . . . . . —0000 —0000 —0000 —0000 (2,857) (2,857) —0000 —0000 (2,857)
Total GovernmentalFunds . . . . . . . . . 300 606 955 996 2,857 —0000 485 —0000 485
Business-typeActivities . . . . . . . . . 380 3 —0000 170 —0000 553 —0000 62 615
Fiduciary . . . . . . . . . . . 1,180 —0000 —0000 —0000 —0000 1,180 —0000 —0000 1,180
Total . . . . . . . . . . . . $ 1,860 $ 609 $ 955 $ 1,166 $ (2,857) $ 1,733 $ 485 $ 62 $ 2,280
84 • Notes to Basic Financial Statements ____________________________________________________________________________
Note 10 Commitments and ContingenciesThe State receives significant financial assistance fromthe Federal government in the form of grants andentitlements. Receipt of grants is generally conditionedupon compliance with terms and conditions of thegrant agreements and applicable Federal regulations,including the expenditure of resources for eligiblepurposes. The State reported additional Federalfunding of $4.2 billion from the American Recoveryand Reinvestment Act (Federal Stimulus) as of March31, 2013 for Medicaid, unemployment benefits, edu-cation and other programs. Substantially all Federalgrants are subject to either the Federal Single Audit Actor to financial and compliance audits by grantoragencies of the Federal government or their designees.Disallowances by Federal program officials as a result ofthese audits may become liabilities of the State. Inaddition, the U.S. Department of Health and HumanServices is reviewing the allowability of Medicaid costsfor prior years in certain State operated IntermediateCare Facilities for the developmentally disabled. Thefederal review may seek to recover funds for paymentsdetermined to be in excess of federal requirements.
Pursuant to legislation enacted in 1985, the Stateentered into service contracts establishing a contingent-contractual obligation with respect to financings relatedto the DASNY Secured Hospital Program for thepurpose of enabling certain financially distressed not-for-profit hospitals to gain access to the capital markets. TheState service contracts obligate the State to pay debtservice, subject to annual appropriations, on bonds inthe event of shortfalls in hospital resources. As of March2013, there are $421 million of outstanding bonds inthe program with annual debt service requirements of$73 million. Authorization to issue bonds under thisprogram expired on March 1, 1998.
As of March 2013, the financial condition of most ofthe hospitals in the program has deteriorated. Assumingrecent trends continue, State resources will be neededto meet debt service obligations on outstanding bonds.The financial plan projected costs are $13 million infiscal year 2013-2014, approximately $30 millionannually for fiscal year 2014-2015 through fiscal year2016-2017, and $17 million in fiscal year 2017-2018.These amounts would cover the debt service costs forfour hospitals that currently are not meeting the termsof their agreements. The State has additional exposureof up to a maximum of $44 million annually, if alladditional hospitals failed to meet their terms andavailable reserve funds were depleted.
The New York State Constitution provides thatthe State may guarantee repayment of certain bor-rowings of the Job Development Authority (JDA) tocarry out designated projects. The State has neverbeen called upon to make any direct paymentspursuant to such guarantees. However, in 1996, theState entered into an agreement with JDA and the
New York State Urban Development Corporation(UDC) whereby UDC would provide funding neededby JDA to meet its debt service obligations throughMarch 31, 2013. JDA required no financial assistanceto meet debt service obligations during the State fiscalyear ended March 31, 2013. As of March 31, 2013,JDA had $15 million of State-guaranteed bonds andnotes outstanding (with an additional $735 millionauthorized but not issued).
In order to provide additional inducement toinvestors to purchase the obligations of certain publicbenefit corporations, the legislation creating thesecorporations authorizes the State to make up anydeficiencies in their debt service reserve funds, subjectto legislative appropriation (effectively, a “moralobligation” debt to back the corporations’ credit).Such “moral obligation” does not constitute full faithand credit obligations of the State. As of March 31,2013, approximately $12 million in moral obligationbonds were outstanding. During the year, the Statewas not called on to make any payments.
Health care providers have a right to appealMedicaid reimbursement rates. Based on an analysis ofappeals, a liability of $899 million has been recognizedin the Statement of Net Position.
In 1977-78, the State required that reserve fundsheld by insurance companies that underwrite the Stateemployee health insurance programs be paid to theGeneral Fund. The State is liable to replenish thesereserve funds if needed to pay insured benefits or if thecontracts with the insurance companies are terminated.Accordingly, based on actuarial calculations, the Statehas recorded a liability of $192 million, which isreported as accrued liabilities due in more than oneyear on the Statement of Net Position.
Generally, the State does not insure its buildings,contents or related risks and does not insure its State-owned automobiles for bodily injury and propertydamages, but the State does have fidelity insuranceon State employees. A liability is estimated for unpaidautomobile claims based on an analysis of propertyloss and claim settlement trends. Routine uninsuredlosses are recorded as expenditures in the GeneralFund as paid, while significant uninsured losses usuallyare the result of litigation that is discussed further inNote 11. Insured losses incurred by the State did notexceed coverage for any of the three preceding fiscalyears. Litigation losses are estimated based on anassessment of pending cases conducted by the Office ofthe Attorney General.
Workers’ compensation is provided with the StateInsurance Fund acting as the State’s administratorand claims processing agent. Under an agreementwith the State Insurance Fund, the State pays onlywhat is necessary to fund claims. Based on actuarialcalculations, discounted at 2.45 percent as of March 31,
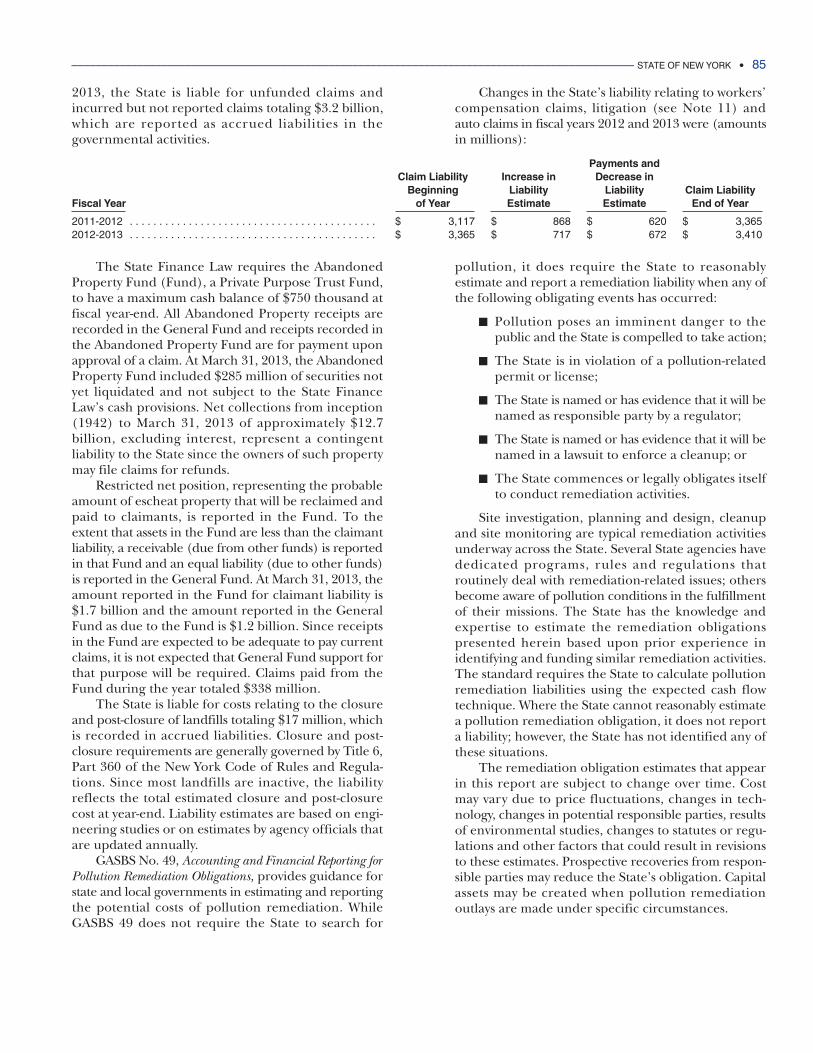
2013, the State is liable for unfunded claims andincurred but not reported claims totaling $3.2 billion,which are reported as accrued liabilities in thegovernmental activities.
Changes in the State’s liability relating to workers’compensation claims, litigation (see Note 11) andauto claims in fiscal years 2012 and 2013 were (amountsin millions):
______________________________________________________________________________________________ STATE OF NEW YORK • 85
Payments andClaim Liability Increase in Decrease in
Beginning Liability Liability Claim LiabilityFiscal Year of Year Estimate Estimate End of Year
2011-2012 . . . . . . . . . . . . . . . . . . . . . . . . . . . . . . . . . . . . . . . . . . $ 3,117 $ 868 $ 620 $ 3,3652012-2013 . . . . . . . . . . . . . . . . . . . . . . . . . . . . . . . . . . . . . . . . . . $ 3,365 $ 717 $ 672 $ 3,410
The State Finance Law requires the AbandonedProperty Fund (Fund), a Private Purpose Trust Fund,to have a maximum cash balance of $750 thousand atfiscal year-end. All Abandoned Property receipts arerecorded in the General Fund and receipts recorded inthe Abandoned Property Fund are for payment uponapproval of a claim. At March 31, 2013, the AbandonedProperty Fund included $285 million of securities notyet liquidated and not subject to the State FinanceLaw’s cash provisions. Net collections from inception(1942) to March 31, 2013 of approximately $12.7billion, excluding interest, represent a contingentliability to the State since the owners of such propertymay file claims for refunds.
Restricted net position, representing the probableamount of escheat property that will be reclaimed andpaid to claimants, is reported in the Fund. To theextent that assets in the Fund are less than the claimantliability, a receivable (due from other funds) is reportedin that Fund and an equal liability (due to other funds)is reported in the General Fund. At March 31, 2013, theamount reported in the Fund for claimant liability is$1.7 billion and the amount reported in the GeneralFund as due to the Fund is $1.2 billion. Since receiptsin the Fund are expected to be adequate to pay currentclaims, it is not expected that General Fund support forthat purpose will be required. Claims paid from theFund during the year totaled $338 million.
The State is liable for costs relating to the closureand post-closure of landfills totaling $17 million, whichis recorded in accrued liabilities. Closure and post-closure requirements are generally governed by Title 6,Part 360 of the New York Code of Rules and Regula-tions. Since most landfills are inactive, the liabilityreflects the total estimated closure and post-closurecost at year-end. Liability estimates are based on engi-neering studies or on estimates by agency officials thatare updated annually.
GASBS No. 49, Accounting and Financial Reporting forPollution Remediation Obligations, provides guidance forstate and local governments in estimating and reportingthe potential costs of pollution remediation. WhileGASBS 49 does not require the State to search for
pollution, it does require the State to reasonablyestimate and report a remediation liability when any ofthe following obligating events has occurred:
y Pollution poses an imminent danger to thepublic and the State is compelled to take action;
y The State is in violation of a pollution-relatedpermit or license;
y The State is named or has evidence that it will benamed as responsible party by a regulator;
y The State is named or has evidence that it will benamed in a lawsuit to enforce a cleanup; or
y The State commences or legally obligates itselfto conduct remediation activities.
Site investigation, planning and design, cleanupand site monitoring are typical remediation activitiesunderway across the State. Several State agencies havededicated programs, rules and regulations thatroutinely deal with remediation-related issues; othersbecome aware of pollution conditions in the fulfillmentof their missions. The State has the knowledge andexpertise to estimate the remediation obligationspresented herein based upon prior experience inidentifying and funding similar remediation activities.The standard requires the State to calculate pollutionremediation liabilities using the expected cash flowtechnique. Where the State cannot reasonably estimatea pollution remediation obligation, it does not reporta liability; however, the State has not identified any ofthese situations.
The remediation obligation estimates that appearin this report are subject to change over time. Costmay vary due to price fluctuations, changes in tech-nology, changes in potential responsible parties, resultsof environmental studies, changes to statutes or regu-lations and other factors that could result in revisionsto these estimates. Prospective recoveries from respon-sible parties may reduce the State’s obligation. Capitalassets may be created when pollution remediationoutlays are made under specific circumstances.
86 • Notes to Basic Financial Statements ____________________________________________________________________________
During the fiscal year, the State recognizedestimated additional liabilities of $70 million, spent$87 million in pollution remediation obligation-relatedactivities, recognized adjustments decreasing the liabilityby $17 million, and recovered $18 million from otherresponsible parties. At March 31, 2013, the State had anoutstanding pollution remediation liability of $826million, with an estimated potential recovery of $96million from other responsible parties.
The Federal government has lowered Medicaiddevelopmental disability center payment rates, effectiveApril 1, 2013, which will reduce federal funding to theState by approximately $1.1 billion beginning in fiscalyear 2014. The enacted State budget includes a plan toaddress the loss in Federal aid which is dependent inpart on the approval of the Federal government.
The Federal Budget Control Act of 2011 mandatedthe federal government enact deficit reduction actionsby March 1, 2013. The government did not come toterms on a deficit reduction action as required by thisdeadline. This triggered a 5 percent reduction in anacross the board non-defense related discretionaryfederal programs. The New York Division of Budgetestimates that the State and local governments could loseapproximately $5 billion over 9 years, mostly fromreductions in pass through aid to individuals, schooldistricts, not-for-profit providers, and other beneficiaries.
The State and the New York State Energy Researchand Development Authority (NYSERDA) have beenengaged in a dispute with the federal government overboth the responsibility of the federal government for sitecleanup at West Valley, as well as which government isliable for perpetual care of any remaining wastes afterdecontamination activities are complete. In August2010, the U.S. District Court approved and entered aConsent Decree that formalized a settlement agreementthat covered a number of the State’s claims. The Decreeidentifies a specific cost share for each government forspecified facilities and known areas of contamination,and sets forth a process for determining cost sharesfor contamination that may be identified in the future.The agreement does not affect in any way the cleanupalternatives that are being or may be developed in theongoing EIS process. Two claims remain unresolved.
The unresolved State’s natural resource damages claimhas been tolled. The Nuclear Waste Policy Act claim,concerning responsibility for the disposal cost of certainremaining waste at the site, is in litigation. The partiesare discussing potential ways to resolve this claim.
Legislation enacted in 2003 authorized the Stateto securitize all of its tobacco settlement payments to theTobacco Settlement Financing Corporation through anasset-backed securitization transaction. To lower costs, thelegislation authorized the State to enter into contingencycontracts obligating the State to pay debt service, sub-ject to annual appropriations, on the TSFC bonds inthe event that tobacco receipts and bond reserves areinsufficient. To ensure that State contractual paymentswill not be required and that tobacco receipts and bondreserves are sufficient to pay debt service, the TSFCbonds were structured to meet or exceed all ratingagency tobacco bonds stress tests. The bonds carry a finalnominal maturity of 19 years and an expected finalmaturity of 13 years, based on optional redemptions. Theexpected final maturity may deviate due to the optionalnature of the redemptions and adjustments to tobaccosettlement payments due from participatingmanufacturers. A lawsuit was filed in 2006 by theAttorney General of New York to recover the settlementpayments that were withheld from the State. Litigationcontinues to recover the funds withheld. In addition,participating manufacturers brought a nationwidearbitration against the settling states, including NewYork, asserting that those states failed to diligentlyenforce their respective escrow statutes in 2003 asrequired to maintain the base settlement payments perthe Master Settlement Agreement. This was settled in2003. The same claim for the 2004-2006 years has beenraised. The last New York diligent enforcement hearingwas held in May 2013. If the arbitration ruling is againstNew York, the State anticipates it will challenge theruling by moving to set aside the arbitral award.
Several unions have not reached labor settlementagreements with the State at this time. Settlementsmay result in added costs to the State. The EnactedBudget assumes spending related to these settlements,but the actual settlements could exceed the amounts inthe budget.
Note 11 LitigationThe State is a defendant in numerous legal proceedingspertaining to matters incidental to the performance ofroutine governmental operations. Such litigationincludes, but is not limited to, claims asserted againstthe State arising from alleged torts, alleged breaches ofcontracts, condemnation proceedings, and otheralleged violations of State and Federal laws.
Included in the State’s outstanding litigation area number of cases challenging the legality or theadequacy of a variety of significant social welfareprograms, primarily involving the State’s Medicaid andmental health programs. Adverse judgments in these
matters generally could result in injunctive reliefcoupled with prospective changes in patient care thatcould require substantial increased financing of thelitigated programs in the future.
With respect to pending and threatened litigation,the State has reported, in the governmental activities,liabilities of $220 million, of which $56 million pertainsto SUNY, for awarded and anticipated unfavorablejudgments. In addition, the State is party to otherclaims and litigation that its legal counsel has advisedmay result in possible adverse court decisions withestimated potential losses of approximately $1.4 billion.
______________________________________________________________________________________________ STATE OF NEW YORK • 87
There are three systems within the State and LocalRetirement System (System) for employees of the Stateand its localities (except employees of New York Cityand teachers, essentially all of whom are covered byseparate pension plans). The System, known andreported collectively as the New York State and LocalRetirement System, comprises the State and LocalEmployees’ Retirement System (ERS), the New YorkState and Local Police and Fire Retirement System(PFRS), and the Public Employees’ Group LifeInsurance Plan (GLIP). GLIP provides death benefitsin the form of life insurance. The net position of theSystem is held in the Common Retirement Fund, whichwas established to hold all plan assets and recordchanges in net plan assets allocated to the System. Inthese statements, GLIP amounts are apportioned to andincluded in either ERS or PFRS.
The State Comptroller is sole trustee of the NewYork State Common Retirement Fund (the Fund) andadministrative head of the System. The System is acost sharing multiple-employer defined benefit pensionplan. On March 31, 2013, there were 3,029 participatinggovernment employers. Employees of the Stateconstituted about 35 percent and 17 percent of themembers of ERS and PFRS, respectively, during thefiscal year ended March 31, 2013.
The System provides retirement benefits as well asdeath and disability benefits. Members who joined theSystem prior to January 1, 2010 generally need fiveyears of service to be 100 percent vested. Memberswho joined on or after January 1, 2010 (ERS) orJanuary 9, 2010 (PFRS) need ten years of service creditto be 100 percent vested. Retirement benefits areestablished by the New York State Retirement andSocial Security Law (RSSL) and are dependent uponthe point in time at which the employees last joinedthe System. Contributor y and noncontributor yrequirements also depend upon the point in time atwhich an employee last joined the System. Mostmembers of ERS who joined the System on or beforeJuly 26, 1976 are enrolled in a noncontributory plan.Most members of PFRS are not required to makeemployee contributions. Employees who last joinedERS subsequent to July 26, 1976 are enrolled in acontributory plan which requires a 3 percent contri-bution of their salary. As a result of Article 19 of theRSSL, eligible Tier 3 and Tier 4 employees with amembership date after July 26, 1976 who have ten ormore years of membership or credited service withinthe System are not required to contribute. Memberscannot be required to begin contributing or makeincreased contributions beyond what was requiredwhen their memberships began. Generally, members ofthe System may retire at age 55; however, members ofTiers 2, 3 and 4 will receive a reduced benefit if theyretire before age 62 with less than 30 years of service.
Tier 5 members must be 62 years of age with at least 10years of service credit to retire with full benefits. Anemployee with less than five years of service maywithdraw and obtain a refund, including interest, of theaccumulated employee contributions. The full benefitage for Tier 6 is 63 for ERS members and 62 for PFRSmembers. Tier 6 members with 10 years of service ormore can retire as early as age 55 with reduced benefits.The contribution rate varies from 3 percent to 6percent depending on salary. Members are required tocontribute for all years of service.
The System’s financial statements are preparedusing the accrual basis of accounting. Revenue isrecognized when earned and liabilities are recognizedwhen incurred. Benefits and refunds are recognizedwhen due and payable in accordance with the terms ofthe plan. Employer contributions are recognized whenbilled. Investments are reported at fair value. Stockstraded on a national or international exchange arevalued at quoted market value at current exchangerates. Bonds are primarily reported at market valuesobtained from independent pricing services. Mortgagesare valued on the basis of future principal and interestpayments, and are discounted at prevailing interestrates for similar instruments. The fair value of directreal estate investments is based on independentappraisals made every three years or according to thefund agreement. Investments that do not have anestablished market are reported at estimated fair valueas determined by the general partner or by theinvestment manager. The System trades in foreignexchange contracts in the normal course of its investingactivities in order to manage exposure to market risks.Such contracts, which are generally for a period ofless than one year, are used to purchase and sell foreigncurrency at a guaranteed future price. These contractsare recorded at market value using foreign currencyexchange rates. The System is exposed to variousinvestment risks as follows:
Investment Custodial Credit Risk—Equity and fixedincome investments owned directly by the Systemwhich trade in the United States (U.S.) marketsare held at the System’s custodian, in separateaccounts, in the name of the Comptroller of theState of New York in Trust for the CommonRetirement Fund. These securities are typicallyheld in electronic form by the Depository TrustCompany (DTC) and its subsidiaries, acting as anagent of the System’s custodian bank. Securitiesheld directly by the System which trade in marketsoutside the U.S. are held by a subsidiary of theSystem’s custodian bank in the local market, a bankperforming custodial services in the local marketacting as an agent for the System’s custodian bank,or, in some foreign markets, the securities are heldin electronic format by a DTC subsidiary or an
Note 12 State and Local Retirement System
88 • Notes to Basic Financial Statements ____________________________________________________________________________
organization similar to DTC. Directly held invest-ments include short-term and long-term fixedincome, and domestic and international equityseparately managed accounts. The aforementionedinvestments have the lowest custodial risk. Equityinvestments held indirectly by the System via limitedpartnerships, commingled investment funds, jointventures and other similar vehicles are held incustody by an organization contracted with by thegeneral partner and/or the investment manage-ment firm responsible for the management of eachinvestment organization. Title to real propertyinvested in by the System is either held by a realestate holding company or a real estate investmentfund. Ownership of mortgage assets is documentedby the System’s holding of original mortgage andnote documents by the Division of Pension Invest-ment and Cash Management in the Office of theState Comptroller (OSC).
Credit Risk—New York State statutes and theSystem’s investment policies require that corporatefixed income obligations must be investment gradeat the time of their acquisition.
Approximately $28 billion or 73.89 percentof the System’s $39 billion long-term bond portfoliois rated AAA by Moody’s. For the balance of theportfolio; 19.15 percent is rated A or AA, 6.13percent is rated BA to BAA and .83 percent israted B to BBB.
Interest Rate Risk—Interest rate risk is the riskthat changes in interest rates will adversely affectthe fair value of the System’s fixed incomesecurities. The price volatility of the System’s fixedincome holdings are measured by duration. TheSystem attempts to mitigate price volatility bymatching the duration of the assets with theduration of the retired lives liabilities so that anychange in the market value of the assets resultingfrom a change in interest rates will result in asimilar change in the value of the liabilities. Theaverage duration of the System’s fixed incomeportfolio is 5.23 years.
Concentration of Credit Risk—Issuer limits forinvestments held by the System are established foreach investment area by RSSL, Article 2, Section 13and Article 4A, Sections 176, 177, and 313, andpolicy guidelines adopted by the Comptroller.
Restrictions are placed on short-term fixedincome investments such that any one issuer ofcommercial paper must have the highest ratingby two NRSROs and a maximum of $500 million ofthe short-term portfolio can be invested in anyone issuer. In addition, simultaneous purchaseand sales of U.S. Treasury obligations may beexecuted with primary government dealers; how-ever, a maximum of $200 million may be investedwith any one primary dealer.
Restrictions are placed on fixed incomeinvestments with maturities longer than one yearsuch that obligations payable in U.S. dollars ofany one department, agency or political subdivi-sion of the U.S. Government or issued by anycorporation, company or other issuer of any kindor description created or existing under the laws ofthe United States, any state of the United States, theDistrict of Columbia, the Commonwealth of PuertoRico and obligations of Canada or any province orcity of Canada, provided each obligation is ratedinvestment grade by two NRSROs and does notexceed 2 percent of the assets of the System or 5percent of the direct liabilities of the issuer. Inaddition, the aggregate amount invested in interest-bearing obligations payable in U.S. dollars which atthe time of investment are rated one of the fourhighest grades by each NRSRO may not exceed 1percent of the assets of the System, and bondsissued or guaranteed by the State of Israel payablein U.S. dollars may not exceed 5 percent of theassets of the System.
Securities Lending—Section 177-d of the RSSLauthorizes the System to enter into security loanagreements with broker/dealers and New YorkState or national banks. The System has designatedits master custodian bank (Custodian) to manage asecurities lending program. This program is subjectto a written contract between the System and theCustodian who acts as security lending agent for theSystem. The Custodian is authorized to lendsecurities within the borrower limits and guidelinesestablished by the System. Types of collateralreceived from borrowers for securities loaned arecash, government securities and Federal agencyobligations. The Custodian is authorized to investthe cash collateral in short-term investments that arelegal for the System. These include domesticcorporate and bank notes, U.S. Treasury obliga-tions, obligations of Federal agencies, repurchaseagreements and specific asset-backed securities.All rights of ownership to securities pledged ascollateral remain with the borrower except in theevent of default. The System has not experiencedany losses resulting from the default of a borroweror lending agent during the year ended March 31,2013 or in the history of the program.
The System lends fixed income, domestic equity,and international equity securities to approvedbroker/dealers. Collateral for securities loanedequals 102 percent of fair market value for domesticsecurities and 105 percent for internationalsecurities. Credit risk associated with the investmentof cash collateral pledged by borrowers is mitigatedby the maturity restrictions, percentage limitations,and rating requirements for individual asset classesincluded in the System’s reinvestment guidelines.The Custodian acknowledges responsibility to
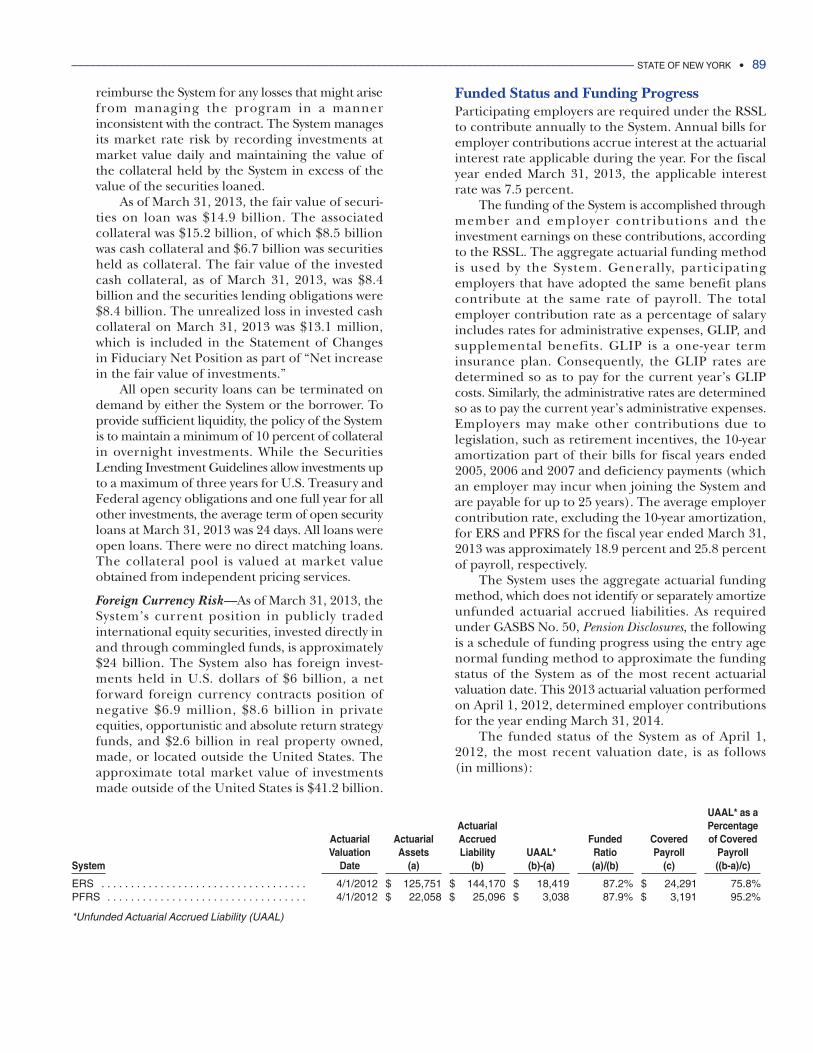
______________________________________________________________________________________________ STATE OF NEW YORK • 89
reimburse the System for any losses that might arisefrom managing the program in a mannerinconsistent with the contract. The System managesits market rate risk by recording investments atmarket value daily and maintaining the value ofthe collateral held by the System in excess of thevalue of the securities loaned.
As of March 31, 2013, the fair value of securi-ties on loan was $14.9 billion. The associatedcollateral was $15.2 billion, of which $8.5 billionwas cash collateral and $6.7 billion was securitiesheld as collateral. The fair value of the investedcash collateral, as of March 31, 2013, was $8.4billion and the securities lending obligations were$8.4 billion. The unrealized loss in invested cashcollateral on March 31, 2013 was $13.1 million,which is included in the Statement of Changesin Fiduciary Net Position as part of “Net increasein the fair value of investments.”
All open security loans can be terminated ondemand by either the System or the borrower. Toprovide sufficient liquidity, the policy of the Systemis to maintain a minimum of 10 percent of collateralin overnight investments. While the SecuritiesLending Investment Guidelines allow investments upto a maximum of three years for U.S. Treasury andFederal agency obligations and one full year for allother investments, the average term of open securityloans at March 31, 2013 was 24 days. All loans wereopen loans. There were no direct matching loans.The collateral pool is valued at market valueobtained from independent pricing services.
Foreign Currency Risk—As of March 31, 2013, theSystem’s current position in publicly tradedinternational equity securities, invested directly inand through commingled funds, is approximately$24 billion. The System also has foreign invest-ments held in U.S. dollars of $6 billion, a netforward foreign currency contracts position ofnegative $6.9 million, $8.6 billion in privateequities, opportunistic and absolute return strategyfunds, and $2.6 billion in real property owned,made, or located outside the United States. Theapproximate total market value of investmentsmade outside of the United States is $41.2 billion.
Funded Status and Funding ProgressParticipating employers are required under the RSSLto contribute annually to the System. Annual bills foremployer contributions accrue interest at the actuarialinterest rate applicable during the year. For the fiscalyear ended March 31, 2013, the applicable interestrate was 7.5 percent.
The funding of the System is accomplished throughmember and employer contributions and theinvestment earnings on these contributions, accordingto the RSSL. The aggregate actuarial funding methodis used by the System. Generally, participatingemployers that have adopted the same benefit planscontribute at the same rate of payroll. The totalemployer contribution rate as a percentage of salaryincludes rates for administrative expenses, GLIP, andsupplemental benefits. GLIP is a one-year terminsurance plan. Consequently, the GLIP rates aredetermined so as to pay for the current year’s GLIPcosts. Similarly, the administrative rates are determinedso as to pay the current year’s administrative expenses.Employers may make other contributions due tolegislation, such as retirement incentives, the 10-yearamortization part of their bills for fiscal years ended2005, 2006 and 2007 and deficiency payments (whichan employer may incur when joining the System andare payable for up to 25 years). The average employercontribution rate, excluding the 10-year amortization,for ERS and PFRS for the fiscal year ended March 31,2013 was approximately 18.9 percent and 25.8 percentof payroll, respectively.
The System uses the aggregate actuarial fundingmethod, which does not identify or separately amortizeunfunded actuarial accrued liabilities. As requiredunder GASBS No. 50, Pension Disclosures, the followingis a schedule of funding progress using the entry agenormal funding method to approximate the fundingstatus of the System as of the most recent actuarialvaluation date. This 2013 actuarial valuation performedon April 1, 2012, determined employer contributionsfor the year ending March 31, 2014.
The funded status of the System as of April 1,2012, the most recent valuation date, is as follows(in millions):
UAAL* as aActuarial Percentage
Actuarial Actuarial Accrued Funded Covered of CoveredValuation Assets Liability UAAL* Ratio Payroll Payroll
System Date (a) (b) (b)-(a) (a)/(b) (c) ((b-a)/c)
ERS . . . . . . . . . . . . . . . . . . . . . . . . . . . . . . . . . . . 4/1/2012 $ 125,751 $ 144,170 $ 18,419 87.2% $ 24,291 75.8%PFRS . . . . . . . . . . . . . . . . . . . . . . . . . . . . . . . . . . 4/1/2012 $ 22,058 $ 25,096 $ 3,038 87.9% $ 3,191 95.2%
*Unfunded Actuarial Accrued Liability (UAAL)
90 • Notes to Basic Financial Statements ____________________________________________________________________________
Significant actuarial assumptions used in the April1, 2012 valuation to determine employer contributionsfor the year ended March 31, 2014 were interest rate of7.5 percent, salary scale for ERS of 4.9 percent, salaryscale for PFRS of 6 percent, decrement tables April 1,2005 to March 31, 2010 System’s experience, andinflation rate of 2.7 percent.
The actuarial asset value for domestic bonds andmortgages is amortized value. Short-term investmentsare at market value. Normally, all other investments usea five-year moving average of market values methodassuming a 7 percent rate of expected appreciation.This method immediately recognizes regular invest-ment income (interest and dividends) while phasing inunexpected appreciation/depreciation over a five-yearperiod. It treats realized or unrealized gains (or losses)in the same manner.
ContributionsEmployers’ contributions receivable are presented netof withdrawals, refunds, advance employer payments,and credits due employers. Receivable amounts fromparticipating employers include $117.2 million foramortization of retirement incentives, new planadoptions and retroactive membership. Receivableamounts from the State for other amortizations total$123.2 million.
RSSL Chapter 260 of the Laws of 2004 authorizedemployers to amortize over ten years, at 5 percentinterest, the portion of their annual bill for fiscal yearended 2005 that exceeded 7 percent of payroll. Theamortized amount receivable from New York State as ofMarch 31, 2013 is $120.8 million and from participatingemployers is $25.5 million.
RSSL Chapter 260 of the Laws of 2004 authorizedemployers to amortize over ten years, at 5 percentinterest, the portion of their annual bill for fiscal yearended 2006 that exceeded 9.5 percent of payroll. Theamortized amount receivable as of March 31, 2013from the State is $55.4 million and from participatingemployers is $10.9 million.
RSSL Chapter 260 of the Laws of 2004 authorizedlocal employers to amortize over ten years, at 5 percentinterest, the portion of their annual bill for fiscal yearended 2007 that exceeded 10.5 percent of payroll.The amortized amount receivable as of March 31, 2013from participating employers is $11.2 million.
RSSL Chapter 57 of the Laws of 2010 authorized theState and local employers to amortize over ten years, at5 percent interest, the portion of their annual bill forfiscal year ended 2011 that exceeded 9.5 percent ofpayroll for ERS and 17.5 percent of payroll for PFRS.The amortized amount receivable as of March 31, 2013from the State is $209.8 million and from participatingemployers is $36.7 million. The thresholds for the fiscalyear ended 2012 were 10.5 percent of payroll for ERSand 18.5 percent for PFRS. The interest rate was 3.75percent. The amortized amount receivable as of March31, 2013 from the State is $517 million and fromparticipating employers is $194.2 million. The thresholdsfor fiscal year ended 2013 were 11.5 percent of payrollfor ERS and 19.5 percent for PFRS. The interest rate was3.0 percent. The amortized amount receivable as ofMarch 31, 2013 from the State is $780.4 million andfrom participating employers is $370.7 million.
The State’s contributions to the System for theyears ended March 31, 2013, 2012, and 2011 were $1.4billion, $1.5 billion, and $1.1 billion, respectively, whichequaled 100 percent of the required billedcontributions for each respective year.
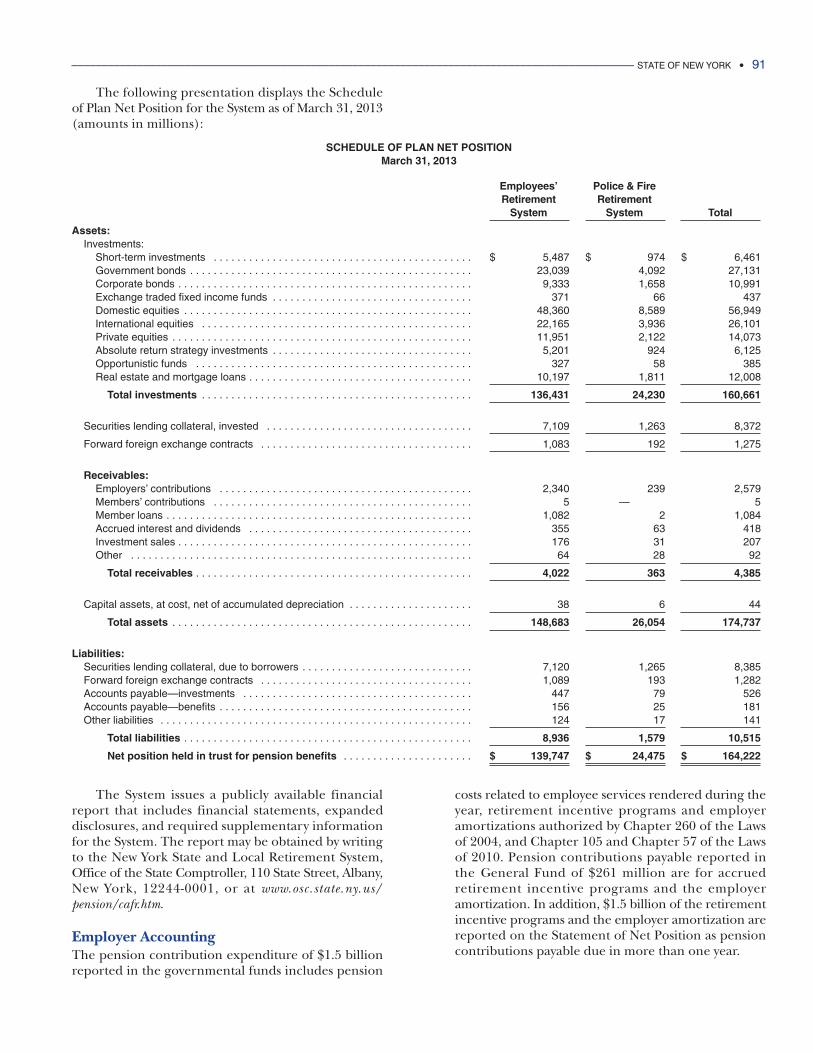
______________________________________________________________________________________________ STATE OF NEW YORK • 91
The following presentation displays the Scheduleof Plan Net Position for the System as of March 31, 2013(amounts in millions):
SCHEDULE OF PLAN NET POSITIONMarch 31, 2013
Employees’ Police & FireRetirement Retirement
System System Total
Assets:Investments:
Short-term investments . . . . . . . . . . . . . . . . . . . . . . . . . . . . . . . . . . . . . . . . . . . . $ 5,487 $ 974 $ 6,461Government bonds . . . . . . . . . . . . . . . . . . . . . . . . . . . . . . . . . . . . . . . . . . . . . . . . 23,039 4,092 27,131Corporate bonds . . . . . . . . . . . . . . . . . . . . . . . . . . . . . . . . . . . . . . . . . . . . . . . . . . 9,333 1,658 10,991Exchange traded fixed income funds . . . . . . . . . . . . . . . . . . . . . . . . . . . . . . . . . . 371 66 437Domestic equities . . . . . . . . . . . . . . . . . . . . . . . . . . . . . . . . . . . . . . . . . . . . . . . . . 48,360 8,589 56,949International equities . . . . . . . . . . . . . . . . . . . . . . . . . . . . . . . . . . . . . . . . . . . . . . 22,165 3,936 26,101Private equities . . . . . . . . . . . . . . . . . . . . . . . . . . . . . . . . . . . . . . . . . . . . . . . . . . . 11,951 2,122 14,073Absolute return strategy investments . . . . . . . . . . . . . . . . . . . . . . . . . . . . . . . . . . 5,201 924 6,125Opportunistic funds . . . . . . . . . . . . . . . . . . . . . . . . . . . . . . . . . . . . . . . . . . . . . . . 327 58 385Real estate and mortgage loans . . . . . . . . . . . . . . . . . . . . . . . . . . . . . . . . . . . . . . 10,197 1,811 12,008
Total investments . . . . . . . . . . . . . . . . . . . . . . . . . . . . . . . . . . . . . . . . . . . . . . 136,431 24,230 160,661
Securities lending collateral, invested . . . . . . . . . . . . . . . . . . . . . . . . . . . . . . . . . . . 7,109 1,263 8,372
Forward foreign exchange contracts . . . . . . . . . . . . . . . . . . . . . . . . . . . . . . . . . . . . 1,083 192 1,275
Receivables:Employers’ contributions . . . . . . . . . . . . . . . . . . . . . . . . . . . . . . . . . . . . . . . . . . . 2,340 239 2,579Members’ contributions . . . . . . . . . . . . . . . . . . . . . . . . . . . . . . . . . . . . . . . . . . . . 5 —000000 5Member loans . . . . . . . . . . . . . . . . . . . . . . . . . . . . . . . . . . . . . . . . . . . . . . . . . . . . 1,082 2 1,084Accrued interest and dividends . . . . . . . . . . . . . . . . . . . . . . . . . . . . . . . . . . . . . . 355 63 418Investment sales . . . . . . . . . . . . . . . . . . . . . . . . . . . . . . . . . . . . . . . . . . . . . . . . . . 176 31 207Other . . . . . . . . . . . . . . . . . . . . . . . . . . . . . . . . . . . . . . . . . . . . . . . . . . . . . . . . . . 64 28 92
Total receivables . . . . . . . . . . . . . . . . . . . . . . . . . . . . . . . . . . . . . . . . . . . . . . . 4,022 363 4,385
Capital assets, at cost, net of accumulated depreciation . . . . . . . . . . . . . . . . . . . . . 38 6 44
Total assets . . . . . . . . . . . . . . . . . . . . . . . . . . . . . . . . . . . . . . . . . . . . . . . . . . . 148,683 26,054 174,737
Liabilities:Securities lending collateral, due to borrowers . . . . . . . . . . . . . . . . . . . . . . . . . . . . . 7,120 1,265 8,385Forward foreign exchange contracts . . . . . . . . . . . . . . . . . . . . . . . . . . . . . . . . . . . . 1,089 193 1,282Accounts payable—investments . . . . . . . . . . . . . . . . . . . . . . . . . . . . . . . . . . . . . . . 447 79 526Accounts payable—benefits . . . . . . . . . . . . . . . . . . . . . . . . . . . . . . . . . . . . . . . . . . . 156 25 181Other liabilities . . . . . . . . . . . . . . . . . . . . . . . . . . . . . . . . . . . . . . . . . . . . . . . . . . . . . 124 17 141
Total liabilities . . . . . . . . . . . . . . . . . . . . . . . . . . . . . . . . . . . . . . . . . . . . . . . . . 8,936 1,579 10,515
Net position held in trust for pension benefits . . . . . . . . . . . . . . . . . . . . . . $ 139,747 $ 24,475 $ 164,222
The System issues a publicly available financialreport that includes financial statements, expandeddisclosures, and required supplementary informationfor the System. The report may be obtained by writingto the New York State and Local Retirement System,Office of the State Comptroller, 110 State Street, Albany,New York, 12244-0001, or at www.osc.state.ny.us/pension/cafr.htm.
Employer AccountingThe pension contribution expenditure of $1.5 billionreported in the governmental funds includes pension
costs related to employee services rendered during theyear, retirement incentive programs and employeramortizations authorized by Chapter 260 of the Lawsof 2004, and Chapter 105 and Chapter 57 of the Lawsof 2010. Pension contributions payable reported inthe General Fund of $261 million are for accruedretirement incentive programs and the employeramortization. In addition, $1.5 billion of the retirementincentive programs and the employer amortization arereported on the Statement of Net Position as pensioncontributions payable due in more than one year.
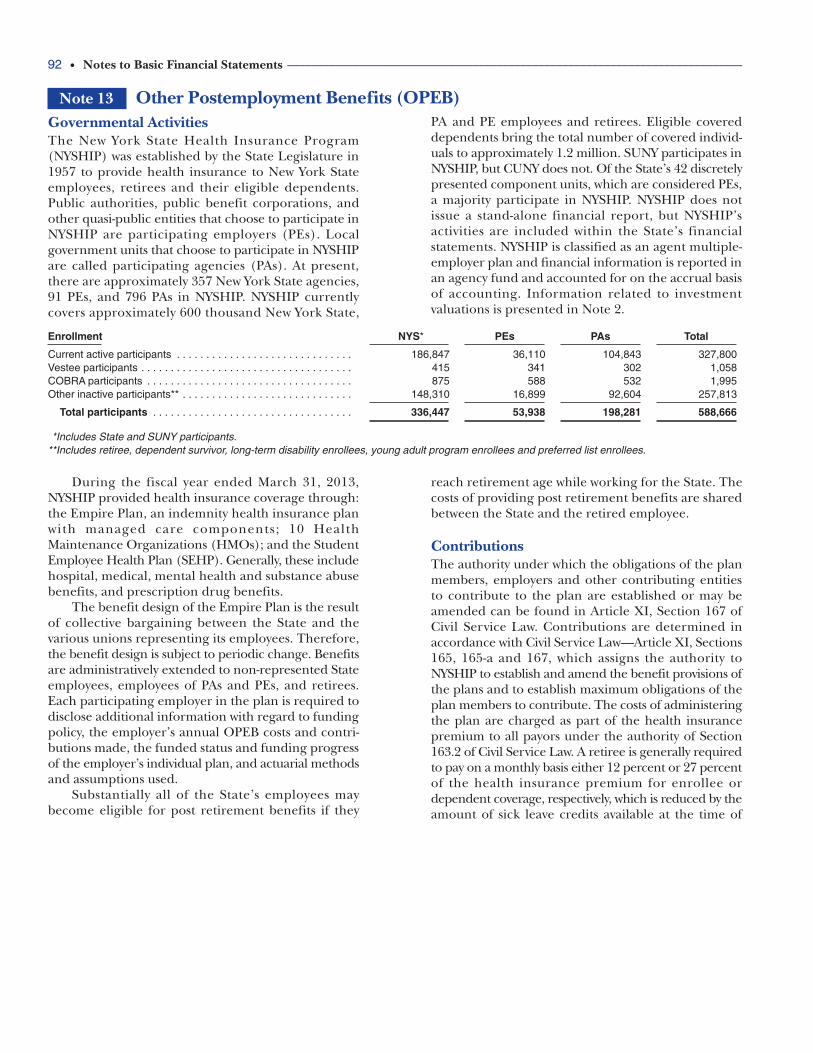
92 • Notes to Basic Financial Statements ____________________________________________________________________________
During the fiscal year ended March 31, 2013,NYSHIP provided health insurance coverage through:the Empire Plan, an indemnity health insurance planwith managed care components; 10 HealthMaintenance Organizations (HMOs); and the StudentEmployee Health Plan (SEHP). Generally, these includehospital, medical, mental health and substance abusebenefits, and prescription drug benefits.
The benefit design of the Empire Plan is the resultof collective bargaining between the State and thevarious unions representing its employees. Therefore,the benefit design is subject to periodic change. Benefitsare administratively extended to non-represented Stateemployees, employees of PAs and PEs, and retirees.Each participating employer in the plan is required todisclose additional information with regard to fundingpolicy, the employer’s annual OPEB costs and contri-butions made, the funded status and funding progressof the employer’s individual plan, and actuarial methodsand assumptions used.
Substantially all of the State’s employees maybecome eligible for post retirement benefits if they
reach retirement age while working for the State. Thecosts of providing post retirement benefits are sharedbetween the State and the retired employee.
ContributionsThe authority under which the obligations of the planmembers, employers and other contributing entitiesto contribute to the plan are established or may beamended can be found in Article XI, Section 167 ofCivil Service Law. Contributions are determined inaccordance with Civil Service Law—Article XI, Sections165, 165-a and 167, which assigns the authority toNYSHIP to establish and amend the benefit provisions ofthe plans and to establish maximum obligations of theplan members to contribute. The costs of administeringthe plan are charged as part of the health insurancepremium to all payors under the authority of Section163.2 of Civil Service Law. A retiree is generally requiredto pay on a monthly basis either 12 percent or 27 percentof the health insurance premium for enrollee ordependent coverage, respectively, which is reduced by theamount of sick leave credits available at the time of
Note 13 Other Postemployment Benefits (OPEB)
Enrollment *NYS* PEs PAs Total
Current active participants . . . . . . . . . . . . . . . . . . . . . . . . . . . . . . 186,847 36,110 104,843 327,800Vestee participants . . . . . . . . . . . . . . . . . . . . . . . . . . . . . . . . . . . . 415 341 302 1,058COBRA participants . . . . . . . . . . . . . . . . . . . . . . . . . . . . . . . . . . . 875 588 532 1,995Other inactive participants** . . . . . . . . . . . . . . . . . . . . . . . . . . . . . 148,310 16,899 92,604 257,813
Total participants . . . . . . . . . . . . . . . . . . . . . . . . . . . . . . . . . . 336,447 53,938 198,281 588,666
**Includes State and SUNY participants.**Includes retiree, dependent survivor, long-term disability enrollees, young adult program enrollees and preferred list enrollees.
Governmental ActivitiesThe New York State Health Insurance Program(NYSHIP) was established by the State Legislature in1957 to provide health insurance to New York Stateemployees, retirees and their eligible dependents.Public authorities, public benefit corporations, andother quasi-public entities that choose to participate inNYSHIP are participating employers (PEs). Localgovernment units that choose to participate in NYSHIPare called participating agencies (PAs). At present,there are approximately 357 New York State agencies,91 PEs, and 796 PAs in NYSHIP. NYSHIP currentlycovers approximately 600 thousand New York State,
PA and PE employees and retirees. Eligible covereddependents bring the total number of covered individ-uals to approximately 1.2 million. SUNY participates inNYSHIP, but CUNY does not. Of the State’s 42 discretelypresented component units, which are considered PEs,a majority participate in NYSHIP. NYSHIP does notissue a stand-alone financial report, but NYSHIP’sactivities are included within the State’s financialstatements. NYSHIP is classified as an agent multiple-employer plan and financial information is reported inan agency fund and accounted for on the accrual basisof accounting. Information related to investmentvaluations is presented in Note 2.
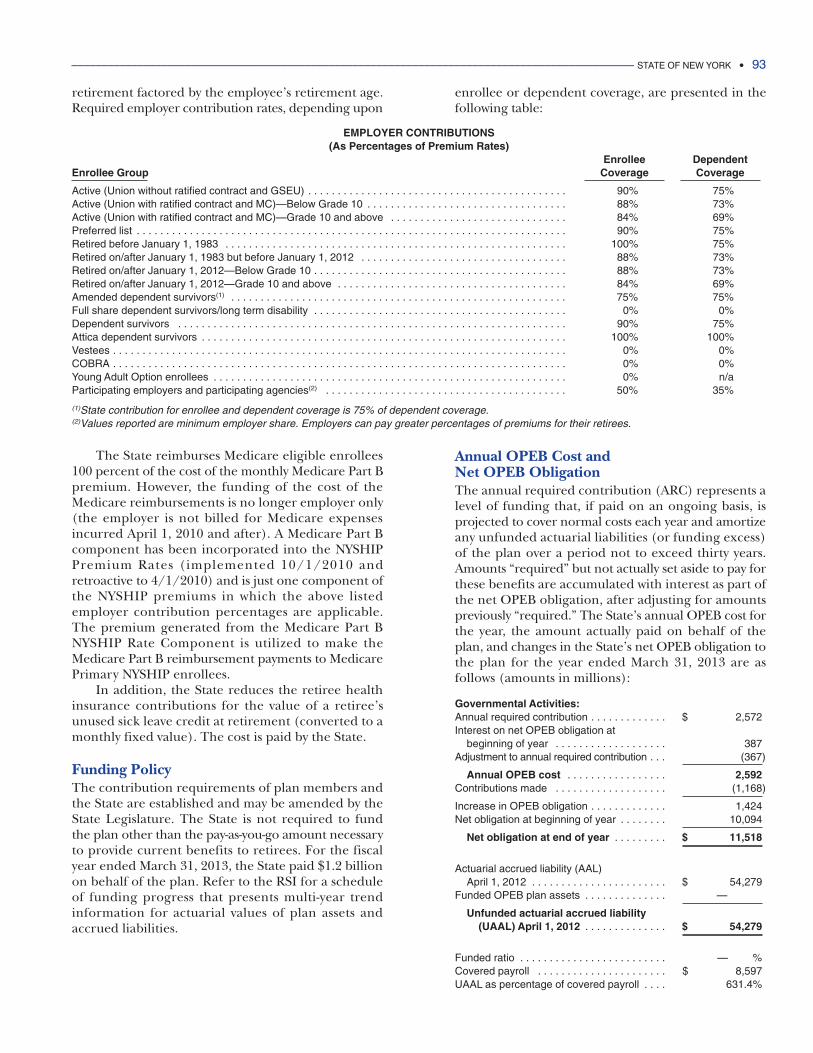
______________________________________________________________________________________________ STATE OF NEW YORK • 93
retirement factored by the employee’s retirement age.Required employer contribution rates, depending upon
enrollee or dependent coverage, are presented in thefollowing table:
EMPLOYER CONTRIBUTIONS (As Percentages of Premium Rates)
Enrollee Dependent Enrollee Group Coverage Coverage
Active (Union without ratified contract and GSEU) . . . . . . . . . . . . . . . . . . . . . . . . . . . . . . . . . . . . . . . . . . . . 90% 75%Active (Union with ratified contract and MC)—Below Grade 10 . . . . . . . . . . . . . . . . . . . . . . . . . . . . . . . . . . 88% 73%Active (Union with ratified contract and MC)—Grade 10 and above . . . . . . . . . . . . . . . . . . . . . . . . . . . . . . 84% 69%Preferred list . . . . . . . . . . . . . . . . . . . . . . . . . . . . . . . . . . . . . . . . . . . . . . . . . . . . . . . . . . . . . . . . . . . . . . . . . 90% 75%Retired before January 1, 1983 . . . . . . . . . . . . . . . . . . . . . . . . . . . . . . . . . . . . . . . . . . . . . . . . . . . . . . . . . . 100% 75%Retired on/after January 1, 1983 but before January 1, 2012 . . . . . . . . . . . . . . . . . . . . . . . . . . . . . . . . . . . 88% 73%Retired on/after January 1, 2012—Below Grade 10 . . . . . . . . . . . . . . . . . . . . . . . . . . . . . . . . . . . . . . . . . . . 88% 73%Retired on/after January 1, 2012—Grade 10 and above . . . . . . . . . . . . . . . . . . . . . . . . . . . . . . . . . . . . . . . 84% 69%Amended dependent survivors(1) . . . . . . . . . . . . . . . . . . . . . . . . . . . . . . . . . . . . . . . . . . . . . . . . . . . . . . . . . 75% 75%Full share dependent survivors/long term disability . . . . . . . . . . . . . . . . . . . . . . . . . . . . . . . . . . . . . . . . . . . 0% 0%Dependent survivors . . . . . . . . . . . . . . . . . . . . . . . . . . . . . . . . . . . . . . . . . . . . . . . . . . . . . . . . . . . . . . . . . . 90% 75%Attica dependent survivors . . . . . . . . . . . . . . . . . . . . . . . . . . . . . . . . . . . . . . . . . . . . . . . . . . . . . . . . . . . . . . 100% 100%Vestees . . . . . . . . . . . . . . . . . . . . . . . . . . . . . . . . . . . . . . . . . . . . . . . . . . . . . . . . . . . . . . . . . . . . . . . . . . . . . 0% 0%COBRA . . . . . . . . . . . . . . . . . . . . . . . . . . . . . . . . . . . . . . . . . . . . . . . . . . . . . . . . . . . . . . . . . . . . . . . . . . . . . 0% 0%Young Adult Option enrollees . . . . . . . . . . . . . . . . . . . . . . . . . . . . . . . . . . . . . . . . . . . . . . . . . . . . . . . . . . . . 0% n/aParticipating employers and participating agencies(2) . . . . . . . . . . . . . . . . . . . . . . . . . . . . . . . . . . . . . . . . . 50% 35%
(1)State contribution for enrollee and dependent coverage is 75% of dependent coverage.(2)Values reported are minimum employer share. Employers can pay greater percentages of premiums for their retirees.
The State reimburses Medicare eligible enrollees100 percent of the cost of the monthly Medicare Part Bpremium. However, the funding of the cost of theMedicare reimbursements is no longer employer only(the employer is not billed for Medicare expensesincurred April 1, 2010 and after). A Medicare Part Bcomponent has been incorporated into the NYSHIPPremium Rates (implemented 10/1/2010 andretroactive to 4/1/2010) and is just one component ofthe NYSHIP premiums in which the above listedemployer contribution percentages are applicable.The premium generated from the Medicare Part BNYSHIP Rate Component is utilized to make theMedicare Part B reimbursement payments to MedicarePrimary NYSHIP enrollees.
In addition, the State reduces the retiree healthinsurance contributions for the value of a retiree’sunused sick leave credit at retirement (converted to amonthly fixed value). The cost is paid by the State.
Funding PolicyThe contribution requirements of plan members andthe State are established and may be amended by theState Legislature. The State is not required to fundthe plan other than the pay-as-you-go amount necessaryto provide current benefits to retirees. For the fiscalyear ended March 31, 2013, the State paid $1.2 billionon behalf of the plan. Refer to the RSI for a scheduleof funding progress that presents multi-year trendinformation for actuarial values of plan assets andaccrued liabilities.
Annual OPEB Cost and Net OPEB ObligationThe annual required contribution (ARC) represents alevel of funding that, if paid on an ongoing basis, isprojected to cover normal costs each year and amortizeany unfunded actuarial liabilities (or funding excess)of the plan over a period not to exceed thirty years.Amounts “required” but not actually set aside to pay forthese benefits are accumulated with interest as part ofthe net OPEB obligation, after adjusting for amountspreviously “required.” The State’s annual OPEB cost forthe year, the amount actually paid on behalf of theplan, and changes in the State’s net OPEB obligation tothe plan for the year ended March 31, 2013 are asfollows (amounts in millions):
Governmental Activities:Annual required contribution . . . . . . . . . . . . . $ 2,572Interest on net OPEB obligation at
beginning of year . . . . . . . . . . . . . . . . . . . 387Adjustment to annual required contribution . . . (367)
Annual OPEB cost . . . . . . . . . . . . . . . . . 2,592Contributions made . . . . . . . . . . . . . . . . . . . (1,168)
Increase in OPEB obligation . . . . . . . . . . . . . 1,424Net obligation at beginning of year . . . . . . . . 10,094
Net obligation at end of year . . . . . . . . . $ 11,518
Actuarial accrued liability (AAL) April 1, 2012 . . . . . . . . . . . . . . . . . . . . . . . $ 54,279
Funded OPEB plan assets . . . . . . . . . . . . . . —0 0 000
Unfunded actuarial accrued liability (UAAL) April 1, 2012 . . . . . . . . . . . . . . $ 54,279
Funded ratio . . . . . . . . . . . . . . . . . . . . . . . . . —0 0 0 %Covered payroll . . . . . . . . . . . . . . . . . . . . . . $ 8,597UAAL as percentage of covered payroll . . . . 631.4%
94 • Notes to Basic Financial Statements ____________________________________________________________________________
In accordance with GASBS No. 45, Accounting andFinancial Reporting by Employers for Postemployment BenefitsOther Than Pensions, the actuarial valuation of OPEB alsoincludes the value of sick leave that will be converted toreduce the retiree’s share of health insurance premiums.
The State’s annual OPEB cost, the percentage ofannual OPEB cost contributed to the plan, and the netOPEB obligation for the three most recent fiscal yearsended March 31 were as follows (amounts in millions):
Actuarial Methods and AssumptionsProjections of benefits for financial reporting purposesare based on the plan and include the types of benefitsprovided at the time of each valuation. The actuarialmethods and assumptions used include techniquesthat are designed to reduce short-term volatility inactuarial accrued liabilities and the actuarial valueof assets, consistent with the long-term perspective ofthe calculations.
The State’s $2.6 billion annual OPEB cost, deter-mined using the April 1, 2010 actuarial valuation withresults projected to April 1, 2012 for the fiscal yearended March 31, 2013, was determined using the frozenentry age actuarial cost method, allocating costs on alevel basis over earnings. The annual OPEB cost reflectssavings resulting from ratified and/or announced planchanges in the fall of 2011 and the State’s decision toimplement an Employer Group Waiver Plan. Theactuarial assumptions utilized a 3.830 percent discountrate that was the average short-term investment pool ratefor the past 15 years at the time of the valuation. Theassumptions also utilized an annual healthcare costtrend rate of 10 percent for medical and drug, includinginflation, for the first fiscal year in the valuation,declining each year to an ultimate trend rate of 5 percentfor both medical and drug; a salary growth rate of 3.5percent; and an inflation rate of 3 percent.
The State’s $54.3 billion unfunded actuarialaccrued liability, based on an actuarial valuation as ofApril 1, 2012, was determined using the frozen entryage actuarial cost method. The actuarial assumptionsused to establish retiree contribution rates includetrend rates of annual healthcare costs of 9 percentfor non-Medicare eligible medical, 5.5 percent for
Medicare eligible medical and 7.5 percent for drug forthe first fiscal year in the valuation, declining eachyear to an ultimate trend rate of 4.75 percent for bothmedical and drug. Other actuarial assumptions includea salary growth rate of 3 percent, an inflation rate of2.75 percent and a 3.112 percent discount rate that wasthe average short-term investment pool rate for the past15 years at the time of the valuation.
Actuarial valuations involve estimates of the value ofreported amounts and assumptions about the probabilityof events in the future. Examples include assumptionsabout employment, mortality and healthcare cost trends.Actuarial valuations are subject to continual revision asactual results are compared to past expectations and newestimates are made about the future.
Business-type ActivitiesThe State, on behalf of SUNY, provides health insurancecoverage for eligible retired SUNY employees and theirspouses as part of the New York State Health InsurancePlan (NYSHIP). Employee contribution rates forNYSHIP are established by the State and are generally12 percent, and range from 10 to 16 percent for enrolleecoverage, and 27 percent, and range from 25 to 31percent for dependent coverage. The frozen entry ageactuarial cost method is used to determine the annualrequired contribution amounts and the annual netOPEB obligation. The actuarial assumptions include a3.8 percent discount rate, salary growth rate of 3.5percent, an inflation rate of 3 percent, and an annualhealthcare cost trend rate for medical coverage of 10percent initially, reduced by decrements to a rate of 5percent after 7 years.
PercentageAnnual of Annual Net OPEB
Fiscal Year Ended OPEB Cost OPEB Cost Paid Obligation
3/31/13 . . . . . . . . . . . . . . . . . . . . . . . . . . . . . . . . . . . . . . . . . . . . . . . . . . . . . . . . . . . . . $ 2,592 45.06% $ 11,5183/31/12 . . . . . . . . . . . . . . . . . . . . . . . . . . . . . . . . . . . . . . . . . . . . . . . . . . . . . . . . . . . . . $ 3,082 36.92% $ 10,0943/31/11 . . . . . . . . . . . . . . . . . . . . . . . . . . . . . . . . . . . . . . . . . . . . . . . . . . . . . . . . . . . . . $ 3,096 32.75% $ 8,150
______________________________________________________________________________________________ STATE OF NEW YORK • 95
SUNY’s annual OPEB costs and changes in netOPEB obligations for the year ended June 30, 2012 areas follows (amounts in millions):
PercentageAnnual of Annual Net OPEB
Fiscal Year Ended OPEB Cost OPEB Cost Paid Obligation
6/30/12 . . . . . . . . . . . . . . . . . . . . . . . . . . . . . . . . . . . . . . . . . . . . . . . . . . . . . . . . . . . . . $ 784 30.23% $ 3,0796/30/11 . . . . . . . . . . . . . . . . . . . . . . . . . . . . . . . . . . . . . . . . . . . . . . . . . . . . . . . . . . . . . $ 814 27.15% $ 2,5326/30/10 . . . . . . . . . . . . . . . . . . . . . . . . . . . . . . . . . . . . . . . . . . . . . . . . . . . . . . . . . . . . . $ 639 32.86% $ 1,939
Annual required contribution . . . . . . . . . . . . . . . . . . . . . . . . . . . . . . . . . . . . . . . . . . . . . . . . . . . . . . . . . . . . . . . . . . . . . . . . . . . . . $ 779Interest on net OPEB obligation at beginning of year . . . . . . . . . . . . . . . . . . . . . . . . . . . . . . . . . . . . . . . . . . . . . . . . . . . . . . . . . . 97Adjustment to annual required contribution . . . . . . . . . . . . . . . . . . . . . . . . . . . . . . . . . . . . . . . . . . . . . . . . . . . . . . . . . . . . . . . . . . (92)
Annual OPEB cost . . . . . . . . . . . . . . . . . . . . . . . . . . . . . . . . . . . . . . . . . . . . . . . . . . . . . . . . . . . . . . . . . . . . . . . . . . . . . . . . . . 784Contributions made . . . . . . . . . . . . . . . . . . . . . . . . . . . . . . . . . . . . . . . . . . . . . . . . . . . . . . . . . . . . . . . . . . . . . . . . . . . . . . . . . . . . (237)
Increase in OPEB obligation . . . . . . . . . . . . . . . . . . . . . . . . . . . . . . . . . . . . . . . . . . . . . . . . . . . . . . . . . . . . . . . . . . . . . . . . . . . . . 547Net obligation at beginning of year . . . . . . . . . . . . . . . . . . . . . . . . . . . . . . . . . . . . . . . . . . . . . . . . . . . . . . . . . . . . . . . . . . . . . . . . 2,532
Net obligation at end of year $ 3,079
Actuarial accrued liability (AAL) April 1, 2010 . . . . . . . . . . . . . . . . . . . . . . . . . . . . . . . . . . . . . . . . . . . . . . . . . . . . . . . . . . . . . . . . $ 12,200Funded OPEB plan assets . . . . . . . . . . . . . . . . . . . . . . . . . . . . . . . . . . . . . . . . . . . . . . . . . . . . . . . . . . . . . . . . . . . . . . . . . . . . . . —0 0 00
Unfunded actuarial accrued liability (UAAL) April 1, 2010 . . . . . . . . . . . . . . . . . . . . . . . . . . . . . . . . . . . . . . . . . . . . . . . . . $ 12,200
Funded ratio . . . . . . . . . . . . . . . . . . . . . . . . . . . . . . . . . . . . . . . . . . . . . . . . . . . . . . . . . . . . . . . . . . . . . . . . . . . . . . . . . . . . . . . . . —0 0 0%Covered payroll . . . . . . . . . . . . . . . . . . . . . . . . . . . . . . . . . . . . . . . . . . . . . . . . . . . . . . . . . . . . . . . . . . . . . . . . . . . . . . . . . . . . . . . $ 3,141UAAL as percentage of covered payroll . . . . . . . . . . . . . . . . . . . . . . . . . . . . . . . . . . . . . . . . . . . . . . . . . . . . . . . . . . . . . . . . . . . . 388.4%
The SUNY Research Foundation, a blendedcomponent unit of SUNY, is not included in thenumbers reported above. The SUNY ResearchFoundation reports other postemployment benefitsin accordance with the Accounting Standards Codi-fication (ASC) Topic 715, Compensation—RetirementBenefits. SUNY’s other postemployment benefits liabilityreported in the Statement of Net Position, Enterprise
Funds ($3.3 billion), includes SUNY’s net obligationabove ($3.1 billion), and the unfunded status of theSUNY Research Foundation’s plan as of June 30, 2012($182 million).
SUNY’s annual OPEB cost, the percentage ofannual OPEB cost contributed to the plan, and the netOPEB obligation for SUNY’s three most recent fiscalyears were as follows (amounts in millions):
CUNY retirees receive retiree healthcare benefitsthrough the New York City Health Benefits Program,which is a single-employer defined benefit healthcareplan. The program covers individuals who receivepensions from one of the following three pensionplans within the New York City Retirement System(NYCRS): New York City Employees’ RetirementSystem; New York City Teachers’ Retirement System;and New York City Board of Education RetirementSystem. New York City pays for the coverage (Basic
Coverage and Welfare Fund contributions) for retireesin NYCRS who retired from community colleges. Thefrozen entry age actuarial cost method is used todetermine the annual required contribution amountsand the annual net OPEB obligation. The actuarialassumptions include a 4 percent discount rate, payrollgrowth rate of 3 percent, and an annual healthcare costtrend rate for medical coverage of 9.5 percent initially,reduced to a rate of 5 percent by 2023.
96 • Notes to Basic Financial Statements ____________________________________________________________________________
Note 14 Component Units—Public Benefit Corporations
Annual required contribution . . . . . . . . . . . . . . . . . . . . . . . . . . . . . . . . . . . . . . . . . . . . . . . . . . . . . . . . . . . . . . . . . . . . . . . . . . . . . $ 100Interest on net OPEB obligation at beginning of year . . . . . . . . . . . . . . . . . . . . . . . . . . . . . . . . . . . . . . . . . . . . . . . . . . . . . . . . . . 13Adjustment to annual required contribution . . . . . . . . . . . . . . . . . . . . . . . . . . . . . . . . . . . . . . . . . . . . . . . . . . . . . . . . . . . . . . . . . . (13)
Annual OPEB cost . . . . . . . . . . . . . . . . . . . . . . . . . . . . . . . . . . . . . . . . . . . . . . . . . . . . . . . . . . . . . . . . . . . . . . . . . . . . . . . . . . 100Contributions made . . . . . . . . . . . . . . . . . . . . . . . . . . . . . . . . . . . . . . . . . . . . . . . . . . . . . . . . . . . . . . . . . . . . . . . . . . . . . . . . . . . . (33)
Increase in OPEB obligation . . . . . . . . . . . . . . . . . . . . . . . . . . . . . . . . . . . . . . . . . . . . . . . . . . . . . . . . . . . . . . . . . . . . . . . . . . . . . 67Net obligation at beginning of year . . . . . . . . . . . . . . . . . . . . . . . . . . . . . . . . . . . . . . . . . . . . . . . . . . . . . . . . . . . . . . . . . . . . . . . . 324
Net obligation at end of year $ 391
Actuarial accrued liability (AAL) June 30, 2011 . . . . . . . . . . . . . . . . . . . . . . . . . . . . . . . . . . . . . . . . . . . . . . . . . . . . . . . . . . . . . . . $ 1,235Funded OPEB plan assets . . . . . . . . . . . . . . . . . . . . . . . . . . . . . . . . . . . . . . . . . . . . . . . . . . . . . . . . . . . . . . . . . . . . . . . . . . . . . . —0 0 00
Unfunded actuarial accrued liability (UAAL) June 30, 2011 . . . . . . . . . . . . . . . . . . . . . . . . . . . . . . . . . . . . . . . . . . . . . . . . $ 1,235
Funded ratio . . . . . . . . . . . . . . . . . . . . . . . . . . . . . . . . . . . . . . . . . . . . . . . . . . . . . . . . . . . . . . . . . . . . . . . . . . . . . . . . . . . . . . . . . —0 0 0%Covered payroll . . . . . . . . . . . . . . . . . . . . . . . . . . . . . . . . . . . . . . . . . . . . . . . . . . . . . . . . . . . . . . . . . . . . . . . . . . . . . . . . . . . . . . . $ 910UAAL as percentage of covered payroll . . . . . . . . . . . . . . . . . . . . . . . . . . . . . . . . . . . . . . . . . . . . . . . . . . . . . . . . . . . . . . . . . . . . 135.7%
CUNY’s annual OPEB costs and changes in netOPEB obligations for the year ended June 30, 2012 areas follows (amounts in millions):
PercentageAnnual of Annual Net OPEB
Fiscal Year Ended OPEB Cost OPEB Cost Paid Obligation
6/30/12 . . . . . . . . . . . . . . . . . . . . . . . . . . . . . . . . . . . . . . . . . . . . . . . . . . . . . . . . . . . . . $ 100 33.00% $ 3916/30/11 . . . . . . . . . . . . . . . . . . . . . . . . . . . . . . . . . . . . . . . . . . . . . . . . . . . . . . . . . . . . . $ 104 29.81% $ 3246/30/10 . . . . . . . . . . . . . . . . . . . . . . . . . . . . . . . . . . . . . . . . . . . . . . . . . . . . . . . . . . . . . $ 95 29.47% $ 251
The CUNY Research Foundation, a blendedcomponent unit of the CUNY Senior Colleges, reportsother postemployment benefits in accordance withASC Topic 715, Compensation—Retirement Benefits. CUNYSenior Colleges’ other postemployment benefits liabilityreported in the Statement of Net Position, EnterpriseFunds ($420 million), includes the CUNY Senior
Colleges’ net obligation above ($391 million), and thefunded status of the CUNY Research Foundation’splan as of June 30, 2012 ($29 million).
CUNY’s annual OPEB cost, the percentage ofannual OPEB cost contributed to the plan, and the netOPEB obligation for CUNY’s three most recent fiscalyears were as follows (amounts in millions):
Component Units—public benefit corporations(Corporations), as defined in Note 1, are legallyseparate entities that are not operating departments ofthe State. The Corporations are managedindependently, outside the appropriated budgetprocess, and their powers generally are vested in agoverning board. Corporations are established for thebenefit of the State’s citizenry for a variety of purposessuch as economic development, financing and publictransportation. They are not subject to Stateconstitutional restrictions on the incurrence of debt,which apply to the State itself, and may issue bonds andnotes within legislatively authorized amounts.
Corporations are generally supported by revenuesderived from their activities, although the State hasprovided financial assistance, in some cases of arecurring nature, to certain Corporations for operatingand other expenses. Financial assistance in the form ofappropriated loans, contributed capital or operatingsubsidies for certain Corporations, principally theMetropolitan Transportation Authority, the RoswellPark Cancer Institute, and the Urban DevelopmentCorporation was provided in the fiscal year ended
March 31, 2013 and such assistance is expected tobe required in future years. Accordingly, the fiscalcondition of the State is related to the fiscal stability ofthe Corporations.
The amounts presented in the accompanying basicfinancial statements for the Corporations include thefollowing entities for the fiscal years indicated:
Entities Audited by KPMG LLP: Fiscal Year-End
Dormitory Authority of the State of New York . . . . . . . . . . . . . . . . . March 31, 2013*
Health Research, Inc. . . . . . . . . . . . . . . . . . March 31, 2013Long Island Power Authority . . . . . . . . . . . . December 31, 2012*New York Racing Association, Inc . . . . . . . December 31, 2012*New York State Energy Research
and Development Authority . . . . . . . . . . March 31, 2013*New York State Environmental
Facilities Corporation . . . . . . . . . . . . . . . March 31, 2013*New York State Higher Education
Services Corporation . . . . . . . . . . . . . . . March 31, 2013*Power Authority of the State
of New York . . . . . . . . . . . . . . . . . . . . . . December 31, 2012*State University of New York
Foundations . . . . . . . . . . . . . . . . . . . . . . June 30, 2012**
______________________________________________________________________________________________ STATE OF NEW YORK • 97
Entities Audited by Other Auditors: Fiscal Year-End
Aggregate Trust Fund . . . . . . . . . . . . . . . . December 31, 2012Agriculture and New York State
Horse Breeding DevelopmentFund Corporation . . . . . . . . . . . . . . . . . . December 31, 2012*
Albany Convention Center Authority . . . . . December 31, 2012*Capital District Transportation
Authority . . . . . . . . . . . . . . . . . . . . . . . . . March 31, 2013*Central New York Regional
Transportation Authority . . . . . . . . . . . . . March 31, 2013*City University of New York—
Senior College Foundations . . . . . . . . . . June 30, 2012Homeless Housing and
Assistance Corporation . . . . . . . . . . . . . March 31, 2013*Housing Trust Fund Corporation . . . . . . . . March 31, 2013*Hudson River-Black River
Regulating District . . . . . . . . . . . . . . . . . June 30, 2012*Hugh L. Carey Battery Park
City Authority . . . . . . . . . . . . . . . . . . . . . October 31, 2012*Metropolitan Transportation Authority . . . . . December 31, 2012*
Metro-North Commuter Railroad Company . . . . . . . . . . . . . . . December 31, 2012
The Long Island Rail Road Company . . . . . . . . . . . . . . . . . December 31, 2012
Triborough Bridge and Tunnel Authority . . . . . . . . . . . . . . . . . December 31, 2012
New York City Transit Authority . . . . . . . December 31, 2012Staten Island Rapid Transit
Operating Authority . . . . . . . . . . . . . . . December 31, 2012MTA Capital Construction
Company . . . . . . . . . . . . . . . . . . . . . . December 31, 2012MTA Bus Company . . . . . . . . . . . . . . . . . December 31, 2012First Mutual Transportation
Assurance Company . . . . . . . . . . . . . December 31, 2012Municipal Bond Bank Agency . . . . . . . . . . . October 31, 2012*Natural Heritage Trust. . . . . . . . . . . . . . . . . March 31, 2013*Nelson A. Rockefeller Empire State
Plaza Performing Arts . . . . . . . . . . . . . . . March 31, 2013*New York Convention Center
Operating Corporation . . . . . . . . . . . . . . March 31, 2013New York State Affordable
Housing Corporation . . . . . . . . . . . . . . . March 31, 2013*New York State Bridge Authority . . . . . . . . December 31, 2012*New York State Health Foundation . . . . . . December 31, 2012New York State Housing
Finance Agency . . . . . . . . . . . . . . . . . . . October 31, 2012*New York State Job Development
Authority . . . . . . . . . . . . . . . . . . . . . . . . . March 31, 2013*New York State Olympic Regional
Development Authority . . . . . . . . . . . . . . March 31, 2013*New York State Thoroughbred
Breeding and DevelopmentFund Corporation . . . . . . . . . . . . . . . . . . December 31, 2012*
New York State Thruway Authority . . . . . . . December 31, 2012*Niagara Frontier Transportation
Authority . . . . . . . . . . . . . . . . . . . . . . . . . March 31, 2013*Ogdensburg Bridge and
Port Authority . . . . . . . . . . . . . . . . . . . . . March 31, 2013*Port of Oswego Authority . . . . . . . . . . . . . . March 31, 2013*Research Foundation for
Mental Hygiene, Inc . . . . . . . . . . . . . . . . March 31, 2013*Rochester-Genesee Regional
Transportation Authority . . . . . . . . . . . . . March 31, 2013*Roosevelt Island Operating
Corporation . . . . . . . . . . . . . . . . . . . . . . . March 31, 2013*Roswell Park Cancer Institute . . . . . . . . . . March 31, 2013* State Insurance Fund . . . . . . . . . . . . . . . . . December 31, 2012
Entities Audited by Other Auditors (cont’d): Fiscal Year-End
State of New York Mortgage Agency . . . . . October 31, 2012*Urban Development Corporation . . . . . . . . March 31, 2013*
**Audit conducted in accordance with Government AuditingStandards as promulgated by the Comptroller General of the United States.
**KPMG LLP audited 57 percent of the total assets and 76 percent of the total revenues of the State University of New York Foundations. The remaining balances were audited by other auditors.
Additionally, the Downstate at LICH Holding Company, Inc.*,Upstate Properties Development, Inc.*, the Alfred UniversityCollege of Ceramics, the Cornell Statutory Colleges, and auxiliaryservice corporations* included within the SUNY enterprise fundare audited by other auditors.
Financial InformationSubstantially all of the financial data was derived fromaudited annual financial statements and summarizedinto the combining statement format in the basicfinancial statements. The Corporations follow theaccrual basis of accounting. A few of the individualcomponent units, primarily, the State Insurance Fund,do not fully conform to the accrual basis; however,the impact of these variances is not material to theCorporations in total. Ten of the forty-two discreteentities presented comprise 95 percent of the combinedassets and 81 percent of the combined programrevenues (before eliminations). The remaining portionof this note contains a brief description of the opera-tions of the ten largest entities. A presentation of theiraccounts is included in the Combining Statement ofNet Position and Combining Statement of Activities.Beginning net position (before eliminations) wasincreased by $114 million on the Combining Statementof Activities for Discretely Presented Component Unitsto reflect the transition by the New York RacingAssociation from preparing its financial statements inaccordance with GAAP as prescribed by the FinancialAccounting Standards Board, to preparing its financialstatements in accordance with GAAP as prescribedby the GASB, along with the early implementation ofGASBS 65, Items Previously Reported as Assets andLiabilities, by the New York State Thruway Authority andthe Niagara Frontier Transportation Authority. GASBS65 establishes accounting and financial reportingstandards that reclassify, as deferred outflows ofresources or deferred inflows of resources, certainitems that were previously reported as assets andliabilities. Additional information about each of theCorporations can be obtained by contacting theCorporations directly and requesting a copy of theirannual financial reports, or by visiting their websites.
Certain Corporations issue revenue bonds forindependent third-party entities to provide fundingfor the projects of those third parties. These bonds areconsidered conduit debt and are secured by paymentsmade by third party entities and in some cases certain
other pledged funds. These bonds do not constitute adebt or pledge of the faith and credit of the Corporationsor the State, other than the amounts reported in theState’s financial statements. DASNY, the New York StateHousing Finance Agency (HFA), the EnvironmentalFacilities Corporation (EFC), the New York State EnergyResearch and Development Authority (NYSERDA) andthe New York Job Development Authority (JDA) haveissued conduit debt and have elected different, butpermissible, methods of accounting for it under GAAP.DASNY has elected to report conduit debt and relatedassets on its balance sheet. At March 31, 2013, theliability reported for such debt was approximately $20.3billion. HFA reports conduit debt and related assetson its balance sheet. At October 31, 2012, the liabilityHFA reported for such debt was approximately $9billion. At March 31, 2013, EFC’s balance sheet did notinclude $147 million in bonds it issued for certain pri-vate companies. NYSERDA has issued conduit debt forparticipating gas and electric companies and otherthird party entities, the principal of which totaledapproximately $3.4 billion at March 31, 2013, which isnot included on NYSERDA’s balance sheet. LocalDevelopment Corporations that are blended componentunits of JDA have issued conduit debt which is notincluded on JDA’s combined balance sheet. At March 31,2013, the principal on these bonds totaled approximately$7 billion.
Power AuthorityThe Power Authority of the State of New York (NYPA)was created in 1931 to help provide a continuous ade-quate supply of dependable electric power and energyto the people of the State. NYPA generates, transmits,and sells electric power and energy principally atwholesale to various customers including private andmunicipal utilities. Three of NYPA’s largest facilities arethe Niagara Power Project at Lewiston, the Blenheim-Gilboa Pumped Storage Power Project at Blenheimand Gilboa and the St. Lawrence-Franklin D. RooseveltPower Project at Massena. These hydroelectric facilitieshave the capability of producing 2,441,000, 1,100,000and 800,000 kilowatts, respectively.
NYPA has loaned approximately $318 million ofreserves to the State treasury. The State has recorded acorresponding liability in its financial statements. Theindividual financial statements of NYPA are available onthe web at www.nypa.gov.
Housing Finance AgencyHFA was created as a public benefit corporation in 1960under Article III of the Private Housing Finance Law.HFA is empowered to finance or contract for thefinancing of the construction, acquisition, or refinancingof loans for: low-to-moderate income housing; munici-pal health facilities; non-profit health care facilities;
community related facilities; and to provide funds torepay the State for amounts advanced to finance the costof various housing assistance programs. HFA, throughits Capital Grant Low Rent Assistance Program, rentshousing to low and middle income persons and families.HFA also participates in Federal housing assistanceprograms which provide interest reduction and rentalassistance subsidies to eligible projects and tenants. HFAadministers the State’s Housing Project Repair andInfrastructure Trust Fund Programs.
To finance low income housing, HFA raises fundsthrough the issuance of municipal securities and themaking of mortgage loans to eligible borrowers. HFAis authorized to issue bonds in the amount of approxi-mately $17.3 billion to finance housing projects, andapproximately $2.7 billion in Service Contract Obli-gation Revenue Bonds, Service Contract RevenueBonds and Personal Income Tax Revenue Bonds. Totalbond indebtedness reported as of October 31, 2012 isapproximately $10.8 billion. The individual financialstatements of HFA can be obtained by contacting themat www.nyshcr.org.
Thruway AuthorityThe New York State Thruway Authority (NYSTA) wascreated as a public benefit corporation by the StateLegislature in 1950 with powers to construct, operateand maintain a Thruway system. In 1991, the Legis-lature empowered NYSTA to issue Local Highway andBridge Service Contract (LHB) Bonds to provide fundsto municipalities throughout the State for qualifyingcapital expenditures under State programs. In August1992, the Legislature created the New York State CanalCorporation (NYSCC) as a subsidiary corporation ofNYSTA to accept jurisdiction and control over the StateCanal System from the State. In 1993, the Legislatureauthorized NYSTA to issue Highway and Bridge TrustFund (HBTF) Bonds to reimburse the State for expen-ditures made by the State’s Department of Transpor-tation in connection with the State’s multi-year Highwayand Bridge Capital Program. In 2001, the Legislatureauthorized NYSTA to issue Personal Income Tax (PIT)Revenue Bonds to provide funds to municipalities andother project sponsors throughout the State forqualifying local highway, bridge and multi-modal capitalproject expenditures under established State programs.
The financial position of and activities relating tothe special bond programs (LHB, HBTF and PIT) arereported within the funds of the State rather thanunder the public benefit corporations because thesespecial bond programs are not separate legal entitiesbut are considered funds of the State. Columns headed“Thruway Authority” reflect the operations of the Thru-way system and the NYSCC. The individual financialstatements of NYSTA can be obtained by contactingthem at www.thruway.ny.gov.
98 • Notes to Basic Financial Statements ____________________________________________________________________________
______________________________________________________________________________________________ STATE OF NEW YORK • 99
Metropolitan Transportation AuthorityThe Metropolitan Transportation Authority (MTA)was created to continue, develop and improve publictransportation and to develop and implement a unifiedpublic transportation policy in the New York Citymetropolitan area. The accounts presented as the MTAare the combined accounts of its headquarters andeight affiliates and subsidiaries. The MTA operates thelargest transit and commuter rail transportation systemin North America and one of the largest in the world.The MTA is dependent upon the State for a portionof its revenues. During the MTA fiscal year endedDecember 31, 2012, the MTA reported $4.1 billion inpayments from the State. A significant portion of thataid was in payments from the State’s Mass Trans-portation Operating Assistance Fund, a Special RevenueFund, which derives a major portion of its receiptsfrom taxes imposed in the Metropolitan TransportationDistrict for this purpose. Another significant portion ofthat aid came from the Metropolitan CommuterTransportation Mobility Tax enacted in 2009, which isa tax imposed on certain employers and self-employedindividuals engaging in business within the Metro-politan Transportation District. The State also providesfunding to pay the debt service on State ServiceContract bonds issued by the MTA for its capitalprojects. In June 2012, the Dormitory Authority of theState of New York refunded approximately $1.6 billionof these MTA bonds by issuing Personal Income TaxRevenue Bonds. At December 31, 2012, $400 million ofMTA State Service Contract bonds remain outstanding.Capital assets acquired prior to April 1982 for the NewYork City Transit Authority (NYCTA) were fundedprimarily by New York City through capital grants.New York City has title to a substantial portion of suchassets and they are not included among the assetsreported under MTA. In certain instances, title to realproperty used by the Triborough Bridge and TunnelAuthority (TBTA) may revert to New York City in theevent TBTA determines it is not needed for corporatepurposes. The Federal government has a contingentequity interest in assets acquired by the MTA withFederal funds, and upon disposal of such assets, theFederal government may have a right to its share of theproceeds from the sale. The individual financialstatements of the MTA can be obtained by contactingthem at www.mta.info.
Dormitory AuthorityThe Dormitory Authority of the State of New York(DASNY) is a public benefit corporation established in1944. DASNY’s purpose is to finance, design, construct,purchase, reconstruct and/or rehabilitate buildings(projects) for use by public and private educational andother not-for-profit institutions (institutions) locatedwithin the State, certain State agencies, local schooldistricts, and cities and counties with respect to certaincourt and municipal health facilities.
DASNY’s outstanding bonds and notes of $45.3billion consist mainly of debt issued for independentinstitutions ($10.6 billion), New York State agencyprojects ($10.5 billion), SUNY projects ($9.6 billion),health care facilities ($6.6 billion) and CUNY projects($4.4 billion). The remaining debt was issued forprojects for municipal facilities and other non-profitorganizations. The financial statements of DASNY canbe obtained at www.dasny.org.
Long Island Power AuthorityThe Long Island Power Authority (LIPA) was estab-lished as a corporate municipal instrumentality of theState. On May 28, 1998, the LIPA Acquisition Corpora-tion, a wholly-owned subsidiary of LIPA, was mergedwith and into the Long Island Lighting Company(LILCO) pursuant to an Agreement and Plan of Mergerdated as of June 26, 1997. LIPA, as owner of thetransmission and distribution system located in Nassau,Suffolk and a small portion of Queens counties, isresponsible for supplying electricity to customers inthe service area.
LIPA financed the cost of the merger and therefinancing of certain of LILCO’s outstanding debtby the issuance of $6.7 billion aggregate principalamount of Electric System General Revenue Bondsand Electric System Subordinated Revenue Bonds.In addition, LIPA assumed $1.2 billion of LILCO’sGeneral and Refunding Bonds which were defeasedimmediately upon the closing of the merger. Theexcess of the acquisition costs over the fair value ofnet position acquired ($3.5 billion) has been reportedas an “intangible asset,” which is being amortized overa 35-year period which began May 28, 1998. Theindividual financial statements of LIPA can be obtainedby contacting them at www.lipower.org.
Urban Development CorporationThe New York State Urban Development Corporation(UDC) was established by legislative act in 1968 as acorporate governmental agency of the State. UDCconducts business as Empire State Development. UDCis engaged in three principal activities: economicdevelopment, special projects throughout the Statefinanced by revenue bonds, and real estate projectsfinanced by general and corporate purpose bonds.
UDC’s efforts in economic development projectsare primarily funded by State appropriations and Statesupported bonds, and are directed at several activitiesinvolving civic, commercial, high technology, andindustrial development within the State. UDC providesfinancial assistance through loans, grants, tax credits,low cost project financing, including loans and interestsubsidy grants, and technical assistance in management,financing and project design. Economic developmentactivities also include special projects, often of consider-able magnitude, which are carried out through variousconsolidated subsidiaries.
100 • Notes to Basic Financial Statements ___________________________________________________________________________
UDC issues revenue bonds, the proceeds of whichare used primarily for construction and renovation ofState correctional facilities, to refinance State officefacilities or construct technology facilities for universitieslocated within the State, to finance youth facilities, tofinance the acquisition of certain lands, to constructand/or improve various civic and community facilities,and for economic development and preservation ofnatural resources located throughout the State. Underrelated agreements, UDC receives periodic State appro-priations in amounts sufficient to pay the debt service onthe bonds.
UDC was originally created to facilitate the develop-ment of affordable housing for low, moderate andmiddle-income persons and families. Since the mid-1970s, UDC activity in this area has been limited to themonitoring and loan servicing of existing projects. OnJune 5, 2013 UDC’s Housing Portfolio was transferredto the New York State Housing Finance Agency. Theeffect of this transfer is reflected in UDC’s March 31,2013 financial statements.
UDC continues its efforts to promote economicdevelopment throughout the State. Its mission is topromote a vigorous and growing economy, encouragethe creation of new jobs and economic opportunities,increase revenues to the State and its municipalities,and achieve stable and diversified local economies.Through the use of loans, grants, tax credits and otherforms of financial assistance UDC strives to enhanceprivate business investment and growth to spur jobcreation and support prosperous communities acrossthe State. The financial statements of the UDC areavailable at www.esd.ny.gov.
State Insurance FundThe State Insurance Fund (SIF) is comprised of theWorkers’ Compensation Fund and the DisabilityBenefits Fund and is primarily engaged in providingworkers’ compensation and disability benefit insurancefor employers in the State of New York.
During previous fiscal years, the SIF transferredapproximately $1.3 billion to the State’s General Fundand Other Governmental Funds. The statutes authoriz-ing these transfers required that the State appropriateamounts annually for the potential repayment of thetransfers. Such repayment is required only to maintainthe solvency, as defined, of the Workers’ CompensationFund. The entire receivable and equity related to thesetransfers were eliminated from the presentation ofthe SIF, resulting in a fund balance of approximately$2 billion.
The SIF’s financial statements are prepared inconformity with the accounting practices prescribed bythe New York State Department of Financial Services,which is a comprehensive basis of accounting otherthan the accounting principles generally accepted inthe United States of America. The major departure
from GAAP is that SIF established a reserve for securityfluctuations to provide for the difference betweenamortized cost and fair value, where under GAAP, nosuch reserve would be allowed. Bonds are generallycarried at amortized cost. Under GAAP, bonds areclassified into “held to maturity” and reported atamortized cost, “trading” and reported at fair valuewith unrealized gains and losses included in earnings,or “available for sale” and reported at fair value withunrealized gains and losses reported as a separatecomponent of surplus. The net unrealized gains andlosses from investments in common stock are reportedin unassigned surplus and dividend income generallyis reported when received. Under GAAP, commonstocks are classified as either “trading” and reported atfair value with unrealized gains and losses includedin earnings, or “available for sale” and reported at fairvalue with unrealized gains and losses reported as aseparate component of surplus. Policy acquisition costsare expensed as incurred, whereas under GAAP theywould be deferred and amortized to income on thesame basis as premium income is recognized; certainassets designated as non-admitted assets (principallypremiums in the course of collection over 90 days andoffice furniture and equipment) are charged directlyagainst the surplus, where under GAAP they would beincluded in total assets less valuation allowances; andcomprehensive income and its components are notpresented in the SIF’s financial statements. A morecomplete list of departures from GAAP is disclosed inthe SIF’s financial statements, which may be obtainedfrom ww3.nysif.com.
State of New York Mortgage AgencyThe State of New York Mortgage Agency (SONYMA)makes mortgages available to first-time and otherqualifying home buyers through its Low Interest RateProgram and other specialized home ownershipprograms. To accomplish this purpose, SONYMA issuestax-exempt mortgage revenue bonds for direct issuanceof forward commitments for new mortgage loansthrough participating financial institutions. SONYMAalso provides mortgage insurance for qualifying realproperty loans through its Mortgage Insurance Program.By statute, all costs of providing mortgage insuranceare recovered from a State mortgage recording taxsurcharge, which is a dedicated tax revenue streamreceived directly by SONYMA. In April 2009, SONYMA’sstatutory authority to purchase education loans wasupdated and expanded in order to permit the Agencyto work with the New York State Higher EducationServices Corporation in developing a new program tooffer education loans to eligible students attendingcolleges and universities in New York State. The financialstatements of SONYMA can be obtained by contactingthem at www.nyshcr.org.
____________________________________________________________________________________________ STATE OF NEW YORK • 101
Environmental Facilities CorporationThe New York State Environmental Facilities Cor-poration (EFC) is a public benefit corporation, formedpursuant to the New York State Environmental FacilitiesCorporation Act. The mission of EFC is to providelow-cost capital and expert technical assistance forenvironmental projects in New York State. Its purposeis to help public and private entities comply withFederal and State environmental protection and qualityrequirements in a cost effective manner that advancessustainable growth. EFC promotes innovative tech-nologies and practices in all corporate programs. EFCis governed by a board of directors, which consists ofseven members.
The services offered by EFC include providinglow-cost capital for both water quality protection andwater supply projects through the Clean Water andDrinking Water State Revolving Funds; assistingmunicipalities, businesses, and State agencies to
understand and comply with environmental laws andregulations through the Technical Advisory ServicesProgram, including protecting the New York CityWatershed, and helping small businesses comply withair pollution standards; and providing low-cost capitaland other financial assistance to New York businessesfor environmental protection projects through theIndustrial Finance and Financial Assistance to Businessprograms. The complete audited financial statementsand related notes as well as additional informationregarding EFC can be obtained by visiting EFC atwww.nysefc.gov.
EliminationsEliminations are made primarily to avoid duplicatereporting. As explained in Note 7, the State services asignificant portion of the bonds and notes payable ofcertain Corporations.
Note 15 Joint VenturesA joint venture is an entity that results from a contractualarrangement and that is owned, operated, or governedby two or more participants as a separate and specificactivity subject to joint control, in which the participantsretain an ongoing financial interest or an ongoingfinancial responsibility. The only material joint venturein which the State has an interest is the Port Authorityof New York and New Jersey (Port Authority).
The Port Authority is a municipal corporate instru-mentality of the States of New York and New Jerseycreated by compact between the two states in 1921 withthe consent of the Congress of the United States. ThePort Authority is authorized and directed to plan,develop, and operate terminals and other facilities oftransportation and commerce, and to advance projectsin the general fields of transportation, economic devel-opment, and world trade that contribute to promotingand protecting the commerce and economy of the portdistrict, defined in the compact, which comprises anarea of about 1,500 square miles in both states, centeringaround New York Harbor.
The Governor of each state appoints six of thetwelve members of the governing Board of Commis-sioners, subject to confirmation by the respective statesenate. Governors have from time to time exercisedtheir statutory power to veto the actions of the commis-sioners from their states.
The commissioners serve six-year overlappingterms as public officials without compensation. Theyestablish Port Authority policy, appoint an ExecutiveDirector to implement it, and appoint a GeneralCounsel to act as legal advisor to the Board and tothe Executive Director.
The compact envisions the Port Authority as beingfinancially self-sustaining and, as such, it must obtainthe funds necessary for the construction or acquisitionof facilities upon the basis of its own credit. The PortAuthority has neither the power to pledge the credit ofeither state or any municipality nor to levy taxes orassessments.
The liabilities of the Port Authority include $18.2billion of consolidated bonds. Consolidated bonds andnotes are equally and ratably secured by a pledge of thenet revenues of all existing facilities and any additionalfacilities which may be financed in whole or in partthrough the medium of consolidated bonds and notes.
The Port Authority’s Comprehensive AnnualFinancial Report is available from the Public Affairs andComptroller’s Departments of the Port Authority ofNew York and New Jersey, 225 Park Avenue South,New York, NY 10003-1604, or the Port Authority websiteat www.panynj.gov.
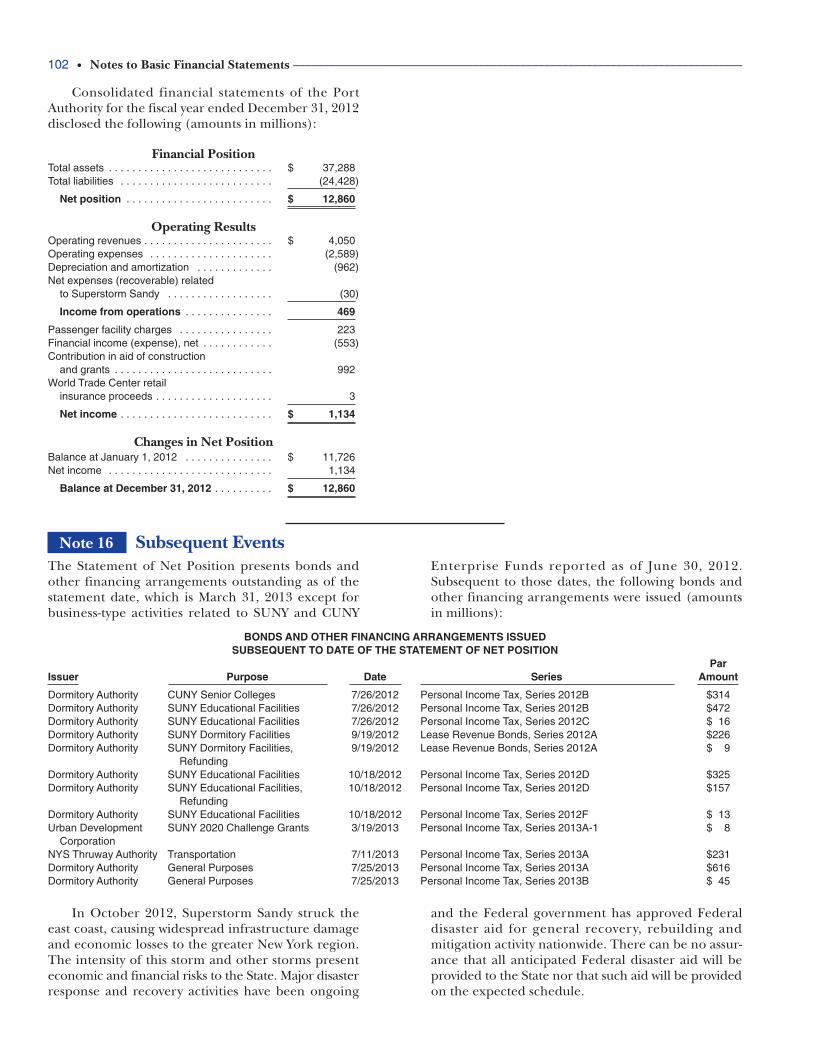
102 • Notes to Basic Financial Statements ___________________________________________________________________________
Consolidated financial statements of the PortAuthority for the fiscal year ended December 31, 2012disclosed the following (amounts in millions):
Financial PositionTotal assets . . . . . . . . . . . . . . . . . . . . . . . . . . . . $ 37,288Total liabilities . . . . . . . . . . . . . . . . . . . . . . . . . . (24,428)
Net position . . . . . . . . . . . . . . . . . . . . . . . . . $ 12,860
Operating ResultsOperating revenues . . . . . . . . . . . . . . . . . . . . . . $ 4,050Operating expenses . . . . . . . . . . . . . . . . . . . . . (2,589)Depreciation and amortization . . . . . . . . . . . . . (962)Net expenses (recoverable) related
to Superstorm Sandy . . . . . . . . . . . . . . . . . . (30)
Income from operations . . . . . . . . . . . . . . . 469
Passenger facility charges . . . . . . . . . . . . . . . . 223Financial income (expense), net . . . . . . . . . . . . (553)Contribution in aid of construction
and grants . . . . . . . . . . . . . . . . . . . . . . . . . . . 992World Trade Center retail
insurance proceeds . . . . . . . . . . . . . . . . . . . . 3
Net income . . . . . . . . . . . . . . . . . . . . . . . . . . $ 1,134
Changes in Net PositionBalance at January 1, 2012 . . . . . . . . . . . . . . . $ 11,726Net income . . . . . . . . . . . . . . . . . . . . . . . . . . . . 1,134
Balance at December 31, 2012 . . . . . . . . . . $ 12,860
The Statement of Net Position presents bonds andother financing arrangements outstanding as of thestatement date, which is March 31, 2013 except forbusiness-type activities related to SUNY and CUNY
Enterprise Funds reported as of June 30, 2012.Subsequent to those dates, the following bonds andother financing arrangements were issued (amountsin millions):
Note 16 Subsequent Events
BONDS AND OTHER FINANCING ARRANGEMENTS ISSUED SUBSEQUENT TO DATE OF THE STATEMENT OF NET POSITION
ParIssuer Purpose Date Series Amount
Dormitory Authority CUNY Senior Colleges 7/26/2012 Personal Income Tax, Series 2012B $314Dormitory Authority SUNY Educational Facilities 7/26/2012 Personal Income Tax, Series 2012B $472Dormitory Authority SUNY Educational Facilities 7/26/2012 Personal Income Tax, Series 2012C $ 16Dormitory Authority SUNY Dormitory Facilities 9/19/2012 Lease Revenue Bonds, Series 2012A $226Dormitory Authority SUNY Dormitory Facilities, 9/19/2012 Lease Revenue Bonds, Series 2012A $ 9
RefundingDormitory Authority SUNY Educational Facilities 10/18/2012 Personal Income Tax, Series 2012D $325Dormitory Authority SUNY Educational Facilities, 10/18/2012 Personal Income Tax, Series 2012D $157
RefundingDormitory Authority SUNY Educational Facilities 10/18/2012 Personal Income Tax, Series 2012F $ 13Urban Development SUNY 2020 Challenge Grants 3/19/2013 Personal Income Tax, Series 2013A-1 $ 8
CorporationNYS Thruway Authority Transportation 7/11/2013 Personal Income Tax, Series 2013A $231Dormitory Authority General Purposes 7/25/2013 Personal Income Tax, Series 2013A $616Dormitory Authority General Purposes 7/25/2013 Personal Income Tax, Series 2013B $ 45
In October 2012, Superstorm Sandy struck theeast coast, causing widespread infrastructure damageand economic losses to the greater New York region.The intensity of this storm and other storms presenteconomic and financial risks to the State. Major disasterresponse and recovery activities have been ongoing
and the Federal government has approved Federaldisaster aid for general recovery, rebuilding andmitigation activity nationwide. There can be no assur-ance that all anticipated Federal disaster aid will beprovided to the State nor that such aid will be providedon the expected schedule.
Required Supplementary
Information(unaudited)
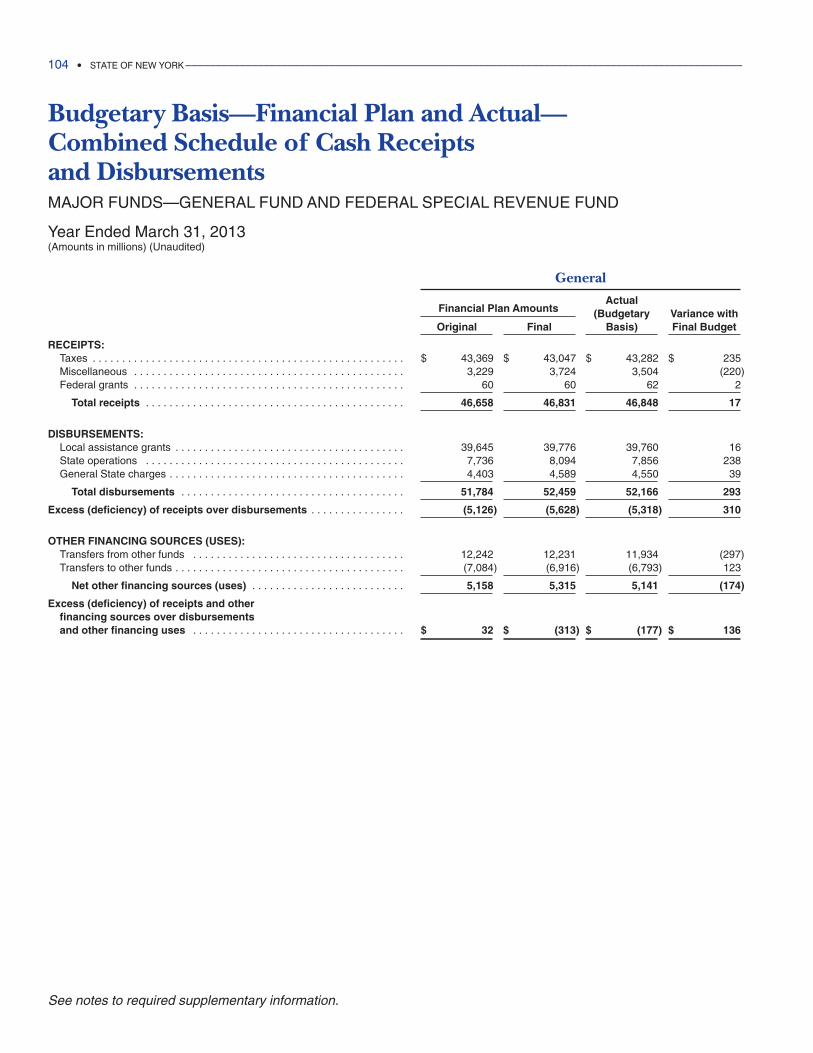
Budgetary Basis—Financial Plan and Actual—Combined Schedule of Cash Receipts and DisbursementsMAJOR FUNDS—GENERAL FUND AND FEDERAL SPECIAL REVENUE FUND
Year Ended March 31, 2013(Amounts in millions) (Unaudited)
General
Financial Plan AmountsActual
(Budgetary Variance withOriginal Final Basis) Final Budget
RECEIPTS:Taxes . . . . . . . . . . . . . . . . . . . . . . . . . . . . . . . . . . . . . . . . . . . . . . . . . . . . . $ 43,369 $ 43,047 $ 43,282 $ 235Miscellaneous . . . . . . . . . . . . . . . . . . . . . . . . . . . . . . . . . . . . . . . . . . . . . . 3,229 3,724 3,504 (220)Federal grants . . . . . . . . . . . . . . . . . . . . . . . . . . . . . . . . . . . . . . . . . . . . . . 60 60 62 2
Total receipts . . . . . . . . . . . . . . . . . . . . . . . . . . . . . . . . . . . . . . . . . . . . 46,658 46,831 46,848 17
DISBURSEMENTS:Local assistance grants . . . . . . . . . . . . . . . . . . . . . . . . . . . . . . . . . . . . . . . 39,645 39,776 39,760 16State operations . . . . . . . . . . . . . . . . . . . . . . . . . . . . . . . . . . . . . . . . . . . . 7,736 8,094 7,856 238General State charges . . . . . . . . . . . . . . . . . . . . . . . . . . . . . . . . . . . . . . . . 4,403 4,589 4,550 39
Total disbursements . . . . . . . . . . . . . . . . . . . . . . . . . . . . . . . . . . . . . . 51,784 52,459 52,166 293
Excess (deficiency) of receipts over disbursements . . . . . . . . . . . . . . . . (5,126) (5,628) (5,318) 310
OTHER FINANCING SOURCES (USES):Transfers from other funds . . . . . . . . . . . . . . . . . . . . . . . . . . . . . . . . . . . . 12,242 12,231 11,934 (297)Transfers to other funds . . . . . . . . . . . . . . . . . . . . . . . . . . . . . . . . . . . . . . . (7,084) (6,916) (6,793) 123
Net other financing sources (uses) . . . . . . . . . . . . . . . . . . . . . . . . . . 5,158 5,315 5,141 (174)
Excess (deficiency) of receipts and otherfinancing sources over disbursementsand other financing uses . . . . . . . . . . . . . . . . . . . . . . . . . . . . . . . . . . . . $ 32 $ (313) $ (177) $ 136
104 • STATE OF NEW YORK _____________________________________________________________________________________________
See notes to required supplementary information.
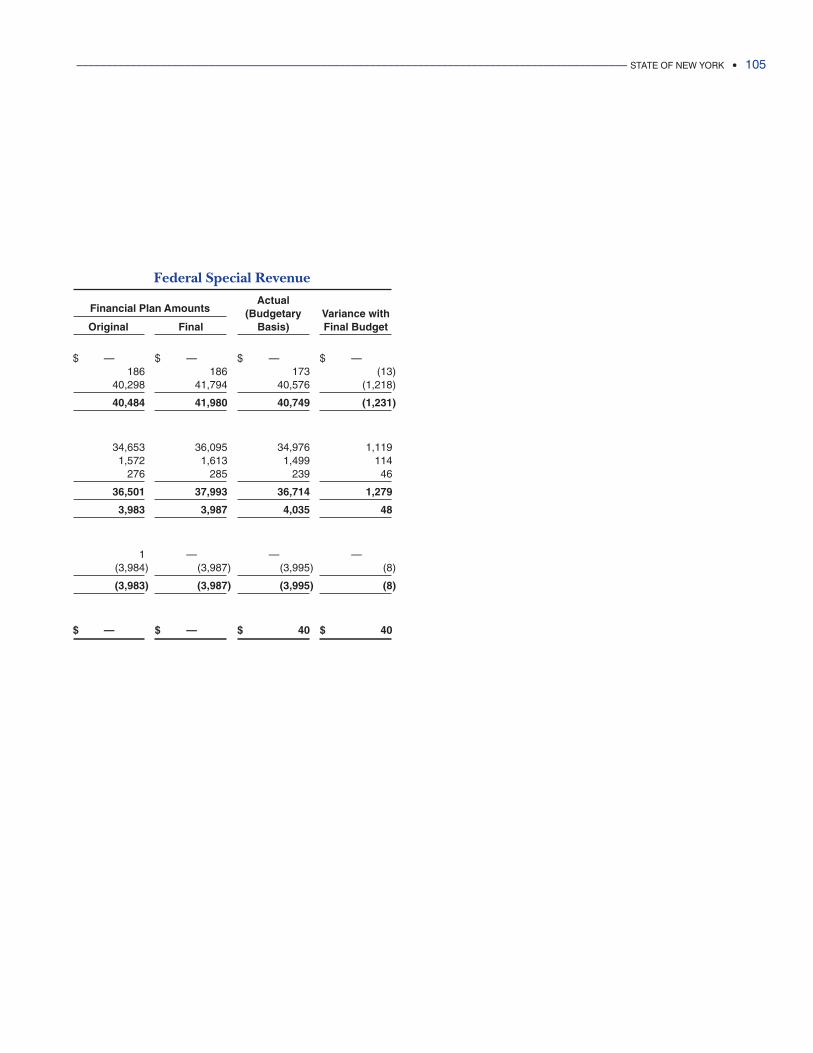
Federal Special Revenue
Financial Plan AmountsActual
(Budgetary Variance withOriginal Final Basis) Final Budget
$ —00000 $ —00000 $ —00000 $ —00000186 186 173 (13)
40,298 41,794 40,576 (1,218)
40,484 41,980 40,749 (1,231)
34,653 36,095 34,976 1,1191,572 1,613 1,499 114
276 285 239 46
36,501 37,993 36,714 1,279
3,983 3,987 4,035 48
1 —00000 —00000 —00000(3,984) (3,987) (3,995) (8)
(3,983) (3,987) (3,995) (8)
$ —00000 $ —00000 $ 40 $ 40
____________________________________________________________________________________________ STATE OF NEW YORK • 105
106 • Required Supplementary Information ________________________________________________________________________
Budgetary Basis ReportingThe State Constitution requires the Governor to sub-mit annually an Executive Budget, which containsplans for all funds of expenditures and disbursementsfor the ensuing fiscal year, as well as all monies and rev-enues estimated to be available. Bills containing all rec-ommended appropriations or reappropriations andany proposed legislation necessary to provide moniesand revenues sufficient to meet such proposed expen-ditures and disbursements accompany the ExecutiveBudget. Reappropriations are commonly used for fed-erally funded programs and capital projects, wherethe funding amount is intended to support activitiesthat may span several fiscal years. Budgets are pre-pared and enacted for all funds. Included in the pro-posed appropriation bills is a provision for spendingauthority for unanticipated revenues or unforeseenemergencies in accordance with statutory require-ments. The Executive Budget also includes a cashbasis financial plan that must be in balance, i.e., dis-bursements must not exceed available receipts.
The Legislature enacts appropriation bills andrevenue measures containing those parts of the Exec-utive Budget it has approved or modified. The Legis-lature may also enact supplemental appropriation orspecial appropriation bills after it completes action onthe Executive Budget. Further, when the Legislatureconvenes in January, it may enact deficiency appro-priations to meet actual or anticipated obligations notforeseen when the annual budget and any supple-mental budgets were enacted and for which the costswould exceed available spending authorizations. Itmight add to a previously authorized appropriationanticipated to be inadequate, or provide a new appro-priation to finance an existing or anticipated liability forwhich no appropriation exists. A deficiency appropri-ation usually applies to the fiscal year during which it ismade. Pursuant to State law, once the Legislature hascompleted action on the appropriation and revenuebills and they are approved by the Governor, the cashbasis and the GAAP basis financial plans must be revisedby the Governor to reflect the impact resulting fromchanges in appropriations and revenue bills. The cashbasis financial plan, which serves as the basis for theadministration of the State’s finances during the fiscalyear, provides a summary of projected receipts, dis-bursements and fiscal year-end balances. Such plans
are updated quarterly throughout the fiscal year bythe Governor, and include a comparison of the actualyear-to-date results with the latest revised plans, pro-viding an explanation of any major deviations and anysignificant changes to the financial plans. Projecteddisbursements are based on agency staffing levels,program caseloads, levels of service needs, formulascontained in State and Federal law, inflation and otherfactors. All projections account for the timing of pay-ments, since not all the amounts appropriated in theBudget are disbursed in the same fiscal year.
The Statewide Financial System includes controlsover expenditures to ensure that the maximum spend-ing authority is not exceeded during the life of the appro-priation. Expenditures are controlled at the major objectlevel within each program or project of each State agencyin accordance with the underlying appropriationpurpose. Compliance with the level of legal control isreported in a separate document entitled, “Approp-SegExpenditure Analysis Report.” This document reports bothexpenditures and encumbrances which reserve a portionof the applicable appropriation, thereby ensuring thatthe appropriations are not exceeded. A copy of thisreport is available upon request by contacting the StateComptroller’s Communication Office at 110 State Street,15th floor, Albany, New York 12236 or by phone at (518)474-4015. Encumbrances are not considered a dis-bursement in the financial plan or an expenditure andexpense in the basic financial statements. Generally,appropriations are available for liabilities incurredduring the fiscal year. Following the end of the fiscalyear, a ‘lapse period’ is provided to liquidate prior yearliabilities. Unless reappropriated, most State operationsappropriations cease on June 30th and local assistance,debt service, capital projects and federal fund appro-priations cease on September 15th—following the endof the fiscal year. Disbursements made during the lapseperiod from prior year appropriations are included,together with disbursements from new year appropria-tions, in the subsequent fiscal year financial plan. Manyappropriations enacted are not intended to be used,although required by law. These types of appropriationswill generally cause total appropriation authorizations toexceed cash basis financial plan disbursement amounts.Actual disbursements for certain spending categoriesmay exceed financial plan estimates (as reported in theBudgetary Basis—Financial Plan and Actual) but do not
NOTES TO BUDGETARY BASIS REPORTING(unaudited)
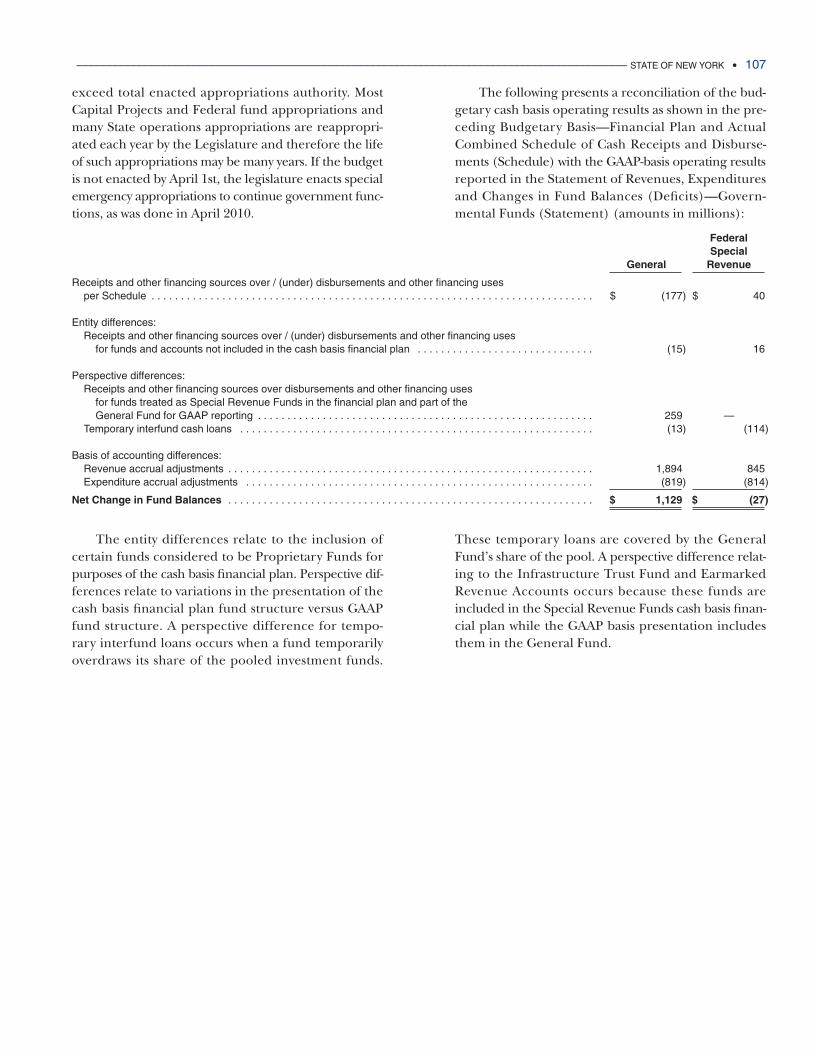
____________________________________________________________________________________________ STATE OF NEW YORK • 107
exceed total enacted appropriations authority. MostCapital Projects and Federal fund appropriations andmany State operations appropriations are reappropri-ated each year by the Legislature and therefore the lifeof such appropriations may be many years. If the budgetis not enacted by April 1st, the legislature enacts specialemergency appropriations to continue government func-tions, as was done in April 2010.
The following presents a reconciliation of the bud-getary cash basis operating results as shown in the pre-ceding Budgetary Basis—Financial Plan and ActualCombined Schedule of Cash Receipts and Disburse-ments (Schedule) with the GAAP-basis operating resultsreported in the Statement of Revenues, Expendituresand Changes in Fund Balances (Deficits)—Govern-mental Funds (Statement) (amounts in millions):
The entity differences relate to the inclusion ofcertain funds considered to be Proprietary Funds forpurposes of the cash basis financial plan. Perspective dif-ferences relate to variations in the presentation of thecash basis financial plan fund structure versus GAAPfund structure. A perspective difference for tempo-rary interfund loans occurs when a fund temporarilyoverdraws its share of the pooled investment funds.
These temporary loans are covered by the GeneralFund’s share of the pool. A perspective difference relat-ing to the Infrastructure Trust Fund and EarmarkedRevenue Accounts occurs because these funds areincluded in the Special Revenue Funds cash basis finan-cial plan while the GAAP basis presentation includesthem in the General Fund.
FederalSpecial
General Revenue
Receipts and other financing sources over / (under) disbursements and other financing uses per Schedule . . . . . . . . . . . . . . . . . . . . . . . . . . . . . . . . . . . . . . . . . . . . . . . . . . . . . . . . . . . . . . . . . . . . . . . . . . . $ (177) $ 40
Entity differences:Receipts and other financing sources over / (under) disbursements and other financing uses
for funds and accounts not included in the cash basis financial plan . . . . . . . . . . . . . . . . . . . . . . . . . . . . . . (15) 16
Perspective differences:Receipts and other financing sources over disbursements and other financing uses
for funds treated as Special Revenue Funds in the financial plan and part of the General Fund for GAAP reporting . . . . . . . . . . . . . . . . . . . . . . . . . . . . . . . . . . . . . . . . . . . . . . . . . . . . . . . . . 259 —00000
Temporary interfund cash loans . . . . . . . . . . . . . . . . . . . . . . . . . . . . . . . . . . . . . . . . . . . . . . . . . . . . . . . . . . . . (13) (114)
Basis of accounting differences:Revenue accrual adjustments . . . . . . . . . . . . . . . . . . . . . . . . . . . . . . . . . . . . . . . . . . . . . . . . . . . . . . . . . . . . . . 1,894 845Expenditure accrual adjustments . . . . . . . . . . . . . . . . . . . . . . . . . . . . . . . . . . . . . . . . . . . . . . . . . . . . . . . . . . . (819) (814)
Net Change in Fund Balances . . . . . . . . . . . . . . . . . . . . . . . . . . . . . . . . . . . . . . . . . . . . . . . . . . . . . . . . . . . . . . $ 1,129 $ (27)
108 • Required Supplementary Information ________________________________________________________________________
In accordance with GAAP, the State has adopted analternative method for recording depreciation expensefor the State’s network of roads and bridges main-tained by the Department of Transportation. Underthis method, referred to as the modified approach, theState will not report depreciation expense for roadsand bridges but will capitalize all costs that add tothe capacity and efficiency of State owned roads andbridges. Generally, all maintenance and preservationcosts will be expensed and not capitalized.
In order to adopt the modified approach, the Stateis required to meet the following criteria:
1. Maintain an asset management system thatincludes a current inventory of eligible infra-structure assets.
2. Conduct condition assessments of eligible assetsand summarize the results using a measure-ment scale.
3. Estimate each year the annual amount neces-sary to maintain and preserve the eligible assetsat the condition level established and disclosedby the State.
4. Document that the assets are being preservedapproximately at, or above, the established con-dition level.
RoadsThe State Department of Transportation maintainsthe Pavement Management System (PMS) which sup-ports a construction program that preserves the State’sinvestment in its roads. The PMS contains locational,operational and historical condition data. The PMS isused to determine the appropriate program forimproving the asset condition and to determine futurefunding levels necessary to meet condition goals. Theoverall goal is for the State to provide a managementsystem for the State’s infrastructure assets in order toprovide long-term benefits to the State’s citizens.
The State annually conducts an assessment of thepavement condition of the State’s road network.Trained technicians rate the condition of the pave-ment based on surface condition and dominant dis-tress (e.g., cracking, faulting) using a scale of 1 (verypoor) to 10 (excellent) based on the prevalence of asurface-related pavement distress. A pavement condi-tion rating (PCR) is assigned to each surface section.The State currently has 42,651 lane miles of roads.
It is the State’s intention to maintain the roads atan average PCR between 6.7 and 7.2.
BridgesThe State Department of Transportation maintains theBridge Management System (BMS) which supports aconstruction program that preserves the State’s invest-ment in its bridges. The BMS is used in planning con-struction programs and estimating construction costs.The overall goal is for the State to provide a manage-ment system for the State’s infrastructure assets in orderto provide long-term benefits to the State’s citizens.
The State conducts biennial inspections of allbridges in the State. The State uses a numerical inspec-tion condition rating scale ranging from 1 (minimum)to 7 (maximum). During each general inspection,various components or elements of each bridge spanare rated by the inspector as to the extent of deterio-ration, as well as the component’s ability to functionstructurally relative to when it was newly designed andconstructed. The element rating values are combinedusing a weighted average formula to compute anoverall bridge condition rating value for each bridge.A rating of 6 to 7 is excellent, which indicates that norepairs are necessary. A rating of 3 to 5 is fair to good,which indicates that minor repairs are required. Arating of 1 to 2 is deficient, which indicates majorrepairs or replacement are necessary. The State hasapproximately 7,887 bridges.
It is the State’s intention to maintain the bridges atan average condition rating level between 5.3 and 5.6.
INFRASTRUCTURE ASSETS USING THE MODIFIED APPROACH(unaudited)
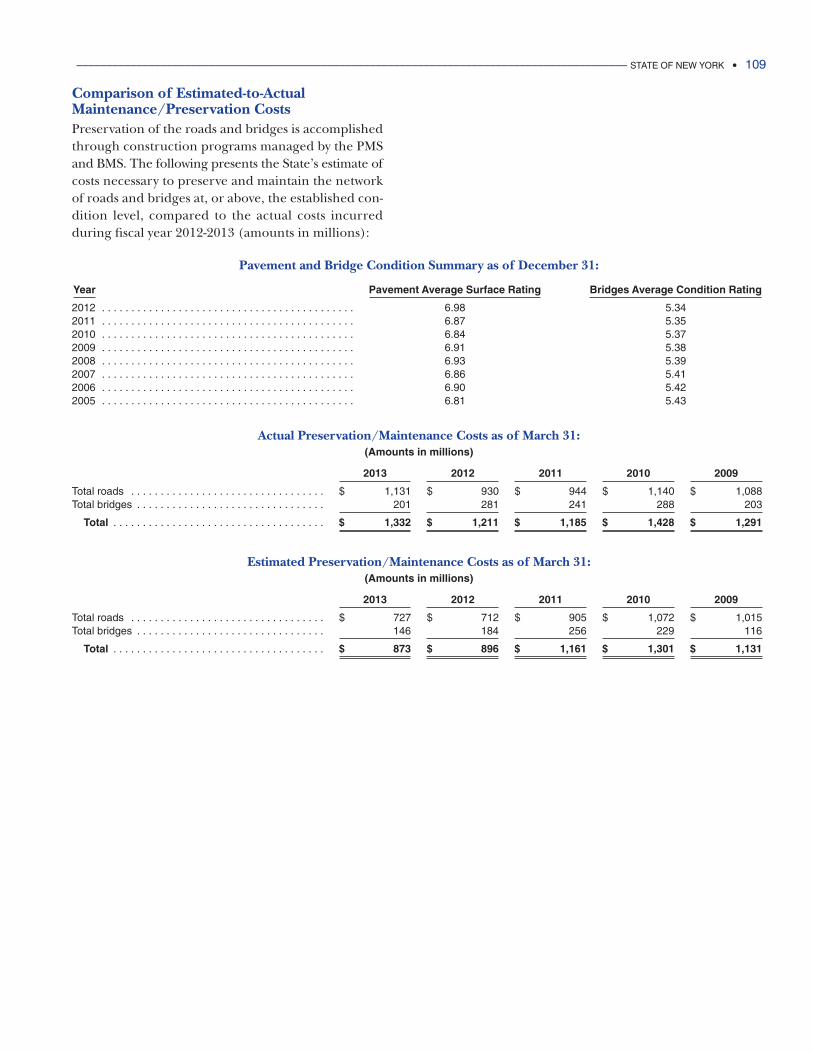
____________________________________________________________________________________________ STATE OF NEW YORK • 109
Comparison of Estimated-to-Actual Maintenance/Preservation CostsPreservation of the roads and bridges is accomplishedthrough construction programs managed by the PMSand BMS. The following presents the State’s estimate ofcosts necessary to preserve and maintain the networkof roads and bridges at, or above, the established con-dition level, compared to the actual costs incurredduring fiscal year 2012-2013 (amounts in millions):
Pavement and Bridge Condition Summary as of December 31:
Year Pavement Average Surface Rating Bridges Average Condition Rating
2012 . . . . . . . . . . . . . . . . . . . . . . . . . . . . . . . . . . . . . . . . . . . 6.98 5.342011 . . . . . . . . . . . . . . . . . . . . . . . . . . . . . . . . . . . . . . . . . . . 6.87 5.352010 . . . . . . . . . . . . . . . . . . . . . . . . . . . . . . . . . . . . . . . . . . . 6.84 5.372009 . . . . . . . . . . . . . . . . . . . . . . . . . . . . . . . . . . . . . . . . . . . 6.91 5.382008 . . . . . . . . . . . . . . . . . . . . . . . . . . . . . . . . . . . . . . . . . . . 6.93 5.392007 . . . . . . . . . . . . . . . . . . . . . . . . . . . . . . . . . . . . . . . . . . . 6.86 5.412006 . . . . . . . . . . . . . . . . . . . . . . . . . . . . . . . . . . . . . . . . . . . 6.90 5.422005 . . . . . . . . . . . . . . . . . . . . . . . . . . . . . . . . . . . . . . . . . . . 6.81 5.43
Actual Preservation/Maintenance Costs as of March 31:(Amounts in millions)
2013 2012 2011 2010 2009
Total roads . . . . . . . . . . . . . . . . . . . . . . . . . . . . . . . . . $ 1,131 $ 930 $ 944 $ 1,140 $ 1,088Total bridges . . . . . . . . . . . . . . . . . . . . . . . . . . . . . . . . 201 281 241 288 203
Total . . . . . . . . . . . . . . . . . . . . . . . . . . . . . . . . . . . . $ 1,332 $ 1,211 $ 1,185 $ 1,428 $ 1,291
Estimated Preservation/Maintenance Costs as of March 31:(Amounts in millions)
2013 2012 2011 2010 2009
Total roads . . . . . . . . . . . . . . . . . . . . . . . . . . . . . . . . . $ 727 $ 712 $ 905 $ 1,072 $ 1,015Total bridges . . . . . . . . . . . . . . . . . . . . . . . . . . . . . . . . 146 184 256 229 116
Total . . . . . . . . . . . . . . . . . . . . . . . . . . . . . . . . . . . . $ 873 $ 896 $ 1,161 $ 1,301 $ 1,131
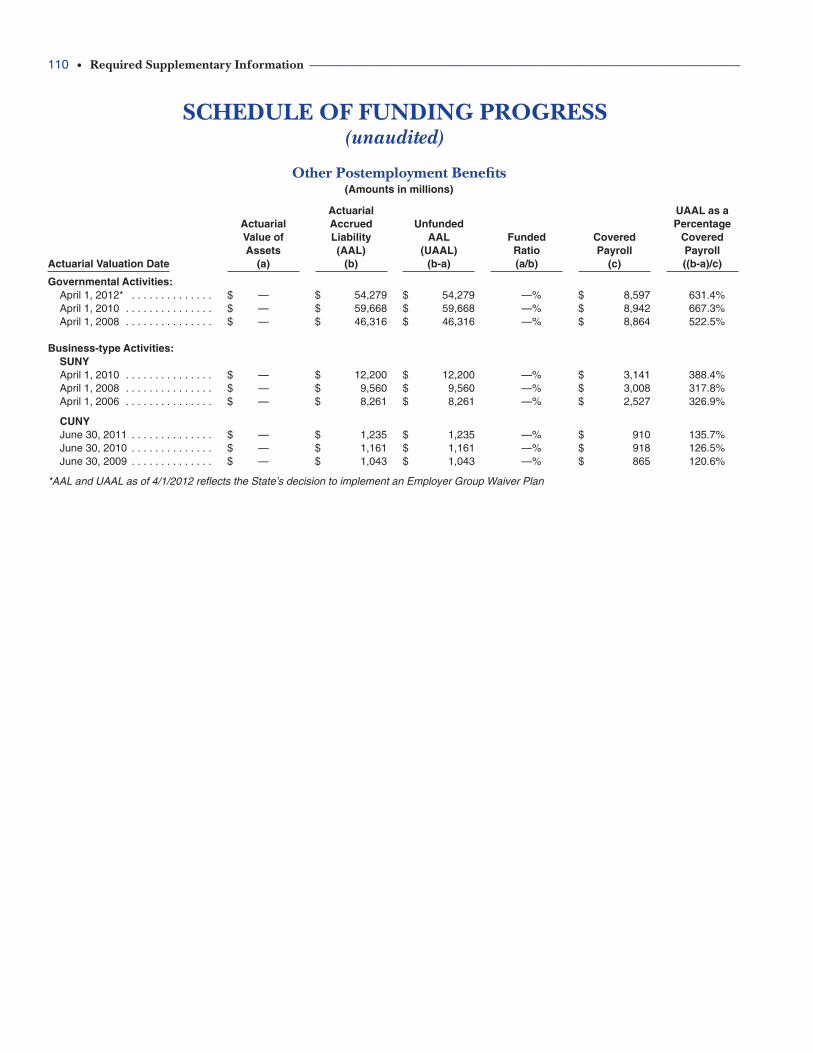
110 • Required Supplementary Information ________________________________________________________________________
Other Postemployment Benefits(Amounts in millions)
Actuarial UAAL as aActuarial Accrued Unfunded PercentageValue of Liability AAL Funded Covered CoveredAssets (AAL) (UAAL) Ratio Payroll Payroll
Actuarial Valuation Date (a) (b) (b-a) (a/b) (c) ((b-a)/c)
Governmental Activities:April 1, 2012* . . . . . . . . . . . . . . $ —00000 $ 54,279 $ 54,279 —% $ 8,597 631.4%April 1, 2010 . . . . . . . . . . . . . . . $ —00000 $ 59,668 $ 59,668 —% $ 8,942 667.3%April 1, 2008 . . . . . . . . . . . . . . . $ —00000 $ 46,316 $ 46,316 —% $ 8,864 522.5%
Business-type Activities:SUNYApril 1, 2010 . . . . . . . . . . . . . . . $ —00000 $ 12,200 $ 12,200 —% $ 3,141 388.4%April 1, 2008 . . . . . . . . . . . . . . . $ —00000 $ 9,560 $ 9,560 —% $ 3,008 317.8%April 1, 2006 . . . . . . . . . . . . . . . $ —00000 $ 8,261 $ 8,261 —% $ 2,527 326.9%
CUNYJune 30, 2011 . . . . . . . . . . . . . . $ —00000 $ 1,235 $ 1,235 —% $ 910 135.7%June 30, 2010 . . . . . . . . . . . . . . $ —00000 $ 1,161 $ 1,161 —% $ 918 126.5%June 30, 2009 . . . . . . . . . . . . . . $ —00000 $ 1,043 $ 1,043 —% $ 865 120.6%
*AAL and UAAL as of 4/1/2012 reflects the State’s decision to implement an Employer Group Waiver Plan
SCHEDULE OF FUNDING PROGRESS(unaudited)

Other Supplementary
Information

The General Fund is the most significant of the State’s funds. Most tax revenuesand certain miscellaneous revenues are recorded in the General Fund.
The General Fund is divided into several accounts. Expenditures in the form of aid to local governments for their general purposes (e.g., State-local revenue sharing) and to school districts and municipalities for certain specific purposes (e.g., education and social services) are made from the Local Assistance account. These payments, often based on specific legislated formulas, are nevertheless limited under the State Constitution to appropriations in force. Expenditures from the Local Assistance account normally comprise approximately 60 percentof General Fund expenditures.
The expenditures of operating the departments of the Executive Branch, theLegislature and the Judiciary, as well as expenditures for general state chargessuch as contributions to employee retirement systems, are paid primarily from theState Purposes account and normally comprise approximately 40 percent of theGeneral Fund expenditures.
General Fund
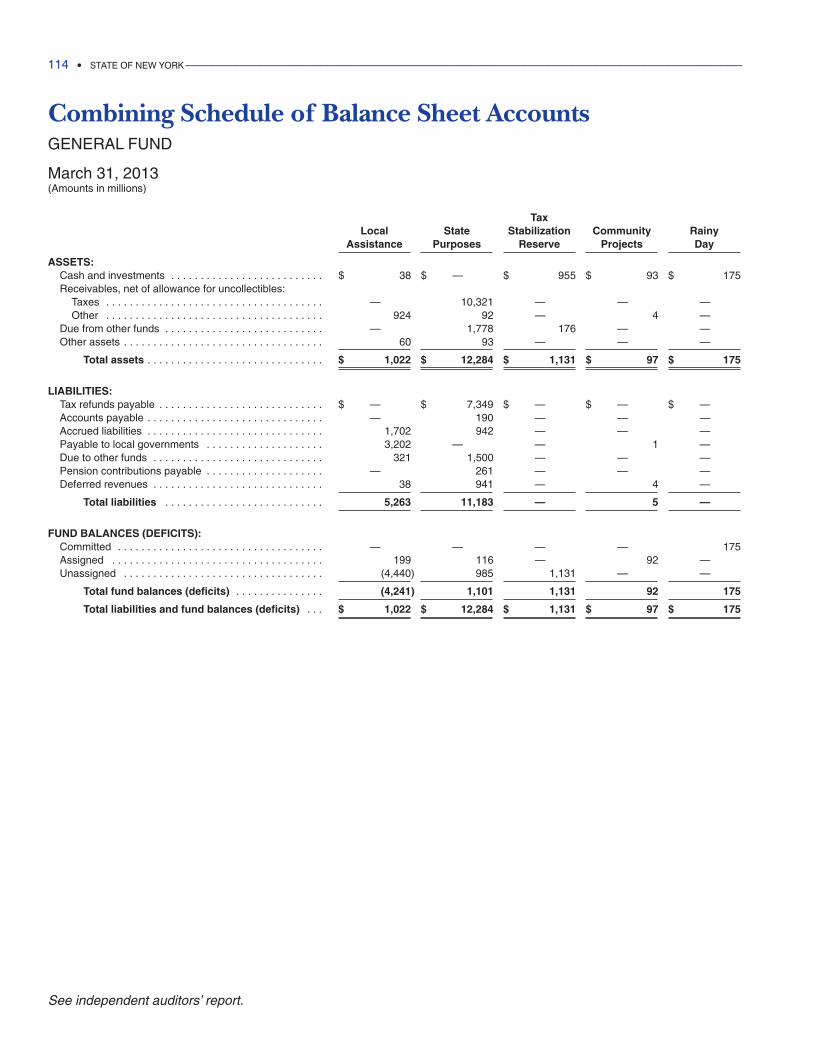
Combining Schedule of Balance Sheet AccountsGENERAL FUND
March 31, 2013(Amounts in millions)
TaxLocal State Stabilization Community Rainy
Assistance Purposes Reserve Projects Day
ASSETS:Cash and investments . . . . . . . . . . . . . . . . . . . . . . . . . . $ 38 $ —00000 $ 955 $ 93 $ 175Receivables, net of allowance for uncollectibles:
Taxes . . . . . . . . . . . . . . . . . . . . . . . . . . . . . . . . . . . . . —00000 10,321 —00000 —00000 —00000Other . . . . . . . . . . . . . . . . . . . . . . . . . . . . . . . . . . . . . 924 92 —00000 4 —00000
Due from other funds . . . . . . . . . . . . . . . . . . . . . . . . . . . —00000 1,778 176 —00000 —00000Other assets . . . . . . . . . . . . . . . . . . . . . . . . . . . . . . . . . . 60 93 —00000 —00000 —00000
Total assets . . . . . . . . . . . . . . . . . . . . . . . . . . . . . . $ 1,022 $ 12,284 $ 1,131 $ 97 $ 175
LIABILITIES:Tax refunds payable . . . . . . . . . . . . . . . . . . . . . . . . . . . . $ —00000 $ 7,349 $ —00000 $ —00000 $ —00000Accounts payable . . . . . . . . . . . . . . . . . . . . . . . . . . . . . . —00000 190 —00000 —00000 —00000Accrued liabilities . . . . . . . . . . . . . . . . . . . . . . . . . . . . . . 1,702 942 —00000 —00000 —00000Payable to local governments . . . . . . . . . . . . . . . . . . . . 3,202 —00000 —00000 1 —00000Due to other funds . . . . . . . . . . . . . . . . . . . . . . . . . . . . . 321 1,500 —00000 —00000 —00000Pension contributions payable . . . . . . . . . . . . . . . . . . . . —00000 261 —00000 —00000 —00000Deferred revenues . . . . . . . . . . . . . . . . . . . . . . . . . . . . . 38 941 —00000 4 —00000
Total liabilities . . . . . . . . . . . . . . . . . . . . . . . . . . . 5,263 11,183 —00000 5 —00000
FUND BALANCES (DEFICITS):Committed . . . . . . . . . . . . . . . . . . . . . . . . . . . . . . . . . . . —00000 —00000 —00000 —00000 175Assigned . . . . . . . . . . . . . . . . . . . . . . . . . . . . . . . . . . . . 199 116 —00000 92 —00000Unassigned . . . . . . . . . . . . . . . . . . . . . . . . . . . . . . . . . . (4,440) 985 1,131 —00000 —00000
Total fund balances (deficits) . . . . . . . . . . . . . . . (4,241) 1,101 1,131 92 175
Total liabilities and fund balances (deficits) . . . $ 1,022 $ 12,284 $ 1,131 $ 97 $ 175
114 • STATE OF NEW YORK _____________________________________________________________________________________________
See independent auditors’ report.
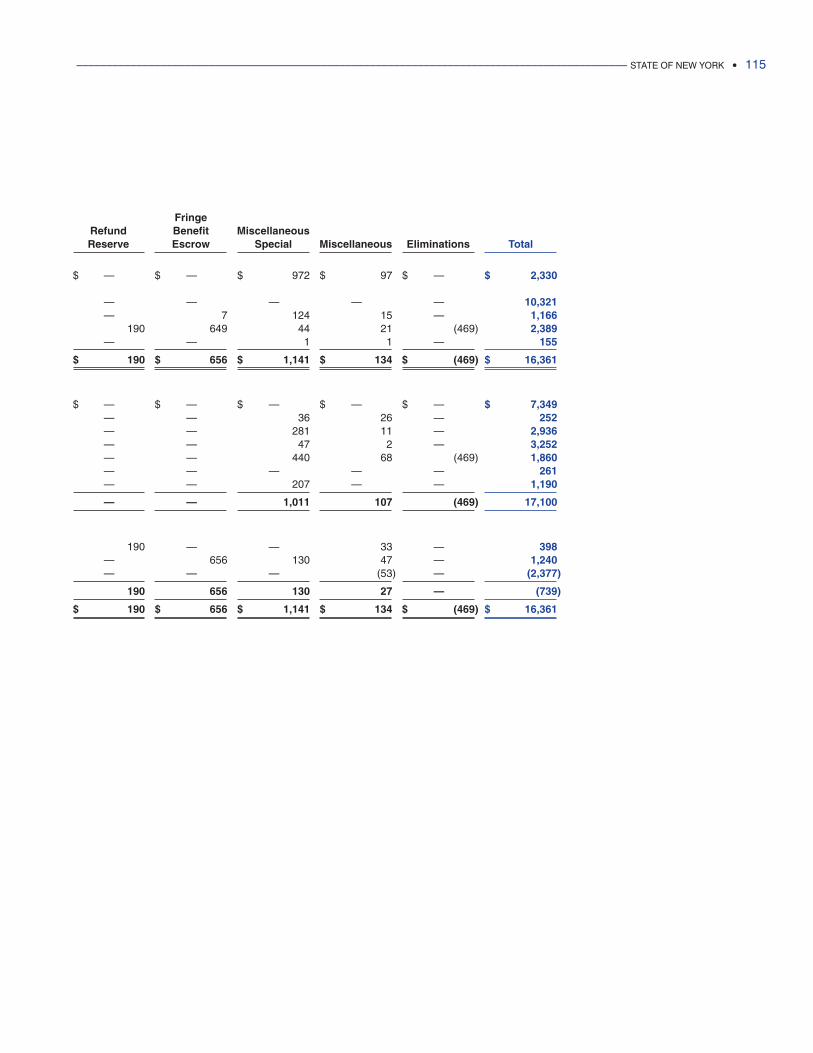
FringeRefund Benefit MiscellaneousReserve Escrow Special Miscellaneous Eliminations Total
$ —00000 $ —00000 $ 972 $ 97 $ —00000 $ 2,330
—00000 —00000 —00000 —00000 —00000 10,321—00000 7 124 15 —00000 1,166
190 649 44 21 (469) 2,389—00000 —00000 1 1 —00000 155
$ 190 $ 656 $ 1,141 $ 134 $ (469) $ 16,361
$ —00000 $ —00000 $ —00000 $ —00000 $ —00000 $ 7,349—00000 —00000 36 26 —00000 252—00000 —00000 281 11 —00000 2,936—00000 —00000 47 2 —00000 3,252—00000 —00000 440 68 (469) 1,860—00000 —00000 —00000 —00000 —00000 261—00000 —00000 207 —00000 —00000 1,190
—00000 —00000 1,011 107 (469) 17,100
190 —00000 —00000 33 —00000 398—00000 656 130 47 —00000 1,240—00000 —00000 —00000 (53) —00000 (2,377)
190 656 130 27 —00000 (739)
$ 190 $ 656 $ 1,141 $ 134 $ (469) $ 16,361
____________________________________________________________________________________________ STATE OF NEW YORK • 115
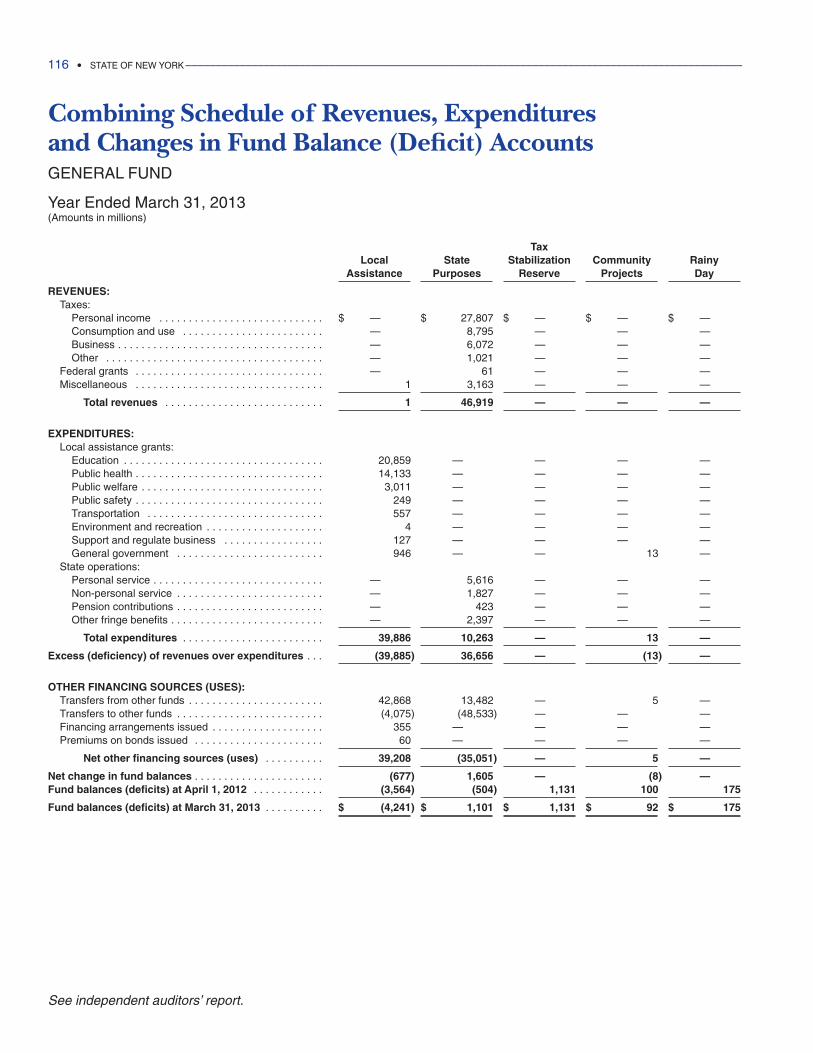
Combining Schedule of Revenues, Expenditures and Changes in Fund Balance (Deficit) AccountsGENERAL FUND
Year Ended March 31, 2013(Amounts in millions)
TaxLocal State Stabilization Community Rainy
Assistance Purposes Reserve Projects Day
REVENUES:Taxes:
Personal income . . . . . . . . . . . . . . . . . . . . . . . . . . . . $ —00000 $ 27,807 $ —00000 $ —00000 $ —00000Consumption and use . . . . . . . . . . . . . . . . . . . . . . . . —00000 8,795 —00000 —00000 —00000Business . . . . . . . . . . . . . . . . . . . . . . . . . . . . . . . . . . . —00000 6,072 —00000 —00000 —00000Other . . . . . . . . . . . . . . . . . . . . . . . . . . . . . . . . . . . . . —00000 1,021 —00000 —00000 —00000
Federal grants . . . . . . . . . . . . . . . . . . . . . . . . . . . . . . . . —00000 61 —00000 —00000 —00000Miscellaneous . . . . . . . . . . . . . . . . . . . . . . . . . . . . . . . . 1 3,163 —00000 —00000 —00000
Total revenues . . . . . . . . . . . . . . . . . . . . . . . . . . . 1 46,919 —00000 —00000 —00000
EXPENDITURES:Local assistance grants:
Education . . . . . . . . . . . . . . . . . . . . . . . . . . . . . . . . . . 20,859 —00000 —00000 —00000 —00000Public health . . . . . . . . . . . . . . . . . . . . . . . . . . . . . . . . 14,133 —00000 —00000 —00000 —00000Public welfare . . . . . . . . . . . . . . . . . . . . . . . . . . . . . . . 3,011 —00000 —00000 —00000 —00000Public safety . . . . . . . . . . . . . . . . . . . . . . . . . . . . . . . . 249 —00000 —00000 —00000 —00000Transportation . . . . . . . . . . . . . . . . . . . . . . . . . . . . . . 557 —00000 —00000 —00000 —00000Environment and recreation . . . . . . . . . . . . . . . . . . . . 4 —00000 —00000 —00000 —00000Support and regulate business . . . . . . . . . . . . . . . . . 127 —00000 —00000 —00000 —00000General government . . . . . . . . . . . . . . . . . . . . . . . . . 946 —00000 —00000 13 —00000
State operations:Personal service . . . . . . . . . . . . . . . . . . . . . . . . . . . . . —00000 5,616 —00000 —00000 —00000Non-personal service . . . . . . . . . . . . . . . . . . . . . . . . . —00000 1,827 —00000 —00000 —00000Pension contributions . . . . . . . . . . . . . . . . . . . . . . . . . —00000 423 —00000 —00000 —00000Other fringe benefits . . . . . . . . . . . . . . . . . . . . . . . . . . —00000 2,397 —00000 —00000 —00000
Total expenditures . . . . . . . . . . . . . . . . . . . . . . . . 39,886 10,263 —00000 13 —00000
Excess (deficiency) of revenues over expenditures . . . (39,885) 36,656 —00000 (13) —00000
OTHER FINANCING SOURCES (USES):Transfers from other funds . . . . . . . . . . . . . . . . . . . . . . . 42,868 13,482 —00000 5 —00000Transfers to other funds . . . . . . . . . . . . . . . . . . . . . . . . . (4,075) (48,533) —00000 —00000 —00000Financing arrangements issued . . . . . . . . . . . . . . . . . . . 355 —00000 —00000 —00000 —00000Premiums on bonds issued . . . . . . . . . . . . . . . . . . . . . . 60 —00000 —00000 —00000 —00000
Net other financing sources (uses) . . . . . . . . . . 39,208 (35,051) —00000 5 —00000
Net change in fund balances . . . . . . . . . . . . . . . . . . . . . . (677) 1,605 —00000 (8) —00000Fund balances (deficits) at April 1, 2012 . . . . . . . . . . . . (3,564) (504) 1,131 100 175
Fund balances (deficits) at March 31, 2013 . . . . . . . . . . $ (4,241) $ 1,101 $ 1,131 $ 92 $ 175
116 • STATE OF NEW YORK _____________________________________________________________________________________________
See independent auditors’ report.
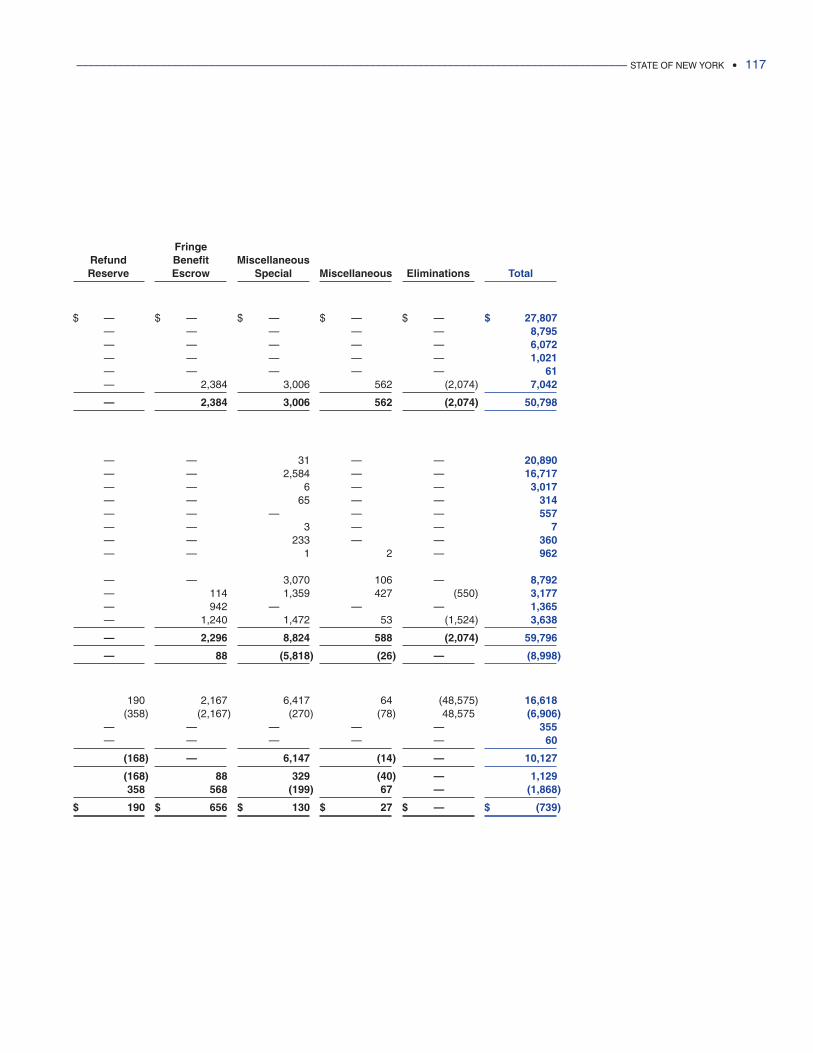
FringeRefund Benefit MiscellaneousReserve Escrow Special Miscellaneous Eliminations Total
$ —00000 $ —00000 $ —00000 $ —00000 $ —00000 $ 27,807—00000 —00000 —00000 —00000 —00000 8,795—00000 —00000 —00000 —00000 —00000 6,072—00000 —00000 —00000 —00000 —00000 1,021—00000 —00000 —00000 —00000 —00000 61—00000 2,384 3,006 562 (2,074) 7,042
—00000 2,384 3,006 562 (2,074) 50,798
—00000 —00000 31 —00000 —00000 20,890—00000 —00000 2,584 —00000 —00000 16,717—00000 —00000 6 —00000 —00000 3,017—00000 —00000 65 —00000 —00000 314—00000 —00000 —00000 —00000 —00000 557—00000 —00000 3 —00000 —00000 7—00000 —00000 233 —00000 —00000 360—00000 —00000 1 2 —00000 962
—00000 —00000 3,070 106 —00000 8,792—00000 114 1,359 427 (550) 3,177—00000 942 —00000 —00000 —00000 1,365—00000 1,240 1,472 53 (1,524) 3,638
—00000 2,296 8,824 588 (2,074) 59,796
—00000 88 (5,818) (26) —00000 (8,998)
190 2,167 6,417 64 (48,575) 16,618(358) (2,167) (270) (78) 48,575 (6,906)
—00000 —00000 —00000 —00000 —00000 355—00000 —00000 —00000 —00000 —00000 60
(168) —00000 6,147 (14) —00000 10,127
(168) 88 329 (40) —00000 1,129358 568 (199) 67 —00000 (1,868)
$ 190 $ 656 $ 130 $ 27 $ —00000 $ (739)
____________________________________________________________________________________________ STATE OF NEW YORK • 117

The Federal Special Revenue Fund is a major fund that accounts for most federalrevenues and expenditures.
The Federal Special Revenue Fund is divided into several accounts. The Fundaccounts for federal grants received by the State that are earmarked for specific pro-grams. The need to satisfy federal accounting and reporting requirements dictatesthat federal grants be accounted for in a number of separate accounts. Theseaccounts include the Federal USDA—Food and Nutrition Services Account, theFederal Health and Human Services Account, the Federal Education Account, theFederal Operating Grants Account, the Unemployment Insurance AdministrationAccount, the Federal Unemployment Insurance Occupational Training Account,and the Federal Employment and Training Grants Account.
Federal Special Revenue Fund
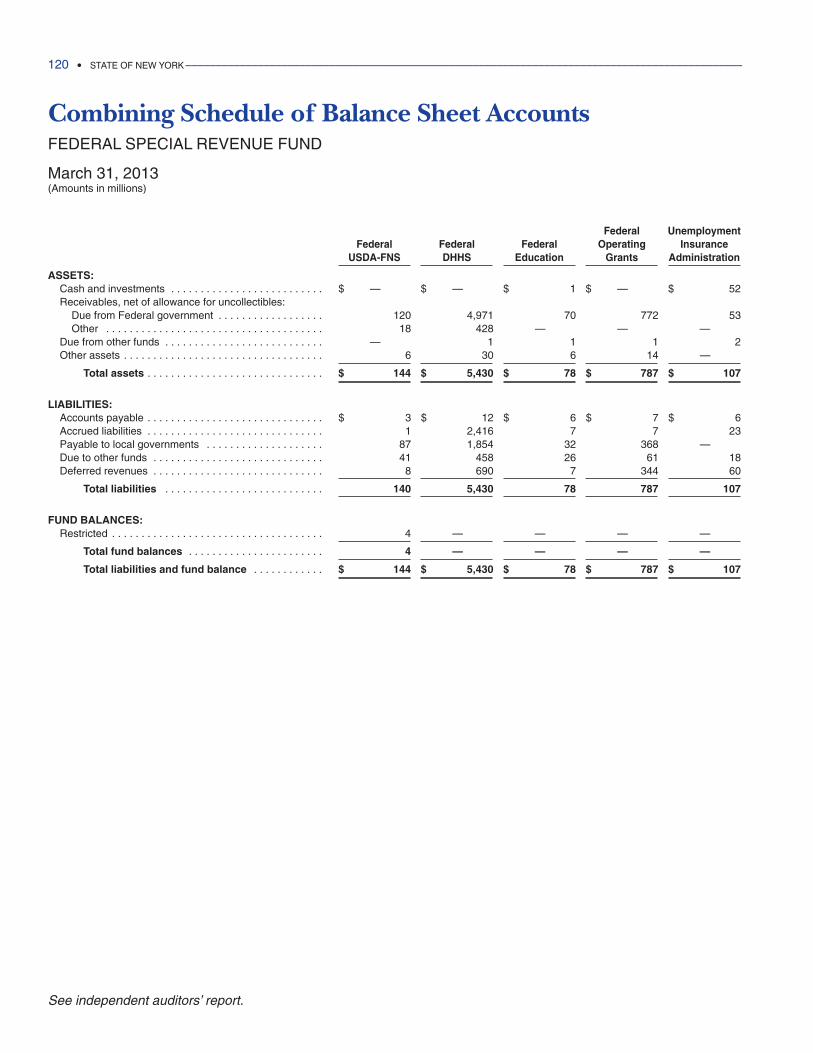
Combining Schedule of Balance Sheet AccountsFEDERAL SPECIAL REVENUE FUND
March 31, 2013(Amounts in millions)
Federal UnemploymentFederal Federal Federal Operating Insurance
USDA-FNS DHHS Education Grants Administration
ASSETS:Cash and investments . . . . . . . . . . . . . . . . . . . . . . . . . . $ —00000 $ —00000 $ 1 $ —00000 $ 52Receivables, net of allowance for uncollectibles:
Due from Federal government . . . . . . . . . . . . . . . . . . 120 4,971 70 772 53Other . . . . . . . . . . . . . . . . . . . . . . . . . . . . . . . . . . . . . 18 428 —00000 —00000 —00000
Due from other funds . . . . . . . . . . . . . . . . . . . . . . . . . . . —00000 1 1 1 2Other assets . . . . . . . . . . . . . . . . . . . . . . . . . . . . . . . . . . 6 30 6 14 —00000
Total assets . . . . . . . . . . . . . . . . . . . . . . . . . . . . . . $ 144 $ 5,430 $ 78 $ 787 $ 107
LIABILITIES:Accounts payable . . . . . . . . . . . . . . . . . . . . . . . . . . . . . . $ 3 $ 12 $ 6 $ 7 $ 6Accrued liabilities . . . . . . . . . . . . . . . . . . . . . . . . . . . . . . 1 2,416 7 7 23Payable to local governments . . . . . . . . . . . . . . . . . . . . 87 1,854 32 368 —00000Due to other funds . . . . . . . . . . . . . . . . . . . . . . . . . . . . . 41 458 26 61 18Deferred revenues . . . . . . . . . . . . . . . . . . . . . . . . . . . . . 8 690 7 344 60
Total liabilities . . . . . . . . . . . . . . . . . . . . . . . . . . . 140 5,430 78 787 107
FUND BALANCES:Restricted . . . . . . . . . . . . . . . . . . . . . . . . . . . . . . . . . . . . 4 —00000 —00000 —00000 —00000
Total fund balances . . . . . . . . . . . . . . . . . . . . . . . 4 —00000 —00000 —00000 —00000
Total liabilities and fund balance . . . . . . . . . . . . $ 144 $ 5,430 $ 78 $ 787 $ 107
120 • STATE OF NEW YORK _____________________________________________________________________________________________
See independent auditors’ report.
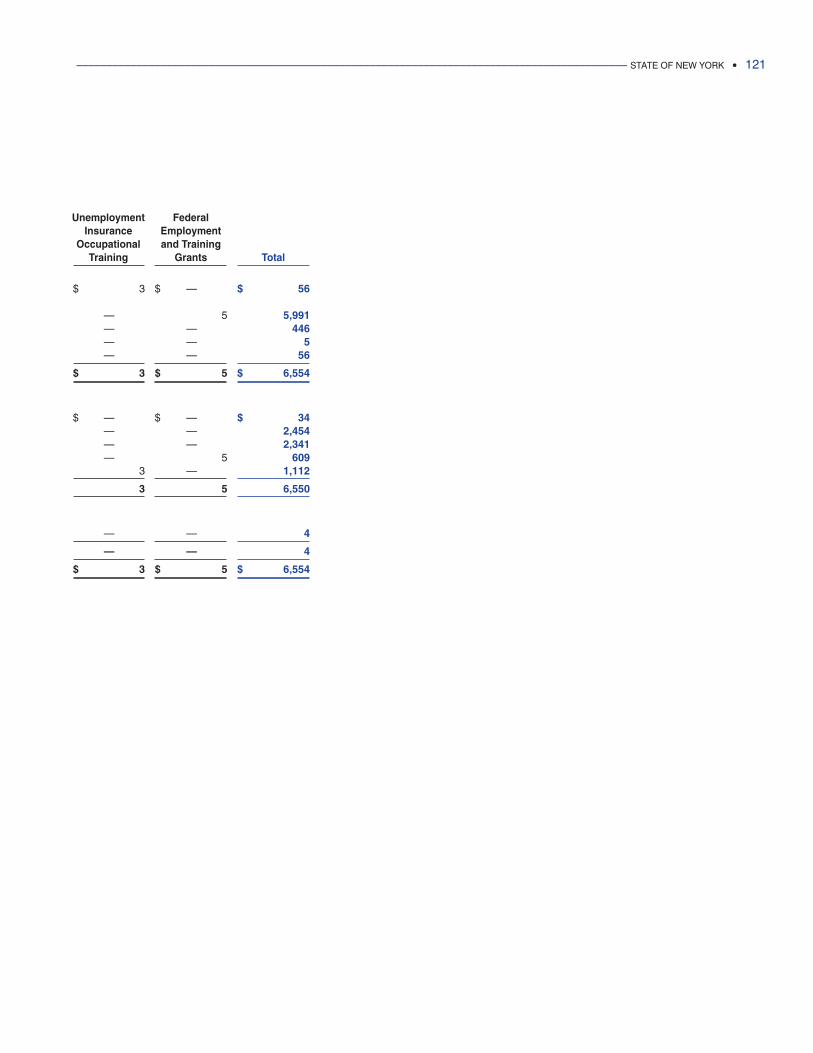
Unemployment FederalInsurance Employment
Occupational and TrainingTraining Grants Total
$ 3 $ —00000 $ 56
—00000 5 5,991—00000 —00000 446—00000 —00000 5—00000 —00000 56
$ 3 $ 5 $ 6,554
$ —00000 $ —00000 $ 34—00000 —00000 2,454—00000 —00000 2,341—00000 5 609
3 —00000 1,112
3 5 6,550
—00000 —00000 4
—00000 —00000 4
$ 3 $ 5 $ 6,554
____________________________________________________________________________________________ STATE OF NEW YORK • 121
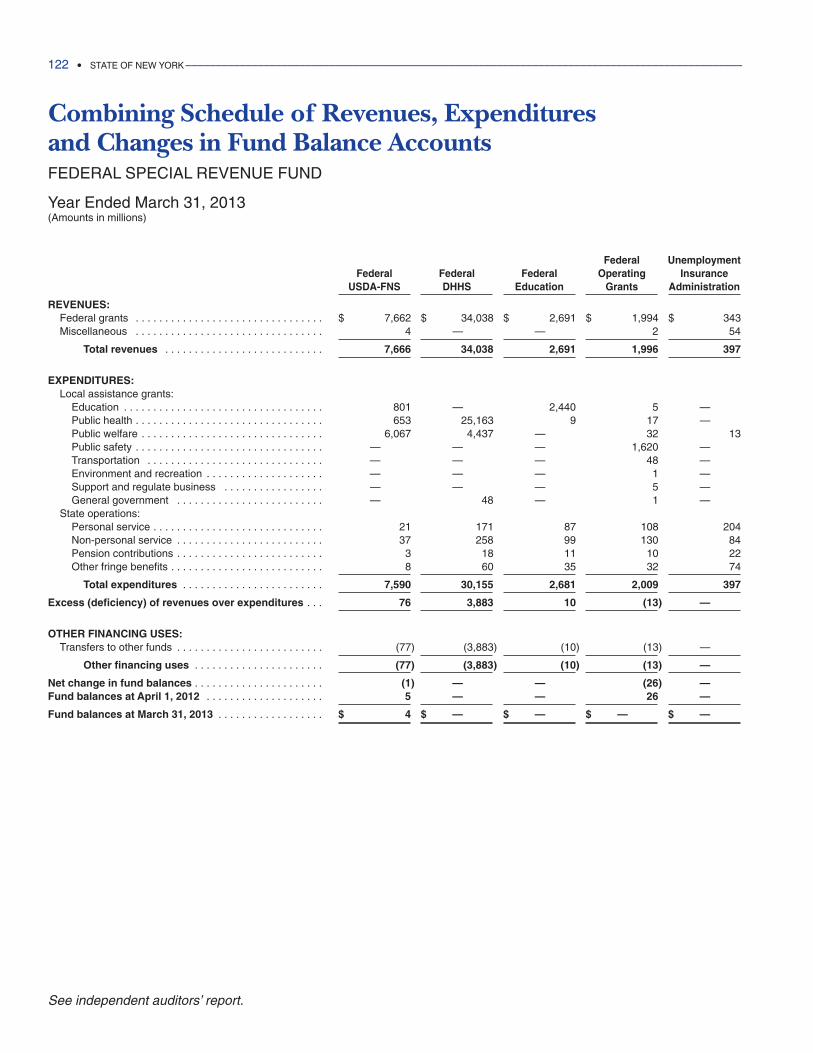
Combining Schedule of Revenues, Expenditures and Changes in Fund Balance AccountsFEDERAL SPECIAL REVENUE FUND
Year Ended March 31, 2013(Amounts in millions)
Federal UnemploymentFederal Federal Federal Operating Insurance
USDA-FNS DHHS Education Grants Administration
REVENUES:Federal grants . . . . . . . . . . . . . . . . . . . . . . . . . . . . . . . . $ 7,662 $ 34,038 $ 2,691 $ 1,994 $ 343Miscellaneous . . . . . . . . . . . . . . . . . . . . . . . . . . . . . . . . 4 —00000 —00000 2 54
Total revenues . . . . . . . . . . . . . . . . . . . . . . . . . . . 7,666 34,038 2,691 1,996 397
EXPENDITURES:Local assistance grants:
Education . . . . . . . . . . . . . . . . . . . . . . . . . . . . . . . . . . 801 —00000 2,440 5 —00000Public health . . . . . . . . . . . . . . . . . . . . . . . . . . . . . . . . 653 25,163 9 17 —00000Public welfare . . . . . . . . . . . . . . . . . . . . . . . . . . . . . . . 6,067 4,437 —00000 32 13Public safety . . . . . . . . . . . . . . . . . . . . . . . . . . . . . . . . —00000 —00000 —00000 1,620 —00000Transportation . . . . . . . . . . . . . . . . . . . . . . . . . . . . . . —00000 —00000 —00000 48 —00000Environment and recreation . . . . . . . . . . . . . . . . . . . . —00000 —00000 —00000 1 —00000Support and regulate business . . . . . . . . . . . . . . . . . —00000 —00000 —00000 5 —00000General government . . . . . . . . . . . . . . . . . . . . . . . . . —00000 48 —00000 1 —00000
State operations:Personal service . . . . . . . . . . . . . . . . . . . . . . . . . . . . . 21 171 87 108 204Non-personal service . . . . . . . . . . . . . . . . . . . . . . . . . 37 258 99 130 84Pension contributions . . . . . . . . . . . . . . . . . . . . . . . . . 3 18 11 10 22Other fringe benefits . . . . . . . . . . . . . . . . . . . . . . . . . . 8 60 35 32 74
Total expenditures . . . . . . . . . . . . . . . . . . . . . . . . 7,590 30,155 2,681 2,009 397
Excess (deficiency) of revenues over expenditures . . . 76 3,883 10 (13) —00000
OTHER FINANCING USES:Transfers to other funds . . . . . . . . . . . . . . . . . . . . . . . . . (77) (3,883) (10) (13) —00000
Other financing uses . . . . . . . . . . . . . . . . . . . . . . (77) (3,883) (10) (13) —00000
Net change in fund balances . . . . . . . . . . . . . . . . . . . . . . (1) —00000 —00000 (26) —00000Fund balances at April 1, 2012 . . . . . . . . . . . . . . . . . . . . 5 —00000 —00000 26 —00000
Fund balances at March 31, 2013 . . . . . . . . . . . . . . . . . . $ 4 $ —00000 $ —00000 $ —00000 $ —00000
122 • STATE OF NEW YORK _____________________________________________________________________________________________
See independent auditors’ report.
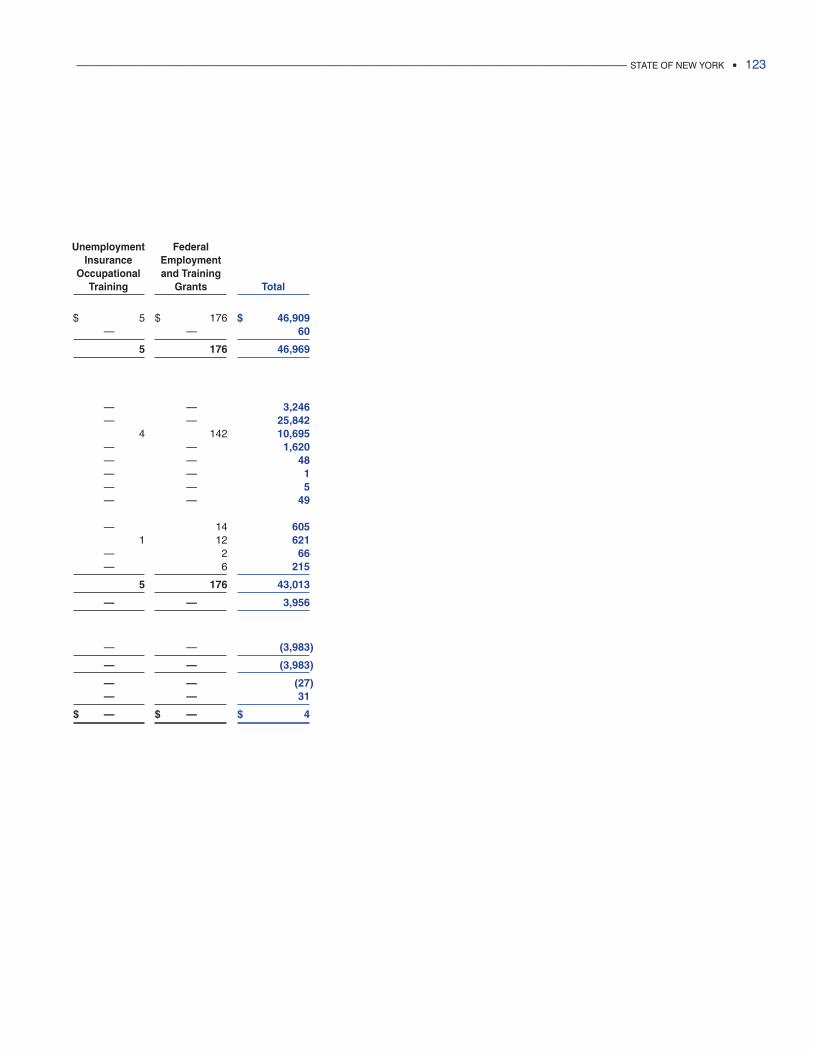
Unemployment FederalInsurance Employment
Occupational and TrainingTraining Grants Total
$ 5 $ 176 $ 46,909—00000 —00000 60
5 176 46,969
—00000 —00000 3,246—00000 —00000 25,842
4 142 10,695—00000 —00000 1,620—00000 —00000 48—00000 —00000 1—00000 —00000 5—00000 —00000 49
—00000 14 6051 12 621
—00000 2 66—00000 6 215
5 176 43,013
—00000 —00000 3,956
—00000 —00000 (3,983)
—00000 —00000 (3,983)
—00000 —00000 (27)—00000 —00000 31
$ —00000 $ —00000 $ 4
____________________________________________________________________________________________ STATE OF NEW YORK • 123

The General Debt Service Fund is a major fund that is used to account for thepayment of principal and interest on the State’s general debt and the payments oncertain lease/purchase or other contractual obligations.
The General Debt Service Fund is divided into two accounts. The principal andinterest payments for the State’s general debt and for certain lease/purchase orother contractual obligations are made from the General Debt Service Account. Theprincipal and interest payments for the Tobacco Settlement Financing Corporation(TSFC) are made from the Tobacco Settlement Financing Corporation Account.
General Debt Service Fund
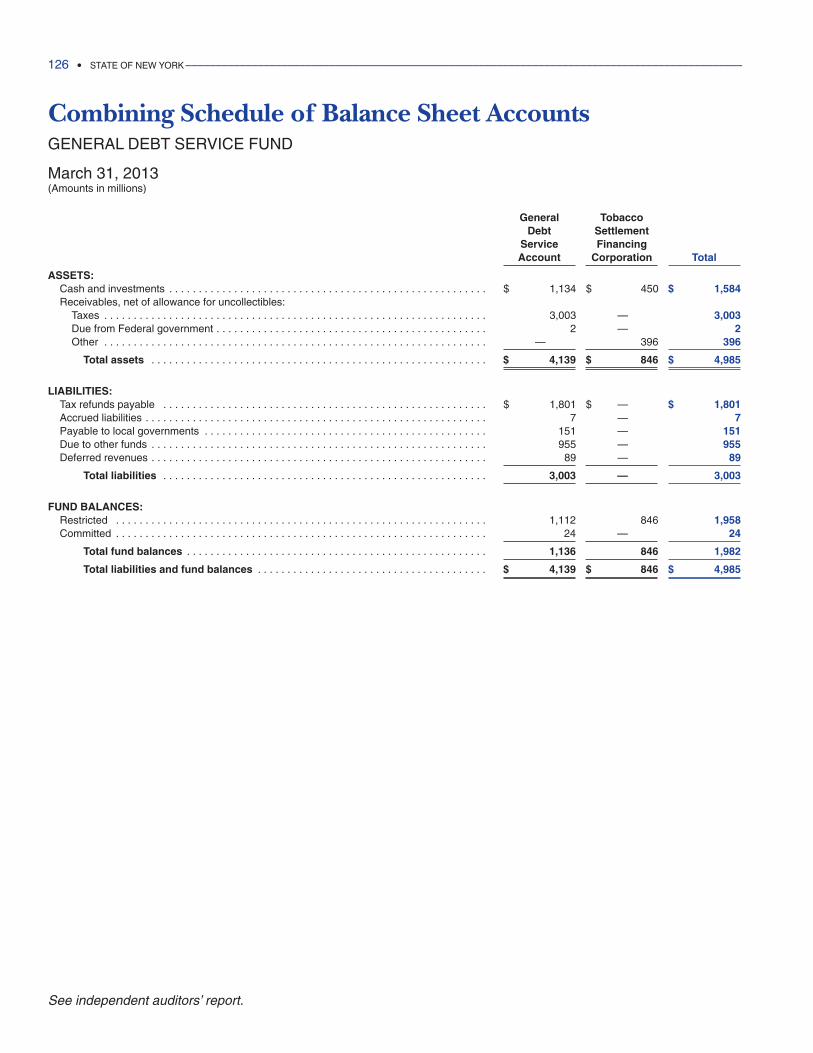
126 • STATE OF NEW YORK _____________________________________________________________________________________________
See independent auditors’ report.
Combining Schedule of Balance Sheet AccountsGENERAL DEBT SERVICE FUND
March 31, 2013(Amounts in millions)
General TobaccoDebt Settlement
Service FinancingAccount Corporation Total
ASSETS:Cash and investments . . . . . . . . . . . . . . . . . . . . . . . . . . . . . . . . . . . . . . . . . . . . . . . . . . . . . . $ 1,134 $ 450 $ 1,584Receivables, net of allowance for uncollectibles:
Taxes . . . . . . . . . . . . . . . . . . . . . . . . . . . . . . . . . . . . . . . . . . . . . . . . . . . . . . . . . . . . . . . . . 3,003 —00000 3,003Due from Federal government . . . . . . . . . . . . . . . . . . . . . . . . . . . . . . . . . . . . . . . . . . . . . . 2 —00000 2Other . . . . . . . . . . . . . . . . . . . . . . . . . . . . . . . . . . . . . . . . . . . . . . . . . . . . . . . . . . . . . . . . . —00000 396 396
Total assets . . . . . . . . . . . . . . . . . . . . . . . . . . . . . . . . . . . . . . . . . . . . . . . . . . . . . . . . . $ 4,139 $ 846 $ 4,985
LIABILITIES:Tax refunds payable . . . . . . . . . . . . . . . . . . . . . . . . . . . . . . . . . . . . . . . . . . . . . . . . . . . . . . . $ 1,801 $ —00000 $ 1,801Accrued liabilities . . . . . . . . . . . . . . . . . . . . . . . . . . . . . . . . . . . . . . . . . . . . . . . . . . . . . . . . . . 7 —00000 7Payable to local governments . . . . . . . . . . . . . . . . . . . . . . . . . . . . . . . . . . . . . . . . . . . . . . . . 151 —00000 151Due to other funds . . . . . . . . . . . . . . . . . . . . . . . . . . . . . . . . . . . . . . . . . . . . . . . . . . . . . . . . . 955 —00000 955Deferred revenues . . . . . . . . . . . . . . . . . . . . . . . . . . . . . . . . . . . . . . . . . . . . . . . . . . . . . . . . . 89 —00000 89
Total liabilities . . . . . . . . . . . . . . . . . . . . . . . . . . . . . . . . . . . . . . . . . . . . . . . . . . . . . . . 3,003 —00000 3,003
FUND BALANCES:Restricted . . . . . . . . . . . . . . . . . . . . . . . . . . . . . . . . . . . . . . . . . . . . . . . . . . . . . . . . . . . . . . . 1,112 846 1,958Committed . . . . . . . . . . . . . . . . . . . . . . . . . . . . . . . . . . . . . . . . . . . . . . . . . . . . . . . . . . . . . . . 24 —00000 24
Total fund balances . . . . . . . . . . . . . . . . . . . . . . . . . . . . . . . . . . . . . . . . . . . . . . . . . . . 1,136 846 1,982
Total liabilities and fund balances . . . . . . . . . . . . . . . . . . . . . . . . . . . . . . . . . . . . . . . $ 4,139 $ 846 $ 4,985
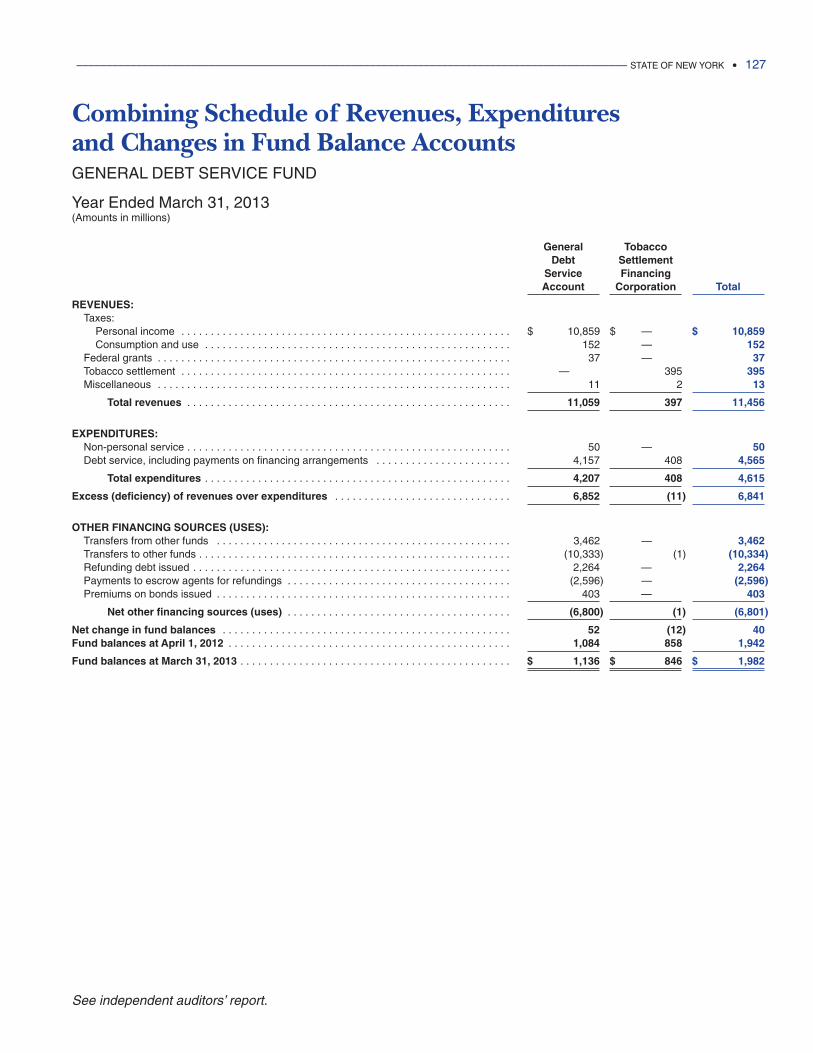
Combining Schedule of Revenues, Expenditures and Changes in Fund Balance AccountsGENERAL DEBT SERVICE FUND
Year Ended March 31, 2013(Amounts in millions)
General TobaccoDebt Settlement
Service FinancingAccount Corporation Total
REVENUES:Taxes:
Personal income . . . . . . . . . . . . . . . . . . . . . . . . . . . . . . . . . . . . . . . . . . . . . . . . . . . . . . . . $ 10,859 $ —00000 $ 10,859Consumption and use . . . . . . . . . . . . . . . . . . . . . . . . . . . . . . . . . . . . . . . . . . . . . . . . . . . . 152 —00000 152
Federal grants . . . . . . . . . . . . . . . . . . . . . . . . . . . . . . . . . . . . . . . . . . . . . . . . . . . . . . . . . . . . 37 —00000 37Tobacco settlement . . . . . . . . . . . . . . . . . . . . . . . . . . . . . . . . . . . . . . . . . . . . . . . . . . . . . . . . —00000 395 395Miscellaneous . . . . . . . . . . . . . . . . . . . . . . . . . . . . . . . . . . . . . . . . . . . . . . . . . . . . . . . . . . . . 11 2 13
Total revenues . . . . . . . . . . . . . . . . . . . . . . . . . . . . . . . . . . . . . . . . . . . . . . . . . . . . . . . 11,059 397 11,456
EXPENDITURES:Non-personal service . . . . . . . . . . . . . . . . . . . . . . . . . . . . . . . . . . . . . . . . . . . . . . . . . . . . . . . 50 —00000 50Debt service, including payments on financing arrangements . . . . . . . . . . . . . . . . . . . . . . . 4,157 408 4,565
Total expenditures . . . . . . . . . . . . . . . . . . . . . . . . . . . . . . . . . . . . . . . . . . . . . . . . . . . . 4,207 408 4,615
Excess (deficiency) of revenues over expenditures . . . . . . . . . . . . . . . . . . . . . . . . . . . . . . 6,852 (11) 6,841
OTHER FINANCING SOURCES (USES):Transfers from other funds . . . . . . . . . . . . . . . . . . . . . . . . . . . . . . . . . . . . . . . . . . . . . . . . . . 3,462 —00000 3,462Transfers to other funds . . . . . . . . . . . . . . . . . . . . . . . . . . . . . . . . . . . . . . . . . . . . . . . . . . . . . (10,333) (1) (10,334)Refunding debt issued . . . . . . . . . . . . . . . . . . . . . . . . . . . . . . . . . . . . . . . . . . . . . . . . . . . . . . 2,264 —00000 2,264Payments to escrow agents for refundings . . . . . . . . . . . . . . . . . . . . . . . . . . . . . . . . . . . . . . (2,596) —00000 (2,596)Premiums on bonds issued . . . . . . . . . . . . . . . . . . . . . . . . . . . . . . . . . . . . . . . . . . . . . . . . . . 403 —00000 403
Net other financing sources (uses) . . . . . . . . . . . . . . . . . . . . . . . . . . . . . . . . . . . . . . (6,800) (1) (6,801)
Net change in fund balances . . . . . . . . . . . . . . . . . . . . . . . . . . . . . . . . . . . . . . . . . . . . . . . . . 52 (12) 40Fund balances at April 1, 2012 . . . . . . . . . . . . . . . . . . . . . . . . . . . . . . . . . . . . . . . . . . . . . . . . 1,084 858 1,942
Fund balances at March 31, 2013 . . . . . . . . . . . . . . . . . . . . . . . . . . . . . . . . . . . . . . . . . . . . . . $ 1,136 $ 846 $ 1,982
____________________________________________________________________________________________ STATE OF NEW YORK • 127
See independent auditors’ report.
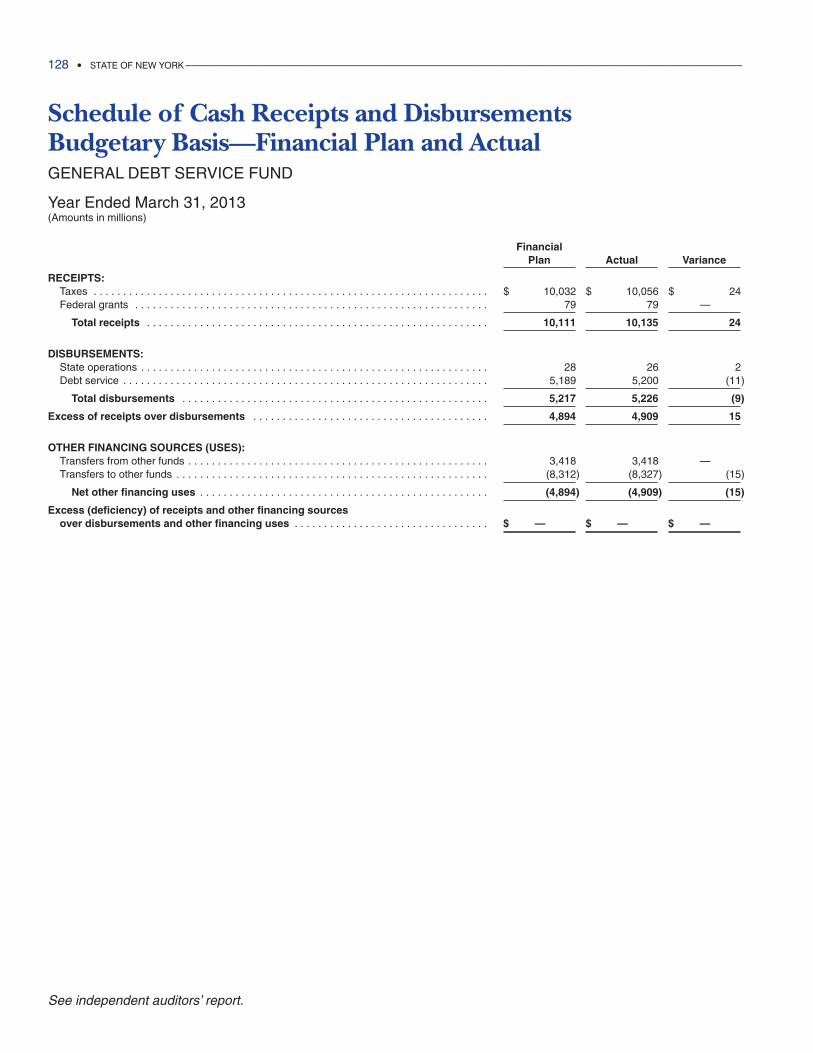
Schedule of Cash Receipts and Disbursements Budgetary Basis—Financial Plan and ActualGENERAL DEBT SERVICE FUND
Year Ended March 31, 2013(Amounts in millions)
FinancialPlan Actual Variance
RECEIPTS:Taxes . . . . . . . . . . . . . . . . . . . . . . . . . . . . . . . . . . . . . . . . . . . . . . . . . . . . . . . . . . . . . . . . . . . $ 10,032 $ 10,056 $ 24Federal grants . . . . . . . . . . . . . . . . . . . . . . . . . . . . . . . . . . . . . . . . . . . . . . . . . . . . . . . . . . . . 79 79 —00000
Total receipts . . . . . . . . . . . . . . . . . . . . . . . . . . . . . . . . . . . . . . . . . . . . . . . . . . . . . . . . . . 10,111 10,135 24
DISBURSEMENTS:State operations . . . . . . . . . . . . . . . . . . . . . . . . . . . . . . . . . . . . . . . . . . . . . . . . . . . . . . . . . . . 28 26 2Debt service . . . . . . . . . . . . . . . . . . . . . . . . . . . . . . . . . . . . . . . . . . . . . . . . . . . . . . . . . . . . . . 5,189 5,200 (11)
Total disbursements . . . . . . . . . . . . . . . . . . . . . . . . . . . . . . . . . . . . . . . . . . . . . . . . . . . . 5,217 5,226 (9)
Excess of receipts over disbursements . . . . . . . . . . . . . . . . . . . . . . . . . . . . . . . . . . . . . . . . 4,894 4,909 15
OTHER FINANCING SOURCES (USES):Transfers from other funds . . . . . . . . . . . . . . . . . . . . . . . . . . . . . . . . . . . . . . . . . . . . . . . . . . . 3,418 3,418 —00000Transfers to other funds . . . . . . . . . . . . . . . . . . . . . . . . . . . . . . . . . . . . . . . . . . . . . . . . . . . . . (8,312) (8,327) (15)
Net other financing uses . . . . . . . . . . . . . . . . . . . . . . . . . . . . . . . . . . . . . . . . . . . . . . . . . (4,894) (4,909) (15)
Excess (deficiency) of receipts and other financing sources over disbursements and other financing uses . . . . . . . . . . . . . . . . . . . . . . . . . . . . . . . . . $ —00000 $ —00000 $ —00000
128 • STATE OF NEW YORK _____________________________________________________________________________________________
See independent auditors’ report.

Other Governmental Funds
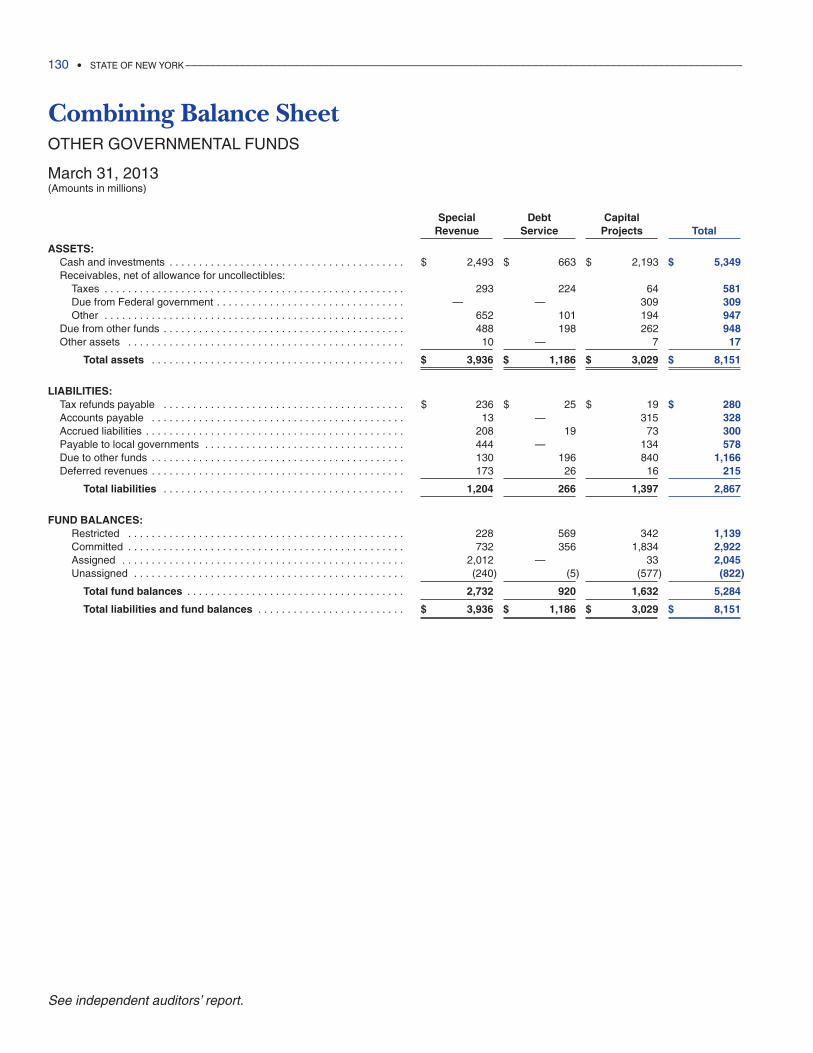
Combining Balance SheetOTHER GOVERNMENTAL FUNDS
March 31, 2013(Amounts in millions)
Special Debt CapitalRevenue Service Projects Total
ASSETS:Cash and investments . . . . . . . . . . . . . . . . . . . . . . . . . . . . . . . . . . . . . . . . $ 2,493 $ 663 $ 2,193 $ 5,349Receivables, net of allowance for uncollectibles:
Taxes . . . . . . . . . . . . . . . . . . . . . . . . . . . . . . . . . . . . . . . . . . . . . . . . . . . 293 224 64 581Due from Federal government . . . . . . . . . . . . . . . . . . . . . . . . . . . . . . . . —00000 —00000 309 309Other . . . . . . . . . . . . . . . . . . . . . . . . . . . . . . . . . . . . . . . . . . . . . . . . . . . 652 101 194 947
Due from other funds . . . . . . . . . . . . . . . . . . . . . . . . . . . . . . . . . . . . . . . . . 488 198 262 948Other assets . . . . . . . . . . . . . . . . . . . . . . . . . . . . . . . . . . . . . . . . . . . . . . . 10 —00000 7 17
Total assets . . . . . . . . . . . . . . . . . . . . . . . . . . . . . . . . . . . . . . . . . . . $ 3,936 $ 1,186 $ 3,029 $ 8,151
LIABILITIES:Tax refunds payable . . . . . . . . . . . . . . . . . . . . . . . . . . . . . . . . . . . . . . . . . $ 236 $ 25 $ 19 $ 280Accounts payable . . . . . . . . . . . . . . . . . . . . . . . . . . . . . . . . . . . . . . . . . . . 13 —00000 315 328Accrued liabilities . . . . . . . . . . . . . . . . . . . . . . . . . . . . . . . . . . . . . . . . . . . . 208 19 73 300Payable to local governments . . . . . . . . . . . . . . . . . . . . . . . . . . . . . . . . . . 444 —00000 134 578Due to other funds . . . . . . . . . . . . . . . . . . . . . . . . . . . . . . . . . . . . . . . . . . . 130 196 840 1,166Deferred revenues . . . . . . . . . . . . . . . . . . . . . . . . . . . . . . . . . . . . . . . . . . . 173 26 16 215
Total liabilities . . . . . . . . . . . . . . . . . . . . . . . . . . . . . . . . . . . . . . . . . 1,204 266 1,397 2,867
FUND BALANCES:Restricted . . . . . . . . . . . . . . . . . . . . . . . . . . . . . . . . . . . . . . . . . . . . . . . 228 569 342 1,139Committed . . . . . . . . . . . . . . . . . . . . . . . . . . . . . . . . . . . . . . . . . . . . . . . 732 356 1,834 2,922Assigned . . . . . . . . . . . . . . . . . . . . . . . . . . . . . . . . . . . . . . . . . . . . . . . . 2,012 —00000 33 2,045Unassigned . . . . . . . . . . . . . . . . . . . . . . . . . . . . . . . . . . . . . . . . . . . . . . (240) (5) (577) (822)
Total fund balances . . . . . . . . . . . . . . . . . . . . . . . . . . . . . . . . . . . . . 2,732 920 1,632 5,284
Total liabilities and fund balances . . . . . . . . . . . . . . . . . . . . . . . . . $ 3,936 $ 1,186 $ 3,029 $ 8,151
130 • STATE OF NEW YORK _____________________________________________________________________________________________
See independent auditors’ report.
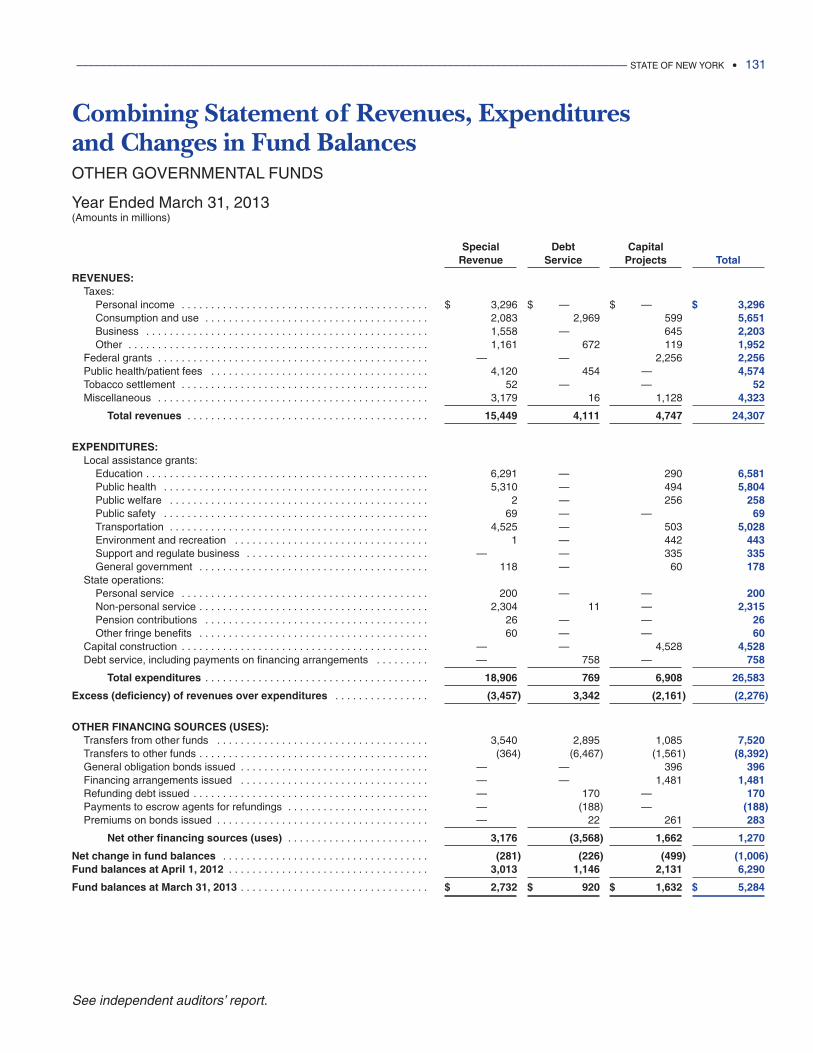
Combining Statement of Revenues, Expenditures and Changes in Fund BalancesOTHER GOVERNMENTAL FUNDS
Year Ended March 31, 2013(Amounts in millions)
Special Debt CapitalRevenue Service Projects Total
REVENUES:Taxes:
Personal income . . . . . . . . . . . . . . . . . . . . . . . . . . . . . . . . . . . . . . . . . . $ 3,296 $ —00000 $ —00000 $ 3,296Consumption and use . . . . . . . . . . . . . . . . . . . . . . . . . . . . . . . . . . . . . . 2,083 2,969 599 5,651Business . . . . . . . . . . . . . . . . . . . . . . . . . . . . . . . . . . . . . . . . . . . . . . . . 1,558 —00000 645 2,203Other . . . . . . . . . . . . . . . . . . . . . . . . . . . . . . . . . . . . . . . . . . . . . . . . . . . 1,161 672 119 1,952
Federal grants . . . . . . . . . . . . . . . . . . . . . . . . . . . . . . . . . . . . . . . . . . . . . . —00000 —00000 2,256 2,256Public health/patient fees . . . . . . . . . . . . . . . . . . . . . . . . . . . . . . . . . . . . . 4,120 454 —00000 4,574Tobacco settlement . . . . . . . . . . . . . . . . . . . . . . . . . . . . . . . . . . . . . . . . . . 52 —00000 —00000 52Miscellaneous . . . . . . . . . . . . . . . . . . . . . . . . . . . . . . . . . . . . . . . . . . . . . . 3,179 16 1,128 4,323
Total revenues . . . . . . . . . . . . . . . . . . . . . . . . . . . . . . . . . . . . . . . . . 15,449 4,111 4,747 24,307
EXPENDITURES:Local assistance grants:
Education . . . . . . . . . . . . . . . . . . . . . . . . . . . . . . . . . . . . . . . . . . . . . . . . 6,291 —00000 290 6,581Public health . . . . . . . . . . . . . . . . . . . . . . . . . . . . . . . . . . . . . . . . . . . . . 5,310 —00000 494 5,804Public welfare . . . . . . . . . . . . . . . . . . . . . . . . . . . . . . . . . . . . . . . . . . . . 2 —00000 256 258Public safety . . . . . . . . . . . . . . . . . . . . . . . . . . . . . . . . . . . . . . . . . . . . . 69 —00000 —00000 69Transportation . . . . . . . . . . . . . . . . . . . . . . . . . . . . . . . . . . . . . . . . . . . . 4,525 —00000 503 5,028Environment and recreation . . . . . . . . . . . . . . . . . . . . . . . . . . . . . . . . . 1 —00000 442 443Support and regulate business . . . . . . . . . . . . . . . . . . . . . . . . . . . . . . . —00000 —00000 335 335General government . . . . . . . . . . . . . . . . . . . . . . . . . . . . . . . . . . . . . . . 118 —00000 60 178
State operations:Personal service . . . . . . . . . . . . . . . . . . . . . . . . . . . . . . . . . . . . . . . . . . 200 —00000 —00000 200Non-personal service . . . . . . . . . . . . . . . . . . . . . . . . . . . . . . . . . . . . . . . 2,304 11 —00000 2,315Pension contributions . . . . . . . . . . . . . . . . . . . . . . . . . . . . . . . . . . . . . . 26 —00000 —00000 26Other fringe benefits . . . . . . . . . . . . . . . . . . . . . . . . . . . . . . . . . . . . . . . 60 —00000 —00000 60
Capital construction . . . . . . . . . . . . . . . . . . . . . . . . . . . . . . . . . . . . . . . . . . —00000 —00000 4,528 4,528Debt service, including payments on financing arrangements . . . . . . . . . —00000 758 —00000 758
Total expenditures . . . . . . . . . . . . . . . . . . . . . . . . . . . . . . . . . . . . . . 18,906 769 6,908 26,583
Excess (deficiency) of revenues over expenditures . . . . . . . . . . . . . . . . (3,457) 3,342 (2,161) (2,276)
OTHER FINANCING SOURCES (USES):Transfers from other funds . . . . . . . . . . . . . . . . . . . . . . . . . . . . . . . . . . . . 3,540 2,895 1,085 7,520Transfers to other funds . . . . . . . . . . . . . . . . . . . . . . . . . . . . . . . . . . . . . . . (364) (6,467) (1,561) (8,392)General obligation bonds issued . . . . . . . . . . . . . . . . . . . . . . . . . . . . . . . . —00000 —00000 396 396Financing arrangements issued . . . . . . . . . . . . . . . . . . . . . . . . . . . . . . . . —00000 —00000 1,481 1,481Refunding debt issued . . . . . . . . . . . . . . . . . . . . . . . . . . . . . . . . . . . . . . . . —00000 170 —00000 170Payments to escrow agents for refundings . . . . . . . . . . . . . . . . . . . . . . . . —00000 (188) —00000 (188)Premiums on bonds issued . . . . . . . . . . . . . . . . . . . . . . . . . . . . . . . . . . . . —00000 22 261 283
Net other financing sources (uses) . . . . . . . . . . . . . . . . . . . . . . . . 3,176 (3,568) 1,662 1,270
Net change in fund balances . . . . . . . . . . . . . . . . . . . . . . . . . . . . . . . . . . . (281) (226) (499) (1,006)Fund balances at April 1, 2012 . . . . . . . . . . . . . . . . . . . . . . . . . . . . . . . . . . 3,013 1,146 2,131 6,290
Fund balances at March 31, 2013 . . . . . . . . . . . . . . . . . . . . . . . . . . . . . . . . $ 2,732 $ 920 $ 1,632 $ 5,284
____________________________________________________________________________________________ STATE OF NEW YORK • 131
See independent auditors’ report.
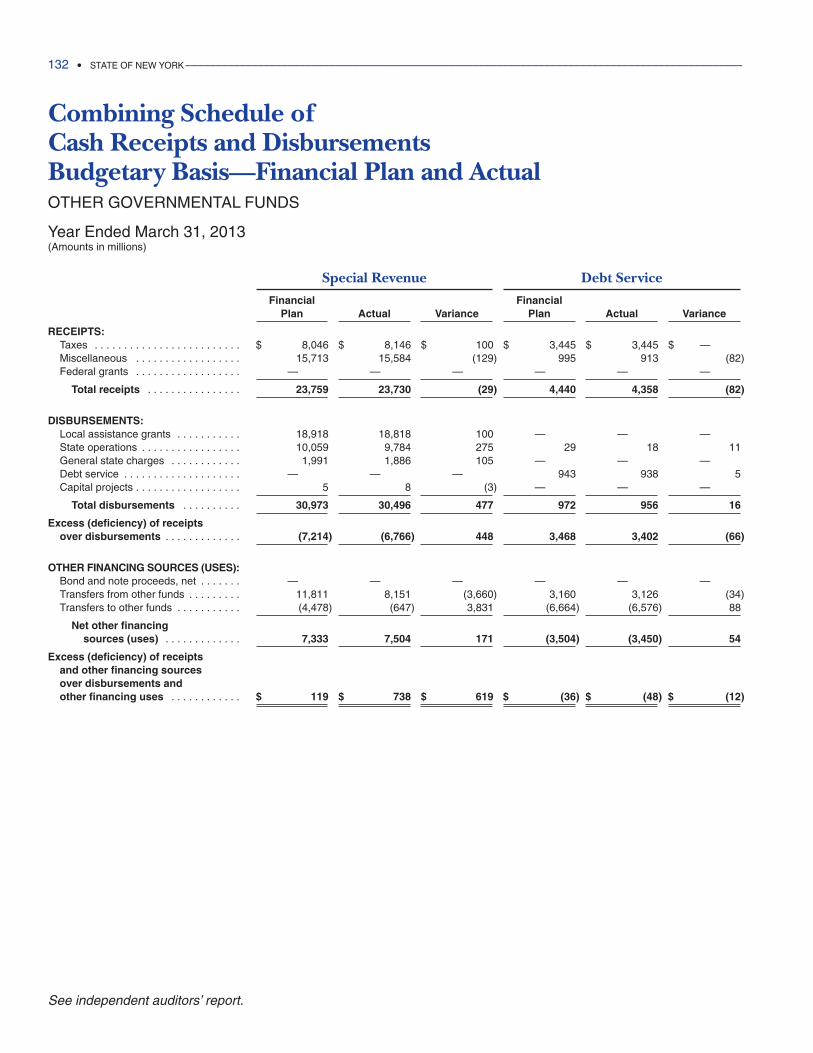
Combining Schedule of Cash Receipts and Disbursements Budgetary Basis—Financial Plan and ActualOTHER GOVERNMENTAL FUNDS
Year Ended March 31, 2013(Amounts in millions)
Special Revenue Debt Service
Financial FinancialPlan Actual Variance Plan Actual Variance
RECEIPTS:Taxes . . . . . . . . . . . . . . . . . . . . . . . . . $ 8,046 $ 8,146 $ 100 $ 3,445 $ 3,445 $ —00000Miscellaneous . . . . . . . . . . . . . . . . . . 15,713 15,584 (129) 995 913 (82)Federal grants . . . . . . . . . . . . . . . . . . —00000 —00000 —00000 —00000 —00000 —00000
Total receipts . . . . . . . . . . . . . . . . 23,759 23,730 (29) 4,440 4,358 (82)
DISBURSEMENTS:Local assistance grants . . . . . . . . . . . 18,918 18,818 100 —00000 —00000 —00000State operations . . . . . . . . . . . . . . . . . 10,059 9,784 275 29 18 11General state charges . . . . . . . . . . . . 1,991 1,886 105 —00000 —00000 —00000Debt service . . . . . . . . . . . . . . . . . . . . —00000 —00000 —00000 943 938 5Capital projects . . . . . . . . . . . . . . . . . . 5 8 (3) —00000 —00000 —00000
Total disbursements . . . . . . . . . . 30,973 30,496 477 972 956 16
Excess (deficiency) of receiptsover disbursements . . . . . . . . . . . . . (7,214) (6,766) 448 3,468 3,402 (66)
OTHER FINANCING SOURCES (USES):Bond and note proceeds, net . . . . . . . —00000 —00000 —00000 —00000 —00000 —00000Transfers from other funds . . . . . . . . . 11,811 8,151 (3,660) 3,160 3,126 (34)Transfers to other funds . . . . . . . . . . . (4,478) (647) 3,831 (6,664) (6,576) 88
Net other financing sources (uses) . . . . . . . . . . . . . 7,333 7,504 171 (3,504) (3,450) 54
Excess (deficiency) of receipts and other financing sources over disbursements and other financing uses . . . . . . . . . . . . $ 119 $ 738 $ 619 $ (36) $ (48) $ (12)
132 • STATE OF NEW YORK _____________________________________________________________________________________________
See independent auditors’ report.
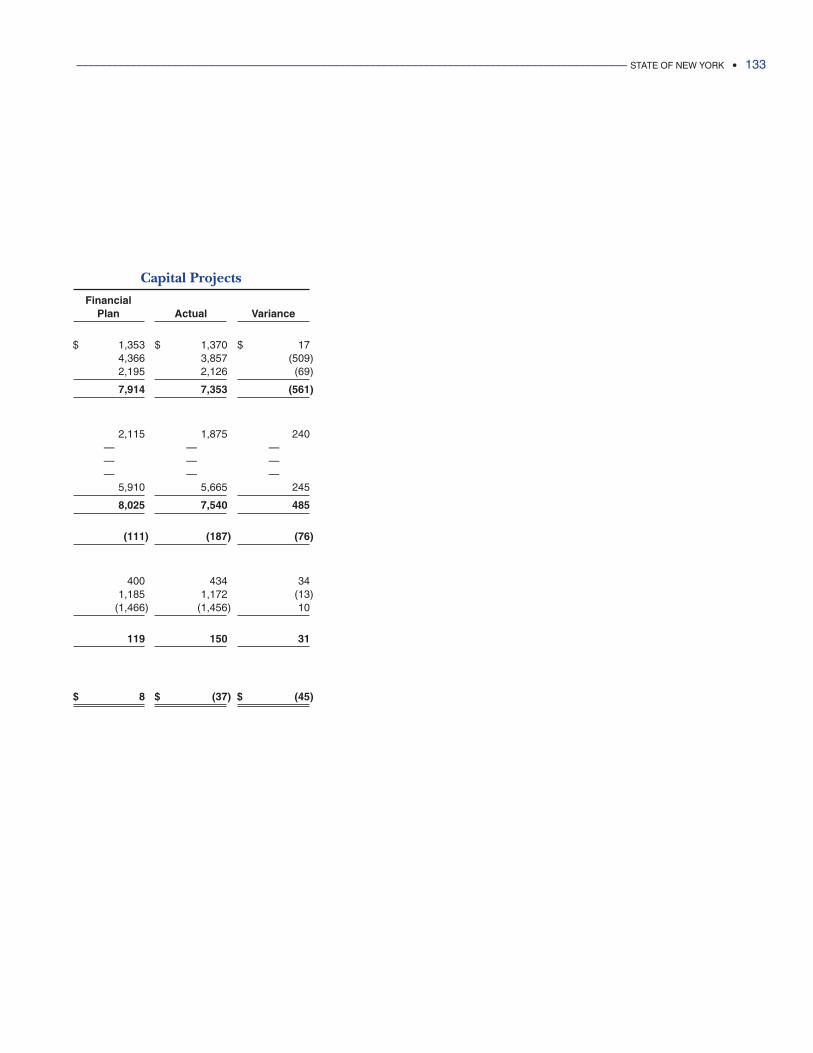
Capital Projects
FinancialPlan Actual Variance
$ 1,353 $ 1,370 $ 174,366 3,857 (509)2,195 2,126 (69)
7,914 7,353 (561)
2,115 1,875 240—00000 —00000 —00000—00000 —00000 —00000—00000 —00000 —00000
5,910 5,665 245
8,025 7,540 485
(111) (187) (76)
400 434 341,185 1,172 (13)
(1,466) (1,456) 10
119 150 31
$ 8 $ (37) $ (45)
____________________________________________________________________________________________ STATE OF NEW YORK • 133

Special Revenue Funds are used to account for the proceeds of specific revenue sources that are legally restricted to expenditures for specific purposes.
School Tax Relief Fund (STAR)—to reimburse school districts for the property taxexemptions for homeowners.
Health Care Reform Act Resources—to account for health care initiatives financedwith hospital assessments, surcharges, proceeds from the sale of public assets andcigarette tax receipts.
Dedicated Mass Transportation Trust Fund—to account for monies that areearmarked for mass transportation purposes.
ENCON Special Revenue—to account for various fees, fines and penaltiesearmarked for environmental monitoring activities, conservation and efficiencyprojects and other environmental maintenance and regulation purposes.
Conservation Fund—to account for hunting and fishing license fees and relatedfines and penalties that are dedicated to fish and wildlife programs.
Environmental Protection and Spill Compensation Fund—to account for license feesand penalties that are earmarked for oil spill clean-up costs and claims for damages.
Mass Transportation Operating Assistance—to account for various taxes earmarkedfor public mass transportation operating assistance programs.
MTA Financial Assistance Fund—to account for taxes and fees imposed in theMetropolitan Commuter Transportation District dedicated for MetropolitanTransportation Authority operating and capital needs.
Miscellaneous—to account for various fees, fines, user charges and other miscellaneousrevenues that are earmarked for specific State programs.
Special Revenue Funds
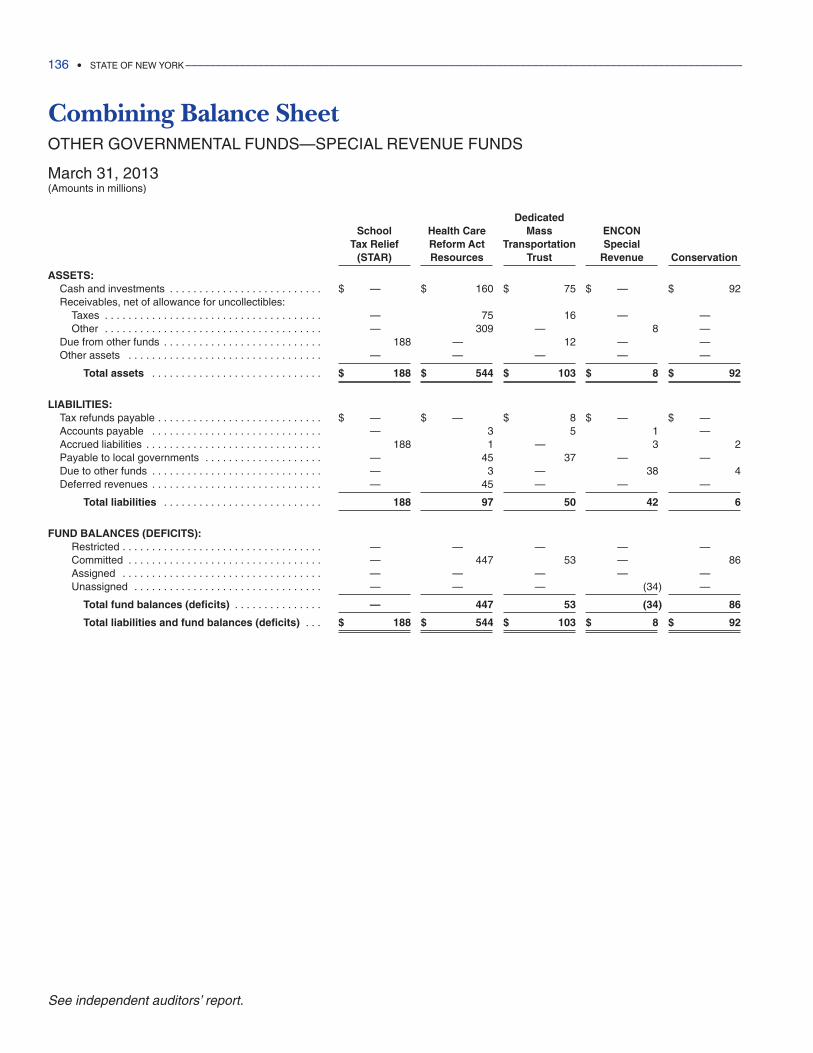
Combining Balance SheetOTHER GOVERNMENTAL FUNDS—SPECIAL REVENUE FUNDS
March 31, 2013(Amounts in millions)
DedicatedSchool Health Care Mass ENCON
Tax Relief Reform Act Transportation Special(STAR) Resources Trust Revenue Conservation
ASSETS:Cash and investments . . . . . . . . . . . . . . . . . . . . . . . . . . $ —00000 $ 160 $ 75 $ —00000 $ 92Receivables, net of allowance for uncollectibles:
Taxes . . . . . . . . . . . . . . . . . . . . . . . . . . . . . . . . . . . . . —00000 75 16 —00000 —00000Other . . . . . . . . . . . . . . . . . . . . . . . . . . . . . . . . . . . . . —00000 309 —00000 8 —00000
Due from other funds . . . . . . . . . . . . . . . . . . . . . . . . . . . 188 —00000 12 —00000 —00000Other assets . . . . . . . . . . . . . . . . . . . . . . . . . . . . . . . . . —00000 —00000 —00000 —00000 —00000
Total assets . . . . . . . . . . . . . . . . . . . . . . . . . . . . . $ 188 $ 544 $ 103 $ 8 $ 92
LIABILITIES:Tax refunds payable . . . . . . . . . . . . . . . . . . . . . . . . . . . . $ —00000 $ —00000 $ 8 $ —00000 $ —00000Accounts payable . . . . . . . . . . . . . . . . . . . . . . . . . . . . . —00000 3 5 1 —00000Accrued liabilities . . . . . . . . . . . . . . . . . . . . . . . . . . . . . . 188 1 —00000 3 2Payable to local governments . . . . . . . . . . . . . . . . . . . . —00000 45 37 —00000 —00000Due to other funds . . . . . . . . . . . . . . . . . . . . . . . . . . . . . —00000 3 —00000 38 4Deferred revenues . . . . . . . . . . . . . . . . . . . . . . . . . . . . . —00000 45 —00000 —00000 —00000
Total liabilities . . . . . . . . . . . . . . . . . . . . . . . . . . . 188 97 50 42 6
FUND BALANCES (DEFICITS):Restricted . . . . . . . . . . . . . . . . . . . . . . . . . . . . . . . . . . —00000 —00000 —00000 —00000 —00000Committed . . . . . . . . . . . . . . . . . . . . . . . . . . . . . . . . . —00000 447 53 —00000 86Assigned . . . . . . . . . . . . . . . . . . . . . . . . . . . . . . . . . . —00000 —00000 —00000 —00000 —00000Unassigned . . . . . . . . . . . . . . . . . . . . . . . . . . . . . . . . —00000 —00000 —00000 (34) —00000
Total fund balances (deficits) . . . . . . . . . . . . . . . —00000 447 53 (34) 86
Total liabilities and fund balances (deficits) . . . $ 188 $ 544 $ 103 $ 8 $ 92
136 • STATE OF NEW YORK _____________________________________________________________________________________________
See independent auditors’ report.
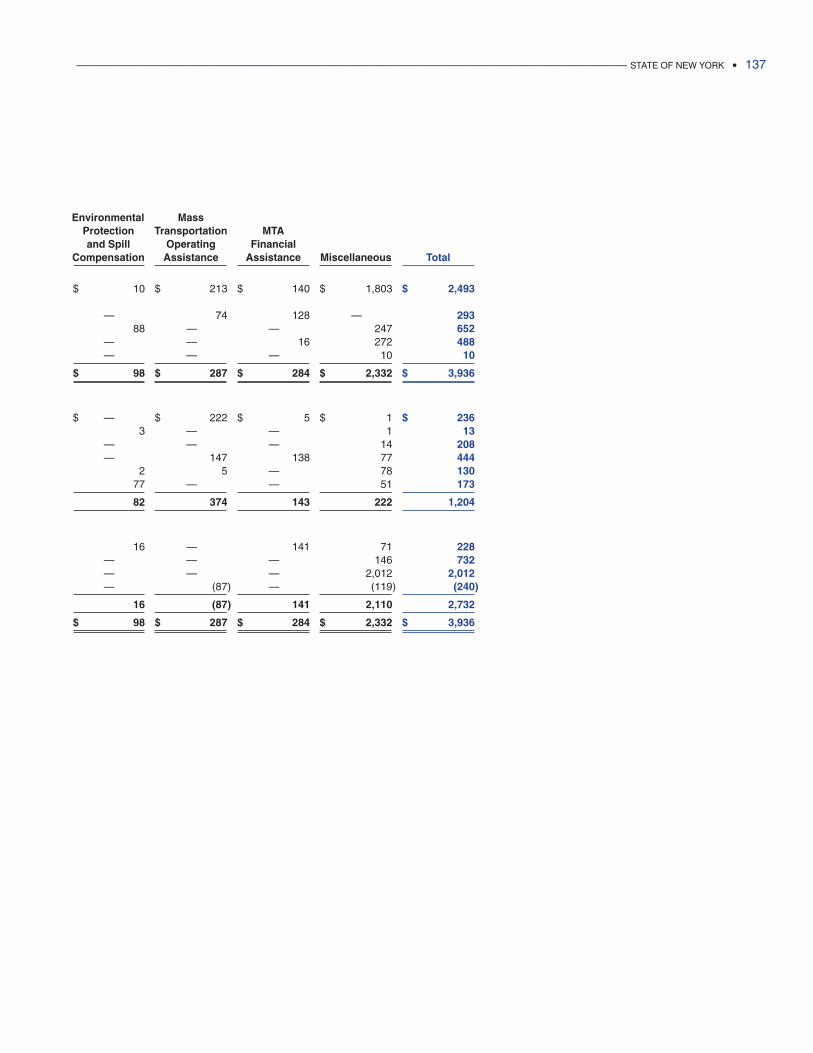
Environmental MassProtection Transportation MTAand Spill Operating Financial
Compensation Assistance Assistance Miscellaneous Total
$ 10 $ 213 $ 140 $ 1,803 $ 2,493
—00000 74 128 —00000 29388 —00000 —00000 247 652
—00000 —00000 16 272 488—00000 —00000 —00000 10 10
$ 98 $ 287 $ 284 $ 2,332 $ 3,936
$ —00000 $ 222 $ 5 $ 1 $ 2363 —00000 —00000 1 13
—00000 —00000 —00000 14 208—00000 147 138 77 444
2 5 —00000 78 13077 —00000 —00000 51 173
82 374 143 222 1,204
16 —00000 141 71 228—00000 —00000 —00000 146 732—00000 —00000 —00000 2,012 2,012—00000 (87) —00000 (119) (240)
16 (87) 141 2,110 2,732
$ 98 $ 287 $ 284 $ 2,332 $ 3,936
____________________________________________________________________________________________ STATE OF NEW YORK • 137
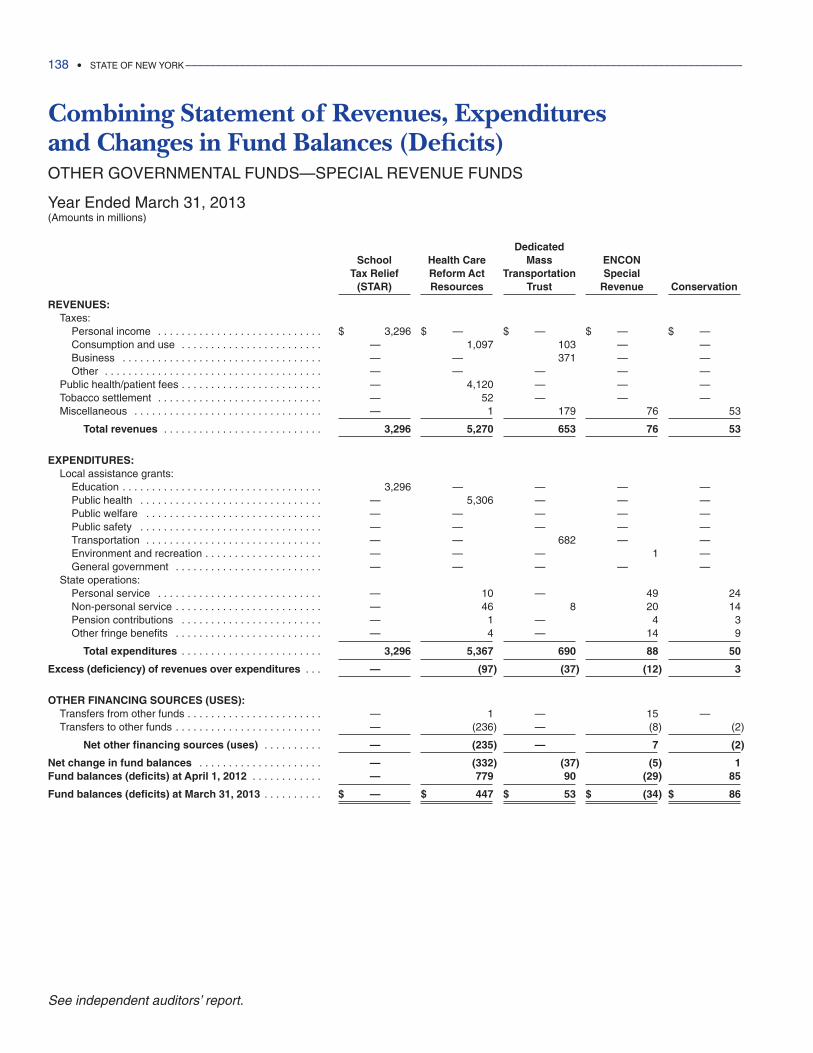
Combining Statement of Revenues, Expenditures and Changes in Fund Balances (Deficits)OTHER GOVERNMENTAL FUNDS—SPECIAL REVENUE FUNDS
Year Ended March 31, 2013(Amounts in millions)
DedicatedSchool Health Care Mass ENCON
Tax Relief Reform Act Transportation Special(STAR) Resources Trust Revenue Conservation
REVENUES:Taxes:
Personal income . . . . . . . . . . . . . . . . . . . . . . . . . . . . $ 3,296 $ —00000 $ —00000 $ —00000 $ —00000Consumption and use . . . . . . . . . . . . . . . . . . . . . . . . —00000 1,097 103 —00000 —00000Business . . . . . . . . . . . . . . . . . . . . . . . . . . . . . . . . . . —00000 —00000 371 —00000 —00000Other . . . . . . . . . . . . . . . . . . . . . . . . . . . . . . . . . . . . . —00000 —00000 —00000 —00000 —00000
Public health/patient fees . . . . . . . . . . . . . . . . . . . . . . . . —00000 4,120 —00000 —00000 —00000Tobacco settlement . . . . . . . . . . . . . . . . . . . . . . . . . . . . —00000 52 —00000 —00000 —00000Miscellaneous . . . . . . . . . . . . . . . . . . . . . . . . . . . . . . . . —00000 1 179 76 53
Total revenues . . . . . . . . . . . . . . . . . . . . . . . . . . . 3,296 5,270 653 76 53
EXPENDITURES:Local assistance grants:
Education . . . . . . . . . . . . . . . . . . . . . . . . . . . . . . . . . . 3,296 —00000 —00000 —00000 —00000Public health . . . . . . . . . . . . . . . . . . . . . . . . . . . . . . . —00000 5,306 —00000 —00000 —00000Public welfare . . . . . . . . . . . . . . . . . . . . . . . . . . . . . . —00000 —00000 —00000 —00000 —00000Public safety . . . . . . . . . . . . . . . . . . . . . . . . . . . . . . . —00000 —00000 —00000 —00000 —00000Transportation . . . . . . . . . . . . . . . . . . . . . . . . . . . . . . —00000 —00000 682 —00000 —00000Environment and recreation . . . . . . . . . . . . . . . . . . . . —00000 —00000 —00000 1 —00000General government . . . . . . . . . . . . . . . . . . . . . . . . . —00000 —00000 —00000 —00000 —00000
State operations:Personal service . . . . . . . . . . . . . . . . . . . . . . . . . . . . —00000 10 —00000 49 24Non-personal service . . . . . . . . . . . . . . . . . . . . . . . . . —00000 46 8 20 14Pension contributions . . . . . . . . . . . . . . . . . . . . . . . . —00000 1 —00000 4 3Other fringe benefits . . . . . . . . . . . . . . . . . . . . . . . . . —00000 4 —00000 14 9
Total expenditures . . . . . . . . . . . . . . . . . . . . . . . . 3,296 5,367 690 88 50
Excess (deficiency) of revenues over expenditures . . . —00000 (97) (37) (12) 3
OTHER FINANCING SOURCES (USES):Transfers from other funds . . . . . . . . . . . . . . . . . . . . . . . —00000 1 —00000 15 —00000Transfers to other funds . . . . . . . . . . . . . . . . . . . . . . . . . —00000 (236) —00000 (8) (2)
Net other financing sources (uses) . . . . . . . . . . —00000 (235) —00000 7 (2)
Net change in fund balances . . . . . . . . . . . . . . . . . . . . . —00000 (332) (37) (5) 1Fund balances (deficits) at April 1, 2012 . . . . . . . . . . . . —00000 779 90 (29) 85
Fund balances (deficits) at March 31, 2013 . . . . . . . . . . $ —00000 $ 447 $ 53 $ (34) $ 86
138 • STATE OF NEW YORK _____________________________________________________________________________________________
See independent auditors’ report.
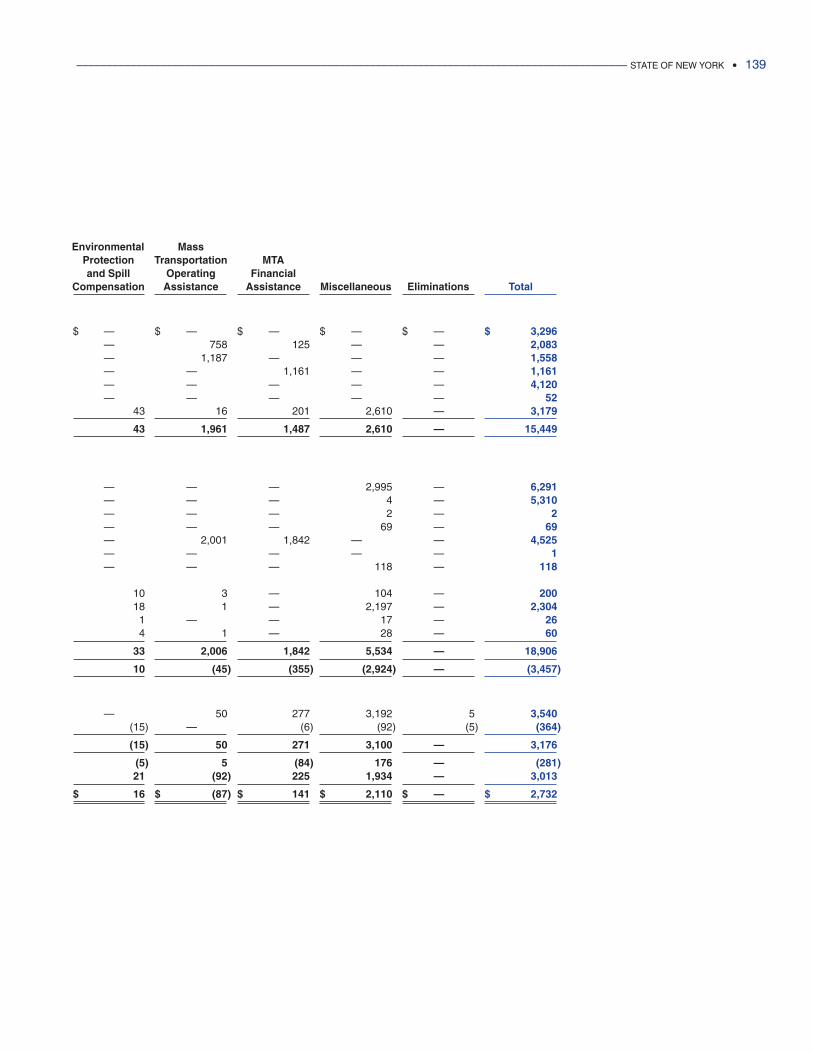
Environmental MassProtection Transportation MTAand Spill Operating Financial
Compensation Assistance Assistance Miscellaneous Eliminations Total
$ —00000 $ —00000 $ —00000 $ —00000 $ —00000 $ 3,296—00000 758 125 —00000 —00000 2,083—00000 1,187 —00000 —00000 —00000 1,558—00000 —00000 1,161 —00000 —00000 1,161—00000 —00000 —00000 —00000 —00000 4,120—00000 —00000 —00000 —00000 —00000 52
43 16 201 2,610 —00000 3,179
43 1,961 1,487 2,610 —00000 15,449
—00000 —00000 —00000 2,995 —00000 6,291—00000 —00000 —00000 4 —00000 5,310—00000 —00000 —00000 2 —00000 2—00000 —00000 —00000 69 —00000 69—00000 2,001 1,842 —00000 —00000 4,525—00000 —00000 —00000 —00000 —00000 1—00000 —00000 —00000 118 —00000 118
10 3 —00000 104 —00000 20018 1 —00000 2,197 —00000 2,3041 —00000 —00000 17 —00000 264 1 —00000 28 —00000 60
33 2,006 1,842 5,534 —00000 18,906
10 (45) (355) (2,924) —00000 (3,457)
—00000 50 277 3,192 5 3,540(15) —00000 (6) (92) (5) (364)
(15) 50 271 3,100 —00000 3,176
(5) 5 (84) 176 —00000 (281)21 (92) 225 1,934 —00000 3,013
$ 16 $ (87) $ 141 $ 2,110 $ —00000 $ 2,732
____________________________________________________________________________________________ STATE OF NEW YORK • 139
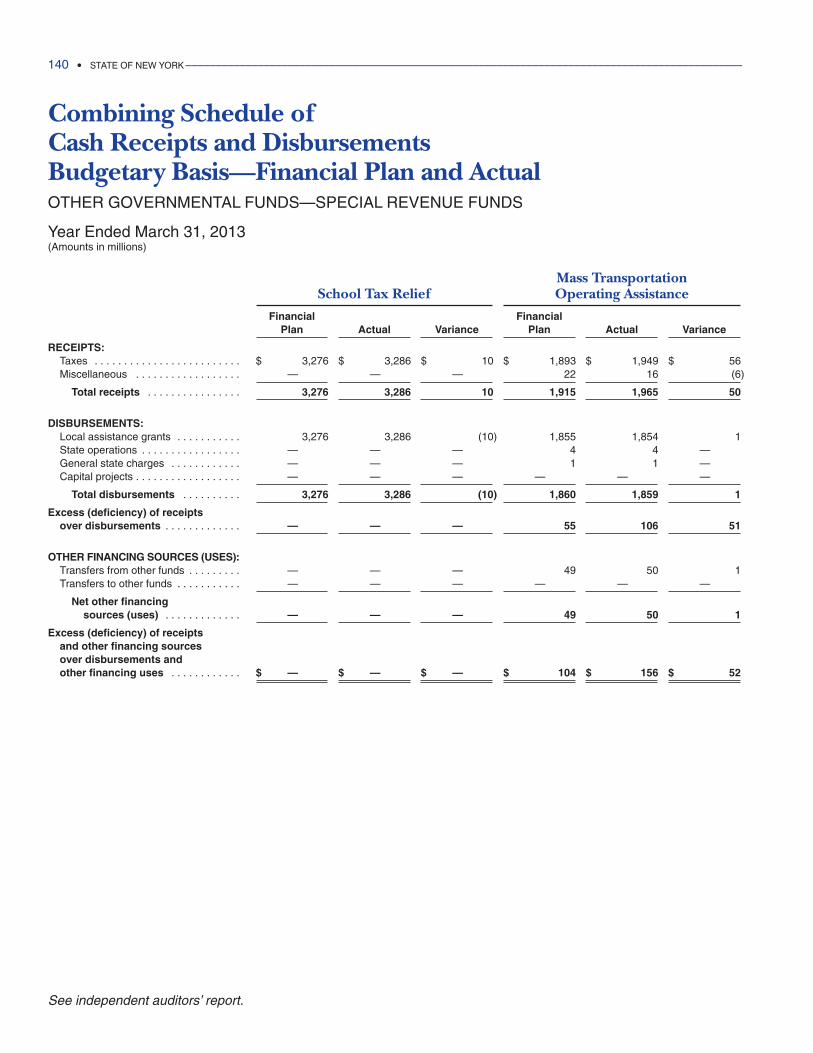
Combining Schedule of Cash Receipts and Disbursements Budgetary Basis—Financial Plan and ActualOTHER GOVERNMENTAL FUNDS—SPECIAL REVENUE FUNDS
Year Ended March 31, 2013(Amounts in millions)
Mass Transportation School Tax Relief Operating Assistance
Financial FinancialPlan Actual Variance Plan Actual Variance
RECEIPTS:Taxes . . . . . . . . . . . . . . . . . . . . . . . . . $ 3,276 $ 3,286 $ 10 $ 1,893 $ 1,949 $ 56Miscellaneous . . . . . . . . . . . . . . . . . . —00000 —00000 —00000 22 16 (6)
Total receipts . . . . . . . . . . . . . . . . 3,276 3,286 10 1,915 1,965 50
DISBURSEMENTS:Local assistance grants . . . . . . . . . . . 3,276 3,286 (10) 1,855 1,854 1State operations . . . . . . . . . . . . . . . . . —00000 —00000 —00000 4 4 —00000General state charges . . . . . . . . . . . . —00000 —00000 —00000 1 1 —00000Capital projects . . . . . . . . . . . . . . . . . . —00000 —00000 —00000 —00000 —00000 —00000
Total disbursements . . . . . . . . . . 3,276 3,286 (10) 1,860 1,859 1
Excess (deficiency) of receiptsover disbursements . . . . . . . . . . . . . —00000 —00000 —00000 55 106 51
OTHER FINANCING SOURCES (USES):Transfers from other funds . . . . . . . . . —00000 —00000 —00000 49 50 1Transfers to other funds . . . . . . . . . . . —00000 —00000 —00000 —00000 —00000 —00000
Net other financing sources (uses) . . . . . . . . . . . . . —00000 —00000 —00000 49 50 1
Excess (deficiency) of receipts and other financing sources over disbursements and other financing uses . . . . . . . . . . . . $ —00000 $ —00000 $ —00000 $ 104 $ 156 $ 52
140 • STATE OF NEW YORK _____________________________________________________________________________________________
See independent auditors’ report.
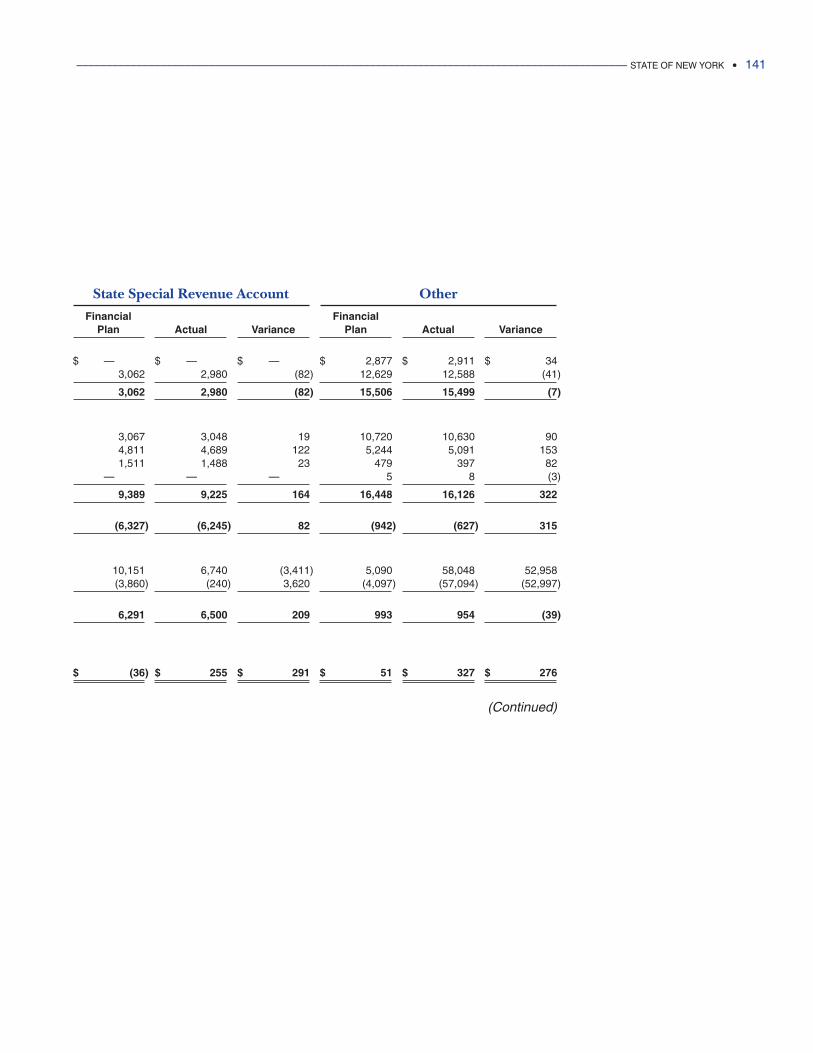
State Special Revenue Account Other
Financial FinancialPlan Actual Variance Plan Actual Variance
$ —00000 $ —00000 $ —00000 $ 2,877 $ 2,911 $ 343,062 2,980 (82) 12,629 12,588 (41)
3,062 2,980 (82) 15,506 15,499 (7)
3,067 3,048 19 10,720 10,630 904,811 4,689 122 5,244 5,091 1531,511 1,488 23 479 397 82
—00000 —00000 —00000 5 8 (3)
9,389 9,225 164 16,448 16,126 322
(6,327) (6,245) 82 (942) (627) 315
10,151 6,740 (3,411) 5,090 58,048 52,958(3,860) (240) 3,620 (4,097) (57,094) (52,997)
6,291 6,500 209 993 954 (39)
$ (36) $ 255 $ 291 $ 51 $ 327 $ 276
(Continued)
____________________________________________________________________________________________ STATE OF NEW YORK • 141
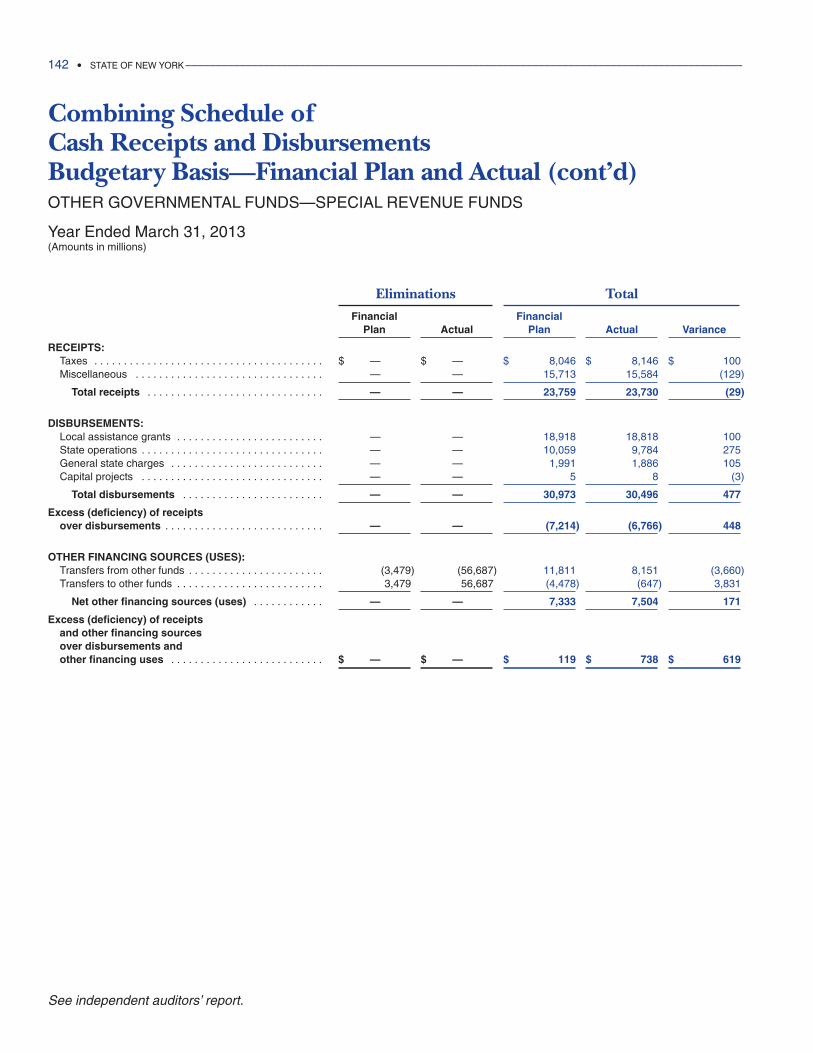
Combining Schedule of Cash Receipts and Disbursements Budgetary Basis—Financial Plan and Actual (cont’d)OTHER GOVERNMENTAL FUNDS—SPECIAL REVENUE FUNDS
Year Ended March 31, 2013(Amounts in millions)
Eliminations Total
Financial FinancialPlan Actual Plan Actual Variance
RECEIPTS:Taxes . . . . . . . . . . . . . . . . . . . . . . . . . . . . . . . . . . . . . . . $ —00000 $ —00000 $ 8,046 $ 8,146 $ 100Miscellaneous . . . . . . . . . . . . . . . . . . . . . . . . . . . . . . . . —00000 —00000 15,713 15,584 (129)
Total receipts . . . . . . . . . . . . . . . . . . . . . . . . . . . . . . —00000 —00000 23,759 23,730 (29)
DISBURSEMENTS:Local assistance grants . . . . . . . . . . . . . . . . . . . . . . . . . —00000 —00000 18,918 18,818 100State operations . . . . . . . . . . . . . . . . . . . . . . . . . . . . . . . —00000 —00000 10,059 9,784 275General state charges . . . . . . . . . . . . . . . . . . . . . . . . . . —00000 —00000 1,991 1,886 105Capital projects . . . . . . . . . . . . . . . . . . . . . . . . . . . . . . . —00000 —00000 5 8 (3)
Total disbursements . . . . . . . . . . . . . . . . . . . . . . . . —00000 —00000 30,973 30,496 477
Excess (deficiency) of receiptsover disbursements . . . . . . . . . . . . . . . . . . . . . . . . . . . —00000 —00000 (7,214) (6,766) 448
OTHER FINANCING SOURCES (USES):Transfers from other funds . . . . . . . . . . . . . . . . . . . . . . . (3,479) (56,687) 11,811 8,151 (3,660)Transfers to other funds . . . . . . . . . . . . . . . . . . . . . . . . . 3,479 56,687 (4,478) (647) 3,831
Net other financing sources (uses) . . . . . . . . . . . . —00000 —00000 7,333 7,504 171
Excess (deficiency) of receipts and other financing sources over disbursements and other financing uses . . . . . . . . . . . . . . . . . . . . . . . . . . $ —00000 $ —00000 $ 119 $ 738 $ 619
142 • STATE OF NEW YORK _____________________________________________________________________________________________
See independent auditors’ report.
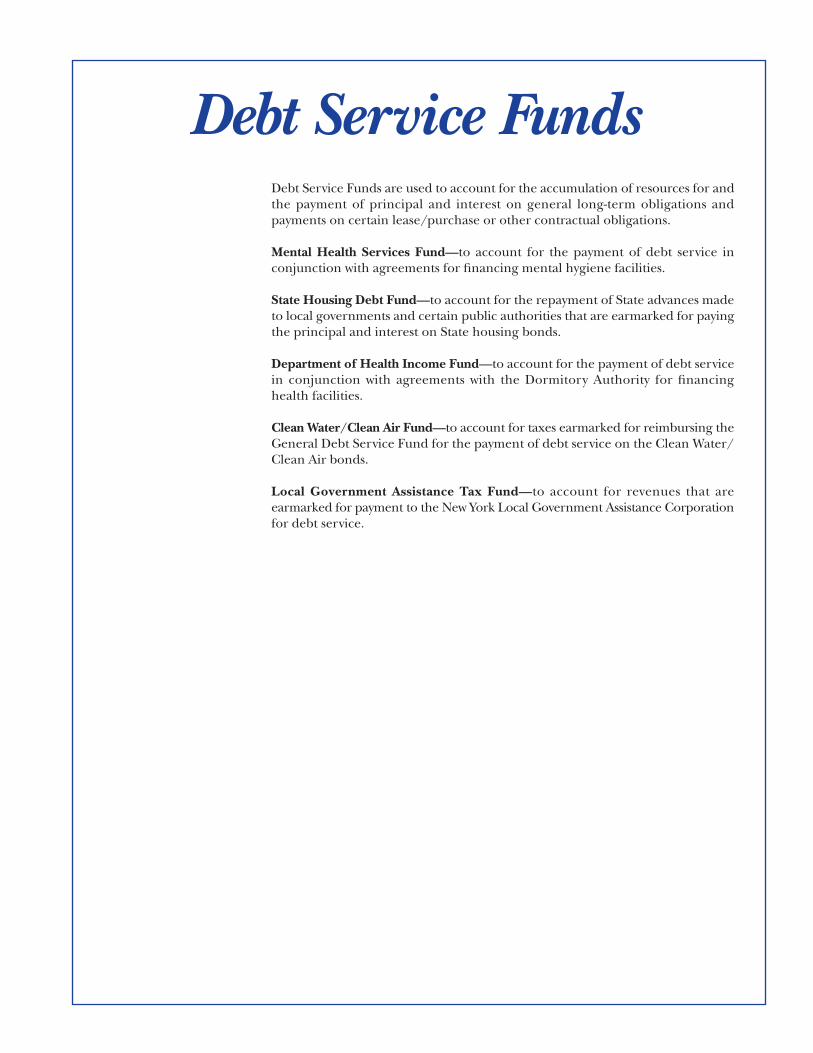
Debt Service Funds are used to account for the accumulation of resources for andthe payment of principal and interest on general long-term obligations andpayments on certain lease/purchase or other contractual obligations.
Mental Health Services Fund—to account for the payment of debt service inconjunction with agreements for financing mental hygiene facilities.
State Housing Debt Fund—to account for the repayment of State advances madeto local governments and certain public authorities that are earmarked for payingthe principal and interest on State housing bonds.
Department of Health Income Fund—to account for the payment of debt servicein conjunction with agreements with the Dormitory Authority for financinghealth facilities.
Clean Water/Clean Air Fund—to account for taxes earmarked for reimbursing theGeneral Debt Service Fund for the payment of debt service on the Clean Water/Clean Air bonds.
Local Government Assistance Tax Fund—to account for revenues that areearmarked for payment to the New York Local Government Assistance Corporationfor debt service.
Debt Service Funds
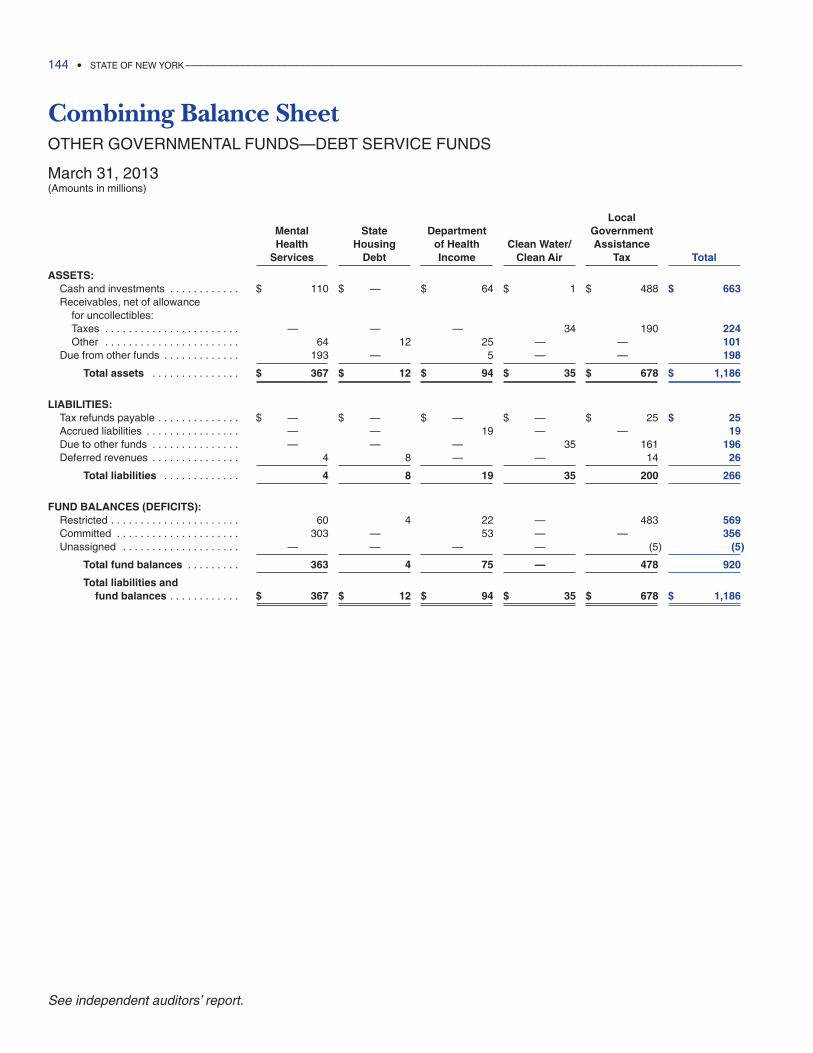
Combining Balance SheetOTHER GOVERNMENTAL FUNDS—DEBT SERVICE FUNDS
March 31, 2013(Amounts in millions)
LocalMental State Department GovernmentHealth Housing of Health Clean Water/ Assistance
Services Debt Income Clean Air Tax Total
ASSETS:Cash and investments . . . . . . . . . . . . $ 110 $ —00000 $ 64 $ 1 $ 488 $ 663Receivables, net of allowance
for uncollectibles:Taxes . . . . . . . . . . . . . . . . . . . . . . . —00000 —00000 —00000 34 190 224Other . . . . . . . . . . . . . . . . . . . . . . . 64 12 25 —00000 —00000 101
Due from other funds . . . . . . . . . . . . . 193 —00000 5 —00000 —00000 198
Total assets . . . . . . . . . . . . . . . $ 367 $ 12 $ 94 $ 35 $ 678 $ 1,186
LIABILITIES:Tax refunds payable . . . . . . . . . . . . . . $ —00000 $ —00000 $ —00000 $ —00000 $ 25 $ 25Accrued liabilities . . . . . . . . . . . . . . . . —00000 —00000 19 —00000 —00000 19Due to other funds . . . . . . . . . . . . . . . —00000 —00000 —00000 35 161 196Deferred revenues . . . . . . . . . . . . . . . 4 8 —00000 —00000 14 26
Total liabilities . . . . . . . . . . . . . 4 8 19 35 200 266
FUND BALANCES (DEFICITS):Restricted . . . . . . . . . . . . . . . . . . . . . . 60 4 22 —00000 483 569Committed . . . . . . . . . . . . . . . . . . . . . 303 —00000 53 —00000 —00000 356Unassigned . . . . . . . . . . . . . . . . . . . . —00000 —00000 —00000 —00000 (5) (5)
Total fund balances . . . . . . . . . 363 4 75 —00000 478 920
Total liabilities and fund balances . . . . . . . . . . . . $ 367 $ 12 $ 94 $ 35 $ 678 $ 1,186
144 • STATE OF NEW YORK _____________________________________________________________________________________________
See independent auditors’ report.
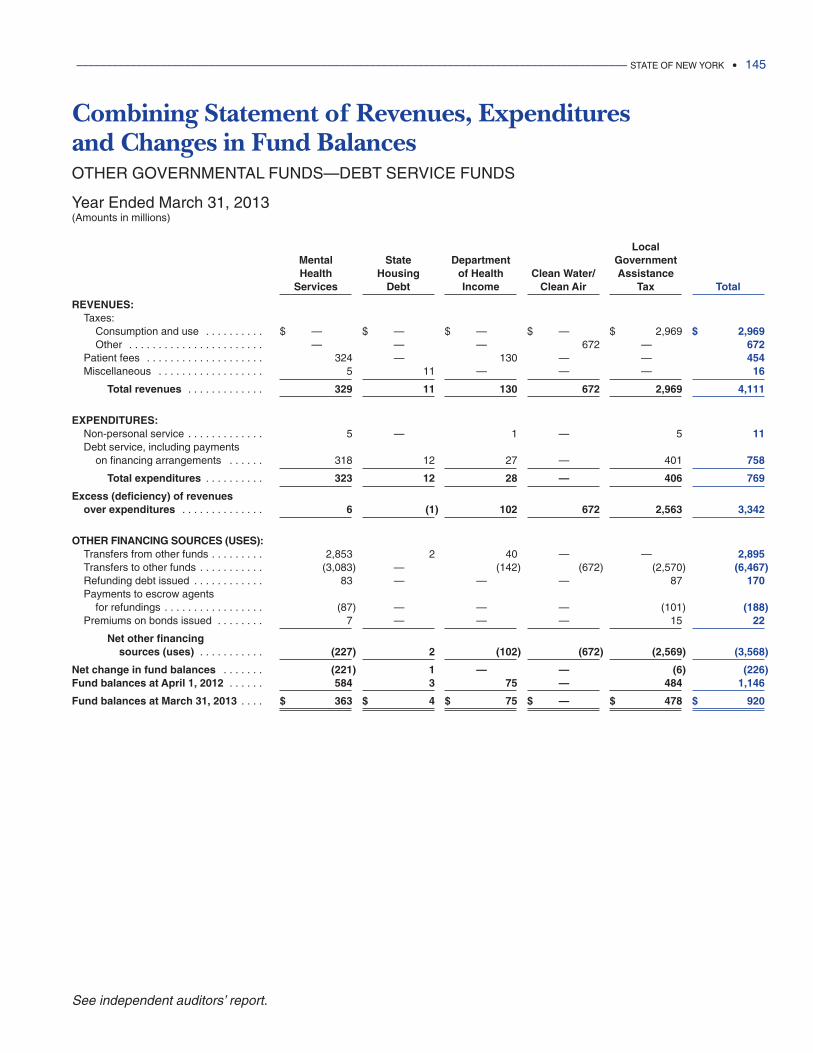
____________________________________________________________________________________________ STATE OF NEW YORK • 145
See independent auditors’ report.
Combining Statement of Revenues, Expenditures and Changes in Fund BalancesOTHER GOVERNMENTAL FUNDS—DEBT SERVICE FUNDS
Year Ended March 31, 2013(Amounts in millions)
LocalMental State Department GovernmentHealth Housing of Health Clean Water/ Assistance
Services Debt Income Clean Air Tax Total
REVENUES:Taxes:
Consumption and use . . . . . . . . . . $ —00000 $ —00000 $ —00000 $ —00000 $ 2,969 $ 2,969Other . . . . . . . . . . . . . . . . . . . . . . . —00000 —00000 —00000 672 —00000 672
Patient fees . . . . . . . . . . . . . . . . . . . . 324 —00000 130 —00000 —00000 454Miscellaneous . . . . . . . . . . . . . . . . . . 5 11 —00000 —00000 —00000 16
Total revenues . . . . . . . . . . . . . 329 11 130 672 2,969 4,111
EXPENDITURES:Non-personal service . . . . . . . . . . . . . 5 —00000 1 —00000 5 11Debt service, including payments
on financing arrangements . . . . . . 318 12 27 —00000 401 758
Total expenditures . . . . . . . . . . 323 12 28 —00000 406 769
Excess (deficiency) of revenues over expenditures . . . . . . . . . . . . . . 6 (1) 102 672 2,563 3,342
OTHER FINANCING SOURCES (USES):Transfers from other funds . . . . . . . . . 2,853 2 40 —00000 —00000 2,895Transfers to other funds . . . . . . . . . . . (3,083) —00000 (142) (672) (2,570) (6,467)Refunding debt issued . . . . . . . . . . . . 83 —00000 —00000 —00000 87 170Payments to escrow agents
for refundings . . . . . . . . . . . . . . . . . (87) —00000 —00000 —00000 (101) (188)Premiums on bonds issued . . . . . . . . 7 —00000 —00000 —00000 15 22
Net other financing sources (uses) . . . . . . . . . . . (227) 2 (102) (672) (2,569) (3,568)
Net change in fund balances . . . . . . . (221) 1 —00000 —00000 (6) (226)Fund balances at April 1, 2012 . . . . . . 584 3 75 —00000 484 1,146
Fund balances at March 31, 2013 . . . . $ 363 $ 4 $ 75 $ —00000 $ 478 $ 920
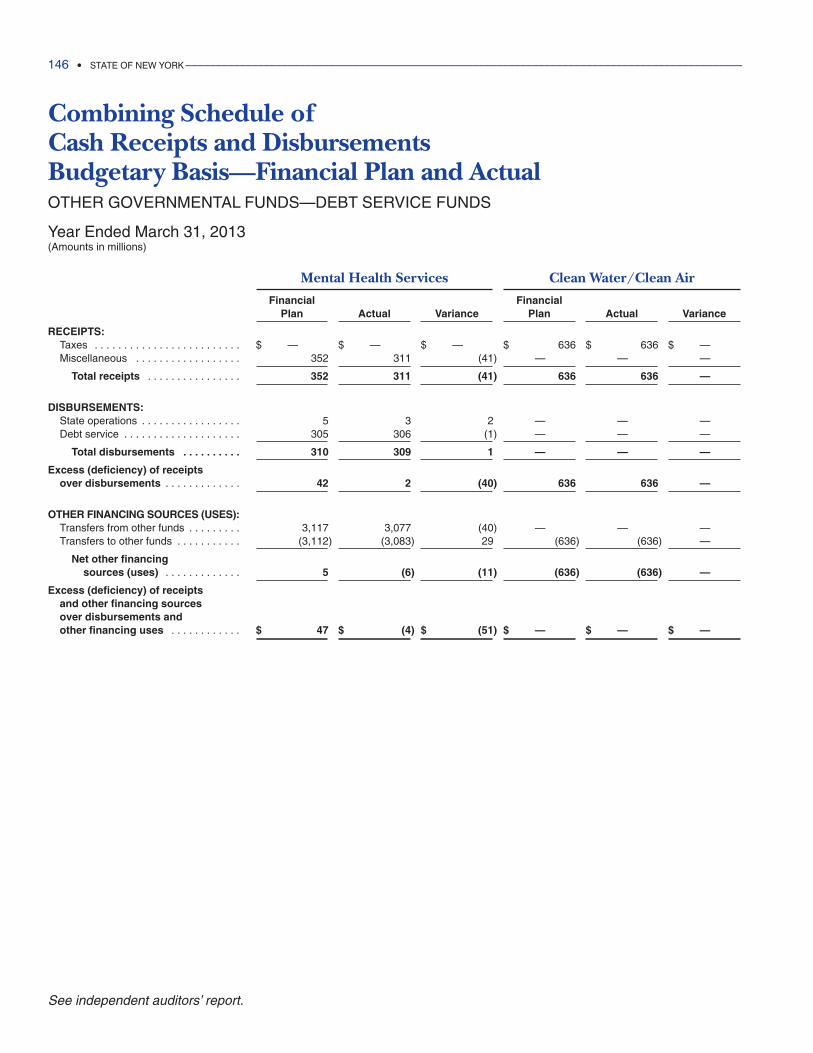
Combining Schedule of Cash Receipts and Disbursements Budgetary Basis—Financial Plan and ActualOTHER GOVERNMENTAL FUNDS—DEBT SERVICE FUNDS
Year Ended March 31, 2013(Amounts in millions)
Mental Health Services Clean Water/Clean Air
Financial FinancialPlan Actual Variance Plan Actual Variance
RECEIPTS:Taxes . . . . . . . . . . . . . . . . . . . . . . . . . $ —00000 $ —00000 $ —00000 $ 636 $ 636 $ —00000Miscellaneous . . . . . . . . . . . . . . . . . . 352 311 (41) —00000 —00000 —00000
Total receipts . . . . . . . . . . . . . . . . 352 311 (41) 636 636 —00000
DISBURSEMENTS:State operations . . . . . . . . . . . . . . . . . 5 3 2 —00000 —00000 —00000Debt service . . . . . . . . . . . . . . . . . . . . 305 306 (1) —00000 —00000 —00000
Total disbursements . . . . . . . . . . 310 309 1 —00000 —00000 —00000
Excess (deficiency) of receiptsover disbursements . . . . . . . . . . . . . 42 2 (40) 636 636 —00000
OTHER FINANCING SOURCES (USES):Transfers from other funds . . . . . . . . . 3,117 3,077 (40) —00000 —00000 —00000Transfers to other funds . . . . . . . . . . . (3,112) (3,083) 29 (636) (636) —00000
Net other financing sources (uses) . . . . . . . . . . . . . 5 (6) (11) (636) (636) —00000
Excess (deficiency) of receipts and other financing sources over disbursements and other financing uses . . . . . . . . . . . . $ 47 $ (4) $ (51) $ —00000 $ —00000 $ —00000
146 • STATE OF NEW YORK _____________________________________________________________________________________________
See independent auditors’ report.
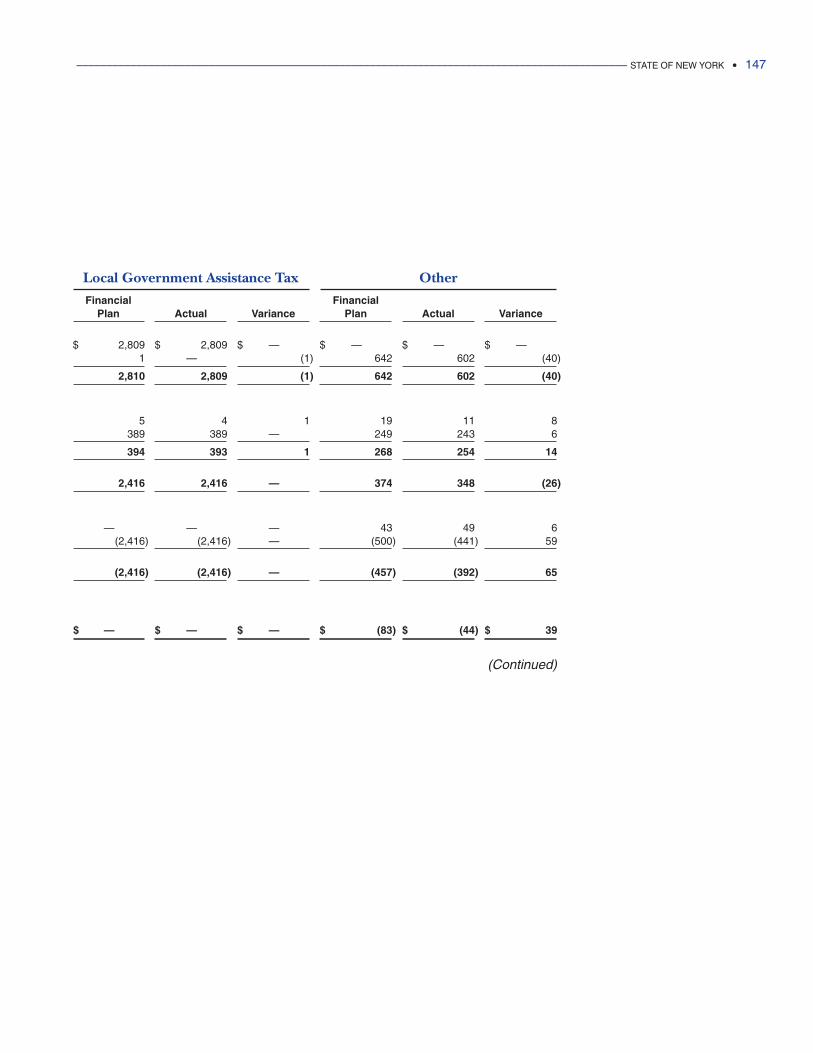
Local Government Assistance Tax Other
Financial FinancialPlan Actual Variance Plan Actual Variance
$ 2,809 $ 2,809 $ —00000 $ —00000 $ —00000 $ —000001 —00000 (1) 642 602 (40)
2,810 2,809 (1) 642 602 (40)
5 4 1 19 11 8389 389 —00000 249 243 6
394 393 1 268 254 14
2,416 2,416 —00000 374 348 (26)
—00000 —00000 —00000 43 49 6(2,416) (2,416) —00000 (500) (441) 59
(2,416) (2,416) —00000 (457) (392) 65
$ —00000 $ —00000 $ —00000 $ (83) $ (44) $ 39
(Continued)
____________________________________________________________________________________________ STATE OF NEW YORK • 147
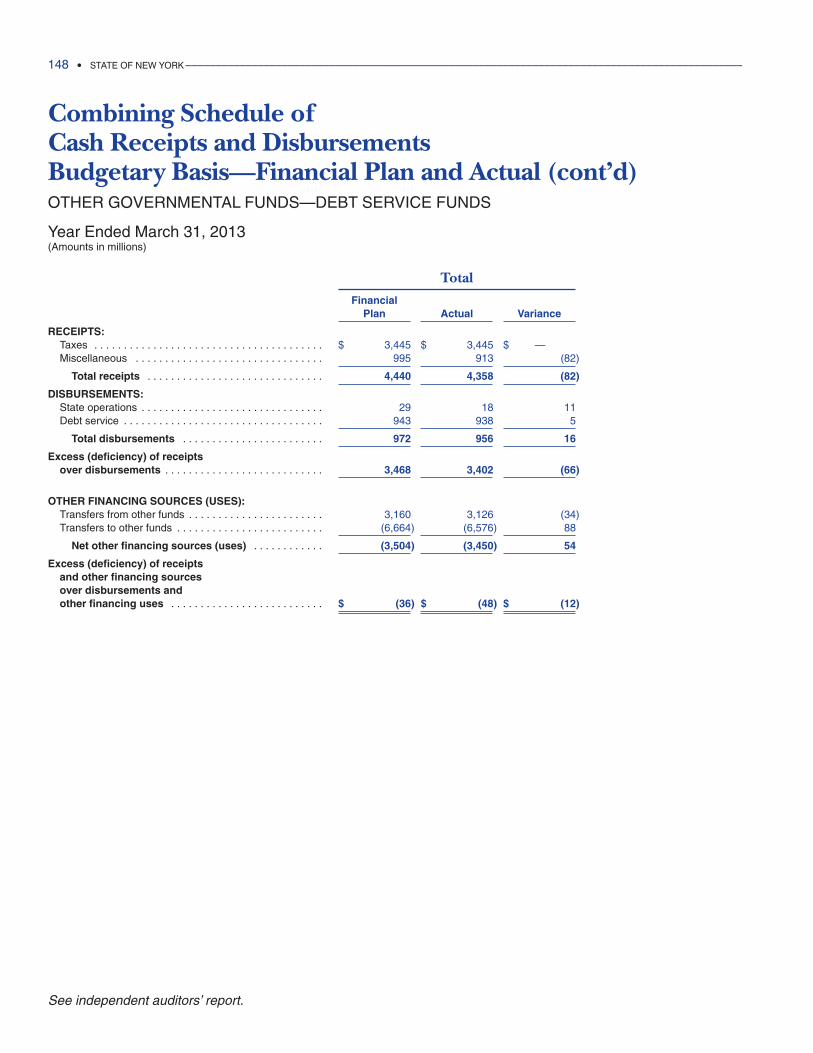
Combining Schedule of Cash Receipts and Disbursements Budgetary Basis—Financial Plan and Actual (cont’d)OTHER GOVERNMENTAL FUNDS—DEBT SERVICE FUNDS
Year Ended March 31, 2013(Amounts in millions)
Total
FinancialPlan Actual Variance
RECEIPTS:Taxes . . . . . . . . . . . . . . . . . . . . . . . . . . . . . . . . . . . . . . . $ 3,445 $ 3,445 $ —00000Miscellaneous . . . . . . . . . . . . . . . . . . . . . . . . . . . . . . . . 995 913 (82)
Total receipts . . . . . . . . . . . . . . . . . . . . . . . . . . . . . . 4,440 4,358 (82)
DISBURSEMENTS:State operations . . . . . . . . . . . . . . . . . . . . . . . . . . . . . . . 29 18 11Debt service . . . . . . . . . . . . . . . . . . . . . . . . . . . . . . . . . . 943 938 5
Total disbursements . . . . . . . . . . . . . . . . . . . . . . . . 972 956 16
Excess (deficiency) of receiptsover disbursements . . . . . . . . . . . . . . . . . . . . . . . . . . . 3,468 3,402 (66)
OTHER FINANCING SOURCES (USES):Transfers from other funds . . . . . . . . . . . . . . . . . . . . . . . 3,160 3,126 (34)Transfers to other funds . . . . . . . . . . . . . . . . . . . . . . . . . (6,664) (6,576) 88
Net other financing sources (uses) . . . . . . . . . . . . (3,504) (3,450) 54
Excess (deficiency) of receipts and other financing sources over disbursements and other financing uses . . . . . . . . . . . . . . . . . . . . . . . . . . $ (36) $ (48) $ (12)
148 • STATE OF NEW YORK _____________________________________________________________________________________________
See independent auditors’ report.
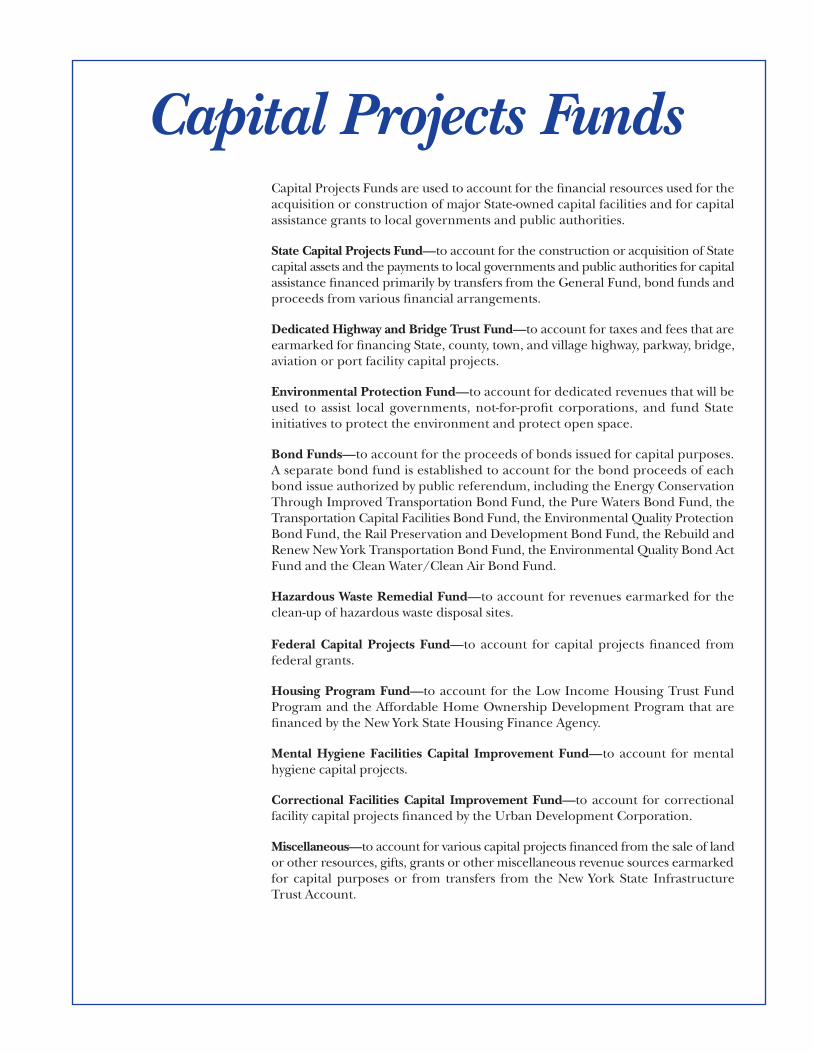
Capital Projects Funds are used to account for the financial resources used for theacquisition or construction of major State-owned capital facilities and for capitalassistance grants to local governments and public authorities.
State Capital Projects Fund—to account for the construction or acquisition of Statecapital assets and the payments to local governments and public authorities for capitalassistance financed primarily by transfers from the General Fund, bond funds andproceeds from various financial arrangements.
Dedicated Highway and Bridge Trust Fund—to account for taxes and fees that areearmarked for financing State, county, town, and village highway, parkway, bridge,aviation or port facility capital projects.
Environmental Protection Fund—to account for dedicated revenues that will beused to assist local governments, not-for-profit corporations, and fund Stateinitiatives to protect the environment and protect open space.
Bond Funds—to account for the proceeds of bonds issued for capital purposes.A separate bond fund is established to account for the bond proceeds of eachbond issue authorized by public referendum, including the Energy ConservationThrough Improved Transportation Bond Fund, the Pure Waters Bond Fund, theTransportation Capital Facilities Bond Fund, the Environmental Quality ProtectionBond Fund, the Rail Preservation and Development Bond Fund, the Rebuild andRenew New York Transportation Bond Fund, the Environmental Quality Bond ActFund and the Clean Water/Clean Air Bond Fund.
Hazardous Waste Remedial Fund—to account for revenues earmarked for theclean-up of hazardous waste disposal sites.
Federal Capital Projects Fund—to account for capital projects financed fromfederal grants.
Housing Program Fund—to account for the Low Income Housing Trust FundProgram and the Affordable Home Ownership Development Program that arefinanced by the New York State Housing Finance Agency.
Mental Hygiene Facilities Capital Improvement Fund—to account for mentalhygiene capital projects.
Correctional Facilities Capital Improvement Fund—to account for correctionalfacility capital projects financed by the Urban Development Corporation.
Miscellaneous—to account for various capital projects financed from the sale of landor other resources, gifts, grants or other miscellaneous revenue sources earmarkedfor capital purposes or from transfers from the New York State InfrastructureTrust Account.
Capital Projects Funds
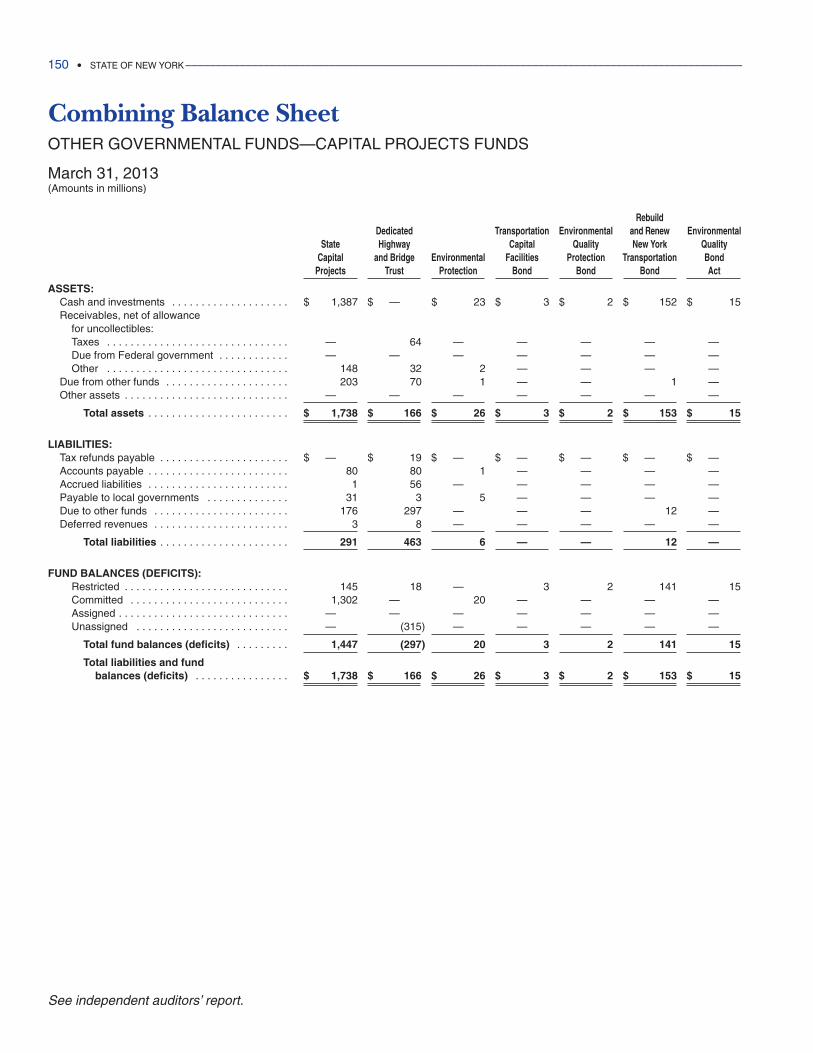
Combining Balance SheetOTHER GOVERNMENTAL FUNDS—CAPITAL PROJECTS FUNDS
March 31, 2013(Amounts in millions)
RebuildDedicated Transportation Environmental and Renew Environmental
State Highway Capital Quality New York QualityCapital and Bridge Environmental Facilities Protection Transportation Bond
Projects Trust Protection Bond Bond Bond Act
ASSETS:Cash and investments . . . . . . . . . . . . . . . . . . . . $ 1,387 $ —0000 $ 23 $ 3 $ 2 $ 152 $ 15Receivables, net of allowance
for uncollectibles:Taxes . . . . . . . . . . . . . . . . . . . . . . . . . . . . . . . —0000 64 —0000 —0000 —0000 —0000 —0000Due from Federal government . . . . . . . . . . . . —0000 —0000 —0000 —0000 —0000 —0000 —0000Other . . . . . . . . . . . . . . . . . . . . . . . . . . . . . . . 148 32 2 —0000 —0000 —0000 —0000
Due from other funds . . . . . . . . . . . . . . . . . . . . . 203 70 1 —0000 —0000 1 —0000Other assets . . . . . . . . . . . . . . . . . . . . . . . . . . . . —0000 —0000 —0000 —0000 —0000 —0000 —0000
Total assets . . . . . . . . . . . . . . . . . . . . . . . . $ 1,738 $ 166 $ 26 $ 3 $ 2 $ 153 $ 15
LIABILITIES:Tax refunds payable . . . . . . . . . . . . . . . . . . . . . . $ —0000 $ 19 $ —0000 $ —0000 $ —0000 $ —0000 $ —0000Accounts payable . . . . . . . . . . . . . . . . . . . . . . . . 80 80 1 —0000 —0000 —0000 —0000Accrued liabilities . . . . . . . . . . . . . . . . . . . . . . . . 1 56 —0000 —0000 —0000 —0000 —0000Payable to local governments . . . . . . . . . . . . . . 31 3 5 —0000 —0000 —0000 —0000Due to other funds . . . . . . . . . . . . . . . . . . . . . . . 176 297 —0000 —0000 —0000 12 —0000Deferred revenues . . . . . . . . . . . . . . . . . . . . . . . 3 8 —0000 —0000 —0000 —0000 —0000
Total liabilities . . . . . . . . . . . . . . . . . . . . . . 291 463 6 —0000 —0000 12 —0000
FUND BALANCES (DEFICITS):Restricted . . . . . . . . . . . . . . . . . . . . . . . . . . . . 145 18 —0000 3 2 141 15Committed . . . . . . . . . . . . . . . . . . . . . . . . . . . 1,302 —0000 20 —0000 —0000 —0000 —0000Assigned . . . . . . . . . . . . . . . . . . . . . . . . . . . . . —0000 —0000 —0000 —0000 —0000 —0000 —0000Unassigned . . . . . . . . . . . . . . . . . . . . . . . . . . —0000 (315) —0000 —0000 —0000 —0000 —0000
Total fund balances (deficits) . . . . . . . . . 1,447 (297) 20 3 2 141 15
Total liabilities and fund balances (deficits) . . . . . . . . . . . . . . . . $ 1,738 $ 166 $ 26 $ 3 $ 2 $ 153 $ 15
150 • STATE OF NEW YORK _____________________________________________________________________________________________
See independent auditors’ report.
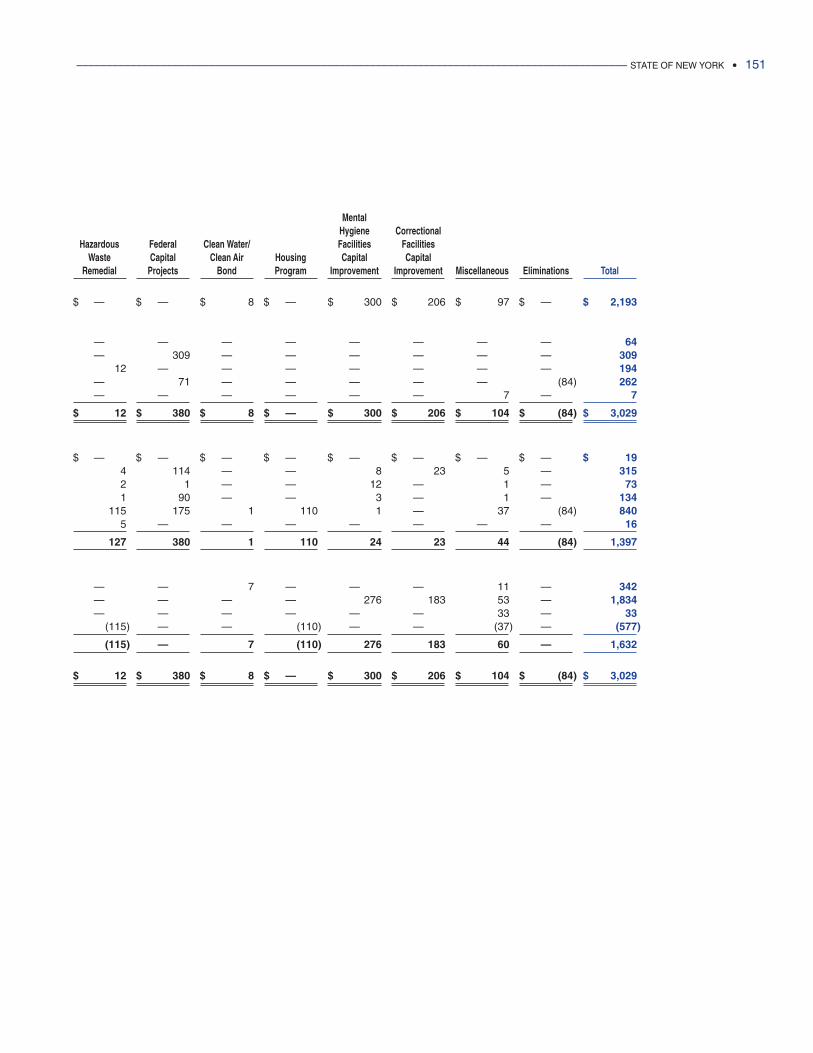
Mental Hygiene Correctional
Hazardous Federal Clean Water/ Facilities FacilitiesWaste Capital Clean Air Housing Capital Capital
Remedial Projects Bond Program Improvement Improvement Miscellaneous Eliminations Total
$ —0000 $ —0000 $ 8 $ —0000 $ 300 $ 206 $ 97 $ —0000 $ 2,193
—0000 —0000 —0000 —0000 —0000 —0000 —0000 —0000 64—0000 309 —0000 —0000 —0000 —0000 —0000 —0000 309
12 —0000 —0000 —0000 —0000 —0000 —0000 —0000 194—0000 71 —0000 —0000 —0000 —0000 —0000 (84) 262—0000 —0000 —0000 —0000 —0000 —0000 7 —0000 7
$ 12 $ 380 $ 8 $ —0000 $ 300 $ 206 $ 104 $ (84) $ 3,029
$ —0000 $ —0000 $ —0000 $ —0000 $ —0000 $ —0000 $ —0000 $ —0000 $ 194 114 —0000 —0000 8 23 5 —0000 3152 1 —0000 —0000 12 —0000 1 —0000 731 90 —0000 —0000 3 —0000 1 —0000 134
115 175 1 110 1 —0000 37 (84) 8405 —0000 —0000 —0000 —0000 —0000 —0000 —0000 16
127 380 1 110 24 23 44 (84) 1,397
—0000 —0000 7 —0000 —0000 —0000 11 —0000 342—0000 —0000 —0000 —0000 276 183 53 —0000 1,834—0000 —0000 —0000 —0000 —0000 —0000 33 —0000 33
(115) —0000 —0000 (110) —0000 —0000 (37) —0000 (577)
(115) —0000 7 (110) 276 183 60 —0000 1,632
$ 12 $ 380 $ 8 $ —0000 $ 300 $ 206 $ 104 $ (84) $ 3,029
____________________________________________________________________________________________ STATE OF NEW YORK • 151
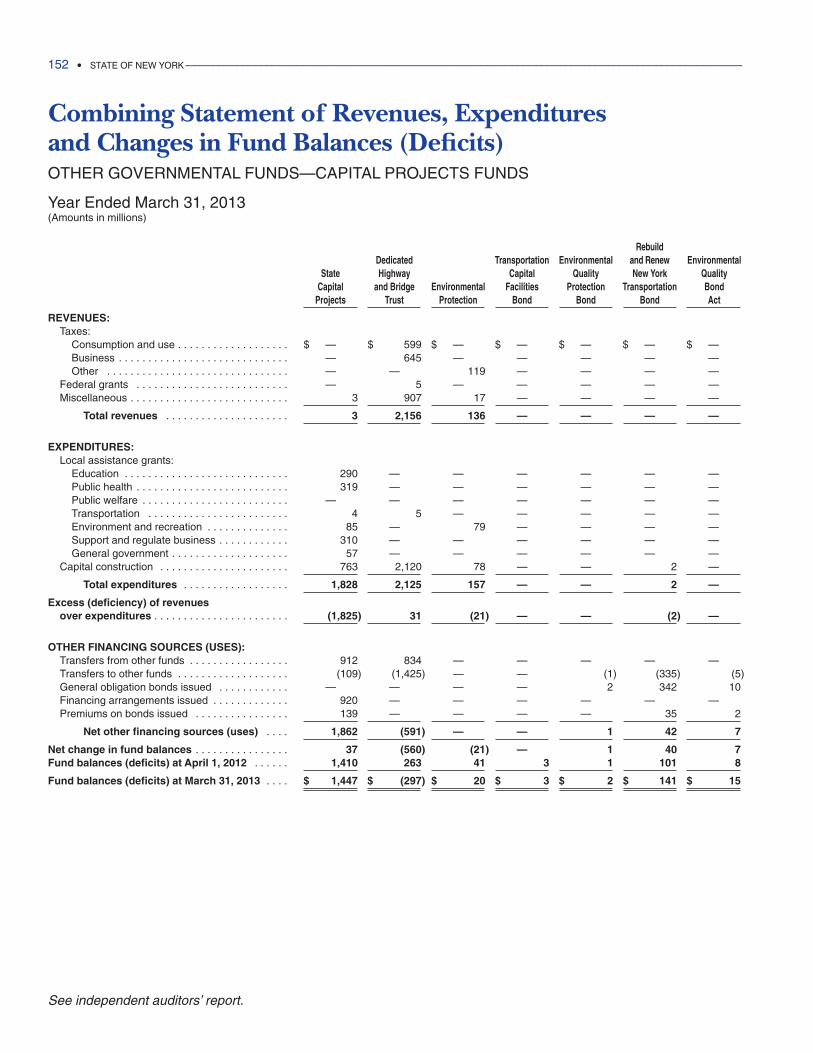
Combining Statement of Revenues, Expenditures and Changes in Fund Balances (Deficits)OTHER GOVERNMENTAL FUNDS—CAPITAL PROJECTS FUNDS
Year Ended March 31, 2013(Amounts in millions)
RebuildDedicated Transportation Environmental and Renew Environmental
State Highway Capital Quality New York QualityCapital and Bridge Environmental Facilities Protection Transportation Bond
Projects Trust Protection Bond Bond Bond Act
REVENUES:Taxes:
Consumption and use . . . . . . . . . . . . . . . . . . . $ —0000 $ 599 $ —0000 $ —0000 $ —0000 $ —0000 $ —0000Business . . . . . . . . . . . . . . . . . . . . . . . . . . . . . —0000 645 —0000 —0000 —0000 —0000 —0000Other . . . . . . . . . . . . . . . . . . . . . . . . . . . . . . . —0000 —0000 119 —0000 —0000 —0000 —0000
Federal grants . . . . . . . . . . . . . . . . . . . . . . . . . . —0000 5 —0000 —0000 —0000 —0000 —0000Miscellaneous . . . . . . . . . . . . . . . . . . . . . . . . . . . 3 907 17 —0000 —0000 —0000 —0000
Total revenues . . . . . . . . . . . . . . . . . . . . . 3 2,156 136 —0000 —0000 —0000 —0000
EXPENDITURES:Local assistance grants:
Education . . . . . . . . . . . . . . . . . . . . . . . . . . . . 290 —0000 —0000 —0000 —0000 —0000 —0000Public health . . . . . . . . . . . . . . . . . . . . . . . . . . 319 —0000 —0000 —0000 —0000 —0000 —0000Public welfare . . . . . . . . . . . . . . . . . . . . . . . . . —0000 —0000 —0000 —0000 —0000 —0000 —0000Transportation . . . . . . . . . . . . . . . . . . . . . . . . 4 5 —0000 —0000 —0000 —0000 —0000Environment and recreation . . . . . . . . . . . . . . 85 —0000 79 —0000 —0000 —0000 —0000Support and regulate business . . . . . . . . . . . . 310 —0000 —0000 —0000 —0000 —0000 —0000General government . . . . . . . . . . . . . . . . . . . . 57 —0000 —0000 —0000 —0000 —0000 —0000
Capital construction . . . . . . . . . . . . . . . . . . . . . . 763 2,120 78 —0000 —0000 2 —0000
Total expenditures . . . . . . . . . . . . . . . . . . 1,828 2,125 157 —0000 —0000 2 —0000
Excess (deficiency) of revenues over expenditures . . . . . . . . . . . . . . . . . . . . . . . (1,825) 31 (21) —0000 —0000 (2) —0000
OTHER FINANCING SOURCES (USES):Transfers from other funds . . . . . . . . . . . . . . . . . 912 834 —0000 —0000 —0000 —0000 —0000Transfers to other funds . . . . . . . . . . . . . . . . . . . (109) (1,425) —0000 —0000 (1) (335) (5)General obligation bonds issued . . . . . . . . . . . . —0000 —0000 —0000 —0000 2 342 10Financing arrangements issued . . . . . . . . . . . . . 920 —0000 —0000 —0000 —0000 —0000 —0000Premiums on bonds issued . . . . . . . . . . . . . . . . 139 —0000 —0000 —0000 —0000 35 2
Net other financing sources (uses) . . . . 1,862 (591) —0000 —0000 1 42 7
Net change in fund balances . . . . . . . . . . . . . . . . 37 (560) (21) —0000 1 40 7Fund balances (deficits) at April 1, 2012 . . . . . . 1,410 263 41 3 1 101 8
Fund balances (deficits) at March 31, 2013 . . . . $ 1,447 $ (297) $ 20 $ 3 $ 2 $ 141 $ 15
152 • STATE OF NEW YORK _____________________________________________________________________________________________
See independent auditors’ report.
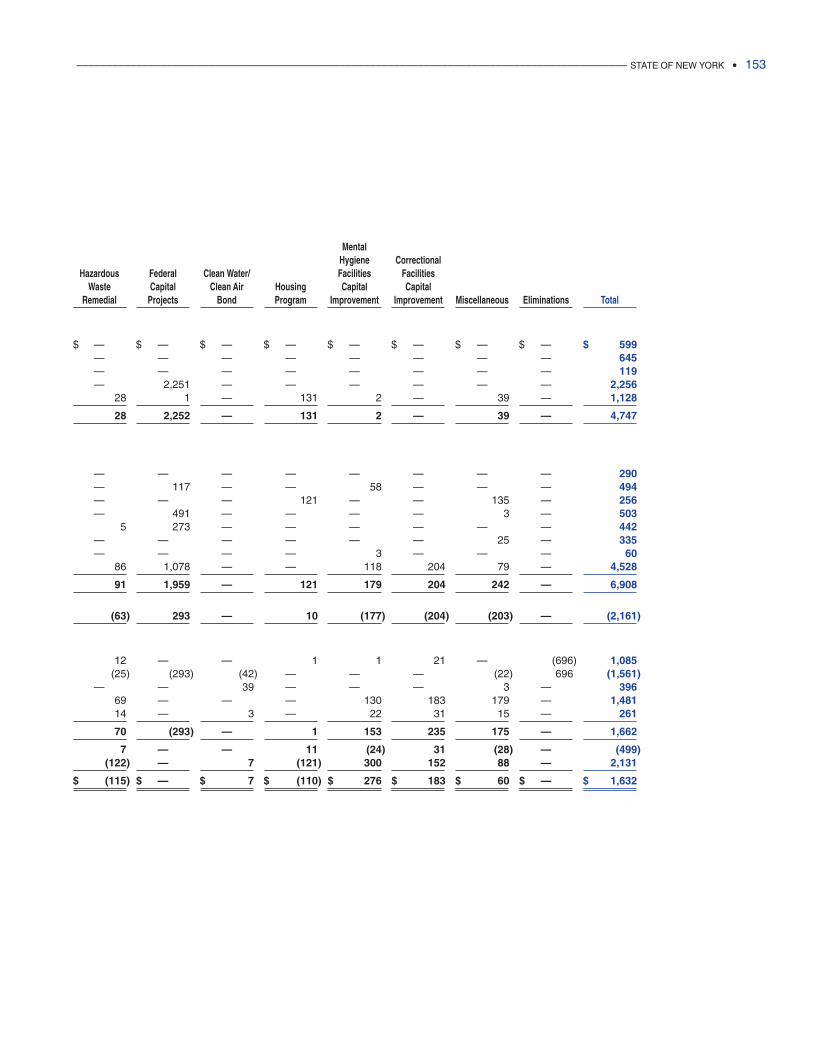
Mental Hygiene Correctional
Hazardous Federal Clean Water/ Facilities FacilitiesWaste Capital Clean Air Housing Capital Capital
Remedial Projects Bond Program Improvement Improvement Miscellaneous Eliminations Total
$ —0000 $ —0000 $ —0000 $ —0000 $ —0000 $ —0000 $ —0000 $ —0000 $ 599—0000 —0000 —0000 —0000 —0000 —0000 —0000 —0000 645—0000 —0000 —0000 —0000 —0000 —0000 —0000 —0000 119—0000 2,251 —0000 —0000 —0000 —0000 —0000 —0000 2,256
28 1 —0000 131 2 —0000 39 —0000 1,128
28 2,252 —0000 131 2 —0000 39 —0000 4,747
—0000 —0000 —0000 —0000 —0000 —0000 —0000 —0000 290—0000 117 —0000 —0000 58 —0000 —0000 —0000 494—0000 —0000 —0000 121 —0000 —0000 135 —0000 256—0000 491 —0000 —0000 —0000 —0000 3 —0000 503
5 273 —0000 —0000 —0000 —0000 —0000 —0000 442—0000 —0000 —0000 —0000 —0000 —0000 25 —0000 335—0000 —0000 —0000 —0000 3 —0000 —0000 —0000 60
86 1,078 —0000 —0000 118 204 79 —0000 4,528
91 1,959 —0000 121 179 204 242 —0000 6,908
(63) 293 —0000 10 (177) (204) (203) —0000 (2,161)
12 —0000 —0000 1 1 21 —0000 (696) 1,085(25) (293) (42) —0000 —0000 —0000 (22) 696 (1,561)
—0000 —0000 39 —0000 —0000 —0000 3 —0000 39669 —0000 —0000 —0000 130 183 179 —0000 1,48114 —0000 3 —0000 22 31 15 —0000 261
70 (293) —0000 1 153 235 175 —0000 1,662
7 —0000 —0000 11 (24) 31 (28) —0000 (499)(122) —0000 7 (121) 300 152 88 —0000 2,131
$ (115) $ —0000 $ 7 $ (110) $ 276 $ 183 $ 60 $ —0000 $ 1,632
____________________________________________________________________________________________ STATE OF NEW YORK • 153
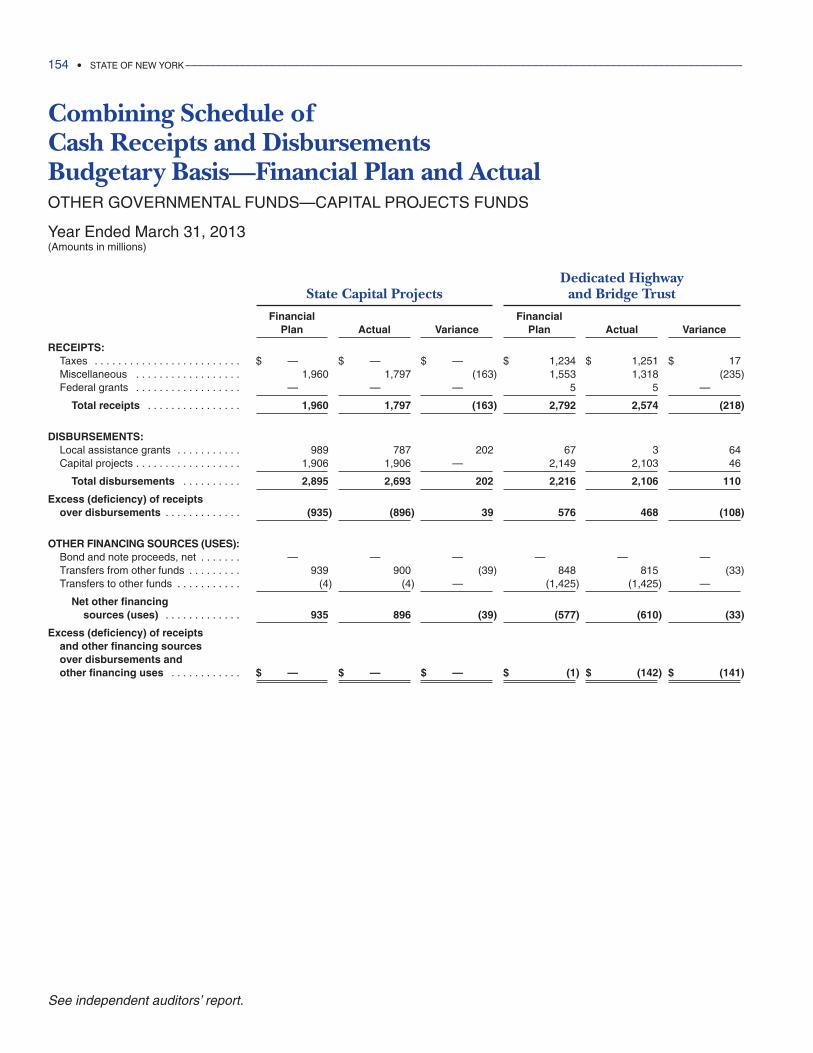
Combining Schedule of Cash Receipts and Disbursements Budgetary Basis—Financial Plan and ActualOTHER GOVERNMENTAL FUNDS—CAPITAL PROJECTS FUNDS
Year Ended March 31, 2013(Amounts in millions)
Dedicated Highway State Capital Projects and Bridge Trust
Financial FinancialPlan Actual Variance Plan Actual Variance
RECEIPTS:Taxes . . . . . . . . . . . . . . . . . . . . . . . . . $ —00000 $ —00000 $ —00000 $ 1,234 $ 1,251 $ 17Miscellaneous . . . . . . . . . . . . . . . . . . 1,960 1,797 (163) 1,553 1,318 (235)Federal grants . . . . . . . . . . . . . . . . . . —00000 —00000 —00000 5 5 —00000
Total receipts . . . . . . . . . . . . . . . . 1,960 1,797 (163) 2,792 2,574 (218)
DISBURSEMENTS:Local assistance grants . . . . . . . . . . . 989 787 202 67 3 64Capital projects . . . . . . . . . . . . . . . . . . 1,906 1,906 —00000 2,149 2,103 46
Total disbursements . . . . . . . . . . 2,895 2,693 202 2,216 2,106 110
Excess (deficiency) of receiptsover disbursements . . . . . . . . . . . . . (935) (896) 39 576 468 (108)
OTHER FINANCING SOURCES (USES):Bond and note proceeds, net . . . . . . . —00000 —00000 —00000 —00000 —00000 —00000Transfers from other funds . . . . . . . . . 939 900 (39) 848 815 (33)Transfers to other funds . . . . . . . . . . . (4) (4) —00000 (1,425) (1,425) —00000
Net other financing sources (uses) . . . . . . . . . . . . . 935 896 (39) (577) (610) (33)
Excess (deficiency) of receipts and other financing sources over disbursements and other financing uses . . . . . . . . . . . . $ —00000 $ —00000 $ —00000 $ (1) $ (142) $ (141)
154 • STATE OF NEW YORK _____________________________________________________________________________________________
See independent auditors’ report.
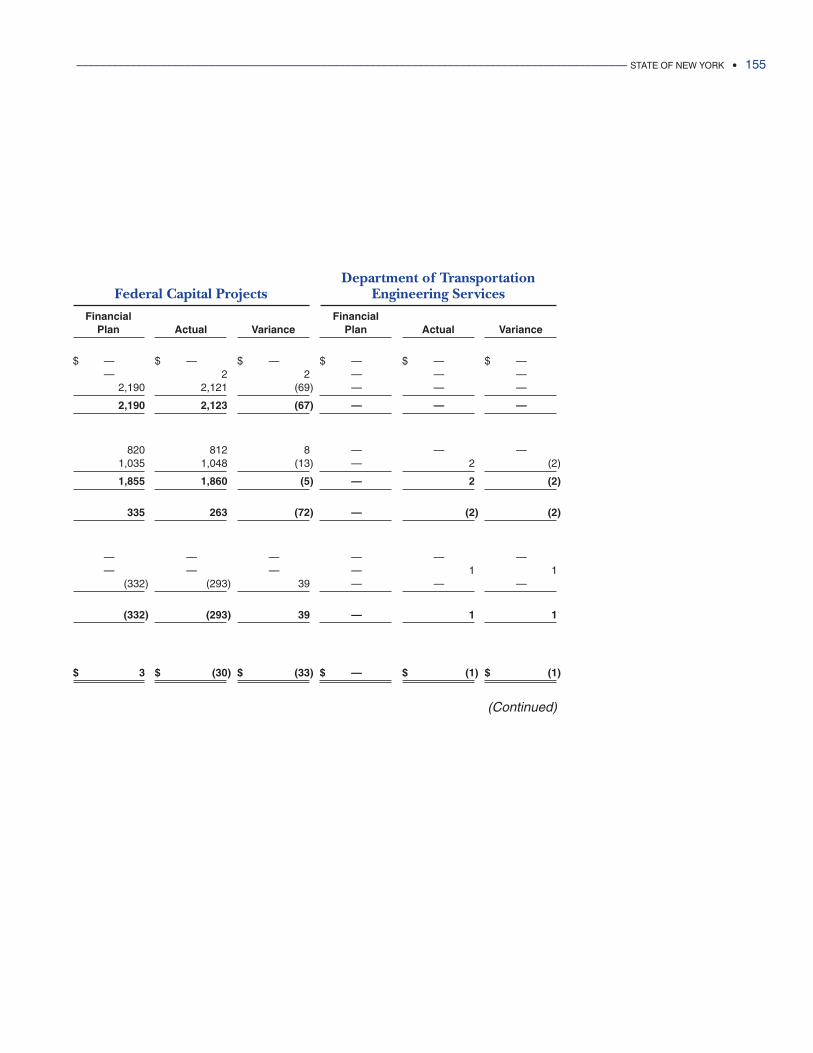
Department of TransportationFederal Capital Projects Engineering Services
Financial FinancialPlan Actual Variance Plan Actual Variance
$ —00000 $ —00000 $ —00000 $ —00000 $ —00000 $ —00000—00000 2 2 —00000 —00000 —00000
2,190 2,121 (69) —00000 —00000 —00000
2,190 2,123 (67) —00000 —00000 —00000
820 812 8 —00000 —00000 —000001,035 1,048 (13) —00000 2 (2)
1,855 1,860 (5) —00000 2 (2)
335 263 (72) —00000 (2) (2)
—00000 —00000 —00000 —00000 —00000 —00000—00000 —00000 —00000 —00000 1 1
(332) (293) 39 —00000 —00000 —00000
(332) (293) 39 —00000 1 1
$ 3 $ (30) $ (33) $ —00000 $ (1) $ (1)
(Continued)
____________________________________________________________________________________________ STATE OF NEW YORK • 155
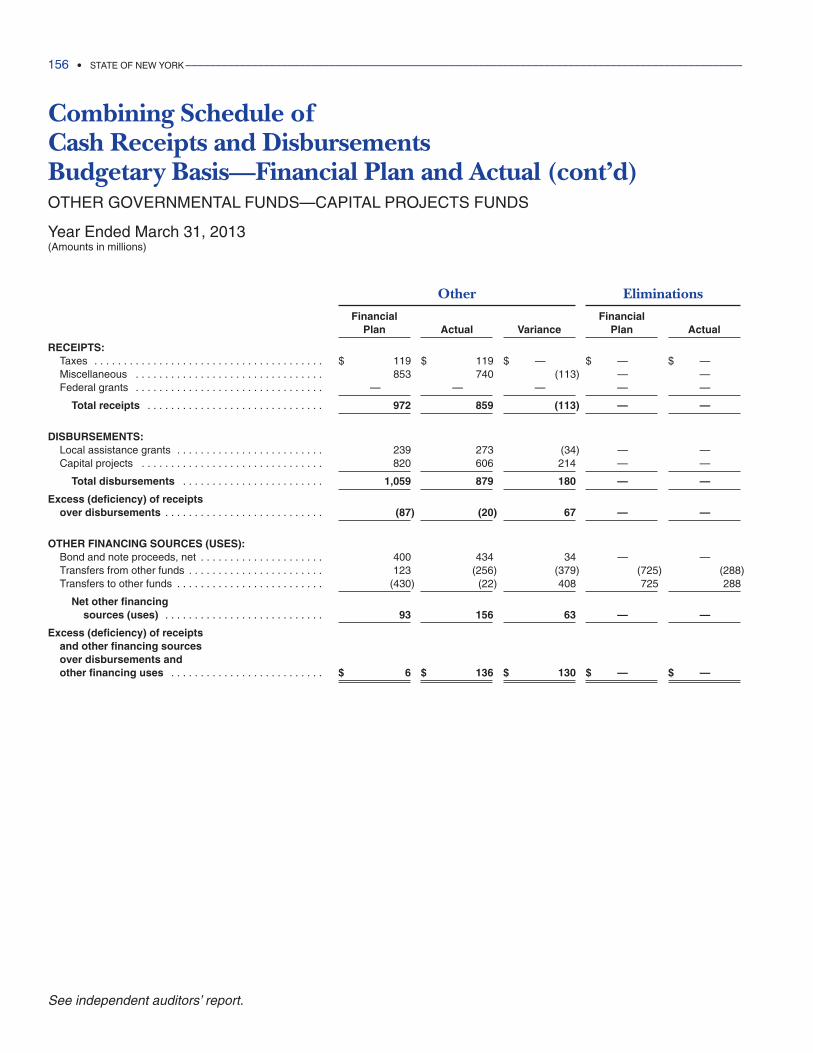
Combining Schedule of Cash Receipts and Disbursements Budgetary Basis—Financial Plan and Actual (cont’d)OTHER GOVERNMENTAL FUNDS—CAPITAL PROJECTS FUNDS
Year Ended March 31, 2013(Amounts in millions)
Other Eliminations
Financial FinancialPlan Actual Variance Plan Actual
RECEIPTS:Taxes . . . . . . . . . . . . . . . . . . . . . . . . . . . . . . . . . . . . . . . $ 119 $ 119 $ —00000 $ —00000 $ —00000Miscellaneous . . . . . . . . . . . . . . . . . . . . . . . . . . . . . . . . 853 740 (113) —00000 —00000Federal grants . . . . . . . . . . . . . . . . . . . . . . . . . . . . . . . . —00000 —00000 —00000 —00000 —00000
Total receipts . . . . . . . . . . . . . . . . . . . . . . . . . . . . . . 972 859 (113) —00000 —00000
DISBURSEMENTS:Local assistance grants . . . . . . . . . . . . . . . . . . . . . . . . . 239 273 (34) —00000 —00000Capital projects . . . . . . . . . . . . . . . . . . . . . . . . . . . . . . . 820 606 214 —00000 —00000
Total disbursements . . . . . . . . . . . . . . . . . . . . . . . . 1,059 879 180 —00000 —00000
Excess (deficiency) of receiptsover disbursements . . . . . . . . . . . . . . . . . . . . . . . . . . . (87) (20) 67 —00000 —00000
OTHER FINANCING SOURCES (USES):Bond and note proceeds, net . . . . . . . . . . . . . . . . . . . . . 400 434 34 —00000 —00000Transfers from other funds . . . . . . . . . . . . . . . . . . . . . . . 123 (256) (379) (725) (288)Transfers to other funds . . . . . . . . . . . . . . . . . . . . . . . . . (430) (22) 408 725 288
Net other financing sources (uses) . . . . . . . . . . . . . . . . . . . . . . . . . . . 93 156 63 —00000 —00000
Excess (deficiency) of receipts and other financing sources over disbursements and other financing uses . . . . . . . . . . . . . . . . . . . . . . . . . . $ 6 $ 136 $ 130 $ —00000 $ —00000
156 • STATE OF NEW YORK _____________________________________________________________________________________________
See independent auditors’ report.
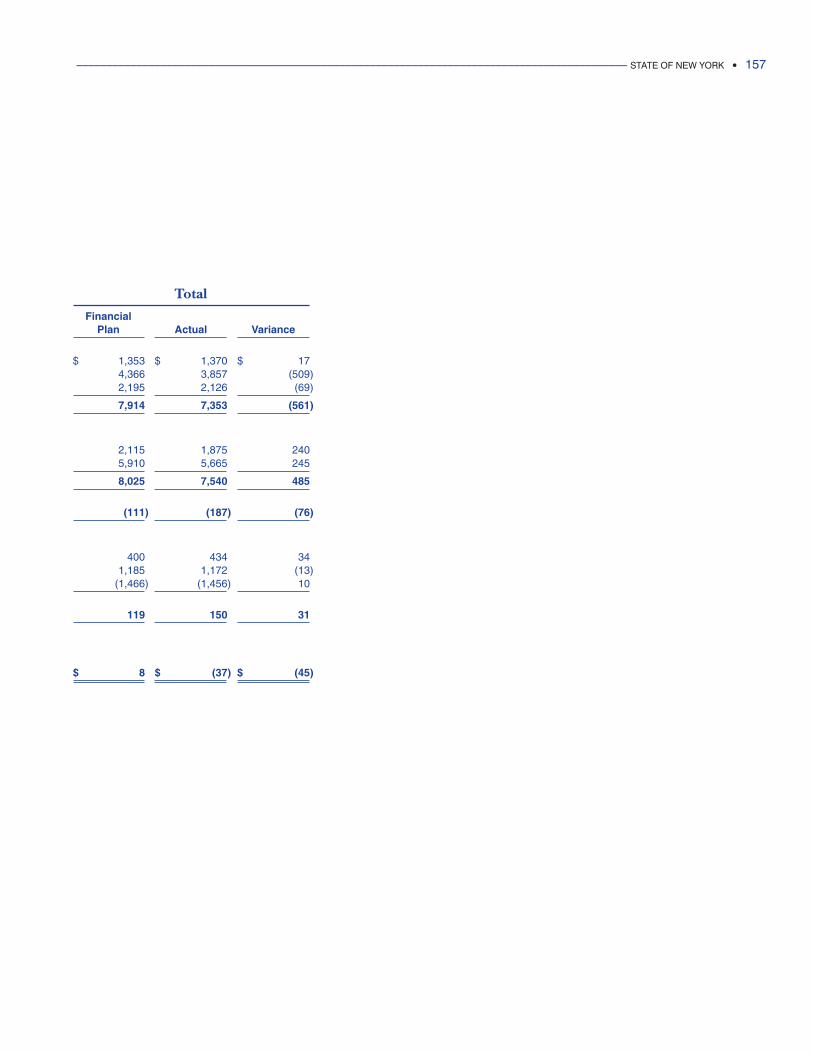
Total
FinancialPlan Actual Variance
$ 1,353 $ 1,370 $ 174,366 3,857 (509)2,195 2,126 (69)
7,914 7,353 (561)
2,115 1,875 2405,910 5,665 245
8,025 7,540 485
(111) (187) (76)
400 434 341,185 1,172 (13)
(1,466) (1,456) 10
119 150 31
$ 8 $ (37) $ (45)
____________________________________________________________________________________________ STATE OF NEW YORK • 157

Fiduciary Funds are used to account for assets held by the State in a fiduciarycapacity or as agent for individuals, private organizations or other governments andinclude Private Purpose Trust Funds, the State and Local Retirement SystemFund and Agency Funds.
Private Purpose Trust Funds:Agriculture and Milk Producers’ Security Funds—to provide security to agricultureand milk producers against loss of revenues.
Abandoned Property Fund—accounts for assets from banks, utilities, investmentcompanies, and insurance companies representing inactive accounts that arerequired by law to be turned over to the State. The Comptroller is custodian of thisaccount. Assets are returned to the proper owner upon approval of a claim.
Tuition Savings Program Fund—accounts for contributions made by individuals andfamilies for college savings. The withdrawals from the Fund are used to pay collegecosts at any eligible public and private college and university in New York State.
Agency Funds:Employee Benefit and Payroll Related Funds—accounts for various employeebenefit programs, such as the New York State employee health insurance programs,for the disposition of various payroll related deductions, such as for social securitycontributions.
MMIS Statewide Escrow Fund—accounts for the transfer from other funds of theFederal, State, and local shares of Medicaid program expenditures to a paying agentfor ultimate payment to health care providers.
Other Agency Funds—account for various escrow, revenue collection and agencyaccounts for which the State acts in an agent’s capacity until proper disposition ofthe assets can be made. This includes accounting for advances from the State forpaying CUNY operating costs.
Fiduciary Funds
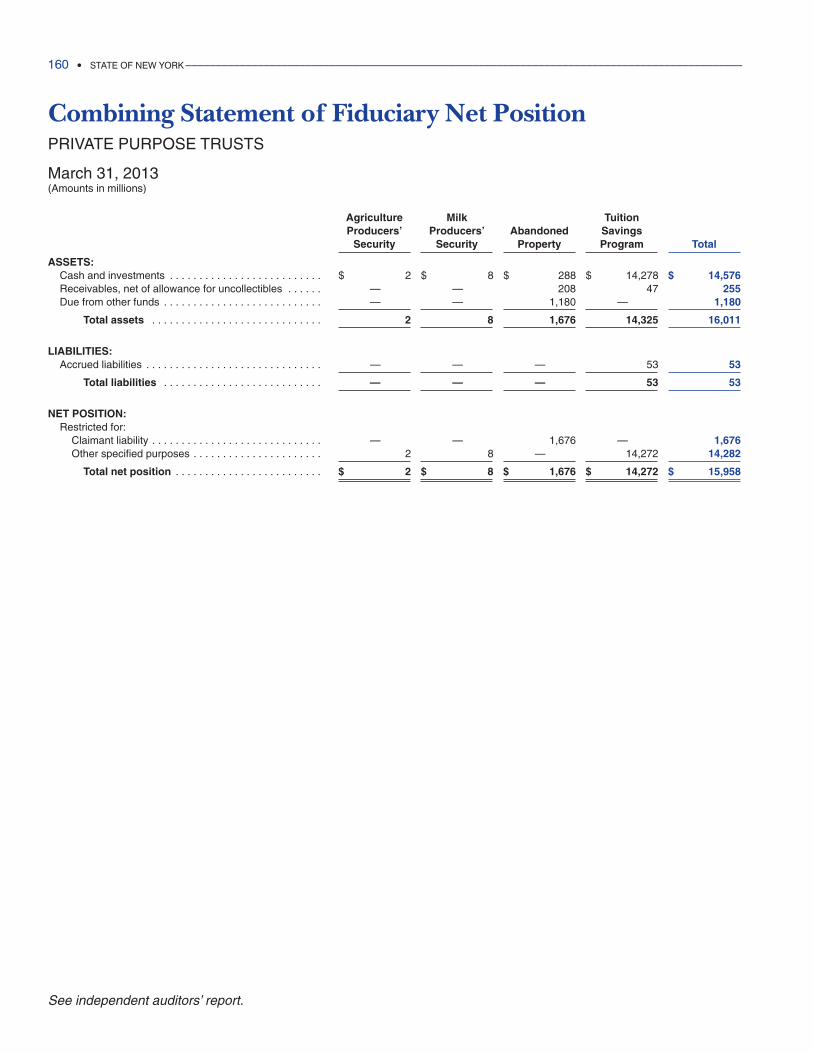
Combining Statement of Fiduciary Net PositionPRIVATE PURPOSE TRUSTS
March 31, 2013(Amounts in millions)
Agriculture Milk TuitionProducers’ Producers’ Abandoned Savings
Security Security Property Program Total
ASSETS:Cash and investments . . . . . . . . . . . . . . . . . . . . . . . . . . $ 2 $ 8 $ 288 $ 14,278 $ 14,576Receivables, net of allowance for uncollectibles . . . . . . —00000 —00000 208 47 255Due from other funds . . . . . . . . . . . . . . . . . . . . . . . . . . . —00000 —00000 1,180 —00000 1,180
Total assets . . . . . . . . . . . . . . . . . . . . . . . . . . . . . 2 8 1,676 14,325 16,011
LIABILITIES:Accrued liabilities . . . . . . . . . . . . . . . . . . . . . . . . . . . . . . —00000 —00000 —00000 53 53
Total liabilities . . . . . . . . . . . . . . . . . . . . . . . . . . . —00000 —00000 —00000 53 53
NET POSITION:Restricted for:
Claimant liability . . . . . . . . . . . . . . . . . . . . . . . . . . . . . —00000 —00000 1,676 —00000 1,676Other specified purposes . . . . . . . . . . . . . . . . . . . . . . 2 8 —00000 14,272 14,282
Total net position . . . . . . . . . . . . . . . . . . . . . . . . . $ 2 $ 8 $ 1,676 $ 14,272 $ 15,958
160 • STATE OF NEW YORK _____________________________________________________________________________________________
See independent auditors’ report.
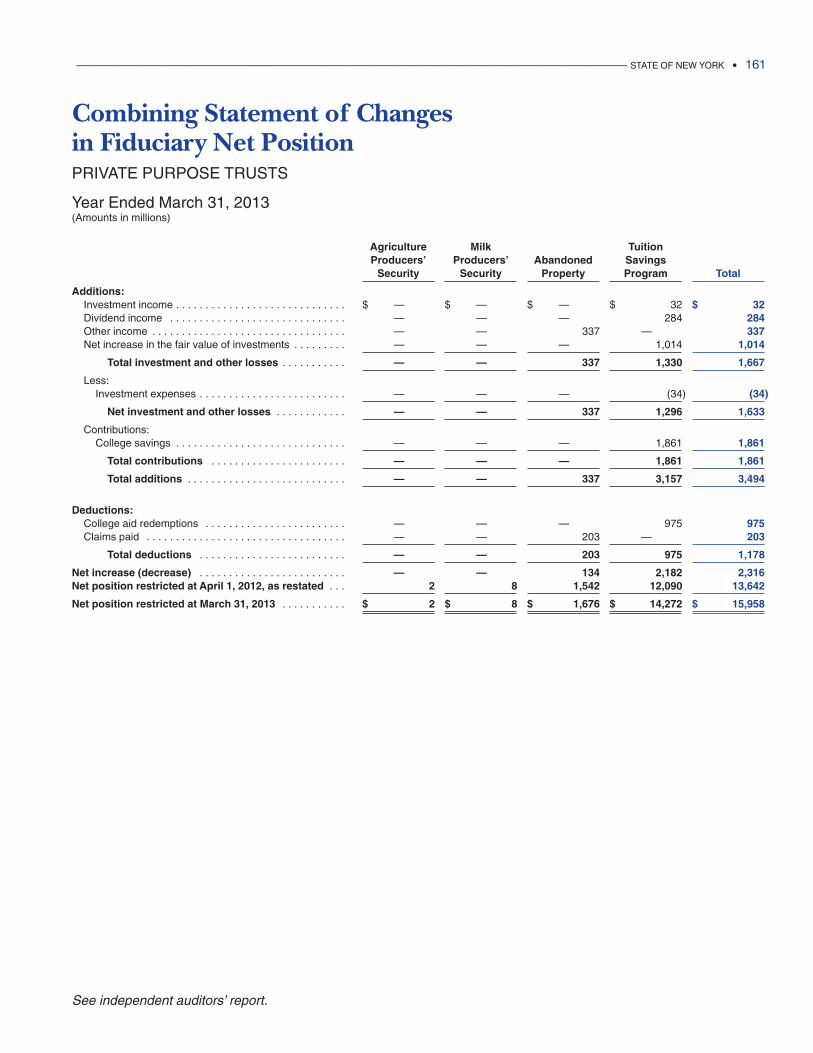
Combining Statement of Changes in Fiduciary Net PositionPRIVATE PURPOSE TRUSTS
Year Ended March 31, 2013(Amounts in millions)
Agriculture Milk TuitionProducers’ Producers’ Abandoned Savings
Security Security Property Program Total
Additions:Investment income . . . . . . . . . . . . . . . . . . . . . . . . . . . . . $ —00000 $ —00000 $ —00000 $ 32 $ 32Dividend income . . . . . . . . . . . . . . . . . . . . . . . . . . . . . . —00000 —00000 —00000 284 284Other income . . . . . . . . . . . . . . . . . . . . . . . . . . . . . . . . . —00000 —00000 337 —00000 337Net increase in the fair value of investments . . . . . . . . . —00000 —00000 —00000 1,014 1,014
Total investment and other losses . . . . . . . . . . . —00000 —00000 337 1,330 1,667
Less:Investment expenses . . . . . . . . . . . . . . . . . . . . . . . . . —00000 —00000 —00000 (34) (34)
Net investment and other losses . . . . . . . . . . . . —00000 —00000 337 1,296 1,633
Contributions:College savings . . . . . . . . . . . . . . . . . . . . . . . . . . . . . —00000 —00000 —00000 1,861 1,861
Total contributions . . . . . . . . . . . . . . . . . . . . . . . —00000 —00000 —00000 1,861 1,861
Total additions . . . . . . . . . . . . . . . . . . . . . . . . . . . —00000 —00000 337 3,157 3,494
Deductions:College aid redemptions . . . . . . . . . . . . . . . . . . . . . . . . —00000 —00000 —00000 975 975Claims paid . . . . . . . . . . . . . . . . . . . . . . . . . . . . . . . . . . —00000 —00000 203 —00000 203
Total deductions . . . . . . . . . . . . . . . . . . . . . . . . . —00000 —00000 203 975 1,178
Net increase (decrease) . . . . . . . . . . . . . . . . . . . . . . . . . —00000 —00000 134 2,182 2,316Net position restricted at April 1, 2012, as restated . . . 2 8 1,542 12,090 13,642
Net position restricted at March 31, 2013 . . . . . . . . . . . $ 2 $ 8 $ 1,676 $ 14,272 $ 15,958
____________________________________________________________________________________________ STATE OF NEW YORK • 161
See independent auditors’ report.
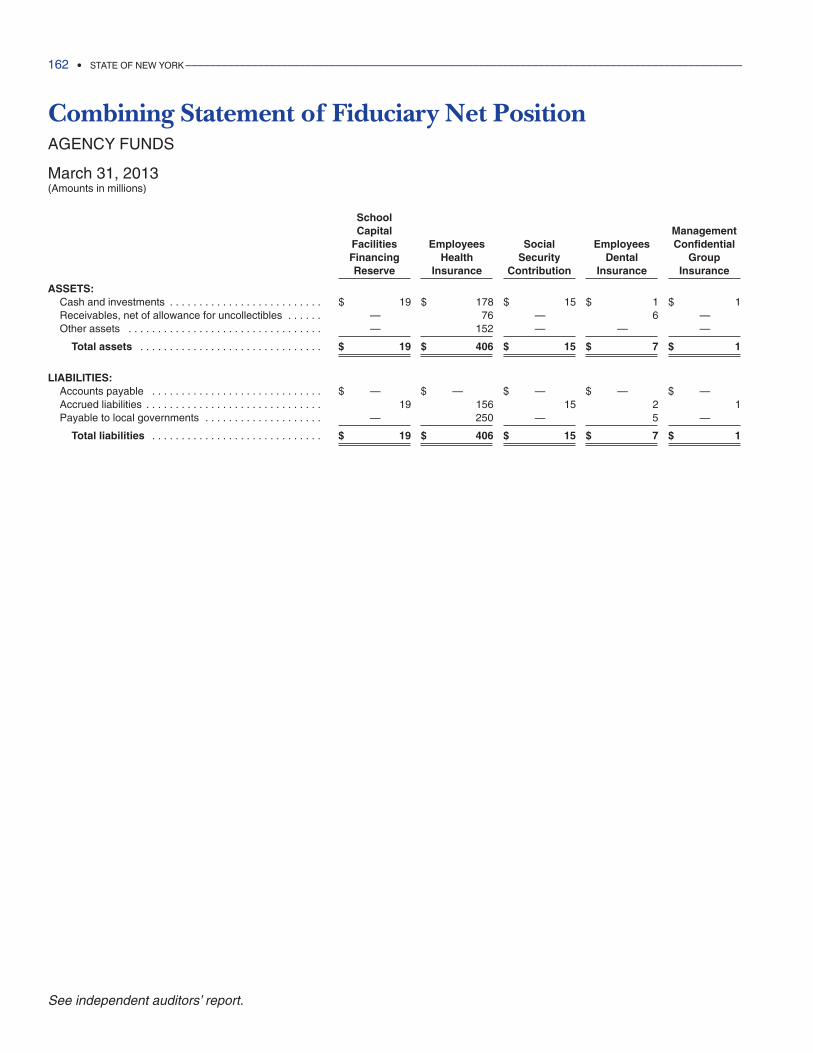
Combining Statement of Fiduciary Net PositionAGENCY FUNDS
March 31, 2013(Amounts in millions)
SchoolCapital Management
Facilities Employees Social Employees ConfidentialFinancing Health Security Dental GroupReserve Insurance Contribution Insurance Insurance
ASSETS:Cash and investments . . . . . . . . . . . . . . . . . . . . . . . . . . $ 19 $ 178 $ 15 $ 1 $ 1Receivables, net of allowance for uncollectibles . . . . . . —00000 76 —00000 6 —00000Other assets . . . . . . . . . . . . . . . . . . . . . . . . . . . . . . . . . —00000 152 —00000 —00000 —00000
Total assets . . . . . . . . . . . . . . . . . . . . . . . . . . . . . . . $ 19 $ 406 $ 15 $ 7 $ 1
LIABILITIES:Accounts payable . . . . . . . . . . . . . . . . . . . . . . . . . . . . . $ —00000 $ —00000 $ —00000 $ —00000 $ —00000Accrued liabilities . . . . . . . . . . . . . . . . . . . . . . . . . . . . . . 19 156 15 2 1Payable to local governments . . . . . . . . . . . . . . . . . . . . —00000 250 —00000 5 —00000
Total liabilities . . . . . . . . . . . . . . . . . . . . . . . . . . . . . $ 19 $ 406 $ 15 $ 7 $ 1
162 • STATE OF NEW YORK _____________________________________________________________________________________________
See independent auditors’ report.
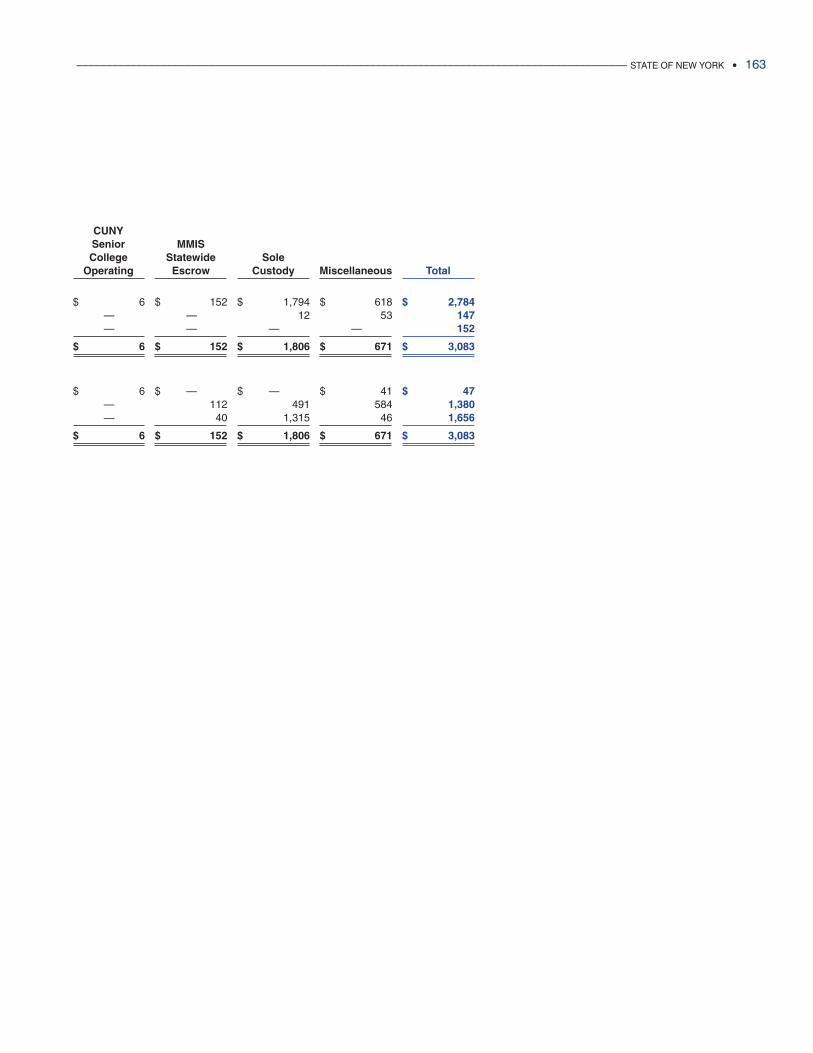
CUNYSenior MMISCollege Statewide Sole
Operating Escrow Custody Miscellaneous Total
$ 6 $ 152 $ 1,794 $ 618 $ 2,784—00000 —00000 12 53 147—00000 —00000 —00000 —00000 152
$ 6 $ 152 $ 1,806 $ 671 $ 3,083
$ 6 $ —00000 $ —00000 $ 41 $ 47—00000 112 491 584 1,380—00000 40 1,315 46 1,656
$ 6 $ 152 $ 1,806 $ 671 $ 3,083
____________________________________________________________________________________________ STATE OF NEW YORK • 163
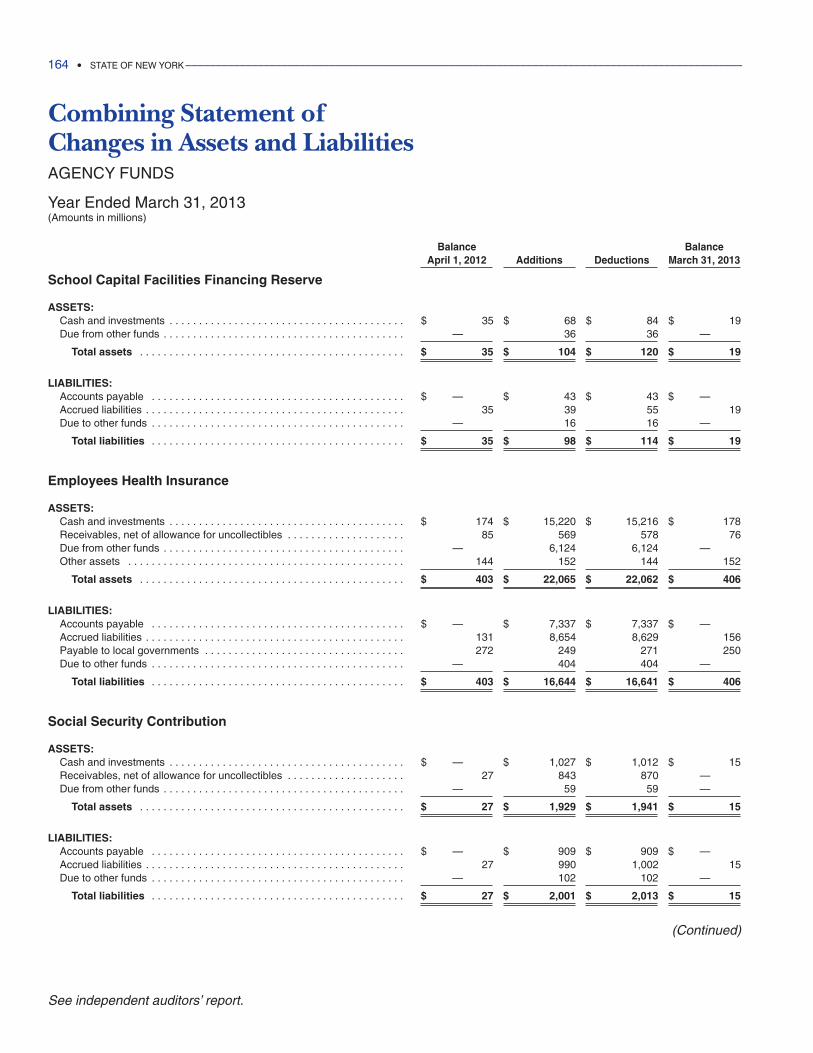
Combining Statement of Changes in Assets and LiabilitiesAGENCY FUNDS
Year Ended March 31, 2013(Amounts in millions)
Balance BalanceApril 1, 2012 Additions Deductions March 31, 2013
School Capital Facilities Financing Reserve
ASSETS:Cash and investments . . . . . . . . . . . . . . . . . . . . . . . . . . . . . . . . . . . . . . . . $ 35 $ 68 $ 84 $ 19Due from other funds . . . . . . . . . . . . . . . . . . . . . . . . . . . . . . . . . . . . . . . . . —00000 36 36 —00000
Total assets . . . . . . . . . . . . . . . . . . . . . . . . . . . . . . . . . . . . . . . . . . . . . $ 35 $ 104 $ 120 $ 19
LIABILITIES:Accounts payable . . . . . . . . . . . . . . . . . . . . . . . . . . . . . . . . . . . . . . . . . . . $ —00000 $ 43 $ 43 $ —00000Accrued liabilities . . . . . . . . . . . . . . . . . . . . . . . . . . . . . . . . . . . . . . . . . . . . 35 39 55 19Due to other funds . . . . . . . . . . . . . . . . . . . . . . . . . . . . . . . . . . . . . . . . . . . —00000 16 16 —00000
Total liabilities . . . . . . . . . . . . . . . . . . . . . . . . . . . . . . . . . . . . . . . . . . . $ 35 $ 98 $ 114 $ 19
Employees Health Insurance
ASSETS:Cash and investments . . . . . . . . . . . . . . . . . . . . . . . . . . . . . . . . . . . . . . . . $ 174 $ 15,220 $ 15,216 $ 178Receivables, net of allowance for uncollectibles . . . . . . . . . . . . . . . . . . . . 85 569 578 76Due from other funds . . . . . . . . . . . . . . . . . . . . . . . . . . . . . . . . . . . . . . . . . —00000 6,124 6,124 —00000Other assets . . . . . . . . . . . . . . . . . . . . . . . . . . . . . . . . . . . . . . . . . . . . . . . 144 152 144 152
Total assets . . . . . . . . . . . . . . . . . . . . . . . . . . . . . . . . . . . . . . . . . . . . . $ 403 $ 22,065 $ 22,062 $ 406
LIABILITIES:Accounts payable . . . . . . . . . . . . . . . . . . . . . . . . . . . . . . . . . . . . . . . . . . . $ —00000 $ 7,337 $ 7,337 $ —00000Accrued liabilities . . . . . . . . . . . . . . . . . . . . . . . . . . . . . . . . . . . . . . . . . . . . 131 8,654 8,629 156Payable to local governments . . . . . . . . . . . . . . . . . . . . . . . . . . . . . . . . . . 272 249 271 250Due to other funds . . . . . . . . . . . . . . . . . . . . . . . . . . . . . . . . . . . . . . . . . . . —00000 404 404 —00000
Total liabilities . . . . . . . . . . . . . . . . . . . . . . . . . . . . . . . . . . . . . . . . . . . $ 403 $ 16,644 $ 16,641 $ 406
Social Security Contribution
ASSETS:Cash and investments . . . . . . . . . . . . . . . . . . . . . . . . . . . . . . . . . . . . . . . . $ —00000 $ 1,027 $ 1,012 $ 15Receivables, net of allowance for uncollectibles . . . . . . . . . . . . . . . . . . . . 27 843 870 —00000Due from other funds . . . . . . . . . . . . . . . . . . . . . . . . . . . . . . . . . . . . . . . . . —00000 59 59 —00000
Total assets . . . . . . . . . . . . . . . . . . . . . . . . . . . . . . . . . . . . . . . . . . . . . $ 27 $ 1,929 $ 1,941 $ 15
LIABILITIES:Accounts payable . . . . . . . . . . . . . . . . . . . . . . . . . . . . . . . . . . . . . . . . . . . $ —00000 $ 909 $ 909 $ —00000Accrued liabilities . . . . . . . . . . . . . . . . . . . . . . . . . . . . . . . . . . . . . . . . . . . . 27 990 1,002 15Due to other funds . . . . . . . . . . . . . . . . . . . . . . . . . . . . . . . . . . . . . . . . . . . —00000 102 102 —00000
Total liabilities . . . . . . . . . . . . . . . . . . . . . . . . . . . . . . . . . . . . . . . . . . . $ 27 $ 2,001 $ 2,013 $ 15
(Continued)
164 • STATE OF NEW YORK _____________________________________________________________________________________________
See independent auditors’ report.
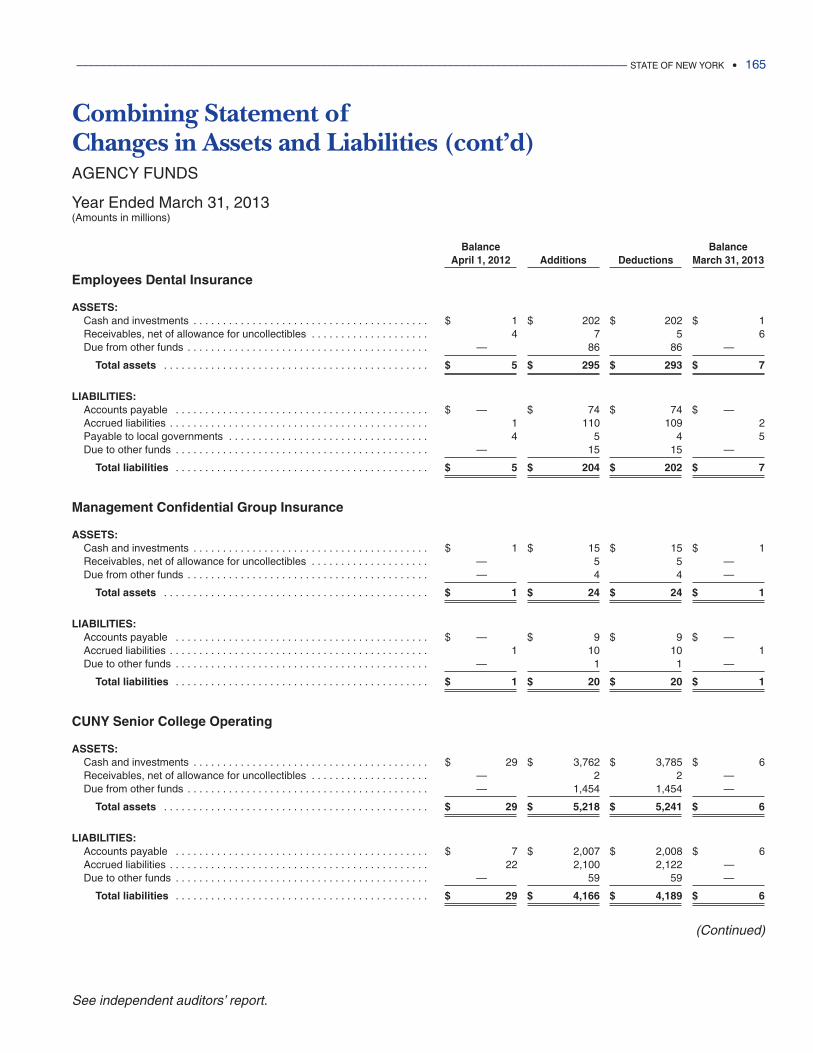
Combining Statement of Changes in Assets and Liabilities (cont’d)AGENCY FUNDS
Year Ended March 31, 2013(Amounts in millions)
Balance BalanceApril 1, 2012 Additions Deductions March 31, 2013
Employees Dental Insurance
ASSETS:Cash and investments . . . . . . . . . . . . . . . . . . . . . . . . . . . . . . . . . . . . . . . . $ 1 $ 202 $ 202 $ 1Receivables, net of allowance for uncollectibles . . . . . . . . . . . . . . . . . . . . 4 7 5 6Due from other funds . . . . . . . . . . . . . . . . . . . . . . . . . . . . . . . . . . . . . . . . . —00000 86 86 —00000
Total assets . . . . . . . . . . . . . . . . . . . . . . . . . . . . . . . . . . . . . . . . . . . . . $ 5 $ 295 $ 293 $ 7
LIABILITIES:Accounts payable . . . . . . . . . . . . . . . . . . . . . . . . . . . . . . . . . . . . . . . . . . . $ —00000 $ 74 $ 74 $ —00000Accrued liabilities . . . . . . . . . . . . . . . . . . . . . . . . . . . . . . . . . . . . . . . . . . . . 1 110 109 2Payable to local governments . . . . . . . . . . . . . . . . . . . . . . . . . . . . . . . . . . 4 5 4 5Due to other funds . . . . . . . . . . . . . . . . . . . . . . . . . . . . . . . . . . . . . . . . . . . —00000 15 15 —00000
Total liabilities . . . . . . . . . . . . . . . . . . . . . . . . . . . . . . . . . . . . . . . . . . . $ 5 $ 204 $ 202 $ 7
Management Confidential Group Insurance
ASSETS:Cash and investments . . . . . . . . . . . . . . . . . . . . . . . . . . . . . . . . . . . . . . . . $ 1 $ 15 $ 15 $ 1Receivables, net of allowance for uncollectibles . . . . . . . . . . . . . . . . . . . . —00000 5 5 —00000Due from other funds . . . . . . . . . . . . . . . . . . . . . . . . . . . . . . . . . . . . . . . . . —00000 4 4 —00000
Total assets . . . . . . . . . . . . . . . . . . . . . . . . . . . . . . . . . . . . . . . . . . . . . $ 1 $ 24 $ 24 $ 1
LIABILITIES:Accounts payable . . . . . . . . . . . . . . . . . . . . . . . . . . . . . . . . . . . . . . . . . . . $ —00000 $ 9 $ 9 $ —00000Accrued liabilities . . . . . . . . . . . . . . . . . . . . . . . . . . . . . . . . . . . . . . . . . . . . 1 10 10 1Due to other funds . . . . . . . . . . . . . . . . . . . . . . . . . . . . . . . . . . . . . . . . . . . —00000 1 1 —00000
Total liabilities . . . . . . . . . . . . . . . . . . . . . . . . . . . . . . . . . . . . . . . . . . . $ 1 $ 20 $ 20 $ 1
CUNY Senior College Operating
ASSETS:Cash and investments . . . . . . . . . . . . . . . . . . . . . . . . . . . . . . . . . . . . . . . . $ 29 $ 3,762 $ 3,785 $ 6Receivables, net of allowance for uncollectibles . . . . . . . . . . . . . . . . . . . . —00000 2 2 —00000Due from other funds . . . . . . . . . . . . . . . . . . . . . . . . . . . . . . . . . . . . . . . . . —00000 1,454 1,454 —00000
Total assets . . . . . . . . . . . . . . . . . . . . . . . . . . . . . . . . . . . . . . . . . . . . . $ 29 $ 5,218 $ 5,241 $ 6
LIABILITIES:Accounts payable . . . . . . . . . . . . . . . . . . . . . . . . . . . . . . . . . . . . . . . . . . . $ 7 $ 2,007 $ 2,008 $ 6Accrued liabilities . . . . . . . . . . . . . . . . . . . . . . . . . . . . . . . . . . . . . . . . . . . . 22 2,100 2,122 —00000Due to other funds . . . . . . . . . . . . . . . . . . . . . . . . . . . . . . . . . . . . . . . . . . . —00000 59 59 —00000
Total liabilities . . . . . . . . . . . . . . . . . . . . . . . . . . . . . . . . . . . . . . . . . . . $ 29 $ 4,166 $ 4,189 $ 6
(Continued)
____________________________________________________________________________________________ STATE OF NEW YORK • 165
See independent auditors’ report.
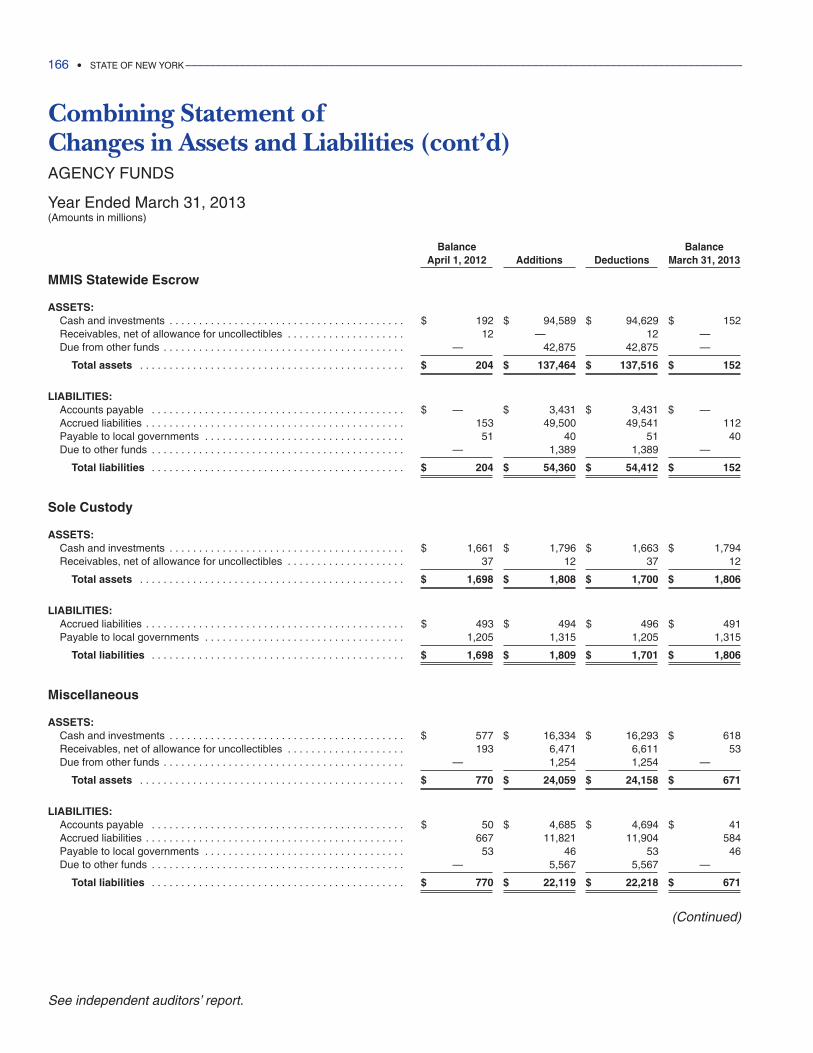
Combining Statement of Changes in Assets and Liabilities (cont’d)AGENCY FUNDS
Year Ended March 31, 2013(Amounts in millions)
Balance BalanceApril 1, 2012 Additions Deductions March 31, 2013
MMIS Statewide Escrow
ASSETS:Cash and investments . . . . . . . . . . . . . . . . . . . . . . . . . . . . . . . . . . . . . . . . $ 192 $ 94,589 $ 94,629 $ 152Receivables, net of allowance for uncollectibles . . . . . . . . . . . . . . . . . . . . 12 —00000 12 —00000Due from other funds . . . . . . . . . . . . . . . . . . . . . . . . . . . . . . . . . . . . . . . . . —00000 42,875 42,875 —00000
Total assets . . . . . . . . . . . . . . . . . . . . . . . . . . . . . . . . . . . . . . . . . . . . . $ 204 $ 137,464 $ 137,516 $ 152
LIABILITIES:Accounts payable . . . . . . . . . . . . . . . . . . . . . . . . . . . . . . . . . . . . . . . . . . . $ —00000 $ 3,431 $ 3,431 $ —00000Accrued liabilities . . . . . . . . . . . . . . . . . . . . . . . . . . . . . . . . . . . . . . . . . . . . 153 49,500 49,541 112Payable to local governments . . . . . . . . . . . . . . . . . . . . . . . . . . . . . . . . . . 51 40 51 40Due to other funds . . . . . . . . . . . . . . . . . . . . . . . . . . . . . . . . . . . . . . . . . . . —00000 1,389 1,389 —00000
Total liabilities . . . . . . . . . . . . . . . . . . . . . . . . . . . . . . . . . . . . . . . . . . . $ 204 $ 54,360 $ 54,412 $ 152
Sole Custody
ASSETS:Cash and investments . . . . . . . . . . . . . . . . . . . . . . . . . . . . . . . . . . . . . . . . $ 1,661 $ 1,796 $ 1,663 $ 1,794Receivables, net of allowance for uncollectibles . . . . . . . . . . . . . . . . . . . . 37 12 37 12
Total assets . . . . . . . . . . . . . . . . . . . . . . . . . . . . . . . . . . . . . . . . . . . . . $ 1,698 $ 1,808 $ 1,700 $ 1,806
LIABILITIES:Accrued liabilities . . . . . . . . . . . . . . . . . . . . . . . . . . . . . . . . . . . . . . . . . . . . $ 493 $ 494 $ 496 $ 491Payable to local governments . . . . . . . . . . . . . . . . . . . . . . . . . . . . . . . . . . 1,205 1,315 1,205 1,315
Total liabilities . . . . . . . . . . . . . . . . . . . . . . . . . . . . . . . . . . . . . . . . . . . $ 1,698 $ 1,809 $ 1,701 $ 1,806
Miscellaneous
ASSETS:Cash and investments . . . . . . . . . . . . . . . . . . . . . . . . . . . . . . . . . . . . . . . . $ 577 $ 16,334 $ 16,293 $ 618Receivables, net of allowance for uncollectibles . . . . . . . . . . . . . . . . . . . . 193 6,471 6,611 53Due from other funds . . . . . . . . . . . . . . . . . . . . . . . . . . . . . . . . . . . . . . . . . —00000 1,254 1,254 —00000
Total assets . . . . . . . . . . . . . . . . . . . . . . . . . . . . . . . . . . . . . . . . . . . . . $ 770 $ 24,059 $ 24,158 $ 671
LIABILITIES:Accounts payable . . . . . . . . . . . . . . . . . . . . . . . . . . . . . . . . . . . . . . . . . . . $ 50 $ 4,685 $ 4,694 $ 41Accrued liabilities . . . . . . . . . . . . . . . . . . . . . . . . . . . . . . . . . . . . . . . . . . . . 667 11,821 11,904 584Payable to local governments . . . . . . . . . . . . . . . . . . . . . . . . . . . . . . . . . . 53 46 53 46Due to other funds . . . . . . . . . . . . . . . . . . . . . . . . . . . . . . . . . . . . . . . . . . . —00000 5,567 5,567 —00000
Total liabilities . . . . . . . . . . . . . . . . . . . . . . . . . . . . . . . . . . . . . . . . . . . $ 770 $ 22,119 $ 22,218 $ 671
(Continued)
166 • STATE OF NEW YORK _____________________________________________________________________________________________
See independent auditors’ report.
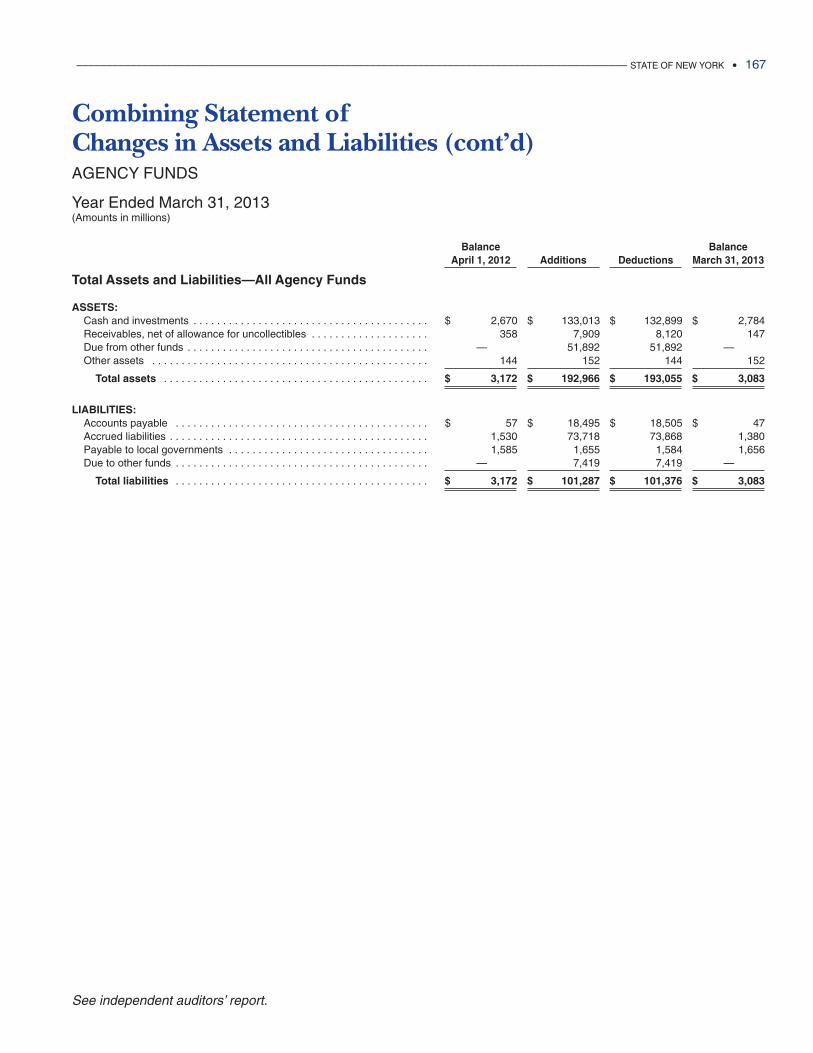
Combining Statement of Changes in Assets and Liabilities (cont’d)AGENCY FUNDS
Year Ended March 31, 2013(Amounts in millions)
Balance BalanceApril 1, 2012 Additions Deductions March 31, 2013
Total Assets and Liabilities—All Agency Funds
ASSETS:Cash and investments . . . . . . . . . . . . . . . . . . . . . . . . . . . . . . . . . . . . . . . . $ 2,670 $ 133,013 $ 132,899 $ 2,784Receivables, net of allowance for uncollectibles . . . . . . . . . . . . . . . . . . . . 358 7,909 8,120 147Due from other funds . . . . . . . . . . . . . . . . . . . . . . . . . . . . . . . . . . . . . . . . . —00000 51,892 51,892 —00000Other assets . . . . . . . . . . . . . . . . . . . . . . . . . . . . . . . . . . . . . . . . . . . . . . . 144 152 144 152
Total assets . . . . . . . . . . . . . . . . . . . . . . . . . . . . . . . . . . . . . . . . . . . . . $ 3,172 $ 192,966 $ 193,055 $ 3,083
LIABILITIES:Accounts payable . . . . . . . . . . . . . . . . . . . . . . . . . . . . . . . . . . . . . . . . . . . $ 57 $ 18,495 $ 18,505 $ 47Accrued liabilities . . . . . . . . . . . . . . . . . . . . . . . . . . . . . . . . . . . . . . . . . . . . 1,530 73,718 73,868 1,380Payable to local governments . . . . . . . . . . . . . . . . . . . . . . . . . . . . . . . . . . 1,585 1,655 1,584 1,656Due to other funds . . . . . . . . . . . . . . . . . . . . . . . . . . . . . . . . . . . . . . . . . . . —00000 7,419 7,419 —00000
Total liabilities . . . . . . . . . . . . . . . . . . . . . . . . . . . . . . . . . . . . . . . . . . . $ 3,172 $ 101,287 $ 101,376 $ 3,083
____________________________________________________________________________________________ STATE OF NEW YORK • 167
See independent auditors’ report.

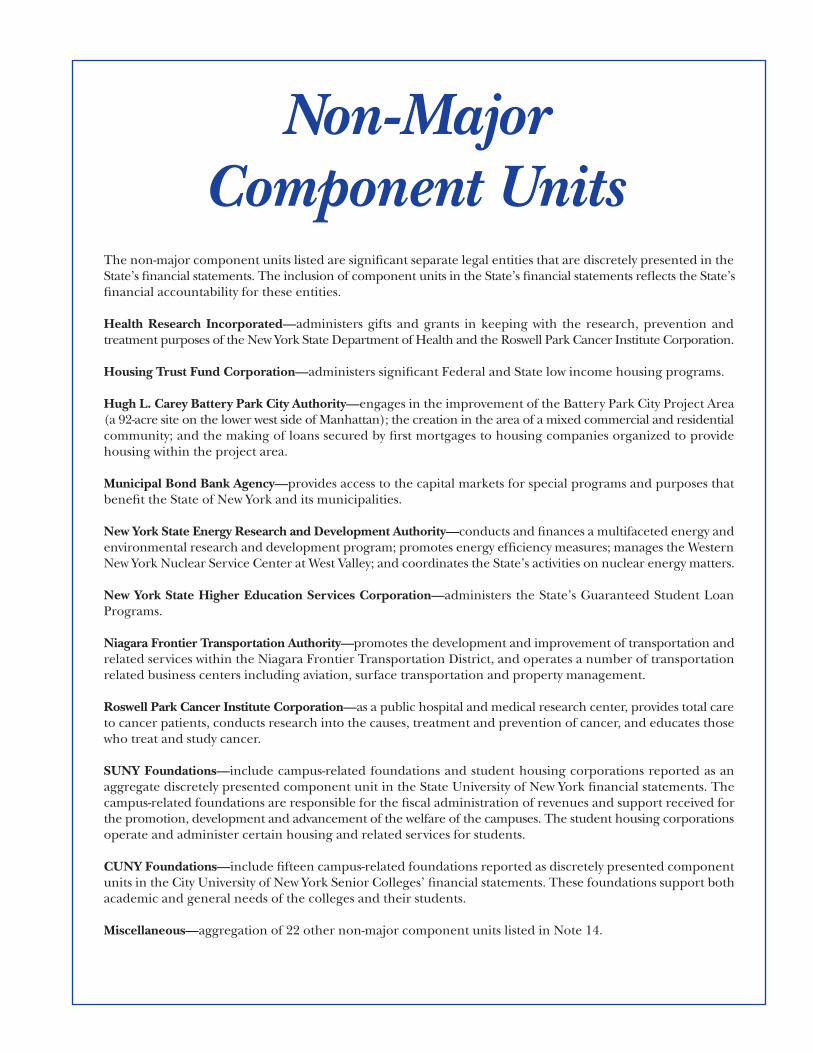
The non-major component units listed are significant separate legal entities that are discretely presented in theState’s financial statements. The inclusion of component units in the State’s financial statements reflects the State’sfinancial accountability for these entities.
Health Research Incorporated—administers gifts and grants in keeping with the research, prevention andtreatment purposes of the New York State Department of Health and the Roswell Park Cancer Institute Corporation.
Housing Trust Fund Corporation—administers significant Federal and State low income housing programs.
Hugh L. Carey Battery Park City Authority—engages in the improvement of the Battery Park City Project Area(a 92-acre site on the lower west side of Manhattan); the creation in the area of a mixed commercial and residentialcommunity; and the making of loans secured by first mortgages to housing companies organized to providehousing within the project area.
Municipal Bond Bank Agency—provides access to the capital markets for special programs and purposes thatbenefit the State of New York and its municipalities.
New York State Energy Research and Development Authority—conducts and finances a multifaceted energy andenvironmental research and development program; promotes energy efficiency measures; manages the WesternNew York Nuclear Service Center at West Valley; and coordinates the State’s activities on nuclear energy matters.
New York State Higher Education Services Corporation—administers the State’s Guaranteed Student LoanPrograms.
Niagara Frontier Transportation Authority—promotes the development and improvement of transportation andrelated services within the Niagara Frontier Transportation District, and operates a number of transportationrelated business centers including aviation, surface transportation and property management.
Roswell Park Cancer Institute Corporation—as a public hospital and medical research center, provides total careto cancer patients, conducts research into the causes, treatment and prevention of cancer, and educates thosewho treat and study cancer.
SUNY Foundations—include campus-related foundations and student housing corporations reported as anaggregate discretely presented component unit in the State University of New York financial statements. Thecampus-related foundations are responsible for the fiscal administration of revenues and support received forthe promotion, development and advancement of the welfare of the campuses. The student housing corporationsoperate and administer certain housing and related services for students.
CUNY Foundations—include fifteen campus-related foundations reported as discretely presented componentunits in the City University of New York Senior Colleges’ financial statements. These foundations support bothacademic and general needs of the colleges and their students.
Miscellaneous—aggregation of 22 other non-major component units listed in Note 14.
Non-Major Component Units
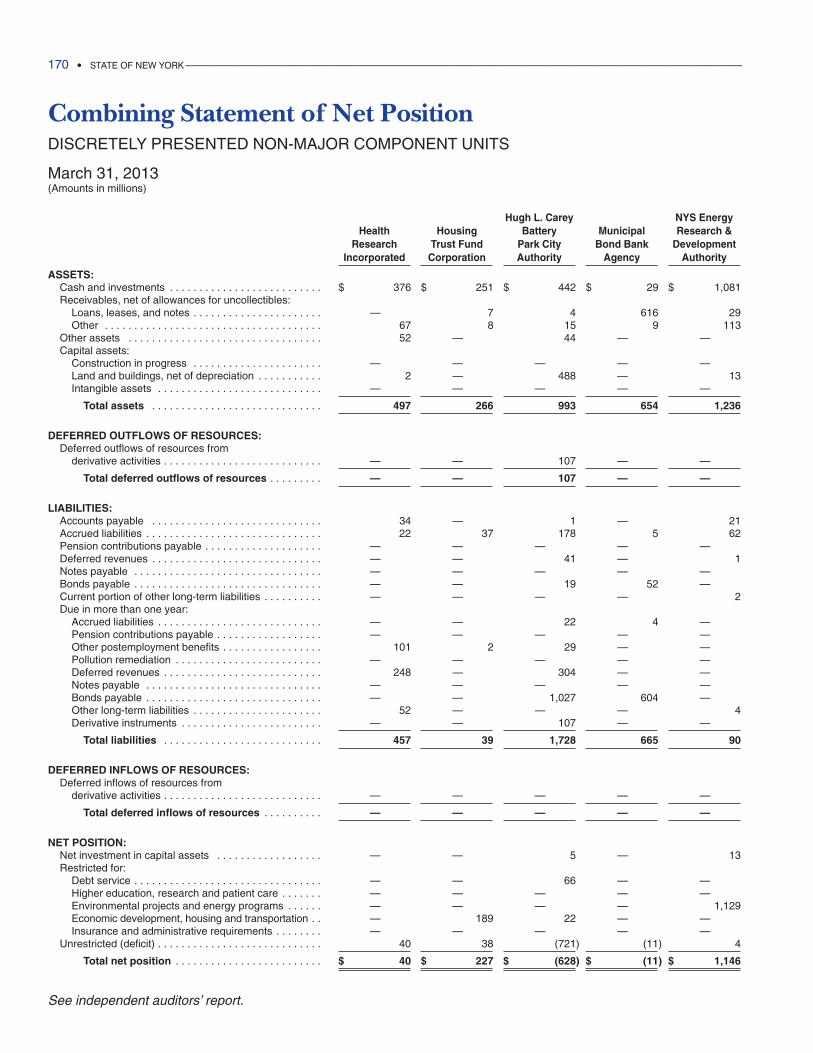
170 • STATE OF NEW YORK _____________________________________________________________________________________________
See independent auditors’ report.
Combining Statement of Net PositionDISCRETELY PRESENTED NON-MAJOR COMPONENT UNITS
March 31, 2013(Amounts in millions)
Hugh L. Carey NYS EnergyHealth Housing Battery Municipal Research &
Research Trust Fund Park City Bond Bank DevelopmentIncorporated Corporation Authority Agency Authority
ASSETS:Cash and investments . . . . . . . . . . . . . . . . . . . . . . . . . . $ 376 $ 251 $ 442 $ 29 $ 1,081Receivables, net of allowances for uncollectibles:
Loans, leases, and notes . . . . . . . . . . . . . . . . . . . . . . —00000 7 4 616 29Other . . . . . . . . . . . . . . . . . . . . . . . . . . . . . . . . . . . . . 67 8 15 9 113
Other assets . . . . . . . . . . . . . . . . . . . . . . . . . . . . . . . . . 52 —00000 44 —00000 —00000Capital assets:
Construction in progress . . . . . . . . . . . . . . . . . . . . . . —00000 —00000 —00000 —00000 —00000Land and buildings, net of depreciation . . . . . . . . . . . 2 —00000 488 —00000 13Intangible assets . . . . . . . . . . . . . . . . . . . . . . . . . . . . —00000 —00000 —00000 —00000 —00000
Total assets . . . . . . . . . . . . . . . . . . . . . . . . . . . . . 497 266 993 654 1,236
DEFERRED OUTFLOWS OF RESOURCES:Deferred outflows of resources from
derivative activities . . . . . . . . . . . . . . . . . . . . . . . . . . . —00000 —00000 107 —00000 —00000
Total deferred outflows of resources . . . . . . . . . —00000 —00000 107 —00000 —00000
LIABILITIES:Accounts payable . . . . . . . . . . . . . . . . . . . . . . . . . . . . . 34 —00000 1 —00000 21Accrued liabilities . . . . . . . . . . . . . . . . . . . . . . . . . . . . . . 22 37 178 5 62Pension contributions payable . . . . . . . . . . . . . . . . . . . . —00000 —00000 —00000 —00000 —00000Deferred revenues . . . . . . . . . . . . . . . . . . . . . . . . . . . . . —00000 —00000 41 —00000 1Notes payable . . . . . . . . . . . . . . . . . . . . . . . . . . . . . . . . —00000 —00000 —00000 —00000 —00000Bonds payable . . . . . . . . . . . . . . . . . . . . . . . . . . . . . . . . —00000 —00000 19 52 —00000Current portion of other long-term liabilities . . . . . . . . . . —00000 —00000 —00000 —00000 2Due in more than one year:
Accrued liabilities . . . . . . . . . . . . . . . . . . . . . . . . . . . . —00000 —00000 22 4 —00000Pension contributions payable . . . . . . . . . . . . . . . . . . —00000 —00000 —00000 —00000 —00000Other postemployment benefits . . . . . . . . . . . . . . . . . 101 2 29 —00000 —00000Pollution remediation . . . . . . . . . . . . . . . . . . . . . . . . . —00000 —00000 —00000 —00000 —00000Deferred revenues . . . . . . . . . . . . . . . . . . . . . . . . . . . 248 —00000 304 —00000 —00000Notes payable . . . . . . . . . . . . . . . . . . . . . . . . . . . . . . —00000 —00000 —00000 —00000 —00000Bonds payable . . . . . . . . . . . . . . . . . . . . . . . . . . . . . . —00000 —00000 1,027 604 —00000Other long-term liabilities . . . . . . . . . . . . . . . . . . . . . . 52 —00000 —00000 —00000 4Derivative instruments . . . . . . . . . . . . . . . . . . . . . . . . —00000 —00000 107 —00000 —00000
Total liabilities . . . . . . . . . . . . . . . . . . . . . . . . . . . 457 39 1,728 665 90
DEFERRED INFLOWS OF RESOURCES:Deferred inflows of resources from
derivative activities . . . . . . . . . . . . . . . . . . . . . . . . . . . —00000 —00000 —00000 —00000 —00000
Total deferred inflows of resources . . . . . . . . . . —00000 —00000 —00000 —00000 —00000
NET POSITION:Net investment in capital assets . . . . . . . . . . . . . . . . . . —00000 —00000 5 —00000 13Restricted for:
Debt service . . . . . . . . . . . . . . . . . . . . . . . . . . . . . . . . —00000 —00000 66 —00000 —00000Higher education, research and patient care . . . . . . . —00000 —00000 —00000 —00000 —00000Environmental projects and energy programs . . . . . . —00000 —00000 —00000 —00000 1,129Economic development, housing and transportation . . —00000 189 22 —00000 —00000Insurance and administrative requirements . . . . . . . . —00000 —00000 —00000 —00000 —00000
Unrestricted (deficit) . . . . . . . . . . . . . . . . . . . . . . . . . . . . 40 38 (721) (11) 4
Total net position . . . . . . . . . . . . . . . . . . . . . . . . . $ 40 $ 227 $ (628) $ (11) $ 1,146
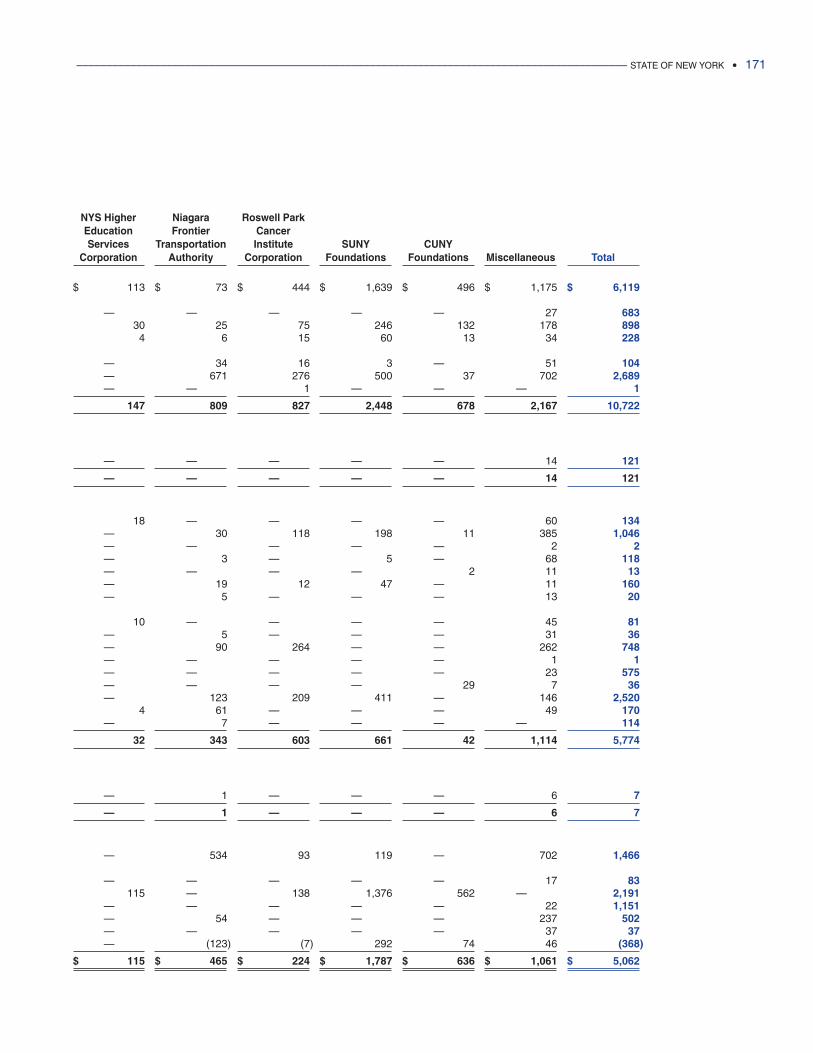
____________________________________________________________________________________________ STATE OF NEW YORK • 171
NYS Higher Niagara Roswell ParkEducation Frontier CancerServices Transportation Institute SUNY CUNY
Corporation Authority Corporation Foundations Foundations Miscellaneous Total
$ 113 $ 73 $ 444 $ 1,639 $ 496 $ 1,175 $ 6,119
—00000 —00000 —00000 —00000 —00000 27 68330 25 75 246 132 178 8984 6 15 60 13 34 228
—00000 34 16 3 —00000 51 104—00000 671 276 500 37 702 2,689—00000 —00000 1 —00000 —00000 —00000 1
147 809 827 2,448 678 2,167 10,722
—00000 —00000 —00000 —00000 —00000 14 121
—00000 —00000 —00000 —00000 —00000 14 121
18 —00000 —00000 —00000 —00000 60 134—00000 30 118 198 11 385 1,046—00000 —00000 —00000 —00000 —00000 2 2—00000 3 —00000 5 —00000 68 118—00000 —00000 —00000 —00000 2 11 13—00000 19 12 47 —00000 11 160—00000 5 —00000 —00000 —00000 13 20
10 —00000 —00000 —00000 —00000 45 81—00000 5 —00000 —00000 —00000 31 36—00000 90 264 —00000 —00000 262 748—00000 —00000 —00000 —00000 —00000 1 1—00000 —00000 —00000 —00000 —00000 23 575—00000 —00000 —00000 —00000 29 7 36—00000 123 209 411 —00000 146 2,520
4 61 —00000 —00000 —00000 49 170—00000 7 —00000 —00000 —00000 —00000 114
32 343 603 661 42 1,114 5,774
—00000 1 —00000 —00000 —00000 6 7
—00000 1 —00000 —00000 —00000 6 7
—00000 534 93 119 —00000 702 1,466
—00000 —00000 —00000 —00000 —00000 17 83115 —00000 138 1,376 562 —00000 2,191
—00000 —00000 —00000 —00000 —00000 22 1,151—00000 54 —00000 —00000 —00000 237 502—00000 —00000 —00000 —00000 —00000 37 37—00000 (123) (7) 292 74 46 (368)
$ 115 $ 465 $ 224 $ 1,787 $ 636 $ 1,061 $ 5,062
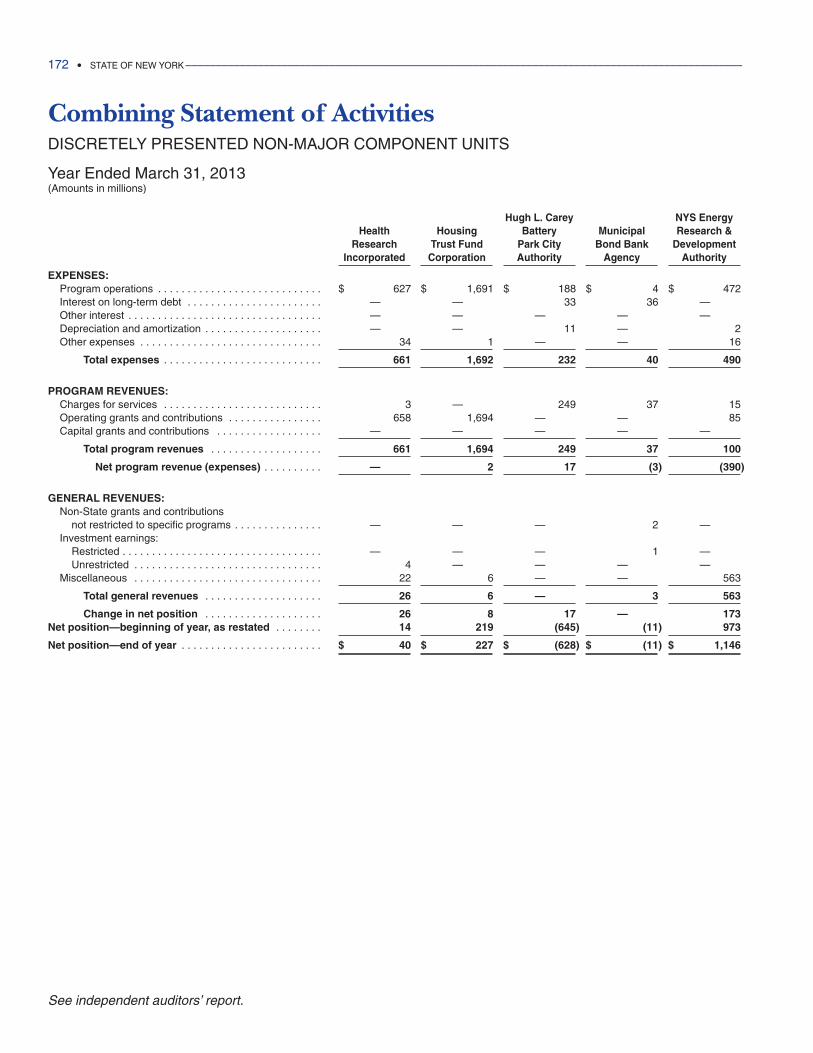
172 • STATE OF NEW YORK _____________________________________________________________________________________________
See independent auditors’ report.
Combining Statement of ActivitiesDISCRETELY PRESENTED NON-MAJOR COMPONENT UNITS
Year Ended March 31, 2013(Amounts in millions)
Hugh L. Carey NYS EnergyHealth Housing Battery Municipal Research &
Research Trust Fund Park City Bond Bank DevelopmentIncorporated Corporation Authority Agency Authority
EXPENSES:Program operations . . . . . . . . . . . . . . . . . . . . . . . . . . . . $ 627 $ 1,691 $ 188 $ 4 $ 472Interest on long-term debt . . . . . . . . . . . . . . . . . . . . . . . —00000 —00000 33 36 —00000Other interest . . . . . . . . . . . . . . . . . . . . . . . . . . . . . . . . . —00000 —00000 —00000 —00000 —00000Depreciation and amortization . . . . . . . . . . . . . . . . . . . . —00000 —00000 11 —00000 2Other expenses . . . . . . . . . . . . . . . . . . . . . . . . . . . . . . . 34 1 —00000 —00000 16
Total expenses . . . . . . . . . . . . . . . . . . . . . . . . . . . 661 1,692 232 40 490
PROGRAM REVENUES:Charges for services . . . . . . . . . . . . . . . . . . . . . . . . . . . 3 —00000 249 37 15Operating grants and contributions . . . . . . . . . . . . . . . . 658 1,694 —00000 —00000 85Capital grants and contributions . . . . . . . . . . . . . . . . . . —00000 —00000 —00000 —00000 —00000
Total program revenues . . . . . . . . . . . . . . . . . . . 661 1,694 249 37 100
Net program revenue (expenses) . . . . . . . . . . —00000 2 17 (3) (390)
GENERAL REVENUES:Non-State grants and contributions
not restricted to specific programs . . . . . . . . . . . . . . . —00000 —00000 —00000 2 —00000Investment earnings:
Restricted . . . . . . . . . . . . . . . . . . . . . . . . . . . . . . . . . . —00000 —00000 —00000 1 —00000Unrestricted . . . . . . . . . . . . . . . . . . . . . . . . . . . . . . . . 4 —00000 —00000 —00000 —00000
Miscellaneous . . . . . . . . . . . . . . . . . . . . . . . . . . . . . . . . 22 6 —00000 —00000 563
Total general revenues . . . . . . . . . . . . . . . . . . . . 26 6 —00000 3 563
Change in net position . . . . . . . . . . . . . . . . . . . . 26 8 17 —00000 173Net position—beginning of year, as restated . . . . . . . . 14 219 (645) (11) 973
Net position—end of year . . . . . . . . . . . . . . . . . . . . . . . . $ 40 $ 227 $ (628) $ (11) $ 1,146
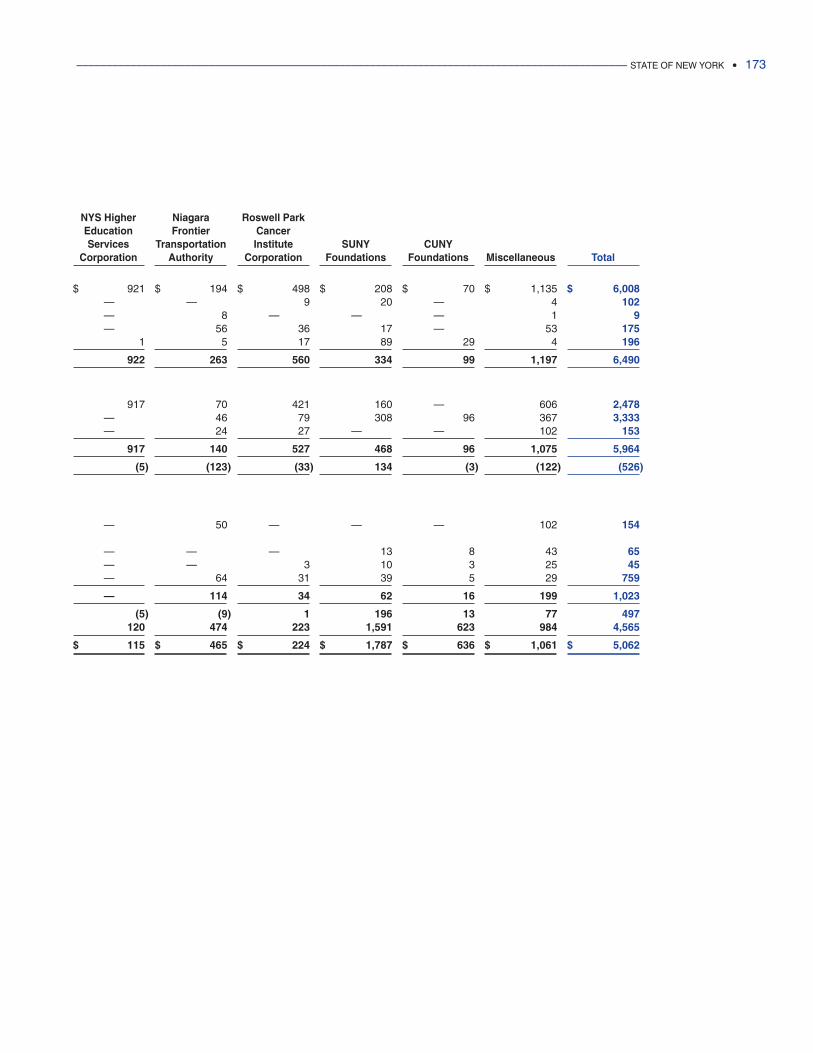
____________________________________________________________________________________________ STATE OF NEW YORK • 173
NYS Higher Niagara Roswell ParkEducation Frontier CancerServices Transportation Institute SUNY CUNY
Corporation Authority Corporation Foundations Foundations Miscellaneous Total
$ 921 $ 194 $ 498 $ 208 $ 70 $ 1,135 $ 6,008—00000 —00000 9 20 —00000 4 102—00000 8 —00000 —00000 —00000 1 9—00000 56 36 17 —00000 53 175
1 5 17 89 29 4 196
922 263 560 334 99 1,197 6,490
917 70 421 160 —00000 606 2,478—00000 46 79 308 96 367 3,333—00000 24 27 —00000 —00000 102 153
917 140 527 468 96 1,075 5,964
(5) (123) (33) 134 (3) (122) (526)
—00000 50 —00000 —00000 —00000 102 154
—00000 —00000 —00000 13 8 43 65—00000 —00000 3 10 3 25 45—00000 64 31 39 5 29 759
—00000 114 34 62 16 199 1,023
(5) (9) 1 196 13 77 497120 474 223 1,591 623 984 4,565
$ 115 $ 465 $ 224 $ 1,787 $ 636 $ 1,061 $ 5,062

StatisticalSection
This part of the State’s Comprehensive Annual Financial Report presents detailedinformation as a context for understanding what the information in the financialstatements, note disclosures, and required supplementary information says aboutthe State’s overall financial health.
Contents
Financial TrendsThese schedules contain trend information to help the reader understand how theState’s financial performance and well-being have changed over time.
Revenue CapacityThese schedules contain information to help the reader assess the State’s mostsignificant revenue source, the personal income tax.
Debt CapacityThese schedules present information to help the reader assess the affordability ofthe State’s current levels of outstanding debt and the State’s ability to issue addi-tional debt in the future.
Demographic and Economic InformationThese schedules offer demographic and economic indicators to help the readerunderstand the environment within which the State’s financial activities take place.
Operating InformationThese schedules contain service and infrastructure data to help the reader under-stand how the information in the State’s financial report relates to the services theState provides and the activities it performs.
Sources: Unless otherwise noted, the information in these schedules is derived from theComprehensive Annual Financial Reports for the relevant year.
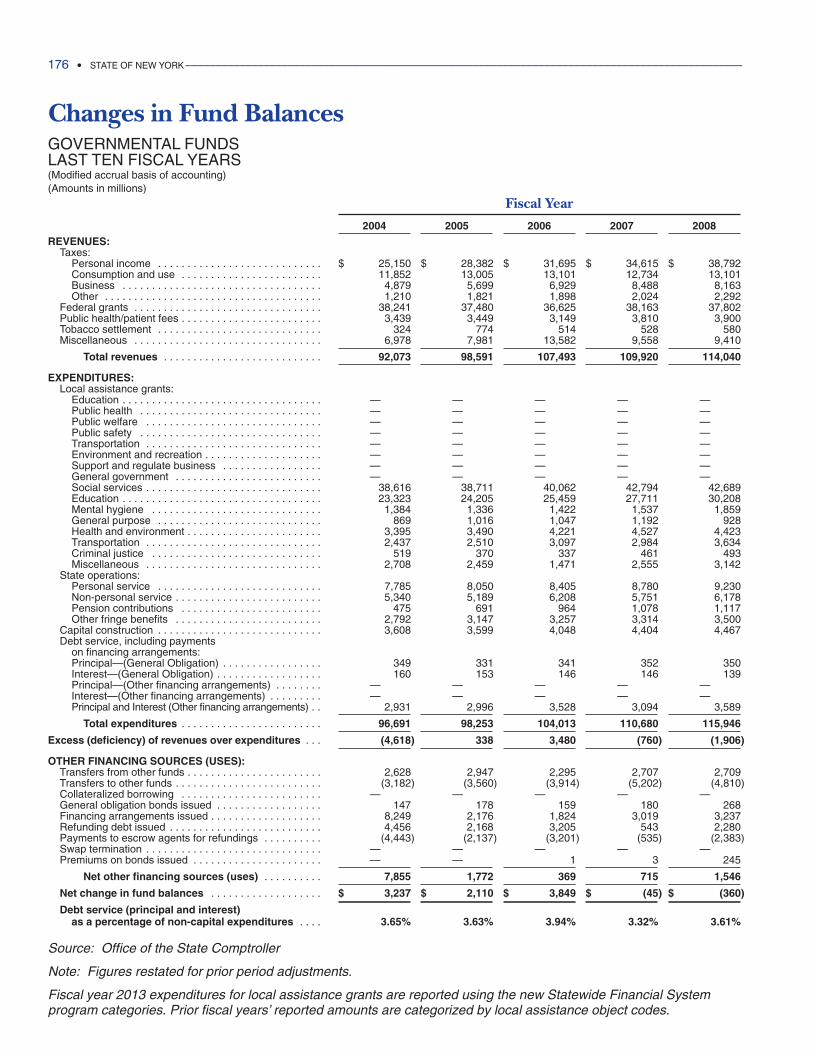
Changes in Fund BalancesGOVERNMENTAL FUNDSLAST TEN FISCAL YEARS(Modified accrual basis of accounting)(Amounts in millions)
Fiscal Year
2004 2005 2006 2007 2008REVENUES:
Taxes:Personal income . . . . . . . . . . . . . . . . . . . . . . . . . . . . $ 25,150 $ 28,382 $ 31,695 $ 34,615 $ 38,792Consumption and use . . . . . . . . . . . . . . . . . . . . . . . . 11,852 13,005 13,101 12,734 13,101Business . . . . . . . . . . . . . . . . . . . . . . . . . . . . . . . . . . 4,879 5,699 6,929 8,488 8,163Other . . . . . . . . . . . . . . . . . . . . . . . . . . . . . . . . . . . . . 1,210 1,821 1,898 2,024 2,292
Federal grants . . . . . . . . . . . . . . . . . . . . . . . . . . . . . . . . 38,241 37,480 36,625 38,163 37,802Public health/patient fees . . . . . . . . . . . . . . . . . . . . . . . . 3,439 3,449 3,149 3,810 3,900Tobacco settlement . . . . . . . . . . . . . . . . . . . . . . . . . . . . 324 774 514 528 580Miscellaneous . . . . . . . . . . . . . . . . . . . . . . . . . . . . . . . . 6,978 7,981 13,582 9,558 9,410
Total revenues . . . . . . . . . . . . . . . . . . . . . . . . . . . 92,073 98,591 107,493 109,920 114,040
EXPENDITURES:Local assistance grants:
Education . . . . . . . . . . . . . . . . . . . . . . . . . . . . . . . . . . —00000 —00000 —00000 —00000 —00000Public health . . . . . . . . . . . . . . . . . . . . . . . . . . . . . . . —00000 —00000 —00000 —00000 —00000Public welfare . . . . . . . . . . . . . . . . . . . . . . . . . . . . . . —00000 —00000 —00000 —00000 —00000Public safety . . . . . . . . . . . . . . . . . . . . . . . . . . . . . . . —00000 —00000 —00000 —00000 —00000Transportation . . . . . . . . . . . . . . . . . . . . . . . . . . . . . . —00000 —00000 —00000 —00000 —00000Environment and recreation . . . . . . . . . . . . . . . . . . . . —00000 —00000 —00000 —00000 —00000Support and regulate business . . . . . . . . . . . . . . . . . —00000 —00000 —00000 —00000 —00000General government . . . . . . . . . . . . . . . . . . . . . . . . . —00000 —00000 —00000 —00000 —00000Social services . . . . . . . . . . . . . . . . . . . . . . . . . . . . . . 38,616 38,711 40,062 42,794 42,689Education . . . . . . . . . . . . . . . . . . . . . . . . . . . . . . . . . . 23,323 24,205 25,459 27,711 30,208Mental hygiene . . . . . . . . . . . . . . . . . . . . . . . . . . . . . 1,384 1,336 1,422 1,537 1,859General purpose . . . . . . . . . . . . . . . . . . . . . . . . . . . . 869 1,016 1,047 1,192 928Health and environment . . . . . . . . . . . . . . . . . . . . . . . 3,395 3,490 4,221 4,527 4,423Transportation . . . . . . . . . . . . . . . . . . . . . . . . . . . . . . 2,437 2,510 3,097 2,984 3,634Criminal justice . . . . . . . . . . . . . . . . . . . . . . . . . . . . . 519 370 337 461 493Miscellaneous . . . . . . . . . . . . . . . . . . . . . . . . . . . . . . 2,708 2,459 1,471 2,555 3,142
State operations:Personal service . . . . . . . . . . . . . . . . . . . . . . . . . . . . 7,785 8,050 8,405 8,780 9,230Non-personal service . . . . . . . . . . . . . . . . . . . . . . . . . 5,340 5,189 6,208 5,751 6,178Pension contributions . . . . . . . . . . . . . . . . . . . . . . . . 475 691 964 1,078 1,117Other fringe benefits . . . . . . . . . . . . . . . . . . . . . . . . . 2,792 3,147 3,257 3,314 3,500
Capital construction . . . . . . . . . . . . . . . . . . . . . . . . . . . . 3,608 3,599 4,048 4,404 4,467Debt service, including payments
on financing arrangements:Principal—(General Obligation) . . . . . . . . . . . . . . . . . 349 331 341 352 350Interest—(General Obligation) . . . . . . . . . . . . . . . . . . 160 153 146 146 139Principal—(Other financing arrangements) . . . . . . . . —00000 —00000 —00000 —00000 —00000Interest—(Other financing arrangements) . . . . . . . . . —00000 —00000 —00000 —00000 —00000Principal and Interest (Other financing arrangements) . . 2,931 2,996 3,528 3,094 3,589
Total expenditures . . . . . . . . . . . . . . . . . . . . . . . . 96,691 98,253 104,013 110,680 115,946
Excess (deficiency) of revenues over expenditures . . . (4,618) 338 3,480 (760) (1,906)
OTHER FINANCING SOURCES (USES):Transfers from other funds . . . . . . . . . . . . . . . . . . . . . . . 2,628 2,947 2,295 2,707 2,709Transfers to other funds . . . . . . . . . . . . . . . . . . . . . . . . . (3,182) (3,560) (3,914) (5,202) (4,810)Collateralized borrowing . . . . . . . . . . . . . . . . . . . . . . . . —00000 —00000 —00000 —00000 —00000General obligation bonds issued . . . . . . . . . . . . . . . . . . 147 178 159 180 268Financing arrangements issued . . . . . . . . . . . . . . . . . . . 8,249 2,176 1,824 3,019 3,237Refunding debt issued . . . . . . . . . . . . . . . . . . . . . . . . . . 4,456 2,168 3,205 543 2,280Payments to escrow agents for refundings . . . . . . . . . . (4,443) (2,137) (3,201) (535) (2,383)Swap termination . . . . . . . . . . . . . . . . . . . . . . . . . . . . . . —00000 —00000 —00000 —00000 —00000Premiums on bonds issued . . . . . . . . . . . . . . . . . . . . . . —00000 —00000 1 3 245
Net other financing sources (uses) . . . . . . . . . . 7,855 1,772 369 715 1,546
Net change in fund balances . . . . . . . . . . . . . . . . . . . $ 3,237 $ 2,110 $ 3,849 $ (45) $ (360)
Debt service (principal and interest) as a percentage of non-capital expenditures . . . . 3.65% 3.63% 3.94% 3.32% 3.61%
Source: Office of the State Comptroller
Note: Figures restated for prior period adjustments.
Fiscal year 2013 expenditures for local assistance grants are reported using the new Statewide Financial Systemprogram categories. Prior fiscal years’ reported amounts are categorized by local assistance object codes.
176 • STATE OF NEW YORK _____________________________________________________________________________________________
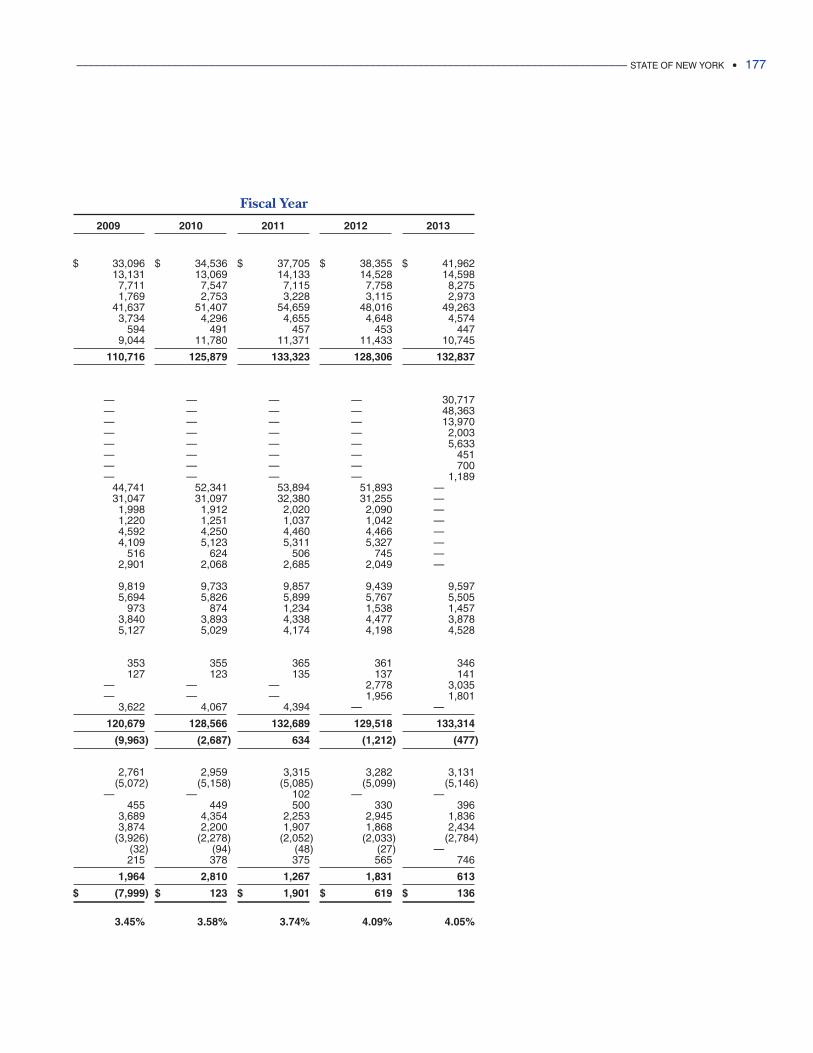
Fiscal Year
2009 2010 2011 2012 2013
$ 33,096 $ 34,536 $ 37,705 $ 38,355 $ 41,96213,131 13,069 14,133 14,528 14,598
7,711 7,547 7,115 7,758 8,2751,769 2,753 3,228 3,115 2,973
41,637 51,407 54,659 48,016 49,2633,734 4,296 4,655 4,648 4,574
594 491 457 453 4479,044 11,780 11,371 11,433 10,745
110,716 125,879 133,323 128,306 132,837
—00000 —00000 —00000 —00000 30,717—00000 —00000 —00000 —00000 48,363—00000 —00000 —00000 —00000 13,970—00000 —00000 —00000 —00000 2,003—00000 —00000 —00000 —00000 5,633—00000 —00000 —00000 —00000 451—00000 —00000 —00000 —00000 700—00000 —00000 —00000 —00000 1,189
44,741 52,341 53,894 51,893 —0000031,047 31,097 32,380 31,255 —000001,998 1,912 2,020 2,090 —000001,220 1,251 1,037 1,042 —000004,592 4,250 4,460 4,466 —000004,109 5,123 5,311 5,327 —00000
516 624 506 745 —000002,901 2,068 2,685 2,049 —00000
9,819 9,733 9,857 9,439 9,5975,694 5,826 5,899 5,767 5,505
973 874 1,234 1,538 1,4573,840 3,893 4,338 4,477 3,8785,127 5,029 4,174 4,198 4,528
353 355 365 361 346127 123 135 137 141
—00000 —00000 —00000 2,778 3,035—00000 —00000 —00000 1,956 1,801
3,622 4,067 4,394 —00000 —00000
120,679 128,566 132,689 129,518 133,314
(9,963) (2,687) 634 (1,212) (477)
2,761 2,959 3,315 3,282 3,131(5,072) (5,158) (5,085) (5,099) (5,146)
—00000 —00000 102 —00000 —00000455 449 500 330 396
3,689 4,354 2,253 2,945 1,8363,874 2,200 1,907 1,868 2,434
(3,926) (2,278) (2,052) (2,033) (2,784)(32) (94) (48) (27) —00000215 378 375 565 746
1,964 2,810 1,267 1,831 613
$ (7,999) $ 123 $ 1,901 $ 619 $ 136
3.45% 3.58% 3.74% 4.09% 4.05%
____________________________________________________________________________________________ STATE OF NEW YORK • 177
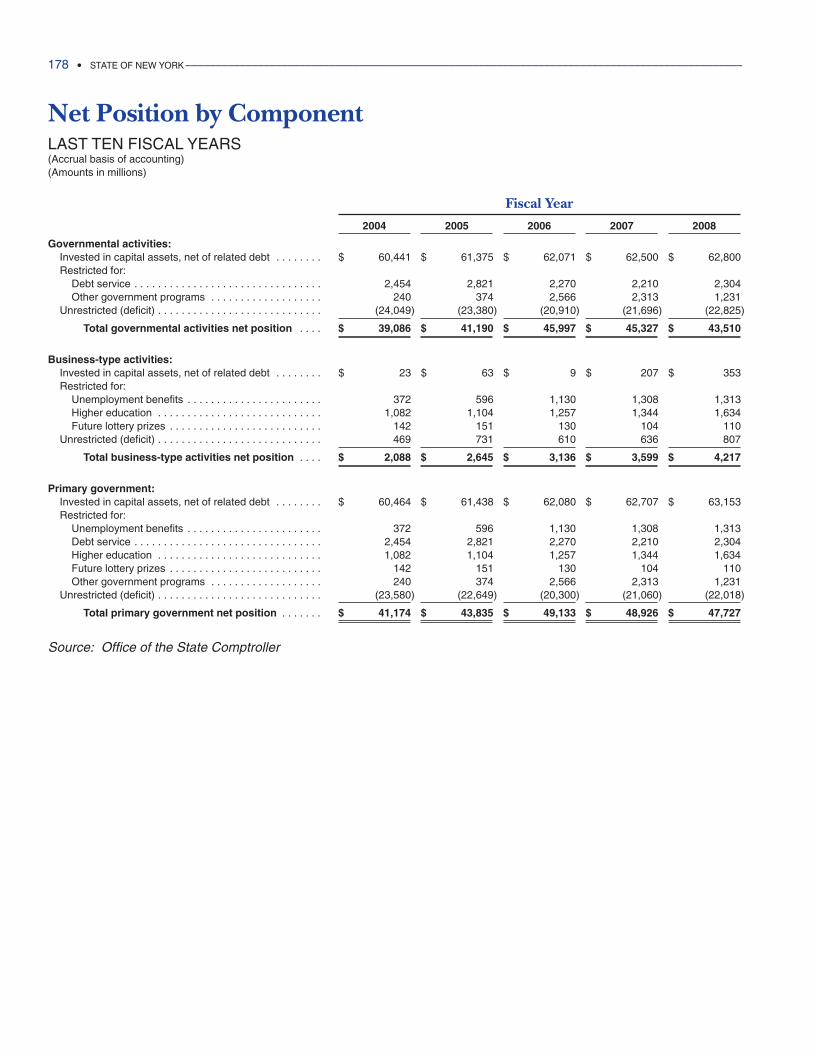
178 • STATE OF NEW YORK _____________________________________________________________________________________________
Net Position by ComponentLAST TEN FISCAL YEARS(Accrual basis of accounting)(Amounts in millions)
Fiscal Year
2004 2005 2006 2007 2008
Governmental activities:Invested in capital assets, net of related debt . . . . . . . . $ 60,441 $ 61,375 $ 62,071 $ 62,500 $ 62,800Restricted for:
Debt service . . . . . . . . . . . . . . . . . . . . . . . . . . . . . . . . 2,454 2,821 2,270 2,210 2,304Other government programs . . . . . . . . . . . . . . . . . . . 240 374 2,566 2,313 1,231
Unrestricted (deficit) . . . . . . . . . . . . . . . . . . . . . . . . . . . . (24,049) (23,380) (20,910) (21,696) (22,825)
Total governmental activities net position . . . . $ 39,086 $ 41,190 $ 45,997 $ 45,327 $ 43,510
Business-type activities:Invested in capital assets, net of related debt . . . . . . . . $ 23 $ 63 $ 9 $ 207 $ 353Restricted for:
Unemployment benefits . . . . . . . . . . . . . . . . . . . . . . . 372 596 1,130 1,308 1,313Higher education . . . . . . . . . . . . . . . . . . . . . . . . . . . . 1,082 1,104 1,257 1,344 1,634Future lottery prizes . . . . . . . . . . . . . . . . . . . . . . . . . . 142 151 130 104 110
Unrestricted (deficit) . . . . . . . . . . . . . . . . . . . . . . . . . . . . 469 731 610 636 807
Total business-type activities net position . . . . $ 2,088 $ 2,645 $ 3,136 $ 3,599 $ 4,217
Primary government:Invested in capital assets, net of related debt . . . . . . . . $ 60,464 $ 61,438 $ 62,080 $ 62,707 $ 63,153Restricted for:
Unemployment benefits . . . . . . . . . . . . . . . . . . . . . . . 372 596 1,130 1,308 1,313Debt service . . . . . . . . . . . . . . . . . . . . . . . . . . . . . . . . 2,454 2,821 2,270 2,210 2,304Higher education . . . . . . . . . . . . . . . . . . . . . . . . . . . . 1,082 1,104 1,257 1,344 1,634Future lottery prizes . . . . . . . . . . . . . . . . . . . . . . . . . . 142 151 130 104 110Other government programs . . . . . . . . . . . . . . . . . . . 240 374 2,566 2,313 1,231
Unrestricted (deficit) . . . . . . . . . . . . . . . . . . . . . . . . . . . . (23,580) (22,649) (20,300) (21,060) (22,018)
Total primary government net position . . . . . . . $ 41,174 $ 43,835 $ 49,133 $ 48,926 $ 47,727
Source: Office of the State Comptroller
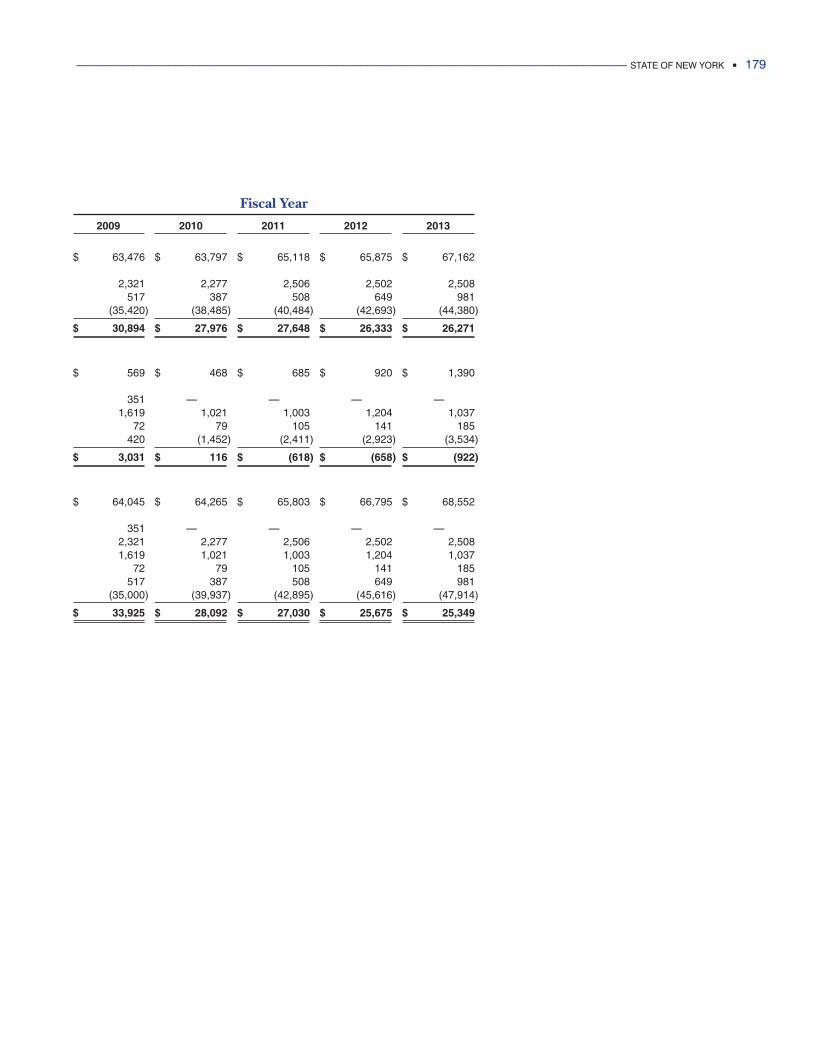
Fiscal Year
2009 2010 2011 2012 2013
$ 63,476 $ 63,797 $ 65,118 $ 65,875 $ 67,162
2,321 2,277 2,506 2,502 2,508517 387 508 649 981
(35,420) (38,485) (40,484) (42,693) (44,380)
$ 30,894 $ 27,976 $ 27,648 $ 26,333 $ 26,271
$ 569 $ 468 $ 685 $ 920 $ 1,390
351 —00000 —00000 —00000 —000001,619 1,021 1,003 1,204 1,037
72 79 105 141 185420 (1,452) (2,411) (2,923) (3,534)
$ 3,031 $ 116 $ (618) $ (658) $ (922)
$ 64,045 $ 64,265 $ 65,803 $ 66,795 $ 68,552
351 —00000 —00000 —00000 —000002,321 2,277 2,506 2,502 2,5081,619 1,021 1,003 1,204 1,037
72 79 105 141 185517 387 508 649 981
(35,000) (39,937) (42,895) (45,616) (47,914)
$ 33,925 $ 28,092 $ 27,030 $ 25,675 $ 25,349
____________________________________________________________________________________________ STATE OF NEW YORK • 179
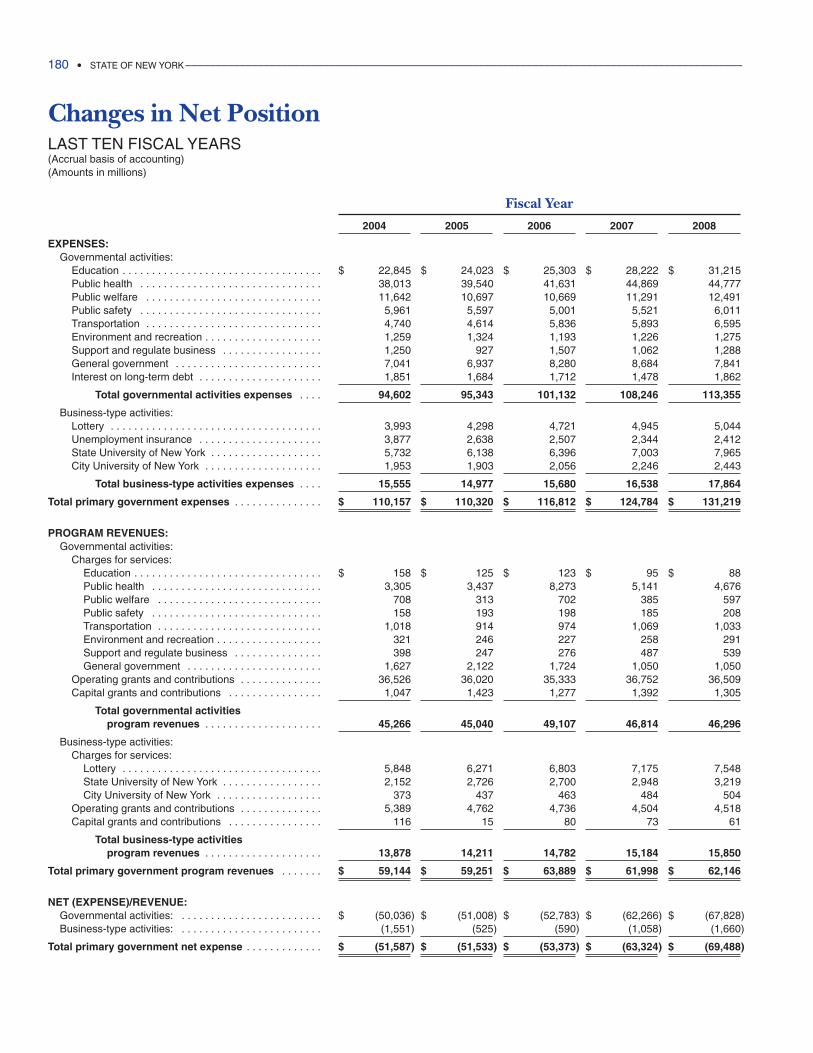
Changes in Net PositionLAST TEN FISCAL YEARS(Accrual basis of accounting)(Amounts in millions)
Fiscal Year
2004 2005 2006 2007 2008
EXPENSES:Governmental activities:
Education . . . . . . . . . . . . . . . . . . . . . . . . . . . . . . . . . . $ 22,845 $ 24,023 $ 25,303 $ 28,222 $ 31,215Public health . . . . . . . . . . . . . . . . . . . . . . . . . . . . . . . 38,013 39,540 41,631 44,869 44,777Public welfare . . . . . . . . . . . . . . . . . . . . . . . . . . . . . . 11,642 10,697 10,669 11,291 12,491Public safety . . . . . . . . . . . . . . . . . . . . . . . . . . . . . . . 5,961 5,597 5,001 5,521 6,011Transportation . . . . . . . . . . . . . . . . . . . . . . . . . . . . . . 4,740 4,614 5,836 5,893 6,595Environment and recreation . . . . . . . . . . . . . . . . . . . . 1,259 1,324 1,193 1,226 1,275Support and regulate business . . . . . . . . . . . . . . . . . 1,250 927 1,507 1,062 1,288General government . . . . . . . . . . . . . . . . . . . . . . . . . 7,041 6,937 8,280 8,684 7,841Interest on long-term debt . . . . . . . . . . . . . . . . . . . . . 1,851 1,684 1,712 1,478 1,862
Total governmental activities expenses . . . . 94,602 95,343 101,132 108,246 113,355
Business-type activities:Lottery . . . . . . . . . . . . . . . . . . . . . . . . . . . . . . . . . . . . 3,993 4,298 4,721 4,945 5,044Unemployment insurance . . . . . . . . . . . . . . . . . . . . . 3,877 2,638 2,507 2,344 2,412State University of New York . . . . . . . . . . . . . . . . . . . 5,732 6,138 6,396 7,003 7,965City University of New York . . . . . . . . . . . . . . . . . . . . 1,953 1,903 2,056 2,246 2,443
Total business-type activities expenses . . . . 15,555 14,977 15,680 16,538 17,864
Total primary government expenses . . . . . . . . . . . . . . . $ 110,157 $ 110,320 $ 116,812 $ 124,784 $ 131,219
PROGRAM REVENUES:Governmental activities:
Charges for services:Education . . . . . . . . . . . . . . . . . . . . . . . . . . . . . . . . $ 158 $ 125 $ 123 $ 95 $ 88Public health . . . . . . . . . . . . . . . . . . . . . . . . . . . . . 3,305 3,437 8,273 5,141 4,676Public welfare . . . . . . . . . . . . . . . . . . . . . . . . . . . . 708 313 702 385 597Public safety . . . . . . . . . . . . . . . . . . . . . . . . . . . . . 158 193 198 185 208Transportation . . . . . . . . . . . . . . . . . . . . . . . . . . . . 1,018 914 974 1,069 1,033Environment and recreation . . . . . . . . . . . . . . . . . . 321 246 227 258 291Support and regulate business . . . . . . . . . . . . . . . 398 247 276 487 539General government . . . . . . . . . . . . . . . . . . . . . . . 1,627 2,122 1,724 1,050 1,050
Operating grants and contributions . . . . . . . . . . . . . . 36,526 36,020 35,333 36,752 36,509Capital grants and contributions . . . . . . . . . . . . . . . . 1,047 1,423 1,277 1,392 1,305
Total governmental activities program revenues . . . . . . . . . . . . . . . . . . . . 45,266 45,040 49,107 46,814 46,296
Business-type activities:Charges for services:
Lottery . . . . . . . . . . . . . . . . . . . . . . . . . . . . . . . . . . 5,848 6,271 6,803 7,175 7,548State University of New York . . . . . . . . . . . . . . . . . 2,152 2,726 2,700 2,948 3,219City University of New York . . . . . . . . . . . . . . . . . . 373 437 463 484 504
Operating grants and contributions . . . . . . . . . . . . . . 5,389 4,762 4,736 4,504 4,518Capital grants and contributions . . . . . . . . . . . . . . . . 116 15 80 73 61
Total business-type activities program revenues . . . . . . . . . . . . . . . . . . . . 13,878 14,211 14,782 15,184 15,850
Total primary government program revenues . . . . . . . $ 59,144 $ 59,251 $ 63,889 $ 61,998 $ 62,146
NET (EXPENSE)/REVENUE:Governmental activities: . . . . . . . . . . . . . . . . . . . . . . . . $ (50,036) $ (51,008) $ (52,783) $ (62,266) $ (67,828)Business-type activities: . . . . . . . . . . . . . . . . . . . . . . . . (1,551) (525) (590) (1,058) (1,660)
Total primary government net expense . . . . . . . . . . . . . $ (51,587) $ (51,533) $ (53,373) $ (63,324) $ (69,488)
180 • STATE OF NEW YORK _____________________________________________________________________________________________
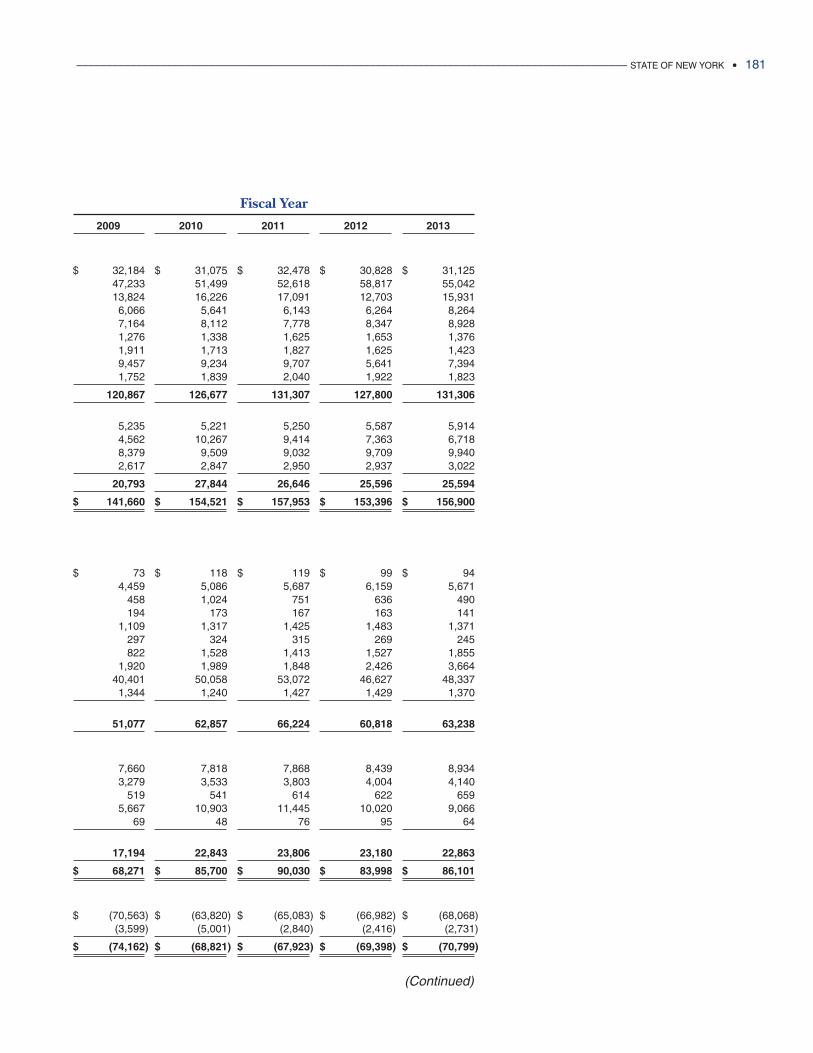
Fiscal Year
2009 2010 2011 2012 2013
$ 32,184 $ 31,075 $ 32,478 $ 30,828 $ 31,12547,233 51,499 52,618 58,817 55,04213,824 16,226 17,091 12,703 15,9316,066 5,641 6,143 6,264 8,2647,164 8,112 7,778 8,347 8,9281,276 1,338 1,625 1,653 1,3761,911 1,713 1,827 1,625 1,4239,457 9,234 9,707 5,641 7,3941,752 1,839 2,040 1,922 1,823
120,867 126,677 131,307 127,800 131,306
5,235 5,221 5,250 5,587 5,9144,562 10,267 9,414 7,363 6,7188,379 9,509 9,032 9,709 9,9402,617 2,847 2,950 2,937 3,022
20,793 27,844 26,646 25,596 25,594
$ 141,660 $ 154,521 $ 157,953 $ 153,396 $ 156,900
$ 73 $ 118 $ 119 $ 99 $ 944,459 5,086 5,687 6,159 5,671
458 1,024 751 636 490194 173 167 163 141
1,109 1,317 1,425 1,483 1,371297 324 315 269 245822 1,528 1,413 1,527 1,855
1,920 1,989 1,848 2,426 3,66440,401 50,058 53,072 46,627 48,3371,344 1,240 1,427 1,429 1,370
51,077 62,857 66,224 60,818 63,238
7,660 7,818 7,868 8,439 8,9343,279 3,533 3,803 4,004 4,140
519 541 614 622 6595,667 10,903 11,445 10,020 9,066
69 48 76 95 64
17,194 22,843 23,806 23,180 22,863
$ 68,271 $ 85,700 $ 90,030 $ 83,998 $ 86,101
$ (70,563) $ (63,820) $ (65,083) $ (66,982) $ (68,068)(3,599) (5,001) (2,840) (2,416) (2,731)
$ (74,162) $ (68,821) $ (67,923) $ (69,398) $ (70,799)
(Continued)
____________________________________________________________________________________________ STATE OF NEW YORK • 181
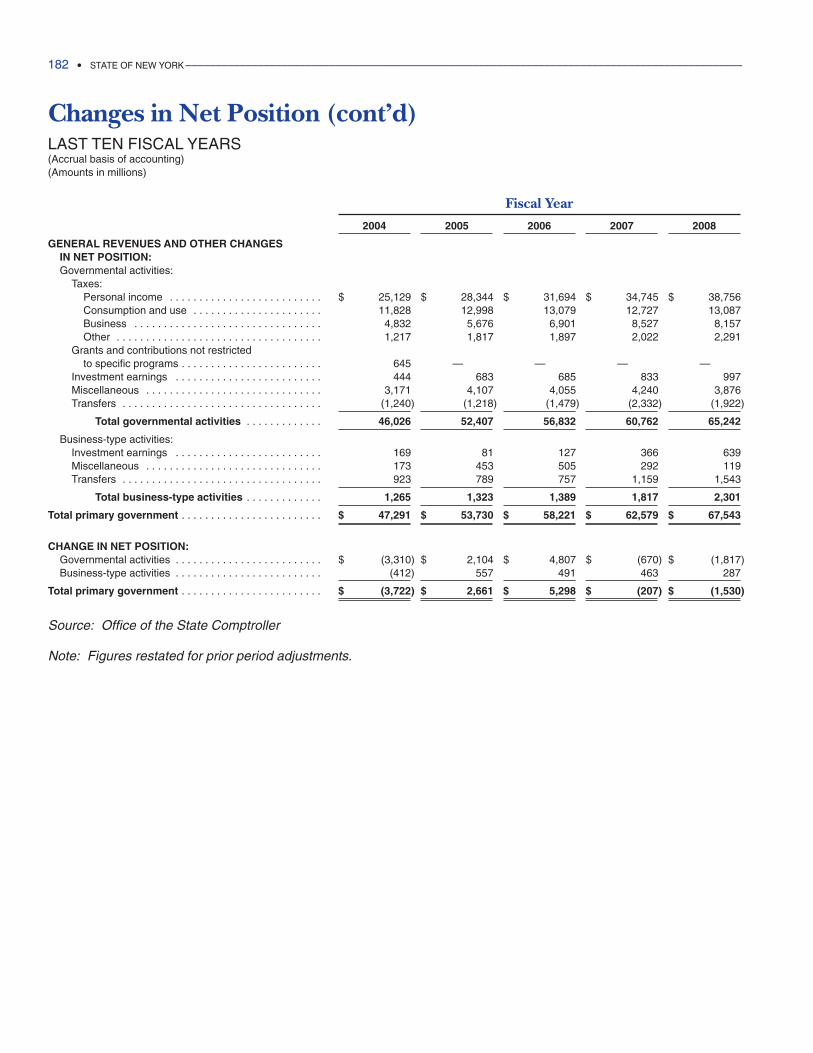
182 • STATE OF NEW YORK _____________________________________________________________________________________________
Changes in Net Position (cont’d)LAST TEN FISCAL YEARS(Accrual basis of accounting)(Amounts in millions)
Fiscal Year
2004 2005 2006 2007 2008
GENERAL REVENUES AND OTHER CHANGES IN NET POSITION:Governmental activities:
Taxes:Personal income . . . . . . . . . . . . . . . . . . . . . . . . . . $ 25,129 $ 28,344 $ 31,694 $ 34,745 $ 38,756Consumption and use . . . . . . . . . . . . . . . . . . . . . . 11,828 12,998 13,079 12,727 13,087Business . . . . . . . . . . . . . . . . . . . . . . . . . . . . . . . . 4,832 5,676 6,901 8,527 8,157Other . . . . . . . . . . . . . . . . . . . . . . . . . . . . . . . . . . . 1,217 1,817 1,897 2,022 2,291
Grants and contributions not restricted to specific programs . . . . . . . . . . . . . . . . . . . . . . . . 645 —00000 —00000 —00000 —00000
Investment earnings . . . . . . . . . . . . . . . . . . . . . . . . . 444 683 685 833 997Miscellaneous . . . . . . . . . . . . . . . . . . . . . . . . . . . . . . 3,171 4,107 4,055 4,240 3,876Transfers . . . . . . . . . . . . . . . . . . . . . . . . . . . . . . . . . . (1,240) (1,218) (1,479) (2,332) (1,922)
Total governmental activities . . . . . . . . . . . . . 46,026 52,407 56,832 60,762 65,242
Business-type activities:Investment earnings . . . . . . . . . . . . . . . . . . . . . . . . . 169 81 127 366 639Miscellaneous . . . . . . . . . . . . . . . . . . . . . . . . . . . . . . 173 453 505 292 119Transfers . . . . . . . . . . . . . . . . . . . . . . . . . . . . . . . . . . 923 789 757 1,159 1,543
Total business-type activities . . . . . . . . . . . . . 1,265 1,323 1,389 1,817 2,301
Total primary government . . . . . . . . . . . . . . . . . . . . . . . . $ 47,291 $ 53,730 $ 58,221 $ 62,579 $ 67,543
CHANGE IN NET POSITION:Governmental activities . . . . . . . . . . . . . . . . . . . . . . . . . $ (3,310) $ 2,104 $ 4,807 $ (670) $ (1,817)Business-type activities . . . . . . . . . . . . . . . . . . . . . . . . . (412) 557 491 463 287
Total primary government . . . . . . . . . . . . . . . . . . . . . . . . $ (3,722) $ 2,661 $ 5,298 $ (207) $ (1,530)
Source: Office of the State Comptroller
Note: Figures restated for prior period adjustments.
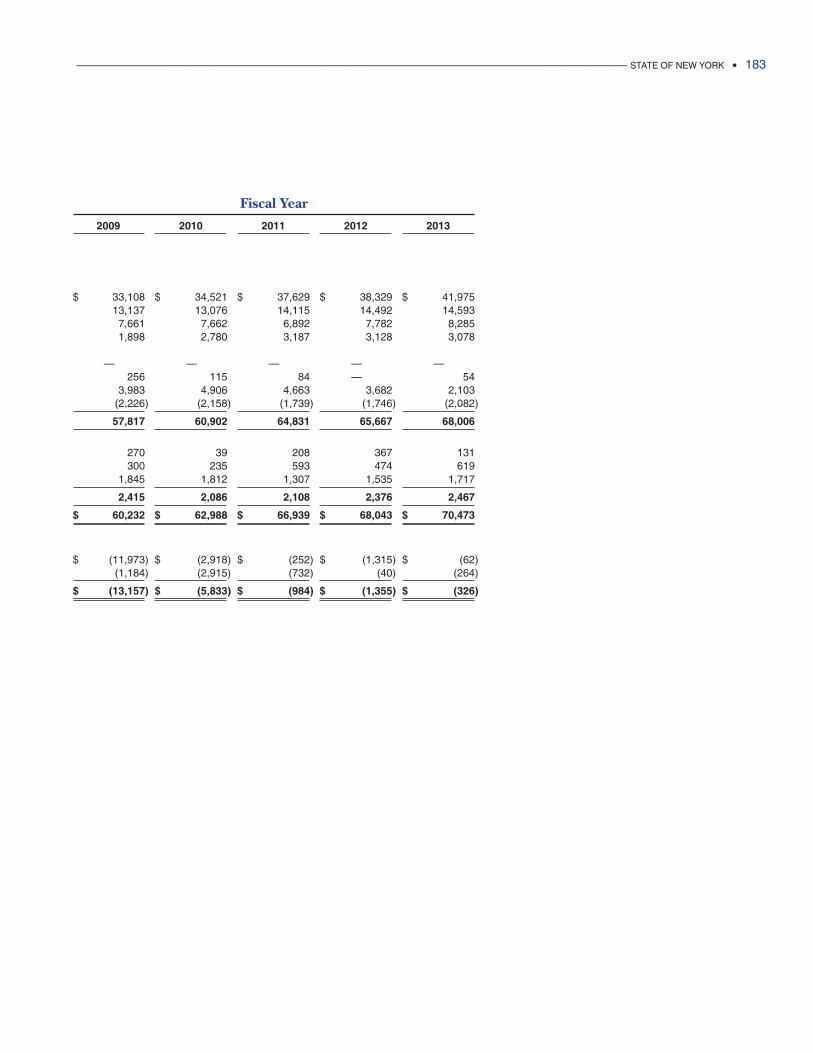
Fiscal Year
2009 2010 2011 2012 2013
$ 33,108 $ 34,521 $ 37,629 $ 38,329 $ 41,97513,137 13,076 14,115 14,492 14,593
7,661 7,662 6,892 7,782 8,2851,898 2,780 3,187 3,128 3,078
—00000 —00000 —00000 —00000 —00000256 115 84 —00000 54
3,983 4,906 4,663 3,682 2,103(2,226) (2,158) (1,739) (1,746) (2,082)
57,817 60,902 64,831 65,667 68,006
270 39 208 367 131300 235 593 474 619
1,845 1,812 1,307 1,535 1,717
2,415 2,086 2,108 2,376 2,467
$ 60,232 $ 62,988 $ 66,939 $ 68,043 $ 70,473
$ (11,973) $ (2,918) $ (252) $ (1,315) $ (62)(1,184) (2,915) (732) (40) (264)
$ (13,157) $ (5,833) $ (984) $ (1,355) $ (326)
____________________________________________________________________________________________ STATE OF NEW YORK • 183
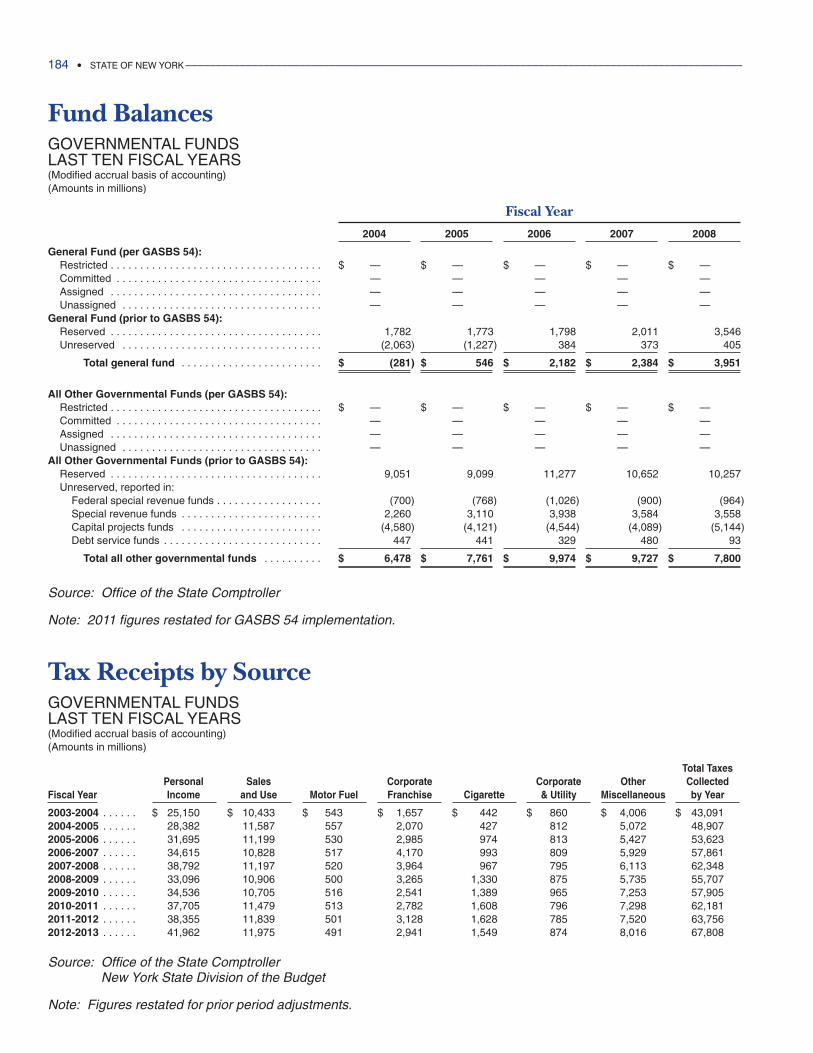
184 • STATE OF NEW YORK _____________________________________________________________________________________________
Fund BalancesGOVERNMENTAL FUNDSLAST TEN FISCAL YEARS(Modified accrual basis of accounting)(Amounts in millions)
Fiscal Year
2004 2005 2006 2007 2008
General Fund (per GASBS 54):Restricted . . . . . . . . . . . . . . . . . . . . . . . . . . . . . . . . . . . . $ —00000 $ —00000 $ —00000 $ —00000 $ —00000Committed . . . . . . . . . . . . . . . . . . . . . . . . . . . . . . . . . . . —00000 —00000 —00000 —00000 —00000Assigned . . . . . . . . . . . . . . . . . . . . . . . . . . . . . . . . . . . . —00000 —00000 —00000 —00000 —00000Unassigned . . . . . . . . . . . . . . . . . . . . . . . . . . . . . . . . . . —00000 —00000 —00000 —00000 —00000
General Fund (prior to GASBS 54):Reserved . . . . . . . . . . . . . . . . . . . . . . . . . . . . . . . . . . . . 1,782 1,773 1,798 2,011 3,546Unreserved . . . . . . . . . . . . . . . . . . . . . . . . . . . . . . . . . . (2,063) (1,227) 384 373 405
Total general fund . . . . . . . . . . . . . . . . . . . . . . . . $ (281) $ 546 $ 2,182 $ 2,384 $ 3,951
All Other Governmental Funds (per GASBS 54):Restricted . . . . . . . . . . . . . . . . . . . . . . . . . . . . . . . . . . . . $ —00000 $ —00000 $ —00000 $ —00000 $ —00000Committed . . . . . . . . . . . . . . . . . . . . . . . . . . . . . . . . . . . —00000 —00000 —00000 —00000 —00000Assigned . . . . . . . . . . . . . . . . . . . . . . . . . . . . . . . . . . . . —00000 —00000 —00000 —00000 —00000Unassigned . . . . . . . . . . . . . . . . . . . . . . . . . . . . . . . . . . —00000 —00000 —00000 —00000 —00000
All Other Governmental Funds (prior to GASBS 54):Reserved . . . . . . . . . . . . . . . . . . . . . . . . . . . . . . . . . . . . 9,051 9,099 11,277 10,652 10,257Unreserved, reported in:
Federal special revenue funds . . . . . . . . . . . . . . . . . . (700) (768) (1,026) (900) (964)Special revenue funds . . . . . . . . . . . . . . . . . . . . . . . . 2,260 3,110 3,938 3,584 3,558Capital projects funds . . . . . . . . . . . . . . . . . . . . . . . . (4,580) (4,121) (4,544) (4,089) (5,144)Debt service funds . . . . . . . . . . . . . . . . . . . . . . . . . . . 447 441 329 480 93
Total all other governmental funds . . . . . . . . . . $ 6,478 $ 7,761 $ 9,974 $ 9,727 $ 7,800
Source: Office of the State Comptroller
Note: 2011 figures restated for GASBS 54 implementation.
Tax Receipts by SourceGOVERNMENTAL FUNDSLAST TEN FISCAL YEARS(Modified accrual basis of accounting)(Amounts in millions)
Total TaxesPersonal Sales Corporate Corporate Other Collected
Fiscal Year Income and Use Motor Fuel Franchise Cigarette & Utility Miscellaneous by Year
2003-2004 . . . . . . $ 25,150 $ 10,433 $ 543 $ 1,657 $ 442 $ 860 $ 4,006 $ 43,0912004-2005 . . . . . . 28,382 11,587 557 2,070 427 812 5,072 48,9072005-2006 . . . . . . 31,695 11,199 530 2,985 974 813 5,427 53,6232006-2007 . . . . . . 34,615 10,828 517 4,170 993 809 5,929 57,8612007-2008 . . . . . . 38,792 11,197 520 3,964 967 795 6,113 62,3482008-2009 . . . . . . 33,096 10,906 500 3,265 1,330 875 5,735 55,7072009-2010 . . . . . . 34,536 10,705 516 2,541 1,389 965 7,253 57,9052010-2011 . . . . . . 37,705 11,479 513 2,782 1,608 796 7,298 62,1812011-2012 . . . . . . 38,355 11,839 501 3,128 1,628 785 7,520 63,7562012-2013 . . . . . . 41,962 11,975 491 2,941 1,549 874 8,016 67,808
Source: Office of the State ComptrollerNew York State Division of the Budget
Note: Figures restated for prior period adjustments.
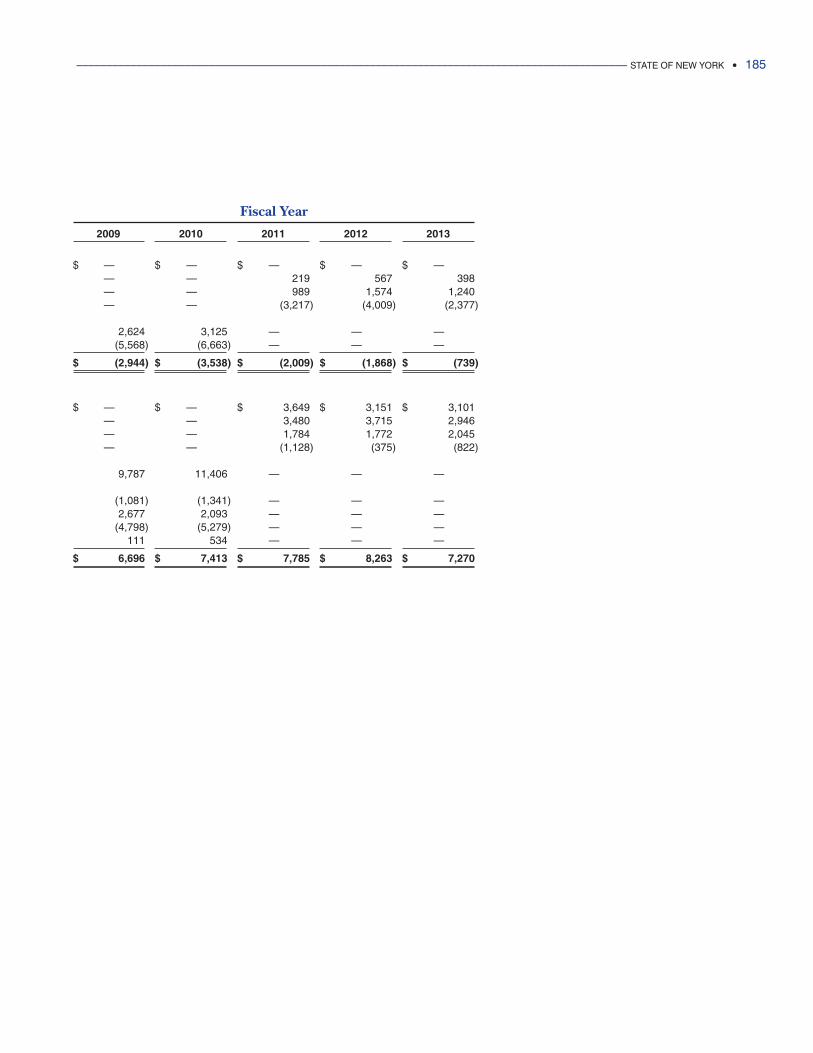
____________________________________________________________________________________________ STATE OF NEW YORK • 185
Fiscal Year
2009 2010 2011 2012 2013
$ —00000 $ —00000 $ —00000 $ —00000 $ —00000—00000 —00000 219 567 398—00000 —00000 989 1,574 1,240—00000 —00000 (3,217) (4,009) (2,377)
2,624 3,125 —00000 —00000 —00000(5,568) (6,663) —00000 —00000 —00000
$ (2,944) $ (3,538) $ (2,009) $ (1,868) $ (739)
$ —00000 $ —00000 $ 3,649 $ 3,151 $ 3,101—00000 —00000 3,480 3,715 2,946—00000 —00000 1,784 1,772 2,045—00000 —00000 (1,128) (375) (822)
9,787 11,406 —00000 —00000 —00000
(1,081) (1,341) —00000 —00000 —000002,677 2,093 —00000 —00000 —00000
(4,798) (5,279) —00000 —00000 —00000111 534 —00000 —00000 —00000
$ 6,696 $ 7,413 $ 7,785 $ 8,263 $ 7,270
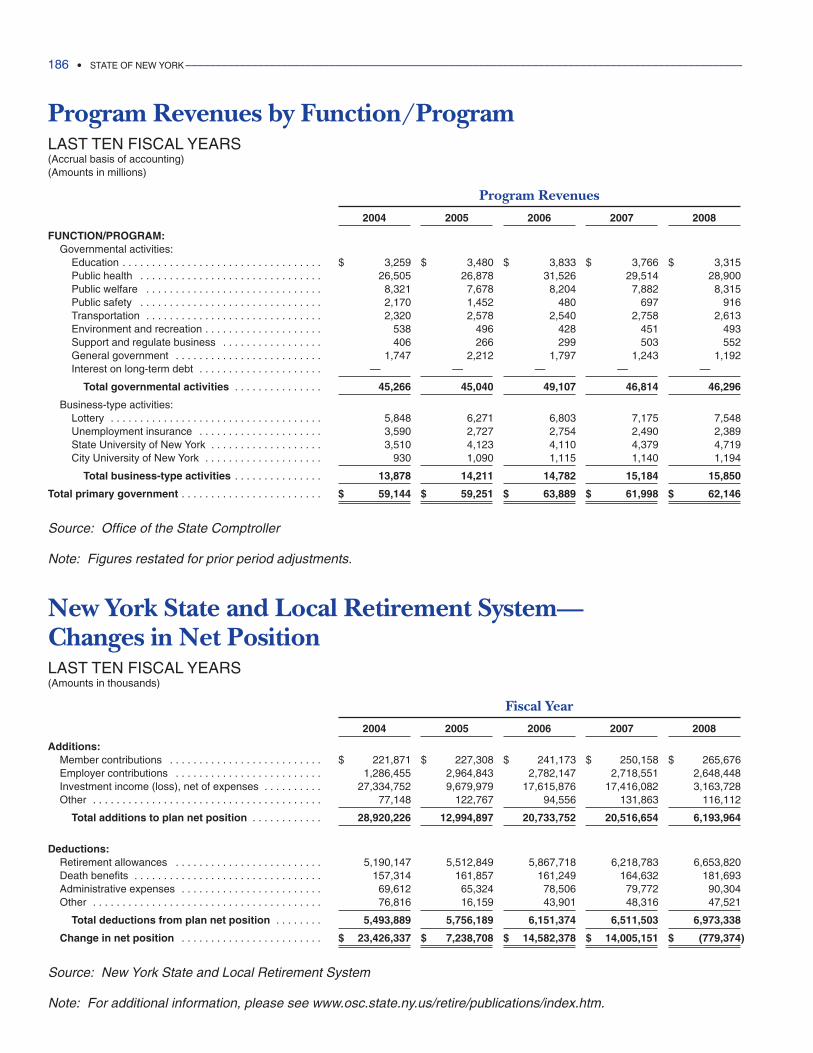
186 • STATE OF NEW YORK _____________________________________________________________________________________________
Program Revenues by Function/ProgramLAST TEN FISCAL YEARS(Accrual basis of accounting)(Amounts in millions)
Program Revenues
2004 2005 2006 2007 2008
FUNCTION/PROGRAM:Governmental activities:
Education . . . . . . . . . . . . . . . . . . . . . . . . . . . . . . . . . . $ 3,259 $ 3,480 $ 3,833 $ 3,766 $ 3,315Public health . . . . . . . . . . . . . . . . . . . . . . . . . . . . . . . 26,505 26,878 31,526 29,514 28,900Public welfare . . . . . . . . . . . . . . . . . . . . . . . . . . . . . . 8,321 7,678 8,204 7,882 8,315Public safety . . . . . . . . . . . . . . . . . . . . . . . . . . . . . . . 2,170 1,452 480 697 916Transportation . . . . . . . . . . . . . . . . . . . . . . . . . . . . . . 2,320 2,578 2,540 2,758 2,613Environment and recreation . . . . . . . . . . . . . . . . . . . . 538 496 428 451 493Support and regulate business . . . . . . . . . . . . . . . . . 406 266 299 503 552General government . . . . . . . . . . . . . . . . . . . . . . . . . 1,747 2,212 1,797 1,243 1,192Interest on long-term debt . . . . . . . . . . . . . . . . . . . . . —00000 —00000 —00000 —00000 —00000
Total governmental activities . . . . . . . . . . . . . . . 45,266 45,040 49,107 46,814 46,296
Business-type activities:Lottery . . . . . . . . . . . . . . . . . . . . . . . . . . . . . . . . . . . . 5,848 6,271 6,803 7,175 7,548Unemployment insurance . . . . . . . . . . . . . . . . . . . . . 3,590 2,727 2,754 2,490 2,389State University of New York . . . . . . . . . . . . . . . . . . . 3,510 4,123 4,110 4,379 4,719City University of New York . . . . . . . . . . . . . . . . . . . . 930 1,090 1,115 1,140 1,194
Total business-type activities . . . . . . . . . . . . . . . 13,878 14,211 14,782 15,184 15,850
Total primary government . . . . . . . . . . . . . . . . . . . . . . . . $ 59,144 $ 59,251 $ 63,889 $ 61,998 $ 62,146
Source: Office of the State Comptroller
Note: Figures restated for prior period adjustments.
New York State and Local Retirement System—Changes in Net PositionLAST TEN FISCAL YEARS(Amounts in thousands)
Fiscal Year
2004 2005 2006 2007 2008
Additions:Member contributions . . . . . . . . . . . . . . . . . . . . . . . . . . $ 221,871 $ 227,308 $ 241,173 $ 250,158 $ 265,676Employer contributions . . . . . . . . . . . . . . . . . . . . . . . . . 1,286,455 2,964,843 2,782,147 2,718,551 2,648,448Investment income (loss), net of expenses . . . . . . . . . . 27,334,752 9,679,979 17,615,876 17,416,082 3,163,728Other . . . . . . . . . . . . . . . . . . . . . . . . . . . . . . . . . . . . . . . 77,148 122,767 94,556 131,863 116,112
Total additions to plan net position . . . . . . . . . . . . 28,920,226 12,994,897 20,733,752 20,516,654 6,193,964
Deductions:Retirement allowances . . . . . . . . . . . . . . . . . . . . . . . . . 5,190,147 5,512,849 5,867,718 6,218,783 6,653,820Death benefits . . . . . . . . . . . . . . . . . . . . . . . . . . . . . . . . 157,314 161,857 161,249 164,632 181,693Administrative expenses . . . . . . . . . . . . . . . . . . . . . . . . 69,612 65,324 78,506 79,772 90,304Other . . . . . . . . . . . . . . . . . . . . . . . . . . . . . . . . . . . . . . . 76,816 16,159 43,901 48,316 47,521
Total deductions from plan net position . . . . . . . . 5,493,889 5,756,189 6,151,374 6,511,503 6,973,338
Change in net position . . . . . . . . . . . . . . . . . . . . . . . . $ 23,426,337 $ 7,238,708 $ 14,582,378 $ 14,005,151 $ (779,374)
Source: New York State and Local Retirement System
Note: For additional information, please see www.osc.state.ny.us/retire/publications/index.htm.
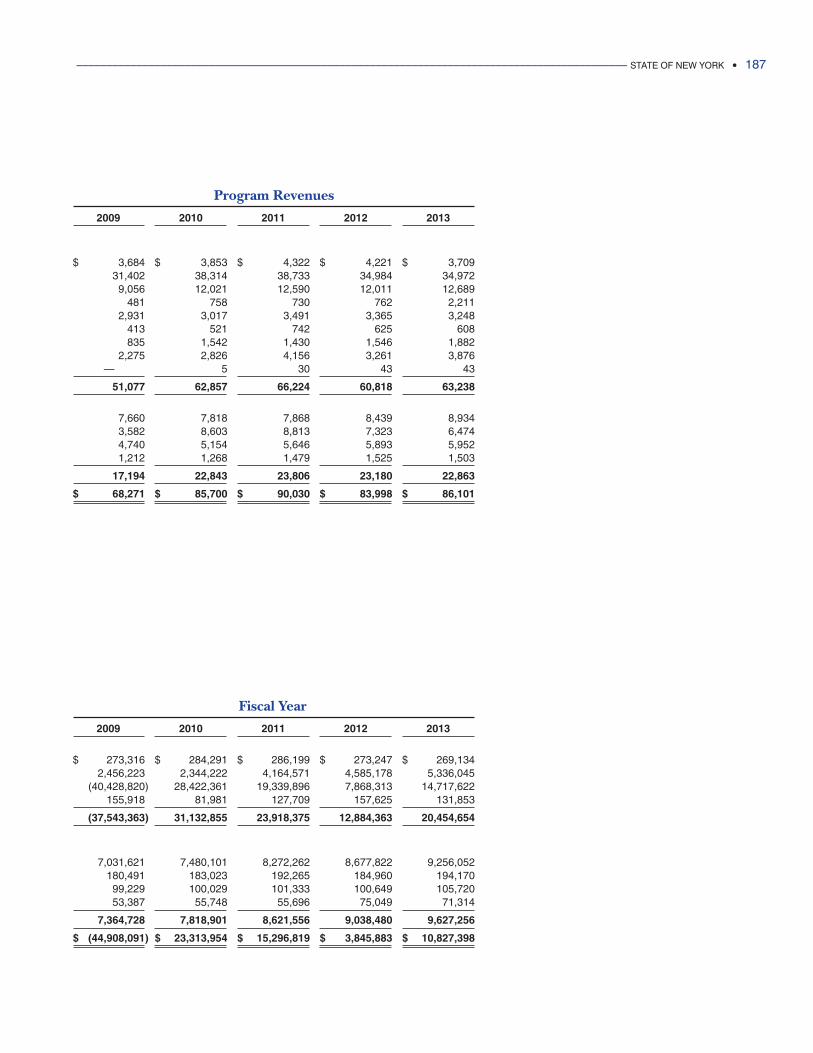
Program Revenues
2009 2010 2011 2012 2013
$ 3,684 $ 3,853 $ 4,322 $ 4,221 $ 3,70931,402 38,314 38,733 34,984 34,972
9,056 12,021 12,590 12,011 12,689481 758 730 762 2,211
2,931 3,017 3,491 3,365 3,248413 521 742 625 608835 1,542 1,430 1,546 1,882
2,275 2,826 4,156 3,261 3,876—00000 5 30 43 43
51,077 62,857 66,224 60,818 63,238
7,660 7,818 7,868 8,439 8,9343,582 8,603 8,813 7,323 6,4744,740 5,154 5,646 5,893 5,9521,212 1,268 1,479 1,525 1,503
17,194 22,843 23,806 23,180 22,863
$ 68,271 $ 85,700 $ 90,030 $ 83,998 $ 86,101
____________________________________________________________________________________________ STATE OF NEW YORK • 187
Fiscal Year
2009 2010 2011 2012 2013
$ 273,316 $ 284,291 $ 286,199 $ 273,247 $ 269,1342,456,223 2,344,222 4,164,571 4,585,178 5,336,045
(40,428,820) 28,422,361 19,339,896 7,868,313 14,717,622155,918 81,981 127,709 157,625 131,853
(37,543,363) 31,132,855 23,918,375 12,884,363 20,454,654
7,031,621 7,480,101 8,272,262 8,677,822 9,256,052180,491 183,023 192,265 184,960 194,17099,229 100,029 101,333 100,649 105,72053,387 55,748 55,696 75,049 71,314
7,364,728 7,818,901 8,621,556 9,038,480 9,627,256
$ (44,908,091) $ 23,313,954 $ 15,296,819 $ 3,845,883 $ 10,827,398
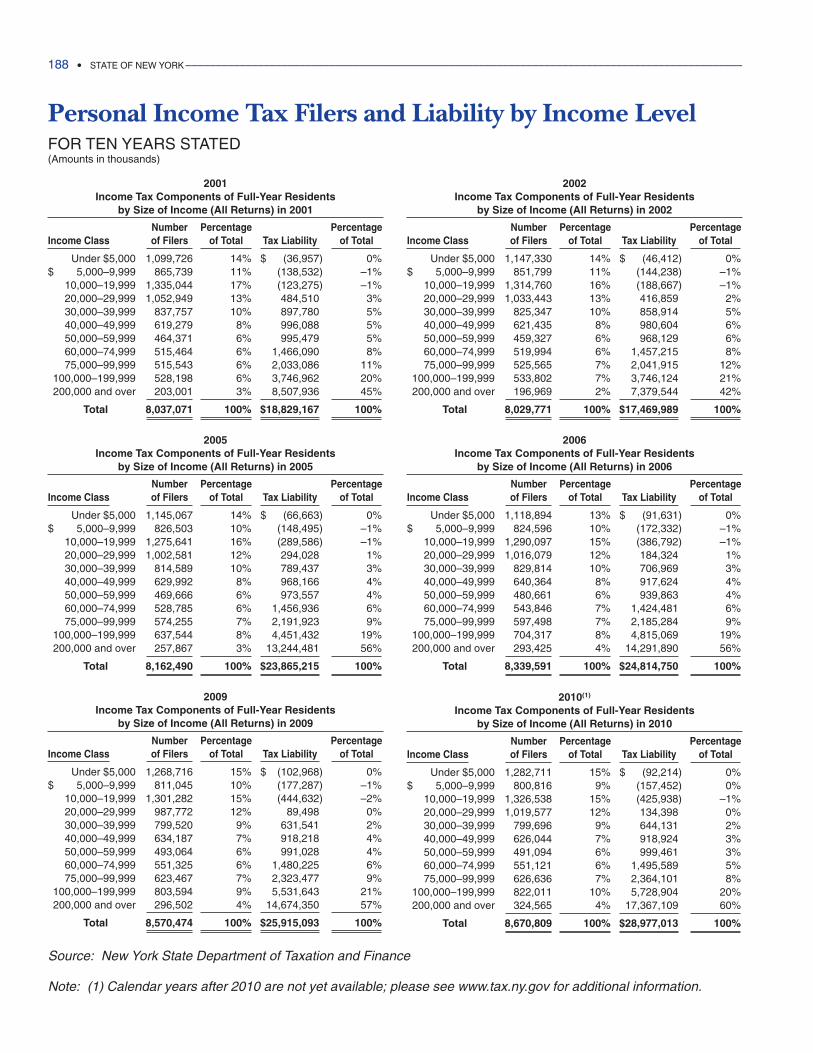
188 • STATE OF NEW YORK _____________________________________________________________________________________________
Personal Income Tax Filers and Liability by Income LevelFOR TEN YEARS STATED(Amounts in thousands)
2001Income Tax Components of Full-Year Residents
by Size of Income (All Returns) in 2001
Number Percentage PercentageIncome Class of Filers of Total Tax Liability of Total
Under $5,000 1,099,726 14% $ (36,957) 0%$ 5,000–9,999 865,739 11% (138,532) –1%
10,000–19,999 1,335,044 17% (123,275) –1%20,000–29,999 1,052,949 13% 484,510 3%30,000–39,999 837,757 10% 897,780 5%40,000–49,999 619,279 8% 996,088 5%50,000–59,999 464,371 6% 995,479 5%60,000–74,999 515,464 6% 1,466,090 8%75,000–99,999 515,543 6% 2,033,086 11%
100,000–199,999 528,198 6% 3,746,962 20%200,000 and over 203,001 3% 8,507,936 45%
Total 8,037,071 100% $18,829,167 100%
2002Income Tax Components of Full-Year Residents
by Size of Income (All Returns) in 2002
Number Percentage PercentageIncome Class of Filers of Total Tax Liability of Total
Under $5,000 1,147,330 14% $ (46,412) 0%$ 5,000–9,999 851,799 11% (144,238) –1%
10,000–19,999 1,314,760 16% (188,667) –1%20,000–29,999 1,033,443 13% 416,859 2%30,000–39,999 825,347 10% 858,914 5%40,000–49,999 621,435 8% 980,604 6%50,000–59,999 459,327 6% 968,129 6%60,000–74,999 519,994 6% 1,457,215 8%75,000–99,999 525,565 7% 2,041,915 12%
100,000–199,999 533,802 7% 3,746,124 21%200,000 and over 196,969 2% 7,379,544 42%
Total 8,029,771 100% $17,469,989 100%
2005Income Tax Components of Full-Year Residents
by Size of Income (All Returns) in 2005
Number Percentage PercentageIncome Class of Filers of Total Tax Liability of Total
Under $5,000 1,145,067 14% $ (66,663) 0%$ 5,000–9,999 826,503 10% (148,495) –1%
10,000–19,999 1,275,641 16% (289,586) –1%20,000–29,999 1,002,581 12% 294,028 1%30,000–39,999 814,589 10% 789,437 3%40,000–49,999 629,992 8% 968,166 4%50,000–59,999 469,666 6% 973,557 4%60,000–74,999 528,785 6% 1,456,936 6%75,000–99,999 574,255 7% 2,191,923 9%
100,000–199,999 637,544 8% 4,451,432 19%200,000 and over 257,867 3% 13,244,481 56%
Total 8,162,490 100% $23,865,215 100%
Source: New York State Department of Taxation and Finance
Note: (1) Calendar years after 2010 are not yet available; please see www.tax.ny.gov for additional information.
2006Income Tax Components of Full-Year Residents
by Size of Income (All Returns) in 2006
Number Percentage PercentageIncome Class of Filers of Total Tax Liability of Total
Under $5,000 1,118,894 13% $ (91,631) 0%$ 5,000–9,999 824,596 10% (172,332) –1%
10,000–19,999 1,290,097 15% (386,792) –1%20,000–29,999 1,016,079 12% 184,324 1%30,000–39,999 829,814 10% 706,969 3%40,000–49,999 640,364 8% 917,624 4%50,000–59,999 480,661 6% 939,863 4%60,000–74,999 543,846 7% 1,424,481 6%75,000–99,999 597,498 7% 2,185,284 9%
100,000–199,999 704,317 8% 4,815,069 19%200,000 and over 293,425 4% 14,291,890 56%
Total 8,339,591 100% $24,814,750 100%
2009Income Tax Components of Full-Year Residents
by Size of Income (All Returns) in 2009
Number Percentage PercentageIncome Class of Filers of Total Tax Liability of Total
Under $5,000 1,268,716 15% $ (102,968) 0%$ 5,000–9,999 811,045 10% (177,287) –1%
10,000–19,999 1,301,282 15% (444,632) –2%20,000–29,999 987,772 12% 89,498 0%30,000–39,999 799,520 9% 631,541 2%40,000–49,999 634,187 7% 918,218 4%50,000–59,999 493,064 6% 991,028 4%60,000–74,999 551,325 6% 1,480,225 6%75,000–99,999 623,467 7% 2,323,477 9%
100,000–199,999 803,594 9% 5,531,643 21%200,000 and over 296,502 4% 14,674,350 57%
Total 8,570,474 100% $25,915,093 100%
2010(1)
Income Tax Components of Full-Year Residents by Size of Income (All Returns) in 2010
Number Percentage PercentageIncome Class of Filers of Total Tax Liability of Total
Under $5,000 1,282,711 15% $ (92,214) 0%$ 5,000–9,999 800,816 9% (157,452) 0%
10,000–19,999 1,326,538 15% (425,938) –1%20,000–29,999 1,019,577 12% 134,398 0%30,000–39,999 799,696 9% 644,131 2%40,000–49,999 626,044 7% 918,924 3%50,000–59,999 491,094 6% 999,461 3%60,000–74,999 551,121 6% 1,495,589 5%75,000–99,999 626,636 7% 2,364,101 8%
100,000–199,999 822,011 10% 5,728,904 20%200,000 and over 324,565 4% 17,367,109 60%
Total 8,670,809 100% $28,977,013 100%
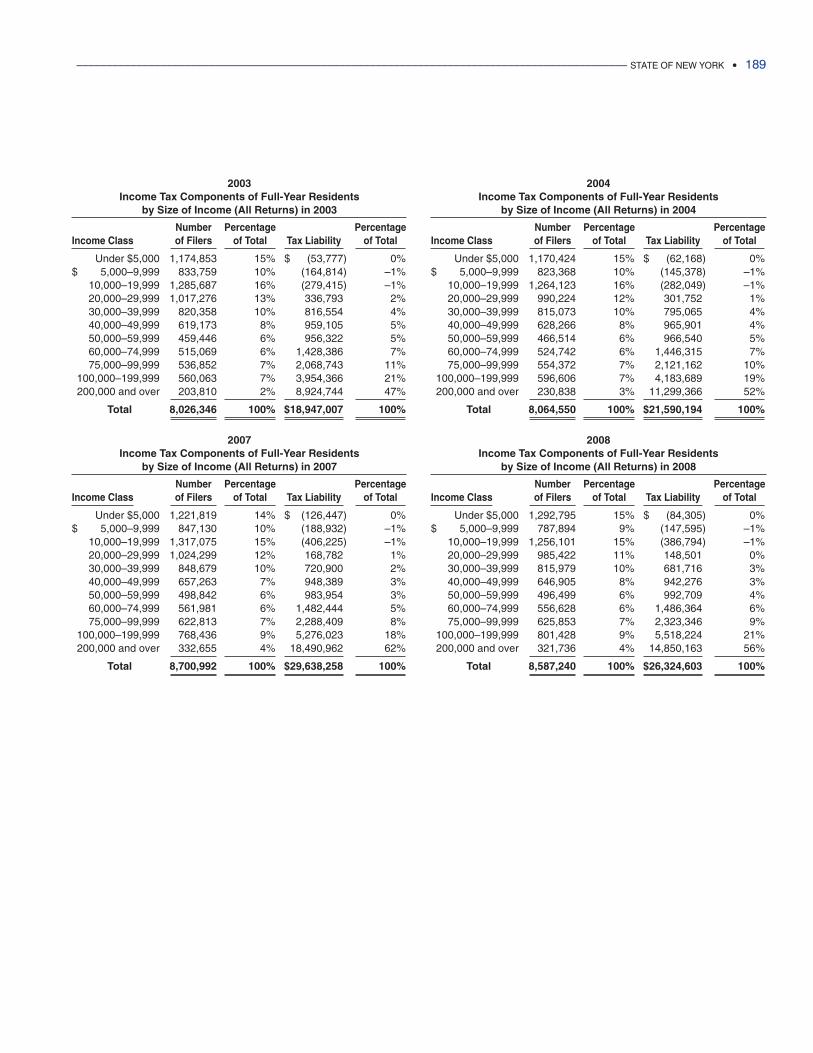
____________________________________________________________________________________________ STATE OF NEW YORK • 189
2003Income Tax Components of Full-Year Residents
by Size of Income (All Returns) in 2003
Number Percentage PercentageIncome Class of Filers of Total Tax Liability of Total
Under $5,000 1,174,853 15% $ (53,777) 0%$ 5,000–9,999 833,759 10% (164,814) –1%
10,000–19,999 1,285,687 16% (279,415) –1%20,000–29,999 1,017,276 13% 336,793 2%30,000–39,999 820,358 10% 816,554 4%40,000–49,999 619,173 8% 959,105 5%50,000–59,999 459,446 6% 956,322 5%60,000–74,999 515,069 6% 1,428,386 7%75,000–99,999 536,852 7% 2,068,743 11%
100,000–199,999 560,063 7% 3,954,366 21%200,000 and over 203,810 2% 8,924,744 47%
Total 8,026,346 100% $18,947,007 100%
2004Income Tax Components of Full-Year Residents
by Size of Income (All Returns) in 2004
Number Percentage PercentageIncome Class of Filers of Total Tax Liability of Total
Under $5,000 1,170,424 15% $ (62,168) 0%$ 5,000–9,999 823,368 10% (145,378) –1%
10,000–19,999 1,264,123 16% (282,049) –1%20,000–29,999 990,224 12% 301,752 1%30,000–39,999 815,073 10% 795,065 4%40,000–49,999 628,266 8% 965,901 4%50,000–59,999 466,514 6% 966,540 5%60,000–74,999 524,742 6% 1,446,315 7%75,000–99,999 554,372 7% 2,121,162 10%
100,000–199,999 596,606 7% 4,183,689 19%200,000 and over 230,838 3% 11,299,366 52%
Total 8,064,550 100% $21,590,194 100%
2007Income Tax Components of Full-Year Residents
by Size of Income (All Returns) in 2007
Number Percentage PercentageIncome Class of Filers of Total Tax Liability of Total
Under $5,000 1,221,819 14% $ (126,447) 0%$ 5,000–9,999 847,130 10% (188,932) –1%
10,000–19,999 1,317,075 15% (406,225) –1%20,000–29,999 1,024,299 12% 168,782 1%30,000–39,999 848,679 10% 720,900 2%40,000–49,999 657,263 7% 948,389 3%50,000–59,999 498,842 6% 983,954 3%60,000–74,999 561,981 6% 1,482,444 5%75,000–99,999 622,813 7% 2,288,409 8%
100,000–199,999 768,436 9% 5,276,023 18%200,000 and over 332,655 4% 18,490,962 62%
Total 8,700,992 100% $29,638,258 100%
2008Income Tax Components of Full-Year Residents
by Size of Income (All Returns) in 2008
Number Percentage PercentageIncome Class of Filers of Total Tax Liability of Total
Under $5,000 1,292,795 15% $ (84,305) 0%$ 5,000–9,999 787,894 9% (147,595) –1%
10,000–19,999 1,256,101 15% (386,794) –1%20,000–29,999 985,422 11% 148,501 0%30,000–39,999 815,979 10% 681,716 3%40,000–49,999 646,905 8% 942,276 3%50,000–59,999 496,499 6% 992,709 4%60,000–74,999 556,628 6% 1,486,364 6%75,000–99,999 625,853 7% 2,323,346 9%
100,000–199,999 801,428 9% 5,518,224 21%200,000 and over 321,736 4% 14,850,163 56%
Total 8,587,240 100% $26,324,603 100%
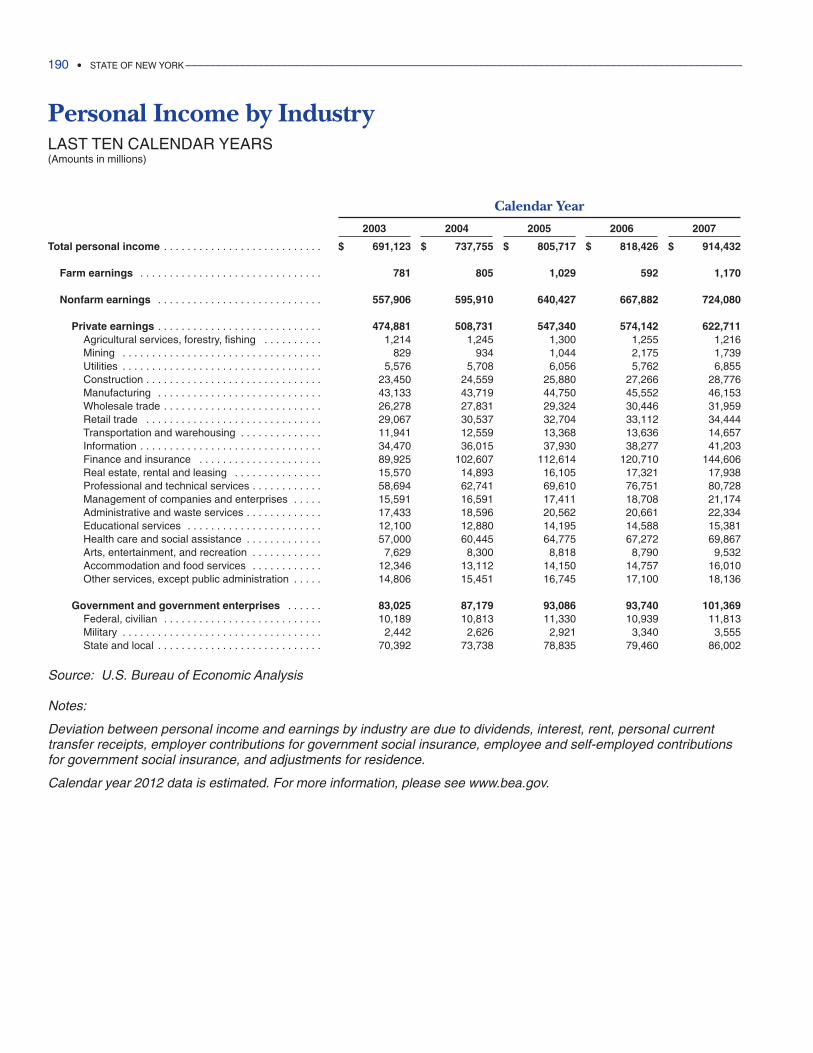
Personal Income by IndustryLAST TEN CALENDAR YEARS(Amounts in millions)
Calendar Year
2003 2004 2005 2006 2007
Total personal income . . . . . . . . . . . . . . . . . . . . . . . . . . . $ 691,123 $ 737,755 $ 805,717 $ 818,426 $ 914,432
Farm earnings . . . . . . . . . . . . . . . . . . . . . . . . . . . . . . . 781 805 1,029 592 1,170
Nonfarm earnings . . . . . . . . . . . . . . . . . . . . . . . . . . . . 557,906 595,910 640,427 667,882 724,080
Private earnings . . . . . . . . . . . . . . . . . . . . . . . . . . . . 474,881 508,731 547,340 574,142 622,711Agricultural services, forestry, fishing . . . . . . . . . . 1,214 1,245 1,300 1,255 1,216Mining . . . . . . . . . . . . . . . . . . . . . . . . . . . . . . . . . . 829 934 1,044 2,175 1,739Utilities . . . . . . . . . . . . . . . . . . . . . . . . . . . . . . . . . . 5,576 5,708 6,056 5,762 6,855Construction . . . . . . . . . . . . . . . . . . . . . . . . . . . . . . 23,450 24,559 25,880 27,266 28,776Manufacturing . . . . . . . . . . . . . . . . . . . . . . . . . . . . 43,133 43,719 44,750 45,552 46,153Wholesale trade . . . . . . . . . . . . . . . . . . . . . . . . . . . 26,278 27,831 29,324 30,446 31,959Retail trade . . . . . . . . . . . . . . . . . . . . . . . . . . . . . . 29,067 30,537 32,704 33,112 34,444Transportation and warehousing . . . . . . . . . . . . . . 11,941 12,559 13,368 13,636 14,657Information . . . . . . . . . . . . . . . . . . . . . . . . . . . . . . . 34,470 36,015 37,930 38,277 41,203Finance and insurance . . . . . . . . . . . . . . . . . . . . . 89,925 102,607 112,614 120,710 144,606Real estate, rental and leasing . . . . . . . . . . . . . . . 15,570 14,893 16,105 17,321 17,938Professional and technical services . . . . . . . . . . . . 58,694 62,741 69,610 76,751 80,728Management of companies and enterprises . . . . . 15,591 16,591 17,411 18,708 21,174Administrative and waste services . . . . . . . . . . . . . 17,433 18,596 20,562 20,661 22,334Educational services . . . . . . . . . . . . . . . . . . . . . . . 12,100 12,880 14,195 14,588 15,381Health care and social assistance . . . . . . . . . . . . . 57,000 60,445 64,775 67,272 69,867Arts, entertainment, and recreation . . . . . . . . . . . . 7,629 8,300 8,818 8,790 9,532Accommodation and food services . . . . . . . . . . . . 12,346 13,112 14,150 14,757 16,010Other services, except public administration . . . . . 14,806 15,451 16,745 17,100 18,136
Government and government enterprises . . . . . . 83,025 87,179 93,086 93,740 101,369Federal, civilian . . . . . . . . . . . . . . . . . . . . . . . . . . . 10,189 10,813 11,330 10,939 11,813Military . . . . . . . . . . . . . . . . . . . . . . . . . . . . . . . . . . 2,442 2,626 2,921 3,340 3,555State and local . . . . . . . . . . . . . . . . . . . . . . . . . . . . 70,392 73,738 78,835 79,460 86,002
Source: U.S. Bureau of Economic Analysis
Notes:
Deviation between personal income and earnings by industry are due to dividends, interest, rent, personal currenttransfer receipts, employer contributions for government social insurance, employee and self-employed contributionsfor government social insurance, and adjustments for residence.
Calendar year 2012 data is estimated. For more information, please see www.bea.gov.
190 • STATE OF NEW YORK _____________________________________________________________________________________________
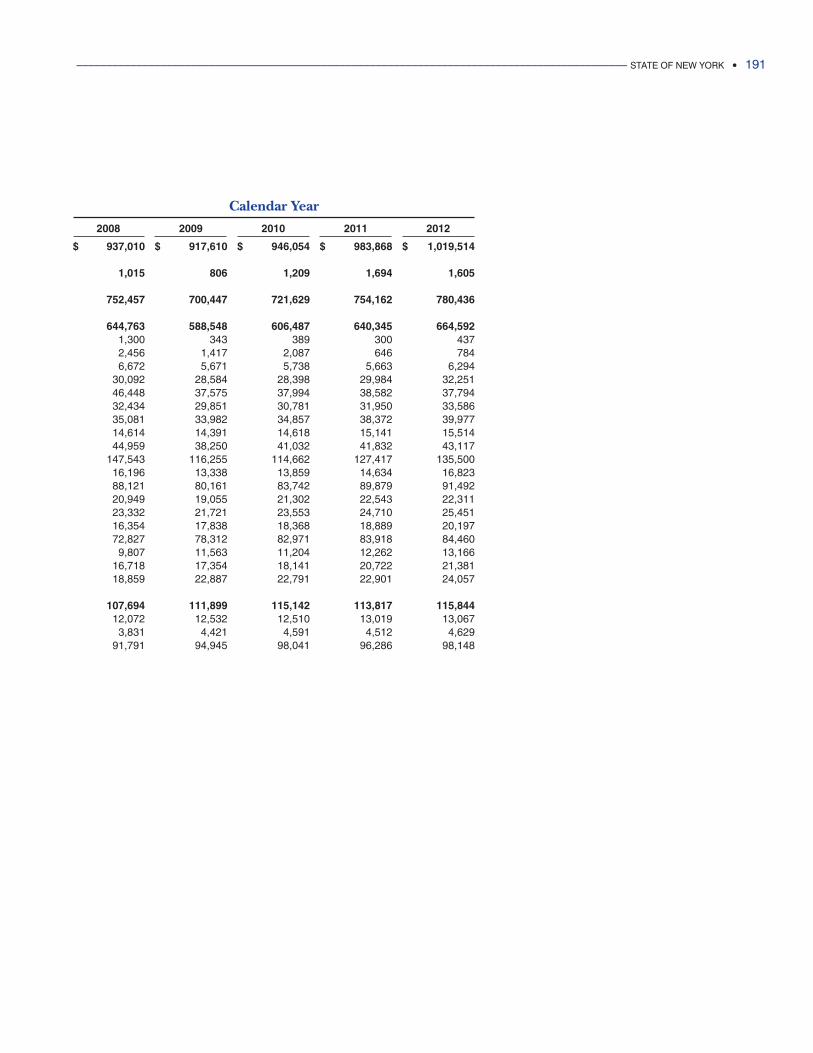
Calendar Year
2008 2009 2010 2011 2012
$ 937,010 $ 917,610 $ 946,054 $ 983,868 $ 1,019,514
1,015 806 1,209 1,694 1,605
752,457 700,447 721,629 754,162 780,436
644,763 588,548 606,487 640,345 664,5921,300 343 389 300 4372,456 1,417 2,087 646 7846,672 5,671 5,738 5,663 6,294
30,092 28,584 28,398 29,984 32,25146,448 37,575 37,994 38,582 37,79432,434 29,851 30,781 31,950 33,58635,081 33,982 34,857 38,372 39,97714,614 14,391 14,618 15,141 15,51444,959 38,250 41,032 41,832 43,117
147,543 116,255 114,662 127,417 135,50016,196 13,338 13,859 14,634 16,82388,121 80,161 83,742 89,879 91,49220,949 19,055 21,302 22,543 22,31123,332 21,721 23,553 24,710 25,45116,354 17,838 18,368 18,889 20,19772,827 78,312 82,971 83,918 84,4609,807 11,563 11,204 12,262 13,166
16,718 17,354 18,141 20,722 21,38118,859 22,887 22,791 22,901 24,057
107,694 111,899 115,142 113,817 115,84412,072 12,532 12,510 13,019 13,067
3,831 4,421 4,591 4,512 4,62991,791 94,945 98,041 96,286 98,148
____________________________________________________________________________________________ STATE OF NEW YORK • 191
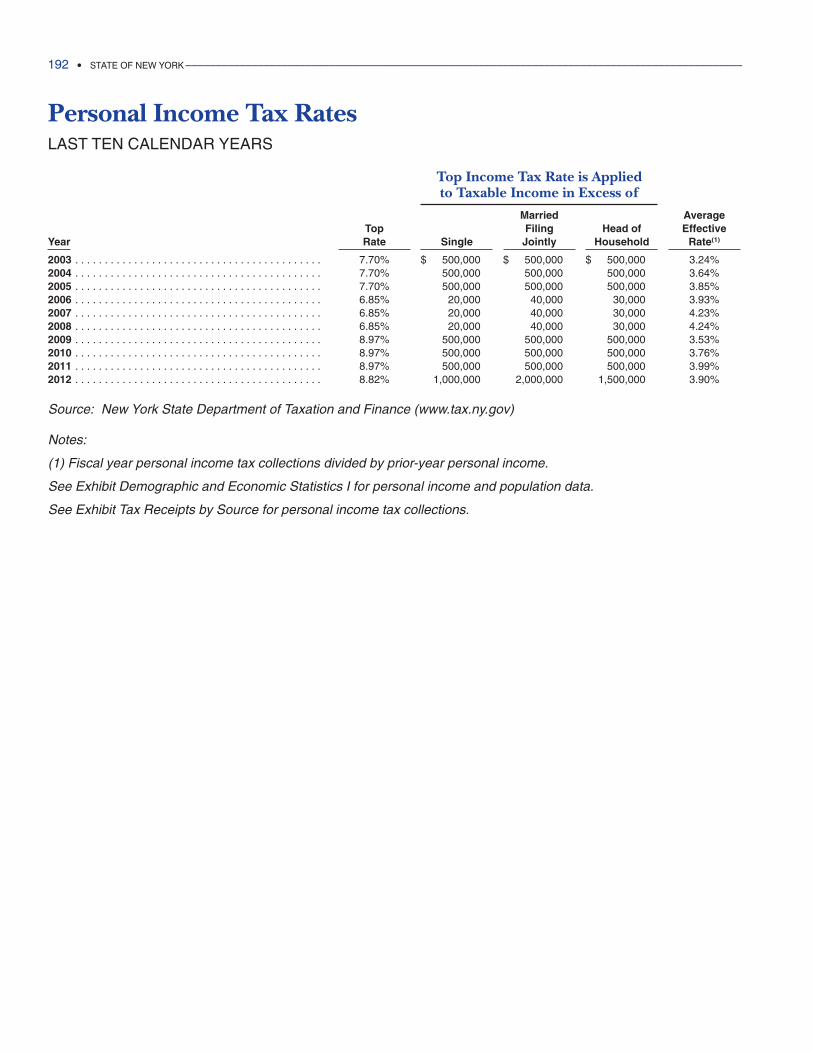
192 • STATE OF NEW YORK _____________________________________________________________________________________________
Personal Income Tax RatesLAST TEN CALENDAR YEARS
Top Income Tax Rate is Appliedto Taxable Income in Excess of
Married AverageTop Filing Head of Effective
Year Rate Single Jointly Household Rate(1)
2003 . . . . . . . . . . . . . . . . . . . . . . . . . . . . . . . . . . . . . . . . . . 7.70% $ 500,000 $ 500,000 $ 500,000 3.24%2004 . . . . . . . . . . . . . . . . . . . . . . . . . . . . . . . . . . . . . . . . . . 7.70% 500,000 500,000 500,000 3.64%2005 . . . . . . . . . . . . . . . . . . . . . . . . . . . . . . . . . . . . . . . . . . 7.70% 500,000 500,000 500,000 3.85%2006 . . . . . . . . . . . . . . . . . . . . . . . . . . . . . . . . . . . . . . . . . . 6.85% 20,000 40,000 30,000 3.93%2007 . . . . . . . . . . . . . . . . . . . . . . . . . . . . . . . . . . . . . . . . . . 6.85% 20,000 40,000 30,000 4.23%2008 . . . . . . . . . . . . . . . . . . . . . . . . . . . . . . . . . . . . . . . . . . 6.85% 20,000 40,000 30,000 4.24%2009 . . . . . . . . . . . . . . . . . . . . . . . . . . . . . . . . . . . . . . . . . . 8.97% 500,000 500,000 500,000 3.53%2010 . . . . . . . . . . . . . . . . . . . . . . . . . . . . . . . . . . . . . . . . . . 8.97% 500,000 500,000 500,000 3.76%2011 . . . . . . . . . . . . . . . . . . . . . . . . . . . . . . . . . . . . . . . . . . 8.97% 500,000 500,000 500,000 3.99%2012 . . . . . . . . . . . . . . . . . . . . . . . . . . . . . . . . . . . . . . . . . . 8.82% 1,000,000 2,000,000 1,500,000 3.90%
Source: New York State Department of Taxation and Finance (www.tax.ny.gov)
Notes:
(1) Fiscal year personal income tax collections divided by prior-year personal income.
See Exhibit Demographic and Economic Statistics I for personal income and population data.
See Exhibit Tax Receipts by Source for personal income tax collections.
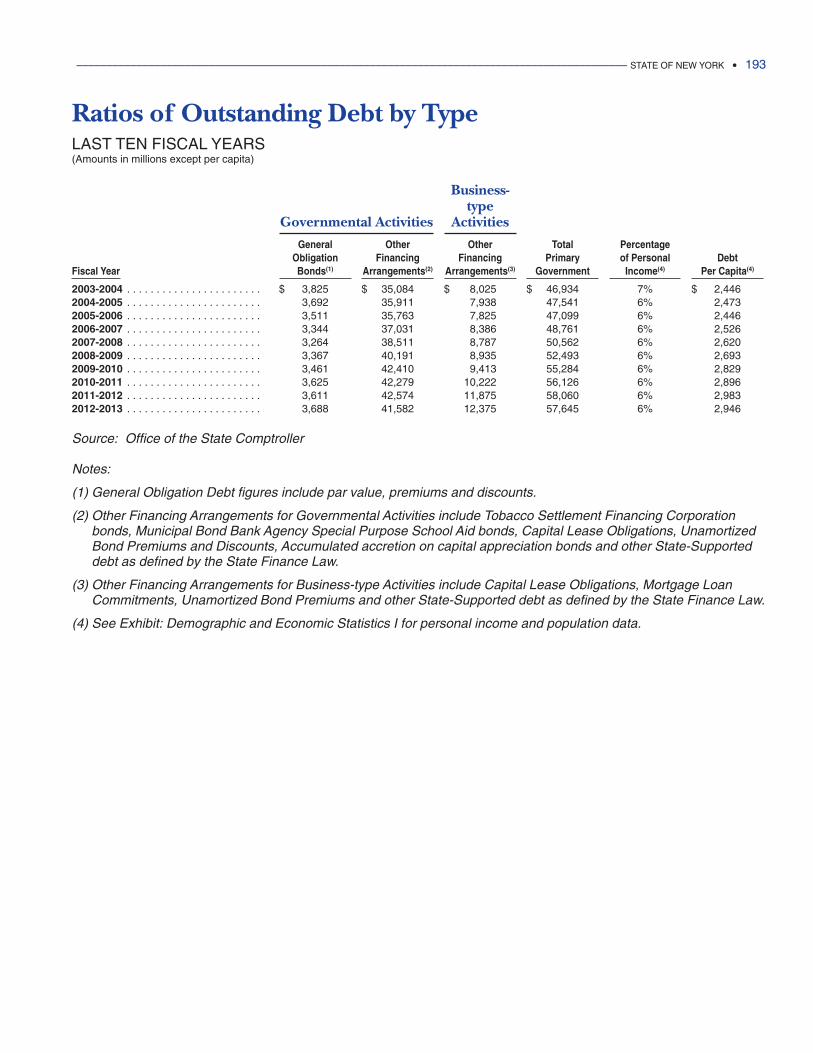
____________________________________________________________________________________________ STATE OF NEW YORK • 193
Ratios of Outstanding Debt by TypeLAST TEN FISCAL YEARS(Amounts in millions except per capita)
Business-type
Governmental Activities Activities
General Other Other Total Percentage Obligation Financing Financing Primary of Personal Debt
Fiscal Year Bonds(1) Arrangements(2) Arrangements(3) Government Income(4) Per Capita(4)
2003-2004 . . . . . . . . . . . . . . . . . . . . . . . $ 3,825 $ 35,084 $ 8,025 $ 46,934 7% $ 2,4462004-2005 . . . . . . . . . . . . . . . . . . . . . . . 3,692 35,911 7,938 47,541 6% 2,4732005-2006 . . . . . . . . . . . . . . . . . . . . . . . 3,511 35,763 7,825 47,099 6% 2,4462006-2007 . . . . . . . . . . . . . . . . . . . . . . . 3,344 37,031 8,386 48,761 6% 2,5262007-2008 . . . . . . . . . . . . . . . . . . . . . . . 3,264 38,511 8,787 50,562 6% 2,6202008-2009 . . . . . . . . . . . . . . . . . . . . . . . 3,367 40,191 8,935 52,493 6% 2,6932009-2010 . . . . . . . . . . . . . . . . . . . . . . . 3,461 42,410 9,413 55,284 6% 2,8292010-2011 . . . . . . . . . . . . . . . . . . . . . . . 3,625 42,279 10,222 56,126 6% 2,8962011-2012 . . . . . . . . . . . . . . . . . . . . . . . 3,611 42,574 11,875 58,060 6% 2,9832012-2013 . . . . . . . . . . . . . . . . . . . . . . . 3,688 41,582 12,375 57,645 6% 2,946
Source: Office of the State Comptroller
Notes:
(1) General Obligation Debt figures include par value, premiums and discounts.
(2) Other Financing Arrangements for Governmental Activities include Tobacco Settlement Financing Corporationbonds, Municipal Bond Bank Agency Special Purpose School Aid bonds, Capital Lease Obligations, UnamortizedBond Premiums and Discounts, Accumulated accretion on capital appreciation bonds and other State-Supporteddebt as defined by the State Finance Law.
(3) Other Financing Arrangements for Business-type Activities include Capital Lease Obligations, Mortgage LoanCommitments, Unamortized Bond Premiums and other State-Supported debt as defined by the State Finance Law.
(4) See Exhibit: Demographic and Economic Statistics I for personal income and population data.
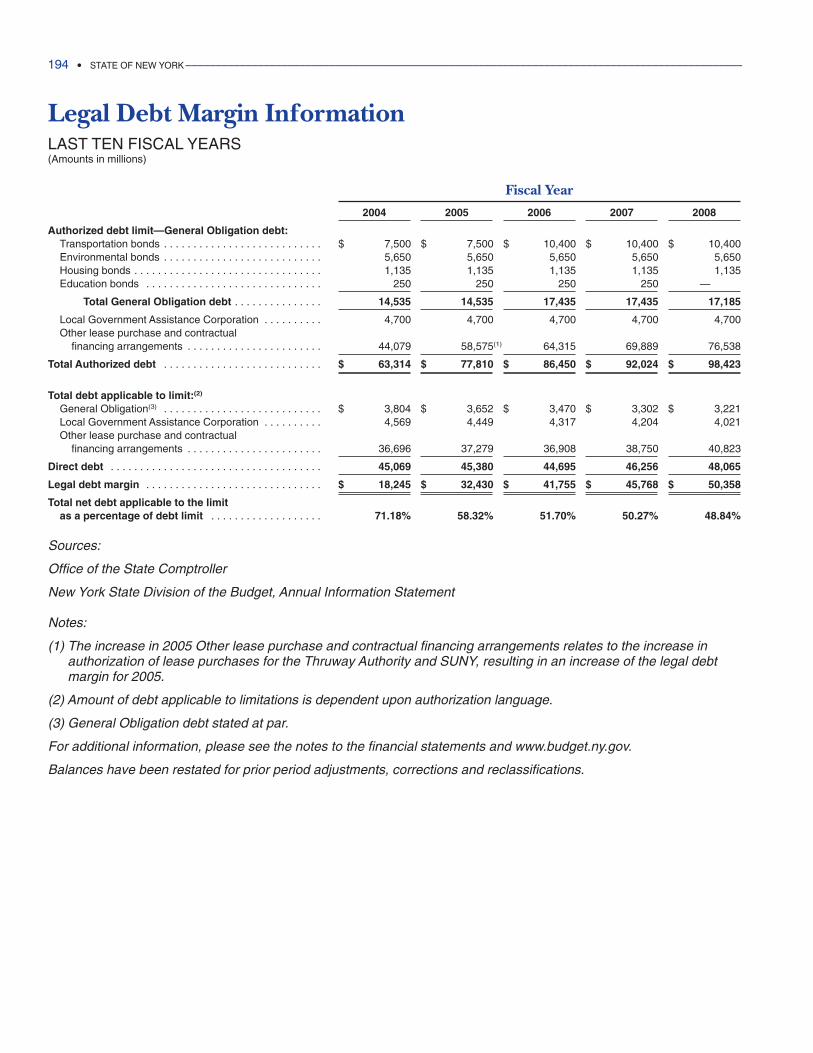
194 • STATE OF NEW YORK _____________________________________________________________________________________________
Legal Debt Margin InformationLAST TEN FISCAL YEARS(Amounts in millions)
Fiscal Year
2004 2005 2006 2007 2008
Authorized debt limit—General Obligation debt:Transportation bonds . . . . . . . . . . . . . . . . . . . . . . . . . . . $ 7,500 $ 7,500 $ 10,400 $ 10,400 $ 10,400Environmental bonds . . . . . . . . . . . . . . . . . . . . . . . . . . . 5,650 5,650 5,650 5,650 5,650Housing bonds . . . . . . . . . . . . . . . . . . . . . . . . . . . . . . . . 1,135 1,135 1,135 1,135 1,135Education bonds . . . . . . . . . . . . . . . . . . . . . . . . . . . . . . 250 250 250 250 —00000
Total General Obligation debt . . . . . . . . . . . . . . . 14,535 14,535 17,435 17,435 17,185
Local Government Assistance Corporation . . . . . . . . . . 4,700 4,700 4,700 4,700 4,700Other lease purchase and contractual
financing arrangements . . . . . . . . . . . . . . . . . . . . . . . 44,079 58,575(1) 64,315 69,889 76,538
Total Authorized debt . . . . . . . . . . . . . . . . . . . . . . . . . . . $ 63,314 $ 77,810 $ 86,450 $ 92,024 $ 98,423
Total debt applicable to limit:(2)
General Obligation(3) . . . . . . . . . . . . . . . . . . . . . . . . . . . $ 3,804 $ 3,652 $ 3,470 $ 3,302 $ 3,221Local Government Assistance Corporation . . . . . . . . . . 4,569 4,449 4,317 4,204 4,021Other lease purchase and contractual
financing arrangements . . . . . . . . . . . . . . . . . . . . . . . 36,696 37,279 36,908 38,750 40,823
Direct debt . . . . . . . . . . . . . . . . . . . . . . . . . . . . . . . . . . . . 45,069 45,380 44,695 46,256 48,065
Legal debt margin . . . . . . . . . . . . . . . . . . . . . . . . . . . . . . $ 18,245 $ 32,430 $ 41,755 $ 45,768 $ 50,358
Total net debt applicable to the limitas a percentage of debt limit . . . . . . . . . . . . . . . . . . . 71.18% 58.32% 51.70% 50.27% 48.84%
Sources:
Office of the State Comptroller
New York State Division of the Budget, Annual Information Statement
Notes:
(1) The increase in 2005 Other lease purchase and contractual financing arrangements relates to the increase inauthorization of lease purchases for the Thruway Authority and SUNY, resulting in an increase of the legal debtmargin for 2005.
(2) Amount of debt applicable to limitations is dependent upon authorization language.
(3) General Obligation debt stated at par.
For additional information, please see the notes to the financial statements and www.budget.ny.gov.
Balances have been restated for prior period adjustments, corrections and reclassifications.
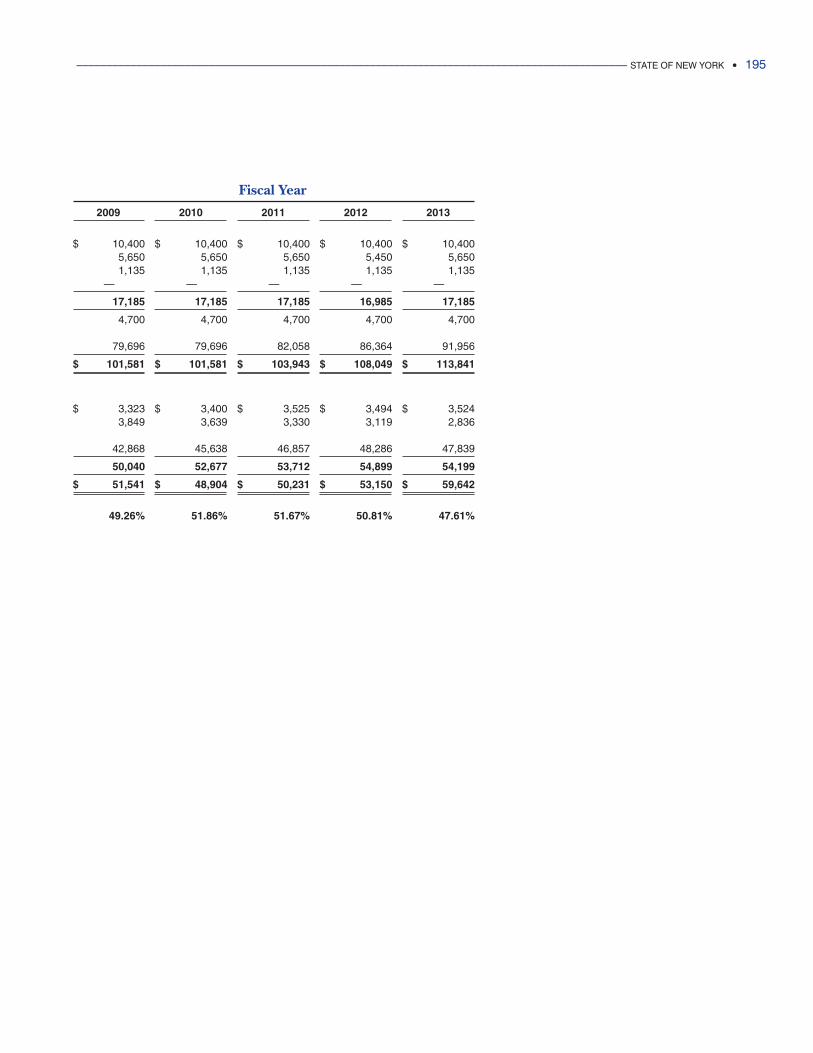
Fiscal Year
2009 2010 2011 2012 2013
$ 10,400 $ 10,400 $ 10,400 $ 10,400 $ 10,4005,650 5,650 5,650 5,450 5,6501,135 1,135 1,135 1,135 1,135
—00000 —00000 —00000 —00000 —00000
17,185 17,185 17,185 16,985 17,185
4,700 4,700 4,700 4,700 4,700
79,696 79,696 82,058 86,364 91,956
$ 101,581 $ 101,581 $ 103,943 $ 108,049 $ 113,841
$ 3,323 $ 3,400 $ 3,525 $ 3,494 $ 3,5243,849 3,639 3,330 3,119 2,836
42,868 45,638 46,857 48,286 47,839
50,040 52,677 53,712 54,899 54,199
$ 51,541 $ 48,904 $ 50,231 $ 53,150 $ 59,642
49.26% 51.86% 51.67% 50.81% 47.61%
____________________________________________________________________________________________ STATE OF NEW YORK • 195
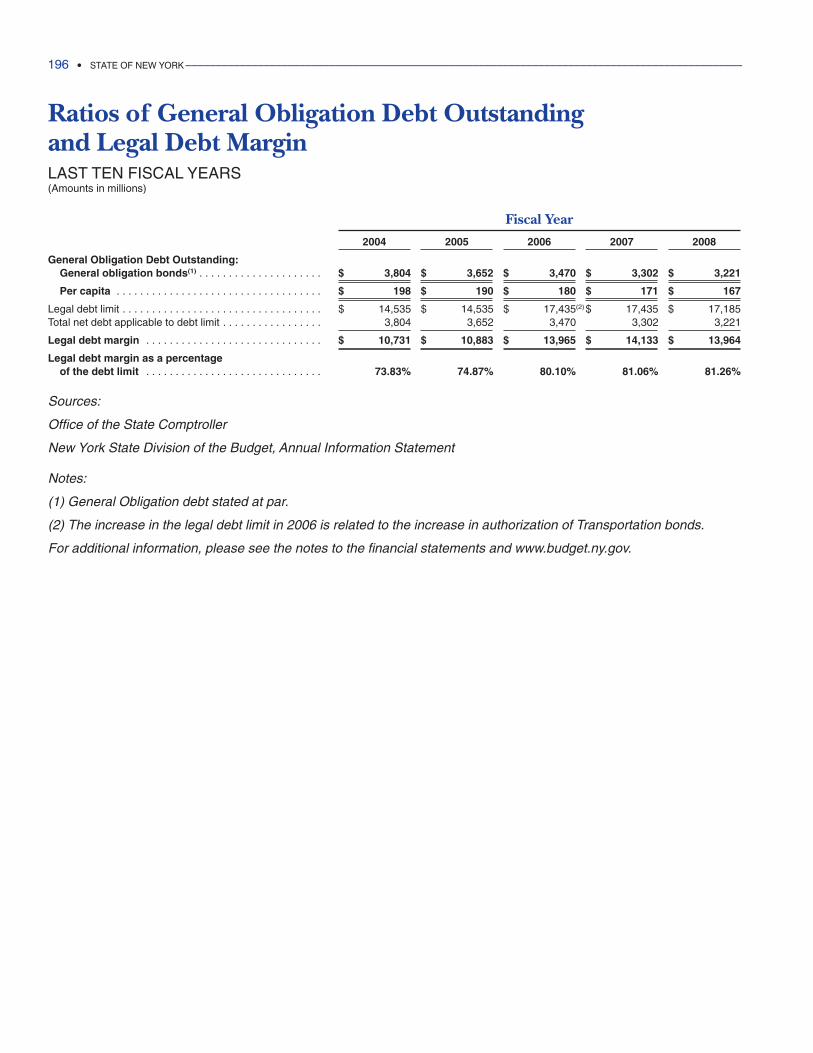
196 • STATE OF NEW YORK _____________________________________________________________________________________________
Ratios of General Obligation Debt Outstanding and Legal Debt MarginLAST TEN FISCAL YEARS(Amounts in millions)
Fiscal Year
2004 2005 2006 2007 2008
General Obligation Debt Outstanding:General obligation bonds(1) . . . . . . . . . . . . . . . . . . . . . $ 3,804 $ 3,652 $ 3,470 $ 3,302 $ 3,221
Per capita . . . . . . . . . . . . . . . . . . . . . . . . . . . . . . . . . . . $ 198 $ 190 $ 180 $ 171 $ 167
Legal debt limit . . . . . . . . . . . . . . . . . . . . . . . . . . . . . . . . . . $ 14,535 $ 14,535 $ 17,435(2) $ 17,435 $ 17,185Total net debt applicable to debt limit . . . . . . . . . . . . . . . . . 3,804 3,652 3,470 3,302 3,221
Legal debt margin . . . . . . . . . . . . . . . . . . . . . . . . . . . . . . $ 10,731 $ 10,883 $ 13,965 $ 14,133 $ 13,964
Legal debt margin as a percentage of the debt limit . . . . . . . . . . . . . . . . . . . . . . . . . . . . . . 73.83% 74.87% 80.10% 81.06% 81.26%
Sources:
Office of the State Comptroller
New York State Division of the Budget, Annual Information Statement
Notes:
(1) General Obligation debt stated at par.
(2) The increase in the legal debt limit in 2006 is related to the increase in authorization of Transportation bonds.
For additional information, please see the notes to the financial statements and www.budget.ny.gov.
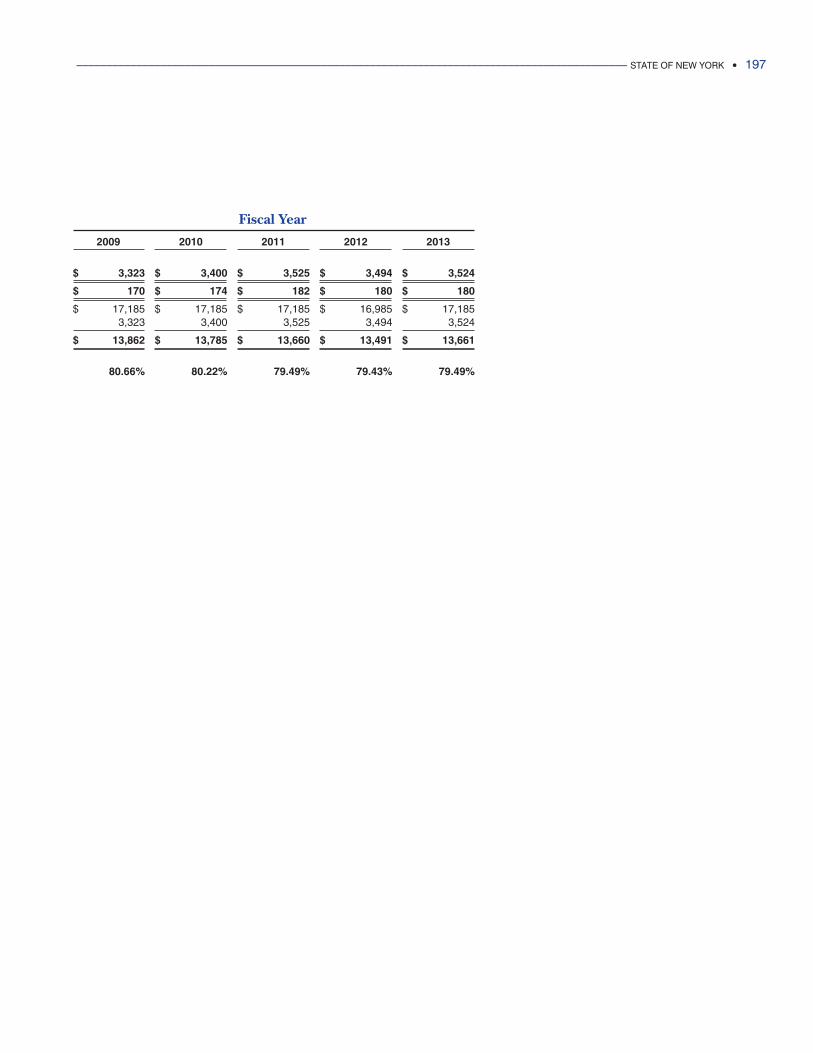
Fiscal Year
2009 2010 2011 2012 2013
$ 3,323 $ 3,400 $ 3,525 $ 3,494 $ 3,524
$ 170 $ 174 $ 182 $ 180 $ 180
$ 17,185 $ 17,185 $ 17,185 $ 16,985 $ 17,1853,323 3,400 3,525 3,494 3,524
$ 13,862 $ 13,785 $ 13,660 $ 13,491 $ 13,661
80.66% 80.22% 79.49% 79.43% 79.49%
____________________________________________________________________________________________ STATE OF NEW YORK • 197
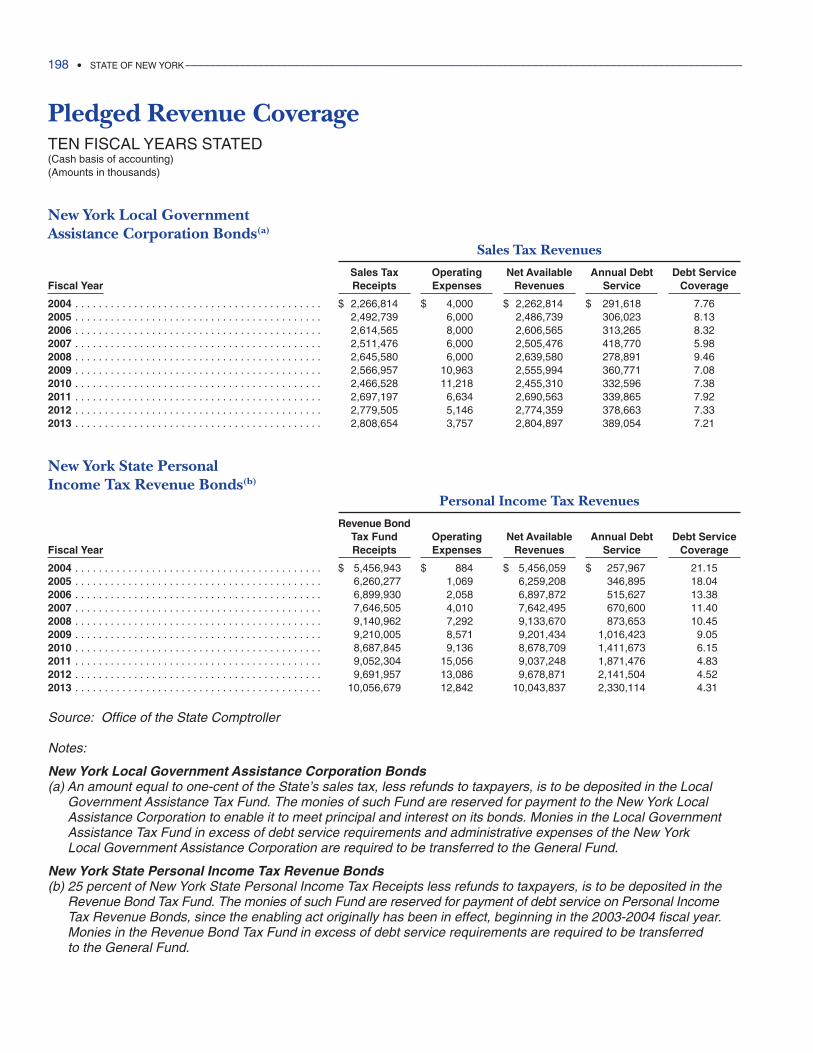
Pledged Revenue CoverageTEN FISCAL YEARS STATED(Cash basis of accounting)(Amounts in thousands)
New York Local Government Assistance Corporation Bonds(a)
Sales Tax Revenues
Sales Tax Operating Net Available Annual Debt Debt ServiceFiscal Year Receipts Expenses Revenues Service Coverage
2004 . . . . . . . . . . . . . . . . . . . . . . . . . . . . . . . . . . . . . . . . . . $ 2,266,814 $ 4,000 $ 2,262,814 $ 291,618 7.762005 . . . . . . . . . . . . . . . . . . . . . . . . . . . . . . . . . . . . . . . . . . 2,492,739 6,000 2,486,739 306,023 8.132006 . . . . . . . . . . . . . . . . . . . . . . . . . . . . . . . . . . . . . . . . . . 2,614,565 8,000 2,606,565 313,265 8.322007 . . . . . . . . . . . . . . . . . . . . . . . . . . . . . . . . . . . . . . . . . . 2,511,476 6,000 2,505,476 418,770 5.982008 . . . . . . . . . . . . . . . . . . . . . . . . . . . . . . . . . . . . . . . . . . 2,645,580 6,000 2,639,580 278,891 9.462009 . . . . . . . . . . . . . . . . . . . . . . . . . . . . . . . . . . . . . . . . . . 2,566,957 10,963 2,555,994 360,771 7.082010 . . . . . . . . . . . . . . . . . . . . . . . . . . . . . . . . . . . . . . . . . . 2,466,528 11,218 2,455,310 332,596 7.382011 . . . . . . . . . . . . . . . . . . . . . . . . . . . . . . . . . . . . . . . . . . 2,697,197 6,634 2,690,563 339,865 7.922012 . . . . . . . . . . . . . . . . . . . . . . . . . . . . . . . . . . . . . . . . . . 2,779,505 5,146 2,774,359 378,663 7.332013 . . . . . . . . . . . . . . . . . . . . . . . . . . . . . . . . . . . . . . . . . . 2,808,654 3,757 2,804,897 389,054 7.21
New York State Personal Income Tax Revenue Bonds(b)
Personal Income Tax Revenues
Revenue BondTax Fund Operating Net Available Annual Debt Debt Service
Fiscal Year Receipts Expenses Revenues Service Coverage
2004 . . . . . . . . . . . . . . . . . . . . . . . . . . . . . . . . . . . . . . . . . . $ 5,456,943 $ 884 $ 5,456,059 $ 257,967 21.152005 . . . . . . . . . . . . . . . . . . . . . . . . . . . . . . . . . . . . . . . . . . 6,260,277 1,069 6,259,208 346,895 18.042006 . . . . . . . . . . . . . . . . . . . . . . . . . . . . . . . . . . . . . . . . . . 6,899,930 2,058 6,897,872 515,627 13.382007 . . . . . . . . . . . . . . . . . . . . . . . . . . . . . . . . . . . . . . . . . . 7,646,505 4,010 7,642,495 670,600 11.402008 . . . . . . . . . . . . . . . . . . . . . . . . . . . . . . . . . . . . . . . . . . 9,140,962 7,292 9,133,670 873,653 10.452009 . . . . . . . . . . . . . . . . . . . . . . . . . . . . . . . . . . . . . . . . . . 9,210,005 8,571 9,201,434 1,016,423 9.052010 . . . . . . . . . . . . . . . . . . . . . . . . . . . . . . . . . . . . . . . . . . 8,687,845 9,136 8,678,709 1,411,673 6.152011 . . . . . . . . . . . . . . . . . . . . . . . . . . . . . . . . . . . . . . . . . . 9,052,304 15,056 9,037,248 1,871,476 4.832012 . . . . . . . . . . . . . . . . . . . . . . . . . . . . . . . . . . . . . . . . . . 9,691,957 13,086 9,678,871 2,141,504 4.522013 . . . . . . . . . . . . . . . . . . . . . . . . . . . . . . . . . . . . . . . . . . 10,056,679 12,842 10,043,837 2,330,114 4.31
Source: Office of the State Comptroller
Notes:
New York Local Government Assistance Corporation Bonds(a) An amount equal to one-cent of the State’s sales tax, less refunds to taxpayers, is to be deposited in the Local
Government Assistance Tax Fund. The monies of such Fund are reserved for payment to the New York LocalAssistance Corporation to enable it to meet principal and interest on its bonds. Monies in the Local GovernmentAssistance Tax Fund in excess of debt service requirements and administrative expenses of the New York Local Government Assistance Corporation are required to be transferred to the General Fund.
New York State Personal Income Tax Revenue Bonds(b) 25 percent of New York State Personal Income Tax Receipts less refunds to taxpayers, is to be deposited in the
Revenue Bond Tax Fund. The monies of such Fund are reserved for payment of debt service on Personal Income Tax Revenue Bonds, since the enabling act originally has been in effect, beginning in the 2003-2004 fiscal year.Monies in the Revenue Bond Tax Fund in excess of debt service requirements are required to be transferred to the General Fund.
198 • STATE OF NEW YORK _____________________________________________________________________________________________
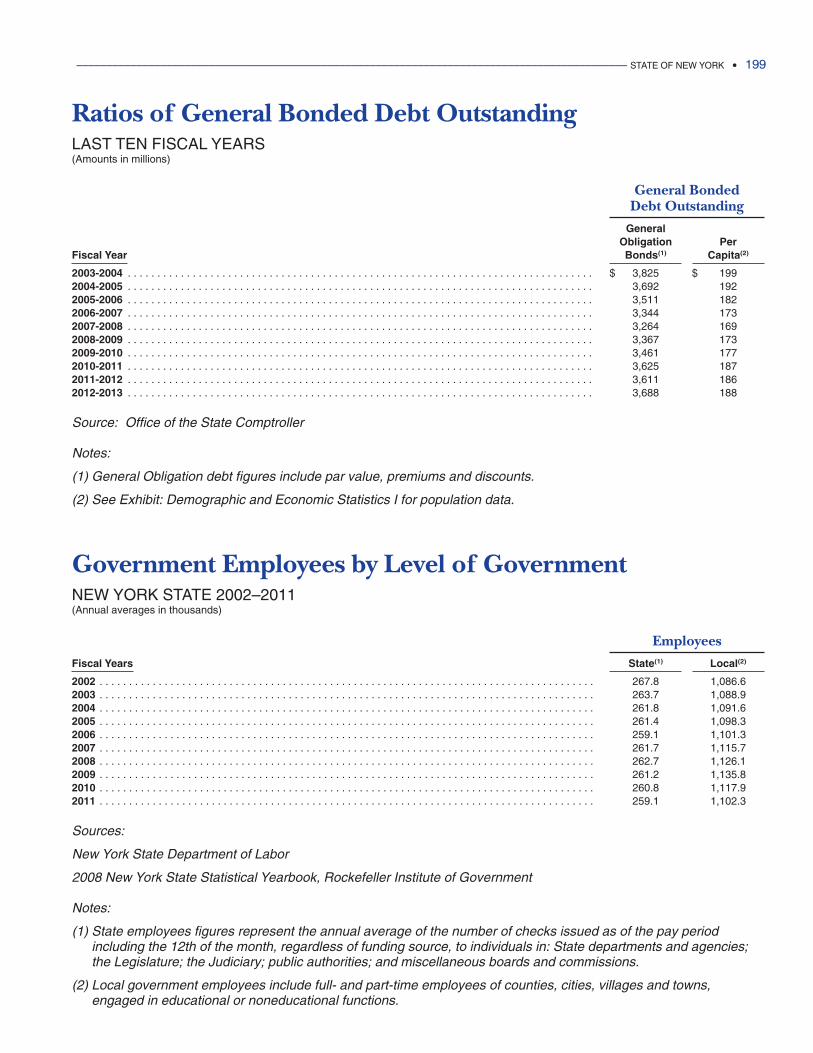
Ratios of General Bonded Debt OutstandingLAST TEN FISCAL YEARS(Amounts in millions)
General BondedDebt Outstanding
GeneralObligation Per
Fiscal Year Bonds(1) Capita(2)
2003-2004 . . . . . . . . . . . . . . . . . . . . . . . . . . . . . . . . . . . . . . . . . . . . . . . . . . . . . . . . . . . . . . . . . . . . . . . . . . . . . . . $ 3,825 $ 1992004-2005 . . . . . . . . . . . . . . . . . . . . . . . . . . . . . . . . . . . . . . . . . . . . . . . . . . . . . . . . . . . . . . . . . . . . . . . . . . . . . . . 3,692 1922005-2006 . . . . . . . . . . . . . . . . . . . . . . . . . . . . . . . . . . . . . . . . . . . . . . . . . . . . . . . . . . . . . . . . . . . . . . . . . . . . . . . 3,511 1822006-2007 . . . . . . . . . . . . . . . . . . . . . . . . . . . . . . . . . . . . . . . . . . . . . . . . . . . . . . . . . . . . . . . . . . . . . . . . . . . . . . . 3,344 1732007-2008 . . . . . . . . . . . . . . . . . . . . . . . . . . . . . . . . . . . . . . . . . . . . . . . . . . . . . . . . . . . . . . . . . . . . . . . . . . . . . . . 3,264 1692008-2009 . . . . . . . . . . . . . . . . . . . . . . . . . . . . . . . . . . . . . . . . . . . . . . . . . . . . . . . . . . . . . . . . . . . . . . . . . . . . . . . 3,367 1732009-2010 . . . . . . . . . . . . . . . . . . . . . . . . . . . . . . . . . . . . . . . . . . . . . . . . . . . . . . . . . . . . . . . . . . . . . . . . . . . . . . . 3,461 1772010-2011 . . . . . . . . . . . . . . . . . . . . . . . . . . . . . . . . . . . . . . . . . . . . . . . . . . . . . . . . . . . . . . . . . . . . . . . . . . . . . . . 3,625 1872011-2012 . . . . . . . . . . . . . . . . . . . . . . . . . . . . . . . . . . . . . . . . . . . . . . . . . . . . . . . . . . . . . . . . . . . . . . . . . . . . . . . 3,611 1862012-2013 . . . . . . . . . . . . . . . . . . . . . . . . . . . . . . . . . . . . . . . . . . . . . . . . . . . . . . . . . . . . . . . . . . . . . . . . . . . . . . . 3,688 188
Source: Office of the State Comptroller
Notes:
(1) General Obligation debt figures include par value, premiums and discounts.
(2) See Exhibit: Demographic and Economic Statistics I for population data.
____________________________________________________________________________________________ STATE OF NEW YORK • 199
Government Employees by Level of GovernmentNEW YORK STATE 2002–2011(Annual averages in thousands)
Employees
Fiscal Years State(1) Local(2)
2002 . . . . . . . . . . . . . . . . . . . . . . . . . . . . . . . . . . . . . . . . . . . . . . . . . . . . . . . . . . . . . . . . . . . . . . . . . . . . . . . . . . . . 267.8 1,086.62003 . . . . . . . . . . . . . . . . . . . . . . . . . . . . . . . . . . . . . . . . . . . . . . . . . . . . . . . . . . . . . . . . . . . . . . . . . . . . . . . . . . . . 263.7 1,088.92004 . . . . . . . . . . . . . . . . . . . . . . . . . . . . . . . . . . . . . . . . . . . . . . . . . . . . . . . . . . . . . . . . . . . . . . . . . . . . . . . . . . . . 261.8 1,091.62005 . . . . . . . . . . . . . . . . . . . . . . . . . . . . . . . . . . . . . . . . . . . . . . . . . . . . . . . . . . . . . . . . . . . . . . . . . . . . . . . . . . . . 261.4 1,098.32006 . . . . . . . . . . . . . . . . . . . . . . . . . . . . . . . . . . . . . . . . . . . . . . . . . . . . . . . . . . . . . . . . . . . . . . . . . . . . . . . . . . . . 259.1 1,101.32007 . . . . . . . . . . . . . . . . . . . . . . . . . . . . . . . . . . . . . . . . . . . . . . . . . . . . . . . . . . . . . . . . . . . . . . . . . . . . . . . . . . . . 261.7 1,115.72008 . . . . . . . . . . . . . . . . . . . . . . . . . . . . . . . . . . . . . . . . . . . . . . . . . . . . . . . . . . . . . . . . . . . . . . . . . . . . . . . . . . . . 262.7 1,126.12009 . . . . . . . . . . . . . . . . . . . . . . . . . . . . . . . . . . . . . . . . . . . . . . . . . . . . . . . . . . . . . . . . . . . . . . . . . . . . . . . . . . . . 261.2 1,135.82010 . . . . . . . . . . . . . . . . . . . . . . . . . . . . . . . . . . . . . . . . . . . . . . . . . . . . . . . . . . . . . . . . . . . . . . . . . . . . . . . . . . . . 260.8 1,117.92011 . . . . . . . . . . . . . . . . . . . . . . . . . . . . . . . . . . . . . . . . . . . . . . . . . . . . . . . . . . . . . . . . . . . . . . . . . . . . . . . . . . . . 259.1 1,102.3
Sources:
New York State Department of Labor
2008 New York State Statistical Yearbook, Rockefeller Institute of Government
Notes:
(1) State employees figures represent the annual average of the number of checks issued as of the pay periodincluding the 12th of the month, regardless of funding source, to individuals in: State departments and agencies;the Legislature; the Judiciary; public authorities; and miscellaneous boards and commissions.
(2) Local government employees include full- and part-time employees of counties, cities, villages and towns,engaged in educational or noneducational functions.
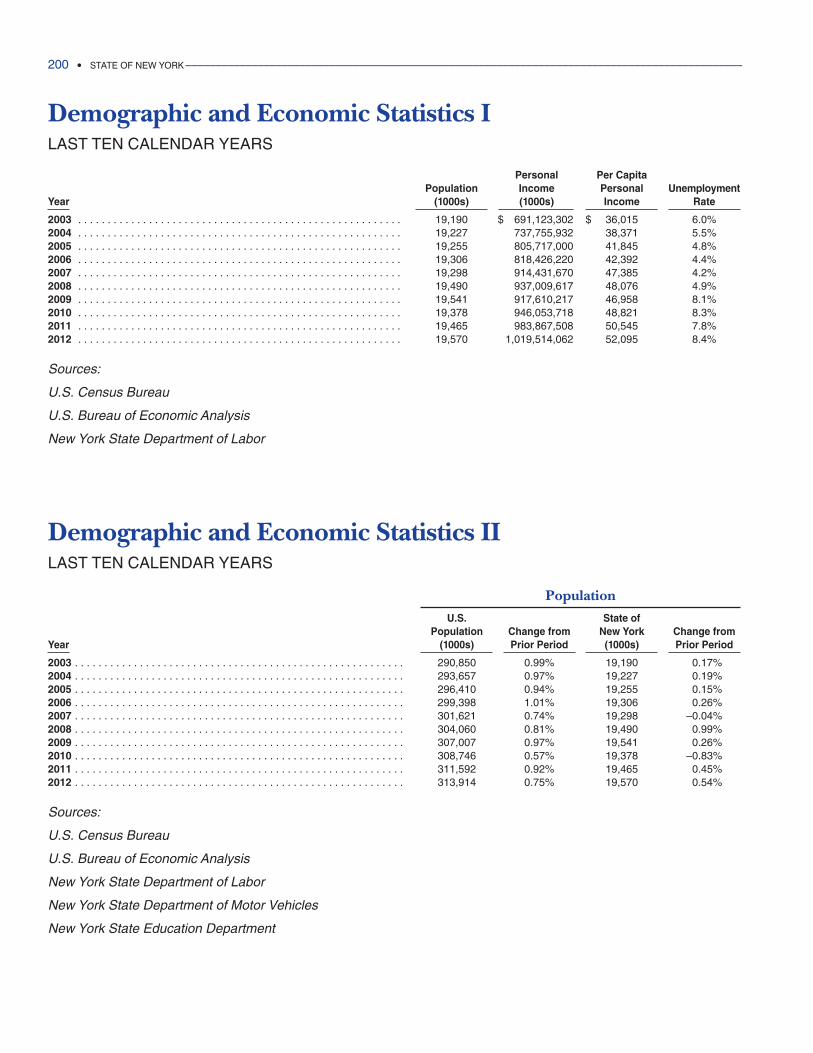
Demographic and Economic Statistics IILAST TEN CALENDAR YEARS
200 • STATE OF NEW YORK _____________________________________________________________________________________________
Population
U.S. State ofPopulation Change from New York Change from
Year (1000s) Prior Period (1000s) Prior Period
2003 . . . . . . . . . . . . . . . . . . . . . . . . . . . . . . . . . . . . . . . . . . . . . . . . . . . . . . . . 290,850 0.99% 19,190 0.17%2004 . . . . . . . . . . . . . . . . . . . . . . . . . . . . . . . . . . . . . . . . . . . . . . . . . . . . . . . . 293,657 0.97% 19,227 0.19%2005 . . . . . . . . . . . . . . . . . . . . . . . . . . . . . . . . . . . . . . . . . . . . . . . . . . . . . . . . 296,410 0.94% 19,255 0.15%2006 . . . . . . . . . . . . . . . . . . . . . . . . . . . . . . . . . . . . . . . . . . . . . . . . . . . . . . . . 299,398 1.01% 19,306 0.26%2007 . . . . . . . . . . . . . . . . . . . . . . . . . . . . . . . . . . . . . . . . . . . . . . . . . . . . . . . . 301,621 0.74% 19,298 –0.04%2008 . . . . . . . . . . . . . . . . . . . . . . . . . . . . . . . . . . . . . . . . . . . . . . . . . . . . . . . . 304,060 0.81% 19,490 0.99%2009 . . . . . . . . . . . . . . . . . . . . . . . . . . . . . . . . . . . . . . . . . . . . . . . . . . . . . . . . 307,007 0.97% 19,541 0.26%2010 . . . . . . . . . . . . . . . . . . . . . . . . . . . . . . . . . . . . . . . . . . . . . . . . . . . . . . . . 308,746 0.57% 19,378 –0.83%2011 . . . . . . . . . . . . . . . . . . . . . . . . . . . . . . . . . . . . . . . . . . . . . . . . . . . . . . . . 311,592 0.92% 19,465 0.45%2012 . . . . . . . . . . . . . . . . . . . . . . . . . . . . . . . . . . . . . . . . . . . . . . . . . . . . . . . . 313,914 0.75% 19,570 0.54%
Sources:
U.S. Census Bureau
U.S. Bureau of Economic Analysis
New York State Department of Labor
New York State Department of Motor Vehicles
New York State Education Department
Demographic and Economic Statistics ILAST TEN CALENDAR YEARS
Personal Per CapitaPopulation Income Personal Unemployment
Year (1000s) (1000s) Income Rate
2003 . . . . . . . . . . . . . . . . . . . . . . . . . . . . . . . . . . . . . . . . . . . . . . . . . . . . . . . 19,190 $ 691,123,302 $ 36,015 6.0%2004 . . . . . . . . . . . . . . . . . . . . . . . . . . . . . . . . . . . . . . . . . . . . . . . . . . . . . . . 19,227 737,755,932 38,371 5.5%2005 . . . . . . . . . . . . . . . . . . . . . . . . . . . . . . . . . . . . . . . . . . . . . . . . . . . . . . . 19,255 805,717,000 41,845 4.8%2006 . . . . . . . . . . . . . . . . . . . . . . . . . . . . . . . . . . . . . . . . . . . . . . . . . . . . . . . 19,306 818,426,220 42,392 4.4%2007 . . . . . . . . . . . . . . . . . . . . . . . . . . . . . . . . . . . . . . . . . . . . . . . . . . . . . . . 19,298 914,431,670 47,385 4.2%2008 . . . . . . . . . . . . . . . . . . . . . . . . . . . . . . . . . . . . . . . . . . . . . . . . . . . . . . . 19,490 937,009,617 48,076 4.9%2009 . . . . . . . . . . . . . . . . . . . . . . . . . . . . . . . . . . . . . . . . . . . . . . . . . . . . . . . 19,541 917,610,217 46,958 8.1%2010 . . . . . . . . . . . . . . . . . . . . . . . . . . . . . . . . . . . . . . . . . . . . . . . . . . . . . . . 19,378 946,053,718 48,821 8.3%2011 . . . . . . . . . . . . . . . . . . . . . . . . . . . . . . . . . . . . . . . . . . . . . . . . . . . . . . . 19,465 983,867,508 50,545 7.8%2012 . . . . . . . . . . . . . . . . . . . . . . . . . . . . . . . . . . . . . . . . . . . . . . . . . . . . . . . 19,570 1,019,514,062 52,095 8.4%
Sources:
U.S. Census Bureau
U.S. Bureau of Economic Analysis
New York State Department of Labor
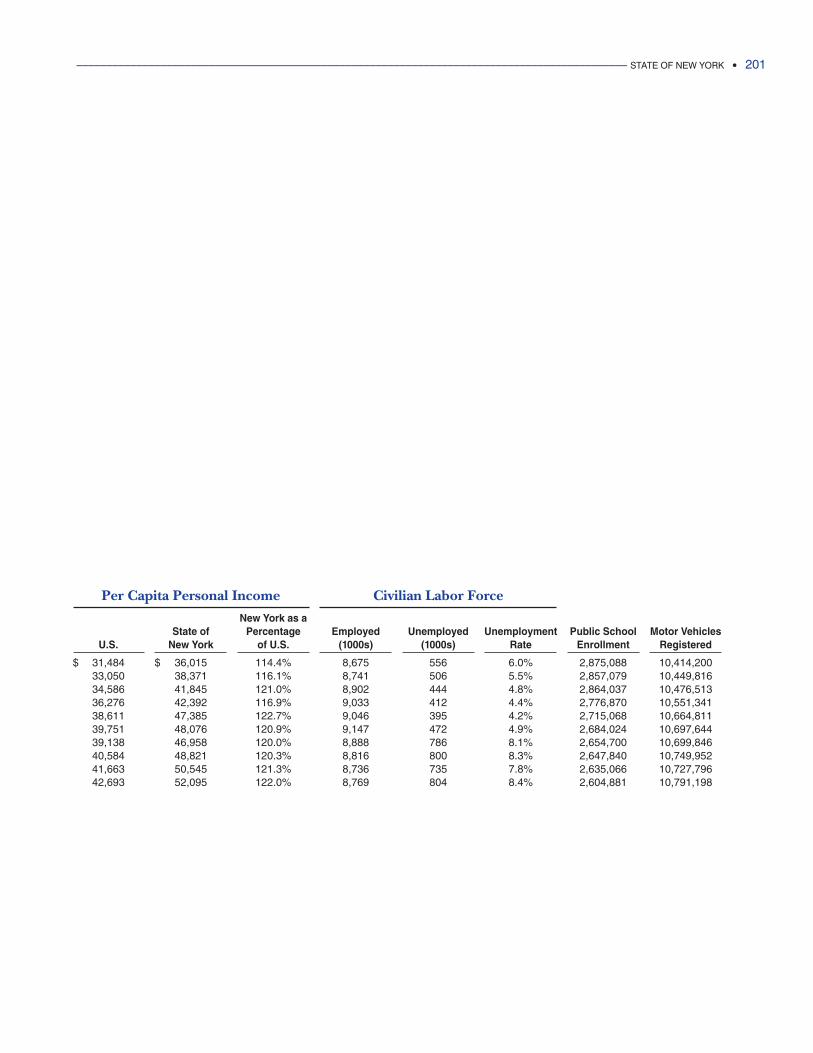
Per Capita Personal Income Civilian Labor Force
New York as aState of Percentage Employed Unemployed Unemployment Public School Motor Vehicles
U.S. New York of U.S. (1000s) (1000s) Rate Enrollment Registered
$ 31,484 $ 36,015 114.4% 8,675 556 6.0% 2,875,088 10,414,20033,050 38,371 116.1% 8,741 506 5.5% 2,857,079 10,449,81634,586 41,845 121.0% 8,902 444 4.8% 2,864,037 10,476,51336,276 42,392 116.9% 9,033 412 4.4% 2,776,870 10,551,34138,611 47,385 122.7% 9,046 395 4.2% 2,715,068 10,664,81139,751 48,076 120.9% 9,147 472 4.9% 2,684,024 10,697,64439,138 46,958 120.0% 8,888 786 8.1% 2,654,700 10,699,84640,584 48,821 120.3% 8,816 800 8.3% 2,647,840 10,749,95241,663 50,545 121.3% 8,736 735 7.8% 2,635,066 10,727,79642,693 52,095 122.0% 8,769 804 8.4% 2,604,881 10,791,198
____________________________________________________________________________________________ STATE OF NEW YORK • 201
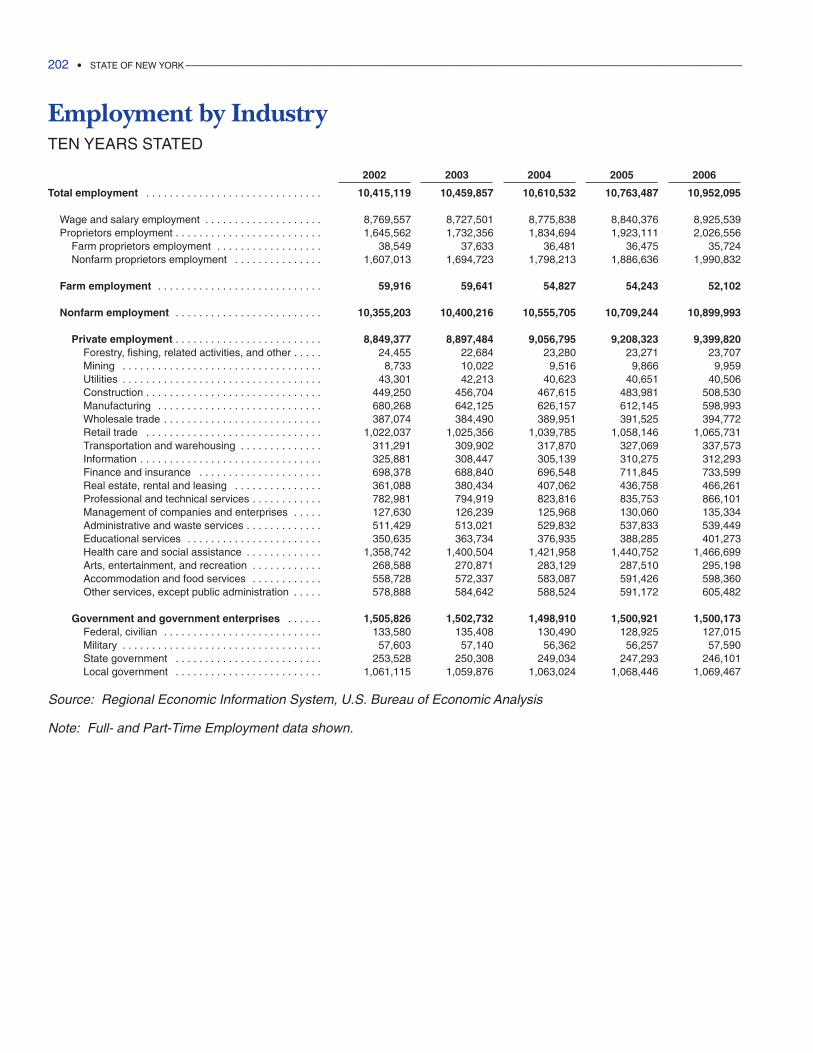
Employment by IndustryTEN YEARS STATED
2002 2003 2004 2005 2006
Total employment . . . . . . . . . . . . . . . . . . . . . . . . . . . . . . 10,415,119 10,459,857 10,610,532 10,763,487 10,952,095
Wage and salary employment . . . . . . . . . . . . . . . . . . . . 8,769,557 8,727,501 8,775,838 8,840,376 8,925,539Proprietors employment . . . . . . . . . . . . . . . . . . . . . . . . . 1,645,562 1,732,356 1,834,694 1,923,111 2,026,556
Farm proprietors employment . . . . . . . . . . . . . . . . . . 38,549 37,633 36,481 36,475 35,724Nonfarm proprietors employment . . . . . . . . . . . . . . . 1,607,013 1,694,723 1,798,213 1,886,636 1,990,832
Farm employment . . . . . . . . . . . . . . . . . . . . . . . . . . . . 59,916 59,641 54,827 54,243 52,102
Nonfarm employment . . . . . . . . . . . . . . . . . . . . . . . . . 10,355,203 10,400,216 10,555,705 10,709,244 10,899,993
Private employment . . . . . . . . . . . . . . . . . . . . . . . . . 8,849,377 8,897,484 9,056,795 9,208,323 9,399,820Forestry, fishing, related activities, and other . . . . . 24,455 22,684 23,280 23,271 23,707Mining . . . . . . . . . . . . . . . . . . . . . . . . . . . . . . . . . . 8,733 10,022 9,516 9,866 9,959Utilities . . . . . . . . . . . . . . . . . . . . . . . . . . . . . . . . . . 43,301 42,213 40,623 40,651 40,506Construction . . . . . . . . . . . . . . . . . . . . . . . . . . . . . . 449,250 456,704 467,615 483,981 508,530Manufacturing . . . . . . . . . . . . . . . . . . . . . . . . . . . . 680,268 642,125 626,157 612,145 598,993Wholesale trade . . . . . . . . . . . . . . . . . . . . . . . . . . . 387,074 384,490 389,951 391,525 394,772Retail trade . . . . . . . . . . . . . . . . . . . . . . . . . . . . . . 1,022,037 1,025,356 1,039,785 1,058,146 1,065,731Transportation and warehousing . . . . . . . . . . . . . . 311,291 309,902 317,870 327,069 337,573Information . . . . . . . . . . . . . . . . . . . . . . . . . . . . . . . 325,881 308,447 305,139 310,275 312,293Finance and insurance . . . . . . . . . . . . . . . . . . . . . 698,378 688,840 696,548 711,845 733,599Real estate, rental and leasing . . . . . . . . . . . . . . . 361,088 380,434 407,062 436,758 466,261Professional and technical services . . . . . . . . . . . . 782,981 794,919 823,816 835,753 866,101Management of companies and enterprises . . . . . 127,630 126,239 125,968 130,060 135,334Administrative and waste services . . . . . . . . . . . . . 511,429 513,021 529,832 537,833 539,449Educational services . . . . . . . . . . . . . . . . . . . . . . . 350,635 363,734 376,935 388,285 401,273Health care and social assistance . . . . . . . . . . . . . 1,358,742 1,400,504 1,421,958 1,440,752 1,466,699Arts, entertainment, and recreation . . . . . . . . . . . . 268,588 270,871 283,129 287,510 295,198Accommodation and food services . . . . . . . . . . . . 558,728 572,337 583,087 591,426 598,360Other services, except public administration . . . . . 578,888 584,642 588,524 591,172 605,482
Government and government enterprises . . . . . . 1,505,826 1,502,732 1,498,910 1,500,921 1,500,173Federal, civilian . . . . . . . . . . . . . . . . . . . . . . . . . . . 133,580 135,408 130,490 128,925 127,015Military . . . . . . . . . . . . . . . . . . . . . . . . . . . . . . . . . . 57,603 57,140 56,362 56,257 57,590State government . . . . . . . . . . . . . . . . . . . . . . . . . 253,528 250,308 249,034 247,293 246,101Local government . . . . . . . . . . . . . . . . . . . . . . . . . 1,061,115 1,059,876 1,063,024 1,068,446 1,069,467
Source: Regional Economic Information System, U.S. Bureau of Economic Analysis
Note: Full- and Part-Time Employment data shown.
202 • STATE OF NEW YORK _____________________________________________________________________________________________
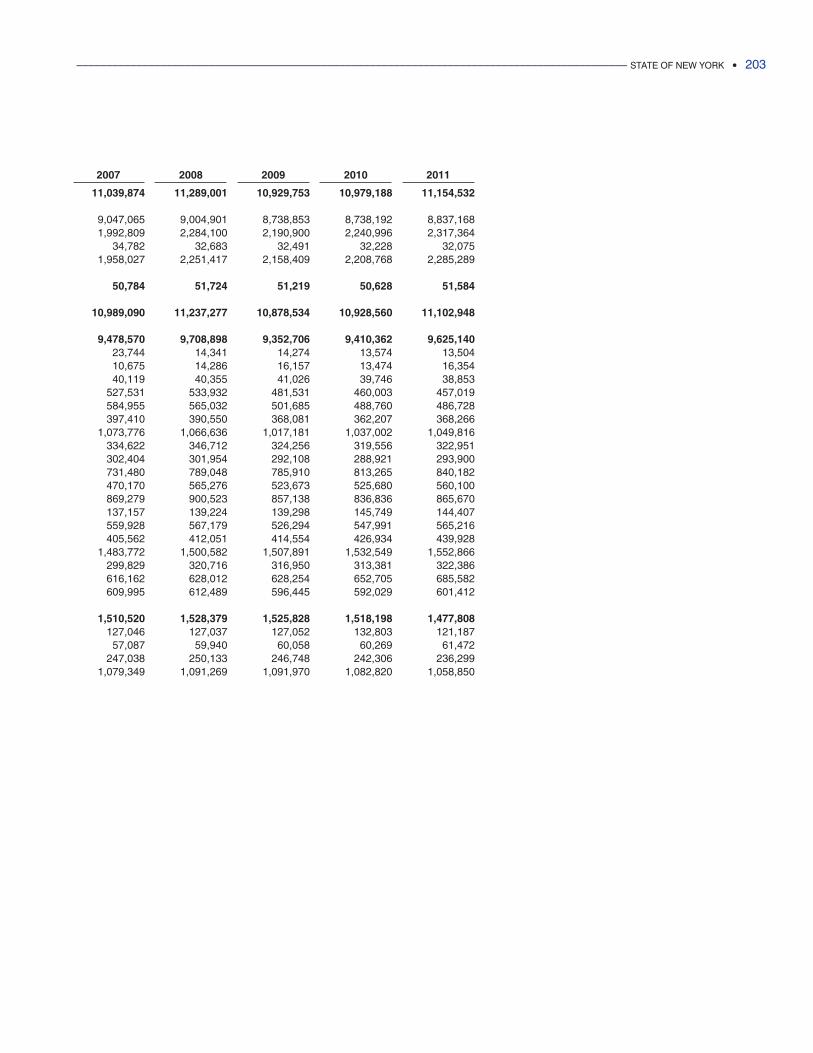
____________________________________________________________________________________________ STATE OF NEW YORK • 203
2007 2008 2009 2010 2011
11,039,874 11,289,001 10,929,753 10,979,188 11,154,532
9,047,065 9,004,901 8,738,853 8,738,192 8,837,1681,992,809 2,284,100 2,190,900 2,240,996 2,317,364
34,782 32,683 32,491 32,228 32,0751,958,027 2,251,417 2,158,409 2,208,768 2,285,289
50,784 51,724 51,219 50,628 51,584
10,989,090 11,237,277 10,878,534 10,928,560 11,102,948
9,478,570 9,708,898 9,352,706 9,410,362 9,625,14023,744 14,341 14,274 13,574 13,50410,675 14,286 16,157 13,474 16,35440,119 40,355 41,026 39,746 38,853
527,531 533,932 481,531 460,003 457,019584,955 565,032 501,685 488,760 486,728397,410 390,550 368,081 362,207 368,266
1,073,776 1,066,636 1,017,181 1,037,002 1,049,816334,622 346,712 324,256 319,556 322,951302,404 301,954 292,108 288,921 293,900731,480 789,048 785,910 813,265 840,182470,170 565,276 523,673 525,680 560,100869,279 900,523 857,138 836,836 865,670137,157 139,224 139,298 145,749 144,407559,928 567,179 526,294 547,991 565,216405,562 412,051 414,554 426,934 439,928
1,483,772 1,500,582 1,507,891 1,532,549 1,552,866299,829 320,716 316,950 313,381 322,386616,162 628,012 628,254 652,705 685,582609,995 612,489 596,445 592,029 601,412
1,510,520 1,528,379 1,525,828 1,518,198 1,477,808127,046 127,037 127,052 132,803 121,187
57,087 59,940 60,058 60,269 61,472247,038 250,133 246,748 242,306 236,299
1,079,349 1,091,269 1,091,970 1,082,820 1,058,850
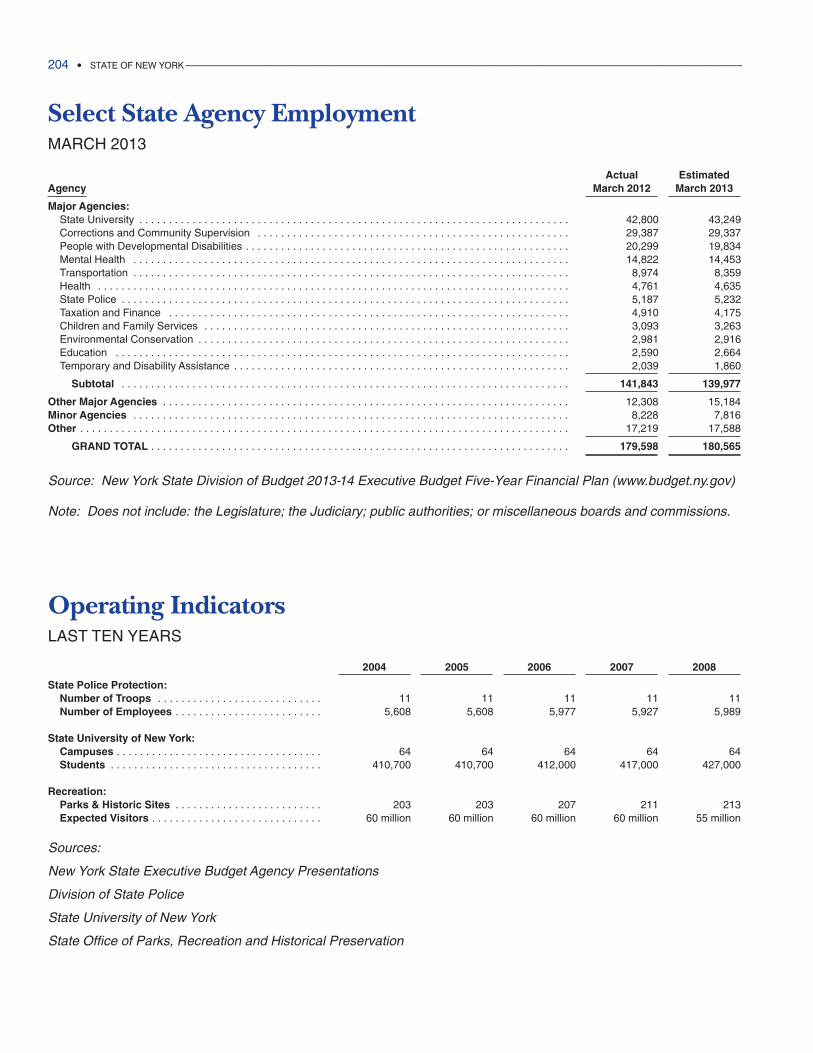
Operating IndicatorsLAST TEN YEARS
2004 2005 2006 2007 2008
State Police Protection:Number of Troops . . . . . . . . . . . . . . . . . . . . . . . . . . . . 11 11 11 11 11Number of Employees . . . . . . . . . . . . . . . . . . . . . . . . . 5,608 5,608 5,977 5,927 5,989
State University of New York:Campuses . . . . . . . . . . . . . . . . . . . . . . . . . . . . . . . . . . . 64 64 64 64 64Students . . . . . . . . . . . . . . . . . . . . . . . . . . . . . . . . . . . . 410,700 410,700 412,000 417,000 427,000
Recreation:Parks & Historic Sites . . . . . . . . . . . . . . . . . . . . . . . . . 203 203 207 211 213Expected Visitors . . . . . . . . . . . . . . . . . . . . . . . . . . . . . 60 million 60 million 60 million 60 million 55 million
Sources:
New York State Executive Budget Agency Presentations
Division of State Police
State University of New York
State Office of Parks, Recreation and Historical Preservation
204 • STATE OF NEW YORK _____________________________________________________________________________________________
Select State Agency EmploymentMARCH 2013
Actual EstimatedAgency March 2012 March 2013
Major Agencies:State University . . . . . . . . . . . . . . . . . . . . . . . . . . . . . . . . . . . . . . . . . . . . . . . . . . . . . . . . . . . . . . . . . . . . . . . . . 42,800 43,249Corrections and Community Supervision . . . . . . . . . . . . . . . . . . . . . . . . . . . . . . . . . . . . . . . . . . . . . . . . . . . . . 29,387 29,337People with Developmental Disabilities . . . . . . . . . . . . . . . . . . . . . . . . . . . . . . . . . . . . . . . . . . . . . . . . . . . . . . . 20,299 19,834Mental Health . . . . . . . . . . . . . . . . . . . . . . . . . . . . . . . . . . . . . . . . . . . . . . . . . . . . . . . . . . . . . . . . . . . . . . . . . . 14,822 14,453Transportation . . . . . . . . . . . . . . . . . . . . . . . . . . . . . . . . . . . . . . . . . . . . . . . . . . . . . . . . . . . . . . . . . . . . . . . . . . 8,974 8,359Health . . . . . . . . . . . . . . . . . . . . . . . . . . . . . . . . . . . . . . . . . . . . . . . . . . . . . . . . . . . . . . . . . . . . . . . . . . . . . . . . 4,761 4,635State Police . . . . . . . . . . . . . . . . . . . . . . . . . . . . . . . . . . . . . . . . . . . . . . . . . . . . . . . . . . . . . . . . . . . . . . . . . . . . 5,187 5,232Taxation and Finance . . . . . . . . . . . . . . . . . . . . . . . . . . . . . . . . . . . . . . . . . . . . . . . . . . . . . . . . . . . . . . . . . . . . 4,910 4,175Children and Family Services . . . . . . . . . . . . . . . . . . . . . . . . . . . . . . . . . . . . . . . . . . . . . . . . . . . . . . . . . . . . . . 3,093 3,263Environmental Conservation . . . . . . . . . . . . . . . . . . . . . . . . . . . . . . . . . . . . . . . . . . . . . . . . . . . . . . . . . . . . . . . 2,981 2,916Education . . . . . . . . . . . . . . . . . . . . . . . . . . . . . . . . . . . . . . . . . . . . . . . . . . . . . . . . . . . . . . . . . . . . . . . . . . . . . 2,590 2,664Temporary and Disability Assistance . . . . . . . . . . . . . . . . . . . . . . . . . . . . . . . . . . . . . . . . . . . . . . . . . . . . . . . . . 2,039 1,860
Subtotal . . . . . . . . . . . . . . . . . . . . . . . . . . . . . . . . . . . . . . . . . . . . . . . . . . . . . . . . . . . . . . . . . . . . . . . . . . . . 141,843 139,977
Other Major Agencies . . . . . . . . . . . . . . . . . . . . . . . . . . . . . . . . . . . . . . . . . . . . . . . . . . . . . . . . . . . . . . . . . . . . . 12,308 15,184Minor Agencies . . . . . . . . . . . . . . . . . . . . . . . . . . . . . . . . . . . . . . . . . . . . . . . . . . . . . . . . . . . . . . . . . . . . . . . . . . 8,228 7,816Other . . . . . . . . . . . . . . . . . . . . . . . . . . . . . . . . . . . . . . . . . . . . . . . . . . . . . . . . . . . . . . . . . . . . . . . . . . . . . . . . . . . 17,219 17,588
GRAND TOTAL . . . . . . . . . . . . . . . . . . . . . . . . . . . . . . . . . . . . . . . . . . . . . . . . . . . . . . . . . . . . . . . . . . . . . . . 179,598 180,565
Source: New York State Division of Budget 2013-14 Executive Budget Five-Year Financial Plan (www.budget.ny.gov)
Note: Does not include: the Legislature; the Judiciary; public authorities; or miscellaneous boards and commissions.
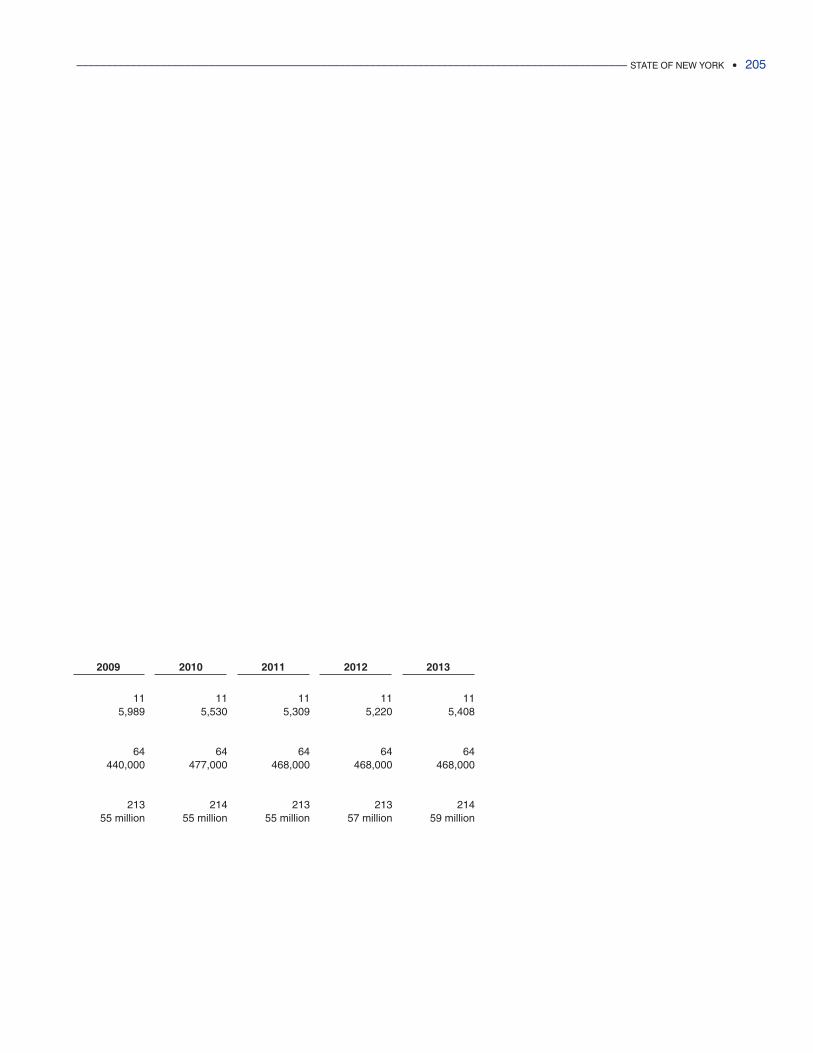
2009 2010 2011 2012 2013
11 11 11 11 115,989 5,530 5,309 5,220 5,408
64 64 64 64 64440,000 477,000 468,000 468,000 468,000
213 214 213 213 21455 million 55 million 55 million 57 million 59 million
____________________________________________________________________________________________ STATE OF NEW YORK • 205
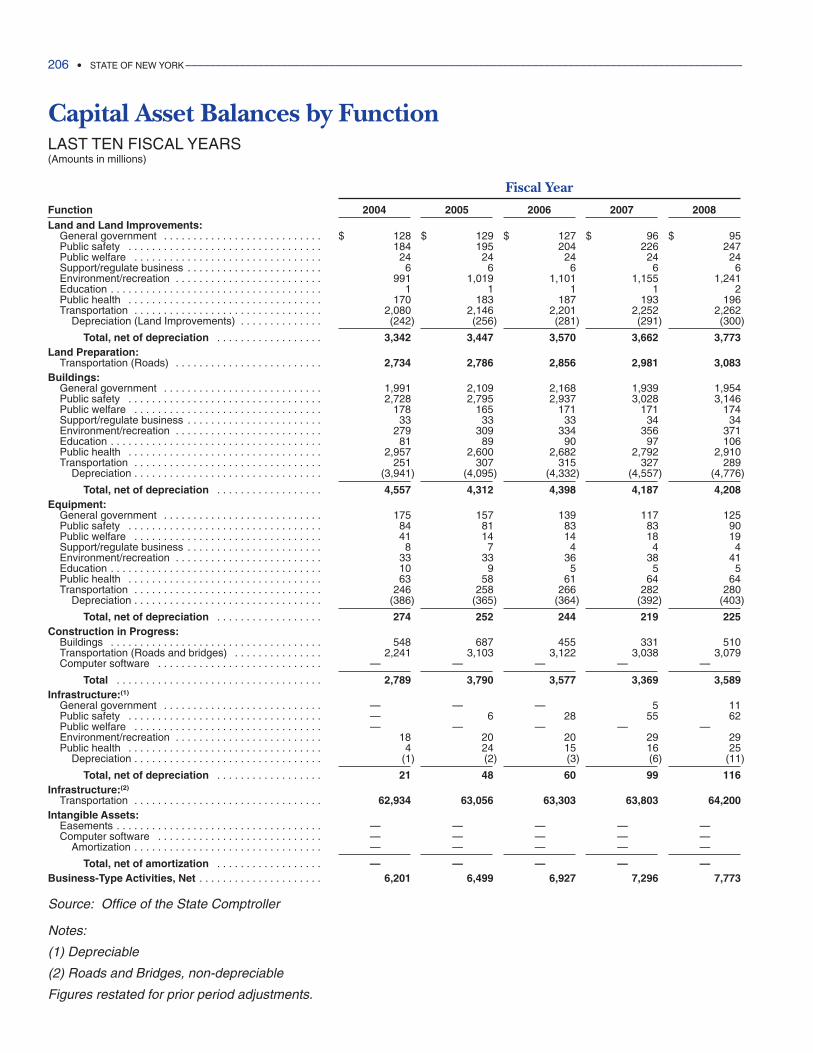
206 • STATE OF NEW YORK _____________________________________________________________________________________________
Capital Asset Balances by FunctionLAST TEN FISCAL YEARS(Amounts in millions)
Fiscal Year
Function 2004 2005 2006 2007 2008Land and Land Improvements:
General government . . . . . . . . . . . . . . . . . . . . . . . . . . . $ 128 $ 129 $ 127 $ 96 $ 95Public safety . . . . . . . . . . . . . . . . . . . . . . . . . . . . . . . . . 184 195 204 226 247Public welfare . . . . . . . . . . . . . . . . . . . . . . . . . . . . . . . . 24 24 24 24 24Support/regulate business . . . . . . . . . . . . . . . . . . . . . . . 6 6 6 6 6Environment/recreation . . . . . . . . . . . . . . . . . . . . . . . . . 991 1,019 1,101 1,155 1,241Education . . . . . . . . . . . . . . . . . . . . . . . . . . . . . . . . . . . . 1 1 1 1 2Public health . . . . . . . . . . . . . . . . . . . . . . . . . . . . . . . . . 170 183 187 193 196Transportation . . . . . . . . . . . . . . . . . . . . . . . . . . . . . . . . 2,080 2,146 2,201 2,252 2,262
Depreciation (Land Improvements) . . . . . . . . . . . . . . (242) (256) (281) (291) (300)
Total, net of depreciation . . . . . . . . . . . . . . . . . . 3,342 3,447 3,570 3,662 3,773Land Preparation:
Transportation (Roads) . . . . . . . . . . . . . . . . . . . . . . . . . 2,734 2,786 2,856 2,981 3,083Buildings:
General government . . . . . . . . . . . . . . . . . . . . . . . . . . . 1,991 2,109 2,168 1,939 1,954Public safety . . . . . . . . . . . . . . . . . . . . . . . . . . . . . . . . . 2,728 2,795 2,937 3,028 3,146Public welfare . . . . . . . . . . . . . . . . . . . . . . . . . . . . . . . . 178 165 171 171 174Support/regulate business . . . . . . . . . . . . . . . . . . . . . . . 33 33 33 34 34Environment/recreation . . . . . . . . . . . . . . . . . . . . . . . . . 279 309 334 356 371Education . . . . . . . . . . . . . . . . . . . . . . . . . . . . . . . . . . . . 81 89 90 97 106Public health . . . . . . . . . . . . . . . . . . . . . . . . . . . . . . . . . 2,957 2,600 2,682 2,792 2,910Transportation . . . . . . . . . . . . . . . . . . . . . . . . . . . . . . . . 251 307 315 327 289
Depreciation . . . . . . . . . . . . . . . . . . . . . . . . . . . . . . . . (3,941) (4,095) (4,332) (4,557) (4,776)
Total, net of depreciation . . . . . . . . . . . . . . . . . . 4,557 4,312 4,398 4,187 4,208Equipment:
General government . . . . . . . . . . . . . . . . . . . . . . . . . . . 175 157 139 117 125Public safety . . . . . . . . . . . . . . . . . . . . . . . . . . . . . . . . . 84 81 83 83 90Public welfare . . . . . . . . . . . . . . . . . . . . . . . . . . . . . . . . 41 14 14 18 19Support/regulate business . . . . . . . . . . . . . . . . . . . . . . . 8 7 4 4 4Environment/recreation . . . . . . . . . . . . . . . . . . . . . . . . . 33 33 36 38 41Education . . . . . . . . . . . . . . . . . . . . . . . . . . . . . . . . . . . . 10 9 5 5 5Public health . . . . . . . . . . . . . . . . . . . . . . . . . . . . . . . . . 63 58 61 64 64Transportation . . . . . . . . . . . . . . . . . . . . . . . . . . . . . . . . 246 258 266 282 280
Depreciation . . . . . . . . . . . . . . . . . . . . . . . . . . . . . . . . (386) (365) (364) (392) (403)
Total, net of depreciation . . . . . . . . . . . . . . . . . . 274 252 244 219 225Construction in Progress:
Buildings . . . . . . . . . . . . . . . . . . . . . . . . . . . . . . . . . . . . 548 687 455 331 510Transportation (Roads and bridges) . . . . . . . . . . . . . . . 2,241 3,103 3,122 3,038 3,079Computer software . . . . . . . . . . . . . . . . . . . . . . . . . . . . —00000 —00000 —00000 —00000 —00000
Total . . . . . . . . . . . . . . . . . . . . . . . . . . . . . . . . . . . 2,789 3,790 3,577 3,369 3,589Infrastructure:(1)
General government . . . . . . . . . . . . . . . . . . . . . . . . . . . —00000 —00000 —00000 5 11Public safety . . . . . . . . . . . . . . . . . . . . . . . . . . . . . . . . . —00000 6 28 55 62Public welfare . . . . . . . . . . . . . . . . . . . . . . . . . . . . . . . . —00000 —00000 —00000 —00000 —00000Environment/recreation . . . . . . . . . . . . . . . . . . . . . . . . . 18 20 20 29 29Public health . . . . . . . . . . . . . . . . . . . . . . . . . . . . . . . . . 4 24 15 16 25
Depreciation . . . . . . . . . . . . . . . . . . . . . . . . . . . . . . . . (1) (2) (3) (6) (11)
Total, net of depreciation . . . . . . . . . . . . . . . . . . 21 48 60 99 116Infrastructure:(2)
Transportation . . . . . . . . . . . . . . . . . . . . . . . . . . . . . . . . 62,934 63,056 63,303 63,803 64,200Intangible Assets:
Easements . . . . . . . . . . . . . . . . . . . . . . . . . . . . . . . . . . . —00000 —00000 —00000 —00000 —00000Computer software . . . . . . . . . . . . . . . . . . . . . . . . . . . . —00000 —00000 —00000 —00000 —00000
Amortization . . . . . . . . . . . . . . . . . . . . . . . . . . . . . . . . —00000 —00000 —00000 —00000 —00000
Total, net of amortization . . . . . . . . . . . . . . . . . . —00000 —00000 —00000 —00000 —00000Business-Type Activities, Net . . . . . . . . . . . . . . . . . . . . . 6,201 6,499 6,927 7,296 7,773
Source: Office of the State Comptroller
Notes:
(1) Depreciable
(2) Roads and Bridges, non-depreciable
Figures restated for prior period adjustments.
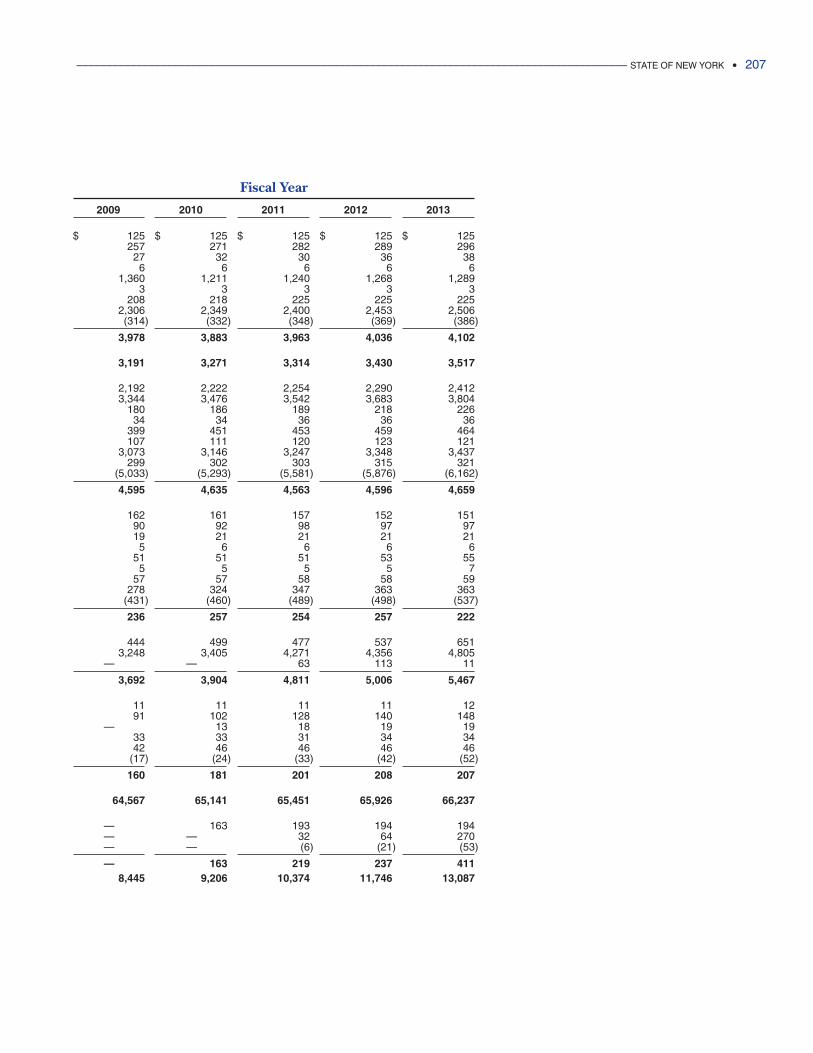
____________________________________________________________________________________________ STATE OF NEW YORK • 207
Fiscal Year
2009 2010 2011 2012 2013
$ 125 $ 125 $ 125 $ 125 $ 125257 271 282 289 29627 32 30 36 386 6 6 6 6
1,360 1,211 1,240 1,268 1,2893 3 3 3 3
208 218 225 225 2252,306 2,349 2,400 2,453 2,506(314) (332) (348) (369) (386)
3,978 3,883 3,963 4,036 4,102
3,191 3,271 3,314 3,430 3,517
2,192 2,222 2,254 2,290 2,4123,344 3,476 3,542 3,683 3,804
180 186 189 218 22634 34 36 36 36
399 451 453 459 464107 111 120 123 121
3,073 3,146 3,247 3,348 3,437299 302 303 315 321
(5,033) (5,293) (5,581) (5,876) (6,162)
4,595 4,635 4,563 4,596 4,659
162 161 157 152 15190 92 98 97 9719 21 21 21 215 6 6 6 6
51 51 51 53 555 5 5 5 7
57 57 58 58 59278 324 347 363 363
(431) (460) (489) (498) (537)
236 257 254 257 222
444 499 477 537 6513,248 3,405 4,271 4,356 4,805
—00000 —00000 63 113 11
3,692 3,904 4,811 5,006 5,467
11 11 11 11 1291 102 128 140 148
—00000 13 18 19 1933 33 31 34 3442 46 46 46 46
(17) (24) (33) (42) (52)
160 181 201 208 207
64,567 65,141 65,451 65,926 66,237
—00000 163 193 194 194—00000 —00000 32 64 270—00000 —00000 (6) (21) (53)
—00000 163 219 237 4118,445 9,206 10,374 11,746 13,087
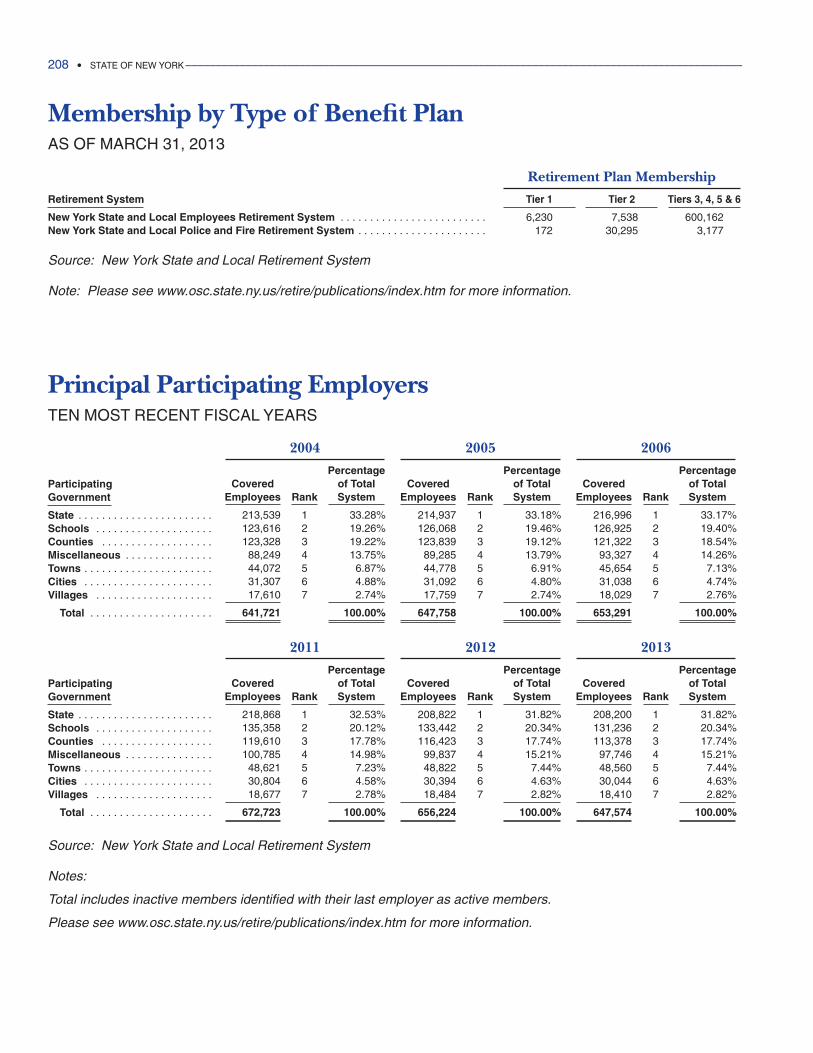
208 • STATE OF NEW YORK _____________________________________________________________________________________________
Principal Participating EmployersTEN MOST RECENT FISCAL YEARS
ParticipatingGovernment
State . . . . . . . . . . . . . . . . . . . . . . .Schools . . . . . . . . . . . . . . . . . . . .Counties . . . . . . . . . . . . . . . . . . .Miscellaneous . . . . . . . . . . . . . . .Towns . . . . . . . . . . . . . . . . . . . . . .Cities . . . . . . . . . . . . . . . . . . . . . .Villages . . . . . . . . . . . . . . . . . . . .
Total . . . . . . . . . . . . . . . . . . . . .
Membership by Type of Benefit PlanAS OF MARCH 31, 2013
Retirement Plan Membership
Retirement System Tier 1 Tier 2 Tiers 3, 4, 5 & 6
New York State and Local Employees Retirement System . . . . . . . . . . . . . . . . . . . . . . . . . 6,230 7,538 600,162New York State and Local Police and Fire Retirement System . . . . . . . . . . . . . . . . . . . . . . 172 30,295 3,177
Source: New York State and Local Retirement System
Note: Please see www.osc.state.ny.us/retire/publications/index.htm for more information.
2004
PercentageCovered of Total
Employees Rank System
213,539 1 33.28%123,616 2 19.26%123,328 3 19.22%88,249 4 13.75%44,072 5 6.87%31,307 6 4.88%17,610 7 2.74%
641,721 100.00%
2005
PercentageCovered of Total
Employees Rank System
214,937 1 33.18%126,068 2 19.46%123,839 3 19.12%89,285 4 13.79%44,778 5 6.91%31,092 6 4.80%17,759 7 2.74%
647,758 100.00%
2006
PercentageCovered of Total
Employees Rank System
216,996 1 33.17%126,925 2 19.40%121,322 3 18.54%93,327 4 14.26%45,654 5 7.13%31,038 6 4.74%18,029 7 2.76%
653,291 100.00%
2011
PercentageCovered of Total
Employees Rank System
218,868 1 32.53%135,358 2 20.12%119,610 3 17.78%100,785 4 14.98%48,621 5 7.23%30,804 6 4.58%18,677 7 2.78%
672,723 100.00%
2012
PercentageCovered of Total
Employees Rank System
208,822 1 31.82%133,442 2 20.34%116,423 3 17.74%99,837 4 15.21%48,822 5 7.44%30,394 6 4.63%18,484 7 2.82%
656,224 100.00%
2013
PercentageCovered of Total
Employees Rank System
208,200 1 31.82%131,236 2 20.34%113,378 3 17.74%97,746 4 15.21%48,560 5 7.44%30,044 6 4.63%18,410 7 2.82%
647,574 100.00%
Source: New York State and Local Retirement System
Notes:
Total includes inactive members identified with their last employer as active members.
Please see www.osc.state.ny.us/retire/publications/index.htm for more information.
ParticipatingGovernment
State . . . . . . . . . . . . . . . . . . . . . . .Schools . . . . . . . . . . . . . . . . . . . .Counties . . . . . . . . . . . . . . . . . . .Miscellaneous . . . . . . . . . . . . . . .Towns . . . . . . . . . . . . . . . . . . . . . .Cities . . . . . . . . . . . . . . . . . . . . . .Villages . . . . . . . . . . . . . . . . . . . .
Total . . . . . . . . . . . . . . . . . . . . .
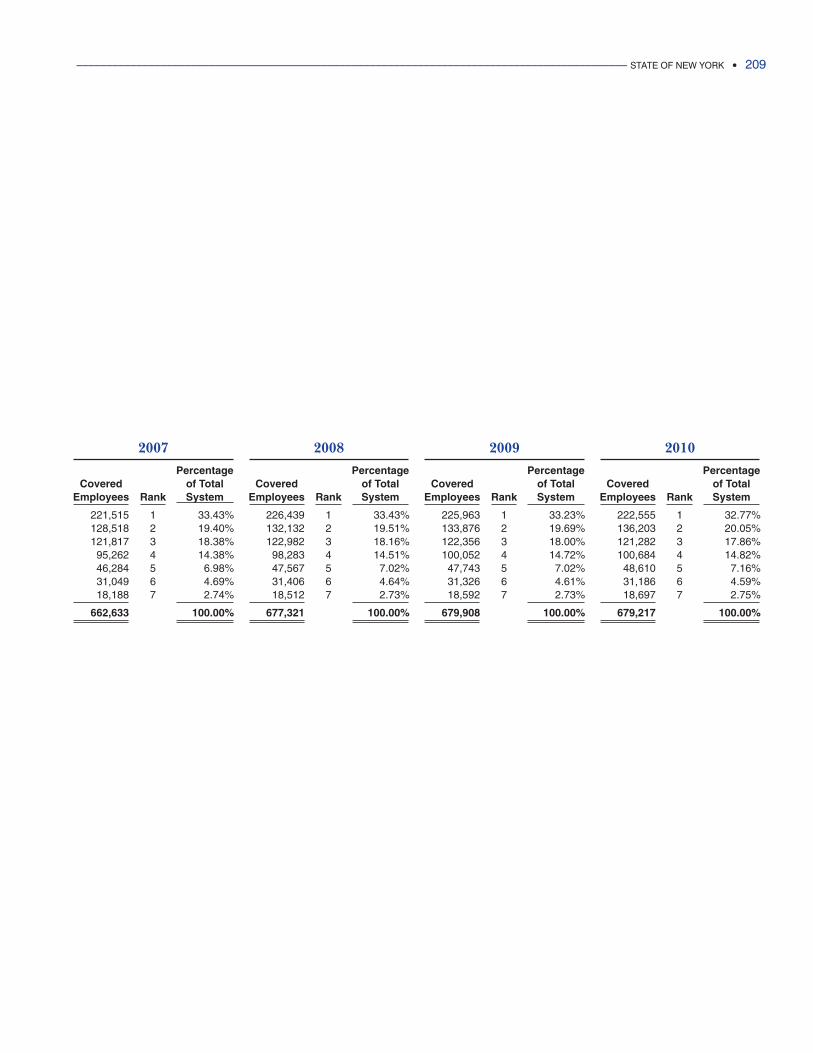
____________________________________________________________________________________________ STATE OF NEW YORK • 209
2007
PercentageCovered of Total
Employees Rank System
221,515 1 33.43%128,518 2 19.40%121,817 3 18.38%95,262 4 14.38%46,284 5 6.98%31,049 6 4.69%18,188 7 2.74%
662,633 100.00%
2008
PercentageCovered of Total
Employees Rank System
226,439 1 33.43%132,132 2 19.51%122,982 3 18.16%98,283 4 14.51%47,567 5 7.02%31,406 6 4.64%18,512 7 2.73%
677,321 100.00%
2009
PercentageCovered of Total
Employees Rank System
225,963 1 33.23%133,876 2 19.69%122,356 3 18.00%100,052 4 14.72%47,743 5 7.02%31,326 6 4.61%18,592 7 2.73%
679,908 100.00%
2010
PercentageCovered of Total
Employees Rank System
222,555 1 32.77%136,203 2 20.05%121,282 3 17.86%100,684 4 14.82%48,610 5 7.16%31,186 6 4.59%18,697 7 2.75%
679,217 100.00%


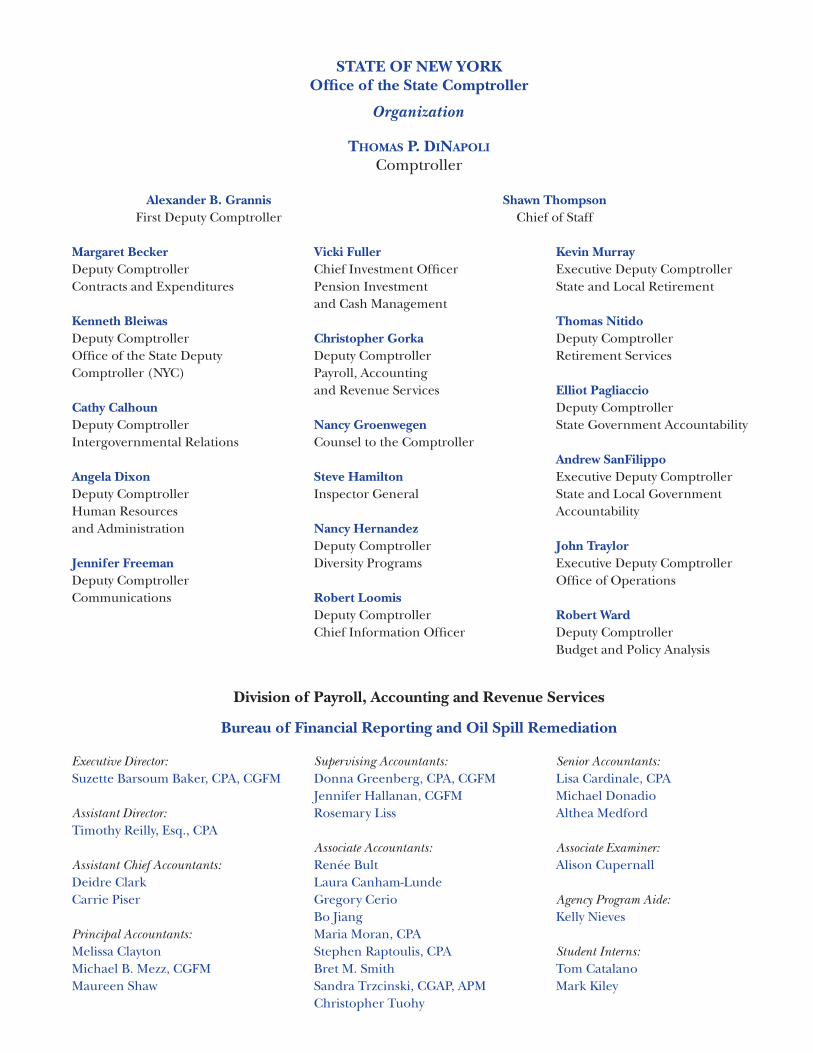
Bureau of Financial Reporting and Oil Spill Remediation
Division of Payroll, Accounting and Revenue Services
Margaret BeckerDeputy ComptrollerContracts and Expenditures
Kenneth BleiwasDeputy ComptrollerOffice of the State DeputyComptroller (NYC)
Cathy CalhounDeputy ComptrollerIntergovernmental Relations
Angela DixonDeputy ComptrollerHuman Resources and Administration
Jennifer FreemanDeputy ComptrollerCommunications
Vicki FullerChief Investment OfficerPension Investment and Cash Management
Christopher GorkaDeputy ComptrollerPayroll, Accounting and Revenue Services
Nancy GroenwegenCounsel to the Comptroller
Steve HamiltonInspector General
Nancy HernandezDeputy ComptrollerDiversity Programs
Robert LoomisDeputy ComptrollerChief Information Officer
Kevin MurrayExecutive Deputy ComptrollerState and Local Retirement
Thomas NitidoDeputy ComptrollerRetirement Services
Elliot PagliaccioDeputy ComptrollerState Government Accountability
Andrew SanFilippoExecutive Deputy ComptrollerState and Local GovernmentAccountability
John TraylorExecutive Deputy ComptrollerOffice of Operations
Robert WardDeputy ComptrollerBudget and Policy Analysis
Alexander B. Grannis Shawn ThompsonFirst Deputy Comptroller Chief of Staff
Executive Director:Suzette Barsoum Baker, CPA, CGFM
Assistant Director:Timothy Reilly, Esq., CPA
Assistant Chief Accountants:Deidre ClarkCarrie Piser
Principal Accountants:Melissa ClaytonMichael B. Mezz, CGFMMaureen Shaw
Supervising Accountants:Donna Greenberg, CPA, CGFMJennifer Hallanan, CGFMRosemary Liss
Associate Accountants:Renée BultLaura Canham-LundeGregory CerioBo JiangMaria Moran, CPAStephen Raptoulis, CPABret M. SmithSandra Trzcinski, CGAP, APMChristopher Tuohy
Senior Accountants:Lisa Cardinale, CPAMichael DonadioAlthea Medford
Associate Examiner:Alison Cupernall
Agency Program Aide:Kelly Nieves
Student Interns:Tom CatalanoMark Kiley
STATE OF NEW YORKOffice of the State Comptroller
Organization
THOMAS P. DINAPOLI
Comptroller