state of rhode islandcontroller.admin.ri.gov/documents/financial reports//103... · state of rhode...
TRANSCRIPT

STATE OF
RHODE ISLAND AND PROVIDENCE PLANTATIONS
Lincoln C. Almond, Governor
COMPREHENSIVEANNUAL
FINANCIAL REPORT
For the Fiscal Year Ended June 30, 2001
Prepared By :
Department of Administration
Robert L. Carl , Jr. , Ph.D. , Director
Office of Accounts and Control
Lawrence C. Franklin , Jr. , CPA , State Controller

TABLE OF CONTENTS
Page
Statement of Revenues, Expenditures, and Changes in Fund Balance .......................... 83
Statement of Revenues, Expenditures, and Changes in Fund Balance - Budget and Actual................................................................................................ 84
Statement of Revenues, Other Financing Sources, Expenditures, and Other FinancingUses - General Revenue Appropriations - Budget and Actual..................................... 85
Statement of General Fund Restricted Revenues, Expenditures, and Other FinancingSources and Uses - Budget and Actual ..................................................................... 90
Statement of General Fund Operating Transfers In, Expenditures, and Other FinancingSources and Uses – Budget and Actual..................................................................... 94
Statement of General Fund Federal Revenues, Expenditures, and Other FinancingSources and Uses - Budget and Actual ..................................................................... 97
Special Revenue Funds:
Combining Balance Sheet ........................................................................................... 108
Combining Statement of Revenues, Expenditures, and Changes inFund Balances ........................................................................................................ 109
Combining Statement of Revenues, Expenditures, and Changes in Fund Balances -Budget and Actual - Budgeted Special Revenue Funds.............................................. 110
Statement of Federal Revenues, Expenditures and Other Financing Sourcesand Uses - Budget and Actual – Intermodal Surface Transportation Fund ................. 112
Statement of Restricted Revenues, Expenditures and Other Financing Sourcesand Uses - Budget and Actual - Intermodal Surface Transportation Fund ................. 113
Statement of State Gasoline Tax Revenue and Bond Proceeds, Expenditures andOther Financing Sources and Uses - Budget and Actual - Intermodal SurfaceTransportation Fund................................................................................................ 114
Debt Service Fund:
Balance Sheet ............................................................................................................. 118
Statement of Revenues, Expenditures, and Changes in Fund Balance .......................... 119
Capital Projects Funds:
Combining Balance Sheet............................................................................................ 122
Combining Statement of Revenues, Expenditures, and Changes inFund Balances......................................................................................................... 123

TABLE OF CONTENTS
Page
Enterprise Fund:
Balance Sheet ............................................................................................................. 126
Statement of Revenues, Expenses and Changes in Fund Equity ................................... 127
Statement of Cash Flows ............................................................................................. 128
Internal Service Funds:
Combining Balance Sheet............................................................................................ 130
Combining Statement of Revenues, Expenses, and Changes in Fund Equity ................. 132
Combining Statement of Cash Flows............................................................................ 134
Trust and Agency Funds:
Combining Balance Sheet ........................................................................................... 138
Combining Statement of Plan Net Assets – Pension Trust Funds................................... 139
Combining Statement of Changes in Plan Net Assets – Pension Trust Funds................. 140
Statement of Revenues, Expenditures, and Changes in FundBalance - Expendable Trust Fund - Employment Security......................................... 141
Combining Statement of Revenues, Expenses, and Changes in FundBalances - Nonexpendable Trust Funds.................................................................... 142
Combining Statement of Cash Flows - Nonexpendable Trust Funds .............................. 143
Combining Statement of Changes in Assets and Liabilities - Agency Funds................... 144
General Long-Term Debt Account Group:
Statement of General Long-Term Debt ......................................................................... 146
Statement of Changes in General Long-Term Debt ....................................................... 147
Component Units:
Combining Balance Sheet - Discretely Presented GovernmentalComponent Units..................................................................................................... 150
Combining Statement of Revenues, Expenditures, and Changes in Fund Equity -Discretely Presented Governmental Component Units............................................... 151

TABLE OF CONTENTS
Page
Combining Balance Sheet - Discretely Presented ProprietaryComponent Units..................................................................................................... 152
Combining Statement of Revenues, Expenses, and Changes in Fund Equity -Discretely Presented Proprietary Component Units ................................................... 156
Combining Statement of Cash Flows - Discretely Presented ProprietaryComponent Units..................................................................................................... 160
STATISTICAL SECTION
Revenues by Source and Expenditures by Function - All Governmental Fund Types -Last Ten Fiscal Years .................................................................................................. 170
Percentage of Annual Debt Service For Governmental Debt to Total Expenditures – All Governmental Fund Types - Last Ten Fiscal Years ............................................... 172
Ratio of General Obligation Debt Per Capita - Last Ten Fiscal Years.............................. 172
Schedule of Personal Income and Per Capita Personal Income –1991 through 2000.................................................................................................. 173
Schedule of Economic Indicators - 1991 through 2000................................................. 173
Schedule of Ten Largest Private Employers in 2001...................................................... 174
Schedule of Miscellaneous Statistics ............................................................................ 174

INTRODUCTORY
SECTION


- - - - - - -
Rhode Island State Government
Organization Chart
GeneralAssembly
- - - - - - - - -
Voters
Legislative Branch Executive Branch Judicial Branch
GeneralTreasurer's
Office
LieutenantGovernor's
Office
Governor'sOffice
StateDepartment
AttorneyGeneral
Department
Office ofHigher
Education
Administration
Labor &Training
SupremeCourt
EnvironmentalManagement
OtherCommissions& Agencies
PublicAuthorities &Corporations
Children,Youth &Families
CorrectionsExecutiveElementary
& SecondaryEducation
GovernorSenate
Boardof
Regents
House
Boardof
Governors
DistrictCourt
SuperiorCourt
FamilyCourt
BusinessRegulation
Mental HealthRetardation& Hospitals
Health HumanServices
TransportationElderlyAffairs
Retirement
AttorneyGeneral
LieutenantGovernor
GeneralTreasurer
Secretaryof
State

- 7 -
STATE OF RHODE ISLAND AND PROVIDENCE PLANTATIONS
OFFICIALS OF STATE GOVERNMENT
EXECUTIVE BRANCH
GovernorLincoln C. Almond
Lieutenant GovernorCharles J. Fogarty
Secretary of StateEdward S. Inman, III
General TreasurerPaul J. Tavares
Attorney GeneralSheldon W. Whitehouse
LEGISLATIVE BRANCH
SenatePresident Pro-Tempore of the Senate
John C. Revens Jr.
House of RepresentativesSpeaker of the House
John B. Harwood
JUDICIAL BRANCH
Chief Justice of the Supreme CourtFrank W. Williams

FINANCIAL SECTION
- 9 -


This Page Intentionally Left Blank
- 12 -

FINANCIAL SECTION
GENERAL - PURPOSE
FINANCIAL STATEMENTS
- 13 -

STATE OF RHODE ISLAND AND PROVIDENCE PLANTATIONS
COMBINED BALANCE SHEET
ALL FUND TYPES, ACCOUNT GROUPS, AND DISCRETELY PRESENTED COMPONENT UNITS
June 30, 2001
(Expressed in thousands)
DebtService
Cash and cash equivalents $ 211,089 $ 102,609 $ 23,660 $ 141,570 $ 4,799 $ 3,613Funds on deposit with fiscal agent 258 32,134Investments 16,343 1,840Receivables (net) 194,846 51,179 6,005 5,964Due from other funds 73,275 20,532 29 19,435 6,393Due from component units 5,112 1,647Due from primary governmentDue from other governments and agencies (net) 125,908 38,701 3,157Inventories 736 2,299Loans to other funds 5,845Fixed assets (net) 513 4,344Other assets 1,210 28 3,525 427 500Amount available in debt service reservesAmount to be provided for retirement of
general long-term obligationsRentals due
Total assets $ 617,285 $ 214,696 $ 23,947 $ 216,164 $ 14,320 $ 23,113
Liabilities:Cash overdraft $ 3,085 $ $ $ 11,622 $ 433 $ 472Vouchers and accounts payable 268,774 27,591 4,472 5,735 6,872Due to other funds 12,913 48,078 23,213 40,207 1,461 1,413Due to component units 1,838 2,162 1,200Due to primary governmentDue to other governments and agencies 831Accrued liabilities 23,353 2,028 476 2,236Deferred revenue 15,772 541 66 141Loans from other funds 2,995 2,850Other current liabilities 23,405 3,755Compensated absencesNotes payableLoans payableObligations under capital leases 1,343Bonds payableOther long-term liabilities 5,967
Total liabilities 349,140 81,231 23,213 64,317 14,213 15,186
Fund equity:Contributed capitalRetained earnings:
Reserved 1,456Unreserved (deficit) 107 6,471
Fund balances:Reserved 136,963 310,625 734 57,182Unreserved:
Designated 32,955 94,481Undesignated (deficit) 131,182 (210,115) 184
Total fund equity 268,145 133,465 734 151,847 107 7,927
Total liabilities and fund equity $ 617,285 $ 214,696 $ 23,947 $ 216,164 $ 14,320 $ 23,113
The accompanying notes are an integral part of these financial statements.
Assets
Liabilities and Fund Equity
General
Governmental Fund Types Proprietary Fund TypesEnterprise
(State Lottery)InternalService
SpecialRevenue
CapitalProjects
- 14 -

STATE OF RHODE ISLAND AND PROVIDENCE PLANTATIONS
$ 17,620 $ $ 504,960 $ 55,116 $ 460,028 $ 1,020,104293,712 326,104 326,104
6,622,622 6,640,805 1,165 1,314,767 7,956,73760,549 318,543 38,814 2,168,935 2,526,2927,707 127,371 127,371
6,759 6,7592,147 3,053 5,200
1,674 169,440 25,660 195,1003,035 2,830 1,968 7,8335,845 5,845
9,121 13,978 19,237 969,425 1,002,6401,545 7,235 38,590 163,203 209,028
19,922 19,922 800 20,722
1,571,782 1,571,782 121,688 1,693,4707,815 7,815
$ 7,014,550 $ 1,591,704 $ 9,715,779 $ 280,387 $ 5,114,854 $ 15,111,020
$ $ $ 15,612 $ 5,830 $ $ 21,4425,926 319,370 32,711 38,892 390,973
86 127,371 127,3715,200 5,200
1,801 4,958 6,7591,110 1,941 18,269 20,210
28,093 85,094 113,18716,520 12,540 10,013 39,0735,845 5,845
506,762 533,922 4,830 538,75265,574 65,574 32,598 98,172
2,272 17,005 19,277861 52,843 53,704
442,275 443,618 21,624 34,681 499,9231,035,399 1,035,399 104,941 3,049,165 4,189,505
48,456 54,423 306,145 360,568
513,884 1,591,704 2,652,888 220,008 3,617,065 6,489,961
369,066 369,066
1,456 15,127 734,046 750,6296,578 394,677 401,255
6,497,629 7,003,133 73,035 7,076,168
127,436 127,4363,037 (75,712) (27,783) (103,495)
6,500,666 7,062,891 60,379 1,497,789 8,621,059
$ 7,014,550 $ 1,591,704 $ 9,715,779 $ 280,387 $ 5,114,854 $ 15,111,020
Governmental Proprietary(Memorandum
only)
TOTAL REPORTINGENTITYComponent UnitsAccount Group
(Memorandumonly)
TOTAL PRIMARYGOVERNMENT
Trust andAgency
GeneralLong-term Debt
FiduciaryFund Types
- 15 -
STATE OF RHODE ISLAND AND PROVIDENCE PLANTATIONS
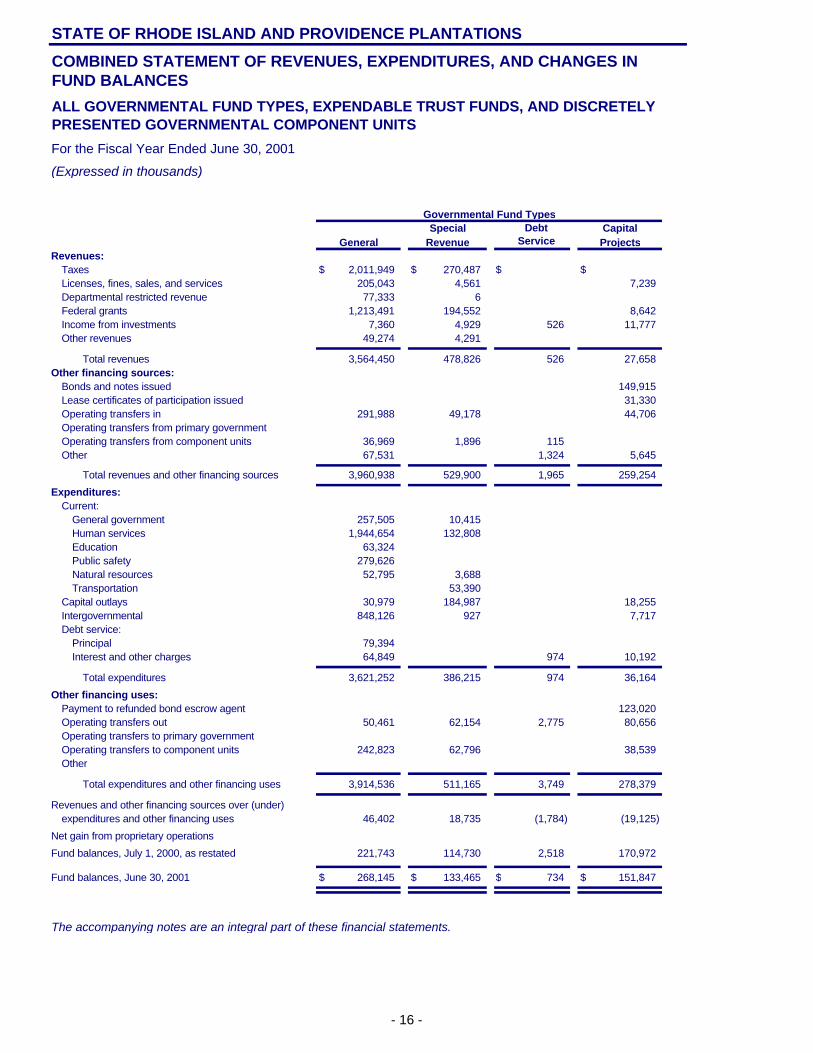
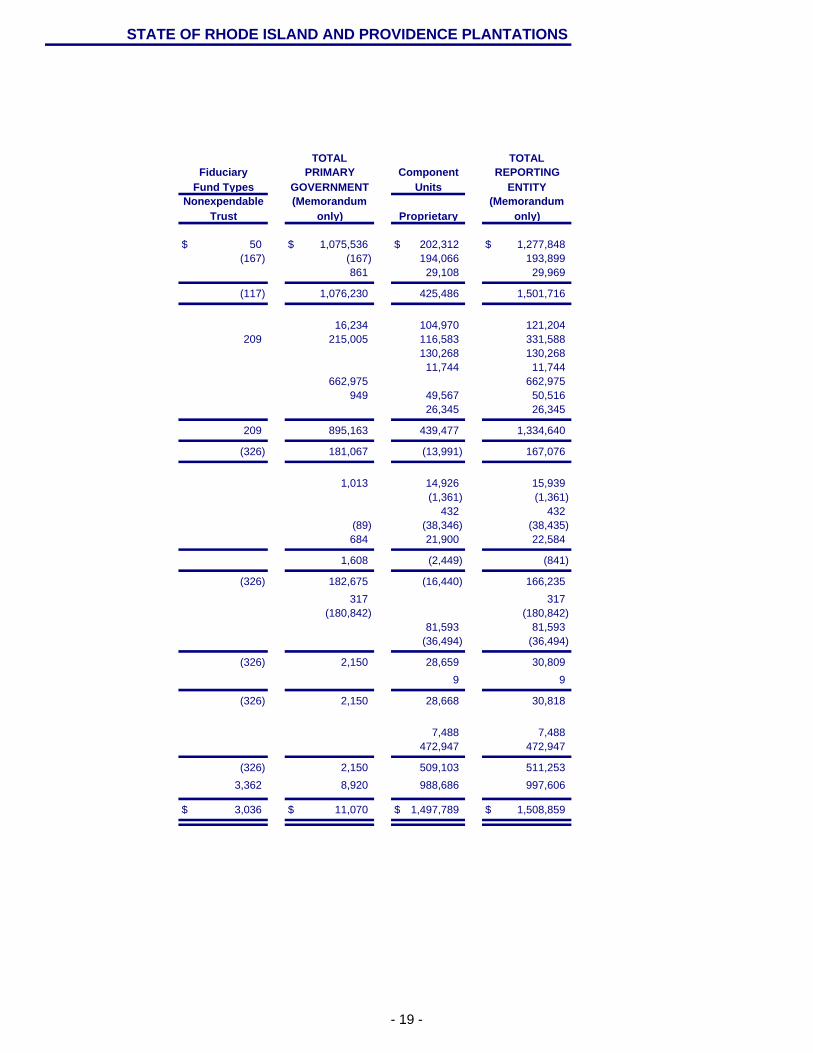
COMBINED STATEMENT OF REVENUES, EXPENDITURES, AND CHANGES INFUND BALANCES
ALL GOVERNMENTAL FUND TYPES, EXPENDABLE TRUST FUNDS, AND DISCRETELYPRESENTED GOVERNMENTAL COMPONENT UNITS
For the Fiscal Year Ended June 30, 2001
(Expressed in thousands)
DebtService
Revenues:Taxes $ 2,011,949 $ 270,487 $ $Licenses, fines, sales, and services 205,043 4,561 7,239Departmental restricted revenue 77,333 6Federal grants 1,213,491 194,552 8,642Income from investments 7,360 4,929 526 11,777Other revenues 49,274 4,291
Total revenues 3,564,450 478,826 526 27,658Other financing sources:
Bonds and notes issued 149,915Lease certificates of participation issued 31,330Operating transfers in 291,988 49,178 44,706Operating transfers from primary governmentOperating transfers from component units 36,969 1,896 115Other 67,531 1,324 5,645
Total revenues and other financing sources 3,960,938 529,900 1,965 259,254
Expenditures:Current:
General government 257,505 10,415Human services 1,944,654 132,808Education 63,324Public safety 279,626Natural resources 52,795 3,688Transportation 53,390
Capital outlays 30,979 184,987 18,255Intergovernmental 848,126 927 7,717Debt service:
Principal 79,394Interest and other charges 64,849 974 10,192
Total expenditures 3,621,252 386,215 974 36,164
Other financing uses:Payment to refunded bond escrow agent 123,020Operating transfers out 50,461 62,154 2,775 80,656Operating transfers to primary governmentOperating transfers to component units 242,823 62,796 38,539Other
Total expenditures and other financing uses 3,914,536 511,165 3,749 278,379
Revenues and other financing sources over (under)expenditures and other financing uses 46,402 18,735 (1,784) (19,125)
Net gain from proprietary operations
Fund balances, July 1, 2000, as restated 221,743 114,730 2,518 170,972
Fund balances, June 30, 2001 $ 268,145 $ 133,465 $ 734 $ 151,847
The accompanying notes are an integral part of these financial statements.
General Revenue ProjectsSpecial Capital
Governmental Fund Types
- 16 -

STATE OF RHODE ISLAND AND PROVIDENCE PLANTATIONS
$ 139,847 $ 2,422,283 $ $ 2,422,283216,843 192,807 409,65077,339 77,339
1,478 1,418,163 68,752 1,486,91518,720 43,312 43,3121,520 55,085 41,070 96,155
161,565 4,233,025 302,629 4,535,654
149,915 9,339 159,25431,330 31,330
385,872 385,872198,935 198,935
38,980 38,9805,482 79,982 350 80,332
167,047 4,919,104 511,253 5,430,357
267,920 267,920151,075 2,228,537 2,228,537
63,324 484,168 547,492279,626 279,62656,483 56,48353,390 53,390
234,221 31,268 265,489856,770 856,770
79,394 624 80,01876,015 2,504 78,519
151,075 4,195,680 518,564 4,714,244
123,020 123,020196,046 196,046
4,373 4,373344,158 344,158
3,903 3,903 33 3,936
154,978 4,862,807 522,970 5,385,777
12,069 56,297 (11,717) 44,580
13,880 13,880
320,038 830,001 58,216 888,217
$ 332,107 $ 886,298 $ 60,379 $ 946,677
Governmental only)
Component
Trust only)Expendable (Memorandum (Memorandum
GOVERNMENT Units
TOTAL TOTALPRIMARY REPORTING
ENTITYFund TypesFiduciary
- 17 -

STATE OF RHODE ISLAND AND PROVIDENCE PLANTATIONS
COMBINED STATEMENT OF REVENUES, EXPENSES, AND CHANGES IN FUND EQUITY
ALL PROPRIETARY FUND TYPES, SIMILAR TRUST FUNDS, AND DISCRETELYPRESENTED PROPRIETARY COMPONENT UNITS
For the Fiscal Year Ended June 30, 2001
(Expressed in thousands)
Operating revenues:Charges for services $ 978,020 $ 97,466Interest incomeOther operating income 861
Total operating revenues 978,020 98,327
Operating expenses:Personal services 3,146 13,088Supplies, materials, and services 132,565 82,231Interest expenseGrant, scholarships, and contract programsPrize awards 662,975Depreciation, depletion, and amortization 217 732Other operating expenses
Total operating expenses 798,903 96,051
Operating income (loss) 179,117 2,276
Nonoperating revenues (expenses):Income from investments 969 44GrantsGain on sale of propertyInterest expense (89)Other nonoperating revenues 684
Total nonoperating revenue (expenses) 1,653 (45)
Income (loss) before transfers 180,770 2,231
Operating transfers in 317Operating transfers out (180,842)Operating transfers from primary governmentOperating transfers to primary government
Income (loss) before extraordinary items (72) 2,548
Extraordinary items
Net income (loss) (72) 2,548
Other changes in fund equity:Increase in contributed capitalOther
Net increase (decrease) in fund equity (72) 2,548
Fund equity, July 1, 2000, as restated 179 5,379
Fund equity, June 30, 2001 $ 107 $ 7,927
The accompanying notes are an integral part of these financial statements.
Service
Proprietary Fund Types
(State Lottery)Enterprise Internal
- 18 -
STATE OF RHODE ISLAND AND PROVIDENCE PLANTATIONS
$ 50 $ 1,075,536 $ 202,312 $ 1,277,848(167) (167) 194,066 193,899
861 29,108 29,969
(117) 1,076,230 425,486 1,501,716
16,234 104,970 121,204209 215,005 116,583 331,588
130,268 130,26811,744 11,744
662,975 662,975949 49,567 50,516
26,345 26,345
209 895,163 439,477 1,334,640
(326) 181,067 (13,991) 167,076
1,013 14,926 15,939(1,361) (1,361)
432 432(89) (38,346) (38,435)684 21,900 22,584
1,608 (2,449) (841)
(326) 182,675 (16,440) 166,235
317 317(180,842) (180,842)
81,593 81,593(36,494) (36,494)
(326) 2,150 28,659 30,809
9 9
(326) 2,150 28,668 30,818
7,488 7,488472,947 472,947
(326) 2,150 509,103 511,253
3,362 8,920 988,686 997,606
$ 3,036 $ 11,070 $ 1,497,789 $ 1,508,859
only) only)Proprietary(Memorandum (MemorandumGOVERNMENT Units ENTITY
ComponentTOTAL TOTAL
PRIMARY REPORTINGFund Types
Fiduciary
NonexpendableTrust
- 19 -

STATE OF RHODE ISLAND AND PROVIDENCE PLANTATIONS
COMBINED STATEMENT OF CASH FLOWS
ALL PROPRIETARY FUND TYPES, SIMILAR TRUST FUNDS, AND DISCRETELYPRESENTED PROPRIETARY COMPONENT UNITS
For the Fiscal Year Ended June 30, 2001(Expressed in thousands)
Cash flows from operating activities:Cash received from customers $ 982,954 $ 95,856 $ 50 $ 1,078,860 $ 580,159 $ 1,659,019Cash received from grants 661 661 1,885 2,546Collections from loans and receivership assets 16,927 16,927Cash payments to suppliers for goods and services (3,470) (83,209) (209) (86,888) (135,479) (222,367)Cash payments to employees for services (3,104) (13,088) (16,192) (94,161) (110,353)Loans issued (1,113) (1,113) (110,419) (111,532)Cash payments for claims, grants, and scholarships (177,641) (177,641)Other operating revenue 895 1,674 2,569 16,249 18,818Other operating expenses (802,018) (802,018) (1,564) (803,582)
Net cash provided by (used for)operating activities 175,257 781 (159) 175,879 95,956 271,835
Cash flows from noncapital financing activities:Proceeds from issuance of long-term debt 349,907 349,907Payment of bonds and notes (255,418) (255,418)Payment of interest (132,125) (132,125)Proceeds from grants 17,212 17,212Loans from other funds 2,463 2,463 2,463Repayment of loans to other funds (2,983) (2,983) (2,983)Collection of loans and mortgages 318 318Contract revenue 4,083 4,083Operating transfers out (192,282) (192,282) (192,282)Operating transfers from primary government 80,693 80,693Operating transfers to primary government (47,686) (47,686)Grants issued (1,510) (1,510)Negative cash balance implicitly financed 433 472 905 (361) 544
Net cash provided by (used for) noncapitalfinancing activities (191,849) (48) (191,897) 15,113 (176,784)
Cash flows from capital and relatedfinancing activities:Principal paid on revenue bonds (12,903) (12,903)Proceeds from issuance of long-term debt 1,900 1,900Payment of interest (89) (89) (38,181) (38,270)Payment of notes and loans (9,747) (9,747)Payment of capital lease obligations (448) (448) (723) (1,171)Payment of financing costs (656) (656)Payment for the purchase of program rights (497) (497)Acquisition of capital assets (193) (496) (689) (73,904) (74,593)Contributed capital 317 317 24,829 25,146Proceeds from capital grants 23,580 23,580Proceeds from sale of assets 1,846 1,846
Net cash provided by (used for) capitaland related financing activities (193) (716) (909) (84,456) (85,365)
Cash flows from investing activities:Purchase of investments (731) (731) (675,128) (675,859)Proceeds from sale and maturity of investments 1,210 891 2,101 612,932 615,033Interest on investments 969 44 114 1,127 67,049 68,176
Net cash provided by (used for) investing activities 2,179 44 274 2,497 4,853 7,350
Net increase (decrease) in cash andcash equivalents (14,606) 61 115 (14,430) 31,466 17,036
Cash and cash equivalents, July 1, 2000 19,405 3,552 654 23,611 409,887 433,498
Cash and cash equivalents, June 30, 2001 $ 4,799 $ 3,613 $ 769 $ 9,181 $ 441,353 $ 450,534
The accompanying notes are an integral part of these financial statements.
Proprietary only)(State Lottery) Service Trust only)(Memorandum
TOTAL TOTALPRIMARY Component REPORTING
(MemorandumEnterprise Internal NonexpendableProprietary Fund Types Fund Types
FiduciaryGOVERNMENT Units ENTITY
- 20 -

STATE OF RHODE ISLAND AND PROVIDENCE PLANTATIONS
Reconciliation of operating income (loss) to net cashprovided by (used for) operating activities:Operating income (loss) $ 179,117 $ 2,276 $ (326) $ 181,067 $ (13,991) $ 167,076
Adjustments to reconcile operating income (loss)to net cash provided by (used for) operatingactivities:
Depreciation, depletion, and amortization 217 732 949 49,567 50,516Interest on investments and other income (1,170) 167 (1,003) (58,565) (59,568)Interest expense and other charges 130,815 130,815Provision for cost of scholarships 1,100 1,100Landfill postclosure costs (1,827) (1,827)(Increase) decrease in assets:
Receivables (1,154) (3,026) (4,180) (34,355) (38,535)Inventories 68 (6) 62 114 176Prepaid items (500) (500) (131) (631)Other assets 1,868 1,868 (3,527) (1,659)
Increase (decrease) in liabilities:Accounts payable and accrued expenses (1,137) 1,305 168 13,367 13,535Deferred revenue (114) (114) (153) (267)Escrow deposits 13,542 13,542Other liabilities (2,438) (2,438) (2,438)
Subtotal (3,860) (1,495) 167 (5,188) 109,947 104,759
Net cash provided by (used for) operating activities $ 175,257 $ 781 $ (159) $ 175,879 $ 95,956 $ 271,835
Noncash investing, capital, and financing activities:Assets acquired through loan program $ $ $ $ $ 7,550 $ 7,550Interest capitalized 100 100Land transfers (837) (837)
Total noncash transactions $ $ $ $ $ 6,813 $ 6,813
Cash and cash equivalents in the Fiduciary Fund Types on the Combined Balance Sheet include:
Expendable Trust Funds $ 1,323Pension Trust Funds 1,154Agency Fund 14,374Nonexpendable Trust Funds 769
Total $ 17,620
Cash and cash equivalents for Proprietary Component Units on the Combined Balance Sheet include:Cash and cash equivalents from Statement of Cash Flow $ 441,353R.I. Housing Mortgage Finance Corporation - Affordability Housing Trust 5,542R.I. Higher Education Assistance Authority - CollegeBoundfund Program Fund 6,312R.I. Higher Education Assistance Authority - Federal Student Loan Reserve Fund 6,821
Total $ 460,028
Proprietary only)(State Lottery) Service Trust only)
ENTITYEnterprise Internal Nonexpendable (Memorandum (MemorandumProprietary Fund Types Fund Types GOVERNMENT Units
TOTAL TOTALFiduciary PRIMARY Component REPORTING
- 21 -

STATE OF RHODE ISLAND AND PROVIDENCE PLANTATIONS
COMBINED STATEMENT OF REVENUES, EXPENDITURES, AND CHANGESIN FUND BALANCES - BUDGET AND ACTUAL
GENERAL FUND AND BUDGETED SPECIAL REVENUE FUNDSFor the Fiscal Year Ended June 30, 2001
(Expressed in thousands)
Revenues:Taxes $ 2,011,700 $ 2,011,949 $ 249Licenses, fines, sales, and services 197,000 205,043 8,043Departmental restricted revenue 52,273 77,333 25,060Federal grants 1,288,036 1,213,491 (74,545)Other revenues 57,500 56,634 (866)
Total revenues 3,606,509 3,564,450 (42,059)
Other financing sources:Operating transfers in 282,431 291,988 9,557Operating transfers from component units 35,255 36,969 1,714Other 72,152 67,531 (4,621)
Total revenues and other financing sources 3,996,347 3,960,938 (35,409)
Expenditures:Current:
General government 271,521 257,505 14,016Human services 1,980,267 1,944,654 35,613Education 90,184 63,324 26,860Public safety 290,371 279,626 10,745Natural resources 65,842 52,795 13,047Transportation
Capital outlays 30,480 30,979 (499)Intergovernmental 851,821 848,126 3,695Debt service:
Principal 81,397 79,394 2,003Interest and other charges 62,739 64,849 (2,110)
Total expenditures 3,724,622 3,621,252 103,370
Other financing uses:Operating transfers out 45,160 50,461 (5,301)Operating transfers to component units 237,695 242,823 (5,128)
Total expenditures and other financing uses 4,007,477 3,914,536 92,941
Revenues and other financing sources over (under)expenditures and other financing uses (11,130) 46,402 57,532
Fund balances, July 1, 2000, as restated 221,743 221,743
Fund balances, June 30, 2001 $ 210,613 $ 268,145 $ 57,532
The accompanying notes are an integral part of these financial statements.
General FundVarianceBudget Actual
- 22 -

STATE OF RHODE ISLAND AND PROVIDENCE PLANTATIONS
$ 266,767 $ 270,487 $ 3,720 $ 2,278,467 $ 2,282,436 $ 3,969197,000 205,043 8,043
25,560 6 (25,554) 77,833 77,339 (494)231,762 194,552 (37,210) 1,519,798 1,408,043 (111,755)
3,500 8,887 5,387 61,000 65,521 4,521
527,589 473,932 (53,657) 4,134,098 4,038,382 (95,716)
45,290 45,290 282,431 337,278 54,84735,255 36,969 1,71472,152 67,531 (4,621)
527,589 519,222 (8,367) 4,523,936 4,480,160 (43,776)
6,159 5,490 669 277,680 262,995 14,685128,000 132,808 (4,808) 2,108,267 2,077,462 30,805
90,184 63,324 26,860290,371 279,626 10,74565,842 52,795 13,047
88,642 53,045 35,597 88,642 53,045 35,597180,510 184,987 (4,477) 210,990 215,966 (4,976)
756 (756) 851,821 848,882 2,939
81,397 79,394 2,00362,739 64,849 (2,110)
403,311 377,086 26,225 4,127,933 3,998,338 129,595
56,100 62,154 (6,054) 101,260 112,615 (11,355)72,388 61,924 10,464 310,083 304,747 5,336
531,799 501,164 30,635 4,539,276 4,415,700 123,576
(4,210) 18,058 22,268 (15,340) 64,460 79,8004,900 112,632 107,732 226,643 334,375 107,732
$ 690 $ 130,690 $ 130,000 $ 211,303 $ 398,835 $ 187,532
TotalBudgeted Special Revenue Funds (Memorandum Only)
ActualBudget VarianceActualBudgetVariance
- 23 -

STATE OF RHODE ISLAND AND PROVIDENCE PLANTATIONS
COMBINED STATEMENT OF PLAN NET ASSETS
PENSION TRUST FUNDS
June 30, 2001
(Expressed in thousands)
Cash and cash equivalents $ 685 $ 174 $ 181 $ 114 $ 1,154
Receivables:Member contributions 11,467 1,489 12,956 Employer contributions 9,624 1,510 11,134 Due from other funds 7,569 7,569 Miscellaneous 1,341 195 6 4 1,546
Total receivables 30,001 3,194 6 4 33,205
Investments, at fair value:Equity in short-term investment fund 4,323 2,653 6,976 Equity in pooled trust 5,296,572 776,856 12,354 7,886 6,093,668 Plan specific investments 27,325 27,325
Total investments before lending activities 5,328,220 779,509 12,354 7,886 6,127,969
Invested securities lending collateral 381,179 55,908 889 568 438,544
Property and equipment, at cost, net of accumulated depreciation Line of Business System in Development 7,468 1,090 15 10 8,583 Computer Equipment (net of accumulated depreciation $134,535) 468 68 1 1 538
Total Property and Equipment 7,936 1,158 16 11 9,121
Total assets 5,748,021 839,943 13,446 8,583 6,609,993
Securities lending liability 381,179 55,908 889 568 438,544 Vouchers and accounts payable 5,164 743 12 8 5,927
Total liabilities 386,343 56,651 901 576 444,471
Net assets held in trustfor pension benefits $ 5,361,678 $ 783,292 $ 12,545 $ 8,007 $ 6,165,522
The accompanying notes are an integral part of these financial statements.
Municipal State Police Judicial Employees' Employees' Retirement Retirement TOTAL Retirement Retirement Benefits Benefits (Memorandum
only)
Assets
Liabilities
System System Trust Trust
- 24 -

STATE OF RHODE ISLAND AND PROVIDENCE PLANTATIONS
COMBINED STATEMENT OF PLAN NET ASSETS
PENSION TRUST FUNDS
June 30, 2001
(Expressed in thousands)
Cash and cash equivalents $ 685 $ 174 $ 181 $ 114 $ 1,154
Receivables:Member contributions 11,467 1,489 12,956Employer contributions 9,624 1,510 11,134Due from other funds 7,569 7,569Miscellaneous 1,341 195 6 4 1,546
Total receivables 30,001 3,194 6 4 33,205
Investments, at fair value:Equity in short-term investment fund 4,323 2,653 6,976Equity in pooled trust 5,296,572 776,856 12,354 7,886 6,093,668Plan specific investments 27,325 27,325
Total investments before lending activities 5,328,220 779,509 12,354 7,886 6,127,969
Invested securities lending collateral 381,179 55,908 889 568 438,544
Property and equipment, at cost, net of accumulated depreciation Line of Business System in Development 7,468 1,090 15 10 8,583 Computer Equipment (net of accumulated depreciation $134,535) 468 68 1 1 538
Total Property and Equipment 7,936 1,158 16 11 9,121
Total assets 5,748,021 839,943 13,446 8,583 6,609,993
Securities lending liability 381,179 55,908 889 568 438,544Vouchers and accounts payable 5,164 743 12 8 5,927
Total liabilities 386,343 56,651 901 576 444,471
Net assets held in trustfor pension benefits $ 5,361,678 $ 783,292 $ 12,545 $ 8,007 $ 6,165,522
The accompanying notes are an integral part of these financial statements.
Liabilities
Assets
Employees'Retirement
System
MunicipalEmployees'Retirement
System
State PoliceRetirement
BenefitsTrust only)
JudicialRetirement
BenefitsTrust
TOTAL(Memorandum
- 25 -

This Page Intentionally Left Blank
-26 -

STATE OF RHODE ISLAND AND PROVIDENCE PLANTATIONS Notes to General-Purpose Financial Statements
- 27 -
INDEX
Page
Note 1. Summary of Significant Accounting Policies ................................. 28
Note 2. Budgeting and Budgetary Control ................................................ 38
Note 3. Cash, Cash Equivalents and Investments ..................................... 45
Note 4. Receivables .............................................................................. 49
Note 5. Intra-Entity Receivables and Payables .......................................... 50
Note 6. Fixed Assets ............................................................................ 51
Note 7. Long-Term Obligations............................................................... 52
Note 8. Reservations and Designations of Fund Equity .............................. 59
Note 9. Operating Transfers................................................................... 62
Note 10. Operating Lease Commitments ................................................... 64
Note 11. Commitments........................................................................... 64
Note 12. Contingencies........................................................................... 67
Note 13. Employer Pension Plans ............................................................. 69
Note 14. Postemployment Benefits........................................................... 71
Note 15. Deferred Compensation ............................................................. 71
Note 16. Fund Deficits............................................................................ 71
Note 17. Restatement of Fund Equity ....................................................... 72
Note 18. Segment Information ................................................................. 73
Note 19. Risk Management ..................................................................... 74
Note 20. Extraordinary Items ................................................................... 75
Note 21. Related Party Transactions ......................................................... 75
Note 22. Subsequent Events ................................................................... 76

STATE OF RHODE ISLAND AND PROVIDENCE PLANTATIONS Notes to General-Purpose Financial Statements
- 28 -
Note 1. Summary Of Significant Accounting Policies
A. Basis of Presentation
The accompanying general-purpose financial statements have been prepared in conformancewith generally accepted accounting principles (GAAP) for governments as prescribed by theGovernmental Accounting Standards Board (GASB), except as described in Note 1(D). GASB is the accepted standard setting body for establishing governmental accounting andfinancial reporting principles. In accordance with GASB Statement No. 20, "Accounting andFinancial Reporting for Proprietary Funds and Other Governmental Entities That UseProprietary Fund Accounting," in the absence of specific guidance from GASBpronouncements, pronouncements of the Financial Accounting Standards Board issued on orbefore November 30, 1989 have been followed.
B. Reporting Entity
The general-purpose financial statements include all funds and account groups of the Stateof Rhode Island and Providence Plantations (the state) and its component units. GASBdefines component units as legally separate entities for which a primary government (thestate) is financially accountable or, if not financially accountable, their exclusion wouldcause the state's financial statements to be misleading. GASB has set forth criteria to beconsidered in determining financial accountability. These criteria include appointing a votingmajority of an entity's governing body and (1) the ability of the state to impose its will onthat entity or (2) the potential for the entity to provide specific financial benefits to, orimpose specific financial burdens on the state. The state has considered all agencies,boards, commissions, public benefit authorities and corporations, the state university andcolleges and the Central Falls School District as potential component units. Audited financialstatements of the individual component units can be obtained from their respectiveadministrative offices.
Blended Component Units
These component units are entities which are legally separate from the state, but are sointertwined with the state that they are in substance, the same as the state. They arereported as part of the state and blended into the appropriate funds.
State Lottery Fund (Lottery) - This fund is used to account for the revenues generated bythe State Lottery Commission in conducting various lottery games. According to statute,earnings after allocation for prize awards and payment of expenses shall be transferred tothe state’s general fund. For more detailed information, a copy of the financial statementscan be obtained by writing to the State Lottery Commission, 1425 Pontiac Avenue,Cranston, RI 02920.
Rhode Island Refunding Bond Authority (RIRBA) - This authority was created by law for thepurpose of loaning money to the state to provide funds to pay, redeem, or retire certaingeneral obligation bonds. In fiscal 1998, the state abolished the R.I. Public BuildingsAuthority (RIPBA) and assigned the responsibility for managing RIPBA’s outstanding debt tothe RIRBA. RIPBA was previously reported as a blended component unit. The RIRBA isauthorized to issue bonds. Even though it is legally separate, the RIRBA is reported as if it

STATE OF RHODE ISLAND AND PROVIDENCE PLANTATIONS Notes to General-Purpose Financial Statements
- 29 -
were part of the primary government because it provides services entirely to the primarygovernment. It is blended into the Capital Projects Funds and the General Long-Term DebtAccount Group. For more detailed information, a copy of the financial statements can beobtained by writing to the R.I. Refunding Bond Authority, State House, Providence, RI02903.
Rhode Island Economic Policy Council (RIEPC) - This council is a non-profit organizationcreated by executive order in March 1995 and incorporated in January 1996. The purposeof the council is to work closely with state officials to identify issues facing the state'seconomy, to develop and recommend creative strategies and policies to address them, toadvise the state legislature in policy matters relating to economic development, and toadminister a program designed to foster private technology commercialization and plant andprocess modernization through research centers, higher education partnerships and clustercollaboratives. It is blended into the Special Revenue Funds. For more detailed information,a copy of the financial statements can be obtained by writing to the R.I. Economic PolicyCouncil, 15 Westminster Street Suite 615, Providence, RI 02903-2417.
Discretely Presented Component Units
Discretely presented component units are reported in separate columns in the combinedfinancial statements to emphasize that they are legally separate from the primarygovernment. They are financially accountable to the primary government, or haverelationships with the primary government such that exclusion would cause the reportingentity's financial statements to be misleading or incomplete. These discretely presentedcomponent units serve or benefit those outside of the primary government. Discretelypresented component units are:
Governmental Component Units
University and Colleges - The Board of Governors for Higher Education has oversightresponsibility for the University of Rhode Island, Rhode Island College and CommunityCollege of Rhode Island. The Board is appointed by the Governor with approval of theSenate. The university and colleges are funded through state appropriations, tuition, federalgrants, private donations and grants. For more detailed information, a copy of the financialstatements can be obtained by writing to the University of Rhode Island, CarlottiAdministration Building, Kingston, RI 02881; Rhode Island College, Mount Pleasant Avenue,Providence, RI 02908; and Community College of Rhode Island, 400 East Avenue, Warwick,RI 02886-1805.
Central Falls School District - The Rhode Island General Assembly passed an act whichprovided for the state to assume an administrative takeover of the Central Falls SchoolDistrict. The Governor appointed a special state administrator who replaced the schoolcommittee. The state administrator reports to the Commissioner of Elementary andSecondary Education. The District's purpose is to provide elementary and secondaryeducation to residents of the City of Central Falls. For more detailed information, a copy ofthe financial statements can be obtained by writing to the Central Falls School District, 21Hadley Avenue, Central Falls, RI 02863.

STATE OF RHODE ISLAND AND PROVIDENCE PLANTATIONS Notes to General-Purpose Financial Statements
- 30 -
Proprietary Component Units
Rhode Island Housing and Mortgage Finance Corporation (RIHMFC) - This Corporation,established in 1973, was created in order to expand the supply of housing available topersons of low and moderate income and to stimulate the construction and rehabilitation ofhousing and health care facilities in the state. It has the power to issue notes and bonds toachieve its corporate purpose. For more detailed information, a copy of the financialstatements can be obtained by writing to the R.I. Housing and Mortgage FinanceCorporation, 44 Washington Street, Providence, RI 02903-1721.
Rhode Island Student Loan Authority (RISLA) - This Authority, established in 1981, wascreated in order to provide a statewide student loan program through the acquisition ofstudent loans. It has the power to issue bonds and notes, payable solely from its revenues. For more detailed information, a copy of the financial statements can be obtained by writingto the R.I. Student Loan Authority, 560 Jefferson Boulevard, Warwick, RI 02886.
Rhode Island Turnpike and Bridge Authority (RITBA) - This Authority was created by theGeneral Assembly as a body corporate and politic, with powers to construct, acquire,maintain and operate bridge projects as defined by law. For more detailed information, acopy of the financial statements can be obtained by writing to the R.I. Turnpike and BridgeAuthority, P.O. Box 437, Jamestown, RI 02835-0437.
Rhode Island Economic Development Corporation (RIEDC) - This Corporation was created in1995 as a result of a merger by the General Assembly of the Rhode Island Port Authority(RIPAEDC) and former Department of Economic Development. The purpose of RIEDC is topromote and encourage the preservation, expansion, and sound development of new andexisting industry, business, commerce, agriculture, tourism, and recreational facilities in thestate, which will promote economic development. It has the power to issue tax-exemptindustrial development bonds to accomplish its corporate purpose. Prior to 1995, theRIPAEDC created a subsidiary corporation, the R. I. Airport Corporation, to manage thestate's six airports. For more detailed information, a copy of the financial statements can beobtained by writing to the R.I. Economic Development Corporation, One West ExchangeStreet, Providence, RI 02903.
Rhode Island Convention Center Authority (RICCA) - This Authority was created in 1987 tofacilitate the construction and development of a convention center, parking garages andrelated facilities within the City of Providence. For more detailed information, a copy of thefinancial statements can be obtained by writing to the R.I. Convention Center Authority, OneWest Exchange Street, Providence, RI 02903.
Narragansett Bay Commission (NBC) - This Commission was created for the purposes ofacquiring, planning, constructing, extending, improving, operating and maintaining publiclyowned wastewater treatment facilities. NBC receives contributed capital from the state toupgrade its facilities. For more detailed information, a copy of the financial statements canbe obtained by writing to the Narragansett Bay Commission, One Service Road, Providence,RI 02905.
Rhode Island Health and Educational Building Corporation (RIHEBC) - This Corporation hasthe following purposes: (1) to assist in providing financing for education facilities for colleges

STATE OF RHODE ISLAND AND PROVIDENCE PLANTATIONS Notes to General-Purpose Financial Statements
- 31 -
and universities operating in the state; (2) to assist hospitals in the state in the financing ofhealth care facilities; (3) to assist stand-alone, non-profit assisted-living and adult daycarefacilities; (4) to assist in financing a broad range of non-profit health care providers; and (5)to assist in financing non-profit secondary schools and child care centers. RIHEBC issuesbonds, notes and leases which are special obligations of RIHEBC payable from revenuesderived from the projects financed or other moneys of the participating education institutionor health care institution. The bonds, notes and leases do not constitute a debt or pledge ofthe faith and credit of RIHEBC or the state and accordingly have not been reported in theaccompanying financial statements. For more detailed information, a copy of the financialstatements can be obtained by writing to the R.I. Health and Educational BuildingCorporation, 400 Westminster Street, Providence, RI 02903.
Rhode Island Resource Recovery Corporation (RIRRC) - This Corporation was established in1974 in order to provide and/or coordinate solid waste management services tomunicipalities and persons within the state. RIRRC has the power to issue negotiable bondsand notes to achieve its corporate purpose. For more detailed information, a copy of thefinancial statements can be obtained by writing to the R.I. Resource Recovery Corporation,65 Shun Pike, Johnston, RI 02919.
Rhode Island Depositors Economic Protection Corporation (DEPCO) - This Corporation wascreated in 1991 to assist in protecting the interests of depositors of certain financialinstitutions in the state which had been closed when their private deposit insurer failed,thereby leaving those institutions without deposit insurance as required by statute. DEPCOis empowered to acquire all or a portion of the assets of the closed institutions therebyaiding the prompt repayment of the deposit liabilities of the closed institutions. DEPCO hasthe power to issue negotiable bonds and notes to achieve its corporate purpose. For moredetailed information, a copy of the financial statements can be obtained by writing to theR.I. Depositors Economic Protection Corporation, 832 Dyer Avenue, Cranston, RI 02920.
Rhode Island Higher Education Assistance Authority (RIHEAA) - This Authority was createdby law in 1977 for the dual purpose of guaranteeing loans to students in eligible institutionsand administering other programs of post secondary student assistance. For more detailedinformation, a copy of the financial statements can be obtained by writing to the R.I. HigherEducation Assistance Authority, 560 Jefferson Boulevard, Warwick, RI 02886.
Rhode Island Public Transit Authority (RIPTA) - This Authority was established in 1964 toacquire any mass motor bus transportation system if that system has previously filed apetition to discontinue its service and further, if RIPTA determines it is in the public interestto continue such service. Revenues of RIPTA include operating assistance grants from thefederal and state governments. For more detailed information, a copy of their financialstatements can be obtained by writing to the R.I. Public Transit Authority, 265 MelroseStreet, Providence, RI 02907.
Rhode Island Industrial Facilities Corporation (RIIFC) - The purpose of this Corporation is toissue revenue bonds, construction loan notes and equipment acquisition notes for thefinancing of projects which further industrial development in the state. All bonds and notesissued by RIIFC are payable solely from the revenues derived from leasing or sale by RIIFC ofits projects. The bonds and notes do not constitute a debt or pledge of the faith and creditof RIIFC or the state and accordingly have not been reported in the accompanying financial

STATE OF RHODE ISLAND AND PROVIDENCE PLANTATIONS Notes to General-Purpose Financial Statements
- 32 -
statements. For more detailed information, a copy of the financial statements can beobtained by writing to the R.I. Industrial Facilities Corporation, One West Exchange Street,Providence, RI 02903.
Rhode Island Clean Water Finance Agency (RICWFA) - This Agency was established in 1991for the purpose of providing financial assistance in the form of loans to municipalities, sewercommissions and waste water management districts in the state for the construction orupgrading of water pollution abatement projects. RICWFA receives capital grants from thestate and federal governments and is authorized to issue revenue bonds and notes. Formore detailed information, a copy of the financial statements can be obtained by writing tothe R.I. Clean Water Finance Agency, 235 Promenade Street, Suite 119, Providence, RI02908.
Rhode Island Industrial-Recreational Building Authority (RIIRBA) - This Authority is authorizedto insure first mortgages and first security agreements granted by financial institutions andthe Rhode Island Industrial Facilities Corporation for companies conducting business in thestate. Any losses realized in excess of the fund balance would be funded by the state. Formore detailed information, a copy of the financial statements can be obtained by writing tothe R.I. Industrial-Recreational Building Authority, One West Exchange Street, Providence, RI02903.
Rhode Island Water Resources Board Corporate (RIWRBC) - This Board was created by lawto foster and guide the development of water resources including the establishment of watersupply facilities and lease these facilities to cities, towns, districts, and other municipal,quasi-municipal or private corporations engaged in the water supply business in the state. RIWRBC is authorized to issue revenue bonds which are payable solely from revenuesgenerated by the lease of its facilities or the sale of water. For more detailed information, acopy of the financial statements can be obtained by writing to the R.I. Water ResourcesBoard Corporate, 100 North Main Street, Providence, RI 02903.
Rhode Island Public Telecommunications Authority (RIPTCA) - This Authority owns andoperates a non-commercial educational television station in the state. For more detailedinformation, a copy of the financial statements can be obtained by writing to the R.I. PublicTelecommunications Authority, 50 Park Lane, Providence, RI 02907-3124.
Rhode Island Children's Crusade for Higher Education (RICCHE) - This is a Rhode Islandnonprofit corporation formed for the purpose of fostering the education of economicallydisadvantaged youth through scholarship awards, summer jobs programs, and mentoringprograms for parents and students. For more detailed information, a copy of the financialstatements can be obtained by writing to the R.I. Children’s Crusade for Higher Education,The 134 Center, Suite 111, 134 Thurbers Avenue, Providence, RI 02905.
C. Fund Accounting
The general-purpose financial statements have been prepared from accounts maintained bythe State Controller and from reports prescribed by the State Controller and prepared by thecomponent units based on independent accounting systems maintained by those entities.

STATE OF RHODE ISLAND AND PROVIDENCE PLANTATIONS Notes to General-Purpose Financial Statements
- 33 -
The state uses funds and account groups to report on its financial position and the results ofits operations. Fund accounting is designed to demonstrate legal compliance and to aidfinancial management by segregating transactions related to certain government functions oractivities. A fund is a separate accounting entity with a self-balancing set of accounts. Anaccount group is a financial reporting device designed to provide accountability for certainassets and liabilities that are not recorded in the funds because they do not directly affectnet expendable available financial resources.
The state records its transactions in the fund types and account group described below.
Governmental Fund Types
General - is the general operating fund of the state and is used to account for all financialtransactions except those required to be accounted for in another fund. Included within thisfund are the operations of most jointly financed state - federal programs.
Special Revenue - is used to account for the proceeds of specific revenue sources that arelegally restricted to expenditures for specified purposes and where a separate fund ismandated.
Debt Service – is used to account for the accumulation of resources for, and the paymentof, long-term debt. The state’s debt service fund is funded by annual appropriations thatapproximate the annual interest savings from debt refundings and other sources.
Capital Projects - accounts for resources obtained and used for the acquisition, constructionor improvement of capital facilities not reported in other governmental or proprietary funds.Such resources are derived principally from the proceeds of general obligation bonds,revenue bonds, lease participation certificates, and operating transfers from the generalfund.
Proprietary Fund Types
Enterprise - is used to account for activities that are financed and operated in a mannersimilar to private business enterprises where (1) the costs of providing goods or services tothe general public on a continuing basis are to be financed or recovered through usercharges; or (2) the periodic determination of revenues earned, expenses incurred and/or netincome is appropriate. The State Lottery Fund is the only fund in this category.
Internal Service - is used to account for the financing and providing of specified goods andservices, on a centralized basis, for other departments and agencies.
Fiduciary Fund Types
Trust and Agency - is used to account for transactions related to assets held by the state ina trustee or agency capacity. These include pension trust funds, expendable andnonexpendable trust funds, and agency funds.

STATE OF RHODE ISLAND AND PROVIDENCE PLANTATIONS Notes to General-Purpose Financial Statements
- 34 -
Account Group
General Long-Term Debt Account Group - accounts for all general long-term debt and otherlong-term obligations of the primary government not accounted for in the proprietary funds.Significant long-term obligations include general obligation bonds, revenue bonds, capitalleases and compensated absences.
D. Basis of Accounting
All governmental fund types, expendable trust funds, agency funds and governmentalcomponent units are accounted for using the current financial resources measurement focusand are maintained on the modified accrual basis of accounting. Under this measurementfocus, only current assets and current liabilities are generally included on the balance sheet. Operating statements of these funds present increases (i.e., revenues and other financingsources) and decreases (i.e., expenditures and other financing uses) as changes in netcurrent assets.
Under the modified accrual basis of accounting, revenues, grants, entitlements and relatedreceivables are recorded in the accounting period that they become both measurable andavailable, i.e., earned and collected or expected to be collected within the next 12 months.Tax revenues are recorded by the state as taxpayers earn income (personal and businessincome taxes), as sales are made (sales and use taxes) and as the taxable event occurs(miscellaneous taxes), net of estimated refunds. Deferred revenues offset taxes receivablenot expected to be collected within the next 12 months. Grant revenue is recorded whenthe related expenditure has been made. Cash advances from grants are reported as deferredrevenue.
Expenditures are recorded when the related fund liability is incurred. Exceptions to thegeneral modified accrual expenditure recognition criteria include principal and interest ongeneral long-term debt which are recognized when due and compensated absences whichare recognized when paid.
On-behalf payments for fringe benefits are reported the same as direct payments tograntees. Therefore, both the state aid to local public school districts and the state’s shareof the employers’ contribution, as required by General Laws, to the Employees’ RetirementSystem for teachers employed by local public school districts are reported asintergovernmental expenditures (operating transfers out for the Central Falls School District)in the general fund.
Unexpended general revenue appropriations, as reappropriated by the Governor, andunexpended restricted revenues and operating transfers in are carried forward at fiscal yearend and are available for expenditure in the following fiscal year. The amounts carriedforward are reflected in the combined balance sheet as part of fund equity.
All proprietary fund types, pension trust funds, nonexpendable trust funds and proprietarycomponent units are accounted for using the economic resources measurement focus andare maintained on the accrual basis of accounting. Under the accrual basis of accounting,revenues and grants are recognized when earned and expenses are recognized at the timerelated liabilities are incurred. All assets and liabilities associated with the operation of these

STATE OF RHODE ISLAND AND PROVIDENCE PLANTATIONS Notes to General-Purpose Financial Statements
- 35 -
funds are included on the combined balance sheet. Fund equity is segregated intocontributed capital and retained earnings/fund balance.
The financial statements of R.I. Children’s Crusade for Higher Education (RICCHE) areprepared in conformity with generally accepted accounting principles using FASB guidance.
E. Cash and Cash Equivalents
Cash represents amounts in demand deposit accounts with financial institutions. Cashequivalents are highly liquid investments with a maturity of three months or less at the timeof purchase.
The state does not pool its cash deposits.
F. Funds on Deposit with Fiscal Agent
Funds on deposit with fiscal agent in the capital projects funds and trust and agency fundsare the unexpended portion of certificates of participation and funds held by the UnitedStates Treasury Department for the payment of unemployment benefits, respectively.
G. Investments
Investments are generally stated at fair value. Fair value is the amount at which a financialinstrument could be exchanged in a current transaction between willing parties, other than aforced or liquidation sale. Short-term investments are stated at amortized cost, whichapproximates fair value.
The pension trust funds may enter into foreign currency exchange contracts to minimize theshort-term impact of foreign currency fluctuations on the asset and liability positions offoreign investments. The gains or losses on these contracts are included in income in theperiod in which the exchange rates change. Gains and losses on contracts which hedgespecific foreign currency denominated commitments are deferred and recognized in theperiod in which the transaction is completed. By policy, no more than 50% of activelymanaged foreign equity securities (at fair value) may be hedged into the base currency (U.S.dollars).
H. Receivables
Receivables are stated net of allowances for uncollectable and unavailable amounts.
I. Due From Other Governments and Agencies
Due from other governments and agencies represents principally amounts owed to the statein reimbursement of federal expenditures.
J. Due from/to Other Funds/Component Units/Primary Government
During the course of operations, numerous transactions occur between individual fundswithin the primary government and between the primary government and discretely

STATE OF RHODE ISLAND AND PROVIDENCE PLANTATIONS Notes to General-Purpose Financial Statements
- 36 -
presented component units. These intra-entity receivables and payables are classified as"due from other funds/component units/primary government" or "due to otherfunds/component units/primary government" in the combined balance sheet.
K. Inventories
Inventory type items acquired by governmental funds are accounted for as expenditures atthe time of purchase.
Inventories of governmental component units are stated at the lower of cost (first-in, first-out and retail inventory method) or market, and consist primarily of bookstore and dining,health and residential life services items.
Inventories of the proprietary funds and proprietary component units are stated at cost.
L. Fixed Assets
The cost of fixed assets acquired by governmental fund types is accounted for as anexpenditure upon purchase.
A statement of general fixed assets is not included herein since the information required toprepare such a statement has not been fully developed.
Certain fixed assets used in the operation of internal service funds are capitalized in the fundin which they are utilized and are depreciated on the straight-line basis over their estimateduseful lives. Certain internal service funds use capital leases to finance assets. Since thelease costs are recovered through service charges, such assets and related debt areaccounted for within the internal service funds. These assets are depreciated over theirestimated useful lives.
The cost of fixed assets used by the enterprise fund and pension trust funds is capitalizedand depreciation is provided on a straight-line basis over the estimated useful lives of theassets.
The cost of fixed assets used by the component units is capitalized and depreciation isprovided on a straight-line basis over the estimated useful lives of the assets. With theexception of the R.I. Economic Development Corporation, R.I. Resource RecoveryCorporation and the Narragansett Bay Commission, interest is not capitalized.
M. Other Assets
Other assets include, among other things, deferred bond issuance and financing costs,present value of future scholarships pledged by institutions of higher learning, airport noisemitigation assets, restricted assets held in trust, and property held for sale and development.
N. Rentals Due
Rentals due for payment of principal and current interest on revenue bonds representamounts due as required under several lease arrangements relating to capital projects.

STATE OF RHODE ISLAND AND PROVIDENCE PLANTATIONS Notes to General-Purpose Financial Statements
- 37 -
O. Other Liabilities
Other liabilities include, among other things, deferred scholarships, landfill post-closurecosts, securities lending liability, and deposits pending distribution.
P. Bonds Payable
In governmental fund types, bond discounts/premiums and issuance costs are recognized inthe current period; bond proceeds are recorded net of these amounts. Bond discounts,premiums and issuance costs for proprietary fund types are generally deferred and amortizedover the term of the bonds using the straight-line method for issuance costs and the interestmethod for discounts and premiums. Bond discounts and premiums are presented as anadjustment to the face amount of bonds payable.
The R.I. Convention Center Authority has entered into interest rate swap agreements tomodify interest rates on outstanding debt. Other than the net interest expenditures resultingfrom these agreements, no amounts are recorded in the financial statements.
Q. Obligations Under Capital Leases
The construction and acquisition of certain state office buildings, campus facilities and otherpublic facilities, as well as certain equipment acquisitions, have been financed through bondsand notes issued by the R.I. Refunding Bond Authority, the R.I. Convention CenterAuthority, the R.I. Economic Development Corporation, or by a trustee pursuant to alease/purchase agreement with the state (See Note 7(D)).
R. Accrued Liabilities
Accrued liabilities generally represent accrued salary and fringe benefits in the governmentalfund types and accrued interest payable, accrued salaries and accrued vacation and sickleave in the proprietary fund types.
S. Compensated Absences
Vacation pay may be discharged, subject to limitations as to carry-over from year to year, byfuture paid leave or by cash payment upon termination of service. Sick pay may bedischarged by payment for an employee's future absence caused by illness or, to the extentof vested rights, by cash payment upon death or retirement. For governmental fund types,such obligations are recorded in the General Long-Term Debt Account Group and forproprietary fund types, they are recorded as fund liabilities.
T. Fund Equity
Contributed capital is recorded in proprietary funds that have received capital grants orcontributions from the federal and/or state governments. Depreciation expense isrecognized on assets acquired or constructed with these funds. Certain component unitsrecord transfers from contributed capital to retained earnings in an amount equal to theannual depreciation charge.

STATE OF RHODE ISLAND AND PROVIDENCE PLANTATIONS Notes to General-Purpose Financial Statements
- 38 -
Reserved fund balances represent amounts which are (1) not appropriable for expenditure or(2) legally segregated for a specific future use.
Designated fund balances represent amounts segregated to indicate management's tentativeplans or intent for future use of financial resources.
U. Memorandum Only - Total Columns
Total columns on the general-purpose financial statements are captioned "memorandumonly" to indicate that they are presented only to facilitate financial analysis. Data in thesecolumns are not comparable to a consolidation. Intra-entity eliminations have not beenmade in the aggregation of this data.
V. New Accounting Pronouncements
1. In fiscal year 2001, the state implemented GASB Statement No. 33, "Accounting andFinancial Reporting for Nonexchange Transactions." The implementation of GASBStatement No. 33 resulted in the recognition of an additional $7,050,800 of tax revenues,net of estimated refunds, in the General Fund. The net effect of implementing GASBStatement No. 33 on the Rhode Island Temporary Disability Insurance Fund within theSpecial Revenue Funds and on the Employment Security Trust Fund within the Trust andAgency Funds was a cumulative increase in fund balances of $37,636,000 and$33,873,900, respectively (See Note 17 - Restatement of Fund Equity).
2. In June 1999, the GASB issued Statement No. 34, Basic Financial Statements--andManagement's Discussion and Analysis--for State and Local Governments. The state isrequired to apply this statement for periods beginning after June 15, 2001. GASBStatement No. 34 establishes new financial reporting requirements that fundamentally affectthe presentation of general purpose government's basic financial statements and relatedrequired supplementary information. In November 1999, the GASB established accountingand financial reporting standards for public colleges and universities within the financialreporting guidelines of GASB Statement No. 34 when the Board issued GASB Statement No.35, Basic Financial Statements--and Management's Discussion and Analysis--for PublicColleges and Universities. Management has not yet determined the impact that GASBStatements No. 34 and 35 will have on the state's financial statements.
Note 2. Budgeting and Budgetary Control
An annual budget is adopted on a basis consistent with generally accepted accountingprinciples for the general fund and certain special revenue funds. Preparation andsubmission of the budget is governed by both the State Constitution and the Rhode IslandGeneral Laws. The budget, as enacted by the General Assembly and signed by the governor,contains a complete plan of estimated general, federal, restricted revenues and operatingtransfers in and proposed expenditures.
The legal level of budgetary control, i.e. the lowest level at which management (executivebranch) may not reassign resources without special approval (legislative branch) is asfollows:

STATE OF RHODE ISLAND AND PROVIDENCE PLANTATIONS Notes to General-Purpose Financial Statements
- 39 -
(1) For general revenue appropriations, it is the line item within the appropriationact. Management cannot reallocate any appropriations without special approvalfrom the legislative branch.
(2) For federal grants, it is the total of all grants available to a department underthe same Catalog of Federal Domestic Assistance (CFDA) number. Federalgrant appropriations may also be limited by the availability of matching fundsand may also require special approval from a federal agency before reallocatingresources among programs.
(3) For restricted programs and operating transfers in, it is the account level. By itsvery nature, a restricted account is created by statute for a special purpose andmanagement cannot reassign the resources without special approval. Operatingtransfers in are accounted for separately because they are reported under“Other Financing Sources” in the Combined Statement of Revenues,Expenditures, and Changes in Fund Balances – All Governmental Fund Types,Expendable Trust Funds and Discretely Presented Governmental ComponentUnits.
Internal administrative and accounting budgetary controls utilized by the state consistprincipally of statutory restrictions on the expenditure of funds in excess of appropriationsand the supervisory powers and functions exercised by management. Management cannotreduce the budget without special approval.
Unexpended general revenue appropriations lapse at the end of the fiscal year, unless thedepartment/agency directors identify unspent appropriations related to specificprojects/purchases and request a reappropriation. If the requests are approved by thegovernor, such amounts are reappropriated for the ensuing fiscal year and made immediatelyavailable for the same purposes as the former appropriations. Unexpended appropriations ofthe General Assembly and its legislative commissions and agencies may be reappropriatedby the Joint Committee on Legislative Services. If the sum total of all departments andagencies general revenue expenditures exceeds the total general revenue appropriations, it isthe policy of management to lapse all unexpended appropriations, except those of thelegislative branch and the Justice Link program.
For the fiscal year ended June 30, 2001 expenditures exceeded appropriations in thefollowing departments and agencies (expressed in thousands):
General Fund
CFDA AccountDepartment - Division Grant or Program Number Number AmountAdministration General revenue appropriations: Central Management 142$ Accounts and Control 25 Auditing 21 Human Resources 23 Taxation 1,314 Central Services 643

STATE OF RHODE ISLAND AND PROVIDENCE PLANTATIONS Notes to General-Purpose Financial Statements
- 40 -
General Fund
CFDA AccountDepartment - Division Grant or Program Number Number AmountAdministration (continued) Office of Library and Information Services 30 Race and Police Community Relations Commission 6 Motor Vehicle Excise Tax Program 4,921 Federal grants: Rural Housing Preservation Grants 10.433 29 Economic Development - Support for Planning Organizations 11.302 33 Community Development Block Grants/State's Program 14.228 721 Emergency Shelter Grants Program 14.231 41 Byrne Formula Grant Program 16.579 1 Workforce Investment Act 17.255 65 National Motor Carrier Safety 20.218 115 Low-Income Home Energy Assistance 93.568 5,560 Restricted programs: DEPCO Escrow Account 2450-80200 1,261 Exxon Oil Overcharge Interest Earnings 2460-81410 151 COP - Center General-Furniture 2485-80200 1 COP - DLT Building - WC 2485-80500 1 COP - DLT Building - Job Development Fund 2485-80700 44 COP - Center General Furniture - JDF 2485-80800 14 COP - Pastore Center Telecomm - JDF 2485-80900 2 Operating transfers in: Debt Service Special Account 2480-90200 10,282 RICAP State House - Terrace Walls/South Stairs 2480-90800 571 COP - DLT Building - Other 2485-90200 23 Debt - URI Education and General 2486-91100 31 Debt - URI Dining Services 2486-91420 1 Debt - RIC Student Union 2486-95404 49 Business Regulation General revenue appropriations: Insurance Regulation 91 Labor and Training General revenue appropriations: Central Management 32 Workforce Regulation and Safety 383 Labor Relations Board 14 Federal grants: Labor Force Statistics 17.002 109 Trade Adjustment Assistance - Dislocated Workers 17.245 209 Restricted programs: Office of Director - Workers Compensation 1652-80100 257 Education Unit - Workers Compensation 1652-80400 100 Second Injury Indemnity Fund Operation 1652-80500 42 Tardy Fund 1690-80100 472 Interest Fund 1695-80100 99 Legislature Restricted programs: Audit of Federal Assistance Programs 2626-80100 257 Secretary of State Federal grants: National Historical Publications and Records Grants 89.003 2 Treasury Restricted Programs: Forfeited Property Fund 2310-80100 6

STATE OF RHODE ISLAND AND PROVIDENCE PLANTATIONS Notes to General-Purpose Financial Statements
- 41 -
General Fund
CFDA AccountDepartment - Division Grant or Program Number Number AmountBoard for Design Professionals General revenue appropriation 29 Children, Youth and Families General revenue appropriations: Friendship Street Renovations 303 Juvenile Corrections 46 Child Welfare 1,196 Federal grants: Byrne Formula Grant Program 16.579 2 Comprehensive Community Mental Health Services for Children with Serious Emotional Disturbances (SED) 93.104 250 Promoting Safe and Stable Families 93.556 199 Temporary Assistance for Needy Families 93.558 1,513 Child Care and Development Block Grant 93.575 46 Independent Living 93.674 93 Other Expenditures of Federal Awards 140 Restricted programs: Social Security Income 3340-80200 281 Operating transfers in: RICAP - Spurwink/RI 3350-90100 16 Elderly Affairs Federal grants: Senior Community Service Employment Program 17.235 78 Special Programs for the Aging - Title III, Part F - Disease Prevention and Health Promotion Services 93.043 15 Special Programs for the Aging - Title III, Part C - Nutrition Services 93.045 149 New Demonstration Grants to States with Respect to Alzheimer's Disease 93.051 10 Nation Family Caregiver Support Program 93.052 11 Medical Assistance Program 93.778 54 Senior Companion Program 94.016 69 Operating transfers in: Gas Tax 3260-91500 71 Health General revenue appropriations: Central Management 136 Family Health 140 Poison Control Center 15 Health Services Regulation 152 Health Laboratories 302 Federal grants: Compensation and Working Conditions 17.005 1 Air Pollution Control Program Support 66.001 7 TSCA Title IV State Lead Grants - Certification of Lead-Based Paint Professionals 66.707 34 Special Education - Grants for Infants and Families With Disabilities 84.181 90 State and Territorial and Technical Assistance Capacity Development Minority HIV/AIDS Demonstration Program 93.006 8 Grants for State Loan Repayment 93.165 19 Family Planning - Services 93.217 148 Innovative Food Safety Projects 93.245 7 Immunization Grants 93.268 257 Child Support Enforcement 93.563 6 Child Care and Development Block Grant 93.575 38 State Survey and Certification of Health Care Providers and Suppliers 93.777 321 Medical Assistance Program 93.778 320

STATE OF RHODE ISLAND AND PROVIDENCE PLANTATIONS Notes to General-Purpose Financial Statements
- 42 -
General Fund
CFDA AccountDepartment - Division Grant or Program Number Number AmountHealth (continued) Preventive Health Services - Sexually Transmitted Diseases Control Grants 93.977 28 Cooperative Agreements for State-Based Diabetes Control Programs and Evaluation of Surveillance Systems 93.988 39 Restricted programs: Indirect Cost Recovery - Central Management 1102-80601 353 RWJ - Making The Grade - Planning 1131-80200 3 All Kids Count 1134-80200 6 Drinking Water Revolving Fund 1173-80200 171 Human Services General revenue appropriations: Veterans Affairs 354 Medical Benefits - Managed Care 1,663 Medical Benefits - Special Education 2,638 Family Independence Program 319 Weatherization One-Time Payment 5 Federal grants: Food Stamps 10.551 882 Family Violence Prevention and Services - Grants for Battered Women's Shelters - Grants to States and Indian Tribes 93.671 158 State's Children Insurance Program 93.767 9,586 Restricted programs: Indirect Cost Recovery - Central Management 1210-80101 12 Vending Stand Proceeds 1237-80100 40 Health Indicators Development Project 1246-80100 37 Medicaid Provider Participation 1260-80200 35 Mental Health, Retardation and Hospitals General revenue appropriations: Central Management 96 Hospitals and Community System Support 256 Integrated Mental Health Services 148 Hospital and Community Rehabilitative Services 4,308 Federal grants: Projects for Assistance in Transition from Homelessness (PATH) 93.150 298 Office of the Child Advocate General revenue appropriation 40 Federal grants: Crime Victim Assistance 16.575 4 Medical Assistance Program 93.778 9 Governor's Commission on Disabilities General revenue appropriation 4 Restricted programs: Human Resource Investment Council 2041-80200 6 Elementary and Secondary Education General revenue appropriations: Program Operations 194 Federal grants: Summer Food Service Program for Children 10.559 6 Title I Program for Neglected and Delinquent Children 84.013 1 Special Education - Grants for Infants and Families with Disabilities 84.181 3 Even Start - State Educational Agencies 84.213 86 Class Size Reduction 84.340 428 Medical Assistance Program 93.778 303 Restricted programs: Indirect Cost Recovery - Program Support 1410-80121 16

STATE OF RHODE ISLAND AND PROVIDENCE PLANTATIONS Notes to General-Purpose Financial Statements
- 43 -
General Fund
CFDA AccountDepartment - Division Grant or Program Number Number AmountRhode Island State Council on the Arts General revenue appropriations: Operating Support 18 Rhode Island Higher Education Assistance Authority General revenue appropriations: Needs Based Grants and Work Opportunity 73 Historical Preservation and Heritage Commission Federal grants: Historic Preservation Fund Grants-In-Aid 15.904 4 National Maritime Heritage Grants 15.925 11 Restricted Programs: Survey and Planning - Restricted Fund 2062-80100 2 Historic Preservation Easement Fund 2062-80300 54 Attorney General General revenue appropriations: Criminal 15 Federal grants: Byrne Formula Grant Program 16.579 3 Restricted Programs: Consumer Protection/Education 2211-80800 37 Gambling Forfeitures 2230-80500 4 Corrections General revenue appropriations: Institutional Corrections 2,087 Federal grants: Special Education - Grants to States 84.027 22 Vocational Education - Basic Grants to States 84.048 24 Operating transfers in: RICAP - Perimeter & Security Upgrades 1370-90300 777 Rhode Island Justice Commission Federal grants: Juvenile Accountability Incentive Block Grants 16.523 193 Byrne Formula Grant Program 16.579 38 Violence Against Women Formula Grants 16.588 27 Judiciary General revenue appropriations: Supreme Court 673 Traffic Tribunal 9 Federal grants: Victims of Child Abuse 16.547 4 National Criminal History Improvement Program 16.554 6 Restricted programs: Advisory Committee on Women and Minorities 2710-80100 1 RI Supreme Court Disciplinary Counsel 2710-80400 1 General Operations 2750-80100 1 Retirement Benefits of Commissioners and Judges 2750-80200 25 Military Staff General revenue appropriations: National Guard 488 Emergency Management 46 Federal grants: Community Assistance Program - State Support Services Element (CAP-SSSE) 83.105 27

STATE OF RHODE ISLAND AND PROVIDENCE PLANTATIONS Notes to General-Purpose Financial Statements
- 44 -
General Fund
CFDA AccountDepartment - Division Grant or Program Number Number AmountMilitary Staff (continued) Operating transfers in: RICPF - Bristol Armory Rehabilitation 2089-90300 14 E-911 Emergency Telephone System General revenue appropriation 42 Restricted programs 2085-80100 353 Fire Safety Code Board of Appeal and Review General revenue appropriation 3 Fire Safety and Training Academy Federal grants: Interagency Hazardous Materials Public Sector Training and Planning Grants 20.703 24 Commission on Judicial Tenure and Discipline General revenue appropriation 9 State Police General revenue appropriation 2,099 Restricted programs: Forfeited Property Retained - State Police 2070-80100 21 Comprehensive Crime Control Act - Federal Regulation 2070-80900 6 Forfeiture of Motor Vehicles 2070-81000 7 Operating transfers in: Traffic Enforcement 2070-90500 176 Environmental Management General revenue appropriations: Natural Resources 519 Environmental Protection 6 Federal Grants: Boating Safety Financial Assistance 20.005 4 State Underground Water Source Protection 66.433 74 Wetlands Grants 66.461 35 Water Quality Cooperative Agreements 66.463 91 Innovative Community Partnership 66.651 18 Centers for Disease Control and Prevention - Investigations and Technical Assistance 93.283 24 Restricted programs: Indirect Cost Recovery - Public Resources Management 1730-80103 191 Fishing License Receipts 1732-80100 72 Hunting License Receipts 1732-80200 46 Shellfish and Marine License Receipts 1732-80400 73 Boating Safety 1735-80100 40 State Revolving Fund Administration 1751-80900 19 Indirect Cost Recovery - Water Resources 1751-81300 15 Environmental Response Fund 1754-80200 244 Water and Air Protection Program 1754-80600 490 Underground Storage Tank Fees 1759-80100 39 Operating transfers in: RICAP - Newport Pier Upgrades 1736-91300 393 State Water Resources Board Operating transfers in: RICAP - Big River Management Area 2835-90100 3 RICAP - Water Allocation Plan 2835-90300 1
Special Revenue Funds
Intermodal Surface Transportation Federal Grants: Local Rail Freight Assistance 20.308 13 Restricted programs: Vehicle Salvage 5312-80300 5

STATE OF RHODE ISLAND AND PROVIDENCE PLANTATIONS Notes to General-Purpose Financial Statements
- 45 -
Note 3. Cash, Cash Equivalents and Investments
Cash Deposits
Primary Government
At June 30, 2001, the carrying amount of the state's cash deposits was $54,213,846 andthe bank balance was $99,502,057. Of the bank balance, $633,804 was covered byfederal depository insurance. The remaining amount, $98,868,253 was uninsured anduncollateralized. The carrying amount and bank balance include $32,343,000 of certificatesof deposit.
Component Units
At June 30, 2001, the carrying amount of the component units' cash deposits was$211,562,598 and the bank balance was $242,726,294. Of the bank balance,$3,904,556 was covered by federal depository insurance and $50,406,096 wascollateralized with investments held by a bank in a component unit's name. The remainingamount, $188,415,642 was uninsured and uncollateralized. The carrying amount and thebank balance include $4,827,205 of certificates of deposit.
In accordance with Chapter 35-10.1 of the General Laws, depository institutions holdingdeposits of the state, its agencies or governmental subdivisions of the state, shall at aminimum, insure or pledge eligible collateral equal to one hundred percent of time depositswith maturities greater than 60 days. Any of these institutions which do not meet minimumcapital standards prescribed by federal regulators shall insure or pledge eligible collateralequal to one hundred percent of deposits, regardless of maturity. None of the cash depositsof the primary government was required to be collateralized at June 30, 2001.
Investments
The State Investment Commission (Commission) is responsible for the investment of allstate funds. Pursuant to Chapter 35-10 of the General Laws, the Commission may, ingeneral, "invest in securities as would be acquired by prudent persons of discretion andintelligence in these matters who are seeking a reasonable income and the preservation oftheir capital."
Short-term cash equivalent type investments are made by the General Treasurer inaccordance with guidelines established by the Commission. Investments of the pensiontrust funds are made by investment managers in accordance with the Commission's statedinvestment objectives and policies.
Investments of certain component units are not made at the direction of the Commission,but are governed by specific statutes or policies established by their governing body.

STATE OF RHODE ISLAND AND PROVIDENCE PLANTATIONS Notes to General-Purpose Financial Statements
- 46 -
The state's investments (expressed in thousands) are categorized in the following table togive an indication of the level of risk assumed by the entity at June 30, 2001.
Category 1: Insured or registered, or securities held by the state or its agent in thestate’s name.
Category 2: Uninsured and unregistered, with securities held by the counterparty’strust department or agent in the state's name.
Category 3: Uninsured and unregistered, with securities held by the counterparty,or by its trust department or agent but not in the state's name.
Component Units Category1 2 3 Fair Value
U.S. Government and Agency Securities $ 139,243 $ 202,466 $ 7,873 $ 349,582Money Market 3,692 20,150 23,842Commercial Paper 57,193 27,924 85,117Repurchase Agreements 43,105 1,276 74,480 118,861Corporate Notes 340 340Equity Securities 1,640 1,640
$ 239,881 $ 209,074 $ 130,427 579,382
Money Market Mutual Funds 38,686Investment Agreements 522,051Investments of R.I. Higher Education Assistance Authority CollegeBoundfund Trust Fund 469,017Investments of the R.I. Children's Crusade for Higher Education 10,352Other 25Total 1,619,513Less amount classified as cash equivalents 303,581Total Investments $ 1,315,932
Primary Government Category1 2 3 Fair Value
U.S. Government and Agency Securities $ 833,162 $ $ $ 833,162Commercial Paper 53,129 53,129Repurchase Agreements 15,602 15,602Corporate Bonds 792,673 200 792,873Equity Securities 926,492 1,496 927,988Foreign Securities 1,036,832 1,036,832Unit Investment Trust 1,755,007 1,755,007
$ 5,412,897 $ 1,696 $ 5,414,593
Money Market Mutual Funds 423,714Real Estate and Venture Capital Limited Partnership 318,857Investments held by broker-dealers under securities loans with cash collateral 424,459Securities lending short-term collateral investment pool 438,544Investments of Statutory Deposits Held In Trust 68,218Other 3,167Total 7,091,552Less amount classified as cash equivalents 450,747Total Investments $ 6,640,805

STATE OF RHODE ISLAND AND PROVIDENCE PLANTATIONS Notes to General-Purpose Financial Statements
- 47 -
Derivatives and Other Similar Investments
Primary Government
The Employees’ Retirement System (System) allows its investment managers to invest incertain derivative type transactions, including forward foreign currency transactions,futures contracts and mortgage-backed securities. Through the Unit Investment Trusts(UIT), the System also indirectly holds derivative type instruments. Information on theextent of the use, and holdings of derivative securities by the UITs is not readily available.
The System may enter into foreign currency exchange contracts to minimize the short-term impact of foreign currency fluctuations on foreign investments. These contractsinvolve risk in excess of the amount reflected in the System’s Statements of Plan NetAssets. The face or contract amount in U.S. dollars reflects the total exposure theSystem has in that particular currency contract. By policy, no more than 50% of activelymanaged Foreign Equity securities (at fair value) may be hedged into the base currency(US Dollars). The U.S. dollar value of forward foreign currency contracts is determinedusing forward currency exchange rates supplied by a quotation service. Losses may arisedue to changes in the value of the foreign currency or if the counterparty does notperform under the contract.
The System may use futures to manage its exposure to the stock, money market, andbond markets and the fluctuations in interest rates and currency values. Buying futurestend to increase the System’s exposure to the underlying instrument. Selling futures tendto decrease the System’s exposure to the underlying instrument, or hedge other Systeminvestments. Losses may arise from changes in the value of the underlying instruments, ifthere is an illiquid secondary market for the contracts, or if the counterparties do notperform under the contract terms.
The System invests in various mortgage-backed securities, such as collateralized mortgageobligations (CMO), interest-only and principal-only (PO) strips. They are reported inaggregate as U.S. Government and Agency Securities in the disclosure of custodial creditrisk. CMO’s are bonds that are collateralized by whole loan mortgages, mortgage pass-through securities or stripped mortgage-backed securities. Income is derived frompayments and prepayments of principal and interest generated from collateral mortgages.Cash flows are distributed to different investment classes or tranches in accordance withthe CMO’s established payment order. Some CMO tranches have more stable cash flowsrelative to changes in interest rates while others are significantly sensitive to interest ratefluctuations. The System may invest in interest-only (IO) and principal-only strips (PO) inpart to hedge against a rise in interest rates. Interest-only strips are based on cash flowsfrom interest payments on underlying mortgages. Therefore, they are sensitive to pre-payments by mortgagees, which may result from a decline in interest rates. Principal-onlystrips receive principal cash flows from the underlying mortgages. In periods of risinginterest rates, homeowners tend to make fewer mortgage prepayments.
The Unit Investment Trusts (UIT) may sell a security they do not own in anticipation of adecline in the fair value of that security. Short sales may increase the risk of loss to theUIT when the price of a security underlying the short sale increases and the UIT is subjectto a higher cost to purchase the security in order to cover the position.

STATE OF RHODE ISLAND AND PROVIDENCE PLANTATIONS Notes to General-Purpose Financial Statements
- 48 -
Securities Lending
Primary Government
Policies of the State Investment Commission permit use of investments to enter intosecurities lending transactions. The Employees’ Retirement System (System) hascontracted with State Street Bank & Trust Company as third party securities lending agentto lend the System’s debt and equity securities for cash, securities and sovereign debt offoreign countries as collateral at 102% of the market value of the domestic securities onloan and 105% of the market value of the international securities on loan. There are norestrictions on the amount of loans that can be made. There have been no violations ofthe provisions of the contract. Securities on loan at year-end for cash collateral arepresented as not categorized. Securities on loan for noncash collateral are classifiedaccording to the category for the collateral. The contract with the lending agent requiresthem to indemnify the System if the borrowers fail to return the securities. Either theSystem or the borrower can terminate all securities loans on demand. The cash collateralreceived on security loans was invested in the lending agent’s short-term investment poolfor an average duration of 73 days and a weighted average maturity of 172 days. Because the loans were terminable at will, their duration did not generally match theduration of the investments made with cash collateral. The System is not permitted topledge or sell collateral securities received unless the borrower defaults. There were nolosses during the fiscal year resulting from default of the borrower or lending agent. AtJune 30, 2001, management believes the System has no credit risk exposure toborrowers because the amounts the System owes the borrowers does not exceed theamounts the borrowers owe the System. The securities on loan at year-end were$476,390,965 (fair value), and the collateral received for those securities on loan was$491,764,265 (fair value).
Cash and Cash Equivalents
Primary Government
Cash and cash equivalents of $504,960,000 consists of the $54,213,000 cash carryingamount and $450,747,000 of investments determined to be cash equivalents.
Component Units
Cash and cash equivalents of $515,144,000 consists of the $211,563,000 cash carryingamount and $303,581,000 of investments determined to be cash equivalents.
Note 4. Receivables
Receivables at June 30, 2001 (expressed in thousands) consist of the following:

STATE OF RHODE ISLAND AND PROVIDENCE PLANTATIONS Notes to General-Purpose Financial Statements
- 49 -
Component Units
Loans receivable of the R.I. Housing and Mortgage Finance Corporation are secured by a firstlien on real and personal property and, in some instances, are federally insured. Loansreceivable of the R.I. Student Loan Authority are insured by the R.I. Higher EducationAssistance Authority, which in turn has a reinsurance agreement with the federalgovernment. The R.I. Clean Water Finance Agency provides loans to municipalities, sewercommissions, or wastewater management districts in the state for constructing or upgradingwater pollution abatement projects.
Other
The amount reported in the special revenue funds as due from other governments andagencies, $38,701,000, is net of $5,035,000, which is considered unavailable to meetcurrent year expenditures.
Note 5. Intra-Entity Receivables and Payables
Intra-entity receivables and payables (operations - due from/due to and working capital loans- loan to/loan from), as of June 30, 2001, are summarized below (expressed in thousands):
Allowancefor
UncollectableNotes and
Accrued and Unavailable Taxes Accounts Interest Loans Contributions Amounts Total
Primary Government:General fund $ 236,733 $ 10,089 $ $ $ $ (51,976) $ 194,846Special revenue funds 52,109 1,850 (2,780) 51,179Enterprise fund 6,319 (314) 6,005Internal service fund 4,851 1,113 5,964Trust and agency funds 38,077 8,225 24,090 (9,843) 60,549
Total Primary Government 326,919 31,334 1,113 24,090 (64,913) 318,543
Component Units:Governmental 28,309 4 16,959 (6,458) 38,814Proprietary 69,931 32,122 2,104,003 (37,121) 2,168,935
Total Receivables $ 326,919 $ 129,574 $ 32,126 $ 2,122,075 $ 24,090 $ (108,492) $ 2,526,292

STATE OF RHODE ISLAND AND PROVIDENCE PLANTATIONS Notes to General-Purpose Financial Statements
- 50 -
Due from Due to Due from Due toOther Other Component Component
Fund Type/Fund Funds Funds Units UnitsGeneral $ 73,275 $ 12,913 $ 5,112 $ 1,838Special Revenue:
R.I. Temporary Disability Insurance 695 2,113Intermodal Surface Transportation 19,837 45,964 1,647 2,162Providence River Relocation 1
Subtotal 20,532 48,078 1,647 2,162
Debt Service 29 23,213
Capital Projects:Bond Capital 19,435 40,207 1,200
Subtotal 19,435 40,207 1,200Enterprise:
State Lottery 1,461Subtotal 1,461
Internal Service: Central Utilities 1,410
Central Services 1,638 222Assessed Fringe Benefit 619 730Special Facilities 659 30Automotive Maintenance 483 27Central Warehouse 241 2Correctional Industries 1,143 384Energy Conservation 200Records Center Fund 18
Subtotal 6,393 1,413Trust and Agency:
Pension Trust 7,569Expendable Trust - ES 138 86
Subtotal 7,707 86Total $ 127,371 $ 127,371 $ 6,759 $ 5,200
Due from Due to Due to Due fromOther Other Primary Primary
Component Units: Funds Funds Government GovernmentGovernmental:
University of Rhode Island $ $ $ 901 $ 858Rhode Island College 403 867Community College of Rhode Island 497 422
Subtotal 1,801 2,147Proprietary:
R.I. Economic Development Corporation 666R.I. Depositors Economic Protection Corporation 1,000R.I. Higher Education Assistance Authority 33 9R.I. Public Telecommunications Authority 11Narragansett Bay Commission 32R.I. Convention Center Authority 2,235R.I. Public Transit Authority 1,647 2,378
Subtotal 4,958 3,053Total $ $ $ 6,759 $ 5,200

STATE OF RHODE ISLAND AND PROVIDENCE PLANTATIONS Notes to General-Purpose Financial Statements
- 51 -
Note 6. Fixed Assets
The fixed assets by fund type consist of the following (expressed in thousands):
The R.I. Economic Development Corporation capitalized interest income of approximately$207,000 net of interest expense of $2,752,000 (asset value was reduced). TheNarragansett Bay Commission capitalized approximately $99,900 of interest expense as acomponent of the cost of construction. The Rhode Island Resource Recovery Corporationcapitalized approximately $15,000 of interest expense. For the Proprietary ComponentUnits, actual nonoperating interest expense was $41,212,900 and actual nonoperatinginterest revenue was $17,867,000 which represents increases of $2,866,900 and$2,959,000 respectively, over the amounts reported in Combined Statement of Revenues,Expenses, and Changes in Fund Equity - All Proprietary Fund Types, Similar Trust Funds, andDiscretely Presented Proprietary Component Units.
Land Structures Machinery Netand and and Construction Accumulated Fixed
Improvements Improvements Equipment in Progress Depreciation AssetsEstimated useful lives 15-100 5-10Primary Government:
Enterprise fund $ $ 1,575 $ 850 $ $ (1,912) $ 513Internal service funds 4,212 3,845 (3,713) 4,344Trust and Agency Funds 9,255 (134) 9,121
Total Primary Government 5,787 13,950 (5,759) 13,978Component Units:
Governmental 526 1,811 363 17,293 (756) 19,237Proprietary 145,856 916,521 143,858 104,722 (341,532) 969,425
Total $ 146,382 $ 924,119 $ 158,171 $ 122,015 $ (348,047) $ 1,002,640
Loans to Loans fromOther OtherFunds Funds
General $ 5,845 $Capital Projects:
Bond Capital 1,459RI Clean Water Act Environmental Trust Fund 1,500Certificates of Participation 36
Subtotal 2,995
Internal Service:Assessed Fringe Benefits 1,000Central Services 200Central Warehouse 200Central Utilities 200Correctional Industries 850Special Facilities 400
Subtotal 2,850
Total $ 5,845 $ 5,845
Fund Type/Fund

STATE OF RHODE ISLAND AND PROVIDENCE PLANTATIONS Notes to General-Purpose Financial Statements
- 52 -
Note 7. Long-Term Obligations
Long-term obligations include bonds, notes and loans payable, obligations under capitalleases, compensated absences, and other long-term liabilities.
A. Bonds Payable
At June 30, 2001, future debt service requirements were as follows (expressed inthousands):
Primary Government
Current interest bonds of the state are serial bonds with interest payable semi-annually andmulti-modal variable rate demand bonds. Capital appreciation bonds are designated asCollege and University Savings Bonds. The College and University Savings Bonds mature invarying amounts to 2010 with all interest payable at maturity. Interest requirements for themulti-modal variable rate bonds are not reflected in the amortization table shown abovesince the amounts are indeterminable.
Included in the current interest bonds is $31,565,000 of general obligation multi-modalvariable rate demand bonds maturing in fiscal year 2020. These bonds were initially issuedin the weekly rate mode but can be changed by the issuer (the state) to a daily, commercialpaper or term rate mode. The interest rate is determined either weekly or daily based on themode; interest is paid monthly. The owners of the bonds in a weekly mode can require thestate (acting through its remarketing and tender agents) to repurchase the bonds. Theremarketing agent is authorized to use its best efforts to resell any purchased bonds byadjusting the interest rate offered. The state has entered into a standby bond purchaseagreement (liquidity facility) with the tender agent and a commercial bank (the bank). Theremarketing agent is required to offer for sale all bonds properly tendered for purchase. Inthe event the remarketing agent is unable to remarket tendered bonds, the standby bondpurchase agreement provides that the bank agrees to purchase any bonds from time to timein an amount not to exceed the principal amount plus accrued interest up to 37 days at aninterest rate not to exceed 12% per annum, subject to the terms and provisions of theliquidity facility. This agreement has been extended through July 2002. The state isrequired to pay the bank at an interest rate based on its prime lending rate or the federalfunds rate plus 1/2 of 1 percent, whichever is higher. The standby bond purchaseagreement remains in effect until the payment in full of the principal and interest on allbonds purchased by the bank.
Fiscal Governmental ProprietaryYear Primary Government Component Units Component Units
EndingJune 30 Principal Interest Principal Interest Principal Interest
2002 $ 76,832 $ 53,248 $ 1,572 $ 5,676 $ 154,662 $ 154,2852003 79,412 49,423 1,631 5,628 153,961 146,9162004 78,965 45,410 1,758 5,628 141,350 138,6602005 79,681 40,801 1,815 5,572 80,669 132,7092006 74,626 44,362 2,544 5,491 96,636 126,115Later Years 611,719 188,049 95,621 71,507 2,449,284 1,652,344
$ 1,001,235 $ 421,293 $ 104,941 $ 99,502 $ 3,076,562 $ 2,351,029

STATE OF RHODE ISLAND AND PROVIDENCE PLANTATIONS Notes to General-Purpose Financial Statements
- 53 -
Revenue bonds of the R.I. Refunding Bond Authority (RIRBA) are secured by lease rentalspayable by the state pursuant to lease agreements relating to projects financed by theauthority and leased to the state. Proceeds from the RIRBA bonds have been used (1) toloan funds to the state to effect the advance refunding of general obligation bonds issued bythe state in 1984; (2) to finance construction and renovation of certain buildings, and (3) tofinance acquisition of equipment used by various state agencies.
Governmental Component Units
Revenue bonds of the Governmental Component Units were issued under trust indenturesand are collateralized by a pledge of revenues from the facilities financed. The facilitiesinclude housing, student union (including bookstores) and dining operations. Under terms ofthe trust indentures, certain net revenues from these operations must be transferred to thetrustees for payment of interest, retirement of bonds, and maintenance of facilities. Thebonds are payable in annual or semi-annual installments to various maturity dates. Revenuebonds of the Governmental Component Units also include amounts borrowed under a loanand trust agreement between the R.I. Health and Educational Building Corporation (RIHEBC)(a proprietary component unit) and the Board of Governors for Higher Education acting forURI, RIC, and CCRI. The agreement provides for RIHEBC's issuance of the bonds with aloan of the proceeds to the university and colleges and the payment by the university andcolleges to RIHEBC of loan payments that are at least equal to debt service on the bonds. The bonds are secured by a pledge of revenues of the respective institutions.
Proprietary Component Units
Bonds of the R.I. Housing and Mortgage Finance Corporation (RIHMFC) are specialobligations of RIHMFC, payable from the revenue, prepayments and all the funds andaccounts pledged under the various bond resolutions to the holders of the bonds. Theproceeds of the bonds were generally used to acquire mortgage loans which are securedprincipally by a first lien upon real property and improvements.
The R.I. Student Loan Authority issued tax exempt Student Loan Revenue Bonds that aresecured by eligible student loans, the monies in restricted funds established by the trustindenture and all related income. The proceeds of the issuance and operating cash wereused to refund bonds and to originate and purchase eligible student loans.
The R.I. Economic Development Corporation (RIEDC) has bonds outstanding referred to asAirport Revenue Bonds. They were issued to finance the construction and related costs ofcertain capital improvements at T.F. Green State Airport. The proceeds of the bonds wereloaned to the R.I. Airport Corporation, a subsidiary and component unit of RIEDC. Theremainder of bonds outstanding comprise the financing to purchase land and make landimprovements at Island Woods Industrial Park in Smithfield, R.I. and to acquire land, makeimprovements and renovations of a building and parking lot (The Fleet National BankProject).
Revenue bonds of the R.I. Convention Center Authority (RICCA) were issued to (a) refundbonds and notes, (b) pay construction costs, (c) pay operating expenses, (d) pay interest onrevenue bonds prior to completion of construction, (e) fund a debt service reserve and (f)pay costs of issuance. The revenue bonds are secured by all rents receivable, if any, under a

STATE OF RHODE ISLAND AND PROVIDENCE PLANTATIONS Notes to General-Purpose Financial Statements
- 54 -
lease and agreement between the RICCA and the state covering all property purchased bythe RICCA. It also covers a mortgage on facilities and land financed by the proceeds of therevenue bonds and amounts held in various accounts into which bond proceeds weredeposited.
The proceeds of the revenue bonds of the R.I. Clean Water Finance Agency provide funds tomake low interest loans to municipalities in the state and quasi-state agencies to finance orrefinance the costs of construction or rehabilitation of water pollution abatement projects.
Bonds of the Narragansett Bay Commission (NBC) represent the NBC's portion of the state'sgeneral obligation bonds. Debt service on NBC’s portion is recovered through charges leviedfor services provided to users of its facilities. These bonds are guaranteed by the state.
Bonds of the R.I. Water Resources Board Corporate were issued to provide financing tovarious cities, towns, private corporations and companies engaged in the sale of potablewater and the water supply business.
A summary of general obligation bonds authorized by the voters and unissued (expressed inthousands) at June 30, 2001 is shown below.
In accordance with the General Laws, unissued bonds are subject to extinguishment sevenyears after the debt authorization was approved unless extended by the General Assembly.The amount of authorized bonds that may be issued by the R.I. Industrial-RecreationalBuilding Authority is limited by mortgage balances that it has insured, $26,274,527 at June30, 2001 (See Note 21). The insured mortgages are guaranteed by the state.
Authorized Authorized and and
Unissued Unissued July 1 Authorized Issued Extinguished June 30
General Obligation Bonds Supported by Taxes:Capital Development Plan - 1986 $ 160 $ $ $ $ 160Capital Development Plan - 1988 970 970Capital Development Plan - 1989 3,506 3,506Capital Development Plan - 1990 18,390 18,390Capital Development Plan - 1994 8,115 8,115Capital Development Plan - 1996 28,618 1,565 27,053Capital Development Plan - 1998 57,655 29,800 27,855Capital Development Plan - 2000 193,460 193,460R.I. Economic Development Fund 450 450Underground Storage Tank Replacement
Revolving Loan Fund 2 2Narragansett Bay Water Quality Management
District Commission Fund 12,935 12,935Clean Water Act Environmental Trust Fund 3,840 3,840Open Space and Recreational Area Fund 4,438 4,438Drinking Water Protection Fund 3,415 3,415Clean Water Finance Agency -
Water Pollution Revolving Loan Fund 13,960 13,960General Obligation Bonds Supported by Taxes 156,454 193,460 31,365 2 318,547
R. I. Industrial-Recreational Building Authority 80,000 80,000Total $ 236,454 $ 193,460 $ 31,365 $ 2 $ 398,547

STATE OF RHODE ISLAND AND PROVIDENCE PLANTATIONS Notes to General-Purpose Financial Statements
- 55 -
See Note 12 for information concerning contingent liabilities relating to "Moral Obligation"bonds.B. Notes Payable
Notes payable (expressed in thousands) at June 30, 2001 are as follows:
C. Loans Payable
Loans payable of the Proprietary Component Units represent liabilities of the NarragansettBay Commission (NBC) to the R.I. Clean Water Finance Agency (RICWFA) ($52,813,472)and to the R.I. Refunding Bond Authority ($30,000). The loans payable to the RICWFA arefor projects financed by that agency.
D. Obligations Under Capital Leases
Primary Government
The state's obligation to the R.I. Convention Center Authority (RICCA) consists of RICCA'soutstanding debt at June 30, 2001 based on a lease and agreement between RICCA and thestate in effect at that date. The state makes lease payments to pay the operating expensesof RICCA and the debt service on its obligations to the extent they are not supported byRICCA revenues.
The state has entered into capital lease agreements with financial institutions which haveissued certificates of participation (COP). These financing arrangements have been used bythe state to acquire, construct or renovate facilities and acquire other fixed assets.
The state’s obligation under capital leases at June 30, 2001 consists of the present value offuture minimum lease payments less any funds available in debt service reserve funds. Theportion of the state’s obligation under capital leases that is payable from general fundappropriations and capital leases not recorded in proprietary fund types is reflected in thegeneral long-term debt account group at June 30, 2001.
Obligation of the state to make payments under lease agreements is subject to anddependent upon annual appropriations being made by the General Assembly.
Component Units - GovernmentalRhode Island College note payable to the federal
government with interest at 5.5% payable in semi-annual installments of principal andinterest through 2024. $ 2,272
Component Units - ProprietaryR.I. Housing and Mortgage Finance Corporation bank
notes, 4.375% to 6.71% interest, payable through 2008. $ 14,086R.I. Economic Development Corporation (R.I. Airport Corpration)
note payable at 6.75% interest, payable through 2005 431R.I. Higher Education Assistance Authority notes
payable to the Student Loan Marketing Association, interest is 1.5% above the Treasury Bill rate, through 2001. 435
R.I. Convention Center Authority notes payable undermanagement agreements . 2,053
$ 17,005

STATE OF RHODE ISLAND AND PROVIDENCE PLANTATIONS Notes to General-Purpose Financial Statements
- 56 -
The following is a summary of material future minimum lease payments (expressed inthousands) required under capital leases that have initial or remaining noncancelable leaseterms in excess of one year as of June 30, 2001. Interest for variable rate COP is notreported since the amount is indeterminable.
Component Units
The University of Rhode Island (URI), Rhode Island College (RIC), Community College ofRhode Island (CCRI), and R.I. Public Telecommunications Authority (RIPTCA) obligationsunder capital leases consist, primarily, of construction of facilities and equipmentacquisitions financed by the R.I. Refunding Bond Authority, a blended component unit.
Capital lease obligations of the R.I. Airport Corporation (RIAC), a subsidiary and componentunit of the R.I. Economic Development Corporation (RIEDC), are for annual payments to thestate equal to the principal and interest for airport related general obligation bonds issued bythe state.
The following is a summary of the material future minimum lease payments (expressed inthousands) required under capital leases that have initial or remaining noncancelable leaseterms in excess of one year as of June 30, 2001.
Fiscal YearEnding June 30 RICCA COP Total
2002 $ 23,952 $ 14,933 $ 38,8852003 23,952 14,534 38,4862004 23,952 14,447 38,3992005 23,956 13,314 37,2702006 23,956 11,308 35,264Later Years 434,244 108,714 542,958
Total future minimum lease payments 554,012 177,250 731,262
Amount representing interest (238,207) (50,780) (288,987)Present value of future minimum lease payments $ 315,805 $ 126,470 $ 442,275
Fiscal Year GovernmentalEnding June 30 URI RIC CCRI RIEDC RIPTCA
2002 $ 1,676 $ 444 $ 157 $ 4,096 $ 8212003 1,605 439 156 4,100 8272004 1,448 443 156 3,914 8202005 1,428 449 156 3,671 8072006 1,295 445 156 3,334 806Later Years 17,744 1,457 2,814 19,426 4,102
Total future minimum lease payments 25,196 3,677 3,595 38,541 8,183
Amount representing interest (8,428) (790) (1,645) (10,342) (1,905)Present value of future minimum lease payments $ 16,768 $ 2,887 $ 1,950 $ 28,199 $ 6,278
Proprietary

STATE OF RHODE ISLAND AND PROVIDENCE PLANTATIONS Notes to General-Purpose Financial Statements
- 57 -
E. Compensated Absences
State employees are granted vacation and sick leave in varying amounts based upon yearsof service. At the termination of service, the employee is paid for accumulated unusedvacation leave. Also, the employee is entitled to payment of a percentage of accumulatedsick leave at retirement. Payment is calculated at their then-current rate of pay.
F. Other Long-Term Liabilities
Income on invested general obligation bond proceeds, determined to be arbitrage earnings inaccordance with federal regulations, has been included in the general long-term debt accountgroup. These amounts are generally payable to the federal government five years after thebond issuance date.
The long-term debt portion of violent crimes’ claims is included in the general long-term debtaccount group. Also included is an advance from the Federal Highway Authority Right ofWay Revolving Fund that will be used to acquire land and rights-of-way for the Quonsetaccess road project. Repayment has been budgeted for fiscal year 2002 with federal fundsallowable under federal regulations (23 CFR Subpart G 712.701 to 712.703). The amountincluded for negotiated settlements represents the amount due to correctional officers and ispayable over three years. Retainage payable is also included in other long-term debt sincethe related construction projects are not expected to be completed in the subsequent fiscalperiod. Finally, an amount due to the federal government is being reported as long-termdebt because the payment schedule coincides with the repayment of a long-term loan issuedto a private employer.
G. Changes in General Long-Term Debt
During the fiscal year ended June 30, 2001, the following changes (expressed in thousands)occurred in general long-term debt:
Primary Government
Balance BalanceJuly 1 Additions Reductions June 30
General obligation bonds payable:Current interest bonds $ 849,769 $ 149,935 $ (170,670) $ 829,034Capital appreciation bonds 31,289 (6,473) 24,816Accreted interest on capital appreciation bonds 36,346 5,118 (7,300) 34,164
Revenue bonds - RIRBA 161,210 (13,825) 147,385Bonds payable 1,078,614 155,053 (198,268) 1,035,399
Lease obligations to the RICCA 322,930 (7,125) 315,805Certificates of Participation (COP) 102,013 31,330 (6,873) 126,470Obligations under capital leases 424,943 31,330 (13,998) 442,275
Compensated absences 65,007 6,236 (5,669) 65,574Other long-term liabilities 19,701 34,143 (5,388) 48,456
$ 1,588,265 $ 226,762 $ (223,323) $ 1,591,704

STATE OF RHODE ISLAND AND PROVIDENCE PLANTATIONS Notes to General-Purpose Financial Statements
- 58 -
Governmental Component Units
H. Defeased Debt
In prior years, the state and its component units defeased certain general obligation bonds,revenue bonds and certificates of participation (COP) by placing the proceeds of the newbonds or COP, or other sources, in irrevocable trusts to provide for all future debt servicepayments on the old bonds or COP. Accordingly, the trust account assets and the liabilitiesfor the defeased bonds or COP are not included in the general-purpose financial statements.On June 30, 2001, the following bonds outstanding (expressed in thousands) areconsidered defeased:
In February 2001, the state issued $55,990,000 Consolidated Capital Development Loan of2001, Refunding Series A, with interest rates ranging from 3.35% to 5.50%, maturing from2003 through 2016. The proceeds were used to advance refund $15,865,000 of 1992Series A Consolidated Capital Development Loans, $14,725,000 of 1995 Series AConsolidated Capital Development Loans, and $25,210,000 of 1996 Series A ConsolidatedCapital Development Loans. The net proceeds from the sale of the refunding bonds wereused to purchase U. S. Government securities which were deposited in an irrevocable trustwith an escrow agent to provide for all future debt service of the refunded bonds. Theadvance refunding met the requirements of an in-substance debt defeasance and therefunded bonds were removed from the state’s General Long-Term Debt Account Group.The refunding decreased total debt service payments over the next 15 years by $2,410,743and resulted in an economic gain (difference between the present values of the debt servicepayments on the old and new debt) of $1,773,900.
The above amounts include $425,000 of refunding bonds issued on behalf of NarragansettBay Commission (NBC), a component unit, to advance refund $445,000 of outstanding
AmountPrimary government:
General Obligation Bonds(includes $4,746,000 of NBC) 159,540$
Component Units:R.I. Clean Water Finance Agency 14,935R.I. Depositors Economic Protection Corporation 647,410R.I. Economic Development Corporation 31,200R.I. Turnpike And Bridge Authority 40,600
Balance BalanceJuly 1 Additions Reductions June 30
Compensated absences $ 32,011 $ 4,031 $ (3,444) $ 32,598Obligations under capital leases 23,208 57 (1,641) 21,624Notes payable 2,320 (48) 2,272Loans payable 652 251 (42) 861Bonds payable 63,073 43,550 (1,682) 104,941Other liabilities 628 (628)
$ 121,892 $ 47,889 $ (7,485) $ 162,296

STATE OF RHODE ISLAND AND PROVIDENCE PLANTATIONS Notes to General-Purpose Financial Statements
- 59 -
bonds. This advance refunding decreased NBC’s total debt service payments over the next15 years by $18,076 and resulted in an economic gain of $12,625.
As part of the February 2001 refunding issue, the state issued $63,005,000 ConsolidatedCapital Development Loan of 2001, Refunding Series B, with interest rates ranging from4.06% to 5.375%, maturing from 2008 through 2019. The proceeds were used to convert$32,400,000 Variable Rate Multi-Modal General Obligation Bonds of 1998, and$31,290,000 Variable Rate Multi-Modal General Obligation Bonds of 1999 to fixed interestserial debt. The net proceeds from the sale of the refunding bonds were used to purchase U.S. Government securities which were deposited in an irrevocable trust with an escrow agentto provide for all future debt service of the refunded bonds. The advance refunding met therequirements of an in-substance debt defeasance and the refunded variable rate bonds wereremoved from the state’s General Long-Term Debt Account Group. The debt servicesavings and economic gain or loss were indeterminable.
During the year ended June 30, 2001, the Rhode Island Depositors Economic ProtectionCorporation (DEPCO) purchased U.S. Government securities, which were deposited into anirrevocable trust with an escrow agent to provide for all future debt service on $32,540,0001992 Series A special obligation bonds. These bonds are legally defeased and the liabilityhas been removed from the statement of assets, liabilities, and fund balance (deficit). Thedefeasance was funded through the liquidation of assets, net settlements, and excess statesales tax; it resulted in the recognition of an accounting loss of $71,051. DEPCO reduced itsaggregated principal and interest payments by approximately $38,884,000 over the next 5years.
I. Conduit Debt
The R.I. Industrial Facilities Corporation, the R.I. Health and Educational Building Corporationand the R.I. Economic Development Corporation issue revenue bonds, equipment acquisitionnotes, and construction loan notes to finance various capital expenditures for Rhode Islandbusiness entities. The bonds and notes issued by the corporations are not generalobligations of the corporations and are payable solely from the revenues derived from therelated projects. They neither constitute nor give rise to a pecuniary liability for thecorporations nor do they represent a charge against their general credit. Under the terms ofthe various indentures and related loan and lease agreements, the business entities makeloan and lease payments directly to the trustees of the related bond and note issues inamounts equal to interest and principal payments due on the respective issues. Thepayments are not shown as receipts and disbursements of the corporations, nor are therelated assets and obligations included in the financial statements. The amount of conduitdebt outstanding on June 30, 2001 was $144,000,000, $1,082,868,867 and$410,000,000, respectively.
Note 8. Reservations and Designations of Fund Equity
Reserved Retained Earnings

STATE OF RHODE ISLAND AND PROVIDENCE PLANTATIONS Notes to General-Purpose Financial Statements
- 60 -
The General Laws require that the net income of the Correctional Industries Internal ServiceFund be reserved for capital expansion. At June 30, 2001, the balance of the reserve was$1,456,275.The reservations of retained earnings of the R.I. Housing and Mortgage Finance Corporation(RIHMFC) are restricted by specific bond resolutions, designations by the Board ofCommissioners (Board), or by a trust agreement initiated by RIHMFC. These reserves aremade up of three major elements: (1) RIHMFC's Housing Endowment Fund (Fund), (2)commitments for housing initiatives, and (3) Affordability Housing Trust (Trust). The Fundwas established by the Board to provide a reserve against its outstanding indebtedness,future uncertainties related to the marketplace and as a reserve against non-market relateduncertainties. In addition to meeting the foregoing objectives, the Fund was established toprovide a means whereby RIHMFC can meet the short-term and long-term affordablehousing needs targeted to low and moderate income Rhode Island residents. At a minimum,the amount of the Fund will be maintained at the greater of $50,000,000 or 4% of theoutstanding long-term indebtedness of RIHMFC. The Fund amounted to $54,523,511 atJune 30, 2001. Commitments for housing initiatives represent amounts set aside by theBoard. In order to properly finance and administer various major housing initiatives, theBoard approved the utilization of RIHMFC's program fund balances for program expenses,housing loans, subsidies and trust funds. Most of the programs, once established, areaccounted for in the Operating Program. Commitments for Housing Initiatives designationand Other Designated Funds amounted to $179,159,165 at June 30, 2001. The Trust wasestablished to assist in activities that involve the creation and preservation of affordablehousing in the state. The Trust accounts for funds held by the Trust in a trustee capacitywhere both the corpus and earnings may be spent in fulfillment of a variety of designatedpurposes. The balance of the Trust was $18,827,582 at June 30, 2001.
Reserved retained earnings of the R.I. Turnpike and Bridge Authority (RITBA) consists of$4,804,826 for debt service.
The General Laws authorize the Narragansett Bay Commission (NBC) to maintain a restrictedasset account for environmental enforcement funds. These funds consist of sums recoveredby administrative or civil enforcement action and may be used for emergency response orenforcement activities. At June 30, 2001, NBC reported $101,241 of funds reserved forthis purpose.
The reserved retained earnings of the R.I. Higher Education Assistance Authority (RIHEAA) isthe trust fund balance of the R.I. Higher Education Savings Trust (RIHEST), also known asCollegeBoundfund. RIHEST was created by law to provide a qualified state tuition savingsprogram under Section 529 of the Internal Revenue Code. RIHEST is managed by anindependent contractor under the supervision of the R.I. State Investment Commission andRIHEAA. The balance held in trust at June 30, 2001 was $476,629,974.

STATE OF RHODE ISLAND AND PROVIDENCE PLANTATIONS Notes to General-Purpose Financial Statements
- 61 -
Reserved Fund Balance
The state and its component units' reserved fund balances represent those portions of fundbalance that are (1) not appropriable for expenditure or (2) legally segregated for a specificfuture use. Reserved fund balances (expressed in thousands) are as follows:
Changes in General Fund Reserves
The state maintains certain reserves within the General Fund in accordance with the GeneralLaws. These reserves accumulate in the General Fund until withdrawn by statute or usedfor the intended purposes pursuant to the enabling legislation.
The state maintains a budget reserve in the general fund. Annually, 2% of general revenuesand opening surplus are set aside in this reserve account. Amounts in excess of 3% of thetotal general revenues and opening surplus are transferred to the bond capital fund to beused for capital projects, debt reduction or debt service. The reserve account, or anyportion thereof, may be appropriated in the event of an emergency involving the health,safety or welfare of the citizens of the state or in the event of an unanticipated deficit in anygiven fiscal year. Such appropriations must be approved by a majority of each chamber ofthe General Assembly.
Appropriations carried forward can only be used for the same purpose as intended in theoriginal budget as enacted by the General Assembly.
The following table summarizes the activity (expressed in thousands) of these reserveaccounts for the fiscal year ended June 30, 2001:
FiduciaryGovernmental Fund Types Fund Types Total Governmental
Special Trust and Primary ComponentGeneral Revenue Agency Government Units
Budget reserve $ 79,689 $ $ $ $ $ 79,689 $ Appropriations carried forward
General revenue 11,056 11,056Departmental restricted revenue 34,521 34,521Operating transfers in 11,697 11,697
Encumbrances 212,889 37,894 250,783 27,214Long-term receivables 1,147 1,147Employment insurance programs 96,589 332,107 428,696Debt 734 19,188 19,922 1,180Self-insurance 100 100Pension benefits 6,165,522 6,165,522Academic college overhead 2,467Inventory 2,299Asset protection and capital projects 5,210Auxiliary enterprises 9,848Restricted grants, gifts, and aid 1,513Loan fund 21,989Trust indenture 1,295Landscaping fund 20
$ 136,963 $ 310,625 $ 734 $ 57,182 $ 6,497,629 $ 7,003,133 $ 73,035
DebtService
CapitalProjects

STATE OF RHODE ISLAND AND PROVIDENCE PLANTATIONS Notes to General-Purpose Financial Statements
- 62 -
Designations of Fund Balance
Designated fund balances represent that portion of fund balance segregated to indicatemanagement's tentative plans for future financial resource use.
Designated fund balances in the Special Revenue Funds represent unexpended gasoline taxrevenue and unexpended bond proceeds ($31,436,317) and restricted revenue($1,518,734) brought forward to fiscal year 2002.
Designated fund balance in the Capital Projects Funds ($94,480,713) represents fundscommitted to capital projects.
Note 9. Operating Transfers
Operating transfers for the fiscal year ended June 30, 2001 are presented below (expressedin thousands):
ReservedFund Balance Reserved
July 1, Fund Balanceas restated Additions Reductions June 30
State Budget Reserve Account $ 71,269 $ 53,126 $ (44,706) $ 79,689Appropriations carried forward
General revenue 21,739 11,056 (21,739) 11,056Departmental restricted revenue 30,366 34,521 (30,366) 34,521Operating transfers in 6,448 11,697 (6,448) 11,697Total $ 129,822 $ 110,400 $ (103,259) $ 136,963
Operating Transfers From To
Component Component Fund Type/Fund In Out Units UnitsPrimary Government: General $ 291,988 $ 50,461 $ 36,969 $ 242,823 Special Revenue:
R.I. Temporary Disability 1,025R.I. Underground Storage Tank Fund 872Intermodal Surface Transportation 43,394 61,129 1,896 61,924Providence River Relocation 346R.I. Economic Policy Council 5,438Subtotal 49,178 62,154 1,896 62,796
Capital Projects:Bond Capital 44,706 80,656 36,191R.I. Clean Water Act/ Environmental Trust Fund 2,348
Subtotal 44,706 80,656 38,539
Debt Service 2,775 115 Enterprise - State Lottery 180,842 Internal Service - Central Warehouse 317
Total $ 386,189 $ 376,888 $ 38,980 $ 344,158

STATE OF RHODE ISLAND AND PROVIDENCE PLANTATIONS Notes to General-Purpose Financial Statements
- 63 -
The difference of $9,655,000 between operating transfers in/out occurs because theEmployees’ Retirement System recorded the transactions as expenses as required by GASBStatement No. 25, “Financial Reporting for Defined Benefit Pension Plans and NoteDisclosures for Defined Contribution Plans. The difference of $354,000 in the IntermodalSurface Transportation Fund (ISTEA) occurred because the respective prior year's due to/due
To FromPrimary Primary
Government GovernmentComponent Units: Governmental:
University of Rhode Island $ 3,162 $ 82,134Rhode Island College 1,031 42,642Community College of Rhode Island 180 38,968Central Falls School District 35,191Subtotal 4,373 198,935
Proprietary:R.I. Economic Development Corporation 1,896 13,480R.I. Convention Center Authority 19,420R.I. Depositors Economic Protection Corporation 30,203 1,262R.I. Higher Education Assistance Authority 7,538R.I. Public Transit Authority 647 36,964R.I. Public Telecommunications Authority 1,244R.I. Children's Crusade for Higher Education 1,685R.I. Resource Recovery 3,115Narragansett Bay Commission 633
Subtotal 36,494 81,593
Total Component Units $ 40,867 $ 280,528
Operating Transfers
Reconciliation Operating Transfers From To To From
Component Primary Component Primary In Out Units Government Units Government
Amounts recorded $ 386,189 $ 376,888 $ 38,980 $ 40,867 $ 344,158 $ 280,528General 1,050Special Revenue
Intermodal Surface Transportation 354Pension Trust
Employees Retirement Fund 8,410State Police Retirement Fund 13Judicial Retirement Fund 8Municipal Employees Retirement Fund 1,224
Component UnitsGovernmental
University of Rhode Island 16,555Rhode Island College 5,062Community College of Rhode Island 8,112
ProprietaryR.I. Depositors Economic Protection Corporation 1,887R.I. Economic Development Corporation 5,203Narragansett Bay Commission 5R.I. Clean Water Finance Agency 2,354R.I. Public Transit Authority 27,389
$ 386,543 $ 386,543 $ 40,867 $ 40,867 $ 345,208 $ 345,208

STATE OF RHODE ISLAND AND PROVIDENCE PLANTATIONS Notes to General-Purpose Financial Statements
- 64 -
from recorded in the Bond Capital Fund and ISTEA represented amounts due to/due from theRhode Island Economic Development Corporation (RIEDC) at the beginning of the fiscal yearfor a project that RIEDC withdrew from effective July 1, 2000. The difference of$1,887,000 occurred because the Rhode Island Depositors Economic Protection Corporationrecorded the fair value of land that was transferred to the state as an operating transfer tothe primary government. The difference of $1,050,000 occurred because the RIEDCrecorded the proceeds of a land transfer as an operating transfer from the primarygovernment. The remaining differences occur because some component units reported fundsreceived from the primary government as contributed capital, grants or increases in fixedassets rather than as operating transfers.
Note 10. Operating Lease Commitments
The primary government is committed under numerous operating leases covering realproperty. Operating lease expenditures totaled approximately $12,747,000 for the fiscalyear ended June 30, 2001
Most of the operating leases contain an option allowing the state, at the end of the initiallease term, to renew its lease at the then fair rental value. In most cases, it is expected thatthese leases will be renewed or replaced by other leases.
The following is a summary of material future minimum rental payments (expressed inthousands) required under operating leases that have initial or remaining lease terms inexcess of one year as of June 30, 2001:
The minimum payments shown above have not been reduced by any sublease receipts.
Note 11. Commitments
Commitments (expressed in thousands) arising from encumbrances outstanding at June 30,2001 are summarized as follows:
Fiscal YearEnding June 30
2002 $ 11,6852003 11,1822004 10,5362005 10,0082006 7,471Later Years 30,757Total $ 81,639
General fund ($5,600 to be funded by federal $ 22,500funds, $4,000 to be funded substantiallyby future appropriations and $12,900from other sources)
Special revenue funds 212,889Capital projects funds 37,894
$ 273,283

STATE OF RHODE ISLAND AND PROVIDENCE PLANTATIONS Notes to General-Purpose Financial Statements
- 65 -
Encumbrance accounting, under which contracts, purchase orders and other commitmentsfor the expenditure of funds are recorded to reserve that portion of the applicableappropriation during the fiscal year, is employed in the governmental fund types. GeneralFund encumbrances outstanding at fiscal year end are not reported as a reservation of fundbalance. These commitments are funded by future appropriations in the subsequent fiscalyear. For financial statement purposes, encumbrances outstanding at June 30 of theSpecial Revenue Funds and the Capital Projects Funds are shown as a reservation of fundbalance.
In fiscal year 1999, the state initiated the development of an integrated financialmanagement information system. The system is expected to be implemented in fiscal year2002. The state has expended approximately $4,200,000 thus far and expects to spend$2,000,000 in fiscal year 2002.
The R.I. Economic Development Corporation (RIEDC) entered into several agreements withProvidence Place Group Limited Partnership (PPG). The agreements state the terms bywhich the state shall perform with regard to a shopping mall, parking garage and relatedoffsite improvements developed by PPG. The authority to enter into these agreements wasprovided in legislation passed by the General Assembly and signed by the Governor. Thislegislation further provided for payments to the developer, during the first 20 years only, ofan amount equal to the lesser of (a) two-thirds of the amount of sales tax generated fromretail transactions occurring at or within the mall or (b) $3,600,000 in the first five yearsand $3,560,000 in years 6 through 20.
The Employees’ Retirement System of Rhode Island has contracted with a systemsintegration firm to design and build a new pension administration system. The total cost tothe System is estimated at $16.8 million, of which $9.1 million has been expended throughJune 30, 2001. The remaining cost is estimated at $7.7 million. Full implementation isexpected by the second quarter of fiscal 2004. This will be financed in the same manner asother administrative expenses of the System.
Component Units
The R.I. Airport Corporation (RIAC), a subsidiary and component unit of RIEDC, wasobligated for completion of certain airport improvements under commitments ofapproximately $9,411,000 which is expected to be funded from current available resourcesand future operations.
The Narragansett Bay Commission has entered into various engineering and constructioncontracts for the design and improvement of its facilities as part of a capital improvementprogram. Commitments under these contracts aggregated approximately $11,696,000 atJune 30, 2001.
The R.I. Resource Recovery Corporation’s (RIRRC) currently licensed landfill consists of areasknown as Phases II, III, and IV. The capacity of Phase I was reached in May 1993. PhasesII and III encompass 34 acres adjoining Phase I. Phase II consists of two areas, referred toas Area I and Area II. Waste disposal commenced on Area II in April 1993 and on Area I inMarch 1995. Phase III commenced in June 1997. Approximately $10,621,000 in costsrelating to Phase II and $5,303,000 relating to Phase III have been incurred as of June 30,

STATE OF RHODE ISLAND AND PROVIDENCE PLANTATIONS Notes to General-Purpose Financial Statements
- 66 -
2001, and are included in land and improvements in the financial statements. Phase IVconsists of four eleven acre cells of which two cells began accepting refuse in September2000. To date, $19,598,485 has been expended on legal fees, permitting and engineeringcosts related to Phase IV, and other costs associated with readying the area for use,including relocation of a brook.
The Environmental Protection Agency (EPA) established closure and postclosure carerequirements for municipal solid waste landfills as a condition for the right to operate alandfill in the current period. Based on RIRRC's engineers and independent engineeringstudies, it is estimated that these costs of closure and postclosure activities for Phase I, IIand III will be approximately $39,854,000. The liability at June 30, 2001 is approximately$27,802,000, with $12,052,000 remaining to be recognized. RIRRC recognizes anexpense and a liability for these costs based on landfill capacity used to date. Based on theestimates of RIRRC's engineers, approximately 98% of landfill capacity for Phase II and III,which has approximately two years of estimated life remaining, has been used to date andapproximately 22% of capacity of Phase IV has been used to date which has approximatelyfour years of estimated life remaining. Amounts provided for closure and postclosure arebased on current costs. These costs may be adjusted each year due to changes in theclosure and postclosure care plan, inflation or deflation, technology, or applicable laws andregulations. RIRRC has designated investments in the amount of $10,623,534 to meet thefinancial requirements of closure and postclosure costs, and plans to increase thesedesignated investments each year to enable it to pay the costs as they are incurred.
In prior years, the EPA issued administrative orders requiring the RIRRC to conductenvironmental studies of the landfill and undertake various plans of action. Additionally, in1986, the landfill was named to the EPA’s Superfund National Priorities List. The majorityof the studies were completed and were submitted to the EPA for review. During 1996, theRIRRC entered into a consent decree with the EPA concerning remedial actions taken by theRIRRC for groundwater contamination. The consent decree, which was approved by theU.S. District Court on October 2, 1996, requires the establishment of a trust fund in theamount of $27,000,000 for remedial purposes. The trust is included in restricted assetsheld in trust on RIRRC’s balance sheet. As of June 30, 2001, the market value of the trustwas $25,277,932. The remaining deposit required to be made to the trust fund for fiscalyear 2002 is $166,624. In February 2001, the RIRRC transferred an additional $498,777into the trust fund. The present value of the estimated remaining total expenditures relatingto groundwater contamination that will be required as a result of the consent decree isestimated to be approximately $15,146,000 and is recorded in the financial statements, netof the amount included in the trust fund.
RIRRC is required by the R.I. Department of Environmental Management to restore certainwetlands which are located at the Central Landfill. Total costs for this project are estimatedto be approximately $6,100,000.
RIRRC is committed, under various contracts and agreements, for a materials recoveryfacility and a methane gas collection-flare system.
In addition, RIRRC is required to grant funds to municipalities to assist them in organizingsource separation and recycling programs in their communities.

STATE OF RHODE ISLAND AND PROVIDENCE PLANTATIONS Notes to General-Purpose Financial Statements
- 67 -
RIRRC has entered into an agreement with the City of Cranston to furnish sewer and waterservices to RIRRC’s Johnston facilities in exchange for payments by RIRRC.
The R.I. Convention Center Authority (RICCA) has entered into management contracts withvendors under which these vendors will provide various services relating to the operation ofthe convention center, parking garages, and hotel. In addition, RICCA has entered into alicensing agreement with a major hotel chain that permits the hotel to use its name,trademark, reservation system and other services.
The R.I. Housing and Mortgage Finance Corporation had loan commitments of $8,514,000under various loan programs at June 30, 2001.
The R.I. Turnpike and Bridge Authority has entered into various contracts for maintenance ofits bridges. At June 30, 2001 remaining commitments on these contracts approximated$1,769,000.
The R.I. Public Transit Authority is committed under construction contracts in the amount of$10,734,254 at June 30, 2001.
The R.I. Higher Education Assistance Authority is required to return to the federalgovernment $4,310,909 in student loan reserve funds over a period of five years, such thatthe total is returned by September 1, 2002.
The University of Rhode Island, Rhode Island College and Community College of RhodeIsland have begun a technology modernization of core administration systems. This is beingaccomplished system wide through the Office of Higher Education and will be financed overa seven-year period beginning in fiscal year 2000 at a cost of $3,700,000, $2,200,000,and $2,500,000, respectively.
Note 12. Contingencies
Primary Government
The state is involved in various civil lawsuits which could result in monetary loss to thestate. The lawsuits are in various developmental stages, some to the point that a favorabledecision, with no or minimal loss is anticipated, others, where the outcome and amount ofloss, if any, cannot be determined and others which are still in the discovery stage.
Federal Grants
The state receives significant amounts of federal financial assistance under grant agreementswhich specify the purpose of the grant and conditions under which the funds may be used. Generally, these grants are subject to audit. Any disallowances as a result of these auditsbecome a liability of the state. Although such audits could generate expendituredisallowances under terms of the grants, it is believed that any required reimbursements willnot be material.

STATE OF RHODE ISLAND AND PROVIDENCE PLANTATIONS Notes to General-Purpose Financial Statements
- 68 -
Moral Obligation Bonds
Some component units issue bonds with bond indentures requiring capital reserve funds. Moneys in the capital reserve fund are to be utilized by the trustee in the event scheduledpayments of principal and interest by the component unit are insufficient to pay the bondholder(s). These bonds are considered “moral obligations” of the state when the GeneralLaws require the executive director to submit to the Governor the amount needed to restoreeach capital reserve fund to its minimum funding requirement and the Governor is requiredto include the amount in the annual budget. At June 30, 2001 the R.I. Housing andMortgage Finance Corporation and the R.I. Economic Development Corporation (RIEDC) had$180,798,795 and $59,756,495 respectively, in “moral obligation” bonds outstanding. Certain of the RIEDC bonds are economic development revenue bonds whereby the statewill assume the debt if the employer reaches and maintains a specified level of full-timeequivalent employees. The participating employers have certified that the employment levelhas been exceeded, thereby triggering credits toward the debt. As a result, the stateanticipates paying approximately $2,489,000 of the debt on the related economicdevelopment revenue bonds in fiscal year 2002.
Component Units
R.I. Student Loan Authority
The R.I. Student Loan Authority (RISLA) maintains letters of credit in the original statedamount of $31,940,000 on its January 1995 weekly adjustable interest rate bonds and theoriginally stated amount of $69,203,000 on its April 1996 Series I, II and III variable ratebonds. The letters of credit obligate the letter of credit provider to pay to the trustee anamount equal to principal and interest on the bonds when the same becomes due andpayable (whether by reason of redemption, acceleration, maturity or otherwise) and to paythe purchase price of the bonds tendered or deemed tendered for purchase but notremarketed. The RISLA also maintains a standby letter of credit in the original statedamount of $30,000,000 on its March 2000 issue. The letters of credit will expire on theearliest to occur: a) July 28, 2004, for the January 1995 and April 1996 issue, and March15, 2003 for the March 2000 issue; b) the date the letter of credit is surrendered to theletter of credit provider; c) when an alternative facility is substituted for the letter of credit;d) when the bonds commence bearing interest at a fixed rate; e) when an event of defaulthas occurred or f) when no amount becomes available to the trustee under the letter ofcredit.
The RISLA also has an available $20,000,000 line of credit. Interest is based upon onemonth London Inter-Bank Offer Rate (LIBOR) plus thirty basis points adjusted weekly. Theline of credit is secured by eligible loans of RISLA. Minimum drawdowns on the line ofcredit are $100,000 and all proceeds are to be used to purchase or originate eligible studentloans. As of June 30, 2001, there was no outstanding balance.

STATE OF RHODE ISLAND AND PROVIDENCE PLANTATIONS Notes to General-Purpose Financial Statements
- 69 -
R.I. Public Transit Authority
The R.I. Public Transit Authority has a $2,000,000 line of credit with a financial institution. The line of credit is due on demand with interest payable at a floating rate at the financialinstitution’s base rate or fixed rate options at the financial institution’s cost of funds plus2.00%. No amount was due under this line of credit at June 30, 2001.
Note 13. Employer Pension Plans
Plan Descriptions
The state, through the Employees’ Retirement System (System), administers four definedbenefit pension plans. Three of these plans; the Employees’ Retirement System (ERS), acost-sharing multiple-employer defined benefit pension plan and the Judicial RetirementBenefits Trust (JRBT) and the State Police Retirement Benefits Trust (SPRBT), single-employer defined benefit pension plans; cover most state employees. The state does notcontribute to the Municipal Employees’ Retirement System, an agent multiple-employerdefined benefit pension plan. The System provides retirement and disability benefits,annual cost-of-living adjustments, and death benefits to plan members and beneficiaries. The level of benefits provided to state employees, which is subject to amendment by thegeneral assembly, is established by the General Laws as listed below. In addition to thestate, there are 40 local public school entities that are members of the ERS. The Systemissues a publicly available financial report that includes financial statements and requiredsupplementary information for the plans. The report may be obtained by writing to theEmployees’ Retirement System, 40 Fountain Street, Providence, RI 02903.
Summary of Significant Accounting Policies
Basis of Accounting
The financial statements of the System are prepared on the accrual basis of accounting. Under this method, revenues are recorded when earned and expenses are recorded whenincurred. Plan member contributions are recognized in the period in which thecontributions are due. Employer contributions to each plan are recognized when due andthe employer has made a formal commitment to provide the contributions. Benefits andrefunds are recognized when due and payable in accordance with the terms of each plan. Dividend income is recorded on the ex-dividend date. The gains or losses on foreigncurrency exchange contracts are included in income in the period in which the exchangerates change. Gains and losses on contracts which hedge specific foreign currencydenominated commitments are deferred and recognized in the period in which thetransaction is completed. Investment transactions are recorded on a trade date basis.
Method Used to Value Investments
Investments are recorded in the financial statements at fair value. Fair value is theamount that a plan can reasonably expect to receive for an investment in a current salebetween a willing buyer and a willing seller - that is, other than a forced liquidation sale. The fair value of fixed income and domestic and international stocks are generally based

STATE OF RHODE ISLAND AND PROVIDENCE PLANTATIONS Notes to General-Purpose Financial Statements
- 70 -
on published market prices and quotations from national security exchanges and securitiespricing services. Real estate is primarily valued on appraisals by independent appraisers oras adjusted by the general partner. Other securities and investments, which are nottraded on a national security exchange, are valued by the respective fund manager. Short-term investments are stated at cost, which approximates fair value. Unit InvestmentTrusts (UIT) consist primarily of domestic and international institutional funds. The fairvalue of the UITs are based on the reported share value of the respective fund. Futurescontracts are valued at the settlement price established each day by the board of trade orexchange on which they are traded.
Funding Policy and Annual Pension Cost
The state’s annual pension cost (expressed in thousands) for the current year and relatedinformation for each plan is listed below. The most recent actuarial information may befound in the separately issued audit report referred to above.
Other
Certain employees of the University of Rhode Island, Rhode Island College, and theCommunity College of Rhode Island (principally faculty and administrative personnel) are
Three-Year Trend Information
AnnualPension Percentage Net
Year Cost (APC) of APC PensionEnding (In Thousands) Contributed Obligation
Employees' Retirement System 6/30/99 $ 78,729 100% $ 06/30/00 85,073 100% 06/30/01 79,906 100% 0
State Police Retirement Benefits Trust 6/30/99 631 100% 06/30/00 1,509 100% 06/30/01 1,820 100% 0
Judicial Retirement Benefits Trust 6/30/99 737 100% 06/30/00 1,008 100% 06/30/01 1,164 100% 0
Employees' State Police JudicialRetirement Retirement Retirement
System Benefits Trust Benefits TrustContribution rates:
State 7.99% 25.89% 31.09%Plan members - state employees 8.75% 8.75% 8.75%State contribution for teachers 4.34% and 5.16%
Annual pension cost $79,906 $1,820 $1,164Contributions made - state employees $44,541 $1,820 $1,164Contributions made - teachers $35,365Actuarial valuation date June 30, 1998 June 30, 1998 June 30, 1998Actuarial cost method Frozen Entry Age Frozen Entry Age Frozen Entry AgeAmortization method Level Percent of Level Percent of Level Percent of
Payroll - Closed Payroll - Closed Payroll - ClosedEquivalent Single Remaining Amortization Period 17 years 24 years 29 yearsAsset valuation method 4 Year Moving Average 4 Year Moving Average 4 Year Moving AverageActuarial Assumptions:
Investment rate of return 8.25% 8.25% 8.25%Projected salary increases 4.75% to 8.75% 5% to 15.00% 5.50%Inflation 3.50% 3.50% 3.50%Cost-of-living adjustments 3% compounded $1,500 per annum 3% of original
annually retirement,Level of benefits established by: compounding varies
General Law(s) 36-8 to 10 42-28-22.1 8-3-16, 8-8-10.1,8-8.2-7 and28-30-18.1

STATE OF RHODE ISLAND AND PROVIDENCE PLANTATIONS Notes to General-Purpose Financial Statements
- 71 -
covered by individual annuity contracts with the Teachers' Insurance and AnnuityAssociation. Total expenditures by the institutions for such annuity contracts amounted to$10,698,793 during the year ended June 30, 2001.
The R.I. Public Transit Authority has two pension plans that cover employees meetingcertain eligibility requirements. Employer contribution paid in fiscal year 2001 was$2,354,640. At July 1, 2000, the most recent valuation date, the total pension benefitobligation was $36,060,281 and net assets available for benefits were $19,525,620.
Certain other component units have defined contribution pension and savings plans. Forinformation regarding these pension and savings plans, please refer to the component units'separately issued financial reports.
Note 14. Postemployment Benefits
In accordance with the General Laws, postretirement health care benefits are provided tostate employees who retire on or after July 1, 1989. The benefits in general cover medicaland hospitalization costs for pre-Medicare retirees and a Medicare supplement for Medicare-eligible retirees. The state's share varies with years of service and ranges from 50% forretirees with 10-15 years of service to 100% for retirees with 35 years of service. Duringfiscal year 2001, the state contributed 0.98% of covered payroll for postretirementhealthcare benefits. The contribution rates are not actuarially determined. Postretirementhealth care expenses for the fiscal year ended June 30, 2001 were $5,189,298, net ofretirees’ contributions for the 3,517 retirees receiving benefits.
In addition to the pension benefits described above, expenditures of $1,078,250 wererecognized for postretirement benefits provided under early retirement incentive programs(an average of $1,067 for each of the 1,011 retirees covered by the plans).
The above plans are financed on a pay-as-you-go basis.
Note 15. Deferred Compensation
The state offers its employees a deferred compensation plan created in accordance withInternal Revenue Code (IRC) Section 457. The Department of Administration pursuant toChapter 36-13 of the General Laws administers the plan. The Department of Administrationcontracts with private corporations to provide investment products related to themanagement of the deferred compensation plan. Benefit payments are not available toemployees earlier than the calendar year in which the participant attains age 70½,termination, retirement, death or “unforeseeable emergency”.
Current Internal Revenue Service regulations require that amounts deferred under a Section457 plan be held in trust for the exclusive benefit of participating employees and not beaccessible by the government or its creditors. The plan assets also may be held in annuitycontracts or custodial accounts, which are treated as trusts.

STATE OF RHODE ISLAND AND PROVIDENCE PLANTATIONS Notes to General-Purpose Financial Statements
- 72 -
The state does not serve in a trustee capacity. Accordingly, the plan assets are not includedin the financial statements.
Note 16. Fund Deficits
The Federal Surplus Property Internal Service Fund reported a deficit of $500 at June 30,2001. Future revenues or an operating transfer from the General Fund will fund this deficit.
The R.I. Convention Center Authority reported a deficit of $53,128,029 at fiscal year endedJune 30, 2001. This deficit will be funded by future revenues.
The R.I. Public Transit Authority reported a deficit of $5,962,769 at fiscal year ended June30, 2001. This deficit will be funded by future revenues.
The R.I. Water Resources Board Corporate reported a deficit of $1,035,160 at fiscal yearended June 30, 2001. This deficit will be funded by future revenues.
Note 17. Restatement of Fund Equity
Certain restatements of fund equity balances, as of June 30, 2000, are summarized in thefollowing table (expressed in thousands):
July 1, 2000Fund Equity
Restated
Primary GovernmentGeneral Fund $ 213,763 $ 7,980 $ 221,743
Special Revenue FundsEmployment Insurance - Interest Fund $ 473 $ (473) $Employment Insurance - Tardy Fund 498 (498)Employment Insurance - Job Development Fund 7,009 (7,009)R.I. Temporary Disability Insurance Fund 54,910 34,910 89,820Other Special Revenue Funds 24,910 24,910
$ 87,800 $ 26,930 $ 114,730
Internal Service FundsWorkers' Compensation $ (58) $ 58 $Assessed Fringe Benefits 7 (58) (51)Other Internal Service Funds 5,430 5,430
$ 5,379 $ $ 5,379
Trust and Agency FundsEmployment Security Trust Fund $ 282,607 $ 37,431 $ 320,038Other Trust and Agency Funds 7,070,360 7,070,360
$ 7,352,967 $ 37,431 $ 7,390,398
Proprietary Component UnitsR.I. Economic Development Corp. $ 260,627 $ (13,574) $ 247,053Other Proprietary Component Units 741,633 741,633
$ 1,002,260 $ (13,574) $ 988,686
Adjustments
June 30, 2000Fund Equity
As PreviouslyReported

STATE OF RHODE ISLAND AND PROVIDENCE PLANTATIONS Notes to General-Purpose Financial Statements
- 73 -
Effective July 1, 2000, the Employment Insurance Funds (Federal Programs, Interest, Tardy,and Job Development Funds) are no longer included within the Special Revenue Funds. Theassets, liabilities and fund balances of these funds were transferred to the General Fund.
The beginning fund balances of the Rhode Island Temporary Disability Insurance Fund andthe Employment Security Trust Fund have been restated to comply with GASB StatementNo. 33, "Accounting and Financial Reporting for Nonexchange Transactions."
The beginning retained earnings of the Assessed Fringe Benefit Internal Service Fund hasbeen restated to include the Workers’ Compensation Internal Service Fund.
The beginning retained earnings of the R.I. Economic Development Corporation was restatedto correct errors resulting in the overstatement of previously reported assets and to correctthe reporting of capitalized costs.
Note 18. Segment Information
Segment information for the governmental and proprietary component units is presented(expressed in thousands) in the following schedules:
Governmental URI RIC CCRI CFSD
Due from primary government $ 858 $ 867 $ 422 $Other current assets 67,528 16,153 8,585 5,659General fixed assets 19,237Amounts available in debt service fund 209 591Amounts to be provided for retirement of GLTD 87,570 22,451 10,378 1,288Due to primary government 901 402 496Other current liabilities 38,742 8,794 5,098 3,278Bonds payable 87,323 13,555 4,063Other long-term liabilities 39,635 9,526 6,907 1,288Revenues 218,019 47,759 34,454 2,396Current expenditures 290,022 87,052 71,475 35,619Capital outlay expenditures 26,650 2,322 1,376 920Debt service expenditures 2,459 250 419Transfers from primary government 82,134 42,642 38,968 35,191Excess of revenues and expenditures (13,844) 1,106 (27) 1,048Net gain from proprietary operations 13,881
Proprietary RIHMFC RISLA RITBA RIEDC RICCA NBC
Due from primary government $ $ $ $ 666 $ $Other current assets 2,004,154 776,333 38,636 182,664 31,521 28,839Fixed assets (net) 15,229 435 47,605 326,586 213,566 229,792Due to primary government 2,235 32Other current liabilities 48,515 17,711 1,798 7,619 5,615 8,027Bonds payable 1,540,657 715,540 40,661 244,996 295,011 18,321Other long-term liabilities 203,121 42,554 2,053 53,254Operating revenue 130,341 55,344 11,224 44,257 41,367 29,819Operating expenses 117,346 47,999 4,427 38,252 33,506 23,219Depreciation, depletion and amortization 2,742 460 855 14,602 9,207 5,388Operating income (loss) 10,253 6,885 5,941 (8,597) (1,346) 1,212Transfers from primary government 13,480 19,420Transfers to primary government (1,896) (634)Net income (loss) 9,358 6,885 7,300 (7,240) 785 (43)Current capital contribution (20,616) 5
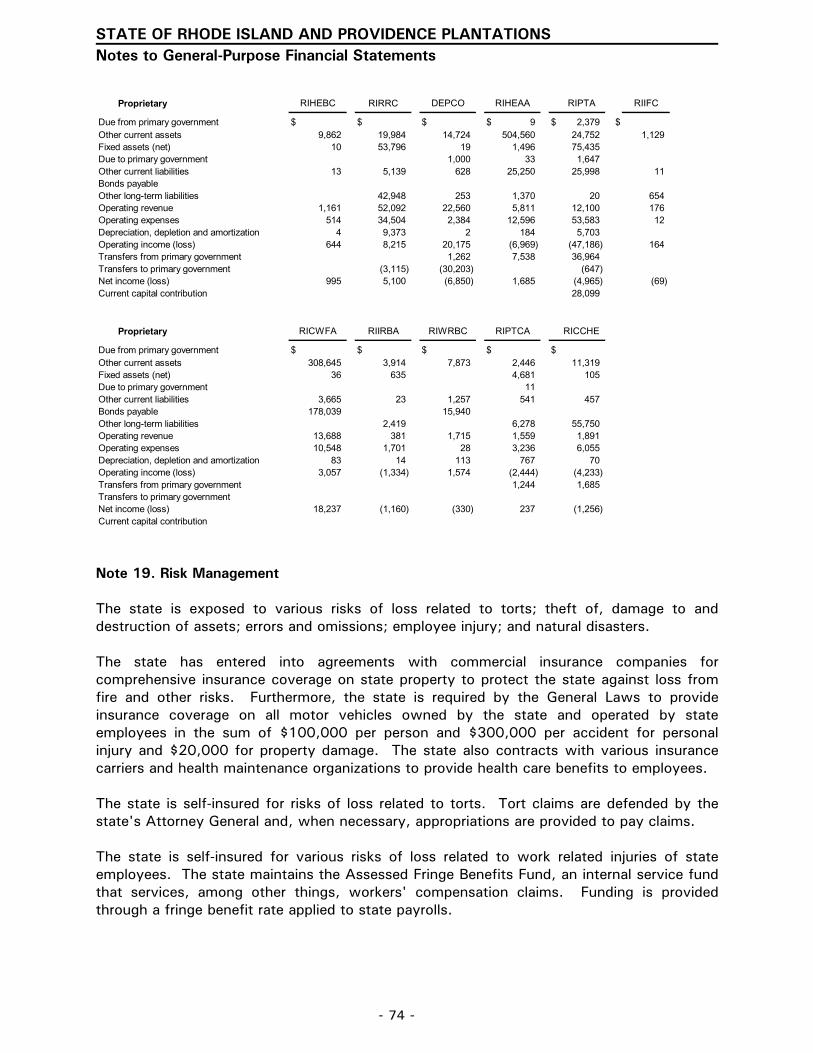
STATE OF RHODE ISLAND AND PROVIDENCE PLANTATIONS Notes to General-Purpose Financial Statements
- 74 -
Note 19. Risk Management
The state is exposed to various risks of loss related to torts; theft of, damage to anddestruction of assets; errors and omissions; employee injury; and natural disasters.
The state has entered into agreements with commercial insurance companies forcomprehensive insurance coverage on state property to protect the state against loss fromfire and other risks. Furthermore, the state is required by the General Laws to provideinsurance coverage on all motor vehicles owned by the state and operated by stateemployees in the sum of $100,000 per person and $300,000 per accident for personalinjury and $20,000 for property damage. The state also contracts with various insurancecarriers and health maintenance organizations to provide health care benefits to employees.
The state is self-insured for risks of loss related to torts. Tort claims are defended by thestate's Attorney General and, when necessary, appropriations are provided to pay claims.
The state is self-insured for various risks of loss related to work related injuries of stateemployees. The state maintains the Assessed Fringe Benefits Fund, an internal service fundthat services, among other things, workers' compensation claims. Funding is providedthrough a fringe benefit rate applied to state payrolls.
Proprietary RIHEBC DEPCO RIHEAA RIPTA RIIFC
Due from primary government $ $ $ $ 9 $ 2,379 $Other current assets 9,862 19,984 14,724 504,560 24,752 1,129Fixed assets (net) 10 53,796 19 1,496 75,435Due to primary government 1,000 33 1,647Other current liabilities 13 5,139 628 25,250 25,998 11Bonds payableOther long-term liabilities 42,948 253 1,370 20 654Operating revenue 1,161 52,092 22,560 5,811 12,100 176Operating expenses 514 34,504 2,384 12,596 53,583 12Depreciation, depletion and amortization 4 9,373 2 184 5,703Operating income (loss) 644 8,215 20,175 (6,969) (47,186) 164Transfers from primary government 1,262 7,538 36,964Transfers to primary government (3,115) (30,203) (647)Net income (loss) 995 5,100 (6,850) 1,685 (4,965) (69)Current capital contribution 28,099
Proprietary RICWFA RIIRBA RIWRBC RIPTCA RICCHE
Due from primary government $ $ $ $ $Other current assets 308,645 3,914 7,873 2,446 11,319Fixed assets (net) 36 635 4,681 105Due to primary government 11Other current liabilities 3,665 23 1,257 541 457Bonds payable 178,039 15,940Other long-term liabilities 2,419 6,278 55,750Operating revenue 13,688 381 1,715 1,559 1,891Operating expenses 10,548 1,701 28 3,236 6,055Depreciation, depletion and amortization 83 14 113 767 70Operating income (loss) 3,057 (1,334) 1,574 (2,444) (4,233)Transfers from primary government 1,244 1,685Transfers to primary governmentNet income (loss) 18,237 (1,160) (330) 237 (1,256)Current capital contribution
RIRRC

STATE OF RHODE ISLAND AND PROVIDENCE PLANTATIONS Notes to General-Purpose Financial Statements
- 75 -
There are no funds reserved for pending claims or incurred but not reported liabilities.
Note 20. Extraordinary Items
The R.I. Housing and Mortgage Finance Corporation periodically retires bonds prior to theredemption date. Deferred bond issuance costs, along with any premium paid on the call, inthe amount of $895,453 were reported as an extraordinary loss in fiscal year 2001.
The R.I. Depositors Economic Protection Corporation reported an extraordinary item of$904,749. This was the net result of reporting an accounting gain of $975,800 on therestructure of the existing escrow for defeased special obligation bonds and an accountingloss of $71,051 on a debt defeasance that was funded through the liquidation of assets, netsettlements and excess state sales tax.
Note 21. Related Party Transactions
The R.I. Depositors Economic Protection Corporation (DEPCO) is entitled by statute to six-tenths of one percent within the state's sales and use tax rate. Payment to DEPCO requiresan annual appropriation by the General Assembly. The General Assembly is not legally boundor obligated to make such appropriations. Due to the final defeasance of all remainingoutstanding bonds on August 3, 2000, the payment agreement between DEPCO and theState was terminated effective August 28, 2000. During fiscal year 2001, DEPCO received$10,744,323 in sales tax payments which included $9,482,634 due at June 30, 2000 andpayments totaling $1,261,689 for the period through termination of the payment agreementbetween DEPCO and the State effective August 28, 2000.
The R.I. Resource Recovery Corporation (RIRRC) entered into a lease and agreement withthe state whereby the RIRRC agreed to lease the landfill to the state. Pursuant to this leaseand agreement RIRRC issued $5,000,000 of notes on July 29, 1999. The principal andinterest on these notes are secured by rentals as set forth in the lease and agreement. Thenotes were due on July 30, 2000. On July 29, 2000, the $5,000,000 and $200,000 ofaccrued interest were paid out of available cash and investments.
Funds held by the University of Rhode Island Foundation for the future use of the universityand its faculty and students are not reflected in the accompanying financial statements. Funds held at June 30, 2001 amounted to $75,446,610. Distributions of $12,162,519during the fiscal year ended June 30, 2001 are included in private gift revenue of theuniversity.
Funds held by the Rhode Island College Foundation for the future use of the college and itsfaculty and students are not reflected in the accompanying financial statements. Funds heldat June 30, 2001 amounted to approximately $9,500,000. There were no distributions toRIC during the fiscal year ended June 30, 2001.
As of June 30, 2001, the Employees' Retirement System held investments in bonds issuedby the R.I. Housing and Mortgage Finance Corporation having a fair value of $3,776,503. This corporation is included as a component unit in the accompanying general-purposefinancial statements.

STATE OF RHODE ISLAND AND PROVIDENCE PLANTATIONS Notes to General-Purpose Financial Statements
- 76 -
The R.I. Industrial-Recreational Building Authority is authorized to insure mortgages and firstsecurity agreements for companies conducting business in the state, granted by financialinstitutions and the R.I. Industrial Facilities Corporation.
The state entered into a lease and operating agreement (the agreement) with the R.I. AirportCorporation (RIAC) a subsidiary of the R.I. Economic Development Corporation providing forthe lease and/or transfer from the state to the RIAC all real, personal, and tangible property;intangible property, including accounts receivable, contract rights, choices in action,licenses, permits, grants, and entitlements; and all other assets of the state used or usedprimarily in connection with the administration, maintenance, management, regulation,operation, improvement, development or use of the state's six airports and other airfacilities. RIAC agrees to reimburse the state for principal and interest payments for certainairport related General Obligation Bonds. The term of the agreement is 35 years beginningJuly 1, 1993, with annual rent of $1.00.
Note 22. Subsequent Events
Primary Government
In July 2001, the state issued $135,400,000 of general obligation serial bonds. Theinterest rate on these bonds ranged from 3.25% to 5.50% with maturities from 2002 to2020.
Component Units
In August, November and December 2001, the R.I. Housing and Mortgage FinanceCorporation (RIHMFC) issued bonds in the amount of $118,785,000, $51,300,000 and$63,705,000, respectively. Additionally in October 2001, RIHMFC called $78,190,000 ofbonds outstanding at June 30, 2001.
In November 2001, the R.I. Convention Center Authority issued refunding revenue bonds inthe amount of $101,315,000 to advance refund $91,885,000 of its 1993 Series A Bonds.
FINANCIAL SECTION
REQUIRED
SUPPLEMENTARY
INFORMATION
- 77 -

STATE OF RHODE ISLAND AND PROVIDENCE PLANTATIONS
REQUIRED SUPPLEMENTARY INFORMATION
SCHEDULES OF FUNDING PROGRESS
(Expressed in thousands)
Actuarial Unfunded Frozen Frozen Excess as aActuarial Value of Actuarial Liability Initial Funded Covered Percentage ofValuation Assets (UFAL) Liability Ratio Payroll Covered Payroll
Date ( a ) ( b ) ( c ) = ( a + b ) ( a / c ) ( d ) ( b / d )
6/30/98 5,121,478 1,454,527 6,576,005 77.9% 1,113,567 130.6%6/30/99 5,460,907 1,114,020 6,574,927 1,168,300 95.4%6/30/00 5,859,719 1,375,068 7,234,787 1,220,833 112.6%
Actuarial Unfunded Frozen Frozen Excess as aActuarial Value of Actuarial Liability Initial Funded Covered Percentage ofValuation Assets (UFAL) Liability Ratio Payroll Covered Payroll
Date ( a ) ( b ) ( c ) = ( a + b ) ( a / c ) ( d ) ( b / d )
6/30/98 6,757 581 7,338 92.1% 7,212 8.1%6/30/99 8,481 2,361 10,842 7,502 31.5%6/30/00 11,337 2,581 13,918 8,917 28.9%
Actuarial Unfunded Frozen Frozen Excess as aActuarial Value of Actuarial Liability Initial Funded Covered Percentage ofValuation Assets (UFAL) Liability Ratio Payroll Covered Payroll
Date ( a ) ( b ) ( c ) = ( a + b ) ( a / c ) ( d ) ( b / d )
6/30/98 4,120 929 5,049 81.6% 3,040 30.6%6/30/99 5,522 1,894 7,416 3,169 59.8%6/30/00 7,375 2,345 9,720 3,533 66.4%
Employees' Retirement System
State Police Retirement Benefits Trust
Judicial Retirement Benefits Trust
75.9%
81.5%
81.0%83.1%
78.2%
74.5%
- 78 -

FINANCIAL SECTION
COMBINING AND INDIVIDUAL
FUND AND ACCOUNT
GROUP STATEMENTS
- 79 -

This Page Intentionally Left Blank
- 80 -

GENERAL FUND
- 81 -

STATE OF RHODE ISLAND AND PROVIDENCE PLANTATIONS
BALANCE SHEET
GENERAL FUND
June 30, 2001
Cash and cash equivalents $ 211,088,754 Receivables (net) 194,845,924 Due from other funds 73,275,386 Due from component units 5,111,666 Due from other governments and agencies 125,907,751 Loans to other funds 5,844,972 Other assets 1,210,404
Total assets $ 617,284,857
Liabilities:
Cash overdraft $ 3,084,740 Vouchers and accounts payable 268,773,992 Due to other funds 12,912,758 Due to component units 1,837,502 Accrued liabilities 23,352,679 Deferred revenue 15,772,563 Other liabilities 23,405,179
Total liabilities 349,139,413
Fund balance:
Reserved:Budget reserve 79,689,074 Appropriations carried forward:
General revenue appropriations 11,056,417 Departmental restricted appropriations 34,521,041 Other, principally capital accounts 11,696,439
Unreserved:Undesignated 131,182,473
Total fund balance 268,145,444
Total liabilities and fund balance $ 617,284,857
Assets
Liabilities and Fund Balance
- 82 -

STATE OF RHODE ISLAND AND PROVIDENCE PLANTATIONS
STATEMENT OF REVENUES, EXPENDITURES, AND CHANGES IN FUND BALANCE
GENERAL FUND
For the Fiscal Year Ended June 30, 2001
Revenues:
Taxes $ 2,011,948,691 Licenses, fines, sales, and services 205,042,601 Departmental restricted revenue 77,332,935 Federal grants 1,213,490,953 Income from investments 7,360,526 Other revenues 49,274,714
Total revenues 3,564,450,420
Other financing sources:
Operating transfers in 291,987,876 Operating transfers from component units 36,968,567 Other 67,530,664
Total revenues and other financing sources 3,960,937,527
Expenditures:
Current:General government 257,505,765 Human services 1,944,653,610 Education 63,323,775 Public safety 279,626,172 Natural resources 52,795,153
Capital outlays 30,978,601 Intergovernmental 848,126,264 Debt service:
Principal 79,393,522 Interest and other charges 64,849,089
Total expenditures 3,621,251,951
Other financing uses:
Operating transfers out 50,460,451 Operating transfers to component units 242,822,929
Total expenditures and other financing uses 3,914,535,331
Revenues and other financing sources overexpenditures and other financing uses 46,402,196
Fund balance, July 1, 2000, as restated 221,743,248
Fund balance, June 30, 2001 $ 268,145,444
- 83 -

STATE OF RHODE ISLAND AND PROVIDENCE PLANTATIONS
STATEMENT OF REVENUES, OTHER FINANCING SOURCES, EXPENDITURES, AND OTHERFINANCING USES - GENERAL REVENUE APPROPRIATIONS - BUDGET AND ACTUAL
GENERAL FUND
For the Fiscal Year Ended June 30, 2001
Revenues:Taxes $ 2,011,700,000 $ 2,011,948,691 $ 248,691 Licenses, fines, sales and services 197,000,000 205,042,601 8,042,601 Miscellaneous revenue 57,500,000 56,635,240 (864,760)
Total revenues 2,266,200,000 2,273,626,532 7,426,532
Other financing sources:Operating transfers in 190,349,120 192,174,621 1,825,501 Operating transfers from component units 30,315,000 31,315,000 1,000,000 Other 72,152,130 67,264,461 (4,887,669) Appropriations carried forward from prior year 21,738,955 21,738,955
Total revenues and other financing sources 2,580,755,205 2,586,119,569 5,364,364
Expenditures:Department or Agency/Program
AdministrationCentral Management 1,741,453 1,883,954 (142,501) Accounts and Control 4,180,355 4,205,554 (25,199) Financial Management Information System 2,001,445 1,936,037 65,408 Budgeting 2,069,381 2,043,188 26,193 Municipal Affairs 1,219,625 1,218,858 767 Purchasing 2,139,447 1,922,014 217,433 Auditing 1,429,112 1,450,943 (21,831) Human Resources 6,317,691 6,341,027 (23,336) Personnel Appeal Board 128,347 119,583 8,764 Taxation 31,497,868 32,812,665 (1,314,797) Central Services 11,982,318 12,625,962 (643,644) Energy Office Grants 913,924 626,150 287,774 Office of Library and Information Services 2,509,058 2,539,459 (30,401) General 10,263,700 9,953,850 309,850 Contingency Fund 1,350,000 1,078,955 271,045 Race and Police Community
Relations Commission 309,110 315,549 (6,439) Slater Technology Fund 2,000,000 2,000,000 Economic Development Corporation 8,126,807 8,126,807 Centers for Excellence 3,250,000 3,250,000 Housing Resources Commission 3,757,822 3,614,207 143,615 Motor Vehicle Excise Tax Payments 70,099,276 75,021,103 (4,921,827) Property Valuation Program 1,473,000 1,389,246 83,754 Revenue Sharing Program 33,496,050 33,496,050 Payment in Lieu of Tax Exempt Property 17,616,190 17,614,802 1,388 Distressed Communities Relief Program 7,500,000 7,293,310 206,690 Resource Sharing and State Library Aid 6,000,000 5,990,388 9,612 Library Construction Aid 2,050,000 2,016,071 33,929 Debt Service Payments 112,270,334 112,076,520 193,814
Continued
Budget Actual Variance
- 85 -

STATE OF RHODE ISLAND AND PROVIDENCE PLANTATIONS
STATEMENT OF REVENUES, OTHER FINANCING SOURCES, EXPENDITURES, AND OTHERFINANCING USES - GENERAL REVENUE APPROPRIATIONS - BUDGET AND ACTUAL (Continued)
GENERAL FUND
For the Fiscal Year Ended June 30, 2001
Department or Agency/Program
Business RegulationCentral Management 1,346,104 1,238,287 107,817 Banking Regulation 1,309,448 1,253,206 56,242 Securities Regulation 670,885 655,354 15,531 Commercial Licensing and Regulation 1,124,684 1,103,811 20,873 Racing and Athletics 670,435 665,552 4,883 Insurance Regulation 3,300,427 3,392,420 (91,993)
Labor and TrainingCentral Management 340,096 372,375 (32,279) Workforce Regulation and Safety 3,543,410 3,926,960 (383,550) Income Support 2,691,797 2,657,147 34,650 Labor Relations Board 329,296 343,944 (14,648)
LegislatureLegislature 27,853,568 24,351,032 3,502,536 Legislative Office Building 4,000,000 4,000,000
Office of Lieutenant Governor 701,599 696,440 5,159 Secretary of State
Administration 1,231,349 1,220,689 10,660 Corporations 1,388,153 1,379,005 9,148 State Archives 265,909 262,410 3,499 Elections 1,522,433 1,485,957 36,476 State Library 714,618 710,148 4,470 Office of Public Information 462,894 432,259 30,635
Office of the General TreasurerGeneral Treasury 2,473,587 2,412,086 61,501 Rhode Island Refunding Bond Authority 86,097 77,917 8,180 Crime Victim Compensation Program 2,416,653 2,411,626 5,027
Board for Design Professionals 327,634 357,428 (29,794) Board of Elections 2,330,624 2,260,980 69,644 Rhode Island Ethics Commission 890,093 628,053 262,040 Office of the Governor 4,019,228 4,013,751 5,477 Public Utilities Commission 735,228 734,122 1,106 Rhode Island Commission on Women 133,014 132,775 239 Children, Youth, and Families
Central Management 7,217,119 7,018,277 198,842 Friendship Street Renovations 1,005,077 1,308,354 (303,277) Children's Behavioral Health 20,509,077 19,382,315 1,126,762 Juvenile Corrections 23,809,742 23,855,974 (46,232) Child Welfare 73,953,863 75,149,958 (1,196,095) Children's Trust Fund 55,500 55,500 Harmony Hill New Construction Grant 250,000 250,000 Higher Education Incentive Grants 111,439 57,712 53,727
Elderly AffairsGeneral 23,293,585 22,463,072 830,513 Safety and Care of the Elderly 1,000 1,000
Budget Actual Variance
- 86 -

STATE OF RHODE ISLAND AND PROVIDENCE PLANTATIONS
Department or Agency/Program
HealthCentral Management 2,583,587 2,720,355 (136,768) State Medical Examiner 1,611,159 1,567,966 43,193 Family Health 7,784,102 7,924,978 (140,876) Poison Control Center 252,932 268,267 (15,335) Health Services Regulation 4,222,537 4,374,934 (152,397) Hospital Care Consultant Report 302,736 301,464 1,272 Environmental Health 4,006,962 3,912,496 94,466 Health Laboratories 5,379,216 5,681,255 (302,039) Disease Prevention and Control 5,056,098 4,917,664 138,434
Human ServicesCentral Management 6,046,902 5,818,758 228,144 Individual and Family Support 19,443,239 18,474,465 968,774 Veterans' Affairs 12,432,099 12,786,459 (354,360) Health Care Quality, Financing and Purchasing 22,890,682 20,963,106 1,927,576 Medical Benefits - Hospitals 93,400,000 92,189,389 1,210,611 Medical Benefits - Nursing Facilities 113,640,206 113,045,289 594,917 Medical Benefits - Managed Care 104,261,311 105,924,947 (1,663,636) Medical Benefits - Other 75,204,753 68,895,719 6,309,034 Medical Benefits - Special Education 9,493,730 12,132,482 (2,638,752) Supplemental Security Income Program 26,646,070 26,409,274 236,796 Family Independence Program 50,345,964 50,665,765 (319,801) TANF - Family Independence Program 17,073,025 17,043,984 29,041 General Public Assistance 1,978,583 1,877,253 101,330 Food Stamp Replacement for Legal Immigrants 1,689,156 1,668,585 20,571 Citizenship Participation Program 100,000 100,000 Weatherization One-Time Payment 1,715,000 1,720,873 (5,873)
Mental Health, Retardation, and HospitalsCentral Management 1,498,533 1,594,623 (96,090) Hospitals and Community System Support 18,877,022 19,133,613 (256,591) Services for the Developmentally Disabled 91,629,577 90,263,053 1,366,524 Pivano Trust 289,085 28,095 260,990 Integrated Mental Health Services 29,285,719 29,433,999 (148,280) Hospital and Community Rehabilitative Services 47,073,055 51,381,198 (4,308,143) Substance Abuse 14,285,943 13,950,896 335,047 Providence Community Action 213,000 208,327 4,673
Office of the Child Advocate 485,441 526,339 (40,898) Commission on the Deaf and Hard of Hearing 246,761 233,790 12,971 Governor's Commission on Disabilities 288,101 292,977 (4,876) Commission for Human Rights 753,548 749,221 4,327 Office of the Mental Health Advocate 243,525 233,966 9,559 Elementary and Secondary Education
State Aid 539,032,756 538,824,639 208,117 School Housing Aid 30,775,774 30,775,773 1 Teachers' Retirement 36,197,184 35,536,235 660,949 Rhode Island School for the Deaf 5,452,018 5,021,968 430,050 Central Falls School District 31,495,887 31,495,887
Continued
Budget Actual Variance
- 87 -

STATE OF RHODE ISLAND AND PROVIDENCE PLANTATIONS
STATEMENT OF REVENUES, OTHER FINANCING SOURCES, EXPENDITURES, AND OTHERFINANCING USES - GENERAL REVENUE APPROPRIATIONS - BUDGET AND ACTUAL (Continued)
GENERAL FUND
For the Fiscal Year Ended June 30, 2001
Department or Agency/Program
Elementary and Secondary Education (Continued)Davies Career and Technical School 10,128,433 9,945,286 183,147 Metropolitan Career and Technical School 1,980,000 1,980,000 Program Operations 14,974,834 15,169,472 (194,638) Computerization of Teacher Certification 100,000 57,800 42,200
Board of Governors 162,841,878 162,750,040 91,838 Rhode Island Council on the Arts
Operating Support 357,407 375,409 (18,002) Grants 1,750,000 1,088,478 661,522
Rhode Island Atomic Energy Commission 629,790 629,357 433 Rhode Island Higher Education Assistance Authority
Needs Based Grants and Work Opportunity 6,519,911 6,593,289 (73,378) Operations and Other Grants 1,031,099 944,882 86,217
Rhode Island Historical Preservationand Heritage Commission 910,637 910,220 417
Rhode Island Public Telecommunications Authority 1,243,915 1,243,915 Attorney General
Criminal 8,943,984 8,959,846 (15,862) Civil 3,573,286 3,435,159 138,127 Bureau of Criminal Identification 615,846 501,721 114,125 General 1,413,591 1,411,069 2,522
CorrectionsCentral Management 8,565,918 8,218,515 347,403 Parole Board 841,292 798,773 42,519 Institutional Corrections 106,090,532 108,178,111 (2,087,579) Community Corrections 9,021,704 8,530,039 491,665 Transition Housing for Women 100,000 100,000
JudiciarySupreme Court 14,701,232 15,374,595 (673,363) Defense of Indigents 1,550,000 1,527,434 22,566 Superior Court 14,199,958 14,146,582 53,376 Family Court 10,616,894 10,506,507 110,387 District Court 6,534,426 6,503,563 30,863 Traffic Tribunal 5,324,999 5,334,788 (9,789) Justice Link 3,306,853 2,410,982 895,871
Military StaffNational Guard 1,688,829 2,177,537 (488,708) Emergency Management 396,359 442,519 (46,160)
E-911 Emergency Telephone System 3,170,405 3,213,003 (42,598) Fire Safety Code Board of Appeal and Review 166,143 170,027 (3,884) Fire Safety and Training Academy 1,308,427 1,306,700 1,727 Commission on Judicial Tenure and Discipline 101,202 110,287 (9,085) Rhode Island Justice Commission 179,638 180,185 (547) Municipal Police Training Academy 478,555 426,616 51,939 State Police 34,381,628 36,480,855 (2,099,227)
Budget Actual Variance
- 88 -

STATE OF RHODE ISLAND AND PROVIDENCE PLANTATIONS
Department or Agency/Program
Office of the Public Defender 5,414,059 5,247,635 166,424 Sheriffs of the Several Counties 8,637,905 8,591,158 46,747 Environmental Management
Policy and Administration 8,950,870 8,495,028 455,842 Natural Resources 14,396,273 14,915,901 (519,628) Environmental Protection 8,811,122 8,817,284 (6,162)
Coastal Resources Management Council 1,158,413 1,114,228 44,185 State Water Resources Board 1,004,505 962,218 42,287
Total expenditures 2,488,573,708 2,482,676,487 5,897,221
Other financing uses:
Appropriations carried forward 11,056,417 (11,056,417)
Total expenditures and other financing uses 2,488,573,708 2,493,732,904 (5,159,196)
Revenue and other financing sources overexpenditures and other financing uses $ 92,181,497 $ 92,386,665 $ 205,168
Concluded
Budget Actual Variance
- 89 -

STATE OF RHODE ISLAND AND PROVIDENCE PLANTATIONS
STATEMENT OF GENERAL FUND RESTRICTED REVENUES, EXPENDITURES, AND OTHER FINANCINGSOURCES AND USES - BUDGET AND ACTUAL
For the Fiscal Year Ended June 30, 2001
AccountNumber Budget Actual Variance Budget Actual Variance
1072-80100 General Hospital - Donations from Public 526 526
1080-80400 Asset Forfeiture 55,000 97,507 42,507 55,000 55,000 1102-80601 Indirect Cost Recovery -
Central Management 1,638,372 1,991,476 353,104 1,638,372 1,991,476 (353,104)1131-80100 Making The Grade - RWJ Foundation 339,317 241,325 (97,992) 339,317 226,329 112,988 1131-80200 RWJ-Making The Grade - Planning 154,761 158,011 3,250 154,761 158,011 (3,250)1134-80100 Infant - Child Immunization 3,404,765 3,111,948 (292,817) 3,404,765 3,111,948 292,817 1134-80200 All Kids Count 6,506 6,506 6,506 (6,506)1140-80400 Managed Care Regulation 429,208 456,938 27,730 429,208 410,050 19,158 1173-80200 Drinking Water Revolving Fund 682,179 854,074 171,895 682,179 854,074 (171,895)1193-80100 RI Research Fund - Breast and
Cervical Cancer 5,000 1,000 (4,000) 5,000 1,000 4,000 1193-80200 ALF - Tobacco 75,000 68,689 (6,311) 75,000 68,689 6,311 1210-80101 Indirect Cost Recovery - Central
Management 1,780,157 1,793,113 12,956 1,780,157 1,793,113 (12,956)1235-80100 Veterans Home Collections 1,627,998 2,271,842 643,844 1,627,998 712,078 915,920 1235-80300 Veterans Home - Resident Benefits 1,800 2,076 276 1,800 2,076 (276)1235-80500 Veterans Cemetery Memorial Fund 467,433 448,063 (19,370) 467,433 327,235 140,198 1236-80200 R.W.J. Grant 83,798 83,798 83,798 83,797 1 1237-80100 Vending Stand Proceeds 73,680 159,469 85,789 73,680 113,780 (40,100)1246-80100 Health Indicators Dvlpmnt. Project 239,500 276,988 37,488 239,500 276,988 (37,488)1246-80200 Health Care Quality 397,988 173,375 (224,613) 397,988 69,556 328,432 1256-80100 Food Stamp Bonus 4 4 1260-80100 Organ Transplant Fund 15,000 39,738 24,738 15,000 8,010 6,990 1260-80200 Medicaid Provider Participation 46,648 46,648 35,092 (35,092)1370-80100 Custody of US Detainees 3,950,209 4,236,577 286,368 3,950,209 3,361,490 588,719 1410-80114 Indirect Cost Recovery - Pgm. Spprt. 49,740 49,342 (398) 49,740 49,342 398 1410-80121 Indirect Cost Recovery - Pgm. Spprt. 513,880 780,483 266,603 513,880 529,940 (16,060)1410-80500 CCSSO Leadership 50,000 50,000 175 (175)1410-80553 Carnegie Foundation 698 698 698 (698)1430-80100 NE Dairy Compact Rmbrsmnt. Pgm. 35,000 24,683 (10,317) 35,000 24,683 10,317 1430-81200 Project Communication Coordination 11,599 1,418 (10,181) 11,599 11,599 1440-80333 Education Partnership Fund 25,000 474 (24,526) 25,000 474 24,526 1440-84133 HRIC - Workplace Literacy (1,392) (1,392) (1,392) 1,392 1652-80000 Donley Rehabilitation Center and
Second Injury Fund 4,464,634 4,464,634 1652-80100 Office of Director - Workers Comp. 444,898 702,683 257,785 444,898 702,683 (257,785)1652-80200 Claims Monitoring and D P Unit 2,088,194 2,062,506 (25,688) 2,088,194 2,062,506 25,688 1652-80300 Donley Ctr. Oprtns. - Workers Comp. 4,251,032 3,924,342 (326,690) 4,251,032 3,924,342 326,690 1652-80400 Education Unit - Workers Comp. 491,619 592,489 100,870 491,619 592,489 (100,870)1652-80500 Scnd. Injury Indemnity Fd. Operation 2,720,051 2,762,074 42,023 2,720,051 2,762,074 (42,023)1652-80600 Injured Workers Incentive Benefit 110,000 86,447 (23,553) 110,000 69,164 40,836 1652-81000 Self-Insurance Operations 210,537 182,897 (27,640) 210,537 182,897 27,640 1653-80100 R. W. Johnson Foundation Grant 147,583 109,265 (38,318) 147,583 109,265 38,318 1670-80100 ES - Reemployment Program 827,112 957,148 130,036 827,112 76,842 750,270 1676-80100 Human Resource Investment Council 8,920,280 17,349,021 8,428,741 8,920,280 7,489,576 1,430,704 1676-80200 Job Development Fund 267,034 342,492 75,458 267,034 40,631 226,403 1690-80100 Tardy Fund 537,664 1,327,705 790,041 537,664 1,010,114 (472,450)1695-80100 Interest Fund 414,066 1,107,492 693,426 414,066 513,512 (99,446)1720-81000 Oil Spill Prvntn. Adm. and Resp Fund 5,485,264 9,168,596 3,683,332 5,485,264 3,974,998 1,510,266 1721-80100 Boat Registration 478,632 1,044,315 565,683 478,632 418,502 60,130 1721-80300 Indirect Cost Recovery - Admin. 219,442 210,881 (8,561) 219,442 210,881 8,561 1721-80301 Indirect Cost Recovery - Admin. 81,581 81,573 (8) 81,581 81,573 8 1721-80302 Indirect Cost Recovery - Legal 73,944 73,944 73,944 73,944
Revenues and Other Financing Sources
Account Title
Expenditures and Other Financing Uses
- 90 -

STATE OF RHODE ISLAND AND PROVIDENCE PLANTATIONS
AccountNumber Budget Actual Variance Budget Actual Variance
1721-80303 Indirect Cost Recovery - Human Res. 88,762 88,753 (9) 88,762 88,753 9 1725-80100 National Heritage Revolving Fund 175,000 329,614 154,614 175,000 173,863 1,137 1725-81600 Champlin Gt. for Goddard Horse Barn 325,000 525,000 200,000 325,000 325,000 1730-80103 Ind. Cost Recovery - Pbc. Res. Mgt. 55,000 246,475 191,475 55,000 246,475 (191,475)1732-80100 Fishing License Receipts 232,485 305,365 72,880 232,485 305,365 (72,880)1732-80200 Hunting License Receipts 285,459 331,471 46,012 285,459 331,471 (46,012)1732-80300 Fishing and Hunting Receipts -
Acquisition and Development 325,762 538,879 213,117 325,762 148,667 177,095 1732-80400 Shellfish and Marine License Receipts 922,564 1,255,567 333,003 922,564 996,177 (73,613)1732-80600 Sale of Trout Conservation Stamp 161,492 381,505 220,013 161,492 160,533 959 1732-80900 Migratory Waterfowl Stamp 44,906 72,232 27,326 44,906 26,051 18,855 1733-80200 State Forestry Fund 119,099 77,271 (41,828) 119,099 51,823 67,276 1735-80100 Boating Safety 781,045 821,463 40,418 781,045 821,463 (40,418)1751-80900 State Revolving Fund Administration 179,915 199,303 19,388 179,915 199,303 (19,388)1751-81300 Indirect Cost Rcvry. - Water Rsrcs. 252,500 267,968 15,468 252,500 267,968 (15,468)1753-80300 Underground Storage Tank Rplcmnt. 500 (500) 500 500 1753-80400 Sewage and Water Supply Failure Fund 17,091 17,091 1754-80200 Environmental Response Fund 407,242 651,531 244,289 407,242 651,531 (244,289)1754-80600 Water and Air Protection Program 630,160 1,334,311 704,151 630,160 1,120,884 (490,724)1754-80601 Water and Air Protection - Water Res. 2,728 2,728 1758-80100 Underground Storage Tank Trust
Fund Reimbursement 104,813 104,813 41 (41)1758-80300 Tire Reclamation Project 6,365 6,365 1759-80100 Underground Storage Tank Fees 180,016 219,370 39,354 180,016 219,370 (39,354)1825-80900 Real Estate Appraiser - Rgstrtn. Fees 21,000 22,649 1,649 21,000 10,200 10,800 1825-81100 Real Estate Recovery 80,000 286,576 206,576 80,000 39,000 41,000 1830-80100 Assessment for Cost of Rate Filings 153,324 106,230 (47,094) 153,324 106,230 47,094 1830-80200 Ins. Companies Assessment Actuary 200,000 147,388 (52,612) 200,000 140,287 59,713 2024-83000 Juvenile Accountability Incentive Intrst 2,876 2,876 2024-83100 99 Juvenile Accountability Incentive 40,007 40,007 2041-80100 Technical Assistance Projects 1,750 8,135 6,385 1,750 1,161 589 2041-80200 Human Resource Investment Council 17,795 17,795 6,000 (6,000)2061-80400 Art for Public Facilities Fund 263,370 10,930 (252,440) 263,370 (3,300) 266,670 2061-80500 Arts Council Private Donations 40 40 2062-80100 Survey and Planning - Rstrctd. Fund 4,800 20,452 15,652 4,800 6,915 (2,115)2062-80300 Historic Preservation Easement Fund 20,633 280,871 260,238 20,633 75,608 (54,975)2062-80500 Historic Preservation Revolving Fund 200,000 663,430 463,430 200,000 200,000 2062-80600 His. Prsrvtn. Rev. Fund - Int. Revenue 99,530 47,537 (51,993) 99,530 37,420 62,110 2070-80100 Forfeited Prop. Retained - State Pol. 119,563 186,366 66,803 119,563 140,940 (21,377)2070-80400 Forfeited Property - Gambling 36,500 71,981 35,481 36,500 30,465 6,035 2070-80900 Cmprhnsv. Crime Ctrl. Act - Fed. Reg. 585,774 765,117 179,343 585,774 592,477 (6,703)2070-81000 Forfeiture of Motor Vehicles 7,440 7,440 7,440 (7,440)2085-80100 E-911 Telephone System Division 353,283 353,283 353,283 (353,283)2086-80100 Seized and Forfeited Property -
Federal Distribution 3,612 3,612 2088-80100 Non-State Fund for Title III Program 100,610 47,076 (53,534) 100,610 47,076 53,534 2088-80200 Indirect Cost Recovery 3,000 95,691 92,691 3,000 3 2,997 2111-80400 Historical Records Trust Fund 181,502 672,274 490,772 181,502 141,813 39,689 2211-80800 Consumer Protection/Education 37,971 37,971 37,971 (37,971)2230-80100 Forfeiture of Property 161,455 155,685 (5,770) 161,455 139,320 22,135 2230-80500 Gambling Forfeitures 8,700 22,977 14,277 8,700 13,204 (4,504)2230-80600 Federal Forfeitures 9 9 2250-80900 Public Utilities 390,633 377,875 (12,758) 390,633 377,875 12,758
Continued
Revenues and Other Financing Sources
Account Title
Expenditures and Other Financing Uses
- 91 -

STATE OF RHODE ISLAND AND PROVIDENCE PLANTATIONS
STATEMENT OF GENERAL FUND RESTRICTED REVENUES, EXPENDITURES, AND OTHER FINANCINGSOURCES AND USES - BUDGET AND ACTUAL (Continued)
For the Fiscal Year Ended June 30, 2001
AccountNumber Budget Actual Variance Budget Actual Variance
2250-81100 Consumer Education - NAAG 197,649 197,649 2250-81200 Attorney General 1,469 1,469 2310-80100 Forfeited Property Fund 6,575 6,575 6,575 (6,575)2310-80300 Violent Crimes Compensation 1,676,096 1,577,064 (99,032) 1,676,096 1,577,064 99,032 2310-81100 Childhood Disease Victims Fund 11,098 28,096 16,998 11,098 11,098 2330-80300 RI Rfndng. Bond Auth. - Admin. 1,164 1,164 2340-80400 Unclaimed Property Program 9,346,519 5,080,845 (4,265,674) 9,346,519 5,080,845 4,265,674 2410-80100 Proceed From Lease/Sale of
Property To RIPBA 487,608 487,608 487,608 487,608 2450-80200 Depco Escrow Account 1,261,689 1,261,689 1,261,689 (1,261,689)2450-80400 Indirect Cost Recovery - Child
Support Enforcement 100,000 (100,000) 100,000 100,000 2457-80100 Vehicle Value Comm. - Municipal 15,838 30,043 14,205 15,838 14,428 1,410 2459-80100 Job Development 207,498 205,162 (2,336) 207,498 205,162 2,336 2460-80100 NE Rgnl. Indstrl. Tchnlgy. Collaborative 306 306 2460-81410 Exxon Oil Overcharge Interest Earnings 729,721 729,721 151,325 (151,325)2460-83410 Stripper Well Oil Ovchrg. Int. Earnings 1,311,278 1,649,216 337,938 1,311,278 861,278 450,000 2460-83510 Diamond Shamrock Ovch. Int. Earngs. 55,852 59,777 3,925 55,852 55,852 2460-83610 Coline Gas and National Helium
Corp Oil Overcharge 16,674 17,800 1,126 16,674 16,674 2470-80100 Rgnl. Library for Blind and Hndcpd. 5,000 11,615 6,615 5,000 1,943 3,057 2470-80200 Summer Reading Program 5,617 (5,617) 5,617 5,617 2480-80100 Restoration and Replace - Ins. Cvrge. 565,269 1,106,766 541,497 565,269 214,815 350,454 2480-81000 RI Independent Insurance Grant 18,683 18,683 2484-81600 RIRBA - DLT - Job Development Fund 22,026 22,026 22,026 22,026 2484-82443 RIRBA - Workers Comp. Fraud Unit 26,184 26,196 12 26,184 26,196 (12)2485-80200 COPS - Center General-Furniture - WC 45,630 46,871 1,241 45,630 46,871 (1,241)2485-80500 COPS - DLT Building - WC 217,393 218,538 1,145 217,393 218,538 (1,145)2485-80700 COPS - DLT Building - Job Dev Fund 15,547 60,038 44,491 15,547 60,038 (44,491)2485-80800 COPS - Center General Furniture - JDF 14,212 14,212 14,212 (14,212)2485-80900 COPS - Pastore Center Telecomm - JDF 890 3,329 2,439 890 3,329 (2,439)2485-85000 COPS - Howard Center Tele. - WC 12,449 12,116 (333) 12,449 12,116 333 2486-80800 RICCA - Excess Debt Serv. Rntl. Pmt. 4,535,108 4,535,108 4,535,108 4,535,108 2626-80100 Audit of Federal Assistance Programs 728,215 2,040,848 1,312,633 728,215 985,749 (257,534)2630-80100 Martin Luther King Commission -
Grant and Scholarship 4,151 4,151 2710-80100 Advisory Committee on Women
and Minorities 8,500 8,500 1,663 (1,663)2710-80200 Examination of Racial and Ethnic
Bias in RI Courts 5,000 5,000 5,000 5,000 2710-80400 RI Supreme Crt. Disciplinary Counsel 680,275 1,048,340 368,065 680,275 681,418 (1,143)2710-80900 Victims Rights Information 50,000 51,352 1,352 50,000 50,000 2729-80100 Indirect Cost Recovery - Family Court 236,522 218,259 (18,263) 236,522 218,259 18,263 2735-80100 Open Society Institute (OSI) Grant 19,651 70,575 50,924 19,651 1,045 18,606 2750-80100 General Operations 4,258,296 4,259,590 1,294 4,258,296 4,259,590 (1,294)2750-80200 Retirement Benefits of
Commissioners and Judges 306,579 332,481 25,902 306,579 332,481 (25,902)2841-80300 Public Utilities Commission - General 3,578,687 3,803,452 224,765 3,578,687 3,001,598 577,089 2841-80400 Public Utilities Reserve Account 1,081,104 577,732 (503,372) 1,081,104 576,857 504,247
Expenditures and Other Financing UsesRevenues and Other Financing Sources
Account Title
- 92 -

STATE OF RHODE ISLAND AND PROVIDENCE PLANTATIONS
AccountNumber Budget Actual Variance Budget Actual Variance
2841-80600 Energy Facility Siting Fund 125,000 61,604 (63,396) 125,000 61,604 63,396 2899-80100 RI Foundation 1 1 3330-80100 Trainees Benefits - RI Training School 8,000 5,061 (2,939) 8,000 1,521 6,479 3340-80200 Social Security Income 1,257,407 1,619,711 362,304 1,257,407 1,539,161 (281,754)
82,638,678$ 107,721,588 25,082,910$ 82,638,678$ 73,200,547$ 9,438,131$
Less: Actual Expenditures And Other Uses (73,200,547)
Restricted Revenue Appropriations Carried Forward to Fiscal Year 2002 34,521,041$
Concluded
Revenues and Other Financing Sources Expenditures and Other Financing Uses
Account Title
- 93 -

STATE OF RHODE ISLAND AND PROVIDENCE PLANTATIONS
STATEMENT OF GENERAL FUND OPERATING TRANSFERS IN, EXPENDITURES, AND OTHER FINANCINGSOURCES AND USES - BUDGET AND ACTUAL
For the Fiscal Year Ended June 30, 2001
AccountNumber Budget Actual Variance Budget Actual Variance
1032-90200 RICAP - Howard Center Utility $ 288,000 $ 288,000 $ $ 288,000 $ 46,470 241,530$
1032-90300 RICAP - Medical Center Rehabilitation 333,520 333,520 333,520 243,052 90,468
1032-90400 RICAP - Water Tanks and Pipes 21,000 21,000 21,000 9,675 11,325
1032-90600 RICAP - Environmental Mandates 20,000 20,000 20,000 20,000
1032-90900 RICAP - Central Power Plant Rehabilitation 360,000 360,000 360,000 360,000
1074-90100 RICAP - Debt Service - Zambarano 145,000 145,000 145,000 104,354 40,646
1080-90100 RICAP - Asset Protection 109,426 109,426 109,426 69,930 39,496
1104-90100 Trauma Registry 204,623 116,854 (87,769) 204,623 116,854 87,769
1230-90100 RICAP - Forand Building Exterior Shell 20,000 20,000 20,000 4,803 15,197
1230-90300 RICAP - Forand Building Steam Chiller (1,537) (1,537) (1,537) 1,537
1370-90300 RICAP - Perimeter & Security Upgrades 573,391 1,351,298 777,907 573,391 1,351,298 (777,907)
1370-90400 RICAP - Fire Code Safety Improvements 891,852 891,852 891,852 217,836 674,016
1370-90500 RICAP - High Security - Fire Alarm/HVAC 381,271 381,271 381,271 353,264 28,007
1370-90600 RICAP - DOC Capital Project 556,000 556,000 556,000 556,000
1370-90700 RICAP - Smoke Evacuation System - Max 83,180 83,180 83,180 63,744 19,436
1370-90800 RICAP - Roof Replacement - Max 809,350 809,350 809,350 40,470 768,880
1370-90900 RICAP - Window Replacement - DIX and GM 365,230 365,230 365,230 18,998 346,232
1370-91000 RICAP - Dix Expansion - Phase II 589,000 589,000 589,000 589,000
1370-91100 RICAP - D-Building State Match 405,850 405,850 405,850 234,579 171,271
1370-91300 RICAP - Maximum - General Renovations 131,700 131,700 131,700 54,627 77,073
1370-91500 RICAP - Dix Expansion - State Match 44,660 44,660 44,660 1,482 43,178
1430-90300 JPTA - NRI - Hearing 10,179 10,179
1440-90100 RICAP - Woonsocket Vocational HVAC 297,079 297,079 297,079 286,919 10,160
1440-90200 RICAP - Chariho Vctnl - Roof/Window 27,889 27,889 27,889 26,603 1,286
1440-90300 RICAP - Hazardous Materials Storage/Dust 181,547 181,547 181,547 181,547
1440-90400 RICAP - East Prov. Vocational - HVAC 59,020 59,020 59,020 49,420 9,600
1440-90500 RICAP - School for the Deaf - Phys Ed 31,750 31,750 31,750 18,281 13,469
1440-90700 RICAP - Hanley HVAC System 205,000 205,000 205,000 113,383 91,617
1440-90800 RICAP - State Facilities Fire Alarms 57,150 57,150 57,150 18,376 38,774
1710-90100 RICAP - Allendale Dam 41,680 41,680 41,680 41,680
1725-90100 DOT Recreational Projects 220,000 175,962 (44,038) 220,000 175,962 44,038
1725-90400 Final Design Blackstone River Bike Facility 1,106,277 821,278 (284,999) 1,106,277 821,278 284,999
1731-91200 RICAP - Misquamicut Beach 29,074 29,074 29,074 29,074
1731-91300 RICAP - Recreational Facilities Improvements 149,208 149,208 149,208 135,319 13,889
1731-91400 RICAP - Brenton Point 30,000 30,000 30,000 30,000
1731-91500 RICAP - Westerly Boat Ramp 187 187 187 187
1732-91200 RICAP - Fish and Wildlife Office/Lab 1,500,000 1,500,000 1,500,000 1,401,635 98,365
1736-91200 RICAP - Pier Upgrades 1,390,455 1,390,455 1,390,455 1,030,484 359,971
1736-91300 RICAP - Newport Pier Upgrades 1,690,476 2,083,786 393,310 1,690,476 2,083,786 (393,310)
1751-91600 Aquafund 52,966 (52,966) 52,966 52,966
1760-90900 RICAP - Dam Repair 955,411 955,411 955,411 358,226 597,185
2062-90100 RICAP - Eisenhower House Roof and Chimney 127,900 127,900 127,900 127,900
2062-90200 RICAP - Eisenhower House - Exterior Painting 20,000 20,000 20,000 20,000
2070-90200 RICAP - Headquarters Repairs/Renovation 29,565 29,565 29,565 24,212 5,353
2070-90500 Traffic Enforcement 176,728 176,728 176,728 (176,728)
2070-90501 Traffic Enforcement - Municipal Training 249,698 (249,698) 249,698 249,698
2070-90600 Lottery Commission Assistance 100,494 97,998 (2,496) 100,494 97,998 2,496
2070-90700 Road Construction Detail Reimbursements 2,292,484 1,998,488 (293,996) 2,292,484 1,998,488 293,996
2086-90100 Rails To Trails - Military Staff 300,000 148,497 (151,503) 300,000 146,134 153,866
2089-90300 RICAP - Bristol Armory Rehabilitation 40,000 54,854 14,854 40,000 54,854 (14,854)
2089-90400 RICAP - Benefit St Armory Rehabilitation 15,780 15,780 15,780 11,994 3,786
2360-90100 Retirement - Administration 11,119,206 9,162,085 (1,957,121) 11,119,206 9,162,085 1,957,121
2360-90101 Retirement - Investment Operations 528,997 492,149 (36,848) 528,997 492,149 36,848
2454-90100 Motor Fuel Tax Evasion Program 91,013 73,653 (17,360) 91,013 73,653 17,360
Operating Transfers In and Other Financing Sources Expenditures and Other Financing Uses
Account Title
- 94 -

STATE OF RHODE ISLAND AND PROVIDENCE PLANTATIONS
STATEMENT OF GENERAL FUND OPERATING TRANSFERS IN, EXPENDITURES, AND OTHER FINANCINGSOURCES AND USES - BUDGET AND ACTUAL
For the Fiscal Year Ended June 30, 2001
AccountNumber Budget Actual Variance Budget Actual Variance
2456-90100 Auto Emissions Program - CMAQ 172,064 161,120 (10,944) 172,064 161,120 10,944
2459-90200 Employer Tax - Temporary Disability Insurance 567,265 560,796 (6,469) 567,265 560,796 6,469
2462-90100 Lighting Conservation 661,278 266,204 (395,074) 661,278 266,204 395,074
2472-90100 FHWA Planning - Systems Planning 763,994 690,908 (73,086) 763,994 690,908 73,086
2472-90200 FHWA - T2 - Systems Planning 103,550 89,386 (14,164) 103,550 89,386 14,164
2472-90300 Air Quality Modeling 20,283 (20,283) 20,283 20,283
2480-90200 Debt Service Special Account 10,332,340 10,332,340 10,282,625 (10,282,625)
2480-90600 RICAP - State House Renovations - Phase I 495,000 495,000 495,000 495,000
2480-90700 RICAP - State House Skylights 1,513,209 1,513,209 1,513,209 1,513,209
2480-90800 RICAP - State House Terrace Walls/South Stairs 1,036,804 1,608,042 571,238 1,036,804 1,608,042 (571,238)
2480-91000 RICAP - Chapin Health Laboratory 358,843 358,843 358,843 243,216 115,627
2480-91100 RICAP - Cranston Street Armory 358,251 358,251 358,251 263,064 95,187
2480-91300 RICAP - Underground Strg. Tank Rmdtn. 81,717 81,717 81,717 81,717
2480-91400 RICAP - Cannon Building 397,852 397,852 397,852 159,993 237,859
2480-91600 RICAP - House & Senate Chmbs Rnvtns 325,012 325,012 325,012 115,249 209,763
2480-91700 RICAP - State House Elevator 418,000 418,000 418,000 391,525 26,475
2480-91800 RICAP - Ladd Center 2,474,368 2,474,368 2,474,368 1,000,322 1,474,046
2480-92200 RICAP - Old State House 40,000 40,000 40,000 40,000
2480-92300 RICAP - State Office Building 22,517 22,517 22,517 12,120 10,397
2480-92400 RICAP - Veterans Office Building 75,000 75,000 75,000 1,796 73,204
2480-92500 RICAP - Information Operatins Center 75,000 75,000 75,000 67,982 7,018
2480-92600 RICAP - Old Colony House 98,000 98,000 98,000 98,000
2480-92700 RICAP - Court Buildings - HVAC 314,301 314,301 314,301 156,380 157,921
2480-92900 RICAP - Washington Cty Government Center 50,000 50,000 50,000 50,000
2480-93100 RICAP - State House Renovations - Phase II 17,336 17,336 17,336 8,688 8,648
2480-93600 RICAP - Environmental Compliance 900,000 900,000 900,000 882,205 17,795
2480-93700 RICAP - Fox Point Hurricane Barrier 266,409 266,409 266,409 266,409
2483-91702 RICAP - DEM Debt Service NBA 655,402 655,402 655,402 655,402
2483-91751 RICAP - DEM Debt Service WWT 6,697,391 6,697,391 6,697,391 6,697,391
2483-95310 RIPTA Debt Service 647,222 647,222 647,222 647,222
2483-95332 Transportation Debt Service 42,167,763 41,980,903 (186,860) 42,167,763 41,980,903 186,860
2484-95902 RIRBA - DLT Temporary Disability Insurance 60,222 60,222 60,222 60,222
2485-90200 COPS - DLT Building - Other 359,451 382,842 23,391 359,451 382,842 (23,391)
2485-90300 COPS - Center General - Furniture - TDI 2,163 (2,163) 2,163 2,163
2485-90400 COPS - Pastore Center Telecomm - TDI 20,584 21,226 642 20,584 21,226 (642)
2486-91100 Debt - URI Education and General 795,168 826,781 31,613 795,168 826,781 (31,613)
2486-91400 Debt - URI Housing Loan Funds 1,695,473 1,694,569 (904) 1,695,473 1,694,569 904
2486-91420 Debt - URI Dining Services 236,898 237,993 1,095 236,898 237,993 (1,095)
2486-91425 Debt - URI Health Services 112,035 112,553 518 112,035 112,553 (518)
2486-91427 Debt - W Alton Jones Services 99,207 99,665 458 99,207 99,665 (458)
2486-91432 Debt - URI Memorial Union 87,234 87,636 402 87,234 87,636 (402)
2486-91501 Debt - URI Sponsored Research Ind Cost 102,758 102,551 (207) 102,758 102,551 207
2486-95100 Debt - RIC Education and General 266,458 265,693 (765) 266,458 265,693 765
2486-95400 Debt - RIC Housing 522,185 521,358 (827) 522,185 521,358 827
2486-95401 Debt - RIC Student Center and Dining 158,973 158,669 (304) 158,973 158,669 304
2486-95404 Debt - RIC Student Union 36,550 85,588 49,038 36,550 85,588 (49,038)
2486-97402 Debt - CCRI Bookstore 179,768 179,768 179,768 179,768
2710-90100 RICAP - Kent County Court House 218,805 218,805 218,805 218,305 500
2710-90200 RICAP - Garrahy Judicial Complex Renovation 940,000 940,000 940,000 940,000
2710-90201 RICAP - Garrahy Complex - Roof Repair 350,000 350,000 350,000 27,370 322,630
2710-90400 RICAP - Licht Exterior/Interior Refurbishment 337,774 337,774 337,774 208,035 129,739
2710-90500 RICAP - Murray Interior Refurbishment 75,000 75,000 75,000 74,519 481
2710-90700 RICAP - McGrath Exterior Refurbishment 140,000 140,000 140,000 140,000
Continued
Expenditures and Other Financing Uses
Account Title
Operating Transfers In and Other Financing Sources
- 95 -

STATE OF RHODE ISLAND AND PROVIDENCE PLANTATIONS
STATEMENT OF GENERAL FUND OPERATING TRANSFERS IN, EXPENDITURES, AND OTHER FINANCINGSOURCES AND USES - BUDGET AND ACTUAL
For the Fiscal Year Ended June 30, 2001
AccountNumber Budget Actual Variance Budget Actual Variance
2820-90200 RINSC - Building Repairs 20,000 20,000 20,000 20,000
2820-90300 North Bunker Roof Replacement 33,600 33,600 33,600 33,600
2820-95511 URI Sponsored Research 124,071 124,090 19 124,071 124,090 (19)
2835-90100 RICAP - Big River Management Area 86,363 89,958 3,595 86,363 89,958 (3,595)
2835-90200 RICAP - BRMA Water Survey 112,261 112,261 112,261 112,261
2835-90300 RICAP - Water Allocation Plan 462,981 464,867 1,886 462,981 464,867 (1,886)
2835-90700 RICAP - Groundwater Prot/Acqu Program 86,267 86,267 86,267 83,334 2,933
3260-90100 Almacs - Dislocated Workers 3,583 3,583
3260-90800 JTPA Title Il 1,467 1,467
3260-91500 Gas Tax 4,700,000 5,017,615 317,615 4,700,000 4,771,805 (71,805)
3350-90100 Spurwink/RI 16,077 16,077 16,077 (16,077)
103,469,439$ 112,305,013 8,835,574$ 103,469,439$ 100,608,574$ 2,860,865$
Less: Actual Expenditures And Other Uses (100,608,574)
Operating Transfers Carried Forward
To Fiscal Year 2002 11,696,439$
Concluded
Operating Transfers In and Other Financing Sources Expenditures and Other Financing Uses
Account Title
- 96 -

STATE OF RHODE ISLAND AND PROVIDENCE PLANTATIONSSTATEMENT OF GENERAL FUND FEDERAL REVENUES, EXPENDITURES, AND OTHER FINANCING SOURCES AND USES - BUDGET AND ACTUAL
For the Fiscal Year Ended June 30, 2001
CFDA Number Department/Program Budget Actual Variance Budget Actual Variance
MENTAL HEALTH, RETARDATION AND HOSPITALS
16.727 Enforcing Underage Drinking Laws Program $ 485,948 457,346$ (28,602)$ $ 485,948 457,346$ 28,602$ 84.126 Rehabilitation Services -Vocational
Rehabilitation Grants to States 646,323 378,410 (267,913) 646,323 378,410 267,913 84.186 Safe and Drug-Free Schools and
Communities - State Grants 470,345 423,949 (46,396) 470,345 423,949 46,396 93.150 Projects for Assistance in Transition
from Homelessness (PATH) 298,295 298,295 298,295 (298,295) 93.230 Consolidated Knowledge Development
and Application Program 625,000 557,395 (67,605) 625,000 557,395 67,605 93.238 Cooperative Agreements for State Treatment
Outcomes and Performance PilotStudies Enhancement 342,052 219,773 (122,279) 342,052 219,773 122,279
93.242 Mental Health Research Grants 99,000 78,404 (20,596) 99,000 78,404 20,596 93.278 Drug Abuse National Research Service
Awards for Research Training 35,035 11,078 (23,957) 35,035 11,078 23,957 93.778 Medical Assistance Program 186,310,303 172,811,510 (13,498,793) 186,310,303 172,811,510 13,498,793 93.958 Block Grants for Community Mental
Health Services 1,483,793 1,277,554 (206,239) 1,483,793 1,277,554 206,239 93.959 Block Grants for Prevention and Treatment
of Substance Abuse 6,184,694 5,845,359 (339,335) 6,184,694 5,845,359 339,335
HEALTH
10.557 Special Supplemental Nutrition Program forWomen, Infants, and Children 16,830,070 16,689,734 (140,336) 16,830,070 16,689,734 140,336
14.401 Fair Housing Assistance Program - State and Local (801) (801) (801) 801
16.560 National Institute of Justice Research, Evaluation, and Development Project Grants 25,000 (16,510) (41,510) 25,000 (16,510) 41,510
16.598 State Identification Systems Grant Program 176,353 149,828 (26,525) 176,353 149,828 26,525 17.005 Compensation and Working Conditions 11,613 13,177 1,564 11,613 13,177 (1,564) 66.001 Air Pollution Control Program Support 623,461 631,332 7,871 623,461 631,332 (7,871) 66.032 State Indoor Radon Grants 87,136 76,710 (10,426) 87,136 76,710 10,426 66.432 State Public Water System Supervision 440,255 306,713 (133,542) 440,255 306,713 133,542 66.600 Environmental Protection Consolidated
Grants - Program Support 97,807 94,407 (3,400) 97,807 94,407 3,400 66.606 Surveys, Studies, Investigations and
Special Purpose Grants 134,580 86,487 (48,093) 134,580 86,487 48,093 66.707 TSCA Title IV State Lead Grants -Certification
of Lead-Based Paint Professionals 336,701 370,950 34,249 336,701 370,950 (34,249) 84.181 Special Education - Grants for Infants and
Families With Disabilities 1,991,882 2,082,436 90,554 1,991,882 2,082,436 (90,554) 93.006 State and Territorial and Technical Assistance
Capacity Development Minority HIV/AIDSDemonstration Program 149,507 158,260 8,753 149,507 158,260 (8,753)
93.103 Food and Drug Administration - Research 5,000 1,075 (3,925) 5,000 1,075 3,925 93.110 Maternal and Child Health Federal
Consolidated Programs 254,206 137,547 (116,659) 254,206 137,547 116,659 93.116 Project Grants and Cooperative Agreements for
Tuberculosis Control Programs 478,967 422,349 (56,618) 478,967 422,349 56,618 93.118 Acquired Immunodeficiency Syndrome
(AIDS) Activity 425,614 283,290 (142,324) 425,614 283,290 142,324 93.127 Emergency Medical Services for Children 123,000 103,658 (19,342) 123,000 103,658 19,342 93.130 Primary Care Services-Resource Coordination
and Development Primary Care Offices 226,587 220,124 (6,463) 226,587 220,124 6,463 93.136 Injury Prevention and Control Research and
State and Community Based Programs 346,684 293,279 (53,405) 346,684 293,279 53,405 93.161 Health Program for Toxic Substances
and Disease Registry 26,250 24,521 (1,729) 26,250 24,521 1,729 93.165 Grants for State Loan Repayment 110,000 129,384 19,384 110,000 129,384 (19,384) 93.184 Disabilities Prevention 428,053 327,918 (100,135) 428,053 327,918 100,135
Continued
Revenues and Other Financing Sources Expenditures and Other Financing Uses
- 97 -
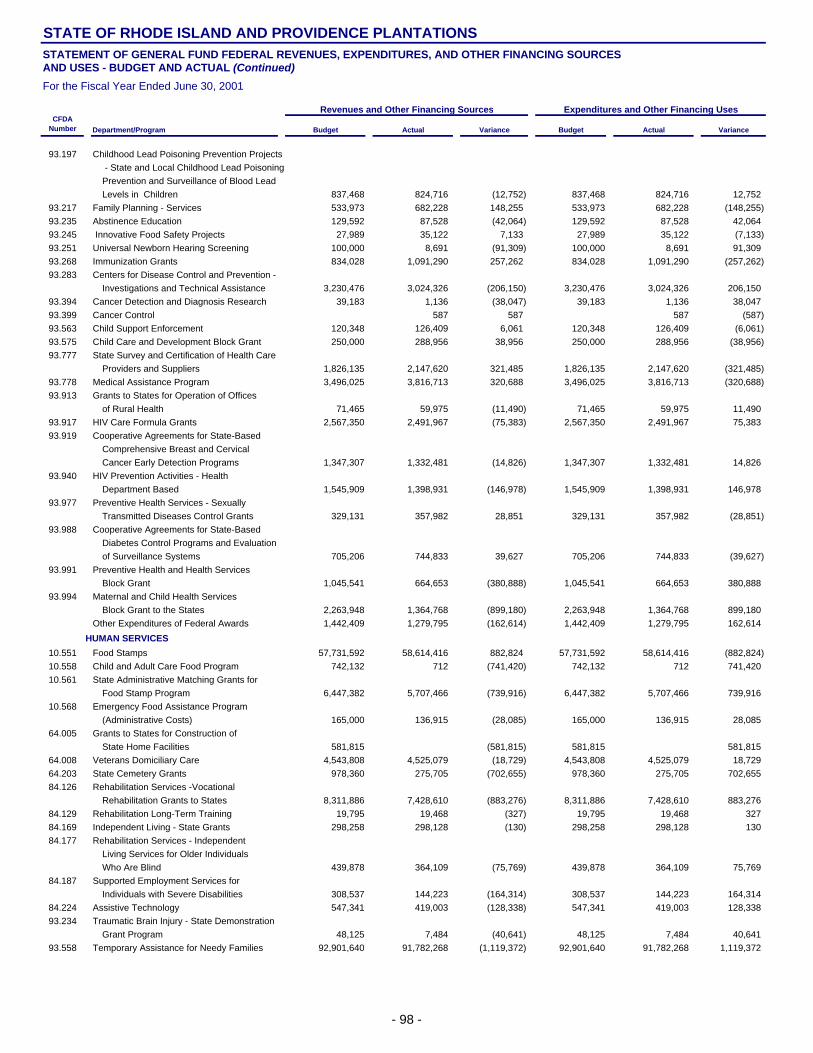
STATE OF RHODE ISLAND AND PROVIDENCE PLANTATIONSSTATEMENT OF GENERAL FUND FEDERAL REVENUES, EXPENDITURES, AND OTHER FINANCING SOURCES AND USES - BUDGET AND ACTUAL (Continued)
For the Fiscal Year Ended June 30, 2001
CFDA Number Department/Program Budget Actual Variance Budget Actual Variance
93.197 Childhood Lead Poisoning Prevention Projects - State and Local Childhood Lead PoisoningPrevention and Surveillance of Blood LeadLevels in Children 837,468 824,716 (12,752) 837,468 824,716 12,752
93.217 Family Planning - Services 533,973 682,228 148,255 533,973 682,228 (148,255) 93.235 Abstinence Education 129,592 87,528 (42,064) 129,592 87,528 42,064 93.245 Innovative Food Safety Projects 27,989 35,122 7,133 27,989 35,122 (7,133) 93.251 Universal Newborn Hearing Screening 100,000 8,691 (91,309) 100,000 8,691 91,309 93.268 Immunization Grants 834,028 1,091,290 257,262 834,028 1,091,290 (257,262) 93.283 Centers for Disease Control and Prevention -
Investigations and Technical Assistance 3,230,476 3,024,326 (206,150) 3,230,476 3,024,326 206,150 93.394 Cancer Detection and Diagnosis Research 39,183 1,136 (38,047) 39,183 1,136 38,047 93.399 Cancer Control 587 587 587 (587) 93.563 Child Support Enforcement 120,348 126,409 6,061 120,348 126,409 (6,061) 93.575 Child Care and Development Block Grant 250,000 288,956 38,956 250,000 288,956 (38,956) 93.777 State Survey and Certification of Health Care
Providers and Suppliers 1,826,135 2,147,620 321,485 1,826,135 2,147,620 (321,485) 93.778 Medical Assistance Program 3,496,025 3,816,713 320,688 3,496,025 3,816,713 (320,688) 93.913 Grants to States for Operation of Offices
of Rural Health 71,465 59,975 (11,490) 71,465 59,975 11,490 93.917 HIV Care Formula Grants 2,567,350 2,491,967 (75,383) 2,567,350 2,491,967 75,383 93.919 Cooperative Agreements for State-Based
Comprehensive Breast and CervicalCancer Early Detection Programs 1,347,307 1,332,481 (14,826) 1,347,307 1,332,481 14,826
93.940 HIV Prevention Activities - HealthDepartment Based 1,545,909 1,398,931 (146,978) 1,545,909 1,398,931 146,978
93.977 Preventive Health Services - SexuallyTransmitted Diseases Control Grants 329,131 357,982 28,851 329,131 357,982 (28,851)
93.988 Cooperative Agreements for State-BasedDiabetes Control Programs and Evaluationof Surveillance Systems 705,206 744,833 39,627 705,206 744,833 (39,627)
93.991 Preventive Health and Health ServicesBlock Grant 1,045,541 664,653 (380,888) 1,045,541 664,653 380,888
93.994 Maternal and Child Health ServicesBlock Grant to the States 2,263,948 1,364,768 (899,180) 2,263,948 1,364,768 899,180
Other Expenditures of Federal Awards 1,442,409 1,279,795 (162,614) 1,442,409 1,279,795 162,614
HUMAN SERVICES
10.551 Food Stamps 57,731,592 58,614,416 882,824 57,731,592 58,614,416 (882,824) 10.558 Child and Adult Care Food Program 742,132 712 (741,420) 742,132 712 741,420 10.561 State Administrative Matching Grants for
Food Stamp Program 6,447,382 5,707,466 (739,916) 6,447,382 5,707,466 739,916 10.568 Emergency Food Assistance Program
(Administrative Costs) 165,000 136,915 (28,085) 165,000 136,915 28,085 64.005 Grants to States for Construction of
State Home Facilities 581,815 (581,815) 581,815 581,815 64.008 Veterans Domiciliary Care 4,543,808 4,525,079 (18,729) 4,543,808 4,525,079 18,729 64.203 State Cemetery Grants 978,360 275,705 (702,655) 978,360 275,705 702,655 84.126 Rehabilitation Services -Vocational
Rehabilitation Grants to States 8,311,886 7,428,610 (883,276) 8,311,886 7,428,610 883,276 84.129 Rehabilitation Long-Term Training 19,795 19,468 (327) 19,795 19,468 327 84.169 Independent Living - State Grants 298,258 298,128 (130) 298,258 298,128 130 84.177 Rehabilitation Services - Independent
Living Services for Older IndividualsWho Are Blind 439,878 364,109 (75,769) 439,878 364,109 75,769
84.187 Supported Employment Services forIndividuals with Severe Disabilities 308,537 144,223 (164,314) 308,537 144,223 164,314
84.224 Assistive Technology 547,341 419,003 (128,338) 547,341 419,003 128,338 93.234 Traumatic Brain Injury - State Demonstration
Grant Program 48,125 7,484 (40,641) 48,125 7,484 40,641 93.558 Temporary Assistance for Needy Families 92,901,640 91,782,268 (1,119,372) 92,901,640 91,782,268 1,119,372
Revenues and Other Financing Sources Expenditures and Other Financing Uses
- 98 -

CFDA Number Budget Actual Variance Budget Actual Variance
93.566 Refugee and Entrant Assistance -State Administered Programs 512,862 417,616 (95,246) 512,862 417,616 95,246
93.569 Community Services Block Grant 3,317,004 3,118,999 (198,005) 3,317,004 3,118,999 198,005 93.575 Child Care and Development Block Grant 4,276,796 2,892,753 (1,384,043) 4,276,796 2,892,753 1,384,043 93.585 Empowerment Zones Program 600,000 251,080 (348,920) 600,000 251,080 348,920 93.596 Child Care Mandatory and Matching Funds
of the Child Care and Development Fund 11,063,273 11,063,273 11,063,273 11,063,273 93.600 Head Start 178,000 105,239 (72,761) 178,000 105,239 72,761 93.667 Social Services Block Grant 9,607,843 9,491,947 (115,896) 9,607,843 9,491,947 115,896 93.671 Family Violence Prevention and Services -
Grants for Battered Women's Shelters -Grants to States and Indian Tribes 535,000 693,927 158,927 535,000 693,927 (158,927)
93.767 State Children's Insurance Program 5,471,631 15,058,000 9,586,369 5,471,631 15,058,000 (9,586,369) 93.778 Medical Assistance Program 481,065,643 466,283,544 (14,782,099) 481,065,643 466,283,544 14,782,099 96.001 Social Security - Disability Insurance 6,811,992 5,895,744 (916,248) 6,811,992 5,895,744 916,248
Other Expenditures of Federal Awards 86,527 4,256 (82,271) 86,527 4,256 82,271
CORRECTIONS
16.575 Crime Victim Assistance 170,011 141,787 (28,224) 170,011 141,787 28,224 16.579 Byrne Formula Grant Program 630,289 276,398 (353,891) 630,289 276,398 353,891 16.585 Drug Court Discretionary Grant Program 1,623,994 299,670 (1,324,324) 1,623,994 299,670 1,324,324 16.590 Grants to Encourage Arrest Policies and
Enforcement of Protection Orders 219,584 176,583 (43,001) 219,584 176,583 43,001 16.606 State Criminal Alien Assistance Program 1,649,030 1,646,427 (2,603) 1,649,030 1,646,427 2,603
84.013 Title I Program for Neglectedand Delinquent Children 257,031 125,642 (131,389) 257,031 125,642 131,389
84.027 Special Education - Grants to States 58,303 80,476 22,173 58,303 80,476 (22,173) 84.048 Vocational Education - Basic Grants
to States 3,900 27,900 24,000 3,900 27,900 (24,000) 84.331 Grants to States for Incarcerated
Youth Offenders 64,695 14,664 (50,031) 64,695 14,664 50,031 93.118 Acquired Immunodeficiency Syndrome
(AIDS) Activity 175,820 130,387 (45,433) 175,820 130,387 45,433 93.977 Preventive Health Services - Sexually
Transmitted Diseases Control Grants 30,994 15,986 (15,008) 30,994 15,986 15,008
ELEMENTARY AND SECONDARY EDUCATION
10.553 School Breakfast Program 4,564,030 3,264,506 (1,299,524) 4,564,030 3,264,506 1,299,524 10.555 National School Lunch Program 18,556,880 15,794,767 (2,762,113) 18,556,880 15,794,767 2,762,113 10.556 Special Milk Program for Children 125,608 98,402 (27,206) 125,608 98,402 27,206 10.558 Child and Adult Care Food Program 6,387,593 4,882,810 (1,504,783) 6,387,593 4,882,810 1,504,783 10.559 Summer Food Service Program for Children 1,190,884 1,197,782 6,898 1,190,884 1,197,782 (6,898) 10.560 State Administrative Expenses for
Child Nutrition 574,492 481,662 (92,830) 574,492 481,662 92,830 10.564 Nutrition Education and Training Program 30,000 (1,637) (31,637) 30,000 (1,637) 31,637 10.574 Team Nutrition Grants 269,749 203,206 (66,543) 269,749 203,206 66,543 84.002 Adult Education - State Grant Program 1,959,906 1,938,181 (21,725) 1,959,906 1,938,181 21,725 84.010 Title I Grants to Local Educational Agencies 25,500,485 23,186,897 (2,313,588) 25,500,485 23,186,897 2,313,588 84.011 Migrant Education - Basic State
Grant Program 109,582 73,026 (36,556) 109,582 73,026 36,556 84.013 Title I Program for Neglected
and Delinquent Children 4,000 5,278 1,278 4,000 5,278 (1,278) 84.027 Special Education - Grants to States 20,981,733 18,443,734 (2,537,999) 20,981,733 18,443,734 2,537,999 84.048 Vocational Education - Basic Grants
to States 6,336,023 5,603,232 (732,791) 6,336,023 5,603,232 732,791 84.126 Rehabilitation Services -Vocational
Rehabilitation Grants to States 421,342 420,967 (375) 421,342 420,967 375 84.158 Secondary Education and Transitional
Services for Youth with Disabilities 735,649 618,251 (117,398) 735,649 618,251 117,398 84.162 Immigrant Education 1,337,465 836,849 (500,616) 1,337,465 836,849 500,616
Continued
STATE OF RHODE ISLAND AND PROVIDENCE PLANTATIONS
Revenues and Other Financing Sources Expenditures and Other Financing Uses
Department/Program
- 99 -

STATE OF RHODE ISLAND AND PROVIDENCE PLANTATIONSSTATEMENT OF GENERAL FUND FEDERAL REVENUES, EXPENDITURES, AND OTHER FINANCING SOURCES AND USES - BUDGET AND ACTUAL (Continued)
For the Fiscal Year Ended June 30, 2001
CFDA Number Department/Program Budget Actual Variance Budget Actual Variance
84.173 Special Education - Preschool Grants 1,845,842 1,785,752 (60,090) 1,845,842 1,785,752 60,090 84.181 Special Education - Grants for Infants
and Families with Disabilities 61,884 65,275 3,391 61,884 65,275 (3,391) 84.185 Byrd Honors Scholarships 151,000 145,500 (5,500) 151,000 145,500 5,500 84.186 Safe and Drug-Free Schools and
Communities - State Grants 1,865,863 1,766,353 (99,510) 1,865,863 1,766,353 99,510 84.194 Bilingual Education Support Services 107,670 98,066 (9,604) 107,670 98,066 9,604 84.196 Education for Homeless Children and Youth 170,922 89,793 (81,129) 170,922 89,793 81,129 84.213 Even Start - State Educational Agencies 574,664 661,512 86,848 574,664 661,512 (86,848) 84.215 Fund for the Improvement of Education 372,563 173,233 (199,330) 372,563 173,233 199,330 84.216 Capital Expenses 520,000 43,297 (476,703) 520,000 43,297 476,703 84.243 Tech-Prep Education 672,798 416,502 (256,296) 672,798 416,502 256,296 84.276 Goals 2000 - State and Local Education
Systemic Improvement Grants 2,260,109 1,596,245 (663,864) 2,260,109 1,596,245 663,864 84.281 Eisenhower Professional Development
State Grants 1,453,660 1,325,137 (128,523) 1,453,660 1,325,137 128,523 84.282 Charter Schools 1,400,277 509,732 (890,545) 1,400,277 509,732 890,545 84.298 Innovative Education Program Strategies 1,972,630 1,692,689 (279,941) 1,972,630 1,692,689 279,941 84.318 Technology Literacy Challenge Fund Grants 2,751,232 2,078,784 (672,448) 2,751,232 2,078,784 672,448 84.330 Advanced Placement Incentive Program 10,000 3,712 (6,288) 10,000 3,712 6,288 84.332 Comprehensive School Reform
Demonstration (A) 980,932 429,519 (551,413) 980,932 429,519 551,413 84.336 Teacher Quality Enhancement Grants 1,327,815 863,850 (463,965) 1,327,815 863,850 463,965 84.338 Reading Excellence 2,000,000 668,106 (1,331,894) 2,000,000 668,106 1,331,894 84.340 Class Size Reduction 7,241,706 7,669,969 428,263 7,241,706 7,669,969 (428,263) 84.348 Title I Accountability Grants 350,000 (350,000) 350,000 350,000 93.239 Policy Research and Evaluation Grants 15,207 14,961 (246) 15,207 14,961 246 93.251 Universal Newborn Hearing Screening 90,000 82,557 (7,443) 90,000 82,557 7,443 93.283 Centers for Disease Control and Prevention -
Investigations and Technical Assistance 14,157 88 (14,069) 14,157 88 14,069 93.558 Temporary Assistance for Needy Families 963,250 759,660 (203,590) 963,250 759,660 203,590 93.575 Child Care and Development Block Grant 132,645 111,572 (21,073) 132,645 111,572 21,073 93.778 Medical Assistance Program 288,884 592,469 303,585 288,884 592,469 (303,585) 93.938 Cooperative Agreements to Support
Comprehensive School Health Programsto Prevent the Spread of HIV and OtherImportant Health Problems 762,209 619,782 (142,427) 762,209 619,782 142,427
93.994 Maternal and Child Health ServicesBlock Grant to the States 95,000 95,000 95,000 95,000
94.004 Learn and Serve America - School and Community Based Programs 67,623 14,826 (52,797) 67,623 14,826 52,797
Other Expenditures of Federal Awards 119,061 89,864 (29,197) 119,061 89,864 29,197
LABOR AND TRAINING
17.002 Labor Force Statistics 483,873 593,196 109,323 483,873 593,196 (109,323) 17.207 Employment Service 3,737,686 2,470,331 (1,267,355) 3,737,686 2,470,331 1,267,355 17.225 Unemployment Insurance 14,450,033 13,085,897 (1,364,136) 14,450,033 13,085,897 1,364,136 17.245 Trade Adjustment Assistance - Workers 7,904,172 8,114,055 209,883 7,904,172 8,114,055 (209,883) 17.246 Employment and Training Assistance -
Dislocated Workers 837,741 448,298 (389,443) 837,741 448,298 389,443 17.250 Job Training Partnership Act 621,326 19,728 (601,598) 621,326 19,728 601,598 17.253 Welfare-to-Work Grants to States
and Localities 5,043,358 2,089,008 (2,954,350) 5,043,358 2,089,008 2,954,350 17.255 Workforce Investment Act 9,089,700 5,923,721 (3,165,979) 9,089,700 5,923,721 3,165,979 17.801 Disabled Veterans' Outreach Program 382,227 317,684 (64,543) 382,227 317,684 64,543 17.804 Local Veterans' Employment
Representative Program 346,801 324,336 (22,465) 346,801 324,336 22,465 84.346 Occupational and Employment Information
State Grants 110,572 90,941 (19,631) 110,572 90,941 19,631 93.558 Temporary Assistance for Needy Families 1,910,925 1,805,042 (105,883) 1,910,925 1,805,042 105,883
Other Expenditures of Federal Awards 3,442,135 1,562,552 (1,879,583) 3,442,135 1,562,552 1,879,583
Revenues and Other Financing Sources Expenditures and Other Financing Uses
- 100 -

CFDA Number Budget Actual Variance Budget Actual Variance
ENVIRONMENTAL MANAGEMENT
10.156 Federal - State MarketingImprovement Program (49) (49) (49) 49
10.162 Inspection Grading and Standardization 68,088 36,299 (31,789) 68,088 36,299 31,789 10.664 Cooperative Forestry Assistance 3,179,011 827,521 (2,351,490) 3,179,011 827,521 2,351,490 11.307 Economic Adjustment Assistance 480,335 51 (480,284) 480,335 51 480,284 11.407 Interjurisdictional Fisheries Act of 1986 130,794 68,681 (62,113) 130,794 68,681 62,113 11.420 Coastal Zone Management Estuarine
Research Reserves 832,247 258,830 (573,417) 832,247 258,830 573,417 11.452 Unallied Industry Projects 67,433 (67,433) 67,433 67,433 11.454 Unallied Management Projects 145,379 34,402 (110,977) 145,379 34,402 110,977 11.473 Coastal Services Center 38,370 1,465 (36,905) 38,370 1,465 36,905 11.474 Atlantic Coastal Fisheries Cooperative
Management Act (B) 263,108 127,134 (135,974) 263,108 127,134 135,974 12.113 State Memorandum of Agreement Program
for the Reimbursment of Technical Services 150,880 134,819 (16,061) 150,880 134,819 16,061
15.605 Sport Fish Restoration 5,317,364 2,851,551 (2,465,813) 5,317,364 2,851,551 2,465,813 15.611 Wildlife Restoration 1,055,639 748,185 (307,454) 1,055,639 748,185 307,454 15.614 Coastal Wetlands Planning, Protection
and Restoration Act 722,261 423,880 (298,381) 722,261 423,880 298,381 15.616 Clean Vessel Act 200,200 43,267 (156,933) 200,200 43,267 156,933 15.916 Outdoor Recreation - Acquisition,
Development and Planning 450,000 184,080 (265,920) 450,000 184,080 265,920 20.005 Boating Safety Financial Assistance 448,292 453,006 4,714 448,292 453,006 (4,714) 20.205 Highway Planning and Construction 100,000 (113,991) (213,991) 100,000 (113,991) 213,991 66.001 Air Pollution Control Program Support 897,521 826,804 (70,717) 897,521 826,804 70,717 66.419 Water Pollution Control - State and
Interstate Program Support 1,453,620 724,799 (728,821) 1,453,620 724,799 728,821 66.433 State Underground Water Source Protection 44,271 118,869 74,598 44,271 118,869 (74,598) 66.456 National Estuary Program 468,128 184,844 (283,284) 468,128 184,844 283,284 66.460 Nonpoint Source Implementation Grants 1,660,319 1,074,151 (586,168) 1,660,319 1,074,151 586,168 66.461 Wetlands Grants 35,603 35,603 35,603 (35,603) 66.463 Water Quality Cooperative Agreements 369,277 461,099 91,822 369,277 461,099 (91,822) 66.467 Wastewater Operator Training Grant
Program (Technical Assistance) 35,000 4,798 (30,202) 35,000 4,798 30,202 66.606 Surveys, Studies, Investigations and
Special Purpose Grants 487,763 361,920 (125,843) 487,763 361,920 125,843 66.608 One Stop Reporting 250,000 (250,000) 250,000 250,000 66.651 Innovative Community Partnership 10,000 28,028 18,028 10,000 28,028 (18,028) 66.700 Consolidated Pesticide Enforcement
Cooperative Agreements 345,120 313,598 (31,522) 345,120 313,598 31,522 66.801 Hazardous Waste Management State
Program Support 812,017 223,455 (588,562) 812,017 223,455 588,562 66.802 Superfund State Site-Specific
Cooperative Agreements 1,291,017 582,072 (708,945) 1,291,017 582,072 708,945 66.804 State and Tribal Underground Storage
Tanks Program 79 79 79 (79) 66.805 Leaking Underground Storage Tank Trust
Fund Program 511,753 502,905 (8,848) 511,753 502,905 8,848 66.808 Solid Waste Management Assistance 16,508 4,043 (12,465) 16,508 4,043 12,465 66.810 CEPP Technical Assistance Grants
Program (B) 67,375 15 (67,360) 67,375 15 67,360 83.550 National Dam Safety Program 46,000 (46,000) 46,000 46,000 93.283 Centers for Disease Control and Prevention -
Investigations and Technical Assistance 37,094 62,049 24,955 37,094 62,049 (24,955) Other Expenditures of Federal Awards 51,456 (51,456) 51,456 51,456
OFFICE OF THE GOVERNOR
93.600 Head Start (44) (44) (44) 44
Continued
Department/Program
Revenues and Other Financing Sources Expenditures and Other Financing Uses
STATE OF RHODE ISLAND AND PROVIDENCE PLANTATIONS
- 101 -

STATE OF RHODE ISLAND AND PROVIDENCE PLANTATIONSSTATEMENT OF GENERAL FUND FEDERAL REVENUES, EXPENDITURES, AND OTHER FINANCING SOURCES AND USES - BUDGET AND ACTUAL (Continued)
For the Fiscal Year Ended June 30, 2001
CFDA Number Department/Program Budget Actual Variance Budget Actual Variance
RHODE ISLAND JUSTICE COMMISSION
16.523 Juvenile Accountability Incentive Block Grants 257,975 451,645 193,670 257,975 451,645 (193,670) 16.540 Juvenile Justice and Delinquency Prevention -
Allocation to States 933,622 785,618 (148,004) 933,622 785,618 148,004 16.544 Gang-Free Schools and Communities -
Community-Based Gang Intervention 76,000 50,256 (25,744) 76,000 50,256 25,744 16.550 State Justice Statistics Program for
Statistical Analysis Centers 120,711 90,328 (30,383) 120,711 90,328 30,383 16.575 Crime Victim Assistance 1,091,199 1,013,353 (77,846) 1,091,199 1,013,353 77,846 16.579 Byrne Formula Grant Program 1,194,668 1,232,854 38,186 1,194,668 1,232,854 (38,186) 16.588 Violence Against Women Formula Grants 1,151,516 1,178,874 27,358 1,151,516 1,178,874 (27,358)
GOVERNOR'S COMMISSION ON DISABILITIES
84.133 National Institute on Disability andRehabilitation Research 27,626 27,690 64 27,626 27,690 (64)
DEVELOPMENTAL DISABILITIES COUNCIL
93.630 Developmental Disabilities Basic Supportand Advocacy Grants 455,589 408,971 (46,618) 455,589 408,971 46,618
RHODE ISLAND COUNCIL ON THE ARTS
45.025 Promotion of The Arts - PartnershipAgreements 520,662 455,048 (65,614) 520,662 455,048 65,614
45.026 Promotion of the Arts - Leadership Initiatives 21,000 20,021 (979) 21,000 20,021 979 84.243 Tech-Prep Education (54) (54) (54) 54
HISTORICAL PRESERVATION AND HERITAGE COMMISSION
15.904 Historic Preservation Fund Grants-In-Aid 536,671 540,721 4,050 536,671 540,721 (4,050) 15.925 National Maritime Heritage Grants 2,234 13,234 11,000 2,234 13,234 (11,000)
STATE POLICE
16.001 Law Enforcement Assistance - Narcotics and Dangerous Drugs - Laboratory Analysis 28,165 25,000 (3,165) 28,165 25,000 3,165
16.579 Byrne Formula Grant Program 578,075 539,844 (38,231) 578,075 539,844 38,231 16.710 Public Safety Partnership and Community
Policing Grants 302,526 52,379 (250,147) 302,526 52,379 250,147 20.217 Motor Carrier Safety 713,347 578,893 (134,454) 713,347 578,893 134,454
MUNICIPAL POLICE TRAINING ACADEMY
16.555 National Sex Offender Registry Assistance 5,837 427 (5,410) 5,837 427 5,410 16.579 Byrne Formula Grant Program 72,072 41,023 (31,049) 72,072 41,023 31,049 16.592 Local Law Enforcement Block Grants Program 12,010 8,803 (3,207) 12,010 8,803 3,207
FIRE SAFETY AND TRAINING ACADEMY
16.579 Byrne Formula Grant Program 24,773 25,736 963 24,773 25,736 (963) 20.703 Interagency Hazardous Materials Public
Sector Training and Planning Grants 38,992 63,149 24,157 38,992 63,149 (24,157) 83.527 Emergency Management Institute -
Training Assistance 21,869 (21,869) 21,869 21,869 83.547 First Responder Counter-Terrorism
Training Assistance 64,692 56,650 (8,042) 64,692 56,650 8,042 93.777 State Survey and Certification of Health
Care Providers and Suppliers 30,187 (10,708) (40,895) 30,187 (10,708) 40,895
MILITARY STAFF
17.253 Welfare-to-Work Grants to Statesand Localities 668,027 591,130 (76,897) 668,027 591,130 76,897
83.011 Hazardous Materials Training Program forImplementation of the SuperfundAmendment and Reauthorization Act(SARA) of 1986 35,011 3,969 (31,042) 35,011 3,969 31,042
83.105 Community Assistance Program - StateSupport Services Element (CAP-SSSE) 63,712 90,867 27,155 63,712 90,867 (27,155)
83.551 Project Impact - Building DisasterResistant Communities 30,000 (1,925) (31,925) 30,000 (1,925) 31,925
83.552 Emergency Management Performance Grants 1,583,740 1,184,090 (399,650) 1,583,740 1,184,090 399,650 Other Expenditures of Federal Awards 5,465,726 4,311,768 (1,153,958) 5,465,726 4,311,768 1,153,958
Revenues and Other Financing Sources Expenditures and Other Financing Uses
- 102 -
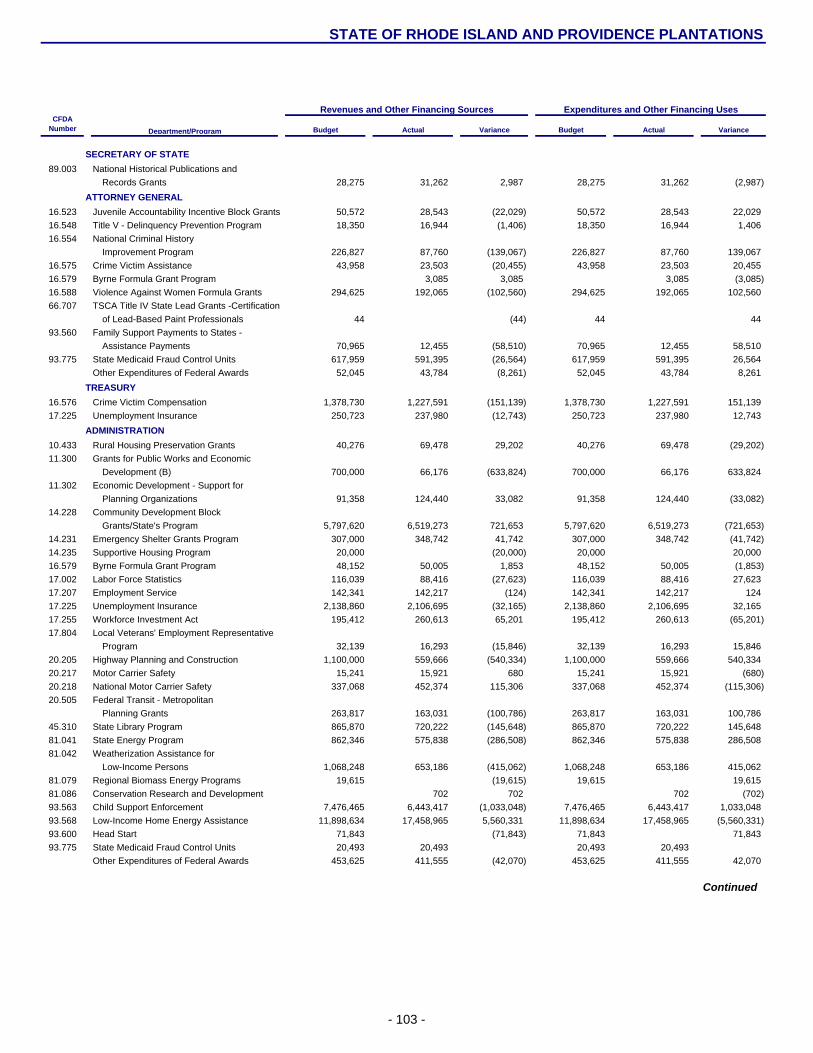
CFDA Number Budget Actual Variance Budget Actual Variance
SECRETARY OF STATE
89.003 National Historical Publications andRecords Grants 28,275 31,262 2,987 28,275 31,262 (2,987)
ATTORNEY GENERAL
16.523 Juvenile Accountability Incentive Block Grants 50,572 28,543 (22,029) 50,572 28,543 22,029 16.548 Title V - Delinquency Prevention Program 18,350 16,944 (1,406) 18,350 16,944 1,406 16.554 National Criminal History
Improvement Program 226,827 87,760 (139,067) 226,827 87,760 139,067 16.575 Crime Victim Assistance 43,958 23,503 (20,455) 43,958 23,503 20,455 16.579 Byrne Formula Grant Program 3,085 3,085 3,085 (3,085) 16.588 Violence Against Women Formula Grants 294,625 192,065 (102,560) 294,625 192,065 102,560 66.707 TSCA Title IV State Lead Grants -Certification
of Lead-Based Paint Professionals 44 (44) 44 44 93.560 Family Support Payments to States -
Assistance Payments 70,965 12,455 (58,510) 70,965 12,455 58,510 93.775 State Medicaid Fraud Control Units 617,959 591,395 (26,564) 617,959 591,395 26,564
Other Expenditures of Federal Awards 52,045 43,784 (8,261) 52,045 43,784 8,261
TREASURY
16.576 Crime Victim Compensation 1,378,730 1,227,591 (151,139) 1,378,730 1,227,591 151,139 17.225 Unemployment Insurance 250,723 237,980 (12,743) 250,723 237,980 12,743
ADMINISTRATION
10.433 Rural Housing Preservation Grants 40,276 69,478 29,202 40,276 69,478 (29,202) 11.300 Grants for Public Works and Economic
Development (B) 700,000 66,176 (633,824) 700,000 66,176 633,824 11.302 Economic Development - Support for
Planning Organizations 91,358 124,440 33,082 91,358 124,440 (33,082) 14.228 Community Development Block
Grants/State's Program 5,797,620 6,519,273 721,653 5,797,620 6,519,273 (721,653) 14.231 Emergency Shelter Grants Program 307,000 348,742 41,742 307,000 348,742 (41,742) 14.235 Supportive Housing Program 20,000 (20,000) 20,000 20,000 16.579 Byrne Formula Grant Program 48,152 50,005 1,853 48,152 50,005 (1,853) 17.002 Labor Force Statistics 116,039 88,416 (27,623) 116,039 88,416 27,623 17.207 Employment Service 142,341 142,217 (124) 142,341 142,217 124 17.225 Unemployment Insurance 2,138,860 2,106,695 (32,165) 2,138,860 2,106,695 32,165 17.255 Workforce Investment Act 195,412 260,613 65,201 195,412 260,613 (65,201) 17.804 Local Veterans' Employment Representative
Program 32,139 16,293 (15,846) 32,139 16,293 15,846 20.205 Highway Planning and Construction 1,100,000 559,666 (540,334) 1,100,000 559,666 540,334 20.217 Motor Carrier Safety 15,241 15,921 680 15,241 15,921 (680) 20.218 National Motor Carrier Safety 337,068 452,374 115,306 337,068 452,374 (115,306) 20.505 Federal Transit - Metropolitan
Planning Grants 263,817 163,031 (100,786) 263,817 163,031 100,786 45.310 State Library Program 865,870 720,222 (145,648) 865,870 720,222 145,648 81.041 State Energy Program 862,346 575,838 (286,508) 862,346 575,838 286,508 81.042 Weatherization Assistance for
Low-Income Persons 1,068,248 653,186 (415,062) 1,068,248 653,186 415,062 81.079 Regional Biomass Energy Programs 19,615 (19,615) 19,615 19,615 81.086 Conservation Research and Development 702 702 702 (702) 93.563 Child Support Enforcement 7,476,465 6,443,417 (1,033,048) 7,476,465 6,443,417 1,033,048 93.568 Low-Income Home Energy Assistance 11,898,634 17,458,965 5,560,331 11,898,634 17,458,965 (5,560,331) 93.600 Head Start 71,843 (71,843) 71,843 71,843 93.775 State Medicaid Fraud Control Units 20,493 20,493 20,493 20,493
Other Expenditures of Federal Awards 453,625 411,555 (42,070) 453,625 411,555 42,070
Continued
Department/Program
STATE OF RHODE ISLAND AND PROVIDENCE PLANTATIONS
Revenues and Other Financing Sources Expenditures and Other Financing Uses
- 103 -

STATE OF RHODE ISLAND AND PROVIDENCE PLANTATIONSSTATEMENT OF GENERAL FUND FEDERAL REVENUES, EXPENDITURES, AND OTHER FINANCING SOURCES AND USES - BUDGET AND ACTUAL (Continued)
For the Fiscal Year Ended June 30, 2001
CFDA Number Department/Program Budget Actual Variance Budget Actual Variance
JUDICIAL
16.523 Juvenile Accountability Incentive Block Grants 74,227 63,951 (10,276) 74,227 63,951 10,276 16.540 Juvenile Justice and Delinquency Prevention -
Allocation to States 34,160 4,048 (30,112) 34,160 4,048 30,112 16.547 Victims of Child Abuse 50,779 55,001 4,222 50,779 55,001 (4,222) 16.554 National Criminal History
Improvement Program 6,000 6,000 6,000 (6,000) 16.579 Byrne Formula Grant Program 250,094 250,094 250,094 250,094 16.580 Edward Byrne Memorial State and Local Law
Enforcement Assistance DiscretionaryGrants Program 189,000 15,634 (173,366) 189,000 15,634 173,366
16.585 Drug Court Discretionary Grant Program 445,109 379,907 (65,202) 445,109 379,907 65,202 16.588 Violence Against Women Formula Grants 202,969 63,609 (139,360) 202,969 63,609 139,360 16.611 Closed-Circuit Televising of Child
Victims of Abuse 555,797 93,577 (462,220) 555,797 93,577 462,220 20.600 State and Community Highway Safety 120,000 24,562 (95,438) 120,000 24,562 95,438 93.563 Child Support Enforcement 1,064,910 815,528 (249,382) 1,064,910 815,528 249,382 93.586 State Court Improvement Program 51,449 51,513 64 51,449 51,513 (64) 93.597 Grants to States for Access and
Visitation Programs 110,739 108,297 (2,442) 110,739 108,297 2,442 93.652 Adoption Opportunities 188,522 184,606 (3,916) 188,522 184,606 3,916 93.778 Medical Assistance Program 5,000 (5,000) 5,000 5,000
RHODE ISLAND ATOMIC ENERGY COMMISSION
81.049 Office of Science FinancialAssistance Program 763,000 59,992 (703,008) 763,000 59,992 703,008
OFFICE OF THE PUBLIC DEFENDER
16.523 Juvenile Accountability Incentive Block Grants 131,661 82,598 (49,063) 131,661 82,598 49,063 16.579 Byrne Formula Grant Program 147,956 66,118 (81,838) 147,956 66,118 81,838 93.586 State Court Improvement Program 70,550 60,577 (9,973) 70,550 60,577 9,973
COMMISSION FOR HUMAN RIGHTS
14.401 Fair Housing Assistance Program -State and Local 126,448 124,850 (1,598) 126,448 124,850 1,598
30.002 Employment Discrimination - State and Local FairEmployment Practices Agency Contracts 187,191 187,856 665 187,191 187,856 (665)
PUBLIC UTILITIES COMMISSION
20.700 Pipeline Safety 61,549 54,845 (6,704) 61,549 54,845 6,704
COASTAL RESOURCES MANAGEMENT COUNCIL
11.419 Coastal Zone ManagementAdministration Awards 1,015,426 1,014,028 (1,398) 1,015,426 1,014,028 1,398
11.473 Coastal Services Center 135,000 56,670 (78,330) 135,000 56,670 78,330
OFFICE OF THE CHILD ADVOCATE
16.575 Crime Victim Assistance 23,332 27,392 4,060 23,332 27,392 (4,060) 84.027 Special Education - Grants to States 235,396 231,874 (3,522) 235,396 231,874 3,522 84.173 Special Education - Preschool Grants 40,188 39,350 (838) 40,188 39,350 838 93.778 Medical Assistance Program 52,134 61,682 9,548 52,134 61,682 (9,548)
ELDERLY AFFAIRS
10.570 Nutrition Program for theElderly (Commodities) 706,871 512,694 (194,177) 706,871 512,694 194,177
17.235 Senior Community Service Employment Program 468,185 546,535 78,350 468,185 546,535 (78,350)
93.041 Special Programs for the Aging - Title VII,Chapter 3 - Programs for Prevention ofElder Abuse, Neglect, and Exploitation 23,963 15,986 (7,977) 23,963 15,986 7,977
93.042 Special Programs for the Aging-Title VII,Chapter 2-Long Term Care OmbudsmanServices for Older Individuals 42,237 42,237 42,237 42,237
93.043 Special Programs for the Aging_Title III,Part F - Disease Prevention andHealth Promotion Services 80,398 96,152 15,754 80,398 96,152 (15,754)
Revenues and Other Financing Sources Expenditures and Other Financing Uses
- 104 -

CFDA Number Budget Actual Variance Budget Actual Variance
93.044 Special Programs for the Aging-Title III,Part B-Grants for Supportive Servicesand Senior Centers 2,437,299 2,267,750 (169,549) 2,437,299 2,267,750 169,549
93.045 Special Programs for the Aging-Title III,Part C - Nutrition Services 1,947,804 2,097,029 149,225 1,947,804 2,097,029 (149,225)
93.048 Special Programs for the Aging - Title IV -Training, Research and DiscretionaryProjects and Programs 85,238 43,961 (41,277) 85,238 43,961 41,277
93.051 New Demonstration Grants to States withRespect to Alzheimer's Disease 231,088 241,343 10,255 231,088 241,343 (10,255)
93.052 Nation Family Caregiver Support Program 11,307 11,307 11,307 (11,307) 93.568 Low-Income Home Energy Assistance 94,118 63,203 (30,915) 94,118 63,203 30,915 93.667 Social Services Block Grant 255,152 255,152 255,152 255,152 93.778 Medical Assistance Program 1,938,633 1,992,639 54,006 1,938,633 1,992,639 (54,006) 93.779 Health Care Financing Research,
Demonstrations and Evaluations 197,992 85,035 (112,957) 197,992 85,035 112,957 94.016 Senior Companion Program 279,344 349,223 69,879 279,344 349,223 (69,879)
CHILDREN, YOUTH AND FAMILIES
16.523 Juvenile Accountability IncentiveBlock Grants 805,684 741,458 (64,226) 805,684 741,458 64,226
16.540 Juvenile Justice and Delinquency Prevention - Allocation to States 30,030 24,092 (5,938) 30,030 24,092 5,938
16.541 Juvenile Justice and DelinquencyPrevention - Special Emphasis 180,000 97,357 (82,643) 180,000 97,357 82,643
16.579 Byrne Formula Grant Program 2,581 2,581 2,581 (2,581) 84.004 Civil Rights Training and Advisory Services 1,956 (794) (2,750) 1,956 (794) 2,750 84.013 Title I Program for Neglected and
Delinquent Children 203,572 160,107 (43,465) 203,572 160,107 43,465 84.027 Special Education - Grants to States 159,512 139,287 (20,225) 159,512 139,287 20,225 84.243 Tech-Prep Education 25,000 22,499 (2,501) 25,000 22,499 2,501 84.281 Eisenhower Professional Development
State Grants 1,115 167 (948) 1,115 167 948 84.298 Innovative Education Program Strategies 1,625 1,626 1 1,625 1,626 (1) 93.104 Comprehensive Community Mental Health
Services for Children with SeriousEmotional Disturbances (SED) 1,169,821 1,420,187 250,366 1,169,821 1,420,187 (250,366)
93.556 Promoting Safe and Stable Families 848,897 1,048,368 199,471 848,897 1,048,368 (199,471) 93.558 Temporary Assistance for Needy Families 6,553,528 8,067,197 1,513,669 6,553,528 8,067,197 (1,513,669) 93.575 Child Care and Development Block Grant 275,524 322,110 46,586 275,524 322,110 (46,586) 93.603 Adoption Incentive Payments 141,459 (141,459) 141,459 141,459 93.643 Children's Justice Grants to States 81,550 72,252 (9,298) 81,550 72,252 9,298 93.645 Child Welfare Services - State Grants 996,103 833,705 (162,398) 996,103 833,705 162,398 93.658 Foster Care - Title IV-E 15,132,154 13,893,781 (1,238,373) 15,132,154 13,893,781 1,238,373 93.659 Adoption Assistance 5,251,277 4,732,975 (518,302) 5,251,277 4,732,975 518,302 93.669 Child Abuse and Neglect State Grants 111,179 109,740 (1,439) 111,179 109,740 1,439 93.674 Independent Living 316,160 409,783 93,623 316,160 409,783 (93,623) 93.778 Medical Assistance Program 48,817,853 48,181,087 (636,766) 48,817,853 48,181,087 636,766 93.958 Block Grants for Community Mental
Health Services 128,423 (128,423) 128,423 128,423 Other Expenditures of Federal Awards 312,000 452,827 140,827 312,000 452,827 (140,827)
OFFICE OF HIGHER EDUCATION
64.124 All-Volunteer Force Educational Assistance 76,133 8,502 (67,631) 76,133 8,502 67,631 84.281 Eisenhower Professional Development
State Grants 259,395 172,710 (86,685) 259,395 172,710 86,685 84.334 Gaining Early Awareness and Readiness
for Undergraduate Programs 1,922,037 1,510,336 (411,701) 1,922,037 1,510,336 411,701 84.336 Teacher Quality Enhancement Grants 50,000 12,612 (37,388) 50,000 12,612 37,388
TOTAL 1,288,036,350$ 1,213,490,953$ (74,545,397)$ ############ 1,213,490,953$ 74,545,397$
Concluded
Department/Program
STATE OF RHODE ISLAND AND PROVIDENCE PLANTATIONS
Revenues and Other Financing Sources Expenditures and Other Financing Uses
- 105 -

- 107 -
SPECIAL REVENUE FUNDSSpecial revenue funds account for the proceeds of specific revenue sources that arelegally restricted to expenditures for specified purposes and where a separate fund ismandated. The state uses the following special revenue funds.
R.I. Temporary Disability Insurance – accounts for the employee tax on wages that are leviedto pay benefits to covered employees who are out of work for an extended period of time due to anon-job-related illness.
R.I. Underground Storage Tank Financial Responsibility – accounts for a designated portionof the gasoline tax to be used to facilitate the clean-up of leaking underground storage tanks orunderground storage tanks systems, in order to protect the environment, including drinking watersupplies and public health.
Intermodal Surface Transportation – accounts for the collection of the gasoline tax, federalgrants, and bond proceeds that are used in maintenance, upgrading, and construction of thestate’s highway system.
Providence River Relocation Project – accounts for all revenues received and expendituresincurred related to the relocation of two rivers in the City of Providence and the extension ofMemorial Boulevard.
Rhode Island Economic Policy Council – works with state officials to identify issues facing thestate's economy, to advise the state legislature in policy matters relating to economicdevelopment, and to administer a grant program designed to foster private technologycommercialization. It is a blended component unit.

This Page Intentionally Left Blank
- 106 -
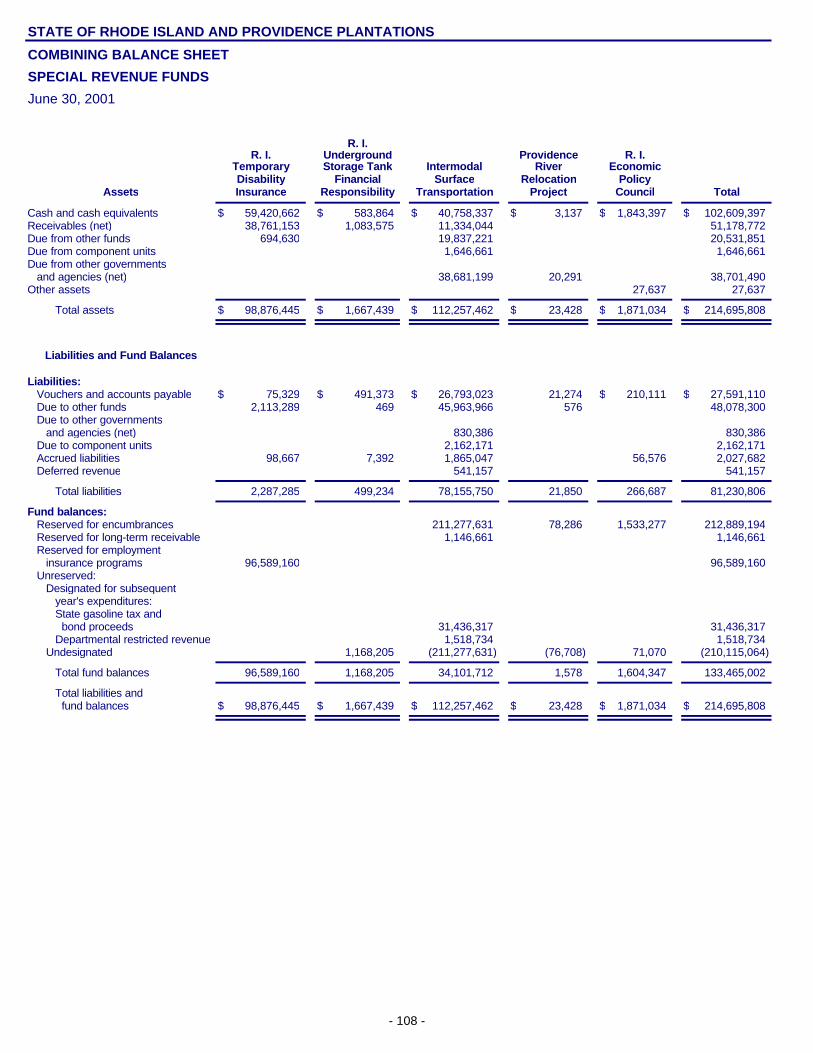
STATE OF RHODE ISLAND AND PROVIDENCE PLANTATIONS
COMBINING BALANCE SHEET
SPECIAL REVENUE FUNDS
June 30, 2001
Cash and cash equivalents $ 59,420,662 $ 583,864 $ 40,758,337 $ 3,137 $ 1,843,397 $ 102,609,397Receivables (net) 38,761,153 1,083,575 11,334,044 51,178,772Due from other funds 694,630 19,837,221 20,531,851Due from component units 1,646,661 1,646,661Due from other governments
and agencies (net) 38,681,199 20,291 38,701,490Other assets 27,637 27,637
Total assets $ 98,876,445 $ 1,667,439 $ 112,257,462 $ 23,428 $ 1,871,034 $ 214,695,808
Liabilities:Vouchers and accounts payable $ 75,329 $ 491,373 $ 26,793,023 21,274 $ 210,111 $ 27,591,110Due to other funds 2,113,289 469 45,963,966 576 48,078,300Due to other governments
and agencies (net) 830,386 830,386Due to component units 2,162,171 2,162,171Accrued liabilities 98,667 7,392 1,865,047 56,576 2,027,682Deferred revenue 541,157 541,157
Total liabilities 2,287,285 499,234 78,155,750 21,850 266,687 81,230,806
Fund balances:Reserved for encumbrances 211,277,631 78,286 1,533,277 212,889,194Reserved for long-term receivable 1,146,661 1,146,661Reserved for employment
insurance programs 96,589,160 96,589,160Unreserved:
Designated for subsequentyear's expenditures:State gasoline tax and bond proceeds 31,436,317 31,436,317Departmental restricted revenue 1,518,734 1,518,734
Undesignated 1,168,205 (211,277,631) (76,708) 71,070 (210,115,064)
Total fund balances 96,589,160 1,168,205 34,101,712 1,578 1,604,347 133,465,002
Total liabilities and fund balances $ 98,876,445 $ 1,667,439 $ 112,257,462 $ 23,428 $ 1,871,034 $ 214,695,808
R. I.
Insurance
IntermodalSurface
Transportation
UndergroundStorage Tank
Financial
R. I.TemporaryDisability
Assets
Liabilities and Fund Balances
Responsibility Project TotalCouncil
R. I.
Relocation
ProvidenceRiver Economic
Policy
- 108 -

STATE OF RHODE ISLAND AND PROVIDENCE PLANTATIONS
COMBINING STATEMENT OF REVENUES, EXPENDITURES, AND CHANGES IN FUND BALANCES
SPECIAL REVENUE FUNDSFor the Fiscal Year Ended June 30, 2001
Revenues:Taxes $ 142,371,540 $ $ 128,115,439 $ $ $ 270,486,979Fees 4,560,784 4,560,784Restricted revenue 5,675 5,675Federal grants 194,552,636 194,552,636Income from investments 3,656,651 63,894 1,144,932 687 62,998 4,929,162Other revenues 207,832 3,878,560 205,320 4,291,712
Total revenues 146,236,023 4,624,678 327,697,242 687 268,318 478,826,948Other financing sources:
Operating transfers in 43,393,537 345,833 5,437,500 49,176,870Operating transfers from
component units 1,896,268 1,896,268
Total revenues and otherfinancing sources 146,236,023 4,624,678 372,987,047 346,520 5,705,818 529,900,086
Expenditures:Current:
General government 5,489,798 4,924,867 10,414,665Human services 132,807,884 132,807,884Natural resources 3,688,063 3,688,063Transportation 53,044,996 344,942 53,389,938
Capital outlays 144,101 184,842,943 184,987,044Intergovernmental 171,714 755,726 927,440
Total expenditures 138,441,783 3,859,777 238,643,665 344,942 4,924,867 386,215,034
Other financing uses:Operating transfers out 1,025,085 61,129,017 214 62,154,316Operating transfers to
component units 871,794 61,924,404 62,796,198
Total expenditures and otherfinancing uses 139,466,868 4,731,571 361,697,086 345,156 4,924,867 511,165,548
Revenues and other financing sourcesover (under) expenditures andother financing uses 6,769,155 (106,893) 11,289,961 1,364 780,951 18,734,538
Fund balances, July 1, 2000, as restated 89,820,005 1,275,098 22,811,751 214 823,396 114,730,464
Fund balances, June 30, 2001 $ 96,589,160 $ 1,168,205 $ 34,101,712 $ 1,578 $ 1,604,347 $ 133,465,002
R. I. Underground Providence R. I.R. I.
RiverRelocationDisability Surface
IntermodalStorage TankFinancial
Temporary
Council Total
EconomicPolicy
ProjectInsurance TransportationResponsibility
- 109 -

STATE OF RHODE ISLAND AND PROVIDENCE PLANTATIONSCOMBINING STATEMENT OF REVENUES, EXPENDITURES, AND CHANGES IN FUND BALANCES - BUDGET AND ACTUAL
BUDGETED SPECIAL REVENUE FUNDSFor the Fiscal Year Ended June 30, 2001
Revenues:Taxes $ 135,166,890 $ 142,371,540 $ 7,204,650Restricted revenueFederal grantsOther revenues 3,864,483 3,864,483
Total revenues 135,166,890 146,236,023 11,069,133
Other financing sources:Operating transfers in
Total revenues and other financing sources 135,166,890 146,236,023 11,069,133
Expenditures:Current:
General government 6,159,368 5,489,798 669,570Human services 128,000,000 132,807,884 (4,807,884)Transportation
Capital outlays 144,101 (144,101)Intergovernmental
Total expenditures 134,159,368 138,441,783 (4,282,415)
Other financing uses:Operating transfers out 1,007,522 1,025,085 (17,563)Operating transfers to component units
Total expenditures and other financing uses 135,166,890 139,466,868 (4,299,978)
Revenues and other financing sources over (under) expenditures and other financing uses 6,769,155 6,769,155
Fund balances, July 1, 2000, as restated 89,820,005 89,820,005
Fund balances, June 30, 2001 $ $ 96,589,160 $ 96,589,160
R.I. Temporary Disability Fund
Budget Actual Variance
- 110 -

STATE OF RHODE ISLAND AND PROVIDENCE PLANTATIONS
$ 131,600,000 $ 128,115,439 $ (3,484,561) $ 266,766,890 $ 270,486,979 $ 3,720,08925,560,600 5,675 (25,554,925) 25,560,600 5,675 (25,554,925)
231,761,639 194,552,636 (37,209,003) 231,761,639 194,552,636 (37,209,003)3,500,000 5,023,492 1,523,492 3,500,000 8,887,975 5,387,975
392,422,239 327,697,242 (64,724,997) 527,589,129 473,933,265 (53,655,864)
45,289,805 45,289,805 45,289,805 45,289,805
392,422,239 372,987,047 (19,435,192) 527,589,129 519,223,070 (8,366,059)
6,159,368 5,489,798 669,570128,000,000 132,807,884 (4,807,884)
88,641,880 53,044,996 35,596,884 88,641,880 53,044,996 35,596,884180,510,027 184,842,943 (4,332,916) 180,510,027 184,987,044 (4,477,017)
755,726 (755,726) 755,726 (755,726)
269,151,907 238,643,665 30,508,242 403,311,275 377,085,448 26,225,827
55,092,763 61,129,017 (6,036,254) 56,100,285 62,154,102 (6,053,817)72,387,778 61,924,404 10,463,374 72,387,778 61,924,404 10,463,374
396,632,448 361,697,086 34,935,362 531,799,338 501,163,954 30,635,384
(4,210,209) 11,289,961 15,500,170 (4,210,209) 18,059,116 22,269,3254,900,000 22,811,751 17,911,751 4,900,000 112,631,756 107,731,756
$ 689,791 $ 34,101,712 $ 33,411,921 $ 689,791 $ 130,690,872 $ 130,001,081
Total Budgeted Special Revenue Funds
Actual Variance
Intermodal Surface Transportation Fund
Budget Actual VarianceBudget
- 111 -

STATE OF RHODE ISLAND AND PROVIDENCE PLANTATIONS
STATEMENT OF FEDERAL REVENUES, EXPENDITURES, AND OTHER FINANCING SOURCES AND USES - BUDGET AND ACTUAL
INTERMODAL SURFACE TRANSPORTATION FUND
For the Fiscal Year Ended June 30, 2001
CFDA Number FUND/PROGRAM Budget Actual Variance Budget Actual Variance
20.205 Highway Planning and Construction $ 180,510,027 $ 159,408,755 $ ######### $ 180,510,027 $ 159,408,755 $ 21,101,272 20.308 Local Rail Freight Assistance 101,800 114,982 13,182 101,800 114,982 (13,182) 20.509 Formula Grants for Other Than Urbanized Areas 900,000 787,156 (112,844) 900,000 787,156 112,844 20.513 Capital Assistance Program for Elderly Persons
and Persons with Disabilities 450,000 5,398 (444,602) 450,000 5,398 444,602 Federal Transit Cluster 45,950,000 32,860,343 ######### 45,950,000 32,860,343 13,089,657 State and Community Highway Safety Cluster 3,849,812 1,376,002 (2,473,810) 3,849,812 1,376,002 2,473,810
$ 231,761,639 $ 194,552,636 $ (37,209,003) $ 231,761,639 $ 194,552,636 $ 37,209,003
Revenues and Other Financing Sources Expenditures and Other Financing Uses
- 112 -

STATE OF RHODE ISLAND AND PROVIDENCE PLANTATIONS
STATEMENT OF RESTRICTED REVENUES, EXPENDITURES, AND OTHER FINANCINGSOURCES AND USES - BUDGET AND ACTUALINTERMODAL SURFACE TRANSPORTATION FUND
For the Fiscal Year Ended June 30, 2001
ACCOUNTNUMBER ACCOUNT TITLE
5312-80300 Vehicle Salvage $ 50,000 $ 55,256 $ 5,256 $ 50,000 $ 55,256 $ (5,256) 5312-81600 Freight Rail Improvement Project 25,000,000 15,577,279 (9,422,721) 25,000,000 15,577,279 9,422,721 5332-80300 Transit Vehicle Disposal / Match 10,600 10,579 (21) 10,600 10,579 21 5332-80400 Sakonnet River Railroad Bridge 184,943 184,943 5496-00000 State Infrastructure Bank 500,000 1,333,791 833,791 500,000 500,000
$ 25,560,600 17,161,848 $ (8,398,752) $ 25,560,600 $ 15,643,114 $ 9,917,486
Less: Actual Expenditures and Other Uses (15,643,114)
Restricted Revenue Appropriations Carried Forward to Fiscal Year 2002 $ 1,518,734
Revenues and Other Financing Sources Expenditures and Other Financing Uses
Budget Actual Variance Budget Actual Variance
- 113 -

STATE OF RHODE ISLAND AND PROVIDENCE PLANTATIONS
STATEMENT OF STATE GASOLINE TAX REVENUE AND BOND PROCEEDS, EXPENDITURESAND OTHER FINANCING SOURCES AND USES - BUDGET AND ACTUAL
INTERMODAL SURFACE TRANSPORTATION FUND
For the Fiscal Year Ended June 30, 2001
Revenues:Taxes $ 131,600,000 $ 128,115,439 $ (3,484,561)Other revenues
Total revenues 131,600,000 128,115,439 (3,484,561)
Other financing sources:Operating transfers in
Total revenues and other financing sources 131,600,000 128,115,439 (3,484,561)
Expenditures:Transportation 54,339,668 51,315,977 3,023,691
Total expenditures 54,339,668 51,315,977 3,023,691
Other financing uses:Operating transfers out 55,092,763 55,462,216 (369,453)Operating transfers to component units 26,377,778 26,411,841 (34,063)
Total expenditures and other financing uses 135,810,209 133,190,034 2,620,175
Revenues and other financing sources over (under)expenditures and other financing uses (4,210,209) (5,074,595) (864,386)
Fund balance, July 1, 2000 4,900,000 5,053,483 153,483
Fund balance, June 30, 2001 $ 689,791 $ (21,112) $ (710,903)
State Gasoline Tax RevenueVarianceBudget Actual
- 114 -

STATE OF RHODE ISLAND AND PROVIDENCE PLANTATIONS
$ $ $ $ 131,600,000 $ 128,115,439 $ (3,484,561)3,500,000 5,004,787 1,504,787 3,500,000 5,004,787 1,504,787
3,500,000 5,004,787 1,504,787 135,100,000 133,120,226 (1,979,774)
29,712,526 29,712,526 29,712,526 29,712,526
3,500,000 34,717,313 31,217,313 135,100,000 162,832,752 27,732,752
3,500,000 17,810,922 (14,310,922) 57,839,668 69,126,899 (11,287,231)
3,500,000 17,810,922 (14,310,922) 57,839,668 69,126,899 (11,287,231)
367,488 (367,488) 55,092,763 55,829,704 (736,941)132,891 (132,891) 26,377,778 26,544,732 (166,954)
3,500,000 18,311,301 (14,811,301) 139,310,209 151,501,335 (12,191,126)
16,406,012 16,406,012 (4,210,209) 11,331,417 15,541,62616,198,079 16,198,079 4,900,000 21,251,562 16,351,562
$ $ 32,604,091 $ 32,604,091 $ 689,791 $ 32,582,979 $ 31,893,188
Bond Proceeds TotalActualBudget VarianceActualBudgetVariance
- 115 -

This Page Intentionally Left Blank
- 116 -

DEBT SERVICE FUND
Debt service funds account for the accumulation of resources for, and the payment of,general long-term debt principal and interest.
The state’s debt service fund is funded by annual appropriations that approximate theannual interest savings from debt refundings and other sources. The funds are used toadvance refund high interest debt.
- 117 -

STATE OF RHODE ISLAND AND PROVIDENCE PLANTATIONS
BALANCE SHEET
DEBT SERVICE FUND
June 30, 2001
Assets
Cash and cash equivalents $ 23,660,497 Funds on deposit with fiscal agent 257,446 Due from other funds 28,840
Total assets $ 23,946,783
Liabilities and Fund Balance
Liabilities:
Due to other funds $ 23,212,646
Total liabilities 23,212,646
Fund balance:
Reserved for debt 734,137
Total fund balance 734,137
Total liabilities and fund balance $ 23,946,783
- 118 -

STATE OF RHODE ISLAND AND PROVIDENCE PLANTATIONS
STATEMENT OF REVENUES, EXPENDITURES, AND CHANGESIN FUND BALANCE
DEBT SERVICE FUND
For the Fiscal Year Ended June 30, 2001
Revenues:
Income from investments $ 526,318
Total revenues 526,318
Other financing sources: Operating transfers from component units 115,360 Other 1,323,804
Total revenues and other financing sources 1,965,482
Expenditures:
Debt service - interest 973,763
Total expenditures 973,763
Other financing uses:
Operating transfers out 2,775,457
Total expenditures and other financing uses 3,749,220
Revenues and other financing sources over (under) expenditures and other financing uses (1,783,738)
Fund balance, July 1, 2000 2,517,875
Fund balance, June 30, 2001 $ 734,137
- 119 -

STATEMENT OF REVENUES, EXPENDITURES, AND CHANGES
- 119 -

This Page Intentionally Left Blank
- 120 -

STATE OF RHODE ISLAND AND PROVIDENCE PLANTATIONS
COMBINING BALANCE SHEET
CAPITAL PROJECTS FUNDS
June 30, 2001
Cash and cash equivalents $ 9,855,781 $ 131,061,785 $ 652,576 $ $ 141,570,142Funds on deposit with fiscal agent 32,133,616 32,133,616Investments 16,343,384 16,343,384Due from other funds 19,434,733 19,434,733Due from federal government 3,156,647 3,156,647Other assets 3,524,978 3,524,978
Total assets $ 9,855,781 $ 153,653,165 $ 20,520,938 $ 32,133,616 $ 216,163,500
Liabilities:Cash overdraft $ $ 11,621,317 $ $ $ 11,621,317Vouchers and accounts payable 3,071,736 62,682 1,336,788 4,471,206Due to other funds 40,206,600 1,671 40,208,271Due to component units 1,200,029 1,200,029Loan from other funds 1,500,000 1,458,339 36,633 2,994,972Deferred revenue 65,695 65,695Other liabilities 3,755,046 3,755,046
Total liabilities 1,500,000 57,623,716 3,817,728 1,375,092 64,316,536
Fund balances:Reserved for encumbrances 9,904,517 27,989,580 37,894,097Reserved for debt 16,419,122 2,768,944 19,188,066Reserved for self-insurance 100,000 100,000Unreserved:
Designated for capital projects 8,355,781 86,124,932 94,480,713Undesignated 184,088 184,088
Total fund balances 8,355,781 96,029,449 16,703,210 30,758,524 151,846,964
Total liabilities and fund balances $ 9,855,781 $ 153,653,165 $ 20,520,938 $ 32,133,616 $ 216,163,500
Bond R.I. Refunding CertificatesR.I. CleanWater Act
EnvironmentalTrust Fund
Capital BondAssets
Liabilities and Fund Balances
Fund Authority Totalof
Participation
- 122 -

STATE OF RHODE ISLAND AND PROVIDENCE PLANTATIONS
COMBINING STATEMENT OF REVENUES, EXPENDITURES, AND CHANGES IN FUND BALANCES
CAPITAL PROJECTS FUNDS
For the Fiscal Year Ended June 30, 2001
Revenues:Charges for services $ $ $ 7,239,166 $ $ 7,239,166Federal grants 8,642,216 8,642,216Income from investments 614,455 8,376,241 1,102,343 847,377 10,940,416Net increase in the fair value of investments 836,644 836,644
Total revenues 614,455 17,018,457 9,178,153 847,377 27,658,442
Other financing sources:Bonds and notes issued 149,915,000 149,915,000Lease certificates of participation issued 31,330,000 31,330,000Premium and accrued interest 5,569,570 75,498 5,645,068Operating transfers in 44,705,959 44,705,959
Total revenues and other financing sources 614,455 217,208,986 9,178,153 32,252,875 259,254,469
Expenditures:Current:
General government 988,102 55,618 1,043,720Human services 2,992,247 2,992,247Education 1,158,944 1,158,944Natural resources 59,553 1,969,394 2,028,947Transportation 3,270,374 3,270,374
Capital outlays 7,760,544 7,760,544Intergovernmental 775 7,716,683 7,717,458Debt service:
Interest and other charges 9,776 1,121,483 8,161,432 899,879 10,192,570
Total expenditures 70,104 19,217,227 8,217,050 8,660,423 36,164,804
Other financing uses:Payment to refunded bonds escrow agent 123,020,189 123,020,189Operating transfers out 80,655,783 80,655,783Operating transfers to component units 2,347,792 36,190,721 38,538,513
Total expenditures and other financing uses 2,417,896 259,083,920 8,217,050 8,660,423 278,379,289
Revenues and other financing sources over (under)expenditures and other financing uses (1,803,441) (41,874,934) 961,103 23,592,452 (19,124,820)
Fund balances, July 1, 2000 10,159,222 137,904,383 15,742,107 7,166,072 170,971,784
Fund balances, June 30, 2001 $ 8,355,781 $ 96,029,449 $ 16,703,210 $ 30,758,524 $ 151,846,964
R.I. Refunding CertificatesR.I. CleanWater Act
EnvironmentalBond
ofParticipation Total
Capital BondTrust Fund Fund Authority
- 123 -

This Page Intentionally Left Blank
- 124 -

ENTERPRISE FUND
Enterprise funds account for operations where management has decided that periodicdetermination of revenues earned, expenses incurred (including depreciation), and/or netincome is appropriate for capital maintenance, public policy, management control, a
State Lottery Fund
The State Lottery Fund operates lottery games for the purpose of generating resources for the state’s General Fund.
- 125 -

STATE OF RHODE ISLAND AND PROVIDENCE PLANTATIONS
BALANCE SHEET
ENTERPRISE FUND
June 30, 2001
Assets State Lottery
Cash and cash equivalents $ 4,798,950 Investments 1,839,580 Receivables (net) 6,004,550 Due from other funds 132 Inventories 735,696 Fixed assets (net) 513,244 Other assets 427,346
Total assets $ 14,319,498
Liabilities and Fund Equity
Liabilities: Cash overdraft $ 432,782 Vouchers and accounts payable 5,734,906 Due to other funds 1,461,136 Accrued liabilities 475,706 Deferred revenue 141,136 Obligation for unpaid prize awards 5,966,884
Total liabilities 14,212,550
Fund equity: Retained earnings: Unreserved 106,948
Total fund equity 106,948
Total liabilities and fund equity $ 14,319,498
- 126 -

STATE OF RHODE ISLAND AND PROVIDENCE PLANTATIONS
STATEMENT OF REVENUES, EXPENSES, AND CHANGES IN FUND EQUITY
ENTERPRISE FUND
For the Fiscal Year Ended June 30, 2001
State Lottery
Operating revenues: Charges for services $ 978,019,702
Total operating revenues 978,019,702
Operating expenses: Personal services 3,146,406 Supplies, materials, and services 132,564,808 Prize awards 662,974,491 Depreciation 217,457
Total operating expenses 798,903,162
Operating income 179,116,540
Nonoperating revenues: Income from investments 969,516 Other nonoperating revenue 683,944
Total nonoperating revenues 1,653,460
Income before transfers 180,770,000
Operating transfers out (180,841,895)
Net loss (71,895)
Fund equity, July 1, 2000 178,843
Fund equity, June 30, 2001 $ 106,948
- 127 -

STATE OF RHODE ISLAND AND PROVIDENCE PLANTATIONS
STATEMENT OF CASH FLOWS
ENTERPRISE FUND
For the Fiscal Year Ended June 30, 2001
State Lottery
Cash flows from operating activities: Cash received from customers $ 982,954,169 Cash payments to suppliers for goods and services (3,470,489) Cash payments to employees for services (3,103,567) Other operating revenue 894,822 Other operating expenses (802,017,627)
Net cash provided by operating activities 175,257,308 Cash flows from noncapital financing activities: Operating transfers out (192,281,633) Negative cash balance implicitly financed 432,782
Net cash used for noncapital financing activities (191,848,851) Cash flows from capital and related financing activities: Acquisition of capital assets (193,649)
Net cash used for capital and related financing activites (193,649)
Cash flows from investing activities: Proceeds from sale and maturity of investments 1,209,579 Interest on investments 969,516
Net cash provided by investing activities 2,179,095
Net increase in cash and cash equivalents (14,606,097) Cash and cash equivalents, July 1, 2000 19,405,047
Cash and cash equivalents, June 30, 2001 $ 4,798,950
Reconciliation of operating income to net cash provided by operating activities: Operating income $ 179,116,540 Adjustments to reconcile operating income to net cash provided by operating activities: Depreciation and amortization 217,457 Interest on investments and other income (1,169,774) (Increase) decrease in assets: Receivables (1,154,047) Inventories 68,105 Other assets 1,868,066 Increase (decrease) in liabilities: Accounts payable and accrued expenses (1,137,000) Deferred revenue (114,274) Other liabilities (2,437,765)
Total adjustments (3,859,232)
Net cash provided by operating activities $ 175,257,308
- 128 -
INTERNAL SERVICE FUNDS
Internal service funds are used to account for the financing and providing of specified goods andservices, on a centralized basis, for other departments and agencies.
Federal Surplus Property – accounts for the revenues received and expenses incurred from the disposition offederal surplus property.
Assessed Fringe Benefits – accounts for the biweekly assessment of a percentage applied to salaries andwages to pay for certain fringe benefits, including workers' compensation to state employees injured on the job.
Central Utilities – processes all electric bills for the state and charges the expending department/agency.
Energy Revolving – accounts for revenues to be used to implement and encourage energy efficiency and costreduction measures in state facilities or alternate fuel vehicles.
Central Services – provides for the delivery of mail services, processes all telephone bills, and is the hub of thestate’s data processing activity.
Special Facilities – maintains an inventory of prescription drugs for use at state institutions and provides laundryservice to same.
Automotive Maintenance – approves work orders, pays the corresponding bills for the state fleet and bills theuser department/agency.
Central Warehouse – purchases and maintains inventories of food and a variety of cleaning, household and officesupplies for distribution to state agencies, local governments and non-profit agencies.
Correctional Industries – provides job training for inmates through prison industries.
Record Center – provides a centralized location for the archival of state documents.
- 129 -

STATE OF RHODE ISLAND AND PROVIDENCE PLANTATIONS
COMBINING BALANCE SHEET
INTERNAL SERVICE FUNDSJune 30, 2001
Cash and cash equivalents $ $ 854,509 $ 1,047,969 $Accounts receivable 1,250,000 1,862,785 111,329Loans receivable 1,113,283Due from other funds 618,699 1,410,355 200,000InventoriesPrepaid itemsFixed assets (net) 25,012 1,158
Total assets $ $ 2,748,220 $ 4,322,267 $ 1,424,612
Liabilities:Cash overdraft $ 500 $ $ $ 110,767Vouchers and accounts payable 169,855 3,850,696Due to other funds 729,610 354Accrued liabilities 368,437 34,704Loans from the general fund 1,000,000 200,000Obligations under capital leases
Total liabilities 500 2,267,902 4,085,754 110,767Fund equity:
Retained earnings (deficit):Reserved for capital expansionUnreserved (500) 480,318 236,513 1,313,845
Total fund equity (deficit) (500) 480,318 236,513 1,313,845
Total liabilities and fund equity $ $ 2,748,220 $ 4,322,267 $ 1,424,612
Federal
Surplus Property
Central
Utilities
Energy
RevolvingAssets
Liabilities and Fund Equity
Assessed
Fringe Benefits
- 130 -

STATE OF RHODE ISLAND AND PROVIDENCE PLANTATIONS
Total
$ $ 73,071 $ 716,717 $ 207,476 $ 640,428 $ 72,959 $ 3,613,129352,319 592,304 283,602 326,603 72,296 4,851,238
1,113,2831,638,174 659,196 483,426 240,673 1,143,132 6,393,655
218,507 504,530 135,252 745,832 694,398 2,298,519500,000 500,000
1,320,917 83,114 4,291 2,433,169 467,098 8,824 4,343,583
$ 3,529,917 $ 1,819,911 $ 1,931,990 $ 3,910,752 $ 3,271,659 $ 154,079 $ 23,113,407
$ 360,825 $ $ $ $ $ $ 472,092800,390 256,011 1,207,171 210,703 328,821 48,922 6,872,569221,539 30,404 26,988 1,837 383,500 17,907 1,412,139
1,338,308 119,365 61,751 141,029 157,219 15,502 2,236,315200,000 400,000 200,000 850,000 2,850,000152,238 1,174,379 16,632 1,343,249
3,073,300 805,780 1,295,910 1,727,948 1,736,172 82,331 15,186,364
1,456,275 1,456,275456,617 1,014,131 636,080 2,182,804 79,212 71,748 6,470,768
456,617 1,014,131 636,080 2,182,804 1,535,487 71,748 7,927,043
$ 3,529,917 $ 1,819,911 $ 1,931,990 $ 3,910,752 $ 3,271,659 $ 154,079 $ 23,113,407
Special
Facilities
Central
Services
Records
Center
Central
Warehouse
Correctional
Industries
Automotive
Maintenance
- 131 -

STATE OF RHODE ISLAND AND PROVIDENCE PLANTATIONS
COMBINING STATEMENT OF REVENUES, EXPENSES, AND CHANGESIN FUND EQUITYINTERNAL SERVICE FUNDS
For the Fiscal Year Ended June 30, 2001
Operating revenues:Charges for services $ $ 25,982,985 $ 17,896,679 $ 111,329Grants 861,278
Total operating revenues 25,982,985 17,896,679 972,607
Operating expenses:Personal services 1,823,570 209,079Supplies, materials, and services 50 23,618,621 17,688,832Depreciation 9,828 464
Total operating expenses 50 25,452,019 17,898,375
Operating income (loss) (50) 530,966 (1,696) 972,607
Nonoperating revenues (expenses):Interest revenueInterest expense
Income (loss) before transfers (50) 530,966 (1,696) 972,607
Operating transfers in
Net income (loss) (50) 530,966 (1,696) 972,607Fund equity (deficit), July 1, 2000, as restated (450) (50,648) 238,209 341,238
Fund equity (deficit), June 30, 2001 $ (500) $ 480,318 $ 236,513 $ 1,313,845
CentralUtilities
EnergyRevolving
FederalSurplus Property
AssessedFringe Benefits
- 132 -

STATE OF RHODE ISLAND AND PROVIDENCE PLANTATIONS
Total
$ 17,832,342 $ 9,539,320 $ 12,976,889 $ 6,754,160 $ 5,535,960 $ 835,837 $ 97,465,501861,278
17,832,342 9,539,320 12,976,889 6,754,160 5,535,960 835,837 98,326,779
6,851,096 1,079,762 396,411 849,909 1,701,228 176,733 13,087,78811,121,734 8,326,941 12,415,483 5,294,733 3,124,781 639,311 82,230,486
441,964 12,728 812 157,541 107,115 1,909 732,361
18,414,794 9,419,431 12,812,706 6,302,183 4,933,124 817,953 96,050,635
(582,452) 119,889 164,183 451,977 602,836 17,884 2,276,144
26,424 17,660 44,084(86,992) (1,995) (88,987)
(582,452) 119,889 190,607 364,985 618,501 17,884 2,231,241
316,992 316,992
(582,452) 119,889 190,607 681,977 618,501 17,884 2,548,2331,039,069 894,242 445,473 1,500,827 916,986 53,864 5,378,810
$ 456,617 $ 1,014,131 $ 636,080 $ 2,182,804 $ 1,535,487 $ 71,748 $ 7,927,043
CentralServices
SpecialFacilities
AutomotiveMaintenance
RecordsCenter
CentralWarehouse
CorrectionalIndustries
- 133 -

STATE OF RHODE ISLAND AND PROVIDENCE PLANTATIONS
COMBINING STATEMENT OF CASH FLOWSINTERNAL SERVICE FUNDS
For the Fiscal Year Ended June 30, 2001
Cash flows from operating activities:Cash received from customers $ $ 24,995,485 $ 16,853,597 $Cash received from grants 661,278Cash payments to suppliers for goods and services (1,890) (23,608,838) (16,037,582)Cash payments to employees for services (1,781,348) (207,776)Loans issued (1,113,283)Other operating revenue 882,940 7,245
Net cash provided by (used for) operating activities (1,890) 488,239 615,484 (452,005)
Cash flows from noncapital financing activities:Loans from the general fund 1,762,746 100,000Repayment of loans to the general fund (1,412,746) (300,000)Negative cash balance implicitly financed 500 110,767
Net cash provided by (used for) noncapital financing activities 500 350,000 (200,000) 110,767
Cash flows from capital and related financing activities:Principal paid on capital lease obligationsInterest paid on capital lease obligationsAcquisition of capital assetsDebt service subsidy
Net cash provided by (used for) capital and related financing activities
Cash flows from investing activities:Interest on investments
Net cash provided by (used for) investing activities
Net increase (decrease) in cash and and cash equivalents (1,390) 838,239 415,484 (341,238)Cash and cash equivalents, July 1, 2000 1,390 16,270 632,485 341,238
Cash and cash equivalents, June 30, 2001 $ $ 854,509 $ 1,047,969 $
Reconciliation of operating income (loss) to net cashprovided by (used for) operating activities:Operating income (loss) $ (50) $ 530,966 $ (1,696) $ 972,607
Adjustments to reconcile operating income (loss)to net cash provided by (used for) operatingactivities:
Depreciation 9,828 464(Increase) decrease in assets:
Receivables (1,840) (990,713) (1,043,082) (1,424,612)InventoryPrepaid items
Increase (decrease) in liabilities:Vouchers and accounts payable 895,935 1,658,496Accrued expenses 42,223 1,302
Total adjustments (1,840) (42,727) 617,180 (1,424,612)
Net cash provided by (used for) operating activities $ (1,890) $ 488,239 $ 615,484 $ (452,005)
EnergyRevolving
CentralUtilities
FederalSurplus Property
AssessedFringe Benefits
- 134 -

STATE OF RHODE ISLAND AND PROVIDENCE PLANTATIONS
$ 17,056,295 $ 9,644,556 $ 12,488,193 $ 6,551,997 $ 7,430,302 $ 835,800 $ 95,856,225661,278
(10,839,735) (8,908,096) (12,380,598) (5,231,670) (5,572,152) (628,793) (83,209,354)(6,920,971) (1,056,205) (401,604) (857,074) (1,685,010) (178,261) (13,088,249)
508 (1,112,775)174,395 71,711 448,526 42,130 46,748 1,673,695
(530,016) (248,034) 154,517 505,383 219,888 29,254 780,820
100,000 300,000 100,000 100,000 2,462,746(400,000) (400,000) (470,000) (2,982,746)360,825 472,092
60,825 (100,000) (370,000) 100,000 (47,908)
(197,237) (233,737) (16,791) (447,765)(86,992) (1,995) (88,987)
(194,345) (94,405) (3,481) (203,616) (495,847)316,992 316,992
(391,582) (94,405) (3,481) (3,737) (222,402) (715,607)
26,424 17,660 44,084
26,424 17,660 44,084
(860,773) (442,439) 177,460 131,646 115,146 29,254 61,389860,773 515,510 539,257 75,830 525,282 43,705 3,551,740
$ $ 73,071 $ 716,717 $ 207,476 $ 640,428 $ 72,959 $ 3,613,129
$ (582,452) $ 119,889 $ 164,183 $ 451,977 $ 602,836 $ 17,884 $ 2,276,144
441,964 12,728 812 157,541 107,115 1,909 732,361
(933,745) 105,434 (429,891) (202,163) 1,894,342 (38) (3,026,308)(66,557) 199,372 42,061 (22,882) (158,232) (6,238)
(500,000) (500,000)
680,649 (209,014) 382,546 128,075 (2,242,391) 11,027 1,305,323(69,875) 23,557 (5,194) (7,165) 16,218 (1,528) (462)
52,436 (367,923) (9,666) 53,406 (382,948) 11,370 (1,495,324)
$ (530,016) $ (248,034) $ 154,517 $ 505,383 $ 219,888 $ 29,254 $ 780,820
CentralWarehouse
SpecialFacilities
AutomotiveMaintenance Total
CorrectionalIndustries
RecordsCenter
CentralServices
- 135 -

This Page Intentionally Left Blank
- 136 -
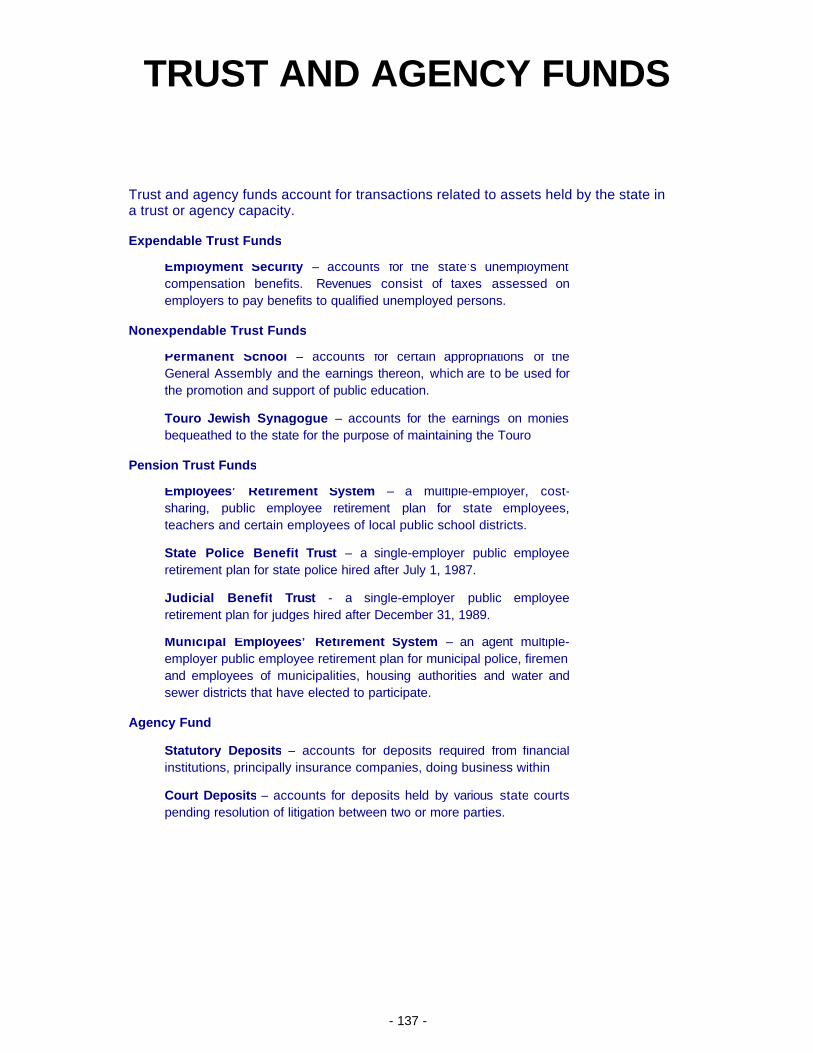
TRUST AND AGENCY FUNDS
Trust and agency funds account for transactions related to assets held by the state in a trust or agency capacity.
Expendable Trust Funds
Employment Security – accounts for the state’s unemploymentcompensation benefits. Revenues consist of taxes assessed onemployers to pay benefits to qualified unemployed persons.
Nonexpendable Trust Funds
Permanent School – accounts for certain appropriations of theGeneral Assembly and the earnings thereon, which are to be used forthe promotion and support of public education.
Touro Jewish Synagogue – accounts for the earnings on moniesbequeathed to the state for the purpose of maintaining the Touro
Pension Trust Funds
Employees’ Retirement System – a multiple-employer, cost-sharing, public employee retirement plan for state employees,teachers and certain employees of local public school districts.
State Police Benefit Trust – a single-employer public employeeretirement plan for state police hired after July 1, 1987.
Judicial Benefit Trust - a single-employer public employeeretirement plan for judges hired after December 31, 1989.
Municipal Employees’ Retirement System – an agent multiple-employer public employee retirement plan for municipal police, firemen and employees of municipalities, housing authorities and water andsewer districts that have elected to participate.
Agency Fund
Statutory Deposits – accounts for deposits required from financialinstitutions, principally insurance companies, doing business within
Court Deposits – accounts for deposits held by various state courtspending resolution of litigation between two or more parties.
- 137 -

STATE OF RHODE ISLAND AND PROVIDENCE PLANTATIONS
COMBINING BALANCE SHEET
TRUST AND AGENCY FUNDSJune 30, 2001
Cash and cash equivalents $ 1,153,662 $ 1,323,274 $ 726,656 $ 42,870 $ 14,373,613 $ 17,620,075Funds on deposit with fiscal agent 293,711,861 293,711,861Investments 6,566,513,881 2,263,338 53,844,476 6,622,621,695Receivables (net) 24,090,307 36,454,883 3,576 60,548,766Due from other funds 7,568,759 137,762 7,706,521Due from other governments
and agencies 1,674,848 1,674,848Fixed assets (net) 9,120,751 9,120,751Other assets 1,545,637 1,545,637
Total assets $ 6,609,992,997 $ 333,302,628 $ 726,656 $ 2,309,784 $ 68,218,089 $ 7,014,550,154
Liabilities:Vouchers and accounts payable $ 5,926,629 $ $ $ $ $ 5,926,629Deposits held for others 68,218,089 68,218,089Due to other funds 85,871 85,871Due to other governments
and agencies 1,109,800 1,109,800Other liabilities 438,543,933 438,543,933
Total liabilities 444,470,562 1,195,671 68,218,089 513,884,322
Fund balances:Reserved for employment
insurance programs 332,106,957 332,106,957Reserved for employees'
pension benefits 6,165,522,435 6,165,522,435Unreserved 726,656 2,309,784 3,036,440
Total fund balances 6,165,522,435 332,106,957 726,656 2,309,784 6,500,665,832
Total liabilities and fund balances $ 6,609,992,997 $ 333,302,628 $ 726,656 $ 2,309,784 $ 68,218,089 $ 7,014,550,154
NonexpendableTrust Funds
PensionTrust
AgencyFunds Total
Touro
SynagogueSchoolJewishPermanent
Liabilities and Fund Balances
Assets
ExpendableTrust Fund
EmploymentSecurity
- 138 -

STATE OF RHODE ISLAND AND PROVIDENCE PLANTATIONS
COMBINING STATEMENT OF PLAN NET ASSETS
PENSION TRUST FUNDS
June 30, 2001
Cash and cash equivalents $ 685,257 $ 173,461 $ 180,635 $ 114,309 $ 1,153,662
Receivables:Member contributions 11,466,584 1,489,260 12,955,844Employer contributions 9,624,894 1,509,569 11,134,463Due from other funds 7,568,759 7,568,759Miscellaneous 1,340,768 195,326 5,511 4,032 1,545,637
Total receivables 30,001,005 3,194,155 5,511 4,032 33,204,703
Investments, at fair value:Equity in short-term investment fund 4,322,868 2,652,647 6,975,515Equity in pooled trust 5,296,571,916 776,856,253 12,354,404 7,886,266 6,093,668,839Plan specific investments 27,325,594 27,325,594
Total investments before lending activities 5,328,220,378 779,508,900 12,354,404 7,886,266 6,127,969,948
Invested securities lending collateral 381,179,145 55,908,125 889,111 567,552 438,543,933
Property and equipment, at cost, net of accumulated depreciation Line of Business System in Development 7,467,544 1,090,313 15,037 9,714 8,582,608 Computer Equipment (net of accumulated depreciation $134,535) 468,329 68,335 897 582 538,143
Total Property and Equipment 7,935,873 1,158,648 15,934 10,296 9,120,751
Total assets 5,748,021,658 839,943,289 13,445,595 8,582,455 6,609,992,997
Securities lending liability 381,179,145 55,908,125 889,111 567,552 438,543,933Vouchers and accounts payable 5,164,143 743,274 11,705 7,507 5,926,629
Total liabilities 386,343,288 56,651,399 900,816 575,059 444,470,562
Net assets held in trustfor pension benefits $ 5,361,678,370 $ 783,291,890 $ 12,544,779 $ 8,007,396 $ 6,165,522,435
Total
JudicialRetirement
BenefitsTrust
State PoliceRetirement
BenefitsTrust
MunicipalEmployees'Retirement
System
Liabilities
Assets
Employees'Retirement
System
- 139 -

STATE OF RHODE ISLAND AND PROVIDENCE PLANTATIONS
COMBINING STATEMENT OF CHANGES IN PLAN NET ASSETS
PENSION TRUST FUNDS
For the Fiscal Year Ended June 30, 2001
Additions:
Contributions:Member contributions $ 120,115,161 $ 15,858,098 $ 615,081 $ 330,424 $ 136,918,764Employer contributions 94,280,315 6,092,688 1,819,930 1,163,571 103,356,504State contributions for teachers 35,365,234 35,365,234Interest on service credits purchased 972,461 127,465 1,099,926
Total contributions 250,733,171 22,078,251 2,435,011 1,493,995 276,740,428
Investment income:Net depreciation in fair value
of investments (833,071,866) (121,990,923) (1,755,616) (1,133,539) (957,951,944)Interest 135,380,467 19,623,649 278,766 180,051 155,462,933Dividends 29,830,012 4,366,801 62,831 40,474 34,300,118Other investment income 19,179,633 2,806,664 39,289 25,427 22,051,013
(648,681,754) (95,193,809) (1,374,730) (887,587) (746,137,880)
Less investment expense 20,180,662 2,952,867 42,299 27,256 23,203,084
Net loss from investing activities (668,862,416) (98,146,676) (1,417,029) (914,843) (769,340,964)
Securities Lending:Securities lending income 11,975,954 1,756,391 27,847 17,777 13,777,969Less securities lending expense (10,931,498) (1,603,339) (25,498) (16,276) (12,576,611)
Net securities lending income 1,044,456 153,052 2,349 1,501 1,201,358
Total net investment loss (667,817,960) (97,993,624) (1,414,680) (913,342) (768,139,606)
Total additions (417,084,789) (75,915,373) 1,020,331 580,653 (491,399,178)
Deductions:
Benefits: Retirement benefits 277,319,497 28,669,422 76,524 306,065,443 Cost of living adjustment 65,615,147 2,889,175 68,504,322 SRA Plus (option) 19,280,077 1,309,124 20,589,201 Supplemental benefits 956,500 956,500 Death benefits post retirement 2,533,440 626,177 3,159,617 Death benefits pre retirement 292,400 92,800 385,200
Total benefits 365,997,061 33,586,698 76,524 399,660,283
Refund of contributions 6,027,280 1,337,479 7,364,759Administrative expense 2,662,558 386,016 2,045 908 3,051,527
Total deductions 374,686,899 35,310,193 2,045 77,432 410,076,569
Net increase (decrease) (791,771,688) (111,225,566) 1,018,286 503,221 (901,475,747)
Net assets held in trust for pension benefits July 1, 2000 6,153,450,058 894,517,456 11,526,493 7,504,175 7,066,998,182
June 30, 2001 $ 5,361,678,370 $ 783,291,890 $ 12,544,779 $ 8,007,396 $ 6,165,522,435
TOTAL(Memorandum
only)
JudicialRetirement
BenefitsTrust
State PoliceRetirement
BenefitsTrust
MunicipalEmployees'Retirement
System
Employees'Retirement
System
- 140 -

STATE OF RHODE ISLAND AND PROVIDENCE PLANTATIONS
COMBINING STATEMENT OF REVENUES, EXPENDITURES, AND CHANGESIN FUND BALANCE
EXPENDABLE TRUST FUND - EMPLOYMENT SECURITYFor the Fiscal Year Ended June 30, 2001
Revenues:Taxes $ 139,847,477Federal grants 1,478,145Interest earnings - funds in trust 18,719,761Other revenues 1,519,678
Total revenues 161,565,061
Other financing sources:Reimbursements from other states 5,481,960
Total revenues and other financing sources 167,047,021
Expenditures:Human services 151,075,062
Total expenditures 151,075,062
Other financing uses:Benefits paid to other states 3,851,298Other 52,038
Total expenditures and other financing uses 154,978,398
Revenues and other financing sources overexpenditures and other financing uses 12,068,623
Fund balance, July 1, 2000, as restated 320,038,334
Fund balance, June 30, 2001 $ 332,106,957
- 141 -

STATE OF RHODE ISLAND AND PROVIDENCE PLANTATIONS
COMBINING STATEMENT OF REVENUES, EXPENSES, AND CHANGES IN FUND BALANCES
NONEXPENDABLE TRUST FUNDSFor the Fiscal Year Ended June 30, 2001
Operating revenues:Fees $ 50,135 $ $ 50,135Investment revenue:
Interest and dividends 35,786 77,885 113,671Net decrease in fair value of investments (280,282) (280,282)
Total operating revenues 85,921 (202,397) (116,476)
Operating expenses:Maintenance 185,892 185,892Brokerage fees 23,257 23,257
Total operating expenses 209,149 209,149
Operating income 85,921 (411,546) (325,625)
Fund balances, July 1, 2000 640,735 2,721,330 3,362,065
Fund balances, June 30, 2001 $ 726,656 $ 2,309,784 $ 3,036,440
School Synagogue TotalPermanent Jewish
Touro
- 142 -

STATE OF RHODE ISLAND AND PROVIDENCE PLANTATIONS
COMBINING STATEMENT OF CASH FLOWS
NONEXPENDABLE TRUST FUNDSFor the Fiscal Year Ended June 30, 2001
Cash flows from operating activities:Fees $ 50,135 $ $ 50,135Maintenance (185,892) (185,892)Brokerage fees (23,257) (23,257)
Net cash provided by (used for) operating activities 50,135 (209,149) (159,014)
Cash flows from investing activities:
Purchase of investments (730,772) (730,772)Proceeds from sale of investments 891,304 891,304Interest and dividends on investments 35,786 77,885 113,671
Net cash provided by investing activities 35,786 238,417 274,203
Net increase (decrease) in cash and cash equivalents 85,921 29,268 115,189Cash and cash equivalents, July 1, 2000 640,735 13,602 654,337
Cash and cash equivalents, June 30, 2001 $ 726,656 $ 42,870 $ 769,526
Reconciliation of operating income to net cashprovided by (used for) operating activities:Operating income $ 85,921 $ (411,546) $ (325,625)
Adjustments to reconcile operating income to net cashprovided by (used for) operating activities:
Income from investments (35,786) 202,397 166,611
Total adjustments (35,786) 202,397 166,611
Net cash provided by (used for) operating activities $ 50,135 $ (209,149) $ (159,014)
Cash and cash equivalents reported on the combining balance sheet are:
Pension Trust Funds $ 1,153,662Expendable Trust Fund:
Employment Security 1,323,274Nonexpendable Trust Funds:
Permanent School 726,656Touro Jewish Synagogue 42,870
Agency Funds 14,373,613
$ 17,620,075
Total
TouroPermanent Jewish
School Synagogue
- 143 -

STATE OF RHODE ISLAND AND PROVIDENCE PLANTATIONS
COMBINING STATEMENT OF CHANGES IN ASSETS AND LIABILITIES
AGENCY FUNDS
For the Fiscal Year Ended June 30, 2001
Statutory Deposits
Assets
Cash and cash equivalents $ 2,588,250 $ 2,161,302 $ $ 4,749,552 Investments 56,097,014 2,252,538 53,844,476
Total assets $ 58,685,264 $ 2,161,302 $ 2,252,538 $ 58,594,028
Liabilities
Deposits held for others $ 58,685,264 $ $ 91,236 $ 58,594,028
Total liabilities $ 58,685,264 $ $ 91,236 $ 58,594,028
Court Deposits
Assets
Cash and cash equivalents $ 8,973,177 $ 650,884 $ $ 9,624,061
Total assets $ 8,973,177 $ 650,884 $ $ 9,624,061
Liabilities
Deposits held for others $ 8,973,177 $ 650,884 $ $ 9,624,061
Total liabilities $ 8,973,177 $ 650,884 $ $ 9,624,061
Total - All Agency Funds
Assets
Cash and cash equivalents $ 11,561,427 $ 2,812,186 $ $ 14,373,613 Investments 56,097,014 2,252,538 53,844,476
Total assets $ 67,658,441 $ 2,812,186 $ 2,252,538 $ 68,218,089
Liabilities
Deposits held for others $ 67,658,441 $ 650,884 $ 91,236 $ 68,218,089
Total liabilities $ 67,658,441 $ 650,884 $ 91,236 $ 68,218,089
DeductionsBalance
June 30, 2001Balance
July 1, 2000 Additions
Balance BalanceJuly 1, 2000 Additions Deductions June 30, 2001
Balance BalanceJuly 1, 2000 Additions Deductions June 30, 2001
- 144 -
GENERAL LONG-TERM DEBTACCOUNT GROUP
The general long-term debt account group is to establish accounting controland accountability for the state's unmatured principle of its general long-termdebt, except for that which is accounted for in the proprietary and trust funds,for which the state is obligated in some manner.
- 145 -

STATE OF RHODE ISLAND AND PROVIDENCE PLANTATIONS
STATEMENT OF GENERAL LONG-TERM DEBT
June 30, 2001
Assets and other debits
Amount available in debt service reserves: Debt service fund $ 734,137 Certificates of participation 2,768,944 R.I. Refunding Bond Authority 16,419,122 Amount to be provided for the retirement of general long-term debt 1,571,782,308
Total $ 1,591,704,511
Liabilities
Compensated absences $ 65,574,353 Obligations under capital leases:
Lease obligations to the R.I. Convention Center Authority 315,805,000 Certificates of participation 126,470,000
Bonds Payable:Current interest bonds 829,033,563 Capital appreciation bonds 24,816,035 Accreted interest on capital appreciation bonds 34,164,719 Revenue bonds - RIRBA 147,385,000
Other long-term liabilities: FHWA ROW Revolving Fund 2,250,000 Violent crimes claims 5,454,697 Arbitrage rebate payable 13,656,451 Negotiated settlements 17,986,123 Retainage payable - ISTEA 8,935,160 Due to federal government - ISTEA 173,410
Total $ 1,591,704,511
- 146 -

STATE OF RHODE ISLAND AND PROVIDENCE PLANTATIONS
STATEMENT OF CHANGES IN GENERAL LONG-TERM DEBT
For the Fiscal Year Ended June 30, 2001
Balance BalanceJuly 1, 2000 Additions Reductions June 30, 2001
General obligation bonds payable: Current interest bonds $ 849,768,581 $ 149,935,000 $ 170,670,018 $ 829,033,563 Capital appreciation bonds 31,289,264 6,473,229 24,816,035 Accreted interest on capital appreciation bonds 36,345,902 5,118,588 7,299,771 34,164,719 Revenue bonds - R.I. Refunding Bond Authority 161,210,000 13,825,000 147,385,000
Bonds payable 1,078,613,747 155,053,588 198,268,018 1,035,399,317
Lease obligations to the R.I. Convention Center Authortiy 322,930,000 7,125,000 315,805,000 Certificates of participation 102,013,000 31,330,000 6,873,000 126,470,000
Obligations under capital leases 424,943,000 31,330,000 13,998,000 442,275,000
Compensated absences 65,007,407 6,235,528 5,668,582 65,574,353 Other long-term liabilities: FHWA ROW Revolving Fund 2,250,000 2,250,000 Violent crimes claims 10,842,991 5,388,294 5,454,697 Arbitrage rebate payable 6,607,835 7,048,616 13,656,451 Negotiated settlements 17,986,123 17,986,123 Retainage payable - ISTEA 8,935,160 8,935,160 Due to federal government - ISTEA 173,410 173,410
$ 1,588,264,980 $ 226,762,425 $ 223,322,894 $ 1,591,704,511
- 147 -

This Page Intentionally Left Blank
- 148 -
COMPONENT UNITS
- 149 -

STATE OF RHODE ISLAND AND PROVIDENCE PLANTATIONS
COMBINING BALANCE SHEET
DISCRETELY PRESENTED GOVERNMENTAL COMPONENT UNITS
June 30, 2001
Cash and cash equivalents $ 37,305,803 $ 6,276,147 $ 6,584,341 $ 4,949,833 $ 55,116,124Investments 1,165,378 1,165,378Receivables (net) 28,428,037 8,217,731 1,459,327 708,782 38,813,877Due from primary government 857,692 866,840 422,098 2,146,630Inventories 1,794,296 494,217 541,648 2,830,161Fixed assets (net) 19,236,690 19,236,690Other assets 37,047,589 1,467,225 74,968 38,589,782Amount available in debt service reserves 209,345 591,031 800,376Amount to be provided for retirement of
general long-term obligations 87,569,954 22,451,481 10,378,381 1,287,802 121,687,618
Total assets $ 212,240,061 $ 41,148,364 $ 20,051,794 $ 6,946,417 $ 280,386,636
Liabilities:Cash overdraft $ 5,495,100 $ $ $ 335,515 $ 5,830,615Vouchers and accounts payable 21,647,052 5,051,313 3,231,161 2,781,430 32,710,956Due to primary government 900,995 402,482 496,336 1,799,813Deferred revenue 9,725,491 1,422,302 1,391,798 12,539,591Other current liabilities 1,874,008 2,320,704 475,169 160,606 4,830,487Compensated absences 22,005,805 4,366,867 4,956,535 1,268,949 32,598,156Notes payable 2,271,846 2,271,846Loans payable 861,181 861,181Obligations under capital leases 16,767,838 2,886,790 1,950,026 18,853 21,623,507Bonds payable 87,323,283 13,555,323 4,062,851 104,941,457
Total liabilities 166,600,753 32,277,627 16,563,876 4,565,353 220,007,609
Fund equity:Retained earnings 15,126,993 15,126,993Fund balances:
Reserved 60,219,796 8,750,873 3,487,918 576,939 73,035,526Unreserved:
Undesignated (deficit) (29,707,481) 119,864 1,804,125 (27,783,492)
Total fund equity 45,639,308 8,870,737 3,487,918 2,381,064 60,379,027
Total liabilities and fund equity $ 212,240,061 $ 41,148,364 $ 20,051,794 $ 6,946,417 $ 280,386,636
Liabilities and Fund Equity
Rhode IslandAssets
University ofTotalCollege School District
Central FallsRhode Island
CommunityCollege of
Rhode Island
- 150 -

STATE OF RHODE ISLAND AND PROVIDENCE PLANTATIONS
COMBINING STATEMENT OF REVENUES, EXPENDITURES, AND CHANGESIN FUND EQUITY
DISCRETELY PRESENTED GOVERNMENTAL COMPONENT UNITS
For the Fiscal Year Ended June 30, 2001
Revenues:Sales and services $ 129,632,320 $ 38,571,288 $ 24,454,601 $ 148,619 $ 192,806,828Federal grants 55,300,421 6,875,686 6,575,817 68,751,924Other revenues 33,086,532 2,312,487 3,423,352 2,247,370 41,069,741
Total revenues 218,019,273 47,759,461 34,453,770 2,395,989 302,628,493
Other financing sources:Bond and loan proceeds 8,328,827 1,010,126 9,338,953Operating transfers from primary government 82,134,164 42,641,830 38,968,039 35,190,665 198,934,698Other 350,000 350,000
Total revenues and other financing sources 308,482,264 91,761,417 73,421,809 37,586,654 511,252,144
Expenditures:Current:
Education 290,022,294 87,052,277 71,474,862 35,618,696 484,168,129Capital outlays 26,650,093 2,321,719 1,375,957 920,177 31,267,946Debt service:
Principal 598,678 25,239 623,917Interest 1,860,491 249,674 393,428 2,503,593
Total expenditures 319,131,556 89,623,670 73,269,486 36,538,873 518,563,585
Other financing uses:Operating transfers out to primary government 3,161,748 1,031,308 179,768 4,372,824Other 32,858 32,858
Total expenditures and other financing uses 322,326,162 90,654,978 73,449,254 36,538,873 522,969,267
Revenues and other financing sources over (under)expenditures and other financing uses (13,843,898) 1,106,439 (27,445) 1,047,781 (11,717,123)
Net gain from proprietary operations 13,880,596 13,880,596
Fund equity, July 1, 2000 45,602,610 7,764,298 3,515,363 1,333,283 58,215,554
Fund equity, June 30, 2001 $ 45,639,308 $ 8,870,737 $ 3,487,918 $ 2,381,064 $ 60,379,027
College Rhode IslandRhode IslandCentral Falls
School District TotalUniversity of Rhode Island
CommunityCollege of
- 151 -
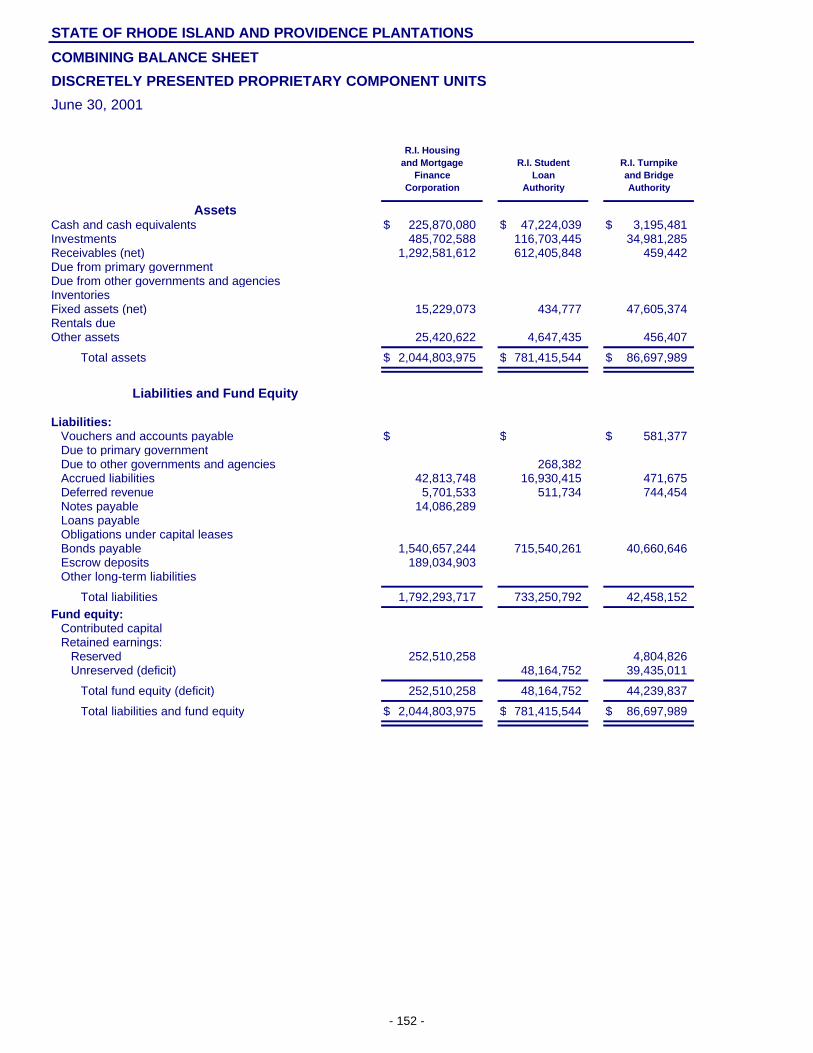
STATE OF RHODE ISLAND AND PROVIDENCE PLANTATIONS
COMBINING BALANCE SHEET
DISCRETELY PRESENTED PROPRIETARY COMPONENT UNITS
June 30, 2001
Cash and cash equivalents $ 225,870,080 $ 47,224,039 $ 3,195,481Investments 485,702,588 116,703,445 34,981,285Receivables (net) 1,292,581,612 612,405,848 459,442Due from primary governmentDue from other governments and agenciesInventoriesFixed assets (net) 15,229,073 434,777 47,605,374Rentals dueOther assets 25,420,622 4,647,435 456,407
Total assets $ 2,044,803,975 $ 781,415,544 $ 86,697,989
Liabilities:Vouchers and accounts payable $ $ $ 581,377Due to primary governmentDue to other governments and agencies 268,382Accrued liabilities 42,813,748 16,930,415 471,675Deferred revenue 5,701,533 511,734 744,454Notes payable 14,086,289Loans payableObligations under capital leasesBonds payable 1,540,657,244 715,540,261 40,660,646Escrow deposits 189,034,903Other long-term liabilities
Total liabilities 1,792,293,717 733,250,792 42,458,152Fund equity:
Contributed capitalRetained earnings:
Reserved 252,510,258 4,804,826Unreserved (deficit) 48,164,752 39,435,011
Total fund equity (deficit) 252,510,258 48,164,752 44,239,837
Total liabilities and fund equity $ 2,044,803,975 $ 781,415,544 $ 86,697,989
Liabilities and Fund Equity
Authority
R.I. Housingand Mortgage
FinanceCorporation Authority
R.I. StudentLoan
R.I. Turnpikeand Bridge
Assets
- 152 -

STATE OF RHODE ISLAND AND PROVIDENCE PLANTATIONS
$ 75,142,789 $ 8,202,135 $ 18,248,250 $ 322,188 $ 1,568,596 $ 14,584,93949,391,955 21,417,751 7,296,180 11,991,75948,512,445 1,901,414 10,590,979 2,243,257 6,424,123 138,997
665,5969,616,756
326,585,549 213,566,286 229,792,093 10,100 53,795,816 18,986
4,449,954 6,699,066 1,960,609 20,001 55,014,834 6,573,954
$ 514,365,044 $ 251,786,652 $ 260,591,931 $ 9,891,726 $ 128,795,128 $ 21,316,876
$ 2,733,200 $ 1,512,623 $ 4,426,983 $ $ 4,785,331 $2,235,108 32,260 1,000,000
260,6324,885,975 3,379,697 2,471,149 12,643 353,230 628,109
722,583 868,001431,000 2,053,286
52,843,47228,199,533 203,214
244,995,686 295,011,384 18,321,154
13,923,084 207,683 42,948,161 253,215
295,168,478 304,914,681 79,634,548 12,643 48,086,722 1,881,324
144,657,378 143,275,761
101,24174,539,188 (53,128,029) 37,580,381 9,879,083 80,708,406 19,435,552
219,196,566 (53,128,029) 180,957,383 9,879,083 80,708,406 19,435,552
$ 514,365,044 $ 251,786,652 $ 260,591,931 $ 9,891,726 $ 128,795,128 $ 21,316,876
Continued
CorporationCommissionAuthority Corporation
R.I. DepositorsEconomicProtection
Corporation
NarragansettBay
R.I. Health andEducational
BuildingR.I. Resource
RecoveryR.I. EconomicDevelopmentCorporation
R.I. ConventionCenter
- 153 -

STATE OF RHODE ISLAND AND PROVIDENCE PLANTATIONS
COMBINING BALANCE SHEET (Continued)
DISCRETELY PRESENTED PROPRIETARY COMPONENT UNITS
June 30, 2001
Cash and cash equivalents $ 14,524,344 $ 7,229,043 $ 1,001,044Investments 486,846,566Receivables (net) 725,257 1,976,196 128,057Due from primary government 8,925 2,378,552Due from other governments and agencies 2,464,122 13,579,116Inventories 1,967,854Fixed assets (net) 1,496,062 75,434,547Rentals dueOther assets 7,656,820 268,921
Total assets $ 513,722,096 $ 102,834,229 $ 1,129,101
Liabilities:Vouchers and accounts payable $ 6,937,981 $ 17,174,035 $ 10,000Due to primary government 33,148 1,646,661Due to other governments and agencies 17,739,316Accrued liabilities 284,633 8,629,520Deferred revenue 288,168 194,539 875Notes payable 434,956Loans payableObligations under capital leasesBonds payableEscrow deposits 653,671Other long-term liabilities 935,000 20,050
Total liabilities 26,653,202 27,664,805 664,546Fund equity:
Contributed capital 81,132,193Retained earnings:
Reserved 476,629,974Unreserved (deficit) 10,438,920 (5,962,769) 464,555
Total fund equity (deficit) 487,068,894 75,169,424 464,555
Total liabilities and fund equity $ 513,722,096 $ 102,834,229 $ 1,129,101
Liabilities and Fund Equity
TransitAuthority
R.I. IndustrialFacilities
Corporation
R.I. HigherEducationAssistanceAuthority
R.I. Public
Assets
- 154 -

STATE OF RHODE ISLAND AND PROVIDENCE PLANTATIONS
$ 35,236,475 $ 3,220,138 $ 3,339,100 $ 736,995 $ 382,013 $ 460,027,64984,281,906 4,160,783 1,640,383 10,352,227 1,314,766,828
189,127,098 693,783 373,557 68,289 584,906 2,168,935,2603,053,073
25,659,9941,967,854
35,779 634,635 4,681,299 105,023 969,425,3997,815,000 7,815,000
1,487,299 6,626 473,352 458,266 47,608,480 163,202,646
$ 310,168,557 $ 4,555,182 $ 16,161,792 $ 7,585,232 $ 59,032,649 $ 5,114,853,703
$ 168,849 $ 23,177 $ 11,007 $ 69,613 $ 457,260 $ 38,891,43611,337 4,958,514
18,268,3303,495,696 280,587 456,200 85,093,277
965,780 15,217 10,012,88417,005,53152,843,472
6,278,234 34,680,981178,039,450 15,939,578 3,049,165,403
653,671 190,342,2451,765,799 55,750,000 115,802,992
181,703,995 2,442,647 17,196,952 6,830,601 56,207,260 3,617,065,065
369,065,332
734,046,299128,464,562 2,112,535 (1,035,160) 754,631 2,825,389 394,677,007
128,464,562 2,112,535 (1,035,160) 754,631 2,825,389 1,497,788,638
$ 310,168,557 $ 4,555,182 $ 16,161,792 $ 7,585,232 $ 59,032,649 $ 5,114,853,703
Concluded
Total
R.I. Children'sCrusade for
HigherEducation
R.I. PublicTelecommuni-
cationsAuthority
R.I. WaterResources
BoardCorporate
R.I. CleanWater Finance
Agency
R.I. Industrial-Recreational
BuildingAuthority
- 155 -

STATE OF RHODE ISLAND AND PROVIDENCE PLANTATIONS
COMBINING STATEMENT OF REVENUES, EXPENSES, AND CHANGESIN FUND EQUITY
DISCRETELY PRESENTED PROPRIETARY COMPONENT UNITS
For the Fiscal Year Ended June 30, 2001
Operating revenues:Charges for services $ 4,091,974 $ $ 11,223,554Interest on loans 93,007,332 55,126,597Interest on investments 30,050,539Net increase (decrease) in fair value of investments 2,043,183 217,231Other operating revenue 1,147,991
Total operating revenues 130,341,019 55,343,828 11,223,554Operating expenses:
Personal services 8,602,575 1,251,856 1,544,068Supplies, materials, and services 8,666,505 3,074,478 1,580,189Interest expense 89,893,620 31,413,887Grant, scholarships, and contract programsDepreciation, depletion, and amortization 2,742,103 459,987 855,391Other operating expenses 10,182,928 12,259,045 1,302,556
Total operating expenses 120,087,731 48,459,253 5,282,204
Operating income (loss) 10,253,288 6,884,575 5,941,350Nonoperating revenues (expenses):
Interest revenue 3,238,598GrantsGain (loss) on sale of property (1,123)Interest expense (1,984,969)Other nonoperating revenues (expenses) 106,116
Total nonoperating revenue (expenses) 1,358,622
Income (loss) before transfers 10,253,288 6,884,575 7,299,972Operating transfers from primary governmentOperating transfers from (to) component unitsOperating transfers to primary government
Income (loss) before extraordinary items 10,253,288 6,884,575 7,299,972Extraordinary items (895,453)
Net income (loss) 9,357,835 6,884,575 7,299,972Other changes in fund equity:
Increase (decrease) in contributed capitalOther 3,650,044
Net increase (decrease) in fund equity 13,007,879 6,884,575 7,299,972Fund equity (deficit), July 1, 2000, as restated 239,502,379 41,280,177 36,939,865
Fund equity (deficit), June 30, 2001 $ 252,510,258 $ 48,164,752 $ 44,239,837
R.I. Housingand Mortgage
FinanceCorporation
R.I. StudentLoan
Authority
R.I. Turnpikeand BridgeAuthority
- 156 -

STATE OF RHODE ISLAND AND PROVIDENCE PLANTATIONS
$ 43,595,807 $ 40,778,039 $ 29,818,802 $ 1,058,523 $ 49,516,679 $661,341 102,914 6,138
1,337,343
588,922 1,237,640 22,554,263
44,257,148 41,366,961 29,818,802 1,161,437 52,091,662 22,560,401
15,539,517 14,942,903 11,809,558 191,077 8,181,022 703,92622,712,923 18,562,913 11,409,269 322,995 24,744,295 856,182
1,578,65914,601,630 9,207,242 5,388,068 3,687 9,372,960 1,986
823,675
52,854,070 42,713,058 28,606,895 517,759 43,876,936 2,385,769
(8,596,922) (1,346,097) 1,211,907 643,678 8,214,726 20,174,632
6,394,279 1,586,831 494,964 351,759 1,129,349(17,213,210) 228,265
443,390(13,459,475) (18,876,158) (2,563,511) (216,346)13,358,526 1,219,246 98,289
(10,476,490) (17,289,327) (621,036) 351,759 1,011,292
(19,073,412) (18,635,424) 590,871 995,437 8,214,726 21,185,92413,479,823 19,420,385 1,261,689
250,000(1,896,268) (633,522) (3,115,000) (30,202,557)
(7,239,857) 784,961 (42,651) 995,437 5,099,726 (7,754,944)904,749
(7,239,857) 784,961 (42,651) 995,437 5,099,726 (6,850,195)
(20,616,076) 5,089
(27,855,933) 784,961 (37,562) 995,437 5,099,726 (6,850,195)247,052,499 (53,912,990) 180,994,945 8,883,646 75,608,680 26,285,747
$ 219,196,566 $ (53,128,029) $ 180,957,383 $ 9,879,083 $ 80,708,406 $ 19,435,552
Continued
R.I. EconomicDevelopmentCorporation
R.I. ConventionCenter
Authority Commission
R.I. Health andEducational
BuildingCorporation
NarragansettBay
R.I. ResourceRecovery
Corporation
R.I. DepositorsEconomicProtection
Corporation
- 157 -

STATE OF RHODE ISLAND AND PROVIDENCE PLANTATIONS
COMBINING STATEMENT OF REVENUES, EXPENSES, AND CHANGESIN FUND EQUITY (Continued)
DISCRETELY PRESENTED PROPRIETARY COMPONENT UNITS
For the Fiscal Year Ended June 30, 2001
Operating revenues:Charges for services $ 5,742,457 $ 12,100,081 $ 175,915Interest on loansInterest on investmentsNet increase (decrease) in fair value of investmentsOther operating revenue 68,096
Total operating revenues 5,810,553 12,100,081 175,915Operating expenses:
Personal services 2,250,229 35,763,807Supplies, materials, and services 3,161,530 17,818,982 12,336Interest expenseGrant, scholarships, and contract programs 7,027,760Depreciation, depletion, and amortization 183,521 5,703,489Other operating expenses 156,543
Total operating expenses 12,779,583 59,286,278 12,336
Operating income (loss) (6,969,030) (47,186,197) 163,579Nonoperating revenues (expenses):
Interest revenue 586,233 431,850 17,167Grants 221,634Gain (loss) on sale of property (10,426)Interest expense (29,534) (5,069)Other nonoperating revenues (expenses) 337,308 5,487,701
Total nonoperating revenue (expenses) 1,115,641 5,904,056 17,167
Income (loss) before transfers (5,853,389) (41,282,141) 180,746Operating transfers from primary government 7,538,171 36,964,154Operating transfers from (to) component units (250,000)Operating transfers to primary government (647,222)
Income (loss) before extraordinary items 1,684,782 (4,965,209) (69,254)Extraordinary items
Net income (loss) 1,684,782 (4,965,209) (69,254)Other changes in fund equity:
Increase (decrease) in contributed capital 28,098,773Other 468,552,410
Net increase (decrease) in fund equity 470,237,192 23,133,564 (69,254)Fund equity (deficit), July 1, 2000, as restated 16,831,702 52,035,860 533,809
Fund equity (deficit), June 30, 2001 $ 487,068,894 $ 75,169,424 $ 464,555
R.I. HigherEducationAssistanceAuthority
R.I. PublicTransit
Authority
R.I. IndustrialFacilities
Corporation
- 158 -

STATE OF RHODE ISLAND AND PROVIDENCE PLANTATIONS
$ 868,066 $ 235,014 $ 1,714,874 $ 1,392,476 $ $ 202,312,26111,839,068 37,452 160,780,842
281,495 31,669,377(189,623) (454,745) 1,616,046
980,856 108,735 356,401 2,064,450 29,107,354
13,687,990 381,201 1,714,874 1,559,254 1,891,200 425,485,880
272,431 28,089 1,859,322 2,029,516 104,969,8961,314,660 80,732 1,376,337 888,260 116,582,5868,960,486 130,267,993
3,137,143 11,743,56283,211 14,286 112,819 767,217 69,751 49,567,348
1,620,509 26,345,256
10,630,788 1,715,527 140,908 4,002,876 6,124,670 439,476,641
3,057,202 (1,334,326) 1,573,966 (2,443,622) (4,233,470) (13,990,761)
174,140 520,559 14,925,72915,179,859 (1,510,104) 1,733,055 (1,360,501)
431,841(914,438) (296,619) (38,346,119)
1,292,779 21,899,965
15,179,859 174,140 (1,903,983) 1,436,436 1,292,779 (2,449,085)
18,237,061 (1,160,186) (330,017) (1,007,186) (2,940,691) (16,439,846)1,243,915 1,685,040 81,593,177
(36,494,569)
18,237,061 (1,160,186) (330,017) 236,729 (1,255,651) 28,658,7629,296
18,237,061 (1,160,186) (330,017) 236,729 (1,255,651) 28,668,058
7,487,786744,840 472,947,294
18,237,061 (1,160,186) (330,017) 236,729 (510,811) 509,103,138110,227,501 3,272,721 (705,143) 517,902 3,336,200 988,685,500
$ 128,464,562 $ 2,112,535 $ (1,035,160) $ 754,631 $ 2,825,389 $ 1,497,788,638
Concluded
R.I. CleanWater Finance
Agency
R.I. Industrial-Recreational
BuildingAuthority
R.I. WaterResources
BoardCorporate
R.I. PublicTelecommuni-
cationsAuthority Total
R.I. Children'sCrusade for
HigherEducation
- 159 -

STATE OF RHODE ISLAND AND PROVIDENCE PLANTATIONS
COMBINING STATEMENT OF CASH FLOWS
DISCRETELY PRESENTED PROPRIETARY COMPONENT UNITS
For the Fiscal Year Ended June 30, 2001
Cash flows from operating activities:Cash received from customers $ 244,227,660 $ 137,537,714 $ 11,279,471Cash received from grantsCollections from loans and receivership assetsCash payments to suppliers for goods and services (13,209,459) (12,222,453) (3,922,788)Cash payments to employees for services (8,602,575) (1,234,481) (1,178,852)Loans issued (110,418,949)Cash payments for claims, grants, and scholarships (163,755,931)Other operating revenue 11,001,571 193,889 35,618Other operating expenses
Net cash provided by (used for) operating activities 122,998,248 (39,481,262) 6,213,449Cash flows from noncapital financing activities:
Proceeds from issuance of long-term debt 213,400,000 110,000,000Payment of bonds and notes (192,624,523) (17,765,000)Payment of interest (90,205,285) (31,896,445)Proceeds from grantsCollection of loans and mortgagesContract revenueOperating transfers from primary governmentOperating transfers to primary governmentOperating transfers from (to) component unitsGrants issuedNegative cash balance implicitly financed (361,145)
Net cash provided by (used for) noncapital financing activities (69,429,808) 59,977,410Cash flows from capital and related financing activities:
Principal paid on revenue bonds (1,490,000)Proceeds from issuance of long-term debtPayment of interest (1,990,060)Payment of notes and loansPayment of capital lease obligationsPayment of financing costs (652,819)Payment for the purchase of program rightsAcquisition of capital assets (69,568) (2,338,207)Contributed capitalProceeds from capital grantsProceeds from sale of assets
Net cash provided (used for) capital and related financing activities (722,387) (5,818,267)Cash flows from investing activities:
Purchase of investments (375,360,733) (170,997,931) (22,295,000)Proceeds from sale and maturity of investments 358,023,205 143,967,471 19,882,906Interest on investments 29,672,685 7,256,388 2,139,273
Net cash provided by (used for) investing activities 12,335,157 (19,774,072) (272,821)
Net increase (decrease) in cash and cash equivalents 65,903,597 (311) 122,361Cash and cash equivalents, July 1, 2000 154,424,909 47,224,350 3,073,120
Cash and cash equivalents, June 30, 2001 $ 220,328,506 $ 47,224,039 $ 3,195,481
R.I. Housingand Mortgage
FinanceCorporation
R.I. StudentLoan
Authority
R.I. Turnpikeand BridgeAuthority
- 160 -

STATE OF RHODE ISLAND AND PROVIDENCE PLANTATIONS
R.I. EconomicDevelopmentCorporation
$ 43,631,665 $ 41,507,720 $ 29,443,176 $ 1,071,167 $ 50,488,295 $ 6,138
102,914 16,823,547(19,157,357) (20,231,173) (8,658,669) (21,606,550) (2,479,377)(15,957,094) (14,810,821) (11,673,239) (508,485) (7,595,680)
(6,089,440)765,080 1,085,805 132,002
(463,389)
8,517,214 6,465,726 9,876,348 665,596 16,282,430 14,018,921
(40,321,025)(1,286,158)
183,738 164,962
12,817,135 19,177,328 10,744,323(4,523,881) (3,115,000) (39,400,000)
250,000
8,726,992 19,177,328 164,962 (3,115,000) (70,262,860)
(7,125,000) (3,108,263)1,900,000
(15,249,829) (16,991,063) (2,525,272) (199,444)(4,747,124) (5,000,000)
(3,246)
(24,553,895) (2,438,726) (9,241,246) (5,719) (17,585,989)7,640,326 5,089
13,473,0081,482,661 4,500 358,761
(21,954,853) (24,650,289) (14,872,938) (5,719) (22,426,672)
(718,188) (28,284,744) (16,826,611)742,104 26,685,321 24,396,807 10,596,196
8,711,808 1,593,814 494,964 399,218 1,340,585 1,277,356
7,993,620 2,335,918 494,964 (1,200,205) 8,910,781 11,873,552
3,282,973 3,328,683 (4,336,664) (540,328) (348,461) (44,370,387)71,859,816 4,873,452 22,584,914 862,516 1,917,057 58,955,326
$ 75,142,789 $ 8,202,135 $ 18,248,250 $ 322,188 $ 1,568,596 $ 14,584,939
Continued
R.I. ConventionCenter
Authority
R.I. DepositorsEconomicProtection
Corporation
R.I. ResourceRecovery
Corporation
R.I. Health andEducational
BuildingCorporationCommission
NarragansettBay
- 161 -

STATE OF RHODE ISLAND AND PROVIDENCE PLANTATIONS
COMBINING STATEMENT OF CASH FLOWS (Continued)
DISCRETELY PRESENTED PROPRIETARY COMPONENT UNITS
For the Fiscal Year Ended June 30, 2001
Cash flows from operating activities:Cash received from customers $ 5,064,658 $ 11,411,591 $ 223,056Cash received from grants 213,158Collections from loans and receivership assetsCash payments to suppliers for goods and services (3,506,255) (28,341,876) (33,336)Cash payments to employees for services (2,244,333) (25,030,327)Loans issuedCash payments for claims, grants, and scholarships (7,127,560)Other operating revenue 337,308 1,695,701 640,765Other operating expenses (679,945)
Net cash provided by (used for) operating activities (7,263,024) (40,264,911) 150,540Cash flows from noncapital financing activities:
Proceeds from issuance of long-term debtPayment of bonds and notesPayment of interest (29,534) (5,069)Proceeds from grantsCollection of loans and mortgagesContract revenue 4,083,117Operating transfers from primary government 7,579,680 26,371,268 32,825Operating transfers to primary government (647,222)Operating transfers from (to) component units (250,000)Grants issuedNegative cash balance implicitly financed
Net cash provided by (used for) noncapital financing activities 7,550,146 29,802,094 (217,175)Cash flows from capital and related financing activities:
Principal paid on revenue bondsProceeds from issuance of long-term debtPayment of interestPayment of notes and loansPayment of capital lease obligationsPayment of financing costsPayment for the purchase of program rightsAcquisition of capital assets (95,959) (17,376,053)Contributed capital 17,183,921Proceeds from capital grants 10,107,010Proceeds from sale of assets
Net cash provided (used for) capital and related financing activities (95,959) 9,914,878Cash flows from investing activities:
Purchase of investments (6,860,110)Proceeds from sale and maturity of investments 5,005,555Interest on investments 224,463 431,850 17,167
Net cash provided by (used for) investing activities (1,630,092) 431,850 17,167
Net increase (decrease) in cash and cash equivalents (1,438,929) (116,089) (49,468)Cash and cash equivalents, July 1, 2000 2,829,964 7,345,132 1,050,512
Cash and cash equivalents, June 30, 2001 $ 1,391,035 $ 7,229,043 $ 1,001,044
R.I. IndustrialFacilities
Corporation
R.I. PublicTransit
Authority
R.I. HigherEducationAssistanceAuthority
- 162 -

STATE OF RHODE ISLAND AND PROVIDENCE PLANTATIONS
$ $ 213,563 $ 2,451,559 $ 1,601,826 $ $ 580,159,2591,672,050 1,885,208
16,926,461(1,121,221) (97,352) (28,089) (863,005) (135,478,960)
(272,431) (3,023,274) (2,029,516) (94,161,108)(110,418,949)
(667,772) (177,640,703)146,187 214,871 16,248,797
(421,152) (1,564,486)
(1,393,652) (158,754) 2,423,470 (1,421,448) (1,673,372) 95,955,519
26,506,667 349,906,667(4,707,437) (255,417,985)(8,702,119) (132,124,610)16,160,715 702,703 17,212,118
317,667 317,6674,083,117
2,285,604 1,685,040 80,693,203(47,686,103)
(1,510,104) (1,510,104)(361,145)
29,257,826 317,667 (1,510,104) 2,988,307 1,685,040 15,112,825
(1,180,000) (12,903,263)1,900,000
(928,357) (296,619) (38,180,644)(9,747,124)
(719,132) (3,666) (722,798)(656,065)
(497,512) (497,512)(13,197) (120,156) (65,289) (73,904,004)
24,829,33623,580,0181,845,922
(13,197) (2,108,357) (1,633,419) (68,955) (84,456,134)
(51,678,210) (2,106,285) (675,127,812)22,902,686 (1,546,285) 406,986 1,868,965 612,931,91712,716,078 174,140 507,307 (189,623) 281,495 67,048,968
(16,059,446) 174,140 (1,038,978) 217,363 44,175 4,853,073
11,791,531 333,053 (2,233,969) 150,803 (13,112) 31,465,28323,444,944 2,887,085 5,573,069 586,192 395,125 409,887,483
$ 35,236,475 $ 3,220,138 $ 3,339,100 $ 736,995 $ 382,013 $ 441,352,766
Continued
Total
R.I. CleanWater Finance
Agency
R.I. Children'sCrusade for
HigherEducation
R.I. PublicTelecommuni-
cationsAuthority
R.I. WaterResources
BoardCorporate
R.I. Industrial-Recreational
BuildingAuthority
- 163 -

STATE OF RHODE ISLAND AND PROVIDENCE PLANTATIONS
COMBINING STATEMENT OF CASH FLOWS (Continued)
DISCRETELY PRESENTED PROPRIETARY COMPONENT UNITS
For the Fiscal Year Ended June 30, 2001
Reconciliation of operating income (loss) to net cashprovided by (used for) operating activities:Operating income (loss) $ 10,253,288 $ 6,884,575 $ 5,941,350
Adjustments to reconcile operating income (loss) tonet cash provided by (used for) operating activities:
Depreciation, depletion, and amortization 2,742,103 459,987 855,391Interest on investments and other income (33,997,471) (6,921,954)Interest expense and other charges 89,981,148 31,413,887Provision for cost of scholarshipsLandfill postclosure costs(Increase) decrease in assets:
Receivables 39,080,009 (76,026,089) (2,591)InventoriesPrepaid items (95,359) 83,272Other assets (3,484,371) (195,124)
Increase (decrease) in liabilities:Accounts payable and accrued expenses 4,974,678 4,958,050 (758,099)Deferred revenue (93,420) 40,765 94,126Escrow deposits 13,542,284
Subtotal 112,744,960 (46,365,837) 272,099
Net cash provided by (used for) operating activities $ 122,998,248 $ (39,481,262) $ 6,213,449
Noncash investing, capital, and financing activities:Assets acquired through loan program $ $ $Interest capitalizedLand transfers
Total noncash transactions $ $ $
R.I. Housingand Mortgage
FinanceCorporation
R.I. StudentLoan
Authority
R.I. Turnpikeand BridgeAuthority
- 164 -

STATE OF RHODE ISLAND AND PROVIDENCE PLANTATIONS
$ (8,596,922) $ (1,346,097) $ 1,211,907 $ 643,678 $ 8,214,726 $ 20,174,632
14,601,630 9,207,242 5,388,068 3,687 9,372,960 1,986(1,489,178) (6,144,380)
459,756
(1,828,536)
273,040 231,154 (47,206) 12,644 971,671 1,923,487
(158,886) 45,000 (380) (11,981)(110,423) 270,878 697 (506,138) (177,851)
2,508,775 (1,897,451) 2,846,972 5,270 1,546,925 (1,746,972)(28,149)
17,114,136 7,811,823 8,664,441 21,918 8,067,704 (6,155,711)
$ 8,517,214 $ 6,465,726 $ 9,876,348 $ 665,596 $ 16,282,430 $ 14,018,921
$ $ $ 7,550,393 $ $ $99,866
1,050,000 (1,887,197)
$ 1,050,000 $ $ 7,650,259 $ $ $ (1,887,197)
Continued
R.I. DepositorsEconomicProtection
Corporation
R.I. ResourceRecovery
Corporation
R.I. Health andEducational
BuildingCorporation
NarragansettBay
Commission
R.I. ConventionCenter
Authority
R.I. EconomicDevelopmentCorporation
- 165 -

STATE OF RHODE ISLAND AND PROVIDENCE PLANTATIONS
COMBINING STATEMENT OF CASH FLOWS (Continued)
DISCRETELY PRESENTED PROPRIETARY COMPONENT UNITS
For the Fiscal Year Ended June 30, 2001
Reconciliation of operating income (loss) to net cashprovided by (used for) operating activities:Operating income (loss) $ (6,969,030) $ (47,186,197) $ 163,579
Adjustments to reconcile operating income (loss) tonet cash provided by (used for) operating activities:
Depreciation, depletion, and amortization 183,521 5,703,489Interest on investments and other income 608,442 1,695,701Interest expense and other chargesProvision for cost of scholarshipsLandfill postclosure costs(Increase) decrease in assets:
Receivables 57,989 (685,218) (12,439)Inventories 113,649Prepaid items (7,810) (83,499)Other assets
Increase (decrease) in liabilities:Accounts payable and accrued expenses (962,416) 180,436Deferred revenue (173,720) (3,272) (600)Escrow deposits
Subtotal (293,994) 6,921,286 (13,039)
Net cash provided by (used for) operating activities $ (7,263,024) $ (40,264,911) $ 150,540
Noncash investing, capital, and financing activities:Assets acquired through loan program $ $ $Interest capitalizedLand transfers
Total noncash transactions $ $ $
R.I. IndustrialFacilities
Corporation
R.I. PublicTransit
Authority
R.I. HigherEducationAssistanceAuthority
- 166 -

STATE OF RHODE ISLAND AND PROVIDENCE PLANTATIONS
$ 3,057,202 $ (1,334,326) $ 1,573,966 $ (2,443,622) $ (4,233,470) $ (13,990,761)
83,211 14,286 112,819 767,217 69,751 49,567,348(13,971,547) 189,623 1,466,029 (58,564,735)
8,960,486 130,815,2771,100,000 1,100,000
(1,828,536)
(21,451) 43,106 24,153 (177,529) (34,355,270)113,649
109,085 (4,428) (5,713) (130,699)(10,000) 685,000 (3,527,332)
367,911 1,197,165 2,330 41,827 101,847 13,367,2486,249 5,067 (152,954)
13,542,284
(4,450,854) 1,175,572 849,504 1,022,174 2,560,098 109,946,280
$ (1,393,652) $ (158,754) $ 2,423,470 $ (1,421,448) $ (1,673,372) $ 95,955,519
$ $ $ $ $ $ 7,550,39399,866
(837,197)
$ $ $ $ $ $ 6,813,062
Reconciliation of Combining Statement of Cash Flows and Combining Balance Sheet
Cash and cash equivalents from Statement of Cash Flow $ 441,352,766R.I. Housing Mortgage Finance Corporation - Affordability Housing Trust 5,541,574R.I. Higher Education Assistance Authority - CollegeBoundfund Program Fund 6,311,886R.I. Higher Education Assistance Authority - Federal Student Loan Reserve Fund 6,821,423
Total Cash and Cash Equivalents as reported on the Combining Balance Sheet $ 460,027,649
Concluded
Total
R.I. Children'sCrusade for
HigherEducation
R.I. PublicTelecommuni-
cationsAuthority
R.I. WaterResources
BoardCorporate
R.I. Industrial-Recreational
BuildingAuthority
R.I. CleanWater Finance
Agency
- 167 -

This Page Intentionally Left Blank
-168 -

STATISTICAL SECTION
- 169 -

STATE OF RHODE ISLAND AND PROVIDENCE PLANTATIONS
REVENUES BY SOURCE AND EXPENDITURES BY FUNCTIONALL GOVERNMENTAL FUND TYPES
Last Ten Fiscal Years
(Expressed in thousands)
2001 2000 1999 1998Revenues by Source
Taxes 2,282,436$ 2,082,906$ 1,919,008$ 1,851,224$ Licenses, fines, sales and services 216,843 183,753 175,925 169,496 Departmental restricted revenues 77,339 114,462 107,208 119,561 Federal grants 1,416,685 1,257,203 1,215,433 1,079,633 Income from investments 24,592 19,270 20,426 17,568 Other revenues 53,565 36,631 32,657 32,113
Total revenues 4,071,460$ 3,694,225$ 3,470,657$ 3,269,595$
2001 2000 1999 1998Expenditures by Function
Current: General government 267,920$ 222,125$ 211,525$ 227,620$ Human services 2,077,462 1,880,477 1,761,940 1,644,950 Education 63,324 59,869 43,723 43,222 Public safety 279,626 257,625 246,057 233,031 Natural resources 56,483 52,450 54,729 46,568 Transportation 53,390 45,368 43,660 32,934 Capital outlay 234,221 229,678 227,573 145,846 Intergovernmental 856,770 765,670 684,890 591,766 Debt service 155,409 150,191 125,062 123,086
Total expenditures 4,044,605$ 3,663,453$ 3,399,159$ 3,089,023$
- 170 -

STATE OF RHODE ISLAND AND PROVIDENCE PLANTATIONS
REVENUES BY SOURCE AND EXPENDITURES BY FUNCTIONALL GOVERNMENTAL FUND TYPES
Last Ten Fiscal Years
(Expressed in thousands)
Revenues by Source
TaxesLicenses, fines, sales and servicesDepartmental restricted revenuesFederal grantsIncome from investmentsOther revenues
Total revenues
Expenditures by Function
Current: General government Human services Education Public safety Natural resources TransportationCapital outlayIntergovernmentalDebt service
Total expenditures
1997 1996 1995 1994 1993 1992
1,686,265$ 1,584,277$ 1,533,559$ 1,496,371$ 1,453,390$ 1,459,043$ 179,634 173,736 182,646 154,629 186,477 420,056 91,317 92,854 135,687 157,677 189,732 147,987
1,082,058 1,009,558 1,009,331 948,495 927,712 999,445 11,658 12,118 14,542 4,634 5,743 16,787 23,793 19,966 15,766 15,559 10,769 8,885
3,074,725$ 2,892,509$ 2,891,531$ 2,777,365$ 2,773,823$ 3,052,203$
1997 1996 1995 1994 1993 1992
198,800$ 197,233$ 247,873$ 307,216$ 240,489$ 272,241$ 1,596,517 1,539,547 1,438,725 1,333,235 1,397,913 1,803,156
39,877 33,415 62,328 61,151 73,459 43,607 215,939 211,777 196,174 129,623 126,294 122,574 43,532 39,000 50,061 48,249 25,405 21,474 33,275 43,391 37,560 44,674 93,163 88,304
138,758 148,942 247,579 243,829 201,298 224,451 561,001 535,455 494,819 430,549 434,380 430,583 115,358 107,870 108,658 97,701 100,305 81,705
2,943,057$ 2,856,630$ 2,883,777$ 2,696,227$ 2,692,706$ 3,088,095$
- 171 -

STATE OF RHODE ISLAND AND PROVIDENCE PLANTATIONSPERCENTAGE OF ANNUAL DEBT SERVICE FOR GOVERNMENTAL DEBT TO TOTALEXPENDITURES - ALL GOVERNMENTAL FUND TYPES
Last Ten Fiscal Years
(Expressed in thousands)
Debt Service Total
Fiscal (Principal and General Year Interest Expenditures Ratio
2001 155,409 4,044,605 3.84%2000 150,191 3,663,453 4.10%1999 125,062 3,399,159 3.68%1998 123,086 3,089,023 3.98%1997 115,358 2,943,057 3.92%1996 107,870 2,856,630 3.78%1995 108,658 2,883,777 3.77%1994 97,701 2,696,227 3.62%1993 100,305 2,692,706 3.73%1992 81,705 3,088,095 2.65%
STATE OF RHODE ISLAND AND PROVIDENCE PLANTATIONS
RATIO OF GENERAL OBLIGATION DEBT PER CAPITA
Last Ten Fiscal Years
(Expressed in thousands except per capita)
Rhode General G.O. Debt
Fiscal Island Obligation Bonds perYear Population Outstanding Capita
2001 1,059 1,035,399 977.71 2000 1,048 1,078,614 1,029.21 1999 991 998,961 1,008.03 1998 988 990,772 1,002.81 1997 987 1,015,506 1,028.88 1996 988 991,786 1,003.83 1995 989 987,367 998.35 1994 993 986,249 993.20 1993 998 855,203 856.92 1992 1,001 787,914 787.13
Source : Population - U.S. Department of Commerce, Bureau of the Census
- 172 -

STATE OF RHODE ISLAND AND PROVIDENCE PLANTATIONS
SCHEDULE OF PERSONAL INCOME AND PER CAPITA PERSONAL INCOME
1991 THROUGH 2000
Personal Income Per Capita Personal Income (in millions) (in dollars)
United States Rhode Island United States Rhode IslandPercent Percent Percent Percent
Amount Change Amount Change Amount Change Amount Change
2000 8,312.3$ 6.8% 30.6$ 5.2% 29,451 3.2% 29,158 (0.7%)1999 7,783.1 5.4% 29.1 5.1% 28,542 4.5% 29,377 4.9%1998 7,383.7 6.6% 27.7 9.1% 27,322 5.6% 28,012 5.2%1997 6,928.6 6.0% 25.4 2.4% 25,874 5.0% 26,631 6.0%1996 6,538.2 5.6% 24.8 4.2% 24,651 4.6% 25,123 4.5%1995 6,192.2 5.3% 23.8 5.3% 23,562 4.3% 24,046 5.6%1994 5,878.4 5.0% 22.6 2.3% 22,581 4.0% 22,762 2.8%1993 5,598.5 4.1% 22.1 3.8% 21,718 3.0% 22,137 4.1%1992 5,376.5 6.1% 21.3 4.4% 21,082 4.9% 21,257 4.4%1991 5,065.5 3.7% 20.4 0.5% 20,089 2.6% 20,363 0.8%
STATE OF RHODE ISLAND AND PROVIDENCE PLANTATIONSSCHEDULE OF ECONOMIC INDICATORS1991 THROUGH 2000
Unemployment Rate
Number in Percent Percent Number PercentLabor Force Change Rate Change of Sales Change
2000 505 0.2% 4.1% 0.0% 19,500 (5.8)%1999 504 1.2% 4.1% (16.3)% 20,700 22.5%1998 498 (1.4)% 4.9% (7.5)% 16,900 17.4%1997 505 1.8% 5.3% 3.9% 14,400 21.0%1996 496 2.3% 5.1% (27.1)% 11,900 0.0%1995 485 (2.4)% 7.0% (1.4)% 11,900 2.6%1994 497 (2.9)% 7.1% (9.0)% 11,600 5.5%1993 512 (1.7)% 7.8% (13.3)% 11,000 10.0%1992 521 1.8% 9.0% 4.7% 10,000 28.2%1991 512 (1.3)% 8.6% 26.5% 7,800 0.0%1989 525 #DIV/0! 4.1% 32.3% 9,500 -13.6%
Sources: US Department of Commerce, Bureau of Economic Analysis. US Department of Labor. Federal Reserve Bank of Boston.
Rhode Island Economic Development Corporation.
Civilian Labor Force(in thousands)
Home Sales
- 173 -

STATE OF RHODE ISLAND AND PROVIDENCE PLANTATIONS
SCHEDULE OF TEN LARGEST PRIVATE EMPLOYERS IN 2001
Rank Employer Employed Primary Business Activity1 Lifespan 10,100 Hospital2 Care New England 5,700 Hospital3 Stop & Shop Supermarket Co., Inc. 4,500 Grocery Store4 Brown University 4,400 University5 Royal Bank of Scotland 3,500 Bank6 CVS Corporation 3,300 Drug Stores7 The Jan Companies 3,200 Restaurants8 Fleet Financial Group, Inc. 3,100 Bank9 Metropolitan Life Insurance Company 2,200 Insurance
10 Shaw's Markets 1,900 Grocery Store
Source: Rhode Island Economic Development Corporation. Some employers are not listed because they did not wish to participate.
STATE OF RHODE ISLAND AND PROVIDENCE PLANTATIONS
SCHEDULE OF MISCELLANEOUS STATISTICS
Adoption of Constitution November 5, 1842Land area (square miles) 1,545 Miles of state highway 5,978
State Police Protection: Number of stations 5 Number of officers 219
Higher Education: Number of institutions 13 Number of educators 4,019 Number of students 75,633
Recreation: Number of state parks, beaches, bike paths 21 Area of state parks, beaches (acres) 13,289 Length of bike paths (miles) 32 Area of state-owned forests (square miles) 63 Percent of state covered with forest (all ownership) 55%
Sources: Rhode Island State Police Annual Report. Office of Higher Education. Rhode Island Almanac. Rhode Island Department
of Environmental Management, Division of Parks and Recreation and Division of Forest Environment.
- 174 -