state of smb cyber security readiness: uk study - … · we are pleased to present the findings of...
TRANSCRIPT
State of SMB Cyber Security Readiness: UK Study
Ponemon Institute© Research Report
Sponsored by Faronics Independently conducted by Ponemon Institute LLC Publication Date: November 2012

Ponemon Institute© Research Report Page 1
State of SMB Cyber Security Readiness: UK Study
Prepared by Ponemon Institute, November 2012 Part 1. Introduction We are pleased to present the findings of the State of SMB Cyber Security Readiness: UK Study conducted by Ponemon Institute and sponsored by Faronics. The purpose of the study is to understand the ability of small to medium-sized businesses (SMBs) to prepare their organisations for a possible cyber attack and data breach. This same study was conducted in the United States and the findings are presented in a separate report. The research also examines the differences in perceptions about the consequences of a data breach between those organisations that had a data breach and those that have so far escaped the loss or theft of their confidential and sensitive information. In this study, 54 percent of organisations experienced at least one data breach in the past 12 months. The most negative consequences reported by respondents were time and productivity losses and brand or reputation damage. In this study, we surveyed 544 individuals in organisations with a headcount between 50 and 3,000 employees. Fifty-eight percent of respondents are at the supervisor level or higher with an average of more than 12 years experience. To ensure knowledgeable respondents participated in the study we screened potential participants to ensure they are all familiar with their organisation’s security mission. Some of the most noteworthy findings include the following: § The mission of most organisations is not to be their industry’s leader for security protection.
Rather it is to achieve substantial compliance with regulations and with internal policies and procedures.
§ Priorities for IT security spending are to be able to comply with regulations and a sense of
responsibility to protect information. § Organisations tend to rely on reduced frequency and duration of system downtime and
reduced number of attacks or incidents to measure their ability to minimise security threats. However, most organisations rely on informal observations by supervisors and managers to identify security risk.
§ The most significant threats are the proliferation of end user devices, including BYOD, and
lack of security protection across all devices. § The biggest benefit realised when investing in security solutions is a reduction in the
occurrence of data breaches. § The biggest frustration for respondents in this study is dealing with employee negligence and
mistakes. The second frustration is the lack of guidance from management. § Almost half of respondents (48 percent) say their organisations’ reputation was damaged as
a result of a data breach. In contrast, 39 percent that did not have a data breach believe such an incident would affect reputation and brand.
§ In the aftermath of the data breach, 30 percent of organisations had to lay off employees.
Only 7 percent of respondents from organisations that did not have a data breach believe such action would be very likely.

Ponemon Institute© Research Report Page 2
Part 2. Key Findings We have organised the key findings according to the following topics: § Mission and resources allocated to achieve cyber security readiness § Cyber security tactics deployed § Threats and barriers to achieving cyber security readiness § The great data breach perception divide Compliance is mission critical. As shown in Figure 1, the purpose of a cyber security mission is to achieve substantial compliance with regulations and internal policies, procedures and agreements, according to 45 percent of respondents (23 percent + 22 percent). Only 17 percent want to be their industry’s leader for security protection. Compliance is an important objective for these organisations because only 15 percent want to do the minimum with regulations and laws and 6 percent say the objective is to do the minimum to meet compliance with internal or external policies. Figure 1. The cyber security mission
7%
6%
10%
15%
17%
22%
23%
0% 5% 10% 15% 20% 25%
Don’t know
Do the minimum level as required by internal or external policies
Protect against cyber threats as best as possible with a fixed budget
Incur the minimum cost to achieve compliance
Be an industry leader for security protection
Achieve substantial compliance with internal policies, procedures and agreements
Achieve substantial compliance with regulations, laws and public standards
Ponemon Institute© Research Report Page 3
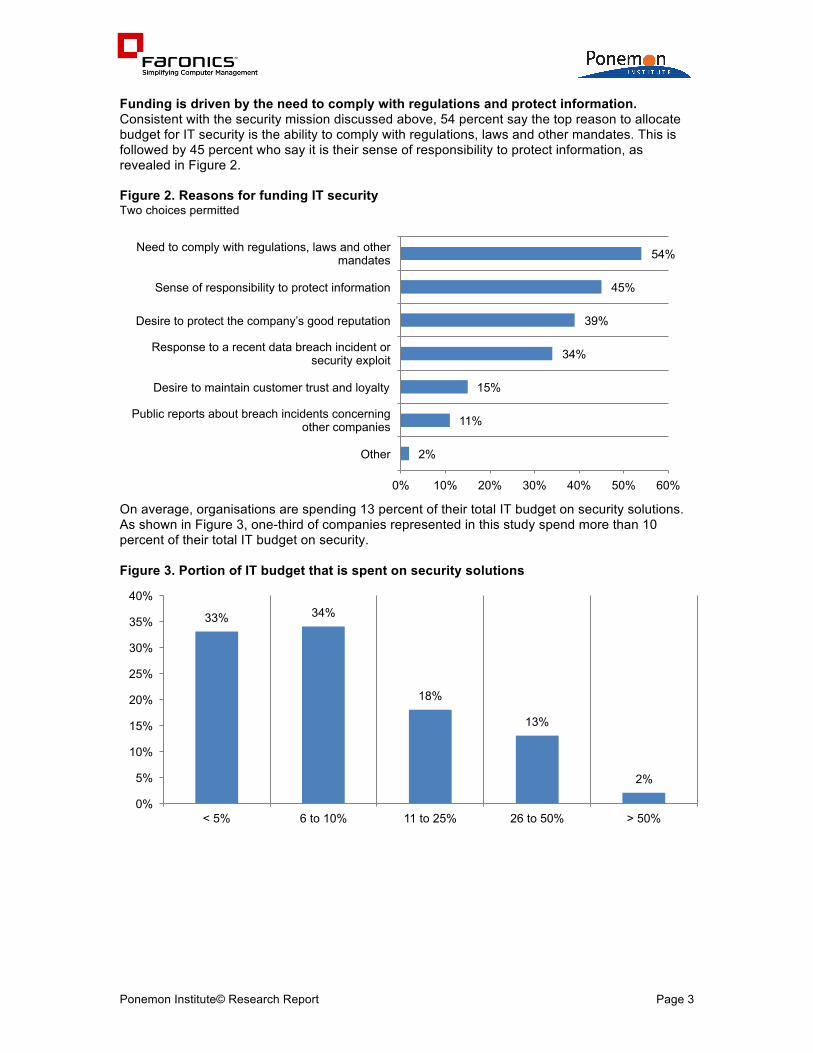
Funding is driven by the need to comply with regulations and protect information. Consistent with the security mission discussed above, 54 percent say the top reason to allocate budget for IT security is the ability to comply with regulations, laws and other mandates. This is followed by 45 percent who say it is their sense of responsibility to protect information, as revealed in Figure 2. Figure 2. Reasons for funding IT security Two choices permitted
On average, organisations are spending 13 percent of their total IT budget on security solutions. As shown in Figure 3, one-third of companies represented in this study spend more than 10 percent of their total IT budget on security. Figure 3. Portion of IT budget that is spent on security solutions
2%
11%
15%
34%
39%
45%
54%
0% 10% 20% 30% 40% 50% 60%
Other
Public reports about breach incidents concerning other companies
Desire to maintain customer trust and loyalty
Response to a recent data breach incident or security exploit
Desire to protect the company’s good reputation
Sense of responsibility to protect information
Need to comply with regulations, laws and other mandates
33% 34%
18%
13%
2%
0%
5%
10%
15%
20%
25%
30%
35%
40%
< 5% 6 to 10% 11 to 25% 26 to 50% > 50%

Ponemon Institute© Research Report Page 4
We asked respondents to rank the steps they believe are most important to lowering the total cost of ownership for cyber security solutions, as shown in Figure 4. They ranked as most important the use of solutions that are relatively easy to implement and don’t increase complexity. Obtaining the lowest cost from vendors is the next most important step. Use of cloud services is ranked much lower as a measure that could reduce TCO. Figure 4. Most important steps taken to lower cyber security solution costs 7 = most important to 1 = least important
2.21
2.31
2.69
3.07
3.56
5.64
5.99
0.00 1.00 2.00 3.00 4.00 5.00 6.00 7.00
Thoroughly train end users
Minimise the investment in traditional security solutions
Use cloud security services whenever practicable
Thoroughly train IT security staff
Outsource the operations of security solutions
Obtain the lowest purchase cost from vendors
Choose solutions that are easy to implement and don’t increase complexity

Ponemon Institute© Research Report Page 5
Cyber security tactics deployed Measuring reductions in system downtime and number of cyber attacks are used to understand the effectiveness of minimising security risks. According to Figure 5, most organisations (44 percent) rely on reduced frequency and duration of system downtime followed by 36 percent of organisations that measure reduced number of attacks or incidents and informal reports from staff. Only 12 percent say it is observing and regularly testing data protection and security solutions and reducing the number of compliance or regulatory violations. Figure 5. Measures to determine effectiveness of minimising security risks More than one response permitted
1%
25%
12%
12%
21%
22%
36%
36%
44%
0% 5% 10% 15% 20% 25% 30% 35% 40% 45% 50%
Other
None of the above
Observation and regular testing of data protection and security solutions
Reduced number of compliance or regulatory violations
Key metrics from management console
Management reports summarising results
Informal reports from staff
Reduced number of attacks or incidents
Reduced frequency and duration of system downtime

Ponemon Institute© Research Report Page 6
When asked what steps are taken to identify security risk, 74 percent say their organisations rely upon supervisors and managers providing informal observations followed by manual compliance monitoring, as revealed in Figure 6. Only 28 percent conduct risk assessments to understand their risks. Figure 6. Steps taken to identify security risk More than one choice permitted
By far the greatest benefit from investing in security solutions is to reduce the number of data breaches (63 percent). This is followed by better productivity because of machine availability (52 percent) and enhanced end-user accountability (51 percent), as shown in Figure 7. Figure 7. Greatest benefits from the deployment of security solutions Two responses permitted
2%
5%
15%
28%
56%
74%
0% 10% 20% 30% 40% 50% 60% 70% 80%
Other
Internal or external audits
Automated monitoring tools
Risk assessments
Manual compliance monitoring
Informal observations by supervisors and managers
1%
8%
13%
15%
15%
22%
51%
52%
63%
0% 10% 20% 30% 40% 50% 60% 70%
Other
Sharing data in secured workspace on a computer
Reduced number of IT support tickets
Quicker discovery & containment of data breach or security exploit
Reduced number of compliance or regulatory violations
Reduced risks with mobile workers and their computing devices
Enhanced end-user accountability
Better productivity because of machine availability
Reduced number of data breach incidents

Ponemon Institute© Research Report Page 7
Understanding where sensitive information is located and curtailing end-user access to insecure Internet sites and web applications is key to meeting the security mission. According to Figure 8, the security control features considered essential or very important are: identifying the location of sensitive information (59 percent), curtailing end-user access to insecure Internet sites and web applications (57 percent), restricting access to sensitive or confidential data (56 percent) and conducting close surveillance of all user activities (50 percent). Less important are: defining data collection, use, storage and retention procedures (28 percent), curtailing insecure endpoints from accessing sensitive applications or systems (31 percent) and benchmarking data protection practises or operations against peers (32 percent). Figure 8. Features important to achieving security objectives or mission Essential and very important response combined
28%
31%
32%
37%
39%
39%
39%
40%
44%
45%
45%
46%
50%
56%
57%
59%
0% 10% 20% 30% 40% 50% 60% 70%
Defined data collection, use, storage and retention procedures
Curtail insecure endpoints from accessing sensitive applications or systems
Benchmarks of data protection practises or operations against peers
Prevent the use of insecure software applications
Prioritise threats and vulnerabilities
Establish actionable metrics and reporting
Curtail unauthorised sharing of sensitive data
Establish policies that specify data compliance requirements
Monitor business partners, vendors & other third-parties
Prevent suspicious inbound communications
Prevent suspicious outbound communications
Disengage lost or stolen mobile devices
Conduct close surveillance of all user activities
Restrict access to sensitive or confidential data
Curtail end-user access to insecure Internet sites and web applications
Identify location of sensitive information

Ponemon Institute© Research Report Page 8
Laptops and devices, including mobile devices, are vulnerable and lack cyber security readiness. Less than half (47 percent) of respondents say the security of laptops, smartphones and other mobile devices is essential or very important. According to Ponemon Institute’s 2011 Cost of Data Breach Study: UK Study1, lost or stolen devices can increase the average per record cost from £79 to £83. Figure 9, shows the rate of anti-virus/anti-malware endpoint protections for organisations represented in this study. Clearly, on average, desktops have the most protection followed by laptops (48 percent and 38 percent, respectively). An average of only 12 percent say devices are secured. Figure 9. Deployment of anti-virus/anti-malware protections Extrapolated value: Desktop 48%, Laptop 38%, Other devices 12%
Further, 73 percent of respondents say file and full disk encryption technologies are either not deployed or only partially deployed on endpoints (44 percent + 29 percent). Twenty-seven percent say these technologies are fully deployed as shown in Figure 10. Figure 10. Deployment of file or full disk encryption technologies
1 2011 Cost of Data Breach: UK Study conducted by Ponemon Institute and sponsored by Symantec, March 2012
5%
11%
18%
43%
11% 12% 11%
23% 21%
27%
9% 9%
55%
29%
8%
2% 4% 2%
0%
10%
20%
30%
40%
50%
60%
None < 20% 21 to 40% 41 to 60% 61 to 80% > 80%
Desktop Laptop Other devices
44%
29% 27%
0%
5%
10%
15%
20%
25%
30%
35%
40%
45%
50%
Not deployed Partially deployed Fully deployed

Ponemon Institute© Research Report Page 9
Threats and barriers to achieving cyber security readiness Employee mistakes and lack of guidance from management frustrate respondents. According to 55 percent, respondents are frustrated by employee mistakes, ignorance or negligence and 32 percent say it is a lack of guidance from management (Figure 11). Less frustrating are increasing complexity of the job (9 percent) and unrealistic expectations about keeping the organisation secure (12 percent). Figure 11. Job-related frustrations Two responses permitted
9%
12%
15%
15%
16%
23%
23%
32%
55%
0% 10% 20% 30% 40% 50% 60%
Increasing complexity of the job
Unrealistic expectations about keeping the organisation secure
Technologies that do not live up to vendor promises
Unrealistic deadlines
Lack of collabouration with other departments
Lack of funding to accomplish objectives
Continuing network or system downtime
Lack of guidance from management
Employee mistakes, ignorance or negligence

Ponemon Institute© Research Report Page 10
Concerns about end-user devices are believed to create the most threat to the organisation. As shown in Figure 12, the most serious threats are proliferation of end-user devices, including BYOD, and a lack of security protection across all devices. This seems to contradict the finding that less than half say the security of laptops, smartphones and other mobile devices is essential or very important. Lack of effective data protection technologies and employee ignorance are considered less of a threat. Figure 12. Most serious threats to the organisation Four responses permitted
5%
7%
7%
10%
21%
22%
25%
35%
44%
53%
53%
56%
62%
0% 10% 20% 30% 40% 50% 60% 70%
Lack of effective data protection technologies
Employee ignorance
External attackers (hackers)
System or business process glitches
Increase in the frequency and/or sophistication of malware and viruses
Sensitive company data residing on insecure devices
Malicious employees and other dangerous insiders
Not knowing where all sensitive information is located
Proliferation of unstructured data
Insecure third parties including cloud providers
Compliance violations and related legal infractions
Lack of security protection across all devices
Proliferation of end user devices including BYOD

Ponemon Institute© Research Report Page 11
Smaller organisations lack the in-house expertise to become cyber ready. Barriers to achieving cyber readiness are insufficient people resources (75 percent), complexity of compliance and regulatory requirements (62 percent) and lack of in-house skilled or expert personnel (55 percent), as shown in Figure 13. Only 4 percent say security is not taken seriously because their organisation is not perceived as being vulnerable to attacks. Figure 13. Barriers to achieving effective security and data protection Three responses permitted
4%
16%
23%
23%
42%
55%
62%
75%
0% 10% 20% 30% 40% 50% 60% 70% 80%
Security is not taken seriously as our organisation is not perceived as vulnerable to
attacks
Insufficient technology resources
Insufficient budget
Lack of monitoring and enforcement of end users
Lack of central accountability
Lack of in-house skilled or expert personnel
Complexity of compliance & regulatory requirements
Insufficient people resources

Ponemon Institute© Research Report Page 12
Cheque and credit card fraud are of greatest concern followed by zero-day attacks. As shown in Figure 14, the most likely cyber security threats, according to respondents, are: cheque and credit card fraud (77 percent), zero-day attacks (70 percent) and insecure mobile devices that connect to the company’s network (68 percent). Figure 14. Most likely cyber security threats Very likely and likely response combined
24%
26%
27%
30%
37%
49%
49%
52%
61%
63%
64%
68%
70%
77%
0% 10% 20% 30% 40% 50% 60% 70% 80% 90%
Economic espionage
Denial of services attacks
Malicious insiders
Advanced persistent threats
Insecure cloud computing applications or platform
Insecure software applications
Web-based security attacks
Loss or theft of data bearing devices
Social engineering or “pre-texting”
Surreptitious download of malware, virus, worm or Trojan that penetrates your network
Phishing scams
Insecure mobile devices connect to your company’s network
Zero-day attacks
Cheque and credit card fraud

Ponemon Institute© Research Report Page 13
Organisations rely on firewall and perimeter security technologies to reduce risks associated with the use of applications in the workplace. To ensure applications used by employees do not contain security vulnerabilities, organisations are using a firewall and other perimeter security technologies (75 percent) followed by enforcement of strict policies (45 percent) and use of a blacklisting tool that identifies vulnerable applications (33 percent) as shown in Figure 15. Figure 15. Application security measures taken More than one response permitted
3%
18%
20%
23%
33%
45%
75%
0% 10% 20% 30% 40% 50% 60% 70% 80%
Other
Use of patch management tools
Use a whitelisting tool that identifies safe and secure applications
Lock down user machines to prevent user changes
Use a blacklisting tool that identifies vulnerable applications
Enforce strict policies
Use a firewall and other perimeter security technologies

Ponemon Institute© Research Report Page 14
The great data breach perception divide Do organisations that have never experienced the loss or theft of sensitive and confidential information understand the potential reputational and financial consequences to their organisations? In this study, we divided the sample of respondents between the 54 percent who say they had a data breach in the past 12 months and the 46 percent who self-report they have not experienced an incident. Companies underestimate the cost of a data breach. On average, breaches experienced in the past 12 months cost almost £138,700. However, organisations that did not have a data breach believe the total cost would average about £94,750. As shown in Figure 17, 54 percent of organisations had data breaches that cost almost £100k (25 percent + 29 percent). However, 30 percent of respondents in organisations that did not have a breach believe it would cost nothing. Figure 17. Cost of the data breach
22% 25%
29%
18%
5%
1%
30%
42%
13% 11%
3% 1%
0%
5%
10%
15%
20%
25%
30%
35%
40%
45%
None £1 to £10,000 £10,001 to £100,000
£100,001 to £500,000
£500,001 to £1,000,000
£1,000,001 to £5,000,000
Organisations that had a data breach Organisations that did not have a breach

Ponemon Institute© Research Report Page 15
Organisations that had a breach suffered reputational damage. According to the organisations that had a breach, the most serious consequences were time and productivity losses (66 percent) and brand or reputation damage (64 percent) as shown in Figure 18. Only 28 percent say have had no negative impact. Figure 18. Consequences of a data breach More than one response permitted
According to Figure 19, 48 percent say their organisation’s reputation was damaged as a result of the data breach incident. In organisations that did not have a breach, 58 percent believe they would not suffer reputational damage and 3 percent are unsure. Figure 19. Reputational damage
Respondents in organisations that had a data breach say it took on average about 9 months to recover. In contrast, the average for organisations that did not have a breach is believed to be about 4 months.
1%
2%
3%
11%
12%
19%
22%
28%
64%
66%
0% 10% 20% 30% 40% 50% 60% 70%
Other
Lawsuits
Regulatory fines and penalties
Cost of outside consultants and lawyers
Loss of customer loyalty
Loss of revenues
Decrease in rate of customer acquisition
No negative impact
Brand or reputation damage
Time and productivity losses
48% 44%
8%
39%
58%
3%
0%
10%
20%
30%
40%
50%
60%
70%
Yes No Unsure
Organisations that had a data breach Organisations that did not have a breach

Ponemon Institute© Research Report Page 16
Losing the sensitive and confidential information of a business partner or a third party jeopardises relationships with customers and business partners. Thirty-six percent say the data breach incidents involved sensitive and confidential information that was entrusted to them by another organisation. According to Figure 20, the primary response made by organisations was to conduct an investigation to determine the cause of the data breach (55 percent) and to demonstrate that the root cause of the breach was resolved or fixed (48 percent). Customer churn and loss of business relationships is a problem following a data breach. Thirty-eight percent of organisations say they lost customers and business partners and 33 percent of respondents report that the breach resulted in the termination of the relationship with the other organisation. On average, companies lost about 3.4 percent of their customers as a result of the data breach. However, those organisations that did not have a breach believe it would be a much lower 1.8 percent. Figure 20. Consequences & response to a data breach More than one response permitted
Layoffs occurred after the data breach. The consequences of the data breach included organisations having to lay off employees, according to 30 percent of employees. Figure 21. Downsizing following a data breach
1%
21%
29%
31%
33%
36%
38%
48%
55%
0% 10% 20% 30% 40% 50% 60%
Other
The organisation filed a lawsuit against our company
Reimbursed any legal costs or financial losses
Suffered a loss of reputation
The organisation terminated its relationship
Negotiated an economic settlement
Lost customers and business partners
Demonstrated that the root cause was resolved
Conducted an investigation to determine the cause
30%
69%
1% 0%
10% 20% 30% 40% 50% 60% 70% 80%
Yes No Unsure

Ponemon Institute© Research Report Page 17
In contrast, only 7 percent of respondents believe it would be very likely their organisations would have to lay off employees in the aftermath of a data breach. Figure 22. Likelihood that a data breach would result in employee layoffs
Following a data breach it costs more to attract new customers. As shown in Figure 23, organisations that had a data breach had an increase in the cost of new customer acquisition for such activities as discounts, promotions and additional advertising (34 percent). In fact, on average, it cost companies approximately £91,985 to attract new customers. Whereas, those organisations that did not have a data breach believe it would cost £36,905. Figure 23. New customer acquisition cost increase
7%
21%
26%
33%
13%
0%
5%
10%
15%
20%
25%
30%
35%
Very likely Likely Somewhat likely Not likely Unsure
34%
62%
4%
25%
70%
5%
0%
10%
20%
30%
40%
50%
60%
70%
80%
Yes No Unsure
Organisations that had a data breach Organisations that did not have a breach
Ponemon Institute© Research Report Page 18
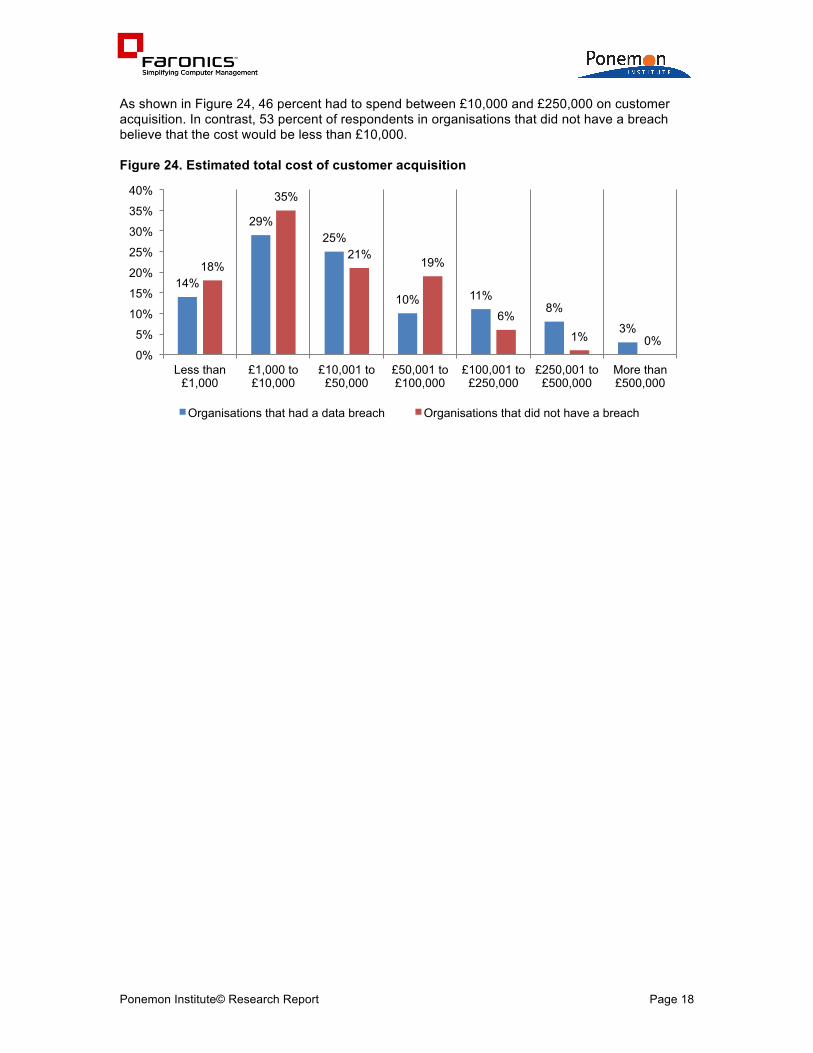
As shown in Figure 24, 46 percent had to spend between £10,000 and £250,000 on customer acquisition. In contrast, 53 percent of respondents in organisations that did not have a breach believe that the cost would be less than £10,000. Figure 24. Estimated total cost of customer acquisition
14%
29% 25%
10% 11% 8%
3%
18%
35%
21% 19%
6%
1% 0% 0%
5%
10%
15%
20%
25%
30%
35%
40%
Less than £1,000
£1,000 to £10,000
£10,001 to £50,000
£50,001 to £100,000
£100,001 to £250,000
£250,001 to £500,000
More than £500,000
Organisations that had a data breach Organisations that did not have a breach

Ponemon Institute© Research Report Page 19
Part 3. Conclusion Underestimating the financial and reputational consequences of a data breach can have a negative affect on an SMB’s ability to achieve cyber readiness. In this study, 46 percent of respondents work in organisations that did not have a data breach. These respondents had much different expectations as to what their organisations would face than the 54 percent of respondents that actually experienced at least one incident in the past 12 months. Such differences could mean that many organisations are not allocating sufficient resources and making cyber security readiness the priority it should be. The current state of cyber readiness can be improved based on the findings of this research. The following are recommendations: § Have formal programs or processes in place to detect security risks. Many organisations in
this research are relying upon informal reports and observations from staff to understand what they need to do to be prepared for data breaches and cyber attacks.
§ Conduct risk assessments and conduct manual and automated monitoring to identify security
risks with greater accuracy. Establish actionable metrics and reporting to meet security objectives and mission.
§ Recognise the risk posed by mobile workers and their computing devices. Increase anti-
virus/anti-malware protections on laptops, smartphones and other mobile devices. § Decrease the risk of lost or stolen laptops and mobile devices through the deployment of file
or full disk encryption technologies. § Respondents are correct to view the proliferation of end users devices, including BYOD, as
the top threat to their organisations. Steps should be taken to make sure the necessary security controls are in place to reduce mobile security risks.
§ Make the case for having sufficient in-house expertise to prevent, detect and respond to
cyber attacks and data breaches. This research provides some insight into what it could cost an organisation to respond to the breach, repair reputation and restore customer loyalty. These findings could help organisations make the business case for investing in cyber security.
§ Address the frustration of employee negligence and mistakes through training and awareness
programs. As shown in previous Ponemon Institute studies, the negligent insider is one of the primary causes of a data breach.
Our goal in conducting this research is to shed light on the challenges SMBs face in keeping their organisations secure. Based on the findings, the size of an organisation does not mean it is immune from the financial and reputational consequences experienced by much larger organisations. Hopefully, these findings will help SMBs make the business case for investing in people, processes and technologies.
Ponemon Institute© Research Report Page 20
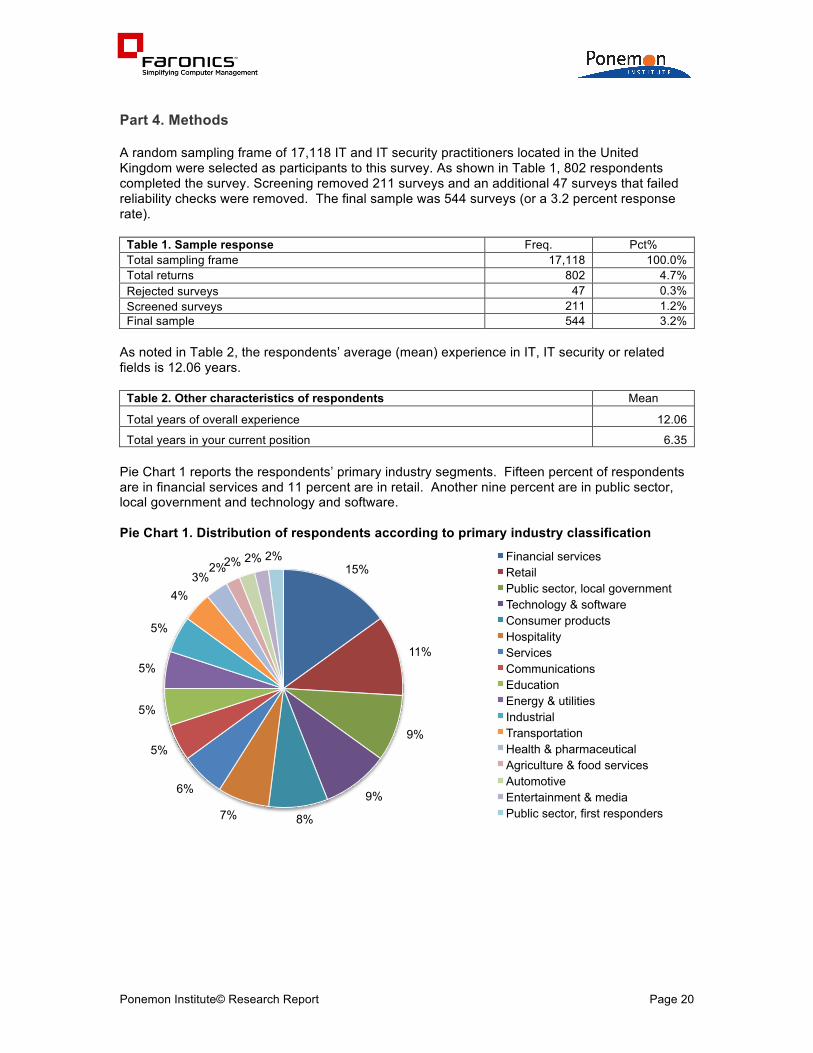
Part 4. Methods A random sampling frame of 17,118 IT and IT security practitioners located in the United Kingdom were selected as participants to this survey. As shown in Table 1, 802 respondents completed the survey. Screening removed 211 surveys and an additional 47 surveys that failed reliability checks were removed. The final sample was 544 surveys (or a 3.2 percent response rate).
Table 1. Sample response Freq. Pct% Total sampling frame 17,118 100.0% Total returns 802 4.7% Rejected surveys 47 0.3% Screened surveys 211 1.2% Final sample 544 3.2%
As noted in Table 2, the respondents’ average (mean) experience in IT, IT security or related fields is 12.06 years.
Table 2. Other characteristics of respondents Mean
Total years of overall experience 12.06
Total years in your current position 6.35 Pie Chart 1 reports the respondents’ primary industry segments. Fifteen percent of respondents are in financial services and 11 percent are in retail. Another nine percent are in public sector, local government and technology and software. Pie Chart 1. Distribution of respondents according to primary industry classification
15%
11%
9%
9%
8% 7%
6%
5%
5%
5%
5%
4% 3%
2% 2% 2% 2% Financial services Retail Public sector, local government Technology & software Consumer products Hospitality Services Communications Education Energy & utilities Industrial Transportation Health & pharmaceutical Agriculture & food services Automotive Entertainment & media Public sector, first responders
Ponemon Institute© Research Report Page 21
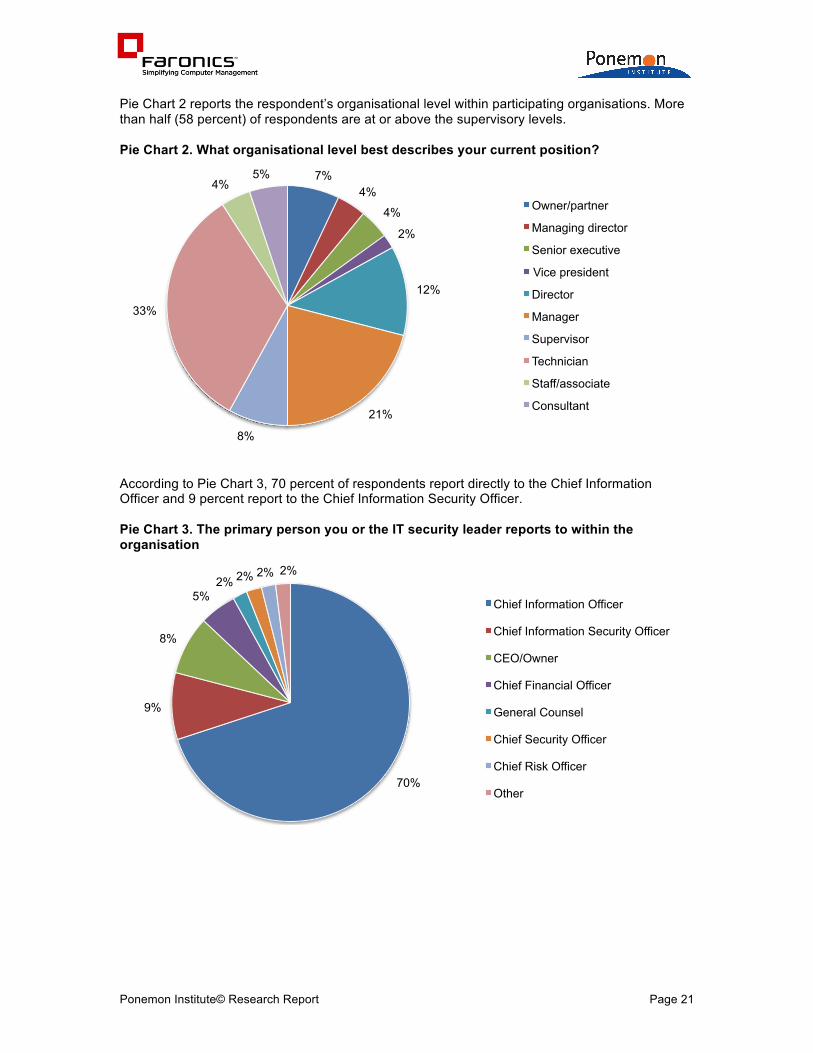
Pie Chart 2 reports the respondent’s organisational level within participating organisations. More than half (58 percent) of respondents are at or above the supervisory levels. Pie Chart 2. What organisational level best describes your current position?
According to Pie Chart 3, 70 percent of respondents report directly to the Chief Information Officer and 9 percent report to the Chief Information Security Officer. Pie Chart 3. The primary person you or the IT security leader reports to within the organisation
7% 4%
4%
2%
12%
21%
8%
33%
4% 5%
Owner/partner
Managing director
Senior executive
Vice president
Director
Manager
Supervisor
Technician
Staff/associate
Consultant
70%
9%
8%
5% 2% 2% 2% 2%
Chief Information Officer
Chief Information Security Officer
CEO/Owner
Chief Financial Officer
General Counsel
Chief Security Officer
Chief Risk Officer
Other

Ponemon Institute© Research Report Page 22
Part 5. Caveats There are inherent limitations to survey research that need to be carefully considered before drawing inferences from findings. The following items are specific limitations that are germane to most web-based surveys.
Non-response bias: The current findings are based on a sample of survey returns. We sent surveys to a representative sample of individuals, resulting in a large number of usable returned responses. Despite non-response tests, it is always possible that individuals who did not participate are substantially different in terms of underlying beliefs from those who completed the instrument. Sampling-frame bias: The accuracy is based on contact information and the degree to which the list is representative of individuals who are IT or IT security practitioners. We also acknowledge that the results may be biased by external events such as media coverage. We also acknowledge bias caused by compensating subjects to complete this research within a holdout period. Self-reported results: The quality of survey research is based on the integrity of confidential responses received from subjects. While certain checks and balances can be incorporated into the survey process, there is always the possibility that a subject did not provide a truthful response.

Ponemon Institute© Research Report Page 23
Appendix: Detailed Survey Results The following tables provide the frequency or percentage frequency of responses to all survey questions contained in this study. All survey responses were captured in September 2012. Survey response Freq Pct% Total sampling frame 17,118 100.0% Total returns 802 4.7% Total rejections 47 0.3% Screening reductions 211 1.2% Final sample 544 3.2% Part 1. Screening questions S1. What is your organisation’s total headcount? Freq Pct% Less than 50 employees (STOP) 75 10% 50 to 100 employees 135 18% 101 to 250 employees 150 20% 251 to 500 employees 199 26% 501 to 1,000 employees 93 12% 1,001 to 3,000 employees 55 7% More than 3,000 employees (STOP) 48 6% Total 755 100% S2. Are you responsible for your company’s information systems and security protection efforts? Freq Pct% Yes, directly 327 52% Yes, indirectly 255 40% No (STOP) 50 8% Total 632 100% S3. What statement best describes your organisation’s cyber security mission or objective? Please select only one. Freq Pct% To be our industry’s leader for security protection 101 17% To achieve substantial compliance with regulations, laws and public standards 136 23% To achieve substantial compliance with internal policies, procedures and agreements 126 22% To incur the minimum cost necessary to achieve compliance requirements 86 15% To do the minimum level as required by internal or external policies 34 6% To protect our organisation from cyber threats as best as possible with a fixed budget 61 10% Don’t know (STOP) 38 7% Total 582 100% Adjusted sample size 544 Part 2. General survey on cyber security experience Q1. In your opinion, what are the top two reasons why IT security efforts within your organisation are funded? Pct% Response to a recent data breach incident or security exploit within your organisation 34% Public reports or news stories about breach incidents concerning other companies 11% Sense of responsibility to protect information 45% Desire to protect the company’s good reputation 39% Desire to maintain customer trust and loyalty 15% Need to comply with regulations, laws and other mandates 54% Other (please specify) 2% Total 200%

Ponemon Institute© Research Report Page 24
Q2. How important is the security of laptops, desktops, smartphones and other mobile devices to your organisation’s business operations? Essential
Very important
Essential & very important 24% 39% Q3. What percent of your organisation’s endpoints contain current anti-virus/anti-malware protections? Please select the percentage range for each computing device listed below. Q3a. Desktop Pct% None 5% < 20% 11% 21 to 40% 18% 41 to 60% 43% 61 to 80% 11% > 80% 4% All 8% Extrapolation Total 100% 48% Q3b. Laptop Pct% None 11% < 20% 23% 21 to 40% 21% 41 to 60% 27% 61 to 80% 9% > 80% 2% All 7% Extrapolation Total 100% 38% Q3c. Other devices Pct% None 55% < 20% 29% 21 to 40% 8% 41 to 60% 2% 61 to 80% 4% > 80% 1% All 1% Extrapolation Total 100% 12% Q4. What best describes the state of file or full disk encryption technologies deployed on endpoints within your organisation today? Pct% Not deployed 44% Partially deployed 29% Fully deployed 27% Other 0% Total 100% Q5. What do you see as the most important steps that your organisation could take to lower the total cost of ownership for cyber security solutions? Please rank the following actions from 7 = most important to 1 = least important. Average rank Rank order Thoroughly train IT security staff 3.07 4 Thoroughly train end users 2.21 7 Obtain the lowest purchase cost from vendors 5.64 2 Choose solutions that are relatively easy to implement and don’t increase complexity 5.99 1 Outsource the operations of security solutions 3.56 3 Use cloud security services whenever practicable 2.69 5 Minimise the investment in traditional security solutions 2.31 6 Average 3.64

Ponemon Institute© Research Report Page 25
Q6a. How important is centralised management to the success of cyber security efforts within your organisation? Essential
Very important
Essential & very important 19% 40% Q6b. [For those selecting essential or very important] What do you consider essential or very important in centralised management? Please select all that apply. Pct% Policy administration 58% Configuration management 36% Reporting 68% Monitoring 51% Actionable information 65% Automatic securing of ports and endpoints 45% Ease of updating and installation 35% Total 358% Q7. How do you know that your organisation’s security solutions are effective at minimising cyber security risks such as data theft, malware infections, viruses and more? Please select all that apply. Pct% Key metrics from management console 21% Management reports summarising results 22% Observation and regular testing of data protection and security solutions 12% Reduced frequency and duration of system downtime 44% Reduced number of attacks or incidents 36% Reduced number of compliance or regulatory violations 12% Informal reports from staff 36% None of the above 25% Other (please specify) 1% Total 209% Q8. What do you see as the greatest benefits realised from the deployment of security solutions within your organisation? Please select your top two choices. Pct% Reduced risks associated with mobile workers and their use of portable computing devices 22% Shortened time to discover and contain a data breach or security exploit from a compromised device 15% Enabled sharing of data in secured workspace on a single computer 8% Enhanced end-user accountability 51% Reduced number of data breach incidents 63% Reduced number of compliance or regulatory violations 15% Reduced number of IT support tickets 13% Better employee productivity because of machine availability 52% Other (please specify) 1% Total 240% Q9, What is the best way to educate employees (end users) within your organisation about safe data protection and security practises? Please select the top two choices. Pct% Conduct formal training and awareness programs 51% Provide written policies and clear instruction to end users 73% Automate policies that automatically enforce requirements behind the scenes 12% Hold supervisors and managers accountable for educating subordinates on safe data protection 63% Other (please specify) 1% Total 200%

Ponemon Institute© Research Report Page 26
Q10. With respect to your organisation’s total IT budget, how much is spent on security solutions? Pct% < 5% 33% 6 to 10% 34% 11 to 25% 18% 26 to 50% 13% > 50% 2% Extrapolation Total 100% 13% Q11. On a “full time equivalent” basis, how many employees in your organisation are dedicated to security and data protection activities? Pct% < 1 50% 1 to 2 25% 2 to 5 15% 5 to 10 8% > 10 2% Extrapolation Total 100% 2.17 Q12. Who within your organisation is most responsible for security and data protection activities (such as setting strategy, overseeing deployment and ongoing management)? Pct% IT 30% IT security 10% Finance 3% Compliance & legal 2% Business units 25% Risk management 2% Shared responsibility (no one department) 28% Other (please specify) 0% Total 100% Q13. What do you see as the most serious threats to your organisation? Please select four top choices. Pct% Lack of security protection across all devices 56% Increase in the frequency and/or sophistication of malware and viruses 21% Not knowing where all sensitive information is located 35% Proliferation of end user devices including BYOD 62% Proliferation of unstructured data 44% Sensitive company data residing on insecure devices 22% Employee ignorance 7% System or business process glitches 10% Insecure third parties including cloud providers 53% Lack of effective data protection technologies 5% Malicious employees and other dangerous insiders 25% External attackers (hackers) 7% Compliance violations and related legal infractions 53% Other (please specify) 0% Total 400%

Ponemon Institute© Research Report Page 27
Q14. What do you see as the most significant barriers to achieving effective security and data protection activities within your organisation today? Please select the three top choices. Pct% Insufficient people resources 75% Lack of in-house skilled or expert personnel 55% Insufficient budget 23% Lack of central accountability 42% Lack of monitoring and enforcement of end users 23% Insufficient technology resources 16% Complexity of compliance and regulatory requirements 62% Security is not taken seriously because our organisation is not perceived as being vulnerable to attacks 4% Other (please specify) 0% Total 300% Q15. What are the job-related frustrations you experience most days? Please select the two top choices. Pct% Employee mistakes, ignorance or negligence 55% Lack of funding to accomplish objectives 23% Lack of guidance from above (management) 32% Increasing complexity of the job 9% Lack of collabouration with other departments 16% Technologies that do not live up to vendor promises 15% Unrealistic expectations about keeping the organisation secure 12% Unrealistic deadlines 15% Continuing network or system downtime 23% Other (please specify) 0% Total 200% Q16. What steps does your organisation take to identify security risk? Pct% Risk assessments 28% Manual compliance monitoring 56% Automated monitoring tools 15% Internal or external audits 5% Informal observations by supervisors and managers 74% Other (please specify) 2% Total 180% Q17. What steps does your organisation take to ensure applications used by employees do not contain security vulnerabilities? Please select all that apply. Pct% Use a firewall and other perimeter security technologies 75% Use a blacklisting tool that identifies all applications that have known vulnerabilities 33% Use a whitelisting tool that identifies all applications that are known to be safe and secure 20% Use of patch management tools 18% Enforce strict policies 45% Lock down user machines to prevent user changes 23% Other (please specify) 3% Total 217%

Ponemon Institute© Research Report Page 28
Q18. What type of information if lost or stolen presents the highest level of risk to your organisation? Please rank the following data types from 6 = the highest risk level to 1 = the lowest risk level. Average rank Rank order Customer lists and identity information 5.89 2 Customer financial information 4.59 4 Customer purchase history 3.24 6 Employee records 3.77 5 Confidential non-financial information (such as intellectual property) 6.28 1 Confidential financial information 5.28 3 Average 4.84 Q19. What do you see as the most important factors when investing in security and data protection solutions? Please select the four top choices. Pct% Low purchase cost 58% Low TCO 52% Vendor support 40% Scalability within the organisation 13% Peer reviews and recommendations of the product or company 9% Ease of deployment 78% Ease of ongoing operations and maintenance 62% Interoperability with other IT solutions 11% Available of metrics and management reports 14% Reputation of the vendor 24% Availability of technical support and deployment assistance 36% Other (please specify) 4% Total 400% Q20. Following are 15 security control features considered important by many organisations. What is the relative importance of each feature in terms of achieving your organisation’s objectives or mission? Please rate each feature using the following five-point scale. Essential and very important Essential
Very important
Prevent questionable or suspicious outbound communications 23% 22% Prevent questionable or suspicious inbound communications such as phishing or spam 20% 25% Establish actionable policies that specify data compliance requirements 20% 20% Prioritise threats and vulnerabilities 19% 20% Prevent the use of insecure or vulnerable software applications 24% 13% Prevent or curtail insecure endpoints from accessing sensitive applications or systems 21% 10% Restrict access to sensitive or confidential data 24% 32% Curtail unauthorised sharing of sensitive or confidential data 13% 27% Curtail end-user access to insecure Internet sites and web applications 23% 34% Disengage lost or stolen mobile devices such as laptops, smartphones and others 20% 27% Identify where sensitive or confidential information is located 29% 30% Establish actionable metrics and management reporting 20% 19% Conduct close surveillance of all user activities 30% 20% Clearly defined data collection, use, storage and retention procedures 14% 14% Monitoring of business partners, vendors and other third-parties 16% 28% Benchmarks of data protection practises or operations against peer or reference group 17% 15% Total 21% 22%

Ponemon Institute© Research Report Page 29
Q21. How likely do you believe the following cyber security threats will affect your organisation’s business objectives or mission? Please rate each security threat according the adjacent occurrence scale. Very likely and likely response Very likely Likely Loss or theft of data bearing devices 32% 20% Economic espionage 8% 16% Social engineering or “pre-texting” 30% 30% Zero-day attacks 41% 29% Phishing scams 37% 27% Advanced persistent threats 17% 12% Malicious insiders 13% 14% Cheque and credit card fraud 33% 44% Insecure software applications 22% 27% Denial of services attacks 9% 17% Web-based security attacks 27% 22% Surreptitious download of malware, virus, worm or Trojan that penetrates your company’s network or enterprise system 24% 39% Insecure cloud computing applications or platform 17% 20% Insecure mobile devices connect to your company’s network or enterprise system 35% 33% Average 23% 30% Q22a. Did your organisation experience a data breach involving the loss or theft of confidential or sensitive business information in the past 12-month period? Pct% Yes 54% No or Unsure (Skip to Part Q29a) 46% Total 100% Completed only by those who experienced a data breach in the past year. Q22b. If yes, what type of records were lost or stolen? Pct% Mostly data involving consumers (individuals or B2C) 44% Mostly data involving business customers (other organisations or B2B) 51% Other business confidential information 5% Total 100% Q22c. How many separate incidents did your organisation experience in the past 12 months? Pct% Only 1 55% 2 to 3 26% 4 to 5 11% 6 to 10 7% More than 10 1% Extrapolation Total 100% 2.375 Q22d. Approximately how many separate records were lost or stolen over the past 12 months? Pct% Less than 100 54% 101 to 1,000 28% 1,001 to 10,000 11% 10,001 to 50,000 6% 50,001 to 100,000 1% More than 100,000 0% Extrapolation Total 100% 3,293

Ponemon Institute© Research Report Page 30
Q22e. What best describes the negative impact of these incidents? Please check all that apply. Pct% Loss of revenues 19% Brand or reputation damage 64% Time and productivity losses 66% Cost of outside consultants and lawyers 11% Loss of customer loyalty 12% Decrease in rate of customer acquisition 22% Regulatory fines and penalties 3% Lawsuits 2% No negative impact 28% Other (please specify) 1% Total 228% Q23a. Did any of the data breach incidents involve sensitive and confidential information entrusted to you by another organisation? Pct% Yes 36% No 59% Unsure 5% Total 100% Q23b. If yes, what were the consequences? Pct% The organisation terminated its relationship after they became aware of the breach 33% Our organisation suffered a loss of reputation 31% Our organisation lost customers and business partners 38% The organisation filed a lawsuit against our company 21% We conducted an investigation to determine the cause of the data breach 55% We negotiated an economic settlement with the organisation 36% We demonstrated that the root cause of the breach was resolved or fixed 48% We reimbursed the organisation for any legal costs or financial losses 29% Other (please specify) 1% Total 292% Q24. In your opinion, what best describes the lifetime economic value, on average, of one customer lost as a result of your organisation’s data breach? Your best guess is welcome? Measured in GBP Pct% None 15% 1 to 100 11% 101 to 1,000 32% 1,001 to 10,000 23% 10,001 to 50,000 11% 50,001 to 100,000 6% 100,001 to 250,000 1% 250,001 to 500,000 1% 500,001 to 1,000,000 0% More than 1,000,000 0% Extrapolation Total 100% £14,731

Ponemon Institute© Research Report Page 31
Q25a. To the best of your knowledge, what percentage of customer turnover did your organisation experience as a result of data breach? Pct% None (skip to Q26) 14% 1% 11% 2% 16% 3% 17% 4% 12% 5% 11% 6% 8% 7% 5% 8% 1% 9% 2% 10% 1% More than 10% 2% Extrapolation Total 100% 3.4% Q25b. Did your data breach (and the loss of customers) force your organisation to downsize and lay off employees? Pct% Yes 30% No 69% Unsure 1% Total 100% Q26a. Did the cost of new customer acquisition for your organisation increase following the data breach incident? Please note that customer acquisition costs include discounts, promotions, and additional advertising. Pct% Yes 34% No 62% Unsure 4% Total 100% Q26b. If yes, how much was the total cost of customer acquisition increase? Your best guess is welcome. Pct% Less than 1,000 14% 1,000 to 10,000 29% 10,001 to 50,000 25% 50,001 to 100,000 10% 100,001 to 250,000 11% 250,001 to 500,000 8% 500,001 to 1,000,000 2% More than 1,000,000 1% Extrapolation Total 100% £91,985 Q27a. Do you believe that your organisation’s reputation was damaged as a result of the data breach incident? Pct% Yes 48% No 44% Unsure 8% Total 100%

Ponemon Institute© Research Report Page 32
Q27b. If yes, how long did it take your organisation to recover from reputation damages following the data breach incident? Your best guess is welcome. Pct% Less than 1 month 0% 1 to 3 months 13% 4 to 6 months 21% 7 to 12 months 30% 1 to 2 years 8% More than 2 years 7% Not recovered 21% Extrapolation Total 100% 9.3 Q27c. If yes, how much did your organisation pay to recover from reputational damage following the data breach incident? For example, hiring public relation experts, outbound communications, special customer outreach efforts and more. Your best guess is welcome. Pct% None 12% 1 to 1,000 20% 1,000 to 10,000 21% 10,001 to 50,000 19% 50,001 to 100,000 11% 100,001 to 250,000 11% 250,001 to 500,000 3% 500,001 to 1,000,000 2% More than 1,000,000 1% Extrapolation Total 100% £71,705 Q28. Approximately, what is the total cost of the data breach incidents experienced by your organisation over the past 12 months? For this estimate, please include direct cost (such as cash outlays) and indirect costs (such as in-house labour and overhead) associated with these incidents. Your best guess is welcome. Pct% None 22% 1 to 10,000 25% 10,001 to 100,000 29% 100,001 to 500,000 18% 500,001 to 1,000,000 5% 1,000,001 to 5,000,000 1% More than 5,000,000 0% Extrapolation Total 100% £138,700

Ponemon Institute© Research Report Page 33
GO TO PART 4 Completed only by those who did not experience a data breach in the past year. Q29a. In your opinion, what percentage of customer turnover would your organisation experience as a direct result of notification of a data breach involving the loss or theft of their personal information? Pct% None (skip to Q30a) 30% 1% 31% 2% 14% 3% 13% 4% 2% 5% 1% 6% 4% 7% 2% 8% 1% 9% 1% 10% 1% More than 10% 0% Extrapolation Total 100% 1.8% Q29b. What is the likelihood that a publicised data breach and the loss of customers would force your organisation to downsize and layoff employees? Pct% Very likely 7% Likely 21% Somewhat likely 26% Not likely 33% Unsure 13% Total 100% Q30a. Do you believe that the cost of new customer acquisition for your organisation would increase following a publicised data breach incident? Please note that customer acquisition costs include discounts, promotions, and additional advertising. Pct% Yes 25% No 70% Unsure 5% Total 100% Q30b. If yes, how much would the total cost of customer acquisition increase? Your best guess is welcome. Less than 1,000 18% 1,000 to 10,000 35% 10,001 to 50,000 21% 50,001 to 100,000 19% 100,001 to 250,000 6% 250,001 to 500,000 1% 500,001 to 1,000,000 0% More than 1,000,000 0% Extrapolation Total 100% £36,905
Ponemon Institute© Research Report Page 34
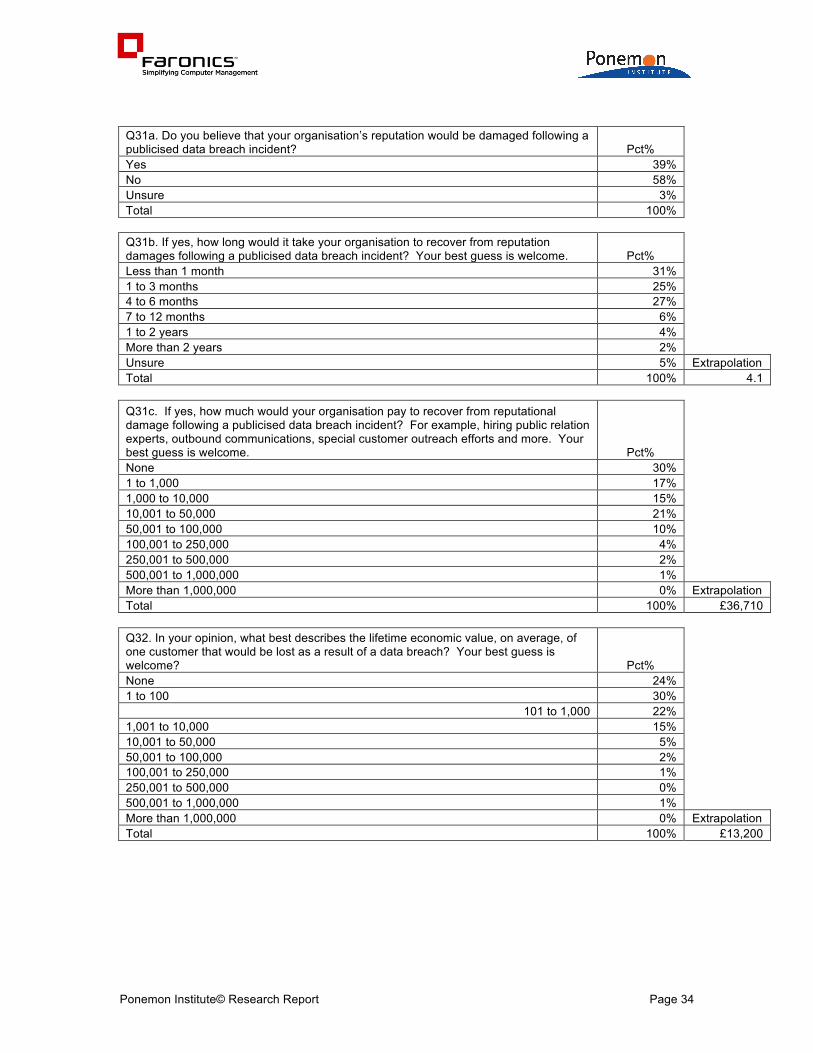
Q31a. Do you believe that your organisation’s reputation would be damaged following a publicised data breach incident? Pct% Yes 39% No 58% Unsure 3% Total 100% Q31b. If yes, how long would it take your organisation to recover from reputation damages following a publicised data breach incident? Your best guess is welcome. Pct% Less than 1 month 31% 1 to 3 months 25% 4 to 6 months 27% 7 to 12 months 6% 1 to 2 years 4% More than 2 years 2% Unsure 5% Extrapolation Total 100% 4.1 Q31c. If yes, how much would your organisation pay to recover from reputational damage following a publicised data breach incident? For example, hiring public relation experts, outbound communications, special customer outreach efforts and more. Your best guess is welcome. Pct% None 30% 1 to 1,000 17% 1,000 to 10,000 15% 10,001 to 50,000 21% 50,001 to 100,000 10% 100,001 to 250,000 4% 250,001 to 500,000 2% 500,001 to 1,000,000 1% More than 1,000,000 0% Extrapolation Total 100% £36,710 Q32. In your opinion, what best describes the lifetime economic value, on average, of one customer that would be lost as a result of a data breach? Your best guess is welcome? Pct% None 24% 1 to 100 30%
101 to 1,000 22% 1,001 to 10,000 15% 10,001 to 50,000 5% 50,001 to 100,000 2% 100,001 to 250,000 1% 250,001 to 500,000 0% 500,001 to 1,000,000 1% More than 1,000,000 0% Extrapolation Total 100% £13,200

Ponemon Institute© Research Report Page 35
Q33. If your company had a data breach involving the loss or theft of confidential information, what would be the total cost of this incident? For this estimate, please include all direct costs (such as cash outlays) and indirect costs (such as in-house labour and overhead) associated with these incidents. Your best guess is welcome. Pct% None 30% 1 to 10,000 42% 10,001 to 100,000 13% 100,001 to 500,000 11% 500,001 to 1,000,000 3% 1,000,001 to 5,000,000 1% More than 5,000,000 0% Extrapolation Total 100% £94,750 Part 3. Demographics & Organisational Characteristics D1. What organisational level best describes your current position? Pct% Owner/partner 7% Managing director 4% Senior executive 4% Vice president 2% Director 12% Manager 21% Supervisor 8% Technician 33% Staff/associate 4% Consultant 5% Other 0% Total 100% D2. Check the Primary Person you or your IT security leader reports to within the organisation. Pct% CEO/Owner 8% Chief Financial Officer 5% General Counsel 2% Chief Information Officer 70% Compliance Officer 1% Human Resources VP 1% Chief Security Officer 2% Chief Information Security Officer 9% Chief Risk Officer 2% Other 0% Total 100%

Ponemon Institute© Research Report Page 36
D3. What industry best describes your organisation’s industry focus? Pct% Agriculture & food services 2% Automotive 2% Communications 5% Consumer products 8% Defence 0% Education 5% Energy & utilities 5% Entertainment & media 2% Financial services 15% Health & pharmaceutical 3% Hospitality 7% Industrial 5% Public sector, first responders 2% Public sector, local government 9% Public sector, central government 0% Retail 11% Services 6% Technology & software 9% Transportation 4% Other 0% Total 100% D4. Total years of relevant experience Mean Median Total years of overall experience 12.06 11.50 Total years in current position years 6.35 5.00
For more information about this study, please contact Ponemon Institute by sending an email to [email protected] or calling our toll free line at 1.800.887.3118.
Ponemon Institute
Advancing Responsible Information Management Ponemon Institute is dedicated to independent research and education that advances responsible information and privacy management practises within business and government. Our mission is to conduct high quality, empirical studies on critical issues affecting the management and security of sensitive information about people and organisations. As a member of the Council of American Survey Research Organisations (CASRO), we uphold strict data confidentiality, privacy and ethical research standards. We do not collect any personally identifiable information from individuals (or company identifiable information in our business research). Furthermore, we have strict quality standards to ensure that subjects are not asked extraneous, irrelevant or improper questions.