state-of-the-art conve ntional densificatio … · ing disposal areas. 5. it was concluded that...
TRANSCRIPT

TECHNICALREPORT D-77-4
STATE-OF-THE-ART 'APPLICABILITY ,OFCONVE NTIONAL DENSIFICATIO N.TCNQE
'TO INCREASE 'DISPOSAL AREA:.STORAGE CAPACITY
~IhI~h1 by
~ Stanley'J. Johnson,. Robert W. CunnyEdward B. Perry,' Leslie. Devay
.Soils.,and Pavements Laboratory.U.S Ary Egineer Waterway's Exprien Station
P. 0. Box7631, Vicksburg, Miss. 39180
April, 1977Final Report
AooWve For Pubflc Mue:ea DilstbuionUfm
Washington, D. C-20314U IAm
Under DMRP Work Unit No. 5A03,
Monitored by Environmental E-ffects Labora'toryrU. . AmyEngineer Waterwayi Expertment Station
P. 0. Box 63 1, Viclcsburg, Miss.' 39180

Destroy this report when no longer needed. Oo not return
11 to the originator.

DEPARTMENT OF THE- ARMYWATERWAYS EXPERIMENT STATION. CORPS OF ENGINEERS
P. 0. BOX 631
VICKSBURG. MISSISSIPPI 39180
IN RPLY REFER TO- WESYV 29 April 1977
SUBJECT: Transmittal of Technical Report D-77-4
TO: All Report Recipients
1. The report transmitted herewith :epresents the results of a studyof dredged material dewatering concepts evaluated as part of Task 5A(Dredged Material Densificacion) of the Corps of Engineers' DredgedMaterial Research Program (DMRP). This task, included as part. of theDisposal Operations Project of the DMRP, is concerned with developingand/or testing promising techniques for dewatering or densifying (i.e.,reducing the voluime of) dredged material using mechanical, biological,
and/or chemical techniques prior to, during, and after placement incontainment areas.
2. Rapidly escalating requirements for land for the confinement ofdredged material, often in the midst of urbanizpd areas where l.and valuesare high, have dictated that significant priority within the DMRP hegiven to research aimed at extending the life expectancies of existingor proposed containment facilities. While increased life expectanciescan be achieved to some extent by improved site design and operation andto a greater extent by removing dredged material for use elsewhere, theattractive approach being considered under Task 5A is to densify theinplace dredged material. Densification of the material would not onlyincrease site capacity but also wou.ci result in an area more attractivefor various subsequent uses because of improved engineering propertiesof the material.
3. The technical objective of this study (Work Unit 5A03) was the evalu-ation of techniques for dewatering/densifying dredged material beforeand/or after placement in confined disposal sites. The study included
* conventional techniques used in soil mechanics and foundation engineeringand by industries such as phosphate and aluminum processors to dewater/dens;ify large containment areas. The evaluations were made on anengineering judgment basis by experts from the WES Soils and PavementsLaboratory and without laboratory or field research. The purpose of thestudy was to provide information for use in the overall development and -field evaluation of promising dewatering/densifying tech-liques for & .dredged material.
F-)
-a- S. .-J A¶ .Aa.K~f

aWESYV 29 April 1977
SUBJECT: Transmittal of Technical Report D-77-97
4. The study included (a) a comprehensive review of existing conventionaltreatment methods for maintenance dredging of soft and compressible sedi-ments, (b) evaluation of the technical applicability of various conventionaltechniques that could be applied before and after dredged material hasbeen placed in the containment area, and (c) approximate evaluation ofrelative economics of the various techniques. The methodologies consideredincluded conventional stabilization techniques used in so!! mechanicsand foundation engineering such as surcharge loading, vertical drains,underdrainage, and internal drainage systems; chemical additives; andmechanical working of material. An effort was also devoted to the establish-ment of the characteristics and properties of dredged material in exist-ing disposal areas.
5. It was concluded that dredged material in disposal areas is similarto material successfully treated by conventional foundation and engineeringpractice, but the practicability of using these techniques to increasedisposal area capacity depends more on economic and other factors than ontechnical considerations. It was concluded that seepage consolidationand urnderdrainage with and without vacuum pumping offers significantpotential and should be investigated. Desiccation of dredged materialplaced in relatively thin layers is especially attractive both in costand quantity of additional storage capacity achieved even though theconcept may have limited application. Recommendations are also made forlaboratory and field research. Results of this theoretical study shouldbe considered tentative pending completion of the applied research.
6. Major field studies on dewatering techninies are now in progress inMobile, Alabama. The techniques being evaluated were selected on thebasis of the results from this study and other feasibility studies conductedas part of Task 5A. The studies in Mobile include the underdrainageand desiccation studies recommended in this report. Definitive informationon the feasibility of these techniques will be provided in guidance inthe synthesis reports within Task 5A.
t"'JOHN L. CANNONColonel, Corps of EnginecrsI •Commander and Director
2

UnclassifiedSECURITY CLASSIFICATION OF THIS PAGE (W"ier Data Pntvfvd)
IR UPE ENTA RY DO U ENOTESA EEDINTUCIN
I 1. REP ORT S NUMBRrlu oOV ACCESSIO NOald.CPEN' CATLO NUMBERwi dett b loknub
T Dedgehn aeral ReotDisposal
70. AUTHOR AT(#)~ u S. CONTRAC OR~ GRAN NUMBER Iedybyboc.)mb
hdarbor oftPenr Lesire cofied rde atra ipoa ra. nmno
U.eSt rictiognsea er plaedwy on allowaben heaighsofn eaiigdie//ddphs
Thel purposvem ofnths saortudy wasct determin ift covninlsaiiaion-
L ONTOLN OFIC NAME~ ANDowo ADDRESISo T UnclassifiEd
SECURITY CLASSIRICATIO OF THSPAGES(?e~Dl.Etrd

Unclassified Tm i,, ,-,.<- ,SECURITY CLASSIFICATION OF THIS PAGE(Whi Dot. Entered) 1-"
20. ABSTRACT (Continued-. f \
--. ý-,techniques can be used to densify/dewater dredged material as a means),or-in-
ere&ee -the-storage capacity of disposal areas`. :This Was done 5h o- a-7=-frnt'basis-and' without laboratory or field research. -'Coarse-grained dredged mate-rial was not included in•-is study, -w •hwas restricted to clays and silty
clays,ýwhich have high wa-rer contents after placement in disposal areas.
It was concluded that conventional stabilization techniques can be used
to increase disposal area capacity but *haý economic constraints may restricttheir use.-4n--me-areas.----lwas found-that---the water content, density, andAtterberg limits of fine-grained dredged material in existing disposal areasare inadequately known. and a large-scale but relatively low-cost samplingprogram is recommended to investigate existing disposal areas of various agescontaining various depths and types of dredged material. -----
A variety of conventional stabilization techniques were evaluated. Itwas concluded that seepage consolidation and underdrainage with vacuum pumpingoffer significant potential and should be investigated. Desiccation ofdredged material placed in thin layers is especially attractive both in re-gard to cost and quantity of additional storage capacity achieved, even thoughthe concept may have limited application.
Selected research is recommended and is considered essential. Thisincludes construction of simple but large-scale sedimentation consolidationtest devices to investigate fundamental aspects of stabilization processesand benefits of various stabilization techniques.
The increase in storage capacity available from densification treat-ments should be compared with the alternative of raising the height of re-taining dikes and placing greater thicknesses of dredged material in disposalareas. The latter is generally more economical, but may not be possible insome localities because of environmental constraints or because weak foun-dations are a limiting factor for small disposal areas. Where disposal areafoundation consolidation and/or thickness of dredged material is large, densi-fication treatment is especially beneficial.
Appendixes include a description of river sediments, a general descrip-tion of conventional densification techniques, and calculations for theeconomic evaluation of densification techniques. (Ti - . .
'. . .... . . . . .
UnclassifiedSECURITY CLASSIFICATION OF THIS PAGE'When Doal Entered)

THE CONTENTS OF THIS REPORT ARE NOT T0 BE
USED FOR ADVERTISING, PUBLICATION, OR
PROMOTIONAL PURPOSES. CITATION OF TRADE
NAMES DOES NOT CONSTITUTE AN OFFICIAL EN-
DORSEMENT OR APPROVAL OF THE USE OF SUCH
COMMERCIAL PRODUCTS.
K............
• . ." .
1.............. .. ....
S• t... ........ - i

fThe ob,ýective 01, bhItt 2UL "0t a oeaut convenit tort:t 1,(5';-
niiqueS; fur duii:; ifjyint; U 'suge,,d nat L(2 ci til 1y dCWttteriiig to0 ricreaseu tim:>-
josal ar'ea stourageu capuc ilby ande tu Iittj'rue tfie enigineeringt, clharactber'-
1stlcie of tire riateri a. 'Ilic repjort intcludes a cunji'euhter::; we rev rew of
Cciivent lonal tre"atmentl methods and1( teC.Inj.1Cic and eruitOal c)F eva]luati.l cnOf'
siurchargýe loadingr, vest ±cu.r ,saild drains , ustue rdraitiage , che-mical a~id i-
tivas , arid me~chanlical workingý techiniquet--; for densýitVying dreýdged stats rial.
A s igril f'icanit effort wasý de-VULco to the CAs tabli slmieitt of bteu
o nat'aete'i stiesan'r.eti; of dr-edged m~ateriati inietsiri isoa
arecas,. Xdricen p-umned h ibo a dspslarea, dredgied mater iatl coumiotily may
have a dry solidi content ranging from, 7 to '25 p~ercent by weigrht or waler
contents; rangiiig fromr about 1300 to 300 1p- rcert. Af'ter a period of tirl~i
(rangLing from months to Years), deedtgor. the chfsacter of tine uiregeU(d
material and the nature of' the dispos3al arcea, a crulst may fonrml below
which th.-e material miay ha~ve a water con~tent approxirtately equal to 80
to !40 pe)rcenit of thie liquid limit.
lotntalcostsý for dewateririgL arid densi Lying dredg-ed materi~al
are tilluLtrated for an asserted illitiaA Coriditi on of OF tei in bteQ
dLtsposa~l area, as; ftolitows: a de-vejloped s-uriace, cru,"t 2 ftý thick, gotr
water at a depth of' 'c ft , 1.0-ft thickness of dredged mate(2rial-, initial
water content below water iabie equal to liquid limit, and liquidlit:
rang~ing front 50 to 200. Ti eati,,ne rctmthods, consideredu included:to-
jxeraiy sarxchtarge fi~ls up) to) t0 't hii ghi; tempor-ary sutrcharge(- Vi Ii. W!itut
vertical. sand dralins (20 "t ol' dredged;, natcr.i al. a.&snmjied f'or thIL:;t'rt.
rio mthd ny)) ;wate(r cd! surcharg-e up to 1 It )I' dceep wi thi itirbrance'I. s~~.and bl~atiket , anid co11c o'; ; 'a'ace ;e 1t miat, 'Si,,tt l 'r0(L
blanket, collectors, and vacuum purmping for 5 yr; uxtderdrairnage with
collecto()r;; anid sand. blanket ; urideridralinagfe with t;arid blneu o I ic-
to r ;, antd vat: uit poLutipil rig; :nee-pae 1:1toll ~dodt ,Oi onWiLbtml1 r a t:1±si
biariku t , Wo cC tots; , aridi putted wate-r se tge(no uinurte); ri
les satintbypl1acingr inl thinlay 'cr I'.' , :U1at 1 amraea: n(Tictrnal.
tai-u tenicltiri! .I. Co:;r sl range 11ceaf- Arj

F-11
capaij)itCy l'or vei't ical sand drains with 10-it surchrge on dredged mate-
e'[A, with a 1 iqui'i limit of 50 t1o $0.33 ptij cu yd 1or desicc'ation of
dredged material with a liquid limit of 200.
Chemical.. li'occulatlug agents currently u.;edl by the pliosphe•te and
alummnmi industric;; accelerate sedimentation of slurries, but unless
ot01,l0 t1oatmen t methods are used, the ecud product has a water content of
about 200 to 600 p!ercent; this is greater than that desired for densi-
flied dredgcd material. Other chemical agents such as calciumn hydroxide
and calcium carbiue, while capable of dewatering drudged material, are
very costly and are relatively ineffective for creating a reduction in
volume because ti : chemical reaction with water produces a chemical
residue of significant volume.
It is concluded that dredged ma.terial in disposal areas jis similar
to materýials successfully treated by conventional foundation engineering
practice, but the practicability of using, conventional densification
techniques to increase disposal area capacity depends more on economic
and other factors rather than technical, considerations. For dredged
naaterý ..ith water contents equal to liquid limits ranging fr'om 50 to
200 per-cent5 vnoume changes of from 10 to 60 percent can be produced
depending on treatment metnod used. Desiccatious of thin layers was the
most effective means for increasing disposal area capacity and was the
lbest costly. A choice of other methods can be made on the basis of
time available for dewatering and availability of underdrainage, which
generally must be provided prior to disposeal o.uratlo.
j, t"Surface drainag•e and surface drying should be promoted during den-
sification to reduce water contents to the liquid limit prior to special
treatment. The foruidation consolidation may result in ,;ubstaLintial addi-
tional disposal area capacity arnd should be estimated when evaluatinig
po•sibsol use of deijsification treatment to increase capacity. Dike
Ir.] mng is; the lowest cost alternative for increased storage capacity,
where termi-ssiblo(,
'i'h study found that the 'ollow in1; laboratory research is
(10,. . . . . .. . . . . . . .3

a.Dote vitllio t ioediioitn i-ose u a r ltarac torc ie:t ; a Vdvelroilgd isateiual.-
1) 1V211Ujtt(' al vrieýty 01' neQw dral iltage ma~toriiltl; atn pk Jaait(eeltniq ucs; ( agesai boratory test in ig I s neses oar: toavoid teehnitPal of< eeL 301121to prcvi ous sml11cl toot`S itldto litres Ligate p~ropos)Led denel fienti as toelirti queý 'before unlder--taking, relatively expensive fieold testsý).
iThe followingý field jiut2reti gatlon is also recumaisended:
a.Deceursine in situ conditions of dredg~ed material int disposýali
b. Test proposed draintage- techniques including7 pumpned urtderdraini-age wýith induced vacuum and seepage consolidation with andwithiout pumlped underdraitnage and iniduced vacnun;.
c. Tes;t the ef'ficacy co' desiccation by vegetation.
d. Deterrded techniques for efficiently inttroducing f'locculizi~tsinto dredged material slurries.
The effects of earthquakes were not, considered. Witers uartltiqnakes-
are possible and tite ef'fects of dike failureý anrd loss of dredged mate-
rial may be objecUlonable, separate studies are rr~qoired. In Such stud-
ies dreadged material should be conisideýred liquefaction, susceptible.
Suppleinental intformaLtion in the appendixes; includes a doescript ion
of river sediments, a genorai des3cription of conventional deosi licaition
techniques, and calculationis for the ecocnomiic evaluation of' densifica-
tion techniques.

r~i, :;tuiiy 'r~iit liei'tŽ i n Wtti masdeŽ b'1,' tlii' 1 ] :aIld 1atV;;Irft :; :ddjti
tire di) re Lio IŽ'lyE Mr. JtIuIL" 1'. 'ale, Cfwy let ,11 a: part oftir Cop oItit
I-ITo itr ,-ýt: II. of Mr. Am V wia i, Ir ' .V _ýI:Lewy' (211 eri msir, t: Sta t . I' th (Cx ) V u i t, i
rivr;;Pidireýd M~ater .iaCl DemrI ~t~lWr(iii),I :;prnsa I cpe'Val-i nnltrsI'I,
act, D1,l1i' So ek riii t liz . 5A03. lays I 1 t ii V t iirough VI 1T wcnerpr'ar:
by Mi'r. St~anlety 3J. Johiriroir. Part, IV wa jrepnr'ed by 1Mr, iPos)ers W. Cornly IarIdIC Part1 1a 'tland III wereý( preparedl jointly by Dr. Edward Pý. PerryZ arid
Mr'. Johnusonr. Dr. Perry preparedr Apecindix, A,* Mr. len] e )LeVav- zejar
Appendlix 'B, and Mr. Johnson prepared Apjr.nridix C. Plorti oris of rtie rp rt.
werve ditneusseil with Mr. Walter 2. Sýherrirni, Jr.* , who also noe;cever,,l o~f
tire visit:; to District offices.
The DM131' is ass3igned to the Einvirorrnrentai I-ffects Laboratory,I
undeor the general. so-pervisionr of Dr. John Harrison, Chief;- tire D p.
Operations Project of the DMRP is manageod by Mh'. Charles C. Calhoun, Jr'.;
andJ Dr. T. Allan lialiborton, DMPP Leotechnical Engineering Consultallt,
wass manager for the work unit.
Tire Directors of WES during the work and publication of this
report ware COL G. ih. Hilt, CL, aird COL J. L. Cannon, Ch'. 'lechnirealI
Di roe ter was Mr. PF. R. Drown.

EXF CtT I }. UF .A ' . . . . . . . . . . . . . . . . . . . . .. .}' I.:,A V. .. MA................................................
,.. I..h ....... . . .........................
tAI ' AnT 1 1 *i'TOIJ JC' l''i . . . . . . . . . . . . 9
.b .. .V . . . . 9cti w;; .................. .......................... 9
00Ii i... .'.c.i. .]. .C .; . . . ....... . . ................ 9q,: ,:l Co l l' , ! 1101-11tC on .;i a. . n . . . . . . . . . . . . . .. ].
.nhh .. i .C.; i .tt io ..... .. 2
A r~r urit. t. of .. . .. .. ... ] 3'All? II: Z•lOTI 00.01i-i]>( 1>O] H'l.•l 10 QF DiiiC)GElJ IgViAP IK lAl . . . . .*
G U'cti: ff7............................................................... 1 >
lrojOrtie.; osci' "odged Mo,,ateriid i'lacod in ConfirltedDi spo aIl Area; . . . . . . . . . . . . . . . .. . a
L'uwmary 'arid Di :0;cuion of i'roj,'rt 1.8; of ir'odged .. t. altin Coificd i as Area.. ............ ................. 36
Comparison of Dred;;ed li-aterla with Soils Stabilized byConve:nt. o nal Toclini jues............................... 31
P'ART il: 1Di,:-CRi' 7100 0, CTIN OJlNFT, DENSIFICAT]OT1011IK TECII I(QUrS . ho
-j4_ if cat jar ',tIIn'laio I os................................toli 1 ;;t, ,l cdt:*; for Deon;i C.cliat io ......................lochanhi aO) Met]otds for Dounsi.'icaLion.. ........ ............. 45
PAII' IV: Crii41[CAL DI.,,J LI,'TCATC ýi TiChiU IQUIKS. . .. ...... ............ 49
I 'hoa:;}'t•tt aod Alumoiown lndu:;try T'occhrJque. ......... .......... 19Otho2r Climfical Tr"atnt . . 6s
I'ART V:; '-CIII41CAT, A~iAL'Y2I ; ANS CO .'AI ........ . ............ (L
I.ottho.s i' Anal. V:i., . . . . . . . . . . . . . . . . . . . .. (,.Aiily i; for- DenI ;if'catio art .ff.ctn . . . .. .. . . . 75
Di seas:;Ion of liensfloatiorn.l.. ............ ................. 91
M-AET VI: ]COCNOM I" CD)MILI'AIlSONS ............. .................. 92
iBai;is for Co;;t Comp art sons..... ............ .................. 92Denrs fication by Loading .............. .................. 93Doensiftcation by Drai: . . ..... 97iens 12ia, tiolo by De:;iccuation.. ......... .................. 100,v'al]uatiori of Donrl-ii' cation Ilon'fit... . ....... ............. 101
Coendlus ioni of" DientsIfiriation Treatment ...... ............ ...
-Lrt't VII: tIf'COI.WEIIDU REEARCI .................. .............. 1 h
Saorard.ory :arc. ........ ..................... ]i4liit li. Cociiiion:; in IiA;;,os al Areas; ...... ............. ... 03
6
a

COillIENTS
h oretic l ese rch . . . . . . . . . . . . 0Densif'ication Treatmenteb Research ............... 109
PART VIII: CONCLUNIolNN .. . . . . . . . . . . . . . . . . . . .. . 1
Soil Type- in Disjosal Areas ... .. .. . .. . .. . ... 112Applicabilitv oC Conventional Dernsificatior i,]etho-ý s . 12Increased I) -'osal Area Capacity ............... 113Densificati( Veýr;us Dike Raising .............. 114Dredged Mat( !d AAs Borrow .................. 114Upgradin, o. .sposAl Areas . . . . . . . . . . . . . .. . . 11.5Chemical Trea aent . . . . . . . . . . . . . . . . . . . . . . 115Recommended Research . . ... ... .. .. .. .. . ... . 116
REFERENCES . . . . . . . . . . . . . . . . . . . . . . . . . . . . 11I
TABLES 1-24
APPEN'DIX A: COMPOSITION OF SEDIMENT"
APPENDIX B: SUMMARY OF CONVENTIONAL DEWATYRINS AND DENSIFICATIONMEMHODSI,
APPENDIX C: ECONOMIC EVALUATIONS
APPENDIX D: NOTATION
1-!
,U,

COHIVE'1I2lN FACTBIhS , U. - CuS'POrIAM• TO)
Ui . CU;3 LOIi5VY Ulli t3 of fIICUSUI~efl~iui 11,used ill this5 repcI)rt canl be con-
vcvue lto mtric (s)units, as f.ollows;
IMu Itil --1 by To Obtain
11i is 0. 00254 centimietres
inchles 2.54 centimetres
"Lef 0.30ýO48 metres
miles (U. S. statute) 1.6093414 kilometres
square feet 0. 09290304 square metres
acrtes I, o46. 8%6 square metres
cubic feet 0.02831685 cubic metres
cubic yards o.7r64555 cubic metres
gallons (U. S. liquid) 0.003785412 cubic metres
pounds (m-fass) 4153.- 59237 grantsA
tons (Ehort) 907. 1847 ki ingrains
Pounds (mass) pjer cubic 16.o1814 kilograms per cubicfoot metre
pounds (f orc e) 4. 448222 riewteorsI
poundas per square inch 6894.757 pascal,-s
pou-nds per square foot 4.882428 kilograms per squaremetre
tons per square. foot 95. 76052 kilopascals
atmosphieress (normal) .101.- 32 5 ki Icp~ascals
feet per miri itc, 0. 00508 meCtres per seconld
kiiowatt-hcur 3600000.0 loules
horsepower (550 foot- 745.6999watpouniiis per second)I
A floot-pounds (force) 1. 355-81 ouo
IFahrenheit degrees 5/9 Cels.ius dlegree,- or~4iKel,.v inu*
* Io obtaiai CelsiusAý (C ) teimpervoLure Ferom13 Fii ahrehlheiL ( rewannirs , u:,u the foilowirITg Iformula.: C =(5)/9 ) (F 32) . To obtai Kel' j.n
(K) eahnes us: F= (/9)(F 3,)) +-23.5
Ai- 4]

S'i'ATR-OI -TUIE-ARIT A4 I'LICARI LIlY 01'CI (.0.VL'']iTORAI,
DEN L;I IFICA'Il'i'.)NICIIIIQULS '1TO IIJCIsEASI
IIISPOSA1, AiREA STORAGE CAPACiTY
PART I INTHO0DUCTIOIJ
O~bje ct ives
I. Task 5A of the Dredged Material Research Program (DMRIP) of
the Corps of ligineers (CE) has as its objective the developing and
testing of promising techniques for dewatering or densifying dredged
material using physical, biological, and/or chemical methods.
2. The work described in this report is a subtask uider Research
Task 5A and has as its primary technical. objective the evaluation of
techniques for dewetering/densifying dredged material after placement
in confined disposal sites. The subta.sk involves an engineering eval-
uatiorn of the applicability of conventional techniques used in soil
mechaies and foundation engineering and b)y industry to dewatei/len:;ify
large containment areas. The principal reason for densifying dredgedmatarial placed in cýuntaiwnmuit areas is to increase disposal area
sturage capacity. A secondary objective, occasionally important, is
to improve the engineering characteristics of' disposal areas ,0o make
them suitable for subsequeni development or to make the dre-iger material
suitable as a source of borrow.
3. An ultimate objective of work described herein is to miiinimize
the numnber of now disposal areas requ.ired to contain dr'cdied material
" and to ellance tIw environmental impact of Land disposal by providinin
Asiies which can be utilized l'or Penecicial purposes. An associated
benefit is to produce significant cost savings; in disposing- o0' dredged
; ~mat erial. 1
Sc ,ce
I,, Thi:i A uty evalu.aateIl e 'Cois:i bi lity of den:si m7i no dredg'ee
o I >1'>: ]05i t, confined di.:; foJal area.; . ''hue work ireAuded (
S = ... . . -.. ...

comprehensive review of existingi convention al treatment methods for
mtainternance dredging of soft and compressive subsoils 'dredgirg of new
works sometimes contains clay balls or lumips of clay in a matrix of' soft,
clay, bu, the treatoienrt of these materiaxls is excluded from this study);
(b) evaluation of the technical applicability of various conventional
techniques that could be applied before or after dredged material has
been placed in confined disposal areas; arid (c) approximate evaluation
of relative economics of various techniques.
5. The scope of work involves application of conventional tech-
niques to both active and inactive confined, disposal sites. The method-
ologies considered included conventional stabilization techniques used
in soil mechanics and foundation engineering such as surcharge loading,
verticale drains, underdrainagc and internal drainage systems, chemical
additives, and mechanical working of material.
6. The scope of work also included a literature review. It gen-
erally excluded densification concepts of an innovative or unproved
nature or the conduct of field tests of the applicability of conven-
tional soil mechanics and fourduntion engineering techniques. As Part
of the work dIon, visits were made to the New York Port Authority
(NYPA), the N1orfolk, Seattle, arid San Francisco Districts of the CE, Am
and various private firms.
General Technical Cornsiderations
7. The simplest method of confining dredged material emlploys
low dikes and large disposal areas, out this method is not always peo-sible because of land cost arid use restrictions. An alternative is to
restrict the size of the disposal area and to gradually increase the
iheight of retaining dikes and thickness of material placed in the dis-posal area. While merely increasihr the height of retainil-ng dikes and
thickn(ess', of drodgri material. ultimately becorrmes undesirable for tech-
uicral and ae:;ý titic roasoes , land creationu is low-priority 1:80 in
lY comptred to ý;spacc creation.
8. Conventional teorltriqu;es used in soil mechaniicl and f'oundatiton
- I Ot ~ I . ... ~..........~.

eigineeriig to 3tabiliz'At (i.e. , dewater and deinsify ) sof't materials in-
volv(, cOnsideraetror of' ultimate results together with the time rcte at
which desired benet'its can be achieved. tomei ap,,liections of conven-
tional techniques do not; require special means to accelerate the rate
of densific-ajion. Under other circemistances, the desired results can-
not be obtained in the tiie desired, arid additional provisions are made
to accelerate the rate of' densifiration. For example, a surcharge load
will deinsify underlying amaterials, but if the thickness - soft mate-
rials is large, the time required may be several decades. Where ui~i..
is the case, vertical drains can be provided that decrease the length
a' drainage paths and accelerate the rate of consolidation. Since the
diains increase the cost substantially, they are not crovided unless
required. Where disposal areas are large and the rate of placement of
dredged material is slow, adequate time may be available for densifica-
tion without installing special provisions for accelerating the rate of
de-nsification. In other locations, this will nut; be the ease and added
money must be expended to obtain the desired results within the time
available.
9. The time factor is, therefore, a major consideration when
evaluauing densification techniques. This makes it essential that pla.l-
ling, engineering, and operation consider long-range utilization of
disposal areas so that time requirements for the most economical tech-
niques can be anticipated. Unless planning is done sufficiently early,
some low-cost alternatives may be precluded because cert.ain construc-
tion work was not undertaken before the disposal area was placed in
operation. For example, underdrainage layers cannot be added after th:
disposal area is filled. Planning factors relating to disposal area
". management are listed in Table 1.
10. After initiation of' this study, it was found that relatively
"little dcefinitive information was uvailable on the condition of' dredged
nat,±' ii aL'Lur sedimentatioen in disposal areas. Siice this is thu, :tart -
iniC point for ,;tuaying dcnsification treatment, consideralie eN'ffort wjs
expeiided to hind dat a relatin(g to in s;itu condition:: of dredged Yirte'ia]
jlaced in dispo:sal areas,
ii

Economic Considerations
11. The cost of techniques used in soil mechanics and foundation
engineering for densifying soft materials diffeirs enormously. Since the
availability of dredged material disposal sites varies greatly, it is
impossible to generalize on the economic burden that can be assigned to
disposal of dredged material.
12. In some areas, as in the Norfolk District, CE, large disposal
sites are available that cost as little as $0.04* per cubic yardO* of
storage capacity. This prohibits use of even the simplest densification
technique. In many areas, tolerable disposal area costs vary from $I.00
to $3.00 per cubic yard,t which is sufficient to permit various conven-
tional densification techniques to be considered. Occasionally, the
cost of provi-ing a disposal site may approach $5.00 to $10.00 per cubic
yard,• and almost all conventional techniques used in soil mechanics and
foundation engineering can be considered.
13. The evaluation of individual treatment methods depends
greatly upon site conditions, and detailed studies should be made com-
•paing various alternatives. The nethods discussed in this report are
intended to illustrate approaches that can be used to evaluate alterna-
tives in light of local and technical factors.
114. Specific techniques will be discussed individually, but the
most efficient use of disposal areas may involve either the concurrent
or staged use of' more than one approach. The most efficient use of coli-
fined 6dsposal sites will be achieved by early and continuous planning
and conuarison of technica;l and economic aspects of available techniques,
followed by field instrmentation to determine results being obtained.
ýsA Techinical evaluation of various alternactives must be considered as a
proc(es:•s starting when a disposal area is first being pilanned and contiij-
ujng throughout its operation, This entails: (a) detail]ed invectigation
SiTom Lawless;, rersonal conmunjcaJtion with H. W. Ciiny , 10 lone 1915.• A tab]e of fac tors for convortinrg U. c, customary units of miasure-
mjnti tri netric (SI ) i:: (,iven on page 0.• t' reonal• cohuili:Le at ion, R~og, er S~uoc ,i',) Stanley Jol nson.
]2'

of nat~erials to be dr-edged;I (b) laboratory tesus to determinie their
physical prioperties, suchI as g~rain ie AttEvrbv ra limits, and eonsel±]-.
daLion characteriss lacs; (c ) detailed eonsol idation arid densificat~ioni
treamtment anialyses, considering aill alter-natives; anid (d) field in-
surwunentaT~ioni arid conIn~uing- analyseus.
Arr angemrent of Reuport
15. The main text presenits only cssential discussions; supple-I
mental information that amrplifies or substantiates t~he text is g~ive-n
in the appendixes. A general description of' conventIo~nal. de~nsi ticat inn
techniques is given in Appendix A.

PART !I: ENGINEERING PROPERIIES OF" DREIDGED MATERIAL
General
16, The small amiount of data currently available regarding the
typos and physical conditions of dredged material placed in disposal
areas made it advisable to supplement this data by whatever relevant in-
formation that couLd be obtained. M'4aterials to be dredged were deposited
in a sedimentary environment generally similar to that found in disposal
areas. For this reason, data from field and laboratory testing of
in situ materials requiring dredging have been reviewed. These are
summarized in Appendix A.
Properties of Dredged Material Placedin Confined Disposal Areas
Placement of dredgedmaterial and formation of crust
17. When dredged material is pmsped into a confined disposal area,
the dry solids content may range from 7 to 25 percent by weight. If
the material is allowed to remain undisturbed for a few hours to a few
weeks, sedimentation will occur and free water can be decanted through
a sluice. The surface of dredged material exposed t5 the atmosphere
will begin to dry and a crust will form. The depth of the crust will
increase with time of exposure generally at a rapidly decreasing rate. 2
The ultimate thickness of the crust will depend upon underdrainage,
vegetation, and climatic conditions.
18. Little definitive information is available regarding engi-
. ~*neering properties of the crust. 2 ' 3 Available information generallyconcerns the movement of men or equipment on the surface of the crust.
In describing the condition of the surface crust at Penn 7, a confined*.,- Sa e 3
"disposal area near Toledo Harbor, Krizek and Salem noted there was a
period of' time during early crust formation when the disposal area was
inaccessible. Later it was possible to walk on the disposal are;- sur-
face using plywood mudshoes. Still later the crust wa.s capable of sup-
porting an individual.
lbi

19. Bishop and Vaughan described the condition of surface crusts
at disposal areas; in ]inigland. At Marchwood it was just possible to walk
on the surface after I yr. After 3-1/2 yr, a firm crust capable of sup- I
porting cattle extended down about i ft. The effects of surface drying
extended down to about 3 ft. At Rainham, the surface could be walked on
after 6 ri)-tths. At Teesmouth, a surface crust of 50 0 -psf average un-
drained strength and 2.5-ft thickness had developed after 7 yr.
20. At the "Navy Area," Port Newark, N. J. , the NYPA founed that
after 5 mrontils portions of a dredged material disposz:l area had de-
veloped a crust capable of supporting personnel, but no crust had formed
in low areas.
Effect of organic matter
21. Organic matter in dredged material may be in the form of
sanitary sewage, industrial waste, petroleum products, agricultural
wastes, and fibrous material from vegetation growth during dormant4
periods when no dredging occurs. As shown in Figure 1, an increase
in the amount of organic matter results in a decrease in the maximum dry
density and an increase in the optimum moisture content for an illiticr
soil.' Similar effects also occur in sodimented soils containing or-
ganic matter. The influence of temperature un the behavior of organi-
.6soils is discussed by Habibagahi. The presence of organic matter in
dredged material may generate gasses which could cause expansion under3
low-intensity loadings.
Engineering propcerties - Delaware R_4iver
22. Engineering properties of dredged material in confined dis-
posal areas along the Delaware River are given in Table 2.7 Phis mate-rial was sampled and tested several years following placement in the
'. disposal area. The average dry uniit weight was 51.6 pcf. The average
ratio of water content to liquid limit (LL)* was 0.80. The average li-
quidity index (LI) was o.65. The Atterberg limits are plotted in Fig-
ure 2 and fall practically on the A-line. Relationships involving the
* For convenience, symbols and unusual abbreviations are listed and
defined in the Notation (Appendix D).
15

MAXIMUM DRY DENS1I Y 35100
- PT1 IMUM MOISTURE 0083 ENT
- FC
z
z
Z 2 b
0
/u
v-II
NOEwORAI MTE -| 8 OGNI ARO
0 90 .o _ _o __,090 D
>- 1--- -- - U)
I ......... ..
80 _ _-_ _ _ _ _ 25
NOT~t ORGANIC MATTER 1.60 ORGANIK; CARBON
1.0 2.0 3,0 4.0 5.0U.
ORGANIC CARBON,
"Figre 1. Influenoe of orpyanic carbon content on compactioncharacteristics of illitic soil (from SclciidtL)
LI, water content, and percent solids are given in Figure 3 for soils
plotting along Ca.sagrande's A-line on the plasticity plot.
Eng$inleering prolperties - Toledo hlarbor
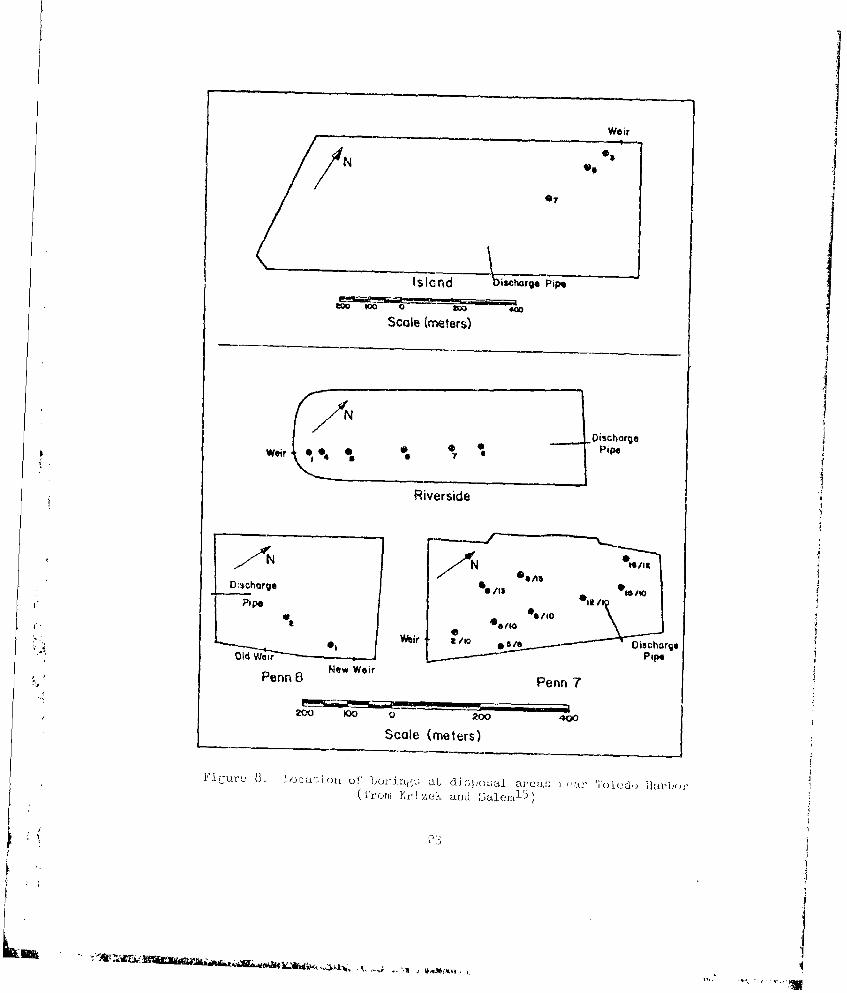
"23. Krizek and co-worKers3,8-14 conducted extensi-ve investigat -
tions into the engineering properties of dredged material placed in con-
fjired disposal areas near Toledo Harbor. Rlesults of these investiga-
tions on maintenance dredging from the freshwater environment of the
Great Lakes should not be indiscriminately applied to dredged material
from -'lainu enviruoiments. Since these ioves tigAtioxis were unucua]i ly ex-
tens yive and eeji-'cent the largeust .ourc•e ol' cngJfnecerinig dLatu on ]'ve. h-
water a :;pes a] tires, thcj a.'u ruviuw in (Il -tal -i. 'ihe tour i ape: a•)
a 'eas aUre :;t'rnowl in "ir -Ure, )4 AIl i'oiu, areas" are n al, . rectaareu In
p5lan an" t enY •;sd , iike:i rai in jTin From ae i .& , 1't 1 L to ;0 ft in height-
I. .. .Is -, l. I I- -i

425~ I) L [AW4ARV HIYER ~1ITOLED 00 0Vk-H
u UPPE.R POLLCAT BAYi00 x- ~ I OSAL, ARFA NO. H,4UFýALO HARBIOR --
Y H'ýISPPOSAL ARE-A NO. I.CLEVE LANL) IHARBOH
-A MONROE, MICH.QNUW ORLEANS, LA. ALN
50
Y(
-5 -- -- -_-------- --_---------
5002 010205 7
4000 --------r -- - 20-v1
ýOD 220
300 202) j 0
L2004-- 0 >
a~L So~0
1101- _ 1_ ------ 1___9
0 0. LL<5 I 4 1'20 . .
LIQLJUIUIY ;NUEX
tJ'ij(- 3, u~lutioiilshil) bL-AWCerl WULCer CoUte.11 11,ii.prcrlfor socil plot uinpj. on A--lille of Ipia-3tiCitY diart

Weir
Island bi~charge Pipe
M0 0 0 WD 400
Scale (meters)
Dischargo
Riverside
N
Discharge o.1/0
Pipe
1
5/1
P0/1Old Weir
Penn 8 Nevi Weir Penn 7
20 to 0 2w0 400
FjF Lu-e 4 Di SLtO:3.i siteo al. Toledo liairbor 1.-irot Kzvi s~k mi 'Ial enf

'file islund situ i; located ati the mouth of the Maumc River at the era-
trvance to the buy, The other thrjec ,sites are loca•ed au.ong, the north
b-unk of the Matuiieeý .iver near ito mouth. About 9 million cu yd of
dredl'(d iaterial1 was deposited i.n these four containmenrt areas duririLn
the period 196h-1974. The cunulative volume of dredged material de-
posjited in the Toledo Harbor di.sposal areas is showni in Figure 5. Elgi-
neeirnCg properties of dredged material in •h, zarious confined disposal3
areas are given in Table 3. Based on the results of classification
tests, it was found that the characteristics of dredged material de-
posited in the four sites listed in Table 3 were essentially the smIle,
thereby enabling (data from the different sites to be synthesized and
interpreted as representative of one large site spanning a period of
about 8 yr.
21. Sampling. Krizek8 and Hummel l resented 4nformation on
sampling techniques developed. Most of the sampling was done after for-
nation of a desiccated crust firm enough to allow access by foot. It
was necessary to use custom-designed, lightweight, hand-operated samIpling
equipment. The materials sampled were mostly fine-grained Ohi soils with
a wau"er content slightly below the LL. A 3-in. piston sampler was used
to obtain undisturbed samples. Thin tubing was used as liners in the
core barrel to minimize samrple disturbance during extraction, handling,
and storage. An air vent connected the hollow stem of the rod to the
cutting tip to reduce suction and facilitate sample retrieval. S ample 1
recovery in the soft materials was nearly 100 percent.
5•. Water contents, limits, and densities. The average ratio
of the water content to the LL (Table 3) was 1.08 1 yr after deposi-
tion. For times of 3 to 8 yr after deposition, this ratio was about
0.P5. LI values for corresponding times were 1.14 and about 0,65,
respectively. The plasticity relationships for the dredged material
are gives in Figure 6 according to Krizek et al.Z' 9 Atterberg limits
listed in Table 3 are plotted in Figure 2 and are close to the A-line.
26. The rapid increase in dry unit weight with time is shown in13
Figure 7. The average organic matter present in the dredged material
was about 5 percent.
19
-... .. ..--.. -."

0.5M.
I I Penn 7
1964 1966 1968 1 .970 197 .2 1974 1976
~-0 .
4
1ý4 1966 16 190 97174 1976L2 5 ..... . c
0 9 4 1 6 19 6 _ _ _ _ _ _ _ _ _ _w 96 166 196 1970 1972 1974 1976YeE
CU IAD 5. If -, 1!' C d~ d M 'c'i"" J
il0uoul r

SIsan 0 Riverside V en7 a Penn 8 J
!I
120 , I 1- 0
LL 1.3 (% Clay 20)
0 - 6 0 P I =l.4I lC lI y - lO )-J
•!'"V
40 0 20 40 60 . o ' v ,Percent Clay
60 -
.- 40 '•' - - •20a
60-V V
2- 2 40 6 0 8 0 1 0 60
Perc nt C ay P rcen Cla
a.41
C CL • * - OH gndMH
e-v
_,_.,_ _,,LP _ _ _ _ _L _ 1 40
020 40 60 80 100 120
Liquid Limii, LL (%)
1:1 / / T ILL 'fi- harb 'I I'm I I I I I

* Penn 7 * Riverside
* Penn 8 M Island()Number of Samples
70 - 165 14 L
(121 "
S60 -(5C)
0 55 -
0 2 4 G 8 10
Time, yr
Figure 7. Increase in dry density withtime f'or dredgea material deposited indiked. disposal areas near Toledo Harbor
(from Kri:',ek anO. Giglerl3)
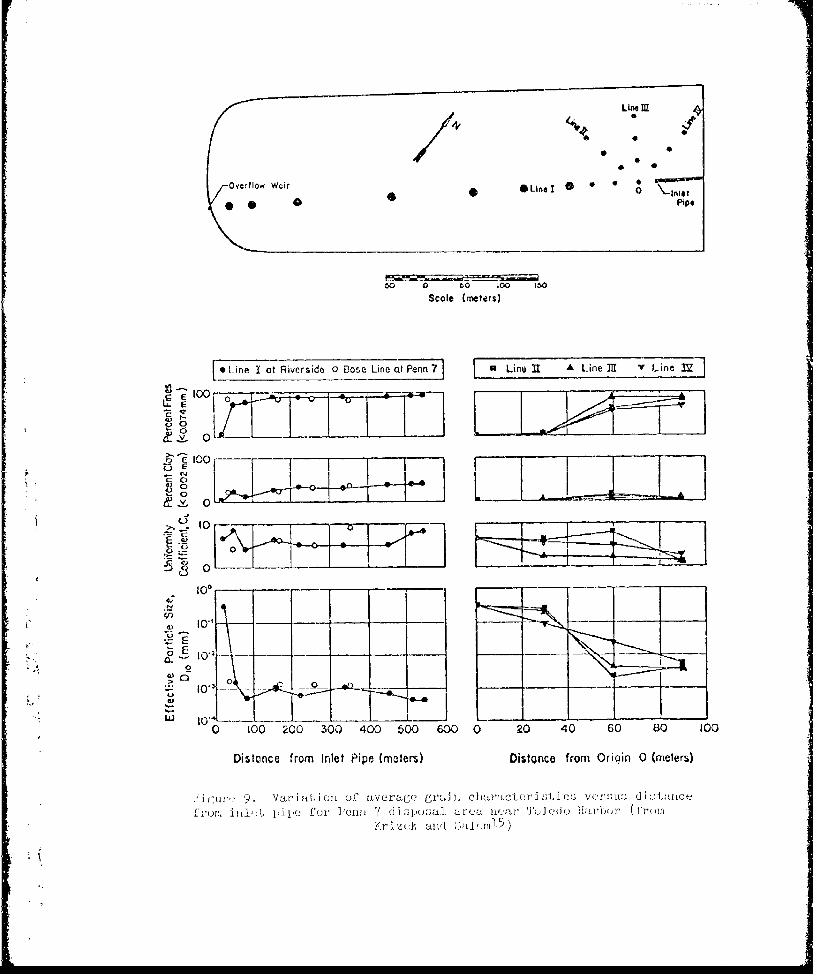
"27. Eiffect of' distanice from, i-alet -ipe. As shown in Figure L1,
borings were located to enable the dteterminatior: of' dredge-d mraterial
properties versus distance from the inlet pipe or overflow weir. The
variation in average grain characteristics versus distance ffrorr thej inl-
let. pipe f'or Penn -( disposal area is shown in Fig-,ure 9.3 The effective-_
C ~~particle size, D o0 decreases from about 0.3 to 0,0015 rim int a dis-
tance of' about 30 mn. In the folliow-ing -300 Tn, D 10fluctuates_ with no
*definite trend. A gradual decreas~e is noted fromir about 0.001 to
0.0005ý mmr ini the vicinity of' the ovei-flow weir where, surf'ace water
normally covered the site,,. The pcerent f'ines (<.T m licease I'ronl
zero nmear the inlet pipe to 9o p)ercenit in 160 m. Anmy sands present in
the dredgped material tend to dirop and displace underlying, ;(oft materiatls,
near the end of' the 1411)0.
22
Weir
N O 1 e
07
Island sa~harge Pipe j' • 0- O00 J
Scale (meters)
/ Discharge
W e teir 4 * Pipe
Riverside
N *
Dischorge . l al' O m !
%. 061
Mld WWir ai DischorgeOl C Pipe
::" Penn 8 New WeirPen 8 Penn 7
20 00 0 Z4W0
Scale (meters)
S , l~iuu~ru 8. LToc adioo o' bo'Jng:: a.t di ;1,o,,1. arzea.:; ,IeIo.'.) -fr•.'om ,' ze, ad Saleml 5
I"I
Line X
* 0
O v r f o w W e i r 0 U n\ -1 01,
0 Pipe
o to 10 0 150
Scole (meters)
.Line I at Riverside . i D e .. L, A Line
In- N.°on--o zz:T7 7 L A00 __! I _ _.I
-V 0
84 0- o0l-- _ - _-_ -_ _ _
S 10 fr1
0 100 OO00 300 400 500 600 0 20 40 60 80 100
Di5tonce from Inlet Pipe (malers) DistQnce from Origin 0 (meters)
Si ur"- . Va.riulionl of iivcrago uraui'al ia}aector I;at:; V( 'r':;u.8; di]At;t3icc
fi i: &lii' t• jio fr Poijoi r di apoai ai,. roa h r 'Jo] ed. lIai' ' ( 1Pin onl

28. Decrease in permeability with decrease in void ratio. As
shown in Figure 10, the coefficient of' permeability decreased from about
10 to about 10 em/see as the void ratio decreased from approximately
10 to 1.17 Most permeability values for the firmer materials, which had
void ratios between 1 and 2, were in the range of 10-6 to 10-e cm/sec.
Two field infiltration tests yielded permeabilities approximately three
orders of' magnitude higher than those obtained from laboratory tests on
Lndiluturbed samples.
29. The influence of salinity of depositional environment on the
structure of clay is that high salinity causes a more dispersed struc-
ture.1819 Increased permeabilities may occur in dredged material de-
posited in saline environments compared to permeabilities measured in
freshwater deposits in the Great Lakes region.
30. Consolidation characteristics. The results of slurry consol-
idation tests on dredged material yielded the empirical equation: 2 0 -22
C = 0.02(LL - 22) (1)c
where C = compression index. However, the range of LL values (60 toc
76 percent) was relatively small. This equation gives considerably
higher C values than given by other correlations for LL more than 40.C
31. An increase in void with time during consolidation at low in-
tensity of loading was believed to have resulted from gas generation.
Analysis of a gas sample revealed 3.6 percent oxygen, 15.7 percent car-
bon dioxide, 16.8 percent methane, and 63.9 percent nitrogen.
32. The initial water content w also has a significant influ-
ence on consolidation behavior at low-intensity loading.P3 Secondary
compression was found to be significant and was generally more than one-2 Lt.. half of the total settlement- under low loads. The secondary compres-
sion tended to increase in a linear manner with the logarithum of time
for a considerable period of time, after which the rate of secondary
compression increased significantly reaching a maximtum and then decreas-
ing. Thu' influence of temperature on the secondary compression of or-
guanic soils is discussed by So.25 The relative importance of .secondary
comprez•sion will be considerod furLher in Part V.
25
i..., ii i ii I i • . . . .

o
'I' 0.2 c I
0C tun) :I
-0 -0A
Eoi
00
C) CL
r=- 0
> >
(T) 6)
- J..- 04<
0 a 0 a
Lii.
(3(
3 13
E-.
',, E % .I> <] o a (3 ] .•,_- -_
t 2)
o
" °a
0 " 0 .
8 'QI4U'P,.

33. Field settlements. Field settlements measured at Penn 7 con-
fined disposal area are compared with settlements predicted using the
Casteleiro one-dimensional mathematical model3' in ligure 11. Thiis
model accounts for bottom-drainage conditions, nonhomogeneous material
properties, and consolidation and desiccation of successive layers of
dredged material periodically placed in a disposal area.
34. Shear strength. The relationship between undrained shear
strength and water content, dry unit weight, and LI are shown in Fig-
ures 12-14, respectively. 3 The strength characteristics of the dredged
material were found to be comparable to those associated with fine-
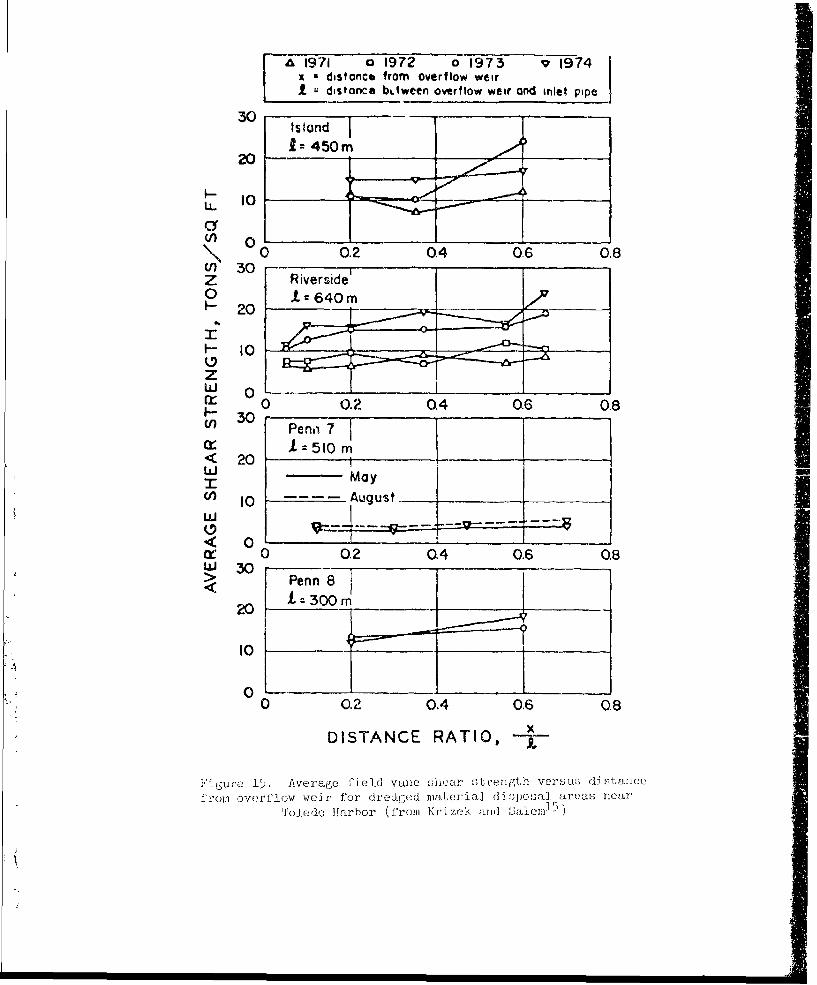
grained organic soils of comparable water content. As shown in Fig-
ure 15, the average field vane shear strength was found to increase with
iorizontal distance from the overflow weir.15 This variation is due in
part to the grain-size distribution. Coarse particles tend to settle
near the inlet pipe and fine particles tend to settle closer to the over-
flow weir. The coarse material would drain and consolidate faster than
fine material, thereby developing greater strength in a given period of
t ilme.
25. 1 igurc 16 shows the average field vane shear strength versus
age of landfill. 3 Since the placement of material at a given site took
place intermittently during several dredging seasons, an equivalent zero
time, corresponding to the placement of one-half of the final volume of'
dredged material in a site, was arbitrarily assumed. As shown in Fig-
ure 16, the shear strength increased corsistently and rapidly with time.
36. Sensitivity. The relationship between :sensitivity and water
content, dry unit weight, and LI is shown in Figures 17-19, respec-A.. tively.3 The sensitivity of freshwater dredgings, as shown in Figure 17,
inc4rses with a decrease in water content. The sensitivity cfI marine"2r jclays increases with an increase in water content. The sensitivity
of freshwater dredgings, as shown in F'igure 19, increases with a de-
cr�ase ],i. The sensitivity of marine clays increases with an, increase
in hi'. 6
hnihJuering prop0erties - Buffalo Liarbor
S7. The U. 2, Army Engineer ]istricl., Buffalo, conducted studies
S2'

Time (days)
00 _ 00 200 300 400
a Locction 5/8A Location 5/10a Location 5/13
A_ -- Mothematicol Model0.2 [ .B
E
C.
0O 6 -"_ _ _ _ _
E
UI
0.8
Figure 11. Comparison bet,.ween measured settlementsat Penn 7 disposal area near Toledo Harbor and pre-diction of Casteleiro's one-dimensional mathematical
model (from Krizek and Saleml 5 )
.00
0.50 --LI.a
U)
Z 0.200
•.•,.•,: •~ ~~~I- UCNIE OPESOFALL CONE __
S0.102w LABORATORY VANE -
0.05o FIELD VANE - -
w UNCONFINED COMPRESSION:
0.02 -- ___ _ _ _ - ______ __ _
40 60- 0
WATER COH VFENT, %
i. g iwar. stre1ntL~• vý:uru:; w: t,er ccunLent t'fur dredged malterialdisolicsal Zi'(2arua near 5'icodo Harbt'or (frci., Krizek and

1.00 j0.5,0 I- -FALIL CONE- --- ,"- -
Ii.u. LABORATORY
0 ~~VANE ..03
S0.20zo
z FIEONFINED.
I0.10 -COMPRESSION
0
I- OoO __ __
F 0.02
0,01 i40 so 60 70
DRY UNIT WEIGHT, PCF
Figure 13. Shear strength versus dry unit weight for dredged material
disposal areas near Toledo harbor (from Krizek and Salem1 5 )
1.00
0o.50o ._
FLI.
U) 0.20,,, 0° 0 _ __ _ _ _ _ _ _ _ _ _ _ _ _ _ _ _z
0FALL CONE* ~LABORATORY VANE
1- 0.10
w
SIz UNCONFINED COMPRESSIO -J-
"0.02
0,01 _______ _______________
0 0.5 1.0 1,5
LIQUIDITY INDEX
Figure 14. Mhear strength verý;us Ll for dredged material disposalareas near Toledo Harbor (from Karizek and Saleml 5 )
29
iI
a 1971 o 1972 o 1973 V 1974x distonCe from overflow weirI. distanca bLiween overflow weir and inlet pipe
30Island
20 450m
0 I0
IL
S 00 0.2 Q4 0.6 0.8
V) 30Z Riverside0 .1= 640 m
l 20
(Z 0 0.2 0,4 0.6 0.8I- 30
V) Pena 7CC" 1 =--510 mI< 20 i !W MayIW 10 August.
<0S0 0.2 0.4 0.6 08
UW 30
10
00 0.2 0.4 0.6 0.8
DISTANCE RATIO, ----
Figure 15. Average field vale s;hcar strength versus di stance
Iron overflow weir for di'edi;ed material. di: posia areas near
Toledo Harbor (from Kri zek and] '3alem]Q 5)

a Island (1967) oRiverside(1968) -JFnn 7(1972) APenn 8(1966)]
Solid symbols indicate that site was flooded in spring of 1973 and 1974
20_
-x010Io __ __I 1 I_•
10 -- _ _ _ _ _ _ _ _ _
- 0 26 8 100 20
-10-
U) 0 2 4 6 8 10
I- T 0.55
<n 0 2 4 6 8 10
LLJ.I
> 006
< 0 2 4 6 a I0
<• 20 . . ..__ __ _ _ ___ __ _ _
': ~0
AGE OF LANDFILL, YR
1Figure 16. Average fc.ield vane shear strength versus age ut' landfillfor dredged material diuposal areas near Toledo Harbor (f.'rom K1rizek
and Salem1 5 )
i r. I " I I I II I• 1 1 . ......

15
Field Vane
I0I
0r 00
0
40 60 80 10015
Field Vane
10
i' ____ Laboratory Vane
40 60 80 10015
Laboratory Vane
000
0
5 I o ] 0t
50 00. -a0 00 0 80 _
0 000
40 60 80 100
Natural Water Content, %
ligur'o Se, rsitivity vurswu; waLer conitent oir drcidfge(d materialdir. or-al --veas near Toledo Hurbor (fro 1ij Iivek aud Lalei]-)
A

1,5
FIELD VANE
00.0
5 60 80_ 0
40 45 50 65 70 75
15 -- -- -10
> FIELD VANE --
I-
W, •----•'-•LABORATORY
40 45 50 55 60 65 70 75
15- - -_ _____Is. .. II I U
LABORATORY VANE1 0I'"0
0
008.
0 00 0
• • ~0 u0,.5o-
00
40 45 50 55 60 65 70 75
DRY UNIT WEIGHT, LB/FT 3
Figure 18. eili;itivity versus dry unit weii.,l for dredgued material
dicpos'al areas near Toledo harbor (from Kri.zek and Su]erm- 5)
21":• -.7 .,•• ";9• •':": " • :•l •" •' {,: "••'•-•"'.•.tW4,• ,,,• I•,.. ,. ,t• ,,.'.,.• .4 ,,.,la•'.•.. '.. .... " ". -" •'•7•-

I5Field Vane
I0 0 0o -
5 o' -
°'-LaboraoryVn
0"
00
0 j 0_ __-----
0 0.5 1.0 1.515--
L i0 d- FieldeVax-e
0igur 1.0 1.n5iiAyv-v --;, -lfi d fd,.d m t r u
are; " TLaboratory Vane
to- -5- --- ~___ _
"* ]
O0 0.5 I.0 1.5
ara haaldbhror(f om r ikator Vanera1
-O I j Fu$, -"
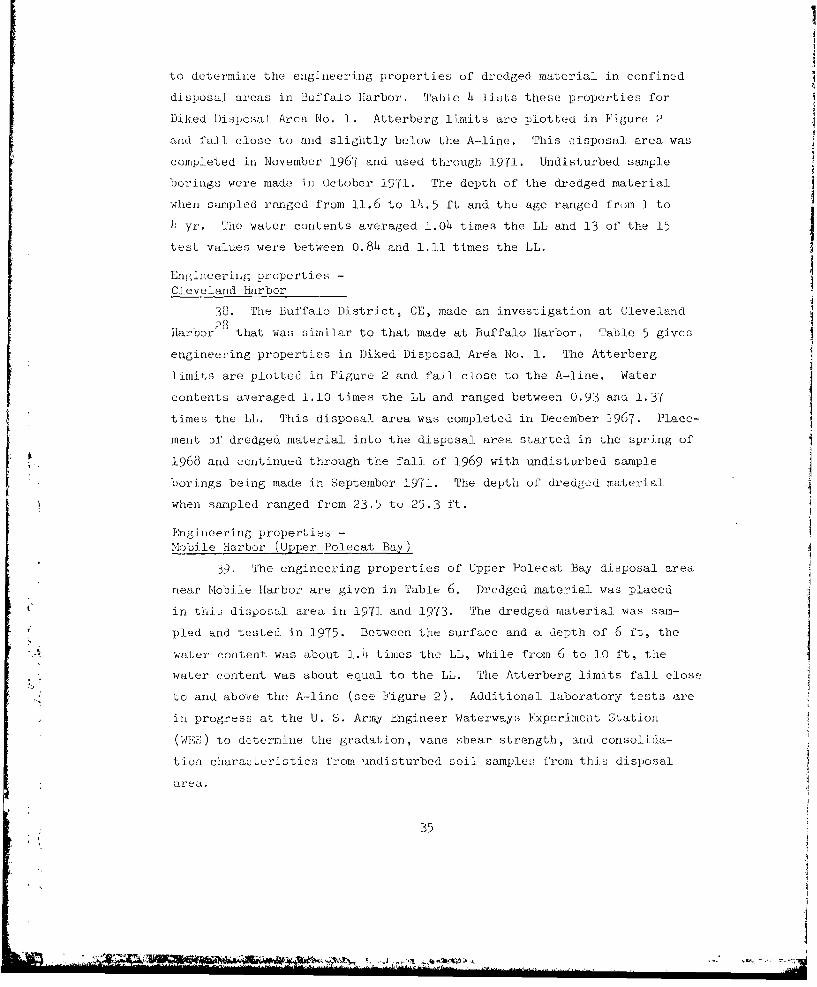
to determine the engineering properties of dredged material in confined
disposal a•reas in Buffalo Harbor. Table 4 lists these properties for
Diked Disposal Area No. 1. Atterberg limits are plottea in Figure 2
and fall close to and slightly below the A--line. This disposal area was
completed in November 1967 and used thr'ough 1971. Undisturbed saimple
borings were made in October 1971. The depth of the dredged material
when sampled ranged from 11.6 to 14.5 ft and the age ranged from 1 to
)! yr, The water contents averaged 1.04 times the LL and 13 of the 15
test values were between 0.84 and 1.11 times the LL.
Engineering properties -
Cleveland Harbor
38. The Buffalo District, CE, made an investigation at Cleveland28
Harbor that was similar to that made at Buffalo Harbor. Table 5 gives
engineering properties in Diked Disposal Arda No. 1. The Atterberg
limits are plotted in Figure 2 and fall close to the A-line. Water
contents averaged 1.10 times the LL and ranged between 0.93 and 1.37
times the LL. This disposal area was completed in December 1967. Place-
ment of dredged. material into the disposal area. started in the spring of
* 1968 and continued through the fall of 1969 with undisturbed sample
borings being made in September 1971. The depth of dredged material
when sampled ranged from 23,5 to 25.3 ft.
Engineering properties -
Mobile Harbor (Upper Polecat Bay)
39. The engineering properties of Upper Polecat Bay disposal area
near Mobile Harbor are given in Table 6. Dredged material was placed
in tihis disposal area in 1971 and 19"(3. The dredged material was sam-
pled and tested in 1975. Between the surface and a depth of 6 ft, the
water content was about 1.4 times the LL, while from 6 to 10 ft, the
water content was about equal to the LL. The Atterberg limits fall close
"to and above the A-line (see Figure 2). Additional laboratory tests are
in progress at the U. S. Army Engineer Waterways Experiment Station
(WES') to determine the gradation, vane shear strength, and consolida-
tion characteristics from undisturbed soil samples from this disposal
35
A
Engineering properties -
New Orleans2, La.
40. The New Orleans District, CE, investigated dredged material
from the Mississippi River Gulf Outlet after it had been placed in a
disposal area in 1960 and 1964. lnformation on limits and water con-
tents is given in Table 7.* Atterberg limits are plotted in Migure 2
and fall well above the A-line, higher than for all other areas, but
below the U-line. The water contents ranged between 0.6 and 1.0 times
the LL.
Summary and Discussion of Properties of DredgedMaterial in Confined Disposal Areas
41. The water content of dredged material in disposal areas at
the time of densification treatment is of paramount importance in eval-
uating the efficacy of densification alternatives. If dredged material
is placed in a disposal area and remains underwater, it will, for a
short time, be in a condition generally similar to that existing in
sedimentation tests. The water content in the upper foot might be S or
5 times the LL, while below this depth, the water content might be 2 or
3 times the LL. The material would be so weak that densification by
surcharge loading would be impossible because the shear resistance
would be too small for the dredged material to support any loading.
42. Conditions in dredged material disposal sites are, however,
considerably different than in laboratory sedimentation tests. While
the laboratory tests are useful, they relate to actual disposal sites
only for a short time period following placement of dredged material.
* -With time, surface and base drainage effects some lowering of the
groundwater level; a surface crust forms from desiccation; secondary
compression effects develop; and consolidation occurs as the effective
weight of soil above the lowered grouidwater level increases from it:;
submergtd weight to its saturated weigtht, whichi may be up to 5 to 10
* Personal cormmuniucation , 19'(5, Crum Cannon, I.ew Orleans District, few
Orleaijs, La.
36

times greater than the slurry. After a year or two, tb disposal area
has reachud a more stable condition arid densification C r. be initiated.
Great care should be taken because the materials beneath the crust are
still extremely weak.
s3. Since conventional densification treatments are practicable
only after some drainage has occurred arid a crust has developed, the
water contents at this stage are those relevant to densification anal-
yses. The benefits of densification treatments must be related to vol-
mxae changes caused by the treatments; any volumie and water content de-
creases that occur before the start of densification treatment should
not be credited to the treatment. Water contents relevant to densifi-
cation analyses cannot be obtained from sedimentation tests but can be
obtained from tests on sam•]ples recovered from borings made in disposal Iareas. This is why much attention has been focused on conditions found
in actual disposal areas at times when densification treatment might beinitiated.
44. To some extent, the condition of recent channel fillings that
must be removed during maintenance dredging approximates the condition
"of dedgjed .aterial placed in disposal areas. Consequently, and because
of the paucity of data from disposal sites, information concerning mate-rial to be dredged is also relevant to densification analyses. Never-
theless, differences between natural material in situ and when dredged
and placed in disposal areas may be substantial. As reviewed, materials
in disposal areas undergo water content decreases and densification that
do not occur, in situ in natural river bottom deposits. Hence, sediment
should be in a more adverse condition than material in disposal areas.
It'5. information previously presented on dredged naterial in dis-
I posal :;ites and on typical materials that are dredged is stumrarized in
Table - . Val]ues for the L1 and water content-liquid limit ratios are
-ls:ted in Table 9. It appe-ars that, with few e-xceptions, water contents
in ui'posai areas arc less than 1.5 times the LL and it is posjsible that
in l", shwater aruas; the wat(eIr content i. about equal to the LI. The
av�r��g� v•I~uu lo" all. do sposal cites is about 1.0. Li val.ues are t(eii-
e'al ' s mil ar ( l'.ie~ 9 ) . W,-ater cuitent -I.iquid limit ra.tio'• olnd LA
31
I I I I I I I I I II
ratios are significantly higher for in situ materials typical of loca-
tions where dredging is required. For reasons given, these are believed
too high to use in densification analyses. Liquid limits of dredged
material are generally less than 200 (Table 8), with most values be-
tween 50 and 100. For practical purposes, the Atterberg limits can be
assumred to plot on the A-line (Figure 2). Typical specific gravities'.
are about 2.60 to 2.65. Many sites contain organic matter, as discussed
for individual sites.
Comparison of Dredged Material with Soils
Stabilized by Conventional Techniques
46. Stabilization of soft soils is a frequent necessity in soil
mechanics and foundation engineering, and a large amount of experience
is available on the performance of various stabilization techniques.
The most frequently used stabilization technique is surcharge loading
with or without vertical drains to accelerate the rate of consolidation.
This type of work is reviewed in detail in References 29-34. The rele-
vancy of such work to dredged material is discussed in Bishop and
2 -, _. IVaugnan.l References 29. and 30 contain exlensive rxeforences to stabioi-
zation case histories.
4'. Engineering properties of some typical soils stabilized by
precompression techniques are listed in Table 10. According to this
table, much experience exists in stabilizing soft, highly compressible
soils with water contents in the range of 0.9 to 1.4 times the LL.
Since this is about the same water content range as most dredged mate-
rial (Table 9), conventional engineering experience appears applicable
to densification of dredged material. Shear strengths and compress-
ibilities have not been discussed, but similar findings apply.
148. While the above comparisons and conclusions are believed
valid for reasons cited, more direct justification is available for
considering conventional stabilization techniques for densification of
dredged material. Dredged material was stabilized for the Philadelphia
ý5jInternational Airport that had water contents close to the LL, and
work done by the NYPA is cospocially rclevant because of the innovative
38

techniques that were used for construction.
49. The NYPA had an area at Port Newark, 14. J. , the so-called
Navy Arca, into which dredged material (glacial till) was placed hydrau-
lically in 1972 to an average depth of 20 ft. The plasticity index (PI)
ranged between 6 and 24. After placement, the dredged material was too
soft (water content was equal to or slightly greater than the LL, which
ranged from about 29 to 43) to support a man, but after about 5 months
a crust formed over part o the area. Sand fill was placed (causing
local soil displacements), rertical sand drains of the displacement type
were installed (1974), and the area is now (October 1975) under sur-
charge loading. The sand fill was placed hydraulically using end dis-
charge and a deflector, but any future filling work would probably be
done under water to obtain more uniform distribution of the sand fill.
This case illustrates that conventional stabilization techniques can be
used but require special construction expedients.*
50. The conclusion that densification of dredged material placed
in disposal areas can be analyzed using presently available knowledge
and experience is not intended to suggest that special problems and
shortages of data and knowledge do not exist when analyzing densifica-
tion for dredged material in disposal areas. These limitations will be
discussed subsequently.
* Donald York, personal conmunications to S. J. Johnson, 21 October
19(5, also communicati, i to P. W Gunny during visit to NYPA,
16 June 19'(5.
39
PART Iil: DESCRIPTIO' F01,O CONVENTIONALDENSIFI CATI ON TECIHiQUES
Deosi ficat ion Methodologies
51. Dewatering-densification methodologies can be broadly classi-
fied as physical, mechanical, chemical, or thermal. Specific treatments
may utilize certain features of various methodologies. These method-
ologies, t,;gether with general techniques under each and their status
regarding current state of development for subsoil stabilization, are
described in Reference 36 and listed in Table 11. A general literature
review of conventional subsoil stabilization practices is given in Ap-
pendix B. Chemical methodologies are discussed in Part IV. Thermal
techniques are in a research stage and are not reviewed, being beyond
the scope of this report. Electro-osmosis is an old but seldom used
technique and is also beyond the scope of this report and will not be
discussed; however, it is being considerea for dredged material volume
reduction. 36
Physical Methods fur Densification
52. Physical methods group themselves broadly into loading,
drainage, and desiccation techniques. These treatment methods are
listed and described in Table 12 and are identified in Table 13 accord-
ing to benefits achieved.
53. The p)hysical methods are used in soil mechanics and founda-
timo engineering to reduce postconstruction settlements and increase
shear strengths and bearing capacities of soft soils. When used for
these purposes, the objective is to improve the properties of soft
soils so a site can be developed for construction purposes. In some
cases, the subsoils treated are extremely soft and approach tie prop-
ertics of dredged material after several years in a dispos;al area.
Construction purposes for which stabilized soft soil areas are used
include construction of embankments and foundations for bui]dings3,
tank.-;, etc. 2 9 ' 3 0
110
tank;;

Loading techniques
54. Various loading techniques, listed in Table 12, are illus-
trated in Figure 20.29,30 As generally used in conjunction with loading
techniques, vertical drains to accelerate consolidation serve only to
decrease the time required for densification. Vertical drains dissipate
excess pore water Dressures developed by loading techniques.
55. Surface ponding of water with a membrane on the surface of
the material to be densified (Figure 20) was used by the NYPA. A sand
blanket and collector pipe system are required beneath the membrane for
this technique. Surface ponding without a membrane could densify soft
soils if downward flow could be induced by drainage beneath or in the
soft materials, i.e., seepage pressure consolidation. This method will
be examined in Part V in detail since it is not described in available
technical literature.
56. Surface loading by atmospheric pressure was T Dposed by
Kjellmnan in 1952 (Reference 37 and Figure 20). For sa arging large
areas, vacuum pumps and collector pipes in the sand blanket beneath
the membrane would be required to avoid excessive head losses and facil-
itate removal of water forced into the sand blanket.
Drainage techniques
57. Various treatment methods to secure dewatering and densifi-
cation by improving drainage are listed in Table 12 and are shown
schematically in Figure 21. Drainage techniques can increase the settle-
ment of dredged material, thereby increasing the storage capacity of the
disposal area. Drainage can also accelerate the rate of consolidation,
i.e., stabilization, of dredged material. The various types of verti-
cal drains that have been used or proposed for dewatering soft soils
function in the same manner as conventional vertical sand drains. Fig-
S• ure 22 shows two typ,'s of paper drains developed by the Swedish Geotech-38
nical Institute. Ore such drain was reported by Kjellman and was
later adopted for use in Japan. The Kjellman type of vertical drain
was called a cardboard wick, but this term is a misnomer in the sense
that a wick implies capillary action, whereas Kjel]lman's dr:ain did not
fiuction as a capilfl-,ry device. Kjellman's cardboard drains (wicks)
S41i

-I
TEMPORARY SURCHARGE
EDDEOGED MATERIAL
CASE I: TEMPORARY SURCHARGE
PROVIDE SAND BLANKEI IFTEMPORARY SUJRCHARUE-\ 'FOUNDATION 15 IMPERVIOUS
CITCL DRAINS TO ACCELERATE CONSOLIDATIONEXTEND INTO FOUNoAION I, FOUNDATION IS COMPRESSIBL E
CASE II: TEMPORARY SURCHARGE WITH VERTICAL DRAINSIi ii
SAND BLANKET WITHCOLLECTOR PIPES REQLUIRED
-PLASTIC MEMBRANE~'- /
-TEMPOR.ARY SURF'ACE '.ONDING SURCHARG E
DREDGED MATERIAL -
CASE III: SURFACE SURCHARGE BY TEMPORARY PONDING
(KJELLMAN37
)
SAND BLANKET WITHCOLLECTOR PIPES
MEMBRANE } F, :_--.- VACUUM RjMP
C" DREDGED MATERIAL
CASE IV: SWEDISH (KJELLMAN37
) VACUUM METHOD(ADD VERlICAL DRAINS IF REQUIRED TO ACCELERATE CONSOLIDATION)
F, igu re 20. Leading techniques used to increase denrsificaLion
42
I I I I

IOI-OALARE A IS LARGE,ROUMV SAND FOJNLIAE ON - ROVIDE COLLECTOR PIPES
, !I
SAND FOUNDATION - SAND BLANKSET --
CASE !A: UNDERDRAINAGE -GRAVIIY FLOW
TO WATERVAUUPUS TO WATER
VU 3. REOGED MATERIAL "A - -U . .---
_- - - .. .: .,, •. COLLECTOR PIPES AS REQUIRED
--- MAINTAIN' PARTIAL VACUUM
I-IN" SAND FOUNDATION SAND BLANKET
CASE IB: UNDERDRAINAGE WITH PARTIAL VACUUM
'•INTERNAL STRIP DRAINS OR DRAINAGE LAYERSWITH COLLECTOR PIPES
(CASE iI: iN I ERNAL DRAiNAGE
Figure 21. Drainage techniques used to increase (lensification
4;'
a. KJELLMAN CARDBOARD DRAIN
100 M --1.4 MM
b. GEODRAIN (PAPER FILTER WITH POLYTHENE CORE)
Figure 22. Paper drains developed by the Swedish
Geotechnical Institute
143
"mI . I I I I I I I I • J

consist of' a cardboard sleeve having small open channels that conduct
water under pressure vertically to a drainage layer. T!he cardboard
serves as its own filter.
58. A drain generally similar in concept to Kjellxnan's cardboard
wick was recently developed at the Swedish Geotechnical Institute and
is called a Ceodrain (Figure 22b). This device utilizes an inner piece
of plastic with grooves that conduct water and is surrounded by an outer
heavy paper that serves as a filter. Geodrains are riot capillary de--
vices. They appear to be potentially useful in lieu of vertical sand
drains or as horizontal drains.
59. Underdrainage by lowering the groundwater level has beau used
to effect consolidation of soft soils. The effect is increased if a
partial vacuum, is maintained in the underlying material in which the
groundwater level is lowered (Figure 21 and Reference 35).
Desiccation by vegetation
60. Desiccation techniques are attractive and imply relatively
low-cost treatment methods. These treatment techniques (Table 12) are
generally applicable to disposal areas to varying degrees.
ox, Thc useý of l avtauaon to secure dewa.e..n-..ns.ificato by
the water demand of root systems is attractive on the basis of engineer-
ing experience. It is known that some types of vegetation in swamp and
marsh areas reduce the soil moisture content and increase the precon-
solidation stress. In some areas where normally consolidated soi-ls
were expected, subsoils were found to be preconsolidated by as much as
500 psf. This is a major benefit and a systematic investigation ofdesiccation by vegetation is obviously of substantial importance to
engineering studies of disposal area densification. The effects of
vegetation are being investigated separately in the DMIBP, WES.
Desiccation by capillary wicks
62. Capillary wicks (Table 12) have never been used for stabiliz-
ing soft soils and must be regarded as completely experimental. 'They
were only recently proposed by Dr. James Spotts,* and are currently
* Personal communication, Dr. James Spotts, civil engineer, Soils and
Pavements Laboratory, WES, April 1975.
44
being evalwuaed for possible us- in stabilizing dredged material. The
concept is attractive, but its potcntial cannot be assessed until nec-
essnry research has been pcrformed. it will not be discussed herein.
Mechanical Methods for Densification
63. Mechanical methods for densifying dredged material include
surface drainage, surface trenching, and reworking to accelerate desic-
cation. These techniques involve, therefore, drainage and desiccation
concepts and could also be listed under other methodologies. Less in-
formation is readily available on mechanical methods and are, therefore,
reviewed in some detail.
Laboratory tests on effects of mixing
64. Greeley and Hansen (reported by Krizek et al.') conducted
lausratory evaporation tests on dredgings from the Calumet River in
Chicago, Ill. Tnh program cunsisted of' drying dredgings, which wereplaced at depths of 2, 4, 8, and 12 in., with and without mixing at a
temperature of 741'O and relative humidity of 58 percent. The 2-in. sam-
ples were mixed at 1-hr intervals, 4- and 8-.in. samples three times a
day, and there was no mixing of the 12-in. samples. As shown in Fig-
ure 23, nearly linear relationships were obtained for the reduction in
water content with time. The rate of drying increased with mixing but
was influenced more by a decrease in thickness of dredged material.
65. A laboratory study at WES is under way to quantify the rates
of water loss so that field operations with regard to agitation fre-
quencies and duration can be optimized for various types of dredged ma-
terial slurry. Another laboratory study is being conducted to determinethe benefit of agitation on reduction in moisture content under con-
trolled foundation conditions. It is evident that controlled tests are
rnecessar,, to separate mixing benefits from those caused by normal sur-
face desli.ccation and downward drainage.
66. The mechanism of mixing effects is not clearly understood.
¶Pnaditionally, tilling, or breaking up the surface of a cultivated agri-
cultural area, is eone partially -) interrupt capillary channels and
45

20
S10
0
8i" Unmix~ed
00 10 20 30 40 50 60 70 80 90
Elapsed Time, hr>~ 8 r200
0 CD.2 4 L< 150
EC) Mixed
0
at VC)
UnmixeudCl.C 0.
'73 9 1 100 3610 2 0 3 -1
Depth, in, Depth, in,
Figure 23. Greeley and Hansen laboratory study of evaporation
tests of dredged ma-terial from Caiwnet River, Chicago (fromKrizek, Karadi, and lluime18 ),
4 6

reoduce oLace evLPeflttlor. F'Irom this viewpoint surface agitation a•nd
axing would appear 5o be of limited or questionable beriul'it. Thie tests
undcr way should clarify thii s aspect.
Dutch FIc' 3d
U . The Dutch have developed a method to increase the speed of
"r ipc?.. .j'," (biological and chemical process by which dredged material.
is c(,; verted to earth containing animal and plant life) of dredged ma-
teriai from Rotterdamn Harbor. 2,39-41 The dredged material is pumped
into' confined disposal areas which are surrounded and subdivided into
eoml trtments by dikes. Following sedimentation and decanting of the
free water, the dredged material is about 1 m thick.
68. About 2 months after filling, a vehicle known as the Amphirol
is brought into the area, leaving ditches about 10 cm deep. Figure 24
shows the Amaphirol and the Riverine Utility Craft (RUC), a similar type
vehicle used at Upper Polecat Bay disposal area near Mobile Harbor. The
Amphirol is supported by two cylinders that provide near buoyancy. The
vehicle is propelled by rotating the cylinders, which have a spiral cut-
ting edge to cut small furrows in the wall of the ditches, which ini-i-
ates cracking and ripening of the soil.
69. Two months later the ditches are deepened by tne Ampnirol4
pulling a pair of small disk wheels (2.5 m in diameter) through the
original ditches. Before the third stage, again 2 months later, a
good growth of swamp weeds has developed. A large disk wheel (3.4 m
in diameter) is pulled by tractors located on the dikes. A pattern of
ditches about 0.5 m deep and 10 m apart results. When the first layer
of dredged material has sufficiently ripened, the process is repeated
'. until the final height is reached. Underdrains have been used in some
A • cases to promote consolidation. The thickness of the dredged material
layer after ripening will decrease to 60 to 80 percent of the freshly
deposited layer. A seven-layer deposit, with 1-yr consolidation and
ripening time for each layer, will yield a 4-m final thickness in about
10 yr. Grass is sown in desiccation cracks in each lift to dcwater and
form a vegetative mat.
47
-.. .. ;9" S -,-. - iM.., k,4;..��,.' 4 t-, --. ....

7t 4A1 M
a. Riverine utility craft (RUG)
.. q :4r '.
As.i
414
~O"U~or.
b.A ... hirol.

PART IV: CHEI1CAL DENSIFICATION TECHNIQUES
Phospjhate and Aluminum Industry Tecniues
Survey conducted
70, As part of the effort for evaluating potential methods for de-
watering and densification of dredged material, contacts were made with
the phosphate and aluminum industries to determine what chemical treat-
ments are being used to dewater their waste slimes and to evaluate the
potential application of these procedures to dredged material. Visits
were made to the U. S. Bureau of Mines, Tuscaloosa Metallur v Research
Laboratory, Tuscaloosa, Ala.; Florida Phosphazic Clays Research Project,
Lakeland, Fla. ; Andco, Inc., Buffalo, N. Y. ; and Kaiser Aluminum and
Chemical Corp., Gramercy, La.
Phosphatic clay slimes
71. Phosphorus in America is obtained from phosphate rock ore
called matrix, which contains approximately equal parts of phosphate
minerals, sand, and clay. Over 100 million tons of ore is mined an-&: nually in central Florida. Thc crc is mined with large draglines,
slurried, and pumped to washer plants where it is washed, sized, and
subjected to various benefication methods to produce phosphate rock
used principally for production of fertilizer-. 42
72. Phosphatic clay slurry produced by the washing process is a
waste product called slime. The slimes must be disposed of, but they
cannot be deposited into nearby streams because of the pollution problem
and instead are stored in ponds for reasons of economy. TLe average
solids concentration of slimes discharged from a plant usually ranges
from 2 to 6 percent by weight. The suspension is pumped into extensive
settling ponds constructed in the mined--out areas. However, because the
volume of stored slimes exceeds the volume of mined-out matrices, the
dams used for impounding the slimes extend above the ground to heights
up to 40 or 50 ft. The industry reuses supernatant water released from
the suspension as settling progresses, but the combination of very slow
settling anid large volumes of slurry requires very large settling ponds.
49
-J

73. The mineralogical and engineering properties of the slimes are
suimmarized in Reference 42. The slimes are primarily a suspension of
clay parTiicles in water. The particles are of colloidal size (0.001 mm
-and smaller), and tend to form a gel and remain in suspension. Settling
is slow because of the resistance of the gel to compression and the up-
ward flow of entrapped water. A plot of solids content versus depth for
six Florida settling ponds ranging in age from 1 to 60 yr is shown in
Figure 25. The solids content for slimes less than 10 yr old and more
45 SYMBOL SETTLING AREA A GE, YR0] KINGSFORD I
40 A FM - 3
SF'M-I 5
0 S-I 635 ACHAN -6 10
0 0 CHRISTINA 60
co
0 2
9 1I X
25
14 28 2 26 30 34 38 46
SOLIDS CONTENT (I IGHT).
Figure 25. Solids content if phosphatic slimes from sixFlorida impoundment areash'3
'- than 10 ft above the bottom generally ranged from 14 to 24 percent (this
is equivalent to water contents of 610 to 320 percent). The higher
s, Lds near the bottom are attributed to drainage of water from the
slimes into perviouJ underlying material.
Potential volume decrease
74. The phosphate industry is highly motivated to find rapid and
economical methods for dewatering slime not only because of public pres-
sure to eliminate the potential environmental hazard of dike failures
50
JA
- t.&* *4~ i

and slime spills but also because the slimes retain a significant amount
of water that must be replaced for continued plant operations. An
estimate of the potential volume change that might be brought about by
dewatering can be obtained by inspection of Figure 26, which shows the
relationship between percent volume decrease and change in percent
solids, As an example, if slimes at an initial solids content of 20 pe-r-
cent by weight could be dewatered to 35 percent solids, a volume de-
crease of almaost 50 percent would result. This volume decrease is sig-
nificant to the phosphate industry. As has been shown in Figure 25,
PERCENT SOL.IlDS, BY WEIGHT
1 2 4 8 10 20 40 60 80 100
S 2 3 , ,10 20 35 50
20• 4 . _____ __
I 0
j j4.
*0
:'.0o - -__ _- __--
,U."
100 ___ __ __ ______ ______
"ig~uc 26. Volume decrease potential as a functionof percent solids
ALI
Islimes less than 10 yr old are generally in a condition of about 20 per-
cent solids. If the slime solids could be increased to 35 percent, all
slimes and sand tailings could be placed back into the pits from which
the phosphate ore had been mined. Elevated settling ponds would not be
required, and the potential of dike failure and slime spills would be
eliminated.
Phosphate slimes researchby Tennessee Valley Authority
75. The phosphate industry has been studying ways to dewater
slimes more rapidly for many years. In the late 1940's and early 1950's,
the Tennessee Valley Authority (TVA) conducted an extensive study of a
wide variety of methods that might be used to dewater slimes. These
methods included filtration, centrifugation, drying, electrophoresis,
flocculation, ultrasonic irradiation, freezing, weighing, and stirring.
Their studies found that although it is technically feasible to dewater
the slime suspension to 50 percent solids by several different methods,
the expense of applying any of the processes is significantly greater
than that of storing the material in pcnds. However, they also noted
A that thickening of the suspension by sedimentation is expedited by the
use of minimum amounts of water and dispersing and flocculating agents
in the hydraulic classification operation. They also noted that de-
watering of the suspension by filtration would be facilitated by lining
storage basino with a properly constructed filter bed, and that pro-
visions for drainage of surface water from ponds that had been filled
would permit drying of the mud by evaporation and by transpiration from
ensuing plant growth.
yC6. As part of their investigation of chemical agents, the '1TTA
studied the effect of (a) amount of reagent, (b) type of flocculant,
(c) type of dispersant, and (d) depth of suspension. For these tests a
standard slurry of 5 percent solids by weight was used. Sodium hydrox-
ide was the standard dispersant, calcium sulfate the standard flocculant,
and both were used for evaluating other reagents. These tests indicated
an optimum amount of dispersant and fiocculant above which slower and
decreased sedimentation occurs. Generally, 0.5 to 3 lb of dispersant
52

and 3 to 7 lb of flocculant per ton of solids was used for these experi-
ments. For the slurry tested, calcium sulfate was the most effective
flocculant for the first 7 hr, but sulfuric acid and calcium chloride
each were more effective after 24 hr. Suspensions that were dispersed
with sodium hydroxide and sodium silicate and later reflocculated with
calcium sulfate settled more rapidly than those dispersed with ammonium
hydroxide or sodium oxalate.
77. None of the 32 different dispersants, 34 different floccu-
lants, and 40 modifiers produced marked improvement in settling. The
depth of suslension appeared to have no effect on the settling for
short-period tests in the laboratory; however, the tendency of different
suspensions to form incompressible gels at different times subsequent to
agitation makes iL difficult to Lvaluate the effect of depth. In all
of these laboratory tests it is important to note that the best floccu-
lants produced a sediment with about 25 percent solids after a period
of 17 to 24 months.
Florida PhosphaticClays Research Project
78. More recently, the Florida Phosphatic Clays Researchit 143,45,46Project '' initiated a study for the finding of the most economical
flocculants for use with clay slurries found in Polk County, Fla. Floc-
culants that produce strong aggregations (large flocs, rapid dewatering)
to as much as 35 percent solids or more are desired and chemical plus
operating costs for treatment of the slurries hopefully will not exceed
$].00 per ton of solids. The investigation is still going on but con-
clusions based on testing conducted to date indicate that the most sig-
nificanb variable influencing flocculant effectiveness is the mineralogy
of the clay. Slime lacking in attapulgite could be flocculated at
levels of 0.3 to 0.4 lb per ton of solids with the best flocculants,
but about 3 lb of some flocculants were required for a sample with a
relatively large amount of attapulgite. Different flocculants work best
for different slines (i.e., no one flocculant gives the lowest dosage
level for all slimes tested). However, of more than 100 products tested,
S~53
II

about 10 appear consistently to give the best results.* Many of the
flocculants cost about $1.05 to $1.15 per pound. If' the required dosage
is 0.5 lb per ton of solids, the cost for the flocculant is about $0.50
per too of solids for the treated material. Since other costs for
treating the material are about $0.50 per ton of solids, it appears that
the phosphate industry will successfully reach its objective of finding
a satisfactory treatment process that costs no more than about $1.00 per
ton of solids.
79. In the past 10 yr or so there have been no really new floc-
culants produced. Advancements made have been primarily in modification
of existing flocculants to improve settlement times and rcduce cost.
Many of the better flocculants are polyacrylamides that have different
molecular weights and ionic conditions. Based on experience with phos-
phatic slimes, it appears that different types of dredged material will
flocculate best with different flocculants. However, it is believed
that it would not be too difficult to determine what flocculant from a
group of approximately 100 would be best for a particular material, and
it was estimated that this could be done for about $200 per sample.
80. Studies of the Florida Phosphatic Clays Research Project also
involve determination of the most practical and effective means for in-
troducing fiocculants into the slurry. Techniques which are currently
being studied include the addition of flocculants to the slurry with and
without prior mixing with sand tailings. Based on field experiments, it
has been determined that the flocculant should be added about 25 to
50 ft from the end of the discharge pipe. At lesser distances insuffi-
cient mixing occurred and at greater distances degradation of the
* polymer-type flocculant appeared to occur. When flocculant was added
"* without sand tailings the average solids content of the flocculated
slimes at the end of 5 months was about 25 to 27 percent by weight.
This was significantly better than the nonflocculated slimes, which
"averaged about 15 percent by weight. When flocculant was added with
* Personal communication, Fred E. Woodward, Surface Chemists of Florida,
to R. W. Cuny, 1 April 1975.
54

sand tailings, the solids content of the slimes 1 week after deposition
ranged from 20 to 40 percent with an average of 27 percent; the rapid
dewatering of these slimes was aided by the sand tailings, which sepa-
rated from the flocculated clay and provided some sort of drainage
system for the clay.
81. Based on tests currently being conducted, it appears that
flocculants will be found useful to the phosphate industry in that they
will make possible the rapid dewatering of the slimes to a solids con-
tent of 35 percent by weight or more. This will satisfy the require-
ments of the phosphate industry since, at this solids content, all the
slimes and sand tailings will fit back into the mine pits. However, it
is to be noted that 35 percent solids is equivalent to a water content
of 186 percent, and this iK more water than considered acceptable for
dewatered dredged material.
Bauxite residue treatment
82. Bauxite residue, also called red mud or slurry, is a waste
product resulting from the production of alumina. At the Kaiser Alumi-
num and Chemical Plant in Gramercy, La., alumina is made from Jamaican
bauxite, and residue is produced more or less continuously at the rate
of approximately 1400 gallons per minute (gpm) with a solids content
ranging from 15 to 20 percent by weight. In the past this waste has
been discharged into the Mississippi River, but in 1971 an agreement was
made to discontinue this practice and since November 1974, the residue)47
has been impounded in a storage pond.
83. A substantial portion of residue has a particle size in the
range of I p, and the slurry is highly caustic. To permit the recovery
r of soda values from the slurry, starch is added, thereby flocculating
¼ the solids to an average size of about 10 P. The resultant slurry at
15 to 20 percent solids by weight still has poor settling characteris-
ties and without additional processing would settle and consolidate to
a solids content of only 28 to 30 percent (equivalent to a water content
of 260 to 230 percent).
84. To obtain increased consolidation of the residue and minimize
land area required for storage, the following additional processes were
55
L!

studied: (a) a mechnical filtration/filter cake distribution; (b) decan-
tation and evaporation of water (DEW process); and (c) drainage, decan-
tation, and evaporation of water (DREW process). Pilot filtration ex-
periments were conducted with a 4- by 3-ft rotary drum filter, and it
was found that the solids contents could be increased to about 40 per-
cent by weight. The 40 percent mud was pumped at a rate of 8 gpm to
an impoundment area where, within 2 months, it further dewatered to
70 percent solids, its estimated shrinkage limit. Pilot tests of decan-
tation and evaporation in a 100- to 200-acre pond indicated that, with
rainfall. that occurs in south Louisiana, only a maximum of 37 percent
solids could be expected.
85. The third method, called the DREW process, involved the addi-
tion of a sand bed to the bottom of the storage pond. Two DREW proces-
ses, shallow and deep, were studied. The shallow DREW process involved
repetitive distribution of an average h-in. layer of slurry over the
sand bed. Pilot tests for this process indicated that a h-in, layer of
slurry at 15 to 20 percent solids by weight would be dewatered to the
shrinkage limit in about 15 days on the average, depending on rainfall
and time of year. Based on these results, it was estimated that a mini-
mum of 600 acres of sand beds would be required to handle the bauxite
residue from the Gramercy plant.
86. The deep DREW process involves the continuous distribution
of slurry from a feed point infrequently rotated around or within a
sand bed impoundment area to ultimate depths of 18 ft or greater. Pilot
tests for this process indicated that 50 percent solids by weight can
be obtained in about 10 months. During feeding, 65 percent of the liquid
extracted was removed by decantation and evaporation, and 35 percent was
removed via the bottom sand bed. After feeding stopped, surface cracks
developed. Rainfall was removed primarily by decantation although some
rain penetrated through the mud into the drains. If rainwater was not
removed by subsurface drainage, it was believed that dewatering past
37 percent solids would not be possible. However, it was also believed
that evaporation was necessary for the bed to reach an ultimate solids
56
A

content of 50 percent, and after the tenth month it became the principal
dewatering mechanism.
87. Of the several alternative methods studied, the deep DREW
process was selected for dewatering the bauxi1 residue. The basis for
this selection was: (a) stable land with 50 percent solids by weight or
greater could be obtained; (b) minimum land area required; (c) lowest
capital and operating costs; and (d) storage area apparently can be con-verted to usable land or raw material sources after pond is filled.Cost for construction, operation, and maintenance of the storage pond
has been estimated to be about $1.00 to $1.20 per ton of solids,
Discussion
88. Experience in and status of the use of flocculants by the
phosphate industry in Florida and the Kaiser Gramercy plant have been de--
scribed in the preceding sections. Both used flocculants to increase
the rate of sedimentation of slurries composed of clay-size particles.
The Kaiser group at Gramercy has -ound that their bauxite residue can
be flocculated and dewatered to a condition of 28 to 30 percent solids
by weight by the use of starch alo~ie and that by the addition of under-
drains and surface evaporation an averape condition of 50 percent solids
can be obtained at a cost of anproximately $1.00 per ton of solids. The
phosphate industry investigators are currently searching for the least
costly flocculants and are developing techniques for efficiently intro-
ducing the flocculants into the phosphate slimes to increase the solids
content from about 5 to 35 percent in a period of weeks or months rather
than years, and at a total cost of about $1.00 per ton of solids. Sim-
ilar experience might be anticipated with dredged material. However,
solids contents of either 50 or 35 percent are equivalent to water con-
tents of 100 or 186 percent and these are still relatively high; this
appears to be the lowest water contents that should be expected if
dredged material was treated only with flocculants,
89. Caution must be taken when dealing with flocculants. As a
result of laboratory experience, it has long been recognized that
flocculants greatly accelerate the settlement of soil suspensions and
this is of interest to the dredged material disposal business. However,
57

laboratory experience has also showni that, while flocculants accelerate
initial settlement, after a period of time untreated material will set-
tle to void ratio less than that for the treated material. This is
illustrated by a test reported by Bishop and Vaughan2 and snown in
Figure 27. This figure shows that in the laboratory a 4O0-mm high,
400
350z
]
0 300 -
5 SEDIMENTATION TESTS(0 250 - HEIGHT OF SOIL COLUMN VERSUStL rIM E. INITIAL SLURRY 5% SOLIDS BY0 WEIGHT. TREATED SLURRY 3.9 PARTSI-I 200 - FLOCCULANT TO 104 PARTS SOLID.
IdT
150
0.01 0.10 1.0 10 100I|TIME, HR
Figure 27. Comparative :laboratory sedimentation tests on Thamesblack mud untreated and treated with polyacrylamide
5 percent solids by weight, suspension of Thames black1 mud treated with
polyacrylamide initially settled much faster than the untreated mud.
Settlement of the treated mud was virtually complete after 1 day, but.
the untreated mud continued to settle. After 8 days the untreated mud
had settled more than the treated mud.
90. It is not known whether the above test reported by Bishop
and Vaughan should be considered typical of dredged material treated
with flocculants. At least one aspect of the Bishop and Vaughan test
appears to be nontypical and that is that after 3 weeks the solids con-
tent of the treated mud had increased only from 5 to 10 percent by
weight. In a test conducted by Andco, Inc., flocculant was added to a
slurry of Mobile Bay mud and in a matter of moments the solids content
had increased from about 21 to about 35 percent. Also field tests
58
. .. . .. . . a. . . .

conducted on attapulgite phosphatic slimes in Florida indicated that
after 26 days and at depths of 2 to 8 ft the solids content of treated
slimes averaged 1-4.8 percent whereas the solids content of untreated
slime averaged 10.2 percent. It is also possible that the salt content
of the liquid phase of the dredged material could have a significant
effect on the efficiency of the particular flocculant being used. This
factor should be carefully considered in the evaluation of different
flocculants. However, in Florida the laboratory phenomenon is generally
not duplicated in the field and it is thought that this is because
gravity forces are very important. At depths greater than those ob-
tained in laboratory flasks, it is believed that effective stresses
caused by the weight of the overlying material are sufficient to over-
come the interparticle shear strength of flocculated material and then,
because of other characteristics, the flocculated material is compressed
to a degree greater than that possible for the untreated material (at
least during the time frame of interest).
Conclusions from reviewof industrial practice
91. Based on the experience of the phosphate and aluminum in-
dustries, it appears that flocculants could be used to expedite the
initial seditentation of clay-size dredged material that would other-
wise settle only very slowly. Solids contents of 25 to 30 percent by
weight for treated dredgings up to 18 ft thick can be anticipated in
less than I yr. With the addition of underdrains, surface drainage,
and evaporation, a solids content of about 50 percent is a reasonable
expectation.
92. Cost for effective floccul-•• xppears to be approximately
$0.50 per ton of solids treated. For claylike materials with a natural
water content of 100 to 300 percent, cost for the floccalant will range
from $0.30 to $0.15 per cu yd of measured material in the disposal area.
Other costs associated with the flocculant treatment might be $0.1.5 to
$0.10 per cu yd with the total costs ranging from $0.25 to $0.45 per
cu yd of material treated. If tbe volume decrease resulting from using
flocculants was 63 percent, the cost of the flocculants would be about
19

$0.21 per cu yd of additional storage volume obti Lned. These benefits
would not be realized if the solids drop out of suspension without undue
delay.
Other Chemical Treatments
Types of treatment
93. In 'Idition to various uses of flocculants to accelerate sed-
imentation, other chemical treatments have been used to stabilize soils.
It is appropriate, therefore, to consider the potential application of
these techniques for dewatering and reducing the volume of high-water-
content dredged materhal. The most common treatment of this type is theapplication of quicklime which reacts with water to produce a material
with a lowered water content. Another chemical of this type is calcium
carbide, which the University of California at Berkeley has suggested
might be added to dredged or other material to produce a desirable con- 3struction material and at the same time produce acetylene gas which
could possibly be recovered and sold to recoup at least part of the
treatment cost. A patent application for these and other uses has been
prepared. Chemical grouting has been used to stabilize soils but is not
considered applicable for reducing the volume of dredged material placed
in disposal areas. Chemical grouting could be used to increase shear
strengths but the high cost eliminates its consideration even for this
purpose.
94. Quicklime. When quicklime (CaO) is added to a high-water-
content soil, the immediate reaction is for the quicklime to combine
with the water (H,20) to produce calcium hydroxide (Ca(OH)2) and heat.
Over a longer time period the calcium hydroxide (slaked lime) reacts
with some minerals in the soil to produce a soil with improved drainage
and strength characteristics. However, from the point of view of' de-
watering and densification, interest centers on the immediate reaction
as it relates to volume change resulting from loss of water due to the
formation of calcium hydroxide and heat.
6o

95. The chemical equation foi the reaction of quicklime and water
is as follows:
Ca0 + h2 0 -• Ca(0H)2 + - 16,000 cal (2)
The comparable equation with molecular weights is j56.07 + 18.02 -* 74.09 (3)
Thus, for each 56.07 g of quicklime added to a wet soil, 18.02 g of
water is consumed and 74.09 g of calcium hydroxide and approximately
16,000 cal of heat are produced. Since the specific gravities of water
and calcium hydroxide are 1.0 and 2.08, respectively, the net volume
change of such a reaction in the absence of any vaporization of water
is an increase of 17.6 cc and not a decrease.
96. To examine the potential for vaporization of water, it will
be helpful to run through a sample calculation. Assume that I cu yd
(0.76 m3) of dredged material with a water content of 200 percent is to
be treated with 430 lb (195 kg) of quicklime. If the specific gravity
of solids of the dredged material is 2.50, each cubic yard will contain
702 lb (318 kg) of solids and 1400 lb (635 kg) of water. The 430 lb of
quicklime will consume 138 lb (63 kg) (2.2 ft 3 ) of water and will pro-3 7 -
duce 568 lb (258 kg) (4.4 ft ) of calcium hydroxide and 5.58 x 1-0 cal
of heat. The specific heat of water is 1.0 cal/g and if it is assumed
that the specific heat of solids is 0.2, the temperature will be in- 4creased 810C if 100 percent of the liberated heat is uniformly utilized.
If the initial temperature was 19"C, all the water would be at the boil-ing point, but none would have vaporized; and the net volume change
would have been an increase of 8 percent.
97. If an additional 100 lb (45 kg) of quicklime was added to
the dredged material, an additional 0.50 ft 3 (0.014 m3 ) of volume in-
crease would result from the production of additional calcium hydroxide,
but since the heat of vaporization of water is 540 cal/g, the extra
heat would vaporize 0.90 ft 3 (0.026 m3 ) of water. Thus, the volume of
water lost by vaporization is greater than the volume increase from
calcium hydroxide. However, it would take an additional 540 lb (245 kg)
1

of quicklime to reduce the volume to the original. Thus, with the addi-
tion of a total of 970 lb (440 kg) of quicklime, there would have been
no volume decrease and the material would be more lime than soil; but
the water content would have been reduced to about 40 percent. Based on
1975 prices, the cost of the quicklime would have been about $20, and it
is quite apparent that, volumewise, nothing would have been gained by
this expenditure of effort.
98. Calcium carbide. Calcium carbide (CaC2 ) is another chemical
agent that reacts with water and thus potentially might be useful for
de~a.ering purposes. When calcium carbide is added to water, acetylene
gas (C H ), calcium hydroxide (slaked lime), and heat are produced. The
chemical reaction and molecular weight equations are as follows:
Ca2 + 2H10 2 C22 + Ca(OH) 2 + ; 30,000 cal (4)
64.07 + 36.04 - 26.02 + 74.09 (5)
The above equations indicate that for each 64.07 g of calcium carbide
added to a wet soil, 36.04 g of water will be consumed, 26.02 g of
acetylene gas will be released, 74.09 g of calcitum, hydroxide will be
produced, and approximately 30,000 cal of heat will be liberated. Using
the specific gravities of water and calcium hydroxide, the net volume
change of such a reaction in the absence of any vaporizatibn of water is
a net volume decrease of o.44 cc.
99. To examine the potential for vaporization of water it again
will be helpful to use a sample calculation. Assume that the same I cu
yd (0.76 m3) of dredged material as in the previous example is to be
treated, but this time 250 lb (113 kg) of calcium carbide is added. The
chemical reaction consumes 141 lb (64 kg) (2.2 ft 3 ) of water, produces
289 lb (131 kg) (2.2 ft3) of calcium hydroxide, releases 102 lb (46 kg)
of acetylene gas to the atmosphere, and liberates 5.31 x 1]0 cal. As-
suming the same specific heats as before, the temperature of the dredged
material would be increased by 80'C if 100 percent of the liberated heat
is uniformly utilized. If the initial temperature was 200C, all the
water would be at the boiling point, but none would have vaporized;
62

ana the net volume change would have been negligible.
100. If an additional 250 lb (113 kg) of calcium carbide was
added to the dredged material, the additional heat would vaporize 216 lb
(96 kg) (3.5 ft 3 ) of water. Thus, with the addition of a total of
500 lb (227 kg) of calcium carbide, the volume would have been decreased
13 percent and the water content reduced from 200 to about 71 percent.
Based on 1974 prices, the cost of the calcium carbide would have been
about $46, and it is apparent that only a relatively small volume de-
crease would result from a relatively costly expenditure. It is possi-
ble that some of the acetylene gas could be recovered from this opera-
tion; and while the value of the acetylene gas produced apparently is
somewhat greater than the cost of the calcium carbide, the cost for
collection and distribution of the gas and thus the cost benefit from
such a recovery operation is not known.
Discussion
101. In the examples described above, it was assumed that 100 per-
cent of the heat liberated by the chemical 'eactions was utilized to
increase the temperature of the dredged material and to vaporize water.
In actual practice, thiE of course, would not be the case. The actual
efficiency of heat utilization would depend on the process used and most
likely would not exceed 70 percent, probably being much less. Thus, the
volume changes that might be obtained in a full-scale operation would
be less than that calculated, and it is apparent that the potential for
obtaining significant dewatering and volume reduction by addition of
commonly known chemicals to dredged material is minimal.
102. While only quicklime and calcium carbide were considered in
the above analyses, it is possible that other more effective chemical
comyouadu may exist. However, no survey of the chemical industry was
made for this study, and it is believed unlikely that more effective
and less expensive chemical dewatering compounds would be fourd if such
a survey were conducted. Unfortunately, the cost of even ,pensive
chemicals is relatively high.
63

PART V: TECHNICAL ANALYSIS AND COMPARISONS
Methods of Analysis
Basic concepts
103. Because dredged material placed by hydraulic means in dis-
posal areas is essentially saturated, increased disposal area capacity
can be achieved only if the water content of the dredged material is
decreased.. Procedures for computing volume decreases associated with
moisture content decreases utilize methods developed in soil mechanics
and foundation engineering and are widely used for analyzing effects of
conventional stabilization techniques. Computations for amount and rate
of volume decrease can be made considering the (a) characteristics and
thickness of dredged material; (b) type of densificatirjn treatment, if
any; and (c) opportunities for natural moisture content decreases from
drainage into foundation soils beneath the disposal area.
104. While di~nc~al areas may have relatively firm and incompres-
sible foundation soils, such materials also may be soft and highly com-
pressible since disposal areas are generally located along rivers or
harbors. Where foundation soils are thick and highly compressible, the
weight of dredged material may cause substantial foundation consolida-
tion and result in increased disposal area storage. In some cases, the
increase in storage capacity from the weight of dredged material and
effects of densification treatment may largely result from foundation
settlement. It is necessary, therefore, when analyzing effects of
densification treatment, to evaluate the effect of treatment on the dis-
posal area foundation as well as on the dredged material. While this
K5 can be done by methods to be discussed, this report will consider only
the effects of densification treatment on dredged material.
Magnitude of volume decrease
105. The volume decrease which can be achieved by densification
treatment, i.e., the storage capacity increase, depends on the initial
water content of the dredged material after ;edimentation has occurred.
Sandy soils placed in disposal areas have low moisture contents after
64
- - . 4' 'I

sedimentation, and little storage volume can be obtained by attempting
to dewater such soils. This is not true for fine-grained dredged mate-
rial because it has high water contents and undergoes large volume de-
creases it' the moisture contents can be reduced. It is this type of
material that is of primary interest.
106. The nature of fine-grained-dredged material can most easily
be described by the Atterberg limits and water content. For convenience,
Atterberg limits, i.e., the LL and plastic limits (PL), are normally
plotted on a plasticity chart, as was done, for example, in Figures 2
and 28. Clayey soils generally plot above the A-line whereas silty
LEGENDC YORK RIVER A SOUTH ATLANTICC3 SAN FRANCISCO BAY Ln NORTH ATLANTIC
0 DELAWARE RIVER V GREAT LAKES
100 V CHARI-ESTON HARBOR o PACIFIC COAST _ ____
C GULF STA7IES 0 NATION
I n• -A-LINE
JSLIN
Li IUO IIT E
LJU
0
0 2b 50 75 100 125 IS020
LIQUID LIMIT, LL
SFigure 28. Plasticity plot for material to be dredged
and organic soils plot below the A-line. From Figures 2 and 28 it is
evident that materials encountered in most dredging work plot along the
A-line, This is convenient because soil property correlations and vol.-
uine changes ;ire somewhat sirnpler if only the LL and water content are
cootrolling factors.
;j 65
.3 ;2E2M ~ A~aL&,2x. .*

107. The equations for volume decrease of a normally consolidated A
fine-grained soil are;
AV iAH Ae C c l o + A"-v = l=7e l+e log T (6)
0 o PO
where
AV = decrease in volume
V = original volume
AH = decrease in dredged material thickness
H = thickness of dredged material
Ae = decrease in void ratio
e = initial void ratio0
0o= initial effective stress
A7 = increase in effective stress
The effective stress increase causing volume decrease Ap carn be caused
by surcharge, drainage, or by desiccation. The effective stress before
application of Ap is P . The value of Cc /(l + e) is a measure
of the compressibility of a soil and can be corruelated with LL and w
Various correlations have been developed (Reference 29 aDd Appendix C),
and the following conservative values are selected and used in the illus-
trative computations made subsequently.
c (l + e)LL c 0
50 0.16
75 0.22
100 0.25
150 0.29
"200 0.31
The above values assume that the initial void ratio e corresponds to0
a water content equal to the LL and the specific gravity is 2.6.
108. The volume decrease of dredged material can be related to
a decrease in water content w as follows:
AV AH eA_V H l+e
0
66
*1
, ta.a, j . A~~

Since, for saturated materials e = wG and Ae = GAw
AV_ A•L GAw (8)
V H i + Gw
in which e is the void ratio, Aw is the decrease in water content,
and, G is specific gravity. For reference purposes, the water content
of dredged material having an initial moisture content of twice the LL,
which might exist shortly after sedimentation in the disposal area, has
been plotted versus corresponding volume changes in Figure 29. Moisture
contents of natural soils generally fall between the LL and FL. At the
LL, soils are soft, have low shear strengths, and can undergo large vol-
ume changes if loaded. At the PL, soils are relatively strong and can
carry significant loads without undergoing large voliume changes. Soft
soils stabilized by conventional techniques have LI values generally in
the range of 50 to 100 percent. These soils, stabilized by techniques
such as surcharging, undergo relatively small decreases in water content.
109. Volume changes associated with moisture content decreases
plotted in Figure 29 are summarized in Table 14. It is evident that it
* becomes increasingly difficult to secure an added increment of volwne
decrease as the moisture content decreases. For example, it is rela-
tively easy to secure moisture content decreases from initial values of
twice the LL down to the LI, since this almost occurs naturally (accord-
ing to data presented in Part II). Further decreases in moisture con-
tent, to LI values of 0.75, 0.50, 0.25, or 0.00, are increasingly more
difficult to obtain. The upper portion of Table 14 shows incremental
volume decreases expressed in percent of an initial volume corresponding
to a water content equal to twice the LL. The lower portion of this
table shows similar incremental volume changes for a disposal area in
"which the water content at the time of possible densification treatment
is at the LL.
lilO. At the present time, the relatively little information
available suggests that initial moisture contents of dredged material 3
at the time of densification will range from I to 1.5 times the LL.
There is some evidence that dredged material extracted from salt water
67

900 I
INOTE: 2 LIQUID L.IMITLIQUIDITY INDEX VALUESASSUME ATTERBERG LIMITS
I PLOT ON A-LINE
700 ~- --
600- L
-JJ
U,
0 00
<.Q
200
020 40 60 80 100
AV
0
Figure 29. Volume chf.'ges with moisture content,reases

has higher water contents than dredged material from tida± marsh or
freshwater deposits. For conservatism, benefits of densification treat-
ment will be computed assuming initial water contents equal to the LL.
This is consistent with the data examined in Part 11.
Time required fordensification by consolidation
-11. Basic concepts. The time required to obtain densification
by consolidation can be estimated using Terzaghi's method for one-
dimensional consolidation. While there have been many modifications
to this approach, it is convenient and sufficiently accurate for esti-
mating the time required and illustrating concepts involved. When a
soil is loaded, excess pore water pressures are developed which dissi-
pate with time as pore water is squeezed from the interior of a soil
deposit to the exterior or drainage boundaries. The time required to
reach a given percent consolidation is dependent on a time factor T ;2 v
the thickness squared H2 of the soil deposit, where H is the length
of one-uay drainage path; and the coefficient of consolidation cv of
the soil, which is considered a soil property although it depends also
upon effective stress. These factors are related to the time t re-quired to reaco a given peuenu cuasolidation by the equation:
T 12
t = v (9)c
v
112. The effects of time, thickness of soil deposit, and degree
of consolidation achieved are illustrated in Figure 30 for a soil hav-
ing a c of 0.01 sq ft/day. If the soil is underlain by imperviousvmaterial and water must flow to the surface to escape during consoli-
dation, the thickness H is taken as the total thickness of dredgedmaterial. Alternatively, if the dredged material is underlain by free-
draining soil so that water can be squeezed from the dredged material
to the surface and also to underlying material, the thickness H is
one-half the -total thickness of dredged material. The curves shown in
Figure 30 il.lustrate that the thickness of disposal material has a
great effect on the time required to achieve consolidation. Values for
69
L

ANOTE TIME - RE- UIO•Ef) TO REACH A
(,IVEN PERCENT CONSOLIDATION IS
20 I,~~ ~ p.F I, FOE-WYDAN,
IRHEN, , IS A CON5l ANT FOR EACH
IEENCLM I AGE OF CONSOLIDATIOn.20 - it ,~ , EN(,TH OF: ONF-WAY ORAIINA,'ý
HATHI, AND) C, IS THE COEFFICIENT OF
Is
1 '
50 % 25%1
I 5.4 YR 7 YR 10.1 YR 2 YR
sCv 00 QFTDA
0 L
0 5 10 Is 70 25 30
TIME, yr
Figure 30. Effect of thickness on consolidation of *dredged material
a 10-ft-thick layer are summarized in Table 15. While the first 50 per-
ccnt consolidation may be achieved fairly rapidly (Table 15 and Fig- J
ure 30), succeeding increments of consolidation require substantially .4
more time.
113. Figure 30 illustrates that thin layers consolidate rapidly
even for the low value of coefficient of consolidation used for this
example, which is, incidendly, that for a high LL dredged material.
This figure illustrates thi)t if the one-way drainage path is 5 ft or
less5 or the two-way drainage path is 10 ft or less, the rate cf con-
solidation may be so rapid that treatment methods are unnecessary to
accelerate consolidation.
114. Radial flow to vertical drains. The general concepts illus-
trated in Figure 30 also apply to radial flow of vertical drains. A
theory for such flow was fully developed by Barron and is reviewed in
Reference 30. Consolidation by radial flow depends on the length of
flow pDath iL, the same manner as illustrated for vertical flow. The
70
\9
J i m • IS'• " ' " I. . . i ... . -' -' i ... • L ' i .. . .. V . .. '.. . .., ' ' %, V... .;:

1
time factors have different values for vertical ard radial flow and
values for these cases can be obtsained from numerous references,30 The
coefficient of consolidation fox, radial flow can be determined from
laboratory tests and from field permeability tests, but precautions must
be observed in using the results of field tests. 3 0
115. Combined vertical and radial flow. The theory for combined
vertical flow to drainage layers and radial flow to vertical drains was
also developed by Barron and is reviewed in Reference 30. It is evident
that if the length of radial drainage path is long, vertical flow will
dominate even if vertical drains are installed. Drains cannot be spaced
more than the thickness of soil being treated. IMeans to accelerate densification
116. Since the time required to achieve a given percent consoli-
dation depends on the square of the length of drainage path for either
vertical or radial flow, an effective means for accelerating the rate
of densification is to decrease the length of flow p.th. This can be
done by placing intermediate drainage layers within the dredged material !
or by adding vertical drains. Because of the large size of disposal Jareas, drainage layers must be provided with collector pipes surrounded
by suitable filter materials. Also, vertical drains must discharge
into drainage layers which in turn must have collector pipes. An ex-
ception to this occurs where vertical drains discharge into underlying Ipumped drainage layers. Vertical drains accelerate the rate of con-
solidation but do nothing to promote an increased degree of densifica-
tion or additional storage area capacity. This is not the case, how-
ever, with intermediate drainage layers which can result in increased
settlements and, hence, more storage.
Secondary compression effects
117. Clay-type dredged material obtained in maintenance dredging
undergoes volume changes as a result of primary consolidation, which Iinvolves ihe dissipation of excess pore water ,ressures. however, a
secondarj ,ype of volume change occurs as a con3equence of shear
stre.ses.; in t e s'in These secondary compression effects can proceed Iundecr snmail ez:.ýess hydrosatic pressure differentials. Because they
I,i 4 I
1. I

occur slowly, pore pressures associated with seccondary compression
effects are, for practical purposes, negligible. Secondary compression
effects are small for overconsolidated soil and are at a maximum for
normally consolidated soils, especially for stress increases only
slightly greater than the existing overburden stress.
118. The practical significance of secondary compression depends
upon the use of a given area of soft soils. For example, if soft soils
are to be densified so they can be loaded by buildings or other similar
structures, secondary compression effects normally must be considered
and measures taken so that stabilization treatment minimizes postcon-
struction effects.29 Alternatively, if the purpose of densification
treatments is to secure more storage capacity in a disposal area, sec-
ondary compression effects have little practical importance. For ex-
ample, if increased storage capacity is being obtained by surcharge
loading treatments or the equivalent, the ratio of storage volume ob-
tained by secondary compression effects to that obtained by primary
consolidation would be in the range of 3 to 10 percent. In other words,
the effects of secondary compression on available storage capacity are
not sufficiently large to be considered when evaluating storage capaci-
ties increases which can be achieved by treatment methods.
1.19. The practical significance of secondary compression effects
is sometimes evaluated by expressing settlements from secondary com-
pression as a fraction of settlements from primary consolidation, This
is satisfactory provided care is exercised to obtain meaningful com-
parisons. For example, if small increments of added effective stresses
Ap are used to estimate settlements from primary consolidation, the
settlements from secondary compression may be a substantial percentage
A of primary consolidation settlements. From a practical viewpoint, this
does not demonstrate the importance of secondary compression, because
neither type of settlements is ].t.irge. If this procedure is repeated
with larger increments of effective stress, it becomes evident that
secondary compression is not a significant factor in determining dis-
posal area storage capacity.
72
S...... .. . .. . . . . . . . . . . . . . . ...- ,.

Practical considerations
120. Pore pressures beneath disposal areas. The weight of
dredged material placed in disposal areas in which the subsoil profile
consists of slit or clay overlying sand (Figure 31) causes water to
PORE PRESSURE IN FOUNDATION SAND
NLSS RELIEVED
PRESSURE RELIEF WELLS
ýDREDGED MATERIALS
SILT OR CLAY I
SAND ~ ~ Yz
IMPERVIOUS •.WEIG.HT OF DR'EDGED MATERIAL
INCREASES PORE PRESSURE IN
SAND LAYER.
Figure 31. Pore pressures beneath disposal areas
be squeezed from the silt or clay strata into the underlying sand. In
addition, the pore pressure in the underlying foundation sand is in-
creased because of the high water level in the dredged material. The
pore pressure in the foundation sand may be further increased if the
dredged material is subjected to a temporary surcharge. Outside the
retaining dike the pore pressures in the underlying foundation sand can
be high, thereby preventing the sand layer from functioning as a drain-
age layer and impairing retaining dike stability. To some extent, this
situation can be alleviated by installing free-flowing pressure-relief
wells outside the retaining dikes. While this may assure stability of
the retaining dikes, it may not make this layer effective in providing
underdrainage for the dredged material. Where studies on any specific
disposal area show this is the case, the pore pressures in the founda-
tion sand can be decreased by pumping the wells. Also, it may be nec-
essary to install wells within the interior of the dredged material dis-
posal area because of the large size.
121. Horizontal drainage layers. Where sand layers are provided
as underdrainage in dredged material disposal areas, or as layers at
vario.ns intermediate elevations within the dredged material, they will
73

normally develop such large pore water pressures as to render them in-
effective as drainage layers unless collector pipes are provided. The
design of required collector pipe systems has been developed in connc-
tion with -onventional stabilization procedures for soft soils. The
increased pore water pressures within drainage layers are similar to
that illustrated in Figure 31.
3-22. Placement of temporary surcharge loads. The practical
aspects of placing temporary surcharge loads to secure densification
assumes great importance due to the difficulty of placing a surcharge
fill in thin layers without locally building up accumulations of fill
that overstress the extremely soft dredged material. This can be done
by using small draglines to cast thin layers of material in advance of
thr fill. Another procedure is hydraulic placement, but open-end pipes
cannot be readily used because of' the rapid accumulations of coarse ma-
terial at the end of the pipe. This accumulation causes an overstress-
ing of soft dredged material and the development of large mud waves.
Underwater fill placement may be beneficial in these cases.
123. I2es of vertical drains. Vertical drains have, 1until re-
cently, consisted of vertical columns of sand of a suitable gradation. 0
Various methods have been used to install such columns as jetting, au-
gering, displacement mandrels, and subsequent ejection of sand by coin-
pressed air, etc. 30 Vertical cardboard drains were developed by Kjell-
man, and a drain of this type in plastic was recently developed by the
Swedish Geotechnical Institute and is being marketed under the trade-
name Geodrain.
124. The extremely soft and weak dredged material tends to favor
the simplest possible installation technique, arid it seems possible that
vertical drains could be installed to limited depths by hand or simple
[ light equipment. Froma this viewpoint, the Geodrain appe,%rs to be worthI investigation and use in preliminary feasibility tests where vertical
drains are desirable. A Geodrain is self-filtering and installation
techniques should be extremely simple. Jetted or displacement drains
would be satisfactory from technical viewpoints but require heavy equip-ment for installation.
74
.1

125. Pumped drainage techniques. Drainage techniques combining
pumping with large vacuum pumps appear promising and probably can be
developed into an automatic system requiring a minimum of labor, partic-
ularly since the consequences of a malfunction would not be significant.
It seems practicable to design the systems so that dewatering pumps
would operate as required while vacuum pumps would function continuously
or could operate within predetermined limits of desired vacuum.
126. Pumped drainage and vacuum drainage techniques appear most
practicable where the quantity of water required to be pumped is not
large. Because of the very large size of dredged material disposal
areas, the volume of water would probably be relatively small on a unit
area basis compared to conventional dewatering projects. For this rea-
son, punmped drainage techniques might be practicable where normally they
would be considered too expens/ve. The concept of vacuum pumping is
especially attractive and should be considered seriously as a treatment
technique for certain conditions.
127. Pumped wells with large vacuum pumps to secure vacuum in
underlying drainage layers appear practicable. However, based on con-
ventional usage, pumped wellpoints installed only in the disposal mate-
rial do not appear to be a viable alternative because the spacing of
the wellpoints would have to be so close as to make installation costs
excessive. However, where an underlying sand layer exists in the foun-
dation and the wellpoints are installed into the underlying sand, a
purmped wellpoint would be essentially a pumped vacuum system in the
"underlying sand; and this would require a relatively small numiber of
wellpoints or deep wells se!aled at the upper surface. This appears to
be a viable alternative to pimped wellpoints of the vacutum type in-
stalled only in the dredged material.
AnalDsis for Densification Effects
Concepts of densification
123. The reduction in water content and volumre of dredged mate-
rial is necessarily associated with an increase in the effective stress,
•575

i.e., the grain-to-grain contact pressure in the dredged material. This
is the case for any nonchemical method of densification and includes
treatment methods such as surcharge loading, drainage, or desiccation.
A simple and convenient means for comparing different treatment tech-
niques, therefore, is to compare effective stresses produced in the soil.
by the treatment being considered. Such comparisons apply when excess
pore water pressures have been fully dissipated, i.e., at the end of the
treatment method. The effective stresses to be discussed are ultimate
or maximum possible values, which may in some cases require long time
periods to develop. The effect of time will be considered separately.
Effective stressesfor loading techniques
129. Effective stresses in the dredged material with the ground-
water level at the surface are shown in Figure 32. Similar stresses
when the groundwater level has dropped about 2 ft and a surface crust
has developed are shown in Figure 33. Capillary ,tresses in the surface
crust could be large and exceed I ton/sq ft. Effective stress,; possi-
ble from suxrcharge loading are indicated in Figure 34 and are summari zed
in Table 16. While effective stresses developed from desiccation in
S-the surface crust may be rather large, the use of surcharge loading may
result in effective stresses at the surface which exceed the desiccatiorn
stresses. In this event, for surcharge loading treatment methods, the
benefits of a crust are primarily as an aid to construction operations.
An advantage of surcharge loading techniques is that even thick layer
of dredged material would be benefited.
Effective stressesfor drainage treatments
130. Effective stresses developed by various drainage• tcci:ui-'
are illustrated in Figures 35-38 and are summarized in Table 1-?. U..iA.--
lying drainage layers are quite effective and can consi.;t ot' riasurt.
"sandy or silty soils; occurring in the disposal area or may cos: t ,
sands placed in the disposal area prior to placement of dredged material.
Lf the groundwater level is initially at the top of the dredgCed ma,criial
and is gradually lowered to the top of the underlying drainage layer,
"y76

LL~ j(A,
w
LL C"
Li <I
F icQ
U))U
CD a)
k) 0n L
LU rH
22
0
U.12
Wi -(C
elcl

UO.
Lu 0-ti..
JU3
'00wLI) 0.
wl
J i
4CH'
[I)
tLb
(L 00
U) >
01 t
'0< 0
bJ C)zk
< 04ini
LiiU
uj ? n78
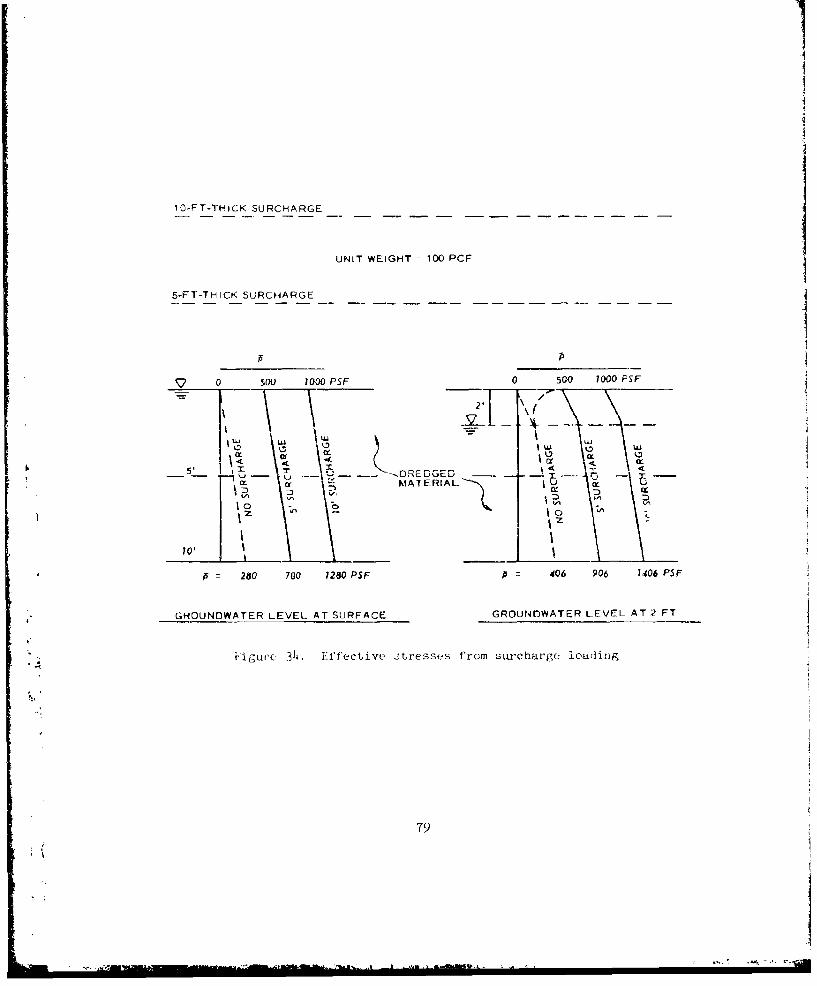
10-FT-THiCK SURCHARGE
UNIT WEIGHT c 100 PCF
5-FT-THICK SURCHARGE
ý7 0 S00 1000 PSF 0 500 1000 PSF
22'
U79
:%K
14
crMATERIALA U m
M Cc
79-

0
LuU I4I U
cc a
LUUI)
LJ~
w Iu
LL 0 k ý-
ww
I-0w
,4 -
aiwww 0 a
0i z I) ý
w Hý
C)) HLii 1-4
'An -A0
w 4J
U')o
"""' 0
w00
4 4-
(0 ULL Q LL]x <LL~> Li.
30

zI
0IILL LI
w (11CCL
w>0
JI-
00wwL 0
Ir-i
* ~0
w
o 0uj 0 '--
(1) L) w -
0
>- U(X 00V
L- >I Uj '.
NC?

Lu
UL
2:L0I:
0: XL
aoD"If
LU 0)w >
I- 02:0: 0LL J.
LU~L __ __ _ - I
w U)Le Lu~
LM ~n uind
ow o
LLU *H (1
-- jj
~0. 1.II
LU)
LU: CL
UU I
wD -n
(f)
(00
Ll.uK J
0 'a
wt ILW)l10 LIr . r
U0 mw0:< ra 0 L>Cii z 00:
:n caa0<0
ID I- frC

LIFL
0
CE) F
0l w
/ .)>/L
0• 0
N <
Qo <
Il LLZ 0 0z
I
zUII P
w -
(D 0
(00 0•
0•0CD (0 0
Lii (0 4 0 .
< w
0.-
14. 0• . -Ha
0• 0
a2 Z

negative pore water pi ssures will develop in the dredged material and
these will increase the effective stresses. This is shown in Figure 35,
which shows effective stresses bath with and without pore water suction
or negative pressures. In addicion, for a case such as shown, desicca-
tion may substantially increase effective retsses in near-surface
materials.
131. The effectiveness of un~derlying drainage layers can be sub-
stantially increased if" the water level in then is lowered and if a par-
tial vacuum in the drainage layer is maintained by vacuum pumps attached
to or operated in conjunction with the groundwater lowering system (Fig-
ure 36). This type of te•'hnique has been successfully used in connec-
tion with conventional stabilization techniques,5 and partial vacuuims
of 15 to 20 in. of mereusy have been obtained and maintained. Thiis re-
sults in greatly incr'eased effective stress in the soil, as indicated in
Figure 36. From a technlical standpoint, it. is immaterial if the drain-
age layer occurts naturel.]y in the foundation of the disposal area or if
it is provided by placing sand materials on the surface of the drainage
area prior to storage of alledged material. A thin sand layer placed
prior to use of 'the disposal area would require collector pipes.
132. The concept of using atmospheric pr'essure in conjunction
with sand layers in which a vacuum is induced was introduced by IKjell-
man7 anid has been applied several times. This concept is illustrated
in Figu~re 37. While the case shown is only for a sand layer on the sum-
face of the dredged material, it is also possible to ptace such sand
lay•ers, in which. partial vacuums are 1 naintained, at intermediate depths *in the dredged material., Obviously, a membrane must protect the sur'face
sanad layor and the edges of all sand layers must be sealed so that par--
K, tial vacuums can be mainta~ined by a practicable amount of pumping.
• ~133. The •underlying drainage layers illustrated in Figures 35 and
,..- 36 and the overlying sand layer illustrated in Figure 37 must be pro-
'" videdl with collector pipes for removal of water front the drainage layers.
If collector pipes are not u~sed, the head losses within the drainage
layers woul~d be excessive and the drainage layers would not function as

134. An alternative that has never been considered, to the au-
thors' knowledge, is seepage consolidation stabilization. In this tech-
nique, water would be ponded cn the surface of the dredged material and
uiderdrainage would be provided at the base of the dredged material.
Downward seepage gradienIs would act as a consolidating force causing
densification (Figure 38). This concept would require increased height Iof dikes, and possibly interior dikes to minimize wave effects in large
disposal areas. After stabilization, surface drainage and surface dry-
ing could be used to increase effective stresses in the upper part of
the dredged material.
135. Effect stresses possible from the various drainage tech-
niques are summarized in Table 17. By comparing Tables 16 and 17, it is
evident that drainage treatments can produce effective stresses as great
as those produced by 5 to 10 ft of temporary surcharge loading. From
this standpoint, drainage treatment concepts are efficient means of in-
creasing effective stresses in dredged material, which is necessary to
cause densil iation.
Effective stressesfor desiccation treatments
"136. When the rate of evaporation exceeds the rainfall, soil lo-
cated above the groundwater level will undergo drying, which-induces
negative pore water pressures in the soil and, consequently, positive
effective stresses in excess of those caused by the weight of the mate-
rial. This is illustrated in Figumre 33. In fine-grained materials
large negative pore water pressures can develop and associated effective
stresses are also large. Pore water suctions from a few atmospheres
to as large as 10 or 15 atmospheres can develop in soil exposed to dry-
' ing. If a disposal area is drained so that surface waters are removed,
-the drying effects in areas where evaporation exceeds rainfall would be
expected to gradually lower the groundwater level, providing that high
pore water pressures do not exist in underlying soils. The drying ef-
fect and lowering of the water level would, of course, be greatly facil-
itated by trenching and other surface drainage techniques.
137. Drying of dredged material could also be effected by plant
85I
II

root systems, and it has been observed in engineering prectice that
certain types of vegetation have deep root systems capable of inducing
sufficient drying to cause preconsolidation stresses as high as 500 psf.
Desiccation effects combined with even slight lowering of the ground-
water level, which may occur either as a result of trenching or as a
consequence of desiccation processes, have a beneficial effect on mate-
rial below the groundwater level. This results because the effective
weight of soil above the groundwater level is changed from initially
submerged weight to a moist or satuiated weight. Thus, the material
above the groundwater level has an effect similar to that of a small
surcharge. Moisture content, shear strength, and preconsolidation
stress changes resulting from desiccation have received only limited
attention in conventional engineerinCg practice although these effects
have been observed and measured. Pevertheless-, this area is one that
merits much more investigation, combining soil engineering studies withb
the study of root systems of various types of vegetation.
Water content decrease
138. The effect of increases in effective stresses is to cause
densification and water content decreases. The water contert decrease
and corresponding LI are listed in Table 18 for soils of various LL and
increases in effective stress. This table was prepared assuming:
(a) initial water contents equal to the LL, (b) At.uerbarg limits plot-
ting along the A-line, and (c) values of C /(1 + e ) from correlationsC 0
previously given. Water content decreases are also plot-ted in Figure 39.
Volume decrease from densification
139. Effective stress increases for various type.s of' densifica-
tion treatments are listed In Table 19 and. afford a means for comparin!g
results from various densification treatments. Unded":ainage assuming
pore water suction, a 500-psf surcharge, seepage consolidation, a-nd
surface vacuum mat without underdrainage would each result in an ultj-
mate effective stress incr.'ease of about 500 psf at a 5-ft depth. A sur-
face vacuum mat comf.bined with underdrainage, seepage conso.lidatior: with
i,5-in. vaclawu 'i the underdrainage laye~r, and a 1000-pvt 5urchzýrge
would cause an ultimate effective stress incre-ase of about 1000 psf
86

125 1 100
100 L__ 0__
(W.-PL) w
_ a'
0- 75
0I500 000 2000
iz
z -
500 a 0 0 00-
INCREASE IN EFFECTIVE STRESS, PSF
Figure 39. Water content versus effective stress
t" ~at the same depth and would be exceeded only by an underlying drainage
•" layer with vacuuam pumping, which would cause an effective stress in-
.100
.0 crease of nearly 2000 psf.
14I0. Volume changes induced by increases in effective stresses
are plotted in Figure 4O for various LL. These were computed on the
-same basis as water content depraases previously discussed and presented
in Table 18 and Figure 39. The volume decrease depends on the increase
in effective stress and on the LL, especially for LL less than 100, as
shown in Figurt 40. Since dredged material generally has a. LL less
87

20
10
JI
u 0 50 100 150 200 250
uJI LIQUID LIMITa:1)
I
0
40
>
11
I
io
0 500 1000 1500 2000 250INCREASE IN EFFECTIVE STRESS, PSF
Figure 40. Volume decrease from densifir-8.tion
8I88
than 100, volume decreases (i.e., additional storage volume) from den-
sification will be less than about 15 to 20 percent of the volume of
dredged material. For high LL (i.e., 200), storage volume increases
would not exceed 20 or at most 30 percent. For lower LL (i.e., 50),
storage volume increases would not exceed about 10 to 15 percent.
Volume decrease from desiccation
141. An important exception to the above summary is the case
where dredged material is placed in thin layers and each layer is sub-
jected to severe desiccation. Drying can lower water contents to the
shrinkege limit, which is close to the PL. (This would cause soils
having water contents initially at the LL to undergo volume decreases
of 25 to 60 percent, or substantially more than could be achieved by
any drainage or loading technique.) While drainage at the bottom of
the dredged material- is significant (Table 19), recent work by Krizek and
Casteleirot 0 has shown that the evapotranspiration potential dominates
the rate of consolidation after desiccation at the surface has begur.
Combined effects of vegetation and evaporation resulted in a 30- to 70-
percent increase in relative settlement (Figure 41). Ditching is im-148
portant in draining confined disposal areas, but transpiration by
vegetation is highly effective for accelerating the consolidation of
dredged material in the thickness of material subject to desiccation.
The use of vegetation with high transpiration rates and the ability to
grow in saline wet soils provides a potential for accelerating the con-
solidation rate of limited thicknesses of dredged material and thereby
increasing the available disposal storage. A field test sponsored by
the DMlP is being conducted at the Grassy Island disposal site in the
a" Detroit District to study dredged material drying by use of vegetation
<A (the reed Phragmites communis).
Dredged material as borrow
142. The suitability of densified fine-grained dredged material
for use in embankments or for other borrow purposýes can be examined by
considering water contents after densification. High LL soils, like
fine-grained dredged material, are not good fill material for many pur-
poses, but might find uses where borrow is scarce.
89

RELATIVE TIME, DAYS
0 25 50 75 100
Dra noqe Condit on Coefficient ofat Bottom Tronsprat on
0 A Inrpervoos 013 Impeded 0C Free 0D Impeded 0.2
0.05 E Impeded 0.5SF Impeded 1.0
F I-ý
zS0,10 -
1 0I--f-
U] AU)
> o.15I-
LUn-
0.20I
0 Location 5/8 \
6 Location 5/10 C 0
0 Location 5/13 F E D
t0 .e o Mathern nticaIm o lde -
Figure 41. Effect of bottom drainage and vegetation onthe settlement of 11enn 7 disposal area ne'er Toledo0 E't-
bor by Casteleiro's one-dimensional mathematical model(from Krizek and Cas.eleirolO)
113. For dredged material to be useful as borrow, the water
contents wouid have to be reduced to 10 percent,!ge points or less abve
the F'L, with a maximum of 5 desirable. As can be seen in Fig.ur. 39, the
"requirement could not be met by loading or arainage- treatments.
li;0i. l lacing, dred(ee material in thin lifts and llwinwg u-r lag
to occux could reduce waeur contents to iu-ar the 1L, a- ;,ruvl clyais-
cussei. This would make dredged material .uitable f 1,r Urr:w w:, -
LL, fine-gromined soil; would be aeccptaY;a.
90
.1

Di.s;cussion of Deisification
145. The var'ious examples are intended to illustrute means for
exam:•ining effects of derssification treatment. The computations made
are believed conservative, inj that actual volimue decreases that could
he achieved might be greater, especially where initial water contents
at ti•..e of densification are more than the LL.
146. Tiie benefits of densifying soils in disposal areas so water
contents; are about equal to the LL are substantial and are cons;idered to
be achievable by simple means. Additional storage volume is more diffi-
cult to obtain, and the practicability of densification for this purpose
must be compared with the alternative of raising dikes surrounding the
disposal area. The latter may be a preferred alternative, where
possible.
147. It is evident that many alternatives exist for densifying
dredged material. This makes iL desirable to analyzc actual conditions
at a disposal area, since these may govern selection of appropriate
methods. Properly designed densification treatments are technically
feasible, but this is a rather time-consuming effort that requires ex-
perience and judC.ent as well as borings and laboratory tests. In the
ultimate analysis, selection of the most appropriate densification treat--
ment will probably be governed by economic factors,
91

PANT VI: ECONOMIC COMPARISONS
Basis for Cost Comparisons
148. The cost of densifying dredged matcrial depends, to a large
extent, upon local conditions at a site, such as foundation compress-
ibiLity, time available for treatment, and flexibility for scheduling
storage of dredged material in different sections of the disposal area.
These can be considered in a specific manner when comparing the cost of
various treatment alternatives for a disposal area and may govern choice
of the most appropriate method. Cost comparisons of alternative treat-
ment methods presented in this section neglect the effects of local
couiditions. Conscquently, data presented are intended only to provide
order of magnitude of densification costs and to illustrate factor.
involved.
149. One of the principal factors influencing the cost of dredged
material treatment is the time available for densification, i.e., how
soon will, added storage capacity in the disposal area be required? Some
treatment methods may produce the desired densification but require a
long time. Where necessary, added drainage can be provided to acceler-
ate the rate of densification, but this benefit is secured only at a sig-
nificant cost increase. If planning for densification is made when a
disposal area is first developed, minimum cost treatments can be se-
lected. Alternatively, if only a few years are available to obtain
densification and added storage capacity, some low-cost alternatives
will be precluded.
150. In g:neral, it appears desirable to anticipate the need for
increased storage capacity from dredged material densification at least
* 7 10 yr prior to the time added capacity will be needed, and even this
* •time period may be insufficient. Unless increased storage capacity from
densification of dredged material is anticipated when the disposal area
is first opened, underdrainageo layers that may result in minimumi cost
cannot be installed. In addition, to preclude the necessity for expen-
sive installations solely -to accelerate the rate of" consolidation,
92
anticipation times for desired storage capacity increase should prefer-
ably be from l0 to 30 yr.
Densification by Loading
Temporary earth surcharge
151. The placement of' a temporary surcharge on the surface of a
disposal area i.z virtually impossible until after a surface crust has
formed. Thus, for economic comparison purposes, it will be assumed that
the disposal area has been drained and that an approximately 2-ft-thick
surface crust has developed, so that light construction operations can
be performed in the disposal area. It will be assumed also that the
groundwater level is 2 ft below the surface and that soils are consoli-
dated below tlis depth only by their ownq weight and by the weight of thecrust,
152. The basis for the settlement and cost estimates is shown in
Appendix C. The settlements were estimated assuming soils are fine-
grained silty clays and clays plotting on the A-line of the plasticity
plot. Various correlations were used between compressibility and soil
pro; erties (Part V and Appendix C). The cost of added storage volume
obtained for various thicknesses of temporary surcharge fill is shown
in Figure 42 for soils having various LL and for a 10-ft thicknesp of
dredged material. The costs shown in this figure 'ire approximately in-
versely proportional to the thickness of dredged material since the
temporary surcharge fill would cause constant effective stress increases
regardless of thickness of dredged material. Thus, if a 20-ft thickness
C of dredged material was being loaded, the costs shown in this figure
would be reduced by at least one-half. Figure 42 illustrates that the
cost of treating soils of low plasticity (i.e., relatively luw LL suchN as 50) is high because the soils are not highly compressible and the
additional storage volume that can be obtained is small. In contrast,
treatment cost for soils having high LI, (100 or higher) drops sharply
because of the added consolidation obtained by the sane amount of sur-
ch.rge fill.
93

1010 I8
Ia
(D
-J-J08
<0
05
I-
IL 0
500
(L-
0
0Lu
0 2 4 6 8 10
HEIGHT OF TEMPORARY SURCHARGE, FT
NOTE: COST ESTIMATE BASED ON SURCHARGE FILL COSTOF $I/CU YD FOR 10-FT THICKNESS OFDREDGED MATERIAL.
Figure )42. Cost of added disposal storage using temporarysurcharge fill
153. The added storage capacity, expressed in cubic yards per-
acre, for dredged material having various LL and heights of temporary
surcharge fill is skumliarized in Table 20. This table also shows the
cost of densification treatment per cubic yard of storage and also per
acre of disposal area. As indicated, these costs were estimated assurn-
ing a placement and removal charge of $1.00 per cubic yard of temporary
surcharge fill. In any specific instancf., the cost could be substan-
tially different.
154. When using a surcharge fill and comnutir~g fill. cccI.; f-r LL
94
4

specific site, it can be assumed that the disposal area is divided into
sections and that the temporary surcharge fill is placed in one section
arid, after duosification is achieved, is moved to successive sections so
that the fill is reused a number of times. The placemenil. and removal of
fill in each section would be the principal charge, together with the
initial cost of the fill divided by the expected number of reuses. The
cost of additional storage-, per cubic yard and per acre uf disposal area,
is inversely proportional to the cost of the surcharge fill. In many
geographical locations it will be possible to sell a sand surcharge fill
when it is no longer required. This would have to be evaluated on a
site-per-site basis.
155. The computations and data summarized in Table 20 are approx-
imate and neglect factors that would be included when making computa-
,ions for a specific site. For example, a site analysis would consider:
(a) possible submergence of surcharge fill below the groundwater level,
therefore decreasing its effective weight; (b) actual thickness of
dredged material being treated, which would influence the amount of
settlement obtained; and (c) consolidation of underlying compressible
natural foundation soils, which would add to the storage volume avail-
able from treatment of dredged material. The time required to secure
densification (discussed in Part V) for dredged material Thicknesses
more than 10 ft may be so long that means to accelerate the rate of con-
solidation may be necessary.
Temporary surchargefill with vertical drains
156. Where the thickness and/or consolidation characteristics of
homogeneous dredged material and time available for densification re-
: quire vertical drains to accelerate the rate of consolidation, the
drains must be installed with fairly close spacings; otherwise, con-
solidation will be dominated by vertical flow and the drains will serve
no useful purpose. An exception arises if intermediate horizontal sand
layers exist in the dredged material-, et-her accidentally or deliber-
ately. This case can be considered on its merits by separate cosiputa-
tions as an exception to the general situation.
95
rC.-• , . .. law•i• ": " ... • T ""•• ... . . " " S• -fl... ....,,...' "

15!. The cost estimate using vertical drains asswumed that 20 ft
of dredged material had been placed in a disposal area and that a crust
had developed. Underl3ying soils were considered normally consolidated
under the weight of oerlying materials. For illustrative purposes, a
c of 0.02 sq ft/day was assumed and it was stipulated that 90-percent
consolidation be achieved in 5 yr. As before, thL dredged material was
assumed to plot along the A-line on the plasticity plot. The computa-
tions are presented in Appendix C, page C4, for a case where vertical
drains cost $1.00 per linear fcot, a collector pipe system costs $1200
per acre of treated area, and sand surcharge fill costs $1.00 per cubic
yard. Obviously, these cost figures would have to be adjusted for spe-
cific locations. The cost of vertical drains at $1.00 per linear foot
for vertical sand drains is comparatively low since a short installation
time would be anticipated for drains in soft materials. Other type
drains could be used, but costs are believed generally similar.
158. The added storage that could be obtained, expressed as cubic
yards per acre of disposal area, is surmnarized in Table 20 for soils
having various LL and subjected to surcharge fill thicknesses of 1, 5,
and 10 ft. The cost of densification per cubic yard, the added storage
capacity obtained, and the cost per acre of disposal area are also sum-
marized in Table 20. It can be seen that a high premium must be paid
for vertical drains. Thiis added cost was incurred because of the re-
quireinent imposed that 90-percent average consolidation be achieved in
5 yr. As illustrated in Figure 30, for a fill thickoess of 20 ft having
one-way drainage, 50-percent consolidation would be achieved in about
22 yr without drains. Obviously, it is beneficial to make long-range
:- plans in an effort to avoid the cost for vertical drains to accelerate
consolidation.
Ponded water surcharge
159. This alternative would generally follow work done by NYPA
and would consist of 20-mil unreinforced PVC membrane, a sand drainage
layer iimmediately beneath the membrane, and collector pipes in the sand
drainage layer. The total cost is approximately $12,700 per acre LAp-
pendix C, page CV).
96
_JI

160. The added storage available in cubic yards per acre for
soils having various LL is tabulated in Table 20 for water depths of
8 and 16 ft, corresponding to surcharge loads of 500 and 1000 psf, re-
spectively. The cost of densification treatment per cubic yard of added
storage is also shown in this table. The cost figures shown do riot re-
flect the added height of retaining di.: es required to confine the ponded
water. Neither do the cost figures include wave protection, which siight
be necessary if large disposal areas were subjected to water pending.
The use of interior dikes could reduce wave heights and reinforced PVC
could protect dikes. While these costs might total appreciable amounts,
they were not included because the effect on average cost per cubic yard
of additional storage obtained would be largely dependent on the con-
figuration and size of the disposal area and would not be expected to
govern selection of a treatment method.
Surface vacuum mat
161. The Kjeilman type of vacuum mat used to apply surface load-
ing by atmospheric pressure was assumed to consist of a membrane, sand
blainket with collectors and water, and vacuum pumping. A vacuum of
about 15 in. of mercury or about 1000 psf was assumed (Appendix C,
page C8). The cost estimate assuaed a pumping time of 5 yr with auto-
matic pumps. Storage available and cost per cubic yard of increased
storage are summarized in Table 20.
Densification by Drainage
Underdrainage
162. The use of an underdrainage layer to effect densification
sis illustrated in Figure 35. The sand layer shorn in this figure can
. be a naturally occurring foundation layer or one placed on the bottom
of the disposal area prior to placing dredged material. Consolidation
of overlying dredged material, would develop pore vressures in a sand .
blanket, which could be reduced by a collector pipe system in the sand A
layer. Such a collector pipe system would probably be required even ift
the foundation consisted of sands because of the large size of disposal
97

areas. As previously discussed, this resulits in large pore pressures
in sand layers and renders them ine fficient, for use as drainage layers
Luless collector pipes are used
163. To be conservative, the cost estimate presented in Appen-
dix C, page CiC, assuined that pore water suctions in dredged material
did arid did not develop. The results are sunmarized in Table 20 for
the conservative assumption that, suction pressures did not develop in
the dredged material. If such suctions developed, and there is good
reason to believe this would be the case, the volumes of additional
storage would be approximately twice the values shown in Table 20 anid
the cost per cubic yard of additional storage would be approximately
one-half. 'These computations were made for a 10-ft thickness of dredged
material.
Pumped underlying
drainage layer with vacuum
164. The conditions for this case (Figure 36) could be developed
by, pumping from an underlying drainage layer with a high vacuum main-
taimed by vacuum pumps. In computing benefits from such a system, it
was assuned that a crust had formed to a depth of 2 ft and that under-
lying soils were normally consolidated. Pumping of water and develop-
ment of a vacuum in an underlying drainage layer would cause additional
settlement. Cost estimates (Appendix C, page Cii) assume that pumping
and maintenance of a vacuum would be necessary for a 5-Yr period on the
premise that this would result in 50-percent consolidation of the
dredged material. This time (Figure 30) applies for one-way drainage,
a 10-ft length of drainage path, and a coefficient of consolidation of
the dredged. material of 0.01 sq ft/day.
165. If the foundation material of the disposail area contained
pervious sands, the only cost world be the pumping involved. Costs per
cubic yard of additional storage obtained are summarized for this case
in Table 20. lf the pumping period could be reduced substantially, as
would be the case if the coefficient of consolidation of the dredged
material were higher, the cost would be reduced correspondingly.
166. In the event that the disposal area did not have pervious
98
AI
'§2"¶ ?|' -. lad4t*W ~%It . ~ -x;

I'oundation ;aids, this treatment method could be used by placing a l-ft
sand 1 Lycr on the surface of tile disposal area, together with collector
pipes embedded in the sand, as shown in Figure 37. The addition of a
sand layer and collector pipes would increase costs shown. in Table 20
by approximately 40 percent. If consolidation proceeded more rapidly,
the available storage volume would be correspondingly increased and the
cost per cubic yard of storage obtained would be decreased. Actual
costs for this treatme.nt technique are largely dependent on local site
conditions and figures shown should be interpreted to illustrate orderof magnitude costs for this technique.
Seepage consolidationwith ponded water surcharge
167. If dredged material is placed on an underdrainage layer in
which the water level is maintained at the top of the layer, water will
drain out of the dredged material into the drainage layer and will exert
a seepage pressure on the dredged material. If water is ponded above
the dredged material, the seepage gradient and seepage forces through
the dredged material will increase, tending to consolidate the dredged
material (Figure 38). This alternative was evaluated assuming that a
drying crust had formed to a depth of 2 ft and toe added storage ob-
tained wouid be in addition to that resulting from consolidation of
dredged material under the weight of a 2-ft crust. This is consistent4
with evaluation for other techniques. -
168. Computations for this case are presented in Appendix C,
page C13, and assume that evaporation and rainfall are in balance over
a 1-yr period so that maintenance of the pond would not be significant.
It was further assuumed that an effective natural underdrainage layer
did not exist and that it would be necessary to provide an artificial
layer with embedded collect( r pipes. A 10-ft thickness of dredged ma-
terial was assumed with water pended to a depth of 10 ft. For these
conditions, tne quantity of added storage that would result for various
dredged material is soumnarizcd in Table 20 together with the coot per
cbic yard of additional storage obtained.
169. If a site had an existing underdrainage layer capable of
99
_'I
S•S~ • •• .• ,• ,,....... • • •*1

conducting seepage away, the cost for stabilization would be only the
cost of raising the retaining dikes and pumping in water. Neglecting Ithe cost of the dikes, which would have to be estimated in accordance
with the size of the area and height required, the cost for pumping only
would amnount to only $0.10 to $0.15 per cubic yard of additional storage
volume obtained, which would be exceedingly inexpensive.170. The section shown in Figure 38 assumes a homogeneous thick,-
ness of dredged material. This could be expected if the dredged mate-
rial was placed continuously. In the event that dredged material was
placed intermittently, a drying crust would develop on the surface of
each lift. These crusts would have reduced permeabilities and would
serve as partial barriers to downward seepage. The effect would be to
decrease consolidation of material above a crust and increase consolida-
tion of material beneath a crust. This is not necessarily an argument
against permitting crust development during intermittent deposition of
dredged material in the disposal areas because the development of a
crust automatically entails a volume reduction and, hence, increased
storage capacity. Detailed studies might show, however, that the per-
meability reduction resulting from formation of a crust would be unde-
sirable and that better overall results would be achieved if crust
development were not permitted. This aspect should be investigated by
additional studies.
171. No instance is Known where water ponding without a membrane
has been used. However, seepage pressures do exist and would cause in-
creased effective stresses in the dredged material. Hence, the concept
of this treatment alternative is considered sound although the technique
itself is regarded as experimental.
. Densification by Desiccation
Incremental placement of dredged material
S172. If dredged material is placed in increments of 1 to 3 ft and
allowed to dry, the water content can be reduced to about the PL if
drying conditions are favorable. This type of disposal area operation
100 "I
i
might be feasible if the area available is large enough to be divided
into sections, some of which are drying while others are receiving
dredged material.
1'73. The cost of this alternative was estimated assmning that
nominal labor and equipment costs would be incurred to maintain good
surface drainage (Appendix C, page C15). The costs and increased
storage for this treatment are summarized in Table 20 for volume bene-
fits that correspond to a water content reduction from the LL to the PL.
Volume reduction from the placement water content to the LL was not
credited, considering that it would develop with nominal maintenance,
as done for the other treatment alternatives.
Other desiccation techniques
17y. Capillar> wicks and internal thermal treatments are re-
garded as being in a research stage and not amenable to cost analyses.
The cost for treatment by capillary wicks might be relatively low, but
this cannot be expected for internal thermal treatments.
Evaluation of Densification Benefits
Increased disposal
area storage capacity
175. The data shown in Table 20 are arranged in Table 21 accord-
ing to the amount of added storage, expressed in cubic yards per acre of
disposal area. This facilitates examination of' treatment alternatives
where the amount of added storage which can be obtained is the para-
mount consideration. The data shown are for a 10-ft thickness of
dredged material being subjected to densification treatment. Some tech-
"A niques would produce added benefits in approximately direct proportion
to the thickness of dredged material being treated, but associated ques-
tions such as time for consolidation might become paramount and would
have to be determined on an individual site basis.
Cost of increased storage capacity
176. For many locations, the feasibility of den.ification treat-
ment will depend on the cost per cubic yard of added storage capacity.
101
For this reason, the data summarized in Table 20 are.ý listed in Table 22
according to the cos;t of densification per cubic yard of' storage. The
cost date shown, as previously stressed, are extremely approximate and
are intended to indicate only the order of magnitude. it is evident
that, densification treatment to obtain added storage is an expensive
process, except for desiccation by placing in thin layers and for some
drainage techniques.
177. The principal limitation of the volume and cost estimates
shown in Tables 20-22 is that foundation settlement is ignored. At some
sites, this will equal or exceed dredged material settlement and may
drastically alter conclusions reached by considering only the dredged
material. Another limitation of data shown on these tables is that only
a 10-ft thickness of dredged material is assumed.
Raising retaining dikes
178. The information shown in Tables 20-22 can also be evaluated
by comparing treatment results with the volume and cost of additional
storage obtained by raising the retaining dikes. The cost of retaining
dikes, expressed in terms of cost per acre of disposal arp., is heavily
dependent on foundation conditions, the size of area, and other factors.
Nevertheless, to obtain the general order of magnitude of what is in-
volved, estimates were maL.e for retaining dikes having a crown width of
5 ft (Appendix C, page C17). For one-on-four side slopes,, the added
volume of dike, expressed in terms of volume of dikes per acre of a
1000- by 3000-ft disposal area, is shown in Table 23 together with the
added storage volume obtained by raising the dikes, Thie added volume
is also expressed in terms of cubic yards per acre of storage area. The
added storage volume that can be obtained per acre by raising the height
of dikes in increments is shown in Table 23 for dikes having side slopes
of one-on-four and a crown width of 5 ft.
179. Comparing this added storage volume with the additional
storage shown in Table 22 for various dredged material treatment tech-
niques shows that increased storage capacity can most easily be ob-
tained merely by raising the height of dikes slightly. As summarized
in 'Table 24, raising the dikes no more than 2 ft is the equal of all
102
~. N' - -.. I

treatments listed in Table 21 except for the desiccation technique, and
raising the dikes 3 ft is the equal of ali treatments considered. If
the thickness of dredged material is more than about 1.0 ft, the added
storage that can be obtained from densification treatmes ' will be in-
creased, and equal storage capacity without treatment would require
higher dikes. In terms of the cost per cubic yard of additional storage,
it is evident (Table 23) that the approximate cost of p: ,.i.ding aided
storage capacity by raising 1te dikes, $0.25 per cubic yard, is substan-
tially less than for any dens ication technique, including desiccation
by placing in thin layers, dr -ing, and trenching.
Conclusions of Densification Treatment
180. It is evident that the densification treatment of dredged
material placed in disposal areas is a practical alternative only wher'e
raising the dikes is prevented by legal or environmental considerations,
or where the cost of dike raising is relatively large because of the
small size of the dispo:sal area. Nevertheless, there are cases where
dikes cannot be raised. Economic comparisons favor raising dikes as a
means of obtaining additional storage capacity at minimum cost.
181. These comparative volume and cost data do not include desic-
cation by internal thermal treatment of dredged material. This tech-
is undeveloped in the United States and meaningful comments concerning
its application cannot be made. However, since this type of work has
been undertaken in Russia and other countries to varying extents, it may
be desirable to consider this subject area for research.
182. The various densification treatment techniques have been
discussed solely from the viewpoint of obtaining additional storage vol-
ume in disposal areas. Where the eventual development of a disposal
area entails construction of buildings or other structures, the efficacy
of densification treatment can be evaluated using engineering analyses
such as have been discussed in this report and elsewhere. 2 9 ' 3 0 It has
been adequately demonstrated by work at many locations that soils found
in disposal areas are of types that can be densified adequately for many
development purposes.
103

PART VII: RECO1VIIENDED RESEARCH
183. The presentation of methods of analysis for total and time
rate of consolidation settlements and for secondary compression have not
emphasized uncertainties involved when using these procedures for high-
water-content dredged material. Similarly, comments have not been made
regarding limitations of the various densification techniques, nor for
recommended research. This was done to make the presentations and eval-
uations concise, but in some cases, research is desirable.
184. The general. concepts of consolidation are reasonably well
understood regarding computation of total settlements. in any specific
case, laboratory consolidation tests can be performed that determine the
consolidation characteristics. However, little is known concerning the
combined sedimentation-consolidation of soils under extremely small in-
crements of loading.
Laboratory Research
Sedimentation-consolidation processes
185. When densifying dredged material, the initial conditions of
the soil are considerably different than those for which much engineer-
ing experience has been accunulated. Consequently, the time rate and
amount of consolidation should be researched under extremely small load-
ings and under small increments of loads. This work should start with
typical slurries and simulate prototype conditions through densification
treatment. Consolidation properties that are regarded as constant in
conventional soils engineering practice are variable when consolidation
takes place over a large range in void ratios. Further, initial con--
ditions arc inadequately known. Variable soil properties can be con-
sidered by available computer analyses but appropriate soil properties
input are largely unknown.
186. Dredged material sedimentation and consolidation are a corn-
bined and continuous process unlike conditions in conventional engineer-
ing practice wherein only the consolidation phase is considered. Some
104

research has been accomplished it. which sedimentation and consolidation
have been jointly studied, but the height-to-diameter ratios of equip-
ment used restrict the validity of the work. Research on consolidation
test requirements has shown that height-to-diameter ratios are critical,
and values of about 0.33 to 1 are generally used in engineering practice.
In contrast, height-to-diameter ratios used in sedimentation or slurry
consolidation tests have been about 4.5 to 1, or the height has been
about 14 times larger than considered appropriate for consolidation
tests. This difference would cause large sidewall friction forces to
develop and makes the test results questionable, although they are prob-
ably correct qualitatively and useful for illustrating concepts and
mechanisms. The principal reason why large, instead of small, height-
to-diameter ratios have been used is, of course, the practical one of
ease of testing.
187. The importance of correctly simulating prototype
sedimentation-consolidation processes under controlled conditions
warrants construction of a large sedimentation-consolidation device that
ii re closely meets normal criteria for height-to-diameter ratios. For
this reason, devices 6 ft high and 4, 8, and 12 ft in diameter are rec-
onmnended. These devices would be simple to construct and operate, since
required loading capacity is small, not over about 2000 psf. The de-
vices should be thoroughly instrumented with piezometers at various
levels; side ports for X-rays, samples, pressure cells, etc.; and facil-
ities to simulate underdrainage, surface drainage, desiccation, seepage
consolidation, and other tre.ttment techniques. Since these devices
would be filled with vrious typical dredged material slurries placed
by pumps, operating costs would be small. If, for example, such devices
'A had to be filled with hand-placed and compacted soil, the cost would be
large, but this would not be the case for dredged material.
188. Equipment of the type recommended would be used to investi-
ga-te the combined process of sedimentation-consolidation followed by
varýious desiccation or densification treatments. Such tests are con-
sidered essential for establisihing initial conditions of disposal areas
at the time densification treatments, including desiccation, might be
105

undertaken and for establishing the validity of theoretical analyses oi'
disposal area treatment.
Se.ondary compressjon research
189. While secondary compression of soils is only partially
understood, it may not appear to be sufficiently important to disposal
area usage to require additional research. This is probably the ease
where effects of densification treatment on dredged material of speci--
fied initial conditions are being evaluated. Secondary compression is
considered relatively unimportant when effective stress increases are
large, but is important when effective stress increases are small, as
during sedirmentation-consolidation. Because secondary compression ef-
fects are possibly of major importance in determining the initial con-
ditions of dredged material at the time densification treatment is
undertaken, the research with large sedimentation-consolidometers should
include study of secondary compression effects. The uncertainty in de-
termining initial conditions of dredged material is of decisive impor-
tance in evaluating effects of densification treatment.
190. If a disposal area is to be extensively developed for build-
ing construction, further research on secondary compression is highly
desirable. Details of recomsrmended research are not presented in this
report because development of disposal areas for such purposes has not
been assigned a high priority.
Atterberg limits research
19!. The utility of Atterberg limits for describing initial con-
ditions in disposal areas and to facilitate computation of total and
time rate of settlements hae been demonstrated by analyses previously
, presented. The Atterberg limits used were the Atterberg LIL and PL-
"however, Atterberg also defined an "upper liquid limit" which should be
explored farther ,ince it relates closely to the placement and subse-h 9
jquýnt changes in dredged material placed in disposal areas.
192. Atterbeog defined tha upper LL as the "upper limit of vis-
cous flow; that is, the limit at which a clay slurry retains so much
water that it flows almost l:ike water." Alter various attempts Atter-
berg states that he obtained the most constant values with the follow-149
ing test procedures:
106

iI
The clay powder is mixed in a porcelain dish, withround bottom, with enough water for the sticky limitto be reached.... Only then, water is gradually,with the aid of a wash bottle, added until with con-stant mixing the mass begins to flow like water. Agroove is then made in the slurry with a glass rod.If this groove disappears within half a minute, thelimit is reached. If one has gone beyond the limit,
one should set the procelain dish over a hot waterbath for a while in order to evaporate some of thewater, or one can add a little more clay powder tothe slurry (less desirable, however). Then one againattempts, by the addition of small amounts of water,to reach the limit. When it has apparently beenreached, one lets the slurry pass through a faesieve so that any small lumps that may be present
will be removed. A portion of strained slurry isthen weighed and dried at 100 deg C. The loss ofweight, calculated on the basis of 100 parts of dryclay, gives the position of the limit,
193. The test values reported by Atterberg appear closely re-
lated to properties of dredged material placed in disposal areas. The
values given by Atterberg for the upper LL vary between about 1.0 and
2.3 times the LL, with moss values between 1.5 and 2.2. There appears
to be a generally consistant relationship between the plasticity of the
clays and the upper LL. The ratio between the upper LL and the conven-
tional LL appears to be dependent also on the plasticity of the clays.
Atterberg's tests were limited in number and were not expressed in
current soils engineering terminology. The concept of the "upper limit
of viscous flow" appears sufficiently valuable so that it should be re-
lated to the condition of material in the disposal area at the time
that densification treatment might normally be undertaken.
194. It is extremely important to determine what increase in
density will occur in disposal areas. The analyses made have assumed
that densification treatment would not be attempted unitil the soil had
reached approximately the Lb. This assumes that the volume decrease
from placement moisture contents of 2, 3, or 4 times the LL to the LL
will occur without specific need for treatment other than draining sur-
face water and normal crust development. This assumption is conseriative
and appears warranted, but requires further investigationi.
107

Initial Conditions in Disposal Areas
195. Dredged material deposited hydraulically has water contents
after sedimentation which are different from those normally encountered
in engineering practice. While available data have been examined and
suwmmarized in Part II, the data are insufficient for dredged material
densification design. For this reason, more investigations of existing
conditions in various disposal areas at various t.mes after placement
of dredged material are highly recommended. This work is considered to
have a high, or urgent, priority. It is recommended that systematic
boring and testing programs be undertaken to determine water contents
and soil properties in existing disposal areas having various founda-
tion conditions and covering a variety of dredged material.
1-96. Borings and samplings suitable for determining water con-
tents, Atterberg limit. , and grain-size distributions can consist of
simple displacement-type fixed piston samples having liner tubes. A
diameter of about 1 in. would be sufficient. Samples of this type could
be advanced by hand without casing or drilling mud. At the most, a
simple tripod rig would be required, but even this would probably be
u-nnecessary because of the softness of dredged material and the small
sampler size.
Theoreti al Research
197. The process of sedimentation and consolidation has been con-
sidered in research sponsored by DvMRP, but additional work is necessary.
The effects of secondary compression during sedimentation and consolida-
tion before start of densification treatment have not been considered
and are believed to be of major importance in determining the initial
water content and density of dredged material.. ln addition, the avail-
able analyses need to be compared with results from laboratory and field
tests to establish the validity of available theories axid to modify them
an required.
108

Densification Treatment Research
198. The benefits and utility of' densification treatment have
been examined herein but should be verified by field tests under a vari-
ety of field conditions having a range of dredged material and of dis-
po!;al area foundation conditions. The latter should include pervious
and impervious soils. The field tests should be instrumented and sam-
pled at intervals.
Densification by loading
199. Conventional engineering techniques involving densification
by loading are considered to be understood well enough -to be applied to
dredged material densification treatment, if desired. Principal un-
certainties involve possible construction problems arising because of
the e-tremely soft nature of dredged material requiring densification.
Research required can best be accomplished as part of demonstration test
uses of various methods. A major problem requiring study is how to
place a layer of sand over large disposal areas without permitting local
concentrations of sand that result in displacement of the dredged mate-
rial. Research in this area could consist of underwater placement, use
of various spreaders, etc., to secure a uniform thickness of sand fill.
Densification by drainage
200. Seepage consolidation. Seepage consolidation by downward
flow of ponded water of dredged material is particularly attractive
where foundation conditions underlying the dredged material are suffi-
ciently pervious to prevent pore pressure development in the foundation,
since this would eliminate or reduce downward seepage gradients. This
possibility of seepage consolidation affords an extremely low-cost
method for stabilization where foundation conditions are suitable, but
needs research to establish its feasibility.
201. Underdrainage. Underdrainage, especially with vacuum pump-
ing, affords an attractive means for stabilization. However, further
studies, both field and analytical, are desirable. Plastic collector
pipes that can be unrolled from large coils and have their own plastic
109
- I *..V~ ~ fllj

fitter cloth should be investigated as urderdrainage collectors with
and withouL sand layers.
202. Geodrain . Geodrains offer a possibility for use as hori-
zonta]. drains and also as inexpensive vertical drains. It is suggested
that this possibility be further explored by determining the hydraujJc
conductivities of Geodrains and their stability as filters in dredged
material. A Geodrain may be a simple, vertical drain, substantially
less expensive than anything that has been used in previous engineering
practice. It may be possible to use very lightweight equipment for
economically installing large numbers of Geodrains. Geodrains may also
be useful if inserted vertically in desiccation cracks to connect newly
deposited dredged. material with miderdrainage and avoid sealing effects
of a desiccation crust.Densification by desiccation
203. Desiccation appears to offer the most significant opportu-
nity for securing densification of disposal materials at low cost. It
is recommended that work currently being done in this area be pursued
and intensified. This work should be expanded to include possible use
of Geodrains or other vertical drainage through crusts between intermit-
tently placed iayers of dredged material. Desiccation achieved by
vegetation or by surface drying should be investigated from the view-
point of engineering characteristics involved. Suction pressures caused
by surface drying or by vegetation should be measured, together with
changes in water contents and shear strengths. Measurements should be
made to determine if surface drying or water demand by root systc-s can
effect deep lowerings of the groundwater level during periods of low
rainfall. For example, it can be speculated that surface trenching
"might lower the groundwater level 2 or 3 ft, whereas suction pressures
from deep root systems, or perhaps surface drying, might exist to depths
of 5 to 8 ft and, hence, increase loadings on deeper soils. This might
develop only during periods of low rainfall, but an intermittent effect
could be cumulative.
Densification by chemical treatment
204. Stabilization by chemicals appears to require, and merit,
11i0
IL4M'C44't - - *v ausl.

research only in the manner in which floceulants are dispersed in the
dredged material. Available expertise, in the private sector, seems ad-
equate to select flocculaits for any case where dredged material settles
out of suspension so slowly that the process must be accelerated.
-J
.1
224

PART VIII: CONCZUSIONS
205. The following conclusions are made on the basis of informa-
tion presented. They relate primarily to densification for the purpose
of providing additional disposal area capacity.
Soil Types in Disposal Areas
206. Dredged material varies from sands to silts and fine-grained
plastic silty clays and clays. Sands ani silts consolidate rapidly and
are not considered troublesome, nor susceptible to densification treat-
ment. Fine-grained silty clays and claý's -re weak, compressible , and
undesirable as fill and borrow materials. Only such materials have been
considered in this report.
207. The natural water content of dredged material immediately
after sedimentation is several times the LL. After some surface drain-
age and drying has occurred, the limited data available suggest that
water contents arc about equal to the LL.
208. Fine-grained dredged material usually has Atterberg limiLs
that plot close to Casagrande's A-line on the plasticity plot. This
offers a simple basis for correlating soil properties for preliminary
dcsign computations.
Applicability of Conventional Densification Methods
209. Soil types and conditions in dredged material disposal areas
are similar to those encountered in some conventional soil mechanics and
"foundation engineering stabilization applications. However, conven-
tional applications have encountered difficulties when soil types and
conditions were as poor as those of dredged material. These difficul-
ties can be avoided if personnel are experienced in soft soil stabili-
zation design.
210. The practicability of using conventional densification
techniques to secure increased disposal area capacity depends more
112
[.

upon. economic and other factors than upon technical considerations.
Increased Disposal Area Capacity
211. A large volume decrease occurs when the water content of
dredged material is reduced from its initial value after sedimentaticn
to the LL. According to field observations currently available, this
reduction in water content can be achieved by simple surface drainage
combined with crust development and slight lowering of the groundwater
level in the dredged material.
212. A reduction in water content below the LL is achieved with
much greater difficulty and results in less volume decrease, and, hence,
in less increase in storage capacity. The amount of storage capacity
that can be achieved with densification depends on the plasticity charac-
teristics eof the dredged material, which are related to compressibility
characteristics.
213. The increase iii disposal area capacity that can be achieved
by densification can be related to the Atterberg limits of the dredged
Amaterial. Using surcharge and drainage techniques, materials having LL
less than 50 undergo volume decreases less than about 5 to 15 percent.
If the LL is between 50 and 100, disposal area capacity may be increased
from 10 to 20 percent for most densification treatments, If the LL is
as high as 200, the increase in capacity may be as much as 20 to
30 percent.
214. Desiccation and seepage consolidation techniques produce the
least costly additional storage volume. Desiccation may cause storage
volume increases of 25 to 60 percent for LL of 50 to 200. Seepage con-
".A. solidaLion and underdrainage with vacuum pumping are attractive.
215. Estimates of increased disposal area capacity from densi-
fication have assumed initial moisture contents equal to the LL. This
is intended to apply to disposal areas when surface drainage and a sur-
face crust have developed. This assumption should be further examined.
216. Disposal area foundation consolidation from surcharge load-
ing and drainage treatments may be large where foundation soils are soft,
113
i , l l i I li Ii• i l ... "- ' t ... I

compressible, and thick. Densification treatments may result in suT-
stantial increases in disposal area storage capacity under these con-
ditions, and fouidation consolidation should always be evaluated.
217. Desiccation can produce the largest storage capacity in-
crease of any of the densification treatments considered, and the cost
is less than for other techniques. However, the method may not be
readily usable for areas limited in size where flexibility in scheduling
storage of dredged material does not exist. It is generally not feasi-
ble for treating existing disposal areas where substantial filling has
already occurred.
Densification Versus Dike Raisinjg
218. Surface drainage and surface drying should be promoted in
all disposal areas to reduce water contents to the LL or lower if
possible.
219. Increased storage capacity from densification treatment may
be the equivalent of raising the height of retaining dikes only a few
V .feet. Dike raising, where permissible, is the lowest cost alternative
for increased storage capacity.
Dredged Material As Borrow
220. Fine-grained plastic clays having high LL are undesirable
borrow materials for most purposes where strength and compressibilityof the material are important considerations.
221. Dredged material treated by loading or drainage techniques
cannot be reduced in water content sufficiently to make it useful as
sources of borrow material.
222. Desiccation techniques and placement of dredged material in
1- to 3-ft layers could, under favorable conditions, reduce the water
content sufficiently to permit use of the material. where high LL borrow
material is acceptable.
114-

UJoa _ f Disjosal Areas
223. Disposal areas located in urban centers are especially
attractive for developmmnt purposes, often providing an inexpensive
and strategically located site.
224. Conventional stabilization techniques can be used to improve
disposal areas so they can support substantial one- or ; co-story build-
ings without objectionable settlement. Secondary compression effects
must be included when this use is anticipated.
225. When used for parks, golf courses, etc., disposal areas can
be easily upgraded by conventional densification treatments to avoid
objectionable settlements. The dredged material can be landscaped to
provide rolling topography when desired.
226. Benefits of placing dredged material in disposal areas in
urban centers may be large and the value of land created may pay for
virtually any conventional type of densificvtin treatment. This aspect
has not been included in this report.
Chemical Treatmcnt
227. Chemical densification treatments do not appear applicable
for increasing disposal area storage capacity.
228. Flocculants ordinarily do not appear to be required to ex-
pedite settlement of dredged material.
229. Occasionally dredged material may be slow to drop out of
suspension in reasonable time periods. In these cases, flocculants can
be beneficial. Suitable flocculants must be selected by appropriateA
tests for specific site conditions. This is within the state of the art,
,. especially in the private sector.
"230. The efficient introduction of flocculanto may require ex-
perimentation on a site, since the manner in which flocculants are in-
troduce'! may determine if they are beneficial.
231. Flocculants may effectively accelerate sedimentation where
115

required, but thereafter have no significant effect on the engineering
behavior of dredged material.
Recommended Research
232. Further research in the following areas is considered to
have a Category I priority:
a. Combined sedimentation-consolidation tests with largetest devices, at least 6 ft high and 4 to 12 ft indiameter.
b. Evaluation of Atterberg's "upper liquid limit."
c. Theoretical analyses of the combined sedimentation-consolidation process including effect of secondarycompression in the early stages before densificationtreatment is undertaken.
d. Determination of the condition of dredged material afterplacement in disposal areas. This should include vari-ous types of dredged material and various disposal areafoundation conditions. This work can be done simply ina large number of disposal areas using small-diameterdisplacement samplers with liners. Water contents andAtterberg limits should be determined. 'The "one-point"LL test will probably be adequate.
e. Field test of drainage techniques such as; (a) pumpedunderdrainage with induced vacuum, (b) seepage consoli-dation with normal unpumped underdrainage, and (c) seep-age consolidation with pumped uinderdrainage with in-duced vacuum.
f. Field tests of desiccation by vegetation and by surface
trenching and surface drying should be combined withengineering tests to determine if beneficial effectscan be induced to depths substantially greater thancurrently expected or would be possible by surfacetrenching. This work should include measurement ofsoil moisture suctions at various depths and relation-ship to engineering predict'ons, water contents, settle-ments, piezometer pressures, and similar engineeringtests. These engineering tests must be combined withassociated biologi-al research.
233. Additional research described below, classified Category II,
should be undertaken when possible, and is considered desirable:a. Effects of secondary compression when densification is
undertaken for site development purposes.
116

b. Consolidation of high-water-content soils under smalleffective stress increments.
c. Various types of' collector pipe systems for internal and
underdrainage design. These include Coodrains andplastic pipes that can be unrolled from large coils andequipped with plastic filter-cloths.
d. Introduction techniques for flocculants.
e. Thermal densification techniqLes.
117

REFERENCES
I. Little, Arthur D., Inc., "A Feasibility Study ol' Lawn Sod Produc-tion and/or Related Activities on Dredged Material Disposal Sites,"Contract Report D-75-1, Jan 1975, U. S. Armky Engineer WaterwaysExperiment Station, CE, Vicksburg, Miss.
2. Bishop, A. W. and Vaughan, P. R., "Consolidation of Fine-GrainedDredged Material After Hydraulic Deposition," Aug 1972, NationalPorts Council, London, England.
3. Krizek, R. J. and Saiem, A. H., "Behavior o1' Dredged Materials inDiked Containment Areas," Environmental Protection Agency Grants15070-GCK and R-800948, Technical Report No. 5, Sep 1974, Nortn-western University, Evanston, Ill.
4. Krizek, R. J., Giger, M. W., and Hummel, P. L., 'Organic Contentand Engineering Behavior of Typical Maintenance Dredging.-," pre-sented to the Fourth Southeast Asian Conference on ?oil Engineer-ing, Kuala Lumpur, West Malaysia, npr 1975.
5. Schmidt, N. 0., A Studl of the Isolation of Organic Matter as aVariable Aff cting Engineering Properties of a Soil, Ph. 1. Ttheeiis,University of llinois, Urbana, Ill., 1965.
6. lFabibagahi, K., Influence of Temperature on Consolidation behaviorof Remolded Organic Paulding and Inorganic Paulding Soils, Ph. D.Thesis, University of Illinois, Urbana, Ill., 1969.
7. U. S, Ar•m•y Engineer District, Phildelphia, CE, "Long-Range SpoilDisposal Study; Part II, Substudy 1, Short-Range Solution," Jun1969, Phildeiphia, Pa.
8. Krizek, R. J., Karadi, 0. M., and Hummel, P. L., "EngineeringCharacteristics of Polluted Dredgings," hhvironmental. ProtectionAgency Grants 15070-GCK and R-800948, Technical Report No, i,Mar 1973, Department of Civil Engineering, Northwestern University,Etanston, Ill.
9. Krizek, R. J., Roderick, G. L., and Jin, J. S., "Stabilizationof Dredged Materials," Environmental Protection Agency Grants15070-GCK and R-800948, Technical Report No. 2, 1974, North-western University, Evanston, Ill.
"•1 0. I.rizek, R. J. and Casteleiro, M., "Mathematical Model for One-Dimensional Desiccation and Consolidation of Dredged Materials,"Environmental Protection Agency Grants 15070-GCK and R-800948,
Technical Report No. 3 (in publication), Northwestern University,Evanston, Ill.
11. Krizek, R. J., Gallagher, B. J., and Karadi, G. M., "Water QualityStudy for a Dredgings Disposal Area," Environmental ProtectionAgency Grants 15070-GCK and R-800948, Technical Report No. 4, 1974,Northwestern University, Ill.
1.18 *

1-2. Krizek, R. J. and Giger, M. W. , "Use of Dredgings for Landfill,"
Ltivironmnental Protection Agency Grants 15070-GCK and R-800948,
Final Report (in preparation), Northwestern University, Evanston,
Ill.
13., "Storage Capacity of Diked Containment Areas for
Polluted Dredgings," Proceedings of the Sixth World Dredging
Conference, 1974, pp 354-364.
14. Krizek, R. J. and Karadi, G. 14., "Disposal of Polluted Dredgings
from the Great Lakes Area," Proceedings of the First World Congress_
on Water Resources, Vol- 4 1973, pp 482-491.
15. Krizek, R. J. and Salem, A. M., "Time-Dependent Development of
Strength in Dredgings," 1975, Northwestern University, Evanston,Ill.
16. Hummel, P. L. and Krizek, R. J., "Sampling of Maintenance Dredg-
ings," Journal of Testing and Evaluation, American Society for
Testing and Materials, Vol 22 No. 3, May 1974, pp 139-145.
17. Krizek, R. J., Jin, J. S., and Salem, A, M., "Permeability andDrainage Characteristics of Dredgings," Proceedings of the SeventhDredging Seminar, New Orleans, La., Nov 1974.
18. Englehardt, W. V. and Gaida, K. H., "Concentration Changes of PoreSolutions During the Compaction of Clay Sediments," Journal of Sed-imentary Petrology, Vol 33, No. 4, Dec 1963, pp 919-930.
19. Yong, R. N. and Warkentin, B. P., Introduction to Soil Behavior,MacMillan Co., New York, 1966.
?0. Krizek, R. j. and Sheeran, D. a.., "Sluxry Fi-parueLiun and Charac-teristics of Samples Consolidated in the Sliu'ry Consolidometer,"Contract Report S-70-6, Report 2, Jun 1970, U. S. Army EngineerWaterways Experiment Station, CE, Vicksburg, Miss.
21. Salem, A. M. and Krizek, R. J., "Consolidation Characteristics of
Dredging Slurries," Journal of the Waterways, Harbors, and Coastala•giineering Division. American Society of Civil Engineers, Vol 99,No. WW4, Nov 1973, PP 439-457.
22. Sheeran, D. E. and Krizek, R. J., "Preparation of homogeneous SoilSamples by Slurry Consolidation, " Journal of Materials_, American
a Society for Testing and Materials, Vol 6, No. 2, Jun 1971, pp 356-7*4 373.
23. Skempton, A. W., "Notes on the Compressibility of Clays," QuarterlyJournal of the Geological Society of London, Vol C, Parts 1 and 2,No. 397-398, Jul 1944, pp 119-135.
24. Salem, A. M. and Krizek, R. J., "Secondary Compression of Mainte-nance Dredgings," submitted to the Fifth Panamerican Conferenceon Soil Mechanics and Foundation Engineering, Buenos Aires,Argentina, Oct 1975.
119
it~

25. So, R. K.-M., The Influence of Temperature, Carbon Content andPreloading on Secondary Consolidation of a Clay, M. S. Thesis,University of Missouri at Rolla, 1971.
26. Sangrey, D. A., "Obtaining Strength Profiles with Depth for MarineSoil Deposits Using Disturbed Samples," Underwater Soil Samplin,Testing, and Construction Control. American Society for Testing andMaterials Special Technical Publication 501, 1972, pp 106-121.
27. U. S. Army Engineer District, Buffalo, CE, "Summary Report ofTests, Subsurface Explorations of Dredged Diked Disposal AreaNo. 1, Buffalo Harbor," 31 Jan 1972.
28. U. S. Army Engineer District, Buffalo, "Summary Report of Tests,Subsurface Explorations of Dredged Diked Disposal Area No. 1,Cleveland Harbor," 31 Jan 1972.
29. Johnson, Stanley J., "Precompression for Improving Soils," Journalof the Soil M.lechanics and Foundations Division, American Society of
Civil Engineers, Vol 96, No. SMI, Jan 1970, pp 111-144.
30. , "Foundation Precompression with Vertical Sand Drains,"
Journal of the Soil Mechanics and Foundations Division, AmericanSociety of Civil Engineers, Vol 96, No. SMY, Jan 1970, pp 1.45-175.
31. Moran, Proctor, Mueser, and Rutledge, Consulting Engineers. "Studyof Deep Soil Stabilization by Vertical Sand Drains," Report to theBureau of Yards and Docks, Department of the Navy, Jun 1958
32. Haley and Aldrich, Consulting Soil Engineers, "Engineering Proper-ties of Foundation Soils, Long Creek-Fore River and Back Cove Area,Portland, Maine," Report No. 1 to Maine State Highway Coinission,Oct 1969.
33. Henkel, 1. J., "Problems Associated with the Construction of theEbute Metta Causeway over Soft Clays in Lagos, Nigeria," Paper 3/16,Proceedings of the 6th International Conference on Soil. Mechanicsand Foundation Engineering, Montreal, Vol TI, Divisions 3-6,University of Toronto Press, Canada, 1965.
34. Margason, E. and Arango, I., "Sand Drain Performance on a SanFrancisco Bay Mud Site," Proceedings, Specia]ty Conference onPerformance of Earth and Earth-Supported StrucL'i-es, Soil Mechanics
and Foundation Division, American Society of C'vil Engineers,Purdue University, Lafayette, Ind., Vol I, Part 1, Jun 1972,pp 181-210.
35. Halton, G. R., Loughney, R. W., and Winter, E. "Vacuum Stabiliza-"tion of Subsoil Beneath Runway Extension at Philadelphia Inter-national Airport," Proceedings, 6th International Conference onSoil Mechanics and Foundation Engineering, Vol 2, 1965, pp 61-65.
36. Dredged Material Research, Notes Hews Reviews, etc. , MiscellaneousPaper D-76-1, Jan 1976, U. S. Army Engineer Waterways E)qperi•nw•ntStation, CE, Vicksburg, Miss.
120
37. Kjellman, W. , "Consolidation of Clay Soil by Means of Atmospheric
Pressure," Proceedings of the Conference on Soil Stabilization,Massachusetts Institute of Technology, Cambridge, Mass., Jun 18-20,
1952, pp 258-263.A
38. , Discussion of "Consolidation of Fine.-.Grained Soils by I
Drain Wells," by Reginald A. Barren, Transactions, American Society A
of Civil Engineers, Vol 113, 1948, pp 748-751.39. Calhoun, C. C., Jr., "Trip Report," 29 Aug 1975, U. S. Army Engi-
neer Waterways Experiment Station, CE, Vicksburg, Miss.
40. Chadney, R. F., "Preparation of Dredged Spoil Deposit Areas," The
Dock and Harbor Authority, Jul 1968, pp 115-117.
41. De Nekker, J. and In's Veld, J. K., "Dredged Rotterdam Harbour Mud:
Its Qualities and Use as Soil," Terra et Aqua, No. 8/9, 1975,pp 34--h0.
42. U. S. Bureau of Mines, "The Florida Phosphate Slimes Problem; AReview and a Bibliography," Information Circular 8668, 1975.
43. Bromwell, L, G., Progress Report, Florida Phosphatic Clays ResearchProject, Apr-Jun 1974, 15 Jul 1974.
44. Davenport, J. E., Kieffer, G. W., and Brown, E. H., "Disposal of 4Phosphate Tailing," Tennessee Valley Authority Report No. 661, 1953, i
Wilson Dam, Ala.
45. Brorwell, L. G., Progress Report, Florida Phosphatic Clays Research
Project, Jan-Mar 1974, 10 Apr 1974.
46. , Progress Report, Florida Phosphatic Clays ResearchProject, Jul-Dec 1974, 4 Feb 1975.
47. Vogt, M. F., "Development Studies on Dewatering Red Mud, Kaiser
Aluminum and Chemical Corporation," Gramercy, La., presented atthe 103rd Annual Meeting of the AIME, 25 Feb 1974, Dallas, Tex.
48. U. S. Soil Conservation Service, Drainage of Agricultural Land,
Water Information Center, Inc., Port Washington, N. Y., 1973.
49. Atterberg, A., "Plasticity of Clays," Draft Translation 413,
Sep 1974, U. S. Army Cold Regions Research and EngineeringLaboratory, CE, Hanover, N. H1.
50. Boyd, M. B., et a]., "Disposal of Dredged Spoil; Problem Identifi-cation and Assessment and Research Program Development," Technical
Report H--72-8, Nov 1972, U. S. Army Engineer Waterways Exoeriment
Station, CE, Vicksburg, Miss.
'51. Reikenis, R., Elias, V., and Drabkowski, E. F., "Regional Land-fill and Construction Material Needs in Terms of Dredged MaterialCharacteristics and Availability," Contract Report D-74-2, Vol 1,
May 1974, U. S. Army Engineer Waterways Experiment Station, CE,Vicksburg, Miss.
121
52. Johnson, L. E. and McGuinness, W. V., Jr., "Guidelines for Mate-rial Placement in Marsh Creation," Contract Report D-75-2, Apr 1975,U. S. Army Engineer Waterways Experiment Station, CE, Vicksburg,
Miss.
53. U. S. Army Engineer District, Philadelphia, CE, "Long-Range Spoil
Disposal Study; Part III, Substudy 2: Nature, Source, and Causeof the Shoal," Sep 1973, Phildelphia, Pa.
54. Oosterbaan, N., "On the PIANC Classification of Soils to beDredged," Terra et Aqua, No. 5, 1973, pp 29-32.
55. U. S. Army Engineer District, Charleston, CE, "Investigation for
Reduction of Maintenance Dredging in Charleston Harbor, S. C.;
Part 2, Materials Testing Laboratory Investigation of Propertiesof Shoals and Materials in Movement," Vol 11-2, Feb 1954,
Charleston, S. C.
56. U. S. Army Engineer District, Buffalo, CE, "Dredging and Water
Quality Problems in the Great Lakes," Vol 8, Appendices C6 to C9,Investigation Reports, Jun 1969, Buffalo, N. Y.
57. U. S. Armty Engineer District, San Francisco, CE, "Dredge DisposaA
Study, San Francisco Bay and Estuary; Appendix J, Land Disposal,"
Oct 1974, San Francisco, Calif.
58. Rieke, H. H., III and Chilingarian, G. V., Compaction of Agril-
laceous Sediments, Developments in Sedimentology 16, American
Elsevier Publishing, New York, 1974.
59. Bartos, M. J., Jr., "Classification and Engineering Properties of* Dredged Material," (in preparation), U. S. Army Engineer Waterways* Experiment Station, CE, Vicksburg, Miss.
6o. Mohr, A. W., "Development and Future of Dredging," Journal of the
Waterways, Harbors, and Coastal En-mineering Division, AmericanSociety of Civil Thgineers. Vol 100, lke. WW2, May 1974, pp 69-83.
61. Mesri, G., and Olson, R. E., "Mechanisms Controlling the Perme-ability of Clays," Clays and Clayj inerals, Vol 19, No. 3, 1971,
pp ±51-158.
62. Murphy, W. L. and Zeigler, T. W. , "Practices and Problems in theConfinement of Dredged Material in Corps of Engineers Projects,"Technical Report D-'()-2, May 1974, U. S. Army Engineer Waterway:s"Experiment Station, CE, Vicksburg, Miss.
"63. U. S. Army Engineer District, Phildelphia, CE, "Long-Range Spoil
Disposal Study; Part IV, Substudy 3, Development of New Dr, ging
Equipment and Technique," Jun 1969, Phildelphia, Pa.
64. Mallory, C. W. and Nawrocki, M. A. , "Containment Area Facility
Concepts for Dredged Material Separation, Drying, and Rehandling,"
Contract Rieport D-74-6, Oct 1974, U. S. Ary Engineer Waterways
Experiment Station, CE, Vicksburg, Miss.
122

65. Skempton, A. W., "The Consolidation of Clays by Gravitational
Compaction," Quarterly Journal of Geological Society of London,
Vol 1.25, 1970, pp 373-411.
66. Kaill, J. L., et al., "Artificially Simulating the Geological
History of Clay," Final Technical Report, Jul 1974, U. S. ArmyEuropean Research Office, London, England.
67. Freitag, D. R., "Soil as a Factor in Shoaling Processes; A Litera-ture Review," Technical Bulletin No. 4, Jun 1960, Committee onTidal Hydraulics, U. S. Army Engineer Waterways Experiment Station,CE, Vicksburg, Miss.
68. Johnson, L. D., "Mathematical Model for Predicting the Consolida-tion of Dredged Material in Confined Disposal Areas," TechnicalReport D-76-l, Jan 1976, U. S. Army Engineer Waterways ExperimentStation, CE, Vicksburg, Miss.
69. Olson, R. E., "Shearing Strengths of Kaolinite, Illlite, and Mont-morillonite," Journal of the Geotechnical Engineering Division,American Society of Civil Engineers, Vol 100, No. GTII, Nov 1974,pp 1215-1229.
70. W-hitehouse, U. G., Jeffrey, L. M., and Debbrecht, J. D., "Differ-ential Settling Tendencies of Clay Minerals in Saline Waters,"Proceedings of the Seventh National Co,.ference on Clays and ClayMinerals, 1960, pp 1-79.
71. Krone, R. B., "Flume Studies of the Transport of Sediment inEstuarial Shoaling Process," Final Report, Jun 1962, HydraulicEngineering Laboratory and Sanitary Engineering Research Labora-tory, University of California, Berkeley.
72. May, E. B., "Environmental Effects of Hydraulic Dredging inEstuaries," Bulletin No. 9, Apr 1973, Alabama Marine ResourcesLaboratory, Dauphin Island, Ala.
73. Leonards, G. A. and Altschaeffl, A. G., "Compressibility of Clay,"
Journal of the Soil Mechanics and Foundations Divi7ion, AmericanSociety of Civil Engineers, Vol 90, No. SM5, Sep 1964, pp 133-155.
74. U. S. Army Engineer District, Wilmington, CE, "Final EnvironmentalStatement, Maintenance Dredging of Basins and Channels at MilitaryOcean Terminal, Sunny Point, Southport, North Carolina," preparedby Coastal Zone Resources Corporation, Wilmington, North Carolina,
May 1972.
75. Department of the Navy, Naval Facilities Engineering Command,
"Design Manual, Soil Mechanics Foundations, and Earth Structures,"NAVFAC DM-7, Mar 1971, Washington, D. C.
1.23

Preceding Page Blank
00
4- 4- z)-Pcc 0- 4-) a)C.) to - a d
ri 0 4-1 8C -- ýd ,4A $4 04-; 0 d 4)I
C) O*H) Cd () I 3Lf\ ~ ~ ~ 'CdPýC ý -
0Cd4-1 .Hj Z Cd I~d Hd `4 4'Cd d01 Cd r) 4,ý 9 Q)w 0 (1 0
$ I H ) -4 4-' 94 0 r. )C U) Z W-bf ~ Cd4 C: a) 0O :jH-ICd4- 'C.,1 C 5- Cd 0 Cd toH C\i (1) C Cd 04-r 43 I
z4-) 0 r-I $-1O V'0Cc V: 0O Cd 4,,Cd 'C Q d 0 Cd tf)75 *H (1)-4 Q)H1 00 0 ) 4- 4-3 -P.O-4 Cz-4C U4- b3 to 4, (1 Cd Cd0;> 'C C)~ .04 Cc d U)CAd 43 r'd
En 0 ;.q0 Co~ 4-4 'd " dr- 4-., 4 - 3H b f 4 -4 .) 5-: 0)H
QH 0 4 - i ( 0 O $ 4 d $ z- V 2Cd ý > HCd-4 , 0D HO 0d *H P4 0
0 714U Cd , 4,>-3 H5 Cd $4 11 0d.00 Id -HO 4H- rd 1)Cd *H ) )R
4-$4 4-0 Hz 4- 4 H-4,04Cd -4o a)4 Cd " q-4 Ocd) )0 -4 d 0D f-4 gH,- 4,, 'd Cd 4-3.U
.-4- $4 -1, C3 Coo 4- w$d.,j r4 0 0 H'HI a)F 00w :jCd 4-i U 0.
C) ) 0~C 4-; 4.) -14 C 0 H (1)9 ~ 4-' 3*H 4 H Co _4 U)4 Cd4 HU C Z * C~. rA
Cd to $ -n Cd 0 E C' *rqCdH ., 4- 0 d 51.Id 0 *H4 4-4 :-I p) C) 4-D F'HOI - H Ia) 0) 04 4-' Cdi- () 4 zd -H r4-) 4 C d U) H)-r
od to ". a) >..- .0d ý4- * pfU H C0) cdU I d 0 ) C(H d. 0 C U) U
U4 01 0C 0 9 - H4 4 ' d4 *D * 4 ;-4
-:4 U) 4 Cd 'd$49 (1) to Cd 0 H- to> (1)C) ea0ý 5i Cd Cd) 'd 000 *Ho4 'C d Ur- H-- ,, - d W 04-C$4 U) 0) Q) w w 1) 4CdH (1) :5r - 4-) -H OH.-- Q) '
0 $-4 :ý a)C 0rd a)~ -I Cl 4-0 d -r5 C4 -4() 01 4-H :z 0 C ) <0 U ) 0 OH4
H- Co -H d > )4-U) Cd'Cd 0 0 4-0' .H 4- H 'dflC3Cdj :3- *H .H1d oýC- 1-0C P4$4 to Cd o d od
W ) U)U) 0UU Ind 50r]H-4 H 4, *H 2O WOU Cd V. -4 $4d Cd- 0.0 *H4 Q' 4- 'd. N .0Q ()
0 ) -) V Cd4- Q 4, $- C4 -Cd0 cd (1 1t o rd $4c~~~~00 , 0'Cd 4- 4 4d U, 4 ) -I-u U)C j 'QE- Cd U) 000. .0,0 CoC - 4- ) 0 -4 Cd I Cd-
HU 0 ) -40 Cd1). Cd- r-4- ;3: . Cd 4- d i -NCO 0 0 U).00C Cd ;ý U)-Cd ~ 0. 4 0 U 0 4: Cd0 *HU -A) Cd Id' -4U
CS 4, H - 4- F: 0 4Co~ Id C0 0 V HC C)) 4-U0C) *H Cd 04- CE4Cd) 0c 'tU P Cd Pd4,- rd Cd ul 0 Ci I'H - W~ 4-H
P4U Z 4, - 4.43 00 C d U.HC)d4-4 bl () 04, 'd :0d 4 0 - -HCO H*HO H4 Id Cý rd d :J *HU) 0 U) Cd;-4 C1) f d Cd4- Cd CD d" 04-044-CdH CdH p H > )C - V H
to $4 4,3 C) d> rS $U)'C q 4-) o 'd : $4 s Cd Cd'rd 4-0CH4 o -d 4-d *H4 Cd ';5'+- 'ddU) 0 .0- 4-) 5 *H *HO0 %.1 Cc U)4, "4, ý 4-)b1 M04U 4-U
04-0 CHc *H0$ *H'dU rqCdC -1 -aC 00 oC
Cd CdC
Crd
Cd z44;
'd -P Cdr
ud 0 4-4 U)0P4a 00.4 Q0 aCd -I Cd $4d'
$4 4 U4) rd)4- U) --0 m-45 Cd r'd u4-C4- 0O4-.CdO u 4 0) 0Cd Cj- -1' C)4 r --
O (3) 'CdI 'CpU C)w4,Co . 0 Id z 0 r=;'
=4 * o cc Q)'H . *H 4-1'C 4-)4
C",Q 0 r=CdC 0 0. 4-3 Cd u *C 0 $4 0 H4 -p 00,j 0 4- 4
Cd C C. .0Ca)CU d 0S.: 0'd Cc o -;HHq 4, 4, E
C) C) -- dýP- P4 C)5 Cd Cd
0 Id Id 3: 4-ý4-I ,0", -H a) Cd;.
Cd 03 $4,0' Cd1-H43 C)0W'H 04-uOH0. U'H 0 -1 0 -1dV) -H 4-H
4p *H d 0)~.' 0ý .0pwCd 00 PH' 4, 0'Cd C > P
0 ) IH ' H)*404-ý rCdO

03 '0
0 00 0 000
0,1
0ý C) ri 0 .0 0 H
00
0d 0
L~~~C .4' -. H 0
vb.*- -.. -Cc 4- 'D P- t- t- - t- -
.. 0<)
-r. co
w e . .4 C -lud< ' '
13 10

0 14 .
H o4
0.14
'04 ' ' 0 04 00 en (4 00 4 C 41 0 4 0
010
4( 0 0 ,10C
1-':.4 4 .1 4 4 4 .4 4 4 4 o
09 9 1 : ý ý1
0 o Ný o
4. 0ý O l ý 1044o c ý - o
.441 ~~~~~~~~~~ a,0(. e nn 00( n ( e - 400-
444.-4o
4.-v0 '044(0.4440 ene r ( 0 0
WA ~ ~ ~ ~ ~ ~ ~ ~ ~ . 14-0' 000000. 0 0 0 0 40 0 0
0 Is
.4; 06 C;

0 0 .- 0.0 H H4 I - .
301
a44 H 0 0 H H H 0
010-
444 0 ý 900 00 000 400
.00 .4 w01 oooo
x0
o N4 04 oI WI 0 mn W 40 I No.0 44 m lo ID
o" uo '04. Ný 0 ý In WI0'w44. 4 4 4 4 00 4 4 4 0 0
I4 44w(
44
co> H 4 N H H ND o N, N N7o4a wI O
c o 0
o ~ ~ U 440 M.J( 10( -10 (((0 (co4 0 0 0 0 00 0 0 0
NN1H; 0 >

I -;-
41 4
ca A
-A
1-41
14 --2
u a;
An -n
cii 4A) aA14-,
PL4 -4 ca
oc44-4
0.
44 A)
'42-4 -H 4 IA1 An ' C 44
"" 'l 10 CA 0 ,
'-4- $4 '- A
.4244
C4 (13 At
44 ($41 44 A
a~- 4c) N-4-'0

Table 7
Mississippi Rivcr Gulf Outlet - New Orleans, Dredged
Material in Disposal Area*
Liquid Plastic Plasticity Water Liquidity Water Content:Limit Limit Index Content Index Liquid Limit_L_ _ _ _ •_•_•_ I
92 21 71 88 o.94 0.96
66 21 45 50 0.64 0.76
73 24 49 47 o.47 0.64
74 21 53 67 o.87 0.91
* Borings U-2A and U-2C, samples above elevation 0.0.

4) C CDr (3) II
C))C 4 -'
CC) (NJ
a -A N 4(. .A I- HfN HD o- H
C) I * * * * ON * ID D -iIO 0
HHCj HH -A H 'InH
C);
A'd H C- Mr ( Ni WN * f
'00 * * I * CM H * ' '. I I * I I
ool (0\ \10 t NJ 0- U .0 '.0 O\Nir- f0'Iq D -A (1 * ~ .- 0
H- -H
C)A 0Cd4 r-) C) N'-OHt(n C1 \ ci
$4 ci4) \1 N-A 0 G \
'-I (\ HD M GDCii at H4 CM I_ t-J Ho A~ aý ON \
o 75 H, ~ C I f I Il521 .-I ONl V%0 -:t (Y co \.0C ,-A H\ LCNH. .-A C OH H G M'
0 N 0 0 5 D0
H4 -' 0 II I I o In i- io i C
\1 t- 1 10 A C
(4ý
C'-' Cj Co
' .0CM G GD.,q HC C P4 (IN Hu.qI Ii rl I I 5
O pC 0- GD n 0 CM '00 H, 4- 0 ý 0. W2 '0 c CID 0 t UN UN 1 D (1 cu U 0 GD
Ci C) c
0 CM Hý QNI OH P,
C) to 0 -A'00G 0) GD U)
Cd S )'S Ci) fi
Hd a)i a- 0 $4 -171 -1
Lo r) -Ia
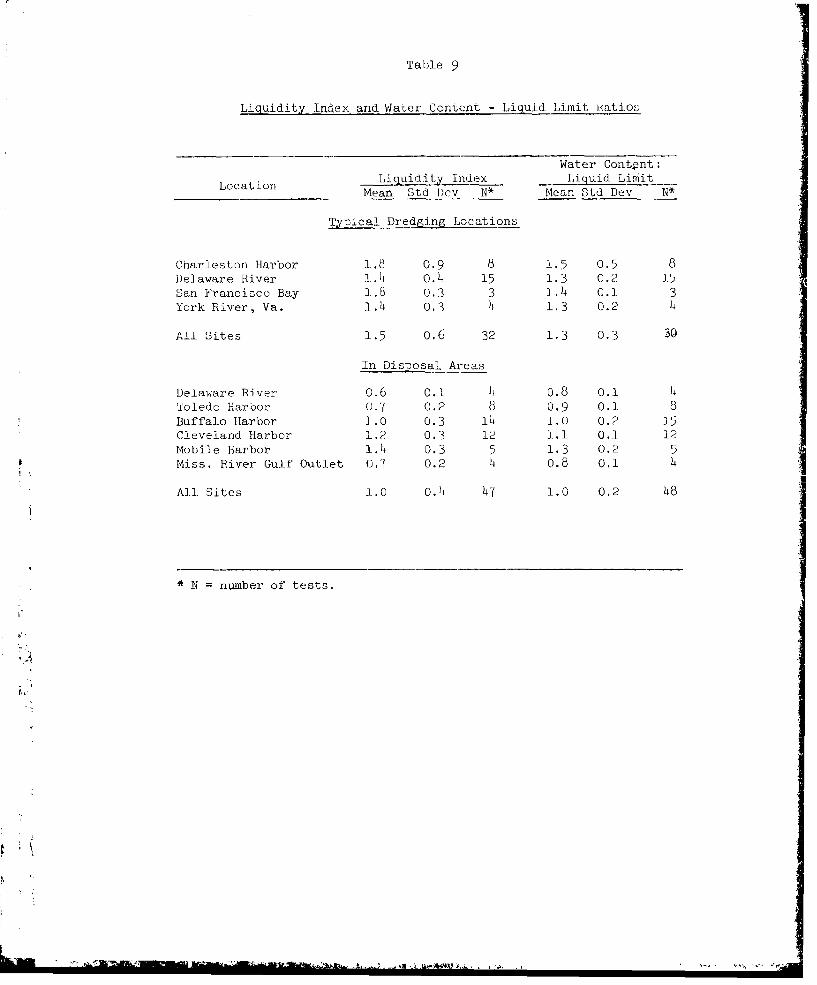
Table 9
Liquidity Index and Water Content - Liquid Limit t.atios
Water Contgnt:
Location Li uidity index Liquid LinjitMean Std bev N* Mean Std Dev N*
Typical Dredging Locations
Charleston Harbor 1.8 0.9 8 1.5 0.5 8Delaware River 1.1 0.4 15 1.3 0.2 1.5San Francisco Bay 1.8 0.3 3 ].4 0.1 3
York River, Va. 1.4 0.3 4 1.3 0.2 4
All Sites 1.5 0.6 32 1.3 0.3 30
In Disposal Areas
Delaware River 0.6 0.1 4 0.8 0.1 )4
Toledo Harbor 0.7 0.2 8 0.9 0.1 8Buffalo Harbor 1.0 0.3 114 1.0 0.2 15Cleveland Harbor 1.? 0.3 12 1.1 0.1 12Mobile Harbor 1.4 0.3 5 1.3 0.2 5Miss. River Gulf' Outlet 0.7 0.2 4 0.8 0.1 4
All Sites 1.0 0.4 47 1.0 0.2 48
* N number of tests.
g.
'-S"
r. ,

r4
H ~ --- C)1m
0j 0 0 0
4-))
o 0
0)4)4,OCcc
rd H2 o iNH -i CO 1 ~
4-) H- 4-) rd (Y) (NJ LfX-\ CLi- C\X12) 0 l)iH (I) ci
.H4) 4)
HP (ii 0 Lic. \D 00 (Y CC) ip(Y V (N' -t CC) (Ti) (Ti
0 ýF-4j H-
H4)I 0*H0_m NLC4-4'
o
Q12 0H H H- 4D 0 ) 4-)
$-4 4)0 - Y) C \ C
4-' 0 0ý Co ") H 0 1\U Hý 00 0 Cou
(12 a)s0-)
0) 1 a ,-
124) 0 11
4) 0 ~u~ U) co w 'A.
o H u wr
C '
(n PLI
~' -~ ., " . --. -

Table 12.
Dewaterirj2-De1sification Methodologies
Methodology Technique Status
Physical Loading ApplicableDrainage ApplicableDesiccation
Surface drying ApplicableCapillary wicks Proposed-not developed
Mechanical Surface reworking In useSurface drainage In use
Chemical Grouting Not applicableFlocculants Applicable
Thermal Internal heating Potentially applicable

Table 12
Dewate ri n-Densification by Physical Methods
Techniquc Description
Loading Temporary surcharge on surface of disposal area.
Temporary surcharge with vertical drains to
accelerate densification.a. Vertical sand drains.
b. Kjellman cardboard drains.
c. Geodrains.
Surface ponding with plastic membranes.
Vacuum mats.
Drainuge and Drainage Underdrainage with lowered water level.
Combined with Other a. Natural sand foundation.Techniques b. Sand layers with collector pipes placed
on disposal area before placement of
dredged materials.
"Seepage pressure consolidation, i.e., surfaceponding without surface membranes but with
underdrainage.
Internal drainage in dredged material afterplacement in disposal area.a. Horizontal sand layers with collector pipes.
b-. Sand finger drains with collector pipes.
C. Geodrain and other drain strips, horizontal.
d. Electro-osmosis.e. Vacuum wellpoints.
Desiccation Surface evaporation.
Surface trenching to increase desiccation depths.
Vegetation.
Capillary wicks.
ri.

d )2 c) c vU) U) V) (a fi) W U)
10 (1 ) (10 ) Q) 0a ) 0 01 0) 01 (1 ) 4)
4P4
41 4))4 02 V) V2 0 ) U) In (n 02 U U) 02 02 UV) P 4.- 0) C ) 6 43) C) Q 4) a.) C) a) a. ) q)43) 04- el 51> z0 > 0 0 0 0 ~ o o
HH 04-'
Q) q) 1I*.4-)
Ed2 C) IV -)0 4) C 6 0) 4 , c ) 0 C) )
r: Hý ;) C) w ,,
(33 0 He f C-) a
fH 0, d , wH --ri Co 44 U) 4) 02 (n 03
0ioo 4-o W o r. $- 0 " - 1O H I-. ;1 '40 0)4) (4) 1> 4D -
4) 0 0 0 r rd> C0 4) 0 01 da) 0 d U) 14' 0 1 00 4U) y H (d ) CO 2d ý.2 (1 4- 4ý ) '1! P4 'd 0 +>C , ci C 0 0,4 c
'H) 4 A - ) (3) (2 W5 - 09-E-' wC H i 0 4) 0 ) ) 0 6
~ 4-0P5~ U ~ 2.C3)Q0)A (14'
4) 13H bo W1 4-. 4-)-,A 4-)4
0,0i3 0 ci4 1-1 i'raC 0 w
04)0* 0 Ci
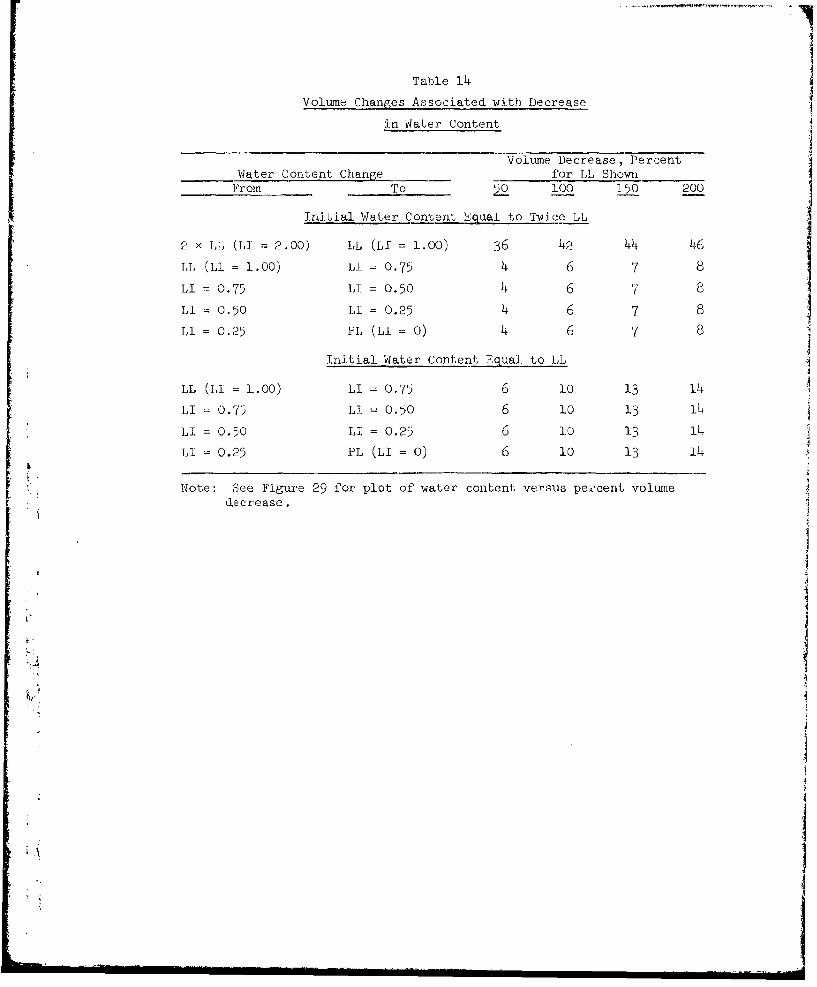
Table 14
Volume Changes Associated with Decrease
in Water Content
Volume Decrease, PercentWater Content Change for LL Shown
From To 100 150 200
Initial Water Content Equal to Twice LL
2 x LL (TI = 2.00) LL (LI = 1.00) 36 42 44 46
LL (LI = 1.00) LI = 0.75 4 6 7 8
LT = 0.75 LI = 0.50 4 6 7 8
LI = 0.50 LT = 0.25 4 6 7 8
T, = 0.25 PL (Li =0 ) 4 6 7 8
Initial Water Content Equal to LL
LL (LI = 1.00) LI = 0.75 6 10 13 14
LI =0.75 LI = 0.50 6 10 13 14
LI 0.50 LI = 0.25 6 10 13 14
11 =0.25 PL (LI =0) 6 10 13 14
"Note: See Figure 29 for plot of water content versus peicent volumedecrease.
I..
$ I
]ItI
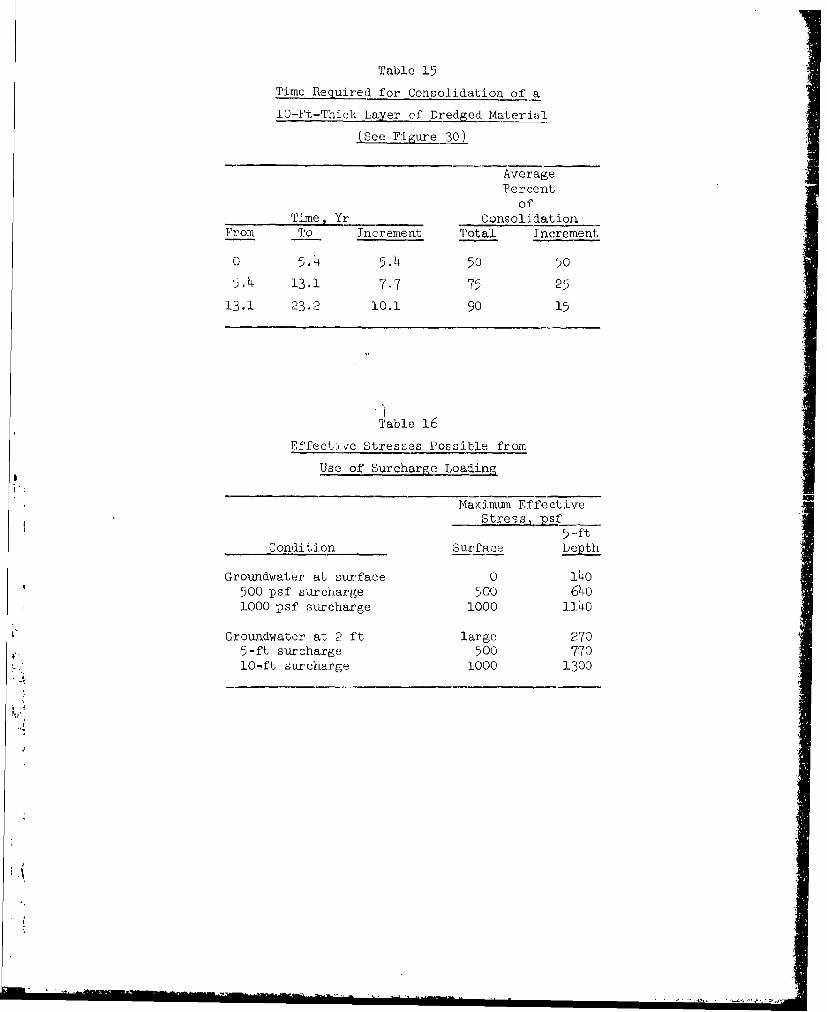
Table 15
Time Required for Consolidation of a
10-Ft-Thick Layer of Dredged Material
(See Figure 30)
AveragePercent
ofTime, Yr Consolidation
From To Increment Total Increment
0 5.4 5.4 50 50
5.4 13.1 7.7 75 2513.1 23.2 10.1 90 15
Table 16
Effect. ve Stresses Possible from
Use of Surcharge Loading
Maximum EffectiveStress, psf 5S~5-ft
Condition Surface Depth
Groundwater at surface 0 140500 psf surcharge 500 6401000 psf surcharge 1000 1140
Groundwater at 2 ft large 270 -* 5-ft surcharge 500 770
10-ft surcharge 1000 1300
S................~~~~~~......................,,, . i...n...... r nU n nm................ ,-- .-....I-•

Table 17
Effective Stresses Possible from Usc of Drainage Treatments
Maximum Effective StressS psf
_Condition Surftace 5-ft Depth
No drainage of disp3sal aree; groundwater level at surface 0 14o
Sur-ace drying, grotu)lnHIaater level at depth of 2 ft Large 2'0
Drainage layer underlying dredged iaterial; gioundwaterlevel at base of dredged material- Large 450-770
Drainage layer underlying dredged material; groundwaterlevel lowered by pumping in drxinage layer and partialvacuum maintained in drainage layer by vacuum pumpsfitted to dewatering pumps Large 2200
Surface sand layer, membrane, and vaceuum-dewatering;15-ir. vacuum in sand layer 1060 670-1200
Seepage consolidation; i.e., surface ponding andunderdrainage (10-ft depth of ponded water)a. No vacumn in underdrainagc layer 0 760b. 15-in. vacuum in underdrainage layer 0 1290
Table 18
Water Content Decrease from Increase in Effective Stress
Initial Water Water Content Decrease, % Liquidity Index for ApContent and for 4p, )2sf psfLiquid Limit 200 500 1000 2000 200 500 1.000 2000
50 3 6 10 13 0.84 0.70 0.56 0.4o
100 8 16 2A 32 0.86 0.73 0.60 0.)4
150 1.3 25 ' 51 0M86 0.74 0.61 0.Y
200 18 34 50 69 0.86 0.711 0.62 o.148
-J,. -- I~"

C'1.11
(1 40<H
4j ý 0 CD0'DC n C ) CCF4) 40 4040 ( L -
q) C) QL(NtC~ ~j O
4' Cc H H) q) [C 4 j 1 ON 0
$4) () w4H -
CHCH
CH0
Un 0rl P-4 HH1 V Q
(1~ 0 4 CNJ -,I I> > -0 -l 04 (J 0F-c bf-' rH Hd -! 0)
II
p- 4)) 44)43) 4-4 (/H 0 d Id.,A z W04 Hl Hl P,3
03 a) 093 H HJ
[-4 2d Q )W 0rI-
0-
(12'4 ,, 2 4 (1) ( $ 343- L) d ( ) M U 43 U 1 PA ) PA 2
$4 4) H- P9 PA) d ) 4-
CD (UC
m) U.4
" -w4c .; 09 6%AAM~r 0

0a C
4,--.C4) v.-.ol -'
0-u0-"
4:
"I
CCC CC C
CCC CCC 00 C0-0-
CCCcr-a "-ZN "4
N N --
Ca - CC�
CO C
5 0.4c '4
'0cC as- 00- 1!'
�2CI 4,.�4C) *�'-.I t-- .o -c .-n 0�
HR
C4
' CCC �CC CO C- '"-Cr - nhr a-C as
�1C 4&Z crc-C -t
COO CCC CC C
N
CCC CCC CC C0'04,) acen -S
0 ha"cr-ca- rca4 CV- CO
C U a"--- -o
N V
'4-o4, 4' C
CO -
-v-i"- N-ON c-c- 2 5F-. � �' � c-ca-
N (fl
420
�2RzC
0
'050 CNO azr-
-C CC
'-C �CCC CCC CC C
as-� C� K Iron''-' - N -
a
'U a
- C
CL - ae
4) aL Lahr 4)
Ft -- '-C,
4- 4) 4) a '4 42 0
,,a" .. C."Co
or c-
-- 'a,,
cr � a �$.c , 0..oj
a ' '-. 24'
I 'C 54,� a a-'Ca 2 ?C sO �0 La
I- H
7 4 0$*-Cow .. ' he4'�flJ�.&- � -

)12
0' 00
Q).
t cit
) 0 C,) 4)4 '.- 0
T 0'ot U 4r
0'c
Up
00 F'.(94, 0 0 0 me
0- C
0 N

LJ4 . 2CO -, I
N O oC
>0 1 o .. o
2 r
-- • '. ••
C)C) C C

414
In In
oo
417
C4)C
"o Wol
4) 10)0u
0 'd .-a
'0~1 '4 0 0v
N Id-z LID I-
10014) ,b

Table 23
Additional DisposalArea Storage by
Raising Retaining Dikes
Added Added Dike Volume CostDikes Raised Storage Volume per Acre of 1000- to per Cubic Yard
ft cu yd/acre 3000-ft Area of Added Storage
0. 5 810 190 $0. 23
1.0 1610 380 0.24
1. 5 2420 590 0.24
2.0 3230 800 0.25
Z. 5 4030 1020 0.25
3.0 4840 1250 0.26
Table 24
Comparison of Treatment Alternatives
Added Storage Volume
Treatment Alternatives %/ _
Dessication or raise dikes 1. 5 to 2.5 ft 15-25
Surcharge loading or raise dikes 1 ft 10
Underdrainage and water surcharge without
membrane or raise dikes 0. 5 ft

APPENDIXES A, B, AND C
of
WES TECHNICAL REPORT D-77-4
STATE-OF-THE-ART APPLICABILITY OF
CONVENTIONAL DENSIFICATION TECHNIQUES
TO INCREASE DISPOSAL AREASTORAGE CAPACITY
by
S. J. Johnson, et al

APPENDIX A: COMPOSITION OF SEDIMENT
Depositional Environments
1. Depositional environments and types of material generated in
maintenance dredging in the United States 50 are shown in Figures Al
and A2, respectively. Engineering properties of dredged material are
determined to a large extent by the depositional environment from whichthey are obtained. Engineering problems associated with dredged coarse-grained materials from littoral zones are minimal in comparison to
problems associated with fine-grained material encountered in routine
maintenance dredging associated with commercial port facilities. ISalinity of Soil Pore N'ater
2. Dredged material taken from soils deposited in a saline en-
vironment and subsequently placed in a diked disposal area may exhibit
different engineering properties from soils which have been subjectedonly to a freshwater environment. As shown in Table A!. the majority
of maintenance dredging in the United States is performed in saline50,52
waters. Only on the Great Lakes and interior riverine environments
is dredging performed in fresh waters. As shown in Figure A3, a salin-53
± ty of i ppt exists 60 miles above the mouth of the Delaware River,
Similar conditions probably exist in other rivers where they discharJe
into salt wauter.
Classification and Enrineerinr Propert.iesof Bot tornm aiet
"3. In 1973, the Permanent Internal Association of Navigation!j Congress (PIANC) piroposed a classification system for soils to be
dredged, given in Table A2. In the United States, the Uniified Seill
* Raised numbers refer to similarly num.bered items in the Beferences]
at the end of the main text.
Al
S| ii -- V. . . . . . - - - - - - - • • |.. . .
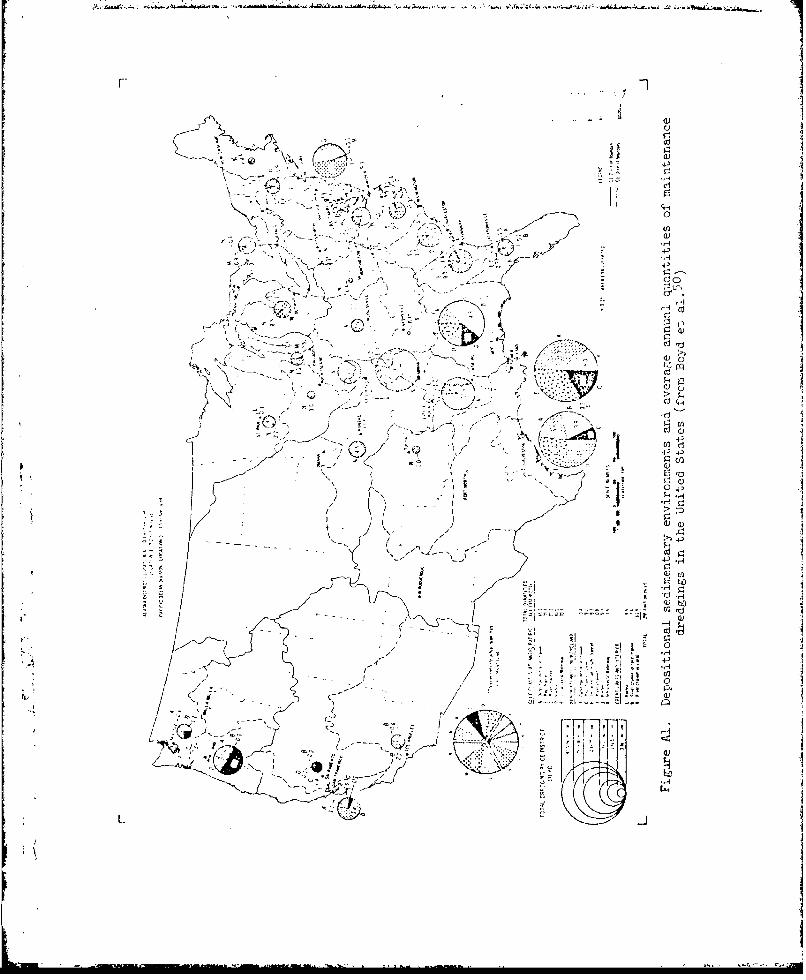
'A C D
2 ~C) '
co
0)
4 P4
CY¼ 4- J {-4 I

4-)
01+
'-'S
? jI $-~tt
0J
- - \7 '---- ~l'

10
2
o- SALINITY SL T
SLW SLACK . V HW SLACK •
-J 0.4 ,.
S 0.2 _ _
0.1J 1 " _ _ _ _
NOTE: AVERAGE OF TOP & BOTTOM SALINITIESUNDER MEAN TIDE & FLOW CONDITIONS.MEAN FLOWS ARE REPRESENTED BY A _____ j
0.04 FRESHWATER DISCHARGE EQUIVALENT -OF 16 475 CFS AT AND iNCLUD:NG THE
0.02 SCHUYLKILL RIVER.
0.01 _ _ _ _ _ _ _ _ _ _ _ _ _
. 20 40 60 80 100
MILES ABOVE MOUTH
Fjr_,ure A3. Salinity ver'su.s mil-es above mouth of' )elawar:e ]diver
(from U. S. Ar.Vy Engineer District, Piladelhia 5 3 )
A4
.1I..•, rc•-"' • .• 2'• N:N-•i'-• A"f ' .... .,

Classification System (USCS) is widely used, not only by the Corps of
Engineers (CE), Bureau of Reclamation, and Department of the Navy, but
also by numerous other public and private engineering organizations,
Charleston Harbor
4. Engineering properties of shoal material in Charleston Harbor
Se- give., in Table A3. 5 5 As shown in Figure A4, the dry unit weight of
shoal material in Charleston Harbor ranges from almost zero at the sur-
face to about 20 pcf at a depth of 6 ft, 5 5 but most of the increase in
density occurred in the upper 2 ft. Figure A5 shows the increase in
dry unit weight of shoal material with an increase in sand content. 5 5
The Atterberg limits are plotted on the plasticity plot (Figure 28 in
main text), and plot close to Casagrande's A-line. About one-third of
the test values had water contents about at or below the liquid limit
(LL), one-third had water contents of about 1.5 LL, and one-third hadwater contents about twice the LL.
Marcus Hook, Delaware River
5. Table Ah gives engineering properties of Marcus Hook shoalmateialin te Dlawae Rver56
material in the Del-aware River. All except one specimen had water
contents about 1.2 LL. Atterberg LL and plastic limits (PL) are plotted
in Figure 28 in main text and fall close to Casagrande's A-line.
San Francisco Bay
6. Engineering properties of shoal material from San Francisco
Bay are given in Table A5.57 The water contents average about 1.4 LL.
Atterberg limits are plotted in Figure 28 in main text, and fall close
to and slightly above the A-line.
York Rivor, Va.
C 7. Faas measured the variation of engineering properties with
depth for bottom sediments in the York River, Va. (Table A6). The li-
quidity index (LI) was about 1.5 to 1.6, with one value of 1.1 at a
depth of about 1.5 ft. The ratio of' water content to the LL was about
1.4, except for one value of 1.0 at a depth of about 1.5 ft. The Atter-
berg limit plot was appreciably above the A-line, but well below the
U-line or upper limit of credible test values (Figure 28 in main text).
A5
I A
A \r~rr. ~~A ~ w >yt* ~~~~s.n,. r -~-

26 -_ _
22
20 0 .. 0l-6-d --- -0 - 0---- •
0 0 0Is
16 L' 0, "0
U-6
> 14- -- _ _ _ _
L 12 ___
10
SYMBOL LOCATION POINT
8 2SHIPYARD RIVER 1X SHIPYARD RIVER 20 SHiPYARD RIVER 3
60c SHOAL 7 3 __
DEPTH BELOW. TOP OF SHOAL, FT
NOTE; LESS THAN 3 PER-ENT OF THE SHOALMATERIAL RETAINED ON 200- MESH SIEVE,
Figu-e A4. Dry density versus depth below top of shoal material
ill Charlestonl darbor, South Carolina (from U. S. Army EngineerDistrict, CharLestoPH55
iýA
i - . ... , I ' ,'- i 'I•u• • ,•- ,-. .- .•;..• : •• ., • •• . . .. • ."•- '

100.-. .
s" o ----- 0 .0 ,
600
I
tn 60
N 70 ,,, - -- -
Z
n0
o 00
W
Z •
W 403 50
W
z2
I- 0 e AiiJ 40 ---...
.JS30 : •
0 1 2 30 40_ 50 0 70 so so 10
I'- 20 __ _
0. 10 .-l- ii. ±. ___...._
10 "*","
0 10 20 30 40 50 60 70 80O• 90 100
DRY DENSITY. PCF
Figure P5. Sand content versus dry density of shoal material inCharleston Harbor, South Carolina (from U. S. Army Engineer
District, Charleston5 5 )
CE studies
8. A study to determine the classification and engineering prop-
erties of soils to be dredged is being conducted at the U. S. Army Engi-
neer Waterways Experiment Station (WES). 5 9 Figures A6 and A7 show the
type of material j.nd USCS classification from remoided samples taken
from various locations in the United States. Figure A8 summarizes par-
ticle size, Atterberg limits, and organic content for remolded samples.
Laboratory tests are in progress at WES to determine the specific
AA7

~~"~~ONC No~~I'
a.II
>- 1 ý
-J II
Su U)
-J
4-)
F-j
U)UAL
SIL
A -A~, ~~ l)- 0A

4-)
< ~41
+)
0,0
4.)
J.-
CH
LjL

'0 0' ON 0f0
'.1.Z1 u-' OtOt- 0 2 NN? U4 ~I n 0( - '-I 0I
I HH
"51 C'. Hz (I D H1 ON, (7,c
4 0 i cm cu tC
13 I, N I- ON I - H 1
41 (o
ON >4 tt 4 04w
0-
41 "1
-PIs-
1440,
16 r)0s-ac \1f
4144 044H 4 H 'I-%d
2~~1 8 8* H
O~V 0 o 11 1
o
* o 1b 'o n P 0 0 on100

gravity compaction characteristics, shear strength, and consolidation
characteristics for these soil samples. These soil properties apply to
possible use of dredged material as sources of borrow.
Sedimentation of Dredged Material
Effect of type of dredge
9. The dry unit weight of dredged material is dependent upon the
type of dredge employed. As shown in Table A7 for dredge types commonly
used in maintenance dredging, the density of the slurry following hy-
draulic dredging is about 1200 g/. 61,62 As shown in Table AS, a slurry
density of 1200 g/Z corresponds to a dry unit weight of about 20 pcf.
Volume-density-water content relationships for materials having specific
gravities of 2.50 and 2.70 are shown in Figure A9,
Sedimentation of hopper loads
10. In 1967, the Philadelphia District investigated sedimentation
in the hoppers of a hopper dredge used in maintenance dredging in the63
Delaware River. Undisturbed samples of dredged material were taken
at hourly intervals over a period of 8 to 10 hr from different depths
in the hopper bin to determine the density of the dredged material
slurry. Significant amounts of free water were released over the 8- to
10-hr test duration. The ratio of average density of dredged material
in the hopper bin (1096 g/i) to the average in situ shoal density
(1288 g/k) was 0.85. 1Percent dry solids 1entering confined disposal area
11. The percent dry solids entering confined disposal areas is
related to the pipeline pumping system. As shown in Figure A10, the
4 percent dry solids is related to the pump speed. Similar relationships
could be developed for pump size, diameter and length of' discharge line,
and transport velocity. Once dredged material enters a confined dis-
posal area, entrance and exit effects generally result in nonuniform
deposition of material over the entire area and varying soil
properties.6
All
/A

I 1k.000 LEGENO
10,000 - 0 = 2,50 1. 000]
a =2.70
1.0 \.0 1,000 POROSITY __0,0O_
SA TURA TED UNIT WEIGH'IT
A U
U
00. < 1.0 Z 100 0 2- 100
m W 0 .
LL-I o ]•';-. -o Io0.10.1 (1. Z0
o100
00 F0
• •PERCENT DRY SOLIDS
4 -'4
rI I I
¶•i 006. 1031. 1084 1 429 2J00,.
DENSITY OF SLURRY,, gi/L ORa a 2,.5
Figure A9. Voiumue-denaity-water content relationships
A12

OF
30
0
0
n-
10
175 200 225 250 275 300
PUMP SPEED, RPM
Figure AO0. Percent solids versus pump speed for MississippiRiver Gulf Outlet dredged material 6 4
Sedimentation of clays in natureS65
12ý Skempton has studied sedimentation and consolidation of
clays in nature. Table A9 shows rates of deposition for several types65,66
of clay deposits. 6 Figure All shows the relationships between
water content and LL for seabed and tidal flat deposits. The largge
Al3

r/
I ST. ANDREWS BAY /
OJ OLSOFJORD 85
200 - 4e A -33
SAVONMOUTH /
(3 GOSPORT - _rtU( DA-31
W) ~G B-a?S15 80
F jSTANPIT SEABED
x L!= 1.75
z I
z 0o 100 a:
U _
WL 70
/I T DAL FLATSw NV LI = 1.0 60050 L,4"• "W = 1.61 LL - 71
/ ' W =1.5"LL 20
0 so 100 150
LIQUID LIMIT
Figure All. Water content w versus Lb for seabed and tidalflat deposits (according to Skempton,' 5 courtesy of Geological
Society, Burlington hous-e)
difference in water contents between these depositional environments
appears significant. The relationship given by Skempton between void
"ratio (or water content) and depth (or effective overburden pressure)
for normally consolidated clays is shown in Figure A12. A similar re-
lationship between LI and depth (or effective overburden pressure) iI
given in Figure A13 (on which has been added the equation for the dotte6
line shown). According to these data, water contents of dredged mate-
rial placed in disposal areas should be expected to be at or above the
LL, generally about 1.2 to 1.3 times the LL, decrea;sing to about the LL
at a depth of 10 ft.
A114
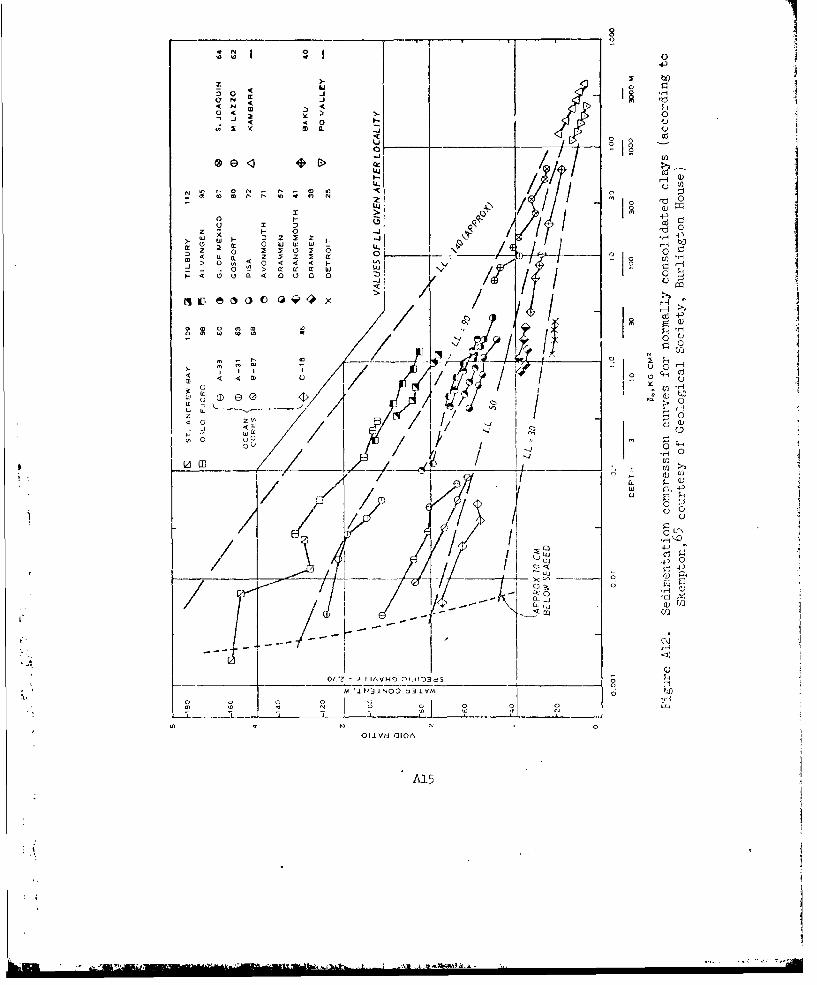
-K N -j
o00
a) o r, N m
U ____-____l- 0- _ _ _4
z 0 0 / 7, a :2 3mZ I i
2 0 4 0 0 0 1
m 0 al
to _/ ~ 71,
Oit c
* J 40. I) /D /I10 '1 /
CWD H
r ~ J U
to q42
.Pf
0l C?0 A tH H0
!D ,/1 -
OF~ d 14CI
- '~ U]0
A15

LI = 0.62 - 0.42 LOG Po; ýo IN KG/CM2
ORLI = 2,01 - 0.42 LOG Po; PO IN PSF2,00 -<
1.75 o 0_
1.50
i 1,25 -- -
-J
x 1.00 - - - L
C 0.75 -0 • •_•
t 0.50 x
00OF 0.25
0.00 -"-," "P L
-0.25 -- • "
-0.50 -
0.001 0.01 0.1 1.0 10 30 100
DEPTH 3 10 30 100 300 1000 3000 M
"ý0,KG/CM2
Figure Ala. Relationship between LI and effective overburdenpressure .• for normally consolidated clay (according toSkempton,b) courtesy of Geological Society, Burlington House)
Effect of environmentalfactors on sedimentation
13. The settling velocity of dredged material is influenced by
environmental factors such as salinity, temperature, and turbulence.67-69
The influence of salinity on the settling velocity of clay minerals is
given in Table AO0.'(0 The settling velocLty of montmorillonite clay
increases with an increase in salinit'y up to seawater concentration
(32,5 ppt). For illite and kaolinite clays, maximwum settling velocity
is approached at a salinity of about one-fourth that of seawater
(7.3 ppt). The temperature of the water in the Delaware River at Phil-
adel]phia varies seasonally from 3h to 80 0 F.53 The influence of tempera-
ture on the settling velocity of c ay minerals is shown in Table A0.
A16
A decrease in temperature from 78 to 43 0 F results in a h0-percent de-
crease in settling velocity for the three clay minerals tested.
14. Turbulent flow increases the probability of particle contacts
and thereby accelerates flocculation.64,67 However, an increase in
turbulence beyond some critical value may disrupt the floes and result
in a decrease in settling velocity. Shoaling occurs in estuaries with
maximum current velocities of 3 ft/sec. Between the tidal extremes the
flow velocity in the estuary is less than 1 ft/sec and therefore ideal
for sedimentation.
Effect of clay mineralogy
and concentration on sedimentation
15. The settling velocity of dredged material is influenced by
clay mineralogy, as shown in Table A10. Illite settled about 25 percent
faster than kaolinite and an order of magnitude or more faster than
montmorillonite.
16. The settling velocity of dredged material increased with
sediment concentration up to a certain limit and may then decrease with
increasing concentration.A'71 Figure Ai4 shows the pronounced influ-
ence of sediment concentration on the settling velocity of shoal mate-- 71
rial for Mare Island, San Francisco Bay. The settling veiocities of
mixtures of clay minerals reveal unique effeccs at very low salt con-
centrations or in pure water.67 Dredged material from Mobile Bay set-72
tles rapidly in water with salinity < 1 ppt. As the sediment con-
centration approaches 10 g/t, the settling floes tend to interfere with
one another, there is a decrease in the settling velocity, and a layer
of fluid mud results.
Physicochezmicala; aspects of sedifentfd clays
17. The chemical environment frn which clays are deposited can
influence physical. properties of the clay.1,2,73 When normally con-
solidated clays sedimented in salt water are leached by percolation
of fresh water, the sensitivity (ratio between the peak undrained
strength and the strength when the clay is remo led) will increase. The
salinity of the dredged material, rate of leaching by fresh waler, and
A17

I - I • I l • | I | I • II
MARE ISLAND STRAIT SEDIMENT
0 I 0 g/I SUSPENSION
12 r+ 0.53 q/l SUSPENSION121 & A 0.22 g/I SUSPENSION- a0.12 g/1 SUSPENSION - 0
+ +o
+0 to 0
z 6-
q• 4 -+ +l
z+
2 4 6 a 10 12 14 16 1e 20 22 24
SALINITY, ppt
Figure A-14. Influence of sediment concentration and salinity ofwater on median set6tling velocity (from Kronel)
A possible effect of overconsolidation by desiccation (or other means)
determine the variation of sensitivity with time, but an increase in
sensitivity might not affect the storage capacity of confined disposal
ar'eas. Laboratory tests, shown in Figure A15, indicate that the in situ
compressibility of limestone residual clay is essentially the samewhether sedimlnted in distilled water, in salt water, or in salt water
73that is subsequently leached with fresh water. However, preconsolida-
tion stresses are affected by leaching.
Laboratory sedimentration"studies of diredLged material
18. Mathematical models to predict the storage capacity of con-10,1.3,68
fined disposal areas require laboratory tests on the dredged
material to determine the sedimentation characteristics. The results
of laboratory sedimentation tests on shoal material from Charleston
Harbor are shown in Figure A16. Suspensions containing 50 percent
A18
I I
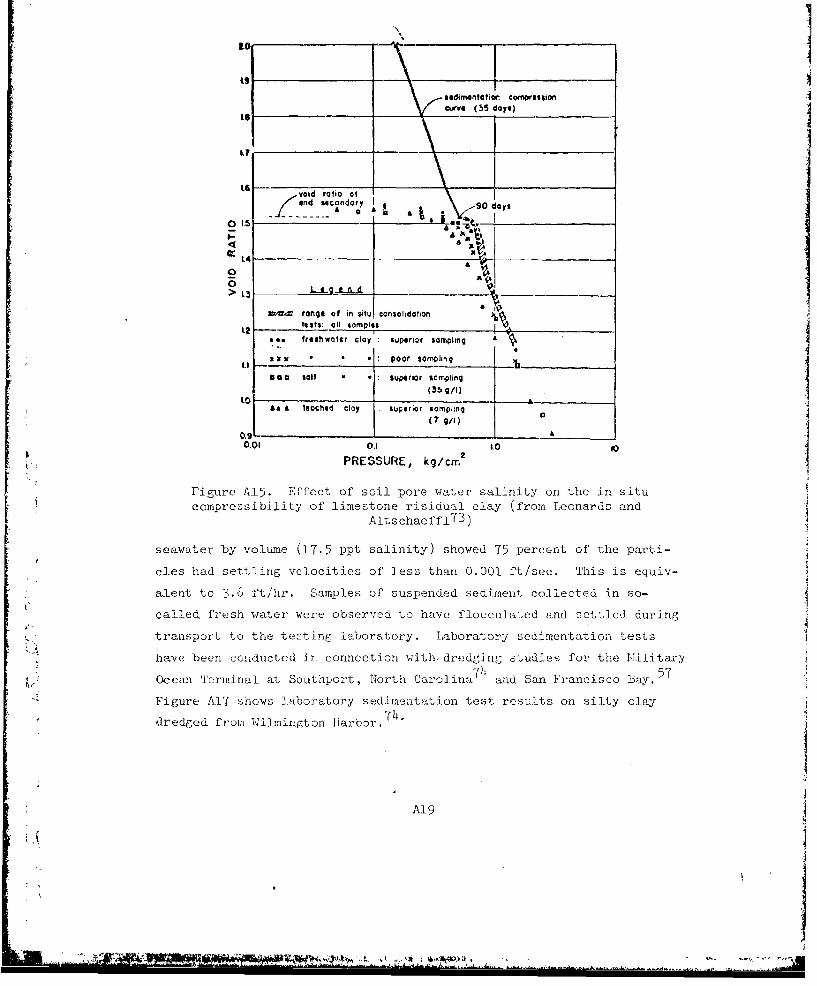
curWve (55 days)
- ~ void rati a'nd siscondoory 90 day
oi2>15
FaQI~ __________
I. ko~ fi t CfoldtwL2 &ets xi tmle I _____
001 01 1
Figure =-C rangFf e of insoil posldtore wae aint6nth nstcompetsbil ts; of l limpestn riiulcaI frmLoad n
seawater byvo reshum e r (17.5 y': salinty) showedn 75 pecn o h p i
alent ~ x to 3.pth. Smls of r suspeindeg eie oletdi o
called~~ frs wate $ere ob uer edrtor haveplouaedadnege drn
have been~& coeAced inclonncto w~ith drmdging tdefothIiitr
Ocean e A1r.irfalea t ouhoft solort e Cai-rol salnt San hera ncic situ
FigurpreYshosibitboratoryestoedimentationtest(reoultsonarsit cand
drege frm i 1migt n arbor, 7'173
sewaerbyvoum 175 ~tsaint) hoed75pecntofthAp194
ce hadstln veoiiso'ls thn001f/e. Ti is qu -

90
so
0 PPT SALINITY
70 70 I
w 0.7 PT SALINITY
60
I-50 ____IJI
O •-3.5 PP T SA LIN)ITY
'Ii
- 3
17.5 Vll'5 PPT SALnITYIii ' ' I !'
o l llIiIiI i -_ _
I I"
100 10 1.0 0.
AVERAGE SETTLING VELOCITY (X 10-4 FT/SEC)
NOTE: MATERIAL FINER THAN 200-MESH SIEVE
CONCENTRATION OF SOLIDS OF THEORDER OF 300 PFM
Aa
Figure A16. Laboratory sedimentation test results for shoal
material from Charleston Harbor, South Carolina (from U. S.Army Engineer District, Cha-heston5 5 )
A20

z 0:
0 Wu 0LI J (r" -
_- 0 W ~ ' < -.--
Ui w
, U0 5. (L 0Jw 0
I--- > F
w -1 0.,U < 0
11 0 w 0 uiLi z ý,w0 I
> >' - > )> D
Hi 0- ,-~l z_ - 0- -HA
V4-
01-
Of --L U
4 -
L00
4-.4- r4zz z~___~r -,0-QO
<. >
Lu- 0 )
0 Z I0
-~~t -r 14 ~ zZ wjO
0~ ~ <
UJ~- -J>j F- DLý- -2 0N L ii I: w-~j~ZE 0IVI NOL fllD
0 LI0

Table Al
Estimated. Salinity of Maintenance Dredgings
in United States (after Boyd. et al.
Region Total* Saline Fresh
Coastal 222.4 208.4 14.0**
Great Lakes 13.5 -- 13.5
Subtotal 235.9 208.4 27.5(88%) (12%)
Interior riverine 62.5 -- 62.5
National total 298.4 208.4 90.0 1
*Million cubic yards of dredged material.
** Assumes half of river channel dredging in coastal districts is infresh water.
rlI
9 '

.--.
-A
I�0 .-.
IiI �.o0404� .4.. .. 4.,
00 0 44 L 4.4494:45 44 44
44 0� � '0.44 ,� 44444 V4-44.4, '1 44 44
0 � 449 494,44.4444
4444 044 I . '4* . '4 .4 444444 444'- 44 44 444,444449
.? .A-,o4 4'j �c. 0 4'
r. 0 � :�-4 v- g .s � .. 44� -
4, � 44 444,4.44-4
- .44444444
4. '44.4.4444 4
o 4'
o t> 44.440 I �
45 * *4 4-4 .44 0� A
4.4 44 4444444 494 5' 44 0 � '4(44.44. .044 0 ,404,444
(-.5 4, 044 .4, 4-� 49.444,4.
4.4- 44 .,.� 0 0.4,44.44
44 4, 4.4444 -,c '.4, 44, 44 44404449
d .44444,. 444444�4.44. '0S� .4 440-44904
.4.44 4. 4-'" 0
�-4' 4'' 44 4--494944A
0 4440>4�
4-4440.049 44
�.444.4 1" 024. " 4' � E
0 49 4-444, 0
.44944 4.4�04. I
o .4.5 44 44.4. 4�4-4, 4-
tIE 4. �44 4, 49444444cr404 4.0
I C
44 44 .449 4,4,49444.4.44 144,
4, 49 4,444444 V 0 4944
04 �-4 4'444 44 14,44
444� -44400
44444 4.444 444
.4 .2-h � .4 00.'49.0.50 49 44 44 14
044,04.44
44490 444.4 �4 4404-4 0 44.4 tO
1� �. .�
�4.04 049P4�40 OCfl'4
4 4(44 44
-444 44-4.
4 44 :'�444-to .404.44 to
4 444�4.. 4444.444 44.4 44490b44-� 049.5440 4444,
4,494,. 4,44 4944.
.44.4,4 *.o,4
44 .,44 4-4444.4.40444,44 494944,4.4 4-4 04�44
4,4 � 494, 49.49 944 .4044944 4*,.�49�44 44 94449.444 .4 4, - 44
4
� -40. � 2!
0,' 44 44 44 4.4� � 2
4904,44-404 4(49 4444 440 -4 044444, 044
49 .4 04.4 4.4404,444� � *,-�0 .444¶44944-44.444 -4 44 .44444 04-4
49 44 ..444 44494444Z4440 4944494944 0>4, 4440 4444 4-4944444
�2 4t� 4-4 4-. -4� 44.4d4.4 494,44.4. 444<4444-44944*
�9Z 0444
0 44 �4,444 4�
444, 44 4,
4 49 4,
-�4'.4.4, 44 44 4�4444 440.40014
40.044 44 49cr ,.'� .4 494'
44 .0 4-4- .44
444444 9 44 0. � �
4,4 o 44�4-44.44444 49
('404,4 49 44 -- 44440-A
III S .5 44 4-44 044.444.40.44
.. 44444,4 49 49 44. 44.44� 04949to
4').4 � 49 � 44.4-, 4444.0444,
44
�4 444444.41.1444
-4 44 444949044
4? 4, 4444 44-4 4449
490 4, 4,-do-i 4
44 44 44��4 �49 4 49
'I�4,44� 4444 4.444.444,49.4-4.444 .4 .4.4-4.44.4 4, .4
44 444440 5 .. 44.44( 44.5494414-449 49
44 -0,444 44.4444)
�,4.4.449('4,.4 to44�4tC-44,444494.
44 49H� 04004 ,.-.4 4 0 4 4
e-.� 4- 44,4
44 000 4449 *6
30 - 0 44 4.('.'4�0.4400 493 04 - 4444.44444 I 0 440 44 4.5 4-44
4 �4fl �(.4 4,�44 4,0449490 4, '0" 44.49.0;I
4,440 4 ��.tŽ�ZA '5'
� 44404 00 444 .8 - � 44,49444,044 44' 4440404 44004 000 .4,44 444444,.5444,444.4444440
q4404Z444�� 040 44 4444,�44440. 0. 4 449-4.4
� �g-t
E 44-4,400.4 44-I 49 49444
' � W4
' � 444,5.44.44 4,4,4.49
2-�4?--. 00.0444
44 4,444-4 49� 4444.2
04.4 44 C4�44 0044
¾U4%
444444 -4�4
4 .--. � d "S
a LV 'z�t -
41
]
1

- .) ~- a - 4) N .4
0 4
to 0 ,4 IN N I
-I )No
04
14 01a,4 0 4 In. 0
4)
o ~ V Oj N ~ '
N) N'4 41 M 4
4.)~ .I M N M
0.U,1

I-C' U V 143b (' -N H N 0 -C'ý 'C
H H H H H H C) H H
a CUN ON C7 H H HN H C) H l (1 H , qH
~~C) ~ C CX Hi .0 a ' -3 (' U C N
t- a 0 (3 UN 4 - ' -4 t-? r'4 H-
U H)
01$0
~~~~~~~C CC(N a U (3 (3 ' n a ' 4 a 'n an an
0 14
m33 1 HCX ('o 0 Y'13 "I N oc 'D H -Dco H t-I t-- an tNC - O-D.tan NO I t-- ND'.D t
20 HV coX. OW H H )
-1 CV - Cý C;; ; ; ; N IH
m 0 0 N 1 4 6 1 C lL"na an i a . c' ('3 (3 T-I cu- a N- In n
HHCXMllI1MH
C'
P 2'

ý:s -~I H I --I . I I C. I O IP V . F, I I .
0
.1 -
0 5- C C-) C3 C-) u)C) U) u~ L)
.1 - ) 4-)ci t- w1 El)
ci 0 C)i Cd
C) N t-N- C r\,D 0 C C', LC,4J0N C rO m~ _:I.-t 0j U-\ 04 H1 VIC
ol
c)N -4 4~ (
Q) rH -4)' --z (\J H4 -- t 1> J -=I fn t-f\ r
Q).P4 I U t-1 (1 n () pj(Y ~ lW 4ý Cd -I
m ~ * -4 -)Q) ON .". (Y\ 04(1 \
Q) CI 0 '1
01
b. H \. aO
IH'-
Hl 00
0) (D 04- Ii) 4-) I~r4*~w *r- I H H 0~ I I '- N 10 I
CO 'A Cd0 CD HQ ~~~~~~~C +3, ~ 4i) c S~I
CD i (Y) (D 0. j*
4-)4Cd rd I

-1) CC H
C) Y~.~C
C) rJ'
4I'
0p
H *
.H lH
0 *+)0 C 0(d LP\ UN\ L\ --t
o b H
PL C
~ H OH
Q) - -Q) - ! ~ C
Q) thq'- .- iH
Q ) '1) -
C)I H
-4-~ 4 H
0*,- ,I r-) I
0 W)
ýD Q)C Cj ol (V
"-4-4-) 4 N (\ H4\,
0dý, Cj cli Cij H-3.0
4-'+)t~C-ICij 0 HAw a) -A H) rd
a C \X )C)
HI
(n

Table A7
Dredged Material Density for Various Dredge Tyrpes
(71romM Mohr6 0)o!I
Dredge Type Dredged Material Density
Dragline on barge Approachbe. in-place density in mudDipper dredge and silt. Approaches dry density incoarser material.
Clam shell or orange peel.bucket d-redge
SEndless chain bucket dredge
Cutterhead dredge Diluted to an average of 1200 g/X.
Dustpan dredge
Hopper: d-redge
Sidecas ing dredge
iI
r; ,"
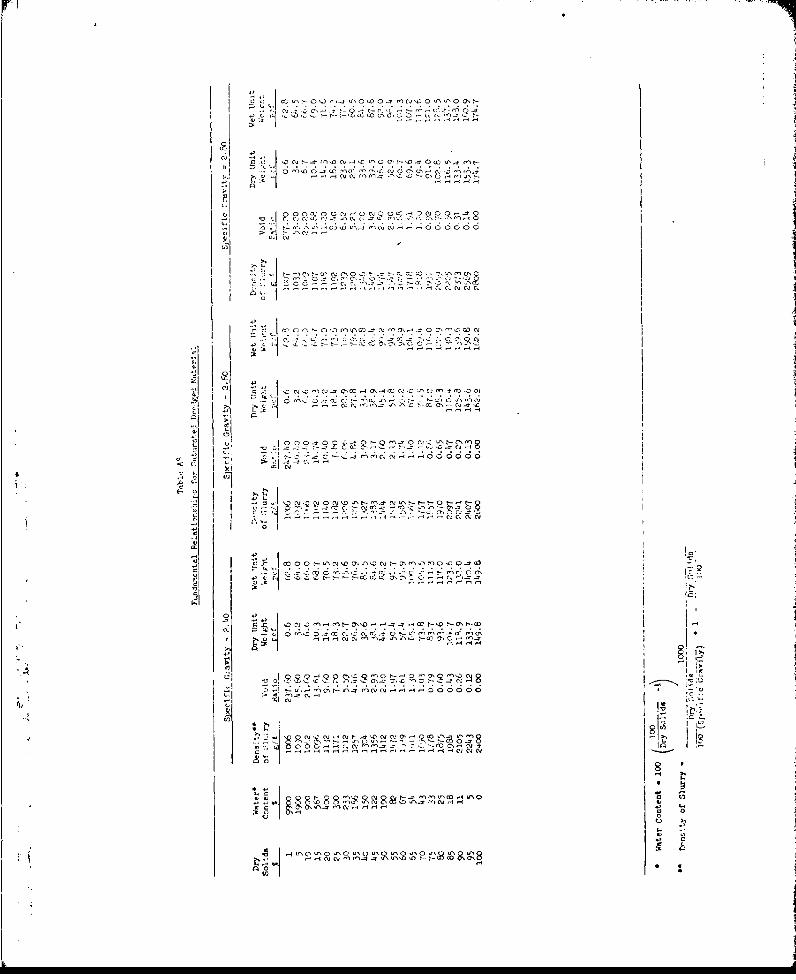
,N N
'C 's(-4 flC 1ý C-'.C 'C0 @ - .O . P.4 . . .
('C Q 0C-O04'A00 Q044 - 00J O. 0 00
'C
a U, C ,: C ý , 1 111 9 C
- - -- --- ,- -- - - '4 C , 0j(4 C.
I .0 0C, I- -
-C ~ ~ ~ ~ c ws- "4C' 640 6- 6N 66 )(C'() 4 '
A' Cj o-'4 C4'- cr- -'0.4.
- - ~ 0. '4. 4' C 0-CC 4 -[4 - to
.4IN C'4l'0.4.''4 00 0
a '-o
0.d I]0(44) ""- 'n N ~-4-4-C t-4 t-~- -'C C >-Cd4. -"~s-C r-
A j (D 0 - '. ' ''- 4C V0
-4 w4 a , ,
Oi o

Table A9
Thickness and Rate of Deposition of Clay Deposits
Lafter Skem-ton, 6 5 courtesy of Geological
Society, Burlington House
Thickness Rate ofof Deposit Deposition
iTpe of Deposit m m/1000 yr
Deltaic
Mississippi 55 120
Rhone 65 17
Orinoco 40 8
Estuarine
Avonmouth 13 2.5
Tilbury -6 2.0
Pisa 10 2.5
Shallow Marine
Oslofjord -- 0.8
P0 Valley 3000 1.0
Kamnbara 2600 0.9
Deep Marine
Caribbean 0.03
L

OlC) 0 0
ID 14'1 -I= N-- CN''' C OO - '0 l Iom
Vt 3 I-t0- c., ON- w ONA In-C Nl CC toa o
0 0 0 a, N- -In0 % lc
co oo.- ,- t-1. ON- -0'-O -O m -C 'n 0040
tc
0
cn -
o tc -0 ,0o Do
"C)mlci Iý Itoý c
-n Cr -1ut '-' 0 ON- ac-ýC) N-C)CO N- CO co~c -
o~W m~ m cc-.4-- - -
04,
I- 0 a i C) - .- 9 ' C . N o
ad a
0
4)) 4
-04 C M Or ON- o-N r-% oOC
U)~ I-
CcEo Go e
C4 4Vt o

APPENDIX B: SUMMARY OF CONVENTIONAL DEWATERING ANDDENSIFICATION METHODS
Dewatering
1. The most common and generally useful methods for soil improve-
ment are dewatering and densification, which are interconnected. De-
watering, or the removal of water from the soil, is a method for soil
improvement which densifies the dewatered soil. In fine-grained soils,which are the main concern of this report, dewatering results in theremoval of part of the pore water and in reduction of pore pressure. It
speeds up consolidation which is accompanied by an increase in strength
and reduction in compressibility.
2. There are several dewatering methods currently in practice.
In order to decide on the appropriate method to t._ used it is necessary
to know:
a. Depth and extent of the formation to be dewatered.
b. Succession and grain-size distribution of each stratum.
c. Average permeability of the soil strata.
d. Groundwater conditions.
3. These data are useful in estinati ig the time necessary for
dewatering and the amount of water to be reisoved, which are major fac-
tors influencing the kind and size of equipment needed.
4. Soils with high or medium permeability are drained by gravity
drainage methods. In these methods the force which produces drainage
is the weight of water. The gravity drainage methods are: pumping from
open sumps, wellpoints, and deep or shallow bored walis and drainage
with horizontal subdrains.
5. It, 3turated fine-grained soils, the lo.- perreability re-
stricts the flow. Therefore, soils with average effective grain size
less than about 0.05 mm, or soils with low permeability, are more
rapidly driý_,ned by vacuumw methods. A vacuum is applied to the filters
surrounding wellpoints or wells. The vacuum increases the force which
produces drainage.
13.1

6. Soils with very low coefficients of permeability may be
stabilized by electro-osmosis. Dewatering of soft, fine-grained soils
with low permeability can also be achieved by consolidation produced by
a load on the soil mass. Vertical sand drains, cardboard wicks, or
plastic drainage wicks are sometimes used to accelerate consolidation.
7. At this time, there is no practical and economical dewatering
technique which can be used in the rapid dewatering of clay-size mate-
rials. Several techniques have been proposed and some are investigated.
Centrifuge densification, vacuum filtration, use of wetting agents,
pressure injection of sand slurry, mechanical aerating, chemical floc-culation, ultrasonic vibration, and evapotranspiration are under
consideration.
Wellpoint systems
8. Conventional wellnoint systems. The wellpoint dewatering
method is the most common dewatering technique used for construction
purposes. A wellpoint system consists of several wellpoints connected
to 2- to 3-in.-diam riser pipes and inserted into the ground at a spac-
ing of 3 to 6 ft, by driving, jetting, or placing in drilled holes.
The upper ends of the riser pipes are attached to a horizontal header
pipe which leads to a combined vacuum-centrifugal pump. Toe groundwater
is drawn by the pump from the surrounding soil inLo the wellpoints and
through the system to the pump, which discharges the water into a dis-
charge line.
9. The wellpoint itself is a 2- to 5-ft-long, 2- to h-in.-diam
perforated pipe covered with a screen. It is constructed with either
closed ends or self-jettig tips. Recently, nonmetal weilpoints have
been used, consisting of polyvinyl plastic pipes with machined slots
which resist corrosion ard require relat.ively little maintenance. They
are more econormical than metal welmoints.
10. In soils finer than clean sands and sandy gravels, a sand
filter is necesoary around the wellpoint to prevent clogging. The max-
imumi deptlh of lowering the water table with one stage of wellpoints is
about 1.8 ft. The main advantage of the method is that several well-
points can be operated by a single pumo.
B2
.. 4

11. Vacuum wellpoint system. A vacuum wellpoint system is simi-
lar to a conventional wellpoint system; the difference is that the well-
point and riser pipe are surrounded with a sand filter sealed at the
top by a plug of bentonite, cement, or clay. In additional to con-
ventional pumping equipment, a vacuum pump is attached to the header
pipe creating a vacuum in the sand filter and helping draw water out of
the surrounding soil.
12. The vacuum system can lower the water table to a depth of
18-25 ft in a single lift, but for these depths, the vacuum induced is
small. The method can be used for dewatering silty fine sands and sandy
silts with a low coefficient of permeability.
13. Eductor wellpoint system. The jet-eductor wellpoint system
consists of a wellpoint above which, in a 4-in.-diam casing, a jet-
eductor pump is located and a4.tached to two riser pipes. The riser
pipes are connected to separate headers, one to supply water under pres-
sure to the eductor ptunp:; and the other for the discharge from the well-
points. The jet-eductor pumps make dewatering possible in a single
stage to a depth of 50-100 ft. The method can be used for dewatering
sands or silty sands and, with proper control, sandy silts. It is use-
ful for large drawdowns where pumping volumes are small.
14. Horizontal ýe'lpointing. A new dewatering method is cur-
rently being used in England. A machine excavates an 0.75-ft-wide and
6- to 20-ft-deep trench, into which a long, 3- to 4-in.-diam perforated
plastic pipe is laid horizontally. At random Intervals the plastic
pipe is cut and connected to an unperforated pipe, which is brought
up to the ground surface and connected to a wellpoint pump. The trench
is then backfilled with the excavated material or with a. granular fill.
The system can be installed economically in a very short time.
Deep yell systems
1.5. Deep wells for dei cering are similar to commercial water
wells. A 6- to 36-in.-diem casing with a length up to 100 ft or more is
installed in a bored hole. The casing is perforated some or all of its
length and provided with a screen. Recently, the traditionally steel
LB

well screen has been made of glass fiber, which has a strength similar
to steel but is inert to corrosion.
16. If the soil is too fine-grained to be filtered by the screen
alone, a gravel-sand filter is placed around the screen. A deep well
piunp is installed near the bottom of each well MaLd attached to a riser
pipe. The riser pipe is connected to a suitable header system through
which the water is discharged.
17. Both the wellpoint and the deep well system may be used in
conjunction with a vacuum system to dewater fine-grained sands and sandy
silts. Deep wells are highly effective for removing large volumes of
water from all types of permeable soils but installation and operational
costs are high.
Subsurface drainage systems
18. Subsurface drains are conduits embedded in a backfill of
filter material laid on the bottom of a trench which collect and dis-
pose of water that occurs below the ground surface.
19. A subsurface drainage system consists of three components:
the filter, the conduit, and the disposal system. Filter materials are
well-graded sand-gravel mixtures with two requirements: they must be
fine enough to prevent infiltration of the soil grains into the drain
and coarse and pervious enough to permit the flow of water into the
drain.
20. The conduit collects water from the filter and carries it to
the disposal system. Conduits can be pipes of metal, clay, plastic, or
fibrous material, or open-jointed tiles. The disposal system removes
the water from the area by gravity or by pumping.
21. Subsurface drainage systems are effective in all types of
permeable soils.
Vertical sand drains
22. Vertical sand drains are used mainly in thick, highly com-.i! pressible deposits of organic soil, silt, or clay. Their purpose is to
accelerate the conoolidation of compressible layers of fine-grained
soils. They provide vertical drainage outlets for water squeezed from
the surrounding soil by the weight of a surcharge load, thereby
B4

increasing the shear strength of the soft soil and decreasing post-
construction settlements to tolerable values.
23. Vertical sai-d drains consist of a series of 6-- to 18-in.-diam
vertical cylindrical columns of free-draining sand, installed at 6- to
15-ft spacings. The upper ends of the sand drains are connected at the
ground surface by a drainage blanket on which a surcharge fill is placed.
The weight of the surcharge fill squeezes water out ctV the underlying
soft soil and causes flow toward the sand drains. The water rises in
the sand drains to the drainage blanket, where it drains away to the
sides of the area occupied by the drains. If the area extent of the
fill is large, collector pipes or ground drains are provided in the
drainage blanket. After the compressible soil- formation has been con-
solidated, the surcharge is removed. If the fine-grained compressible
soil formation overlies a pervious stratum, the drainage can be per-
formed downward into the more permeable stratum, which can be dewatered
with wells or wellpoints.
24. Sand drains are installed by various methods. The displace-
ment method uses a hollow mandrel with a closed bottom plate which is 4
driven into the soil, The mandrel is filled with sand and then with-
drawn while the bottom plate opens. The sand is forced out by air pres-
sure to form a continuous sand column in the ground. The displacement
method of sand drain installation causes disturbance and "smear" in the
fine-grained soil in a zone next to the drain. While disturbance re-
duces the permeability of the disturbed zone, secondary compression
settlements are reduced for small loading increments. Nondisplacement
methods, such as augered holes or jetted holes, are sometimes used to
minimize disturbance but may still cause some smear of the walls of the
holes. Dredged material is fully remolded and any installation method
could be used.
25. The surcharge load has to be applied in stages when the soft
soil is too weak to support the entire load. By overloading the ground,shear failures may occur in the subsoil and the sand drains are likely
to become discontinuous and ineffective. In a new type of vertical
sand drain, sand is placed in jute textile bags which resist shear
SB5
!I

failure of the drain caused by displacements. Stockings, made of woven
polypropylene, can also be filled with sand and used for vertical sand
drains.
26. The design of vertical sand drain systems has developed from
an empirical to a more rational procedure based on theoretical consoli-
dations. The theoretical principles needed in the design are based on
the consolidation theory as applied to radial flow. The following de-
sign data car, be estimated: diameter and spacing of sand dratns;
thickness of drainage blanket; safe rates of load application; height
of surcharge fill necessary to produce a required degree of consolida-
tion; needed time for the completion of the project; and the amount of
settlement to be anticipated.
27. One of the major problems with sand d-rain projects is shear
failure in the unstable subsoil during construction. To ensure against
these failures, stability analyses should be made at various times dur-
ing the construction.
28. Since there are some uncertainties involve'd in the determina-
tion of calculated design data, field control observations are required
during and after construction. By measuring pore pressures and hori-
zontal and vertical displacements, the rate of loading can be controlled
*;. for various heights of fill placement.
29. The improved drainage afforded by .vertical sand drains accel-erates primary consolidation (which is due to pore water extrusion) but
does not affect secondary compression. Settlements due to secondary
compression can be reduced by temporary surcharge loading.
30. Sand drains should not be expected to be of value in highly
organic deposits or peat subsoils, since such materials normally have
* high coefficients of consolidation. The drains are useful beneath large
loaded areas supported by formations consisting of' alternate strata of
* sand and clay, but are not required if the loaded areas are small. Sand
drains are particularly effective in thick, homogeneous clay deposits,
where, because of their low permeability and large drainage paths, con-
solidation without sand drains would be very slow.
31. The installation 0l ertical sand drains is rather expensive;
136
therefore, the designer should first determine if it is necessary to
accelerate consolidation before recommending sand drains. Generally,
6 months to 2 yr is required for consolidation of a soft soil deposit
with sand drains.
32. Cardboard wicks. In Sweden, corrugated, band-shaped cardboard
wicks were tried instead of sand drains with a good result. These have
no capillary action and the use of the term "wicks" to describe them is
probably incorrect. They are driven into the ground by a machine de-
signed for this purpose. The maximum driving depth is 65 ft. Card-
board wicks were used on a large-scale basis in the building of Halmson
Airport near Stockholm in a 23-ft-deep layer of very soft alluvial silt,
underlain by shell sand. Wicks have also been used in the port of
Antwerp, Belgium, and they are also extensively usefd in Japan.
33. Electro-osmatic dewatering. Electro-osmatic or the electrical
drainage method can be highly effective in dewatering fine-gra4ed soils,
such as silts, clayey silts, and fine clayey silty sands. This method
is quite costly because the power requirements are usually high, espe-
cially in saltwater areas. It is mainly used in those countries where
electricity is relatively inexpensive, such as Canada, Norway, and Swit-
zerland. It has been used only on a few occasions in the United States.
Dewatering dredged material
34. One purpose in dewatering dredged material is to increase the
storage capacity of disposal areas by reducing the volume of water in
the slurry. Another purpose is to develop land suitable for cultivation
or building sites.
35. In Holland, a deposit area is prepared and divided into
smaller areas of lagoons. Around the lagoons small dikes and drainage
ditches are built. The slurry is pumped into The lagoons in 5-ft layers.
Each layer is left to drain for approximately 12 months through outlets
cut into the dike. The lagoons are filled and drained in rotation. By
this method a 15-ft-thick layer of dredged material can be drained and
densified.
36. A chemical dewatering technique, the "Panfloc Method," used
in Japan, is based on the transformation of dredged slurry from a
B7

single-grained to an aggregated structure. A coagulant, carboxymethyl
cellulose grafted with acrylic acids (Panfloc X) is added to the
dredged material in the delivery pipe, causing clay and silt particles
to coagulate with sand grains. The coagulated particles then settle
with an increased sedimentation velocity.
37. A method used at the Rotterdam (Holland) Harbor for preparing
drainage ditches in dredged material depots uses a vehicle supported Ilengthwise by two cylinders which enable it to move on the mud surface.
Rotating sl :al cutting edges are mounted along the length of both
cylindeis propelling the vehicle through the mud. The dredged material
is deposited into diked areas in layers about 1 m thick and consolidated
for 2 months. During this time the emerging water is drained into a
canal outside the depot dike. A surface drainage system is then estab-
lished in three stages. During the first stage the vehicle enters the
depot and moves across the mud surface producing ditches in the mud
about 10 cm deep. Two months later, during the second stage, the
ditches are deepened by a set of small disk wheels pulled by the vehicle.
The mud is then left to consolidate for another 2 months. In the third
stage the big disk wheel is pulled by a tractor making ditches about
0.5 to 0.6 m deep and 10 m apart. When the first layer of mud has been
sufficiently drained and consolidated, a new layer is spread out and
the treatment is repeated. With this procedure seven layers can be
deposited, which after drainage and shrinking decrease to a 4-m final
thickness. About a 10-yr period is necessary to consolidate a seven-
layer depot and to change the dredged material from mud to earth.
"38. Besides the above-mentioned dowatering methods, several other
methods are under investigation.
*Dewatering industrial wastes
39. Dewatering of ore tailings-, sewage sludges, and industrial
wastes brings up similar problems which occur in connection with de-
watering dredged material. The study of methods used in dewatering
these materials can help obtain a solution for dewatering dredged mate-
rial and vice versa. There are several dewatering techniques used by
industry, but unfortunately published information on the subject is
surprisingly scarce.B8
-- M

Densification
Vibroflotation
40. Vibroflotation techniques have been used extensively in den-
sifying loose granular materials with good results. Unfortunately, the
method becomes ineffective if the sand contains fines in excess of about
20 percent, with clays not responding to vibration at all.
41. For strengthening cohesive soils, the "stone column" or theI
"vibro-replacement" technique is adapted. The technique may be applied
to any soft or firm cohesive soil. It can be used successfully even in
the treatment of soft organic clays.
42. In the process, vertical holes are formed in the ground by
vibroflotation. The holes are then backfilled with coarse gravel or
crushed stone, and compacted in stages by the vibration and weight of
the vibrofloat. MTe compacted granular columns interact with the
treated soil increasing the average shear strength and reducing the com-
pressibility of cohesive soils. They also act as drains and speed up
consolidation.
Precompression of soils
43. Precompression, also called preloading or surcharging, is an
effective and economical procedure for improving the bearing capacity
of weak, compressible subsoils prior to construction.
44. The method is especially effective on compressible soils in
which consolidation takes place rather rapidly such as soft, fine-
grained. silts and clays, organic deposits, and sanitary landfills. Even
in such soils the available time limits the thickness of the soil layer
to be precompressed to approximately 15 ft. Thinner layers of soils
that consolidate slowly can also be treated, but slowly consolidating
clays of great thickness are not suitable for preloading since the re-
quired loading period to obtain the necessary settleent is long. Ver-
tical drains car be installed to accelerate consolidation, if necessary.
45. Precompression involves placement of a teraporacy surface load
over the area to be loaded by the structure with load generally exceed-
ing the ultimate structural load. This procedure squeezes water out of
3B9
•. h

the soil voids, and when the desired percentage of consolidation is
reached, the load is removed. Due to the effect of precompression, the
consolidation is accelerated, the shear strength of the subsoil in-
creased, and the magnitude of postconstruction settlements reduced.
46. Precompression is most frequently accomplished by placing dead
load in the form of earthfills or water in tanks or ponds over the area
of the future construction. The Elizabeth-Port Authority Marine Termi-
nal on Newark Bay was stabilized by using seawater. The preload was
provided by two reservoirs lined with plastic membranes and filled with
water. One of the advantages of the water surcharge technique is that
water can be placed and removed faster than earthfills.
47. Planning of a precompression project needs detailed subsoil
investigations, laboratory tests, and design analyses. During the place-
ment of the load and during the consolidation period, fild observations
of settlement and pore pressure are required so that modifications can
eventually be made to assure the required result.
48. The precompression method was introduced with the construction
of highway embankments. The method has been extensively used for light
to medium buildings, oil. storage tanks, and highway bridges. However,
its as• is nut •dvisable where local highly concentrated loadings exist.
Compaction with mechanical equipmwent
49. Compaction, or densification with mechanical equiprent, is a
standard method for improving the bearing capacity of natural soil de-
posits or man-made fills. Compaction is effective only in partially
saturated soils; hence, the method is not aipplicabJe for densifying
dredged material and will not be reviewed.
Thermal and Chemi.cal.oi Treatr.e:,t
Thermnal seRtraten
50. One method of improving the physical prop.-erties of soils is
to heat them to suff'iciently higi, t.:mperaturue. 1', thermal treatmenit,
the water content and comprbssibility, of the soil ar-e reduced and its
shear strength arid permeability increased. The the~rmal er-cr-y requlired
B310
BIO
A. .

to develop adequate soil strength depends on the water content and the
mineralogical and chemical composition of the soil. The required energy
varies widely from soil to soil. Thermal treatment is used as a pro-
cedure for stopping slides and plastic flow in clays, for reducing un-
even settlements in soaked loess, and for improving the trafficability
of soils.
51. Thermal treatment of soils by burning fluid or gas fuel in
borings was experimented and applied in the U. S. S. R., Rumania, and
Japan. Since the thermal diffusivity of soil is small, a considerable
duration of combustion is necessary to increase the range of soil
solidification. The effective range of soil strengthening around a
boring at the burning temperature of 4600C, and for burning duration of
10 days, has a diameter of about 20 cm. The resulting final strength
of soil is about 10 or 20 times the initial strength. Surface treatment
has been observed to a depth of about 6 in.
Chemical soil treatment
52. Experience gained in the field of chemical soil treatment may
provide a method of changing the properties of dredged material to allow
better drainage possibilities. In the operation of water supplies,
sewage systems, and in the treatment of papermill wastewater and other
industrial wastes, flocculants are added to suspensions whith, by in-
creasing the electrical attraction between fine-grained particles, tend
to flocculate the particles, making larger particles of smaller ones.
The flocculation of the particles causes a rapid settling rate and a
higher permeability for the settled dredged material.
: I
• 1
.4I
Si

APPENDIX C: ECONOMIC EVALUATIONS
Settlement Under Temporar Surcharge Fill
1. Assume that soils plot on A-line and that initial water
content = liquid limit; i.e., w = LL
22- ..... .. (= 0.733 LL - 14.67
P1 PI = TO(LL - 20) or
0 LL = Pi + 14.67
0 LL 0.733LL
Soils Plotting on A-Line For w° LL e is
LL PL PI G = 2.5 G = 2.7
50 28 22 1.25 1.35100 41 59 2.50 2.70150 55 95 3.75 4.05200 68 132 5.00 5. 0300 95 205 7,50 8.10500 148 352 12.50 13.50
ee w G or w =
So Go0 C0 0 G
a. C from Nishida'sý relationship: C = 0.54 (e - 0.35)
C for Cc/1 + e C for C/i/ + e
LL G 2.5 for G = 2.5 G = 2.7 for G = 2.7
50 0.486 0.216 0.5140 0.230300 1.161 0.332 1. 269 0. 343150 1.836 0.387 1.998 0.396200 2.511 O.1418 2.727 0.1426
300 3.361 0.1 54.185 O.1460500 6.561 0.'1486 7.101 0'1490
C1

b. From NAVFAC DM-7 7*for soils at the LL:
LL C Cfor e 0 C c/1 +e0
50 o.46 o.196100 1.12 0.307150 1.76 0.371
L. From Bishop and Vaughan (Figure 6 in Reference 2):
C /1 + eCC 0
LL -C (Assume G = 2.5)
30 0.18 0.10350 o.36 0.16080 0.63 0.210
140 1.17 0.260
d. From C c 0.01 (LL - 13):
C C C /I + e
LL ~C (Assume G 2.5)
50 0.37 o.164100 0.87 0.249150 1.37 0.288200 1.87 0.312300 2.87 0.338500 4.87 0.361
75 0.62 .0.216
e.From C c 1.3 x10
LL CC C c/1 +e 0for G 2.5
50 0.65 0.2891.00 1.30 0.371
iA150 1.95 o.411200 2.60o 0-433
*Raised numbers refer to similarly numbered items, in the Referencesat the end of the mtain text.
C2

EII
, - NISH|DA G = 2.5. NISHIDA G = 2.7
X NAVFAC CM-?775
0 sISHOP & VAUGHN2
0.4 y FPOM C - 1.3 i-0.
0.3 -
oU 0.2 USE THIS AS CONSERVATIVE (LOW) VALUE FOR
Cc/(? + .o) SINCE ADDITIONAL STORAGE I1 BEING CONSIDERED
0.1 0
0 100 200 300 400 5CO
Settlement: AH H log V ____
o1 +e0 PO
2. Assume that groundwater level at a 2-ft depth and
Ysub 28 pcf. Then assume p.= 266 psf.
AH for Cost/Cu Yd of Cost/Acre of_ sf LL C /1 + e0 H 0 0 2 t Added Storage Disposal Area
100 50 0.16 0.22 $4.55 $ 1,600100 0.25 0.35 2.86
150 0.29 0.40 2.50
200 0.31 0.43 2.38 I
500 50 o.16 0.73 6.85 8,1.00
J.00 0.25 1.15 4.35 f150 0.29 1.33 3.76
200 0.31 1.42 3.52
"1000 50 0.16 1.08 9.26 6,ioo
100 0.25 1.69 5.92 I,150 0.29 1.96 5.10
200 0.31 2.10 4.76 t3. Assume that temporary surcharge fill weighs 100 pcf and. does
not settle below groundwater level. For convenience, assume fill
cost $1/cu yd.
C3
I
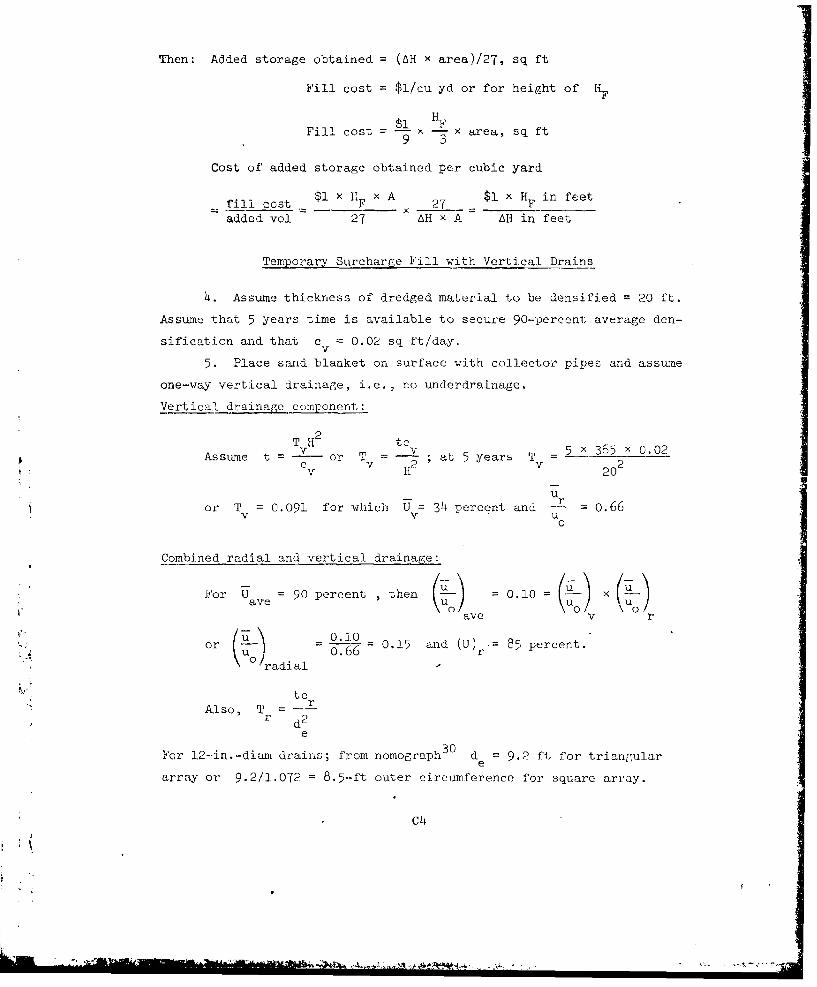
Then: Added storage obtained = (AH x area)/27, sq ft
Fill cost = $1/cu yd or for height of I*
Fill cost = _ × x area, sq ft9 3
Cost of' added storage obtained per cubic yard
fill cost $1 x HF x A 27 $1 x HF in feet
added vol 27 AH x A AH in feet
Temporary Surcharge Fill with Vertical Drains
4. Assume thickness of dredged material to be densified = 20 ft.
Assume that 5 years time is available to secure 90-percent average den-
sification and that c = 0.02 sq ft/day.v
5. Place sand blanket on surface with collector pipes and assume
one-way vertical drainage, i.e., no underdrainage.
Vertical drainage component:
TH 2
Assume t T v a ya 5 x 365 x 0.02Asuet= •or T = ;at 5 years T =-c v v H2 v 202
or T = 0.091 for which U = 34 percent and _ = 0.660
Combined radial and vertical drainag-_e e:
For U = 90 percent , then O.10 (t) xave n\.0
ave v r
or p•.0 - 0.15 and (U) 85 percent.
\j radial
tcAlso, T r
r d 2
e
For 12-in.-diuam drains; from nomograph30 d e 9.2 ft for triangulare
array or 9.2/1.072 8.5-ft outer circumference for square array.
C4
I Y .i. 'LI - -

For 20-ft-long drains costing $1/lin ft, the cost of drains = $i x 20/
8.5 = $0.276 8/sq ft treated area or $12,100/acre treated area.
Sand blankets:
For 1-ft-thick blanket the cost at $1/cu yd ý $1 x 1/27
$0.0370 4 /sq ft = $1 6 00/acre treated area. For collector pipes at
$1200/acre the total cost is:
Vertical drains $12,100/acre
Sand blanket 1, 6 00/acre
Collectors 1,200/acre
Total $1 4 ,900/acre, plus fill
Settlement of 20-,ft-thick layer of dredged material:
CRUST, 97p' H x C P + Ap
9 9. AH i+- e- g
9- 13.5'
Upper layer: po = 28 x 4.5 + 182 = 308 psf
Lower layer: p. = 28 x 13.5 + 182 560 psf
Cc PO + ApAH = 9 x - log
0 p
Calculations in increased Storage Volume____ c 1 AS I AHt
A- c e L Atotal VolumeAp l+e
Zf LL o ft ft ft cu yd/acre
100 50 o.16 0.18 0.10 0.28 45275 0.22 0.24 0.14 0.38 613
100 0.25 0.27 0.16 0.43 694150 0.29 0.32 0.1-9 0.51 823200 0.31 0.34 0.20 0.54 871
500 50 O._j 0.60 0.40 1.00 161375 0.22 0.83 0.55 1.38 2226
100 0.25 0.94 0.62 1.56 2517150 0.29 1.09 0.72 1.81 2920200 0.31 1.17 0.77 194 3130
1000 50 0.16 0.90 0.64 1.54 248575 0.22 1.24 0.88 2.12 3420
100 0.-25 1. 41 1.00 2. 41 3888150 0.29 1.64 1.l6 2.80 451T200 0.31 1.75 1.24 2.99 4824
C5

For:
Ap = 100 psf Fill cost = $ 1,600/acre (1-fL fill)
Vertical drains $12,100/acre
Collectors 1,200/acre
Total $14,900/acre
Ap= 500 psf Fill (sand) = $ 8,100/acre (5-ft fill)
Vertical drains = 12,100/acre
Collectors = 1,200/acre
Total $21,400/acre
Ap= 1000 psf Fill. = $16,100/acre (10-ft fill)
Vertical drains = 12,100/acre
Collectors = 1,200/acre
Total $29,400/acre
Ap Cost of Added Storage1.> LL $/cu yd
100 50 33.0075 24.30
100 21.50150 18.10200 17.10
500 50 13.3075 9.60
i00 8.50150 7.30200 6.80
1000 50 1.1.8075 8.6o100 7.6o1.50 6.50200 6.1o
c6

Water Surchare Load with Underdrainage, SurfaceMembrane, and Collectors
566. New York Port Authority (NYPA) work cost for 63 acres is:
Cost/
Total Cost/Acre f9FtPVC lining and reservoir
filling to 21 ft $625,500 $ 9,929 $0.23
Underdrains 63,900 .,o1h 0.02
Instrumentation 16,500 261 0.01
Total $705,900 $11,204 $0.26
For NYPA work, PVC lining and filling cost $0.2 6 /sq ft. Per discussion
with Dr. Charles E. Staff of Staff Industries, Inc:*
Liner, 10-mil thick $0.06/sq ft delivered
Liner, 20-mil thick $0.11/sq ft delivered
Labor to install $0.025/sq ft delivered
Per Mr. Staff, liner cost would be about $0.14/sq ft for 20-mil
liner or about $6100/acre.
AbovE liners are unreinforced PVC intended for single use.
7. For PVC einforced with nylon scrim fabric with 100-lb tcar
strength, as used in the permanent pond at U. S. Army Engineer Waterways
Experiment Station (WES), the probable cost would be:
Liner $0.30/sq ft
Labor 0.25/sq ft
Equipment 0.15/sq ft
Total $0.70/sq ft (or $30,500/acre,
plus drainage)Using unreinforced PVC liner:
PVC liner with filling $ 9,900/acre
Underdrainage layer 1, 6 00/acre
Collectors 1,200/acre
Total $12,700/acre
* Personal communication, 10 October 1975, Dr. Charles E. Staff, Staff
Industries, Inc.
C7
3\~A)~~awi st- .. '.A .'

Effect of water ponding:
1 ft of water loading = 0.63 ft of soil load
10 ft of water loading = 6.3 ft of soil load
20 ft of water loading = 12,6 ft of soil load
or
1 ft of soil load = 1.59 ft of water load
5 ft of soil load = 7.94 ft of water load
10 ft of soil load = 15.87 ft of water load
(Total cost = $12,700/acre)
DepthWater Added Storage in Cu Yd/Acre Dollars/Cu Yd of Added Storage
Load LL LIft 50 75 100 150 200 50 75 100 150 200
1.6 350 480 560 650 680 36.30 26.50 22.70 19.50 18.70
7.9 i180 1620 1860 2150 2290 10.80 7.80 6.80 5.90 5ý50
15.9 1740 2400 2730 3160 3390 7.30 5.30 4.60 4.00 3.70
Surface Vacuum Mat with Draina e, Layer and Collectors
8. For a vacuum induced in a sand blanket:
Induced VacuumInchesof Hg psi psi'- 1 in. of .Hg = 1.3.33 ft of water
10 4.9 707 = 0.03342 atm
15 7.4 1061 0.4913 Psi
17 8 °4 1203 = 70 ,743 psf
20 9.8 1415
A vacuun of 15 to 20 in. of Hg can be attained. This can be regarded
as equivalent to 1000-1400 psf, approximately. For a 10-ft layer:
C +ApAH=H i +- log _ =p 266 psf
Po
C8

C Ap 1 i000 psf Ap= 1400 psfAH AV AH AV
LL o ft cu yd/acre ft cu yd/acre
50 0.16 0.87 14o4 1.02 1646
75 0.22 1.19 1920 1.40 2259
100 0.25 1.36 2194 1.59 2565
150 0.29 1.57 2533 1.85 2985
200 0.31 1.68 2710 1.98 3194
Assume cost as: 20-mil PVC membrane at $0.14/sq ft = $6100/acre
1-ft saqd blanket = 1613/acre
Collectors = 1200/acre
Construction cost $8913/acre
Assuming that power and equipment costs are $50/day and that one shift
of labor cost = 12 x 8 x 5 = $500/week = $2000/month, say $30,000/year
+ 300 x 50; total = $45,000/year.
9. For a 10-ft thickness with one-way drainage.(see Figure 30 of
main text), assume that pumping is required for 5 years to get 50-percent
consolidation. For 5 years, operating cost is $225,000. Assuming a
1,000- by 3,000-ft disposal area, or 68.87 acres, operating cost is
$3,2 67/acre.
Membrane and collectors $ 8,913/acre
Pumping . 3,267/acre
Total $12,180/acre
AP = 1000 nsf Ap- = 1400 nsfLL AV , cu yd/acre Ccsl'/Cu Yd AV , cu yd/acre Cos'/Cu Yd
50 1404 $8.60 1646 $7.34
75 1920 6.29 2259 5.3'
100 2194 5.51 2565 4.71
150 2533 4.77 2985 4.05
200 2710 4.46 3194 3.78
C9

Underdrainage Densification
IX -•" \'2) ./"-2' CRUST
T WITHOUT2.UNDERDRAINAGE \4 CRUS\T
26 ~EFFECTIVE STRESSES, PSF
WITH UNDERDRAINAGE 10,
Sp"A = AI06
k-SAND LAYER --.-
Case 1: Groundwater level at base of dredged material. No suction in
pore water in dredged material.
Case 2: Same, with suction.
10. Compute sett1ements and costs corresponding to the incre-
mental benefits of suddenly turning on the underdrainage system after a
crust had formed.
Case 1: p 266 psf P + Ap = h55 psf, neglect crust settlement
Case 2: P = 266 psf PC + AP = 770 psf
C
+ce Case 1 Case 2LL e0 AH ft Cu yd/acre Ali ,ft Cu y/acre
50 0.16 0.37 597 Q.74 1192
-1; 0.22 0.51 823 1.02 1638
100 0.25 0.58 936 1.15 1861
1.50 0.29 o.68 1097 1.34 216o
200 031 0.72 1162 1.43 2308
11. Cost of obtaining underdrainage varies witi' conditions, but
V, a collector pipe system on top of the foundation is probably the minimuml
possible that, will be required to avoid building up high pore pressures
in a natural sand foundation. In this case, assume collector cost as
$1200/acre.
12. If a sand blanket must be provided, assumre sand is available
ClO
4 {'

at $1/cu yd by dredging deeper, and use collector pipe system
Sand = $1613/acre
Collectors 1200/acre
Total =$2813/acre
Cost/Cu Yd of Added Storag -
Case 1 Case 2Collectors Sand Blanket Collectors Sand Blanket
LL Only and Collectors Only and Col.ectors
50 $2.01 $4.71 $1.01 $2.36
75 1.46 3.42 0.73 1.72100 i1.28 3,01 o.64 1. 51
150 1.09 2.56 0. 56 1.30
200 1.03 2.42 0. 52 1.22
Underlying Drainage Layer with Vacuum Pumps
13. See Figure 36 of main teyt for conditions assumed--compute
benefits assuming that crust has formed to 2 ft, P = 266 psf,
S+ Ap 2210 psf, and H =10 ft.0 0
C
+LAH AVLL o ft cu yd/acre
50 0.16 1.47 2374
75 0.22 2.02 3264
100 0.25 2.30 3709150 0.29 2.67 4302
200 0.31 2.85 4599
P__npinm equired:It is difficult to describe what is'average." As an extreme case, a3suneseepage entrance face at perimeter of
L B-disposal area with sand at surface.
5
10PSI VACUUM2 NATURAL (OR 10' SAND LAYER I.ARTIFICIAL) BLANKET-- IN FOLINOATION IN SAND
SPUM PED WELLS
03.1
- AC].

kbk14. Effective length of blaoket is 1/a tanh (aL) ,where
a=
L length of blanket, approximately `00 ft.
Take k b/kf = 1/10 , ' a = il/lO x 10 x 2 0.0707107
tanh (aL) = tanh 21.213 = 1.00
effective length = 1.4.i4 ft
q = k iA = k (10/].4.] 10 per foot of perimeterf f
For kf = 0.01 fpm, q = 0, 0 lO0/14.1 = 0.07092 cfm/ft
or q = 0.53 gpm/ft
For a disposal area 1000 ft x 3000 ft, Q = 4240 gpm. In addition,
flow would be increased by water draining from dredged material as it
consolidates. Assume
AH = 2 ft in I year -
= 2 ft x 1000 ft X 3000 ft cf = 85 gpm365 x 1440 = 11.42
and
Q= 4325 gupi toluu.l flow.
15. Assume three 100-hp pumps would be used. For electric pumps,
approximately 63 kw at $0.02/kwhr = $1.26/hr:
3 pumps = 3 x 1.26 x 24 = $90.72/day power cost
Assume automatic pumps with one man on day shift only:
Labor at $15/hr including overhead and profit $120/day.
Equipment - $30,000/year.
For a i-year period:
Power: 365 days at $90.72 = 33100/year
Labor: 120 x 5 x 52 31,200/year
Equipment rental 30,000/year
Total = $100,000/year•00oo x 143,560
or cost,"acre =.. .6 $i,452/year.1,000 x 3,000
16. For a 10-ft-thick layer and c 0.01 sq ft/day,vC1
C12 • :

!= 50 percent in 5 years (see Figure 30 of main text).
a. For no underdrainage sand layer, cost = $14 50/acre/year.
b. With 1-ft-thick underdrainage sand layer and collectorpipes, cost is:
Sand at $1/cu yd = $ 1,613/acre
Collectors = 1,200/acre
Pumping (5 x 1,450) = 7,250/acre
Total. = $10,063/acre
Cost/Cu Yd for 5-year Pumpin_A' 50% x AV Pumping with Sand
LL cu yd/acre cu yd/acre Pumping Only and Collectors
50 2374 1187 $6.11 $8.4875 3264 1632 4.40 6.17100 3709 1854 3.91 5.43150 4302 2151 3.37 4.68200 4599 2299 3.15 4.38
If consolidation proceeded more rapidly, volume of storage would be in-
creased and cost per cubic yard might be dec:eased--possibly by 100 and
50 percent, respectively.
Water Surchare Load with U..devd...ia"e- -... Membrane
17. Settlement induced by seepage aboye that induced by initial
desiccation and consolidation
CH = H log p
l+eo p000
where H 8 ft; 2-ft crust incompressibleC 50% × AV Cost/Cu Yd
,'AH 6V in 5 Years Initial Fill
LL o ft cu yd/acre cu yd at $100/Acre
4" 50 0.16 0.756 1219 610 $0.1675 0.22 2,039 1676 838 0.12100 0.25 1..l81 1905 952 0.10150 0.29 1.370 2210 1105 0.09200 0.31 1.464 2362 1181 0.08
C13

a_ Pumping required: For 1-ft settlement per year and1000-ft by 3000-ft area
1 ft x 1000 ft x 3000 ftAq = 365 x 1440 = 5.71 efm
or Aq = 42.7 gpm, but this would not berequired to maintain H at 10 ft.w
b. Seepage: Q = kiA = I x 10-7 x 2 x 1,000 x 3,000 = 0.60 cnmor Q = 4.5 gpm or 6,463 g/day or 194,000 g/month.
c. Evaporation: Evaporation will equal yearly rainfall inareas where dredging is done.
d. Initial filling: Assume filling in I month,
10 ft x 3000 ft x 1000 ft30 days x 1440 = 2272 cfm - 17,000 gpm
To lift water a total of 20 ft:
(Work done =,10 ft x 3000 ft 1000 ft. x 20 ft x 63 pcf)
quantity
ft-lb
x 3.77 x 10-7 = 1002 kwhr
Labor = 8 hr at $15= $120/day; 1000 ft x 3000 ft=.68.87 acres. Approximately $,3000 total cost to f;ll.
$3000 _Cost/acre = 8-.8 $4 3./acre
Assume $100/acre to fill with water (see tabulationabove for cost/cu yd of storage obtained). Note that thepresence of intermediate drying crusts would decreaseconsolidation of material above crust and increase thatof material below crust. Also note that underdrainageis assumed,
18. If natural effective underdrainage does not exist, cost would
be increased by:
1-ft sand blanket at $1/cu yd $1 6 33/acreCollectors = 1200/acre
Total $2 8 33/ac..e
For this case, costs are:
C14
J ;

Cost/Cu Ydof Added Storage
100% AV LL w/100% Wv
1220 50 $2.321680 75 1.691900 100 1.1492210 150 1.28236o 200 1.20
Desiccation
19. Volume decrease that occurs from desiccition can be related
to effective stresses induced. From data given by Bishop and Vaughan, 2
it appears that drying depths from field observations are:
Depth Timeft Year
0.1 0.070.5 0.51.2 3.02.4 7.0
20. For surface suction of one atmosphere, depth d5, to which
suction has increased to 0.50 atm in time t is:
d5 -- 0.99/c-td50 oqvý,,
or 1.02 d2" " 50
cv
for c v 0.02 sq ft/day
d 50 t*
ft Year
0.5 0.031.0 0.141.5 0.31.2.0 0.562.5 0.873.0 1.26
1 1-3 ft/year mightbe practicable.
21. From Figure 29 of the main text, potential volume increases
cl15
* ~* . . .4. .-.

for the initial volumre corresponding to percent w = 2 x LL .
T- from w% =2 x LL to LL, %o 50 100 150. 200
LL 36 42 44 46
PL 52 66 72 76
LL to PL 16 24 28 30
22. For 10 ft of dredged material, added storage volume for dry-
ing from LL to P1 will be:
LL
50 100 150 200
Added storagecu yd/acre 2580 3870 4520 4640
Assuming that this will require three men for 1 month/year for 10 years,
labor cost would be $15/hr including overhead.
3 x 22 x 8 x 15 = $7,920/year x 10 = $79,200
For a disposal area of 1000 ft x 3000 ft or 68.9 acres,
total cost = $1150/acre
then:
LL
_5 100 150 200
Cost/cu yd foradditional storage $0.45 $0.30 $0.25 $0.24
Note that these costs do not include equipment costs. Increase by
$30,000/$79,200 or 37.9 percent for equipment. Then total cost is
$1,610/acre and
50 100 150 200
Cost/cu yd for
additional storage $0.62 $0.42 $0.36 $0.33
CA
L l

Raising Dikes to Obtain Added Storage--Uo Treatment
23. For raising dikes:
5'
o 2-V : -H + 5 - -4/ H +8 + IH H
+52 27 54 54
AV =16H + 8AH 4 10 x AH = 16H(AH) + 8A-H + 10 AH
2 27 54
AV _ 16H(AH) + 8A-1 + 10(AH)V - .
o 8H + 1011
AV per foot for: H , tV/fto AH ,ft cu yd/ft
10 0.5 1.661
1.0 3.30
1.5 5.o62.0 6.89
2.5 8.8o
3.0 10.78
24. For a 1000- to 3000-ft disposal area:
AV = 8000 x AV/ft
L _AV 8000 x AV/ft
area 68.87 acres
C17
4:'

AV of Dikescu yd/acre
AH , ft Disposal Area
0.5 187
1.0 383
L,5 588
2.0 800
2.5 1022
3.0 1252
Added storage voltueobtained by raising dikes
AV of DredgedMaterial
AH ft cu yd/acre
0.5 do6
1.0 1613
1.5 -2420
2.0 3226
2.5 4033
3.0 4839
Cost of added storage assumning dike cost of $1.00 per cu yd:
Cost of Added StorageAH , ft per acre per cu yd
0.5 $ -87 $0.23
1.0 383 0.24
1.5 588 0.24
2.0 800 0.25
"2.5 1022 0.25
"3.0 1252 0.26
C18

APPENDIX D: NOTATION
A Area of disposal area
B Base width of disposal area
c Coefficient of consolidationv
C Compression indexc
C Uniformity coefficientud Depth
d Effective diameter of area tributary to sand draine
D Effective particle size10e Void ratio
e Initial void ratio0G Specific gravity
Ht Thickness of dredged material; length of one-way drainage path;initial height of levee
H Height of temporary fill
H Initial thickness0
H Height of water
i Hydraulic gradient
k Coefficient of permeability
kb Coefficient of permeability of blanket
kf Coefficient of permeability of sand layer
L Length of disposal area
LI Liquidity index
LL Liquid limit
SEffective stress
P Initial effective strcss• -0
PI Plasticity index
PL Plastic limit
q Discharge per unit time per unit length of perimeter
Q Discharge per unit time
t Time
T Time factor for radial drainager
T Time factorV
Dl

U Average excess pore water pressure
U Initial excess pore water pressure0
'q Average excess pore water pressure in vertical drainage onlyv
U Percent consolidation
U Average percent consolidation for vertical drainage onlyv
V Original volumeo
V Average percent consolidation in vertical drainage and verticalconsolidation
w Water content
w Initial water content0
Zb Thickness of blanket
Zf Thickness of sand layer
Ysub Submerged unit weight
Ae Change in void ratio
Ap Increase in effective stress
Aw Decrease in water content
AH Decrease in dredged material thickness
AHl Lower layer change in thickness
AHU Upper layer change in thickness
AV Decrease in volume
•.D
D2

In accordance with ER 70-2-3, paragraph 6c(1)(b),dated 15 February 1973, a facsimile catalog cardin Library of CongZess format is reproduced below.
Johnson, Stanley JState-of-the-art applicabiliry of conventional densification
techniques to increase disposal area storage capacity, byStanley J. Johnson, Robert W. Cunny, Edward B. Perry, [AndjLeslie Devay. Vicksburg, U. S. Army Engineer Waterways Ex-periment Station, 1977.I v. (various pagings) illus. 27 cm. (U. S. Waterways
Experiment Station. Technical report D-//-4)Prepared for Office, Chief of Engineers, U. S. Army, Wash-
ington, D. C.; monitored by Environmental Effects Laboratory,U. S. Army Engineer Waterways Experiment Station, Vicksburg,Miss., under DMRP Work Unit No. 5A03.
App. A, B, and C on microfiche at end of text.Includes bibliography.1. Densification. 2. Dewatering. 3. Dredged material dis-
posal. 4. Soil stabilization. 5. Waste disposal sites.I. Cunny, Robert W., joint author. Ii. Devay, Leslie, jointauthor. Ill. Perry, Edward Belk, joint author. IV. U. S.Army. Corps of Engineers. (Series: U. S. Waterways Ex-periment Station, Vicksburg, Miss. Technical report D-77-4)TA7.W34 no.D-77-4
I.j.