state of the art coter and challenges ahead for
TRANSCRIPT

Commission for Territorial Cohesion Policy
and EU Budget
State of the artand challenges ahead for
Territorial Impact Assessments
COTE
R

© European Union, 2020 Partial reproduction is permitted, provided that the source is explicitly mentioned. More information on the European Union and the Committee of the Regions is available online at http://www.europa.eu and http://www.cor.europa.eu respectively. Catalogue number: QG-04-19-758-EN-N; ISBN: 978-92-895-1031-8; doi:10.2863/797486

This file note was written by Roland Gaugitsch, Erich Dallhammer,
Chien-Hui Hsiung (ÖIR), Frank Holstein, Flavio Besana,
Sabine Zillmer (Spatial Foresight), Dubravka Kruljac and
Andreu Ulied (Mrcit)
It does not represent the official views of the European Committee
of the Regions.
It does not represent the official views of the Committee of the Regions.

Table of contents
Executive Summary ............................................................................................... I
Advantages and limitation of key EU TIA methodologies ................................ I
Lessons from other TIA methodologies ........................................................... II
Obstacles and opportunities to further develop TIA ....................................... III
1 Understanding of Territorial Impact Assessments ........................................ 1
2 Review of key EU TIA methodologies ......................................................... 3
3 Lessons from other TIA methodologies ........................................................ 7
3.1 Advantages and limitation of other TIA methodologies ......................... 7
3.2 Alternative possibilities to assess territorial impacts ............................ 11
4 Main obstacles to further develop TIA ....................................................... 17
4.1 Technical limitations ............................................................................. 17
4.2 Awareness .............................................................................................. 18
4.3 Limitations of the policy process .......................................................... 19
5 Main opportunities to further develop TIA ................................................. 21
5.1 Further integration of approaches .......................................................... 21
5.2 New data possibilities ............................................................................ 22
5.2.1 Further integration of statistical and geospatial information ......... 22
5.2.2 Big data and unofficial statistics ..................................................... 24
5.3 Awareness-raising and alignment with policy processes ...................... 25
5.3.1 TIA in the Better Regulation Guidelines and toolbox .................... 25
5.3.2 Seeking alignment with new policy processes ............................... 26
5.3.3 TIA platform and guidebook .......................................................... 27
Literature ............................................................................................................. 29
Annex 1 - Factsheets of selected TIA methodologies ......................................... 33 QUICK Check ..................................................................................................................... 33 RHOMOLO ......................................................................................................................... 34 LUISA ................................................................................................................................. 36 ESPON TEQUILA .............................................................................................................. 37 ESPON EATIA.................................................................................................................... 38 TARGET_TIA ..................................................................................................................... 40 ESPON TIA-CBC................................................................................................................ 41
Annex 2 CBA categories .......................................................................................................... 43

I
Executive Summary
Legislations, policies and directives have different effects on territories,
depending on their history, culture and socio-economic, demographic, geographic
and environmental characteristics. Territorial impact assessments (TIA) aim to
better understand these differences and support evidence-based policy and
decision making.
Since the adoption of the European Spatial Planning Document (ESPD) in 1999
and the acknowledgement of Territorial Cohesion as EU objective in the Lisbon
Treaty in 2007 TIA gained more attention. This led to different understandings
and various approaches to TIA.
This file note adopts a broad understanding of TIA. It includes any methodology
designed to assess territorial effects of legislations, policies and directives. This
can be modelling tools using quantitative methodologies as well as rather
qualitative methodologies using expert judgements and participatory approaches.
The file note discusses selected TIA methodologies with the aim to further
develop the assessment approaches. The selected variety shows the main
advantages and limitations of TIA methodologies. This file note reviews the three
main methodologies currently used at EU level (Chapter 2), other TIA
methodologies (Chapter 3) and discusses main obstacles (Chapter 4) and main
opportunities (Chapter 5) to further develop TIA.
Advantages and limitation of key EU TIA tools
The EU level mostly applies the ESPON Quick Check, LUISA, and RHOMOLO
to assess potential territorial impacts of policies and directives. Each tool has
specific characteristics and consequently different scopes of applications.
The ESPON Quick Check provides a user-friendly way to depict the territorial
impact at NUTS 3 levels. It makes use of participatory approaches for expert
inputs and calculations based on quantitative data. This provides a glance of the
potential impact on the EU and beyond in a relatively short timeframe. The
analysis represents a broad overview of several thematic fields for a first review .

II
RHOMOLO is a spatial computable general equilibrium model estimating mainly
economic impacts at NUTS 2 level expressed in changes with respect to a baseline
scenario which can be expressed either in percentage change or in absolute values
(for instance, millions of euros or thousands of persons employed). The model
provides results at the level of the NUTS 2 regions of the EU. The model has a
focus on micro- and macroeconomic foundations. .
LUISA is a modelling platform to assess regional and local impacts of European
policies and trends. The tool develops a baseline scenario until 2050 based on the
assessment of land functions at 100 x 100 m grid level. Grid level data makes the
results applicable to a wide variety of territories, including functional areas and
cross-border regions. The sophisticated modelling approach performed by
researchers can provide spatial analyses on which policy decisions can be
informed especially about general developments. As territorial development
usually is based on local characteristics as e.g. landscape details, zoning plans,
behavioural economics etc. a zooming in to a small region can lead to misleading
interpretations.
Lessons from other TIA tools
Various other TIA tools have been developed at European and national levels. A
selection of these tools has been reviewed in depth to provide lessons to further
develop TIA.
The ESPON programme made considerable contributions to developing TIA
methodologies at European level. The ESPON TEQUILA methodology is one of
the most comprehensive methodologies covering all dimensions and considering
all components of the territorial cohesion concept. Results are based on
quantitative assessments of forecast models performed by external experts and
expert judgements collected via interviews. The comprehensive results of the
TEQUILA methodology limit the methods’ usefulness for policy makers. The
EATIA methodology aims to overcome this challenge by adopting a rather
bottom-up approach using predominantly qualitative inputs from participatory
approaches. The TIA-CBC developed by the ESPON programme is a
methodology designed for cross-border regions’ programmes. The methodology
focuses on desk research and participatory approaches allowing experts to verify
and adapt the findings of the desk research. Compared with TEQUILA, both the
EATIA and the TIA-CBC considerably simplify the assessment and allow policy
makers at national, regional and local levels to be directly involved. They are,
however, less comprehensive and robust than TEQUILA.

III
Outside the ESPON programme, the TARGET_TIA methodology developed by
Eduardo Medeiros is the most developed methodology at European level. While
producing comprehensive results, the processes of the TARGET_TIA are often
considered as lengthy and cumbersome.
Other methods applied at European and national levels to assess territorial impacts
are, for instance, Cost Benefit Analysis, Enriched Environmental Impact
Assessments and territorial foresight approaches. This shows the variety of ways
to assess territorial implication of policies. Moreover, it suggests that elements of
single methodologies may be used or aligned with other methodologies to assess
territorial impacts.
Obstacles and opportunities to further develop TIA
TIA face principally three types of obstacles, namely 1) technical limitations
mostly due to data availability and access, 2) perceptions on the use and
applicability of TIA, such as limited knowledge on TIA added value or a fear of
explicit results, and 3) limitations in the policy process mainly related to the
voluntary character to perform a TIA for EU policy processes.
To address data related obstacles, regional level data can be further integrated and
national statistical offices can further cooperate and harmonise data collection
methods. Policy makers and programme stakeholders can be included to a larger
extent in the impact assessment process, which also addresses awareness related
obstacles. Additional material on TIA and clearer instructions for individual
methodologies could also overcome some obstacles. A verification of territorially
differentiated impacts in the standard impact assessment procedure could
overcome policy process related obstacles.
TIA methodologies can be improved by combining the opportunities of existing
methods, new data possibilities and the alignment with ongoing policy processes.
Existing TIA methodologies can be further integrated and related to each other.
New data possibilities, for instance improving data available at regional and grid
levels as well as big data can positively influence the robustness of results of TIA
in the future. The added value and benefits of TIA can be promoted by seeking
alignment with ongoing policy processes. Such processes provide a momentum
to highlight once more the benefits of TIA.

IV
All opportunities together illustrate that TIA provides valuable insights into
possible territorial implications of policies regardless of the methodology applied.
Addressing unbalancing effects or enhancing effects in favour of territorial
cohesion early in the process supports better policy making. The variety of TIA
methodologies illustrates that this does not necessarily imply making the
processes lengthier or more complicated.
Furthermore, territorial analysis can be important for many types of policy
analysis, for instance, evaluations. Public consultations should also better capture
the local and regional dimension. This may help to address territorial aspects in
the whole policy cycle.

1
1 Understanding of Territorial Impact
Assessments
Since the 1990s there has been a growing interest of policy makers to analyse
territorial impact of Legislations, Policies and Directives (LPDs), specific
seminars (e.g. Amsterdam 2009) were conducted and documents (these include
e.g. the TA20201 or the ESDP2) were published (OIR, AIDICO, 2013). As Fischer
et al. point out: Territorial Impact Assessment (TIA) was “first discussed in the
mid and late 1990s with the European Spatial Development Perspective (ESDP)
(...), calling for TIA to be undertaken in relation to large infrastructure projects
(notably in the field of transport), large-scale water management projects and in
relation to cross-border spatial development” (Fischer et al., 2014: 3).
Impact assessment (IA) in general describes an ex-ante methodology that
“prepares evidence for political decision makers on the advantages and
disadvantages of possible policy options by assessing their potential impact” (EC,
2009:4). This relates to the fact, that even if LPDs have a positive purpose, they
may still have unintended effects on regions and their development. IA aims to
identify processes to propose necessary changes/additions to the policy (Fischer
et al., 2014). As such IA supports decision making processes. Differing from a
classical evaluation, an impact assessment does not judge on a policy’s success in
terms of e.g. potential achievement of set quantitative targets, but rather aims to
identify impacts causally linked to the actions of the policy (EC, 2009 and
ESPON, 2018b). While common methodologies applied in those IAs are set up to
disaggregate impacts thematically, they usually distinguish impacts on the
territorial dimension at country level at best.
Not least because of the territorial cohesion objective added to the Lisbon Treaty,
considering impacts below national level became more important. Territorial
impact assessment (TIA) enriches the IA process by showing such territorial
differentiations of the policies’ impacts (OIR, AIDICO, 2013). In the context of
the EU policy process TIA aims to identify if a policy, regulation or legislation
has “a large asymmetric territorial impact” (EC, 2013: 2). “Territorial impact”
in this context is always related to a specific geographic area and its properties,
defining the susceptibility towards policy actions. In respect of territorial aspects,
TIA often applies a holistic approach and considers the fields of other (thematic)
impact assessments such as economy, environment, society and governance
(ESPON, 2012b). Thus, the assessment relating to the territorial dimension
1 BMU 2007, https://ec.europa.eu/regional_policy/sources/policy/what/territorial-
cohesion/territorial_agenda_leipzig2007.pdf 2 European Commission 1999,
https://ec.europa.eu/regional_policy/sources/docoffic/official/reports/pdf/sum_en.pdf .

2
should limit the risk of “causing an unbalanced territorial or spatial distribution
of costs and benefits for different types of territories” (ESPON 2012b: 7).
With TIA methods striving to cover a wide range of thematic areas and types of
LPDs, one of the main challenges is to include all relevant elements in one
coherent assessment. TIA methodologies need to be flexible and adaptable to a
larger degree, both to the assessed LPD and to the depth of assessments aligned
to the policy makers’ needs. The balance between the soundness and depth of
assessed impacts and the practicability of the approach is challenging under such
circumstances. It requires to take into account time and cost restrictions and
external factors such as data availability (Medeiros 2014: 15).
While in principle any impact assessment method within a specific thematic field
can encompass a territorial dimension, the concept of a dedicated Territorial
Impact Assessment relates to tools and methods with the explicit goal on
providing information on the territorial distribution of impacts for a multitude of
thematic fields. This has led to the development of several such dedicated
methodologies and tools, ranging from quantitative modelling to participative,
stakeholder driven approaches. In many cases, methodologies originate in a
project concerned with a specific policy (e.g. the CAP post 2013) and have
subsequently been further developed to encompass policies or types of policies
on a broader scale (Essig, Kaucic 2017: 2 and Fischer et al., 2014: 4).
While some Member States already apply ex-ante assessments for policies with
explicitly focussing on the territorial dimension, the term “Territorial Impact
Assessment” is mainly linked to the EU level. The explicit territorial cohesion
objective is one of the main drivers for applying TIA. However, TIA provides
more added value and should not be limited to policies with an explicit spatial
dimension. TIA increases awareness that region intrinsic characteristics matter for
policy impacts and are key to create policies fostering the regional potentials and
applying corrective action where needed (Golobic, Marot 2008: 2 and Fischer et
al., 2013: 1). TIA illustrates how different policies interact in the territory. Finally,
it allows to discuss the variety of impacts early in the policy process and to involve
and engage all relevant actors.
Based on these developments the file considers as TIA any methodology designed
to assess territorial effects of legislations, policies and programmes.
The following chapters present several TIA approaches. Chapter 2 focuses on
widely accepted methods applied regularly on the EU level. Chapter 3 presents a
wider number of approaches. These methods do not constitute a complete list but
provide an overview of different types of approaches that have been developed
and tested in order to provide input on future developments. Thereafter, the
remaining chapters take a closer look into obstacles for TIA (Chapter 4) and
further TIA development opportunities (Chapter 5).

3
2 Review of key EU TIA tools
Three tools are most frequently used to assess territorial policy implications at EU
level, namely the TIA Quick Check, RHOMOLO and LUISA. These three
methodologies within the file note serve as basis for comparing other selected
methodologies presented and investigating further TIA development options.
Annex 1 presents additional details about the characteristics of these three
methodologies.
The TIA Quick Check3 is an ex-ante territorial impact assessment method
specifically developed to depict potential effects of a legislation or policy in a
comparably easy way. It serves as discussion basis for further analysis. It is based
on the vulnerability concept that combines qualitative judgements on the effects
caused by a policy (“exposure”4) with quantitative data on the susceptibility of
each region to those effects (“sensitivity”5) to calculate territorial impact patterns
in the fields of economy, environment, society and governance (OIR, AIDICO
2013). The methodology is embedded in an expert workshop setting and aided by
the ESPON TIA Webtool which simplifies which quantitative indicators to select,
to calculate regional impacts and to map the resulting territorial patterns. Maps on
the distribution of impacts are subsequently used to facilitate the expert discussion
on the mechanisms behind the impacts (i.e. the logical link to the policy action),
the needs for adjusting the policy in order to reduce undesired impacts and foster
desired ones, and finally, the need for more in depth research on specific
dimensions when the Quick Check does not allow for sufficient conclusions.
The methodology is easy to apply at comparably low cost in a short timeframe,
which makes it attractive to policy makers. Within the EU policy process, a main
advantage of the TIA Quick Check is that the regulatory scrutiny board recognises
the methodology as suited for ex-ante policy impact assessment improving
acceptance of the results by the relevant authorities. Practical tests on multiple
directives and policies have allowed for a continuous improvement of the
3 https://www.espon.eu/tia-tool-upgrade 4 Exposure defines whether a region is affected by the policy. 5 Sensitivity defines to what extent the territory is affected.

4
method6. In particular the workshop procedure has been subject to numerous
changes, to improve participants’ understanding of the method. This includes, for
example, the introduction of the mathematical and conceptual background of the
Quick Check at the start of each workshop session, the division of work between
two moderators (direct interaction with participants vs. handling of the webtool
and background tasks) and the introduction of a more transparent impact voting
process. Furthermore, the webtool itself has been upgraded several times. This
included new functionalities (e.g. allowing the selection of single typologies of
regions for a more targeted assessment) and the redesign of the user interface and
workshop flow.
One disadvantage of the method is the lack of an in-depth assessment, which
requires other methodologies. The Quick Check, however, can give a first
indication for subsequent more detailed assessments. It is important to keep in
mind, that even though it uses quantitative data as basis for calculating territorial
impacts, the results are exclusively qualitative. At the same time, data input needs
to be of high-quality covering (almost) all regions affected by the policy, thus
creating some limitations in terms of availability. Finally, results of the Quick
Check depend to some extent on the selection of participating experts and the
detail of explanation and understanding of the role and relevance of indicators in
the specific context.
RHOMOLO7 is a so called dynamic “Spatial Computable General Equilibrium
Model” developed by the JRC and DG REGIO with the intention of assessing
impacts of cohesion policy on regional level. By now it is used for broader policy
assessments in several fields, with multiple modules expanding its capabilities
beyond the assessment of purely economic impacts. The model is based on the
decision making of three types of “agents”, namely households, firms and
governments, who earn, spend and save money and who produce and consume
goods. Interlinkages between regions are depicted in the model as flows of goods
and services (trade matrices) and people and investments (factor mobility).
RHOMOLO introduces policies as “shocks” to a baseline scenario, estimating
their influence on key parameters (such as e.g. transportation cost between
regions) and subsequently modelling the policy impacts. The model produces
quantitative impact estimations at NUTS 2 level expressed as relative changes in
relation to the baseline scenario, e.g. an increase in GDP in % per region, which
can also be expressed in absolute values (e.g. millions of euros or thousands of
persons employed).
6 A list of examples is provided in the annex. 7 https://ec.europa.eu/jrc/en/rhomolo

5
Similar to the ESPON TIA Quick Check, RHOMOLO is a well-tested and
established methodology. Being recognised by the Regulatory Scrutiny Board, it
is well suited for impact assessments of EU policies in the ordinary legislative
procedure. RHOMOLO to this day is the only available model tailored to EU
policies that can produced results with a territorial resolution at NUTS 2 level.
The NUTS 2 level can be problematic, nonetheless, if territorial impacts are
compared to other TIA methodologies applying other analytical levels, e.g. in
relation to the urban-rural diversification of impacts. Apart from the capital cities,
in most Member States NUTS 2 regions are rather large and often encompass
highly urbanised as well as rural areas, hampering such a differentiation. The
modelling approach relies to a large extent on classical market theories although
some market imperfections are included in the model. The model has not been
used so far to analyse environmental effects. The modelling approach is complex
and requires an effort in terms of communication of the results and a translation
into the sphere of policy makers.
The LUISA8 Territorial Modelling Platform is an integrated, cross-sectoral model
for “land function” projections going beyond traditional “land cover” models. At
its core, it is a grid-based approach modelling the change in land function for each
grid cell over time based on a number of input factors and subsequently
calculating secondary effects based on the resulting land functions. Projections
for the development of the economy, population, agriculture and energy use from
other calculations feed into a “baseline scenario”. LUISA subsequently allocates
land uses to grid cells. Several constraints (such as e.g. the limitations of land use
possibilities within environmentally protected areas) can be considered as well.
Based on the resulting distribution of land uses, further modules of LUISA are
able to calculate e.g. projections for the accessibility of regions, settlement
structures, sectoral employment etc. To assess specific policy impacts, the input
factors are modified corresponding to the policy (e.g. a policy-induced change in
productivity influences economic projections) and the resulting scenario is
calculated. By comparison of the “baseline scenario” with the “policy scenario”
the potential impacts of the policy can be identified.
8 https://ec.europa.eu/jrc/en/luisa
Input Modelling Output
§ Data for variables in
baseline scenario
§ Numerical values for
model parameters8
§ Estimation of “agents”
behaviour
§ Estimation of inter-
regional interactions8
§ Quantitative impact
values per region
§ 2nd tier effects linked
to economic effects

6
The LUISA model has been applied to EU policy scenarios (e.g. the post 2013
CAP and the ENER-CLIMA reference scenario) and is used to provide inputs to
the periodic EC reporting on economic, social and territorial cohesion. It is a
comparably specialised and integrated approach and is mentioned in the better
regulation toolbox as an ex-ante territorial impact assessment method. It has a
rather long-term perspective and bases projections on several other coherent
models (such as TRANSTOOLS9) respectively projections (such as
EUROPOP10). It can also use inputs produced by RHOMOLO, an integration
effort which the JRC has been undertaken in recent years.
LUISA is currently based upon a rather straightforward top-down approach. This
allows to achieve a harmonised and complete coverage of the whole EU (and
beyond) territories. It includes several assumptions for estimating policy impacts.
The baseline scenario is building on a policies. Additional policies can be
implemented through several validation steps. The results are produced on a
100x100m grid, which provides detailed territorial patterns. As territorial
development usually is based on local characteristics as e.g. landscape details,
zoning plans, behavioural economics etc. a zooming in to a small region can lead
to misleading interpretations.
9 TOOLS for TRansport Forecasting ANd Scenario testing, a model for the European transport network by the
JRC and DG TREN. 10 A population projection for EU population calculated by EUROSTAT.

7
3 Lessons from other TIA methodologies
Several other TIA methodologies have been developed, mostly throughout the
past two decades. Especially the ESPON programme played a major role in this
by encouraging the development of TIA methodologies at European level through
several projects.
This chapter discusses the advantages and limitations of several examples of TIA
methodologies. Although other TIA methodologies exist, for example the
Sustainable Territorial Environmental Management Approach (STeMA)11 as well
as different variations and applications by Member States, this chapter focuses on
those methodologies that provide clear lessons for further TIA development
(chapters 4 and 5). For the same purpose the TIA methodologies described in
section 3.1 are complemented by additional useful methods presented in
section 3.2.
3.1 Advantages and limitation of other TIA methodologies
The following presents four distinct TIA methodologies that provide lessons for
further development, namely TEQUILA, EATIA, TIA-CBC and TARGET.
These four methods highlight different challenges and solutions for TIA related
to comprehensiveness, participatory approaches, data challenges and different
time perspectives of TIA. The following paragraphs present the main advantages
and limitations per methodology. Factsheets with the main characteristics of the
methodology are presented in Annex 1.
The TEQUILA12 methodology aims to evaluate the efficiency of a given
European policy to improve territorial cohesion, encompassing impacts across
regions in terms of the economic competitiveness, environment and climate
change, society and land-use (ESPON 2006). The ESPON TIPTAP13 project
tested the methodology with regards to the Common Agriculture Policy (CAP)
and the Common Transport Policy (CTP) (ESPON 2013). A multicriteria analysis
(see section 3.2) and forecast models serves as basis for the methodology, by
defining the most relevant indicators. Selected indicators help to measure policy
impacts, in doing values are normalised (0-1) to allow for comparison and
aggregation. Next, three “summative” macro-criteria (weighted by political
11 https://economia.uniroma2.it/dmd/STeMA-lab/ ?? 12 https://www.espon.eu/programme/projects/espon-2006/coordinating-cross-thematic-projects/spatial-scenarios-
relation-esdp 13 https://www.espon.eu/programme/projects/espon-2013/applied-research/tiptap-territorial-impact-package-
transport-and

8
preferences obtained from stated-preference surveys among experts) are defined,
namely: territorial efficiency, territorial quality and territorial identity (all adding
up to the concept of territorial cohesion).
Territorial efficiency refers to resource-efficiency with respect to energy, land
and natural resources; competitiveness and attractiveness; internal and external
accessibility of each territory.
Territorial quality refers to the quality of the living and working environment;
living standards across territories; access to services of general interest and to
knowledge.
Territorial identity refers to enhancing “social capital”; developing a shared
vision of the future; safeguarding specificities, strengthening productive
“vocations” and competitive advantage of each territory.
The methodology is rather comprehensive in assessing different perspectives of
territorial cohesion. It uses predominantly statistical calculations performed by
external researchers. Although this provides detailed results, the outcomes are not
always easy to interpret by policy makers in particular due to use of normalised
scales and the summative macro-criteria.
The ESPON EATIA14 provides a participative bottom-up TIA methodology. The
EATIA assesses the possible territorial impact of draft directives and other
policies using expert knowledge during workshops (ESPON 2012a). The
methodology has been tested in the UK, Slovenia and Portugal. It includes four
stages to assess the territorial impact of policies at subnational levels. The stages
allow participants to determine the nature of the possible impact, the interrelations
between different factors defining the nature of the impact and finally assessing
the extent to which different territories are affected in an Impact Assessment
Matrix. The matrix synthesises impacts assessed by each workshop participant
from highly positive (+2) to highly negative (-2). The results of the Impact
Assessment Matrix are visualised in maps and other graphics such as spiderwebs.
14 https://www.espon.eu/programme/projects/espon-2013/targeted-analyses/eatia-espon-and-territorial-impact-
assessment

9
The participatory approach provides policy makers ownership of the results which
may smoothen follow-up processes to minimise negative impacts or enhance
positive impacts. Limited access to detailed statistical evidence can make this
methodology less robust compared to other approaches.
The TARGET_TIA15 approach can be applied in ex-ante and in ex-post
situations, though with a major distinction. Ex-ante assessments use only
qualitative inputs, while ex-post assessments combine quantitative and qualitative
inputs. The methodology applies a multi-vector approach relying on quantitative
(statistical) and qualitative (interviews) data to assess the impacts of a measure on
four predefined territorial cohesion dimensions: socioeconomic, environmental
sustainability, governance/ cooperation, and polycentricity. The elaboration of
inputs allows to calculate arithmetic averages for the four dimensions, combining
them in a statistical index and, finally, a numerical impact of the policy as a whole
is derived. Similar to the TIA Quick Check, the TARGET_TIA adopts the
vulnerability concept in the calculation (see Chapter 2). The concepts of “Policy
Intensity” and “Regional Sensibility”16 are adaptive elements of the assessment in
view of the specific territorial conditions of the targeted territory (Medeiros,
2014).
The TARGET_TIA has the advantage of producing a comprehensive value as a
result of the assessment, therefore allowing for comparison between alternative
measures. The methodology can be applied in different situations (ex-ante and ex-
post and at different territorial scales. Also, it is designed to include multiple
15 https://repositorio.ul.pt/bitstream/10451/35570/1/Medeiros%20Eduardo_2014.pdf . 16 The concepts of policy intensity and regional sensibility are similar to the vulnerability concepts of “exposure”
and “sensitivity” used in the Quick Check (see Chapter 2). They define the territories that are affected and the
extent to what they are affected based on their characteristics.
Input Workshop Output
Quantitative data resulting
from available forecast
models 8§ Indicator selection
§ Expert judgement on policy
effects and TIA
implementation
8§ Territorial impact patterns
§ Policy responses
Input Statistical index Output
Qualitative data
§ Internal and external sources by
combining desk research and
interviews with experts and
policy officials
Quantitative data (only for ex post
analysis
§ Externally produces statistical
indicators combined into an
aggregated index
8
§ Calculation of arithmetic averages
for four dimensions
§ Validation of outcomes through
targeted consultations with
stakeholders, national experts,
sector experts, policy officials 8
§ Territorial impacts on a multi-
vector scale of analysis
§ Degree of impact (-4 / +4) on
different territorial cohesion
dimensions
§ Overall score of the measure as
whole is calculated
10
dimensions enriching the scope of the assessment. At the same time, the model is
the result of a complex and articulated procedure. The identification of reference
objectives and related dimensions can be challenging, especially in territorial
cohesion policies, as well as the selection of appropriate indicators and their
territorial scale and time frame. Moreover, the process may be lengthy if
conducted by unexperienced experts resulting in high financial costs. Finally, the
aggregation of values over multiple dimensions can be problematic in case of an
uneven thematic distribution of impacts, essentially averaging out impact values.
This limitation could possibly be overcome using a composite indicator
methodology.
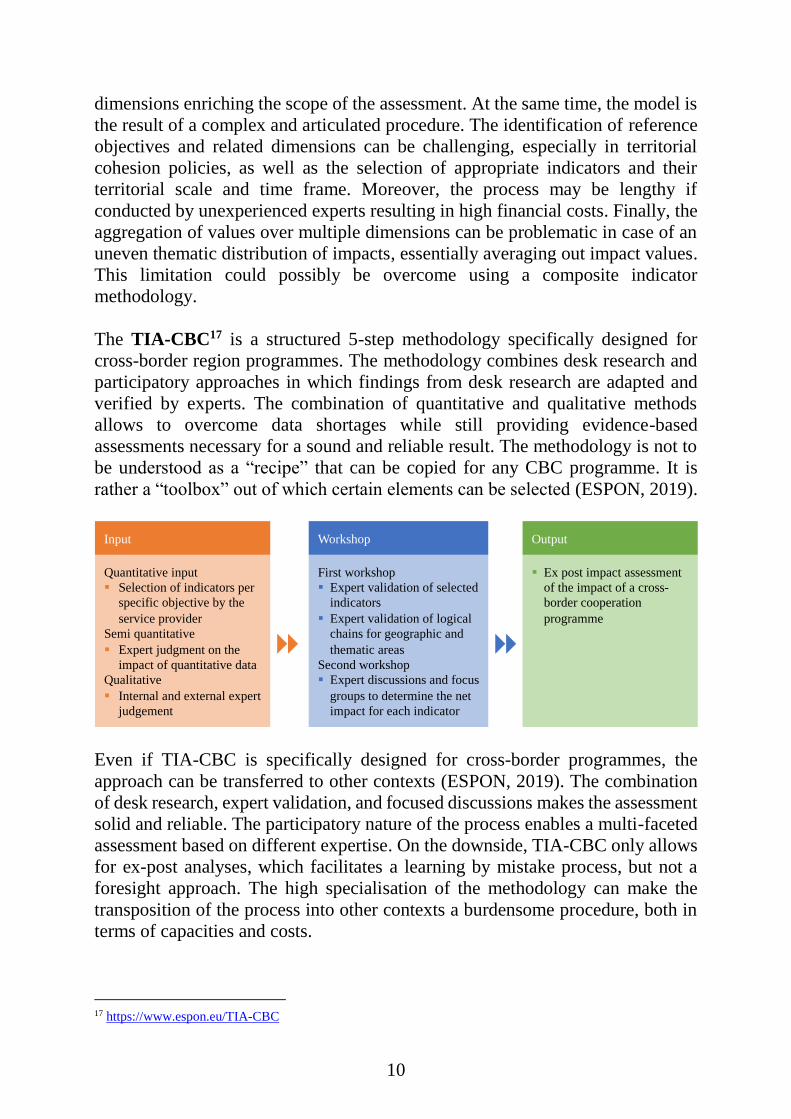
The TIA-CBC17 is a structured 5-step methodology specifically designed for
cross-border region programmes. The methodology combines desk research and
participatory approaches in which findings from desk research are adapted and
verified by experts. The combination of quantitative and qualitative methods
allows to overcome data shortages while still providing evidence-based
assessments necessary for a sound and reliable result. The methodology is not to
be understood as a “recipe” that can be copied for any CBC programme. It is
rather a “toolbox” out of which certain elements can be selected (ESPON, 2019).
Even if TIA-CBC is specifically designed for cross-border programmes, the
approach can be transferred to other contexts (ESPON, 2019). The combination
of desk research, expert validation, and focused discussions makes the assessment
solid and reliable. The participatory nature of the process enables a multi-faceted
assessment based on different expertise. On the downside, TIA-CBC only allows
for ex-post analyses, which facilitates a learning by mistake process, but not a
foresight approach. The high specialisation of the methodology can make the
transposition of the process into other contexts a burdensome procedure, both in
terms of capacities and costs.
17 https://www.espon.eu/TIA-CBC
Input Workshop Output
Quantitative input
§ Selection of indicators per
specific objective by the
service provider
Semi quantitative
§ Expert judgment on the
impact of quantitative data
Qualitative
§ Internal and external expert
judgement
8
First workshop
§ Expert validation of selected
indicators
§ Expert validation of logical
chains for geographic and
thematic areas
Second workshop
§ Expert discussions and focus
groups to determine the net
impact for each indicator
8
§ Ex post impact assessment
of the impact of a cross-
border cooperation
programme

11
3.2 Alternative possibilities to assess territorial impacts
Different territorial implications of policies can also be illustrated by other
methods. In fact, some of the above-described methodologies use elements of
other assessment methods and TIA methodologies inspired strategies and
approaches developed at national levels. These practices also provide relevant
lessons to further develop TIA.
Cost Benefits Analyses (CBA) assess the impact of an investment decision or
regulatory change, in terms of social welfare. As such the method covers various
thematic fields, similar to TIA. Unlike TIA, CBA assesses the net benefits in
monetary terms obtained from a policy by consumers, producers, administrations
and the rest of society. In doing so, CBA use results of demand forecast models
as inputs and assess how much the cost of a given policy is justified by the welfare
improvement generated for the whole society. CBA do not consider the
distribution of improvements among social groups, economic sectors or
territories. CBA, therefore, assume a given territory as a reference. This is, for
example the “European Union” when the EC/DGREGIO Cost-benefit guidelines
2014 are applied to assess investments related to Cohesion policies by INEA. A
given “country”, “region” or even “municipality” is the territorial reference when
specific guidelines for a certain territory and/or sector are applied.
Based on CBA, rural proofing was developed in the UK. Rural proofing provides
policy makers with insights into the impact of policies in a certain rural area. This
indicates the need for adjusting policies when risks for rural communities and
citizens are not sufficiently considered. It can be applied ex-ante and ex-post,
offering the possibility to continuously assess possible territorial impacts and
consequently actions smoothening unwanted effects. Rural proofing assesses
impacts among others on services, infrastructure, business, employment, and
environment in four stages. A guidance tool presents users the four stages,
outlining the steps, questions and indicators (UK Government Department for
environment, food & rural affairs, 2017). The user is free to select methods or
instruments for each of the processing stages. This selection is often place and
Input Analysis Output
Quantitative data
§ Policy/ project costs
assessment
§ Forecast models on a single
territorial scale selected to
assess socioeconomic and
environmental impacts
§ Social value of impacts at the
territorial scale selected
8
§ Comparing of costs and
benefits in monetary units
8
§ Justification of policy/project
costs based on social benefits
generated in the selected
territory

12
context specific, making the methodology less suitable to transfer between
territories and to learn from previous experience.
Multi-criteria analysis aims to establish preferences between alternative options
by referring to an explicit set of policy objectives that are translated into criteria.
Policy analysts select the criteria per policy objective and select the most suitable
indicators to measure each criterion. Indicators are subsequently aggregated to get
values for each criterion. This is achieved by weighting the criteria against their
relative political relevance. Results are expressed in “plusses” and “minuses”
against the policy objective. As such the methodology supports to identify
relevant determinants that can be used to define the scope of TIA. For example,
TEQUILA is partly based on multi-criteria analysis by adding such elements to
territorialise impacts, i.e. considering the intensity of a given policy in any
territory and the sensitivity of the territory.
Compared to CBA, multi-criteria analysis offers more transparent procedures to
get the values of criteria. While multi-criteria weights are obtained by any kind of
stated preference among decision makers, CBA uses “shadow prices” derived for
preferences revealed by consumers and producers on the marketplace. At the same
multi-criteria analysis is often perceived as more subjective as CBA due to the
use of expert opinions to establish objectives, criteria and weights. This method
has been widely applied for the assessment of infrastructure projects and in
Input Process Output
Qualitative input
§ The assessment is performed by
policy makers through desk
research, stakeholder
consultation, and expert opinions
Quantitative input
§ A number of statistical indicators
are chosen to monitor policy
effects
8
Guidance tool for policy makers to
perform this procedure:
§ Stage 1: direct/indirect impacts
of the policy on rural areas
§ Stage 2: scale of these impacts
§ Stage 3: actions to tailor the
policy to work best in rural areas
§ Stage 4: monitoring of policy
effects on rural areas. How can
policy be further adapted?
8
§ Continuous information flow on
how policy affects rural areas
concerned
§ Ex ante, ongoing, and ex-post
assessment of policy impacts on
services, infrastructure, business,
employment and environment
§ Solutions to tailor/mitigate
policy impact on rural areas

13
environmental impact assessments. It is used complementarily to CBA or as
single method to provide a systematic justification of public interests in a given
project or policy. For instance, all Impact Assessment studies developed
according to the European Commission guidelines use multi-criteria analysis to
compare alternative policy options. Similar guidelines exist in many European
countries and regions.
EU Member States enriched other impact assessment methodologies to better
capture territorial implications. A few selected examples illustrate this. In Finland,
enriched environmental impact assessments consider a wider range of possible
impacts similarly to TIA. For example, the Finnish EIA Act (468/1994) refers to
“the direct and indirect effects inside and outside Finnish territory of a project or
operations on:
a) human health, living conditions, and amenity;
b) soil, water, air, climate, organisms, and biological diversity;
c) the community structure, buildings, landscape, townscape, and the cultural
heritage;
d) utilisation of natural resources; and
e) interactions between the factors mentioned in items a) to d).” (Jalava, 2014).
In Poland and Belgium the enriched regulatory impact assessments (RIA)18
consider territorial effects. In Poland, guidelines have been developed building
upon CBA. As such it has enriched RIA with the requirement to also assess
economic, social, and environmental impacts (Polish Ministry of Economy,
2015). In Belgium, the RIA was the basis for the Sustainable Development Impact
Assessment (SDIA). This assessment tool covers economic, social and
environmental impacts, evaluates short- and long-term effects, and seeks to
address the full range of territorial effects. The assessment includes two major
steps:
The first step (screening) defines the scope by assessing measures against 33
indicators. For each indicator, policy makers analyse the timing and the
geographical scale (from local to global level) of the effect.
The second step (scoping) is the SDIA itself, which is done when the screening
step indicated the need for an in-depth analysis, based on participatory
approaches.
18 RIA assesses a wide variety of themes and seeks to address territorial effects. RIA is an ex-ante and integrated
assessment of potential consequences (collateral impacts) of regulatory projects on economic, social and
environmental domains and on public authorities (OECD, 2010). For an overview of worldwide practices of
Regulatory Impact Assessments, see http://documents.worldbank.org/curated/en/905611520284525814/Global-
Indicators-of-Regulatory-Governance-Worldwide-Practices-of-Regulatory-Impact-Assessments.pdf .

14
Both examples of enriched impact assessment methodologies have the advantage
that the original methodologies are applied by policy makers. The familiarity with
the environmental or regulatory impact assessment makes it easier to accept and
apply territorial impact assessment. These examples also illustrate that assessing
territorial implications is not necessarily more burdensome than other impact
assessments. At the same time enriching existing methodologies demands a
flexible attitude towards changing established practices.
Territorial foresight approaches19 help to better understand territorial
implications of trends. Territorial foresight is a future-oriented approach
characterised by (a) critical, lateral thinking concerning long-term developments
and their impacts on territorial development, (b) wider participatory engagement
and (c) informing public and/ or private decision making (Holstein et al., 2019).
Participatory approaches play a central role to support critical thinking in a
constructive and structured way in the territorial foresight approach developed in
the frame of the ESPON Possible Territorial Futures project (ESPON, 2018a).
Three main steps lead to formulating foresight narratives and sketching “fuzzy”
maps of possible futures in this approach. The preparatory phase defines the
foresight topic, collects evidence on possible indicators, selects participants and
interacts with them to get first inputs on possible implications. During workshops
the topics, their main determinants and causalities are defined. In doing so,
approaches from the TIA Quick Check are used. After the workshops the foresight
narratives are completed by complementing the workshop results with additional
quantitative and qualitative information.
The approach is thus of rather qualitative nature and uses quantitative data mostly
as input at different stages of the approach. Nevertheless, it supports policy
19 https://www.espon.eu/territorial-futures
Input Process Output
Screening
§ Defining scope against 33
indicators
§ Identifying timing and
geographic scale of the effect
8
Scoping
§ In-depth analysis based on
participatory approaches 8
Sustainable Development Impact
Assessment
§ Regulatory Impact Assessment
considering also economic,
social and environmental
impacts

15
making processes by dealing with uncertainty and complexity and creates
ownership on possible actions to avoid unwanted implications or enhance desired
implications.
Besides the use of distinctive methodologies or instruments, several European
countries introduced strategies and guidelines to encourage assessing
territorial impacts during policy making processes. For example, the Swiss
Sustainable Development Strategy 2016-2019 encourages cross-sector
coordination similar to some TIA methodologies (Nosek, 2019). In the
Netherlands practical guidelines support the territorial assessment of impacts of
EU policies (Evers, 2011). Six steps encourage policy makers to consider
territorial aspects (Tennekes and Hornis, 2008). The guidelines recommend to
start with rather broad understanding of TIA at early stages of policy processes to
capture the entire range of possible directions EU-policy can take. At later stages,
as the range of possibilities has narrowed down, more detailed research can be
carried out on the most likely, or already established, policy options. Even after
the policy making phase at the EU level has been completed, a TIA can explore
the potential impacts of choices made during implementation at the national and
regional level (Tennekes and Hornis, 2008).


17
4 Main obstacles to further develop TIA
The description of main methodologies and alternative ways to assess territorial
impacts allows to identify obstacles for further TIA development that can be
grouped in several categories. The main categories are technical limitations,
awareness issues and limitations of policy processes. Their significance depends
on the intended application. The following thus focuses on the obstacles in
relation to general methodological issues and the uptake in the EU policy
process. While TIA is principally capable to be applied at different territorial
scales, the document at hand aims to provide input for EU level processes and
thus focuses on this level only.
4.1 Technical limitations
Most TIA approaches described above rely either completely or partly on
quantitative data. Thus, the availability of regionally disaggregated data is a
crucial issue for conducting an evidence based impact assessment. Depending on
the methodology applied and the policy/ legislation assessed, the required level of
spatial resolution of data in most cases corresponds to either NUTS 2 or NUTS 3
level. Some approaches require even LAU or grid-level data. Although Eurostat,
the JRC, ESPON or the OECD produce various datasets for the European Union
(and beyond), they often correspond to rather general information (e.g. GDP,
employment per sector, population age groups) or highly specialised information
produced for specific projects (e.g. many ESPON indicators). This leads to a
mismatch between data availability and the broad range of topics to be assessed
in the EU policy and legislation context by TIA.
Some TIA methodologies circumvent this issue by working with “hybrid data”,
where quantitative data is combined with or serves as backing for qualitative
expert assessments. Other approaches apply quantitative bridging methods, e.g.
through statistical estimation techniques or modelling. While decentralised data
sources can be tapped on, e.g. from national statistical offices, this creates
comparability and harmonisation issues due to different collection approaches and
definitions. Existing datasets on a higher level (e.g. NUTS2) can be broken down
to a lower leval (e.g. NUTS3) via spatial analysis and modelling.
Action: Further integration of EU-wide regional level datasets.
18
Participatory approaches working with hybrid data may overcome some data
limitations but have other constraints. TIA applications at European level often
require sectoral and regional expertise to judge on likely effects of a given policy.
To find suitable workshop participants, interviewees etc. to combine this expertise
can be challenging, especially when covering a broad range of regions and/ or
sectors. Including policy makers (if the TIA addresses a policy) and programme
stakeholders (if the TIA addresses a programme) in expert groups contributes to
covering the expertise required and creating “ownership” of the results.
4.2 Awareness
Territorial impacts of policies often suffer from a lack of awareness. In contrast
to mandatory assessments, such as environmental impact assessments, for various
actions from policy to project development, a “territorial impact assessment” is
not mandated by any EU policy. In consequence, the territorial dimension of
impacts is often overlooked, especially for abstract policies which do not clearly
address specific regions or types of regions. For instance, a legislative act creating
harmonised rules for the banking sector in the EU might be assumed to create
territorially even impacts. This overlooks first and second tier effects depending
on the regional importance of the banking sector implying clear territorial
differentiations. Experience with from the ESPON Quick Check shows, that
workshop participants frequently show this issue, and only the workshop raised
first awareness of such effects.
Differentiated territorial impacts of policies addressing specific regions or types
of regions might be seen as “clear cut” needing no detailed assessment, as the
territorial differentiation is part of the policies design. This may ignore secondary
effects created by such a policy. For instance a policy addressing port regions
impacts on other regions through trade relations and flows of people. Similarly,
some territorially differentiated impacts can be assumed to be clear from the
outset. For example, some regional properties such as economic eastern-western
or northern-southern divides in the EU are accepted as something which is
apparent and is addressed by cohesion policy in any case. A policy which creates
Action: Further harmonisation of cooperation between national statistical offices
and harmonisation of data collection methods.
Action: Include policy makers and programme stakeholders to a larger extent in
TIA processes.

19
differentiated impacts along such a divide therefore might not be seen to need
adjustments.
Sometimes the explicit publication of information on territorially differentiated
impacts of a policy may be detrimental to the objective of the TIA when creating
opposition. If, for example, a programme is assessed to create territorially
different extents of positive impacts, stakeholders of regions benefitting less may
be dissatisfied and oppose the programme despite an overall beneficial impact.
An option to overcome such issues is the more extensive stakeholder inclusion in
the policy drafting and impact assessment to create “ownership” of results.
4.3 Limitations of the policy process
As conducting a Territorial Impact Assessment is not a mandatory element of the
EU legislative procedure, but rather a suggestion mentioned in the Better
Regulation Guidelines as well as encouraged by the Regulatory Scrutiny Board,
it is not conducted as a standard element of policy drafting. Legislative procedures
are already rather complex and time consuming. Thus, responsible authorities are
prone to not create an additional burden through making non-mandatory
assessments mandatory.
The perception of TIA as costly and time consuming procedure that is not
formally included in the policy process is a major obstacle for the uptake in
practice. Simple mandatory verification procedures could overcome this obstacle
by increasing awareness of territorial impacts without insurmountable burden.
The broader inclusion of policy makers in such impact assessments can
“advertise” the added value in the policy drafting, especially compared to
externally contracted impact assessments in other assessment fields.
Action: Provision of information material on territorial impacts (e.g. by ESPON)
and clearer instructions on TIA in Better Regulation Guidelines.
Action: Inclusion of different regional stakeholders in policy drafting and impact
assessment.
Action: Inclusion of a verification for the existence of territorially differentiated
impacts in the standard impact assessment procedure. Provision of
information and assistance with regard to “easy” TIA methods limiting
costs and additional burden.

21
5 Main opportunities to further develop TIA
Based on the assessment of the TIA methodologies described above, three ways
of development opportunities at different levels can be defined. Firstly, the TIA
instrument can be further developed in policy processes by integrating different
approaches. Secondly, new data offers possibilities to further develop individual
TIA methodologies. Thirdly, increased awareness and better alignment with
policy processes addresses the political dimension of TIA development.
5.1 Further integration of approaches
TIA methodologies share methodological elements and instruments. At the same
time, each methodology presented in this file note has different characteristics and
approaches with specific advantages and disadvantages. Further integration of
approaches could address some current shortcomings. Using the key advantages
of single methodologies by combining them in a coherent may result in a variety
of methodologies. The establishment of a single methodology is not encouraged
due to the variety of detailed intentions and characteristics of each approach.
Instead, further integration of approaches implies using single elements of
different approaches to enrich methodologies and to use different methodologies
at different stages of policy development and for different types of policies.
The reviewed TIA methodologies illustrate how specific methodological elements
of one methodology may contribute to make other methodologies more robust.
For example, rural proofing builds upon CBA and environmental and regulatory
impact assessment have been enriched to better consider territorial aspects.
TEQUILA uses elements of multi-criteria analysis and territorial foresight uses
elements of the TIA Quick Check. To increase the level of in-depth analysis for
the TIA Quick Check several theme-specific forecast models20 could be applied
at early stages to provide more evidence to workshop participants.
A first step to enhance TIA methodology integration by using specific elements
of different methodologies is to acknowledge the limitations of each specific
methodology. Then other methodologies addressing these limitations need to be
sought. Particular attention needs to be paid to the specific outcomes of the
intermediate steps of methodologies. Understanding these outcomes helps to
adapt the methodology and align the different elements.
20 Examples of such models include MULTIPOLES for demographic trends, TREMOVE for energy,
TRANSTOOLS for transport or MASST 3. MASST 3 is a macro-economic structural and socio-economic model
that can provide additional evidence on economic implications of policies. For more information see (ESPON,
2014a) and (ESPON, 2014b).

22
Existing methodologies can be used in sequence at different stages of policy
development processes and policy cycles. The use of specific methodologies
depends on their characteristics and intention. Inspired by the Dutch TIA
guidelines (see Evers, 2011 and Tennekes and Hornis, 2008), early stages of
policy development benefit from detailed and analytical evidence on potential
impacts, whereas later stages may benefit from participatory approaches
encouraging ownership among different stakeholders. After policy
implementation, TIA can provide further insights to improve future policy
processes.
For instance, multi-criteria analysis can support the identification phase of policy
development processes by illustrating the variety of policy fields affected by the
policy. Quantitative modelling approaches, such as TEQUILA, LUISA, or
RHOMOLO can provide more detailed evidence on potential impacts.
Participatory approaches could be used to discuss TIA outcomes with involved
and affected following the examples of EATIA or the TIA Quick Check. In
addition, some TIA methodologies, such as the TARGET TIA and TIA CBC
allow for ex-post assessments with the aim to complete the cycle.
5.2 New data possibilities
Data availability and quality are crucial for TIA methodologies. In general,
harmonised data available across Europe, at low territorial levels, with regular
updates support TIA. Different initiatives aim to overcome existing data
challenges addressed in Chapter 4. This section discusses new opportunities in
view of the integration of official statistical and geospatial information and big
data. Both opportunities inhibit specific advantages and disadvantages to further
development TIA.
5.2.1 Further integration of statistical and geospatial information
The trend towards more detailed and harmonised datasets of geospatial
information continues. This includes ongoing efforts by the ESPON programme21,
21 Although ESPON provides many relevant datasets at regional level, evidence is collected by projects, which
challenges a continuous collection of comparable datasets for multiple years.
Action: Encourage further integration of TIA methodologies according to their
specific benefit at the appropriate step of the legislative process.

23
the JRC Knowledge Centre for Territorial Policies (KCTP)22 and Eurostat.
Particularly the latter provides increasing numbers of harmonised datasets at low
geographical levels in line with their commitment to the Global Statistical
Geospatial Framework. This framework facilitates the integration of statistical
and geospatial information and encourages the production of harmonised and
standardised geospatially enabled statistical data, and informs and facilitates data-
driven and evidence-based decision making (UN Statistical Commission, 2019).
Eurostat and the European Statistical System (ESS) work on the implementation
and adaption of this global framework in Europe in the GEOSTAT projects.
GEOSTAT encourages national statistical offices to further integrate statistical
and geospatial information (GEOSTAT 3, 2019). It focuses, inter alia, on defining
policy concepts and identifying indicators to measure them. For example, the
latest GEOSTAT project defined and tested suitable indicators for the UN
Sustainable Development Goals23. These tests show the benefit of using
standardised definitions and data collection and analysis methods.
Another example of integrating statistical and geospatial data by GEOSTAT is
the production of population data at 1 km2 grid level. Previous GEOSTAT
projects have collected and published population data at grid level for 2006 and
201124. This data is currently updated and broken down by sex and economic age
groups. The 2021 population and housing census will make this data available.
Inspired by the Global Statistical Geospatial Framework, more data will be
geocoded and broken down to 1 km2 grid level. This concerns information on
employed persons, place of birth (in reporting country, other EU country,
elsewhere) and place of residence (EUROSTAT, 2019). Compared to previous
censuses this implies a more detailed breakdown of population data that will be
geocoded and better harmonised across European countries.
For TIA methodologies, grid level data, such as produced by the LUISA platform,
can be relevant to better understand population dynamics across administrative
boundaries such as functional areas or cross-border regions. It can directly support
the TIA CBC with additional harmonised statistical population data for specific
cross-border regions. It also provides detailed information supporting all other
TIA methodologies. Grid level data is independent from changes in geographic
delineations of NUTS regions. In addition, grid level data can be aggregated to
administrative units, making it suitable for most TIA methodologies.
22 KCTP aims to support territorial development policies by promoting better knowledge management and
dissemination, and by releasing new spatial datasets, territorial indicators and tools for their interactive
visualisation on the web. 23 cf: https://www.efgs.info/wp-content/uploads/geostat/3/GEOSTAT3_WP2_SDG_findings_report_v1.0.pdf 24 This data is available at : http://ec.europa.eu/eurostat/statistical-atlas/gis/viewer/?config=REF-
GRID.json&mids=2,3,6,7&o=1,0.5,1,1&ch=4,5¢er=50.03696,19.9883,3&lcis=6&

24
5.2.2 Big data and unofficial statistics
Big data can be defined as the large amount and diverse information generated
and collected by ICT services (Batista e Silva et al., 2019). Most of the
information originates directly from the population using these services. Thus, it
is a means to overcome current data challenges by providing continuously updated
information at low geographical levels. Big data can be collected by various
platforms, for example
Communication platforms, e.g. social media and mobile phone data;
Websites, e.g. web searches, businesses websites, e-commerce, job
advertisements, real estate websites;
Sensors, e.g. traffic loops, smart meters, vessel identifications, satellite
images;
Process generated data, e.g. flight booking transactions, supermarket cashier
data, financial transactions;
Crowd sourcing, e.g. voluntary geographic websites (OpenStreetMap),
community picture collections (European Commission, DG REGIO, 2019).
These examples highlight the variety of themes and nature of data that can be
collected. Themes include for example information society, tourism, population,
housing, transport, energy efficiency, labour market and employment. Most
sources provide raw data that illustrate geographic points of interest, flows,
behaviour and development trends (Batista e Silva et al., 2019; Jæger et al., 2013).
Each information source generally provides a harmonised bulk information that
is continuously updated. This information requires data mining and geocoding of
information to retrieve geospatial data.
For territorial analysis the geospatial information retrieved from big data can be
aggregated to statistical regions or grid level. Considering the representation of
the sample is crucial (Jæger et al., 2013), since big data provides often an
unbalanced representation of the population. This needs to be considered when
using big data in quantitative TIA methodologies such as LUISA, RHOMOLO,
TEQUILA, TARGET. Thus, big data might be more suitable to complete existing
datasets or illustrate population trends. It can complement data for methodologies
combining quantitative and qualitative inputs, such as the ESPON Quick Check,
EATIA or territorial foresight approaches.
Action: Modify existing methodologies to allow for frequent data updates and the
integration of new types of data, e.g. grid data in the Quick Check.

25
Accessibility constraints still limit the likelihood of using big data in all TIA
methodologies in the near future. Private enterprises own most of this data and do
not publish it free of charge. Communication platform data is particularly
challenging, since it is costly even if obtained via intermediaries such as mobile
network operators (Batista e Silva et al., 2019). In addition, datasets might be
incomplete if stored voluntarily (Jæger et al., 2013). Current initiatives by
Eurostat, the European Commission, ESPON and the UN seek ways to overcome
these challenges (European Commission, DG REGIO, 2019). EU Member States
also launch initiatives for the use of big data. For instance, statistical offices in the
Netherlands, Italy, the United Kingdom, Ireland, Finland and Slovenia have
launched projects to combine national and big data25.
5.3 Awareness-raising and alignment with policy processes
Further developing TIA methodologies could benefit from a wider application of
the instrument. The review of TIA methodologies illustrated its limited uptake in
current policy processes. Besides the application of the three methodologies at
European levels described in Chapter 2, few other methodologies are applied to
improve policy development. Most methodologies described in Chapter 3 are
predominantly tested and applied for research purposes. To increase the use of
TIA methodologies for policy and decision making purposes, alignment with
existing processes should be sought. This could increase awareness of these
methodologies and their added value in policy and decision-making processes.
The following presents three ways to increase awareness on TIA methodologies
by seeking alignment with policy processes, namely by better resonating TIA
methodologies in the Better Regulation Guidelines and toolbox, by continued
efforts to promote the benefits of TIA and by setting up a TIA platform and
develop TIA guidelines.
5.3.1 TIA in the Better Regulation Guidelines and toolbox
The Better Regulation Guidelines and toolbox set out key principles to prepare
new legislation and proposals for the European Commission. Tool #33 is
explicitly related to territorial impact assessment, more specifically to three
methodologies, the TIA Quick Check, LUISA and RHOMOLO. However, TIA
25 https://ec.europa.eu/jrc/sites/jrcsh/files/j3-bigdata-02-Wirthmann.pdf
Action: Cooperate and coordinate with national statistical offices to encourage the
use of big data.

26
could be explicitly referred to in other sections to encourage more frequent use of
such assessments.
The Better Regulation Guidelines aim to support better policy making by
providing insights into the variety of implications of policies (European
Commission, 2019). However, territorial implications are not explicitly
mentioned in line with the territorial cohesion objective of the EU, only the
section on impact assessment refers to territories as potentially affected parties of
policies (SWD(2017) 350, 2017: 25). In addition, this section hints at other
elements that relate to TIA methodologies, such as the mapping of positive and
negative economic, societal and environmental impacts as well as specific
impacts, for instance, on businesses and citizens. At the same time, foresight and
forward-looking tools are mentioned in the toolbox under Tool #4: “Evidence-
based better regulation”. A reference to TIA, respectively Toolbox #33 could be
included in this Tool as well as in Tool #9: “When is an impact assessment
necessary”. The benefits and added value of TIA could be presented more clearly
as well as their relevance for the territorial cohesion objective.
Furthermore, since TIA is currently only encouraged rather than compulsory, the
Regulatory Scrutiny Board (RSB) can emphasise the need for such assessments
during the policy drafting of the Commission. While the RSB is already
highlighting the existence of such methodologies (e.g. by mentioning territorial
impacts in their annual report26), further measures encouraging their uptake could
be taken.
5.3.2 Seeking alignment with new policy processes
Especially ESPON, DG REGIO, CoR and the JRC have made considerable efforts
to develop, improve and promote the use of TIA. To continue these efforts the
benefits and added value of TIA demands continuous reflection against new
policy processes and political objectives. This requires timely communication
about newly developed or upgraded TIA methodologies. The renewal of the
Territorial Agenda and the EU Green Deal are examples suitable for promoting
TIA.
26 https://ec.europa.eu/info/sites/info/files/rsb_report_2018_en.pdf
Action: Better reflect TIA as relevant approach for evidence based policy making
in the Better Regulation Guidelines and toolbox. Examples are the updating
of Tool #33, adding clearer references in other parts of the guidelines and
toolbox.

27
The Territorial Agenda is a strategic policy document for Europe and its regions
that aims at a sustainable future for all people and places by strengthening
territorial cohesion (MSPTD, 2011). The Member States’ Ministers responsible
for spatial planning and territorial development have agreed to renew the current
Territorial Agenda 2020 and first ideas for the new Territorial Agenda have been
published27. The current draft argues for a more widespread use of TIA at
European and national levels to stimulate cross-sectoral coordination. In addition,
it proposes pilot actions committing players to contribute to the Agenda’s
objectives. Pilot policy actions under discussion propose to perform TIA for EU
and national policies. These activities are an opportunity to promote and highlight
the use of TIA.
President-elect of the European Commission, Ursula von der Leyen mentioned an
EU Green Deal as one of the new Commission’s priorities to make Europe a
frontrunner in climate policies while ensuring balanced effects of climate change
actions for society28. The EU Green Deal demands policy coordination between
environmental, energy and social policies. It could serve as basis to promote the
use of TIA by illustrating the relations between different policy fields and the
variety of territorial effects. Ex-ante insights could be used to further specify the
EU Green Deal.
5.3.3 TIA platform and guidebook
Different TIA methodologies have different purposes and use different methods
to illustrate the variety of effects of policies on territories. Depending on the
question at stake policy makers may choose the adopt different methodologies.
To illustrate the variety of approaches, a TIA platform and guidebook would be
useful. A platform could function as a one-stop-shop for policy makers seeking
more information on TIA, including benefits, different methodologies and
examples of their implementation and outcomes. A TIA guidebook could
supplement this information. Publications of TIA applications should highlight
that performing a TIA is not necessarily a burdensome step in policy making. In
fact, several of the methodologies presented in Chapters 2 and 3 illustrate this.
This could also encourage policy makers at national and regional levels to perform
27 https://www.territorialagenda.eu/home.html 28 In her opening statement in the European Parliament Plenary session on 16 July 2019, Ursula von der Leyen
sketched her ideas and ambitions for a European Green Deal that shall make Europe the first climate-neutral
continent by 2050 by revitalising Europe’s industry and ensure long-term growth and
jobs.https://ec.europa.eu/commission/presscorner/detail/en/speech_19_4230
Action: Encourage alignment with new policy processes for continuous promotion
of TIA.

28
a TIA. The CoR could be a suitable host for such a platform based on experience
in the field and networks with all relevant institutions and authorities. The CoR’s
EGTC platform could be an example for hosting a TIA platform.
Action: Explore the possibilities to set up a TIA platform and guidebook to
disseminate examples and illustrate the benefits of the methodology.

29
Literature
Batista e Silva F, Barranco R, Rosina K, et al. (2019) New territorial analyses
enabled by emerging sources of geospatial data - use cases and challenges.
ESPON Scientific Report - Building the next generation of research on
territorial development: 95–101.
BMU - Bundesministerium für Umwelt, Naturschutz, Bau und Reaktorsicherheit
(2007): Territorial Agenda of the European Union.
ESPON (2006) ESPON project 3.2 Spatial Scenarios and Orientations in relation
to the ESDP and Cohesion Policy, Final Report, European Union.
ESPON (2012a) EATIA ESPON and Territorial Impact Assessment, Final
Report, European Union.
ESPON (2012b) ESPON ARTS. Assessment of Regional and Territorial
Sensitivity.
ESPON (2013) TIPTAP: Territorial Impact Package for Transport and
Agricultural Policies, Final Report, European Union.
ESPON (2014a) ET2050 - Integrated Spatial Scenarios until 2050. Scientific
Report Volume 6. Luxembourg: ESPON.
ESPON (2014b) Progress on a European Platform for Applied Territorial Science.
Luxembourg: ESPON CU edited by Kai Böhme, Erik Gløersen, Cliff
Hague, Frank Holstein and Sabine Zillmer.
ESPON (2018a) Possible European Territorial Futures. Guidelines to Territorial
Foresight. Luxembourg: ESPON. Available at:
https://www.espon.eu/territorial-futures (accessed 19 October 2018).
ESPON (2018b) Territorial Impact Assessment for Cross-Border cooperation
ESPON (2019) Territorial Impact Assessment for Cross-Border Cooperation:
Targeted Analysis. Final Report.
EC (2019): LUISA - Technical Description, Accessed 25 October 2019, available
from: https://ec.europa.eu/jrc/en/luisa/technical-description.

30
European Commission (1999): ESDP - European Spatial Development
Perspective. Towards Balanced and Sustainable Development of the
Territory of the European Union.
European Commission (2013): Commission Staff Working Document. Assessing
territorial impacts: Operational guidance on how to assess regional and
local impacts within the Commission Impact Assessment System.
European Commission (2019) Better regulation ‘Toolbox’. Brussels: European
Commission. Available at: https://ec.europa.eu/info/law/law-making-
process/planning-and-proposing-law/better-regulation-why-and-
how/better-regulation-guidelines-and-toolbox/better-regulation-
toolbox_en (accessed 11 August 2019).
European Commission, DG REGIO (2019) City data from LFS and Big Data.
Luxembourg: Prepared by Statistics Netherlands, INSEE, Destatic,
Statistics Austria, Statbel. Available at:
https://ec.europa.eu/regional_policy/sources/docgener/studies/pdf/city_dat
a_en.pdf (accessed 28 October 2019).
EUROSTAT (2019) EU legislation on the 2021 population and housing censuses
- Explanatory notes. Luxembourg: Eurostat. Available at:
https://ec.europa.eu/eurostat/documents/3859598/9670557/KS-GQ-18-
010-EN-N.pdf/c3df7fcb-f134-4398-94c8-4be0b7ec0494 (accessed 28
October 2019).
Evers D (2011) Territorial Impact Assessment: a critical examiniation of current
practice. The Hague, The Netherlands: PBL Netherlands Environmental
Assessment Agency, The Hague. Available at:
https://www.pbl.nl/sites/default/files/downloads/PBL-2011-
Territorial_Impact_Assessment_a_critical_examination_of_current_practi
ce.pdf.
Fischer, Thomas B., Olivier Sykes, Thomas Gore, Naja Marot, Mojca Golobic,
Paulo Pinho, Bas Waterhout & Anastassios Perdicoulis (2014) Territorial
Impact Assessment of European Draft Directives - The Emergence of a
New Policy Assessment Instrument, European Planning Studies.
GEOSTAT 3 (2019) GSGF Europe - Implementation guide for the Global
Statistical Geospatial Framework in Euope; proposal from the GEOSTAT
3 project. Stockholm: EFGS and Eurostat.

31
Golobic M, Marot N (2008): Territorial Impact Assessment: a policy development
tool for territorial cohesion. University of Ljubljana.
Holstein F, Böhme K and Lüer C (2019) Future-oriented approaches - the case of
territorial foresight. Building the next generation of research on territorial
development: 76–80.
Jæger S, Böhme K and Gløersen E (2013) Exploring Big Data for analysing
territorial development. In: Science in Support of European Territorial
Development and Cohesion. Second ESPON Scientific Report.
Luxembourg: ESPON, pp. 146–152. Available at:
http://www.espon.eu/export/sites/default/Documents/Publications/Scientif
icReports/SecondFebruary2014/ESPON_SCIENTIFIC_REPORT_2.pdf
(accessed 20 February 2016).
Jalava K (2014) Quality of Environmental Impact Assessment in Finland.
JYVÄSKYLÄ STUDIES IN BIOLOGICAL AND ENVIRONMENTAL
SCIENCE. University of Jyväskylä.
Medeiros E (2014) Territorial Impact Assessment (TIA): The Process, Methods
and Techniques. Lisbon: University of Lisbon.
MSPTD (2011) Territorial Agenda of the European Union 2020. Towards an
Inclusive, Smart and Sustainable Europe of Diverse Regions. Agreed at the
Informal Ministerial Meeting of Ministers responsible for Spatial Planning
and Territorial Development on 19th May 2011 Gödöllő, Hungary.
Nosek Š (2019) Territorial Impact Assessment – European context and the case
of Czechia. AUC GEOGRAPHICA: 133–144. DOI:
10.14712/23361980.2019.12.
OECD (2010) Better Regulation in Europe: Belgium. Paris. Available at:
http://www.oecd.org/gov/regulatory-
policy/betterregulationineuropebelgium.htm.
OIR, AIDICO (2013): ESPON TIA Quick Check - Moderator’s Guide and
Methodological Background.
Polish Ministry of Economy (2015) Guidelines for the Regulation Impact
Assessment (RIA).
SWD(2017) 350 (2017) Commission Staff working Document - Better regulation
Guidelines. Brussels: European Commission.

32
Tennekes J and Hornis W (2008) Ruimtelijke-effectanalyses van EU-beleid: een
leidraad. Den Haag: Ruimtelijk planbureau.
UK Government Department for environment, food & rural affairs (2017) Rural
proofing: practical guidance to assess impacts of policies on rural areas.
https://assets.publishing.service.gov.uk/government/uploads/system/uploa
ds/attachment_data/file/600450/rural-proofing-guidance.pdf
UN Statistical Commission (2019) The Global Statistical Geospatial Framework.
New York: UN - GGIM.
Zonneveld W and Waterhout B (2009) EU Territorial Impact Assessment: Under
What Conditions? In: European Congress of the Regional Science
Association, Lodz, Poland, 25 August 2009.

33
Annex 1 - Factsheets of selected TIA
methodologies
TIA Quick Check Main
characteristics
TIA Quick Check
Intention Development of a method capable of depicting potential territorial
impacts in a comparably easy way serving as a discussion basis for
further analysis.
Assessment
method Hybrid. Insights created by an expert workshop is combined with
quantitative data to calculate territorial impact patterns
Data basis The methodology in principle can make use of any non-categorical
indicator, therefore:
Externally produced/quantitative (e.g. EUROSTAT GDP statistics)
Externally produced/qualitative (e.g. EU-level survey)
Internally produced (e.g. programme internal indicators)
Thematic fields
covered Economy, Environment, Society, Governance
Action assessed Policies
Programmes (these assessments are possible, but not the intention
behind the methodology)
Timing Ex-ante
Institutions
involved Self-assessment
External assessment
Examples of
applications Territorial Impact Assessment on Energy Poverty (ex-ante, May
2019)
Territorial Impact Assessment on Climate Neutrality (ex-ante, April
2019)
Territorial Impact assessment on the Bioeconomy (ex-ante, April
2019)
Territorial Impact Assessment on a Place-based Industrial Strategy
(ex-ante, March 2019)
Territorial Impact Assessment – establishment of the European
Labour Authority (ex-ante, July 2018)
Territorial Impact Assessment – UK's withdrawal from the EU (ex-
ante, February 2018)
Territorial Impact Assessment – EGTC Regulation – Regulation
(EU) No 1302/2013 amending Regulation (EC) No 1082/2006 (ex-
post, March 2018)
Cross-border Impact Assessment Report / European Territorial
Cooperation post-2020 (ex-ante, March 2018)
Urban Impact Assessment - Implementation of the 2030 Agenda; The
influence of SDG 11.3 on urban development through spatial
planning (ex-post, May 2018)
Clean Vehicles Directive (CVD) (ex-ante, 2017)

34
Territorial Impact Assessment - Smart Specialisation (ex-ante,
2017)
Minimum Quality Requirements for Reused Water in Agricultural
Irrigation and Aquifer Recharge (ex-ante, 2017)
Directive on Port Reception Facilities for Ship Generated Waste and
Cargo Residues (ex-ante, 2017)
Territorial Impact Assessment – Work-Life Balance Directive (ex-
ante)
Territorial Impact Assessment - Remotely Piloted Aircraft Systems
(ex-ante, 2016)
Urban Impact Assessment – New Skills for Europe (ex-ante, 2016)
Urban Impact Assessment - Sharing economy (ex-ante, 2016)
Territorial Impact Assessment - Birds and Habitats Directives (ex-
post, 2015)
Analytical note - Port reception facilities Directive (ex-post, 2015)
Urban Impact Assessment - Energy performance of Buildings
Directive (ex-post, 2015)
The Resource Efficiency and Waste Package – towards a circular
economy: a zero waste programme for Europe (ex-ante, 2014)
“Smooth Phasing-out of the Milk Quotas in the EU” (ex-ante, 2014)
“Port’s package” (ex-ante, 2013)
Advantages The methodology is easy to apply and an ex-ante impact assessment
can be conducted at comparably low cost in a short timeframe, thus
it is attractive to policy makers
The regulatory scrutiny board recognises the methodology as suited
for ex-ante policy impact assessment, thus the results are likely to be
accepted in the EU-policy process
The method is already applied in practice thus not only a theoretical
creation
Disadvantages Only a quick “glance” at territorial impacts is possible, in depth
assessments require other methodologies
The results depend both on a well composed group of experts and
high quality quantitative data backing, thus e.g. mitigating data
availability issues via qualitative assessments is not possible
RHOMOLO Main
characteristics
RHOMOLO
Intention Regionalised assessment of EU Cohesion Policy
Assessment
method Only quantitative
Data basis Externally produced/quantitative (e.g. EUROSTAT GDP statistics)
Internally compiled (regional Social Account Matrices for the NUTS
2 regions of the EU)
Thematic fields
covered Economy (environment, society as a “2nd tier analysis” based on
economic effects)

35
Action assessed Policies
Programmes
Timing Ex-ante
Ex-post
Institutions
involved
High amount of expertise in running the model is necessary in order
to create meaningful results therefore it does not lend itself to a self-
assessment of e.g. programmes. Thus:
External assessment
Examples of
applications Impact Assessment of Horizon Europe
Evaluation of the European Fund for Strategic Investments
Impact Assessment of the European Social Fund
Impact Assessment of the European Regional Development Fund
and the Cohesion Fund.
Ex-post evaluation of the ERDF and Cohesion Fund 2007-2013
Assessing the macroeconomic impact of the EIB Group
The impact of the Grand Paris Express on the European regions
European NUTS 2 regions: construction of interregional trade-
linked Supply and Use tables with consistent transport flows
Assessing the regional socio-economic impact of the European R&I
programme
The impact of Cohesion Policy 2007-2015 in EU regions
The third pillar of the Investment Plan for Europe
Advantages Rhomolo is the only readily available model on the pan-European
level capable of modelling sector specific economic interlinkages on
this scale
The method is well tested and has been applied in numerous cases
of impact assessments
Similar to the TIA Quick Check the method is recognised by the
Regulatory Scrutiny Board thus accepted as producing valid and
reliable results for the purpose of the EU policy making process
Disadvantages Compared to the other available methodologies, the spatial
resolution is relatively low. NUTS 2 for example does not allow for
a differentiation between urban and rural regions which is
oftentimes requested
Similar to LUISA the effort in running and calibrating the Rhomolo
model is comparably high
The model, as any modelling framework, relies on a number of
assumptions which are grounded on the current economic literature
on general equilibrium modelling
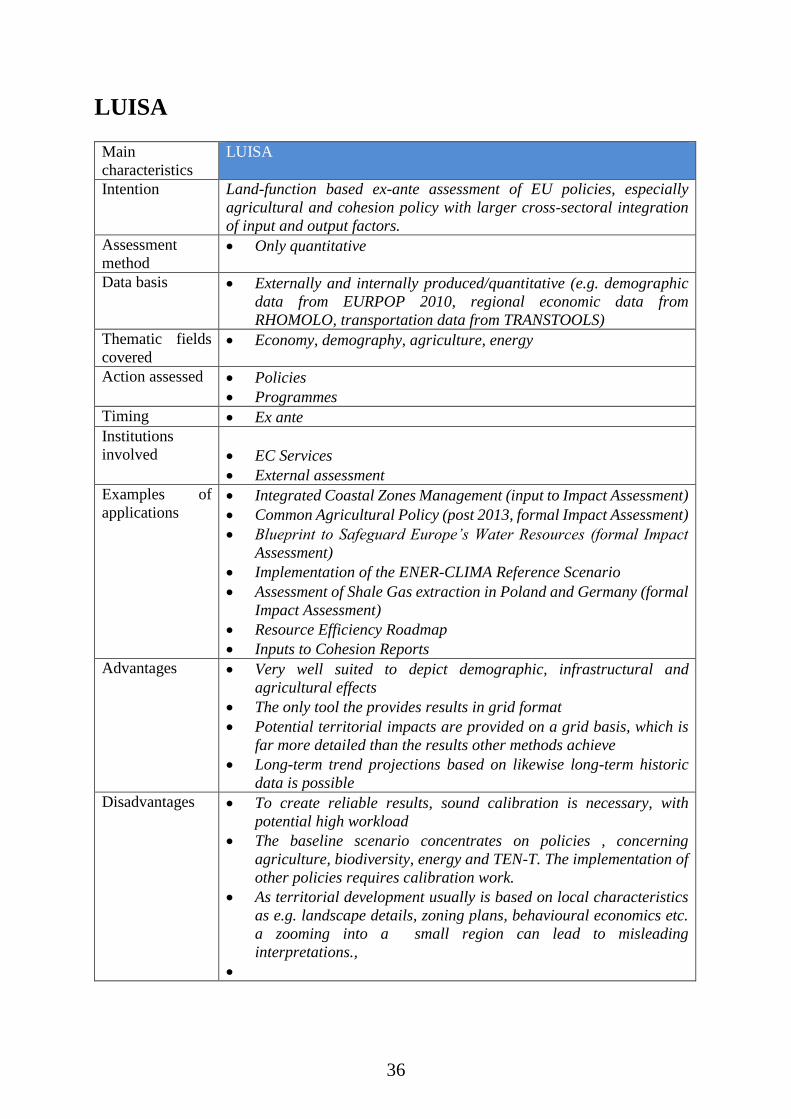
36
LUISA Main
characteristics
LUISA
Intention Land-function based ex-ante assessment of EU policies, especially
agricultural and cohesion policy with larger cross-sectoral integration
of input and output factors.
Assessment
method Only quantitative
Data basis Externally and internally produced/quantitative (e.g. demographic
data from EURPOP 2010, regional economic data from
RHOMOLO, transportation data from TRANSTOOLS)
Thematic fields
covered Economy, demography, agriculture, energy
Action assessed Policies
Programmes
Timing Ex ante
Institutions
involved
EC Services
External assessment
Examples of
applications Integrated Coastal Zones Management (input to Impact Assessment)
Common Agricultural Policy (post 2013, formal Impact Assessment)
Blueprint to Safeguard Europe’s Water Resources (formal Impact
Assessment)
Implementation of the ENER-CLIMA Reference Scenario
Assessment of Shale Gas extraction in Poland and Germany (formal
Impact Assessment)
Resource Efficiency Roadmap
Inputs to Cohesion Reports
Advantages Very well suited to depict demographic, infrastructural and
agricultural effects
The only tool the provides results in grid format
Potential territorial impacts are provided on a grid basis, which is
far more detailed than the results other methods achieve
Long-term trend projections based on likewise long-term historic
data is possible
Disadvantages To create reliable results, sound calibration is necessary, with
potential high workload
The baseline scenario concentrates on policies , concerning
agriculture, biodiversity, energy and TEN-T. The implementation of
other policies requires calibration work.
As territorial development usually is based on local characteristics
as e.g. landscape details, zoning plans, behavioural economics etc.
a zooming into a small region can lead to misleading
interpretations.,
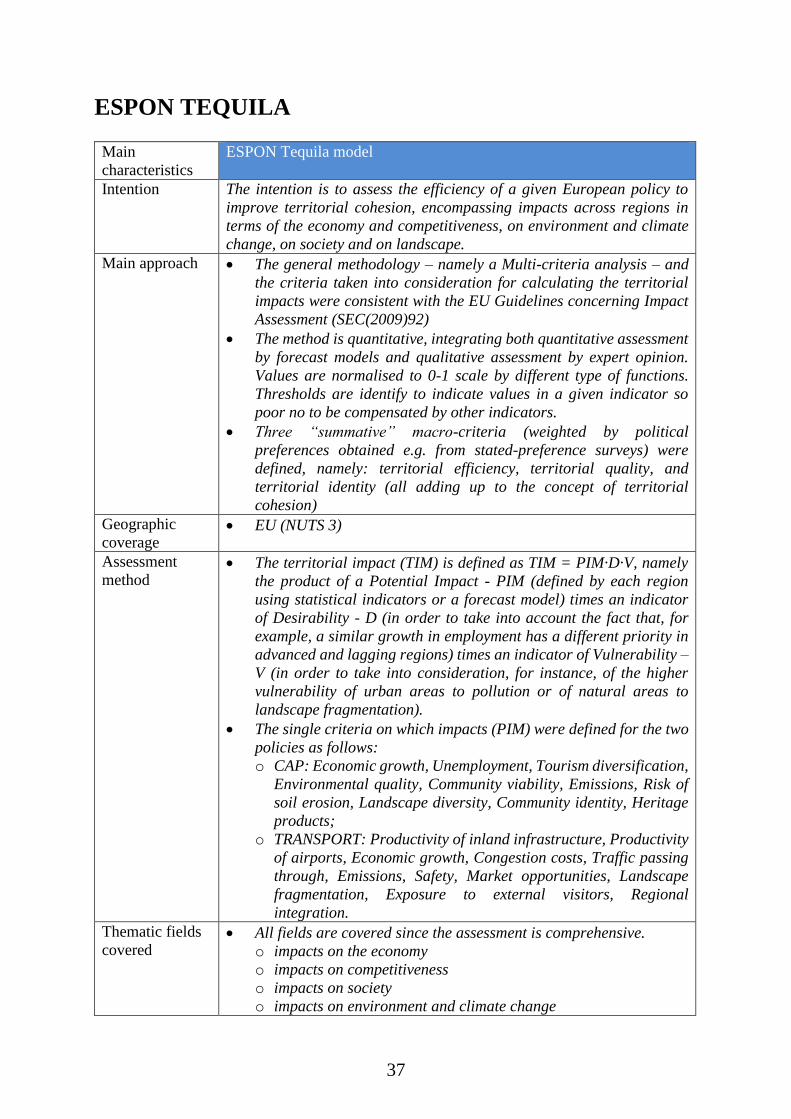
37
ESPON TEQUILA Main
characteristics
ESPON Tequila model
Intention The intention is to assess the efficiency of a given European policy to
improve territorial cohesion, encompassing impacts across regions in
terms of the economy and competitiveness, on environment and climate
change, on society and on landscape.
Main approach The general methodology – namely a Multi-criteria analysis – and
the criteria taken into consideration for calculating the territorial
impacts were consistent with the EU Guidelines concerning Impact
Assessment (SEC(2009)92)
The method is quantitative, integrating both quantitative assessment
by forecast models and qualitative assessment by expert opinion.
Values are normalised to 0-1 scale by different type of functions.
Thresholds are identify to indicate values in a given indicator so
poor no to be compensated by other indicators.
Three “summative” macro-criteria (weighted by political
preferences obtained e.g. from stated-preference surveys) were
defined, namely: territorial efficiency, territorial quality, and
territorial identity (all adding up to the concept of territorial
cohesion)
Geographic
coverage EU (NUTS 3)
Assessment
method The territorial impact (TIM) is defined as TIM = PIM·D·V, namely
the product of a Potential Impact - PIM (defined by each region
using statistical indicators or a forecast model) times an indicator
of Desirability - D (in order to take into account the fact that, for
example, a similar growth in employment has a different priority in
advanced and lagging regions) times an indicator of Vulnerability –
V (in order to take into consideration, for instance, of the higher
vulnerability of urban areas to pollution or of natural areas to
landscape fragmentation).
The single criteria on which impacts (PIM) were defined for the two
policies as follows:
o CAP: Economic growth, Unemployment, Tourism diversification,
Environmental quality, Community viability, Emissions, Risk of
soil erosion, Landscape diversity, Community identity, Heritage
products;
o TRANSPORT: Productivity of inland infrastructure, Productivity
of airports, Economic growth, Congestion costs, Traffic passing
through, Emissions, Safety, Market opportunities, Landscape
fragmentation, Exposure to external visitors, Regional
integration.
Thematic fields
covered All fields are covered since the assessment is comprehensive.
o impacts on the economy
o impacts on competitiveness
o impacts on society
o impacts on environment and climate change

38
Main
characteristics
ESPON Tequila model
o impacts on landscape and local identities
Data basis Data used on the CAP and CTP test application was obtained from
specialised databases and modelling tools.
Impact indicators to be selected were indicated by sectoral experts
and then discussed and adjusted based on data availability and
modelling tools.
In the case of CTP, TRANSTOOL model (2009 version, by
DGMOVE) was applied to simulate scenarios on market regulatory
and investment policies and obtain the 11 indicators (or proxies) to
compute PIM, and then the macro-criteria leading to the overall
assessment.
Timing Ex ante
Institutions
involved The method was developed by POLIMI, a research institution, and
applied by a University with expertise on CAP and a consultancy
expert on transport policies.
Examples of
applications TEQUILA was applied for the Agricultural policies as well as the
Transport policies in the ESPON Tequila project
Advantages The method includes all dimensions needed to assess the
improvement of European territorial cohesion generated by a given
policy, and then facilitates a comprehensive political discussion in
relation to how efficient is in this respect.
Transparent aggregation procedure of the method that can be
relatively easy understand by decision makers and other
stakeholders. The difference between scientific assessment of
indicators and political choice of criteria and preferences among
them is clear.
Disadvantages Data scarcity and conceptual ambiguity may produce controversial
results that are highlighted when displaying results in maps.
Integrating results in graphics and aggregated by types of regions
may reduce this possible disadvantage.
Difficulty to use it on an ex-post evaluation mode. Hardly can be
applied to assess the territorial impacts of EU policies after their
completion
ESPON EATIA Main
characteristics
ESPON EATIA model
Intention The intention is to assess the potential territorial impacts of European
draft directives and to support their implementation processes.
Main approach The EATIA framework / methodology has been developed through
the following 4 stages:
o (1) Establishing differences and similarities of existing
assessment tools and TIA
o (2) Designing a preliminary TIA framework:
o (3) Testing the applicability of the TIA framework and refining it:

39
Main
characteristics
ESPON EATIA model
o (4) Assessing the usefulness and benefits, as well as associated
costs of applying the TIA framework; further refinement of the
framework.
The framework has been developed around three complimentary
strands; procedural, technical and governance.
Geographic
coverage National and tested for UK, Portugal and Slovenia
Assessment
method There are four main stages of the TIA process:
o Stage 1 – Screening aims to determine the necessity for TIA on a
case-by-case basis, that is, whether the approach should be
employed or not employed for a specific policy proposal.
o Stage 2 - Scoping aims to steer the entire TIA process by
determining: whether major territorial impacts are likely to result
from the proposed policy; what the nature of these impacts is; and
where these impacts are likely to emerge geographically.
o Stage 3 – Impact Assessment, the assessors need to complete the
IAM, developed during scoping, by considering the impact of the
policy proposal (or of each policy proposal element) on the
locality in question in terms of the territorial characteristics used
in scoping and possibly other, local characteristics.
o Stage 4 – Impact Evaluation aims to be able to determine whether
the potential impacts identified in the assessment stage are
significant, both, positively and negatively, and to comment, in
particular, on how any undesirable impacts could be avoided or
mitigated though e.g. changing the wording of a directive
proposal or altering the transposition approach.
Thematic fields
covered Employment, Investment in research and development, Greenhouse
gas emissions, Renewable Energy, Energy Efficiency, Educational
attainment, Poverty and social exclusion
Data basis The data was collected through workshops with three national
stakeholders; the national government departments / ministries
responsible for spatial planning of the UK, Portugal and Slovenia.
ESPON documents and projects such as ARTS project and the
TEQUILA model
Timing Ex-ante
Ex-post
Institutions
involved Institutions involved are the departments and ministries responsible
for spatial planning from three member states; the UK, Slovenia and
Portugal (the Stakeholders), impact assessment expert teams of four
universities (Liverpool, Ljubljana, Porto and Delft) and ‘learning
networks’ of between 15 and 20 public and private sector
practitioners from each of these countries.
Examples of
applications During the development, the methodology has been tested in the UK
(including local testing in Dover and Leeds, regional testing in
Northern Ireland and Scotland), Slovenia and Portugal (at national
level and regional in the Norte region).

40
Main
characteristics
ESPON EATIA model
Advantages Highly participatory methodology, which allows the involvement of
national, regional and local departments responsible for spatial
planning
Disadvantages Does not define all dimensions and components of Territorial
Cohesion.
TARGET_TIA Main
characteristics
TARGET_TIA
Intention Assess and compare territorial impacts of a selected measure by
applying a multi-vector approach on predefined territorial cohesion
dimensions.
Assessment
method
Hybrid: qualitative (degree of impact: +4 / - 4); and quantitative
(aggregated statistical index). For ex-ante evaluation only the qualitative
assessment is viable.
Data basis Qualitative assessment
Both internally and externally produced information resulting from:
report and bibliography readings; interviews to national experts
and policy officials; stakeholder and expert consultations; project
analysis. The information collected is used to produce a TIA
qualitative assessment.
Quantitative assessment
Externally produced statistical indicators, used and combined in an
aggregated statistical index.
Thematic fields
covered
Applicable to different thematic fields. Available examples focus mainly
on territorial cohesion and EU cohesion policy impacts at different
levels.
Action addressed Policies
Programmes
Projects
Timing Ex-ante
Ex-post
Institutions
involved The TARGET_TIA should be performed by a service provider and a
consistent share of the work is carried out via desk research and
elaboration
National experts and policy officials are also involved in the
qualitative assessment.
Examples of
applications EU Cohesion Policy in the Iberian Peninsula (ex-post)
EU Cohesion Policy in Algarve, Portugal (ex-post)
Portuguese and Spanish cross-border programmes (ex-post)29
EU Cohesion Policy in Sweden (ex-post)30
29https://www.evaltep.cz/inpage/cross-border/
https://www.tandfonline.com/doi/pdf/10.1080/21681376.2014.999108 30 https://estif.lexxion.eu/article/ESTIF/2015/4/8

41
Advantages Both ex-ante and ex-post evaluation;
It produces a TIA value, therefore allowing for comparability with
other territories or policies;
It allows to assess multiple dimensions. Not only socio-economic-
environmental but also all territorial development dimensions
Facilitated application. Impact elements all together in excel
spreadsheet with predefined formula and coefficients.
Disadvantages Identification of concrete goals and related dimensions can be
challenging, especially in territorial cohesion policies.
Selection of appropriate territorial scale and time frame in relation
with statistic indicators availability.
The assessment can be financially costly due to the large data
collection, especially if an ex-post evaluation is chosen.
Process can become overly lengthy for non-experienced evaluators.
ESPON TIA-CBC Main
characteristics
TIA-CBC: Cross-Border Cooperation
Intention The methodology will allow policy makers and practitioners to obtain
evidence on the territorial impact of CBC programmes and help on
developing better-informed cross-border policies.
The working steps follow a sequence of desk research by the TIA service
provider which is then reflected on with an expert panel in the next step,
whose input again is relevant to the following desk research step by the
service provider.
Assessment
method Quantitative, Semi-quantitative, Qualitative
The approach follows a structured procedure:
Step 1: Programme Characterisation
Step 2: Identification of programme effects
Step 3: Indicator Assessment
Step 4: Impact assessment
Step 5: Reporting
Data basis Mixed combination of:
Externally produced quantitative data – indicators
Internally produced qualitative data - panel discussion and
workshops
Produced by TIA in the form of semi-quantitative and quantitative
net assessment – also done through panel discussion and workshops.
Thematic fields
covered
Adaptable to the specific objectives of the cross-border cooperation
scheme that is under evaluation.
Action addressed Cross border cooperation programmes
Timing Ex post
Institutions
involved
The TIA is a joint exercise between a service provider, programme
authorities, and key stakeholders and experts involved in the workshops.
Examples of
applications The methodology has been tested during its methodology in 5 cross-
border regions, namely Germany-Netherlands, Sweden-Norway,

42
Romania-Bulgaria, Ireland-Northern Ireland-Scotland, and Spain-
Portugal
Advantages It is an ad-hoc methodology for Cross-Border programmes at EU level.
The tool is therefore highly specialized and can be easily considered the
best option available when dealing with such programmes. Nonetheless,
the general approach, strengthened by a double expert validation, can be
transposed into other contexts as well.
Disadvantages It allows only for Ex post assessment, therefore activating a learning by
mistake process, but not a foresight approach.
The high specialization of the methodology, which originates already in
the very design of the methodology, does not allow TIA-CBC to be
applied in different contexts as it is; it would require a supplementary
effort for its adaptation.

43
Annex 2 CBA categories Synthesis of impacts and cost-benefit categories based on DG REGIO (2014)
COSTS/BENEFIT
CATEGORY
METHODOLOGICAL
APPROACH
BASIC DATA SOURCES OF
INFORMATION
Investment costs
Quantitative estimation Detailed accounting of all
investment costs. Includes
measures to mitigate negative
impacts.
Project data
Disruption during
the construction
period
Quantitative estimation of the
impact and monetisation if
possible. Alternatively,
qualitative assessment if
disruption is relevant.
For existing traffic, during the
construction period, changes
on: Time and operating costs;
accidents; emissions; noise
Hypotheses based on the
number of vehicles and citizens
affected by disruptions during
the construction period.
Transport
providers’
operating costs
Quantitative estimation Detailed accounting of all
transport providers’ operating
costs
Project data, project promoters’
data.
User benefits
Travel time
savings
Quantitative estimation of the
effect on travel time of various
categories of users and
monetisation through
corresponding value of time
Values of time savings
(segmentation of users if
possible) and Travel time
estimates
Travel time is generally an
output of the traffic model.
Social values (shadow prices)
may be used if consistent and
politically accepted.
Comfort
improvement
Monetisation through travel
time on affected parts of the
journey, or qualitative
description (depending on data
availability).
Changes on the adopted values
of time due to the modification
of comfort conditions.
Qualitative investigations
about perceived comfort
conditions
Congestion Quantitative estimation of the
impacts on travel time,
reliability, additional
environmental, safety, etc. if
transport data allows.
Additional travel time,
additional emissions, accidents,
etc. Monetary valuation
consistent with the overall
valuation of the two impact
categories.
Transport model
Vehicle operating
and maintenance
costs
Quantitative estimation Detailed accounting of all
vehicle operating and
maintenance costs.
Project data, project promoters’
data.
Safety Quantitative estimation of
accidents (deaths, injuries, etc)
and monetisation.
Number and severity of
accidents and casualties by
mode. Direct and indirect
economic costs, and value of
statistical life.
The number and severity of
accidents is generally taken
from national/ international
statistics
Fares, tolls and
other charges
Quantitative estimation in the
financial analysis. Results
presented in the Stakeholders-
Effect Matrix. No economic
impacts beyond those in
investment and operating costs
of revenue collection.
Detailed data on current fares
and other tariffs and traffic
forecasts.
Ad hoc surveys of existing tariff
system. Forecasts on the
evolution of tariff policy are
based on the strategy decided
by the project promoter.
Taxes and
subsidies
Quantitative estimation in the
financial analysis. Results
presented in the Stakeholders-
Effect Matrix. No economic
impact.
Detailed accounting of current
taxes and subsidies system and
forecasting.
Ad hoc surveys of existing and
planned taxation and
subsidisation systems.
Environmental
impacts
Air pollution Quantitative estimation of the
impact through monetisation.
- Pollutants’ emissions (NOx,
VOCs, SO2, PM10 and PM2.5,
CO) by mode and type of
vehicle related to the urban
cycle. - Unit costs for the
various pollutants.
Emission data from
environmental agencies or
national/international
databases.

44
COSTS/BENEFIT
CATEGORY
METHODOLOGICAL
APPROACH
BASIC DATA SOURCES OF
INFORMATION
Global warming Quantitative estimation of the
impact through monetisation.
- Emissions of greenhouse
gases (CO2, N2O and CH4 in
CO2 equivalents).
- Unit cost for ton of CO2.
Emission data from
environmental agencies or
national/international databases
Noise Quantitative estimation of the
impact through monetisation.
- Perceived noise levels.
- Number of persons exposed,
by noise levels.
- Unit costs for changes in
exposure.
Project data.
Unit costs are drawn from ad
hoc surveys or from
international research.
Territorial
impacts
Impacts on land
use and land
consumption
Qualitative description. Land consumption is
considered if value not properly
reflected in investment costs.
The degree of detail of this
analysis depends on whether
these impacts are the focus of
the project.
Included in Multi-criteria
analysis
Severance and
visual intrusion
Qualitative description. Changes in property values due
to the project, residents and
visitors’ preferences
concerning visual intrusion.
Included in Multi-criteria
analysis
Impacts on
economic
development
Qualitative description. Added value and jobs created
during the construction,
directly created after works
finalised, and induced
indirectly
Included in Multi-criteria
analysis
Social impacts Qualitative description. Information about project
impacts in terms of social
cohesion and quality of life
Included in Multi-criteria
analysis
Analysis of the
distribution of
impacts
Stakeholder analysis based on
the Stakeholders-Effect Matrix.
Identification of the relevant
stakeholders and effects.
Disaggregated results CBA
The same sources indicated for
the other impact categories.

EN
QG-04-19-758-EN-N
ISBN 978-92-895-1031-8doi:10.2863/797486
Created in 1994 following the signing of the Maastricht Treaty, the European Committee of the Regions is the EU's assembly of 350 regional and
local representatives from all 28 Member States, representing over 507 million Europeans.
Rue Belliard/Belliardstraat 101 | 1040 Bruxelles/Brussel | BELGIQUE/BELGIË | Tel. +32 22822211www.cor.europa.eu | @EU_CoR | /european.committee.of.the.regions
/european-committee-of-the-regions