state-of-the-art methods for design and integral brdige ...€¦ · ce 690 state-of-the-art methods...
TRANSCRIPT

CE 690
STATE-OF-THE-ART METHODS FOR DESIGN OF INTEGRAL BRIDGE ABUTMENTS
Submitted To:
Amde M. Wolde-Tinsae, Associate Professor Department of Civil Engineering
Iowa State Vniversity
In partial fulfillment of requirements for th.e degree of Master of Science
Sponsored.By:
Iowa Department of Transportation, Highway Divi~ion Through the Iowa Highway Reseach Board,
Project HR-227, and the Federal Highway Administration
By:
Bruce Johnson, Assistant Bridge Engineer Federal Highway Administration
Iowa Division . '
August 1981

TABLE OF ·CONTENTS
I. INTRODUC~ION
1. Background .1 .
2. Purpose .. .10
3. Plan of Investigation . ~·· .11
II. SURVEY OF CURRENT PRACTICE r 1. Purpose .13
2. Questionnaire .13
3. Trends. in Responses .14
4. Review of Details and Design' of Selected States .21·
a. Tennessee • '.21
b. Kansas .22
c. Missouri .23
d. North Dakota .23
e. California .25
f. Iowa .25
5. Sunmary .. .. . .26
III. LITERATURE REVIEW
1. Analytical Approaches . \• . .29
2. Development of Load-displacement (p-y) Curves 10 . .31
3. Example p-y Curves .38
4. Development of Load-slip Curves .43 ~
5. Exami>le Load-slip Curves . .49 \. .,...,

6. Previous Research .54
a. California .54
b. Missouri .• .60
c. South Dakota .62
d. North Dakota .64
7. Summary .66
IV. CON CL US IONS .69
v. REFERENCES • 71
VI. APPENDIX I .75
VII. APPENDIX II .85
VIII. APPENDIX III .89
ACKNOWLEDGMENTS .97 ..

. LIST OF F.IGURES
1. Cross-section of Bridge with Integral Abutment
2. Cross-section of Bridge with Expansion Joints
3. Integral Abutment Details (Cont.)
4. Semi-integral Abutment Details
5. Integral Abutment Pile Loads
6. Simplified Pile Stress Analysis
7. Resistance - Displacement (p-y) Curve
.. .
• .2
.. . . . .3
• • 5 • • • • .-6
• • • • • 7
• • • • • • 8
.8
. . . . . .30
8. Load-slip Curves . . . . . . . . ~ • .32
9. "A" Coefficient Chart • .37
10. "B" Coefficient Chart • • • .37
11. ·Approximate p-y Curve for a Fine Sand •• 39
12. Skin Friction Distribution .47
13. Approximate Load-slip Curves .51
14. Empirical Load-slip Curves .52
15. Initial Slope Estimate for Load-slip Curves •• • • .53
16. Sample Inspection Record of Structu~es Without Expansion Joints .56
17. Calculated Versus Experimentally Determined Pile Moments .59
18. Sketch of Moore Engineering Integral Abu.tment System ••• 65
/
•

LIST OF TABLES
1. Integral Abutment ·Bridge Length Limitations (1981) • .17
2. Constants Used in p-y Relationships .35
3. Reconmended nh Values .40
4. Ultimate Soil Shear Resistance . ·' . . • • • .48
5. · Load-slip Curve Initial Slope Reconmendations • • .55
6. Integral Abutment Bridge Length Limitations (1972) ••• 61
7. Reconmended Load-slip Parameters . . . . . . . .67
8. Reconmended p-y Relationships •• . . . . . . . . . . ' . . . .67
j
)
• • 1, ~
- -,.-_ .. ··~ - :, ·-· - . ..,, ... ./.,:'

LIST OF NOTATIONS
A = Empirical coefficient
a = Empirical constant
ao = Horizontal angle of initial portion of a load-slip. curve
B = Empirical coefficient
b = Pile width
C = Constant based on soil properties
c = Soil shear strength
d = Pile diameter
E = Elastic modulus
H = Depth below which the soil response is unaffected by the ground
surface boundary
I = Pile moment of inertia about the loaded axis
Ka = Rankine coefficient of minimum active earth pressure
Ko = Coefficient of earth pressure at rest
k = Modulus of horizontal subgrade reaction
L = Portion of the bridge length affecting thermal expansion at one abutment
le = Effective length of the pile
M = Applied moment in the pile
M(x) = Moment along the length of the pile
M(le) = Moment at the point.of fixity
m = Slope of the intermediate portion of a P. -y curve for sandy soils I .
N =·Standard pertetration blowcount
Nc = Dimensionless bearing capacity factor
Nq = Dimensionless bearing capacity factor
n = Empirical constant

nh = Constant of horizontal subgrade reaction
P = Lateral load at the pile top
Pm = Lateral soil resistance at a lateral deflection (y) of b/60
Pu = Ultimate lateral soil resistance
p = Soil resistance
Pp = Pile perimeter
Q = Axial pile load
qe = Ultimate soil resistance
qo = Effective vertical stress at the pile tip
x = Depth measured from the ground surface
y = Lateral deflection of the pile
Yk = Maximum deflection of the elastic portion of a p-y curve in sand
Ym = Maximum deflection of the parabolic portion of a p-y curve in sand
Yu = Ultimate lateral deflection
o< = Coefficient of thermal expansion
/1 = Rankine angle of passive earth pressure
L\ = Lateral deflection at the top of the pile
! T = Allowable temperature drop of rise
6. = Soil strain in a standard triaxial test
'I'= Average effective unit weight of a
¢>= Soil friction angle
fl= Vertical pile settlement
r = Stress in the extreme fibers of
'J;nax = Ultimate soil shear resistance
~= Rotation at the pile top
the
soil
pile
from the surface to depth (x)

I. INTRODUCTION
1. Background
The routine use of integral abutments to tie,bridge superstructures to
foundation piling began in this country about 30 years ago.19 · Kansas,
Missouri, Ohio, North Dakota, and Tennessee were some of .the early users.
This method of construction has steadily grown more popular. Today more
than half of the state highway agencies have developed design criteria for
bridges without expoosion joint devices.
Most of the states using integral.abutments began by building them on
bridges less than 100 feet long. Allowable. lengths were increased based on
good performance of successful connection details. Full-scale field
testing and sophisticated rational design methods were not comnonly used as ' .
a basis for increasing allowable lengths~ ·This led to wide variations 1n
criteria for the use of integral abutments from state to s~ate. In 1974
the variation in maxiurum allowable. length for concrete bridges using -
integral abutments between Kansas and Missouri was 200 feet.19 A survey
conducted by the University of Missoui:;i in 1973 .indicated that al1owable ·
lengths for integral abutment concrete bridges in some states were 500 feet.··
while only 100 feet in others.
The primary _purpose for building integral abutments is to eliminate
bridge deck expansion joints, thus reducing construction and maintenance
costs• A sketch of a bridge with integral abutments is shown in. FIGURE 1. . . .
Conventional bridge bearing devices often become ineffective and ·are
susceptible to deterioration from roadway runoff through.· deck joints. which
are open or leak. A cross~section of a bridge with stub abutments and deck
joints is shown in FIGURE 2.

. CROSS-SECTION. OF A BRIDGE WITH INTEGRAL ABUTMENTS
Bridge deck-.... Reinforced concrete ap~rooch slob -'1 ===t I . I
:---1-------------=-----~--~-------------------1· __ J . Girder -' Integral abutment ___., __
Flexible piling ----~
FIGURE I
N

CROSS- SECTION OF A BRIDGE WITH EXPANSION JOINTS
t Exponsi1on joint :-,
I Bridge deck ~ ·
Girder../
Reinforced concrete approach slab -i
J Stub abutment ..--.,.
Battt-red piling ----·
FIGURE 2

4
In an integral abutment bridge with flexible piling, the thermal
. stresses are transferred to the substructure via a rigid connection.
Various construction details have been developed to accomplish the transfer
as shown in FIGURE 3. The abutments contain sufficient bulk to be con-
sidered a rigid mass. A positive connection to the girder ends is
generally provided by vertical and transverse reinforcing steel. This
provides for full transfer of temperature variation and live load
rotational displacements to the abutment piling.
The semi-integral abutments shown in FIGURE 4 are designed to
minimize the transfer of rotational displacements to the piling. They do
transfer horizontal displacements, and they also allow· elimination of the
deck expansion joints. Ro~ation is generally accomplished by using a
flexible bearing surface at a selected horizontal interface in the abutment.
Al lowing rotation at the pile top generally reduces pile. loads.
i The stresses in the abutment piling are dependent on the axial. load
(Q), lateral load at the top of the pile (P), rotation(-&) allowed at the
abutment, stiffness (EI) of the pile, and resistance (p) of the soil
(see FIGURE 5). Various simplifying assumptions can be made to allow a rou-
tine mathematical analysis of the system to be developed. An elastic solu-
tion based on statics can be obtained by assuming p = 0 and fixing the pile at
some effective length (le) (see FIGURE 6). The point of fixity is assumed
such that the lateral load-deflection response at the pile top is similar
to that of the actual case considering soil support. Lengths of 10 feet and
10 .5 feet have been used by some state highway agencies .38' 14 By assuming
that the abutment is free to rotate and that the moment due to the axial
load (Q) is very small compared to the bending moment caused by the lateral

y-rt At>utmenl
I -I -
--- -I
/
CALIFORNIA 6 , -- -
- ! /
INTEGRAL ABUTMENT DETAILS -
FIGURE 3
/ 'l. Abutment
r- ... ;. ,. - ,. - ·'' . ·_ s:::' =:::i.
. - j~ . ~fl-:- -:- -:-1-. f . I . . . . .
' 'l • •'
~ L. I· > . -... ~_:_ __ ....... ---f
: 4 ~i-:·---~ -L ----
MISSOURl5
\.n
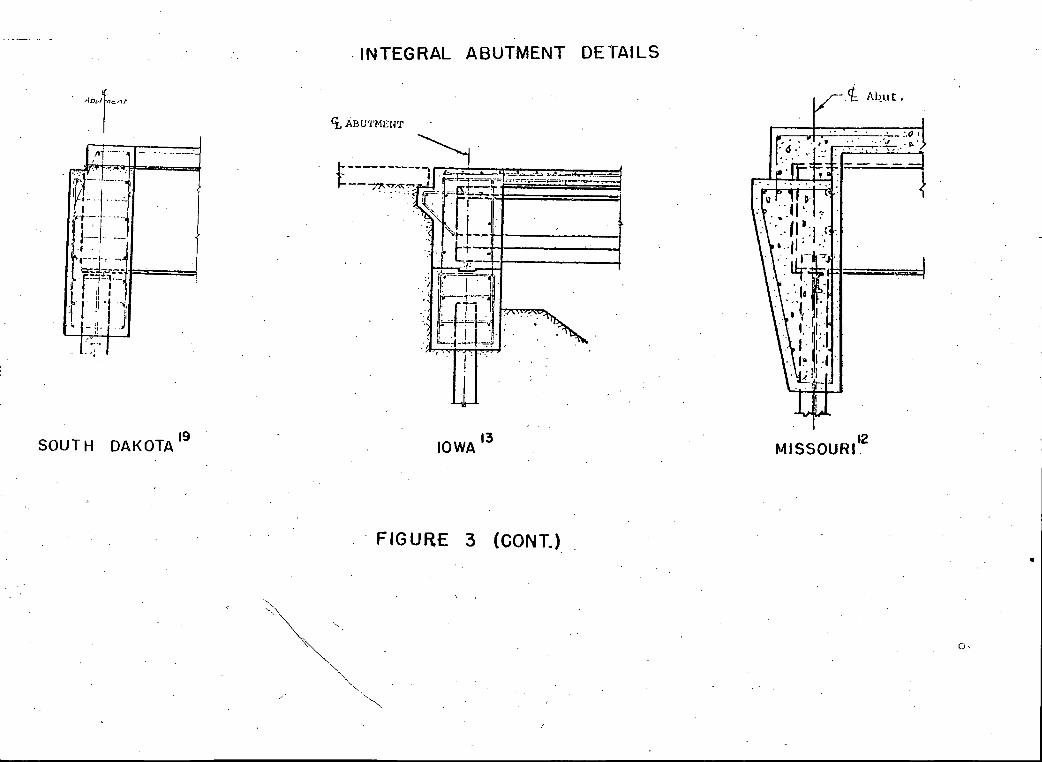
- INTEGRAL ABUTMENT DETAILS
<i. ABUTMENT
--------~ t ! ~~:!.:;;-;.~-_;,,~~ --~~~'.' ~·J1t . .
' ""i-t--~-----i t:;~:-'l:.-i--------1
·.': r-=-j. -I .:.· r:rt1"-~ . ··: t~t~r=r=l ; . _.; L:.,c.~· -~ .. I, .. · ..
SOUTH DAKOTA 19
IOWA 13
MISSOURl12
· FIGURE 3 (CONT.) •

SEMI-INTEGRAL ABUTMENT DETAILS
- '{_ Abut.
- - - - - -_ - 'b
- .,.. -11 - -• p ~ I •I . : - 11- : 11 _.
- .. -. I • I L-...-:J ·i
IJ.;:--d
CALIFORNIA 6 MISSOUR1
12
FIGURE 4
-.J

INTEGRAL ABUTMENT PILE LOADS
r' L ... .. ,
FIGURE 5
SIMPLIFIED
p
PILE STRESS
~ n
I I I I I I
I I I
I I I
I I I I
ANALYSIS
ix· FIGURE 6
8

9
load (P), the following expressions result:
A = Ple3/3EI
M(x) = Px + Q(.6 -y) . . . . . . . . . . . . • (1)
M(le) = Ple = 3EI~ /( le)2
Where:
M(x) = Moment along the length of the pile
M( le) = Moment at the point of fixity
x = Depth from the ground surface
y = Lateral deflection of the pile
ll = Lateral deflection at the top of the pile
E = Elastic modulus of the pile
I = Pile moment of inertia about the loaded axis
In Iowa HP 10 x 42 steel piles are used predominantly in integral
abutments with a 6.0 ksi vertical design load on bridges over 200 feet
long. As an example, the stress in an HP 10 x 42 pile will be calculated
ignoring soil support for an embedment length of 10 feet and a lateral
deflection of 1 inch. The last two criteria are used by Tennessee to
establish maximum allowable bridge lengths using integral abutments.
M(le) = 36.1 Ft-Kips
r =My/I+ Q/A = 3Ey/(le)2 + Q/A ••• (2)
~ = 30.4 + 6.0 = 36.4 ksi
As shown by·EQUATION 2 the piling stress can be decreased by
minimizing the cross-sectional width of the pile. The. stress for the next
size smaller pile, an .HP 10 .x 36 (with y = 4.079), is 30.5 ksi. Changing

10
the fixity condition at the pile top. from "free" to "fixed" substantially
increases the calcul'ated stresses for· a given lateral deflection at the top.
These simplified elastic equations indicate· that the pile stresses are
in the elastic range for movements of about 1 inch. A recent study in
North Dakota included monitoring deflections in a 450-foot concrete box
beam bridge. The total ·maximum movement iiicluding c~~traction and
expansion was found to be about .2 inches at each abutment. When the soil
resistance is included in the analysis, the calculated stress is reduced
but still can be above yield.
The limit of allowable horizontal movement which will cause
objectionable pile stresses has not been well defined. This is one reason
why the wide variation in design crite~ia exists among the state highway
agencies. A related questi~n which may be eq~ally difficult to answer is
to define the level of. objectionabl_e. stress in a pile. That is, can
embedded piles give acceptable service operating at or· near their yield
strength? Experience in Tennessee.and studies in North Dakota seem to
~ indicate that they can •.
2. Purpose
If thermal stresses ca.n be accurately predicted and appropriately
handled, the elimination of deck joints on as many bridges as possl.ble
is desirable. The current length .limitation in Iowa for the use of . .
integral abutments in concrete bridges is 265 feet. The first applicatiOn
with steel I-beam bridges in Iowa is currently under construction. These
dual Interstate bridges are 263 feet in length.
The purpose of this study is to gain a better understanding of the
. . 1
\.,

\.....-' .• -
11
behavior of integral abutments and to present background information
for the Iowa Highway Research Project HR-227, "Piling Stresses in
Bridges with Integral Abutments." The objective of the research study
is to propose maximum .bridge lengths for stee 1 and concrete bridges for
which integral abutments can safely be used.
3. Plan of Investigati.on
A survey questionnaire w,as prepared in cooperation with the Office
of Bridge Design, Highway Division, Iowa Department of Transportation,·
to obtain information concerning the use and design of integral bridge
abutments. Based on a review of the survey, several states were later
contacted to gain a better understanding of successful design details
and assess the performance of reletivel~ long integral abutment bridges.
Summaries of these telephone conversations with bridge engineers in
Tennessee, Missouri, North Dakota, Kansas, and California are included
in: section II-4 of this rep.ort.
Most of the states which use integral abutments, as shown- in
APPENDIX I, have developed specific guidelines concerning allowable
bridge lengths, design of the backwall,_ type of piling, etc. The basis
of these guidelines is shown to be primarily empirical.
A brief review of available methods of mathematically representing
the pile-soil ~ystem is conducted to determine what types of soil
information.are required. Methods of obtaining the soil data are discussed
and limits are presented for use in the analysis.
Previous experimental studies have been conducted by Rowe,34 Alizadeh
and Davison,1 Paduana and Yee,36 South Dakota Department of Highways,19
and North Dakota State University .17 These projects were reviewl:!d and

12
compared to the possible methods of soil parament representation. Results
are presented which may be significant to the current research project.

I;I:. SURVEY OF CURRENT PRACTICE
1. Purpose
Surveys concerning the use of integ'ral abutments have previously been
condµcted.19,12 They have indicated that there are marked variations in
/
design limitations and criteria for their use. Many states have not felt
comfortable using a system which does not. contain some "free spac~" for
temperature variation displacements to occur~
·Some of the variations among the ,states occur because of different
temperature range criteria. Also, depending on the extent of de-icing salt
use, some states may experience gr~ater problems with bridge deck expansion
joint devices than others. Naturally, it is difficult to justify altering
.existing construction techniques by eith.er beginning the use of i;tegral ' '·· '
abutments or using them for much longer bridges, if the possibility of
decreased distress ,and maintenance are not readily apparent.
The current survey was conducted to determine:
1. Various design criteria and limitations being used;
2. Assumptions being made regarding selected design parameters
and appropriate level of analysis;
3. Specific construction details being used;
4. Changes in trends since previous surveys were taken; and
5. Long-term performance of bridges wl.th integral abutments.
2. Questionnaire
The questionnaire was sent to the SO states and Puerto Rico. .Since
the Direct Construction Office, Region 15, Federal Highway Administration .
is involved in bridge construction on Federally owned property, a question-
naire was also sent to the design department in Arlington, Virginia. A
copy of the questionnaire and responses from each of these agencies are

14
contained in APPENDIX I.
The survey questions were directed at limitations in bridge length,
type, and skew. The states were also asked what assumptions were made
in determining fixity conditions and loads for design of the piling and
superstructure. A deeail drawing of the type of integral abutment used
in Iowa was included in the questionnaire.,
It was hoped that some of the states using integral abutments had
performed an analysis· regarding anticipat~d movements and pile stresses.
The questions regarding fixity and design loads were included to determine
what level of analysis was felt to be appropriate.
Much of the progress in the use of integral abutments has come about
by successive extention of limitations based on acceptable performance of
prototype installations. In order to l~arn more. from the several states
who have pioneered the use of integral abutments, questions.were asked
regarding costs and performance.
3. Trends in Responses
Of the 52 responses received, 29 indicated that they use· integral-type
abutments. A few of these, such as New Mexico and Virginia, are just
beginning to use them. Their first integral abutment bri.dge was either
recently designed or cu'rrent ly under construction •.
Of the 23 who did not use these abutments, there :were 4 groups ·having
similar responses.
1. Fourteen states have no plans to consider using this type of
abutment.
2. Five states responded that they have not previously considered
the p~ssibility of fixing the girder ends to the abutments.

15
3. Three states have built some integral abutments or semi-integral
endwalls, but currently do not use them in new bridge construction.
4. One state indicated that they were presently investigating the
possibility of using integral abutments.
The. following are some of the reasons given for avoiding the use of
integral abutments:
1. The possibility of a gap forming between the backwall and the
roadway fill (2 states);
2. Increased substructure loads ( 1, state);
3. The possible attenuation of a bump at the ends of the bridge
(1 state);
4. The lack of a rational method for predicting behavior (1 state);
5. The possible additional stress on approach pavement joints
(2 states); and
6. Cracking of the backwall due to superstructure end span rotation
and contraction (2 states).
One of the purposes of this study is to present methods of analysis
and design details which will reduce the potential ill-effects of these
concerns. Many of the states currently using integral abutments have
effectively solved most of these problems.
The following is a discussion of the responses received from states
using integral abutments keyed to .the question numbers of the survey. A
sunmary of the responses is contained in APPENDIX I.
1. Most of the states using integral abutments do so because of
cost savings. Typical designs use less piling, have simpler
construction details, and eliminate .expensive expansion joints.

16
Some states indicated that their primary concern was to
eliminate problems with the expansion joint. A few said that
simplicity of construction and lower maintenance costs were· .
their motivation.
2. & 3. TABLE 1 shows bridge length limitations currently being I
used. In su1I1I1ary, 70 percent or more of those states·using
integral abutments feel comfortable within the following range
of limitations: steel, 200-300 feet; concre·te, 300-400 feet;
and prestre·ssed concrete, 300-450 feet. There are 3 states using
longer limitations for each structure type. They typically
have been building integral abutments longer than most states
and have h~d good success with them. The move toward longer
bridges is an attempt to achieve the good performance observed
on shorter bridges for structures at the maximum practical
length limit. This achieves the maximum benefit from what many ,,,
regard as a very low main,tenance, dependable abutment design.
The difference in concrete and steel length limitations
·reflects the greater propensity of steel to react to temperature
changes. Although the coefficients of expansion are nearly . . ' .
equal for both materials, the relatively large mass of most
concrete structures makes them less reactive to ambient
temperature changes. ~is is reflected in the American
Association of State Highway and Transportation Officials
(AASHTO) design temperature variation, which is muc.h lower
for concrete.

TABLE 1
Number of States Maximum Length Steel Concrete Pres tressed
800 1 1
500 1 2
450 1 3
400 2 3 4
350 1 3 1
300 8 8 8
250 2 1
200 5 1 2
150 1
100 1
INTEGRAL ABUTMENT BRIDGE LENGTH LIMITATIONS (1981)
17
r /

18
4. Only a few stat.es responded to the question regarding limitations
on piling. Five states use only steel piling with integral
abutments.· Three others allow concrete and steel but not
timber. No length limitations for timber piling were giveri by
states other than Iowa. Timber piling is allowed in Iowa for
bridges le:ss than 200 feet in length.· If the length is greater
than 150 feet, the top of the pile which. is embedded in the
abutment is wrapped with 1/2 inch to 1 inch thick carpet padding
material. This allows some rotation of the abutment, reducing
the bending stress on the pile. Only 4 of the 29 agencies
indicated that the webs of steel piles were placed perpendicular·
to the length of the bridge. In subsequent phone calls to, a
few other states, it :was learned that others also fopow this
practice. At least 1 state began using integral abutments
with steel piling placed in the usual orientad.on. (with the pile
'web along the length of the 1'r~dge). ·This led to distress and
cracking at the beam,-abutment interface, and the st.ate eventually /.
began to rotate the pile~. by 90 degrees for greater flexibility.
The writer believes th.at many states accept this as conman
practice and, therefore,' did not mention it specificaliy.
5. & 6. Twenty-two states indicated that.the superstructure was
.assumed pinned at the abutments•, Five assumed partial fixity,
and one assumed total fixity •. seventeen responses noted that.at
the pile top a pinned assump~ion was made, 4 repor'ted a .. partial•
fixity assumption, and 5 states believe the pile top is·
totally fixed. Six of the states wh'ii:h assume a pinned condition

19
actually use a detail which is designed to eliminate moment
constraint a.t the joint. In the absence of a detail which
allows rotation, the appropriate assumption depends largely on
the relative stiffnesses of the pile group and the end span
superstructure. For example, if a single row of steel piling
with their webs perpendicular to the length of the bridge was
used with a very stiff superstructure, the joint would probably
behave as if it were pinned in response to dead and live loads
and as if it were fixed in response to temperature movements.
If the stiffness of the pile group were increased, some degree of
partial fixity would result depending on the ratio of stiffnesses.
7. Only a few states consider thermal, shrinkage, and soil
pressure forces when calculating pile loads. Several st.ates
noted on the questionnaire that only vertical loads are used in
design. Of those that do consider pile bending stresses, 8 use
thermal forces, 3 use shrinkage forces, and 10 consider soil
pressure.
8. Most states indicated that bending stresses in abutment piling
were neglected. There were 3 states, however, that assumed
a location for a point of zero moment and used combined bending
and axial stresses. Also, prebored holes were used by three
states to limit bending stresses by reducing the soil pressure.
9. Most states· indicated that a free-draining backfill material is
used behind the abutment. Some responses, however, indicated
that problems were e.ncountered such as undermining associated
with granular soils. One state said, "Have recently experienced

20
problems with non-cohesive material behind this type of
abutment. Backfill material should be cohesive and free from
cobbles and boulders." .Six other states us~ common roadway
fill behind the abutment.
10. All except 4 states rest the approach pavement on the
integral abutment. One state indicated that a positive tie
connection was 11 used to connect the slab. No comments regarding
the practice of resting the slab on a pavement notch were·
noted. A few states indicated that they have experienced
problems when reinforced approach slabs were not used.
11. & 12. All except 3 states reported lower construction and
maintenance costs using integral abutments. One said costs
were the same and 2 did not respond to the question. The·
following are some isolated comments that were made about
construction and maintena~ce problems using integral abutments:
a. Longer wingwalls may be necessary with cast-in-place,
post-tensioned bridges for ~ackwall containment;
b. The proper compac1:ion of backfill material is critical;
c. Careful consideration of drainage at the end of the
bridge is necessary;
d. Wingwall conc.rete should be placed after stressing of
cast-in-place, post-tensioned bridges;
e. The effects of elastic shortening after post-tensioning
should be care.fully considered, especially on single
span bridges;
'·.'.'

4.
21
f. Proper placement of piles is more critical than: for
conventional abutments;
g. Wingwalls may need to be designed for heavier loads to
prevent cracking;.
h. Adequate pressure relief joints should be provided i.n
the approach pavement to avoid interference with the
functioning of the abutment;
i. Possible negative friction forces on the piles .should
be accounted for in the design; and
j. Wide bridges. on high skews require special consideration
including strengthening of diaphragtlµ; and wingwall-to-
\ abutment connec:ions.
Review of Detai~ and Design of Selected States
Telephone visits were conducted ·with s·states to discuss in ·greater
depth the items covered on the questicmnaire and to become more familiar· /
with their design rationale for integral abutments. They were Tennessee,
Missouri, North Dakota, Kansas, California, and Iowa. Some of the items
covered in the visits are discussed b.elow.
a. Tennessee38
Tennessee has •extensive ~xperienc~ with integral abutment (' ' '
\
construction and performance. It is.estimated that over 300 steel
and 700 concrete bridges have been built with integral abutments.
Mr. Ed Wasserman, Engineer of Structures, Tennessee Department of·
Transportation, indicB:ted that the state was very pleased with the
performance of these' structures and has noted no undue stress on the
abutments.

22
The maximum length limits using integral abutments were arrived at
by setting'a limit of expansion or contraction of 1 inch. This figure
was developed empirically over a period of several years. By using a
simplified column analysis with an unsupported length of 10 feet the
state calculated the piling stresses to be just slightly over yield
when deflected only 1 inch. Tennessee uses the average AASHTO
temperature change of 350 F for concrete structures and 600 F for steel.
The ma~imum bridge lengths (2L) for this allowable deflection (A) are
ab.out 800 feet for steel and 400 feet for concrete.
L concrete = A = 1/12 = 396 feet a<c< $ l')c ( .0000060)(35)
L steel = ~ = 1/12 = 214 Feet. .• (3)
«s< 6T)s (.0000065) ( 60)
Where:
°'c = Coefficient of .. thermal expansion for concrete (AASHTO)
( J T)c Allowable temperature drop or rise for .concrete (MSHTO)
c:( s = Coefficient of tl:iermal expansion for steel (AASHTO)
f ( { T) s = Allowable temperature drop or rise for s.teel (MSHTO).
Terinessee has not completed any research work to verify the
assumptions used to develop design criteria other than observing the
good performance of constructed bridges. Abutment details used by
Tennessee are very similar to Iowa's. Timber piles are not 1:1sed.
b. Kansas39
Kansas h.as not pa~ticipate'd in formal research activities· to ·
formulate design criteria for integral 'abutments. The length

c.
/
23
limitations and details used have been developed empirically through
many years of experience. The following length limitations have been
established: steel, 300 feet; concrete, 350 feet; and prestressed,
300 feet. Mr. Earl Wilkinsen, Bridge Engineer, Kansas State Highway
Commission, indicated that a few cast-in-place bridges up to 450 feet
long had been built in the past with integral abutments, but this is
not the general rule.
Point-bearing steel piles with 9000 psi allowable bearing are used
most often. Some concrete filled steel shell piling or prestressed
concrete piles are occasionally specified.
Missouri25
Missouri had planned to instrument the piling of an integral
abutment several years ago but was unable to do so because of
construction timing. No other investigations of integral abutments
have since been planned.
Criteria for use of integral abutments have been developed
primarily from following the success of other states, notably Tennessee.
The maximum length limit for steel bridges has recently been. increased
from 300 to 400 feet. Over 100 co~crete bridges (mostly prestressed)
and over 40 steel bridges have been built with integral abutments over
~period of 12-15 years.
d. Nbrth Dakotall I
North Dakota has built over 300 bridges with integral abutments.
Most of these have concrete superstructures. They have had good
performance except in two areas. First, the superstructure was
originally connected to the backwall with dowell bars which were placed

24
\
with insufficient cover. In some places the concrete over the dowell
bars on the inside face of the backwall cracked due to therina_l force.s
caused by contraction of the.superstructure. Second, the piles were
origi~ally placed with the webs parallel to the long axis of the bridge.
Using this orientation caused some distress in the backwall since the
piles offered relatively large resistance to .lateral bridge movements~
The. problem was eliminated when the piles were installed with the webs
perpendicular to the long axis of the bridge.
North Dakota was an early user of integral abutments. Th.eir
design criteria is based mainly .on their own experience. No formal
analysis methods are employed to .calct1late stresses in the piles.
Steel and concrete.bridges are currently limited ·to 300 feet while
pre.stressed bridges are built up to 450 feet in length.
Last year the state built a 450-foot prestressed concrete box beam
br:idge on a 0 degree skew near Fargo, :r-:forth Dakota. The piling in the
integral abutments were instrumented with strain gauges and had
inclinometer tubes attached •. nr. Ji~ Jorganson, Civil Engineering
Department, North Dakota State Un~~ersity, was conmissioned to monitor
the movements and strains in the bri~ge for one year. He will have a
preliminary report prepared late this summer.. It appears that the .:_··
_maximum total movement at each end is about 2 inches.17 This is
equivalent to a temperature variation of about 117° F.
The inst.allation contains a unique feature which was' designed by
Moore Engineering, West Fargo, North Dakota. A special expansion joint
I
material several inches thick is :elaced behind the abutment backwall.
Behind it is· a sheet of corrugated metal. The mechanism is designed

25
to reduce passive earth press~res on the abutment and to help reduce
the formation of a void space upon contraction of the superstructure.
The system is shown in FIGURE 18 and discussed f-q,rther in Section III-6.
e. California7
California has engaged in several projects investigating the
performance of laterally loaded piles in bridge embankments. This
work has been done at California State University at Sacramento, and by
the California Department of Transportation, Bridge Department, arid
will be described more fully in the literature review. The research
was able to suggest a correlation between the coefficient of subgrade
reaction used in an elastic design method to the standard penetration
blowcount •. Maximum bending moments in steel H-piles were predicted
within 15 percent of measured values.
California does not analyze pile stresses due to bending at each
bridge site. Guidelines have been developed to aid designers in
determining the type of abutment to use. They are currently using
integral abutments with concrete b.ridges up to.320 ·feet long. Because
of the effects ~f elastic shortenin,g on application of post-tensioning
forces, the length limitation for prestressed bridges is about 100 feet
less. Design of the endwall is based on specified horizontal loads
depending on the type of piling used (see APPENDIX II).
f. Iowa14
Iowa began building integral abutments on concrete bridges in 1965.
One of the first was on Stange Road over Squaw Creek in Ames. Th is
prestressed beam bridge is about 230 feet long with no skew. The writer
visited this bridge in August 11
981 to deter~ine if any apparent disti:;ess

26
was evident. Both approaches were generally in good shape with no
major cracking noted. The abutment walls, wingwalls, and beams showed
no thermal movement related cracking or distress~
Mr. Henry Gee, Structural Engineer, Office of Bridge, Iowa
Department of Transportation, inspected at least 20 integral
abutment bridges yearly for about 5 years after construction. They
varied in length from 138 to 245 feet with skews. from 0 to 23 degrees.
The inspections were terminated since no distress or problems were
found which related to the lack of expansion joints in the superstructure.
Iowa's length limitation for integral a_butinents in concrete bridges
is 265 feet. This is based on an allowable bending stress of 55 percent
of yield plus a 30 percent overstress since the loading is due to
temperature affects. The moment in the pile was found by a rigid frame
analysis which considered the relative stiffness of the superstructure
and the piling. The piles were assumed to have an effective length of
10.5 feet, and the soil resistance was not considered. The analysis
showed that the allowable pile deflection was about 3/8 inch.
5. Summary
There is wide variation in design a~sumptions and limitations among
the various states in their approach to the use of integral abutinents ~
This is largely due to the empirical basis· for development of current
design criteria. Some s.tates, such as Tennessee and Iowa, have used
traditional statics analysis methods. for a beam or beam-column to estimate
piling stresses. It is recognized, however, that assumptions concerning
end fixity and soil reaction may substandally affect the results. A

27
simple rational method of accurately predicting pile stresses would be a
valuable addition to the current state-of-the-art in integral abutment
design.
Those who use integral abutments are generally satisfied with
performance and believe they are economical. Some problems have been
. reported, however, concerning secondary effects of inevitable lateral
displaceioonts at the abutment. These include abutment, wingwall,
pavement, distress, and backfill .erosion. Only a few states noted that any
difficulty had been encountered (see "Conlnents" section in APPENDIX I).
Other states reported that solutions have been developed for most of the
ill-effects of abutment movements.. They include: (1) additional reinforcing
and concrete cover in the abutment, (2) more effective pavement joints
which allow thermal movements to occur, and (3) positive control of bridge
deck and roadway drainage. From the.comments of most states, the writer
infers that the benefits from using integral abutments are sufficient to
justify the additional care in detailing to make them function properly.
Very little work has been done to monitor the actual behavior of
integral abutments 'except in checking for obvious signs of distress in
visible elements of the bridge. The re.search work being done in North
Dakota to monitor actual strains and pile displacements in an actual
integral abutment installation is one of very few full-scale projects. It
is reported on more fully in section III-6 of this report.
Several states have been· progressively increasing length limitations
for the use of integral abutments over the last 30 years. Improvements in
details have also taken place which generally can eliminate the possibility
of serious distress occurring with abutment movements of up to 1 inch. These

28
progressive steps .in state-of-the-art bridge engineering have occurred
over the past thirty years and are primarily the result of the observance
of satisfactory performance in actual installations.

III• LITERATURE REVIEW
1. Analytical Approaches
Several analytical studies2,9,21,22,29,31 have been made of the
laterally loaded pile problem. They are primarily based on Hetenyi's'
formulation for beams on elastic foundation.16 Most of the formulations
assume an elastic soil response, although some have included inelastic soil
behavior by using an iterative or step-wise· solution.
The two most promising solutions are the finite difference 'method and
the finite element method. They are step-wise formulations which can
consider two-dimensional soil reaction' variations. Both methods require a
computer for solution.
The finite difference. method involves the solution of the basic
differential equation of the laterally loaded pile at preselected node
points along the pile length.
+ p = 0 • • • • • • • • .(4)
Where:
x = Depth from the top of the pile
E = Modulus of elasticity of the pile
I = Pile moment of inertia
Q = Axial load on the pile
Lateral variations in the soil resistance (p) are handled by assuming
a value, solving for the deflection (y), and then iterating until a
preselected p-y curve (see FIGURE 7) for the node is satisfied.
The finite element sofotion gene:rally uses beam-type elements with

RESISTANCE- DISPLACEMENT (p-y) CURVES
Depth (in.) = 600 240
400
p(lbs./in.)
200 30
I 2 · y (in.)
FIGURE 7 21
30

31
I
three degrees of freedom (x and· y .translation and in-plane rotation) •
. Lateral soil springs are used to model the soil structure intera'ction
characteristics. The spring values are adjusted after iterative solutions
'I for pile deflections lilre compared with given p-y curves. After the. soil
resistance values are determined to the desired precision, the final
structural stiffness matrix is formed, displacements are calculated,· and
element forces and .stresses can' then be evaluated •.
The finite element solution has the ability to consider variable shear
.transfer. to the soil by. each element along the pile length. A typical
curve showing the load transfer to soil '!'ersus axial displac;:ement for
various depths is sho~n in FIGU~ 8.2
After each iterative displacement calculation, the vertical movement
due to axial strain in the pile is subtracted from the total deflection to
find the pile element slip. The load matrix is revised with the new
element friction load obtained by enter~ng the load-slip diagram for the
appropriate depth.2 The cycling continues until the current and preceding.
slip values' agree to a specified pr~cision.
2. Development of Load-Displacement (p_:.y) Curves
Probably the most accurate method of' developing p-y curves is to
use sensitive instruments to ~easure pile deflection and earth pressure
directly in a full-scale lateral load test~ Although the necessary
equipment could probably be.obtained given the level of current technology, . .
the method would be expensive and'dµie ~onsuming.
Another potentially accurate method· is to place electric s.train gaµges
along the length of the pile. After calculating pile stresses and bending

LOAD - SLIP CURVES
16
14
Load transfer 12
to soil (tsf) 10
8
6
4
2
Depth (tt.)=26.5
22.6
17.7
12.6
0.4 0.8 1.2 1.6 2.0 2.4 Vertical displocement(in.)
FIGURE 8 2
32
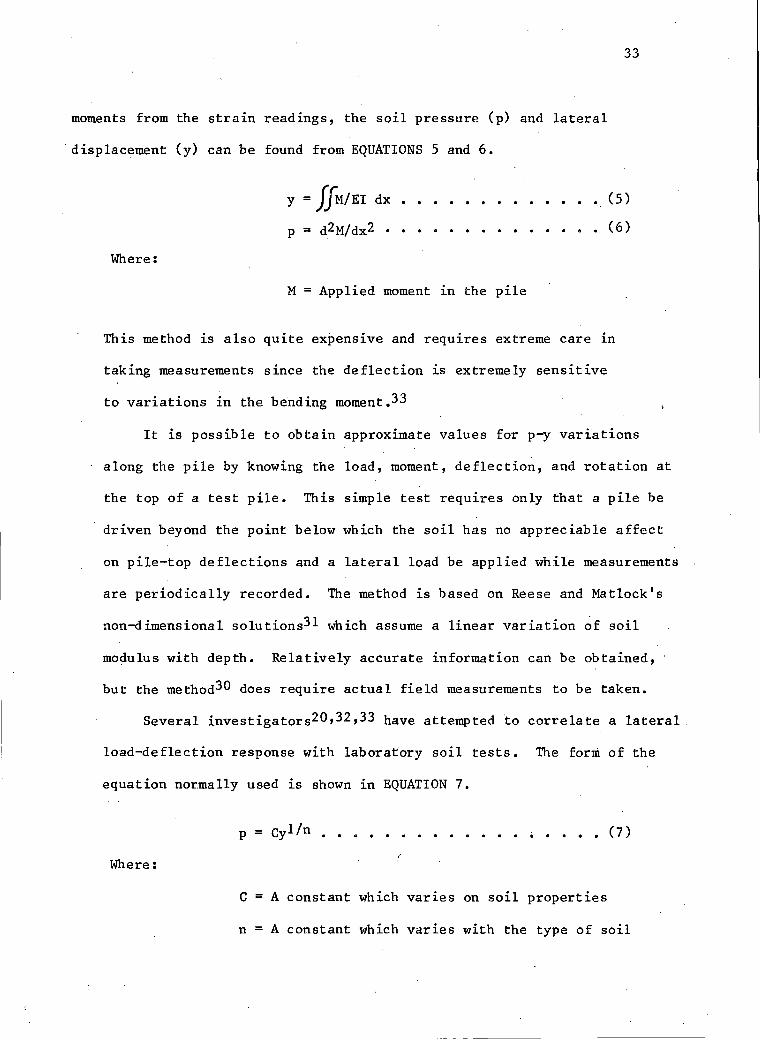
33
moments from the strain readings, the soil pressure (p) and lateral
·displacement (y) can be found from EQUATIONS 5 and 6.
Where:
y = ff Mf EI dx • •
p = d2M/dx2 • •
M Applied moment in the pile
. (5)
• (6)
This method is also quite expensive and requires extreme care in
taking measurements since the deflection is extremely sensitive
to variations in the bending moment.33
It is possible to obtain approximate values for p-y variations
along the pile by knowing the load, moment, deflection, and rotation at
the top of a test pile. This simple test requires only that a pile be
driven beyond the point below which the soil has no appreciable affect
on pile-top deflections and a lateral load be applied while measurements
are periodically recorded. The method is based on Reese and Matlock's
non-dimensional solutions31 which assume a linear variation of soil
modulus with depth. Relatively accurate information can be obtained,
but the method30 does require actual field measurements to be taken.
Several investigatorsZ0,32,33 have attempted to correlate a lateral.
load-deflection response with laboratory soil tests. The forni of the
equation normally used is shown in EQUATION 7.
p = cyl/n . . . . . . . . . . . . • . . . . (7)
Where:
c = A constant which varies on soil properties
n = A constant which varies with the type of soil

34
Possible functional re lat ions and values for C and n are shown in
TABLE 2. The· following specific values for a soft clay have been suggested
by Mat lock20: ,
Where:
C = Pu/2(y50)1/3 ••••• ~ • (8)
= {3cb+)'bx+cx/2 9cb · .
• • • (Sa) (use smaller value) • (Sb)
Y50 - 2.5b£50. . . . (Sc)
Y50 = Displacement at 50 percent of the maximum deviator stress
£50 =Strain at 50percent of the maximum deviator stress
The Iowa ~partment of Transportation Is current soil ·irtvestig~tion.
procedure at bridge sites includes .taking a split tube sample if
compressible layers are found in the area of the approach fill. Soil
strength, unit weight,. and compressibility data are routinely obtained on
these samples by performing triaxial, density, and consolidation tests. If
three split tube samples were taken, sufficient information would be .avail
ble to predict the soil_ response wit'h reasonable accuracy to a depth of
about 15 feet. Since soil conditions below about 15 feet have little affect
on bending stresses in laterally loaded pi~es,2S,l sample depths of 3, 7,
and 12 feet would seem tq be convenient choices.
If stiff clay is encountered, tI:ie equations are modifi~d slightly.
Generally, f 50 will be. somewhat lower and the exponent is changed from 1/3
to 1/4.

n
c
Where:
c =
x =
b =
¥ =
Ko =
~ =
Soft Clay
3
f(c,x,b,l)
Shear strength
Depth from the
(
TABLE 2
Firm Clay
4
f(c,x,1',i)
at depth x
ground surface
Width of the pile
Average effective unit ~eight
0.4
Soil friction angle
... 35
Sand
f(¢ ,K0 ,x ,b, °t)
f(¢,K0 ,x,b 7l)
to the p-y curve
from the surface to x
CONSTANTS USED IN p-y RELATIONSHIPS
\

36
Above a certain depth (H) the-ultimate lateral soil resistance (Pu) 1s
given by:
Where:
Pu = A¥x[ !oxtan0sin6 + tan(/3-~) cos at
(b + xtanptan11C)
+ K0 xtan(J( ta#sin#-tan11.) - Kahl. • • • • • • • • (9)
~ = Average effective unit weight from the surface to x
¢ =,Friction angle of the soil
x = Depth from surface to point where p-y curve is desired
~ = (J/2
(J = 45 + r/J/2
K0 = 0.4
Ka = tan2(45-~/2)
b = Pile width
A,B = Empirical coefficients varying with the depth to width ratio as shown in FIGURES 9 and 10, respectively
H = bcosllC tKatan'ktan(~-0) + K0 tanl/Jtan~tan{J1-¢)-l] •• (9a) Kotan9Jcosp+tanptan1<cos1t+K0 tan¥'-f5) ( tan!6s iqB-tan«) c.os Oil.
H = 11.4 for¢= 30 and 7.77 for~= 20
This formulation is based on a passive wedge-type failure assumed to
occur near the ground surface. The resulting static equilibrium equation
for the lateral force against the wedge is differentiated with respect to
the depth to obtain the expression for soil resistance per unit length of
the pile.
For depths well below the ground surface the soil is assumed to fail

· x/b
x/b
"A''' COEFFiCIENT , CHART
1.0.
2.0
3.0
4.0
5.0
A 1.0 2.0 ' ' \A(Cyclic)
. ' ' I ' I ,
. FIGURE 9 33 ·
"9" COEFFICIENT CH~RT 1.0 a··
1.0
2.0
3.0
4.0
.\ 5.0
FIGURE 103:,,
··:· .... ,
37

38
by flowing horizontally in a rectangular section around the pile. Active
earth pressure is assumed to be the minimum pressure adjacent to the pile.
The total soil resistance at depths greater than H is calculated using
Mohr-Coulomb theory and is given by
An intermediate value (Pm) on the p-y curve can also be calculated
using either EQUATION 9 or 9b if the coefficient B (see FIGURE 10) is used
in place of A. The value of Pm is located on the curve (see FIGURE 11)
where y=b/60.
3. Example p-y Curve
To illustrate the procedure further, a set of p-y curves will be
developed for a fine sand. For use in this example, the sand will be taken
to have a standard penetration blowcount (N) of 15. Based on the given N
value, the sand will be assumed to have medium relative density and
moderate strength. In this case, values of 105 pounds per cubic foot and
30 degrees will be used for effective unit weight and friction angle,
respectively. Using EQUATION 9a, the H value is 11.4. Selecting x equal
to 3 feet, EQUATION 9 yields Pu equal to 184 pounds per inch and Pm equal
to 104 pounds per inch.
The initial straight portion of the p-y curve is. defined by the
modulus of subgrade reaction (k), where k = IlbX, and tlh is the constant
. of horizontal subgrade reaction.36 An appropriate value for nh is selected
from TABLE 3. Since the results are reletively sensitive to the value
selected, correlation with field tests is desireable.

39
APPROXIMATE p-y CURVE FOR A FINE SAND
200 .x
150
100
50
P (lb/in)
x ·k
x
. I
y(in)
x
- Usmg the method of Reese et al 33
•.... using the power curve only
.2 . .3 .5
FIGURE 11

Reletive Density
Reconmended nh lb/in3
TABLE 3 Loose
20
RECOMMENDED nh VALUEs33
40
Medium Dense
60 125
The general shape of the curve is shown in FIGURE 11. Points m and u
are established at:
y m = b I 60 and Yu = 3b I 80 • • • • • • • • • (10)
Point k is located at:
Yk = (C/nhx) n/n-1 . . . . . . . . . . . .(11)
Where:
c = Pm/Yml/n
n = Pm/mym
m = (Pu-Pm) IYu-Ym) •
In this example the following values are obtained using the above
equations and the assumed values of effective unit weight· and friction
angle for a fine sand:
Yu = .375 inches
Ym = .167 inches
m = 385.0 pounds per square inch
n = 1.62
C = 314.0 pounds per inch
Yk = .0065 inches
The portion of the curve between k and mis defined by p = 314yl/l.64.

41
With these values and the selection of nh as 60 pounds per square inch, the
p-y curve shown in FIGURE 11 is completely defined. If Yk is less than 10
percent of Ym, a reasonably accurate curve may be obtained by using only
the power curve (p = cyl/n). The dotted line in FIGURE 11 shows that this
simplification yields nearly the same curve except at higher v~lues of y,
· where it is conservative. The effects of this approach would have to be in
vestigated over the range of values of interest before implementing it fully.
This example development of a p-y curve is based on average
characteristics of fine sand as shown on the Iowa Department of
Transportation Foundation Soils Information Chart (see APPENDIX III).
Similar ~nalyses could be performed for the other soils shown on the chart
using assumed average values of unit weight and strength from blowcount
correlations in the literature.40 If more accurate curves are desired for
specific field locations, soil samples should be obtained and tested.
This method is based on field tests in submerged granular soils. Its
use for soils above the water table may require the selection of higher
values of nh.
Some simplifying techniques can be used to ease the development of p-y
curves in clays. Rewriting EQUATION Sa (found on page 34) in its more
familiar form yields:
Pu= (3 + 1x/c + .Sx/b)cb ••••••••• (12)
Assuming a conservative value for ~/c of 0.2 and selecting b equal to
0.833 (for an HP 10 x 42 pile), the equation becomes:
Pu = (2.S + 0.86x)c •••••••••••• (13)

42
EQUATION Sb can be written for •an H~ 10 x 42 pile as:
Pu = 7.Sc~ ••••••••••••••••••• (14)
Therefore, EQUATION 13 controls to a ·depth of 5 .S feet. Thereafter,
eq~ation 14 begins yielding a lower value of Pu•
If 6"50 in EQUATION Sc is taken as 0.02 for soft clays,10 the
constant C can be written as:
c = f(4.6+ 1.6x)c { 13.Sc .
and there fore:
p = f<4.6 + 1~6x)cyl/3 13 .8cyl/3 .
x(5 .S feet x)5.8 feet • • • • .(IS)
x(5.8 feet x)5.8 feet • • • • .(l6)
A similar development can be done for .stiff clay takingcS50 as.CLOOS
so that:
p = [<4.7·+ l.6x)cyl/4 13.8cyl/4
. x(5. 7 feet
x>5. 7 feet • • ( 17)
This approximate formulation is good for 10 inch piles only. It .is
useful, however, since only a shear strength value is needed to develop p-y
curves for various depths. In an effort to develop a method of predicting
average shear strength values for conmo'n surface soils· in Iowa, historical
soil test records from the Iowa Department of Transportation were studied .
by the writer. Soil test data from split· t~be samples were· available: f;om
location's throughout the state. However, the writer selected, data from 19
sites in 4 Iowa counties (Blackhawk, Benton, Buchanan, and Linn) for further
study. Values. of standard penetration blowcount (N) and shear strength (c)

43
were fit to a simple linear prediction model. The following best fit
equation had a correlation of 0.82 with the actual data:
c = 97.0 N+ll4.0 pounds per square foot •••• (18)
Where:
c = Shear strength
N = Standard penetration blowcount
This simplified procedure should allow quick calculation of approximate
p-y curves based only on readily available N values. If this method were
to be routinely used, further study should be done to verify and improve
the shear strength prediction model and to further limit the i/c ratio for
soft and firm clays.
4. Development of Load-Slip Curves
The vertical load on a pile can be carried by shear transfer to the
adjacent soil and by bearing at the end point. Numerous methods have been
proposed for estimating the ultimate end-bearing resistance of an embedded
pile.40 There are large variations in the results from these methods in
part since they are based on different failure modes. The skin resistance
can be estimated by methods proposed by Meyerhof,24 Tomlinson,37 and Seed
and Reese.40 Their procedures involve empirical relationships derived from
pile load tests.
The basic expression for the ultimate soil resistance for poil}·t
bearing of a pile in clay is:
qf = cNc + q 0 Nq ••••••••••••••• (19)

44
Where:··
qf = Ultimate soil resistance
c = Shear strength
qo = Effective vertical stress at the pile tip
Nc,Nq = Dimensionless bearing capacity factor's
Ne = (Nq-l)cot p
The'strength parameters for a typical glacial clayl5 in Iowa may be
represented by c = 1400 pounds per square foot _and ~ =. 9°. Using an
Nq of 3 as reco~ended by Meyerhot40 and an assumed average buoyant unit
weight for the overburden of 65 pounds per square foot, a 40-foot
pile has an ultimate end-bearing of 25 kips per square foot. Using an
HP 10 x 42 pile as is conman in Iowa, the ultimate point load is about 2.2
kips. Iowa glacial clay deposits can yield. mlich higher bearing values than
this, but on the average the point· resistance can be neglected for the
purpose of this study~ Certainly if the pile is founded in alluvial silts
or soft clay soils, the end-bearing is also negligible.
The point load in sandy soils ~an be estimated using the traditional
' bearing capacity formuta with appropriate estimates of the shear strength
and density. Meyerhof40 has also proposed an empirical· method for use in
granular soils.
q f = SN • • • . ~ • • • • .. • • • • • D • • • • ~ ( 2 0 )
Where:
qf = Ultimate soil resistance
N = Standard penetration blowcount

45
For example, gravelly sand as shown in the Iowa Department of
Transportation Foundation Soils Information Chart has an average N value of
21. The point load using a HP 10 x 42 pile is 14.5 kips. Alternately,
under the same assumptions used in the glacial clay example and assuming a
friction angle of 35 degrees (Nq = 49)3 for the gravelly sand, the bearing
capacity formula yields an ultimate point load of 11 kips. Unless the
friction angle and soil density are known at a specific site, EQUATION 20
can be used as a satisfactory approximation.
Point-bearing piles which are properly seated in bedrock can normally
be assumed capable of carrying allowable pile loads with little or no
displacement. That is, they behave like elastic columns.40 This limits
the amount of skin resistance that can develop. Some shear load transfe~
will occur, however, due to elastic shortening of the pile.
The following is a typical note included on bridge foundation plans by.
the Iowa Department of Transportation .to assure proper seating of point
bearing piles:
"Steel HP 10 x 42 point-bearing piling shall be driven to practical
refusal and seated in sound rock. Seating shall be done with a
diesel ha1D11er with a ram weight of at least 2,700 pounds
delivering at least 19,000-foot pounds of energy or a gravity
ha1D11er having an effective weight of at least 4,500 pounds and
driving energy of not less than 36,000-foot pounds nor more than
40,000-foot pounds. 11 26
The design bearing value is also normally specified. In Iowa it is
limited to a load causing an axial stress of 6,000 pounds per square inch
when used in an integral abutment. Under these conditions it may be

46
assumed that virtually no settlement of the pile tip occurs.
\ Some investigators40 have assumed that the distribution of skin
friction along the length of the pile is parabolic for a floating point
pile (see FIGURE 12). This is intuitively reaso~able if the shear transfer
is considered to be a function of the pile displacement and available shear
resist.ance, which vary inversely along the length of the pile to some point
where the resistance may reach a maximum. For practical problems the . . \
distribution can·be assumed to be linear to a depth of about 15 pile.
diameters where a maximum value of shear resistance can be taken.40 This
is shown in FIGURE 12 as a dashed. line! Meyerhof24 has related this
maxiIIllm value to the standard penetration blowcount (N).
Jm~x = .02 N kips per square. foot • • • • • ( 21)
'Where:
Tmax = Ultimate soil shear resistance
Tomlinson37 has presented a method to estimate the maximum value using
the soil shear strength (c).
Where:
Tmax = ••••••• ; ••• (22).
Pp = Pile perimeter
a - 0.7 for. most applications in soft clay. (Other suggested values are contained in the literature.)
The~e two methods24,37 were tompared by the writer to empirical data
developed by the Iowa Department of Transportation35 for routine pile length
design as shown in TABLE 4. The previously described blowcount-shear

47
SKIN FRICTION DISTRIBUTION
0
15d
DEPTH
15d d = pile diameter
Pile tip~-------.11-----------0 SKIN FRICTION
FlGURE 12

TABLE 4
Ave N-value Steel H-Pile 16'' Concrete Pile
Iowa DOT Meyerhof Tomlinson Iowa DOT Meyerhof Tomlinson
Very soft silty clay 1 .8 .27 .49 2.0 .44 1.1 Soft silty clay 3 .8 .82 .94 2.0 1.3 2.2 Stiff silty clay 6 1.6 1.6 1.6 3.2 2.6 3.7 Stiff silt 5 1.6 1.4 1.4 3.2 2.2 3.2 Stiff sandy silt 5 1.6 1.4 1.4 3.6 2 .2 . 3.2 Stiff sandy clay 6 2.4 1.6 1.6 3.6 2.6 3.7 Silty sand 8 ·2 .8 2.2 4.0 3.5 Clayey sand 13 2.4 . 3 .6 4.0 5.7 Fine sand 15 2.4 4 .1 4.4 6.6 Course sand 20 . 3 .6 5.5 4.8 8.7 Gravelly sand 21 3.6 5.7 6.4 9 .2'
Ultimate Soil Shear Resistance (kips /linear foot of pile)

49
strength correlation was used to establish c for use in Tomlinson•s37
formula. The values used by Iowa are based on numerous pile load tests,
many of which were taken to yield.14 The shear resistance was assumed to
be equal at all depths within a given soil type layer. Values were first
developed from tests in predominately one soil type. Once some of the
values were established, others could be obtained from tests in multi- I
layered soils. For the purposes of this study, it is reconmended that the
Iowa Department of Transportation values be used.
In many of the pile load tests conducted by the Iowa Department of
Transportation the yield point was taken at a vertical settlement of 0.2 ,,
inches. Notable exceptions to this were long piles driven through a thick
layer of soft soil which had high yield displacements (up to 1 .5 inches)
and point bearing piles which had very low yield displacements (as low as
0.04 inches). For pile load testing currently conducted by Iowa, the yield
point is defined as the point where settlement is no longer proportional to
the load and shows a marked deviation from normal. The Department of
Transportation soil engineering staff believe that testing under this
criteria tends to support the 0.2 inch yield point for most Iowa soils.14
This value represents the gross displacement at the top of the pile.
However, it can be used to estimate the point where the.maximum load
transfer to the soil occurs if elastic shortening of the pile is accounted
for by using an arbitrary reduction of 0.05 inch. 'Ibis is the elastic
shortening of an HP 10 x 42 steel pile loaded at half the normal allowable
load (37 tons) in Iowa at a point halfway down a 40-foot embedment length.
5. Example Load-Slip Curves
Based on the foregoing empirical data, the load-slip relationships

50
shown in FIGURE 13 are believed to represent upper and lower bounds that
can be used in a mathematical analysis of soil-pile interaction. These
bounds represent conditions that may likely be found near the ground
surface in Iowa.
The only points identified precisely are the points of maximum load
trans.fer. The shape of the curve is assumed •. The exact shape could be
obtained by conducting load tests on instrumented piles. This was done by
Coyle and Reese8 who developed the curves in FIGURE 14 based on the
analysis of pile responses over a wide geographic area.
K~zdil,8 used a semi-empiri~al law to describe the load-slip behavior
of piles in granular soils. He used information from a measured shear
transfer versus· slip curve to predict. a pile load-settlement curve. If the
load-settlement curve was available, the method could be used in reverse to
estimate the slope in the initial, portion of the load-slip curves shown in
FIGURE 13. The following equation was used by Kezdil8 to describe the
response of a pile during a load test:
Where:
Q = Q0 0-exp(-kflf0 -f)) ••••••••••.• (23)
Q = Load on the pile
Q0 = Ultimate pile load
f = Settlement
f o = Settlement corresponding to P0
k = fo tan a0
a 0 =Horizontal angle of the initial slope of the· load-slip curve (see FIGURE 15)

4.0
3.0
Load transfer to soil (kif t)
2.0
1.0
51
APPROXIMATE LOAD .. SLIP CURVES
Upper bound
Lower bound
0.1 0.2 0.3
Vertical displacement (.in)
FIGURE 13.
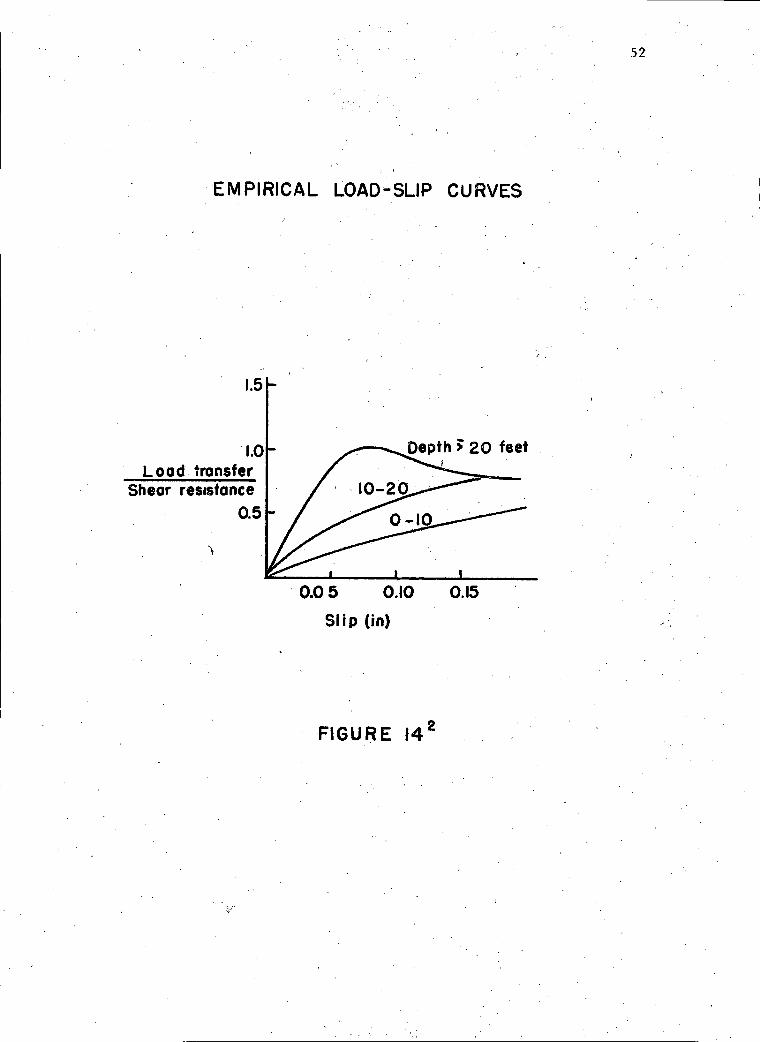
EMPIRICAL LOAD-SLIP CURVES
1.5
Load transfer Sheor resistance
0.5
\
'0.05 0.10 0.15
SI i p (in)
FIGU~E 14 2
52
/ '

5.0
4.0
3.0
Shear transfer (kp t)
2.0
1.0
53
INITIAL SLOPE ESTIMATION FOR LOAD-SLIP CURVES
0.1
Pile load
Q(kips)
ACTUAL I PILE LOAD
TEST DATA
Qo
Settleme"t fJ (in)
FOR GRANULAR SOILS
00 = arctan[~:f (In Qo - In (Qa-Q ))] .
Q0 = Ultimate pile load
(Jo= Ultimate settlement
0.2 0.3 . SI ip (in)
FIGURE 15

54
This equation can be solved for a0 as shown in FIGURE 15. By knowing
the yield point and any other point on the pile load test curve, an
estimate of the initial slope of the load.;.s lip curve can be obtained.. In
an effort to estimate• this angle for the soils described on the Iowa /
Department of Transportation soils chart, actual pile load test r_ecords
were reviewed by the writer. Several tests were selected where the pile.
was embedded in predominately one soil type. Values of the angle a0 were
calculated using the load and settlement values at yield and at a point
about one half of yield. The results are shown in TABLE 5. Note that the
writer has extended the use of the method to. apply it to predominately
cohesive soils. This was done only ~~r academic interest since Kezdi' sl8
original work included correlations with granular.soils only.
6. Previous Research
a. Ca lifornia27
California began informal studi~s of some of their. long structures
without expansion joints about 15 ye~rs ago. Their efforts consisted
of identifying appropriate structures and conducting periodic
inspections to monitor performance. Twenty-seven bridges were
studied. They varied in length from 269 feet to 566 feet. About
18 of the bridges had integral abutments while the others had
semi-integral. An example of a typical. inspection record4 is shown in
, FIGURE 16.
Although a final report on this study will not be available until
1982, the Structures Office, Cali~ornia Department of Transportation,
has reported the following interim findings: 7
1. There is no apparent distress at end bent columns; ) ..

55
TABLE 5
Soil Description !.o (degrees)
Very soft silty clay *70
Soft silty clay *72.
Stiff silty clay *74
'Stiff silt *74
Stiff sandy silt *74
Stiff sandy clay *74
Silty sand 75
Clayey sand 76
Fine sand 78
Coarse sand 80
Gravelly sand 82
* Kezdi'sl8 semi-empirical law was correlated to load tests in
granular soils only (see text).
LOAD-SLIP CURVE INITIAL SLOPE RECOMMENDATIONS

SAMPLE
INSPECTION RECORD OF
STRUCTURES WITHOUT EXPANSION JOINTS
56
Date 5-1-67
Br 53-1671 Name Fairfax On Ramp
Type RCB Length 352' _.....;;-=;.;;:;;;__ __
APPROACH PAVEM~NT
Type: AC
Skew var.
ELEVATION
Co-Rte LA-10
Year Built 1964
I I
Condition: The Westerly approach appears to have been patched twice, it is now in good condition. Easterly approach has settled slightly, it has never been patched. A 1/16" wide transverse crack has occured in the Easterly approach about 8' from the abutment for most of the width. The crack has been filled with latex.
STRUCTURAL DEFECTS
Space between structure and PCC curb: 1/2" Westerly, 3/8" Easterly.
Deck surface has a few transverse cracks over the bents, otherwise crack free.
No cracks found in soffit, webs, abutment walls, or columns.
There is a 1/2" crack between fill and backwall of Westerly abutment.
COMMENTS
Traffic volume appears to be light to moderate.
FIGURE 16 4

57
2. There is no cracking on girder soffits related to the lack
of deck joints;
3. No structural distress is apparent at the abutments;
4. Some problems have occurred from erosion and piping of
abutment support soils due to small amounts of water flowing
down behind the abutments; and
5. There are no apparent deck cracking problems associated with
expansion stresses.
The interim report reconmends that a reinforced concrete approach
slab be used with all jointless structures.
In 1971 and 1972 the California Department of Transportation and
the Federal Highway Administration sponsored a research. project to
correlate theoretical solutions for laterally loaded piles to full
scale field tests in bridge embankments. Most of the work was done by
Mr. W. S. Yee.at the University of California at Sacramento.
Mr. Yee worked with two available solutions for laterally loaded
piles. The first was the non-dimensional solutions with soil modulus
proportional to depth developed by Reese and Matlock.31 This method
allows analysis of variable fixity conditions at the pile top and can
be used in an iterative solution for other than linear variations of the
soil modulus. Mr. Yee also used the finite difference solution to the
general differential equation. Since the pile is separated into small
elements in this solution, any discrete variation in the soil modulus
can be acconmodated.
In Mr. Yee's study, however, a linear variation was assumed. The
coefficient of soil modulus (nh) was determined by measuring the

.. '.
58
deflection and rotation at the top of a laterally loaded pile as
described by Davisson.9
Load tests were performed on instrumented piling at 3 actual
bridge construction sites. Using strain gauge measurements, the moment
in the pile was calculated and compared to calculated moments using the
experimentally determined % value. A typical example of the results
is shown in FIGURE 17.
42 ' Mr. Yee concluded that:
1. Reliable predictions of bending moments and pile stresses could
be found using experimentally determined % values and either
the non-dimensional solution or the finite difference method;
2. The use of a linear variation in soil modulus with depth is a
good approximation;
3. The influence of the soil below about 12 to 20 feet on pile
stresses was practically negligible; and
4. The effective length of the pile was about 15 feet for a free-
head condition and about 21 feet for a fixed-head condition.
The results of this research were used to develop guidelines for
the use of integral abutments in California. They are used when up to
1 1/2 inches of total moV-ement due to thermal forces is expected in a
reinforced concrete bridge. Also to avoid rotation problems at the
abutment, the end span is limited to 160 feet. The use of integral
abutments is limited on prestressed bridges.to those where the elastic
shortening d.ue to post-tensioning is less than 3/8 inch, and the end
span is less than 115 feet (see APPENDIX II).

59 CALCULATED. VERSUS EXPERIMENTALLY DETER MIN ED PILE MOMENTS
0
2
4
6
.... LIJ 8 LIJ LL
z 10
J: .... a. 12 w 0
14
16
18
20
22
24
26
p
p = 15 I 3 3 0 J.b. (Measured)
.P=l2,6101b. (Measured)
p = 9,310 lb. (Measured)
p = 5 ,670 1.b. (Measured) ·
LEGEND
· -o- Measured moment
Theoretical moments: - ~-Reese and Matlock charts
k = 23.4 pci for P=9,310 lb.
..
0 +10 +20 +30 +40 +50 +60 +70 +80 '
· MOMENT IN FOOT-KIPS
FIGURE 17 4.2

60
b. Missouril2
In 1972 the University of Missouri conducted a survey and-
feasibility study of integral and semi-integral abutments. The work
was sponsored by the Missouri State Highway Department ,and _the Federal
Hi,ghway Administration.12 The_ survey was undertaken to determine
current design methods and limitations used by state highway agencies.
The study was made to determine the feasibility of instrumenting a
jointless bridge to obtain thermal induced stresses.
The survey indicated that 13 states were using integral -
abutments with steel bridges and -24 with concrete bridges. The
distribution of length limitations was as sQown in TABLE 6. Three
states allowed the use of integral, abutments for non-skewed bridges
only; none used them with skews over30 degrees.
The survey concluded that:
1. The use of superstructures connected to flexible substructures
was becoming generally acceptable;
2. Design limitations were more restrictive for_ steel bridges
than concrete;
3. There was no simple design criteria which accounted for .. shrinkage, creep, temperature, or substructure flexibility;
- - '
4. - Induced stresses resulting fzlom thermal effects, creep; I .
shrinkage' backfill movement' -etc.' are recognized by bridge
engineers as potentially significant' but there -is a wide -
variance in method for considering them; and
5. Bridge design engineers are interested in induced stresses and
associated proble'ID.9, are generally uncertain as .to the _

61
TABLE 6 ·
Maximum Length (feet) Number of States Steel Concrete
100 2 4
200 8 6
300 2 7
400 2
450 2
500 1
INTEGRAL ABUTMENT BRIDGE LENGTH LIMITATIONS (1972)
\

~.
J
62
significance of and suitable methods for consideration of these
stresses, and would welcome a simple, rational design criteria
and' specific reconmendations as to design details."\ \
In the feasibility study a· temperature· distribution model was
developed and superstructure stresses were calculated for a wide range
of temperature variations. The non-dimensional solutions for laterally
loaded pi'les developed by Reese and Matlock31 were used with an assumed
value of the modulus of soil reaction. Instrumentation procedures were
recommended for a field test to verify the theoretica·l results. The
field test, however, was not carried out and no further work has been
done on the project.
c. South Dakotal9
In 1973 South Dakota State University conducted full-scale model
tests on integral abutments to determine induced stress~s in the
superstructure and the upper portion on the piling. The model
consisted of.two HP 10 x 42 steel piles on 8-foot 6-inc~ centers cast
into a rigid. concrete abutment ~ith 2 plate girders about 26 feet I·
long. The 32-foot p'iles were dri.ven into. silty clay over glacial till
to a bearing capacity of. 23 tons.. The :pile tops were welded' to the
bottom flanges of the girders.
Various lateral displacements within plus or minus 1 inch were
induced at the abutment by jacking at the free end during four
construction stages. The results of interest are with the slab and
backfill in place. Strains were measured .corresponding to stresses of
up to 42 kips per square inch in the piling. This occurred just below
the bottom of the concrete abutment •. Several conclusions were drawn by

63
the investigators. They were called qualitative results which would
require further study to verify.
1. Stresses were induced into the girders which in some cases
were additive with dead and live load stresses. The induced
stresses were generally within the .40 percent overstress
allowed by AASHTO.
2. Horiz.ontal movements over about 1/2 inch will cause yielding
in the piles. ·
3. Free draining backfill is recomnended since frozen soil against
the abutment can greatly .increase induced girder stresses by
limiting free movement.
4. The use of approach slabs which allow rotation and translation
of the abutment and, if possible, avoid continuing compaction
of the backfill by traffic is recomnended.
As part of this study a questionnaire was sent to 10 states in
the North Central part of the United States. Two trends can be
identifi.ed when the survey is compared to the responses of· these states
to the survey recently conducted b~ Iowa. Four of the states (Idaho,
Missouri, North Dakota, and South Dakota) have substantially increased
their length limitations for use with integral abutments. Four of the
states (Iowa, Kansas, Nebraska, and Wisconsin) have retained the same
limits and 2.states still do not routinely tise integral abutments.
Also of interest is the fact that 3 of the states have begun to
routinely use integral abutments with steel bridges since 1973; 4
of them already did and 1 still does not.

64
d. North Dakota17
A recently constructed county road bridge near Fargo, North
Dakota, was instrumented and monitored for temperature induced stresses
by North Dakota State University. The study is being conducted by
Dr. J. Jorgenson, Chairman. of the Civil Engineering Department, and is
sponsored by the State Highway.Department.
The bridge is a 450-foot by 30-foot prestressed concrete box
girder with six 75-foot spans and no skew angle. It was built in
August 1979 on a very low volume gravel road.
The bridge was de~igned by Moore Engineering, West Fargo, North
Dakota. Since the bridge length was at the limit for the use of
integral abutments in North Dakota, a unique system was used to limit
the passive earth pressure on the b,ackwall. A d iagranmatic represen
tation of the abutment is shown in FIGURE 18.
The purpose of the expansion joint material behind the abu,tment is
to hold back the soil during thermal contraction of the superstructure
and to provide a collapsible mass to work against during expansion.
Dr. Jorgenson informed the writer that the maximum lateral movement
measured at the pile top has been about 2 inches. No distress has
been noted which could reasonably be attributed to this movement.
Dr. Jorgenson also reported that the bridge approach to superstructure
transition was still very smooth.
·The piling are founded in a dee~ glacial clay layer. Soft clay
deposits exist near the surface and down to the limit of influence on
the temperature stresses in the pile. Actual stresses in the piles are
being determined from strain gauge readings for various temperature

65
SKETCH OF MOORE· ENGINEERING INTEGRAL ABUTMENT SYSTEM 17
Minimun 10' pavement sect1o~f
Expansion joint
I• 20' Reinforced approach. slob .1
5" I- ..., React ion slob
4" Preformed expons10, joint moterio I .
FIGURE 18
- - - - +---------t
r--1-., I I I I I, I
I I I I
I
' I . I I
I I , , I I
I I '-HP 10 x42x 100•

------- -
66
ranges throughout the year. The results of this analysis will be
available in the late sumner of 1981. Based on the results of the
South Dakota study, it seems likely _that the piles are being stressed
above yield with the reported off.:..center deflections of up to 1 inch
occurring.
7. Sununary
Based on a review of available literature, the most attractive
analytical approaches to obtaining solutions for pile stresses in integral
abutments are iterative methods using a finite difference or finite element
formulation. Both methods require knowledge of soil parameters to predict
load-slip and resistance-displacement (p-y) relations.
The writer has presented recomnendations for use in the development
of p-y and load-slip curves to be used in analytical model ,~pr investigating
pile stresses in integral abutments. TABLE 7 shows the reconmended range
of ultimate shear resistance er-max) and initial horizontal angle (a0 ) of
the load-slip curve.
The range of soil strengths recommended for developement of p-y curves
is shown in TABLE 8. Other relationships for granular soils or intermediate
strength cohesive soils can be developed as described in the body of the
report, if desired.
Previous research work in the area of integral abutments includes:
1. Surveys of detailing and design criteria used by the state highway
agencies;
2. Full-scale model tests; and
3. Monitoring performance of actual bridge installations.
The survey conducted by the University of Missouri in 1972 showed that

TABLE 7
Maximum Minimum
'f max(kips/foot) 3.6 0.8
/
Standard Penetration Blowcount
1
25
a0 (degrees) 82 70
RECOMMENDED LOAD-SLIP PARAMETERS
TABLE 8
Corresponding Shear Strength (psf) (equation ( 11))
210
2500
Recommended p-y Relationship
(eg,uation (IO))
P= rll.8 + 4.0x)yl/4 33.8yl/4
P= rl + x/3)yl/3 2.9yl/3
RECOMMENDED p-y RELATIONSHIPS
67
for x(5.7' for x)5.7'
for x(5.8' for x)5.8'
\

68
the use of integral abutments in highway bridges was a generally accepted
practice. Although no simple rational design method was available, some·
states were building bridges up to 500 feet long without expansion devices.
The few problems reported were judged to be of no greater magnitude than
those experienced when movable supports and expansion devices are used.
The full-scale model tests in South Dakota in 1973 showed that for
lateral pile top deflections over 1/2 inch, the stress in the upper portion
of the pile may be at yield. The tests results indicated that the use of
approach slabs that allow rotation and translation of the abutment was
advisable. Free draining backfill was reconmended in cold climate areas.
Research on full-scale bridge abutments in California in 1973 showed that
the non-dimensional solution as proposed by Reese and Matlock31 and the
finite element formulation could accurately predict piling stresses. The
effective length of laterally loaded piles was shown to vary from 15 to 21
feet. The results of this work were used by the California Department of
Transportation to develop design criteria for integral abutments which are
still in use today.
The performance monitoring of an integral abutment bridge in North
Dakota is still underway. With measured total deflections at the pile top
of about 2 {nches, the abutment appears to be functioning properly with no
movement related distress.

IV. CONCLUSIONS
The responses to the nationwide survey indicate th.at a majority of the
state highway agencies use integral abutments and are pleased with their perfor-
mance. Three more states are using them with concrete bridges today than did in
1973 and 10 more are using them with steel bridges.
Most states that use integral abutments have increased their maximum
allowable bridge length since 1973. Length limitations fo 1973 were on .the·
order of 200 to 300 feet. Several states are now building concrete bridges over
400 feet long without expansion joints. Many would like to increase their
length limitations b~t are concerned ~bout possible additional abutment
distress, approach pavement failures, and overstressed piling.
Problems _mentioned by some of the states seemed to be restricted to only a . I
few respondents. Others noted that they had experienced problems but had since
implemented effective solutions. Wingwalls which had cracked at the backwall
inter face are now being designed for greater loads with more reinforcing. Some
erosion and backfill containment problems are.being solved by using longer
wingwalls. Many states noted the importance of using an adequate approach slab~
Positive containment of runoff at thy bridge ends can also help k'eep backfill
problems to a minimum. End span rotation problems can be reduced by limiting
the length of the endspan.
\
Several states said that unknown piling stresses were a deterrent to the use
of integral abutments. Studies have indeed shown that under normal.temperature
variations, piling in integral abutments of long bridges will be stressed to
yield. This may occur with lateral movements of as little as 1/2 inch.

70
Several states are now building bridges with integral abutments that can have
greater potential movements. As shown by the survey, the piling stress due to
thermal movements is generally ignored since no simple rational method of analysis
is readily available. Some states have assumed simplified fixity conditions and
effective lengths of the piles in order to calculate stresses, but they rea.lize
' that the results are only approximations of the actual conditions. : .
Analytical methods are available that can accurately predict pile response
to lateral loads, but they generally require a full~scale testing program to
supply the needed soil information. Soil parameters can be estimated from
standard laboratory tests, but the results are much less accurate. Another
approach is to develop bounds for the soil information and analyze each
critical combination of input data. To this end these limits have been
established for typical Iowa soils and presented in this paper. It is hoped
that this data will enable accurate analyses to be performed for use in the
development of easy to use design charts capable of predicting safe integral
abutment bridge designs for given soil conditions.

V. REFERENCES
1. Alizadeh, M. and Davisson, M. T., "Lateral Load Tests on Piles-- /.-
Arkansas River Project," Journal of the Soil Mechanics and Foundations
Division, ASCE, September 1970.
2. Bowles, J.E., Analytical and Computer Methods in Foundation
Engineering, McGraw-Hill Book Co., 1974.
3. Bowles, J. E., Foundation Analysis and Design, McGraw-Hill, 1977.
4. Bridge Department, California Division of Highways, "Long Structures
Without Expansion Joints," June 1967. · ) .
. 5. Bridge Division, Miss.ouri Highway and Transportation Conmission,
"Design Manual,~' Section 3.72,Sheet 4.3.1, Octoberl977.
6. California DOT, "Bridg'e Planning and Design Manual," Vol. IV,
Detailing, June 1979.
7. Cassano, R. C., Chief, Office of Structures Design, California DOT,
Correspondence, 900.05, June 10, 1981, and telephone conversations, June, 1
8. Coyle and Reese, "Load Transfer of Axially Loaded Piles in Clay,"
Journal of the Soil Mechanics and Foundations Division, ASCE, Vol. 92,
SM 2, March 1966.
9. Davisson, M. T., "Lateral Load Capacity of Piles," Transportation
Research Record 333, 1970.
10. Desai, c. s. and Christian, J., Ed it ors, Numerical Methods in
Geotechnical Engineering, McGraw-Hill, 1977.
11. Durrow, F •' Assistant Bridge Engineer, North Dakota State Highway
Department , Telephone Conversation, May 1981.

72
12. Emanuel, J. H. et al, "An Investigation of Design, Criteria for Stresses
Induced by Semi-Integral End Bents," University of Missouri, Rolla, 1972.
13. Gee, H., "Length Limit of a Bridge Using Integral Abutments,"
Office of Bridge Design, Iowa DOT, February 13, 1969.
14. Gee, H., Structural Engineer; Lundquist, W., Bridge Design Engineer;
and Miller, G., Geotechnical Engineer; Iowa DOT - Conversations, June 1981.
15. ·Handy, R. L., "The Pleistocene of Iowa: An Engineering Appraisal,"
Proceedings, Iowa Academy of Science, Vol. 75, 1968.
16. Hetenyi, M., "Beams on Elastic Foundations," University of Michigan
Press and Oxford University Press, 1946.
17. Jorgenson, J., Chairman of the Civil Engineering Department, North
Dakota State University, Telephone Conversations, June 1981.
18. Kezdi, A., "Bearing Capacity of Piles and Pile Groups," Proceedings,
Fourth International Conference on Soil Mechanics and Foundations, Vol. 2,
London, 1957.
19. Lee, H. and Sarsam, M., "Analysis of Integral Abutment Bridges," South
Dakota Department of Highways, March 1973.
20. Matlock, H., "Correlations for Design of Later?llY Loaded Piles in
Soft Clay," Proceedings of the Offshore Technology Conference, Houston,
Texas, 1970.
21. Matlock, H. and Reese' L., "Foundation Analysis of Offshore Pile
Supported Structures," Fifth International Conference on Soil Mechanics
and Foundation Engineering, Vol. 2, 1961.
22. Matlock, H. and Reese, L., "Generalized Solutions for Laterally
Loaded Piles," Journal of the Soil Mechanics and Foundations Division,
ASCE, October 1960.

73
23. McClelland, B. and Frocht, J.A., "Soil Moduius for Laterally Loaded
Piles," Transactions, ASCE. Vol. 123, 1958.
24. Meyerhof, G., "Compaction of Sands and Bearing Capacity of Piles,"
Proceedings, ASCE, 85, SM6, 1, .1959.
25. Moberly, J., Structural Engineer, Bridge Division, Missouri State
Highway Comnission, Telephone Conversation, May 1981.
26. Office of Bridge Design, Iowa DOT, Contract Construction Plans,
Project BRF....;137-3(5)-38-62, Design 281, Mahaska County.
27. Office of Structures Design, California DQT, ''Memo to Designers,"
November 15, 1973. .., .
28. Paduana, J. A. and Yee, W. s., "Lateral Load Tests on Piles in Bridge
Embankments," Transportation Research Record 517, 1974. · .. j' ,
29. Reese, L., "Laterally Loaded Piles: Program Documentation," Journal
of the Geotechnical Engineering Division, ASCE, April 1977.
30. Reese, L. and Cox; W., "Soil Behavior from Analysis of Tests of
Uninstrumented Piles Under Lateral Loading," ASTM STP 444, 1969.
31. Reese, L. and Matlock, H., "Non-Dimensional Solutions for Laterally
Loaded Piles With Soil Modulus Assumed Proportional to Depth," Proceedings,
Eighth Texas Co~ference on Soil Mechanics and Foundation Engineering, 1956.
32. Reese and Welch, "Lateral Loading of Deep Foundations in Stiff Clay,"
Journal of the Geo technical Engineering Divis ion, ASCE, Vol. 101, No. GT7,
July 1975.
33. Reese, Cox, and Koop, "Analysis of Lat~rally Loaded Piles in Sand," ., Proceedings· of the Offshore Technofogy Conference, Houston; Texas, 1974.

0
34. Rowe, P. W., "The Single Pile Subjected to a Horizontal Force,"
Geotechnique, Vol. 5, 1955.
35. Soils Department, Iowa DOT, "Foundation Soils Information Chart,"
June 1976.
36. Terzaghi, Karl, "Evaluation of CoE!fficients of Subg_rade Reaction,"
Geotechnique, Vol. 5, 1955.
74_
37. Tomlinson, M., "Some Effects of Pile Driving on Skin Friction,"
Proceedings, ICE Conference: Behavior of Piles, pp. 107-114, London, 1971.
38. Wasserman, E., Engineer of Structures, Office of Structures,
Tennessee DOT, Telephone Conversation~ May 1981.
39. Wilkinson, E., Bridge Engineer, Kansas State Highway Commission,
Telephone Conversation, May 1981.
40. Winkerhorn and Fang, Editors, Foundation Engineering Handbook,
Van Nostrand Reinhold Co., 1975.
41. Wittke, W., Numeric Methods in Geomechanics, Vol. 3, A. A. Balkema,
Ro terdam, 19 79. ·
42. Yee, W. s., "Lateral Resistance and Deflection of Vertical Piles,
Final Report-Phase 1," Bridge Department, California Division of
Highways, 1973.

VI. APPENDIX I
Questionnaire for Bridges with Integral Abutments
and
Sunn.nary of Responses
Part 1. Responses to all questions except number 4
Part 2. Responses to question 4
Part 3. Additional conments made by some of the states
Note: States not listed in Part 1 answered no to question 1 and,
therefore, did not complete the remainder of the questionnaire.

76
QUESTIONNAIRE FOR BRIDGES WITH INTEGRAL ABUTMENTS
1. Do you use bridge designs with integral abutments and without expansion devices, similar to the following sketch? yes no Primary (one) reason why, or why not: If the answer is no, skip the remainder of this questionnaire and please return.
G:, ABUTMENT BEARING
CONSTRUCTION :; : · JOINT --...._;·.
PORTION OF BEAM ENCASED IN ABUTMENT
PILING
,BRIDGE BEAM
2. With what type of bridges do you use integral abutments?
steel pres~ressed concrete poured-in-place concrete __ _
3. What are your maximum length limits (in feet)?
0° - 15° ;I.5° - 30° 30° < skew
steel prestressed concrete ----poured-in-place
concrete
4. What limits, if any, do you place on .the piles? (bearing vs. friction, soil type etc.)
5.
steel pile timber pile concrete pile
What type of structural assumption is made for the end of the girder?
pinned (moment equal zero) fixed (rotation equal zero) partially restrained
other assumptions
{restrained .by pile ---\_!estrained by soil on abut.
--~~~~~~~----~-----~-------

77
6. What type of structural assumption is made for the top of the pile?
pinned (moment equal zero) fixed (rotation equal zero) partially restrained
Is.the joint detailed as a pin?
-- rrestrained by girder ----"\_restrained by soil on abut. __
' other assumptions ~~~~~~~~~~~~~~~~~~~~~~~~~~~~~-
7. What loads do you include when calculating pile stress?
thermal temperature range ~~~~~~~~~~~-
shrinkage --soil pressure on abutment face
8. How is bending accounted for in the pile?
Neglect or assume bending stresses .do not affect pile performance Assume location of pile inflection point and analyze pile as
bending member Reduce bending by prebored hole Other
9. What type of backfill material do you specify on the backside of the abutment?
10. Does the approach pavement rest directly on the abutment? yes no
11. Briefly evaluate the performance of integral abutment bridges in your state. (Compare to bridges with expansion devices).
Construction relative cost more same less ---special problems
~~~~~~~~~~~~~~~~~~~~-~~~~~~~~-
Maintenance relative costs more same less --- ---
·Special problems ~~~~~~~~~~~~~~~~~~~~~~~~~~~~
Please return to: Lowell Greimann 420 Town Engineering Iowa State University Ames, Iowa 50011

PART l, SUMMARY OF RESPONSES TO QUESTIONS 1, 2, 3, 5, 6, and 7
State
AL AZ CA co CT GA IA ID IN KS KY.
MO MT ND NE NM NY OH OK OR .SD TN UT VA VT WA ws WY Rl5
y
N Yes No
Steel Length
Reason Use (30* )30*
Cost Maint Cost Cost
El.Jt Cost Cost.· Cost
. El .Jt Cost El.Jt Cost Maint El.Jt El.Jt Cost Cost
El.Jt Cost El.Jt El.Jt Simp. Cost Cost Cost Simp. El.Jt
y 300 Y 253 N y y 200 y 200 y 300 N Y 200 N N y 300 300 N N . N y 400 Y 300 N y 350 y . 300 Y· y . 305 y 300 300 Y 200 - N Y N N y 320 y 400 400 y 300 250 y 242 y 150 100 N y 200 200 y 300 300 N N. N
No Response * Bridge skew in degrees
Concrete Length
Use (30* )30*
y 115 Y 330 N y 320 320 y 400 N y 300 y 265 Y 400 N y 100 y 350 350 Y 300 N y 400 400 Y 100 N y . 350 N 300 y
y 300 300 Y 200 N y 350 300 y 450 y 800 800 N N N N N y 350 "{ 300 N y 500 500 y 270 160
Pres tressed Length
Use (30* )30*
y 416 104 Y 404 N y 230 230 y 400 N y 300 y 265 Y 400 N N y 300 300 Y 300 N y 500 500
. y· 300 N Y. 450 y N Y'
y 300 300 Y .200 N y 350 300 y 450 y 800· 800 y 300 250 y 454 N N, N
N y 300 300 y 500 500 y 300 240
Girder Pile End Top
Fixity Fixity
Pin Pin Pin Pin Pin P.Res Pin Pin Pin Fix Pin Pin Fix Pin Pin
Pin Pin Fix Fix Pin Pin Pin Pin Pin· Fix Pin Pin P.Res. P.Res. Pin Pin P.Res. Pin Pin Pin Pin Pin P.Res. Pin P.Res. Pin P .Res.
Pin P.Res. Pin Fix Pin Pin Pin P.Res. Pin Fix Pin Pin
Pile Loads Soil
Thermal Shrinkage Pressure
y y N N y N y
N N y y
N N N y y y N N N
N N N N y N N N N
N y N N N N N N N y
N N N N N y N N N N N N N N N N N N N
y y N y
N N N N N N y
N y
N N y N N N N N N N y
N N N N N
""" 00

PART 1, SUMMARY OF RESPONSES TO QUESTIONS 8, 9, 10, and 11
State
AL AZ CA co CT GA IA ID IN
'KS KY MO MT ND NE NM NY OH OK OR SD TN UT VA VT WA ws WY Rl5
Y Yes N No
Pile Bending Neglect In fl. Pt. Pre bore
y y y y y y N y y y N y y y y N y y y y
N y y y y
N y· y y
y N N N N N N N N N y
N N N N y N N N N N N N N N N N N N
N N N y N N y N N N y N N N
·N N N N N N y
N N N N N N N N·
No Response
i
J
.-·-, _j
Backfill
Gran. Co hes. Perv. Gran. Perv. Rd .Fill Gran. Rd .Fill Gran.
·Rd .Fill Gran. Rd .Fill Gran. Gran. Rd .Fill Rd .Fill Gran. Gran.
Gran. Gran. Gran. Gran. Gran.
Gran. Gran. Gran. Perv.
Approach Pavmt. on Abutment
N y y y y y y y y y N y y y y Y-N y y y y y y y N N y N y y
Construction Cost More Same Less
N N N N N N N N N N N N N N N N N N N N N N N N N N N N N
N y N y N y N y N y N . y N y N y N y N y N , y N y N y N y y N N N N y N y N y N y N y N y N y N N
. N y N y N y N y N y
Maintenance Cost More Same Less
.N N N
~ N N N N N N N N N N N· N N N N N N N N N N N N N N
.N N N N N N N N N N N N N N N N N N N N N N N N N N N N y
y y y y y y y y y y y y y
.Y y
N y Yy y y y y
N y y y y
N
I

PART 2, SUMMARY OF RESPONSES TO QUESTION 4
State
AL AZ CA co CT GA IA ID IN KS KY MO MT ND NE NM NY OH OK OR SD TN UT VA VT WA ws WY RlS
Steel
* 9 ksi in Brg., (9 ksi in Frie. Assume 5 kips Lat. Resis./pile
* Use in bearing Use in weak axis Use in weak axis, Frie. only
* Use H-pile or shell Mostly used in bearing Use in Brg. or friction 10' minimum length 9 ksi in bearing
* Used in weak axis Use steel only
* * Use in bearing
* * * Use in single row Upper portion allowed to flex 15' minimum length Use in bearing or friction Use in bearing or friction Use in bearing or friction Use in weak axis
* No Limitations No Response
Timber
* Not used Same as stee 1 Not used
Not used Use if Br. Length(l50' Not used
Mostly used in bearing
Not used Used in friction
* Not used Not used Not used Not used Not used
* Not used Use in single row
Not us.ed Use in Brg. or Frie. U~e in friction Not used Not used
80
Concrete
* In friction only 13 k. Lat. R./pile Not used
Not used Not used Not used
Mostly used in Brg. Used in friction Used in friction Not used
* Not used
* * Not used
* * * Use in single row
Not used Use in Brg. or Frie. Use in Brg. or Frie. Not used Not used

PART 3, SUMMARY OF ADDITIONAli COMMENTS MADE BY SOME OF THE STATES.
Arizona
The additional lateral movement associated with this system,
particularly with cast-in-place, post-tensioned concrete box. girders,
dictates longer wingwalls for backfill containment and the careful
compaction of backfill material. Also, an adequate drainage system must I
be provided to prevent surface runoff from entering voids created at the
81
ends of the wings and approach slabs; otherwise, progressive erosion of the
approach embankmen.t and under the· approach slab occu:i;:-s.
Alaska
No special construction or maintenance problems were noted.
California
The abutment is not stable when standing alone during construction
if the backwall height is too great. Wingwa~ls must be cast after
stressing of cast-in-place prestress construction to avoid rotation and
translation of walls. If soils don't yield, piling absorbs a large amount
of prestressing force resulting in a large rotation at abutments and a
large downward deflection in the span. This has been a particular problem
with simple span cast-in-place prestress construction.
Colorado
We do have some problems with settlement of backfill behind the
abutment and cracks in the asphalt pavement, but the problems are much
less than the problems associated with snowplows and bridge expansion
devices and.bearing devices.
... ..

82
Connecticut
We have constructed one bridge to date and are very satisfied
with it.
Georgia
Have had a problem with cracks in the wingwalls.
Idaho
Some problems have resulted from failing to provide adequate expansion
joints in concrete approach pavements, but such problems are not peculiar
to design concept under considera.tion. Problems are to be ·expected if the
·. bridge is long, has no expansion joints a~ywhere, is a steel bridge, is on
a substantial ske~, or a combination of the foregoing. If used with
discretion, the design concept is good in that it saves initial and
maintenance costs of expansion joints.
Kentucky
No special construction or maintenance problems have been reported. (
Missouri
We limit integral abutment bridges to a .40 degree skew.
Montana
i No special contruction problems noted. Integral abutment bridges
probably require a little more maintenance due to embankment settlement.
Nebraska
Maintenance can be a problem if no concrete approach. slab is provided.

83
New York
We assume that construction costs are lower because of simpler abutment
forming details and fewer piles. Setting the girders directly on the piles
created some alignment difficulty for the contractor. In the future we
plan to use a detail similar to the detail shown in No. 1 of your questionnaire.
The continuous approach slab on a 125 foot single-span steel bridge built
in 1980 has cracked at the rear face of the backwall. It is a tight
crack that runs tha full width of the slab but does not appear to be
detrimental. To date, no detectable cracking has occured in the backwalls
and the abutments seem to be functioning as designed.
Ohio
As yet, no significant constructiori or'maintenance problems have been
noted.
Oklahoma
Integral abutments are used only on bridges with zero skew.
South Dakota
With steel bridges and longer concrete, we still utilize an expansion
device in the approach slab system. Savings is in bearings and piling.
Sill or abutment does not have to be designed for overturning loads.
For most steel bridges and longer concrete, we feel it is necessary to
attach the approach slab with integral curb and gutter to the bridge.
Without this provision, severe erosion around the wings can result and
problems with approach fill settlement are increased.
I
I

84
Utah
\
No special construction or maintenance problems have been noted.
Vermont
Some minor approach settlement is anticipated.
Washington
Sometimes the piles ma~ not end up in a straight line and at the right
location. Some maintenance problems with downdrag and settlement
have been noted.
Wisconsin
Cracking .,of diaphragms has been noted. on bridges with large skews (greater
than 20 degrees) and/or. with long abutments. We limit integral abutment
bridges to 40 degree skews.
Wyoming
No special construction or mainte.nance problems have been noted.
FHWA Region 15
We noted a problem with pavement cracking at bridge ends. This has
since been eliminated with the use of approach slabs.

VII. APPENDIX II
Memorandum to Designers, Office of Structures Design,
California Department of Transportation
This memorandum w:as attached to California's response to the integral
abutment questionnaire. It describes California's criteria for the use of end
diaphragm abutments, which includes both integral and semi-integral types.
Examples of details used by California are shown in FIGURES 1 and 2 in the
body the this report.

'"• ..
November 15, 1973 5-2 86
End Diaphragm Abutments
MEMO TO DESIGNERS:
The end diaphrag-m is an integral part of the br.id9e superstructure. Frequently this diaphragm is extended below the soffit of the superatructure to rest directly on piles or on a footinge This type of support is an "End Diaphragm Abutment." The discussion here will be limited to those situations wh(~re the diaphragm is fixed at the so ff it and in effect is a cantilever beam between the sof::Cit and the ba.se which rests on piles or a footing.
Structure Movement:
Thermal movements are easily absorbed by this abutment. Conc.:-ete bridges of 400 feet between abutments, when conventionally reinforced, have shown no evidence of distress even though the end diaphragms rested directly on piles.
Elastic shortening due to post tensioning, however, is rapid and must be provided for in the abutment design ·when the initia..l shortening due to stressing exceeds 3/8". ffnen the span adjacent to the abutment exceeds about 160 feet, there could be an additiona problem of rotation. To minimize the damage to the abutments of single span post tensioned structures due to earthquake, both abutments should be on sliding supports when that is the reconnnende treatment (See table below).
Below are listed some guidelines for use in_ providing for abutment movement~ The limits sho\l.'Tl are by no means absolute, but illustrate a conservative approach to the problem. Seat-type abutments are advisable where movement ratings are equal or greater than 1-1/2 inches.
SUPPORT TYPE
------
Driven Piles
C! DH Piles
Spread Footing
All Types
LIMITlrJG CONDITION -E --;ECO-M~ENDED TFIEATMEf\JT ~ ln1t1al shortening due to Pre stressed -·---- --C~nvenlion~l-==i
stressing
0
or l::gth
31:~ end ~pan
1. ____ [ ___________ ------·--·----
,,~o spe ciai
" ----- trcr Sheet melo~~'1er j ~r~ast~~;r'.~ 1
0 to I neoprene strip or (Spans up to 160' l elostomeric pod.
---- ------· - - -·-- -------------- --------- -- ---·-· -------··----·-------
0 to 1· c== or [lf= Sheet metal over (Spans up to 160' l r.eoprene strip or
C==:J elostorneric pod. -
Over 1 • IL~ or fl~ Ilk= l Spans over 1601
)
(Conventional - when M.R. ~ 11/2" ) Roller Eloslomeric Pad
-1-· Previous Memo dated 8-25-71

87 November 15, 1973 5-2
Restraining Forces:
Listed below are asoigned values for resi.at'-.mc(~ offered by various end conditions. This force ie applied at the base of the end diaphragm to determine the proper r~inforcemcnt~ The values shown do not t~..ka i'nto account the special si tua.tione where very long piles or ama11 limber piles offer little reaistance to longitudinal movement. Note that earthqu,-:tke longitudinal force may goverp over those shown below. See Section 2-25 Bridge Planning & Design .Manual, Volume Io
Abutment Type
End Diaphragm on CIDH pile a ~ 25 kips per pile
End Diaphragm on Concrete Driven Piles ~'20 kips per pile
End Diaphragm on 45T Steel Pile IS *15 kips per pile
End Diaphragm on Nt!!oprene Strip or Pads 15% of dead load
End Diaphragm on Rollers 5% of dead load
*These values are intended for use in the design of end diaphragm only. For determining the number of piles required for longitudinal force, aee Section 4-15.8{3) of Bridge Planning & Design Manual, Vol~. I.
Earthguake Forces:
Shear keys must be added to provide resistanc0 to transverse and longitudinal earthquake forc3s act:l.ng on the st;:ucture .. •rhese normally will be placed behind and at the ends of the abutment wall on narrow structures. On wide structures, additional keys, may be located in.the interior. One half inch expansion joint filler should be. specified at the aides of all keys to minimize the danger of binding. For earthquake design forces, see Section 2-25.2, Bridge Planning & Design Manual, Vol. I. For key sizes and key reinforcement, see Section 1, Bridge Planning & Design Manual, Volume IIIo
Drainage
1 o No pervious material collector or weep holes requ in:!d for flat slab bridgea.
2. Continuous pervioua backfill material collector and weep holes may be used for abutments in f.ill9·or well
. drained cut a in deaert locations and at si tee \rlhere a 5-ft level berm is specified.
-2-

November 15, 1973
Drainage (Cont'd.)
End Slope Treatment
Unprotected berm
Bib slope paving
Full slope paving
88
5-2
Weep Hole Discharge
Directly on unprotected berm
C. spacer or groove in paved surface
On spacer on groove in paved surface
3. Continuous permeable material and P0rforated Steel Pipe collector discharging into Corrugated Steel Pipe overside drains should be used for all other abutmentso
4. Corrugated Steel. Pipe ov~raiae drains must be coordinated with road plans. If there ie no discharge system and no collector ditch, the outfall must be located c.way from the toe of slope to prevent erosion of the end slope.
5. Abutment drainage ayatems should. be coordinated with the slope paving. See Memo to Designer::; 5-10.
Backfill Placement
U'nlese there are special soil conditions or unusual Btructu:cegeometrics, the designer need not specify the method or timing of backfill placement. Passive :resistance-.~ of soil in front of the end diaphragm offers little restriction to structure movement due to stressing. Nor will the active pressure of backfill behind the end diaphragm materially alter the atrene pattern even if the fill is completed &t one abutment before being started at the other.
Suggested Details:
Sketches showing suggested abutment details are located in Bridge Planning and Deoign Manual, Volume IV, Detailer 0 s Guide.
I. I/ I ~fc1~.
G'. A. Hood
//// ;1;<~ I -~ (:~-/ ./ L.f / -t t l. c.< , ' c ~ ,- W. J, rkovich ·
// .-.·/ F:bt
-3-
· .. -- _,

}
VIII. APPENDIX III
Iowa Department of Transportation
Foundation Soils Information Chart
90
FOUNDATION SOILS INFORMATION CHART
A majo~ity of the bridge foundations designed by the
Highway Division, Iowa Department of Transportation rest upon
piling which derive their support primarily from the shear strength
of the surrounding soil rather than from end bearing. Economical
and safe design of such foundatjons requires a knowledge of the
bearing capacity of the foundation soils. l\ chart for pile
length determination based upon the available information and
experience was first introduced in 1958. This chart provided
a feasible method of selecting pile lengths which effectively
reduced pile. cut-off. As more information becomes available,
it is necessary that the "Foundation soils Information Chart",
used for estimating pile lengths, be periodically updated.
l\ total of 234 pile load tests have been performed since
1950. To properly evaluate the information, the tests were
categorized as (a) pile tested to yj.eld, and (b) pile tested to
bearing. Of the total, 117 pile load tests were grouped into
the "pile tested to y_ield" category. To evaluate the bearing
capacity of foundation soils the piles tested to yield were
reviewed, excluding the inconclusive tests. sufficient numbers
of conclusive tests are available for review.

91
-).-
The pile load tests performed on piles founded in only one
foundation soil have enabled establishing a definite bearing
value for that soil~ Pile tests on certain soils have indicated
a need for change in the bearing values given in the previous
charts.
All available foundation soil information has been evaluated
and incorporated in the revised design chart. Blow count values
(N-Values*) obtained from standard penetration tests performed
on foundation soils and bedrocks have been included in the chart
and in the additional reconunendations. statistical analysis
was used to determine the mean value and standard deviation for
blow counts on all soils.
Evaluation of pile load tests performed upon tapered steel
shell piles on the I-129 project at the Missouri River crossing
south of Sioux City indicate that the bearing value of the tapered
pile in cohesionless foundation soils is greater than the bearing
for parallel sided pile. However, the.bearing value for tapered
piling is not as high as originally indicated by the test loads
made at the council Bluffs viaduct. The additional column for
steel shell piles has.been left in the revised chart but the
*N-value: The number of blows required by a 140 lbs. hanuncr with a free fall of 30 in. to driv8 a 2 in. O.D. by 1-3/8 in. l.D. split tube sampler 1.0 ft. into the soil.

92
-3-
value have been reduced. According to Peck* the effect of taper
pile in uncpnsolidated cohesive soils does not increase the
bearing capacity of. the pile.
··rhe attached "l"oundation Soils Information Chart" gives
the allowable friction.bearing per foot length of pile for different
types of piles in different foundation soils. The chart and the·
methods of pile length determination described on subsequent
pages will allow the designer .to effectively select adequate
pile.lengths. To make effective use of the chart, .the sounding
' nomenclature should compare with the chart nomenclature. The
reyised chart and the information contained herein will be
subje~t to change as additional· information,becomes availa}?le.
The hammer formulas used for pile driving during construction
shall conform to the standard SpE!cifications and current supple-
. . . mental Specifications unless otherwise specified. The _£)resent
hammer formulas are used as a check for pile bearing during
construction. When the formula bearing fo+ a pile is less than
the design beµrirtg, a pile load test.should be secured.
The "Foundation Soils Information Chart~· is intended to be
an effective aid in selecting 'proper pile lengths. At stream
crossings where scour may be a problem,. tip penetration should
*Peck, Ralph B.: A study of the Comparative Behavior of F.riction Piles: Washington., o .C.: , Highway Research Board: Special Report #36: 1958.
~ ...

-4-
be specified. Preliminary Bridge Design will determine the
approximate scour depth.
Where compressible {unconsolidated} soils are under a
fill, the fill should be predrilled, and drag forces calculated
in accordance with the method described elsewhere.
A steel test pile in Johnson county was tested by pulling.
The resultant allowable bearing value for very firm glacial
clay fill was 0.3 tons per foot in uplift.
93

~ ~-' ... ...,_.. . . .. ~ ' ..
Estimated Allowable -
in Tons per Foot
' Range* Steel ,,
Mean of Wood "H" concrete Soil Description N-value N-Value Pile Pile 16 11
·Alluvium or Loess
Very soft silty clay ' "l .
~ 1 0-1 0 .·3 0.2 0.5 Soft . silty clay 3 2-4 0.3 0.2 0.5 Stiff silty clay· 6 4-8 0.5** 0 .. 4 0.8 Stiff silt 5 . 3..,..7 0.5 0.4 0.8 Stiff sandy silt 5 4-8 0.5 0.4. 0.9 Stiff sandy clay 6 4-8 0.7 0.6 0.9 --Silty sand 8 3-13 . 0 .8 0.7 1.0 Clayey sand ·13.' 6-:20 0.7 j 0 .6 1.0
·pine sand 15' 8-22 1.0 0.6 ' 1. 'l ·, -- --Coarse sand - . 20 12-28 1.2 .0.9 '1.2 Gravelly sand 21 11-31 1.6 0.9 1.6
·Glacial Clays
Firm silty Clay •' 11 7-15 1.0 0. 7 ' 0.9 Firm silty gl. clay 11 7-15 1.0 0.8 1.0 Firm clay (Gumbotil) 12 9-15 1.0 1.0 1.0 --
.Finn glacial clay 11 7-15 1.4 0.9 1.1 Finn sandy.gl. clay 13 9-17 1.4 0.9 1.1 Firrq-very firm gl. clay 14 11-17 1.4 1.2 1.2 --very firm gl. clay 24 17-31 ... 1.6 1.4 1. 6 . --Very f inn sandy gl. clay 25 15-35 ·1.6 1.4 1.6 -- --*Rang~ = Mean·± 1 std. Deviation MUnderlined values determined from pile load tests to yield.
Note: Glacial Soils with N-v.alues greater than 35. and granular soils
Bearing value for Friction Piles (Factor of Safety = 2. 0)
Pile 14 11
0.4 0.4 0~7 0.7 0.8 0.8 0.9 0.9 1.0 1.1 1. 6··
0.8 0.9 0.9 1.0 1.1 1.1 1.7 1~6
Steel Shell Pile Parallel Sided Tapered
18 11 14n 12 II 1011 12" (Av.
0.3 0.3 0.3 0.2 0.3 0.3 0.3 0.2 o.s o.s 0.4 0.4 0.5 o.s 0.4 0.4 0.5 o.s 0.4 0.4 0.6 0.6 0.5 0.4 0.6 0.6 o.s 0.4 0.6 0.6 o ~·s 0.4 0.7 0.7 -·- 0.6 0~5 0.9 ·o. 9 0.9 0.8 0.6 1.2 --1.3 1.2 1.0 0.9 1.6
0.7 0.6 0.7 0.6 0.7 0.6 0.9 0.8 0~9 0.8 0.9 0.8
·1.4 1.3 1.4 ' 1. 3
Date: January, .1967 Revised: June, 1976
· w.ith N-values greater· than 50 MUST be given special consideration.·

95
-6-
I ADDITIONAL RECOMMENDATIONS
1. Do not end a pile in a foundation material for which N-Value
is 4 or less.
2. For wood friction piles, calculate the pile length from the
total estimated safe bearing based on the design load and
select the. r1earest pile length in multiples of 5 feet.
3. For a steel pile, the allowable load over the cross sectional
area of the tip of the pile shall not exceed the following:
6,000 psi in bedrocks for.which N = 20 - 200
9,000 psi in bedrocks for which·N = 200 or more
4. When driving steel pile into bedrock, the following penetration.
is.recommended:
8 ft. to 12. ft. in broken limestone, where practicable.
8 ft. to 12 ft. in shale or firm shale (N=20 to 50).
4 ft. to 10 ft. in medium.hard shale, hard shale or silt stone (N~so to 200} .
3 ft. to 6 ft. in sandstone, siltstone, or hard shale (N=200 or more) .
1 ft. to 3 ft. in solid limestone.
5. If spread footing foundations are considered for a.structure,
additional core borings should be obtained to determine the
allowable bearing value of the- foundation material. In

96
-7-
absence of any other data, the allowable bearing value may be
adopted from the following table:
Average Allowable Bearing
Bedrock N-value value, tons/sq. ft.
shale 16 2
Firm shale 25 3
Med. Hard Shale 50+ 5
Hard shale 50+ 5
Siltstone 50+ 5
sandstone 50+ 5
Limestone ·100+ 10

ACKNOWLEDGMENTS
The study presented in this report was conducted by the
Engineering Research Institute of Iowa State University and was
sponsored by the Iowa Department of Transportation, Highway Division,
through the Iowa Highway Research Board, and the Federal Highway
Administration.
97
I wish to express rrrf appeciation to Dr. Amde M. Wolde-Tinsae and
Dr. Lowell F. Greimann, co-Principal Investigators of the research
project, for their assistance during the investigation and preparation
of this report.
I gratefully acknowledge the assistance and use of soil test
information of the Soils Department of the Iowa Department of
Transportation, Highway Division.
I express thanks to all those in the highway agencies who helped
to make this report complete by returning the survey questionnaire.
I offer a special thanks to those who provided additional information
concerning their design and detailing procedures.