state of the art review of wind tunnels and physical ... · pdf filelaunch vehicle) and...
TRANSCRIPT

* PhD CPEng, Cermak Peterka Petersen Inc., 1415 Blue Spruce Drive, Fort Collins, Colorado 80524, USA. Phone: [970] 498 2334, Fax: [970] 221 3124, Email: [email protected]
The use of the wind tunnel as a building design tool has become much more commonplace in recent years. Its effective use requires close co-ordination between the architect, the structural engineer and the wind engineer, with the architect traditionally serving as project leader. Many structural engineers fi nd that the assessment of frame loads and local cladding pressures via physical modeling in the wind tunnel generates a better design with both improved confi dence and economy in the fi nal product. It is common to see cost savings in the structural and cladding design when compared to the code-based design – in effect the “money” is placed where it is needed in a site-specifi c, building-specifi c wind-tun-nel study. The architect may use the same methodology, at a convenient model scale, to assess the pedestrian-wind conditions around the site, including potential adverse pressure differentials across entrances, prior to construction of the fi nal design. As project leader, the architect frequently drives the move into the wind tunnel as custodian of the client’s interest in a quality product. Recent developments in wind-tunnel technology have expanded the usefulness of data generated for the architect and structural engineer and so allows the team, which includes the wind engineer, to explore unique geometries, unusual load combinations and dynamically sensitive structures, or portions of structures. In addition, the wind engineer is being consulted more frequently at the conceptual design stage when the building shape and orientation are being defi ned. Knowledge of how the massing impacts the wind around a project can be a useful input for the architect.
Model ConstructionIn recent years the use of stereolithography (SLA) to build wind-tunnel
pressure models has largely superseded the traditional, machined Plexiglas pressure model. As architectural designs become more complex, with dual-curvature shapes, the ability to generate these elaborate shapes using software programs like AutoCAD, SolidEdge and SolidWorks al-lows the pressure tap paths to be incorporated into the design before
State of the Art Review of Wind Tunnels and Physical Modelling to Obtain
Structural Loads and Cladding Pressures
Leighton Cochran∗
Figure 1: The laser booth and operational console of a stere-olithography machine.
Figure 2: The hot-fi lm anemometer has traditionally been used to collect turbulent
velocity data in the wind tunnel.
Review Article
UDC: 533.6.07. Keywords: Wind Engineering; Wind Tunnel; Curtainwalls; Façade Pressures; Internal Pres-sures; Tall Buildings; Wind Loads; Partition Loads; Complex Terrain; Computational Wind Engineering
7
Architectural Science ReviewVolume 49, pp 7-16

Architectural Science Review Volume 49
8
the laser-induced creation of the physical model commences in the stereolithography vat (Figure 1). There is some skill on the part of the wind engineer in knowing the best way to design the pressure model components for useable pressure path lengths, appropriate strength in construction and optimal material volume, but the competitive cost of SLA models relative to the traditional Plexiglas models means that the vast majority of pressure models are now built using this method at most leading wind-engineering consultancies.
Velocity MeasurementsThe measurement of mean and peak wind speeds in the wind tunnel
has traditionally been done with the hot-wire or hot-fi lm anemometer - the former being more responsive, but less durable in the testing en-vironment. This well established technology (Schubauer and Klebanoff [1] and Sandborn [2, 3]) shown in Figure 2 now has some serious com-
petition from the highly-responsive, multi-hole pressure probes, such as the Cobra Probe in Figures 3 and 4. These devices have the potential to dramatically augment and refi ne data collection in the wind tunnel, opening up new realms of design possibilities for the architect. Multi-hole probes typically have between 4 and 13 holes in the probe head along with the miniature pressure transducers, yielding a good frequency response. The probe collects time-series pressure data that, through analytic software, is converted to speed and direction over angular ranges that can incorporate reverse fl ow in separated regions. In contrast, the lone hot wire or hot fi lm cannot discern directionality. The ability of the multi-hole probe to respond to the reverse fl ow condition depends to some degree on the number of holes (and so transducers) in the probe design. The resulting data can yield fl ow parameters such as time-varying fl ow-wise velocities [u(t)], transverse velocities [v(t)], vertical velocities [w(t)] and useful turbulent velocity-stress correlations [uv, uw, vw], as well as the time-varying pitch and yaw of the fl ow. In recent years many commercial wind-engineering laboratories have discovered the useful-ness of the multi-hole pressure probe, even in highly turbulent fl ows. The wind-engineering community is still evaluating this relatively new technology, but it is likely to be the way of the future for mean and gust velocity measurements in the wind tunnel.
Laser velocimetry (Figure 5), an optical technology, has been used routinely in fl uid mechanics for at least two decades, but it is now starting to appear in the commercial side of wind engineering to help clients with particular problems. Figure 5 shows this device being used in a scale model to defi ne the wind speeds and directions around an open lattice structure at the newly refurbished Pennsylvania Railway Station in New York City. Unlike hot wires and hot fi lms, these fi ne optical measurements can be made at the location of the lattice or open structure without interfering with fl ow that is being measured. Laser velocimetry is usually the more expensive option, but it provides an improved understanding of the complex winds around the lattice. Thus, with the enhanced fl ow data, and knowledge of the member shapes, the structural wind loads may be better assessed by the structural engineer, leading to more structurally sound and economical designs.
Force MeasurementsEven with the popularity of simpler and cheaper aerodynamic models
(both the high-frequency force balance technique and the simultaneous
Figure 3: Four-hole Cobra probe in use at Hong Kong Univer-sity of Science and Technology (after Dr. Peter Hitchcock).
Figure 4: Schematic sketch of the four-hole Cobra Probe (after Turbulent Flow Instrumentation Pty. Ltd.).
Figure 5: Laser velocimetry in the Meteorological Wind Tunnel at Colo-rado State University. The newly refurbished Pennsylvania Station in
New York City is being studied for structural and cladding wind loads.

Number 1 March 2006
9
pressure approach) to assess dynamic structural loads there is still the occasional unconventional project that requires a fuller exploration of the complex nonlinear relationship between the structural response and the impinging wind via an aeroelastic study. Two interesting examples of this “Rolls Royce” analogue solution to the governing differential equations of motion are the Atlas V Launch Vehicle (Figure 6) prior to lift-off and the architecturally decorative Houston Galleria Arches (Figure 7). The
potential wind loads during the critical moments prior to the launch of any orbital vehicle may vary greatly with the arrival of an unexpected front or thunderstorm. In this study these load probabilities were assessed for a variety of meteorological conditions, positions of the Mobile Service Tower and fuel masses in the vehicle. The last condition provided a challenge for the aeroelastic model construction, particularly when there was no fuel on board – thus, severely reducing the mass of the vehicle to be modeled. The mass scaling parameters in this condition dictated that a very light, thin, stiff, cylindrical shell be built. A variety of approaches were tried, including stereolithography and spun carbon fi bre. With some experimentation a very thin payload shell was built using the fi ner limits of the stereolithography machine. The technically related issues of circular-cylinder surface roughness (tripping separation of the fl ow around the launch vehicle) and Reynolds Number (ratio of inertia forces to viscous forces of concern to engineers when modelling fl ow over streamlined surfaces – unlike most bluff, sharp-edged building shapes which are far more forgiving) for this project came into play as well. A roughened, black surface in the payload area can be seen in Figure 6.
A more Earth-bound, but equally interesting aeroelastic study was that of the Houston Galleria Arches in Figure 7. This public art spanning a major thoroughfare in commercial Houston had an interesting aerodynamically interactive response that required aeroelastic modeling. The aeroelastic models, fi tted with very small accelerometers, responded to their own vortex shedding as well as to the turbulence fl owing off the upwind arch. The seven most signifi cant modes of vibration were effectively repro-
Figure 6: Aeroelastic model of the Atlas V Launch Vehicle with the Mobile Service Tower backed away to the rear.
Figure 7: Aeroelastic model of the Galleria Arches in Houston, Texas, were studied for wind-induced dynamic structural loads
due to vortex shedding.
Figure 8: Simultaneous pressure data collection applied to a midrise condominium in Miami, Florida (510 taps).
Figure 9: The new Miami Air Traffi c Control Tower with the old tower in the background.

Architectural Science Review Volume 49
10
duced with this aeroelastic model. The fi nal result was an elegant, full-scale, span of two 600 mm stainless steel tubes across the six-lane road in Houston, Texas.
The vast majority of buildings do not require the elegance of the aeroelas-tic approach to assess useful design wind loads, and so these projects may be evaluated using an aerodynamic model. In essence, this technique seeks to obtain the external loading (base-moment time series) on a given building shape via a light, stiff model in the wind tunnel, after which the dynamic response may be calculated in the time and/or frequency domain for any desired combination of mass, stiffness, damping ratio and wind speed. The structural engineer fi nds this methodology valuable since revised dynamic properties may be applied to the base-moment spectra or time-series data without returning to the wind tunnel, provided that the external
building shape remains unchanged. This encourages a more economic and iterative design scenario for the structural engineer. Some read-ers will be fully familiar with this approach, but those who wish to read more are directed to work by Boggs [4] and many others in the wind-engineering literature.
However, what is relatively new in wind-tunnel studies is the availability of cheap pressure transducers (Irwin and Kochanski [5]), which convert the pressures caused by the wind at a point on the model into an electrical signal that may be stored in a data-collection computer for subsequent analysis. As a consequence, many laboratories can apply 500 to 1000 transducers to a pressure model and collect pressure time-series data, essentially simultaneously, over the entire building. To obtain the same base moment data as the force balance one needs to assign tributary façade
Figure 10: Base-moment comparison between data taken using the high-frequency force balance and simulta-neous pressures on 1:100 models of the new Miami Air Traffi c Control Tower in Figure 9.

Number 1 March 2006
11
areas, and moment arms to the global axes for each of the taps – effectively a substantial accounting problem. From that point on, the data-reduc-tion is almost identical to the high-frequency force balance technique. The obvious advantage to this approach is that only the pressure model needs to be built (Figure 8), and the lightweight balsawood (typically) force-balance model is not needed. There are, however, less obvious advantages. The high-frequency force balance theory is dependent upon linear mode shapes in bending, whereas in reality the building may have a mode shape with some curvature. This is even more of a concern for torsion, which would be approximately linear with height in the full scale but is constant with height on the force balance. Correction factors for these two shortcomings of the high-frequency force balance are available in the literature, but the simultaneous pressure approach offers a way to accommodate these mode-shape issues via weighting the pressure data according to the true mode shapes of the full-scale structure.
For long, lowrise buildings (Figure 8) the high-frequency force balance will generate base moments contaminated by roof uplift pressures at the model building extremities, well removed from the centrally located x and y axes. The structural engineer does not want this impacting the horizontal loads on each fl oor. Those roof uplift forces are accommodated elsewhere in his design. For tall buildings (Figure 9 is an extreme example), with a relatively small plan area, this effect is imperceptible. The simultaneous pressure technique removes the roof infl uence for long buildings since the experiment can be designed to take simultaneous data from wall taps only. This observation is fortuitous since it results in a useful and practical demarcation between times the high-frequency force balance is preferred over the simultaneous pressure approach. Tall building models tend to have a small internal volume, for pressure tubing, and so the force balance is preferred on that pragmatic basis. Conversely, squat buildings do not lend themselves to the force balance and have plenty of internal volume for tubing.
The obvious question any structural engineer would ask is “do both techniques result in the same design loads?” Additionally, the wind engi-neer would like to know how many taps are needed to generate reliable design data. At CPP Inc., we have compared data collected using both the high-frequency force balance and simultaneous pressures for a variety of building shapes and surroundings. Those studies have suggested a relative insensitivity, beyond a threshold, to the actual number of taps used – a suffi cient number to capture the cladding data appears to be more than adequate for the integrated structural loads. The AWES Quality Assurance Manual [6] also has some guidance of the number of taps needed.
By way of example, Figure 10 shows the comparison of base moments for a 1:100 balsawood high-frequency force balance model of the new Miami Air Traffi c Control Tower (ATCT) with a 1:100 pressure model of the same tower (note that 1000 k-ft = 1.356 MNm). This is a tall slender structure in an open upwind environment (i.e. the open fi eld associated with an airport, as shown in Figure 9) that would typically not be studied by the simultaneous pressure technique. However, it was useful in explor-ing how many taps are needed for such a simple prismatic shape. There were about 190 taps in the pressure model (all that could be placed inside the model of the ATCT stem) for simultaneous pressure data collection. The relatively regular shape of the ATCT and lack of interfering structures (reduced fl ow complexity associated with a relatively isolated building) resulted in a good data match even with these few number of taps. Similar comparisons with more complex buildings in more complex surroundings have produced comparable results with about 500 to 700 taps. Figure 10 also shows base moment data for a 1:225 model of the same ATCT tested
at an earlier time. An observant reader will notice that easterly fl ows (i.e. coming from 90 degrees) generate somewhat different peak minimum base moments (M
y) over a range of azimuths for the two 1:100 studies
y) over a range of azimuths for the two 1:100 studies
y
when compared to the 1:225 study. This is due to a 45-degree error in the understanding of the orientation of the shorter existing ATCT legs upwind (Figure 9) of the new tower between the 1:225 and 1:100 tests. This came about from better surrounding photographs in the second study when the correct orientation of the four legs of the existing ATCT became apparent. Thus, all members of the design team need to be involved in assessing the accuracy of the surrounding turntable model.
Many comparisons have been made between the force balance and simultaneous pressure method approaches in more complex urban environments. Figure 11 shows an extreme example, with comparably
Figure 11: Thirty-storey Florida condominium, with tall proximate neighbours, used to compare balsawood force balance (shown here
on the left as the twin building) data with the simultaneous pres-sure technique. The subject building is the middle one. Note that
north is at the top of the photograph.
Figure 12: Mean and peak base moment coeffi cients about the x and y axes using both techniques for the
centre building.

Architectural Science Review Volume 49
12
tall buildings very close to the subject building. The mean and peak base moment coeffi cient data are compared in Figure 12 and the spectral responses are in Figure 13. In this case only 290 taps on the pressure model of the tower were used. The comparison is fair, but the southerly
fl ow impacting the My base moment indicates an underestimation on the mean (solid and dashed lines) and peak (open and solid symbols) base moments, probably due to the low number of taps used. For each wind azimuth there are two peak values (maximum and minimum extreme base moments) as well as a mean value between those extremes. Data like these have been used to suggest a lower bound to the number of taps needed. Interestingly, the fl uctuating component of the load (difference between the mean and peak loads in Figure 12 and the sample spectra taken from the 200 degree load case in Figure 13) is in good agreement between the two techniques. These data, and other in-house studies, have led CPP Inc. to use between 400 and 700 taps in the typical simultaneous pressures study of a new midrise building in a complex cityscape.
New Client ServicesThe arena of new developments in commercial wind engineering is
infl uenced greatly by the needs of the client. One growing new area is forensic wind engineering with client driven needs as varied as glass or louvre failures in relatively modest winds to court cases concerning deaths resulting from wind-induced crane failures. The wind tunnel can produce crucial and convincing data for the legal fraternity in these areas of science and engineering.
Some clients wish to explore their own product research in the wind tunnel. Vortex fences and spoilers (Cochran Cermak and English [7], Cochran [8] and Banks Sarkar Wu and Meroney [9]) have been applied to critical-use buildings in hurricane areas of the United States (Figure 14). In a similar manner new designs for vertical and horizontal axis wind turbines (Figure 15) are more commonly being investigated on a consulting basis in the wind tunnel and in the fi eld.
Another trend in consulting wind engineering, which seems likely to continue, is the combination of complex architecture and reduced real costs of a typical wind-tunnel study. This has caused many mid to lowrise buildings to be tested for cladding and structural loads. It is not uncommon for buildings in the eight to twelve-storey range to be put in the wind tunnel. As more condominium developers realize the benefi ts for their design this trend will continue, particularly in hurricane or cy-clone prone areas. For residential towers some developers actually use the pressure model and a fl ow-visualization DVD of the testing in their
Figure 14: Spoiler on the edge of the TTU Building in Lubbock, Texas [9].
Figure 13: Mx and My spectra from the HFFB and 290-tap simultaneous pressures at 200 degrees.
Figure 15: Full-scale wind turbine design is used to confi rm model studies in the wind tunnel and initial Computational Fluid Dynam-
ics (CFD) input.
Figure 16: A complex 1:100 pressure model of an expensive 4000 m2
home in Palm Desert, California was built using the stereolithogra-phy process (Habitat Guy Dreier Designs).
Number 1 March 2006
13
display unit as a selling point, aimed at potential purchasers. The unique home design in Figure 16 is an example of a lowrise building that does not lend itself to a code wind analysis, due entirely to the complexity of the architecture. This exotic, expensive, single-storey home has been tested in the wind tunnel. Although this is not a common client type, it does occur occasionally.
Wind EnergyOver the last few years a substantial growth area in consulting wind
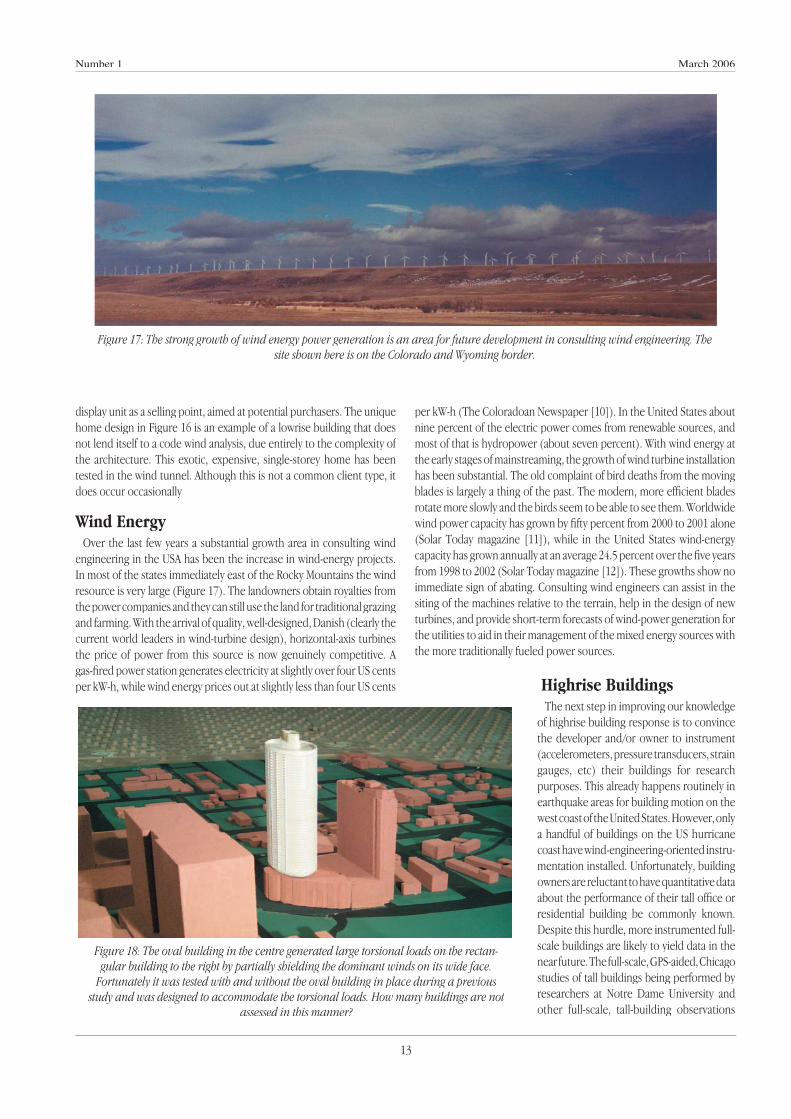
engineering in the USA has been the increase in wind-energy projects. In most of the states immediately east of the Rocky Mountains the wind resource is very large (Figure 17). The landowners obtain royalties from the power companies and they can still use the land for traditional grazing and farming. With the arrival of quality, well-designed, Danish (clearly the current world leaders in wind-turbine design), horizontal-axis turbines the price of power from this source is now genuinely competitive. A gas-fi red power station generates electricity at slightly over four US cents per kW-h, while wind energy prices out at slightly less than four US cents
per kW-h (The Coloradoan Newspaper [10]). In the United States about nine percent of the electric power comes from renewable sources, and most of that is hydropower (about seven percent). With wind energy at the early stages of mainstreaming, the growth of wind turbine installation has been substantial. The old complaint of bird deaths from the moving blades is largely a thing of the past. The modern, more effi cient blades rotate more slowly and the birds seem to be able to see them. Worldwide wind power capacity has grown by fi fty percent from 2000 to 2001 alone (Solar Today magazine [11]), while in the United States wind-energy capacity has grown annually at an average 24.5 percent over the fi ve years from 1998 to 2002 (Solar Today magazine [12]). These growths show no immediate sign of abating. Consulting wind engineers can assist in the siting of the machines relative to the terrain, help in the design of new turbines, and provide short-term forecasts of wind-power generation for the utilities to aid in their management of the mixed energy sources with the more traditionally fueled power sources.
Highrise BuildingsThe next step in improving our knowledge
of highrise building response is to convince the developer and/or owner to instrument (accelerometers, pressure transducers, strain gauges, etc) their buildings for research purposes. This already happens routinely in earthquake areas for building motion on the west coast of the United States. However, only a handful of buildings on the US hurricane coast have wind-engineering-oriented instru-mentation installed. Unfortunately, building owners are reluctant to have quantitative data about the performance of their tall offi ce or residential building be commonly known. Despite this hurdle, more instrumented full-scale buildings are likely to yield data in the near future. The full-scale, GPS-aided, Chicago studies of tall buildings being performed by researchers at Notre Dame University and other full-scale, tall-building observations
Figure 17: The strong growth of wind energy power generation is an area for future development in consulting wind engineering. The site shown here is on the Colorado and Wyoming border.
Figure 18: The oval building in the centre generated large torsional loads on the rectan-gular building to the right by partially shielding the dominant winds on its wide face.
Fortunately it was tested with and without the oval building in place during a previous study and was designed to accommodate the torsional loads. How many buildings are not
assessed in this manner?

Architectural Science Review Volume 49
14
coming from researchers at the Hong Kong University of Science and Technology will help us understand building response more fully. This is particularly important as several current and future super-tall buildings exceed half a kilometer in height.
One glaring research need is a better codifi cation of torsional loads on buildings (M
z, the action of twisting about the vertical axis of the building).
The newer wind-loading codes make some attempt at this, but the end result often bears little resemblance to reality and is frequently uncon-servative. With modern, complex architecture it is now more common to fi nd the centre of stiffness considerably displaced from the centre of mass (e.g. elevator cores near the end of a building, not the centre) and when this is combined with asymmetrical fl ows, caused by neighbouring buildings (Figure 18), torsion may be a major concern. Torsion can also be more signifi cant for curved buildings than their rectilinear counterparts. One observation is that midrise condominiums with a “banana-shaped” fl oor plan (a common architectural shape in a beachfront location) frequently have substantial torsional loads. Additionally these loads tend to occur close to the wind direction that maximizes the two horizontal bending moments(M
x and M
y). In condominium design architectural
y). In condominium design architectural
y
considerations often dictate that peripheral shear walls are not possible. Thus, stiffness about the vertical axis may be low and this will aggravate the torsional response with a susceptible building shape. This condition may result in the fundamental modal response of the building not being
in bending, but being dominated by torsion about the vertical axis. This can produce peak torsional base moments (M
z) with magnitudes of thirty
to forty percent of the peak base overturning bending moment (Mx or
My).
y).
yA structural engineer using a code-based design would have no
reliable knowledge of this action on his/her design.
Operable Facades and Green BuildingsIt is fairly common for wind-engineering laboratories to account for
broken or open windows by using a series of simultaneous pressure differences across a communicable internal space, where one pressure represents the transmitted internal pressure generated at what would be the opening in the full-scale building (Cochran and Peterka [13]). This approach works quite well, but it is somewhat conservative. It assumes that the broken window occurs at the worst location enclosing a given building volume when the wind blows from the worst wind direction in the design storm. This string of unlikely events suggests that a reduced return period could be applied to the open-window design pressures. A recent development is to assign a rational probability analysis to this proc-ess, so that the largest pressure difference is not used. Some statistically lesser peak pressure difference serves better for a risk-consistent design. The building in Figure 19 has a computer-controlled façade (actuators at the operable windows) to aid in the natural ventilation of the internal space. The façade had to be designed to account for the unexpected case of the sudden arrival of a thunderstorm front at or near the design wind speed. In that circumstance some severe external pressures could be transmitted to the internal space if windows were unable to close in time or were subject to a power failure. An example of the real time dif-ferencing used in this green-building study is given in Figure 20. Here a portion of a pair of simultaneous, time-series data that resulted in the largest pressure difference on one penthouse fl oor is shown (taps on either side of a penthouse corner in this case, shown in Figure 20) and the largest difference was about 3.3 kPa for the 100-year design pressure. This type of maximum-difference search analysis is performed for all the tap-pair combinations relevant to a given internal space for all 36 wind directions, and then these data are used in the façade design at the ap-propriate location on the glazed portion of the building.
Less extreme return period pressures (say monthly or annually) around the building envelope may be used as input boundary conditions for a CFD study of the internal fl ows during an analysis for the growing fi eld of natural ventilation. In this way the wind tunnel and computational
analysis are symbiotically used to yield the mechanical engineer a more confi dent understanding of an energy-effi cient design.
Another internal pressure ques-tion has arisen in recent times with the advent of 300-m residential buildings (Figure 21). At such high elevations tenants opening their balcony doors during a strong wind event could differentially load the lightweight partition walls between the units substantially. In the typical shorter and protected buildings of the past this was a small pressure difference and it was rarely even considered. Some
Figure 19: The Genzyme Headquarters in Boston, Massachusetts, was analyzed for cladding pressures when selected critical
windows were assumed open during a design storm.
Figure 20: A typical example of simultaneous time-series pressures that were searched for the maxi-mum difference by wind direction and position on the curtainwall (after Cochran and Peterka [13]).

Number 1 March 2006
15
research is needed to give guidance on this topic to the structural en-gineer and architect. However in the interim, using measured pressure data across two building models and judging the likelihood of tenants simultaneously opening doors during a design storm, two independent commercial laboratories advised values of 2.4 kPa and 2.0 kPa for two residential buildings of 300 m and 270 m height, respectively, for this scenario. Even so, some additional work in this area is needed. Another residential tall-building issue is the perception of motion at the top of these tall apartment buildings. Some current work being performed in a motion simulator at the Hong Kong University of Science and Technology is likely to yield further insight into motion susceptibility of residents in these very tall apartment buildings.
Flying Debris and Wind StormsA recent development in the wind-engineering research community
is the detailed study of how fl ying debris moves in the strong hurricane wind prior to impacting a portion of the building envelope [14, 15, 16]. The focus of this work defi nes three “missile” geometries: rod-like (nominally one dimensional), plate-like (nominally two dimensional) and three-dimensional spheroid-like objects. These shapes are referred to in the literature as “rods”, “plates” and “compact objects”. The paths of these objects have been studied in the wind tunnel and fi eld, for comparison with numerically calculated trajectories. The agreement appears to be quite good. The plate-like objects have been shown to be quite interesting, as they can develop lift characteristics in the wind fl ow. In the strong wind
event it has been observed that “plate” objects (such as clay tiles) cause considerable damage, even though the design standards focus on “rod” and “compact” objects in the missile/debris impact tests. Even though the work is ongoing, this research is likely to be incorporated into testing procedures for façade elements in the near future.
Computational Wind EngineeringLastly, the most obvious future development in commercial wind engi-
neering will be the maturation of Computational Wind Engineering (CWE) – application of Computational Fluid Dynamics (CFD) to atmospheric fl ows. There is still much research to be done on turbulence models, solution algorithms, domain generation and gross computing power before structural loads and cladding pressures are routinely performed on a computer, but I expect to see it in my professional lifetime. Probably the most diffi cult will be the generation of peak cladding pressures from the turbulent Navier-Stokes equations. The truly frightening observation is that some consultants, without much understanding of the wind or fl ow physics, are taking commercial programs, designed for low-turbu-lence internal fl ows, and are applying them to external, highly-turbulent, atmospheric winds around buildings (Cochran [17]). In reviewing some recent journal papers there are examples of CFD-generated fl ows around lone, tall, rectangular buildings that did not even show the elementary phenomenon of downwash. The authors were either unaware or did not care about this fundamental shortcoming. It is examples such as this that has led some researchers to sarcastically refer to CFD as “Colourful Flow Drawings”.
The lack of validation with the full scale (as was done in the early years of wind-tunnel modeling) could easily mislead a well intentioned architect or structural engineer into thinking his CFD package is generating real design wind loads. It is the duty of commercial and research wind-engineers to take the lead in CWE so that it is used where the technology is appropriate, since they have a far better understanding of the turbulent, atmospheric fl ow physics. Even at this early stage there may be realms where CWE can positively contribute. For example, large-area meteorological fl ows over complex terrain (the use of nested grids used in codes developed by atmospheric scientists, such as Advanced Regional Predictive System (ARPS) from the University of Oklahoma or the Regional Advanced Modelling System (RAMS) from Colorado State University, as discussed by Derickson and Peterka [18]), thermally driven fl ows associated with internal atrium fi res and certain smaller-scale dispersion studies seem to be the most likely fi rst steps. Thus, CWE is the way of the future, but wind engineers need to take the lead among other consultants to ensure that poorly or non-validated data are not taken as gospel by designers less familiar with the intricacies of the natural wind.
AcknowledgementsThe author would like to thank the intellectual input and detailed review
by Dr. Russ Derickson during the composition process. The result has been a far more readable text.
References1. G.B. SCHUBAUER and P.S. KLEBANOFF: Theory and Application of
Hot Wire Instruments in the Investigation of Turbulent Boundary Layers, N.A.C.A. Wartime Report, Advance Confi dential Report 5K27 W86, 1946.
2. V.A. SANDBORN: Resistance Temperature Transducers, Metrology
Figure 21: Residential buildings in the 300-m range generate new serviceability and partition design concerns. Sunland Designs’ Q1 in Surfers Paradise, Australia, was wind-tunnel tested by an
Australian wind-engineering fi rm.

Architectural Science Review Volume 49
16
Press, Fort Collins, 1972, 545 pp.
3. V.A. SANDBORN: Class Notes for Experimental Methods in Fluid Me-chanics, Department of Civil Engineering, Colorado State University, Fourth Edition, 1981.
4. D.W. BOGGS: Validation of the Aerodynamic Model Method, Journal 4. D.W. BOGGS: Validation of the Aerodynamic Model Method, Journal 4. D.W. BOGGS: Validation of the Aerodynamic Model Method, of Wind Engineering and Industrial Aerodynamics, Volume 41-44, 1992, pp 1011-1022.
5. H.P.A.H. IRWIN and W.W. KOCHANSKI: Measurement of Structural Wind Loads Using the High Frequency Pressure Integration Method, Proceedings of the XIII ASCE Structural Congress, Boston, 1995.
6. AUSTRALASIAN WIND ENGINEERING SOCIETY (AWES): Qual-ity Assurance Manual for Wind Engineering Studies of Buildings (AWES-QAM-1-2001), 2001, 33pp.
7. L.S., COCHRAN, J.E. CERMAK and E.C. ENGLISH: Load Reduction by Modifying the Roof Corner Vortex, Proceedings of the Ninth International Conference on Wind Engineering, New Delhi, India, 1995, pp 1091-1102.
8. L.S. COCHRAN: Wind Effects on Lowrise Buildings, Proceedings of the Second National Conference on Wind Engineering, Commemorative Volume to Honour Professor Prem Krishna, Indian Society for Wind Engineering, Volume 1, 2004, pp 79-99.
9. D, BANKS, P.P., SARKER, F. WU and R.N. MERONEY: A Device to Mitigate Vortex Induced Rooftop Suction, Proceedings of the Ninth Americas Conference on Wind Engineering, Clemson University, Clemson, South Carolina, 2001, 10 pp.
10. COLORADOAN NEWSPAPER: Colorado Wind Energy, 26 January 2003.
11. EDITOR: Solar Today Magazine, November/December 2002.
12. C. REAL de AZUA: Investors Need to Notice Wind Energy’s Perform-ance, Solar Today Magazine, January/February 2004, p 40.
13. L.S. COCHRAN and J.A. PETERKA: On Breached Building Envelopes and Increased Internal Pressures, Proceedings of the ICBEST-01 Conference, Ottawa, Canada, June 2001, pp 83-87.
14. J. D. HOLMES, C. W. LETCHFORD and N. LIN: Trajectories of Wind-borne Debris of the Plate Type, Proceedings of the Tenth Americas Conference on Wind Engineering, Baton Rouge, USA, June 2005, p 212.
15. N. LIN, C. W. LETCHFORD and J. D. HOLMES: Experimental Investiga-tion of Trajectory of Windborne Debris with Application to Debris Impact Criteria, Proceedings of the Tenth Americas Conference on Wind Engineering, Baton Rouge, USA, June 2005, p 232.
16. J.D. HOLMES, C. LETCHFORD and NING LIN: Application of Wind-borne Debris Research to Hurricane Protection System and Shelter Standards, Proceedings of the Tenth Americas Conference on Wind Engineering, Baton Rouge, USA, June 2005, p 234.
17. L.S. COCHRAN: Wind Analysis Evolves, Letters to the Editor, Engineer-ing News Record, McGraw Hill Construction, Issue 30, September 2002, p5.
18. R.G. DERICKSON and J.A. PETERKA: Development of a Powerful Hybrid Tool for Evaluating Wind Power in Complex Terrain: Atmospheric Numerical Models and Wind Tunnels, Proceedings of the 23rd ASME rd ASME rd
Wind Energy Symposium, Reno, Nevada, January 2004, 15 pp.