state of the ethekwini economy - … learning exchange 2016...knowledge economy • new knowledge,...
TRANSCRIPT

STATE OF THE
ETHEKWINI ECONOMY KNOWLEDGE IN THE ECONOMY

KNOWLEDGE ECONOMY
• New knowledge, innovation and technological change have become the drivers of progress, growth and wealth in the world’s leading economies
• Reduced reliance on traditional resources such as labour and capital
• Innovation is identified as a driver for economic growth and productivity
• Indicators: – R&D expenditure
– patent data and bibliometric data; scientific publications and citations,
HIGH LEVEL ISSUES ON THE GLOBAL
ECONOMY
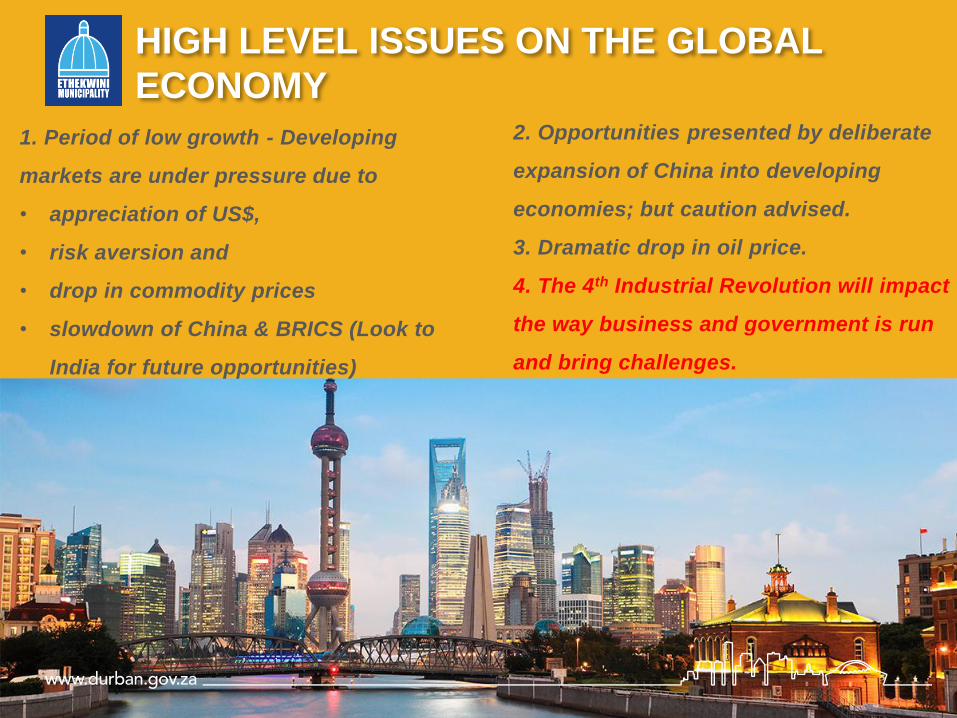
1. Period of low growth - Developing
markets are under pressure due to
• appreciation of US$,
• risk aversion and
• drop in commodity prices
• slowdown of China & BRICS (Look to
India for future opportunities)
2. Opportunities presented by deliberate
expansion of China into developing
economies; but caution advised.
3. Dramatic drop in oil price.
4. The 4th Industrial Revolution will impact
the way business and government is run
and bring challenges.

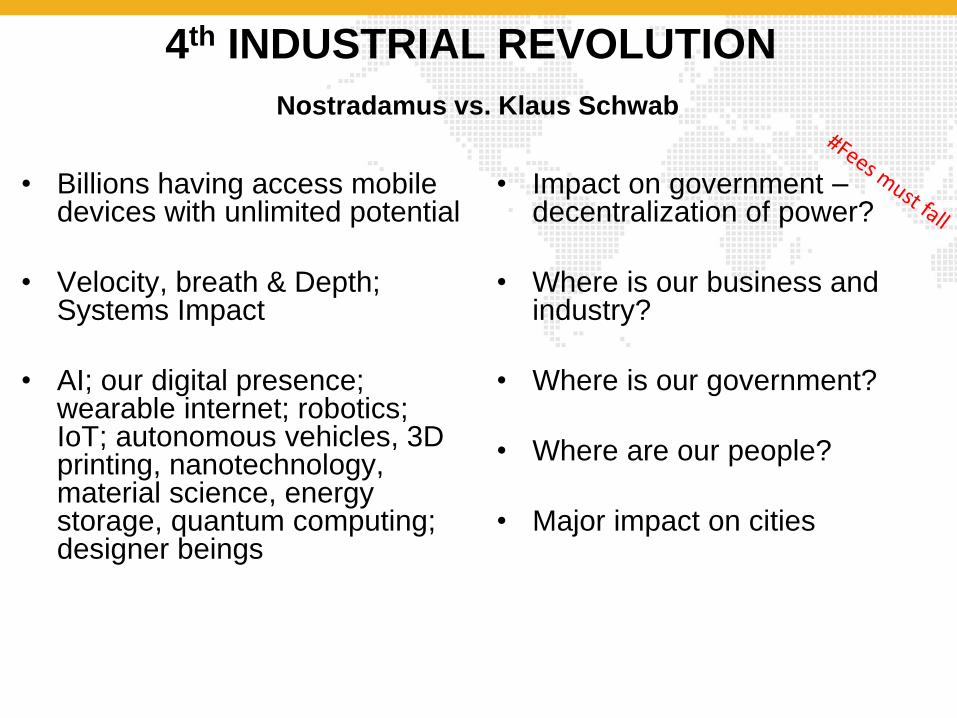
4th INDUSTRIAL REVOLUTION
Nostradamus vs. Klaus Schwab
• Billions having access mobile devices with unlimited potential
• Velocity, breath & Depth; Systems Impact
• AI; our digital presence; wearable internet; robotics; IoT; autonomous vehicles, 3D printing, nanotechnology, material science, energy storage, quantum computing; designer beings
• Impact on government – decentralization of power?
• Where is our business and industry?
• Where is our government?
• Where are our people?
• Major impact on cities

“We’re poised to experience more digital progress in the next 10
years than we have in the last 50” – Denis O’Brien Chairman of Digicel
2018 2021 2022 2023 2024 2025 2026 2027
Storage for all
Robot & services
- The internet of and for things
- Wearable internet
- 3D printing & manufacturing
- Implantable technologies
- Big data decisions
- Vision as new interface
- Our digital presence
- Governments & the blockchain
- A supercomputer in your pocket
- Ubiquitous computing
- 3D printing & human health
- The connected home
- 3D printing & consumer products
- AI & white collar jobs
- The sharing economy
- Driverless cars
- AI & decision making
- Smart cities
- Bitcoin & the blockchain
Average year each tipping point is expected to occur

ISSUES ON THE AFRICAN
ECONOMY 1. Africa is experiencing robust growth in particular markets and it is anticipated
that the growing young middle class will attract investment,
2. South Africa has an opportunity to expand further into African urban markets.
3. Egypt “now” Africa’s 2nd largest economy; but this is result of rebasing and
puts economy size in perspective
4. Cities to look out for: Lagos, Lusaka and Kinshasa (South African cities are
slipping in the rankings).

Internet and Patents
Ranking internet speed in Africa
1. Ghana
2. Zimbabwe
3. Kenya
4. Libya
5. Madagascar
6. South Africa (and 8th in
internet penetration in Africa)
World Intellectual Property Organisation
(WIPO) Patent Registrations 2013
• Africa: 500 of 205 000
• 351 international applications
from South Africa
• Morocco had 54 filings, Nigeria
and Kenya had seven each.
• Patent protection is still embryonic
on the fast-growing continent.

SOUTH AFRICAN ECONOMY AT A GLANCE
A diverse and resilient economy, that is under
severe pressure

SUMMARY: STATE OF SA ECONOMY
• South Africa remains a sound economy, not at all far from repair. IMF recommends the
following in order to reach 5% growth rate:
“…Improving electricity supply, enhanced competition in product markets, a more
inclusive labour market, and … an education system that provides SA’s youth with the
best education possible"
Input costs
Demand and Output
• Inflation
• Electricity
• Municipal costs
• Labour
• Logistics
• Imported materials
• Red tape
• Fuel
• Water
• Infrastructure
• Drought
• Slower demand
• Productivity
• Commodity prices

T H E B I G R I S K S A C R I S I S O F P O L I T I C A L E C O N O M Y
Social
Demands
Po
litica
l Ou
tloo
k
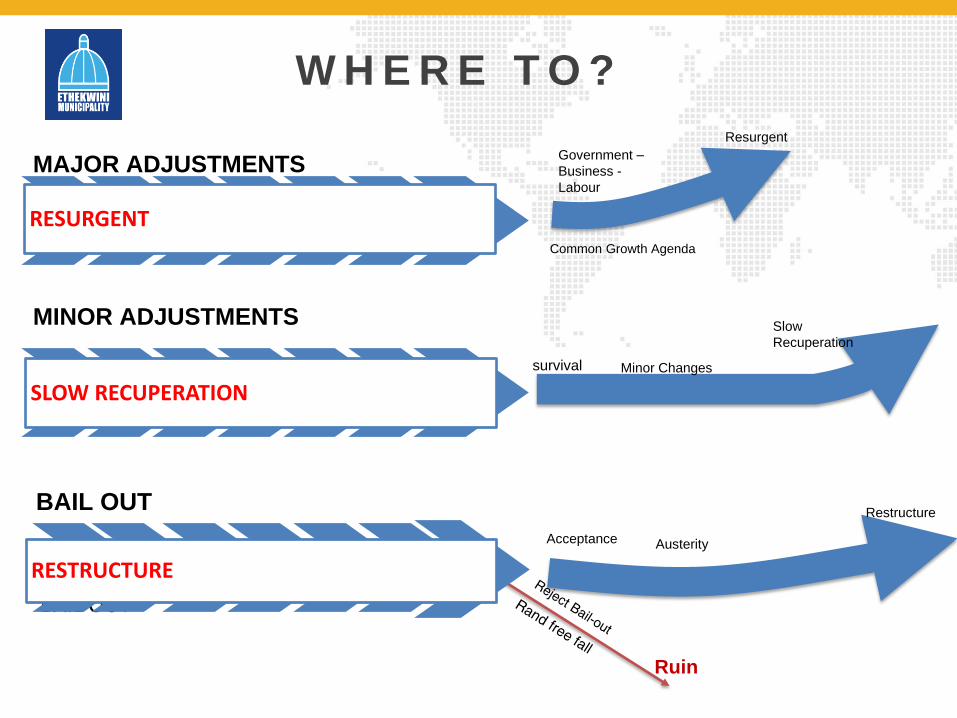
Austerity
Restructure
Ruin
survival Minor Changes
Resurgent
Government –
Business -
Labour
Common Growth Agenda
Slow
Recuperation
Acceptance
MAJOR ADJUSTMENTS
RESURGENT
MINOR ADJUSTMENTS
SLOW RECUPERATION
BAIL OUT
RESTRUCTURE
BAIL OUT
W H E R E T O ?

Moody’s did not downgrade SA, but the outlook is still negative. South Africa still at investment
grade because of Moody’s view that SA growth likely to gradually strengthen. Outlook on SA:
• Supply-side shocks from 2014 receded (Eskom reduced load shedding, the drought is
ending and the number of work days lost to strikes has shrunk significantly)
• Inflation outlook is more subdued
• Interest rates less likely to increase as inflation decreases. Households less under pressure.
• Country growth rate expected to increase to 1.5% in 2017.
• Efforts by government to engage business
• Reassessment of SOE operations
• Aggressive budget consolidation measures
• Gross govt debt expected to stabilize in the current fiscal year to 51% of GDP.
• Strength and independence of South Africa’s systems and institutions
BUT OUTLOOK STILL NEGATIVE BECAUSE:
• There are still risks associated with the growth, fiscal and political outlook
• Possibility of renewed volatility in global financial markets
SA STILL SEEN AS ECONOMICALLY SOUND BUT
MOODY’S TO KEEP AN EYE ON SA GVT PROGRESS AND REASSESS AGAIN
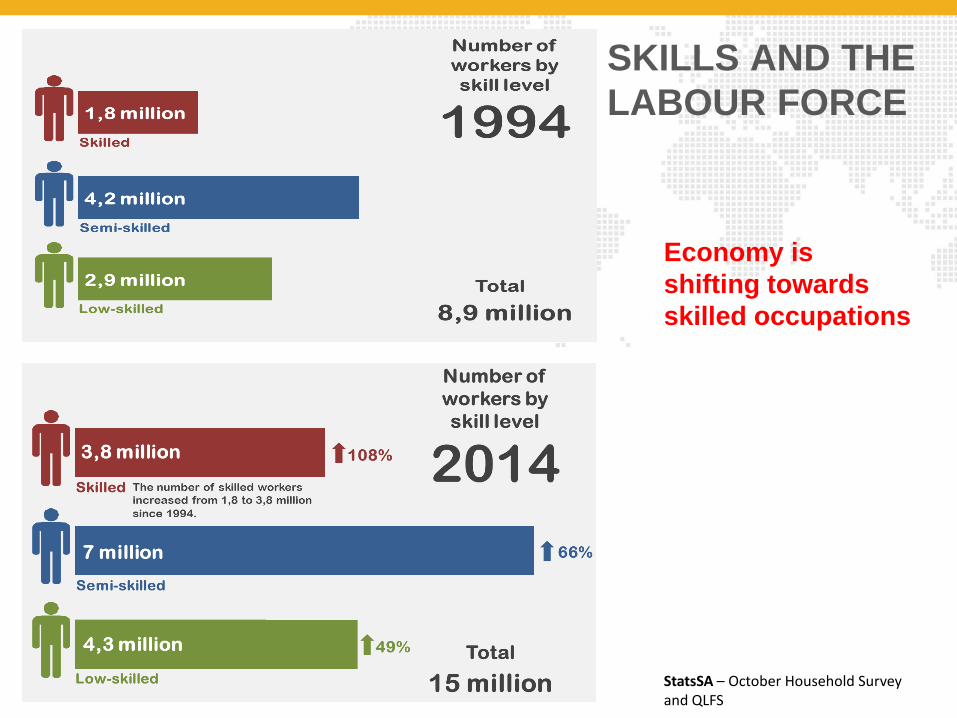
Economy is
shifting towards
skilled occupations
StatsSA – October Household Survey and QLFS
SKILLS AND THE
LABOUR FORCE
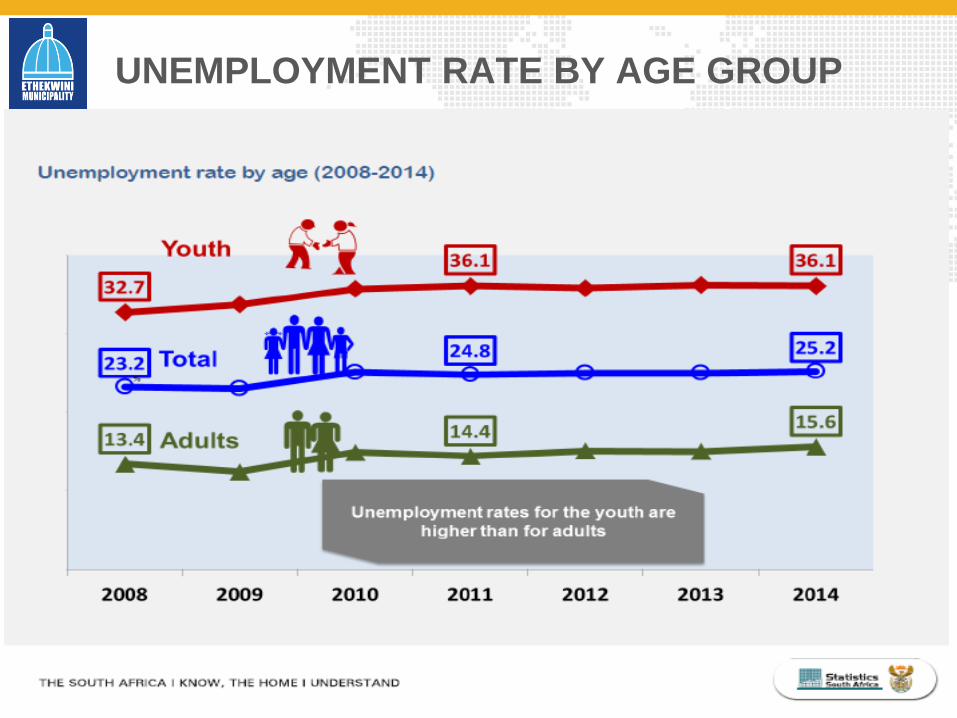
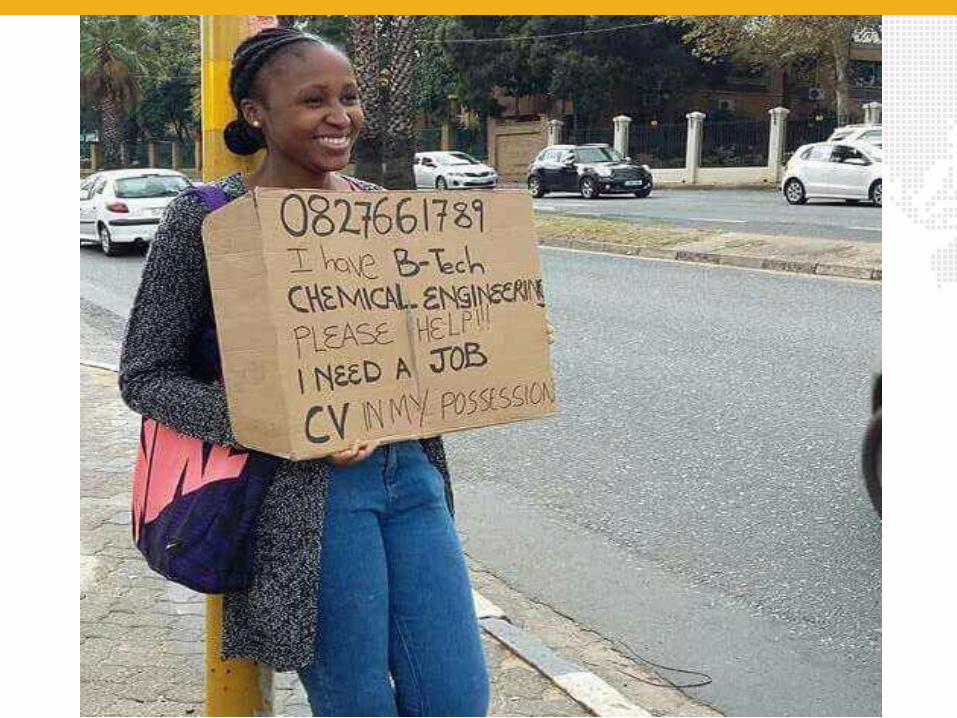
UNEMPLOYMENT RATE BY AGE GROUP

THE EDUCATION SYSTEM
National Development
Plan: CH9
SA faces a low growth, middle income trap, characterized by: • Weak competition • High
unemployment • Low savings • A poor skills profile
• The quality of education for most Black children is poor
• By the end of Grade 12, SA has lost half of every cohort entering the school system
………..”Which wastes human potential and harms life-chances of our youth”

STATE OF ETHEKWINI ECONOMY
There are difficult economic times ahead which will be worsened by
the resource crisis and political outlook. Innovation and efficiency
are required for the economy to survive, and thrive
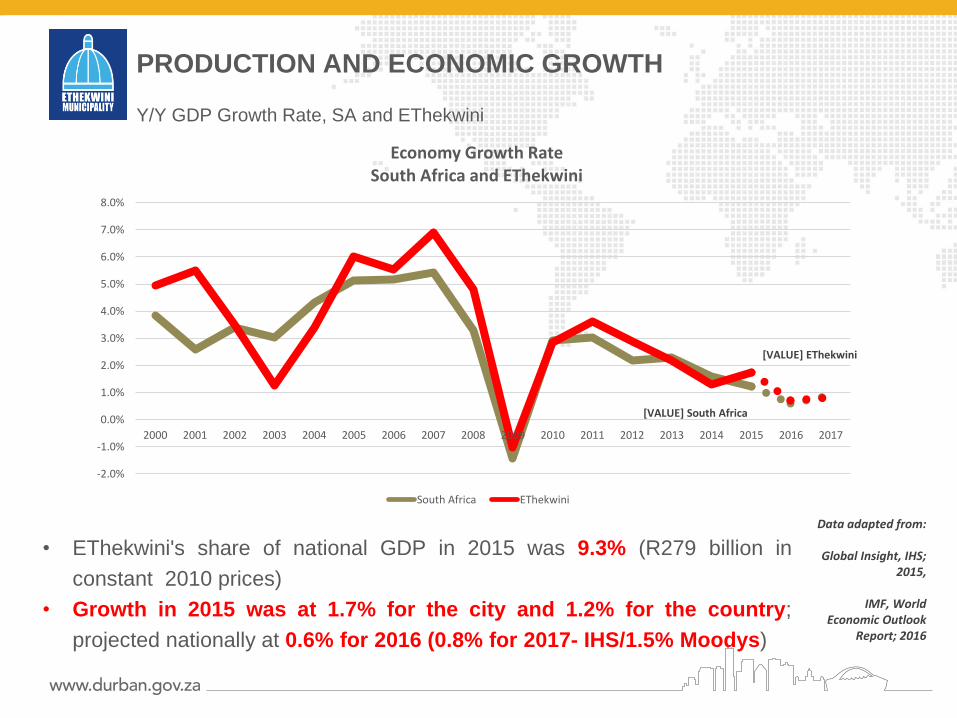
PRODUCTION AND ECONOMIC GROWTH
• EThekwini's share of national GDP in 2015 was 9.3% (R279 billion in
constant 2010 prices)
• Growth in 2015 was at 1.7% for the city and 1.2% for the country;
projected nationally at 0.6% for 2016 (0.8% for 2017- IHS/1.5% Moodys)
Data adapted from:
Global Insight, IHS; 2015,
IMF, World
Economic Outlook Report; 2016
Y/Y GDP Growth Rate, SA and EThekwini
[VALUE] South Africa
[VALUE] EThekwini
-2.0%
-1.0%
0.0%
1.0%
2.0%
3.0%
4.0%
5.0%
6.0%
7.0%
8.0%
2000 2001 2002 2003 2004 2005 2006 2007 2008 2009 2010 2011 2012 2013 2014 2015 2016 2017
Economy Growth Rate South Africa and EThekwini
South Africa EThekwini

• Total GDP in 2015 = R278,9 billion
(Constant 2010 Prices).
• Services now account for 75% of the
City’s economy.
• Main sectors in EThekwini’s economy–
community services, finance,
manufacturing and trade.
• EThekwini is two speed economy;
partially a mature, stagnant (in
secondary sector) economy,
dominated by rapid growth by the
tertiary sector.
Data from Global Insight, IHS; 2016
Primary Sector
Secondary Sector
Tertiary Sector
Agriculture 1%
Mining 0%
Manufacturing 17%
Electricity 2%
Construction 5%
Trade 16%
Transport 16%
Finance 22%
Community services
21%
GVA Composition of EThekwini in 2015
ETHEKWINI’S ECONOMIC COMPOSITION

• The significance of primary sector
has been reducing
• After the economic recession of 2008-
09, the secondary sector has
experienced very slow growth driven
mainly by construction, while
manufacturing has been relatively
stagnant
• McKinsey 2015 place emphasis on
advanced manufacturing
• Manufacturing’s best performers have
been food & beverage and the fuel
petroleum chemicals and rubber
products followed by transport
equipment
• The tertiary sector has experienced the
biggest growth
• The best performers have been wholesale
& retail trade, finance, community
services followed by land and water
transport.
• Mediocre performance of tourism sector
• Shifts away from unskilled and towards
semi-skilled and increasingly sectors
requiring higher skills.
SECTORAL TRENDS

ETHEKWINI LABOUR MARKET
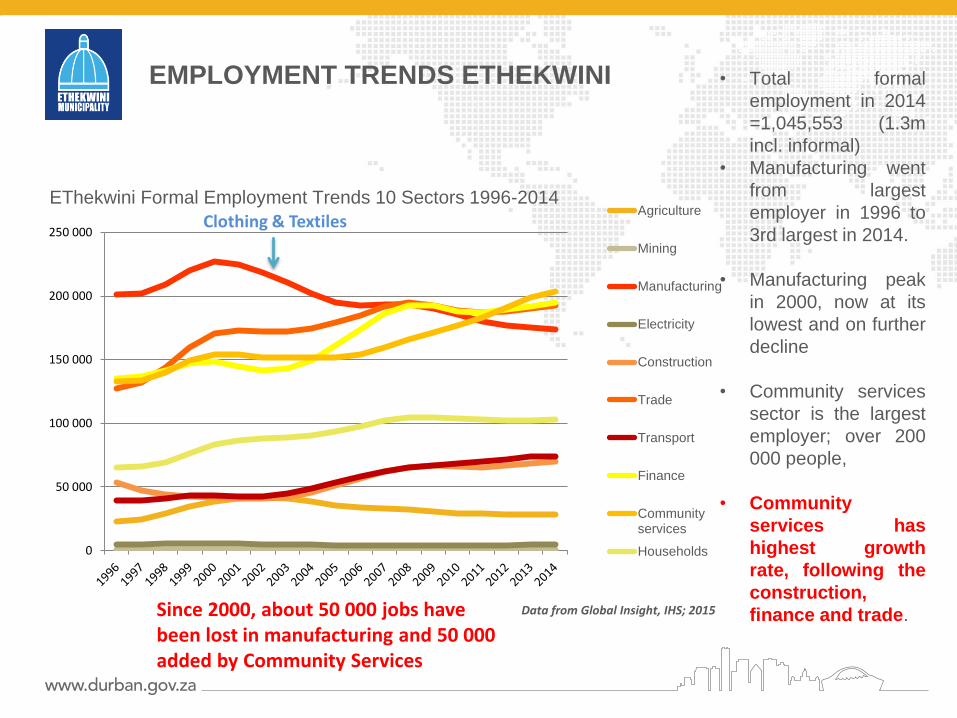
EMPLOYMENT TRENDS ETHEKWINI
0
50 000
100 000
150 000
200 000
250 000
EThekwini Formal Employment Trends 10 Sectors 1996-2014 Agriculture
Mining
Manufacturing
Electricity
Construction
Trade
Transport
Finance
Communityservices
Households
Data from Global Insight, IHS; 2015
• Total formal
employment in 2014
=1,045,553 (1.3m
incl. informal)
• Manufacturing went
from largest
employer in 1996 to
3rd largest in 2014.
• Manufacturing peak
in 2000, now at its
lowest and on further
decline
• Community services
sector is the largest
employer; over 200
000 people,
• Community
services has
highest growth
rate, following the
construction,
finance and trade.
Clothing & Textiles
Since 2000, about 50 000 jobs have been lost in manufacturing and 50 000 added by Community Services

EMPLOYMENT TRENDS ETHEKWINI
Data from Global Insight, IHS; 2015
0
20 000
40 000
60 000
80 000
100 000
120 000
199
6
199
7
199
8
199
9
200
0
200
1
2002
200
3
200
4
200
5
200
6
200
7
200
8
200
9
201
0
201
1
201
2
201
3
201
4
Informal Employment Trends 10 Sectors 1996-2014
Manufacturing
Construction
Trade
Transport
Finance
Communityservices
• Trade is by far
the highest
employer in
the informal
sector.
• The second
highest
employer is
construction,
and then
community
services.
• The informal
sector has
been growing
significantly.

UNEMPLOYMENT AND DISCOURAGED WORKERS
0.0%
5.0%
10.0%
15.0%
20.0%
25.0%
30.0%
35.0%
40.0%
ET
hekw
ini M
etr
opolit
an
Mu
nic
ipalit
y
City o
f C
ape
Tow
n
Buffa
lo C
ity M
etr
op
olit
an
Mu
nic
ipalit
y
Tshw
an
e M
etr
op
olit
an
Mu
nic
ipalit
y
Ne
lson M
an
dela
Bay
Me
tropo
litan
Mun
icip
alit
y
Ma
nga
ung
City o
f Joh
ann
esburg
Eku
rhule
ni
StrictUnemploymentRate
DiscouragedWorkers
2016 Q1 Unemployment and Discouraged Workers in all Metros • EThekwini has lowest
strict unemployment
rate in the country; and
the third highest
proportion of
discouraged workers
• The growth in young
people entering the
working age bracket is
not yet being absorbed
by the labour force
• The labour force participation rate is dropping and the non-economically active
are increasing
• Note: According to Stats SA; Between Q4 2015 and Q1 2016, EThekwini spots an unusual
12% decrease in unemployment. Further queries are being made into these results.
Data from 2016 Q1 Quarterly Labour Force Survey, Statistics SA; 2015

BREAKDOWN OF THE WORKING AGE POPULATION IN
ETHEKWINI
0
200000
400000
600000
800000
1000000
1200000
1400000
1995
1996
1997
1998
1999
2000
2001
2002
2003
2004
2005
2006
2007
2008
2009
2010
2011
2012
2013
Employed
Unemployed
Not econ.active
Weighted
CAGR
2008-2013
-0.1%
2.1%
-0.1%
Employed vs. Unemployed vs. Not Economically Active in EThekwini 2008 - 2013
• The not economically active of EThekwini are the main contributing factor to the drop in
the percentage of those unemployed. They are also growing at a positive rate of 2.1%,
compared to employed and unemployed which are growing at a rate of -0.1%.
Data from Quantec Standardised Regional Data, 2015

ETHEKWINI BUSINESS CLIMATE

DOING BUSINESS IN ETHEKWINI VS. OTHER SA METROS
Municipality
Municipal Seat
Starting a
business
Dealing with
construction
permits
Getting electricity Registering
property Enforcing contracts
Ranking
(1-9)
DTF
score
(100 =
best
result)
Ranking
(1-9)
DTF
score
(100 =
best
result)
Ranking
(1-9)
DTF
score
(100 =
best
result)
Ranking
(1-9)
DTF
score
(100 =
best
result)
Rankin
g (1-9)
DTF score
(100 = best
result)
Buffalo City, East
London 4 78.67 3 77.50 4 75.32 4 62.84 9 62.54
Cape Town 4 78.67 1 78.08 2 81.81 8 59.23 6 67.53
Ekurhuleni, Germiston
1 81.18 4 76.84 5 71.83 3 64.23 4 68.26
EThekwini, Durban 4 78.67 5 76.15 3 75.73 6 62.05 3 69.27
Johannesburg 1 81.18 8 68.52 8 55.74 1 65.82 8 66.14
Mangaung,
Bloemfontein 4 78.67 9 68.22 1 83.88 9 58.41 1 71.04
Msunduzi,
Pietermaritzburg 4 78.67 6 74.07 7 63.00 7 59.49 2 70.81
Nelson Mandela Bay,
Port Elizabeth 4 78.67 2 78.05 9 53.14 5 62.69 7 66.89
Tshwane, Pretoria 1 81.18 7 69.88 6 68.51 2 64.71 5 68.17

INVESTMENT IN ETHEKWINI
• Improvements required in registering a business, getting construction
permits and enforcing a contract.
• Is the public sector keeping pace with technological change? How
will this impact the economy?
• Investment in the secondary sector indicates strong mechanisation
trends which is good for competitiveness, but also an indication of the
need for more relevant, competitive labour
• Smart to Future cities – Smart cities to digital citizens
CITY INVESTMENT: MUNICIPAL BUDGET
• Good financial standing; credit rating; cash on hand and debt to own revenue.
• Data for 2013 – 2014 suggests a slight decline in income tax and company tax
payers. However revenue has increased.
• High spending on the Social programme is not sustainable or achievable
(50-year period)
• Spending towards knowledge and economic drivers
ETHEKWINI POVERTY AND SERVICE
DELIVERY

POVERTY
0.0%
5.0%
10.0%
15.0%
20.0%
25.0%
30.0%
35.0%
40.0%
45.0%1
99
6
199
7
199
8
199
9
200
0
200
1
200
2
200
3
200
4
200
5
200
6
200
7
200
8
200
9
201
0
201
1
201
2
201
3
201
4
City of Cape Town
EThekwini
Ekurhuleni
City of Johannesburg
Nelson Mandela Bay
City of Tshwane
Mangaung
Buffalo City
People Living Below the Food Poverty Line per Metro, 1996- 2014: Percentage and Number
0
200 000
400 000
600 000
800 000
1 000 000
1 200 000
199
6
199
7
199
8
199
9
200
0
200
1
200
2
200
3
200
4
200
5
200
6
200
7
200
8
200
9
201
0
201
1
201
2
201
3
201
4
City of Cape Town
EThekwini
Ekurhuleni
City of Johannesburg
Nelson Mandela Bay
City of Tshwane
Mangaung
Buffalo City

OBSERVATIONS
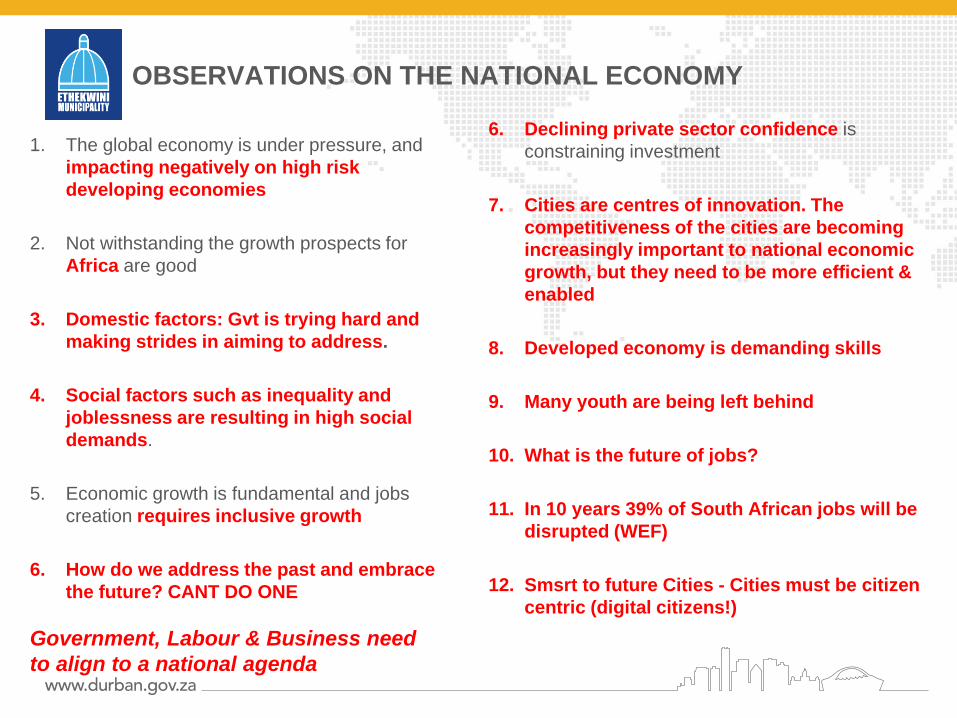
OBSERVATIONS ON THE NATIONAL ECONOMY
1. The global economy is under pressure, and
impacting negatively on high risk
developing economies
2. Not withstanding the growth prospects for
Africa are good
3. Domestic factors: Gvt is trying hard and
making strides in aiming to address.
4. Social factors such as inequality and
joblessness are resulting in high social
demands.
5. Economic growth is fundamental and jobs
creation requires inclusive growth
6. How do we address the past and embrace
the future? CANT DO ONE
6. Declining private sector confidence is
constraining investment
7. Cities are centres of innovation. The
competitiveness of the cities are becoming
increasingly important to national economic
growth, but they need to be more efficient &
enabled
8. Developed economy is demanding skills
9. Many youth are being left behind
10. What is the future of jobs?
11. In 10 years 39% of South African jobs will be
disrupted (WEF)
12. Smsrt to future Cities - Cities must be citizen
centric (digital citizens!)
Government, Labour & Business need
to align to a national agenda

1. EThekwini's growth prospects are strongly
linked to the national picture. Biggest sectors are
global and vulnerable
.
2. Progress has been made on addressing
poverty, but education remains a challenge
3. City’s financial status remains strong, however
sustainability concerns.
4. The local economy has shifted
5. The main growth sectors are consumption related
and government
6. The official unemployment figures do not
reflect the real level of unemployment and
joblessness
7. Small number of employed and tax base
8. Technology and mega events - 2022
8. Labour – skills and productivity form part of the
unemployment problem – skills crises will deepen
9. There is a large youthful population – a big focus
on skills development could have a positive impact
10. Energy and water are placing a significant strain on
the economy (incl water pressure)
11. Local steel industry under pressure
12. Manufacturing survey: Skills mismatch is a major
problem
13. Red tape – WHERE IS THE SMART CITY?
14. Persistent; structural inequality poses a key risk to
the city’s future
15. The global business environment is changing,
are Durban firms ready – are we ready?
OBSERVATIONS ON THE LOCAL ECONOMY

1. The depreciation of the rand presents opportunities for local sourcing, beneficiation and
local production. However, this will take time and effort to achieve.
2. Despite the global and national challenges, a number of issues, such as red tape, are
within the control of the Municipality to address. Improve efficiency
3. Catalytic investments – investments in knowledge intensive industries
4. IRPTN and public transport orientated development – Room for Innovation
5. A good credit rating - enables city to better finance economic infrastructure
6. Localisation
7. Innovation and technology presents an opportunity to increase efficiency and solve
city problems
8. Durban has developed an innovation programme – how can we bridge the skills gap
9. Open data – open government
10. There is an emerging innovative cluster with crosspollination of technology &
creativity
11. Commonwealth Games - 2022
GREEN SHOOTS

Strong economic leadership that builds business confidence, drives
Implementation and improves internal efficiency will be key to rescue the
economy and lead us to the future