state of washington human resource management report hr/hrm... · state of washington human...
TRANSCRIPT

State of WashingtonHuman Resource Management ReportHuman Resource Management Report
Plan & Align Workforce
Statewide RollupOctober 2009 Reporting Period Develop
Workforce
Reinforce Performance
Deploy Workforce
Hire Workforce
Prepared by:Department of Personnel
Eva Santos, DirectorPublished: December 18, 2009
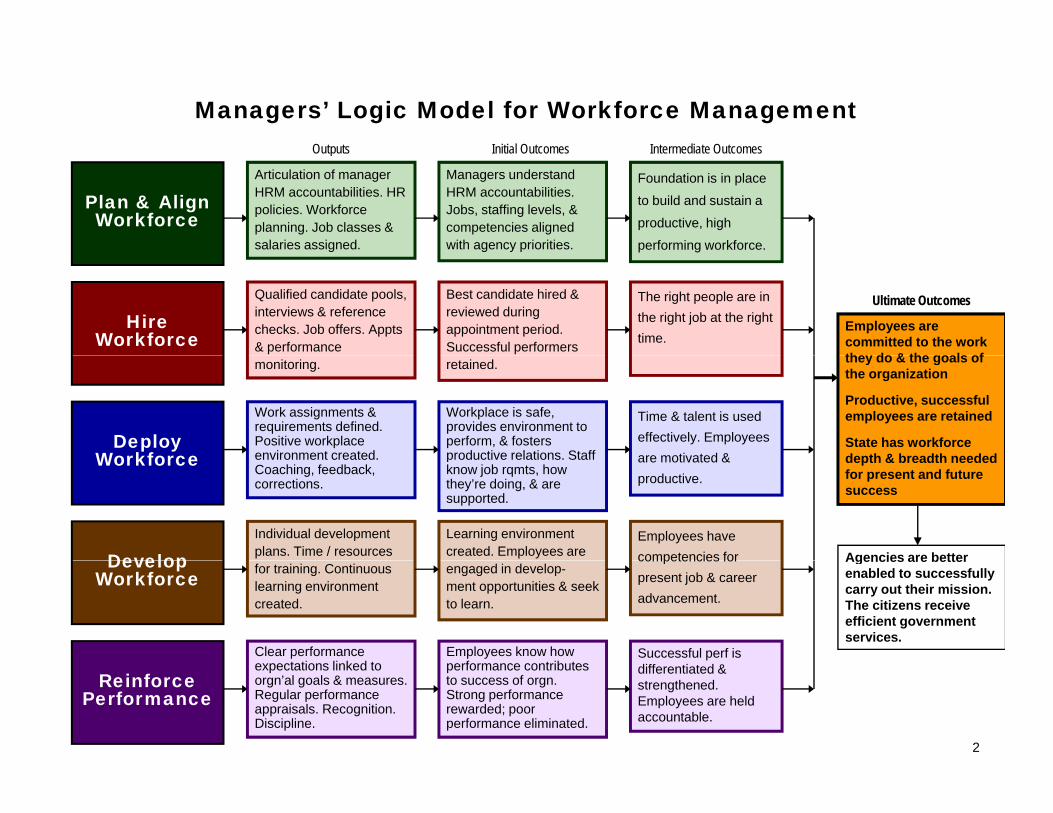
Outputs Initial Outcomes Intermediate Outcomes
Managers’ Logic Model for Workforce Management
Plan & Align Workforce
Articulation of manager HRM accountabilities. HR policies. Workforce planning. Job classes & salaries assigned.
Managers understand HRM accountabilities. Jobs, staffing levels, & competencies aligned with agency priorities.
Foundation is in place
to build and sustain a
productive, high
performing workforce.
Outputs Initial Outcomes Intermediate Outcomes
HireWorkforce
Qualified candidate pools, interviews & reference checks. Job offers. Appts & performance
Best candidate hired & reviewed during appointment period. Successful performers
The right people are in the right job at the right time.
Employees are committed to the work they do & the goals of
Ultimate Outcomes
DeployWorkforce
monitoring.
Work assignments & requirements defined. Positive workplace environment created
retained.
Workplace is safe, provides environment to perform, & fosters productive relations Staff
Time & talent is used effectively. Employees are motivated &
they do & the goals of the organization
Productive, successful employees are retained
State has workforce depth & breadth neededWorkforce
Develop
environment created. Coaching, feedback, corrections.
Individual development plans. Time / resources
productive relations. Staff know job rqmts, how they’re doing, & are supported.
Learning environment created. Employees are
are motivated & productive.
Employees have competencies for
depth & breadth needed for present and future success
Agencies are betterDevelop Workforce for training. Continuous
learning environment created.
Clear performance t ti li k d t
engaged in develop-ment opportunities & seek to learn.
Employees know how f t ib t
competencies for present job & career advancement.
Successful perf is
Agencies are better enabled to successfully carry out their mission. The citizens receive efficient government services.
2
Reinforce Performance
expectations linked to orgn’al goals & measures. Regular performance appraisals. Recognition. Discipline.
performance contributes to success of orgn. Strong performance rewarded; poor performance eliminated.
differentiated & strengthened. Employees are held accountable.
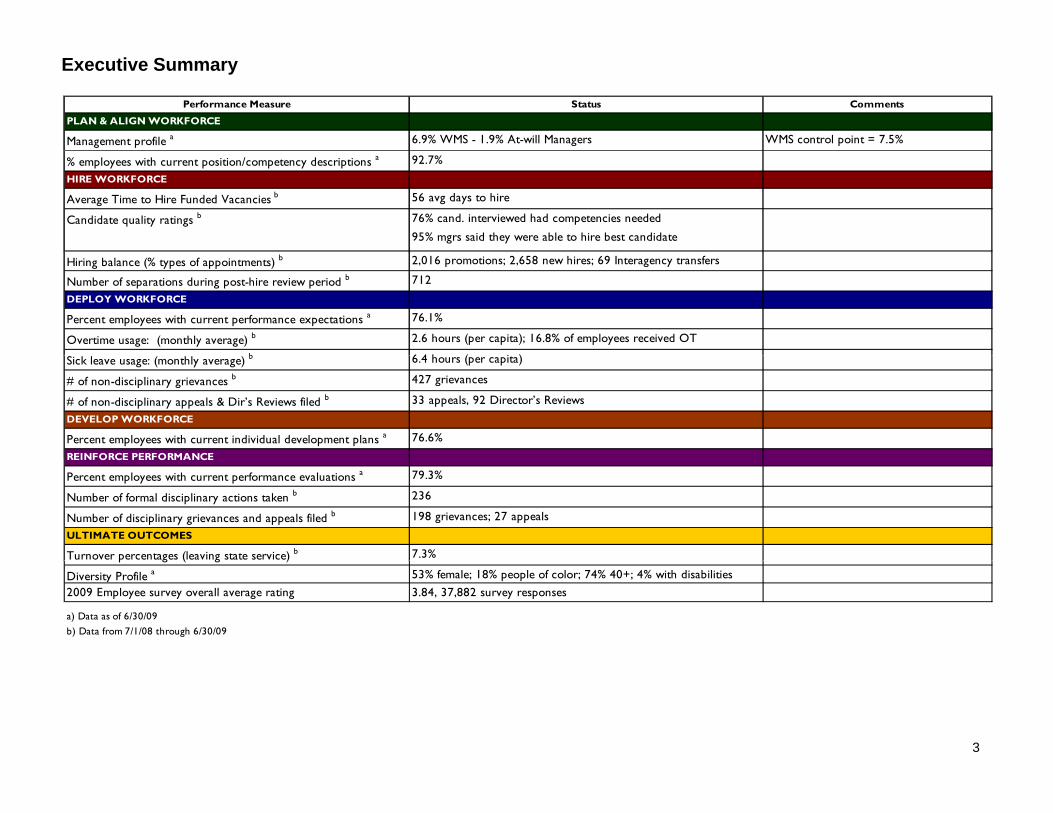
Performance Measure Status Comments
PLAN & ALIGN WORKFORCE
Management profile a 6.9% WMS - 1.9% At-will Managers WMS control point = 7.5%
Executive Summary
% employees with current position/competency descriptions a 92.7%
HIRE WORKFORCE
Average Time to Hire Funded Vacancies b 56 avg days to hire
Candidate quality ratings b 76% cand. interviewed had competencies needed
95% mgrs said they were able to hire best candidate
Hiring balance (% types of appointments) b 2,016 promotions; 2,658 new hires; 69 Interagency transfers
Number of separations during post-hire review period b 712
DEPLOY WORKFORCE
Percent employees with current performance expectations a 76.1%
Overtime usage: (monthly average) b 2.6 hours (per capita); 16.8% of employees received OTb 6 4 h ( i )Sick leave usage: (monthly average) b 6.4 hours (per capita)
# of non-disciplinary grievances b 427 grievances
# of non-disciplinary appeals & Dir’s Reviews filed b 33 appeals, 92 Director’s Reviews
DEVELOP WORKFORCE
Percent employees with current individual development plans a 76.6%
REINFORCE PERFORMANCEREINFORCE PERFORMANCE
Percent employees with current performance evaluations a 79.3%
Number of formal disciplinary actions taken b 236
Number of disciplinary grievances and appeals filed b 198 grievances; 27 appeals
ULTIMATE OUTCOMES
Turnover percentages (leaving state service) b 7.3%p g ( g )
Diversity Profile a 53% female; 18% people of color; 74% 40+; 4% with disabilities2009 Employee survey overall average rating 3.84, 37,882 survey responses
a) Data as of 6/30/09b) Data from 7/1/08 through 6/30/09
3

Plan & Align Workforce
Management Profile
Profile* FY06 FY07 FY08 FY09
WMS headcount 4,869 4,642 4,703 4,511
Analysis:
Since July 2008, the WMS headcount decreased by 4.1% while the total state
Outcomes:
Managers understand
workforce management
accountabilities Jobs and
% of workforce that is WMS 7.9% 7.2% 7.1% 6.9%
Managers headcount* 4,298 4,768 4,906 4,725
% of workforce that are managers 6.9% 7.4% 7.4% 7.2%
Total workforce headcount** 62,516 64,263 66,714 65,290
workforce decreased by 2.3%.
DOP is currently working with agencies to put in place administrative controls on the inclusion of positions in the WMS and salary banding. A monitoring process is also being developedaccountabilities. Jobs and
competencies are defined
and aligned with business
priorities. Overall foundation
is in place to build & sustain a
also being developed.
The numbers shown in the first chart differ from those shown in previous HR Management Reports since we are now counting all general government employees. Previous reports had not
* “Managers” includes at-will managers and WMS positions coded as managers only. ** Includes permanent and non-permanent employees in executive branch general government agencies.
high performing workforce.
Performance Measures:
p y pincluded certain groups such as the DOT Marine Division, WSP troopers, Assistant Attorneys General, and Printing employees.
Measures:
Percent supervisors with current performance expectations for workforce management
Management profile
Workforce Planning measure (TBD)
Percent employees with current position/ competency descriptions
WMS Management Type
4Data as of 6/30/2009 Source: DOP HRMS Business Intelligence
Analysis:
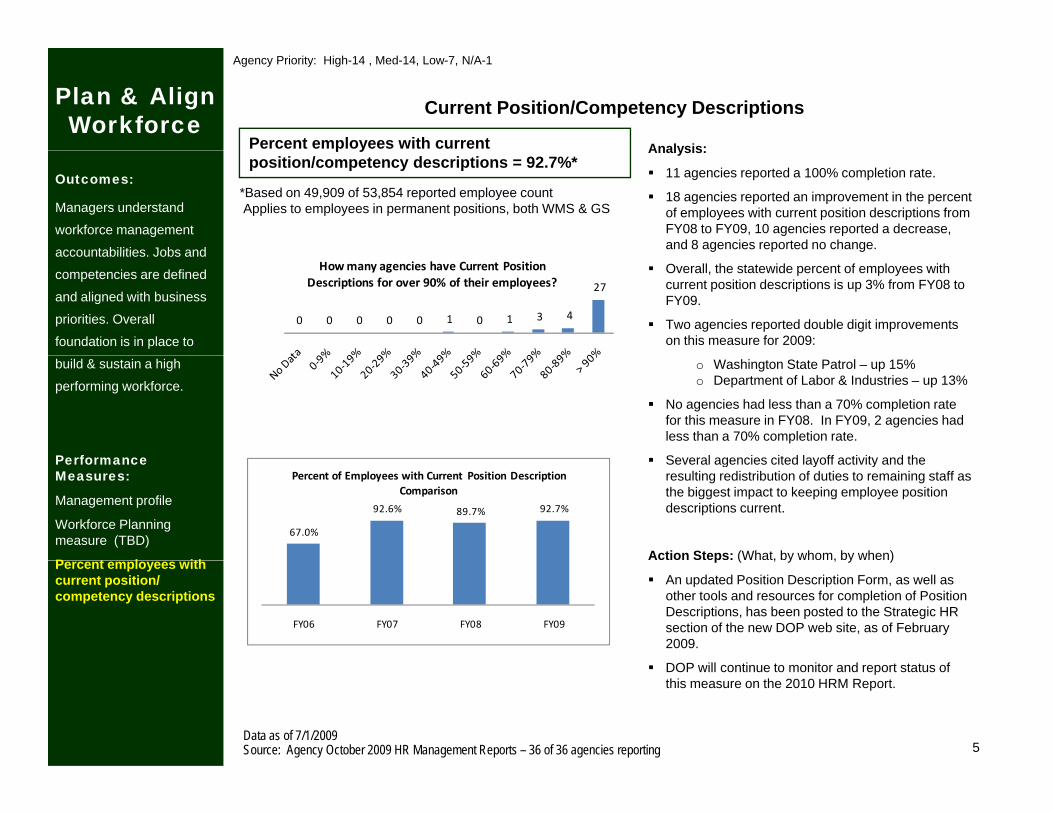
Plan & Align Workforce
Percent employees with current
Current Position/Competency Descriptions
Agency Priority: High-14 , Med-14, Low-7, N/A-1
Analysis:
11 agencies reported a 100% completion rate.
18 agencies reported an improvement in the percent of employees with current position descriptions from FY08 to FY09, 10 agencies reported a decrease, and 8 agencies reported no change.
Outcomes:
Managers understand
workforce management
accountabilities Jobs and
p yposition/competency descriptions = 92.7%*
*Based on 49,909 of 53,854 reported employee countApplies to employees in permanent positions, both WMS & GS
Overall, the statewide percent of employees with current position descriptions is up 3% from FY08 to FY09.
Two agencies reported double digit improvements on this measure for 2009:
accountabilities. Jobs and
competencies are defined
and aligned with business
priorities. Overall
foundation is in place to 0 0 0 0 0 1 0 1 3 4
27
How many agencies have Current Position Descriptions for over 90% of their employees?
o Washington State Patrol – up 15%o Department of Labor & Industries – up 13%
No agencies had less than a 70% completion rate for this measure in FY08. In FY09, 2 agencies had less than a 70% completion rate.
Several agencies cited layoff activity and the
build & sustain a high
performing workforce.
Performance Several agencies cited layoff activity and the resulting redistribution of duties to remaining staff as the biggest impact to keeping employee position descriptions current.
Action Steps: (What, by whom, by when)
Performance Measures:
Management profile
Workforce Planning measure (TBD)
P t l ith
67.0%
92.6% 89.7% 92.7%
Percent of Employees with Current Position Description Comparison
p ( , y , y )
An updated Position Description Form, as well as other tools and resources for completion of Position Descriptions, has been posted to the Strategic HR section of the new DOP web site, as of February 2009.
DOP ill ti t it d t t t f
Percent employees with current position/ competency descriptions
FY06 FY07 FY08 FY09
5
DOP will continue to monitor and report status of this measure on the 2010 HRM Report.
Data as of 7/1/2009 Source: Agency October 2009 HR Management Reports – 36 of 36 agencies reporting
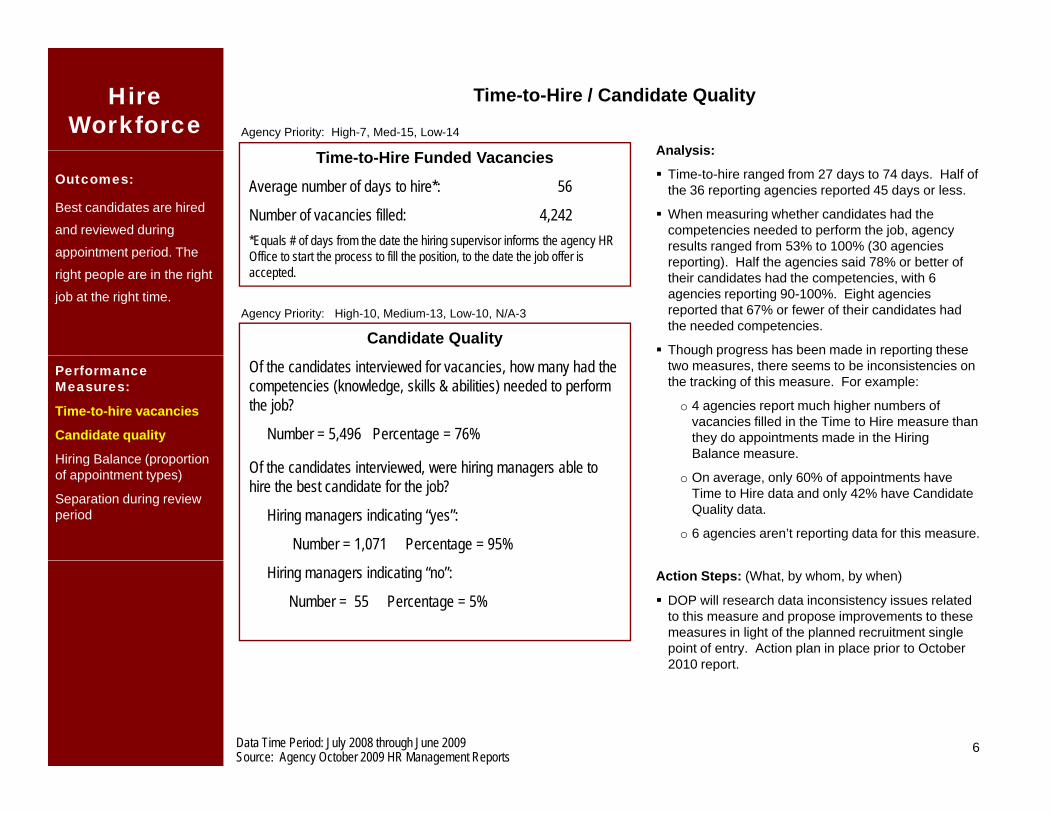
Hire Workforce
Analysis:
Time-to-Hire / Candidate Quality
Agency Priority: High-7, Med-15, Low-14
Outcomes:
Best candidates are hired
and reviewed during
appointment period The
Analysis:
Time-to-hire ranged from 27 days to 74 days. Half of the 36 reporting agencies reported 45 days or less.
When measuring whether candidates had the competencies needed to perform the job, agency results ranged from 53% to 100% (30 agencies
Time-to-Hire Funded Vacancies
Average number of days to hire*: 56
Number of vacancies filled: 4,242*Equals # of days from the date the hiring supervisor informs the agency HR Offi t t t th t fill th iti t th d t th j b ff i appointment period. The
right people are in the right
job at the right time.
g ( greporting). Half the agencies said 78% or better of their candidates had the competencies, with 6 agencies reporting 90-100%. Eight agencies reported that 67% or fewer of their candidates had the needed competencies.
Though progress has been made in reporting these
Office to start the process to fill the position, to the date the job offer is accepted.
Candidate QualityAgency Priority: High-10, Medium-13, Low-10, N/A-3
Performance Measures:
Time-to-hire vacancies
Candidate quality
Hiring Balance (proportion
g p g p gtwo measures, there seems to be inconsistencies on the tracking of this measure. For example:
o 4 agencies report much higher numbers of vacancies filled in the Time to Hire measure than they do appointments made in the Hiring Balance measure.
Of the candidates interviewed for vacancies, how many had the competencies (knowledge, skills & abilities) needed to perform the job?
Number = 5,496 Percentage = 76%Hiring Balance (proportion of appointment types)
Separation during review period
a a ce easu e
o On average, only 60% of appointments have Time to Hire data and only 42% have Candidate Quality data.
o 6 agencies aren’t reporting data for this measure.
Of the candidates interviewed, were hiring managers able to hire the best candidate for the job?
Hiring managers indicating “yes”:
Number = 1,071 Percentage = 95%
Action Steps: (What, by whom, by when)
DOP will research data inconsistency issues related to this measure and propose improvements to these measures in light of the planned recruitment single point of entry. Action plan in place prior to October 2010 report
Hiring managers indicating “no”:
Number = 55 Percentage = 5%
6
2010 report.
Data Time Period: July 2008 through June 2009 Source: Agency October 2009 HR Management Reports
Analysis:
Hire Workforce
Hiring BalanceAgency Priority: High-2, Med-10, Low-19, N/A-1
B l f I t l d E t l Hi Analysis:
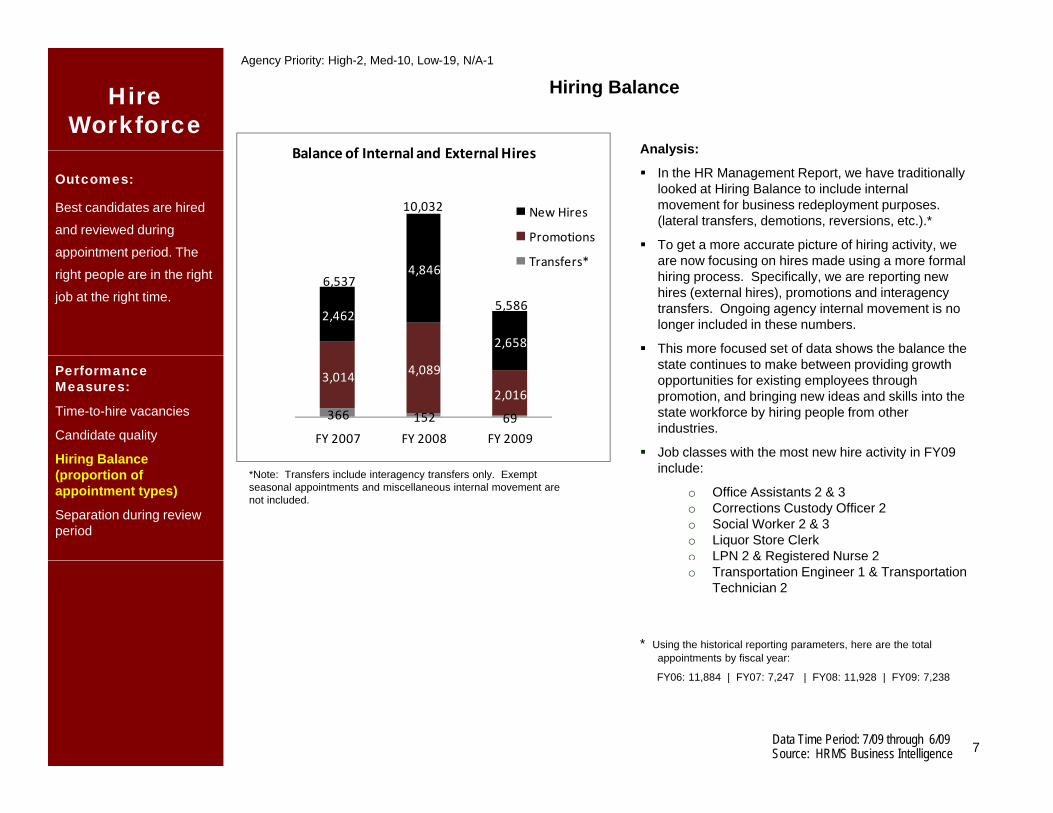
In the HR Management Report, we have traditionally looked at Hiring Balance to include internal movement for business redeployment purposes. (lateral transfers, demotions, reversions, etc.).*
To get a more accurate picture of hiring activity, we
Outcomes:
Best candidates are hired
and reviewed during
appointment period The
Balance of Internal and External Hires
New Hires
Promotions
10,032
are now focusing on hires made using a more formal hiring process. Specifically, we are reporting new hires (external hires), promotions and interagency transfers. Ongoing agency internal movement is no longer included in these numbers.
This more focused set of data shows the balance the
appointment period. The
right people are in the right
job at the right time.2,462
4,846
2,658
Transfers*
6,537
5,586
state continues to make between providing growth opportunities for existing employees through promotion, and bringing new ideas and skills into the state workforce by hiring people from other industries.
Job classes with the most new hire activity in FY09
Performance Measures:
Time-to-hire vacancies
Candidate quality
Hiring Balance
366 152 69
3,014 4,089
2,016
FY 2007 FY 2008 FY 2009y
include:
o Office Assistants 2 & 3o Corrections Custody Officer 2o Social Worker 2 & 3o Liquor Store Clerko LPN 2 & Registered Nurse 2
Hiring Balance (proportion of appointment types)
Separation during review period
*Note: Transfers include interagency transfers only. Exempt seasonal appointments and miscellaneous internal movement are not included.
go Transportation Engineer 1 & Transportation
Technician 2
* Using the historical reporting parameters, here are the total appointments by fiscal year:
7
pp y y
FY06: 11,884 | FY07: 7,247 | FY08: 11,928 | FY09: 7,238
Data Time Period: 7/09 through 6/09Source: HRMS Business Intelligence
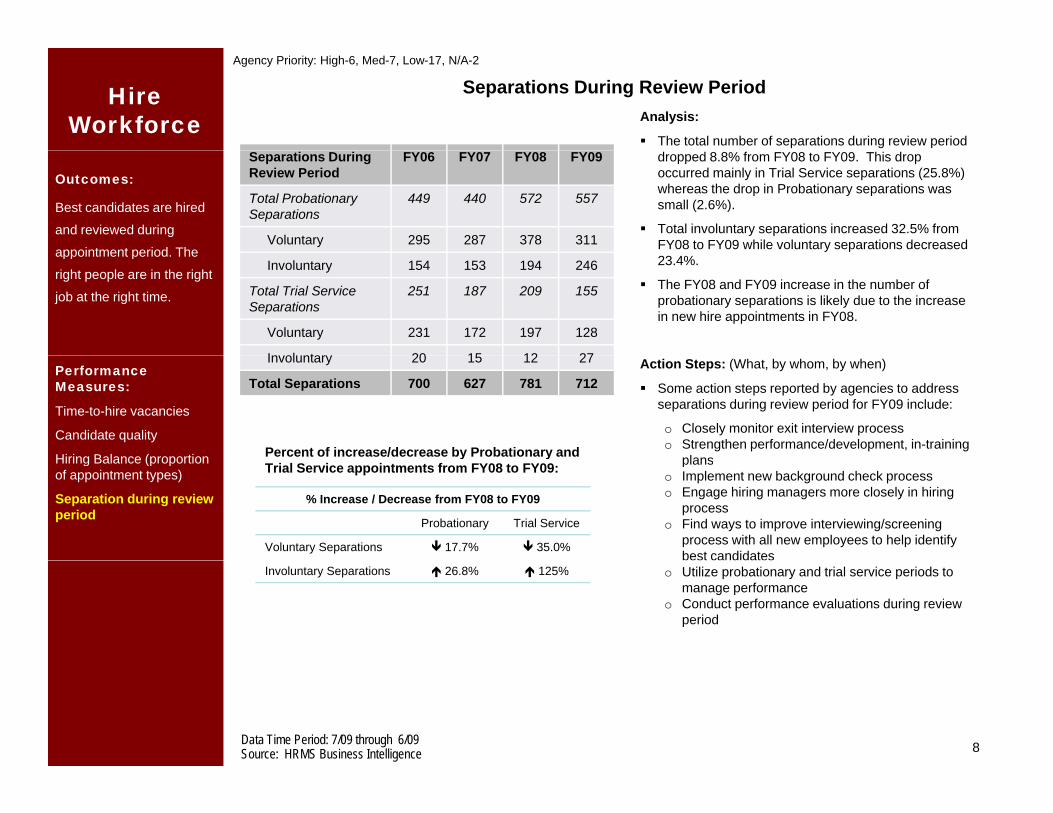
Analysis:
The total number of separations during review period
Hire Workforce
Separations During Review PeriodAgency Priority: High-6, Med-7, Low-17, N/A-2
dropped 8.8% from FY08 to FY09. This drop occurred mainly in Trial Service separations (25.8%) whereas the drop in Probationary separations was small (2.6%).
Total involuntary separations increased 32.5% from FY08 to FY09 while voluntary separations decreased
Outcomes:
Best candidates are hired
and reviewed during
appointment period The
Separations During Review Period
FY06 FY07 FY08 FY09
Total Probationary Separations
449 440 572 557
Voluntary 295 287 378 31123.4%.
The FY08 and FY09 increase in the number of probationary separations is likely due to the increase in new hire appointments in FY08.
appointment period. The
right people are in the right
job at the right time.
Involuntary 154 153 194 246
Total Trial Service Separations
251 187 209 155
Voluntary 231 172 197 128
In ol ntar 20 15 12 27 Action Steps: (What, by whom, by when)
Some action steps reported by agencies to address separations during review period for FY09 include:
o Closely monitor exit interview processo Strengthen performance/development, in-training
plans
Performance Measures:
Time-to-hire vacancies
Candidate quality
Hiring Balance (proportion
Involuntary 20 15 12 27
Total Separations 700 627 781 712
Percent of increase/decrease by Probationary and planso Implement new background check processo Engage hiring managers more closely in hiring
processo Find ways to improve interviewing/screening
process with all new employees to help identify best candidates
Hiring Balance (proportion of appointment types)
Separation during review period
% Increase / Decrease from FY08 to FY09
Probationary Trial Service
Voluntary Separations 17.7% 35.0%
y yTrial Service appointments from FY08 to FY09:
o Utilize probationary and trial service periods to manage performance
o Conduct performance evaluations during review period
Involuntary Separations 26.8% 125%
8Data Time Period: 7/09 through 6/09Source: HRMS Business Intelligence
Deploy Workforce
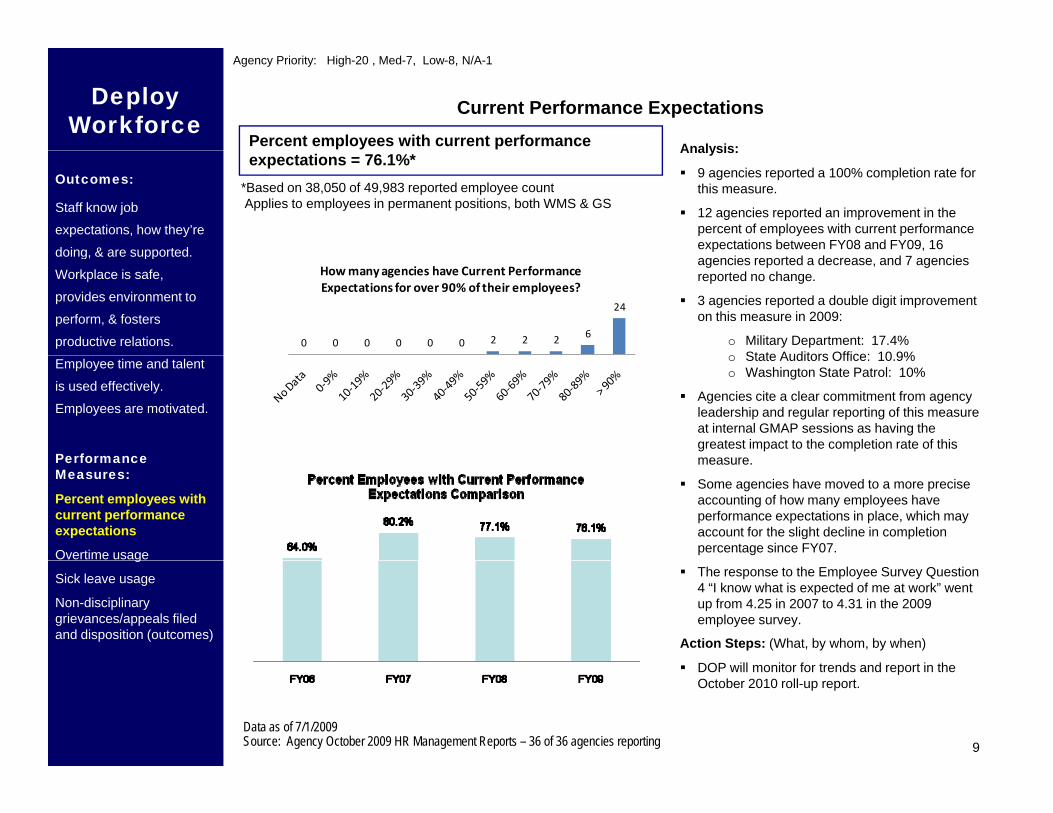
Analysis:Percent employees with current performance
Current Performance Expectations
Agency Priority: High-20 , Med-7, Low-8, N/A-1
Outcomes:
Staff know job
expectations, how they’re
doing & are supported
Analysis:
9 agencies reported a 100% completion rate for this measure.
12 agencies reported an improvement in the percent of employees with current performance expectations between FY08 and FY09, 16
expectations = 76.1%**Based on 38,050 of 49,983 reported employee countApplies to employees in permanent positions, both WMS & GS
doing, & are supported.
Workplace is safe,
provides environment to
perform, & fosters
productive relations.
agencies reported a decrease, and 7 agencies reported no change.
3 agencies reported a double digit improvement on this measure in 2009:
o Military Department: 17.4%o State Auditors Office: 10 9%
0 0 0 0 0 0 2 2 2 6
24
How many agencies have Current Performance Expectations for over 90% of their employees?
Employee time and talent
is used effectively.
Employees are motivated.
Performance
o State Auditors Office: 10.9% o Washington State Patrol: 10%
Agencies cite a clear commitment from agency leadership and regular reporting of this measure at internal GMAP sessions as having the greatest impact to the completion rate of this measurePerformance
Measures:
Percent employees with current performance expectations
Overtime usage
measure.
Some agencies have moved to a more precise accounting of how many employees have performance expectations in place, which may account for the slight decline in completion percentage since FY07.g
Sick leave usage
Non-disciplinary grievances/appeals filed and disposition (outcomes)
The response to the Employee Survey Question 4 “I know what is expected of me at work” went up from 4.25 in 2007 to 4.31 in the 2009 employee survey.
Action Steps: (What, by whom, by when)
DOP ill it f t d d t i th
9
DOP will monitor for trends and report in the October 2010 roll-up report.
Data as of 7/1/2009 Source: Agency October 2009 HR Management Reports – 36 of 36 agencies reporting
Overtime UsageDeploy Workforce Average Overtime (per capita) *
6% Employees Receiving Overtime *
25%
Agency Priority: High-4, Med-7, Low-20, N/A-1
Outcomes:
Staff know job
expectations, how they’re
doing & are supported2
3
4
5
Aver
age
OT H
ours
5%
10%
15%
20%
25%
erce
nt Em
ploye
es
doing, & are supported.
Workplace is safe,
provides environment to
perform, & fosters
productive relations.
0
1
Jul Aug Sep Oct Nov Dec Jan Feb Mar Apr May Jun
Avg OT Hrs FY07 Avg OT Hrs FY08 Avg OT Hrs FY09
0%
5%
Jul Aug Sep Oct Nov Dec Jan Feb Mar Apr May Jun
Pe
Pct EE's w/OT - FY07 Pct EE's w/OT - FY08 Pct EE's w/OT - FY09
Avg Overtime Hrs per Month (per capita)**: Avg Percent Employees Receiving Overtime per Month:**
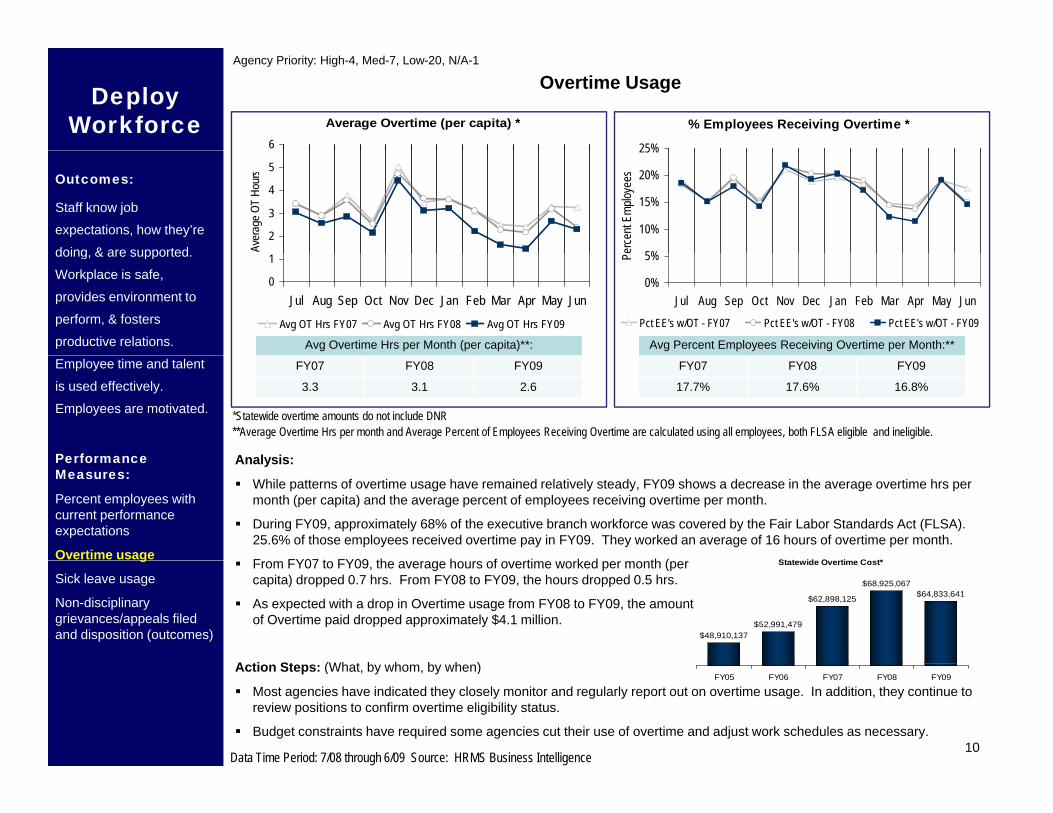
Analysis:
Employee time and talent
is used effectively.
Employees are motivated.
Performance
*Statewide overtime amounts do not include DNR**Average Overtime Hrs per month and Average Percent of Employees Receiving Overtime are calculated using all employees, both FLSA eligible and ineligible.
FY07 FY08 FY09
3.3 3.1 2.6
FY07 FY08 FY09
17.7% 17.6% 16.8%
Analysis:
While patterns of overtime usage have remained relatively steady, FY09 shows a decrease in the average overtime hrs per month (per capita) and the average percent of employees receiving overtime per month.
During FY09, approximately 68% of the executive branch workforce was covered by the Fair Labor Standards Act (FLSA). 25.6% of those employees received overtime pay in FY09. They worked an average of 16 hours of overtime per month.
F FY07 t FY09 th h f ti k d th (
Performance Measures:
Percent employees with current performance expectations
Overtime usageSt t id O ti C t* From FY07 to FY09, the average hours of overtime worked per month (per
capita) dropped 0.7 hrs. From FY08 to FY09, the hours dropped 0.5 hrs.
As expected with a drop in Overtime usage from FY08 to FY09, the amount of Overtime paid dropped approximately $4.1 million.
A ti St (Wh t b h b h )
g
Sick leave usage
Non-disciplinary grievances/appeals filed and disposition (outcomes)
Statewide Overtime Cost*
$48,910,137$52,991,479
$62,898,125
$68,925,067$64,833,641
10
Action Steps: (What, by whom, by when)
Most agencies have indicated they closely monitor and regularly report out on overtime usage. In addition, they continue to review positions to confirm overtime eligibility status.
Budget constraints have required some agencies cut their use of overtime and adjust work schedules as necessary.
Data Time Period: 7/08 through 6/09 Source: HRMS Business Intelligence
FY05 FY06 FY07 FY08 FY09

Analysis:
Average Sick Leave balance for state employees in
Average Sick Leave Use
Sick Leave UsageDeploy Workforce
Agency Priority: High-2, Med-13, Low-17, N/A-1
Average Sick Leave balance for state employees in FY09 was 240.2 hrs.
The average hours of sick leave used per capita rose 0.1 hrs from FY08 to FY09; however, this average has not varied by more than 0.1 hrs from FY07 to FY09.
The 1% rise in Sick Leave usage from FY08 to FY09 in 6
7
8
Avg H
ours
Outcomes:
Staff know job
expectations, how they’re
doing & are supported gDecember may be related to extreme weather conditions and employees using sick leave for inclement weather.
Action Steps: (What, by whom, by when)
4
5
July
Augu
st
Septe
mber
Octob
er
Nove
mber
Dece
mber
Janu
ary
Febr
uary
March Ap
ril
May
June
doing, & are supported.
Workplace is safe,
provides environment to
perform, & fosters
productive relations.
Most agencies report they are actively participating in wellness programs and focusing on safety.
Flu shots, hand-washing posters, wide-spread availability of hand sanitizers, yoga & massage are a few examples of steps agencies are taking to promote wellness in the workplace
S N D
FY07 FY08 FY09Employee time and talent
is used effectively.
Employees are motivated.
Performance
Avg Hrs SL Used (per capita) – Statewide*
FY07 FY08 FY09
6.4 Hrs 6.3 Hrs 6.4 Hrs wellness in the workplace.
Most agencies report they are monitoring sick leave usage and dealing with sick leave abuse as necessary.
While sick leave abuse is closely monitored, agencies are also stressing the importance of staying home when sick to prevent the spread of illness in the
* Statewide data does not include DOL, DOR, L&I, and LCB
Performance Measures:
Percent employees with current performance expectations
Overtime usageworkplace.
g
Sick leave usage
Non-disciplinary grievances/appeals filed and disposition (outcomes)
11Data Time Period: 7/08 through 6/09Source: HRMS Business Intelligence
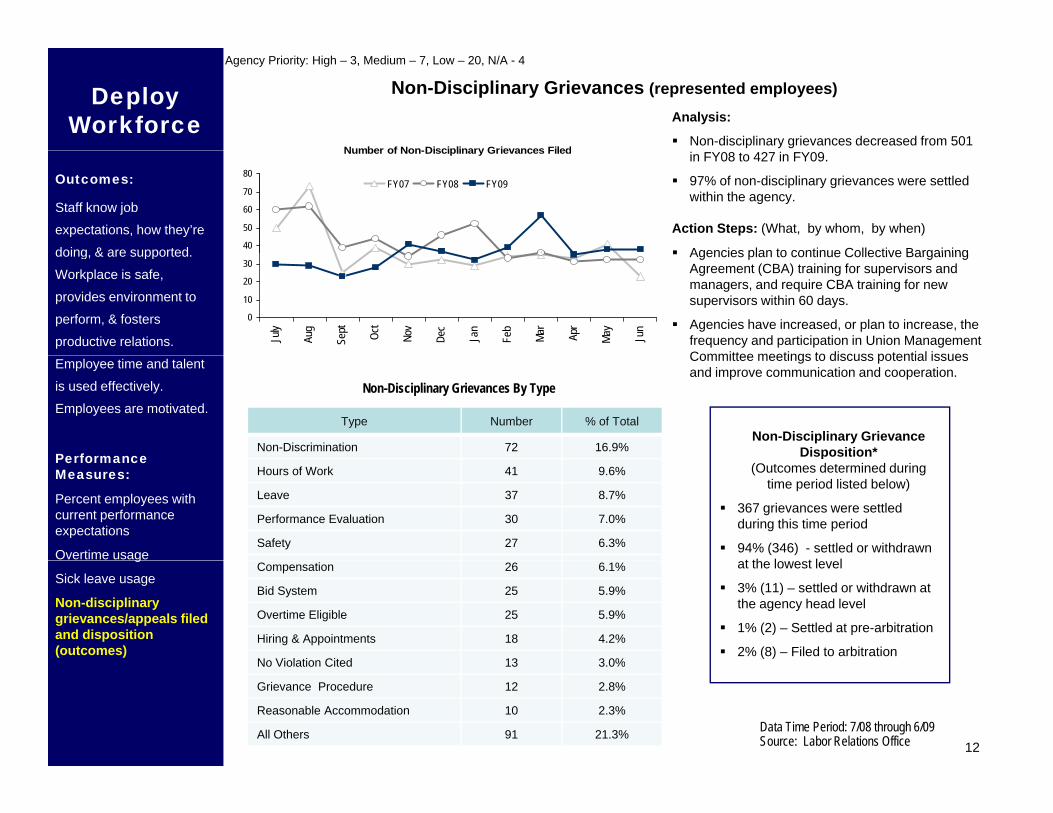
Non-Disciplinary Grievances (represented employees)Deploy Workforce
Agency Priority: High – 3, Medium – 7, Low – 20, N/A - 4
Number of Non-Disciplinary Grievances Filed
Analysis:
Non-disciplinary grievances decreased from 501
Action Steps: (What, by whom, by when)
Agencies plan to continue Collective Bargaining
Outcomes:
Staff know job
expectations, how they’re
doing & are supported
Number of Non-Disciplinary Grievances Filed
40
50
60
70
80FY07 FY08 FY09
in FY08 to 427 in FY09.
97% of non-disciplinary grievances were settled within the agency.
Agencies plan to continue Collective Bargaining Agreement (CBA) training for supervisors and managers, and require CBA training for new supervisors within 60 days.
Agencies have increased, or plan to increase, the frequency and participation in Union Management Committee meetings to discuss potential issues
doing, & are supported.
Workplace is safe,
provides environment to
perform, & fosters
productive relations.
0
10
20
30Ju
ly
Aug
Sept Oct
Nov
Dec
Jan
Feb
Mar
Apr
May
Jun
Committee meetings to discuss potential issues and improve communication and cooperation.
Non-Disciplinary Grievance Disposition*
Employee time and talent
is used effectively.
Employees are motivated.
Performance
Type Number % of Total
Non-Discrimination 72 16.9%
Non-Disciplinary Grievances By Type
p(Outcomes determined during
time period listed below)
367 grievances were settled during this time period
94% (346) - settled or withdrawn t th l t l l
Performance Measures:
Percent employees with current performance expectations
Overtime usage
Hours of Work 41 9.6%
Leave 37 8.7%
Performance Evaluation 30 7.0%
Safety 27 6.3%
at the lowest level
3% (11) – settled or withdrawn at the agency head level
1% (2) – Settled at pre-arbitration
2% (8) – Filed to arbitration
g
Sick leave usage
Non-disciplinary grievances/appeals filed and disposition (outcomes)
Compensation 26 6.1%
Bid System 25 5.9%
Overtime Eligible 25 5.9%
Hiring & Appointments 18 4.2%
No Violation Cited 13 3 0%
12Data Time Period: 7/08 through 6/09Source: Labor Relations Office
No Violation Cited 13 3.0%
Grievance Procedure 12 2.8%
Reasonable Accommodation 10 2.3%
All Others 91 21.3%
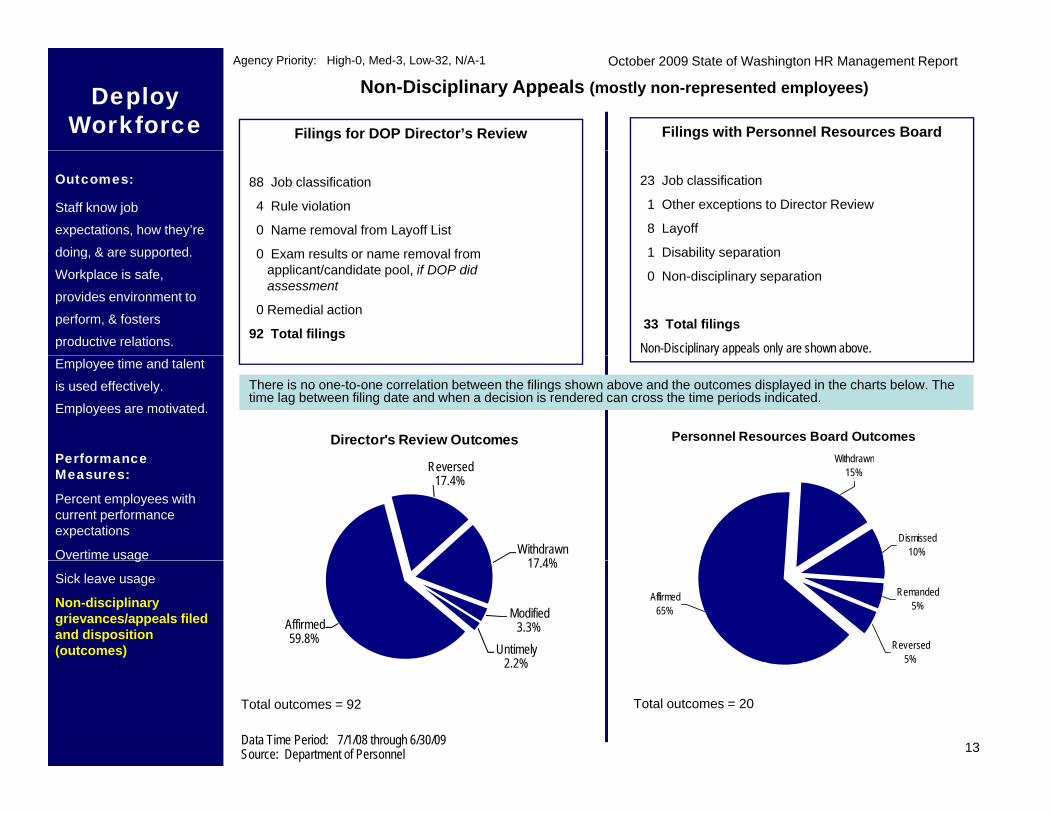
Non-Disciplinary Appeals (mostly non-represented employees)
Filings for DOP Director’s Review Filings with Personnel Resources Board
Deploy Workforce
Agency Priority: High-0, Med-3, Low-32, N/A-1 October 2009 State of Washington HR Management Report
88 Job classification
4 Rule violation
0 Name removal from Layoff List
0 Exam results or name removal from
23 Job classification
1 Other exceptions to Director Review
8 Layoff
1 Disability separation
Outcomes:
Staff know job
expectations, how they’re
doing & are supported 0 Exam results or name removal fromapplicant/candidate pool, if DOP did assessment
0 Remedial action
92 Total filings
1 Disability separation
0 Non-disciplinary separation
33 Total filings
Non-Disciplinary appeals only are shown above.
doing, & are supported.
Workplace is safe,
provides environment to
perform, & fosters
productive relations.
Director's Review Outcomes Personnel Resources Board OutcomesWithdrawn
There is no one-to-one correlation between the filings shown above and the outcomes displayed in the charts below. The time lag between filing date and when a decision is rendered can cross the time periods indicated.
Employee time and talent
is used effectively.
Employees are motivated.
Performance Reversed17.4%
Withdrawn17 4%
Dismissed10%
Withdrawn15%
Performance Measures:
Percent employees with current performance expectations
Overtime usage
Affirmed59.8%
17.4%
Modified3.3%
Untimely2 2%
Affirmed65%
Reversed5%
Remanded5%
g
Sick leave usage
Non-disciplinary grievances/appeals filed and disposition (outcomes)
2.2%
Data Time Period: 7/1/08 through 6/30/09Source: Department of Personnel
Total outcomes = 20Total outcomes = 92
13
Develop Workforce
Analysis:Percent employees with current individual
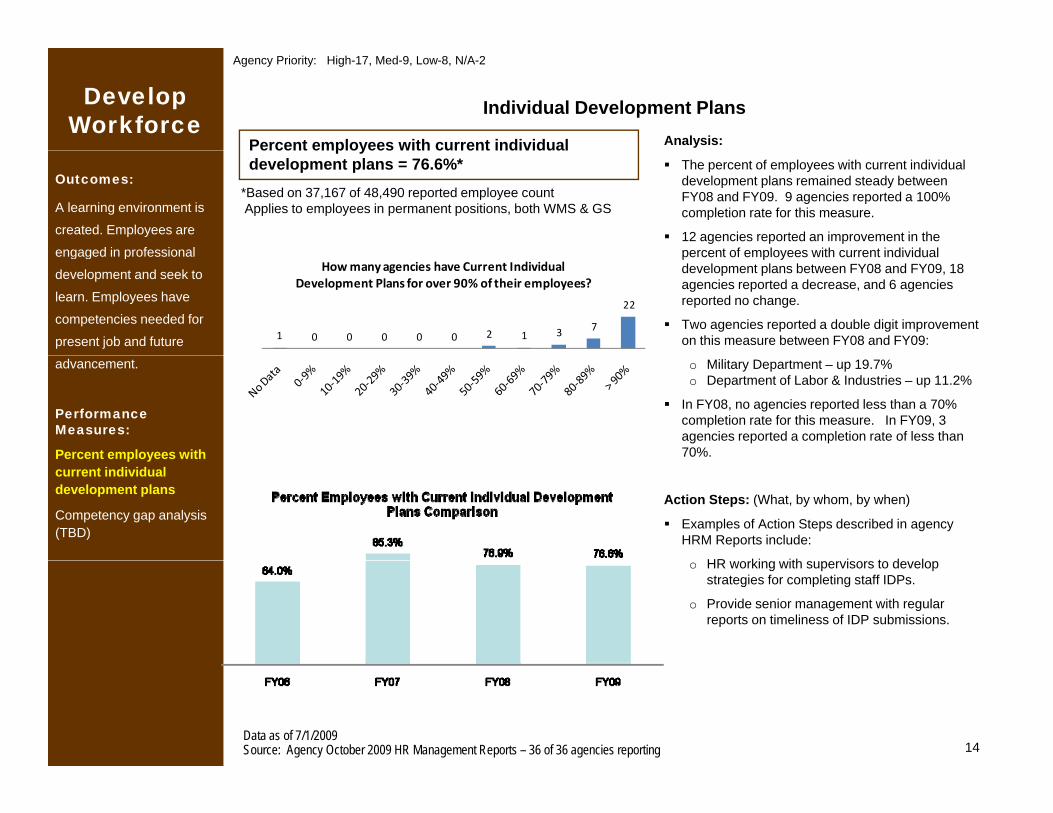
Individual Development Plans
Agency Priority: High-17, Med-9, Low-8, N/A-2
Outcomes:
A learning environment is
created. Employees are
engaged in professional
The percent of employees with current individual development plans remained steady between FY08 and FY09. 9 agencies reported a 100% completion rate for this measure.
12 agencies reported an improvement in the percent of employees with current individual
Percent employees with current individual development plans = 76.6%*
*Based on 37,167 of 48,490 reported employee countApplies to employees in permanent positions, both WMS & GS
engaged in professional
development and seek to
learn. Employees have
competencies needed for
present job and future
percent of employees with current individual development plans between FY08 and FY09, 18 agencies reported a decrease, and 6 agencies reported no change.
Two agencies reported a double digit improvement on this measure between FY08 and FY09:1 0 0 0 0 0 2 1 3 7
22
How many agencies have Current Individual Development Plans for over 90% of their employees?
advancement.
Performance Measures:
Percent employees with
o Military Department – up 19.7%o Department of Labor & Industries – up 11.2%
In FY08, no agencies reported less than a 70% completion rate for this measure. In FY09, 3 agencies reported a completion rate of less than 70%.Percent employees with
current individual development plans
Competency gap analysis (TBD)
Action Steps: (What, by whom, by when)
Examples of Action Steps described in agency HRM Reports include:
HR ki ith i t d lo HR working with supervisors to develop strategies for completing staff IDPs.
o Provide senior management with regular reports on timeliness of IDP submissions.
14Data as of 7/1/2009 Source: Agency October 2009 HR Management Reports – 36 of 36 agencies reporting
Reinforce Performance Analysis:
The statewide percent of employees with currentPercent employees with current performance evaluations = 79 3%*
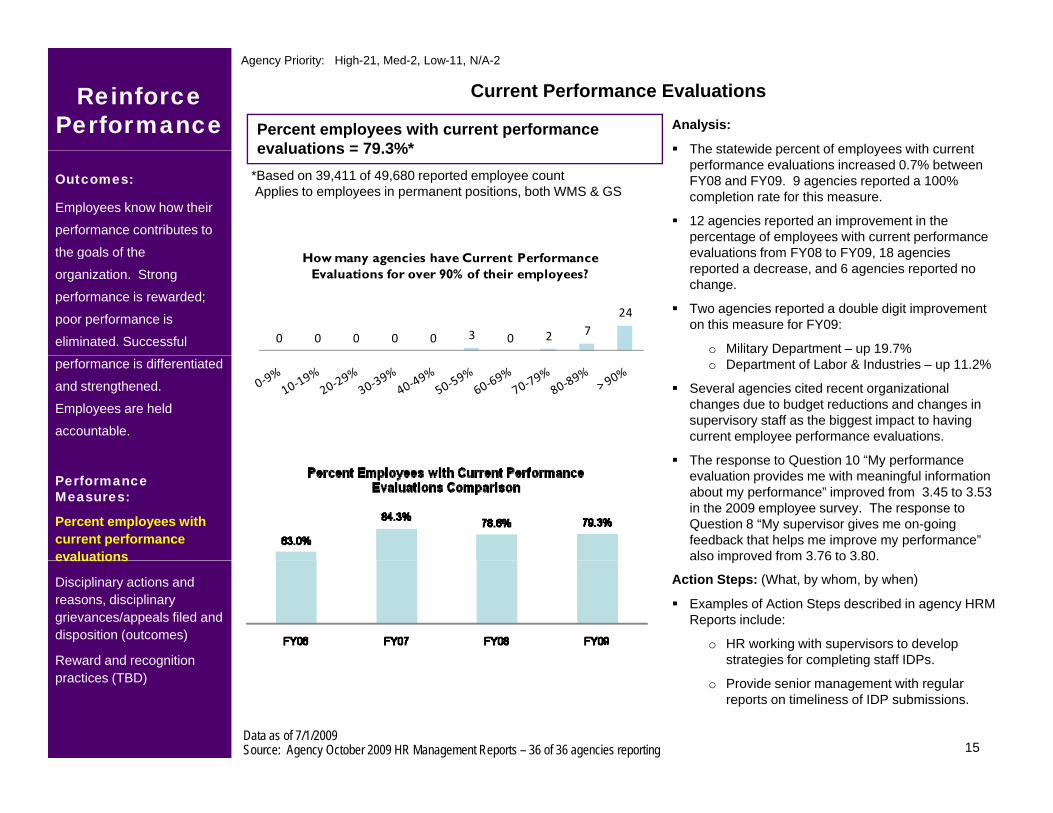
Current Performance Evaluations
Agency Priority: High-21, Med-2, Low-11, N/A-2
Outcomes:
Employees know how their
performance contributes to
the goals of the
The statewide percent of employees with current performance evaluations increased 0.7% between FY08 and FY09. 9 agencies reported a 100% completion rate for this measure.
12 agencies reported an improvement in the percentage of employees with current performance evaluations from FY08 to FY09 18 agencies
evaluations = 79.3%*Based on 39,411 of 49,680 reported employee countApplies to employees in permanent positions, both WMS & GS
0 0 0 0 0 3 0 2 724
How many agencies have Current Performance Evaluations for over 90% of their employees?
the goals of the
organization. Strong
performance is rewarded;
poor performance is
eliminated. Successful
evaluations from FY08 to FY09, 18 agencies reported a decrease, and 6 agencies reported no change.
Two agencies reported a double digit improvement on this measure for FY09:
o Military Department – up 19.7%performance is differentiated
and strengthened.
Employees are held
accountable.
y p po Department of Labor & Industries – up 11.2%
Several agencies cited recent organizational changes due to budget reductions and changes in supervisory staff as the biggest impact to having current employee performance evaluations.
The response to Question 10 “My performancePerformance Measures:
Percent employees with current performance evaluations
The response to Question 10 My performance evaluation provides me with meaningful information about my performance” improved from 3.45 to 3.53 in the 2009 employee survey. The response to Question 8 “My supervisor gives me on-going feedback that helps me improve my performance” also improved from 3.76 to 3.80.evaluations
Disciplinary actions and reasons, disciplinary grievances/appeals filed and disposition (outcomes)
Reward and recognition
p
Action Steps: (What, by whom, by when)
Examples of Action Steps described in agency HRM Reports include:
o HR working with supervisors to develop strategies for completing staff IDPs.
15
Reward and recognition practices (TBD)
strategies for completing staff IDPs.
o Provide senior management with regular reports on timeliness of IDP submissions.
Data as of 7/1/2009 Source: Agency October 2009 HR Management Reports – 36 of 36 agencies reporting
Formal Disciplinary ActionsReinforce
Performance
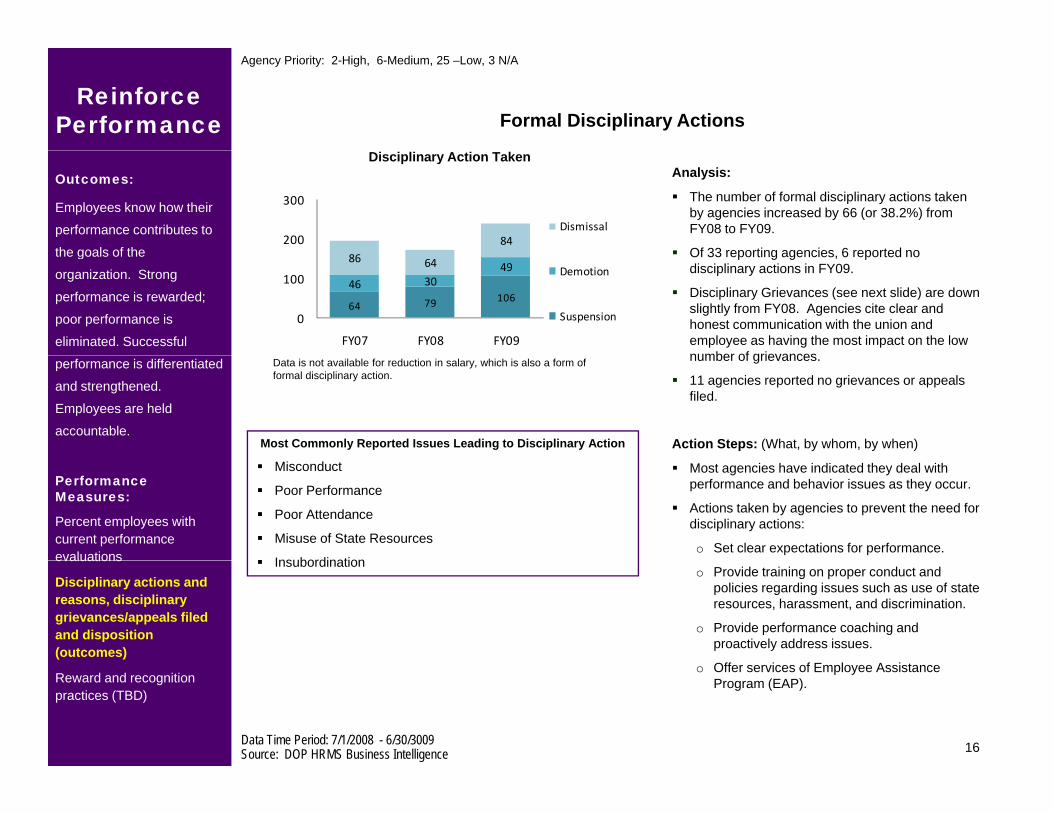
Agency Priority: 2-High, 6-Medium, 25 –Low, 3 N/A
Analysis:
The number of formal disciplinary actions taken by agencies increased by 66 (or 38.2%) from FY08 to FY09.
Of 33 reporting agencies 6 reported no
Disciplinary Action TakenOutcomes:
Employees know how their
performance contributes to
the goals of the84200
300
Dismissal
Of 33 reporting agencies, 6 reported no disciplinary actions in FY09.
Disciplinary Grievances (see next slide) are down slightly from FY08. Agencies cite clear and honest communication with the union and employee as having the most impact on the low number of grievances
the goals of the
organization. Strong
performance is rewarded;
poor performance is
eliminated. Successful
64 79 10646 30
4986 64
0
100
FY07 FY08 FY09
Demotion
Suspension
Most Commonly Reported Issues Leading to Disciplinary Action
number of grievances.
11 agencies reported no grievances or appeals filed.
Action Steps: (What, by whom, by when)
performance is differentiated
and strengthened.
Employees are held
accountable.
Data is not available for reduction in salary, which is also a form of formal disciplinary action.
Misconduct
Poor Performance
Poor Attendance
Misuse of State Resources
Insubordination
Most agencies have indicated they deal with performance and behavior issues as they occur.
Actions taken by agencies to prevent the need for disciplinary actions:
o Set clear expectations for performance.
Performance Measures:
Percent employees with current performance evaluations Insubordination
o Provide training on proper conduct and policies regarding issues such as use of state resources, harassment, and discrimination.
o Provide performance coaching and proactively address issues.
Off i f E l A i t
evaluations
Disciplinary actions and reasons, disciplinary grievances/appeals filed and disposition (outcomes)
16
o Offer services of Employee Assistance Program (EAP).Reward and recognition
practices (TBD)
Data Time Period: 7/1/2008 - 6/30/3009Source: DOP HRMS Business Intelligence

Disciplinary Grievances
Disciplinary Grievances and AppealsReinforce Performance
Disciplinary Grievances – FY09
Agency Priority: High=1, Med=2, Low=25, N/A=8
(Represented Employees)
16 16
22 21
17
25
15
22
18 1720
26 25
1620
25
30Outcomes:
Employees know how their
performance contributes to
the goals of the
Agency Number % of Total
DSHSDOCLNI
O
704015
35.4%20.2%7.6%
%
Disciplinary Grievances – FY09
13 13 14
10
1512 12 11
14 13 14
0
5
10
15
07 07 07 07 07 07 08 08 08 08 08 08 08 08 08 08 08 08 09 09 09 09 09 09
the goals of the
organization. Strong
performance is rewarded;
poor performance is
eliminated. Successful
DOTESDDNRDOHGAPARKS
151210544
7.6%6.1%5.1%2.5%2.0%2 0%
Jul 0
Aug
0Se
p 0
Oct 0
Nov 0
Dec 0
Jan
0Fe
b 0
Mar
0Ap
r 0M
ay 0
Jun
0Ju
l 0Au
g 0
Sep
0Oc
t 0No
v 0De
c 0Ja
n 0
Feb
0M
ar 0
Apr 0
May
0Ju
n 0
Disposition (Outcomes) of Disciplinary
performance is differentiated
and strengthened.
Employees are held
accountable.
Performance
PARKSAll Others
423
2.0%11.5%
FY 09 Total = 198FY08 Total = 204
Disciplinary AppealsPrimarily Non-Represented Employees Filed with
Data as of 7/1/2008 – 6/30/2009 Source: OFM Labor Relations Office
Affirmed18%
p ( ) p yAppeals (issued by the PRB) – FY09
Performance Measures:
Percent employees with current performance evaluations
Employee survey ratings on
Personnel Resources Board (PRB)
4
12
6
7
6
6
9
11
Demotion
Dismissal
Withdrawn72%
Reversed5%
Dismissed5%
Employee survey ratings on “performance and accountability” questions
Disciplinary actions and reasons, disciplinary grievances/appeals filed
1
6
4
27
1
1
5
Salary Reduction
Suspension FY09 - 27 AppealsFY08 - 19 AppealsFY07 - 15 AppealsFY06 - 23 Appeals
17Data as of 7/1/2008 - 6/30/2009 Source: Dept of Personnel
* There is no one-to-one correlation between the filings and the outcomes displayed in the charts above. The time lag between filing date and when a decision is rendered can cross the time periods indicated.
and disposition (outcomes)
Reward and recognition practices (TBD)
Total Outcomes = 22*1
0 5 10 15
Other
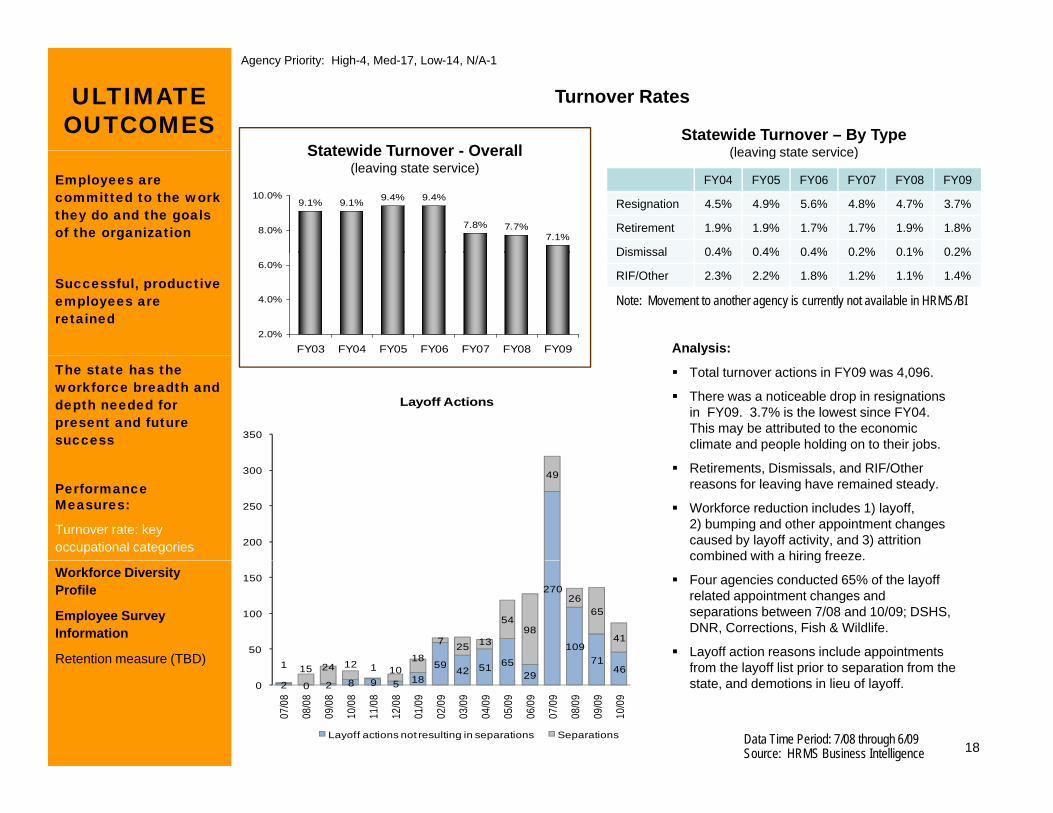
Turnover RatesULTIMATE OUTCOMES
Agency Priority: High-4, Med-17, Low-14, N/A-1
Statewide Turnover OverallStatewide Turnover – By Type
(leaving state service)
Employees are committed to the work they do and the goals of the organization
9.1% 9.1% 9.4% 9.4%
7.8% 7.7%7.1%
8.0%
10.0%FY04 FY05 FY06 FY07 FY08 FY09
Resignation 4.5% 4.9% 5.6% 4.8% 4.7% 3.7%
Retirement 1.9% 1.9% 1.7% 1.7% 1.9% 1.8%
Dismissal 0 4% 0 4% 0 4% 0 2% 0 1% 0 2%
Statewide Turnover - Overall(leaving state service)
(leaving state service)
Analysis:
Note: Movement to another agency is currently not available in HRMS/BISuccessful, productive employees are retained
2.0%
4.0%
6.0%
FY03 FY04 FY05 FY06 FY07 FY08 FY09
Dismissal 0.4% 0.4% 0.4% 0.2% 0.1% 0.2%
RIF/Other 2.3% 2.2% 1.8% 1.2% 1.1% 1.4%
Total turnover actions in FY09 was 4,096.
There was a noticeable drop in resignations in FY09. 3.7% is the lowest since FY04. This may be attributed to the economic climate and people holding on to their jobs.
The state has the workforce breadth and depth needed for present and future success 350
Layoff Actions
Retirements, Dismissals, and RIF/Other reasons for leaving have remained steady.
Workforce reduction includes 1) layoff, 2) bumping and other appointment changes caused by layoff activity, and 3) attrition combined with a hiring freeze.
Performance Measures:
Turnover rate: key occupational categories
49
200
250
300
g
Four agencies conducted 65% of the layoff related appointment changes and separations between 7/08 and 10/09; DSHS, DNR, Corrections, Fish & Wildlife.
Layoff action reasons include appointments f th l ff li t i t ti f th
Workforce Diversity Profile
Employee Survey Information
Retention measure (TBD) 59 65
270
109711 12
18
7 25 13
5498
2665
4150
100
150
18
from the layoff list prior to separation from the state, and demotions in lieu of layoff.
Data Time Period: 7/08 through 6/09Source: HRMS Business Intelligence
Retention measure (TBD)
2 0 2 8 9 5 1859 42 51 65
2971
461 15 24 12 1 100
07/0
8
08/0
8
09/0
8
10/0
8
11/0
8
12/0
8
01/0
9
02/0
9
03/0
9
04/0
9
05/0
9
06/0
9
07/0
9
08/0
9
09/0
9
10/0
9
Layoff actions not resulting in separations Separations

WA State
WA State
WA State
WA State
WA Labor
Workforce Diversity ProfileULTIMATE OUTCOMES
Agency Priority: High-9, Med-20, Low-6
People of Color WA State Government vs WA General Labor Force
FY06 FY07 FY08 FY09 Force
Female 52% 53% 53% 53% 46.3%
Persons w/Disabilities
5% 5% 4% 4% 7.2%
Vietnam Era Vets 7% 7% 6% 6% N/A
7% 7%5% 6%5% 3%2% 2%
American Indian/AlaskanNative
Black or African American
Hispanic/Latino
Employees are committed to the work they do and the goals of the organization
Vets w/Disabilities 2% 2% 2% 2% N/A
People of Color 17.5% 18% 18% 18% 18.9%
Persons Over 40 76% 75% 75% 74% N/A82% 82%
Hispanic/Latino
Asian / Native Hawaiian/Pacific Islander
White
Successful, productive employees are retained
Profile data includes permanent employees only.
WA State GovernmentWorkforce
WA General Labor Force
The state has the workforce breadth and depth needed for present and future success
Analysis:
The majority of all employees – WMS (43%) and non-WMS (34%) are between 50-59 years of age.
The percent of persons over 40 has dropped from
Performance Measures:
Turnover rates and types
Turnover rate: key
p p pp75% to 74% since FY08, and 2% since FY06.
Action Steps: (What, by whom, by when)
DOP and GAAPCom are preparing a policy briefing outlining the recommendations from the Governor’s
Percent Age Distribution
21%22%
17%
All Employees (including WMS)WMS Employees Onlyy
occupational categories
Workforce Diversity Profile
Employee Survey Information
gDisability Sub-committee report.
DOP in partnership with DSHS/DVR is working on an action plan on how to make WA state a model employer for persons with disabilities.
6%
8%10%
17% 17%
10%
7%
15%
12%
%
17%
13%13%
% E
mpl
oyee
s
19
Information
Retention measure (TBD)
Data as of 6/09Source: HRMS Business Intelligence
0% 0%0% 0%1%
4%2%3%
0%2%
< 15
15-1
9
20-2
4
25-2
9
30-3
4
35-3
9
40-4
4
45-4
9
50-5
4
55-5
9
60-6
4
65 +
Age Groups
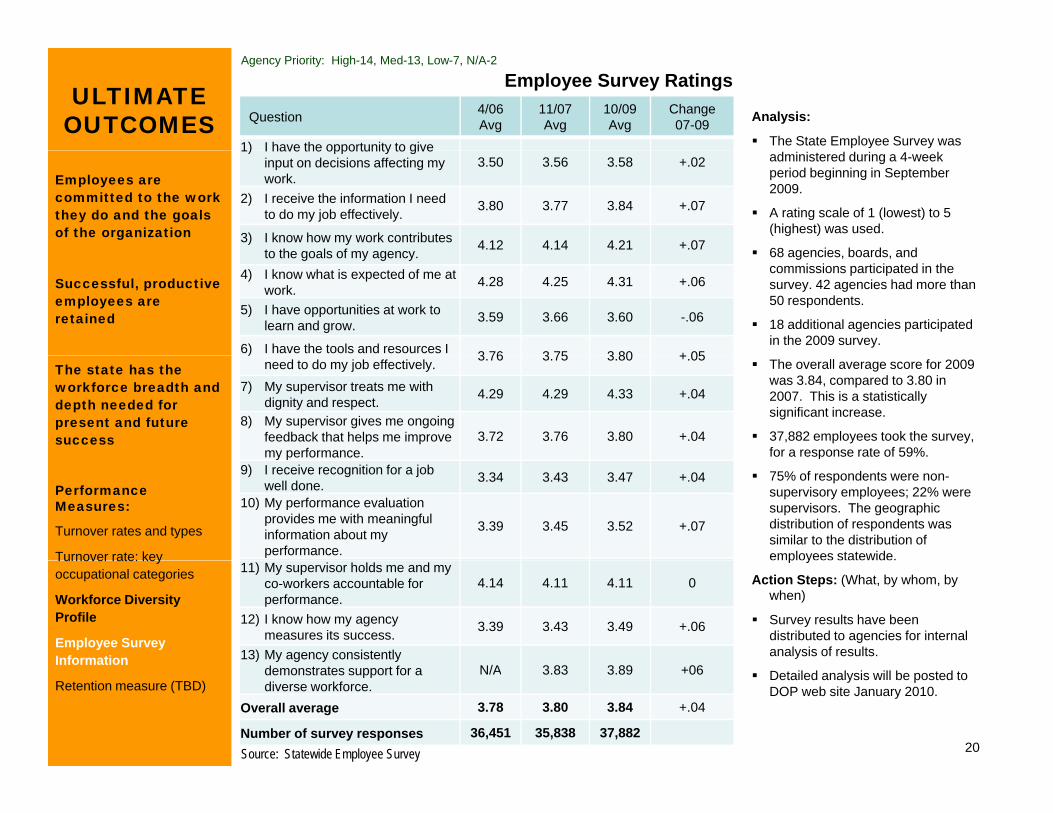
Employee Survey RatingsULTIMATE
OUTCOMES
Agency Priority: High-14, Med-13, Low-7, N/A-2
Analysis:
The State Employee Survey was
Question 4/06 Avg
11/07 Avg
10/09 Avg
Change07-09
1) I have the opportunity to give
Employees are committed to the work they do and the goals of the organization
administered during a 4-week period beginning in September 2009.
A rating scale of 1 (lowest) to 5 (highest) was used.
68 agencies boards and
1) I have the opportunity to give input on decisions affecting my work.
3.50 3.56 3.58 +.02
2) I receive the information I need to do my job effectively. 3.80 3.77 3.84 +.07
3) I know how my work contributes to the goals of my agency 4.12 4.14 4.21 +.07
Successful, productive employees are retained
68 agencies, boards, and commissions participated in the survey. 42 agencies had more than 50 respondents.
18 additional agencies participated in the 2009 survey.
to the goals of my agency.4) I know what is expected of me at
work. 4.28 4.25 4.31 +.06
5) I have opportunities at work to learn and grow. 3.59 3.66 3.60 -.06
6) I have the tools and resources I 3 76 3 75 3 80 + 05The state has the workforce breadth and depth needed for present and future success
The overall average score for 2009 was 3.84, compared to 3.80 in 2007. This is a statistically significant increase.
37,882 employees took the survey, for a response rate of 59%.
)need to do my job effectively. 3.76 3.75 3.80 +.05
7) My supervisor treats me with dignity and respect. 4.29 4.29 4.33 +.04
8) My supervisor gives me ongoing feedback that helps me improve my performance.
3.72 3.76 3.80 +.04
Performance Measures:
Turnover rates and types
Turnover rate: key
p
75% of respondents were non-supervisory employees; 22% were supervisors. The geographic distribution of respondents was similar to the distribution of employees statewide.
y p9) I receive recognition for a job
well done. 3.34 3.43 3.47 +.04
10) My performance evaluation provides me with meaningful information about my performance.
3.39 3.45 3.52 +.07
Turnover rate: key occupational categories
Workforce Diversity Profile
Employee Survey Information
p y
Action Steps: (What, by whom, by when)
Survey results have been distributed to agencies for internal analysis of results.
11) My supervisor holds me and my co-workers accountable for performance.
4.14 4.11 4.11 0
12) I know how my agency measures its success. 3.39 3.43 3.49 +.06
13) My agency consistently
20
Information
Retention measure (TBD)
Data as of October 2009Source: Statewide Employee Survey
Detailed analysis will be posted to DOP web site January 2010.
demonstrates support for a diverse workforce.
N/A 3.83 3.89 +06
Overall average 3.78 3.80 3.84 +.04
Number of survey responses 36,451 35,838 37,882
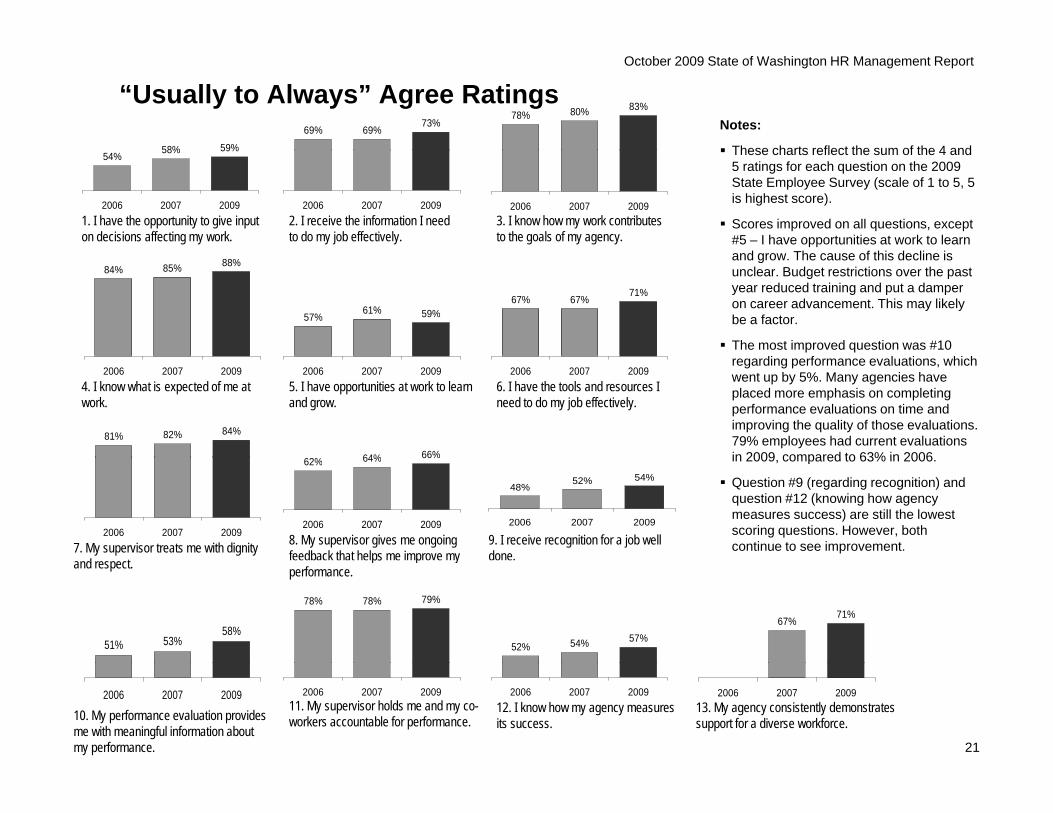
“Usually to Always” Agree Ratings
58% 59%
69% 69%73%
78% 80% 83%
October 2009 State of Washington HR Management Report
Notes:
These charts reflect the sum of the 4 and54% 58% 59%
2006 2007 2009 2006 2007 2009 2006 2007 20091. I have the opportunity to give input on decisions affecting my work.
2. I receive the information I need to do my job effectively.
3. I know how my work contributes to the goals of my agency.
These charts reflect the sum of the 4 and 5 ratings for each question on the 2009 State Employee Survey (scale of 1 to 5, 5 is highest score).
Scores improved on all questions, except #5 – I have opportunities at work to learn
d Th f thi d li i84% 85% 88%
57%61% 59%
67% 67%71%
and grow. The cause of this decline is unclear. Budget restrictions over the past year reduced training and put a damper on career advancement. This may likely be a factor.
The most improved question was #10
2006 2007 2009 2006 2007 20095. I have opportunities at work to learn and grow.
2006 2007 2009
81% 82% 84%
62% 64% 66%
6. I have the tools and resources I need to do my job effectively.
4. I know what is expected of me at work.
regarding performance evaluations, which went up by 5%. Many agencies have placed more emphasis on completing performance evaluations on time and improving the quality of those evaluations. 79% employees had current evaluations in 2009 compared to 63% in 2006
48%52% 54%
2006 2007 2009
9. I receive recognition for a job well done.
2006 2007 2009
62% 64% 66%
2006 2007 2009
7. My supervisor treats me with dignity d t
8. My supervisor gives me ongoing feedback that helps me improve my
in 2009, compared to 63% in 2006.
Question #9 (regarding recognition) and question #12 (knowing how agency measures success) are still the lowest scoring questions. However, both continue to see improvement.
67%71%
52% 54% 57%
78% 78% 79%
51% 53%58%
and respect. ps p yperformance.
2006 2007 200913. My agency consistently demonstrates support for a diverse workforce.
2006 2007 20092006 2007 20092006 2007 2009
10. My performance evaluation provides me with meaningful information about my performance.
11. My supervisor holds me and my co-workers accountable for performance.
12. I know how my agency measures its success.
21