state of water infrastructure
DESCRIPTION
Presentation to the Portfolio Committee: Water & Environment. State of water infrastructure. Presentation by Dr C Ruiters Deputy Director-General: Water Resources Infrastructure 26 - 27 January 2011. Presentation overview. Background Macro Planning: Integrated Water Resources Planning - PowerPoint PPT PresentationTRANSCRIPT
Presentation to the Portfolio Committee: Water & Environment
State of water infrastructure
Presentation byDr C Ruiters
Deputy Director-General: Water Resources Infrastructure 26 - 27 January 2011
Presentation overview1. Background2. Macro Planning: Integrated Water Resources Planning3. Infrastructure Developments4. Condition of existing infrastructure5. Dam Safety Rehabilitation and Refurbishment Programme
(DSRP)6. Strategy on Access to Water for Basic use from Dams7. Regional Bulk Infrastructure
2
3
2. Macro Planning: Integrated Water Resources Planning
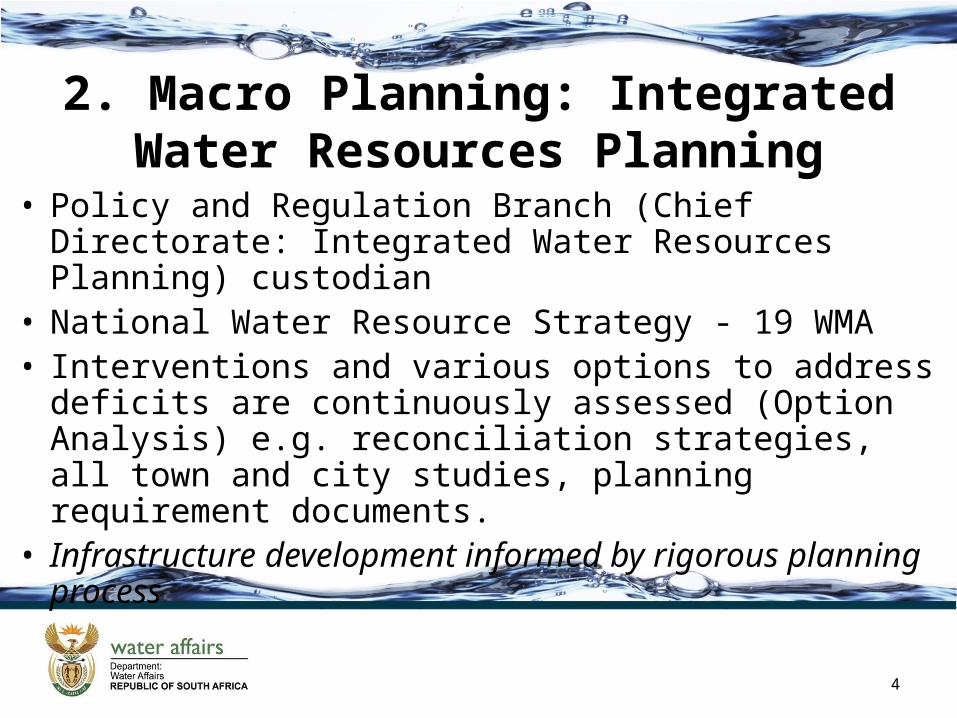
• Policy and Regulation Branch (Chief Directorate: Integrated Water Resources Planning) custodian
• National Water Resource Strategy - 19 WMA• Interventions and various options to address deficits are
continuously assessed (Option Analysis) e.g. reconciliation strategies, all town and city studies, planning requirement documents.
• Infrastructure development informed by rigorous planning process
4
3. Infrastructure Development
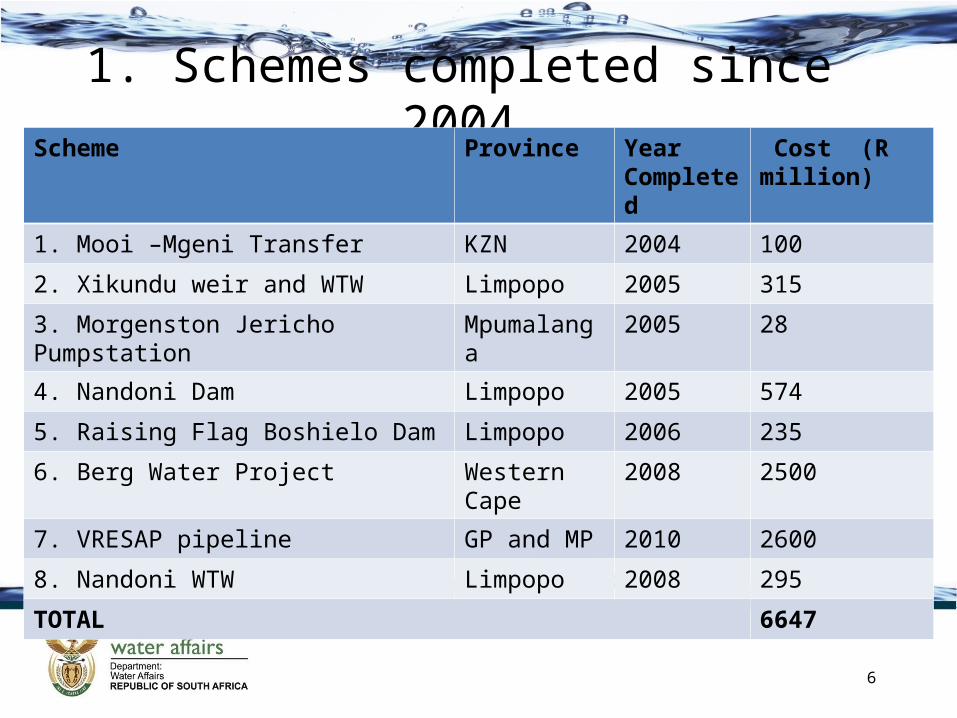
1. Schemes completed since 2004
6
Scheme Province Year Completed
Cost (R million)
1. Mooi –Mgeni Transfer KZN 2004 100
2. Xikundu weir and WTW Limpopo 2005 315
3. Morgenston Jericho Pumpstation Mpumalanga 2005 28
4. Nandoni Dam Limpopo 2005 574
5. Raising Flag Boshielo Dam Limpopo 2006 235
6. Berg Water Project Western Cape 2008 2500
7. VRESAP pipeline GP and MP 2010 2600
8. Nandoni WTW Limpopo 2008 295
TOTAL 6647
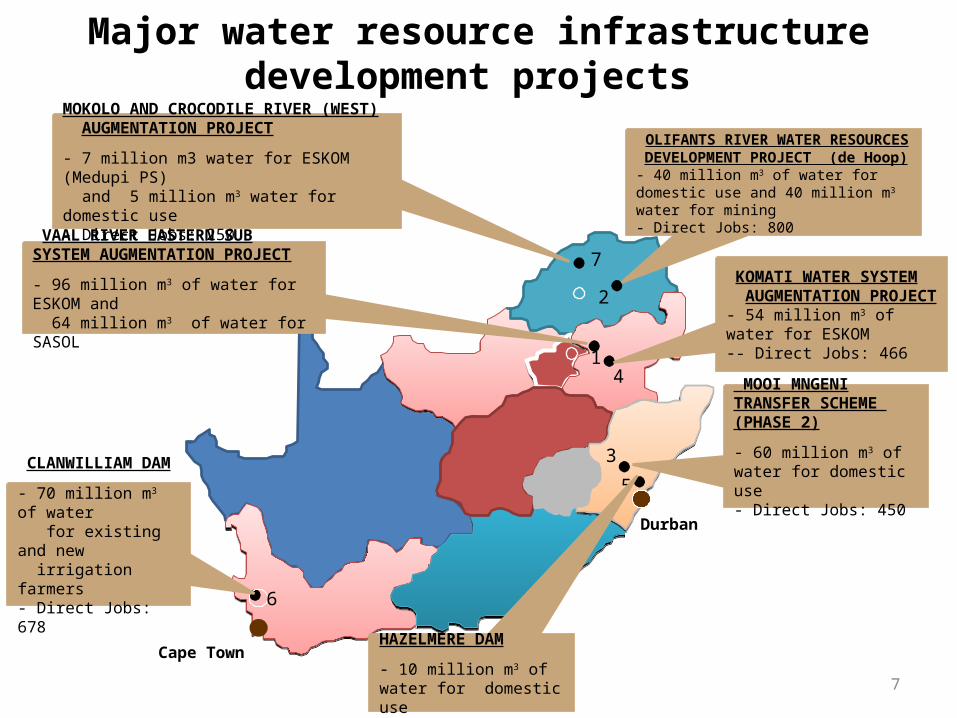
Major water resource infrastructure development projects
7
Durban
Cape Town
461
7
2
4
6
3
5
1
HAZELMERE DAM
- 10 million m3 of water for domestic use
CLANWILLIAM DAM
- 70 million m3 of water for existing and new irrigation farmers- Direct Jobs: 678
VAAL RIVER EASTERN SUB SYSTEM AUGMENTATION PROJECT
- 96 million m3 of water for ESKOM and 64 million m3 of water for SASOL
MOKOLO AND CROCODILE RIVER (WEST) AUGMENTATION PROJECT
- 7 million m3 water for ESKOM (Medupi PS) and 5 million m3 water for domestic use- Direct Jobs: 250
MOOI MNGENI TRANSFER SCHEME (PHASE 2)
- 60 million m3 of water for domestic use- Direct Jobs: 450
KOMATI WATER SYSTEM AUGMENTATION PROJECT- 54 million m3 of water for ESKOM-- Direct Jobs: 466
OLIFANTS RIVER WATER RESOURCES DEVELOPMENT PROJECT (de Hoop)- 40 million m3 of water for domestic use and 40 million m3 water for mining- Direct Jobs: 800
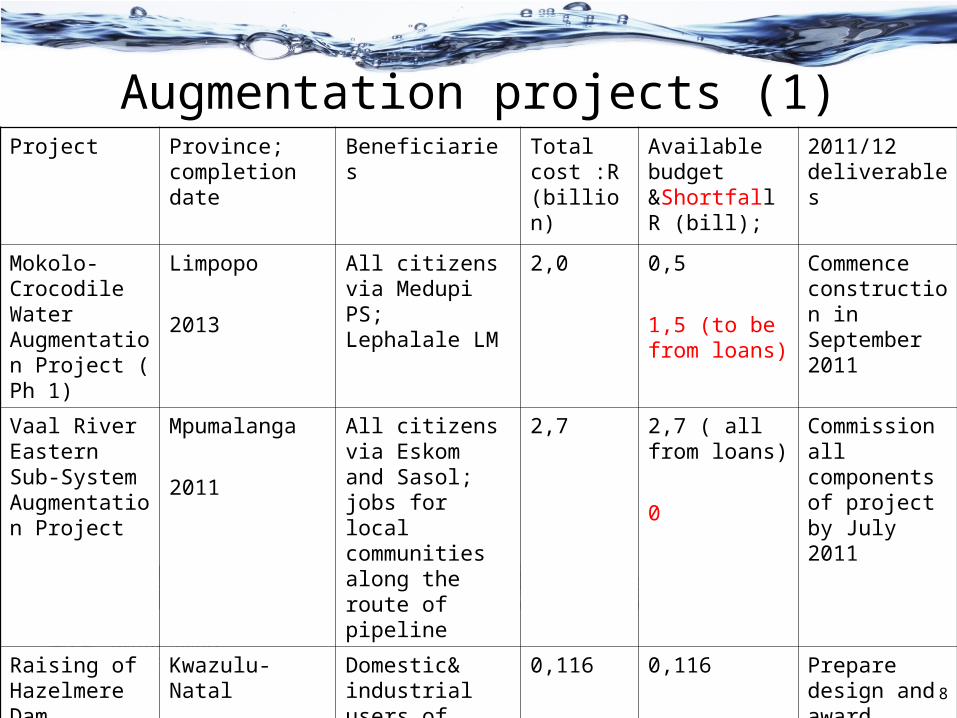
Augmentation projects (1)Project Province;
completion dateBeneficiaries Total
cost :R (billion)
Available budget &Shortfall R (bill);
2011/12 deliverables
Mokolo-Crocodile Water Augmentation Project ( Ph 1)
Limpopo
2013
All citizens via Medupi PS; Lephalale LM
2,0 0,5 1,5 (to be from loans)
Commence construction in September 2011
Vaal River Eastern Sub-System Augmentation Project
Mpumalanga
2011
All citizens via Eskom and Sasol; jobs for local communities along the route of pipeline
2,7 2,7 ( all from loans)
0
Commission all components of project by July 2011
Raising of Hazelmere Dam
Kwazulu-Natal
2012
Domestic& industrial users of IlembeDM and Ethekwini
0,116 0,116 Prepare design and award tender for supply of crest gates 8
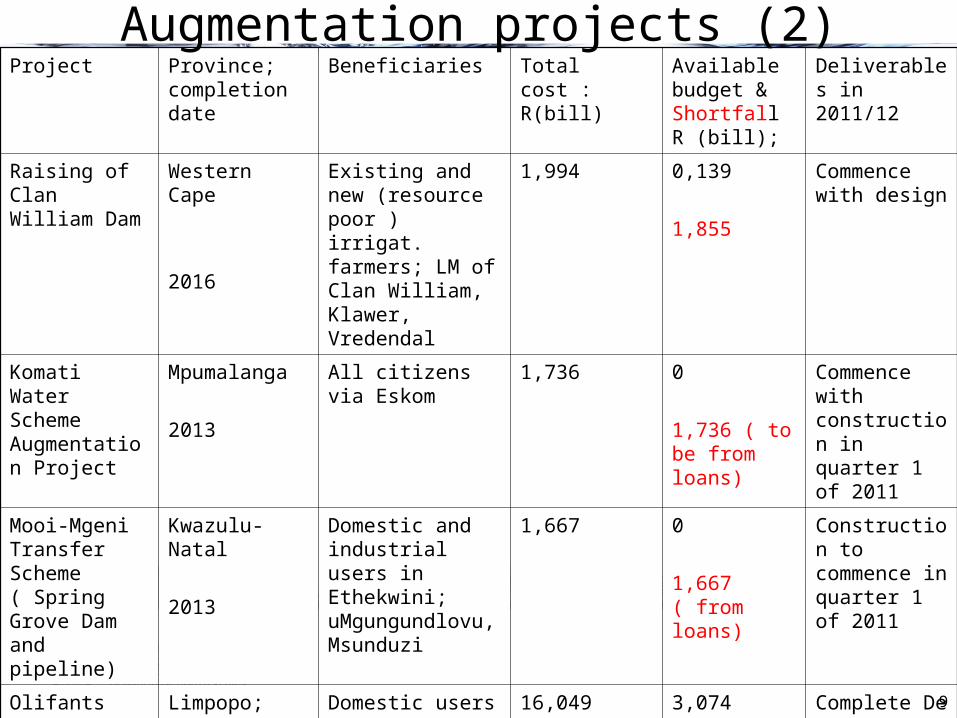
Project Province; completion date
Beneficiaries Total cost : R(bill)
Available budget & Shortfall R (bill);
Deliverables in 2011/12
Raising of Clan William Dam
Western Cape
2016
Existing and new (resource poor ) irrigat. farmers; LM of Clan William, Klawer, Vredendal
1,994 0,139
1,855
Commence with design
Komati Water Scheme Augmentation Project
Mpumalanga
2013
All citizens via Eskom 1,736 0
1,736 ( to be from loans)
Commence with construction in quarter 1 of 2011
Mooi-Mgeni Transfer Scheme ( Spring Grove Dam and pipeline)
Kwazulu-Natal
2013
Domestic and industrial users in Ethekwini; uMgungundlovu, Msunduzi
1,667 0
1,667 ( from loans)
Construction to commence in quarter 1 of 2011
Olifants River Water Resources Development Project 2A-H
Limpopo;De Hoop Dam by 2012; Bulk distribution system by 2015(?)
Domestic users in Sekhukhune District; Polokwane,Mogalakwena LM and mines
16,049 ( not including water services infrastructure requirements of 6,572)
3,074
12,975
Complete De Hoop Dam to 92 %; commence implementation of distribution system
Augmentation projects (2)
9
10
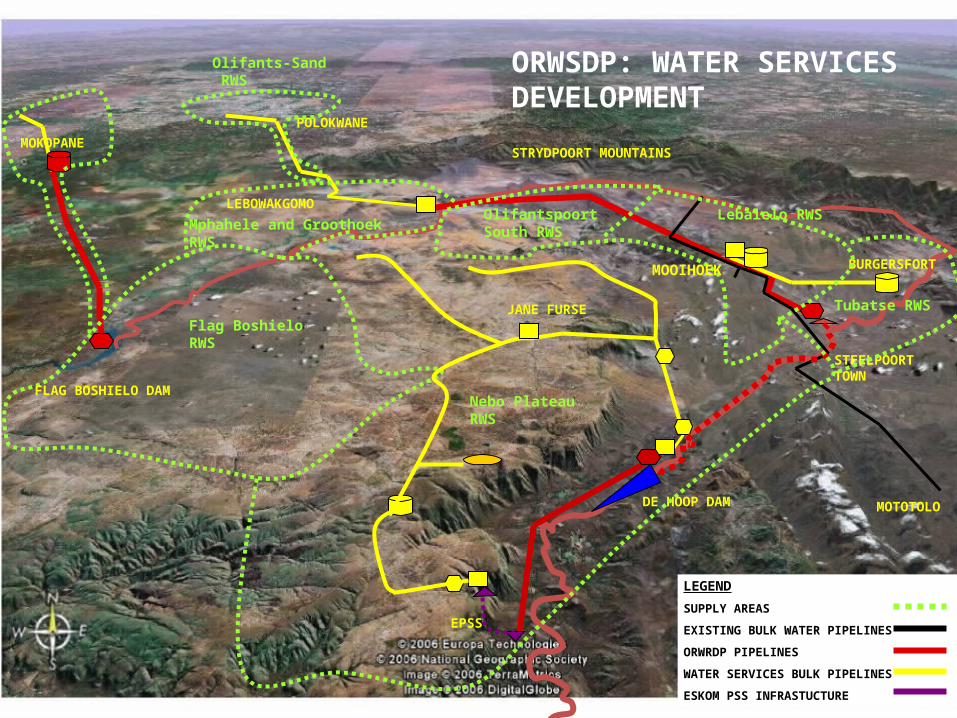
STRYDPOORT MOUNTAINS
BURGERSFORT
EPSS
DE HOOP DAM
STEELPOORT TOWN
MOTOTOLO
MOKOPANE
POLOKWANE
LEBOWAKGOMO
JANE FURSEFlag Boshielo RWS
Tubatse RWS
Nebo Plateau RWS
Lebalelo RWSOlifantspoort South RWS
Olifants-Sand RWS
ORWSDP: WATER SERVICES DEVELOPMENT
FLAG BOSHIELO DAM
MOOIHOEK
Mphahele and Groothoek RWS
LEGEND
SUPPLY AREAS
EXISTING BULK WATER PIPELINES
ORWRDP PIPELINES
WATER SERVICES BULK PIPELINES
ESKOM PSS INFRASTUCTURE
1111
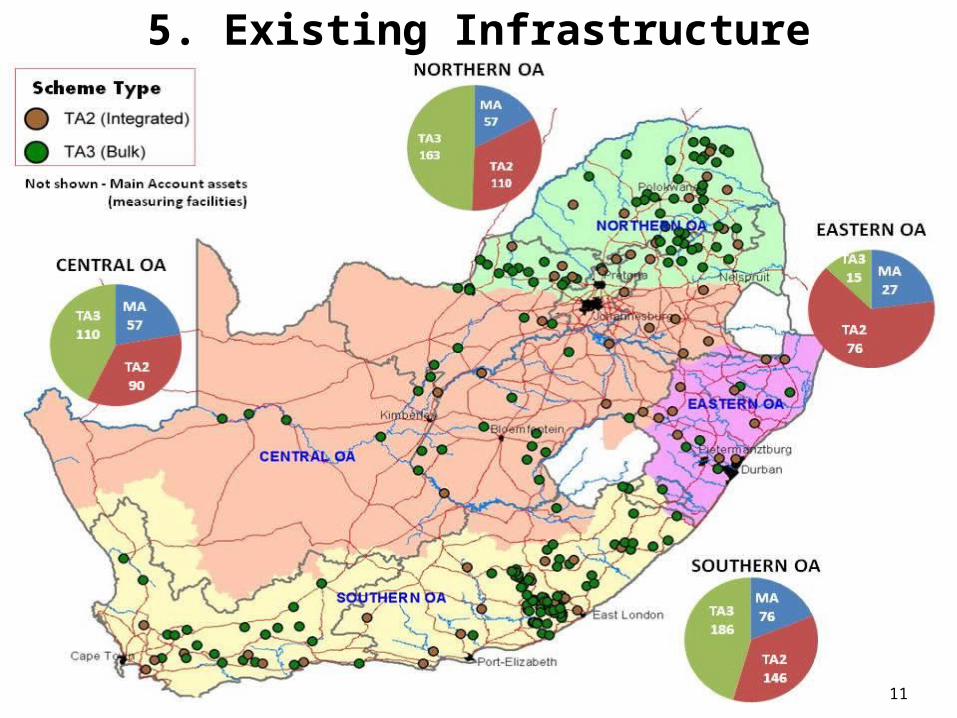
5. Existing Infrastructure
12
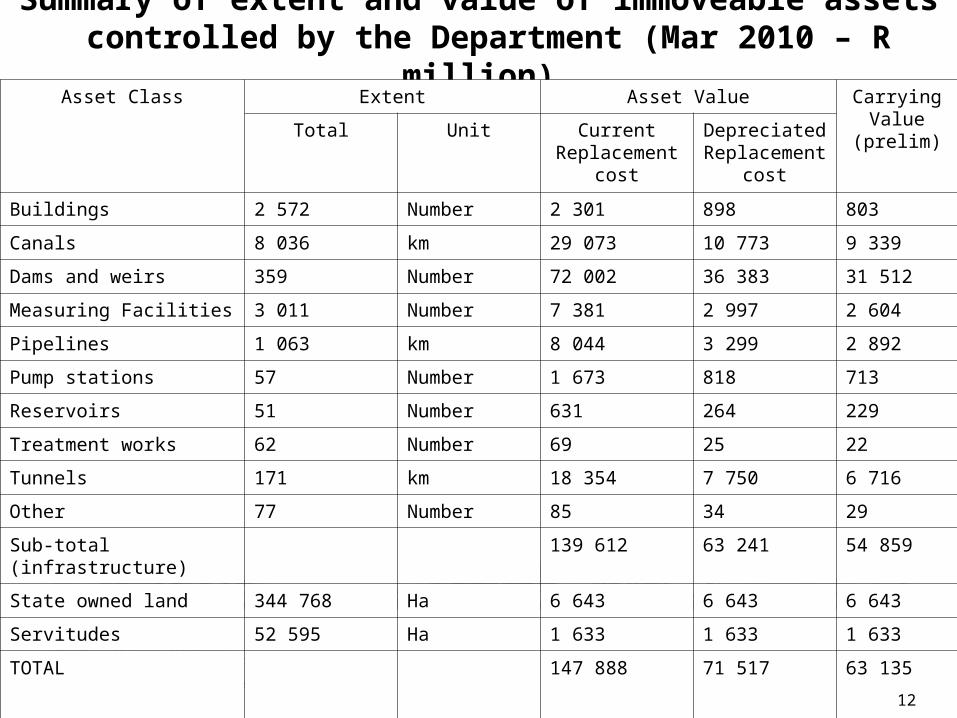
Summary of extent and value of immoveable assets controlled by the Department (Mar 2010 – R million)
Asset Class Extent Asset Value Carrying Value
(prelim)Total Unit Current Replacement
cost
Depreciated Replacement
cost
Buildings 2 572 Number 2 301 898 803
Canals 8 036 km 29 073 10 773 9 339
Dams and weirs 359 Number 72 002 36 383 31 512
Measuring Facilities 3 011 Number 7 381 2 997 2 604
Pipelines 1 063 km 8 044 3 299 2 892
Pump stations 57 Number 1 673 818 713
Reservoirs 51 Number 631 264 229
Treatment works 62 Number 69 25 22
Tunnels 171 km 18 354 7 750 6 716
Other 77 Number 85 34 29
Sub-total (infrastructure) 139 612 63 241 54 859
State owned land 344 768 Ha 6 643 6 643 6 643
Servitudes 52 595 Ha 1 633 1 633 1 633
TOTAL 147 888 71 517 63 135
12
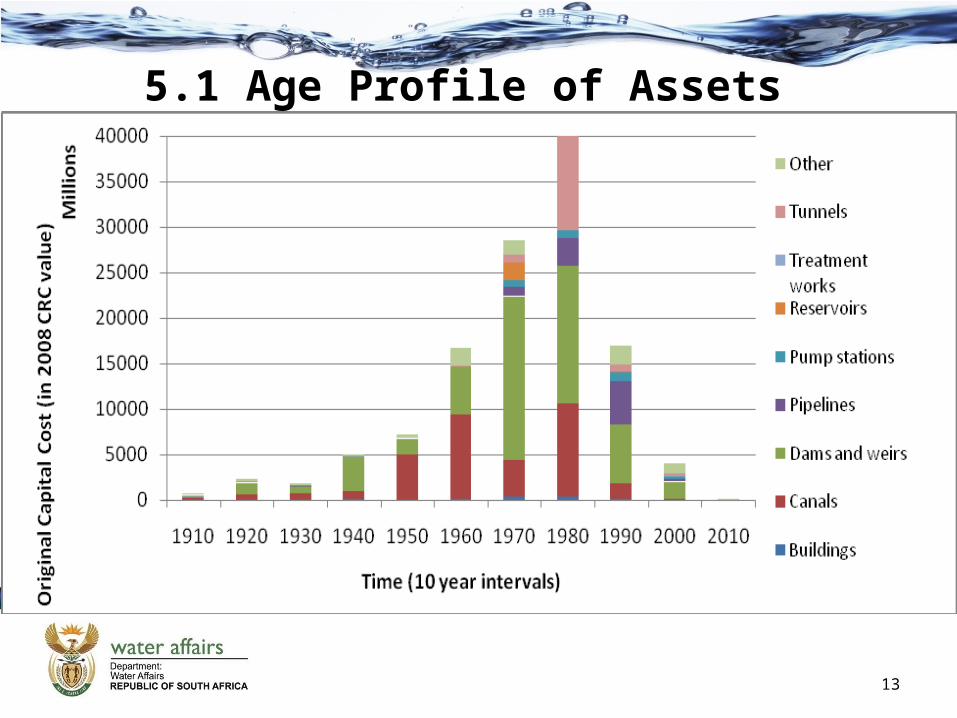
5.1 Age Profile of Assets
13
14
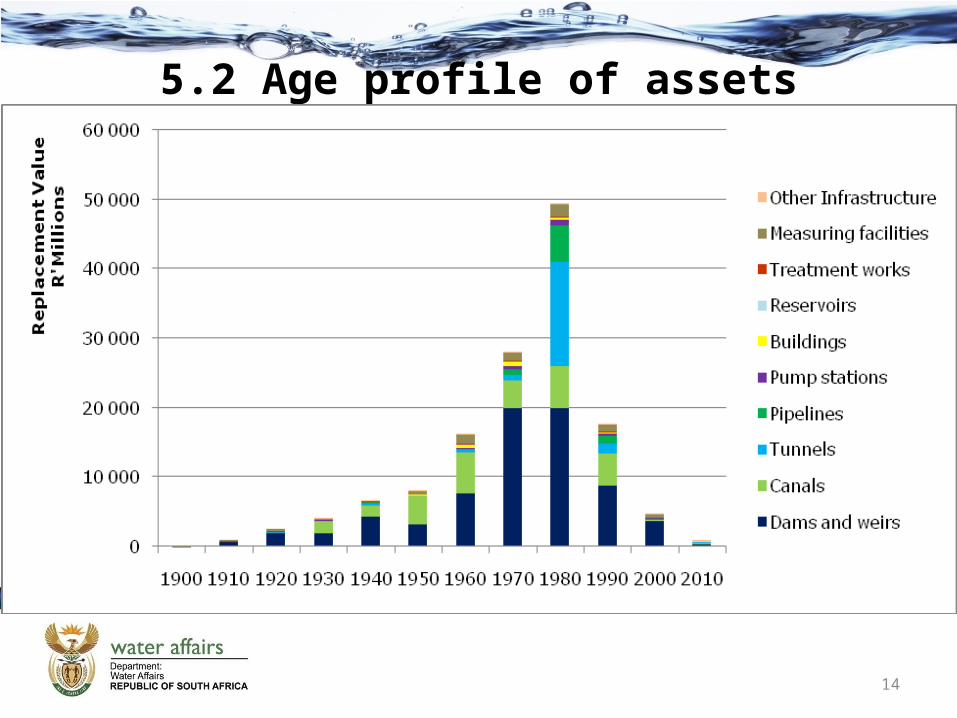
5.2 Age profile of assets
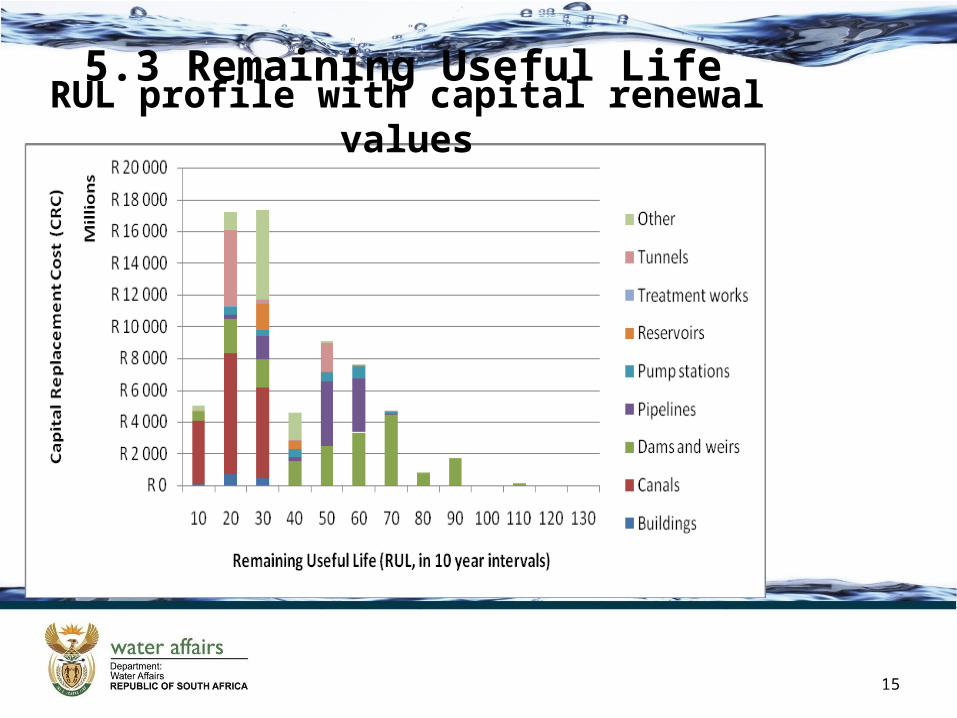
5.3 Remaining Useful Life
15
RUL profile with capital renewal values
5. DAM SAFETY REHABILITATION PROGRAMME (DSRP)
• 359 dams on the asset register (218 listed in the ICOLD world register of large dams)
• Rehabilitation work on 22 dams complete
• 36 dams in various stages: feasibility study, detailed design or construction
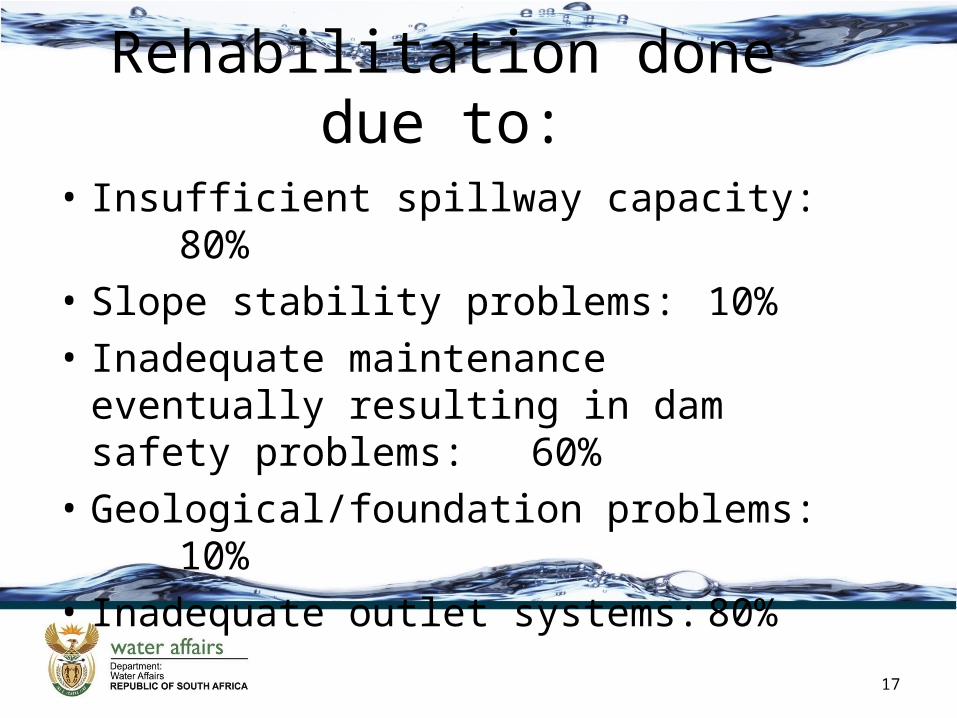
Rehabilitation done due to:
• Insufficient spillway capacity: 80%• Slope stability problems: 10%• Inadequate maintenance eventually
resulting in dam safety problems: 60%• Geological/foundation problems:10%• Inadequate outlet systems: 80%
17
18
0
50,000,000
100,000,000
150,000,000
200,000,000
250,000,000
300,000,000
350,000,000
400,000,000
Cos
t (R
)
'2005/06 2007/08 2009/10
Fin Year
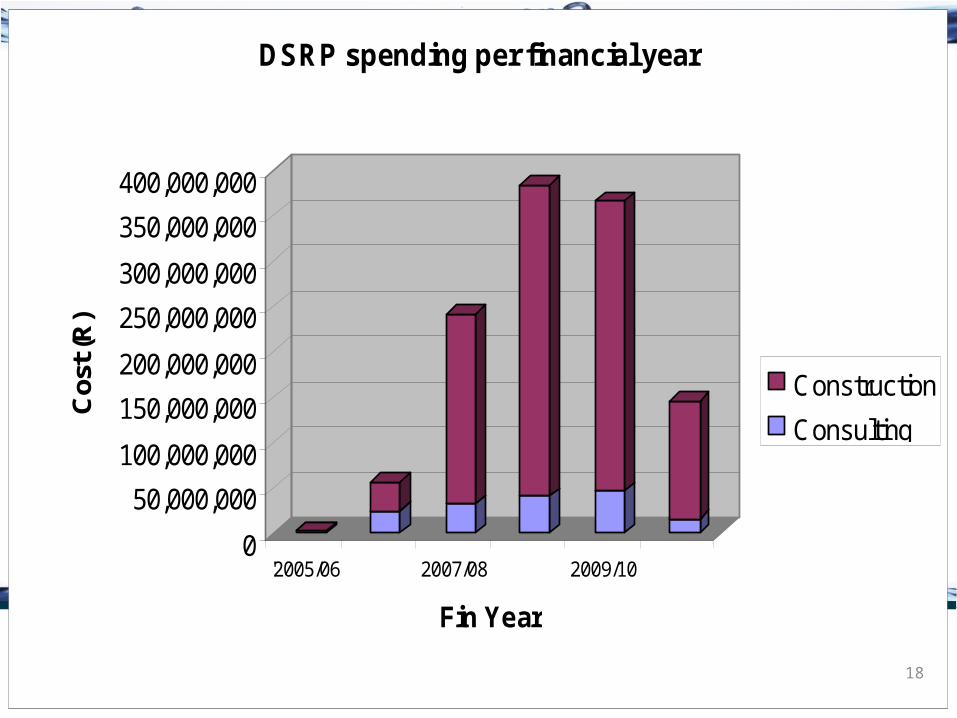
DSRP spending per financial year
Construction
Consulting
18
Progress
• Total Expenditure till Sept 2010: R1 200m• Dams on programme: 58
19
20
6. Strategy on Access to Water for Basic use from Dams
Introduction• Communities in rural areas that live in close proximity to water sources
and networks have been identified throughout South Africa that do not as yet have access to sufficient and safe water to fulfill their basic needs.
• This issue is of serious concern for DWA who has decided that urgent action be taken in order to ensure that the basic constitutional rights of these communities are fulfilled.
• This project is aimed at supporting the DWA to identify communities that live in close proximity to DWA dams that do not as yet have access to water for basic domestic use.
• It is envisaged that the final output of this project will be a report identifying these communities without access to basic water for domestic use and providing potential solutions to the identified service delivery problem.
21

Scope of Work Envisaged by DWA• Conduct a survey of communities in close proximity to the dams as
by DWA in the list below in order to ascertain which communities do not have access to a basic domestic water supply
• Assess what water is available from these dams.• Determine impact of allocating some of the water from the
relevant dam to communities without a basic domestic water supply. The National Water Act states that the provision of water for basic human needs is a priority issue.
• Determine the level of service to be provided.
22
Scope of Work Envisaged by DWA
• Ascertain existing infrastructure in the area.• Determine the possible infrastructure requirements to supply potable
water to the community.• Determine the estimated capital and operational costs of this supply.• Determine the estimated timeframe required to supply the
infrastructure.
23
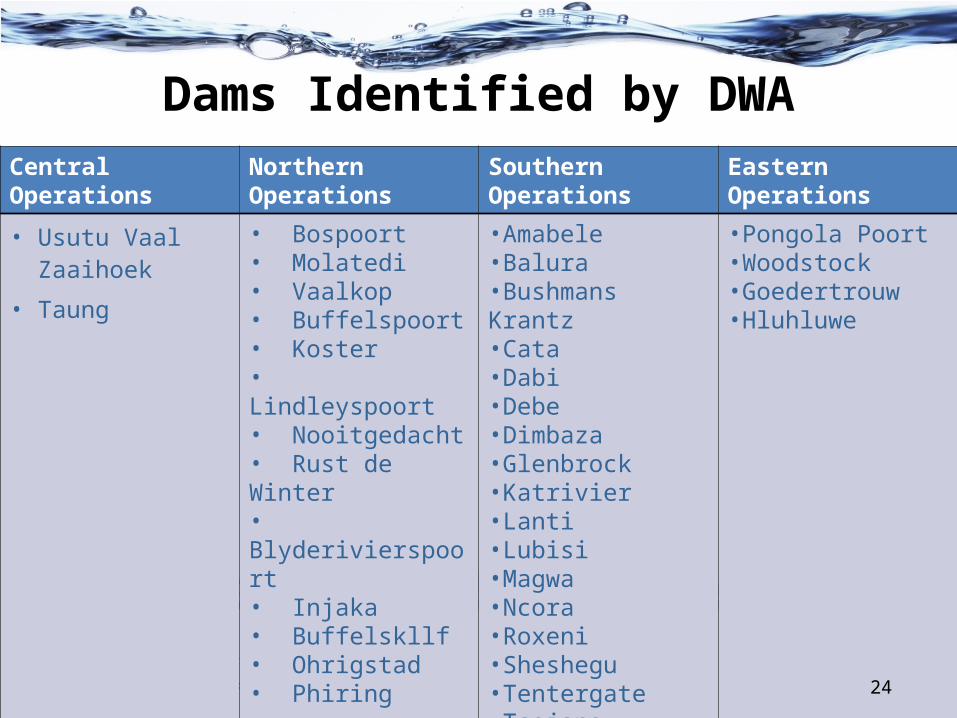
Dams Identified by DWA
24
Central Operations Northern Operations Southern Operations Eastern Operations
• Usutu Vaal Zaaihoek
• Taung
• Bospoort• Molatedi • Vaalkop• Buffelspoort• Koster• Lindleyspoort• Nooitgedacht• Rust de Winter• Blyderivierspoort • Injaka • Buffelskllf• Ohrigstad• Phiring • Chuenniespoort
•Amabele•Balura•Bushmans Krantz•Cata•Dabi•Debe•Dimbaza•Glenbrock•Katrivier•Lanti•Lubisi•Magwa•Ncora•Roxeni•Sheshegu•Tentergate•Tsojana•Umtata
•Pongola Poort•Woodstock•Goedertrouw•Hluhluwe
24
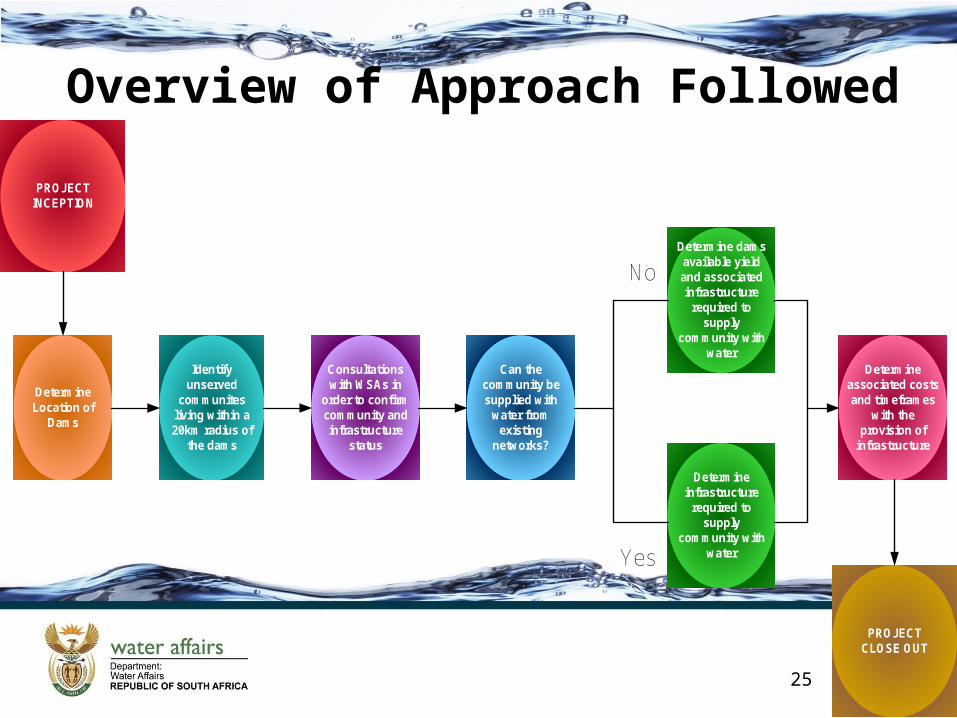
Overview of Approach Followed
25
Can the community be supplied with
water from existing
networks?
Determine Location of
Dams
Consultations with WSAs in
order to confirm community and infrastructure
status
Determine associated costs and timeframes
with the provision of
infrastructure
PROJECT INCEPTION
Identify unserved
communites living within a 20km radius of
the dams
Determine dams available yield and associated infrastructure
required to supply
community with water
Determine infrastructure
required to supply
community with water
PROJECT CLOSE OUT
No
Yes
25
Approach
Phase 1 : Determine Location of Dams and CommunitiesPhase 2 : Consultations with Relevant WSA’sPhase 3: Identify Possible Infrastructure SolutionsPhase 4: Financial and Time Implications for Proposed
Infrastructure per DamPhase 5: Institutional Issues
26
General Comments• Currently the provinces that are focused on is:
– Limpopo– North West– Eastern Cape
• The full amount of funding indicated to conclude all activities was not available from inception
• Therefore the aim is to conclude the full life cycle for them before commencing with the other regions to estimate what funding is remaining.
• A time delay could occur if the All Town Study information is delayed due to some of the areas not yet concluded.
27
Regional Bulk Infrastructure
28
• Is to develop an oversight and support function
that will ensure the development and operational and maintenance of regional bulk infrastructure in the water sector.
29
1- Overview Strategic purpose
Objectives of Programmea. Identify all regional bulk project requirements, through
appropriate integrated planning processes.
b. Assist with the funding and implementation of regional bulk infrastructure projects through RBIG.
c. Facilitate the development of institutional arrangements and capacity to ensure the implementation and effective operations and maintenance of regional bulk infrastructure.
30
31
2 – Progress to date• 109 projects were started since 07/08 financial year.• 50 implementation projects have been initiated and
are in construction, design or tender phase of which 36 are in construction and 14 are in design / tender phase
• 42 feasibility / implementation ready studies are ongoing.
• 17 projects have been completed.
31
32
Projects completed2007/08•Chris Hani Tsomo RDP2 BWS •Delmas Phase 1 Emergency •Thaba Chweu BWS 2008/09•Delmas Phase 2 •Maqwassi Hills RWS
2009/10• Mbhashe North BWS • Mathulini BWS • Greater Mthonjaneni BWS
Phase 1 • Van Wyksvlei Interim
Solutions • Van Der Kloof/Petrusville
BWS • Mjejane BWS
32
33
Projects completed (continue)2010/11
• Mthatha Bulk Water Intervention • Malangeni Waste Water Treatment Plant• Greytown BWS • Mbombela Water Supply• Hoxani BWS• Kenhardt BWS
33
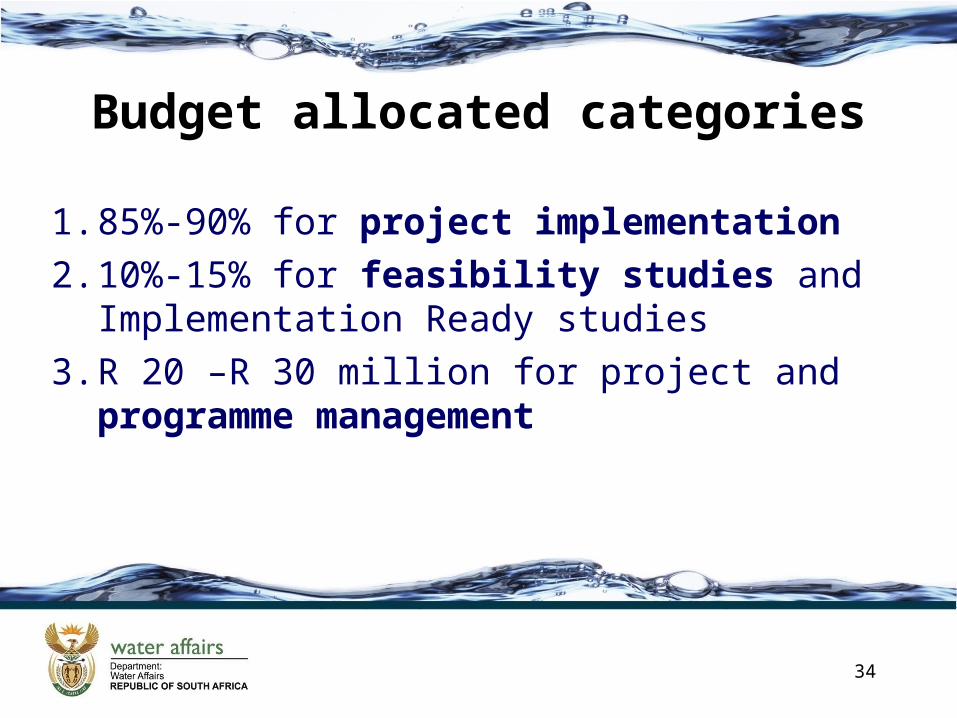
Budget allocated categories
1. 85%-90% for project implementation2. 10%-15% for feasibility studies and
Implementation Ready studies3. R 20 –R 30 million for project and
programme management
34
35
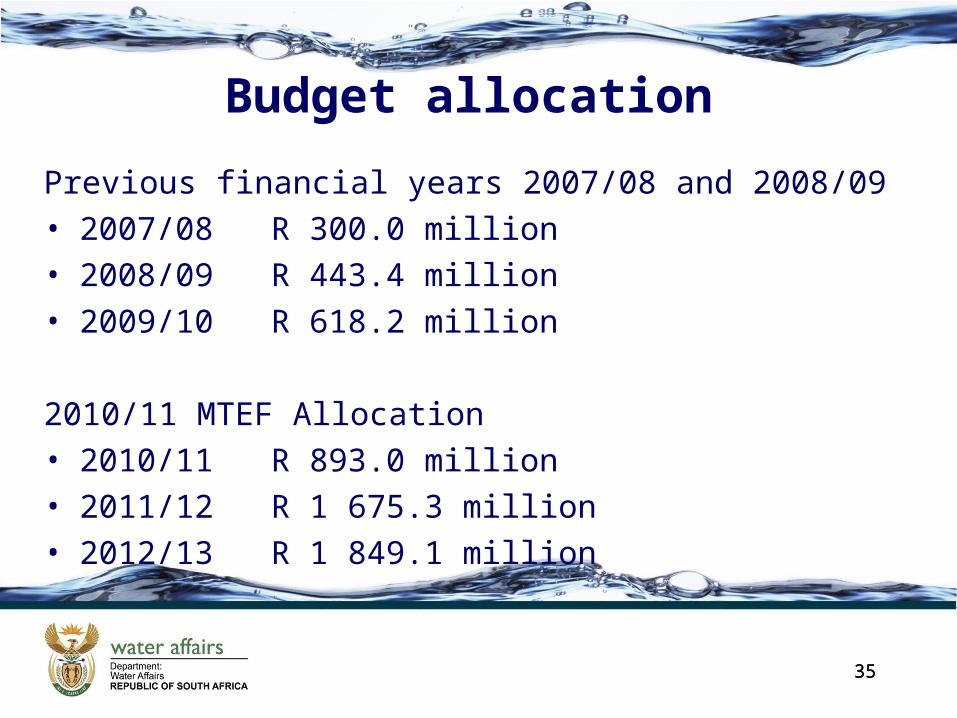
Previous financial years 2007/08 and 2008/09• 2007/08 R 300.0 million• 2008/09 R 443.4 million• 2009/10 R 618.2 million
2010/11 MTEF Allocation• 2010/11 R 893.0 million• 2011/12 R 1 675.3 million• 2012/13 R 1 849.1 million
35
Budget allocation
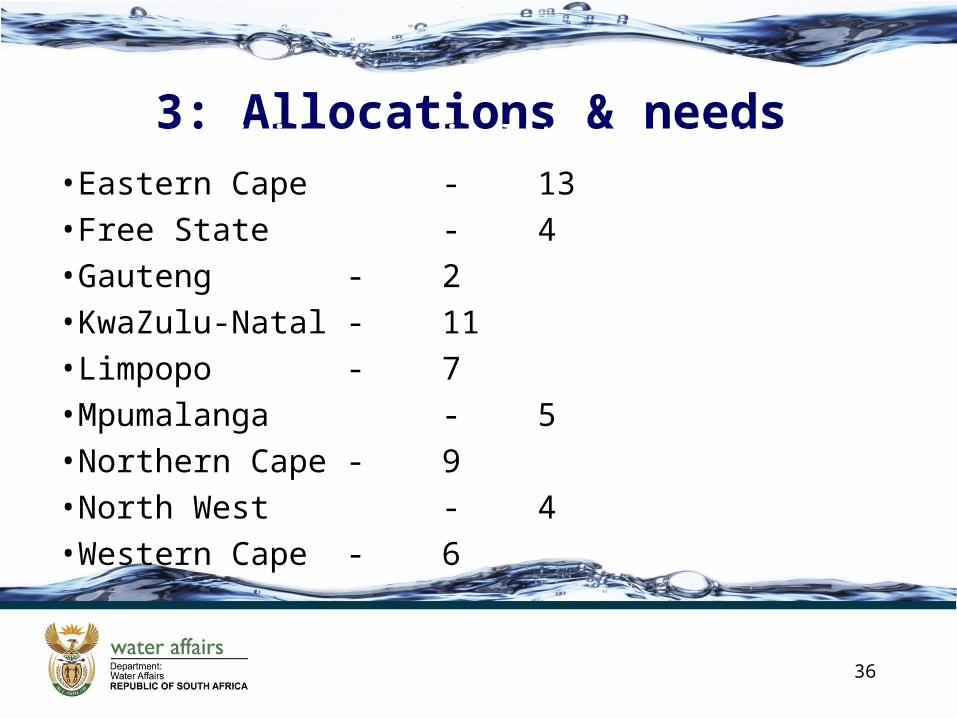
3: Allocations & needs of benefiting municipalities to date•Eastern Cape - 13•Free State - 4•Gauteng - 2•KwaZulu-Natal - 11•Limpopo - 7•Mpumalanga - 5•Northern Cape - 9•North West - 4•Western Cape - 6
36
3737
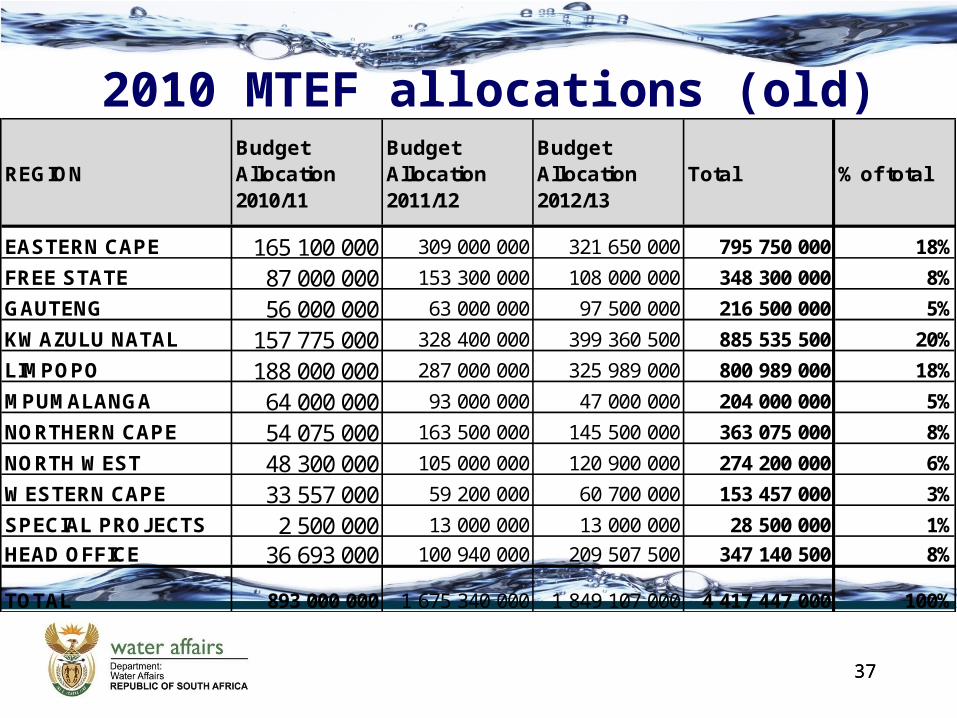
2010 MTEF allocations (old)REGION
Budget Allocation 2010/11
Budget Allocation 2011/12
Budget Allocation 2012/13
Total % of total
EASTERN CAPE 165 100 000 309 000 000 321 650 000 795 750 000 18%
FREE STATE 87 000 000 153 300 000 108 000 000 348 300 000 8%
GAUTENG 56 000 000 63 000 000 97 500 000 216 500 000 5%
KWAZULU NATAL 157 775 000 328 400 000 399 360 500 885 535 500 20%
LIMPOPO 188 000 000 287 000 000 325 989 000 800 989 000 18%
MPUMALANGA 64 000 000 93 000 000 47 000 000 204 000 000 5%
NORTHERN CAPE 54 075 000 163 500 000 145 500 000 363 075 000 8%
NORTH WEST 48 300 000 105 000 000 120 900 000 274 200 000 6%
WESTERN CAPE 33 557 000 59 200 000 60 700 000 153 457 000 3%
SPECIAL PROJECTS 2 500 000 13 000 000 13 000 000 28 500 000 1%
HEAD OFFICE 36 693 000 100 940 000 209 507 500 347 140 500 8%
TOTAL 893 000 000 1 675 340 000 1 849 107 000 4 417 447 000 100%
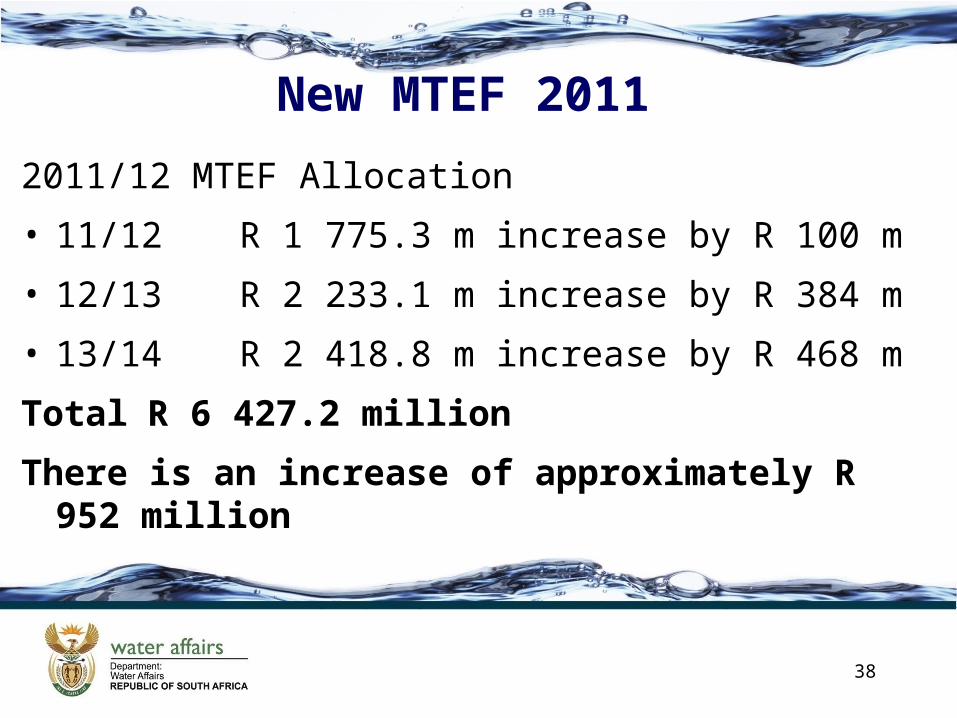
New MTEF 2011
2011/12 MTEF Allocation
• 11/12 R 1 775.3 m increase by R 100 m
• 12/13 R 2 233.1 m increase by R 384 m
• 13/14 R 2 418.8 m increase by R 468 m
Total R 6 427.2 million
There is an increase of approximately R 952 million
38

Comparison: backlog and RBIG funding
39
Housing and water scarcity
sanitation and water scarcity
Urban –metro areas given less priority
RBIG Allocation
RBIG Allocation
(2011/2014) R’000
%
337 747 12.7% 15.2%
245 752 9.2% 4.6%
437 577 16.4% 10.5%
441 153 16.5% 28.2%
501 416 18.8% 19.6%
309 587 11.6% 9.8%
256 602 9.6% 8.4%
50 882 1.9% 1.8%
85 436 3.2% 1.9%
Sanitation Below RDP HH - 2010
Water backlog as % of total 2010
Eastern Cape 145 361 17.8%
Province
Water backlog
Households below basic-
2010
1 112 650 18%
Free State 0 0.0% 493 300
20.4%
KwaZulu-Natal 325 596
8%
Gauteng 37 590 4.6% 419 500 7%
18%
Mpumalanga 65 835 8.1% 421 532
39.8% 1 251 183 20%
Limpopo 167 122
13 069
7%
North West 58 051 7.1% 568 000 9%
817 350 100.0% 6 260 854
1.6% 488 900
Western Cape 4 726 0.6%
Northern Cape
100.0%
Sanitation backlog as % of total 2010
Average backlog
Water and sanitation
2 666 152 100.0% 100.0%
376 900 6%
8%
1 128 889
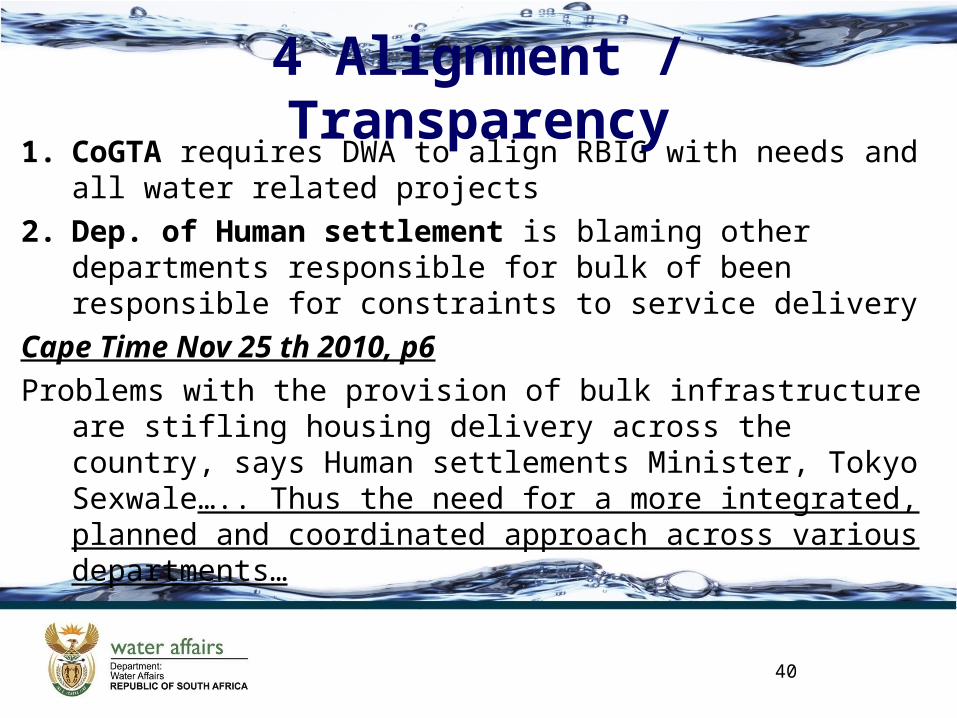
4 Alignment / Transparency1. CoGTA requires DWA to align RBIG with needs and all water related
projects2. Dep. of Human settlement is blaming other departments
responsible for bulk of been responsible for constraints to service delivery
Cape Time Nov 25 th 2010, p6Problems with the provision of bulk infrastructure are stifling housing
delivery across the country, says Human settlements Minister, Tokyo Sexwale….. Thus the need for a more integrated, planned and coordinated approach across various departments…
40
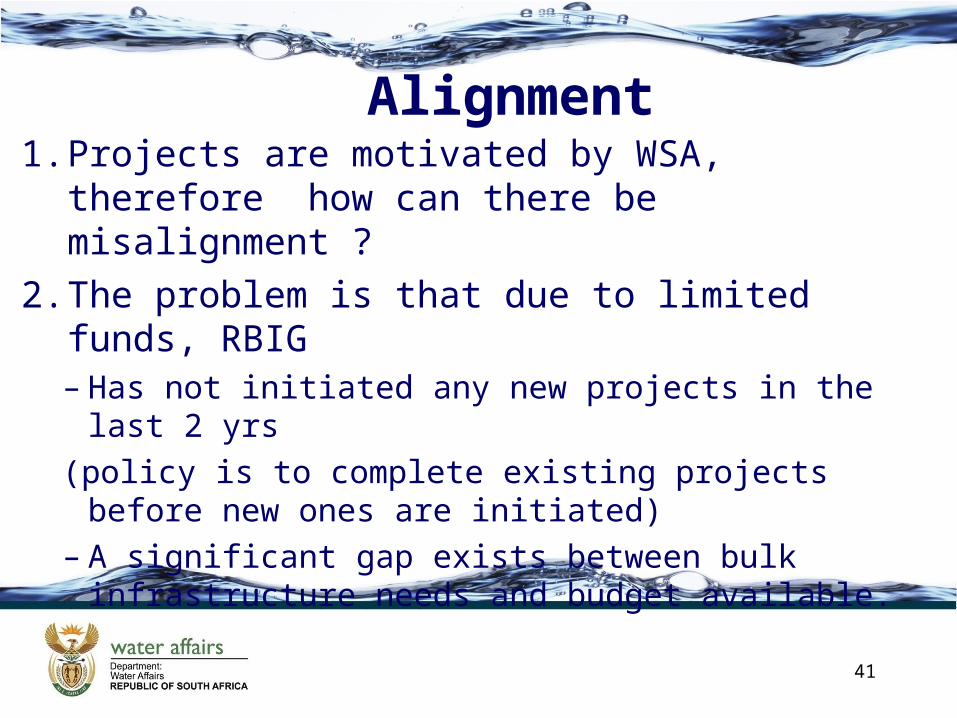
Alignment1. Projects are motivated by WSA, therefore how
can there be misalignment ?2. The problem is that due to limited funds, RBIG
– Has not initiated any new projects in the last 2 yrs(policy is to complete existing projects before new ones
are initiated)– A significant gap exists between bulk infrastructure
needs and budget available.
41
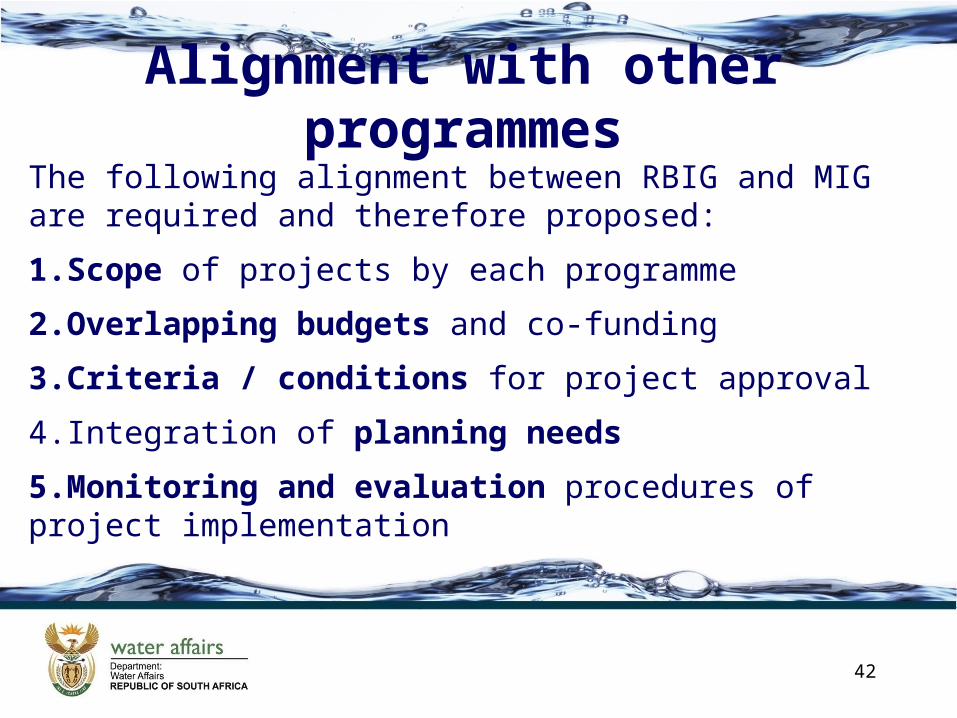
Alignment with other programmesThe following alignment between RBIG and MIG are required and therefore proposed:
1.Scope of projects by each programme
2.Overlapping budgets and co-funding
3.Criteria / conditions for project approval
4.Integration of planning needs
5.Monitoring and evaluation procedures of project implementation
42
Successes1. The programme was expanded from a 3 year term to a long term
programme
2. The programme has expanded from R 300 million / annum in 2007/08 to R 2 418 million / annum in 2013/14
3. A consolidated list of all bulk needs / projects has been developed and is been updated through 9 Regional bulk Master plans.
4. New innovative projects implemented (i.e desalination and Waste Water recycling)
5. Significant amount of new jobs created (6017 jobs).
6. Inter –governmental co-operation (particularly WC, & FS)
43
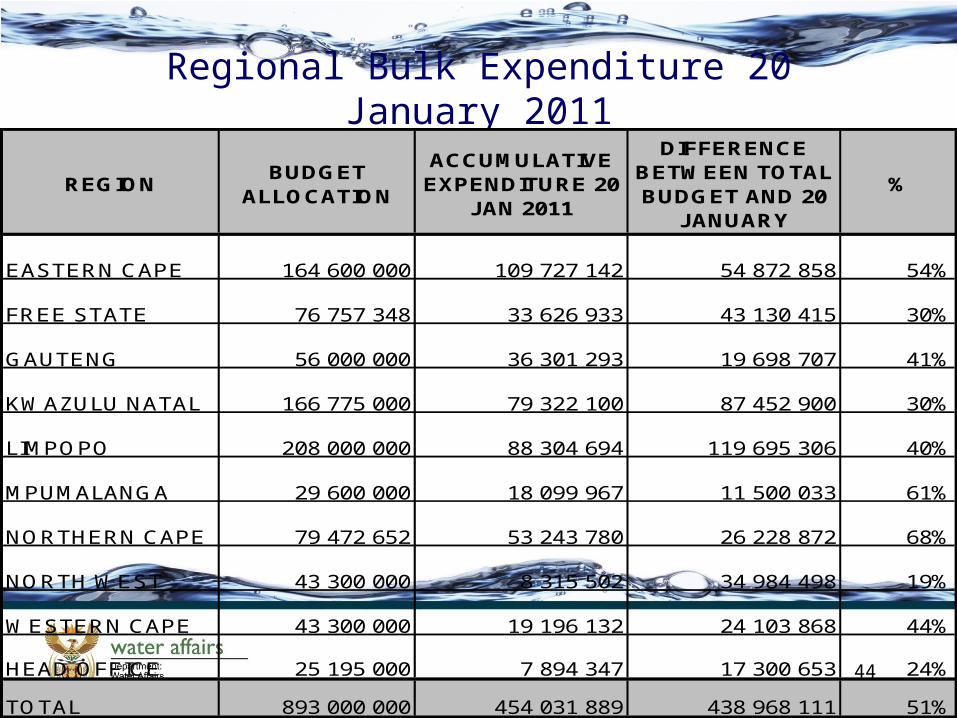
Regional Bulk Expenditure 20 January 2011
44
REGIONBUDGET
ALLOCATION
ACCUMULATIVE EXPENDITURE 20
JAN 2011
DIFFERENCE BETWEEN TOTAL BUDGET AND 20
JANUARY
%
EASTERN CAPE 164 600 000 109 727 142 54 872 858 54%
FREE STATE 76 757 348 33 626 933 43 130 415 30%
GAUTENG 56 000 000 36 301 293 19 698 707 41%
KWAZULU NATAL 166 775 000 79 322 100 87 452 900 30%
LIMPOPO 208 000 000 88 304 694 119 695 306 40%
MPUMALANGA 29 600 000 18 099 967 11 500 033 61%
NORTHERN CAPE 79 472 652 53 243 780 26 228 872 68%
NORTH WEST 43 300 000 8 315 502 34 984 498 19%
WESTERN CAPE 43 300 000 19 196 132 24 103 868 44%
HEAD OFFICE 25 195 000 7 894 347 17 300 653 24%
TOTAL 893 000 000 454 031 889 438 968 111 51%
45
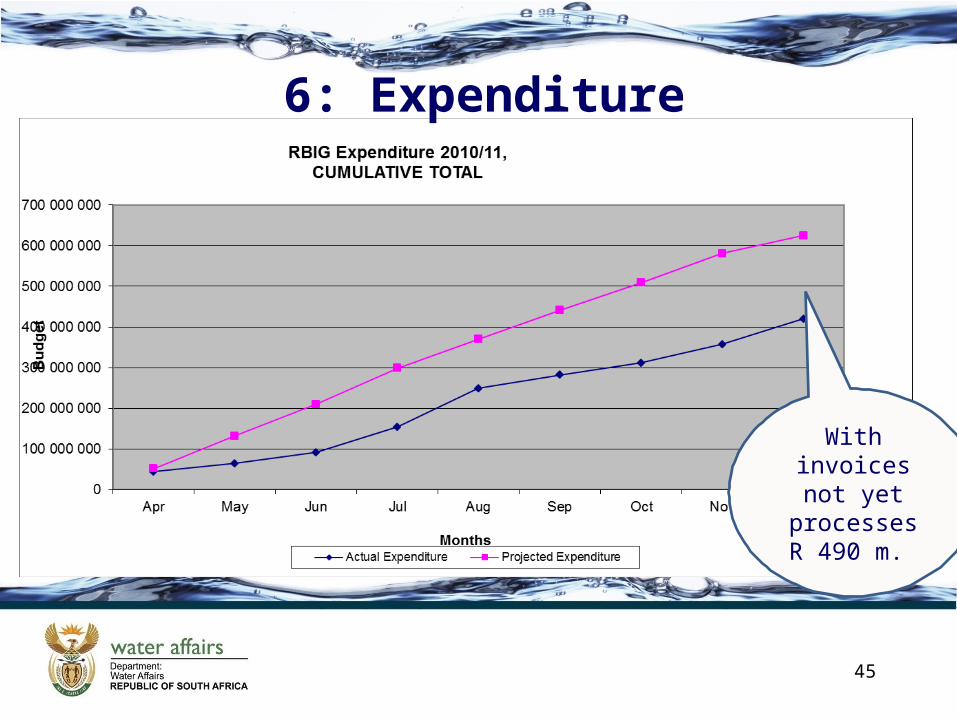
With invoices not yet
processes R 490 m.
6: Expenditure
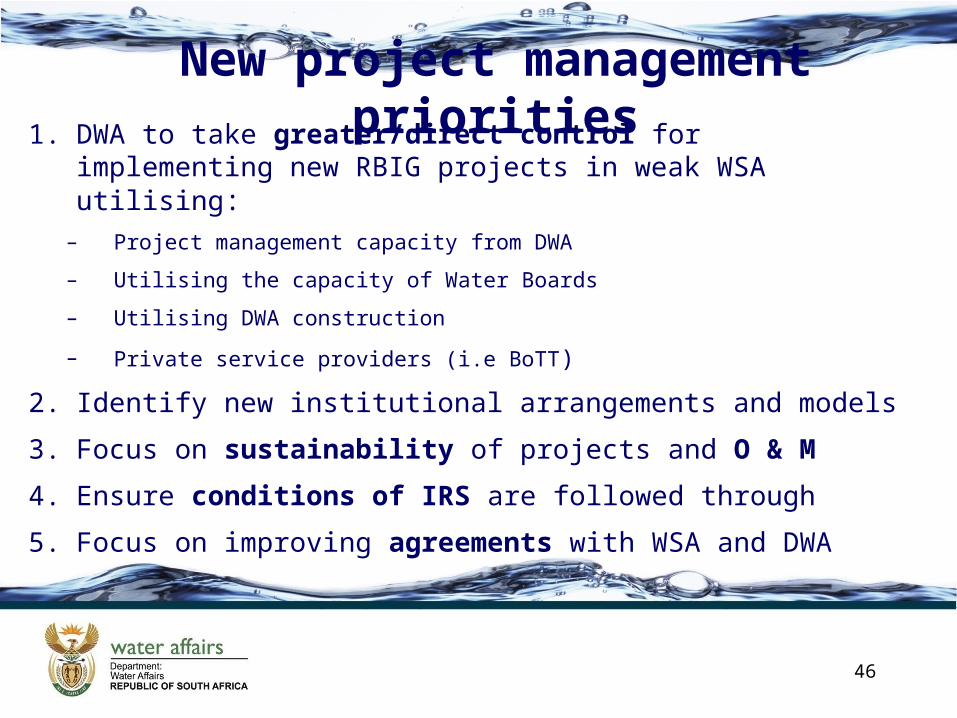
New project management priorities1. DWA to take greater/direct control for implementing new RBIG
projects in weak WSA utilising:– Project management capacity from DWA
– Utilising the capacity of Water Boards
– Utilising DWA construction
– Private service providers (i.e BoTT)
2. Identify new institutional arrangements and models
3. Focus on sustainability of projects and O & M
4. Ensure conditions of IRS are followed through
5. Focus on improving agreements with WSA and DWA
46
Conclusion• Most RBIG projects are large projects that require,
appropriate water sector expertise for planning and implementation, they should not be entrusted to officials and institutions with limited expertise and capacity
• Although expenditure is slow , most funds will be utilised by the end of the financial year
• RBIG has been successful but not without problems
47
48
THANK YOU