state planning strategy 2050 - western australian …€¦ · state planning strategy partners ......
TRANSCRIPT

‘The decisions we make today, shape our tomorrow’
This document seeks to build strategic planning capacity and capability across government, enabling the State to better anticipate and adapt to change in pursuit of sustained growth.
Turn overleaf
State Planning Strategy Partners
Department of Aboriginal AffairsDepartment of Agriculture and FoodDepartment of the Attorney GeneralDepartment of CommerceDepartment of Corrective ServicesDepartment of Culture and the ArtsDepartment of EducationDepartment of Education ServicesDepartment of Environment RegulationDepartment of FinanceDepartment of FisheriesDepartment of HealthDepartment of HousingDepartment of LandsDepartment of Local Government and CommunitiesDepartment of Mines and PetroleumDepartment of Parks and WildlifeDepartment of PlanningDepartment of the Premier and CabinetDepartment of Regional DevelopmentDepartment of Sport and RecreationDepartment of State DevelopmentDepartment of Training and Workforce DevelopmentDepartment of TransportDepartment of TreasuryDepartment of WaterDisability Services CommissionEnvironmental Protection AuthorityHeritage Council of Western AustraliaLandCorpLandgateThe National Trust of Australia (Western Australia)Regional Development Commissions Tourism Western Australia Water Corporation
Cover image: Mudflats, Derby, Western Australia
State PlanningStrategy2050 Planning for sustained growth and prosperity

Migrati on
Minerals
Agriculture
Historical ti meline
1860-20
-10
0
10
20
30
40
50
1896
Coolgardie and Kalgoorlie 1890s Gold rush White Australia Policy
Annu
al n
et m
igra
tion
to W
A (p
erso
ns ‘0
00)
Western AustraliaAustralia
1945 firstMigration program
1956-1965Modern migration
program starts
1916 1941 1950 1959 1968 1978 1988 2008/11-200
-100
0
100
200
300
Net
mig
ratio
n to
Aus
tral
ia (P
erso
ns ‘0
00)
Relatively higher level of migrationRelatively lower level of migration
Global Financial Crisis
Recycled water DesalinationSurface water Ground water
Existi
ng
wat
er re
sour
ces
Proj
ecte
d w
ater
dem
and
Wat
er so
urce
dive
rsity
Euro
pean
Non
Eur
opea
n
|1850 - First convicts arrive on the Scindian
|1851 - Pearling industry starts operation in Shark Bay
|1868 - Transportation of convicts from England ends with the arrival of the Hougoumont
|1879 - First Government railway in the State constructed from Geraldton to Northampton
|1885 - First discovery of gold at Halls Creek triggers gold rush in WA
|1953 - Second Planning Commissioner, John A Hepburn
|1901 - WA becomes part of the Commonwealth of Australia
|1911 - University of Western Australia established
|1914 - WW1 begins
|1914 - First Australian made aeroplane flies at Coolgardie |1985 - State Planning Commission Act gazetted
|1918 - WW1 ends
|1930 - Perth is connected to Adelaide via a telephone line
|1934 - Goldfields riots
|1928 - Town Planning and Development Act gazetted
|1929 - Inaugural Town Planning Board, first Planning Commissioner, David L Davidson
|1990 - Dr.Carmen Lawrence, becomes WA’s first woman premier
|1947 - Florence Cardell-Oliver becomes the first female cabinet member of an Australian Parliament
|1939 - WW2 begins
|1945 - WW2 ends
|1942 - Japanese planes attack Broome. Official death toll 88|1942 - 1945 - Japanese occupation of Christmas Island
|1946 - Pilbara Strike
|1970 - Minerals boom begins/economy bolstered by iron ore mines in the Pilbara and nickel mines around Kalgoorlie
|1967 - Indian Pacific train completes first journey by rail from Sydney to Perth
|1963 - Metropolitan Region Scheme commences operation
|1967 - Aboriginal people given the vote |2012 - Australia’s carbon price legislation in effect
|1984 - Advance Australia Fair proclaimed as Australia's national anthem
|1990 - Paul Keating announces Australia is experiencing an economic recession
|2008 - Prime Minister's apology to the Stolen Generations
|1889 - John Forrest becomes first Premier
|1892 - Married women gain the right to own property
|1895 - Kings Park officially opened
|1899 - Perth Mint established to profit from Australia's richest goldfield at Kalgoorlie
|1898 - First motorcar arrives in Perth
|1898 - Perth Zoo opens
|1889 - Great Southern Railway opened
|1899 - Women given the vote|1826 - The establishment of a British military outpost in Albany
|1829 - The establishment of the Swan River Colony
|1979 - Women win the right to maternity leave
|2009 - Royalties for Regions Act
|1959 - Metropolitan Region Scheme Act gazetted
|1921 - Edith Cowan first woman to be elected to any Australian Parliament
1850-1899Characterised by the development of the Swan River Colony, along with essenti al infrastructure including water supply, telegraph, harbours, rail and roads. It was marked by the establishment of responsible government, preparati on to join the Australian Commonwealth and a focus on building infrastructure between Perth and the Goldfi elds due to the gold rush of the 1890s.
1900-1949 Due largely to the gold rush, a period of rapid economic and populati on growth. It was also a period impacted by two world wars, and a Great Depression, leading to signifi cant diffi culti es. Clearing and sett lement of the Wheatbelt was a major focus, as was the development of rail, road and sea export faciliti es to move commoditi es.
1950-1999 Characterised by the post war baby boom and the development of the Pilbara’s rich mineral, oil and gas reserves. Gas was delivered to the south west of the State via a pipeline from the north, and there was signifi cant investment in major industrial faciliti es and social infrastructure. It also heralded the home computer, the internet, the digital revoluti on and low cost air travel.
2000-2050 Began with a strong demand for raw materials, which is likely to conti nue well into the future. The earlier part of the period was characterised by the global economic crisis and growing concern about climate change. This period is likely to be characterised by growing diversity, the development of renewable energy, evoluti on of digital economy, an ageing populati on, globalisati on and an orientati on towards sustainable living.
WHERE WE HAVE BEEN.
WHAT WILL BE OUR LEGACY?
Prod
ucti v
e ag
ricul
ture
land
Food
pro
duct
dive
rsifi
cati o
n
Land
and
wat
er ch
alle
nges
30,000,000
35,000,000
40,000,000 Sheep (numbers)
Wheat (tonnes)
Meat cattle (numbers)
5,000,000
10,000,000
15,000,000
20,000,000
25,000,000
Maps
Water sources
Emerging trends
Movement
Rail
Shipping
Air
Horses/Camels 1899
1870s Steam locomotive 1980s Electrified rail Light rail / High speed rail
Motor Vehicles
1901 First car registered in WA
Alternative and bio fuels
Alternative fuels
Electric and alternative fuel
1921 First airmail service 1960s Public domestic jet travel
Trams 1958
1917 Trans-Australiam RailwayCong
esti o
n
Popu
lati o
n m
obilit
y
Glob
al su
pply
chai
ns
Infra
stru
ctur
e ne
twor
ks
Info
rmati
on
Com
mun
icati o
ns
Tech
nolo
gy
Populati on
▼
◆
✖
◆
Population projections
High assumptions
Current trendsLow assumptions
▼✖
◆▼✖
◆▼✖
◆▼✖
▼◆
✖
▼
◆
✖
1 million
2 million
3 million
4 million
5 million
Gol
d ru
sh
Wor
ld W
ar II
Iron
ore
boo
m
5.4m
4.3m
3.5m
Sandalwood Whale products Livestock Other Wool Timber Other minerals Wheat Gold Food stuff (excluding wheat) Ores and metals Confidential items*(Includes Aluimina) Liquefied natural gas Petroleum products Other ores & metals Iron ore
TRADE PARTNERSUnited Kingdom
ItalyFranceEgyptIndia
TRADE PARTNERSUnited Kingdom
USAChinaJapan
TRADE PARTNERSAsia and
Indian Ocean Rim countries
Graph to 2010 only.
TRADE PARTNERSUnited Kingdom
Renewables
Fuel oil
Wood and coal
Liquefied natural gas
Man
ufac
turin
g
Wor
kfor
ce p
arti c
ipati
on
Ener
gy a
ff ord
abili
ty
Glob
alisa
ti on
Inve
stm
ent i
n re
new
able
ene
rgy
Esti m
ated
labo
ur fo
rce
Ener
gy so
urce
dive
rsity
Expo
rt va
lue
1840 Town cott age
1900 Post gold rush
1912 Terra-cott a and oiled jarrah
1920 Californian bungalow
1950 Moderate art deco
1960 Low-pitch roof and open planning
2000 Modern house
2050 Mixed use
Hous
ing
mix
and
stoc
k
Popu
lati o
n ag
e
Urba
nisa
ti on
Hous
ing
aff o
rdab
ility
Aver
age
lot s
ize
Major commoditi es
Housing
Urban Form
Energy
Wat
er a
nd e
nerg
y effi
cienc
y
Lot d
ivers
ity
Sola
r orie
ntati
ons
and
layo
ut
Perm
eabi
lity o
f mov
emen
t
Com
pact
sett l
emen
t stru
ctur
es
Site
resp
onsiv
e
Tran
spor
t int
egra
ti on
Regi
onal
cent
res
Movement
Rail
Shipping
Air
Horses/Camels 1899
1870s Steam locomotive
1980s Electrified rail Light rail / High speed rail
Motor Vehicles
1901 First car registered in WA
Alternative & bio fuels
Alternative fuels
Electric and alternative fuel
1921 First airmail service 1960s Public domestic jet travel
Trams 1958
1917 Trans-Australian Railway
Popu
latio
n m
obili
ty
Con
gest
ion
15
10
5
GO
LD
IRO
N O
RE
ALU
MIN
AM
illio
n to
nnes
200
150
100
50
NIC
KEL
Thou
sand
tonn
es
27
18
9
CRU
DE
OIL
Gig
alitr
es
1890 1900 1910 1920 1930 1940 1950 1960 1970 1980 1990 2000 2010
250
200
150
100
50
0
Tonn
es
400
300
200
100
Mill
ion
tonn
es
8,000
6,000
4,000
2,000
A$ Million
0‘02-03 ‘03-04 ’04-05’05-06 ‘06-07 ’07-08 ‘08-09 ’09-10 ‘10-11 ’11-12 ‘12-13 Source: DMP
10,000
Value
OtherNickelGoldIron OrePetroleumAlumina
Production
Western Australia 1850 – 2050
1850
1860
1910
1870
1920
1880
1930
1890
194019
00
1950
2000
2050
1960
2010
1970
2020
1980
2030
1990
2040

Mig
rati o
n
Min
eral
s
Agric
ultu
re
Hist
oric
al ti
mel
ine
1860
-20
-1001020304050
1896
Cool
gard
ie a
nd K
algo
orlie
18
90s
Gold
rush
Whi
te A
ustr
alia
Pol
icy
Annual net migration to WA (persons ‘000)
Wes
tern
Aus
tral
iaAu
stra
lia19
45 fi
rst
Mig
ratio
n pr
ogra
m
1956
-196
5M
oder
n m
igra
tion
prog
ram
sta
rts
1916
1941
1950
1959
1968
1978
1988
2008
/11
-200
-100
0100
200
300
Net migration to Australia (Persons ‘000)
Rel
ative
ly h
ighe
r le
vel o
f mig
ratio
nR
elat
ively
low
er
leve
l of m
igra
tion
Glob
al F
inan
cial
Cris
is
Rec
ycle
d w
ater
Des
alin
atio
nSu
rfac
e w
ater
Grou
nd w
ater
Existi ng water resources
Projected water demand
Water source diversity
European
Non European |1850
- Fi
rst c
onvi
cts
arriv
e on
the
Scin
dian
|1851
- Pe
arlin
g in
dust
ry s
tart
s op
erat
ion
in S
hark
Bay
|1868
- Tr
ansp
orta
tion
of c
onvi
cts
from
Eng
land
end
s w
ith th
e ar
rival
of t
he H
ougo
umon
t
|1879
- Fi
rst G
over
nmen
t rai
lway
in th
e St
ate
cons
truc
ted
from
Ger
aldt
on to
Nor
tham
pton
|1885
- Fi
rst d
isco
very
of g
old
at H
alls
Cre
ek tr
igge
rs g
old
rush
in W
A
|1953
- Se
cond
Pla
nnin
g Co
mm
issi
oner
, Joh
n A
Hep
burn
|1901
- W
A be
com
es p
art o
f the
Com
mon
wea
lth o
f Aus
tral
ia
|1911
- U
nive
rsity
of W
este
rn A
ustr
alia
est
ablis
hed
|1914
- W
W1
begi
ns
|1914
- Fi
rst A
ustr
alia
n m
ade
aero
plan
e fli
es a
t Coo
lgar
die
|1985
- St
ate
Plan
ning
Com
mis
sion
Act
gaz
ette
d
|1918
- W
W1
ends
|1930
- Pe
rth
is c
onne
cted
to A
dela
ide
via
a te
leph
one
line
|1934
- G
oldf
ield
s rio
ts
|1928
- To
wn
Plan
ning
and
Dev
elop
men
t Act
gaz
ette
d
|1929
- In
augu
ral T
own
Plan
ning
Boa
rd, f
irst P
lann
ing
Com
mis
sion
er, D
avid
L D
avid
son
|1990
- D
r.Ca
rmen
Law
renc
e, b
ecom
es
W
A’s
first
wom
an p
rem
ier
|1947
- Fl
oren
ce C
arde
ll-O
liver
bec
omes
the
first
fem
ale
cabi
net m
embe
r of a
n Au
stra
lian
Parl
iam
ent
|1939
- W
W2
begi
ns
|1945
- W
W2
ends
|1942
- Ja
pane
se p
lane
s at
tack
Bro
ome.
Offi
cial
dea
th to
ll 88
|1942
- 19
45 -
Japa
nese
occ
upat
ion
of C
hris
tmas
Isla
nd
|1946
- Pi
lbar
a St
rike
|1970
- M
iner
als
boom
beg
ins/
econ
omy
bols
tere
d by
iron
ore
min
es
in
the
Pilb
ara
and
nick
el m
ines
aro
und
Kal
goor
lie
|1967
- In
dian
Pac
ific
trai
n co
mpl
etes
firs
t jou
rney
by
rail
from
Syd
ney
to P
erth
|1963
- M
etro
polit
an R
egio
n Sc
hem
e co
mm
ence
s op
erat
ion
|1967
- Ab
orig
inal
peo
ple
give
n th
e vo
te|20
12 -
Aust
ralia
’s c
arbo
n pr
ice
le
gisl
atio
n in
effe
ct
|1984
- Ad
vanc
e Au
stra
lia F
air p
rocl
aim
ed
as
Aust
ralia
's n
atio
nal a
nthe
m
|1990
- Pa
ul K
eatin
g an
noun
ces
Aust
ralia
is
ex
perie
ncin
g an
eco
nom
ic re
cess
ion
|2008
- Pr
ime
Min
iste
r's a
polo
gy
to
the
Stol
en G
ener
atio
ns
|1889
- Jo
hn F
orre
st b
ecom
es fi
rst P
rem
ier
|1892
- M
arrie
d w
omen
gai
n th
e rig
ht to
ow
n pr
oper
ty
|1895
- K
ings
Par
k of
ficia
lly o
pene
d
|1899
- Pe
rth
Min
t est
ablis
hed
to p
rofit
from
Aus
tral
ia's
rich
est g
oldf
ield
at K
algo
orlie
|1898
- Fi
rst m
otor
car a
rriv
es in
Per
th
|1898
- Pe
rth
Zoo
open
s
|1889
- G
reat
Sou
ther
n
Rai
lway
ope
ned
|1899
- W
omen
giv
en th
e vo
te|18
26 -
The
esta
blis
hmen
t of a
Brit
ish
mili
tary
out
post
in A
lban
y
|1829
- Th
e es
tabl
ishm
ent o
f the
Sw
an R
iver
Col
ony
|1979
- W
omen
win
the
right
to m
ater
nity
leav
e
|2009
- R
oyal
ties
for R
egio
ns A
ct
|1959
- M
etro
polit
an R
egio
n Sc
hem
e Ac
t gaz
ette
d
|1921
- Ed
ith C
owan
firs
t wom
an to
be
elec
ted
to a
ny A
ustr
alia
n Pa
rlia
men
t
1850
-189
9Ch
arac
teris
ed b
y the
dev
elop
men
t of t
he Sw
an R
iver C
olon
y, al
ong
with
ess
enti a
l infra
stru
ctur
e in
cludi
ng w
ater
supp
ly,
tele
grap
h, h
arbo
urs,
rail a
nd ro
ads.
It w
as m
arke
d by
the
esta
blish
men
t of r
espo
nsib
le go
vern
men
t, pr
epar
ati o
n to
jo
in th
e Au
stra
lian
Com
mon
wea
lth a
nd a
focu
s on
build
ing
infra
stru
ctur
e be
twee
n Pe
rth a
nd th
e Go
ldfi e
lds d
ue to
the
gold
rush
of t
he 1
890s
.
1900
-194
9 Du
e lar
gely
to th
e go
ld ru
sh, a
per
iod
of ra
pid
econ
omic
and
popu
lati o
n gr
owth
. It w
as al
so a
perio
d im
pact
ed b
y tw
o w
orld
w
ars,
and
a Gre
at D
epre
ssio
n, le
adin
g to
signi
fi can
t diffi
cul
ti es.
Clea
ring a
nd se
tt lem
ent o
f the
Whe
atbe
lt w
as a
maj
or fo
cus,
as w
as th
e de
velo
pmen
t of r
ail, r
oad
and
sea e
xpor
t fac
iliti e
s to
mov
e co
mm
oditi
es.
1950
-199
9
Char
acte
rised
by t
he p
ost w
ar b
aby b
oom
and
the
deve
lopm
ent o
f the
Pilb
ara’s
rich
min
eral,
oil a
nd ga
s res
erve
s. Ga
s was
del
ivere
d to
the
sout
h w
est o
f the
Stat
e via
a pi
pelin
e fro
m th
e no
rth, a
nd th
ere
was
sign
ifi ca
nt in
vestm
ent i
n m
ajor
indu
strial
facil
iti es
and
socia
l infra
struc
ture
. It al
so h
erald
ed th
e ho
me
com
pute
r, the
inte
rnet
, the
digi
tal r
evol
uti o
n an
d lo
w
cost
air tr
avel
.
2000
-205
0
Bega
n w
ith a
stro
ng d
eman
d fo
r raw
mat
erial
s, w
hich
is
likel
y to
conti
nue
wel
l into
the
futu
re. T
he e
arlie
r par
t of t
he
perio
d w
as ch
arac
teris
ed b
y the
glob
al ec
onom
ic cr
isis a
nd
grow
ing c
once
rn ab
out c
limat
e ch
ange
. Thi
s per
iod
is lik
ely
to b
e ch
arac
teris
ed b
y gro
win
g dive
rsity
, the
dev
elop
men
t of
rene
wab
le e
nerg
y, ev
oluti
on
of d
igita
l eco
nom
y, an
ag
eing
pop
ulati
on,
glob
alisa
ti on
and
an o
rient
ati o
n to
war
ds
susta
inab
le liv
ing.
WHE
RE W
E HA
VE B
EEN
.W
HAT
WIL
L BE
OU
R LE
GACY
?
Producti ve agriculture land
Food product diversifi cati on
Land and water challenges
30,0
00,0
00
35,0
00,0
00
40,0
00,0
00Sh
eep
(num
bers
)
Whe
at (t
onne
s)
Mea
t cat
tle
(num
bers
)
5,00
0,00
0
10,0
00,0
00
15,0
00,0
00
20,0
00,0
00
25,0
00,0
00
Map
s
Wat
er so
urce
s
Emer
ging
tren
ds
Mov
emen
t
Rail
Ship
ping
Air
Hors
es/C
amel
s18
99
1870
s Ste
am
loco
moti
ve19
80s E
lect
rified
rail
Ligh
t rai
l / H
igh
spee
d ra
il
Mot
or V
ehic
les
1901
Firs
t car
regi
ster
ed in
WA
Alte
rnati
ve a
nd b
io fu
els
Alte
rnati
ve fu
els
Elec
tric
and
alte
rnati
ve fu
el
1921
Firs
t airm
ail s
ervi
ce19
60s P
ublic
dom
estic
jet t
rave
l
Tram
s19
58
1917
Tra
ns-A
ustr
alia
m R
ailw
ay
Congesti on
Populati on mobility
Global supply chains
Infrastructure networks
Informati on Communicati ons Technology
Popu
lati o
n
▼◆ ✖
◆
Pop
ulat
ion
proj
ecti
ons
Hig
h as
sum
ptio
ns
Cur
rent
tren
dsLo
w a
ssum
ptio
ns
▼ ✖
◆ ▼ ✖
◆ ▼ ✖
◆ ▼ ✖
▼◆ ✖
▼◆ ✖
1 m
illio
n
2 m
illio
n
3 m
illio
n
4 m
illio
n
5 m
illio
n
Gold rush
World War II
Iron ore boom
5.4m
4.3m
3.5m
Sand
alw
ood
Wha
le p
rodu
cts
Live
stoc
kO
ther
Woo
lTi
mbe
rO
ther
min
eral
sW
heat
Gol
d Fo
od s
tuff
(exc
ludi
ng w
heat
)O
res
and
met
als
Conf
iden
tial i
tem
s*(In
clud
es A
luim
ina)
Liqu
efie
d na
tura
l gas
Petr
oleu
m p
rodu
cts
Othe
r ore
s &
met
als
Iron
ore
TRA
DE
PAR
TNER
SU
nite
d K
ingd
omIt
aly
Fran
ceEg
ypt
Indi
a
TRA
DE
PAR
TNER
SU
nite
d K
ingd
omU
SAC
hina
Japa
n
TRA
DE
PAR
TNER
SA
sia
and
Indi
an O
cean
Rim
cou
ntrie
s
Gra
ph to
20
10 o
nly.
TRA
DE
PAR
TNER
SU
nite
d K
ingd
om
Ren
ewab
les
Fuel
oil
Woo
d an
d co
al
Liqu
efie
d na
tura
l gas
Manufacturing
Workforce parti cipati on Energy aff ordability
Globalisati on Investment in renewable energy
Esti mated labour force Energy source diversity
Export value
1840
Tow
n co
tt age
1900
Post
gol
d ru
sh1912
Terr
a-co
tt a a
nd o
iled
jarr
ah
1920
Cal
iforn
ian
bung
alow
1950
Mod
erat
e ar
t dec
o
1960
Low
-pitc
h ro
of a
nd o
pen
plan
ning2000
Mod
ern
hous
e
2050
Mix
ed u
se
Housing mix and stock
Populati on age
Urbanisati on
Housing aff ordability
Average lot sizeMaj
or c
omm
oditi
es
Hous
ing
Urb
an F
orm
Ener
gy
Water and energy effi ciency
Lot diversity
Solar orientati ons and layout
Permeability of movement
Compact sett lement structures
Site responsive
Transport integrati on
Regional centres
Mov
emen
t
Rai
l
Ship
ping
Air
Hor
ses/
Cam
els
1899
1870
s St
eam
lo
com
otiv
e19
80s
Elec
trifi
ed r
ail
Ligh
t rai
l / H
igh
spee
d ra
il
Mot
or V
ehic
les
1901
Fir
st c
ar r
egis
tere
d in
WA
Alt
erna
tive
& b
io fu
els
Alt
erna
tive
fuel
s
Elec
tric
and
alt
erna
tive
fuel
1921
Fir
st a
irm
ail s
ervi
ce19
60s
Pub
lic d
omes
tic je
t tra
vel
Tram
s19
58
1917
Tra
ns-A
ustr
alia
n R
ailw
ay
Population mobility
Congestion
15 10 5
GOLD
IRON ORE
ALUMINAMillion tonnes
200
150
100
50
NICKELThousand tonnes
27 18 9
CRUDE OILGigalitres
1890
1
900
1
910
192
0
1930
1940
195
0
19
60
1
970
1980
199
0
20
00
2
010
250
200
150
100
50
0
Tonnes
400
300
200
100
Million tonnes
8,000
6,00
0
4,00
0
2,00
0
A$ M
illio
n
0‘0
2-03
‘03-
04 ’0
4-05
’05-
06 ‘0
6-07
’07-
08 ‘0
8-09
’09-
10 ‘1
0-11
’11-
12 ‘1
2-13
S
ourc
e: D
MP
10,0
00
Valu
e
Othe
rNi
ckel
Gold
Iron
Ore
Petro
leum
Alum
ina
Prod
uctio
n
Wes
tern
Aus
tral
ia 1
850
– 20
50
18501860
1910
1870
1920
1880
1930
1890
1940
1900
1950
2000
2050
1960
2010
1970
2020
1980
2030
1990
2040

Migration
Minerals
Agriculture
Historical timeline
1860-20
-10
0
10
20
30
40
50
1896
Coolgardie and Kalgoorlie 1890s Gold rush White Australia Policy
Annu
al n
et m
igra
tion
to W
A (p
erso
ns ‘0
00)
Western AustraliaAustralia
1945 firstMigration program
1956-1965Modern migration
program starts
1916 1941 1950 1959 1968 1978 1988 2008/11-200
-100
0
100
200
300
Net
mig
ratio
n to
Aus
tral
ia (P
erso
ns ‘0
00)
Relatively higher level of migrationRelatively lower level of migration
Global Financial Crisis
Euro
pean
Non
Eur
opea
n
1850
1875
1825
1900
1925
1950
1975
2000
2025
2050
|1850 - First convicts arrive on the Scindian
|1851 - Pearling industry starts operation in Shark Bay
|1868 - Transportation of convicts from England ends with the arrival of the Hougoumont
|1879 - First Government railway in the State constructed from Geraldton to Northampton
|1885 - First discovery of gold at Halls Creek triggers gold rush in WA
|1953 - Second Planning Commissioner, John A Hepburn
|1901 - WA becomes part of the Commonwealth of Australia
|1911 - University of Western Australia established
|1914 - WW1 begins
|1914 - First Australian made aeroplane flies at Coolgardie |1985 - State Planning Commission Act gazetted
|1918 - WW1 ends
|1930 - Perth is connected to Adelaide via a telephone line
|1934 - Goldfields riots
|1928 - Town Planning and Development Act gazetted
|1929 - Inaugural Town Planning Board, first Planning Commissioner, David L Davidson
|1990 - Dr.Carmen Lawrence, becomes WA’s first woman premier
|1947 - Florence Cardell-Oliver becomes the first female cabinet member of an Australian Parliament
|1939 - WW2 begins
|1945 - WW2 ends
|1942 - Japanese planes attack Broome. Official death toll 88|1942 - 1945 - Japanese occupation of Christmas Island
|1946 - Pilbara Strike
|1970 - Minerals boom begins/economy bolstered by iron ore mines in the Pilbara and nickel mines around Kalgoorlie
|1967 - Indian Pacific train completes first journey by rail from Sydney to Perth
|1963 - Metropolitan Region Scheme commences operation
|1967 - Aboriginal people given the vote |2012 - Australia’s carbon price legislation in effect
|1984 - Advance Australia Fair proclaimed as Australia's national anthem
|1990 - Paul Keating announces Australia is experiencing an economic recession
|2008 - Prime Minister's apology to the Stolen Generations
|1889 - John Forrest becomes first Premier
|1892 - Married women gain the right to own property
|1895 - Kings Park officially opened
|1899 - Perth Mint established to profit from Australia's richest goldfield at Kalgoorlie
|1898 - First motorcar arrives in Perth
|1898 - Perth Zoo opens
|1889 - Great Southern Railway opened
|1899 - Women given the vote|1826 - The establishment of a British military outpost in Albany
|1829 - The establishment of the Swan River Colony
|1979 - Women win the right to maternity leave
|2009 - Royalties for Regions Act
|1959 - Metropolitan Region Scheme Act gazetted
|1921 - Edith Cowan first woman to be elected to any Australian Parliament
Prod
uctiv
e ag
ricul
ture
land
Food
pro
duct
dive
rsifi
catio
n
Land
and
wat
er ch
alle
nges
30,000,000
35,000,000
40,000,000 Sheep (numbers)
Wheat (tonnes)
Meat cattle (numbers)
5,000,000
10,000,000
15,000,000
20,000,000
25,000,000
Movement
Rail
Shipping
Air
Horses/Camels 1899
1870s Steam locomotive
1980s Electrified rail Light rail / High speed rail
Motor Vehicles
1901 First car registered in WA
Alternative & bio fuels
Alternative fuels
Electric and alternative fuel
1921 First airmail service 1960s Public domestic jet travel
Trams 1958
1917 Trans-Australian Railway
Popu
latio
n m
obili
ty
Con
gest
ion
15
10
5
GO
LD
IRO
N O
RE
ALU
MIN
AM
illio
n to
nnes
200
150
100
50
NIC
KEL
Thou
sand
tonn
es
27
18
9
CRU
DE
OIL
Gig
alitr
es
1890 1900 1910 1920 1930 1940 1950 1960 1970 1980 1990 2000 2010
250
200
150
100
50
0
Tonn
es
400
300
200
100
Mill
ion
tonn
es
8,000
6,000
4,000
2,000
A$ Million
0‘02-03 ‘03-04 ’04-05’05-06 ‘06-07 ’07-08 ‘08-09 ’09-10 ‘10-11 ’11-12 ‘12-13 Source: DMP
10,000
Value
OtherNickelGoldIron OrePetroleumAlumina
Production

2
Western Australia: time series 1850-2050 ......................................................... inside cover Premier’s foreword .............................................................................................................. 5Minister’s preface ................................................................................................................ 5 The State Planning Strategy 2050 ........................................................................................ 6Application and assumptions .............................................................................................. 7Supporting documents ...................................................................................................... 10
The context ........................................................................................................................ 12The vision ........................................................................................................................... 20The principles ..................................................................................................................... 22The strategic goals ............................................................................................................. 24The spatial dimensions ...................................................................................................... 29
Interrelated State strategic directions ............................................................................... 331. Economic development ................................................................................................. 35 1.1 The resources economy .................................................................................. 39 1.2 Education, training and knowledge transfer .................................................. 43 1.3 Tourism ............................................................................................................ 47 1.4 Agriculture and food ....................................................................................... 51 1.5 Remote settlements........................................................................................ 57 1.6 Land availability .............................................................................................. 61
2. Physical infrastructure ................................................................................................... 64 2.1 Movement of people, resources and information ........................................ 67 2.2 Water .............................................................................................................. 71 2.3 Energy ............................................................................................................. 75 2.4 Waste .............................................................................................................. 79 2.5 Telecommunications ............................................................................. ..........83
3. Social infrastructure ....................................................................................................... 86 3.1 Spaces and places ........................................................................................... 90 3.2 Affordable living ............................................................................................. 94 3.3 Health and wellbeing ...................................................................................... 96
4. Environment ................................................................................................................. 101
5. Security ........................................................................................................................ 105
Implementation ............................................................................................................... 108Evaluation......................................................................................................................... 110State Planning Strategy checklist ..................................................................................... 112
Glossary ............................................................................................................................ 114Acronyms ......................................................................................................................... 117Acknowledgements ......................................................................................................... 117Bibliography ..................................................................................................................... 118
© Western Australian Planning Commission
Published by theWestern Australian Planning CommissionGordon Stephenson House140 William StreetPerth WA 6000
Locked Bag 2506Perth WA 6001
Published June 2014
website: www.planning.wa.gov.auemail: [email protected]
tel: 08 6551 9000 fax: 08 6551 9001National Relay Service: 13 36 77infoline: 1800 626 477
This document is available in alternative formats on application to Communication Services.
DisclaimerThis document has been published by the Western Australian Planning Commission. Any representation, statement, opinion or advice expressed or implied in this publication is made in good faith and on the basis that the Government, its employees and agents are not liable for any damage or loss whatsoever which may occur as a result of action taken or not taken, as the case may be, in respect of any representation, statement, opinion or advice referred to herein. Professional advice should be obtained before applying the information contained in this document to particular circumstances.
Contents
Introduction
The vision
The Strategy
Action planning
Annexures

3
Figures
1. The State Planning Strategy positioning ............... 6
2. The State Planning Strategy structure ................... 6
3. Overview of the Western Australian planning system .................... 8
4. State planning and development framework ....... 9
5. Western Australia’s population growth .............. 12
6. Net migration compared with policy and economic influences .................. 13
7. Projected population growth .............................. 14
8. Age distribution ................................................... 14
9. Projected labour force ........................................ 15
10. Western Australia’s key trading partners 2010-11 .............................. 15
11. International time zones ..................................... 16
12. Gross domestic product (based on PPP) ............. 17
13. Climate change scenarios: temperature and rainfall projections 2030-70 ......................... 18
14. Trends in Western Australia’s temperature and rainfall 1910-2008 .................. 18
15. Towards an advanced economy: building on economic strengths .......................... 24
16. South West Australian global biodiversity hotspot .................................. 27
17. Planning for spatial dimensions .......................... 28
18. Northern sector map ........................................... 29
19. Central sector map .............................................. 31
20. South West sector map ....................................... 32
21. Planning for economic development .................. 34
22. Planning for the resources economy .................. 38
23. Planning for tourism ............................................ 46
24. Planning for agriculture and food ....................... 50
Tables
1. Structure of strategic directions .......................... 33
2. A strategic approach to to economic development .................................. 37
3. A strategic approach to planning for the State’s resources economy .................................. 41
4. A strategic approach to planning for education, training and knowledge transfer ...... 45
5. A strategic approach to planning for tourism ..... 49
6. A strategic approach to planning for agriculture and food ....................... 54
7. A strategic approach to planning for remote settlements ........................ 59
8. A strategic approach to the sustainable supply of land for future development ............... 63
9. A strategic approach to planning for movement of people, goods and services ..... 69
10. A strategic approach to water planning .............. 73
11. A strategic approach to energy planning ........... 77
12. A strategic approach to planning for waste . ...... 80
13. A strategic approach to telecommunications infrastructure ..................... 84
14. A strategic approach to planning for spaces and places ........................... 92
15. A strategic approach to the planning for affordable living ........................ 95
16. A strategic approach to planning for health and wellbeing ...................... 98
17. A strategic approach to environmental planning .................................... 103
18. A strategic approach to planning for security .......................................... 107
19. Collaborative arrangements ............................. 108
List of figures and tables
25. Western Australia’s key food export markets .... 51
26. Planning for remote settlements ........................ 56
27. Planning for land availability ............................... 60
28. Planning for movement ....................................... 66
29. Planning for water ............................................... 70
30. Planning for energy ............................................. 74
31. Electricity generation in Western Australia (all sources/renewable) ....................................... 75
32. Planning for waste ............................................... 78
33. Planning for telecommunications ....................... 82
34. Planning for social infrastructure ........................ 87
35. Planning for spaces and places ........................... 90
36. Planning for health and wellbeing ...................... 97
37. Planning for environment .................................. 100
38. Planning for security .......................................... 104
39. State planning strategy evaluation cycle ........... 111
40. At a glance – State Planning Strategy checklist .................... 112

4
About the photographer
Richard Woldendorp
Richard was born in Utrecht, The Netherlands, in 1927 and moved to Australia in 1951. On a return trip to Holland in 1955 he bought a camera and his long association with photography was born. In 1961, his photographs won numerous awards in national photographic competitions. It was then that Richard decided to become a professional photographer and he focused his lens on his great passion: the Australian landscape. Aerial depictions became his speciality, as he believes this best captures the vastness and uniqueness of the outback.
Richard’s iconic photographs are housed in national and state Australian galleries, as well as many private collections here and overseas, and he has been recognised for his contribution to photography and the arts with a vast array of awards.
In December 2004 he was honoured as a State Living Treasure for his outstanding contribution to the visual arts, his skill, talent and intensity as a photographer and for his original vision of the Australian landscape. In the Queen’s Birthday Honours in June 2012 he was appointed the Order of Australia“ for service to the arts as an Australian landscape photographer.”
Some of Richard’s awe-inspiring visions of the Western Australian landscape are included in this publication.

5
Minister’s preface
Hon John Day MLAMinister for Planning
Premier’s foreword
Hon Colin Barnett MLAPremier of Western Australia
Western Australia is in a period of sustained growth with a high level of public and private investment being channelled into infrastructure and development; it is a period of great promise and opportunity for all Western Australians.
Much of the world’s economic growth during this century will come from Western Australia’s trading partners in the Asia – Pacific region. Growing demand for the State’s raw materials, renewable energies, knowledge and technological skill base will create future opportunities.
In the past decade, Western Australia has been shaped by population and economic growth. In international trade Western Australia produces more than one third of Australia’s exports with just one tenth of the nation’s population.
Reflecting this changing and increasingly complex global and domestic environment, the need for State strategic planning has never been greater.
The State Planning Strategy 2050 is the Government’s strategic planning response to the challenges the State is likely to face into the future.
It takes a broad integrated view of planning and development in this State, reaching beyond land-use planning to place priority on managing population and economic growth.
I believe the State Planning Strategy 2050 is an important strategic planning framework that will help Western Australia sustain its growth and continue to build prosperity for future generations.
The State Planning Strategy 2050 is an integral part of the Western Australian planning system designed to inform planning policies and decisions throughout the State.
The first State Planning Strategy was published in 1997. The primary focus of that document was regional and local land-use planning.
Since then Western Australia has been shaped by population growth, the global economy, urbanisation, technology, climate change, and increased water and energy requirements.
In response this document seeks to better anticipate, adapt to and manage the drivers of change most likely to influence the future development of Western Australia.
Prepared by the Department of Planning under the guidance of the Western Australian Planning Commission this Strategy takes into account what is known about the future and sets a vision to 2050 based on a framework of State planning principles, strategic goals and objectives.
The State Planning Strategy 2050 envisages a doubling of Western Australia’s current population by 2056 and outlines the arrival of the State’s northern and central regions as hotspots for capital investment and their increasing contribution to Australia’s Gross Domestic Product.
However, land-use planning and development is becoming increasingly complex, requiring a more integrated and strategic response.
This document recognises that collective action can achieve the State’s strategic goals and objectives more effectively than any single organisation acting alone.
In this regard the State Planning Strategy 2050 provides a credible State strategic context from which public authorities and local governments participating in and/or influenced by the planning system can frame their respective legislative mandates and requirements.
Specifically, the State Planning Strategy 2050 outlines the Government’s intention to undertake a collaborative approach in planning for the State’s infrastructure, environment, food security, land availability, economic development, education, training and knowledge transfer.
Accordingly it will be used by the Government as a basis to plan for the coordination of infrastructure across the State; integrate regional planning and development efforts; and to facilitate the consideration of project approvals, delivery of services and urban land supply.
To appreciate the possibilities of this document, it should be viewed in its entirety and not as a series of individual parts.
The State Government looks forward to working with local government, the private sector and all interested Western Australians in the ongoing application and evaluation of the State Planning Strategy 2050.

6
Planning for sustained growth and prosperity
The purpose and function of this document is to provide a credible State strategic context and basis for the integration and coordination of land-use planning and development across state, regional and local jurisdictions.
A function of the Western Australian Planning Commission is “to prepare and keep under review: (i) a planning strategy for the State as a basis for coordinating and promoting land use planning, transport planning and land development in a sustainable manner, and for the guidance of public authorities and local governments on those matters.”Section 14(b), Planning and Development Act 2005
The State Planning Strategy is the lead strategic planning document within Government (Figure 1).
This document takes into account what is known about the future and the expectations of Western Australians, to provide a guide for future land-use planning and development throughout the State. It is structured into five parts (Figure 2).
This Strategy offers a view of the interconnections and interrelationships that are likely to influence Western Australia’s sustained growth and prosperity.
It highlights principles, strategic goals and strategic directions that are important to the land-use planning and development of Western Australia.
Development of this State Planning Strategy involved considerable research and consultation across State Government and the community of Western Australia.
The ongoing application of this document will require continued collaboration to ensure that it stays on course to realise its vision of sustained growth and prosperity.
The State Planning Strategy 2050
Figure 2 - State Planning Strategy structure
Figure 1 - The State Planning Strategy positioning
PARTNERSState Government
Local Government
Private Sector
WA Community
COMMUNITY ASPIRATIONS (Economic, Social, Environment)
STATE STRATEGIES AND POLICIES
REGIONAL PLANNING STRATEGIES, FRAMEWORKS, INVESTMENTS AND SCHEMES
LOCAL PLANNING STRATEGIES, SCHEMES, GROWTH PLANS AND POLICIES
BETTER PLANNING, FASTER DECISIONS, IMPROVED SERVICES
COMMUNITY OUTCOMES
State PlanningStrategy2050 Planning for sustained growth and prosperity
VISION: SUSTAINED GROWTH AND PROSPERITY
Diverse Liveable Connected Collaborative
PRINCIPLES
Community Infrastructure Economy Regional development
Environment Governance
STRATEGIC GOALSGlobal competitiveness Strong and resilient regions Sustainable communities
Infrastructure planning and coordination Conservation
STRATEGIC DIRECTIONS1. Economic development
1.1 Resource economy1.2 Knowledge transfer 1.3 Tourism1.4 Agriculture and food1.5 Remote settlements1.6 Land availability
2. Physical infrastructure2.1 Movement2.2 Water2.3 Energy2.4 Waste2.5 Telecommunications
3. Social infrastructure3.1 Spaces and places3.2 Affordable living3.3 Health and wellbeing
4. Environment
5. Security
ACTION PLANNINGImplementation Evaluation

7
Application and assumptions
The State Planning Strategy is directional, not directive
The legacy
Western Australia enjoys a proud planning history that dates back to the Town Planning and Development Act 1928 and the appointment in July 1929 of the State’s first Planning Commissioner, David Lomas Davidson, to oversee the inaugural Town Planning Board.
Post-war nation building is reflected today in the Perth Metropolitan Region Scheme (Stephenson and Hepburn) which remains an international benchmark for urban and regional planning.
The first State Planning Strategy was published in 1997 as the first document of its kind in Australia required by State law. It subsequently won the 1997 commendation award from the Royal Australian Planning Institute.
The primary focus of that document was land-use planning. Many of its land-use priorities were implemented through a series of annual audits up to the year 2000.
Since 2000, Western Australia has been shaped by global and domestic influences such as climate change, population growth, the global economy, regional expansion, technology, and access to water, food and energy in a cost-competitive economic environment.
This document offers an integrated whole-of-government view of the strategic planning needed to respond to the challenges and opportunities these factors present for the land-use planning and development of Western Australia.
In this regard the release of the State Planning Strategy 2050 builds on the proud legacy of the Western Australian planning system.
The Planning and Development Act 2005
The Planning and Development Act 2005 was enacted by the Parliament of Western Australian to provide for a system of land-use planning and development in the State and for related purposes.
The purposes of this Act are to:
• provide for an efficient and effective land-use planning system in the State; and
• promote the sustainable use and development of land in the State.
To help achieve these objectives the Western Australian Planning Commission (WAPC) is required to, among other things, prepare and keep under review a State planning strategy for the guidance of public authorities and local governments.
The State Planning Strategy 2050 is required to be a credible State strategic context and guide for coordinating and promoting land use planning, transport planning and land development in a sustainable manner.
Delivery culture
The State Planning Strategy 2050 signals the transition of the WAPC and the Department of Planning into a strategic lead role in the planning and development of the State.
This transition seeks to build strategic planning capacity and capability around a State vision that is based on a set of State planning principles, strategic goals and objectives.
Reaching beyond traditional land-use planning this Strategy places a priority on economic and population growth as the key drivers of land use and land development.
The success of this document relies on a collaborative approach to strategic planning that is based on a ‘can do’ attitude and an integrated long-term view of land use planning and development.

8
State planning and development framework
The State Planning Strategy 2050 is the highest order planning instrument in the Western Australian planning system. It is built on the web of interconnections that currently exists across Government.
It provides the strategic context for future strategies, plans, policies and decisions related to the sustainable use and development of land throughout the State.
This Strategy will be used to guide, shape and inform a hierarchy of State, regional and local planning tools, instruments and decisions within the Western Australian planning system (Figure 3).
The State Planning Strategy 2050 ensures that regional planning expresses a whole-of-government view within the wider context and frame of State strategic planning principles, goals and objectives.
This will help to align and deliver regional development programs and services through region scheme amendments, regional planning and infrastructure frameworks, regional investments, sub-regional structure plans, local community plans, and local planning schemes and strategies (Figure 4).
Specifically, it provides the State context for regional planning and development to focus on regional ‘shapers’ capable of delivering transformative change within and between regions.
Application
The State Planning Strategy 2050 is a guide through which public authorities and local governments can express or frame their legislative mandates and/or influence in land-use planning, land development and related matters.
In providing a set of State planning principles, strategic goals and objectives this Strategy can be used as a basis to find synergies between competing, complex and often inter-related land-use planning and development issues.
Importantly the Strategy can also be used to guide, inform and unite:
• local community plans, growth plans and local planning schemes and strategies;
• structure planning and development assessments;
• project approvals through the Government’s Lead Agency framework;
• planning for the coordination of physical and community infrastructure;
• region scheme amendments, regional planning and infrastructure frameworks, regional investments and service delivery programs; and
• investment proposals into areas and sectors of the State most likely to generate a return in the public interest.
Figure 40: At a Glance - State Planning Strategy Checklist summarises the matters of key importance when applying this document.
Assumptions
The application of this document is based on the following assumptions:
1. Western Australians are willing to work together in the pursuit of sustained growth and prosperity. People are willing to commit and pool their resources and efforts towards a common State vision.
2. The land-use planning and development of the State is increasingly complex (a volatile global economy, rapid policy responses, competing priorities and diverse technical matters) requiring a more strategic and collaborative approach.
3. Collaborative action can achieve State strategic goals and objectives more effectively than any single organisation acting alone.
4. The fundamental role and function of planning is that of a collaborator, enabler, coordinator, facilitator, decision-maker and catalyst.
Figure 3 - Overview of the Western Australian planning system
LEVEL STRATEGIC STRUCTURE PLANS STATUTORY POLICY
STATE State PlanningStrategy2050 Planning for sustained growth and prosperity
State Planning Policies
Operational Policies
eg. Liveable Neighbourhoods,
Development Control Policies
REGIONALRegional
Strategies/Frameworks
Regional and Sub-Regional
Plan/sRegion Planning
Schemes
LOCAL Local Planning Strategies
Local Structure Plan/s
Local Planning Schemes
Local Planning Policies

9
5. An efficient and effective land-use planning and development system is one in which State strategic settings are delivered in an integrated way that reduces process duplication and overlap across Government and between the various layers of the planning system.
6. A strategically-led planning system is one that enables streamlined development assessment pathways, unless the proposed use and development of land significantly departs from State planning principles, strategic goals and objectives.
Strategic community plan Local Planning Schemes
Corporate business plan Informing strategies• Asset management• Long term financial planning• Workforce planning
Annual budget Local Planning Strategies, and Land Use Structure Plans
LOCAL GOVERNMENT INTEGRATED PLANNING
ROYALTIES FOR REGIONS FUND
Figure 4 - State planning and development framework
STATE PLANNING STRATEGY
REGIONAL DEVELOPMENT PLANNINGRegional Investment Blueprint Framework State Planning Policy Framework
Region Schemes and Amendments• Bunbury • Peel • Perth
Regional Investment Blueprints Regional Planning and Infrastructure Frameworks• Gascoyne• Goldfields-Esperance• Great Southern• Kimberley• Mid West
• Peel• Pilbara• South West• Wheatbelt
• Gascoyne• Goldfields-Esperance• Great Southern• Kimberley• Mid West
• Perth/Peel (Directions 2031)
• Pilbara• South West• Wheatbelt
Regional investment initiatives Regional Planning InitiativesIncluding:
• Gascoyne revitalisation• Ord Stage 2• Pilbara Cities• Regional Centres
For example• Regional economic and employment strategies• Regional social infrastructure requirements studies• Regional population growth scenarios studies• Regional infrastructure project activation and
benefits studies
This will improve public confidence and business certainty in land use planning and development decisions.
10
Supporting documents
The State Planning Strategy 2050 in context
The State Planning Strategy 2050 is an overarching strategic document that provides direction for all State, regional and local planning strategies, policies and approvals.
To facilitate change at the local level, the State Planning Strategy relies on, links to and builds upon other strategic settings put in place by the WAPC. These include:
• Better Urban Water Management: A guide to facilitate better management of urban water resources through each stage of the planning system (WAPC et al, 2008).
• Directions 2031 and Beyond: A high level spatial framework and strategic plan for the future growth of the metropolitan Perth and Peel regions (WAPC, 2010).
• Economic and Employment Lands Strategy: Non-heavy Industrial, Perth Metropolitan and Peel Regions, WA: (Department of Planning and WAPC, 2012).
• Liveable Neighbourhoods: An award-winning policy that outlines objectives and criteria for the siting, design and assessment of structure plans and the built form (WAPC, 2009).
• Outer Metropolitan Perth and Peel Sub Regional Strategy and Central Metropolitan Perth Sub-regional Strategy: Designed to inform the preparation of sub-regional structure plans and local planning strategies to ensure that the vision of Directions 2031 can be implemented (draft, Department of Planning and WAPC, 2010).
• Pilbara Planning and Infrastructure Framework: A regional framework from which land for major industries and sites and corridors for major infrastructure can be set aside (WAPC, 2011).
• Urban Development Program (including Regional Hotspot reports; Urban Growth Monitor; Perth and Peel Development Outlook): This program coordinates and promotes the development of serviced land. It tracks land demand and supply as well as proposed development and infrastructure in Western Australia’s major urban centres.
• WA Tomorrow: Population forecast of Western Australia’s planning regions 2006 to 2026, Report No. 7 (Department of Planning and WAPC, 2012).
This strategy is supported by a suite of planning documents, schemes, frameworks, implementation plans, codes and regulations administered through the Department of Planning, local government and the Western Australian Planning Commission. Initiatives recently produced across Government that also contribute to the outcomes of the State Planning Strategy include but are not limited to:
• Department of Agriculture and Food, Western Australia: Report card on sustainable natural resource use in agriculture (2013) highlights the need for strategic planning to secure basic raw materials, particularly lime and gypsum resources, to sustain agricultural production.
• Department for Communities: An Age Friendly WA: The Seniors Strategic Planning Framework 2012-2017 (2012) is a joint approach to help all Western Australians to age well in communities where they matter, belong and contribute.
• Department of Culture and the Arts: Cultural Infrastructure Directions 2012-2014 (2012); Creating Value – An Arts and Cultural Sector Policy Framework (2010). The Directions and Framework define cultural infrastructure and outline key principles for arts and cultural investment in the State.
• Department of Education: Excellence and Equity, Strategic Plan for WA Public Schools (2012) provides direction on objectives for education service delivery.
• Department of Education Services: Future Directions for the Role of the State in Higher Education (2013) provides direction on the level of engagement between the higher education sector and the State Government and its agencies to achieve outcomes for workforce needs, regional development, international engagement, social inclusion, knowledge development and transfer, and innovation.
• Department of Environment and Conservation: Adapting to our changing climate (2012) focuses on climate change responses appropriate for Western Australia and outlines key policies the State Government will adopt to tackle this important issue.
• Department of Finance – Office of the Government Architect: Better Places and Spaces: a Policy for the Built Environment in Western Australia outlines strategies for improving architectural quality in the public realm; for recognising value for money across the life of a project; and for promoting sustainable design principles.
• Department of Health: WA Health Promotion Strategic Framework 2012– 2016 sets out strategic directions and priorities for the prevention of avoidable chronic disease and injury over the next five years.
• Department of Housing: Housing 2010-2020: Opening Doors to Affordable Housing (2010) is a strategy which outlines ways to reform long-term low to moderate income accommodation needs.
• Department of Local Government: Integrated Planning and Reporting Framework and Guidelines (2010) is a framework that enables local governments to articulate and plan for their local communities’ long-term aspirations and priorities, based on their resourcing capabilities and capacity.

11
• Department of Local Government - Office of Multicultural Interests: Implementing the Principles of Multiculturalism Locally (2010) assists local governments in responding to the needs of residents from culturally and linguistically diverse backgrounds.
• Department of Planning, Department of Local Government and Communities and Department of Regional Development: Aligned and integrated delivery of services to regional Western Australia (2013) outlines a collaboration between State and local governments in the delivery of regional services.
• Department of the Premier and Cabinet: Lead Agency Framework (2009). Through this framework, major projects are assigned to a Lead Agency that assists project proponents to manage Government interactions and navigate statutory approvals, in the public interest.
• Department of Regional Development and Lands: A Regional Development Policy Framework: An Action Agenda for Regional Development (2011) helps to prioritise investment decisions that are likely to achieve more effective regional development outcomes.
• Department of Regional Development and Lands: Regional Centres Development Plan Framework (2011) outlines funding structures and planning support for selected regional communities in Western Australia’s south-west.
• Department of Regional Development and Lands: Pilbara Cities (2012) provides a vision for the development of Port Hedland and Karratha as vibrant cities of 50,000 each to support a skilled workforce for the major economic developments planned for the region.
• Department of Training and Workforce Development: Skilling WA: A Workforce Development Plan for Western Australia (2010) guides workforce development in the State. This strategy helps to increase the capacity of the Western Australian workforce to meet the high skill needs of the State’s economy.
• Department of Treasury: Strategic Asset Management Framework (2012) provides policies and guidelines to improve asset investment planning and management across the State public sector.
• Disability Services Commission: Disability Future Directions - Count Me In (2011) is a framework of principles, directions and commitments to support the changing needs of people with disabilities, including their families and carers.
• Government of Western Australian – Physical Activity Taskforce: Active Living for All: A Framework for Physical Activity in Western Australia 2012-2016 (2012) provides a coordinated approach to ensuring physical activity opportunities exist for all Western Australians.
• Landgate: Realising the Power of Location: A Location Information Strategy for Western Australia (2010) is a framework for the delivery of integrated consolidated and interactive information across government.
• Office of Road Safety: Towards Zero Road Safety Strategy (2009) outlines strategies for safe road use design and speeds across the State.
• Public Utilities Office: Strategic Energy Initiative, Energy 2031 (2012) addresses the State’s future energy needs to ensure continued energy supply, provision, efficiency and access.
• Swan River Trust: River Protection Strategy for the Swan Canning Riverpark (2012) is a holistic management approach designed to improve the ecological health and community benefit of the Riverpark.
• Tourism WA: State Government Strategy for Tourism in Western Australia 2020 (2012) is the major policy framework guiding the development of tourism in Western Australia over the next decade.
• Waste Authority: Western Australian Waste Strategy, Creating the Right Environment (2012) sets the long-term strategic directions and priorities for waste management in the State.
• Water Corporation: Water Forever, Towards Climate Resilience (2009), Whatever the Weather, Drought-proofing Perth (2011) and Water Forever, A 10-year Plan for Western Australia (2012) together outline plans for the State’s water supply resources.

12
The context
Drivers of change
From a small sparsely populated State with an agricultural-based economy, Western Australia has grown into the powerhouse of the Australian economy, contributing, for the most part through its regions, disproportionately to the nation’s gross domestic product (GDP).
All indicators suggest that Western Australia is experiencing a period of substantial growth in its population and economy; it is a period of great promise and opportunity for all Western Australians.
A range of factors provide a context for, and directly influence, Western Australia’s future development. These drivers of change include:
• Population
• Workforce
• Global economy
• Diversification
• Urbanisation and regional expansion
• Technology
• Climate change.
The State Planning Strategy 2050 through its principles, strategic goals and strategic directions offers an integrated approach to managing and adapting to these drivers of change.
Population
Western Australia’s population make-up is undergoing change that is set to continue into the future. This change in population growth and diversity is having a direct impact on the demand for resources, the productive capacity of the State.
The population of Western Australia has grown at a steady rate since 1961 (Figure 5). This growth in population has not been uniform across the State, with some regional areas (Pilbara, Peel and Kimberley) showing markedly higher rates of population growth.
Migration, both from overseas and interstate, has been the principle source of population growth in Western Australia, with migration trends showing that new arrivals to the State will largely settle in Perth. Regional centres also benefit from migration, with internal intrastate migration being a major driver in population growth.
Economic conditions directly influence Net Overseas Migration which is higher during good economic conditions (Figure 6). For example, the Global Financial Crisis of 2008-09 caused a sharp drop in migrants during that period.
Western Australia’s experience with high migration goes back to the gold rush of 1890s in the Goldfields and a similar period of growth has occurred in recent years due to the investment phase of the current economic cycle.
Overseas students and temporary skilled workers comprise a significant proportion of overseas migrants to Western Australia, which proportionally attracts more migration than its share of the national population.
Western Australia’s population is expected to increase at a faster rate than the Australian average commensurate with the sustained growth of the State’s economy (Figure 6).
Western Australia Tomorrow proposes three scenarios for future population growth (Figure 7):
High Scenario – based on high growth assumptions
Medium Scenario – based on current trends
Low Scenario – based on low growth assumptions.
0
.5
1.0
1.5
Popu
latio
n (m
illio
ns)
2.0
2.5
Calendar year20102001 20111991198119711961
Figure 5 - Western Australia’s population growth
Source: ABS cat. no. 3105.0.65.001 Australian Historical Population Statistics; and Regional Population Growth, Australia, 2009-10 (cat. no. 3218.0) *9 year average annual growth

13
19881968 19781950 19591916 194118961860-20
-10
0
10
20
30
40
50
-100
0
100
200
300
Coolgardie andKalgoorlie
1890s gold rush
White Australia Policy
1945 - first‘MigrationProgram’
2008-2011Global
Financial Crisis
1956-1965 Modern migration
program starts
Annu
al n
et m
igra
tion
to W
A (p
erso
ns ‘0
00)
Calendar year
Annu
al n
et m
igra
tion
to A
ustr
alia
(Per
sons
‘000
)
GDP figures only available post September 1959
Australia
Relatively higher level of WA migration than Australia
Relatively lower level of WA migration than Australia
Western Australia
Economic boom eras
World War eras
Growth in GDP
more than 4%
Negative or zero
Figure 6 - Net migration compared with policy and economic influences
Source: Department of Planning 2012
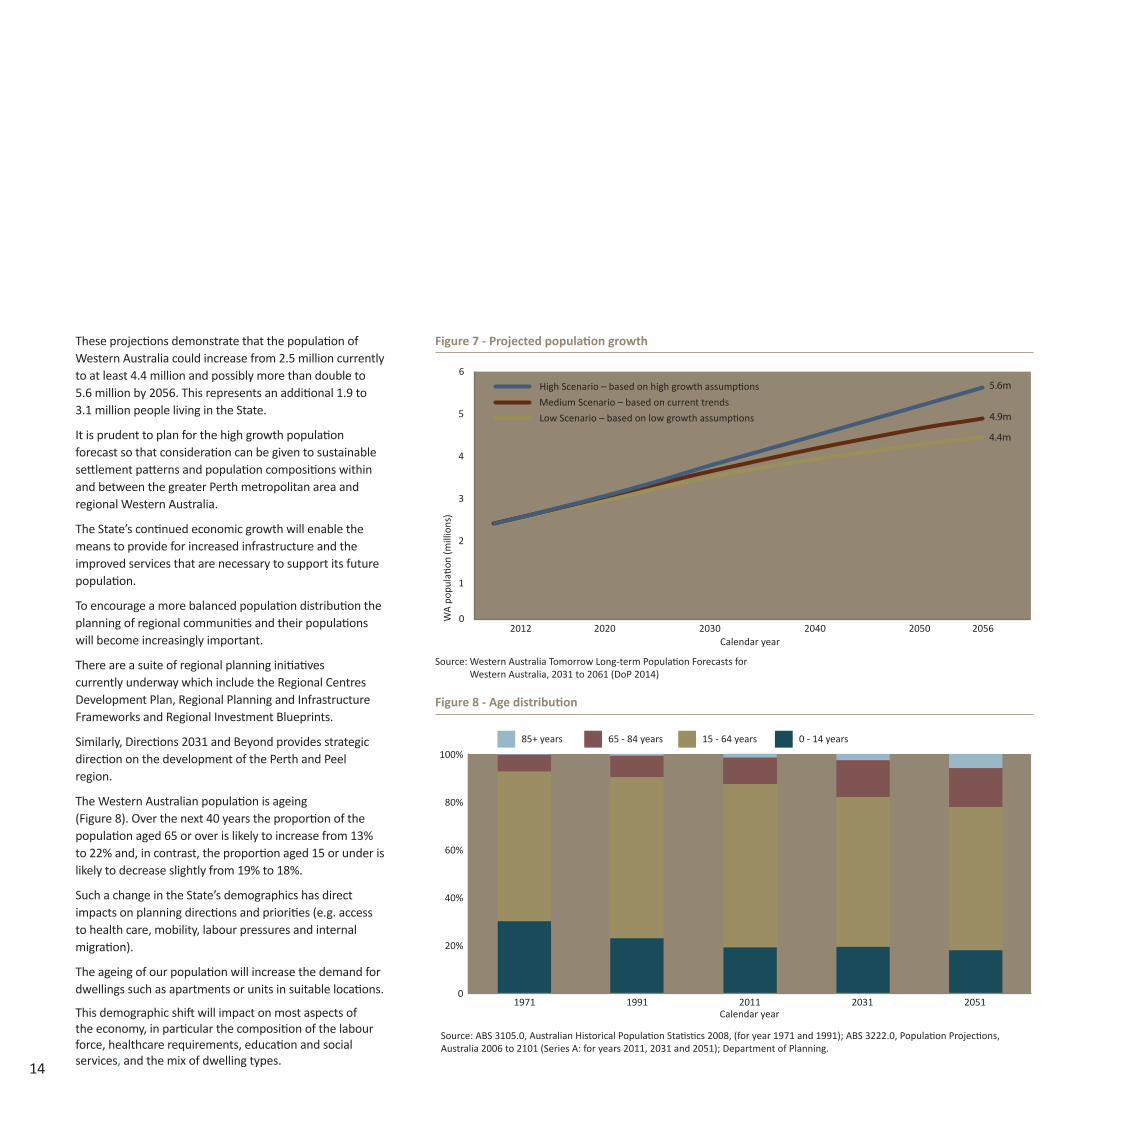
14
These projections demonstrate that the population of Western Australia could increase from 2.5 million currently to at least 4.4 million and possibly more than double to 5.6 million by 2056. This represents an additional 1.9 to 3.1 million people living in the State.
It is prudent to plan for the high growth population forecast so that consideration can be given to sustainable settlement patterns and population compositions within and between the greater Perth metropolitan area and regional Western Australia.
The State’s continued economic growth will enable the means to provide for increased infrastructure and the improved services that are necessary to support its future population.
To encourage a more balanced population distribution the planning of regional communities and their populations will become increasingly important.
There are a suite of regional planning initiatives currently underway which include the Regional Centres Development Plan, Regional Planning and Infrastructure Frameworks and Regional Investment Blueprints.
Similarly, Directions 2031 and Beyond provides strategic direction on the development of the Perth and Peel region.
The Western Australian population is ageing (Figure 8). Over the next 40 years the proportion of the population aged 65 or over is likely to increase from 13% to 22% and, in contrast, the proportion aged 15 or under is likely to decrease slightly from 19% to 18%.
Such a change in the State’s demographics has direct impacts on planning directions and priorities (e.g. access to health care, mobility, labour pressures and internal migration).
The ageing of our population will increase the demand for dwellings such as apartments or units in suitable locations.
This demographic shift will impact on most aspects of the economy, in particular the composition of the labour force, healthcare requirements, education and social services, and the mix of dwelling types.
Source: Western Australia Tomorrow Long-term Population Forecasts for Western Australia, 2031 to 2061 (DoP 2014)
0WA
popu
latio
n (m
illio
ns)
Calendar year
1
2
3
4
5
65.6m
4.9m
4.4m
Low Scenario – based on low growth assumptionsMedium Scenario – based on current trendsHigh Scenario – based on high growth assumptions
205620502040203020202012
Figure 7 - Projected population growth
Source: ABS 3105.0, Australian Historical Population Statistics 2008, (for year 1971 and 1991); ABS 3222.0, Population Projections, Australia 2006 to 2101 (Series A: for years 2011, 2031 and 2051); Department of Planning.
Figure 8 - Age distribution
0
20%
40%
60%
80%
100%85+ years 65 - 84 years 15 - 64 years 0 - 14 years
20512031201119911971Calendar year

15
India(A$4.3 Bill)
United States(A$5.4 Bill)
Imports
Exports
Japan(A$24.6 Bill)
United Kingdom(A$4.2 Bill)
China(A$57.9 Bill)
Thailand(A$4.1 Bill)
Singapore(A$7.2 Bill)
Republic of Korea(A$10.3 Bill)
2056205020402030202020120
500,000
1,000,000
1,500,000
2,000,000
2,500,000
3,000,000
Calendar year
Low Scenario – based on low growth assumptionsMedium Scenario – based on current trendsHigh Scenario – based on high growth assumptions
Figure 9 - Projected labour force
Figure 10 - Western Australia’s key trading partners 2012-13
Workforce
It is estimated that by 2056 Western Australia’s workforce will be 2.2 to 2.9 million, up from 1.2 million in 2012 (Figure 9). This infers that an additional 1.0 to 1.7 million workers may be required to maintain the State’s anticipated level of economic development.
Therefore, if the anticipated workforce in 2056 is to be fully employed, 23,000 to 39,000 jobs per year will need to be created.
The changing face of the global economy and the continued diversification of the State’s economic base will further intensify the competition for labour. The recruitment and retention of a skilled workforce will continue to be an important issue.
Global economy
Much of the world’s economic growth during this century will come from Western Australia’s trading partners in the Asia Pacific region (Figure 10 and 12).
Growing global demand for the State’s mineral and petroleum resources, agricultural products (food and fibre), renewable energy technologies and scientific and technological skill base will create significant opportunities.
However, the volatility of the global economy, with changes to factors such as commodity prices, exchange rates, global demand and mobile capital investment will directly influence the State’s economy.
State Government forecasts predict that economic growth (GSP) will slow from 5.75% in 2012-13 (actual) to 3.25% in 2013-14 and 2.5% in 2014-15.
The key drivers of the Western Australian economy to 2050 and beyond are likely to emanate from India, Africa, China and the Asia-Pacific (Figures 10 and 12).
The State’s agrifood sector is well placed to respond to projected global food demand particularly from the Asian region. There is also great potential in exploring trade with emerging international markets outside the Asia Pacific region. DFAT publication Australia’s Trade by State and Territory 2012-13
Source: Department of Planning – derived estimates

16
Perth
Western Australia
Malaysia
Indonesia
Philippines
China
+ 7 hours + 6 hours
Time Zone UTC (Universal Time Coordinated) + 8 hours
+ 8 hours + 9 hours + 10 hours + 11 hours + 12 hours
Inte
rnati
onal
dat
e lin
e
Figure 11 - International time zones
That most of the State’s major trading partners are in the same time zone as Western Australia (Figure 11) exemplifies the potential opportunities for close cooperation and business development.
Diversification
Western Australia must continue to diversify its economy to facilitate a broader mix of industries and occupations that can make for a resilient and ultimately prosperous society.
Agriculture in the ‘Asian century’ will provide significant opportunities for increased diversities in the State’s economic base that will give resilience to economic fluctuations, such as for commodity prices.
Western Australia will continue to be a global resources hub due not just to the resources themselves, but also to the expertise and technology that has made this State a leader in extractive industries. This will place importance on the capacity, capability and retention of a highly skilled workforce.
Diversification can take place on many levels, ranging from economy-wide diversification to the individual business level. Investment in infrastructure to support appropriate diversification in economic sectors with comparative advantages is a priority.
Enhanced private sector involvement and investment will assist in diversification, essential for regional Western Australia, where economic diversity and (non-resource sector) business development is of particular importance.
Western Australia is well placed, in terms of natural resources and lifestyle choices, to compete globally for skills. To continue to compete successfully, Western Australia must build on its assets and link economic development opportunities to a high quality of life.
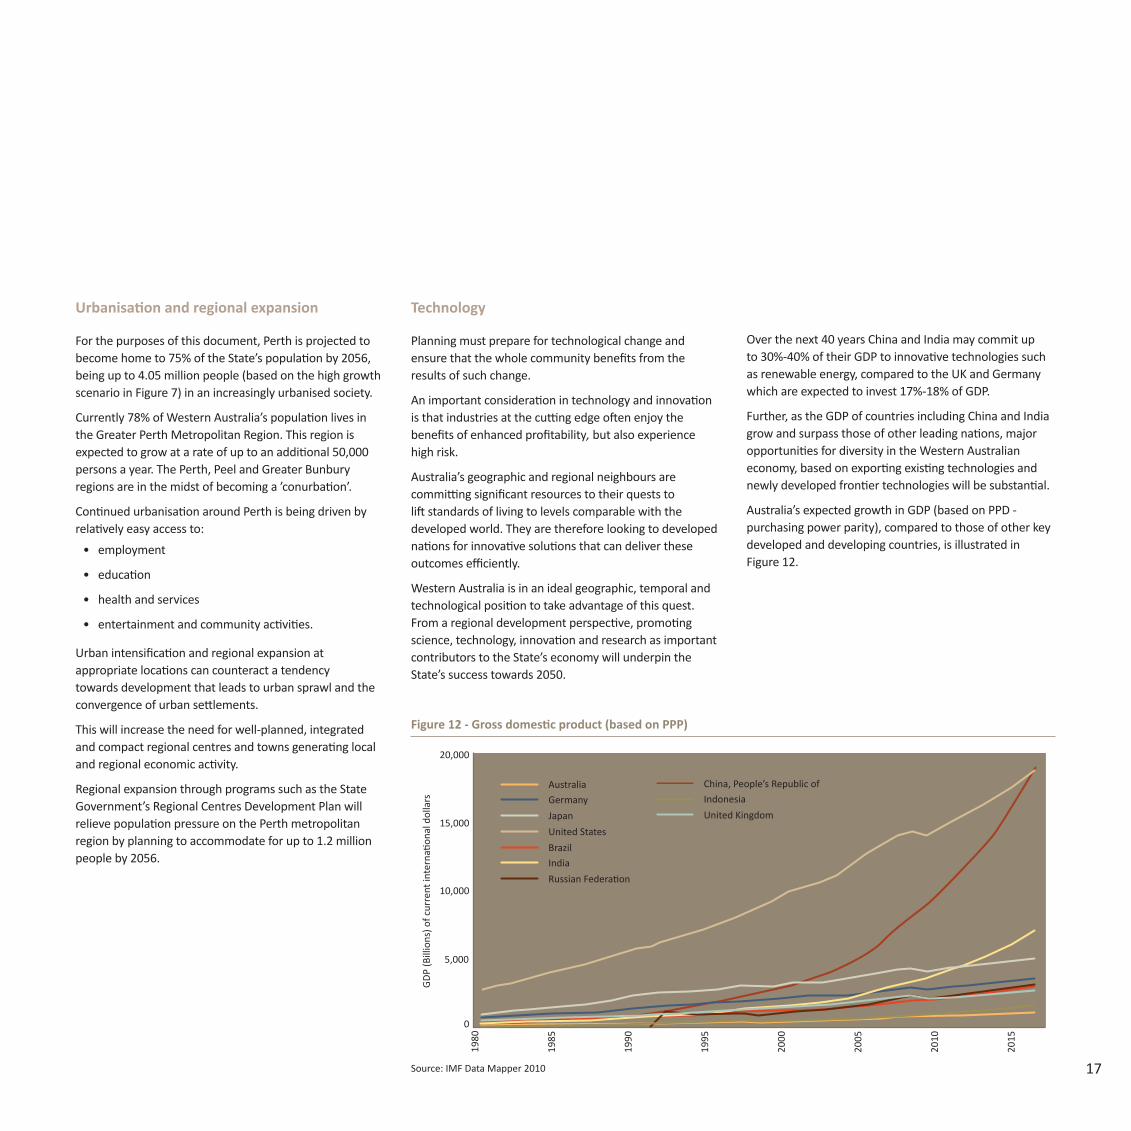
17
Technology
Planning must prepare for technological change and ensure that the whole community benefits from the results of such change.
An important consideration in technology and innovation is that industries at the cutting edge often enjoy the benefits of enhanced profitability, but also experience high risk.
Australia’s geographic and regional neighbours are committing significant resources to their quests to lift standards of living to levels comparable with the developed world. They are therefore looking to developed nations for innovative solutions that can deliver these outcomes efficiently.
Western Australia is in an ideal geographic, temporal and technological position to take advantage of this quest. From a regional development perspective, promoting science, technology, innovation and research as important contributors to the State’s economy will underpin the State’s success towards 2050.
Urbanisation and regional expansion
For the purposes of this document, Perth is projected to become home to 75% of the State’s population by 2056, being up to 4.05 million people (based on the high growth scenario in Figure 7) in an increasingly urbanised society.
Currently 78% of Western Australia’s population lives in the Greater Perth Metropolitan Region. This region is expected to grow at a rate of up to an additional 50,000 persons a year. The Perth, Peel and Greater Bunbury regions are in the midst of becoming a ’conurbation’.
Continued urbanisation around Perth is being driven by relatively easy access to:
• employment
• education
• health and services
• entertainment and community activities.
Urban intensification and regional expansion at appropriate locations can counteract a tendency towards development that leads to urban sprawl and the convergence of urban settlements.
This will increase the need for well-planned, integrated and compact regional centres and towns generating local and regional economic activity.
Regional expansion through programs such as the State Government’s Regional Centres Development Plan will relieve population pressure on the Perth metropolitan region by planning to accommodate for up to 1.2 million people by 2056.
Over the next 40 years China and India may commit up to 30%-40% of their GDP to innovative technologies such as renewable energy, compared to the UK and Germany which are expected to invest 17%-18% of GDP.
Further, as the GDP of countries including China and India grow and surpass those of other leading nations, major opportunities for diversity in the Western Australian economy, based on exporting existing technologies and newly developed frontier technologies will be substantial.
Australia’s expected growth in GDP (based on PPD - purchasing power parity), compared to those of other key developed and developing countries, is illustrated in Figure 12.
5,000
0
10,000
15,000
GDP
(Bill
ions
) of c
urre
nt in
tern
ation
al d
olla
rs
20,000
1980
1985
1990
1995
2000
2005
2010
2015
Australia
Brazil
China, People’s Republic ofGermany
India
IndonesiaJapan
Russian Federation
United KingdomUnited States
Figure 12 - Gross domestic product (based on PPP)
Source: IMF Data Mapper 2010

18
Climate change
Climate projections for Western Australia from 2030 through to 2070 indicate an increase in temperatures across the State, accompanied by a decline in winter rainfall in the South West and a seasonal increase in the North.
The Intergovernmental Panel on Climate Change projections related to Western Australia take into account a number of climate models and greenhouse gas emission scenarios.
These projections (Figure 13) use low, mid-range and high emission scenarios. The scenarios include various assumptions about demographic, economic and technological factors likely to influence future emissions.
Figure 14 - Trends in Western Australia’s temperature and rainfall 1910-2008
Changing temperatures and rainfall patterns (Figures 13 and 14), along with rising sea levels and more frequent and intense natural disasters such as cyclones, flooding and bushfires, will contribute to:
• changes in the location and productivity of agricultural land;
• adjustments to public health and disaster preparedness/response;
• changes in water availability;
• risks to coastal communities and marine infrastructure;
• economic models that underpin emerging water and energy policy settings; and
• changes in the siting and design of major infrastructure and the built form of development.
Adapting to the impacts of climate change will be critical, as will reducing carbon emissions and the development of eco-technologies that promote the efficient use of natural resources.
Western Australia has abundant renewable energy sources that make it well-placed to mitigate and adapt to the effects of climate change.
There are also significant opportunities to develop new technologies that can aid Western Australia to adapt to climate change.
The impacts from climate change are being experienced through an increase in the frequency and intensity of tropical cyclones, severe storms and flooding. Bushfires and decreased rainfall are most noticeable in the State’s southwest region.
Local responses to the impacts of climate change are being delivered through a combination of natural resource management initiatives.
Figure 13 - Climate change scenarios: temperature and rainfall projections 2030-70
Degrees celsius PercentageSource: CSIRO - www.climatechangein australia.gov.au - July 2010
Trend in mean temperature 1910-2008 (0C/10 years) Trend in annual rainfall 1910-2008 (mm/10 years)

19Lake
Mac
leod
with
clo
uds r
eflec
ted,
nor
th o
f Car
narv
on, W
este
rn A
ustr
alia
.

20
The vision
Sustained growth and prosperity
The vision of sustained growth and prosperity envisages a future where Western Australians enjoy high standards of living, improved public health and an excellent quality of life for present and future generations.
Sustained growth and prosperity can be summarised by four reference points: diversity, liveability, connectedness and collaboration.
A diverse state; offering a diversity of ecosystems, landscapes, enterprises, people and cultures.
In 2050, the diversity of Western Australia’s natural assets and unique landscapes, ecosystems, peoples, enterprises, cultural landscapes and historic heritage places will be celebrated, protected and recognised as an important contributor to sustained prosperity.
Communities will access diverse housing and services that complement their values and lifestyle choice.
A liveable state; the place of choice for the brightest and best.
By 2050, Western Australia will be recognised internationally for its capital city and regional centres, each with a unique identity, culture and landscape. Perth will retain and enhance its high liveability rating in global terms.
Regional Western Australia will be robust, interconnected and have timely, cost-effective and superlative access to education, health, housing, social welfare and cultural pursuits.
People will have access to well-designed places and spaces, natural and recreational open spaces, and services that enhance confidence and wellbeing.
A connected state; as connected to the rest of the world as any other place.
In 2050, distance will not be a barrier to connecting people, places and enterprises to resources and information.
Affordable and secure high-speed communication and transport options will connect communities and enable regions to collaborate to build diversity, resilience, international competitiveness and employment.
A collaborative state; enabling alignments that progress the State’s sustained growth and prosperity.
Collaboration brings together the knowledge, experience and skills of people, organisations and sectors, to collectively achieve outcomes that cannot be achieved individually.
A collaborative state will be built on partnerships, alliances and networks that encourage new ways of doing business in order to achieve sustained growth.
Encouraging cross-regional collaboration by embracing and aggregating the distinct identity and competitive advantages of each region will offer greater choice for long-term global and domestic capital investment.
By 2050
By 2050, Western Australia will have a diverse range of interconnected and vibrant local communities and regional centres. The people in these communities will be healthy, resilient, active, prosperous, respectful of cultural difference and participate in the public domain.
Standards of living will continue to be amongst the highest in the world. Improved connections and smarter technologies will enhance the State’s ability to attract global and domestic investment capital where and when it is most needed.
A ‘can do’ attitude will prevail, inspiring new ways of thinking and working, which will deliver optimal outcomes for the economy and communities of Western Australia.

21Abro
lhos
isla
nds

22
The principles
Six interrelated State planning principles underpin and inform the State Planning Strategy 2050, which apply across all regions, local government areas and communities.
Community: Enable diverse, affordable, accessible and safe communities
Planning for community betterment can balance aspirations for creating wealth, caring for the environment and building communities of which people feel proud.
Community growth and betterment can be achieved while retaining a community’s sense of identity and its history through the identification and conservation of its historic heritage places, and through the telling of Western Australia’s stories on stage and screen.
A community which generates a sense of belonging and identity creates the social capital and culture which provides acceptance of diversity, safety and the ability to manage change.
As the size and growth rate of the population continues to change, so too will people’s needs, demands and aspirations.
Sustained growth can be achieved through communities becoming desirable environments in which to live, supported by choice and excellence in housing, health and educational opportunities.
Aboriginal people represent a significant part of the State’s community. Accordingly, it is important that Aboriginal people are economically engaged in the planning and development of Western Australia.
Economy: Facilitate trade, investment, innovation, employment and community betterment
Western Australia is one of the largest exporters of commodities in the fastest growing region of the world, the Asia-Pacific region. Ports are of great importance in facilitating this trade.
The State’s enterprises accounted for 16% of Australia’s GDP in 2011-12, and 46% of the total value of Australia’s merchandise exports in 2012-13.
Harnessing existing and emerging competitive and collaborative advantages can present opportunities to stimulate job creation, wealth and wellbeing. The rapid acceleration of investment that is occurring in the State’s agricultural industry is transforming it into a global industry.
Western Australia is well-placed to build on its strong economic and stable political base by enabling value adding industries, including emerging knowledge and low carbon economies.
An important aspect of this is the contribution of culture and the arts, including creativity, to economic development and diversification. In recognition of this contribution, ScreenWest won the 2013 Premier’s Award in the ‘Developing the Economy’ category for an initiative to maximise funding opportunities for independent filmmakers.
Planning for the State’s economic development will help ensure the release or redevelopment of land for agriculture, resource development, infrastructure and industrial ecology in the right place at the right time.
Environment: Conserve the State’s natural assets through sustainable development
Western Australia occupies one-third of the land mass of Australia and has vast mineral and natural resources across a wide range of temperate to tropical environments.
Research reveals a correlation between human health, economic wealth and ecosystem health. For the people of Western Australia this takes shape in the form of wellbeing, fresh produce, clean air, abundant natural resources, a range of lifestyle choices and high standard of living.
The intrinsic value of the State’s environmental assets and their potential for future economic opportunities needs to be recognised through conservation and management. This includes conserving areas of native vegetation and the biodiversity of species populations and ecological communities.
A careful and managed balance of conservation and development will ensure the State can sustain its growth and prosperity over the long term.
It is imperative therefore that the State’s biodiversity and natural resources are well-managed so that short-term gains do not compromise future opportunities.

23
Infrastructure: Ensure infrastructure supports development
Demand for Western Australia’s goods and services will continue to rise in the foreseeable future, which will increase the pressure on the State’s infrastructure.
Western Australia’s vast distances and sparse population present complex challenges for its sustained growth in terms of productivity, capital investments, liveability and workplace participation.
Planning for the integration and coordination of both physical and social infrastructure is critical in achieving the strategic vision and goals of this document.
Of particular importance will be the continued collaborative approach to define the roles within all tiers of Government; and between the Government and the private sector.
Social infrastructure is by nature highly complex and multidimensional. All levels of government have a role to play in the coordinated delivery of the ‘hard’ elements of community infrastructure, including schools, hospitals, civic centres, aged care facilities and public open spaces, as well as the ‘soft’ elements of community infrastructure, which include social services, community building, and culture and arts programs.
Regional Development: Build the competitive and collaborative advantages of the regions
In order to achieve sustained growth as a state, each region must capitalise on its unique characteristics, assets, resources and supply chains, both independently and by collaboration with all the other regions. Synergies between regions should be the impetus for collaboration.
The opportunity to develop agriculture and the food production sector to meet demand in neighbouring countries is vast. This creates a need for labour, workforce development, new agriculture precincts and liveable communities in the regions to support the development of the economic base.
A strong partnership between local governments, the Department of Regional Development, Regional Development Commissions and the Western Australian Planning Commission (Figure 4) can help regional investments and ensure the devolution of planning and development powers are effective and appropriate to achieving ‘on the ground’ and timely decisions.
Regional planning will inform the capacity, structure, commercial and industry base that is needed to provide an attractive choice for people wanting to live in regional towns and centres.
Governance: Build community confidence in development processes and practices
The State’s development is substantially affected by investment decisions which often need to be made many years ahead of the commencement of a project.
Governance manages, coordinates and improves the interconnections between policy, development decisions and on-the-ground outcomes in the public interest.
It involves the application and alignment of many government regulations, statutory approvals, agreements, judgements, transactions and investment commitments.
Good governance is participatory, collaborative, accountable, transparent, responsive, effective and efficient, equitable and follows the rule of law.
In this way the State Planning Strategy provides a contemporary State strategic context for an efficient and effective land-use planning system in which State strategic settings are delivered in an integrated way that reduces process duplication and overlap across Government and between the various layers of the planning system.
This approach enables streamlined development assessment pathways, unless the proposed use and development of land significantly departs from State planning principles, strategic goals and objectives.
It will also improve public confidence and business certainty in land use and development decisions.

24
The strategic goals
There are many pathways to achieve sustained growth and prosperity
Western Australia’s development since 1850 illustrates the dynamics of the economy and population. The emergence of the Pilbara region as a hotspot for global investment and the engine room of the national economy indicates the diverse opportunities that lie ahead.
Trends that are evident and likely to influence the development of the State include a doubling of the State’s population, a changing climate, drying in the southwest, urbanisation and rapid shifts in the global economy. These present challenges for the sustained growth and prosperity of Western Australia.
Five interrelated strategic goals have been identified with the view to realising a vision of sustained prosperity for Western Australia:
• Global competitiveness will be enhanced through continued economic diversification.
• Strong and resilient regions will be built through economic expansion and inter-regional collaboration.
• Sustainable communities will be enhanced by investment in infrastructure and social capital.
• Infrastructure planning and coordination will achieve efficiencies and synergy in pursuit of economic growth.
• Conservation of the environment will be enhanced by sustainable development and efficient resource use.
Strategic Goal 1 - Global competitiveness
To achieve sustained growth the priorities of this strategic goal are:
STATE VISION PRIORITIES
Diversity a diversified economic base
Liveabilityattraction and retention of human and monetary capital
Connectednessglobal trade and high speed movements
Collaborationgenerating innovative ideas and enterprises
Global competitiveness reflects the degree to which a country can produce goods and services that are in demand in both domestic and international markets at the desired cost and quality.
Western Australia is one of the most resource-rich regions in the world. The State will secure long-term economic prosperity by growing and developing its mineral, petroleum and geothermal energy resources sector through exploration activity, and major product and infrastructure development.
The attraction and retention of skilled workers, who require access to well-developed social infrastructure and social services, is a critical issue.
Culture, heritage and the arts, which contribute to the identity, sense of belonging and desirability of communities, is also important to people.
Figure 15 - Towards an advanced economy: building on economic strengths
Source: Syme Marmion & Co, 2011
APPLICATION TO CREATIVE INDUSTRIES:
– Animation – Game development
APPLICATION TO ASTROPHYSICS:
Australian Square Kilometre Array Pathfinder and Square Kilometre Array
APPLICATION TO HEALTH SCIENCES:
– Epidemiology – Medical imaging – Genetic mapping
World-class expertise and capability in complex analysis and visualisation
Demand for analysis of massive databases, 3D modelling and robotics.
RESOURCES ECONOMY

25
There is a significant opportunity to enhance competitiveness by leveraging the State’s natural environment, cultural assets, stable government, great lifestyle choices, abundant natural resources and economic strengths.
Diversifying the economy by building a high-level knowledge and skill base can be augmented by attracting the world’s most skilled workers and creative thinkers.
Western Australia’s significant advantages will enable it to further develop the capacity to compete successfully in the global market across many sectors, most notably, mining, oil and gas, agriculture and education.
The State’s knowledge economy includes a range of activities around the energy and resources sector (including mining and construction engineering, mapping and remote sensing), as well as defence and marine related engineering.
The knowledge and expertise developed for our resources sector has application for many other sectors (Figure 15). For example, there are opportunities for the application of robotics, three dimensional modeling and database management in biotechnology, education and health services, and a range of related design, research and technical services.
Enterprises and technology developments that capitalise on renewable energy resources, the State’s unique arts, places, technologies and cultures will be well-placed in the global economy.
Strategic Goal 2 - Strong and resilient regions
The priorities of this strategic goal are:
STATE VISION PRIORITIES
Diversity embracing diverse economic and social opportunities
Liveabilitycreating places where people want to live and work
Connectednessbuilding strong relationships and accessibility
Collaborationenabling collaborative advantages across and within regions
Strong and resilient regions are able to deploy their resources and capabilities to respond proactively to opportunities and challenges as they arise.
Resources that support resilience include economic development and capital, physical infrastructure, social capital, information and communication systems. Core capabilities include skills, motivation, community strength and leadership.
Each region of Western Australia has a unique character, natural resources, climate and competitive advantage which can be built upon to generate a diverse range of economic opportunities.
Some regions are growing exponentially and competing globally for large scale investments, while other regions are not.
The key to strong and resilient regions is an understanding of each region in terms of its composition, strengths, opportunities, and vulnerabilities. It is also the capacity and ability to respond in a calm and measured way to changing circumstances through regional planning and associated investment strategies.
Royalties for Regions is a $10.9 billion (to 2016-17) program to help Western Australia’s regional areas grow into thriving and sustainable communities through the funding of approximately 3500 projects aligned with the State’s Planning and Development Framework (Figure 4).
Inter-regional collaborations through partnerships, networks and alliances harness the competitive and collaborative advantage of each region. This offers greater choice for global and domestic capital investment and equips individual regions to better manage change.
Strategic Goal 3 - Sustainable communities:
The priorities of this strategic goal are:
STATE VISION PRIORITIES
Diversitycommunity-specific development, responsive to diverse needs, places and contexts
Liveabilitycommunities with attractive, liveable environments
Connectednessproviding natural and built connections within and between communities
Collaboration collaborative and inclusive planning
Sustainable communities are those that manage community expectations, financial capacity, service delivery, infrastructure and asset quality through collective capabilities and resources.
They are provided with fresh local food and diverse work opportunities, and have good connections between their settlements and landscapes.
Liveability is a key determinant of the State’s ability to attract an internationally mobile workforce, which depends, in part, on the cost of living, adequate social services (including schools and hospitals) and amenity in key regional centres.

26
External influences that are harder to manage are driven by urbanisation, climate change, population growth, legislative requirements and government policy.
Urbanisation, decreasing affordability, ageing populations, and socio-economic differences across the State all require an increased focus when planning for sustainable communities.
A significant part of the State’s settlement patterns are largely in place now and need to be supported through the provision of infrastructure and services.
There is a need to plan proactively for integrated ‘hard’ and ‘soft’ infrastructures so that these communities account for the different and changing needs of an ageing population, migrant communities, indigenous communities, people with disability and a range of other groups within the community.
As each community has different social infrastructure needs, a detailed understanding of a community’s make-up, cultural and social connections, and social pressures is required.
Integrated settlement structures and mixed built form create liveable places and spaces. They provide active transport options, functional green spaces and networks with connections to natural landscapes.
Adaptation of buildings for new uses makes an important contribution to sustainable communities. It both limits the requirement for new materials and reduces the amount of demolition waste. Adaptive reuse of heritage buildings also provides continuity for the community and helps to maintain its identity in the face of ongoing change.
Strategic Goal 4 - Infrastructure planning and coordination
The priorities of this strategic goal are:
STATE VISION PRIORITIES
Diversitysupporting economic diversity, innovation and resilience
Liveabilityproviding contemporary, effective, resource-efficient services
Connectedness
linking regional economic opportunities to the movement of people, goods and services across the State
Collaborationsharing new ideas and creating new business and lifestyle opportunities
The planning for the coordinated provision of State infrastructure is related to the strategic objectives of Government having regard to the likely rate of economic and population growth.
Infrastructure planning and coordination encompasses diverse forms of physical and social infrastructure elements and the linkages between them. It is complex because it involves arranging often highly technical infrastructure elements in an order of importance within an overall infrastructure framework and limited capital investment environment.
In addition to a focus on the ‘hot spots’ of significant economic growth, appropriate infrastructure services need to be consolidated in areas of identified public health and environmental needs, such as in towns affected by emissions from industry, and where sewerage infrastructure including onsite effluent disposal systems or managing drinking water supplies are of particular importance.
The Infrastructure Coordinating Committee (ICC) has legislative responsibility to advise the WAPC on planning for the coordinated provision of physical and community infrastructure throughout the State.
This coordination reaches beyond ‘hard’ infrastructure such as airports, roads, railways, seaports, green networks and cycling and pedestrian links to include ‘soft’ infrastructure such as education, health and cultural services and cultural, science and arts programs. The combination of both ‘hard’ and ‘soft’ infrastructure is fundamental to achieving healthy, active and liveable communities.
The design, location and operation of infrastructure networks will need to balance building capacity for present and emerging enterprises with the infrastructure needs of a growing and ageing population.
The development of activity centres can create an affordable, attractive lifestyle, facilitating free movement and a desirable style of living. This will also need to be done cognisant of a natural environment susceptible to the effects of climate change.
It is proposed to develop a set of infrastructure prioritisation principles through the ICC, which will enable improved consideration and advice to be provided to Government on recommended future infrastructure priorities.
The ICC will use this Strategy among other documents to consider alternative frameworks and methodologies in order to maximise the use of existing infrastructure and improve the assessment of infrastructure proposals. The ICC will regularly review mechanisms that identify, secure, protect and manage infrastructure corridors throughout the State.

27
Figure 16 - South West Australian global biodiversity hotspot
Strategic Goal 5 - Conservation
The priorities of this strategic goal are:
STATE VISION PRIORITIES
Diversityunderstanding, maintaining and conserving biodiversity, landscapes and natural environments
Liveabilitysecuring our natural environments and resources
Connectednessconnecting ecosystems, people and natural resources
Collaboration
realising opportunities through collaboration for environmental conservation and sustainable resource use
Western Australia’s unique natural environment encompasses pristine and diverse natural areas both onshore and offshore, with world-renowned biodiversity, scenic landscapes, heritage sites, marine and coastal areas and places of cultural significance. The clean and beautiful natural environment is a major contributor to the State’s liveability and attractiveness.
The Kimberley region has a particularly unique natural landscape that is rich with biodiversity, with its islands being an important refuge for many species now extinct on the mainland.
South West Australia (Figure 16) is a global biodiversity hotspot that includes Mediterranean-type forests, woodlands and scrub eco-regions. The region has highly diverse landscapes and species, and has a wet winter, dry summer Mediterranean climate. It is one of five such regions in the world.
Historically, land management practices have led to native vegetation being extensively cleared, with less than 40% remaining in the southwest. It is important that the conservation of this region continues to be achieved.
Conservation will increase the resilience of the State’s natural environment by limiting the clearing of native vegetation, maximising natural habitat protection and rehabilitation, avoiding development in environmentally sensitive areas, and reducing the fragmentation of vegetation by urban and industrial development.
Conservation also safeguards the State’s biodiversity and the ecosystem services that Western Australians depend upon such as water and air purification for their health and wellbeing.
Consumption of natural resources in the development of cities and regional centres needs to be managed in a way that will secure these assets for future generations.
Streamlined project approval decisions will be achieved through collaboration, partnerships, alliances and common understanding on environmental issues, informed by evidence-based research and environmental studies.
Western Australia is a significant global competitor in the provision of natural resources and is emerging as a strong competitor in the development of eco-technologies that reduce environmental impact. Ongoing innovation in these technologies will ensure the sustainable use and consumption of our natural resources.
Source: Conservation International 2007

28
Figure 17 - Planning for spatial dimensions
Legend:
Economic activity area
Infrastructure band
Major roadRailwayDraft Regional Planning and Infrastructure FrameworksRegional Planning and Infrastructure Frameworks endorsed by WAPC as finalRegional Planning and Infrastructure Framework - completed
Capital city
Regional centreSub-regional centre (As defined by: WAPC regional hotspots; Regional Centres Development Plan [SuperTowns])
Other centre

29
The spatial dimensions
For the purposes of this Strategy, Western Australia is considered in the context of three sectors each consisting of two or more designated planning regions:
• Northern sector
• Central sector
• South West sector.
Figure 17 envisages a statewide network of regional centres, infrastructure bands and projected economic activity areas resulting from the application of the strategic goals and directions in this document.
It reveals the potential for growth in regional Western Australia, which reinforces the importance of regional planning.
Figure 17 also recognises that while the South West sector is the most intensely developed part of Western Australia, the Northern sector has rapidly gained importance in national and global trade, investment and commerce.
For the purpose of this document regional centres, subregional centres other centres and towns include those identified in the Government’s Regional Centres Development Plan and Regional Hotspot publications.
Regional planning and infrastructure frameworks express a vision on the form and function of centres, subregional centres, towns and remote settlements. They also outline regional land use priorities within the context of this State Planning Strategy.
The State Government’s Regional Centres Development Plan, supported by the Royalties for Regions program and including the Pilbara Cities initiative, is a targeted program to build strong and resilient regions within the context of regional planning and infrastructure frameworks.
Growth plans for regional communities bring together the objectives from all tiers of government for sustainable growth and an implementation schedule for how that growth will be realised.
This Strategy, together with regional frameworks, investment programs and projects, seeks to provide the regions with the capabilities and resources to expand resident populations and enhance economic development opportunities.
Northern sector
Planning of the State’s Northern sector (Figure 18) must be considered within the context of northern Australia to further the development of its untapped potential and continue to build collaborative advantages with the Northern Territory and Queensland.
The Northern sector, comprising the Pilbara and Kimberley regions, each with distinct strengths, issues and challenges, significantly contributes to Australia’s GDP.
The continuing development of agricultural and resource projects within this sector is set to ensure that it remains a key driver for the economy.
The Northern sector can also further promote its unique natural environment through the sustainable development of ecotourism and it has the potential to become a mineral and energy resource (including renewable energy) province.
Harmony must be found between conservation of the Northern sector’s unique environment and its opportunities for economic development.
Periods of further economic growth and development are expected, given the proximity to present and emerging trading partners in South East Asia, India and Africa. This is expected to be fuelled by demand for high quality
Figure 18 - Northern sector
Regional centre
Sub-regional centre (As defined by: WAPC regional hotspots; Regional Centres Development Plan [SuperTowns])
Other centre

30
commodities, goods and services in the State’s resources, agriculture, tourism, education and environmental science sectors.
However, in the ongoing economic growth and development of this sector there are a number of challenges that relate to the amenity, character, social cohesion and the capacity to deliver goods and services for some local communities.
Mining, oil and gas enterprises will continue to support local supply chains. The cost of construction in the resources sector (such as the cost of building materials, trades and allied professions) may require goods and services to be imported, which will add further challenges to local communities and place additional strain on the capacity of existing infrastructure.
To ensure the continued strength and resilience of the Northern sector it is important that regional centres have a local construction industry and higher education facilities that lead to enhanced employment opportunities.
A key challenge is to secure, attract and retain people and businesses not necessarily involved in the mining, oil and gas industries and to deliver a reasonable standard of social services.
The Pilbara Cities initiative will develop Port Hedland and Karratha into cities where people choose to settle on a permanent basis, a place to raise families with access to education, health and diverse employment and career opportunities. Broome is also a significant regional population centre, an air transport hub for the region and gateway to South East Asia.
The Canning Basin area holds significant mineral and petroleum resource potential. In the Rangelands, diversification of land uses will generate further economic opportunities, particularly tourism and agriculture.
Water resources will play an increasingly important role in enhancing the State’s food security, especially in the Ord River irrigation area and more generally in the Kimberley and the Pilbara hinterland.
Under the Ord-East Kimberley Expansion Project, Kununurra will become a vibrant, major regional centre. The project will also increase the size of the Ord irrigation area to about 22,000 ha of agricultural land.
This significant expansion, supported by a patchwork of agricultural prospects across the State, will provide opportunities for growth and a basis for improved community and common-use infrastructure.
Global political dynamics, regional energy security and increasing investment in nationally significant assets have resulted in the need for a greater defence presence.
This includes the need for infrastructure that can support strategic agricultural investments as well as regional defence operations and allow greater logistics access for humanitarian or military purposes.
The embracing and celebration of Aboriginal culture and the positive aspects of life in a remote region will instil a strong sense of place, belonging and community spirit.
Min
igw
al, n
orth
-eas
t of K
algo
orlie

31
Central sector
The Central sector (Figure 19) has a diverse economy underpinned by mining, agriculture, fisheries and tourism, contributing significantly to the Western Australian economy. The sector is set to further contribute to the nation’s mining, scientific, technological, research and innovation industries by 2050.
This sector encompasses some of the most iconic landscapes and diverse climatic conditions in Australia.
Shark Bay has three exceptional natural features: its vast sea-grass beds which are the largest and richest in the world; its dugong population; and its stromatolites, which are amongst the oldest forms of life on earth.
The Ningaloo Coast includes one of the longest near-shore reefs in the world. On land the site features an extensive karst system and network of underground caves and water courses, which support a variety of rare species that contribute to the exceptional biodiversity of the marine and terrestrial site.
It contains regional centres such as Geraldton and Esperance that offer strong lifestyle alternatives to Perth and have substantial growth potential with the investment of appropriate infrastructure. It also contains the most remote settlements in the State, where infrastructure and services will continue to be difficult to deliver.
Cropping in the Mid-West and Esperance and irrigated horticulture and agriculture in the Gascoyne are significant contributors to regional and export economies and food security. The Carnarvon irrigation district is set to undergo a 30% increase in its cultivated area in the near future.
The mining industry is a major contributor to the Central sector’s economy and the State’s gross product, with a diverse range of mineral resources including gold, iron ore, nickel and other metals.
Iron ore mining can become a major driver of the sector’s economy with investment in a number of projects at different stages of development, from exploration through to production and export.
The Oakajee Port and industry precinct has the potential to become one of Australia’s most significant industrial and resource downstream processing centres with the effective success of this zone dependant on the provision of key utilities such as power, water, gas and rail.
The Gascoyne Revitalisation Plan involves an investment by the State’s Royalties for Regions program into major infrastructure, headworks and community priority projects over six years commencing 2010-11.
Figure 19 - Central sector
The Mid West Investment Plan will see further investment to projects identified as strategic priorities and designed to have an impact across the Mid West region over the years to 2021.
Regional centre
Sub-regional centre (As defined by: WAPC regional hotspots; Regional Centres Development Plan [SuperTowns])
Other centre

32
projects for bauxite, gold, titanium-zircon (heavy mineral sands) and spodumene (lithium carbonate). Bauxite is processed into alumina at four refineries, making it one of the world’s largest alumina producing hubs. Heavy mineral sands are upgraded locally and processed into titanium dioxide pigment. The South West also produces all of the State’s coal supplies for electricity generation and other industrial uses. The total value of resource production for 2013 was $6.04 billion.
Challenges include the competition for land and water resources from urbanisation and other industry sectors. A balance between land development and the maintenance of conservation values is a key challenge.
Through the Government’s ‘Regional Centres Development Plan’ communities in the South West are being provided with the capabilities and resources to plan for and build strong and resilient regional communities.
The Government’s ‘Directions 2031 and Beyond’ spatial framework and strategic plan for the Perth and Peel regions foreshadows an increase in density and urban land supply.
A number of other regional planning strategies and region schemes outline landuse planning priorities and directives, including development controls, for each planning region. These include:
• Perth Metropolitan Region Scheme
• Peel Region Scheme
• Greater Bunbury Region Scheme
• Greater Bunbury Strategy
• South-West Framework
• Wheatbelt Land Use Planning Strategy
• Urban Development Program
• Lower Great Southern Strategy
• Economic and Employment Lands Strategy: Perth metropolitan and Peel regions.
South West sector
With a diverse economic base, the South West sector (Figure 20) provides a unique environment and lifestyle making it an attractive place to live, work and invest.
Projections indicate that the South West sector will continue to be the population centre of the State. This means that the highest level and greatest range of social services (health and education services, cultural activities) and employment opportunities will continue to be available in the South West.
Perth, the State’s capital, will remain a main international gateway to Western Australia and will function as its financial, administrative and social centre, while Bunbury is positioning to become the State’s second CBD.
The large majority of the sector lies within an international global biodiversity hotspot. The area’s native flora, approximately half of which is endemic, is especially impressive. It also has the highest concentration of rare and threatened species on the Australian continent. This unique biodiversity provides significant economic opportunities.
Agriculture plays a significant role within the South West sector, which will continue to supply fresh local food to Western Australia’s growing population. The Wheatbelt region alone contributes 35% of the State’s agricultural production.
Mining and downstream processing continues to be a key economic driver for the South West sector. The region hosts nationally and internationally significant resource
Figure 20 - South West sector
Regional centre
Sub-regional centre (As defined by: WAPC regional hotspots; Regional Centres Development Plan [SuperTowns])
Other centre

33
Interrelated State strategic directions
Shaping Western Australia to 2050 and beyond
There are many challenges ahead in the land-use planning and development of the State that requires a different way of thinking in order to achieve sustained growth and prosperity.
Based on research and collaboration across the State, the set of interrelated and interdependent strategic issues of key importance to Western Australia’s sustained growth and prosperity have been identified as:
• Economic development – Resources economy – Education, training and knowledge transfer – Tourism – Agriculture and food – Remote settlements – Land availability
• Physical infrastructure – Movement of people, resources
and information – Water – Energy – Waste – Telecommunications
• Social infrastructure – Spaces and places – Affordable living – Health and wellbeing
• Environment
• Security.
Each State strategic direction is structured in the same way except for the headline chapters of physical and social infrastructure (Table 1).
The pursuit of every objective in each strategic direction will require people and organisations involved in the land-use planning and development of Western Australia to work collaboratively, and to share information, ideas and resources.
Table 1 - Structure of strategic directions
STRATEGIC DIRECTION PURPOSE/FUNCTION
The objective The desired outcome of a strategic direction
Overview Summary of a strategic direction as it relates to the State’s sustained growth
Key facts The latest available information about a strategic direction
The approach Key elements of a strategic direction that will contribute to the objective
State challenges Issues that must be considered when undertaking the approach

34
Legend:
Economic activity area Infrastructure bandShipping laneService sector enterpriseIntensive cropping, livestock or horticultural enterprisesForestryTourismMajor roadRailway
International airport
Jandakot Airport
Major freight infrastructure
Port managed by a port authority
Port facility managed by others
Strategic industrial area
New strategic opportunities (industrial areas)
Capital city
Regional centreSub-regional centre (As defined by: WAPC regional hotspots; Regional Centres Development Plan [SuperTowns])
Other centre
Figure 21 - Planning for economic development

35
1. Economic development
Objective
To facilitate coordinated and sustainable economic development
To achieve sustained growth, Western Australia will improve its productivity, and maintain high rates of employment.
To enhance its global competitiveness and provide resilience to changing economic conditions, Western Australia will seize the opportunity to diversify its economy through innovation, research and development, in addition to capitalising on the State’s comparative advantages.
Innovation will drive productivity growth by enabling inputs such as capital and labour to be combined in new ways to produce higher value-added goods, services and increased efficiencies.
Investment in infrastructure will enhance productivity, and will attract global investment and the physical and human resources needed to sustain the State’s growth and prosperity.
Overview
Growth rates in Western Australia have been significantly higher than most other states and this is expected to continue.
This is part of an overall structural transition in the Australian economy that will result in Western Australia increasingly being home to some of Australia’s most important business activity.
While most jurisdictions in Australia and globally struggle to recover from the global economic downturn, Western Australia has prospered with strong population growth from inwards migration, major new resource project investment and an influx of new workers across engineering, financial and allied services.
In 2011-12 mining accounted for 34.6% of the Gross State Product (GSP), up from 15% 20 years earlier.
Western Australia’s mining, agriculture and energy sectors are built around long-term investments which satisfy growing global demand from countries like China and Japan. This can act as the platform for the long-term economic development of regional Western Australia.
It is a significant base from which to compete for global technical, scientific and entrepreneurial skills.
Competition for skills and labour will intensify as former low-cost countries like China and India commit to transforming their economies to ones based on education and technology.
The abundance of renewable energy resources and natural assets will be increasingly valuable as global technologies enhance the sustainable use of these resources.
A conscious effort to broaden the development of these assets to build diversification into and thereby enhance the State’s economic strength and resilience over time will be required.
Common use facilities can provide strategic industrial, research and global infrastructure to support regional economic development.
They can enable the ongoing development of a wide range of business and industry sectors including marine, oil and gas, mining, housing, construction, defence, paramilitary, emergency response and training and education related to research and development.
The State Government has implemented significant reform of the project approvals process through a ‘Lead Agency Framework’, to provide a more efficient and coordinated process for development decisions.
Key facts
• Western Australia is Australia’s premier growth state, with a quarterly State final demand value that has not decreased in trend terms for over 10 years, a record unmatched by any other State or Territory.
• Western Australia is part of a global economy. Its annual goods and services exports grew by 32.7% in 2010-11 and 16.2% per annum on average during the five years to 2010-11.
• The State’s economy is oriented towards Asia. China, Japan, South Korea and India are the State’s top export destinations and collectively accounted for 77% of the State’s total export value in 2012-13.
• In 2012-13, 66% of Australia’s mineral exports (by value) came from Western Australia. In 2012-13 the value of Western Australia’s mineral and petroleum production was nearly $104 billion and the value of resource projects either committed or under construction was $146 billion and a further $97 billion were planned or possible in coming years.
• In 2012, Western Australia accounted for 85% of national LNG exports, 100% of Australia’s crude oil exports and 98 per cent of its iron ore exports.
• Mining activity, with the sector’s gross value added growing on average 5% annually in the 10 years to June 2012, drove employment across all economic sectors. Together, the mining and the construction industries represented 18% of total employment in 2012-13. The Department of Education, Employment

36
and Workplace Relations projected growth in Western Australia’s total employment to average 1.8% annually over the years to November 2017.
• The value of agricultural production in 2011-12 was $7.2 billion, which included $2.8 billion of wheat or about one-third of Australia’s wheat production.
• The State’s building and construction industry contributes 11.7% towards GSP and employs 12.2% of the full-time workforce. Together with the mining industry, 25% of the full-time workforce is employed within these industries.
• The Western Australian marine industry leads in high speed ferries, car/passenger ferries, patrol boats and para-military vessels and luxury super yachts. In 2009 this industry’s output was $1.5 billion and its direct employment exceeded 6,000 people.
• The services sector, which includes financial, education, communications, tourism, legal, business and medical services, accounted for almost 40% of Western Australia’s GSP in 2010-2011.
• The Western Trade Coast, the region comprising the Kwinana Industrial Area, Rockingham Industry Zone, Latitude 32 Industry Zone and Australian Marine Complex, currently produces over $15 billion annually and employs over 11,000 people.
State challenges
Promoting the ongoing development of existing industries (such as mining, petroleum, tourism, agriculture, pastoralism and horticulture) alongside new emerging economies (such as health sciences, genetic mapping, animation and game development) will raise the State’s productivity.
A concerted effort will be required to further diversify the State’s economy. New strategies will be required to develop supportive environments for human and capital investment into emerging economies.
Recent economic growth in Western Australia and projected labour market shortages highlight the global competition for skilled workers as a critical element in future economic development. Global competiveness in the future will be largely defined in terms of the competition for talent.
Western Australia competes globally for skills successfully because it capitalises on the State’s assets; that is to link economic development opportunities to a high quality of life. This includes access to world-class cultural and artistic activities.
Attracting and retaining skilled people will become increasingly difficult, as they will have greater choice about where they live, work and develop businesses.
A key challenge will be creating the level of livability in the regions that can attract a varied workforce in order to stimulate and maintain diverse economic activity.
Attracting and retaining the right people will require planning and delivering world-class urban and rural environments, transport and social services (health, education, law and order).

37
Approach
Table 2 - A strategic approach to economic development
ELEMENT 2050 OUTCOMES MEASUREMENT ASPIRATIONS
Land availability Land is available to meet the needs of enterprise
Availability and affordability of land for enterprise
• A suitable and affordable supply of land is made available for the long-term needs of people across the State• Suitable land is allocated and zoned for enterprises, business and industry, including project ready industrial lands,
buffers and infrastructure• Crown land transactions are considered at the earliest stage of the land-use planning process and project
delivery initiatives
InfrastructureWA invests in infrastructure that stimulates productivity and economic growth
Infrastructure capacity and investment levels
• Infrastructure is well-connected and coordinated for modern living and emerging economies • WA operates on the technological frontier integrating the most modern infrastructure and ICT• WA responds to hard and soft infrastructure challenges with flexible financing and delivery approaches• Land is zoned or reserved for economic activity including strategic industrial sites and supporting infrastructure
and buffers
Global competiveness
WA out-competes other areas for global investment in a range of new enterprises
Attracted global capital
• The regions consistently attract and retain skilled workforce• Key regional centres emerge as global gateways that capture trade supply chains• WA consistently attracts global investment that enables emerging enterprise to develop and raise productivity• Perth continues to attract and retain corporate headquarters• The State’s airports and seaports provide increased access to global trade and resources• GSP/capita growth rate is maintained at 2% per annum
Economic diversity
The State’s economic diversity enables resilience to changing economic conditions
Economic resilience and diversity of the WA economy and regional areas
• WA continues to provide a range of goods and services to the global economy• WA provides international standard research infrastructure• The regions have become more economically diverse• WA has developed globally-recognised industries in the fields of medicine, agriculture, environmental science,
value-added manufacturing, tourism and game development
Industrial ecology and economic clusters
The State’s industrial areas are eco-efficient and encourage co-location of similar enterprises
Levels of efficiency, synergy and innovation in strategic industrial areas
• Industrial areas are structure planned to produce optimal output with minimal waste• Clusters of industry drive productivity and stimulate new ancillary businesses• Research and technology clusters support and foster economic diversity• All strategic industrial areas are developed to an approved structure plan
Innovation, knowledge, research and development
WA is a world leader in technological, organisational and service innovation
Level of innovation and creativity in WA for all areas of enterprise
• WA continues to be a world leader in mining and energy sectors, as well as in the supply of environmental and community services (health, education, culture and the arts)
• WA has built on research in the bio and life sciences to develop world class food processing centred on supply chain integrity and the targeted marketing of high value-added products
• WA continues to be a leading international education provider and a leading supplier of research services in science and technology

38
Legend:
Economic activity area Infrastructure bandPetroleum provinceMinerals resource provinceShipping laneMajor roadRailway
International airport
Jandakot Airport
Major freight infrastructure
Port managed by a port authority
Port facility managed by others
Strategic industrial area
New strategic opportunities (industrial areas)
Capital city
Regional centreSub-regional centre (As defined by: WAPC regional hotspots; Regional Centres Development Plan [SuperTowns])
Other centre
Figure 22 - Planning for the resources economy

39
1.1 The resources economy
Objective
To maintain and grow Western Australia as the destination of choice for responsible exploration and development of resources
Western Australia is one of the most resource-rich regions in the world.
The State will secure its long-term economic growth and prosperity by growing and developing its mineral, petroleum and geothermal energy resources through exploration activity and major project and infrastructure development.
Technology and innovation, enabled through the State’s internationally renowned mining services industries and research facilities, will contribute to the industry’s global competitiveness.
The State will be a stable partner for resources investment and supply in Asian markets. Industry and Government will continue to engage within and between regions to strengthen trade and international relationships.
Overview
The past decade saw high commodity prices and strong demand for Western Australia’s natural resources, driving industry investment to record levels.
During this period, the Western Australian economy increased its resource exports, with the sector accounting for more than a third of gross state product in 2012-13.
Western Australia is located strategically close to Asia’s growing economies. Growing demand for mineral and petroleum resources from the State’s regional trading partners underpins continuing resource investment.
Growth in the iron ore and liquefied natural gas (LNG) sectors has cemented the State as a major and reliable global supplier of these essential commodities.
A decade ago, Japan and China alone accounted for some 40% of the State’s merchandise exports and this proportion has now grown to almost 75%. In 2013, Western Australian iron ore production was 556 million tonnes, valued at $68 billion.
The resources economic cycle is moving beyond the peak in commodity prices and the intensive investment stage into a period of increased production and exports.
The State is well-positioned to increase exports of iron ore and LNG. Over the next four years, iron ore capacity is expected to grow to more than 692 million tonnes per year, and LNG from 21 million to about 50 million tonnes a year.
This growth is the result of new investments in LNG projects such as Pluto, Gorgon and Wheatstone and major iron ore expansions by BHP Billiton, Rio Tinto and Fortescue Metals Group.
Investment in the resources sector benefits the State and Australia. As the sector expands, direct and indirect labour demand increases.
Western Australia is already home to many multi-national resource companies and a leading centre for resource exploration, production innovation, research and development.
The State benefits directly from royalty revenues, which have increased from a 5% share to more than a 20% share of State revenue over the past decade.
In addition, large numbers of asset transactions provided the State with significant stamp duty revenues. This revenue enables the Government to provide more community services and essential infrastructure to support the growth of the State.
Much of the State’s economic activity occurs in remote regional areas and provides these areas with opportunities for development.
Despite challenges such as access to labour and services, infrastructure availability and high transport costs, the benefits that flow from the resources sector facilitate significant community and economic development throughout the State.
40
Key facts
• Western Australia experienced an average annual gross state product growth of 4.9% over the 10 years to June 2013. Economic growth, driven by mining investment and exports, reached a 10-year high in 2011-12, with 7.3% yearly growth. The 2013-14 State Budget expects growth of 3.25% in 2013-14 due to more subdued global commodity prices.
• In 2013, Western Australia accounted for 28% of global iron ore production and over 40% of world seaborne trade in iron ore.
• Western Australia’s economic development over the past decade was built on the growth of global commodity trade flows, as State merchandise exports grew from $32 billion in 2003 to $125 billion in 2013; of this total nearly $113 billion was attributable to mineral and petroleum exports. This represented a 15% average annual growth as Western Australian mining and petroleum exporters took advantage of growing global demand for their products.
• Western Australia is a globally significant producer of iron ore, LNG, zircon, garnet, alumina, nickel, diamonds, rutile, gold and salt. There are significant downstream processing facilities for minerals including bauxite (to alumina), ilmenite and rutile (to titanium dioxide pigment) and nickel (refined to metal).
• Iron ore dominates Western Australia’s exports, representing 41% of all Western Australian exports in the past 10 years to December 2013. Other exports included gold (15%), oil (10%) and LNG (8%). During this period, Western Australia was the largest global iron ore exporter.
• The Chinese, Japanese and South Korean markets represented jointly 79% of Western Australian merchandise exports in 2013. Demand in these markets is expected to moderate.
• The 2013-14 State Budget expects State exports to grow by 6.25% in 2013-14 and 4.5% in 2014-15, sustained largely by expansion of the State’s iron ore production.
• While exports represented 52% of Western Australia’s gross state product in the five years to June 2012, private investment represented 27% of gross state product. Business investment in the State grew 17% on average each year during the 10 years to June 2013. New capital investment in 2013 was $56 billion, including $47 billion of new capital expenditure from the mining industry.
• Investment in mineral and petroleum exploration is cyclical and dependent on commodity price fluctuations. In 2013, mineral exploration expenditure was $1.51 billion and petroleum exploration expenditure was $3 billion, representing 60% and 66% respectively of total exploration expenditure for Australia.
• Over the past decade, many world-class iron ore deposits were discovered in the Pilbara and Yilgarn regions.
• Western Australia’s iron ore exports grew from 216 to 556 million tonnes in the 10 years to 2013.
• The Pilbara region accounts for 95% of the State’s iron ore exports and has $149 billion of resource projects under construction or committed and a further $112 billion under consideration. These include Rio Tinto’s Cape Lambert port and rail expansion to 360 million tonnes per annum, expansion of its existing mines at Nammuldi, Yandicoogina and West Angelas, and further capacity increases from Fortescue Metals Group and Hancock Prospecting’s Roy Hill project.
• The Gorgon and Wheatstone LNG projects are worth approximately $56 billion and $30 billion respectively, with Gorgon 78% complete and Wheatstone 30% complete. Woodside’s North West Shelf extension, the North Rankin redevelopment, exported its first gas at the end of 2013, and the $2.5 billion Greater Western Flank Phase 1 gas field is under construction, with an estimated start-up in 2016.
• Significant shale-hosted petroleum resources in the onshore Canning, Carnarvon and Perth basins were identified recently.
• The Mid-West has over $8 billion of prospective projects comprising mainly magnetite iron ore, copper and uranium.
• The South West has at least $6 billion of planned or possible resource projects including the Perdaman Chemicals Coal to Urea plant, Boddington gold mine extension and the Collie South West Hub carbon capture and storage project.
• The Goldfields-Esperance region has $5.8 billion of planned or possible resource projects comprising mainly lithium, nickel, gold, iron ore, uranium and the Esperance port expansion.
• In the Kimberley region, $716 million of resource projects are awaiting environmental approvals for commodities including iron ore, silver, lead and zinc.
• There is $583 million of resource projects under construction or committed across the Goldfields-Esperance, South West and Mid-West regions of Western Australia.

41
Approach
Table 3 - A strategic approach to planning for the State’s resources economy
ELEMENT 2050 OUTCOMES MEASUREMENT ASPIRATIONS
Infrastructure
Western Australia invests in strategic infrastructure that stimulates productivity and growth in the resources sector
• Total infrastructure capacity
• Level of State investment in physical and community infrastructure
• Government and industry continue to collaborate in the planning and delivery of infrastructure across the State• Ongoing development of and access to multi-use infrastructure at key industry hubs• Flexible funding and financing approaches to infrastructure development are commonplace • Infrastructure bottlenecks and constraints are minimised
Project facilitation
Effective, transparent, timely and efficient administrative and regulatory systems
• Project approval timeliness
• Amount of resource investment
• Informed and timely project approvals in which the costs and time of doing business in the State continue to be minimised
• The State progressively reviews approvals systems to enhance their transparency and efficiency• Ongoing collaboration with the Australian Government to streamline project approval processes
Strategic industrial lands
Project-ready industrial land to meet the demands of the resources sector
• Number of established project ready industrial sites
• Level of investment in mining and petroleum processing
• Appropriate strategic industrial land and infrastructure to support priority sectors is available throughout the State• Strategic Industrial Lands developed to acceptable environmental standards to ensure ongoing investment and
sustainable economic growth
Downstream processing
Strong downstream processing industries, particularly in the low volume, high value, high technology Critical Minerals sector
• Total investment in profitable downstream processing of resources and value of processed products
• Western Australia is a world-leader in production and downstream processing of Critical Minerals (e.g. titanium metal, rare earth metals, lithium, tantalum)
• Continued investment to add value to resource products• Industrial ecology is maximised in the planning and operation of all strategic industrial areas
Investment
Western Australia is a destination of choice for foreign direct investment in mining and resource activities
• Level of foreign direct investment
• Significant infrastructure and resource projects are developed as a result of foreign direct investment• Investment returns are competitive with overseas destinations, attracting value adding processing and manufacturing
investment
Relationship with Asia
Western Australia has deepened business relationship with trading and investment partners in Asia
• Level of trade and exports to Asia
• Asian investment in infrastructure, resources and technologies
• Asian firms invest in long-term resource and infrastructure projects throughout the State• There is an ongoing productive dialogue with key Asian Governments and companies
Productivity
Western Australia can extract resources at low cost and continue to be internationally competitive
• Gross state product per capita
• Continuous productivity improvements maintain the State as an internationally competitive, low cost producer• High productivity attracts investment and minimises infrastructure requirements• Mineral and petroleum resource inventories and production are maintained or increased compared to 2013
Resource-based education
The resources sector has access to a highly skilled and flexible labour pool.
• Change in dependence on out-of-state and international skills
• WA continues to be a resources hub that attracts global talent • WA continues to be recognised for its leadership in exploration, mining and resource management• There is sufficient skilled local labour to maintain and expand industries allied to the resources sector• WA has world-leading resources-based educational institutions
Basic raw material (BRM) supply
Accessible and affordable supplies of BRM are available close to demand
• The cost of supplying basic raw materials to the building and construction industry
• Appropriate polices are in place to manage existing and future BRM supplies over the long term • BRM are optimally used for their highest purpose• The securing of BRM sites is managed through robust strategic sequential land use planning and development control
prior to final land use• Demand for BRM is partly managed through compact settlement structures that contain high-density built form.
Exploration and resource development
New discoveries of world-class resources continue to be made and developed in Western Australia
• Mineral and petroleum resource inventories and production are maintained or increased compared to 2013.
• Western Australia is the national and global destination of choice for responsible mineral and petroleum investment• The State maintains support for exploration activity and resource development through informed land-use and policy
decisions• Western Australia leads the world in exploration knowledge and technology• Collaboration with the Commonwealth Government enhances exploration activity

42
State challenges
Increased global resource supply and competition
The global resources investment environment is becoming more competitive. Emerging resource provinces and major projects in Africa and South and North America are targeting Western Australia’s major markets in Asia and competing with the State for potential mining and petroleum investment.
Global markets
The resources industry is not immune to global economic conditions. The industry’s proximity to expanding Asian economies is important, with China, Japan and South Korea accounting for around three-quarters of Western Australia’s mineral and petroleum exports. Changes in these economies will affect demand for Western Australian resources and foreign investment in the sector.
Commodity prices and exchange rates
Most of Western Australia’s commodity exports are traded internationally and priced in US dollars, leaving the industry exposed to fluctuations in both commodity prices and international exchange rates. While the exchange rate often acts as a ‘stabiliser’ in response to major commodity price changes, volatility in both of these factors creates management challenges for industry, in terms of international competitiveness and profitability, and for government, primarily through the impact on royalty revenues.
Industry costs and productivity
Increasing capital and operating costs, especially labour costs, affect profitability. Commodity price easing for minerals including iron ore, nickel and alumina has emphasised these cost factors, resulting in project and expansion deferrals and a shift in focus to cost management.
High construction labour costs and capital borrowing difficulties are affecting new ‘greenfield’ project decisions, especially where new infrastructure is a key component. Industry is developing new technologies, such as remote
operations, to further manage costs and improve productivity.
Exploration
Ongoing exploration is essential to the discovery of new deposits for a sustainable mining and petroleum industry. Access to land is fundamentally important. Exploration is a high-risk and capital-intensive activity and increased costs, time delays, and complex approvals process act as a disincentive. This could encourage a shift in exploration investment to other parts of the world considered to have more competitive investment environments with similarly prospective geology. The State needs to maintain support for exploration activity and resource development through informed land use and policy decisions.
Governance
Commonwealth-State relations affect resource project approval processes, particularly in relation to offshore petroleum developments and onshore environmental approvals.
Australian Government involvement in environmental approval issues increases demands on the State to ensure legislative processes are robust and efficient.
Technology that can streamline process management in regulatory and approval functions is also essential to maintain and improve competitiveness.
Industrial lands
Export-oriented heavy industries often require land in strategic industrial areas. These areas generally have multiple proponents and require efficient access to key transport infrastructure. Land suitable for strategic industrial areas is limited and cannot be easily replicated or replaced.
Strategic industrial areas are of significant economic and strategic importance for the State, and require suitable and appropriate integration with surrounding compatible land uses and buffer areas to ensure long-term sustainability.
Regional attractiveness
The attractiveness of regional living and settlements remains a challenge for the resources sector. Improving housing affordability, investment in infrastructure, including multi-use infrastructure, creating attractive places and the delivery of key services will enable a level of liveability that retains families, as well as attracting and growing a regional workforce.
Of particular importance to the State’s resources economy will be the planning of:
• regional centres and towns that are desirable places to live;
• regional towns that have services comparable to regional centres; and
• resource projects which can source the majority of their needs from regional supply chains and local knowledge where practical.
Basic raw materials
All industrial, commercial and residential development requires basic raw materials. Beyond construction basic raw materials also have a significant role in mineral processing and refining and in agriculture, and are subject to conflicting supply and access demands.
Development can sterilise resources close to the urban front by limiting extraction, resulting in increased pressure on distant sources. The resultant transport requirements increase direct and other costs, including an increased carbon footprint, congestion and road safety. To maintain current living standards, sand, limestone, rock aggregate and clay need to be affordable.
This presents a challenge for structure planning as supplies of basic raw materials affect the development and industrial capability of Western Australia. The challenge requires an integrated long-term view of current and future sources, improved rehabilitation and post-extraction capabilities, that leads to planning within a multiple land-use framework.
43
1.2. Education, training and knowledge transfer
Objective
Western Australia becomes globally competitive as a creative, innovative and knowledge-based economy
Stimulating knowledge and innovation within the State’s economy allows Western Australia to maintain its economic competitiveness and fully develop and diversify the workforce.
Science, technology, innovation and research will be important contributors to the State’s economy in the future. This strategy promotes increased education and research in traditional sectors, most notably regional knowledge-based industries.
Education will aim to achieve excellence and equity for every student, whatever their ability, whatever their circumstance, whatever their background and wherever they live.
Delivering educational outcomes and training opportunities for Aboriginal communities ‘in place’ will help communities to prosper and grow. Schooled young people who become lifelong learners will help meet the changing needs of their community and the State.
Maintaining and retaining a well-educated and highly trained population and associated workforce will ensure the State continues to be both nationally and internationally competitive.
Through the development of regional education centres, creative knowledge clusters, and virtual classrooms supported by world class information technologies, Western Australia will be better able to compete in the emerging knowledge-based economy.
This provides trading opportunities in the transfer of knowledge with other countries, particularly within the South East Asian market. It also maximises employment opportunities, ensuring a more equitable delivery between metropolitan and regional centres.
Overview
Enabling creativity and knowledge is both vital to the social wellbeing of communities and at the same time critical to advancing the Western Australian economy.
A focus on literacy and numeracy is key to the success of youth education. Confident learners are more able to adapt to the changing needs of the workforce. Improvements in telecommunications will assist in delivering learning across the State.
The changing nature of work and the increased knowledge and skill requirements across occupations will necessitate the development of more innovative, flexible and accessible training opportunities. This will provide greater opportunity for the State’s workforce to better participate in the global knowledge economy.
Embracing the knowledge-based economy will change the make-up of the workforce and require higher levels of education, training and skills development. For example, the Square Kilometre Array is building Western Australia’s capacity in radio astronomy, engineering and information communications technology.
The education sector has a major role in ensuring young people are prepared for relevant post-school options to enter and participate more fully in the workforce, higher education or vocational training, including for apprenticeships.
Some emerging economies, such as China and India, are making major investments in knowledge capital as part of their transformation away from their traditional role as low cost labour countries. This presents Western Australia with opportunities in the transfer of education, training and knowledge.
Innovation refers to the creation of both new economic opportunities by the application of new knowledge and technology and economic growth by using resources more efficiently. A culture of innovation across the economy will help to improve productivity and competitiveness.
Planning for education, training and knowledge transfer is an approach to secure innovation and a skilled workforce vital to drive enterprise.
One such initiative is the Construction Training Fund, which provides support for apprentices and trainees, as well as for industry workers, to upgrade their skills.
The State’s existing technology and research base, rapid growth, strong economy and mobile workforce provide significant opportunities for strengthening innovative and creative industries.
Creative industries include: music and the performing arts; film, television and radio; advertising and marketing; software development; writing; print and digital media; graphic design and visual arts. Planning for these industries is important because they contribute significantly to the State’s economy by providing a major new source of employment
Key facts• In 2013, 419,493 students attended government
and non-government schools. Since 2011, total enrolments have increased by 20,000.
• By 2023, it is projected that the number of students receiving primary and secondary education will increase by 150,000.
• Western Australia has five universities which offer regional programs and hosts a number of Centres of Excellence, Cooperative Research Centres and other major research facilities.
• Western Australian education exports were valued at $1.2 billion in 2010-11.
• Research predicts that Western Australia’s need for tertiary and professional skills will outweigh vocation and trades-based skills.
• While growth in labour demand in the State is expected to be somewhat moderate over the next few years, broadly similar trends are expected for labour supply. These are key reasons why the State Budget has forecast unemployment rates for Western Australia of around 5.25% to 5.75% to 2016-17.

44
• Perth’s creative industry segments employed almost 40,000 people and contributed $4.6 billion to the metropolitan economy in 2006. The flow-on value was an additional $6 billion, bringing their total contribution to more than $10 billion. In April 2006 there were 11,000 businesses registered for GST in Perth’s creative economy, representing 6.6% of firms across all industries.
• Projections from Monash University show that employment growth in Western Australia out to 2016-17 is expected to come mostly from those jobs requiring a Certificate Level III vocational qualification or higher.
• The Australian Innovation Report 2011 suggests innovation will account for 62% of Australia’s productivity growth in the long term.
• Western Australia’s research and development expenditure was $4.6 billion in 2008-09, out of a total $27.7 billion for Australia.
• Western Australia’s higher education research and development as a proportion of GSP is equivalent to the OECD average.
• Western Australian government’s expenditure on research and development as a proportion of GSP is just below the Australian average; however, this ratio is impacted by the size of the Western Australian economy. On a per capita basis, the Western Australian Government is one of the leading investors in research.
• In 2009-10, Western Australia had the highest levels of business expenditure on research and development (BERD) as a proportion of GSP (1.59%). Western Australia’s BERD as a proportion of GSP has been well above the Australian average since 2004-05.
• The Square Kilometre Array radio telescope is a $2.5 billion global project, with its low-frequency portion to be built in the Murchison area by 2020.
State challenges
Workforce and skills development are critical to capturing and creating knowledge. Current projections indicate Western Australia will not have enough skilled workers to meet the future demands of industry.
Coupled with this, the State consistently loses creative capital and innovative enterprise nationally and internationally to jurisdictions that better foster and support these sectors.
Western Australia must be able to compete not only for project investment but also for the human capital to support this investment.
Competing in a global economy means Western Australia will need to improve the attraction and retention of highly skilled populations.
A challenge will be to further improve educational facilities, broad-based cultural learning, accessibility to educational opportunities and greater investment in research and development.
Of particular importance is the provision of educational opportunities for 18 – 25 year olds in regional centres. Addressing this challenge will enhance the economic diversity, technological expertise and attractiveness of the State.
Equally as important as attracting global talent to Western Australia is the nurturing of talented people in order to stimulate new ideas and research entrepreneurship.
This will require ongoing commitment to the institutions and businesses that develop talent, such as universities, vocational institutes, creative industries and the school system.
Improving housing affordability, investment in infrastructure, creating attractive places and the delivery of key services in the regions will create a level of liveability that can retain rural families, as well as attract a varied regional workforce, in order to both stimulate and maintain education, training and knowledge transfer there.
Telecommunications facilities are also crucial to improving regional and remote education and training outcomes.
Improved teacher training and accessibility to training opportunities will enable a student-centred, demand-driven training entitlement model to develop that responds to the specific skills needs of the State.
The current reforms in the Vocational Education and Training sector aim to drive improvements in quality training, consumer information, and accessibility to training opportunities. These reforms will lead to a training system which is more responsive to the needs of students, employers and industry.
A key component of current reforms is the introduction of Future Skills WA, a new way in which training is subsidised and delivered in Western Australia.
Future Skills WA will provide guaranteed access to priority training opportunities, greater student choice of training provider, investment in skills to meet current and future industry needs and a sustainable training system.

45
Approach
Table 4 - A strategic approach to planning for education, training and knowledge transfer
ELEMENT 2050 OUTCOMES MEASUREMENT ASPIRATIONS
Knowledge and learning
The State provides world class educational opportunities
Knowledge and education attainment levels
Number of educational institutions, plus their supporting facilities and programs
• Leader in educational and research activity associated with the mining and energy sectors, health, agriculture and environmental management
• Regional knowledge-based industries stimulate economic activity• Specific programs for Aboriginal education and skills training are commonplace across the regions • Consistently high levels of funding for research and development• More regional educational infrastructure through greater use of technology and e-learning• Major university hubs compete globally for students, researchers and investment• Perth is globally recognised as a ‘knowledge city’
Creativity and innovation
Increase in innovative enterprise and net gain in creative capital
Employment and economic value of creative industries
Level of innovation and creativity in the resource sector
Number of recognised centres of excellence
• WA is a world leader in resource-focussed service innovation• A high diversity and number of creative industries locate within WA• Innovative enterprises choose to locate in regional areas• WA consistently attracts and retains creative human capital and industries • Creative, knowledge and industry clusters are established throughout the State• The continued development of cultural infrastructure (such as the new WA Museum) results in a world-class
arts and culture sector• WA is a globally recognised leader in the mining and energy sectors, as well as environmental and resource
technologies and services.• WA is a global centre of excellence for mining support and research
Research and development
WA is a world leader in science, technological and services research
Level of research and development in WA
Level of funding for research and development
• WA is a world leader in resource technologies and services for the mining, agriculture and energy sectors• WA continues to be a leading supplier of research services in environmental sciences and technology• WA is a world leader in the number of patents
Workforce and skill development
The State attracts, develops and retains skilled workers
Skill levels and diversity of the workforce
Rates of workforce attraction and retention
Change in dependence on out-of-State and international skills
• Regional communities are desirable places to live• Exceptional educational infrastructure for skills development• Timely systems and processes for skilled migration to the State• Skilled Western Australians are retained in the State• WA continues to be a resources hub, which attracts global talent • WA continues to be renowned for its leadership in exploration, mining and resource management• WA has world-leading resources-based education institutions• The resources sector continues to have access to a highly skilled and flexible labour pool