state report 11.08.2020 oklahoma
TRANSCRIPT
COVID-19
The purpose of this report is to develop a shared understanding of the current status of the pandemic at the national, regional, state and
local levels. We recognize that data at the state level may differ from that available at the federal level. Our objective is to use consistent
data sources and methods that allow for comparisons to be made across localities. We appreciate your continued support in identifying data
discrepancies and improving data completeness and sharing across systems. We look forward to your feedback.
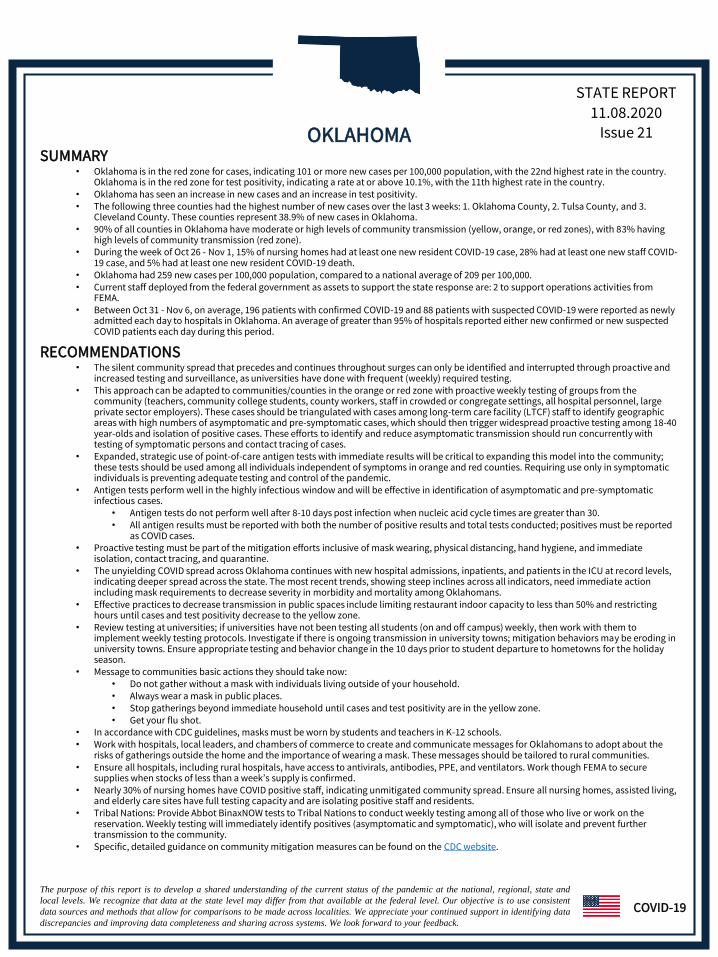
STATE REPORT11.08.2020
Issue 21
SUMMARY• Oklahoma is in the red zone for cases, indicating 101 or more new cases per 100,000 population, with the 22nd highest rate in the country.
Oklahoma is in the red zone for test positivity, indicating a rate at or above 10.1%, with the 11th highest rate in the country.• Oklahoma has seen an increase in new cases and an increase in test positivity.• The following three counties had the highest number of new cases over the last 3 weeks: 1. Oklahoma County, 2. Tulsa County, and 3.
Cleveland County. These counties represent 38.9% of new cases in Oklahoma.• 90% of all counties in Oklahoma have moderate or high levels of community transmission (yellow, orange, or red zones), with 83% having
high levels of community transmission (red zone).• During the week of Oct 26 - Nov 1, 15% of nursing homes had at least one new resident COVID-19 case, 28% had at least one new staff COVID-
19 case, and 5% had at least one new resident COVID-19 death.• Oklahoma had 259 new cases per 100,000 population, compared to a national average of 209 per 100,000.• Current staff deployed from the federal government as assets to support the state response are: 2 to support operations activities from
FEMA.• Between Oct 31 - Nov 6, on average, 196 patients with confirmed COVID-19 and 88 patients with suspected COVID-19 were reported as newly
admitted each day to hospitals in Oklahoma. An average of greater than 95% of hospitals reported either new confirmed or new suspected COVID patients each day during this period.
RECOMMENDATIONS• The silent community spread that precedes and continues throughout surges can only be identified and interrupted through proactive and
increased testing and surveillance, as universities have done with frequent (weekly) required testing.• This approach can be adapted to communities/counties in the orange or red zone with proactive weekly testing of groups from the
community (teachers, community college students, county workers, staff in crowded or congregate settings, all hospital personnel, large private sector employers). These cases should be triangulated with cases among long-term care facility (LTCF) staff to identify geographic areas with high numbers of asymptomatic and pre-symptomatic cases, which should then trigger widespread proactive testing among 18-40 year-olds and isolation of positive cases. These efforts to identify and reduce asymptomatic transmission should run concurrently with testing of symptomatic persons and contact tracing of cases.
• Expanded, strategic use of point-of-care antigen tests with immediate results will be critical to expanding this model into the community; these tests should be used among all individuals independent of symptoms in orange and red counties. Requiring use only in symptomatic individuals is preventing adequate testing and control of the pandemic.
• Antigen tests perform well in the highly infectious window and will be effective in identification of asymptomatic and pre-symptomatic infectious cases.
• Antigen tests do not perform well after 8-10 days post infection when nucleic acid cycle times are greater than 30.• All antigen results must be reported with both the number of positive results and total tests conducted; positives must be reported
as COVID cases.• Proactive testing must be part of the mitigation efforts inclusive of mask wearing, physical distancing, hand hygiene, and immediate
isolation, contact tracing, and quarantine.• The unyielding COVID spread across Oklahoma continues with new hospital admissions, inpatients, and patients in the ICU at record levels,
indicating deeper spread across the state. The most recent trends, showing steep inclines across all indicators, need immediate action including mask requirements to decrease severity in morbidity and mortality among Oklahomans.
• Effective practices to decrease transmission in public spaces include limiting restaurant indoor capacity to less than 50% and restricting hours until cases and test positivity decrease to the yellow zone.
• Review testing at universities; if universities have not been testing all students (on and off campus) weekly, then work with them to implement weekly testing protocols. Investigate if there is ongoing transmission in university towns; mitigation behaviors may be eroding in university towns. Ensure appropriate testing and behavior change in the 10 days prior to student departure to hometowns for the holiday season.
• Message to communities basic actions they should take now:• Do not gather without a mask with individuals living outside of your household.• Always wear a mask in public places.• Stop gatherings beyond immediate household until cases and test positivity are in the yellow zone.• Get your flu shot.
• In accordance with CDC guidelines, masks must be worn by students and teachers in K-12 schools.• Work with hospitals, local leaders, and chambers of commerce to create and communicate messages for Oklahomans to adopt about the
risks of gatherings outside the home and the importance of wearing a mask. These messages should be tailored to rural communities.• Ensure all hospitals, including rural hospitals, have access to antivirals, antibodies, PPE, and ventilators. Work though FEMA to secure
supplies when stocks of less than a week’s supply is confirmed.• Nearly 30% of nursing homes have COVID positive staff, indicating unmitigated community spread. Ensure all nursing homes, assisted living,
and elderly care sites have full testing capacity and are isolating positive staff and residents.• Tribal Nations: Provide Abbot BinaxNOW tests to Tribal Nations to conduct weekly testing among all of those who live or work on the
reservation. Weekly testing will immediately identify positives (asymptomatic and symptomatic), who will isolate and prevent further transmission to the community.
• Specific, detailed guidance on community mitigation measures can be found on the CDC website.
OKLAHOMA

COVID-19
SNFs WITH ≥1 NEW RESIDENT COVID-19 CASE
15% +1%* 17% 15%
SNFs WITH ≥1 NEW STAFF COVID-19 CASE
28% +3%* 28% 29%
SNFs WITH ≥1 NEW RESIDENT COVID-19 DEATH
5% +0%* 6% 5%
STATE
STATE, % CHANGE FROM PREVIOUS
WEEK FEMA/HHS REGION UNITED STATES
NEW COVID-19 CASES (RATE PER 100,000)
10,257(259)
+34%80,966(190)
687,656(209)
VIRAL (RT-PCR) LAB TEST POSITIVITY RATE
15.0% +2.4%* 10.2% 8.4%
TOTAL VIRAL (RT-PCR) LAB TESTS (TESTS PER 100,000)
30,814**(779**)
+6%**645,005**(1,510**)
7,362,570**(2,243**)
COVID-19 DEATHS (RATE PER 100,000)
103(2.6)
+12%1,089(2.5)
6,542(2.0)
* Indicates absolute change in percentage points.** Due to delayed reporting, this figure may underestimate total diagnostic tests and week-on-week changes in diagnostic tests.
DATA SOURCES – Additional data details available under METHODS
Note: Some dates may have incomplete data due to delays in reporting. Data may be backfilled over time, resulting in week-to-week changes.Cases and Deaths: State values are calculated by aggregating county-level data from USAFacts; therefore, the values may not match those reported directly by the state. Data is through 11/6/2020; previous week is 10/24 - 10/30.Testing: CELR (COVID-19 Electronic Lab Reporting) state health department-reported data through 11/4/2020. Previous week is 10/22 - 10/28.SNFs: Skilled nursing facilities. National Healthcare Safety Network. Data are reported separately for cases among residents and staff. Data is through 11/1/2020, previous week is 10/19-10/25. Facilities that are undergoing reporting quality review are not included in the table, but may be included in other NHSN analyses.
STATE REPORT | 11.08.2020
OKLAHOMA
Issue 21

NE
W C
AS
ES
TE
ST
ING
COVID-19
STATE REPORT | 11.08.2020
OKLAHOMA
DATA SOURCES – Additional data details available under METHODS
Note: Some dates may have incomplete data due to delays in reporting. Data may be backfilled over time, resulting in week-to-week changes.Cases: State values are calculated by aggregating county-level data from USAFacts; therefore, the values may not match those reported directly by the state. Data is through 11/6/2020.Testing: HHS Protect laboratory data (provided directly to Federal Government from public health labs, hospital labs, and commercial labs) through 11/4/2020.
TO
P C
OU
NT
IES
Top counties based on greatest number of new cases in last three weeks (10/17 - 11/6)
Issue 21

COVID-19H
OS
PIT
AL
AD
MIS
SIO
NS
HO
SP
ITA
L P
PE
SU
PP
LIE
S
STATE REPORT | 11.08.2020
OKLAHOMA
DATA SOURCES – Additional data details available under METHODS
Hospitalizations: Unified hospitalization dataset in HHS Protect. These data exclude psychiatric, rehabilitation, and religious non-medical hospitals. In addition, hospitals explicitly identified by states/regions as those from which we should not expect reports were excluded from the percent reporting figure.PPE: Unified hospitalization dataset in HHS Protect. These data exclude psychiatric, rehabilitation, and religious non-medical hospitals. In addition, hospitals explicitly identified by states/regions as those from which we should not expect reports were excluded from the percent reporting figure. Values presented show the latest reports from hospitals in the week ending 11/4/2020.
132 hospitals are expected to report in Oklahoma
Issue 21
COVID-19
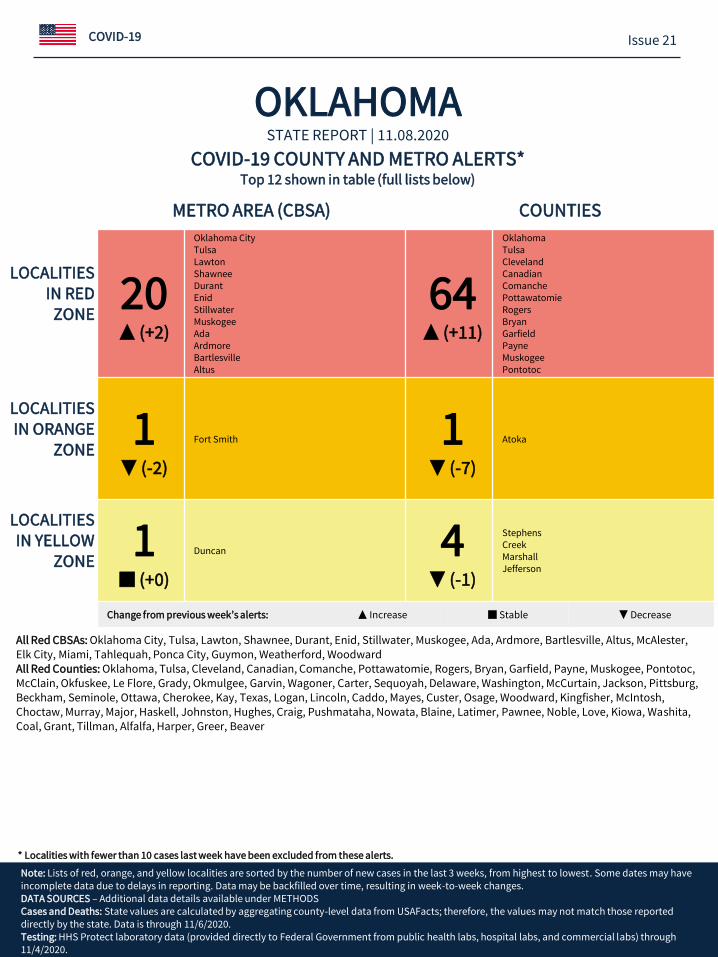
* Localities with fewer than 10 cases last week have been excluded from these alerts.
STATE REPORT | 11.08.2020
OKLAHOMA
Note: Lists of red, orange, and yellow localities are sorted by the number of new cases in the last 3 weeks, from highest to lowest. Some dates may have incomplete data due to delays in reporting. Data may be backfilled over time, resulting in week-to-week changes.DATA SOURCES – Additional data details available under METHODSCases and Deaths: State values are calculated by aggregating county-level data from USAFacts; therefore, the values may not match those reported directly by the state. Data is through 11/6/2020.Testing: HHS Protect laboratory data (provided directly to Federal Government from public health labs, hospital labs, and commercial labs) through 11/4/2020.
COVID-19 COUNTY AND METRO ALERTS*Top 12 shown in table (full lists below)
METRO AREA (CBSA) COUNTIES
LOCALITIES IN RED
ZONE20▲ (+2)
Oklahoma CityTulsaLawtonShawneeDurantEnidStillwaterMuskogeeAdaArdmoreBartlesvilleAltus
64▲ (+11)
OklahomaTulsaClevelandCanadianComanchePottawatomieRogersBryanGarfieldPayneMuskogeePontotoc
LOCALITIES IN ORANGE
ZONE1
▼ (-2)
Fort Smith 1▼ (-7)
Atoka
LOCALITIES IN YELLOW
ZONE1
■ (+0)
Duncan 4▼ (-1)
StephensCreekMarshallJefferson
Change from previous week’s alerts: ▲ Increase ■ Stable ▼ Decrease
All Red CBSAs: Oklahoma City, Tulsa, Lawton, Shawnee, Durant, Enid, Stillwater, Muskogee, Ada, Ardmore, Bartlesville, Altus, McAlester, Elk City, Miami, Tahlequah, Ponca City, Guymon, Weatherford, WoodwardAll Red Counties: Oklahoma, Tulsa, Cleveland, Canadian, Comanche, Pottawatomie, Rogers, Bryan, Garfield, Payne, Muskogee, Pontotoc, McClain, Okfuskee, Le Flore, Grady, Okmulgee, Garvin, Wagoner, Carter, Sequoyah, Delaware, Washington, McCurtain, Jackson, Pittsburg, Beckham, Seminole, Ottawa, Cherokee, Kay, Texas, Logan, Lincoln, Caddo, Mayes, Custer, Osage, Woodward, Kingfisher, McIntosh,Choctaw, Murray, Major, Haskell, Johnston, Hughes, Craig, Pushmataha, Nowata, Blaine, Latimer, Pawnee, Noble, Love, Kiowa, Washita, Coal, Grant, Tillman, Alfalfa, Harper, Greer, Beaver
Issue 21

TO
TA
L D
AIL
Y C
AS
ES
COVID-19
DATA SOURCES – Additional data details available under METHODS
Cases: State values are calculated by aggregating county-level data from USAFacts; therefore, the values may not match those reported directly by the state. Data is through 11/6/2020. Last 3 weeks is 10/17 - 11/6.
Top 12 counties based on number of new cases in the last 3 weeks
Issue 21
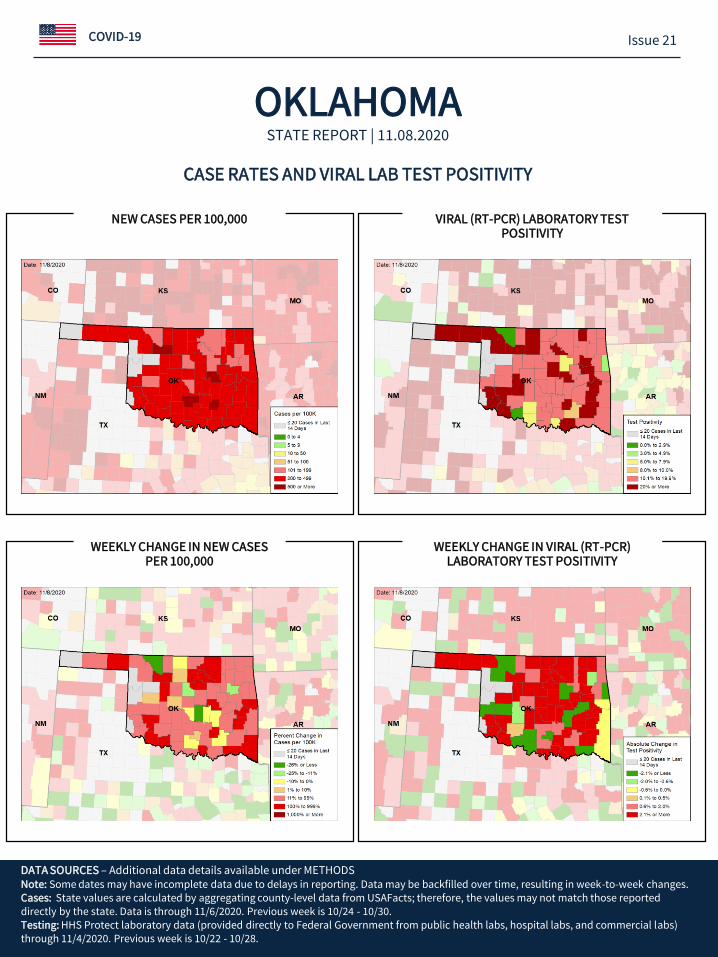
CASE RATES AND VIRAL LAB TEST POSITIVITY
COVID-19
NEW CASES PER 100,000 VIRAL (RT-PCR) LABORATORY TEST POSITIVITY
WEEKLY CHANGE IN NEW CASES PER 100,000
WEEKLY CHANGE IN VIRAL (RT-PCR) LABORATORY TEST POSITIVITY
DATA SOURCES – Additional data details available under METHODSNote: Some dates may have incomplete data due to delays in reporting. Data may be backfilled over time, resulting in week-to-week changes.Cases: State values are calculated by aggregating county-level data from USAFacts; therefore, the values may not match those reporteddirectly by the state. Data is through 11/6/2020. Previous week is 10/24 - 10/30.Testing: HHS Protect laboratory data (provided directly to Federal Government from public health labs, hospital labs, and commercial labs) through 11/4/2020. Previous week is 10/22 - 10/28.
STATE REPORT | 11.08.2020
OKLAHOMA
Issue 21
COVID-19
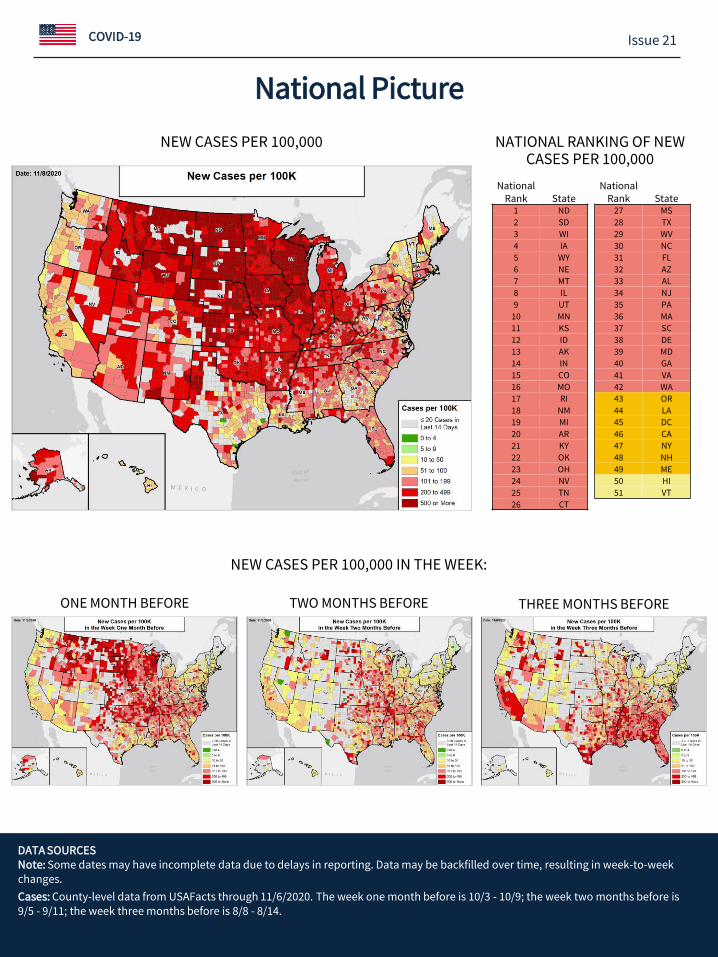
National Picture
ONE MONTH BEFORE THREE MONTHS BEFORETWO MONTHS BEFORE
NEW CASES PER 100,000 NATIONAL RANKING OF NEW CASES PER 100,000
NEW CASES PER 100,000 IN THE WEEK:
DATA SOURCESNote: Some dates may have incomplete data due to delays in reporting. Data may be backfilled over time, resulting in week-to-week changes.
Cases: County-level data from USAFacts through 11/6/2020. The week one month before is 10/3 - 10/9; the week two months before is 9/5 - 9/11; the week three months before is 8/8 - 8/14.
NationalRank State
1 ND
2 SD
3 WI
4 IA
5 WY
6 NE
7 MT
8 IL
9 UT
10 MN
11 KS
12 ID
13 AK
14 IN
15 CO
16 MO
17 RI
18 NM
19 MI
20 AR
21 KY
22 OK
23 OH
24 NV
25 TN
26 CT
NationalRank State
27 MS
28 TX
29 WV
30 NC
31 FL
32 AZ
33 AL
34 NJ
35 PA
36 MA
37 SC
38 DE
39 MD
40 GA
41 VA
42 WA
43 OR
44 LA
45 DC
46 CA
47 NY
48 NH
49 ME
50 HI
51 VT
Issue 21

COVID-19
National Picture
ONE MONTH BEFORE THREE MONTHS BEFORETWO MONTHS BEFORE
VIRAL (RT-PCR) LAB TEST POSITIVITY NATIONAL RANKING OF TEST POSITIVITY
VIRAL (RT-PCR) LAB TEST POSITIVITY IN THE WEEK:
DATA SOURCESNote: Some dates may have incomplete data due to delays in reporting. Data may be backfilled over time, resulting in week-to-week changes.
Testing: Combination of CELR (COVID-19 Electronic Lab Reporting) state health department-reported data and HHS Protect laboratory data (provided directly to Federal Government from public health labs, hospital labs, and commercial labs) through 11/4/2020. Tthe week one month before is 10/1 - 10/7; the week two months before is 9/3 - 9/9; the week three months before is 8/6 - 8/12.
NationalRank State
1 MT
2 ID
3 SD
4 IA
5 KS
6 NE
7 ND
8 MO
9 UT
10 WI
11 OK
12 MN
13 NV
14 NM
15 IN
16 IL
17 TN
18 TX
19 CO
20 MS
21 AL
22 MI
23 WY
24 KY
25 AK
26 SC
NationalRank State
27 AR
28 VA
29 AZ
30 GA
31 OH
32 NC
33 PA
34 FL
35 OR
36 NJ
37 CT
38 WV
39 MD
40 WA
41 LA
42 DE
43 RI
44 NH
45 CA
46 HI
47 ME
48 NY
49 DC
50 MA
51 VT
Issue 21

COVID-19
National Picture
ONE MONTH BEFORE THREE MONTHS BEFORETWO MONTHS BEFORE
NEW DEATHS PER 100,000 NATIONAL RANKING OF NEW DEATHS PER 100,000
NEW DEATHS PER 100,000 IN THE WEEK:
DATA SOURCESNote: Some dates may have incomplete data due to delays in reporting. Data may be backfilled over time, resulting in week-to-week changes.
Deaths: County-level data from USAFacts through 11/6/2020. The week one month before is 10/3 - 10/9; the week two months before is 9/5 - 9/11; the week three months before is 8/8 - 8/14.
NationalRank State
1 ND
2 SD
3 AR
4 MT
5 WI
6 KS
7 IN
8 NM
9 IA
10 MO
11 WY
12 MS
13 ID
14 TN
15 IL
16 NE
17 MN
18 OK
19 AZ
20 AL
21 NC
22 TX
23 WV
24 NV
25 MI
26 RI
NationalRank State
27 SC
28 GA
29 MA
30 LA
31 OH
32 CO
33 NY
34 CT
35 KY
36 UT
37 PA
38 FL
39 DE
40 OR
41 WA
42 MD
43 NJ
44 DC
45 CA
46 VA
47 NH
48 AK
49 ME
50 HI
51 VT
Issue 21

COVID-19
METHODS
Metric Dark Green Light Green Yellow Orange Red
New cases per 100,000 population per week ≤4 5 – 9 10 – 50 51 – 100 ≥101
Percent change in new cases per 100,000 population ≤-26% -25% – -11% -10% – 0% 1% – 10% ≥11%
Diagnostic test result positivity rate ≤2.9% 3.0% – 4.9% 5.0% – 7.9% 8.0% – 10.0% ≥10.1%
Change in test positivity ≤-2.1% -2.0% – -0.6% -0.5% – 0.0% 0.1% – 0.5% ≥0.6%
Total diagnostic tests resulted per 100,000 population per week
≥2001 1001 – 2000 750 – 1000 500 – 749 ≤499
Percent change in tests per 100,000 population ≥26% 11% – 25% 1% – 10% -10% – 0% ≤-11%
COVID-19 deaths per 100,000 population per week 0.0 0.1 – 1.0 1.1 – 2.0 ≥2.1
Percent change in deaths per 100,000 population ≤-26% -25% – -11% -10% – 0% 1% – 10% ≥11%
Skilled Nursing Facilities with at least one resident COVID-19 case, death
0% 1% – 5% ≥6%
Change in SNFs with at least one resident COVID-19case, death
≤-2% -1% – 1% ≥2%
STATE REPORT | 11.08.2020
• Some dates may have incomplete data due to delays in reporting. Data may be backfilled over time, resulting in week-to-week changes. It is critical that states provide as up-to-date data as possible.
• Cases and deaths: County-level data from USAFacts as of 22:13 EST on 11/08/2020. State values are calculated by aggregating county-level data fromUSAFacts; therefore, values may not match those reported directly by the state. Data are reviewed on a daily basis against internal and verified external sources and, if needed, adjusted. Last week data are from 10/31 to 11/6; previous week data are from 10/24 to 10/30; the week one month before data are from 10/3 to 10/9.
• Testing: The data presented represent viral COVID-19 laboratory diagnostic and screening test (reverse transcription polymerase chain reaction, RT-PCR) results—not individual people—and exclude antibody and antigen tests, unless stated otherwise. CELR (COVID-19 Electronic Lab Reporting) state health department-reported data are used to describe county-level viral COVID-19 laboratory test (RT-PCR) result totals when information is available on patients’ county of residence or healthcare providers’ practice location. HHS Protect laboratory data (provided directly to Federal Government from public health labs, hospital labs, and commercial labs) are used otherwise. Some states did not report on certain days, which may affect the total number of tests resulted and positivity rate values. Because the data are deidentified, total viral (RT-PCR) laboratory tests are the number of tests performed, not the number of individuals tested. Viral (RT-PCR) laboratory test positivity rate is the number of positive tests divided by the number of tests performed and resulted. Resulted tests are assigned to a timeframe based on this hierarchy of test-related dates: 1. test date; 2. result date; 3. specimen received date; 4. specimen collection date. Resulted tests are assigned to a county based on a hierarchy of test-related locations: 1. patient residency; 2. provider facility location; 3. ordering facility location; 4. performing organization location. States may calculate test positivity other using other methods. Last week data are from 10/29 to 11/4; previous week data are from 10/22 to 10/28; the week one month before data are from 10/1 to 10/7. HHS Protect data is recent as of 11:59 EST on 11/08/2020. Testing data are inclusive of everything received and processed by the CELR system as of 19:00 EST on 11/07/2020.
• Hospitalizations: Unified hospitalization dataset in HHS Protect. This figure may differ from state data due to differences in hospital lists and reporting between federal and state systems. These data exclude psychiatric, rehabilitation, and religious non-medical hospitals. In addition, hospitals explicitly identified by states/regions as those from which we should not expect reports were excluded from the percent reporting figure. The data presented represents raw data provided; we are working diligently with state liaisons to improve reporting consistency. Data is recent as of 22:28 EST on 11/08/2020.
• Hospital PPE: Unified hospitalization dataset in HHS Protect. This figure may differ from state data due to differences in hospital lists and reporting between federal and state systems. These data exclude psychiatric, rehabilitation, and religious non-medical hospitals. In addition, hospitals explicitly identified by states/regions as those from which we should not expect reports were excluded from the percent reporting figure. Data is recent as of 17:24 EST on 11/07/2020.
• Skilled Nursing Facilities: National Healthcare Safety Network (NHSN). Data report resident and staff cases independently. Quality checks are performed on data submitted to the NHSN. Data that fail these quality checks or appear inconsistent with surveillance protocols may be excluded from analyses. Data presented in this report are more recent than data publicly posted by CMS. Last week is 10/26-11/1, previous week is 10/19-10/25. Facilities that are undergoing reporting quality review are not included in the table, but may be included in other NHSN analyses.
• County and Metro Area Color Categorizations• Red Zone: Those core-based statistical areas (CBSAs) and counties that during the last week reported both new cases at or above 101 per 100,000
population, and a lab test positivity result at or above 10.1%.• Orange Zone: Those CBSAs and counties that during the last week reported both new cases between 51–100 per 100,000 population, and a lab test
positivity result between 8.0–10.0%, or one of those two conditions and one condition qualifying as being in the “Red Zone.”• Yellow Zone: Those CBSAs and counties that during the last week reported both new cases between 10–50 per 100,000 population, and a lab test
positivity result between 5.0–7.9%, or one of those two conditions and one condition qualifying as being in the “Orange Zone” or “Red Zone.”
COLOR THRESHOLDS: Results for each indicator should be taken in context of the findings for related indicators (e.g., changes in case incidence and testing volume). Values are rounded before color classification.
DATA NOTES
Issue 21