state street bank and trust company ssga u.s. government
TRANSCRIPT

State Street Bank and Trust Company
State Street U.S. Government/Credit Bond Index Non-Lending Series Fund
Financial Statements
December 31, 2015

PricewaterhouseCoopers LLP, 101 Seaport Boulevard, Suite 500, Boston, MA 02210 T: (617) 530 5000, F: (617) 530 5001, www.pwc.com/us
Independent Auditor's Report To the Trustee of State Street Bank and Trust Company State Street U.S. Government/Credit Bond Index Non-Lending Series Fund We have audited the accompanying financial statements of State Street Bank and Trust Company State Street U.S. Government/Credit Bond Index Non-Lending Series Fund (formerly State Street Bank and Trust Company SSgA U.S. Government/Credit Bond Index Non-Lending Series Fund) ("the Fund"), which comprise the statement of assets and liabilities, including the schedule of investments as of December 31, 2015, and the related statements of operations and of changes in net assets and the financial highlights for the year then ended. These financial statements and financial highlights are hereafter collectively referred to as "financial statements". Management's Responsibility for the Financial Statements Management is responsible for the preparation and fair presentation of the financial statements in accordance with accounting principles generally accepted in the United States of America; this includes the design, implementation and maintenance of internal control relevant to the preparation and fair presentation of financial statements that are free from material misstatement, whether due to fraud or error. Auditor's Responsibility Our responsibility is to express an opinion on the financial statements based on our audit. We conducted our audit in accordance with auditing standards generally accepted in the United States of America. Those standards require that we plan and perform the audit to obtain reasonable assurance about whether the financial statements are free from material misstatement. An audit involves performing procedures to obtain audit evidence about the amounts and disclosures in the financial statements. The procedures selected depend on our judgment, including the assessment of the risks of material misstatement of the financial statements, whether due to fraud or error. In making those risk assessments, we consider internal control relevant to the Fund’s preparation and fair presentation of the financial statements in order to design audit procedures that are appropriate in the circumstances, but not for the purpose of expressing an opinion on the effectiveness of the Fund’s internal control. Accordingly, we express no such opinion. An audit also includes evaluating the appropriateness of accounting policies used and the reasonableness of significant accounting estimates made by management, as well as evaluating the overall presentation of the financial statements. We believe that the audit evidence we have obtained is sufficient and appropriate to provide a basis for our audit opinion. Opinion In our opinion, the financial statements referred to above present fairly, in all material respects, the financial position of State Street Bank and Trust Company State Street U.S. Government/Credit Bond Index Non-Lending Series Fund at December 31, 2015, and the results of its operations and changes in its net assets and the financial highlights for the year then ended, in accordance with accounting principles generally accepted in the United States of America.
March 24, 2016

State Street Bank and Trust Company
State Street U.S. Government/Credit Bond Index Non-Lending Series Fund
Statement of Assets and Liabilities December 31, 2015
The accompanying notes are an integral part of these financial statements.
2
Assets Investments in securities, at value (cost $805,574,429) $ 809,602,350Receivable for Fund units issued 3,019,317Receivable for investments sold 1,274,475Interest receivable 5,860,940
Total assets 819,757,082
Liabilities Payable for investments purchased 6,945,709Accrued expenses 20,268
Total liabilities 6,965,977
Net Assets, at value $ 812,791,105

State Street Bank and Trust Company
State Street U.S. Government/Credit Bond Index Non-Lending Series Fund
Statement of Assets and Liabilities (continued) December 31, 2015
The accompanying notes are an integral part of these financial statements.
3
State Street U.S. Government/Credit Bond Index Non-Lending Series Fund - Class A (54,262,731 units outstanding, at $11.79 per unit net asset value) $ 639,914,515State Street U.S. Government/Credit Bond Index Non-Lending Series Fund - Class C (14,908,430 units outstanding, at $11.60 per unit net asset value) 172,876,590
$ 812,791,105

State Street Bank and Trust Company
State Street U.S. Government/Credit Bond Index Non-Lending Series Fund
Statement of Operations Year Ended December 31, 2015
The accompanying notes are an integral part of these financial statements.
4
Investment income Interest $ 20,822,613Other 1,385
Total investment income 20,823,998
Expenses Management 88,360Administration 89,220Audit 35,000Other 12,101
Total expenses 224,681
Net investment income (loss) 20,599,317
Net realized and unrealized gain (loss): Net realized gain (loss): Investments 1,202,478Net change in unrealized appreciation (depreciation): Investments (20,718,345)
Net realized and unrealized gain (loss) (19,515,867)
Net increase (decrease) in net assets resulting from operations $ 1,083,450

State Street Bank and Trust Company
State Street U.S. Government/Credit Bond Index Non-Lending Series Fund
Statement of Changes in Net Assets Year Ended December 31, 2015
The accompanying notes are an integral part of these financial statements.
5
From operations Net investment income (loss) $ 20,599,317Net realized gain (loss) 1,202,478
Net change in unrealized appreciation (depreciation) (20,718,345)
Net increase (decrease) in net assets resulting from operations 1,083,450
Net increase (decrease) in net assets resulting from participant transactions (13,116,384)
Net increase (decrease) in net assets (12,032,934)Net Assets
Beginning of year 824,824,039
End of year $ 812,791,105

State Street Bank and Trust Company
State Street U.S. Government/Credit Bond Index Non-Lending Series Fund
Statement of Changes in Net Assets (continued) Year Ended December 31, 2015 Units Amount
The accompanying notes are an integral part of these financial statements.
6
Units of Participation Participant transactions for the Fund were as follows: Class A Units issued 6,682,427 $ 79,519,372Units redeemed (7,198,099) (85,155,150)
(515,672) (5,635,778)
Class C Units issued 1,630,475 $ 19,045,743Units redeemed (2,271,602) (26,526,349)
(641,127) (7,480,606)
Net increase (decrease) $ (13,116,384)

State Street Bank and Trust Company
State Street U.S. Government/Credit Bond Index Non-Lending Series Fund - Class A
Financial Highlights Year Ended December 31, 2015 (For a Unit of Participation Outstanding Throughout the Year)
The accompanying notes are an integral part of these financial statements.
7
Selected Per Unit Data
Net asset value, beginning of year $ 11.77
Net investment income (loss)1 0.29
Net realized and unrealized gain (loss) (0.27)
Total from investment operations 0.02
Net asset value, end of year $ 11.79
Total return (%)2 0.19Ratios to Average Net Assets3 Ratio of expenses (%)4 0.02Ratio of net investment income (loss) (%) 2.47 1 Net investment income (loss) per unit has been calculated based upon an average of daily units outstanding. 2 Calculation is based on the value of a single unit of participation outstanding throughout the year. It represents the
percentage change in the net asset value per unit between the beginning and end of the year. The calculation includes only those expenses charged directly to the Class. The result may be reduced by any administrative or other fees which are incurred in the management or maintenance of individual participant accounts.
3 Calculations include only those expenses charged directly to the Fund (direct expenses) and do not include expenses charged to the funds in which the Fund invests (indirect expenses) (Note 2).
4 Please refer to the Additional Expense Information in the accompanying notes for further disclosures regarding expenses.
State Street Bank and Trust Company
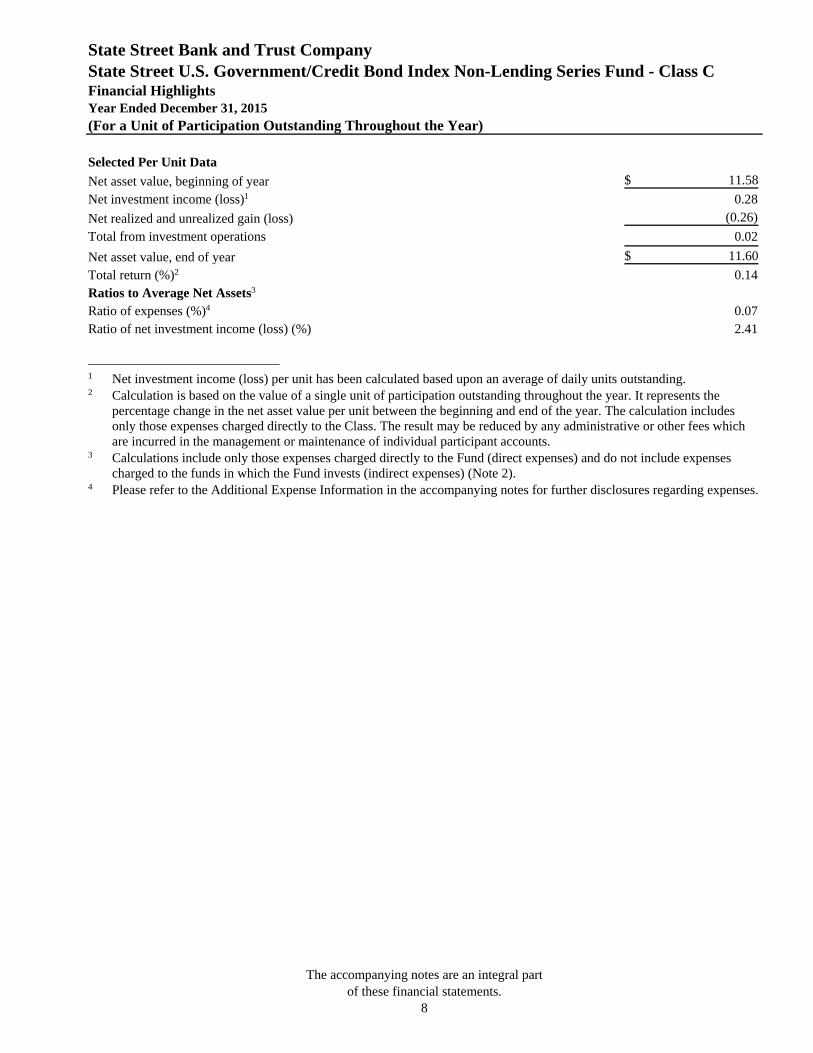
State Street U.S. Government/Credit Bond Index Non-Lending Series Fund - Class C
Financial Highlights Year Ended December 31, 2015 (For a Unit of Participation Outstanding Throughout the Year)
The accompanying notes are an integral part of these financial statements.
8
Selected Per Unit Data
Net asset value, beginning of year $ 11.58
Net investment income (loss)1 0.28
Net realized and unrealized gain (loss) (0.26)
Total from investment operations 0.02
Net asset value, end of year $ 11.60
Total return (%)2 0.14Ratios to Average Net Assets3 Ratio of expenses (%)4 0.07Ratio of net investment income (loss) (%) 2.41 1 Net investment income (loss) per unit has been calculated based upon an average of daily units outstanding. 2 Calculation is based on the value of a single unit of participation outstanding throughout the year. It represents the
percentage change in the net asset value per unit between the beginning and end of the year. The calculation includes only those expenses charged directly to the Class. The result may be reduced by any administrative or other fees which are incurred in the management or maintenance of individual participant accounts.
3 Calculations include only those expenses charged directly to the Fund (direct expenses) and do not include expenses charged to the funds in which the Fund invests (indirect expenses) (Note 2).
4 Please refer to the Additional Expense Information in the accompanying notes for further disclosures regarding expenses.

State Street Bank and Trust Company
State Street U.S. Government/Credit Bond Index Non-Lending Series Fund
Schedule of Investments (showing percentage of total value of investments)
December 31, 2015
The accompanying notes are an integral part
of these financial statements. 9
Debt Instruments - 40.7% Interest
Rate Maturity
Date Principal Value
($) Advertising - 0.1% Interpublic Group of Companies Inc. 2.25% 11/15/2017 USD 100,000 99,486 Omnicom Group Inc. 6.25% 07/15/2019 10,000 11,208 Omnicom Group Inc. 4.45% 08/15/2020 35,000 37,251 Omnicom Group Inc. 3.63% 05/01/2022 200,000 202,246 WPP Finance 2010 5.63% 11/15/2043 100,000 101,478
451,669
Aerospace/Defense - 0.6% Boeing Co. 4.88% 02/15/2020 USD 126,000 139,996 Boeing Co. 8.75% 08/15/2021 6,000 7,900 Boeing Co. 7.95% 08/15/2024 5,000 6,676 Boeing Co. 6.13% 02/15/2033 7,000 8,771 Boeing Co. 6.63% 02/15/2038 3,000 4,015 Boeing Co. 6.88% 03/15/2039 118,000 162,971 Boeing Co. 5.88% 02/15/2040 153,000 191,621 Embraer Netherlands Finance BV 5.05% 06/15/2025 50,000 45,563 Embraer SA 5.15% 06/15/2022 25,000 24,344 General Dynamics Corp. 2.25% 11/15/2022 250,000 240,002 Harris Corp. 2.00% 04/27/2018 200,000 197,641 Harris Corp. 2.70% 04/27/2020 35,000 34,228 Harris Corp. 4.40% 12/15/2020 100,000 103,966 Harris Corp. 3.83% 04/27/2025 50,000 49,251 L-3 Communications Corp. 5.20% 10/15/2019 150,000 158,418 L-3 Communications Corp. 4.75% 07/15/2020 150,000 155,251 Lockheed Martin Corp. 1.85% 11/23/2018 35,000 34,907 Lockheed Martin Corp. 2.50% 11/23/2020 50,000 49,588 Lockheed Martin Corp. 2.90% 03/01/2025 250,000 240,302 Lockheed Martin Corp. 3.55% 01/15/2026 100,000 100,194 Lockheed Martin Corp. 3.60% 03/01/2035 50,000 45,035 Lockheed Martin Corp. 4.50% 05/15/2036 20,000 20,209 Lockheed Martin Corp. 4.85% 09/15/2041 100,000 103,432 Lockheed Martin Corp. 4.07% 12/15/2042 133,000 123,139 Lockheed Martin Corp. 3.80% 03/01/2045 40,000 35,416 Lockheed Martin Corp. 4.70% 05/15/2046 44,000 45,071 Northrop Grumman Corp. 5.05% 08/01/2019 11,000 11,916 Northrop Grumman Corp. 3.50% 03/15/2021 150,000 154,311 Northrop Grumman Corp. 3.25% 08/01/2023 250,000 249,401

State Street Bank and Trust Company
State Street U.S. Government/Credit Bond Index Non-Lending Series Fund
Schedule of Investments (showing percentage of total value of investments)
December 31, 2015
The accompanying notes are an integral part
of these financial statements. 10
Debt Instruments - 40.7% Interest
Rate Maturity
Date Principal Value
($) Raytheon Co. 6.40% 12/15/2018 11,000 12,323 Raytheon Co. 3.13% 10/15/2020 150,000 154,542 Raytheon Co. 2.50% 12/15/2022 100,000 97,894 Raytheon Co. 7.20% 08/15/2027 6,000 7,938 Rockwell Collins Inc. 5.25% 07/15/2019 10,000 10,687 Rockwell Collins Inc. 3.70% 12/15/2023 100,000 103,146 Rockwell Collins Inc. 4.80% 12/15/2043 100,000 106,834 United Technologies Corp. 1.80% 06/01/2017 100,000 100,514 United Technologies Corp. 5.38% 12/15/2017 271,000 290,714 United Technologies Corp. 6.13% 02/01/2019 26,000 28,943 United Technologies Corp. 8.75% 03/01/2021 2,000 2,546 United Technologies Corp. 3.10% 06/01/2022 300,000 305,148 United Technologies Corp. 6.70% 08/01/2028 11,000 13,957 United Technologies Corp. 7.50% 09/15/2029 8,000 10,814 United Technologies Corp. 5.40% 05/01/2035 10,000 11,140 United Technologies Corp. 6.05% 06/01/2036 111,000 132,652 United Technologies Corp. 6.13% 07/15/2038 156,000 189,906 United Technologies Corp. 4.50% 06/01/2042 250,000 251,921
4,575,154
Agriculture - 0.4% Altria Group Inc. 9.70% 11/10/2018 USD 189,000 226,161 Altria Group Inc. 9.25% 08/06/2019 42,000 51,368 Altria Group Inc. 2.63% 01/14/2020 100,000 99,902 Altria Group Inc. 4.75% 05/05/2021 100,000 108,319 Altria Group Inc. 2.85% 08/09/2022 100,000 97,546 Altria Group Inc. 4.00% 01/31/2024 150,000 155,389 Altria Group Inc. 9.95% 11/10/2038 57,000 91,660 Altria Group Inc. 10.20% 02/06/2039 35,000 57,353 Altria Group Inc. 4.25% 08/09/2042 150,000 137,250 Archer-Daniels-Midland Co. 5.45% 03/15/2018 14,000 14,998 Archer-Daniels-Midland Co.1 4.48% 03/01/2021 35,000 37,982 Archer-Daniels-Midland Co. 4.54% 03/26/2042 20,000 20,511 Archer-Daniels-Midland Co. 4.02% 04/16/2043 148,000 140,821 Bunge Ltd. Finance Corp. 8.50% 06/15/2019 13,000 15,075 Bunge Ltd. Finance Corp. 3.50% 11/24/2020 50,000 49,775 Bunge NA Finance LP 5.90% 04/01/2017 5,000 5,215 Philip Morris International Inc. 1.63% 03/20/2017 100,000 100,473

State Street Bank and Trust Company
State Street U.S. Government/Credit Bond Index Non-Lending Series Fund
Schedule of Investments (showing percentage of total value of investments)
December 31, 2015
The accompanying notes are an integral part
of these financial statements. 11
Debt Instruments - 40.7% Interest
Rate Maturity
Date Principal Value
($) Philip Morris International Inc. 1.25% 08/11/2017 100,000 99,949 Philip Morris International Inc. 5.65% 05/16/2018 210,000 229,098 Philip Morris International Inc. 2.90% 11/15/2021 100,000 100,264 Philip Morris International Inc. 3.25% 11/10/2024 250,000 251,419 Philip Morris International Inc. 3.38% 08/11/2025 50,000 50,680 Philip Morris International Inc. 6.38% 05/16/2038 107,000 134,576 Philip Morris International Inc. 4.50% 03/20/2042 50,000 50,227 Philip Morris International Inc. 4.13% 03/04/2043 200,000 189,799 Reynolds American Inc. 6.75% 06/15/2017 29,000 30,952 Reynolds American Inc. 8.13% 06/23/2019 115,000 134,738 Reynolds American Inc. 3.25% 06/12/2020 60,000 60,743 Reynolds American Inc. 3.25% 11/01/2022 150,000 147,773 Reynolds American Inc. 3.75% 05/20/2023 150,000 149,845 Reynolds American Inc. 4.85% 09/15/2023 150,000 160,887 Reynolds American Inc. 4.45% 06/12/2025 45,000 47,091 Reynolds American Inc. 5.70% 08/15/2035 35,000 38,219 Reynolds American Inc. 7.25% 06/15/2037 6,000 7,296 Reynolds American Inc. 5.85% 08/15/2045 45,000 49,795
3,343,149
Airlines - 0.1%
American Airlines Pass Through Trust
3.70%
04/01/2028
USD
89,473
88,579
American Airlines Pass Through Trust
3.60%
03/22/2029
200,000
202,000
Continental Airlines Pass Through Trust
7.25%
05/10/2021
108,078
121,858
Continental Airlines Pass Through Trust
4.00%
04/29/2026
35,879
36,596
Delta Air Lines Pass Through Trust 6.82% 02/10/2024 7,554 8,574 Delta Air Lines Pass Through Trust 3.63% 01/30/2029 75,000 75,938 Southwest Airlines Co. 5.13% 03/01/2017 15,000 15,620
Southwest Airlines Co. Pass Through Trust
6.15%
02/01/2024
4,194
4,686
United Airlines Inc. 4.15% 10/11/2025 87,695 89,888 United Airlines Pass Through Trust 4.00% 10/11/2027 149,423 151,664 United Airlines Pass Through Trust 3.45% 06/01/2029 25,000 24,938 US Airways Pass Through Trust 5.90% 04/01/2026 20,762 22,942

State Street Bank and Trust Company
State Street U.S. Government/Credit Bond Index Non-Lending Series Fund
Schedule of Investments (showing percentage of total value of investments)
December 31, 2015
The accompanying notes are an integral part
of these financial statements. 12
Debt Instruments - 40.7% Interest
Rate Maturity
Date Principal Value
($) US Airways Pass Through Trust 4.63% 12/03/2026 82,915 86,024
929,307
Apparel - 0.0% NIKE Inc. 2.25% 05/01/2023 USD 50,000 48,590 NIKE Inc. 3.88% 11/01/2045 50,000 48,322 Ralph Lauren Corp. 2.63% 08/18/2020 50,000 50,201 VF Corp. 5.95% 11/01/2017 6,000 6,426 VF Corp. 3.50% 09/01/2021 70,000 73,090 VF Corp. 6.00% 10/15/2033 4,000 4,811 VF Corp. 6.45% 11/01/2037 7,000 8,942
240,382
Auto Manufacturers - 0.3% American Honda Finance Corp. 0.95% 05/05/2017 USD 150,000 149,139 American Honda Finance Corp. 1.55% 12/11/2017 100,000 99,805 American Honda Finance Corp. 2.13% 10/10/2018 200,000 201,077 American Honda Finance Corp. 2.45% 09/24/2020 100,000 99,996 Daimler Finance North America LLC 8.50% 01/18/2031 122,000 176,279 Ford Motor Co. 7.45% 07/16/2031 250,000 310,369 General Motors Co. 3.50% 10/02/2018 200,000 201,960 General Motors Co. 5.00% 04/01/2035 200,000 187,747 General Motors Co. 6.25% 10/02/2043 200,000 211,747 General Motors Financial Co. Inc. 3.70% 11/24/2020 100,000 99,995 Toyota Motor Credit Corp. 2.00% 10/24/2018 200,000 200,957 Toyota Motor Credit Corp. 2.10% 01/17/2019 200,000 200,584 Toyota Motor Credit Corp. 2.13% 07/18/2019 200,000 200,165 Toyota Motor Credit Corp. 4.50% 06/17/2020 100,000 108,831
2,448,651
Auto Parts & Equipment - 0.1% BorgWarner Inc. 3.38% 03/15/2025 USD 100,000 94,294 Delphi Automotive PLC 3.15% 11/19/2020 50,000 49,998 Delphi Automotive PLC 4.25% 01/15/2026 50,000 50,092 Delphi Corp. 4.15% 03/15/2024 60,000 60,300 Johnson Controls Inc. 4.25% 03/01/2021 100,000 103,271 Johnson Controls Inc. 3.63% 07/02/2024 43,000 41,469 Johnson Controls Inc. 6.00% 01/15/2036 4,000 4,181

State Street Bank and Trust Company
State Street U.S. Government/Credit Bond Index Non-Lending Series Fund
Schedule of Investments (showing percentage of total value of investments)
December 31, 2015
The accompanying notes are an integral part
of these financial statements. 13
Debt Instruments - 40.7% Interest
Rate Maturity
Date Principal Value
($) Johnson Controls Inc. 4.95% 07/02/2064 63,000 51,603 Magna International Inc. 3.63% 06/15/2024 100,000 98,206
553,414
Banks - 8.8%
Abbey National Treasury Services PLC
1.65%
09/29/2017
USD
100,000
99,773
Abbey National Treasury Services PLC
2.00%
08/24/2018
167,000
166,680
Abbey National Treasury Services PLC
4.00%
03/13/2024
150,000
156,435
American Express Bank FSB 6.00% 09/13/2017 18,000 19,249 American Express Centurion Bank 6.00% 09/13/2017 1,000 1,069 Associated Banc-Corp 2.75% 11/15/2019 100,000 99,450
Australia & New Zealand Banking Group Ltd.
1.25%
06/13/2017
170,000
169,557
Australia & New Zealand Banking Group Ltd.
1.45%
05/15/2018
250,000
247,548
BanColombia SA2 5.95% 06/03/2021 100,000 102,880 Bank of America Corp. 3.88% 03/22/2017 100,000 102,523 Bank of America Corp. 6.40% 08/28/2017 41,000 43,870 Bank of America Corp. 6.00% 09/01/2017 186,000 197,870 Bank of America Corp. 5.75% 12/01/2017 223,000 237,851 Bank of America Corp. 2.00% 01/11/2018 200,000 199,548 Bank of America Corp. 6.88% 04/25/2018 7,000 7,714 Bank of America Corp. 5.65% 05/01/2018 361,000 388,100 Bank of America Corp. 1.95% 05/12/2018 250,000 248,426 Bank of America Corp. 6.50% 07/15/2018 20,000 22,021 Bank of America Corp. 6.88% 11/15/2018 377,000 422,152 Bank of America Corp. 5.49% 03/15/2019 15,000 16,300 Bank of America Corp. 2.65% 04/01/2019 350,000 350,854 Bank of America Corp. 7.63% 06/01/2019 13,000 14,984 Bank of America Corp. 2.25% 04/21/2020 150,000 146,371 Bank of America Corp. 5.63% 07/01/2020 150,000 166,256 Bank of America Corp. 5.88% 01/05/2021 250,000 281,345 Bank of America Corp. 5.70% 01/24/2022 250,000 282,348 Bank of America Corp. 4.00% 04/01/2024 220,000 225,028 Bank of America Corp. 4.20% 08/26/2024 350,000 348,586 Bank of America Corp. 4.00% 01/22/2025 450,000 440,093

State Street Bank and Trust Company
State Street U.S. Government/Credit Bond Index Non-Lending Series Fund
Schedule of Investments (showing percentage of total value of investments)
December 31, 2015
The accompanying notes are an integral part
of these financial statements. 14
Debt Instruments - 40.7% Interest
Rate Maturity
Date Principal Value
($) Bank of America Corp. 3.95% 04/21/2025 150,000 146,050 Bank of America Corp. 3.88% 08/01/2025 150,000 152,151 Bank of America Corp. 4.25% 10/22/2026 200,000 197,504 Bank of America Corp. 6.75% 06/01/2028 2,000 2,377 Bank of America Corp. 6.11% 01/29/2037 136,000 154,180 Bank of America Corp. 7.75% 05/14/2038 130,000 175,213 Bank of America Corp. 5.88% 02/07/2042 237,000 275,846 Bank of America Corp. 5.00% 01/21/2044 150,000 156,012 Bank of America Corp. 4.88% 04/01/2044 250,000 258,376 Bank of America NA 1.25% 02/14/2017 250,000 249,772 Bank of America NA 5.30% 03/15/2017 271,000 282,313 Bank of America NA 6.10% 06/15/2017 23,000 24,318 Bank of America NA 2.05% 12/07/2018 250,000 249,472 Bank of America NA 6.00% 10/15/2036 31,000 37,140 Bank of Montreal 1.30% 07/14/2017 150,000 149,473 Bank of Montreal 1.40% 09/11/2017 250,000 249,032 Bank of Montreal 1.45% 04/09/2018 100,000 99,125 Bank of Montreal 2.55% 11/06/2022 100,000 98,170 Bank of New York Mellon Corp. 5.50% 12/01/2017 7,000 7,468 Bank of New York Mellon Corp. 1.30% 01/25/2018 150,000 148,773 Bank of New York Mellon Corp. 1.60% 05/22/2018 39,000 38,805 Bank of New York Mellon Corp. 5.45% 05/15/2019 10,000 11,016 Bank of New York Mellon Corp. 2.15% 02/24/2020 100,000 99,015 Bank of New York Mellon Corp. 2.60% 08/17/2020 100,000 100,381 Bank of New York Mellon Corp. 2.45% 11/27/2020 50,000 49,769 Bank of New York Mellon Corp. 3.55% 09/23/2021 250,000 259,054 Bank of New York Mellon Corp. 3.65% 02/04/2024 100,000 103,331 Bank of New York Mellon Corp. 3.00% 02/24/2025 50,000 48,917 Bank of New York Mellon Corp. 3.95% 11/18/2025 200,000 210,365 Bank of Nova Scotia 2.55% 01/12/2017 150,000 151,940 Bank of Nova Scotia 1.25% 04/11/2017 200,000 199,539 Bank of Nova Scotia 1.45% 04/25/2018 150,000 148,663 Bank of Nova Scotia 2.35% 10/21/2020 250,000 247,518 Bank of Nova Scotia 4.38% 01/13/2021 100,000 108,075 Bank of Nova Scotia 4.50% 12/16/2025 50,000 49,897 Bank One Capital III 8.75% 09/01/2030 5,000 7,111 Bank One Corp. 7.75% 07/15/2025 3,000 3,690 Bank One Corp. 7.63% 10/15/2026 12,000 14,913

State Street Bank and Trust Company
State Street U.S. Government/Credit Bond Index Non-Lending Series Fund
Schedule of Investments (showing percentage of total value of investments)
December 31, 2015
The accompanying notes are an integral part
of these financial statements. 15
Debt Instruments - 40.7% Interest
Rate Maturity
Date Principal Value
($) Bank One Corp. 8.00% 04/29/2027 7,000 8,992 Barclays Bank PLC 2.50% 02/20/2019 300,000 302,250 Barclays Bank PLC 5.13% 01/08/2020 150,000 165,266 Barclays Bank PLC 3.75% 05/15/2024 200,000 203,950 Barclays PLC 2.00% 03/16/2018 200,000 199,035 Barclays PLC 2.75% 11/08/2019 200,000 199,629 Barclays PLC 2.88% 06/08/2020 200,000 199,787 BB&T Corp. 2.15% 03/22/2017 150,000 151,129 BB&T Corp. 4.90% 06/30/2017 7,000 7,310 BB&T Corp. 2.25% 02/01/2019 150,000 150,518 BB&T Corp. 6.85% 04/30/2019 11,000 12,557 BB&T Corp. 5.25% 11/01/2019 6,000 6,508 BB&T Corp. 2.63% 06/29/2020 150,000 150,589 BB&T Corp. 3.95% 03/22/2022 75,000 78,429 BNP Paribas SA 1.38% 03/17/2017 150,000 149,753 BNP Paribas SA 2.38% 09/14/2017 125,000 126,341 BNP Paribas SA 2.40% 12/12/2018 100,000 100,498 BNP Paribas SA 5.00% 01/15/2021 150,000 165,403 BNP Paribas SA 3.25% 03/03/2023 100,000 99,961 BNP Paribas SA 4.25% 10/15/2024 250,000 247,714 BPCE SA 1.63% 02/10/2017 250,000 249,842 BPCE SA 1.63% 01/26/2018 250,000 248,236 Branch Banking & Trust Co. 1.35% 10/01/2017 300,000 298,801 Capital One Financial Corp. 6.75% 09/15/2017 171,000 184,000 Capital One Financial Corp. 4.75% 07/15/2021 100,000 108,228 Capital One Financial Corp. 3.75% 04/24/2024 100,000 100,380 Capital One Financial Corp. 3.20% 02/05/2025 50,000 48,099 Capital One NA 1.65% 02/05/2018 250,000 247,075 Capital One NA 2.35% 08/17/2018 250,000 250,156 Citigroup Inc. 1.35% 03/10/2017 150,000 149,590 Citigroup Inc. 1.70% 04/27/2018 200,000 198,040 Citigroup Inc. 2.15% 07/30/2018 100,000 99,839 Citigroup Inc. 2.55% 04/08/2019 350,000 351,409 Citigroup Inc. 2.40% 02/18/2020 150,000 148,479 Citigroup Inc. 2.65% 10/26/2020 200,000 198,469 Citigroup Inc. 4.50% 01/14/2022 250,000 268,337 Citigroup Inc. 4.05% 07/30/2022 100,000 102,285 Citigroup Inc. 3.50% 05/15/2023 250,000 244,333

State Street Bank and Trust Company
State Street U.S. Government/Credit Bond Index Non-Lending Series Fund
Schedule of Investments (showing percentage of total value of investments)
December 31, 2015
The accompanying notes are an integral part
of these financial statements. 16
Debt Instruments - 40.7% Interest
Rate Maturity
Date Principal Value
($) Citigroup Inc. 3.75% 06/16/2024 100,000 101,994 Citigroup Inc. 4.00% 08/05/2024 150,000 148,322 Citigroup Inc. 3.88% 03/26/2025 150,000 145,446 Citigroup Inc. 4.30% 11/20/2026 325,000 322,875 Citigroup Inc. 4.45% 09/29/2027 150,000 149,100 Citigroup Inc. 6.63% 01/15/2028 3,000 3,658 Citigroup Inc. 6.63% 06/15/2032 26,000 30,635 Citigroup Inc. 5.88% 02/22/2033 167,000 183,272 Citigroup Inc. 6.00% 10/31/2033 17,000 18,946 Citigroup Inc. 6.13% 08/25/2036 39,000 44,498 Citigroup Inc. 8.13% 07/15/2039 298,000 426,528 Citigroup Inc. 4.95% 11/07/2043 150,000 157,702 Citigroup Inc. 5.30% 05/06/2044 300,000 311,679 Citigroup Inc. 4.65% 07/30/2045 150,000 151,930 Citigroup Inc. 6.88% 02/15/2098 2,000 2,485 Citizens Financial Group Inc. 4.35% 08/01/2025 150,000 149,116 City National Corp. 5.25% 09/15/2020 100,000 111,191 Comerica Bank 5.20% 08/22/2017 9,000 9,473 Comerica Inc. 2.13% 05/23/2019 100,000 98,784 Comerica Inc. 3.80% 07/22/2026 90,000 87,510 Commonwealth Bank of Australia 1.13% 03/13/2017 250,000 249,384 Commonwealth Bank of Australia 2.25% 03/13/2019 350,000 350,527 Compass Bank 3.88% 04/10/2025 250,000 229,740
Cooperatieve Centrale Raiffeisen-Boerenleenbank BA
1.70%
03/19/2018
250,000
249,325
Cooperatieve Centrale Raiffeisen-Boerenleenbank BA
2.25%
01/14/2019
250,000
250,726
Cooperatieve Centrale Raiffeisen-Boerenleenbank BA
4.50%
01/11/2021
300,000
326,692
Cooperatieve Centrale Raiffeisen-Boerenleenbank BA
3.88%
02/08/2022
150,000
157,047
Cooperatieve Centrale Raiffeisen-Boerenleenbank BA
3.95%
11/09/2022
250,000
252,602
Cooperatieve Centrale Raiffeisen-Boerenleenbank BA
4.38%
08/04/2025
250,000
252,911
Credit Suisse 6.00% 02/15/2018 500,000 537,287 Credit Suisse 2.30% 05/28/2019 250,000 249,993 Credit Suisse 4.38% 08/05/2020 100,000 107,411 Credit Suisse 3.00% 10/29/2021 250,000 248,399
State Street Bank and Trust Company
State Street U.S. Government/Credit Bond Index Non-Lending Series Fund
Schedule of Investments (showing percentage of total value of investments)
December 31, 2015
The accompanying notes are an integral part
of these financial statements. 17
Debt Instruments - 40.7% Interest
Rate Maturity
Date Principal Value
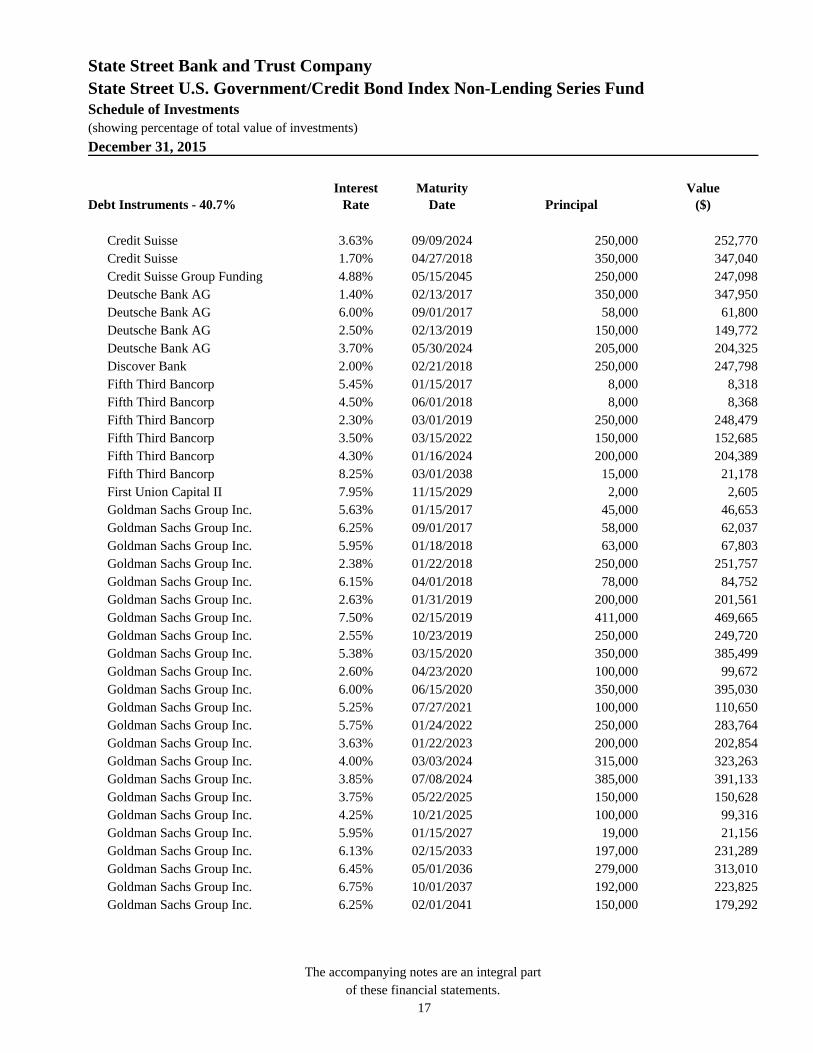
($) Credit Suisse 3.63% 09/09/2024 250,000 252,770 Credit Suisse 1.70% 04/27/2018 350,000 347,040 Credit Suisse Group Funding 4.88% 05/15/2045 250,000 247,098 Deutsche Bank AG 1.40% 02/13/2017 350,000 347,950 Deutsche Bank AG 6.00% 09/01/2017 58,000 61,800 Deutsche Bank AG 2.50% 02/13/2019 150,000 149,772 Deutsche Bank AG 3.70% 05/30/2024 205,000 204,325 Discover Bank 2.00% 02/21/2018 250,000 247,798 Fifth Third Bancorp 5.45% 01/15/2017 8,000 8,318 Fifth Third Bancorp 4.50% 06/01/2018 8,000 8,368 Fifth Third Bancorp 2.30% 03/01/2019 250,000 248,479 Fifth Third Bancorp 3.50% 03/15/2022 150,000 152,685 Fifth Third Bancorp 4.30% 01/16/2024 200,000 204,389 Fifth Third Bancorp 8.25% 03/01/2038 15,000 21,178 First Union Capital II 7.95% 11/15/2029 2,000 2,605 Goldman Sachs Group Inc. 5.63% 01/15/2017 45,000 46,653 Goldman Sachs Group Inc. 6.25% 09/01/2017 58,000 62,037 Goldman Sachs Group Inc. 5.95% 01/18/2018 63,000 67,803 Goldman Sachs Group Inc. 2.38% 01/22/2018 250,000 251,757 Goldman Sachs Group Inc. 6.15% 04/01/2018 78,000 84,752 Goldman Sachs Group Inc. 2.63% 01/31/2019 200,000 201,561 Goldman Sachs Group Inc. 7.50% 02/15/2019 411,000 469,665 Goldman Sachs Group Inc. 2.55% 10/23/2019 250,000 249,720 Goldman Sachs Group Inc. 5.38% 03/15/2020 350,000 385,499 Goldman Sachs Group Inc. 2.60% 04/23/2020 100,000 99,672 Goldman Sachs Group Inc. 6.00% 06/15/2020 350,000 395,030 Goldman Sachs Group Inc. 5.25% 07/27/2021 100,000 110,650 Goldman Sachs Group Inc. 5.75% 01/24/2022 250,000 283,764 Goldman Sachs Group Inc. 3.63% 01/22/2023 200,000 202,854 Goldman Sachs Group Inc. 4.00% 03/03/2024 315,000 323,263 Goldman Sachs Group Inc. 3.85% 07/08/2024 385,000 391,133 Goldman Sachs Group Inc. 3.75% 05/22/2025 150,000 150,628 Goldman Sachs Group Inc. 4.25% 10/21/2025 100,000 99,316 Goldman Sachs Group Inc. 5.95% 01/15/2027 19,000 21,156 Goldman Sachs Group Inc. 6.13% 02/15/2033 197,000 231,289 Goldman Sachs Group Inc. 6.45% 05/01/2036 279,000 313,010 Goldman Sachs Group Inc. 6.75% 10/01/2037 192,000 223,825 Goldman Sachs Group Inc. 6.25% 02/01/2041 150,000 179,292

State Street Bank and Trust Company
State Street U.S. Government/Credit Bond Index Non-Lending Series Fund
Schedule of Investments (showing percentage of total value of investments)
December 31, 2015
The accompanying notes are an integral part
of these financial statements. 18
Debt Instruments - 40.7% Interest
Rate Maturity
Date Principal Value
($) Goldman Sachs Group Inc. 5.15% 05/22/2045 230,000 224,207 Goldman Sachs Group Inc. 4.75% 10/21/2045 100,000 99,205 HSBC Bank PLC 7.65% 05/01/2025 2,000 2,532 HSBC Bank USA NA 6.00% 08/09/2017 11,000 11,668 HSBC Bank USA NA 4.88% 08/24/2020 500,000 541,483 HSBC Bank USA NA 5.88% 11/01/2034 17,000 19,660 HSBC Bank USA NA 5.63% 08/15/2035 8,000 9,030 HSBC Bank USA NA 7.00% 01/15/2039 15,000 19,028 HSBC Holdings PLC 4.00% 03/30/2022 150,000 157,385 HSBC Holdings PLC 4.25% 03/14/2024 200,000 201,013 HSBC Holdings PLC 4.25% 08/18/2025 200,000 199,277 HSBC Holdings PLC 7.63% 05/17/2032 10,000 12,689 HSBC Holdings PLC 6.50% 05/02/2036 39,000 46,299 HSBC Holdings PLC 6.50% 09/15/2037 313,000 373,789 HSBC Holdings PLC 6.80% 06/01/2038 187,000 230,026 HSBC Holdings PLC 5.25% 03/14/2044 200,000 207,809 HSBC USA Inc. 1.30% 06/23/2017 200,000 198,744 HSBC USA Inc. 2.63% 09/24/2018 100,000 101,319 HSBC USA Inc. 2.75% 08/07/2020 100,000 99,996 HSBC USA Inc. 5.00% 09/27/2020 250,000 271,917 Huntington National Bank 2.20% 04/01/2019 250,000 246,894
Industrial & Commercial Bank of China Ltd.
2.91%
11/13/2020
250,000
248,510
Intesa Sanpaolo SpA 2.38% 01/13/2017 200,000 200,493 Intesa Sanpaolo SpA 3.88% 01/16/2018 200,000 205,542 JPMorgan Chase & Co. 1.35% 02/15/2017 400,000 398,969 JPMorgan Chase & Co. 2.00% 08/15/2017 150,000 150,471 JPMorgan Chase & Co. 6.00% 01/15/2018 70,000 75,355 JPMorgan Chase & Co. 1.80% 01/25/2018 250,000 249,271 JPMorgan Chase & Co. 1.70% 03/01/2018 275,000 273,289 JPMorgan Chase & Co. 1.63% 05/15/2018 250,000 247,468 JPMorgan Chase & Co. 6.30% 04/23/2019 306,000 342,195 JPMorgan Chase & Co. 2.20% 10/22/2019 200,000 198,185 JPMorgan Chase & Co. 2.25% 01/23/2020 200,000 197,541 JPMorgan Chase & Co. 4.40% 07/22/2020 650,000 692,184 JPMorgan Chase & Co. 2.55% 10/29/2020 140,000 138,861 JPMorgan Chase & Co. 4.63% 05/10/2021 100,000 107,725 JPMorgan Chase & Co. 4.35% 08/15/2021 150,000 159,199 JPMorgan Chase & Co. 4.50% 01/24/2022 300,000 323,469

State Street Bank and Trust Company
State Street U.S. Government/Credit Bond Index Non-Lending Series Fund
Schedule of Investments (showing percentage of total value of investments)
December 31, 2015
The accompanying notes are an integral part
of these financial statements. 19
Debt Instruments - 40.7% Interest
Rate Maturity
Date Principal Value
($) JPMorgan Chase & Co. 3.25% 09/23/2022 150,000 151,119 JPMorgan Chase & Co. 3.88% 02/01/2024 100,000 103,147 JPMorgan Chase & Co. 3.63% 05/13/2024 200,000 202,436 JPMorgan Chase & Co. 3.88% 09/10/2024 150,000 149,220 JPMorgan Chase & Co. 3.13% 01/23/2025 250,000 241,907 JPMorgan Chase & Co. 4.13% 12/15/2026 50,000 49,778 JPMorgan Chase & Co. 6.40% 05/15/2038 407,000 513,976 JPMorgan Chase & Co. 5.40% 01/06/2042 150,000 168,832 JPMorgan Chase & Co. 4.85% 02/01/2044 200,000 212,746 JPMorgan Chase Bank NA 6.00% 07/05/2017 259,000 274,935 JPMorgan Chase Bank NA 6.00% 10/01/2017 74,000 79,100 KeyBank NA 6.95% 02/01/2028 3,000 3,687 KeyCorp 2.30% 12/13/2018 200,000 199,577 KeyCorp 2.90% 09/15/2020 155,000 153,980 KeyCorp. 5.10% 03/24/2021 90,000 97,943 KFW 4.88% 01/17/2017 64,000 66,501 KFW 1.25% 02/15/2017 450,000 450,838 KFW 0.75% 03/17/2017 250,000 248,937 KFW 0.88% 09/05/2017 300,000 298,620 KFW 0.88% 12/15/2017 350,000 347,558 KFW 4.38% 03/15/2018 211,000 224,925 KFW 1.00% 06/11/2018 300,000 297,108 KFW 4.50% 07/16/2018 67,000 72,141 KFW 1.88% 04/01/2019 500,000 504,164 KFW 4.88% 06/17/2019 212,000 234,746 KFW 1.75% 10/15/2019 250,000 250,229 KFW 4.00% 01/27/2020 50,000 54,210 KFW 1.50% 04/20/2020 250,000 246,332 KFW 2.75% 09/08/2020 350,000 362,802 KFW 2.75% 10/01/2020 250,000 259,091 KFW 2.38% 08/25/2021 250,000 253,470 KFW 2.63% 01/25/2022 150,000 153,965 KFW 2.00% 10/04/2022 250,000 246,311 KFW 2.13% 01/17/2023 250,000 247,227 KFW 2.50% 11/20/2024 350,000 351,554 KFW3 0.00% 04/18/2036 50,000 25,727 KFW3 0.00% 06/29/2037 174,000 85,182 Korea Development Bank 2.25% 08/07/2017 250,000 251,641

State Street Bank and Trust Company
State Street U.S. Government/Credit Bond Index Non-Lending Series Fund
Schedule of Investments (showing percentage of total value of investments)
December 31, 2015
The accompanying notes are an integral part
of these financial statements. 20
Debt Instruments - 40.7% Interest
Rate Maturity
Date Principal Value
($) Korea Development Bank 3.50% 08/22/2017 130,000 133,618 Korea Development Bank 2.50% 03/11/2020 200,000 200,256 Korea Development Bank 3.75% 01/22/2024 200,000 208,686 Landesbank Baden-Wuerttemberg 7.63% 02/01/2023 5,000 6,284 Landwirtschaftliche Rentenbank 5.13% 02/01/2017 13,000 13,559 Landwirtschaftliche Rentenbank 0.88% 09/12/2017 150,000 149,315 Landwirtschaftliche Rentenbank 1.88% 09/17/2018 150,000 151,761 Landwirtschaftliche Rentenbank 1.75% 04/15/2019 100,000 100,477 Landwirtschaftliche Rentenbank 1.38% 10/23/2019 57,000 56,260 Landwirtschaftliche Rentenbank 2.00% 01/13/2025 350,000 337,631 Lloyds Bank PLC 4.20% 03/28/2017 250,000 257,854 Lloyds Bank PLC 1.75% 05/14/2018 200,000 199,102 Lloyds Banking Group PLC 4.50% 11/04/2024 200,000 202,970 Manufacturers & Traders Trust Co. 6.63% 12/04/2017 11,000 11,916 Manufacturers & Traders Trust Co. 2.25% 07/25/2019 350,000 347,259 Mellon Funding Corp. 5.50% 11/15/2018 6,000 6,565 Morgan Stanley 5.45% 01/09/2017 71,000 73,737 Morgan Stanley 4.75% 03/22/2017 150,000 155,367 Morgan Stanley 5.55% 04/27/2017 43,000 45,078 Morgan Stanley 6.25% 08/28/2017 14,000 14,981 Morgan Stanley 5.95% 12/28/2017 60,000 64,504 Morgan Stanley 6.63% 04/01/2018 342,000 374,994 Morgan Stanley 2.50% 01/24/2019 250,000 250,728 Morgan Stanley 7.30% 05/13/2019 255,000 292,225 Morgan Stanley 2.38% 07/23/2019 150,000 149,007 Morgan Stanley 5.63% 09/23/2019 300,000 330,341 Morgan Stanley 2.65% 01/27/2020 500,000 497,879 Morgan Stanley 5.50% 07/24/2020 150,000 166,214 Morgan Stanley 5.75% 01/25/2021 150,000 168,498 Morgan Stanley 5.50% 07/28/2021 150,000 167,075 Morgan Stanley 4.88% 11/01/2022 213,000 226,581 Morgan Stanley 3.75% 02/25/2023 200,000 205,098 Morgan Stanley 3.88% 04/29/2024 450,000 457,985 Morgan Stanley 3.70% 10/23/2024 200,000 200,805 Morgan Stanley 5.00% 11/24/2025 100,000 105,791 Morgan Stanley 6.25% 08/09/2026 17,000 19,916 Morgan Stanley 4.35% 09/08/2026 180,000 180,362 Morgan Stanley 3.95% 04/23/2027 200,000 193,673

State Street Bank and Trust Company
State Street U.S. Government/Credit Bond Index Non-Lending Series Fund
Schedule of Investments (showing percentage of total value of investments)
December 31, 2015
The accompanying notes are an integral part
of these financial statements. 21
Debt Instruments - 40.7% Interest
Rate Maturity
Date Principal Value
($) Morgan Stanley 7.25% 04/01/2032 22,000 28,708 Morgan Stanley 6.38% 07/24/2042 100,000 123,153 MUFG Americas Holdings Corp. 2.25% 02/10/2020 300,000 292,488 National Australia Bank Ltd. 2.30% 07/25/2018 250,000 251,838 National Bank of Canada 2.10% 12/14/2018 250,000 249,958 National City Bank 5.80% 06/07/2017 8,000 8,424 National City Bank of Indiana 4.25% 07/01/2018 8,000 8,352 National City Corp. 6.88% 05/15/2019 21,000 23,734 NBD Bank NA 8.25% 11/01/2024 3,000 3,756 Northern Trust Corp. 3.45% 11/04/2020 50,000 52,035 Northern Trust Corp. 3.38% 08/23/2021 50,000 51,489 Oesterreichische Kontrollbank AG 5.00% 04/25/2017 119,000 124,914 Oesterreichische Kontrollbank AG 1.38% 02/10/2020 300,000 293,971 PNC Bank NA 5.25% 01/15/2017 18,000 18,706 PNC Bank NA 4.88% 09/21/2017 12,000 12,564 PNC Bank NA 2.40% 10/18/2019 250,000 249,991 PNC Bank NA 2.45% 11/05/2020 250,000 247,505 PNC Bank NA 2.70% 11/01/2022 250,000 241,992 PNC Bank NA 3.25% 06/01/2025 250,000 248,477 PNC Financial Services Group Inc. 3.90% 04/29/2024 150,000 152,371 PNC Funding Corp. 5.63% 02/01/2017 6,000 6,246 PNC Funding Corp. 6.70% 06/10/2019 150,000 170,646 PNC Funding Corp. 5.13% 02/08/2020 50,000 54,677 Regions Financial Corp. 2.00% 05/15/2018 100,000 99,254 Royal Bank of Canada 1.20% 01/23/2017 200,000 199,932 Royal Bank of Canada 2.00% 12/10/2018 100,000 100,072 Royal Bank of Canada 2.15% 03/15/2019 350,000 349,989 Royal Bank of Canada 2.15% 03/06/2020 100,000 99,008 Royal Bank of Canada 2.35% 10/30/2020 150,000 148,504 Royal Bank of Scotland Group PLC 1.88% 03/31/2017 450,000 448,303 Santander Bank NA 8.75% 05/30/2018 8,000 9,028 Santander Holdings USA Inc. 2.65% 04/17/2020 100,000 97,608 Santander Holdings USA Inc. 4.50% 07/17/2025 150,000 152,562 Santander UK Group Holdings PLC 2.88% 10/16/2020 100,000 99,441 Societe Generale SA 2.75% 10/12/2017 250,000 253,558 Sumitomo Mitsui Banking Corp. 1.80% 07/18/2017 250,000 249,498 Sumitomo Mitsui Banking Corp. 2.25% 07/11/2019 350,000 347,055 Sumitomo Mitsui Banking Corp. 3.95% 01/10/2024 300,000 312,236
State Street Bank and Trust Company
State Street U.S. Government/Credit Bond Index Non-Lending Series Fund
Schedule of Investments (showing percentage of total value of investments)
December 31, 2015
The accompanying notes are an integral part
of these financial statements. 22
Debt Instruments - 40.7% Interest
Rate Maturity
Date Principal Value
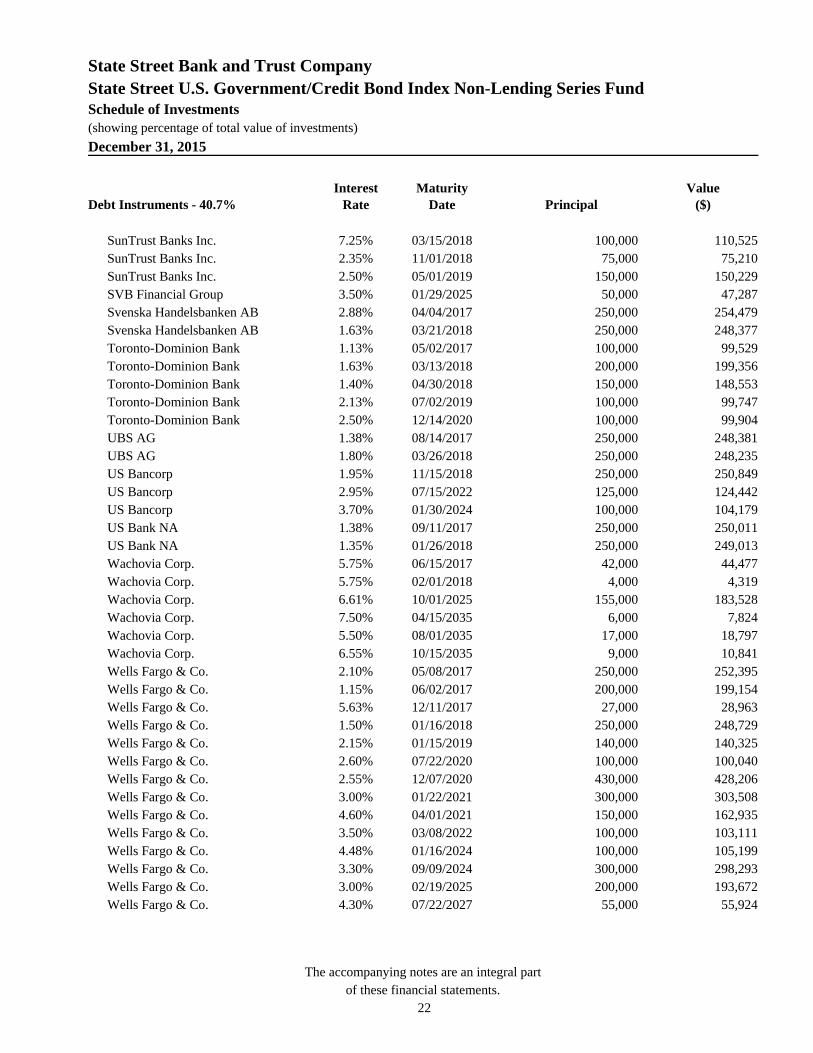
($) SunTrust Banks Inc. 7.25% 03/15/2018 100,000 110,525 SunTrust Banks Inc. 2.35% 11/01/2018 75,000 75,210 SunTrust Banks Inc. 2.50% 05/01/2019 150,000 150,229 SVB Financial Group 3.50% 01/29/2025 50,000 47,287 Svenska Handelsbanken AB 2.88% 04/04/2017 250,000 254,479 Svenska Handelsbanken AB 1.63% 03/21/2018 250,000 248,377 Toronto-Dominion Bank 1.13% 05/02/2017 100,000 99,529 Toronto-Dominion Bank 1.63% 03/13/2018 200,000 199,356 Toronto-Dominion Bank 1.40% 04/30/2018 150,000 148,553 Toronto-Dominion Bank 2.13% 07/02/2019 100,000 99,747 Toronto-Dominion Bank 2.50% 12/14/2020 100,000 99,904 UBS AG 1.38% 08/14/2017 250,000 248,381 UBS AG 1.80% 03/26/2018 250,000 248,235 US Bancorp 1.95% 11/15/2018 250,000 250,849 US Bancorp 2.95% 07/15/2022 125,000 124,442 US Bancorp 3.70% 01/30/2024 100,000 104,179 US Bank NA 1.38% 09/11/2017 250,000 250,011 US Bank NA 1.35% 01/26/2018 250,000 249,013 Wachovia Corp. 5.75% 06/15/2017 42,000 44,477 Wachovia Corp. 5.75% 02/01/2018 4,000 4,319 Wachovia Corp. 6.61% 10/01/2025 155,000 183,528 Wachovia Corp. 7.50% 04/15/2035 6,000 7,824 Wachovia Corp. 5.50% 08/01/2035 17,000 18,797 Wachovia Corp. 6.55% 10/15/2035 9,000 10,841 Wells Fargo & Co. 2.10% 05/08/2017 250,000 252,395 Wells Fargo & Co. 1.15% 06/02/2017 200,000 199,154 Wells Fargo & Co. 5.63% 12/11/2017 27,000 28,963 Wells Fargo & Co. 1.50% 01/16/2018 250,000 248,729 Wells Fargo & Co. 2.15% 01/15/2019 140,000 140,325 Wells Fargo & Co. 2.60% 07/22/2020 100,000 100,040 Wells Fargo & Co. 2.55% 12/07/2020 430,000 428,206 Wells Fargo & Co. 3.00% 01/22/2021 300,000 303,508 Wells Fargo & Co. 4.60% 04/01/2021 150,000 162,935 Wells Fargo & Co. 3.50% 03/08/2022 100,000 103,111 Wells Fargo & Co. 4.48% 01/16/2024 100,000 105,199 Wells Fargo & Co. 3.30% 09/09/2024 300,000 298,293 Wells Fargo & Co. 3.00% 02/19/2025 200,000 193,672 Wells Fargo & Co. 4.30% 07/22/2027 55,000 55,924

State Street Bank and Trust Company
State Street U.S. Government/Credit Bond Index Non-Lending Series Fund
Schedule of Investments (showing percentage of total value of investments)
December 31, 2015
The accompanying notes are an integral part
of these financial statements. 23
Debt Instruments - 40.7% Interest
Rate Maturity
Date Principal Value
($) Wells Fargo & Co. 5.38% 02/07/2035 20,000 22,809 Wells Fargo & Co. 5.38% 11/02/2043 75,000 80,495 Wells Fargo & Co. 5.61% 01/15/2044 250,000 277,152 Wells Fargo & Co. 4.65% 11/04/2044 200,000 193,810 Wells Fargo & Co. 3.90% 05/01/2045 205,000 188,509 Wells Fargo Bank NA 5.95% 08/26/2036 22,000 26,359 Wells Fargo Bank NA 5.85% 02/01/2037 32,000 37,988 Wells Fargo Bank NA 6.60% 01/15/2038 402,000 521,240 Wells Fargo Capital X 5.95% 12/01/2086 9,000 9,086 Westpac Banking Corp. 1.20% 05/19/2017 350,000 348,651 Westpac Banking Corp. 2.00% 08/14/2017 100,000 100,665 Westpac Banking Corp. 4.63% 06/01/2018 9,000 9,451 Westpac Banking Corp. 2.25% 01/17/2019 200,000 200,406 Westpac Banking Corp. 4.88% 11/19/2019 100,000 109,314 Westpac Banking Corp. 2.30% 05/26/2020 100,000 99,374
66,205,563
Beverages - 0.7% Anheuser-Busch Cos Inc. 5.60% 03/01/2017 USD 4,000 4,187 Anheuser-Busch Cos Inc. 5.50% 01/15/2018 17,000 18,174 Anheuser-Busch Cos Inc. 6.80% 08/20/2032 11,000 13,190 Anheuser-Busch Cos Inc. 5.95% 01/15/2033 3,000 3,299 Anheuser-Busch Cos Inc. 5.75% 04/01/2036 103,000 110,435 Anheuser-Busch Cos Inc. 6.45% 09/01/2037 13,000 15,152 Anheuser-Busch Cos Inc. 6.00% 11/01/2041 4,000 4,470 Anheuser-Busch Cos Inc. 6.50% 05/01/2042 2,000 2,364 Anheuser-Busch Cos Inc. 6.50% 02/01/2043 3,000 3,578 Anheuser-Busch InBev Finance Inc. 1.25% 01/17/2018 150,000 148,130 Anheuser-Busch InBev Finance Inc. 3.70% 02/01/2024 300,000 305,974 Anheuser-Busch InBev Finance Inc. 4.63% 02/01/2044 100,000 99,296
Anheuser-Busch InBev Worldwide Inc.
1.38%
07/15/2017
100,000
99,611
Anheuser-Busch InBev Worldwide Inc.
7.75%
01/15/2019
300,000
345,804
Anheuser-Busch InBev Worldwide Inc.
5.38%
01/15/2020
150,000
165,857
Anheuser-Busch InBev Worldwide Inc.
4.38%
02/15/2021
250,000
269,894

State Street Bank and Trust Company
State Street U.S. Government/Credit Bond Index Non-Lending Series Fund
Schedule of Investments (showing percentage of total value of investments)
December 31, 2015
The accompanying notes are an integral part
of these financial statements. 24
Debt Instruments - 40.7% Interest
Rate Maturity
Date Principal Value
($)
Anheuser-Busch InBev Worldwide Inc.
2.50%
07/15/2022
125,000
120,047
Anheuser-Busch InBev Worldwide Inc.
8.00%
11/15/2039
150,000
210,437
Anheuser-Busch InBev Worldwide Inc.
3.75%
07/15/2042
100,000
86,632
Beam Inc. 1.75% 06/15/2018 150,000 146,900 Brown-Forman Corp. 4.50% 07/15/2045 40,000 41,386 Coca-Cola Bottling Co. Consolidated 3.80% 11/25/2025 50,000 49,934 Coca-Cola Co. 0.88% 10/27/2017 85,000 84,576 Coca-Cola Co. 1.88% 10/27/2020 150,000 148,455 Coca-Cola Co. 3.15% 11/15/2020 150,000 156,756 Coca-Cola Co. 3.20% 11/01/2023 150,000 154,130 Coca-Cola Co. 2.88% 10/27/2025 150,000 147,461 Coca-Cola Enterprises Inc. 4.50% 09/01/2021 200,000 212,319 Coca-Cola Femsa SAB de CV 2.38% 11/26/2018 150,000 150,210 Diageo Capital PLC 5.75% 10/23/2017 14,000 14,985 Diageo Capital PLC 4.83% 07/15/2020 150,000 163,544 Diageo Capital PLC 2.63% 04/29/2023 150,000 145,112 Diageo Capital PLC 5.88% 09/30/2036 14,000 16,535 Diageo Investment Corp. 2.88% 05/11/2022 100,000 99,132 Diageo Investment Corp. 4.25% 05/11/2042 100,000 98,435 Dr Pepper Snapple Group Inc 4.50% 11/15/2045 40,000 39,097 Dr Pepper Snapple Group Inc. 2.00% 01/15/2020 66,000 64,489 Dr Pepper Snapple Group Inc. 3.40% 11/15/2025 50,000 49,069 Dr Pepper Snapple Group Inc. 7.45% 05/01/2038 5,000 6,786 Molson Coors Brewing Co. 5.00% 05/01/2042 100,000 96,585 PepsiAmericas Inc. 5.00% 05/15/2017 5,000 5,254 PepsiAmericas Inc. 5.50% 05/15/2035 2,000 2,331 PepsiCo. Inc. 0.95% 02/22/2017 250,000 249,484 PepsiCo. Inc. 1.13% 07/17/2017 50,000 49,918 PepsiCo. Inc. 1.25% 08/13/2017 250,000 249,951 PepsiCo. Inc. 5.00% 06/01/2018 45,000 48,607 PepsiCo. Inc. 7.90% 11/01/2018 143,000 166,966 PepsiCo. Inc. 3.13% 11/01/2020 150,000 155,415 PepsiCo. Inc. 3.60% 03/01/2024 250,000 261,476 PepsiCo. Inc. 3.50% 07/17/2025 50,000 51,582 PepsiCo. Inc. 7.00% 03/01/2029 176,000 236,187 PepsiCo. Inc. 5.50% 01/15/2040 100,000 115,889

State Street Bank and Trust Company
State Street U.S. Government/Credit Bond Index Non-Lending Series Fund
Schedule of Investments (showing percentage of total value of investments)
December 31, 2015
The accompanying notes are an integral part
of these financial statements. 25
Debt Instruments - 40.7% Interest
Rate Maturity
Date Principal Value
($) PepsiCo. Inc. 4.00% 03/05/2042 100,000 96,837 PepsiCo. Inc. 4.60% 07/17/2045 35,000 36,911
5,839,235
Biotechnology - 0.6% Amgen Inc. 2.13% 05/15/2017 USD 100,000 100,665 Amgen Inc. 5.85% 06/01/2017 15,000 15,871 Amgen Inc. 6.15% 06/01/2018 13,000 14,258 Amgen Inc. 5.70% 02/01/2019 171,000 188,204 Amgen Inc. 2.20% 05/22/2019 200,000 199,345 Amgen Inc. 4.10% 06/15/2021 100,000 105,511 Amgen Inc. 3.63% 05/15/2022 150,000 153,724 Amgen Inc. 3.63% 05/22/2024 200,000 199,985 Amgen Inc. 3.13% 05/01/2025 200,000 189,837 Amgen Inc. 6.38% 06/01/2037 1,000 1,166 Amgen Inc. 6.90% 06/01/2038 8,000 9,885 Amgen Inc. 6.40% 02/01/2039 20,000 23,442 Amgen Inc. 5.75% 03/15/2040 150,000 163,675 Amgen Inc. 5.15% 11/15/2041 250,000 253,897 Amgen Inc. 5.38% 05/15/2043 100,000 105,964 Biogen Inc. 2.90% 09/15/2020 100,000 99,559 Biogen Inc. 3.63% 09/15/2022 55,000 55,616 Biogen Inc. 4.05% 09/15/2025 55,000 55,319 Biogen Inc. 5.20% 09/15/2045 65,000 65,287 Bio-Rad Laboratories Inc. 4.88% 12/15/2020 50,000 53,124 Celgene Corp. 2.13% 08/15/2018 55,000 54,930 Celgene Corp. 3.25% 08/15/2022 150,000 148,710 Celgene Corp. 3.55% 08/15/2022 100,000 100,844 Celgene Corp. 4.00% 08/15/2023 100,000 102,604 Celgene Corp. 3.63% 05/15/2024 150,000 147,856 Celgene Corp. 4.63% 05/15/2044 83,000 78,665 Celgene Corp. 5.00% 08/15/2045 55,000 55,418 GenoFocus Inc. 2.34% 11/15/2020 750,000 743,197 Gilead Sciences Inc. 1.85% 09/04/2018 40,000 40,110 Gilead Sciences Inc. 2.55% 09/01/2020 100,000 99,865 Gilead Sciences Inc. 4.50% 04/01/2021 106,000 114,710 Gilead Sciences Inc. 3.25% 09/01/2022 40,000 40,337 Gilead Sciences Inc. 3.70% 04/01/2024 250,000 255,641

State Street Bank and Trust Company
State Street U.S. Government/Credit Bond Index Non-Lending Series Fund
Schedule of Investments (showing percentage of total value of investments)
December 31, 2015
The accompanying notes are an integral part
of these financial statements. 26
Debt Instruments - 40.7% Interest
Rate Maturity
Date Principal Value
($) Gilead Sciences Inc. 3.65% 03/01/2026 100,000 100,616 Gilead Sciences Inc. 4.60% 09/01/2035 45,000 45,746 Gilead Sciences Inc. 5.65% 12/01/2041 100,000 113,679 Gilead Sciences Inc. 4.50% 02/01/2045 350,000 342,207 Gilead Sciences Inc. 4.75% 03/01/2046 50,000 50,798
4,690,267
Building Materials - 0.0% CRH America Inc. 8.13% 07/15/2018 USD 16,000 18,169 Fortune Brands Home & Security Inc. 3.00% 06/15/2020 50,000 49,689 Martin Marietta Materials Inc. 6.60% 04/15/2018 6,000 6,519 Martin Marietta Materials Inc. 4.25% 07/02/2024 30,000 29,840 Owens Corning 4.20% 12/01/2024 175,000 169,602
273,819
Chemicals - 0.7% Agrium Inc. 6.75% 01/15/2019 USD 10,000 11,050 Agrium Inc. 3.38% 03/15/2025 100,000 91,410 Agrium Inc. 7.13% 05/23/2036 6,000 7,007 Agrium Inc. 6.13% 01/15/2041 100,000 105,303 Agrium Inc. 5.25% 01/15/2045 70,000 66,311 Air Products & Chemicals Inc. 3.35% 07/31/2024 150,000 149,380 Airgas Inc. 1.65% 02/15/2018 100,000 99,020 Albemarle Corp. 5.45% 12/01/2044 100,000 94,847 Braskem Finance Ltd.2 6.45% 02/03/2024 200,000 170,500 CF Industries Inc. 3.45% 06/01/2023 38,000 35,334 CF Industries Inc. 5.38% 03/15/2044 200,000 174,067 Dow Chemical Co. 8.55% 05/15/2019 292,000 343,587 Dow Chemical Co. 4.25% 11/15/2020 100,000 104,695 Dow Chemical Co. 3.00% 11/15/2022 100,000 96,045 Dow Chemical Co. 7.38% 11/01/2029 22,000 27,357 Dow Chemical Co. 9.40% 05/15/2039 117,000 168,559 Dow Chemical Co. 5.25% 11/15/2041 150,000 146,464 Eastman Chemical Co. 2.40% 06/01/2017 200,000 200,603 Eastman Chemical Co. 5.50% 11/15/2019 100,000 109,453 Eastman Chemical Co. 3.80% 03/15/2025 100,000 96,777 Eastman Chemical Co. 4.65% 10/15/2044 35,000 31,091 Ecolab Inc. 4.35% 12/08/2021 250,000 266,115

State Street Bank and Trust Company
State Street U.S. Government/Credit Bond Index Non-Lending Series Fund
Schedule of Investments (showing percentage of total value of investments)
December 31, 2015
The accompanying notes are an integral part
of these financial statements. 27
Debt Instruments - 40.7% Interest
Rate Maturity
Date Principal Value
($) EI du Pont de Nemours & Co. 5.75% 03/15/2019 115,000 126,065 EI du Pont de Nemours & Co. 3.63% 01/15/2021 150,000 153,642 EI du Pont de Nemours & Co. 6.50% 01/15/2028 5,000 5,636 EI du Pont de Nemours & Co. 5.60% 12/15/2036 7,000 7,201 EI du Pont de Nemours & Co. 4.90% 01/15/2041 150,000 141,334 FMC Corp. 5.20% 12/15/2019 25,000 26,509 Lubrizol Corp. 8.88% 02/01/2019 19,000 22,603 Lubrizol Corp. 6.50% 10/01/2034 105,000 131,090 LYB International Finance BV 4.88% 03/15/2044 200,000 182,976 LyondellBasell Industries NV 6.00% 11/15/2021 250,000 280,314 Methanex Corp. 3.25% 12/15/2019 100,000 94,991 Monsanto Co. 5.13% 04/15/2018 4,000 4,253 Monsanto Co. 2.13% 07/15/2019 150,000 147,353 Monsanto Co. 2.85% 04/15/2025 100,000 91,325 Monsanto Co. 5.50% 08/15/2025 4,000 4,399 Monsanto Co. 4.20% 07/15/2034 70,000 60,457 Monsanto Co. 5.50% 07/30/2035 5,000 4,958 Monsanto Co. 5.88% 04/15/2038 4,000 4,027 Monsanto Co. 4.65% 11/15/2043 100,000 85,171 Monsanto Co. 3.95% 04/15/2045 100,000 77,323 Mosaic Co. 3.75% 11/15/2021 100,000 98,440 Mosaic Co. 4.25% 11/15/2023 75,000 74,375 Mosaic Co. 5.63% 11/15/2043 100,000 96,650 Potash Corp. of Saskatchewan Inc. 6.50% 05/15/2019 16,000 18,001 Potash Corp. of Saskatchewan Inc. 4.88% 03/30/2020 125,000 135,050 Potash Corp. of Saskatchewan Inc. 3.00% 04/01/2025 150,000 139,865 Potash Corp. of Saskatchewan Inc. 5.88% 12/01/2036 6,000 6,496 PPG Industries Inc. 3.60% 11/15/2020 200,000 202,220 PPG Industries Inc. 5.50% 11/15/2040 100,000 108,263 Praxair Inc. 5.20% 03/15/2017 13,000 13,591 Praxair Inc. 1.25% 11/07/2018 150,000 146,798 Praxair Inc. 2.45% 02/15/2022 100,000 97,295 Praxair Inc. 2.65% 02/05/2025 50,000 48,091 Praxair Inc. 3.55% 11/07/2042 100,000 88,119 Rohm & Haas Co. 6.00% 09/15/2017 14,000 14,914 RPM International Inc. 6.50% 02/15/2018 6,000 6,425 RPM International Inc. 3.45% 11/15/2022 100,000 94,838 Valspar Corp. 7.25% 06/15/2019 7,000 7,871

State Street Bank and Trust Company
State Street U.S. Government/Credit Bond Index Non-Lending Series Fund
Schedule of Investments (showing percentage of total value of investments)
December 31, 2015
The accompanying notes are an integral part
of these financial statements. 28
Debt Instruments - 40.7% Interest
Rate Maturity
Date Principal Value
($) Valspar Corp. 4.20% 01/15/2022 200,000 203,340
5,847,244
Commercial Services - 0.3% Automatic Data Processing Inc. 2.25% 09/15/2020 USD 100,000 99,996 Automatic Data Processing Inc. 3.38% 09/15/2025 50,000 50,767 Block Financial LLC 5.50% 11/01/2022 100,000 105,588
Board of Trustees of The Leland Stanford Junior University
4.75%
05/01/2019
7,000
7,641
Board of Trustees of The Leland Stanford Junior University
3.46%
05/01/2047
50,000
46,726
California Institute of Technology 4.32% 08/01/2045 30,000 30,920 Catholic Health Initiatives 4.35% 11/01/2042 100,000 92,399 Emory University 5.63% 09/01/2019 4,000 4,495 Equifax Inc. 6.30% 07/01/2017 1,000 1,061 Equifax Inc. 7.00% 07/01/2037 5,000 5,459 George Washington University 4.30% 09/15/2044 50,000 48,630 Massachusetts Institute of Technology 3.96% 07/01/2038 60,000 62,110 Massachusetts Institute of Technology 4.68% 07/01/2114 100,000 101,241 MasterCard Inc. 3.38% 04/01/2024 35,000 35,629 McGraw Hill Financial Inc. 4.00% 06/15/2025 100,000 99,643 Moody's Corp. 4.88% 02/15/2024 100,000 105,820 Northwestern University 3.69% 12/01/2038 70,000 69,171
President and Fellows of Harvard College
6.30%
10/01/2037
6,000
6,090
President and Fellows of Harvard College
4.88%
10/15/2040
100,000
117,692
Princeton University 4.95% 03/01/2019 13,000 14,212 Princeton University 5.70% 03/01/2039 11,000 14,361 Total System Services Inc. 2.38% 06/01/2018 60,000 59,305 Trustees of Dartmouth College 4.75% 06/01/2019 4,000 4,348 University of Pennsylvania 4.67% 09/01/2112 150,000 144,011 Vanderbilt University 5.25% 04/01/2019 7,000 7,712 Verisk Analytics Inc. 4.13% 09/12/2022 150,000 151,298 Visa Inc. 1.20% 12/14/2017 55,000 54,966 Visa Inc. 2.20% 12/14/2020 150,000 149,995 Visa Inc. 2.80% 12/14/2022 150,000 150,499 Visa Inc. 3.15% 12/14/2025 250,000 250,925 Visa Inc. 4.15% 12/14/2035 60,000 60,639

State Street Bank and Trust Company
State Street U.S. Government/Credit Bond Index Non-Lending Series Fund
Schedule of Investments (showing percentage of total value of investments)
December 31, 2015
The accompanying notes are an integral part
of these financial statements. 29
Debt Instruments - 40.7% Interest
Rate Maturity
Date Principal Value
($) Visa Inc. 4.30% 12/14/2045 130,000 132,182 Western Union Co. 3.65% 08/22/2018 100,000 102,341 Western Union Co. 5.25% 04/01/2020 25,000 26,766 Western Union Co. 6.20% 11/17/2036 9,000 8,673 William Marsh Rice University 3.57% 05/15/2045 100,000 95,023 Yale University 2.09% 04/15/2019 50,000 50,294
2,568,628
Computers - 0.7% Apple Inc. 1.05% 05/05/2017 USD 200,000 200,047 Apple Inc. 1.00% 05/03/2018 350,000 346,993 Apple Inc. 2.10% 05/06/2019 250,000 252,419 Apple Inc. 1.55% 02/07/2020 100,000 98,118 Apple Inc. 2.00% 05/06/2020 100,000 99,584 Apple Inc. 2.15% 02/09/2022 100,000 97,551 Apple Inc. 2.70% 05/13/2022 200,000 200,742 Apple Inc. 2.40% 05/03/2023 350,000 339,954 Apple Inc. 3.45% 05/06/2024 200,000 206,064 Apple Inc. 2.50% 02/09/2025 100,000 95,457 Apple Inc. 3.20% 05/13/2025 100,000 100,840 Apple Inc. 3.85% 05/04/2043 250,000 231,242 Apple Inc. 4.45% 05/06/2044 40,000 40,580 Apple Inc. 3.45% 02/09/2045 150,000 128,716 Apple Inc. 4.38% 05/13/2045 65,000 65,372 Computer Sciences Corp. 6.50% 03/15/2018 24,000 25,953 Computer Sciences Corp. 4.45% 09/15/2022 100,000 100,711 EMC Corp. 1.88% 06/01/2018 200,000 186,044 EMC Corp. 3.38% 06/01/2023 200,000 160,345 Hewlett Packard Enterprise Co. 2.85% 10/05/2018 200,000 199,656 Hewlett Packard Enterprise Co. 3.60% 10/15/2020 100,000 100,080 Hewlett Packard Enterprise Co. 4.90% 10/15/2025 200,000 196,241 Hewlett Packard Enterprise Co. 6.20% 10/15/2035 100,000 96,135 Hewlett Packard Enterprise Co. 6.35% 10/15/2045 100,000 95,248 HP Enterprise Services LLC 7.45% 10/15/2029 4,000 4,672 HP Inc. 3.75% 12/01/2020 17,000 16,774 HP Inc. 4.65% 12/09/2021 150,000 149,223 HP Inc. 4.05% 09/15/2022 200,000 191,412 HP Inc. 6.00% 09/15/2041 100,000 86,337

State Street Bank and Trust Company
State Street U.S. Government/Credit Bond Index Non-Lending Series Fund
Schedule of Investments (showing percentage of total value of investments)
December 31, 2015
The accompanying notes are an integral part
of these financial statements. 30
Debt Instruments - 40.7% Interest
Rate Maturity
Date Principal Value
($)
International Business Machines Corp.
1.25%
02/06/2017
200,000
200,430
International Business Machines Corp.
5.70%
09/14/2017
300,000
321,455
International Business Machines Corp.
7.63%
10/15/2018
18,000
20,688
International Business Machines Corp.
8.38%
11/01/2019
13,000
15,849
International Business Machines Corp.
2.90%
11/01/2021
200,000
201,596
International Business Machines Corp.
1.88%
08/01/2022
100,000
94,267
International Business Machines Corp.
2.88%
11/09/2022
200,000
198,996
International Business Machines Corp.
3.38%
08/01/2023
150,000
152,505
International Business Machines Corp.
3.63%
02/12/2024
100,000
102,684
International Business Machines Corp.
7.00%
10/30/2025
12,000
15,357
International Business Machines Corp.
6.22%
08/01/2027
8,000
9,906
International Business Machines Corp.
6.50%
01/15/2028
14,000
17,740
International Business Machines Corp.
5.88%
11/29/2032
9,000
10,885
International Business Machines Corp.
5.60%
11/30/2039
100,000
115,684
International Business Machines Corp.
4.00%
06/20/2042
100,000
93,929
Lexmark International Inc. 6.65% 06/01/2018 8,000 8,565 NetApp Inc. 3.38% 06/15/2021 50,000 48,719 Seagate HDD Cayman 3.75% 11/15/2018 200,000 198,000 Seagate HDD Cayman 4.75% 01/01/2025 100,000 83,250
6,023,015
Cosmetics/Personal Care - 0.1% Colgate-Palmolive Co. 0.90% 05/01/2018 USD 100,000 98,574 Colgate-Palmolive Co. 2.95% 11/01/2020 50,000 51,407 Colgate-Palmolive Co. 2.30% 05/03/2022 100,000 99,090 Colgate-Palmolive Co. 2.10% 05/01/2023 100,000 96,383

State Street Bank and Trust Company
State Street U.S. Government/Credit Bond Index Non-Lending Series Fund
Schedule of Investments (showing percentage of total value of investments)
December 31, 2015
The accompanying notes are an integral part
of these financial statements. 31
Debt Instruments - 40.7% Interest
Rate Maturity
Date Principal Value
($) Estee Lauder Companies Inc. 5.55% 05/15/2017 12,000 12,627 Estee Lauder Companies Inc. 6.00% 05/15/2037 6,000 7,208 Estee Lauder Companies Inc. 4.38% 06/15/2045 100,000 99,260 Procter & Gamble - Esop 9.36% 01/01/2021 6,971 8,342 Procter & Gamble Co. 1.60% 11/15/2018 100,000 100,379 Procter & Gamble Co. 4.70% 02/15/2019 27,000 29,366 Procter & Gamble Co. 2.30% 02/06/2022 250,000 249,352 Procter & Gamble Co. 6.45% 01/15/2026 4,000 5,138 Procter & Gamble Co. 5.50% 02/01/2034 13,000 15,271 Procter & Gamble Co. 5.80% 08/15/2034 11,000 13,418 Procter & Gamble Co. 5.55% 03/05/2037 129,000 155,504
1,041,319
Distribution/Wholesale - 0.0% Ingram Micro Inc. 4.95% 12/15/2024 USD 100,000 100,033 WW Grainger Inc. 4.60% 06/15/2045 35,000 36,669
136,702
Diversified Financial Services - 1.6% Affiliated Managers Group Inc. 3.50% 08/01/2025 USD 50,000 47,543 Air Lease Corp. 5.63% 04/01/2017 150,000 155,384 Air Lease Corp. 3.38% 01/15/2019 75,000 75,472 Air Lease Corp. 3.88% 04/01/2021 75,000 75,258 American Express Co. 6.15% 08/28/2017 295,000 315,955 American Express Co. 7.00% 03/19/2018 46,000 50,882 American Express Co. 1.55% 05/22/2018 100,000 99,198 American Express Co. 2.65% 12/02/2022 190,000 183,837 American Express Co. 3.63% 12/05/2024 65,000 64,262 American Express Co. 4.05% 12/03/2042 227,000 215,561 American Express Credit Corp. 2.38% 03/24/2017 150,000 151,350 American Express Credit Corp. 1.13% 06/05/2017 200,000 198,574 American Express Credit Corp. 1.80% 07/31/2018 50,000 49,819 American Express Credit Corp. 1.88% 11/05/2018 25,000 24,897 American Express Credit Corp. 2.13% 03/18/2019 100,000 99,765 Ameriprise Financial Inc. 7.30% 06/28/2019 103,000 118,870 Ameriprise Financial Inc. 3.70% 10/15/2024 100,000 101,531 Ameritech Capital Funding Corp. 6.45% 01/15/2018 120,000 129,179 AXA Financial Inc. 7.00% 04/01/2028 5,000 6,234

State Street Bank and Trust Company
State Street U.S. Government/Credit Bond Index Non-Lending Series Fund
Schedule of Investments (showing percentage of total value of investments)
December 31, 2015
The accompanying notes are an integral part
of these financial statements. 32
Debt Instruments - 40.7% Interest
Rate Maturity
Date Principal Value
($) Bear Stearns Cos LLC 5.55% 01/22/2017 29,000 30,109 Bear Stearns Cos LLC 6.40% 10/02/2017 309,000 332,113 Bear Stearns Cos LLC 7.25% 02/01/2018 170,000 187,294 Bear Stearns Cos LLC 4.65% 07/02/2018 8,000 8,460 BlackRock Inc. 6.25% 09/15/2017 14,000 15,120 BlackRock Inc. 5.00% 12/10/2019 100,000 110,314 BlackRock Inc. 3.38% 06/01/2022 100,000 102,315 Capital One Bank USA NA 2.25% 02/13/2019 250,000 248,130 Capital One Bank USA NA 8.80% 07/15/2019 32,000 37,832 Charles Schwab Corp. 3.23% 09/01/2022 110,000 110,650 Charles Schwab Corp. 3.00% 03/10/2025 100,000 97,824 CME Group Inc. 3.00% 09/15/2022 100,000 100,144 CME Group Inc. 5.30% 09/15/2043 150,000 170,762 Discover Financial Services 6.45% 06/12/2017 9,000 9,511 Discover Financial Services 5.20% 04/27/2022 150,000 158,879 Eaton Vance Corp. 6.50% 10/02/2017 2,000 2,142 Ford Motor Credit Co. LLC 4.25% 02/03/2017 250,000 255,529 Ford Motor Credit Co. LLC 1.68% 09/08/2017 500,000 493,851 Ford Motor Credit Co. LLC 1.72% 12/06/2017 500,000 492,430 Ford Motor Credit Co. LLC 2.38% 01/16/2018 200,000 199,408 Ford Motor Credit Co. LLC 5.00% 05/15/2018 200,000 210,145 Ford Motor Credit Co. LLC 2.60% 11/04/2019 200,000 196,019 Ford Motor Credit Co. LLC 5.88% 08/02/2021 250,000 279,202 Franklin Resources Inc. 2.85% 03/30/2025 100,000 94,326 GE Capital International Funding Co. 3.37% 11/15/2025 750,000 756,080 GE Capital International Funding Co. 4.42% 11/15/2035 1,160,000 1,185,876 GE Capital Trust I1 6.38% 11/15/2067 32,000 33,440 General Electric Capital Corp. 5.40% 02/15/2017 35,000 36,540 General Electric Capital Corp. 5.55% 05/04/2020 16,000 18,101 General Electric Capital Corp. 6.75% 03/15/2032 118,000 154,088 General Electric Capital Corp. 6.15% 08/07/2037 98,000 123,658 General Electric Capital Corp. 5.88% 01/14/2038 29,000 35,556 General Electric Capital Corp. 6.88% 01/10/2039 123,000 168,109 General Electric Capital Corp.1 6.38% 11/15/2067 250,000 261,250 General Motors Financial Co. Inc. 4.75% 08/15/2017 100,000 103,339 General Motors Financial Co. Inc. 2.40% 04/10/2018 200,000 197,703 General Motors Financial Co. Inc. 3.15% 01/15/2020 200,000 197,379 General Motors Financial Co. Inc. 3.20% 07/13/2020 50,000 49,169

State Street Bank and Trust Company
State Street U.S. Government/Credit Bond Index Non-Lending Series Fund
Schedule of Investments (showing percentage of total value of investments)
December 31, 2015
The accompanying notes are an integral part
of these financial statements. 33
Debt Instruments - 40.7% Interest
Rate Maturity
Date Principal Value
($) General Motors Financial Co. Inc. 3.45% 04/10/2022 200,000 191,407 General Motors Financial Co. Inc. 4.00% 01/15/2025 200,000 189,420 General Motors Financial Co. Inc. 4.30% 07/13/2025 50,000 48,755 HSBC Finance Corp. 6.68% 01/15/2021 52,000 59,566 Jefferies Group Inc. 5.13% 04/13/2018 150,000 155,884 Jefferies Group Inc. 6.88% 04/15/2021 150,000 166,584 Jefferies Group Inc. 6.45% 06/08/2027 108,000 110,399 Jefferies Group Inc. 6.25% 01/15/2036 5,000 4,640 Jefferies Group LLC 8.50% 07/15/2019 13,000 15,075 Lazard Group LLC 3.75% 02/13/2025 100,000 92,487 Legg Mason Inc. 2.70% 07/15/2019 50,000 49,748 Legg Mason Inc. 5.63% 01/15/2044 100,000 100,773 Merrill Lynch & Co. Inc. 5.70% 05/02/2017 180,000 187,923 Murray Street Investment Trust I1 4.65% 03/09/2017 150,000 154,676 Nasdaq Inc. 4.25% 06/01/2024 100,000 100,373
National Rural Utilities Cooperative Finance Corp.
5.45%
04/10/2017
2,000
2,106
National Rural Utilities Cooperative Finance Corp.
5.45%
02/01/2018
100,000
106,635
National Rural Utilities Cooperative Finance Corp.
10.38%
11/01/2018
9,000
10,920
National Rural Utilities Cooperative Finance Corp.
2.00%
01/27/2020
300,000
292,171
National Rural Utilities Cooperative Finance Corp.
8.00%
03/01/2032
124,000
169,623
Nomura Holdings Inc. 6.70% 03/04/2020 175,000 201,330 NYSE Holdings LLC 2.00% 10/05/2017 150,000 150,562 Synchrony Financial 1.88% 08/15/2017 20,000 19,887 Synchrony Financial 2.60% 01/15/2019 50,000 49,934 Synchrony Financial 3.00% 08/15/2019 250,000 249,565 Synchrony Financial 4.25% 08/15/2024 75,000 73,955 TD Ameritrade Holding Corp. 5.60% 12/01/2019 50,000 55,648 TD Ameritrade Holding Corp. 2.95% 04/01/2022 50,000 49,334 Toyota Motor Credit Corp. 1.25% 10/05/2017 150,000 149,344 Toyota Motor Credit Corp. 4.25% 01/11/2021 50,000 53,986 Toyota Motor Credit Corp. 3.40% 09/15/2021 150,000 155,912 XTRA Finance Corp. 5.15% 04/01/2017 6,000 6,264
12,851,254

State Street Bank and Trust Company
State Street U.S. Government/Credit Bond Index Non-Lending Series Fund
Schedule of Investments (showing percentage of total value of investments)
December 31, 2015
The accompanying notes are an integral part
of these financial statements. 34
Debt Instruments - 40.7% Interest
Rate Maturity
Date Principal Value
($) Electric - 2.6% AEP Texas Central Co. 6.65% 02/15/2033 USD 3,000 3,623 Alabama Power Co. 5.50% 10/15/2017 6,000 6,374 Alabama Power Co. 5.70% 02/15/2033 5,000 5,698 Alabama Power Co. 6.13% 05/15/2038 7,000 8,349 Alabama Power Co. 6.00% 03/01/2039 22,000 26,183 Alabama Power Co. 3.75% 03/01/2045 150,000 134,743 Ameren Corp. 2.70% 11/15/2020 50,000 49,772 Ameren Illinois Co. 6.13% 11/15/2017 6,000 6,445 Ameren Illinois Co. 3.25% 03/01/2025 50,000 49,390 Ameren Illinois Co. 4.15% 03/15/2046 50,000 49,072 American Electric Power Co. Inc. 1.65% 12/15/2017 250,000 248,034 Appalachian Power Co. 5.00% 06/01/2017 7,000 7,286 Appalachian Power Co. 5.80% 10/01/2035 3,000 3,311 Appalachian Power Co. 6.38% 04/01/2036 253,000 293,763 Appalachian Power Co. 6.70% 08/15/2037 103,000 123,364 Appalachian Power Co. 7.00% 04/01/2038 12,000 14,882 Arizona Public Service Co. 8.75% 03/01/2019 104,000 123,314 Arizona Public Service Co. 2.20% 01/15/2020 150,000 148,278 Arizona Public Service Co. 5.50% 09/01/2035 3,000 3,380 Arizona Public Service Co. 4.35% 11/15/2045 50,000 50,495 Atlantic City Electric Co. 7.75% 11/15/2018 4,000 4,584 Avista Corp. 5.95% 06/01/2018 7,000 7,602 Avista Corp. 5.13% 04/01/2022 30,000 33,200 Baltimore Gas & Electric Co. 6.35% 10/01/2036 5,000 6,184 Berkshire Hathaway Energy Co. 1.10% 05/15/2017 250,000 247,865 Berkshire Hathaway Energy Co. 5.75% 04/01/2018 1,000 1,080 Berkshire Hathaway Energy Co. 2.40% 02/01/2020 50,000 49,384 Berkshire Hathaway Energy Co. 3.50% 02/01/2025 50,000 49,326 Berkshire Hathaway Energy Co. 6.13% 04/01/2036 150,000 174,051 Berkshire Hathaway Energy Co. 5.95% 05/15/2037 11,000 12,519 Berkshire Hathaway Energy Co. 6.50% 09/15/2037 16,000 19,348 Berkshire Hathaway Energy Co. 5.15% 11/15/2043 200,000 209,962 Berkshire Hathaway Energy Co. 4.50% 02/01/2045 100,000 95,772
CenterPoint Energy Houston Electric LLC
6.95%
03/15/2033
3,000
3,929
Cleveland Electric Illuminating Co. 7.88% 11/01/2017 17,000 18,682 Cleveland Electric Illuminating Co. 5.95% 12/15/2036 4,000 4,111 CMS Energy Corp. 3.60% 11/15/2025 50,000 49,605

State Street Bank and Trust Company
State Street U.S. Government/Credit Bond Index Non-Lending Series Fund
Schedule of Investments (showing percentage of total value of investments)
December 31, 2015
The accompanying notes are an integral part
of these financial statements. 35
Debt Instruments - 40.7% Interest
Rate Maturity
Date Principal Value
($) CMS Energy Corp. 4.70% 03/31/2043 100,000 99,233 Columbus Southern Power Co. 6.60% 03/01/2033 9,000 10,879 Columbus Southern Power Co. 5.85% 10/01/2035 3,000 3,411 Commonwealth Edison Co. 6.15% 09/15/2017 6,000 6,446 Commonwealth Edison Co. 5.80% 03/15/2018 18,000 19,519 Commonwealth Edison Co. 4.00% 08/01/2020 100,000 105,282 Commonwealth Edison Co. 5.88% 02/01/2033 5,000 5,899 Commonwealth Edison Co. 5.90% 03/15/2036 13,000 15,552 Commonwealth Edison Co. 6.45% 01/15/2038 160,000 204,116 Connecticut Light & Power Co. 5.65% 05/01/2018 5,000 5,429 Connecticut Light & Power Co. 5.50% 02/01/2019 11,000 12,059 Connecticut Light & Power Co. 6.35% 06/01/2036 3,000 3,764 Connecticut Light & Power Co. 4.15% 06/01/2045 25,000 24,499
Consolidated Edison Co. of New York Inc.
5.85%
04/01/2018
9,000
9,753
Consolidated Edison Co. of New York Inc.
7.13%
12/01/2018
100,000
113,368
Consolidated Edison Co. of New York Inc.
6.65%
04/01/2019
13,000
14,704
Consolidated Edison Co. of New York Inc.
3.30%
12/01/2024
300,000
298,259
Consolidated Edison Co. of New York Inc.
5.30%
03/01/2035
5,000
5,496
Consolidated Edison Co. of New York Inc.
5.85%
03/15/2036
8,000
9,341
Consolidated Edison Co. of New York Inc.
6.20%
06/15/2036
7,000
8,349
Consolidated Edison Co. of New York Inc.
5.70%
12/01/2036
4,000
4,529
Consolidated Edison Co. of New York Inc.
6.30%
08/15/2037
150,000
181,889
Consolidated Edison Co. of New York Inc.
6.75%
04/01/2038
12,000
15,430
Consolidated Edison Co. of New York Inc.
5.50%
12/01/2039
100,000
113,439
Constellation Energy Group Inc. 5.15% 12/01/2020 100,000 108,480 Consumers Energy Co. 5.15% 02/15/2017 5,000 5,203 Consumers Energy Co. 5.65% 09/15/2018 7,000 7,645 Consumers Energy Co. 6.13% 03/15/2019 13,000 14,562 Consumers Energy Co. 6.70% 09/15/2019 135,000 155,197

State Street Bank and Trust Company
State Street U.S. Government/Credit Bond Index Non-Lending Series Fund
Schedule of Investments (showing percentage of total value of investments)
December 31, 2015
The accompanying notes are an integral part
of these financial statements. 36
Debt Instruments - 40.7% Interest
Rate Maturity
Date Principal Value
($) Consumers Energy Co. 5.65% 04/15/2020 5,000 5,615 Consumers Energy Co. 3.13% 08/31/2024 100,000 99,242 Detroit Edison Co. 3.90% 06/01/2021 100,000 106,146 Detroit Edison Co. 2.65% 06/15/2022 25,000 24,597 Detroit Edison Co. 6.63% 06/01/2036 3,000 3,860 Detroit Edison Co. 5.70% 10/01/2037 3,000 3,533 Dominion Resources Inc. 6.40% 06/15/2018 11,000 12,045 Dominion Resources Inc. 4.45% 03/15/2021 400,000 424,365 Dominion Resources Inc. 3.63% 12/01/2024 150,000 147,964 Dominion Resources Inc. 6.30% 03/15/2033 5,000 5,731 Dominion Resources Inc. 5.25% 08/01/2033 8,000 8,308 Dominion Resources Inc. 5.95% 06/15/2035 12,000 13,455 Dominion Resources Inc. 7.00% 06/15/2038 106,000 127,597 DTE Electric Co. 4.30% 07/01/2044 150,000 150,245 DTE Energy Co. 3.85% 12/01/2023 150,000 153,955 DTE Energy Co. 6.38% 04/15/2033 8,000 9,659 Duke Energy Carolinas LLC 5.25% 01/15/2018 14,000 14,993 Duke Energy Carolinas LLC 5.10% 04/15/2018 8,000 8,588 Duke Energy Carolinas LLC 7.00% 11/15/2018 10,000 11,372 Duke Energy Carolinas LLC 4.30% 06/15/2020 194,000 209,481 Duke Energy Carolinas LLC 6.00% 12/01/2028 4,000 4,767 Duke Energy Carolinas LLC 6.45% 10/15/2032 4,000 4,848 Duke Energy Carolinas LLC 6.10% 06/01/2037 12,000 14,307 Duke Energy Carolinas LLC 6.00% 01/15/2038 12,000 14,595 Duke Energy Carolinas LLC 6.05% 04/15/2038 12,000 14,619 Duke Energy Carolinas LLC 5.30% 02/15/2040 100,000 113,451 Duke Energy Carolinas LLC 4.25% 12/15/2041 100,000 99,375 Duke Energy Corp. 1.63% 08/15/2017 250,000 249,174 Duke Energy Corp. 3.75% 04/15/2024 100,000 100,999 Duke Energy Corp. 4.80% 12/15/2045 50,000 50,469 Duke Energy Florida LLC 3.10% 08/15/2021 100,000 101,885 Duke Energy Florida LLC 6.35% 09/15/2037 10,000 12,545 Duke Energy Florida LLC 6.40% 06/15/2038 30,000 38,003 Duke Energy Indiana Inc. 6.12% 10/15/2035 9,000 10,418 Duke Energy Indiana Inc. 6.35% 08/15/2038 17,000 21,099 Duke Energy Indiana Inc. 6.45% 04/01/2039 10,000 12,674 Duke Energy Ohio Inc. 5.45% 04/01/2019 6,000 6,572 Duke Energy Progress LLC 2.80% 05/15/2022 300,000 299,548

State Street Bank and Trust Company
State Street U.S. Government/Credit Bond Index Non-Lending Series Fund
Schedule of Investments (showing percentage of total value of investments)
December 31, 2015
The accompanying notes are an integral part
of these financial statements. 37
Debt Instruments - 40.7% Interest
Rate Maturity
Date Principal Value
($) Duke Energy Progress LLC 6.30% 04/01/2038 5,000 6,347 Duke Energy Progress LLC 4.10% 05/15/2042 100,000 96,553 Duke Energy Progress LLC 4.38% 03/30/2044 100,000 101,202 El Paso Electric Co. 6.00% 05/15/2035 4,000 4,535 Empresa Nacional de Electracidad SA 4.25% 04/15/2024 50,000 50,189 Entergy Arkansas Inc. 3.70% 06/01/2024 100,000 101,584 Entergy Gulf States Louisiana LLC 6.00% 05/01/2018 9,000 9,779 Entergy Gulf States Louisiana LLC 5.59% 10/01/2024 30,000 34,262 Entergy Louisiana LLC 6.50% 09/01/2018 100,000 111,144 Entergy Texas Inc. 7.13% 02/01/2019 10,000 11,338 Eversource Energy 4.50% 11/15/2019 100,000 106,571 Exelon Corp. 2.85% 06/15/2020 100,000 99,582 Exelon Corp. 3.95% 06/15/2025 100,000 99,798 Exelon Corp. 4.95% 06/15/2035 35,000 34,912 Exelon Corp. 5.63% 06/15/2035 6,000 6,370 Exelon Generation Co. LLC 6.20% 10/01/2017 7,000 7,449 Exelon Generation Co. LLC 5.20% 10/01/2019 150,000 161,061 Exelon Generation Co. LLC 4.25% 06/15/2022 44,000 44,659 Exelon Generation Co. LLC 6.25% 10/01/2039 100,000 100,978 Exelon Generation Co. LLC 5.75% 10/01/2041 100,000 94,605 FirstEnergy Solutions Corp. 6.80% 08/15/2039 7,000 6,745 Florida Power & Light Co. 5.55% 11/01/2017 10,000 10,695 Florida Power & Light Co. 3.25% 06/01/2024 100,000 101,426 Florida Power & Light Co. 3.13% 12/01/2025 150,000 149,606 Florida Power & Light Co. 4.95% 06/01/2035 6,000 6,493 Florida Power & Light Co. 5.65% 02/01/2037 7,000 8,226 Florida Power & Light Co. 5.95% 02/01/2038 111,000 137,123 Florida Power & Light Co. 5.96% 04/01/2039 9,000 11,000 Florida Power & Light Co. 4.05% 06/01/2042 100,000 98,559 Georgia Power Co. 5.70% 06/01/2017 10,000 10,546 Georgia Power Co. 5.40% 06/01/2018 8,000 8,610 Georgia Power Co. 5.65% 03/01/2037 105,000 112,841 Georgia Power Co. 5.95% 02/01/2039 150,000 166,738 Georgia Power Co. 5.40% 06/01/2040 100,000 104,587 Georgia Power Co. 4.30% 03/15/2043 100,000 90,750 Great Plains Energy Inc. 4.85% 06/01/2021 50,000 53,043 Hydro Quebec 8.40% 01/15/2022 28,000 36,338 Hydro Quebec 8.05% 07/07/2024 158,000 214,791

State Street Bank and Trust Company
State Street U.S. Government/Credit Bond Index Non-Lending Series Fund
Schedule of Investments (showing percentage of total value of investments)
December 31, 2015
The accompanying notes are an integral part
of these financial statements. 38
Debt Instruments - 40.7% Interest
Rate Maturity
Date Principal Value
($) Hydro Quebec 8.50% 12/01/2029 16,000 23,809 Hydro Quebec 9.38% 04/15/2030 2,000 3,225 Hydro Quebec 9.50% 11/15/2030 3,000 4,856 Hydro-Quebec 1.38% 06/19/2017 50,000 50,114 Iberdrola International BV 5.81% 03/15/2025 4,000 4,447 Iberdrola International BV 6.75% 07/15/2036 9,000 10,981 Indiana Michigan Power Co. 7.00% 03/15/2019 14,000 15,854 Integrys Holding Inc. 4.17% 11/01/2020 250,000 263,631 Interstate Power & Light Co. 3.25% 12/01/2024 50,000 49,824 Interstate Power & Light Co. 6.25% 07/15/2039 6,000 7,545 ITC Holdings Corp. 3.65% 06/15/2024 50,000 49,192 Jersey Central Power & Light Co. 5.65% 06/01/2017 7,000 7,332 Jersey Central Power & Light Co. 6.15% 06/01/2037 4,000 4,262 Kansas City Power & Light Co. 6.38% 03/01/2018 7,000 7,622 Kansas City Power & Light Co. 7.15% 04/01/2019 13,000 14,941 Kansas City Power & Light Co. 3.15% 03/15/2023 100,000 98,250 Kansas City Power & Light Co. 3.65% 08/15/2025 50,000 49,895 Kansas City Power & Light Co. 6.05% 11/15/2035 4,000 4,709 Kentucky Utilities Co. 3.25% 11/01/2020 100,000 103,008 Korea Electric Power Corp. 7.00% 02/01/2027 1,000 1,254 Louisville Gas & Electric Co. 3.30% 10/01/2025 150,000 150,904 Louisville Gas & Electric Co. 4.65% 11/15/2043 100,000 104,440 MidAmerican Energy Co. 5.95% 07/15/2017 8,000 8,519 MidAmerican Energy Co. 5.30% 03/15/2018 5,000 5,360 MidAmerican Energy Co. 6.75% 12/30/2031 4,000 5,114 MidAmerican Energy Co. 5.75% 11/01/2035 8,000 9,337 MidAmerican Energy Co. 5.80% 10/15/2036 157,000 185,784 MidAmerican Energy Holdings Co. 8.48% 09/15/2028 7,000 9,735 MidAmerican Funding LLC 6.93% 03/01/2029 9,000 11,176 Nevada Power Co. 6.50% 05/15/2018 17,000 18,711 Nevada Power Co. 6.50% 08/01/2018 12,000 13,297 Nevada Power Co. 7.13% 03/15/2019 15,000 17,074 Nevada Power Co. 6.65% 04/01/2036 5,000 6,249 Nevada Power Co. 6.75% 07/01/2037 5,000 6,322 NextEra Energy Capital Holdings Inc. 1.59% 06/01/2017 30,000 29,876 NextEra Energy Capital Holdings Inc. 6.00% 03/01/2019 100,000 109,245 NextEra Energy Capital Holdings Inc. 2.70% 09/15/2019 100,000 99,367
NextEra Energy Capital Holdings Inc.1
6.65%
06/15/2067
10,000
7,600

State Street Bank and Trust Company
State Street U.S. Government/Credit Bond Index Non-Lending Series Fund
Schedule of Investments (showing percentage of total value of investments)
December 31, 2015
The accompanying notes are an integral part
of these financial statements. 39
Debt Instruments - 40.7% Interest
Rate Maturity
Date Principal Value
($)
NextEra Energy Capital Holdings Inc.1
7.30%
09/01/2067
3,000
2,850
Nisource Finance Corp. 6.40% 03/15/2018 95,000 103,380 Nisource Finance Corp. 6.80% 01/15/2019 15,000 16,782 Nisource Finance Corp. 5.45% 09/15/2020 18,000 19,673 Nisource Finance Corp. 6.25% 12/15/2040 100,000 117,389 Nisource Finance Corp. 4.80% 02/15/2044 150,000 150,678 Northern States Power Co. 5.25% 03/01/2018 13,000 13,898 Northern States Power Co. 2.15% 08/15/2022 250,000 238,399 Northern States Power Co. 5.25% 07/15/2035 4,000 4,556 Northern States Power Co. 6.25% 06/01/2036 8,000 10,080 Northern States Power Co. 6.20% 07/01/2037 5,000 6,349 Northern States Power Co. 4.85% 08/15/2040 100,000 109,472 NSTAR Electric Co. 5.63% 11/15/2017 10,000 10,695 NSTAR Electric Co. 4.40% 03/01/2044 100,000 101,279 Oglethorpe Power Corp. 6.10% 03/15/2019 10,000 10,988 Oglethorpe Power Corp. 5.38% 11/01/2040 100,000 105,000 Ohio Edison Co. 6.88% 07/15/2036 157,000 189,498 Ohio Edison Co. 8.25% 10/15/2038 5,000 7,090 Ohio Power Co. 6.60% 02/15/2033 3,000 3,625 Oklahoma Gas & Electric Co. 5.25% 05/15/2041 100,000 110,513 Oncor Electric Delivery Co. LLC 6.80% 09/01/2018 108,000 119,831 Oncor Electric Delivery Co. LLC 7.00% 09/01/2022 120,000 142,608 Oncor Electric Delivery Co. LLC 7.00% 05/01/2032 8,000 9,771 Oncor Electric Delivery Co. LLC 7.25% 01/15/2033 5,000 6,267 Oncor Electric Delivery Co. LLC 7.50% 09/01/2038 3,000 4,000 Oncor Electric Delivery Co. LLC 5.25% 09/30/2040 150,000 158,134 Pacific Gas & Electric Co. 5.63% 11/30/2017 162,000 172,932 Pacific Gas & Electric Co. 3.50% 10/01/2020 100,000 103,023 Pacific Gas & Electric Co. 3.40% 08/15/2024 100,000 100,904 Pacific Gas & Electric Co. 3.50% 06/15/2025 100,000 101,533 Pacific Gas & Electric Co. 6.05% 03/01/2034 108,000 129,066 Pacific Gas & Electric Co. 5.80% 03/01/2037 12,000 13,898 Pacific Gas & Electric Co. 6.35% 02/15/2038 190,000 231,332 Pacific Gas & Electric Co. 6.25% 03/01/2039 110,000 133,020 Pacific Gas & Electric Co. 4.75% 02/15/2044 100,000 103,925 Pacific Gas & Electric Co. 4.30% 03/15/2045 60,000 58,725 PacifiCorp 2.95% 02/01/2022 100,000 100,130 PacifiCorp 3.35% 07/01/2025 100,000 100,037

State Street Bank and Trust Company
State Street U.S. Government/Credit Bond Index Non-Lending Series Fund
Schedule of Investments (showing percentage of total value of investments)
December 31, 2015
The accompanying notes are an integral part
of these financial statements. 40
Debt Instruments - 40.7% Interest
Rate Maturity
Date Principal Value
($) PacifiCorp 4.10% 02/01/2042 100,000 96,574 PacifiCorp. 5.65% 07/15/2018 114,000 123,882 PacifiCorp. 7.70% 11/15/2031 14,000 19,295 PacifiCorp. 5.25% 06/15/2035 3,000 3,323 PacifiCorp. 6.10% 08/01/2036 6,000 7,261 PacifiCorp. 5.75% 04/01/2037 8,000 9,419 PacifiCorp. 6.25% 10/15/2037 10,000 12,381 PacifiCorp. 6.35% 07/15/2038 15,000 18,732 PacifiCorp. 6.00% 01/15/2039 13,000 15,779 PECO Energy Co. 5.35% 03/01/2018 15,000 16,101 PECO Energy Co. 5.95% 10/01/2036 4,000 4,869 PECO Energy Co. 4.15% 10/01/2044 200,000 196,036 Pennsylvania Electric Co. 6.05% 09/01/2017 108,000 114,158 Portland General Electric Co. 6.10% 04/15/2019 6,000 6,614 Potomac Electric Power Co. 3.60% 03/15/2024 100,000 102,255 Potomac Electric Power Co. 6.50% 11/15/2037 107,000 136,230 Potomac Electric Power Co. 7.90% 12/15/2038 8,000 11,615 PPL Capital Funding Inc. 4.20% 06/15/2022 25,000 26,188 PPL Capital Funding Inc. 4.70% 06/01/2043 83,000 82,743 PPL Electric Utilities Corp. 2.50% 09/01/2022 150,000 146,601 PPL Electric Utilities Corp. 6.25% 05/15/2039 8,000 10,147 Progress Energy Inc. 7.05% 03/15/2019 100,000 113,429 Progress Energy Inc. 4.88% 12/01/2019 100,000 107,373 Progress Energy Inc. 7.75% 03/01/2031 11,000 14,299 Progress Energy Inc. 7.00% 10/30/2031 5,000 6,165 Progress Energy Inc. 6.00% 12/01/2039 100,000 115,857 PSEG Power LLC 2.45% 11/15/2018 100,000 99,245 PSEG Power LLC 5.13% 04/15/2020 49,000 52,647 PSEG Power LLC 8.63% 04/15/2031 6,000 7,512 Public Service Co. of Colorado 5.80% 08/01/2018 8,000 8,746 Public Service Co. of Colorado 5.13% 06/01/2019 5,000 5,444 Public Service Co. of Colorado 6.25% 09/01/2037 7,000 8,888 Public Service Co. of Colorado 6.50% 08/01/2038 3,000 3,937 Public Service Co. of Colorado 3.95% 03/15/2043 100,000 95,651 Public Service Co. of Colorado 4.30% 03/15/2044 100,000 101,622 Public Service Co. of New Hampshire 3.50% 11/01/2023 100,000 101,832 Public Service Co. of Oklahoma 5.15% 12/01/2019 20,000 21,824 Public Service Electric & Gas Co. 5.30% 05/01/2018 8,000 8,588

State Street Bank and Trust Company
State Street U.S. Government/Credit Bond Index Non-Lending Series Fund
Schedule of Investments (showing percentage of total value of investments)
December 31, 2015
The accompanying notes are an integral part
of these financial statements. 41
Debt Instruments - 40.7% Interest
Rate Maturity
Date Principal Value
($) Public Service Electric & Gas Co. 2.38% 05/15/2023 150,000 143,399 Public Service Electric & Gas Co. 3.05% 11/15/2024 50,000 49,516 Public Service Electric & Gas Co. 5.25% 07/01/2035 3,000 3,386 Public Service Electric & Gas Co. 5.70% 12/01/2036 3,000 3,589 Public Service Electric & Gas Co. 5.80% 05/01/2037 7,000 8,434 Public Service Electric & Gas Co. 5.50% 03/01/2040 100,000 118,086 Public Service Electric & Gas Co. 3.95% 05/01/2042 100,000 95,881 Puget Energy Inc. 6.00% 09/01/2021 100,000 112,741 Puget Sound Energy Inc. 7.02% 12/01/2027 4,000 5,200 Puget Sound Energy Inc. 5.48% 06/01/2035 3,000 3,421 Puget Sound Energy Inc. 6.72% 06/15/2036 5,000 6,500 Puget Sound Energy Inc. 6.27% 03/15/2037 3,000 3,727 Puget Sound Energy Inc. 5.76% 10/01/2039 25,000 29,595 Puget Sound Energy Inc. 5.64% 04/15/2041 100,000 119,071 Puget Sound Energy Inc. 4.30% 05/20/2045 100,000 100,823 San Diego Gas & Electric Co. 6.00% 06/01/2026 5,000 6,120 San Diego Gas & Electric Co. 5.35% 05/15/2035 128,000 146,087 San Diego Gas & Electric Co. 6.13% 09/15/2037 6,000 7,418 San Diego Gas & Electric Co. 6.00% 06/01/2039 7,000 8,545 San Diego Gas & Electric Co. 3.95% 11/15/2041 100,000 95,769 SCANA Corp. 6.25% 04/01/2020 4,000 4,384 South Carolina Electric & Gas Co. 5.25% 11/01/2018 5,000 5,427 South Carolina Electric & Gas Co. 6.50% 11/01/2018 8,000 8,946 South Carolina Electric & Gas Co. 6.63% 02/01/2032 6,000 7,180 South Carolina Electric & Gas Co. 5.30% 05/15/2033 4,000 4,283 South Carolina Electric & Gas Co. 6.05% 01/15/2038 16,000 18,463 South Carolina Electric & Gas Co. 5.45% 02/01/2041 100,000 109,317 South Carolina Electric & Gas Co. 4.50% 06/01/2064 200,000 183,514 South Carolina Electric & Gas Co. 5.10% 06/01/2065 200,000 203,633 Southern California Edison Co. 1.13% 05/01/2017 200,000 198,405 Southern California Edison Co. 5.50% 08/15/2018 100,000 108,830 Southern California Edison Co. 3.88% 06/01/2021 70,000 73,941 Southern California Edison Co. 6.65% 04/01/2029 7,000 8,748 Southern California Edison Co. 6.00% 01/15/2034 8,000 9,706 Southern California Edison Co. 5.75% 04/01/2035 107,000 126,853 Southern California Edison Co. 5.35% 07/15/2035 5,000 5,675 Southern California Edison Co. 5.55% 01/15/2036 2,000 2,328 Southern California Edison Co. 5.63% 02/01/2036 9,000 10,566

State Street Bank and Trust Company
State Street U.S. Government/Credit Bond Index Non-Lending Series Fund
Schedule of Investments (showing percentage of total value of investments)
December 31, 2015
The accompanying notes are an integral part
of these financial statements. 42
Debt Instruments - 40.7% Interest
Rate Maturity
Date Principal Value
($) Southern California Edison Co. 5.55% 01/15/2037 8,000 9,230 Southern California Edison Co. 5.95% 02/01/2038 12,000 14,629 Southern California Edison Co. 6.05% 03/15/2039 162,000 198,720 Southern Co. 2.15% 09/01/2019 250,000 244,537 Southern Power Co. 2.38% 06/01/2020 200,000 193,247 Southwestern Electric Power Co. 5.55% 01/15/2017 7,000 7,285 Southwestern Electric Power Co. 5.88% 03/01/2018 8,000 8,591 Southwestern Electric Power Co. 6.45% 01/15/2019 9,000 10,056 Southwestern Electric Power Co. 6.20% 03/15/2040 150,000 172,319 Southwestern Public Service Co. 6.00% 10/01/2036 8,000 9,345 System Energy Resources Inc. 4.10% 04/01/2023 150,000 150,672 Tampa Electric Co. 6.10% 05/15/2018 2,000 2,178 Tampa Electric Co. 2.60% 09/15/2022 150,000 145,703 Tampa Electric Co. 6.55% 05/15/2036 3,000 3,796 Tampa Electric Co. 6.15% 05/15/2037 6,000 7,331 TECO Finance Inc. 5.15% 03/15/2020 35,000 37,663 Toledo Edison Co. 6.15% 05/15/2037 4,000 4,475 TransAlta Corp. 1.90% 06/03/2017 94,000 89,770 TransAlta Corp. 6.90% 05/15/2018 8,000 8,040 Tucson Electric Power Co. 3.05% 03/15/2025 50,000 47,386 Union Electric Co. 6.40% 06/15/2017 13,000 13,863 Union Electric Co. 5.30% 08/01/2037 4,000 4,498 Union Electric Co. 8.45% 03/15/2039 150,000 228,940 Virginia Electric & Power Co. 1.20% 01/15/2018 100,000 98,815 Virginia Electric & Power Co. 5.40% 04/30/2018 9,000 9,716 Virginia Electric & Power Co. 5.00% 06/30/2019 7,000 7,607 Virginia Electric & Power Co. 2.95% 01/15/2022 100,000 100,395 Virginia Electric & Power Co. 6.00% 01/15/2036 9,000 10,904 Virginia Electric & Power Co. 6.00% 05/15/2037 14,000 17,215 Virginia Electric & Power Co. 6.35% 11/30/2037 11,000 13,870 Virginia Electric & Power Co. 8.88% 11/15/2038 21,000 32,922 Virginia Electric & Power Co. 4.00% 01/15/2043 63,000 60,482 Virginia Electric & Power Co. 4.45% 02/15/2044 100,000 102,898 Virginia Electric & Power Co. 4.20% 05/15/2045 200,000 198,336 WEC Energy Group Inc. 2.45% 06/15/2020 50,000 49,539 WEC Energy Group Inc. 3.55% 06/15/2025 50,000 49,897 WEC Energy Group Inc.1 6.25% 05/15/2067 16,000 12,320 Westar Energy Inc. 5.10% 07/15/2020 5,000 5,494

State Street Bank and Trust Company
State Street U.S. Government/Credit Bond Index Non-Lending Series Fund
Schedule of Investments (showing percentage of total value of investments)
December 31, 2015
The accompanying notes are an integral part
of these financial statements. 43
Debt Instruments - 40.7% Interest
Rate Maturity
Date Principal Value
($) Westar Energy Inc. 4.63% 09/01/2043 100,000 105,670 Wisconsin Electric Power Co. 1.70% 06/15/2018 150,000 148,840 Wisconsin Electric Power Co. 5.63% 05/15/2033 6,000 6,974 Wisconsin Electric Power Co. 5.70% 12/01/2036 4,000 4,743 Wisconsin Power & Light Co. 5.00% 07/15/2019 6,000 6,473 Wisconsin Power & Light Co. 6.38% 08/15/2037 104,000 132,119 Xcel Energy Inc. 4.70% 05/15/2020 50,000 53,461 Xcel Energy Inc. 6.50% 07/01/2036 9,000 10,889 Xcel Energy Inc. 4.80% 09/15/2041 50,000 50,215
21,032,854
Electrical Components & Equipment - 0.1% Emerson Electric Co. 5.38% 10/15/2017 USD 8,000 8,517 Emerson Electric Co. 5.25% 10/15/2018 7,000 7,627 Emerson Electric Co. 5.00% 04/15/2019 200,000 217,730 Emerson Electric Co. 4.88% 10/15/2019 8,000 8,743 Emerson Electric Co. 4.25% 11/15/2020 100,000 107,405 Emerson Electric Co. 6.00% 08/15/2032 2,000 2,356 Emerson Electric Co. 6.13% 04/15/2039 5,000 6,123 Emerson Electric Co. 5.25% 11/15/2039 25,000 27,961 Legrand France SA 8.50% 02/15/2025 200,000 265,934
652,396
Electronics - 0.2% Amphenol Corp. 4.00% 02/01/2022 USD 100,000 101,323 Arrow Electronics Inc. 3.50% 04/01/2022 150,000 144,385 Avnet Inc. 4.88% 12/01/2022 100,000 102,649 Corning Inc. 1.45% 11/15/2017 150,000 148,403 Corning Inc. 6.63% 05/15/2019 3,000 3,361 Corning Inc. 7.25% 08/15/2036 3,000 3,465 Corning Inc. 4.75% 03/15/2042 30,000 28,614 Flextronics International Ltd. 4.75% 06/15/2025 75,000 73,031 Keysight Technologies Inc. 4.55% 10/30/2024 100,000 95,946 Koninklijke Philips Electronics NV 3.75% 03/15/2022 100,000 102,076 Koninklijke Philips Electronics NV 6.88% 03/11/2038 106,000 122,002 Koninklijke Philips NV 5.75% 03/11/2018 26,000 27,807 Thermo Fisher Scientific Inc. 2.40% 02/01/2019 250,000 250,067 Thermo Fisher Scientific Inc. 4.50% 03/01/2021 40,000 42,358

State Street Bank and Trust Company
State Street U.S. Government/Credit Bond Index Non-Lending Series Fund
Schedule of Investments (showing percentage of total value of investments)
December 31, 2015
The accompanying notes are an integral part
of these financial statements. 44
Debt Instruments - 40.7% Interest
Rate Maturity
Date Principal Value
($) Thermo Fisher Scientific Inc. 3.60% 08/15/2021 100,000 101,218 Thermo Fisher Scientific Inc. 4.15% 02/01/2024 200,000 207,789 Thermo Fisher Scientific Inc. 3.65% 12/15/2025 50,000 49,893 Trimble Navigation Ltd. 4.75% 12/01/2024 50,000 48,667
1,653,054
Engineering & Construction - 0.0% ABB Finance USA Inc. 1.63% 05/08/2017 USD 100,000 99,857
Environmental Control - 0.1% Republic Services Inc. 3.80% 05/15/2018 USD 100,000 103,502 Republic Services Inc. 5.50% 09/15/2019 55,000 60,392 Republic Services Inc. 5.25% 11/15/2021 25,000 27,511 Republic Services Inc. 3.20% 03/15/2025 200,000 193,228 Republic Services Inc. 6.09% 03/15/2035 3,000 3,464 Republic Services Inc. 6.20% 03/01/2040 100,000 117,340 Waste Management Inc. 4.60% 03/01/2021 145,000 155,803 Waste Management Inc. 2.90% 09/15/2022 250,000 245,119
906,359
Food - 0.6% Ahold Finance USA LLC 6.88% 05/01/2029 USD 12,000 14,331 Bestfoods 7.25% 12/15/2026 4,000 5,366 Bestfoods 6.63% 04/15/2028 3,000 3,851 Campbell Soup Co. 4.50% 02/15/2019 8,000 8,404 Campbell Soup Co. 2.50% 08/02/2022 150,000 141,873 Campbell Soup Co. 3.80% 08/02/2042 100,000 86,144 ConAgra Foods Inc. 5.82% 06/15/2017 13,000 13,664 ConAgra Foods Inc. 1.90% 01/25/2018 100,000 98,551 ConAgra Foods Inc. 7.00% 04/15/2019 50,000 55,224 ConAgra Foods Inc. 3.25% 09/15/2022 200,000 192,436 ConAgra Foods Inc. 7.13% 10/01/2026 7,000 8,177 ConAgra Foods Inc. 7.00% 10/01/2028 7,000 8,238 ConAgra Foods Inc. 8.25% 09/15/2030 5,000 6,680 Corn Products International Inc. 4.63% 11/01/2020 50,000 52,546 Delhaize America LLC 9.00% 04/15/2031 13,000 16,530 Delhaize Group SA 5.70% 10/01/2040 50,000 50,526

State Street Bank and Trust Company
State Street U.S. Government/Credit Bond Index Non-Lending Series Fund
Schedule of Investments (showing percentage of total value of investments)
December 31, 2015
The accompanying notes are an integral part
of these financial statements. 45
Debt Instruments - 40.7% Interest
Rate Maturity
Date Principal Value
($) Diageo Investment Corp. 8.00% 09/15/2022 2,000 2,565 Diageo Investment Corp. 7.45% 04/15/2035 7,000 9,295 General Mills Inc. 5.70% 02/15/2017 180,000 188,519 General Mills Inc. 5.65% 02/15/2019 23,000 24,931 General Mills Inc. 2.20% 10/21/2019 150,000 146,237 General Mills Inc. 3.65% 02/15/2024 111,000 113,090 JM Smucker Co. 3.50% 10/15/2021 100,000 101,303 JM Smucker Co. 4.38% 03/15/2045 200,000 193,108 Kellogg Co. 1.75% 05/17/2017 200,000 200,455 Kellogg Co. 3.25% 05/21/2018 65,000 66,313 Kellogg Co. 4.00% 12/15/2020 64,000 66,924 Kellogg Co. 7.45% 04/01/2031 171,000 212,180 Kraft Foods Group Inc. 6.13% 08/23/2018 200,000 219,109 Kraft Foods Group Inc. 3.50% 06/06/2022 450,000 455,282 Kraft Foods Inc. 6.13% 02/01/2018 176,000 190,722 Kraft Foods Inc. 6.50% 02/09/2040 60,000 72,331 Kraft Heinz Foods Co. 2.80% 07/02/2020 50,000 49,685 Kraft Heinz Foods Co. 3.95% 07/15/2025 50,000 50,444 Kraft Heinz Foods Co. 5.00% 07/15/2035 20,000 20,445 Kraft Heinz Foods Co. 5.20% 07/15/2045 20,000 20,702 Kroger Co. 2.20% 01/15/2017 150,000 151,338 Kroger Co. 6.40% 08/15/2017 8,000 8,575 Kroger Co. 6.80% 12/15/2018 9,000 10,103 Kroger Co. 6.15% 01/15/2020 119,000 133,395 Kroger Co. 2.95% 11/01/2021 60,000 58,891 Kroger Co. 7.70% 06/01/2029 2,000 2,633 Kroger Co. 8.00% 09/15/2029 2,000 2,691 Kroger Co. 7.50% 04/01/2031 17,000 21,665 Kroger Co. 6.90% 04/15/2038 8,000 9,990 Kroger Co. 5.40% 07/15/2040 100,000 106,721 McCormick & Co. Inc. 3.90% 07/15/2021 25,000 26,217 McCormick & Co. Inc. 3.25% 11/15/2025 35,000 34,632 Sysco Corp. 5.25% 02/12/2018 17,000 18,092 Sysco Corp. 2.60% 10/01/2020 50,000 49,998 Sysco Corp. 3.75% 10/01/2025 25,000 25,308 Sysco Corp. 5.38% 09/21/2035 6,000 6,639 Sysco Corp. 6.63% 03/17/2039 7,000 8,442 Sysco Corp. 4.85% 10/01/2045 15,000 15,476
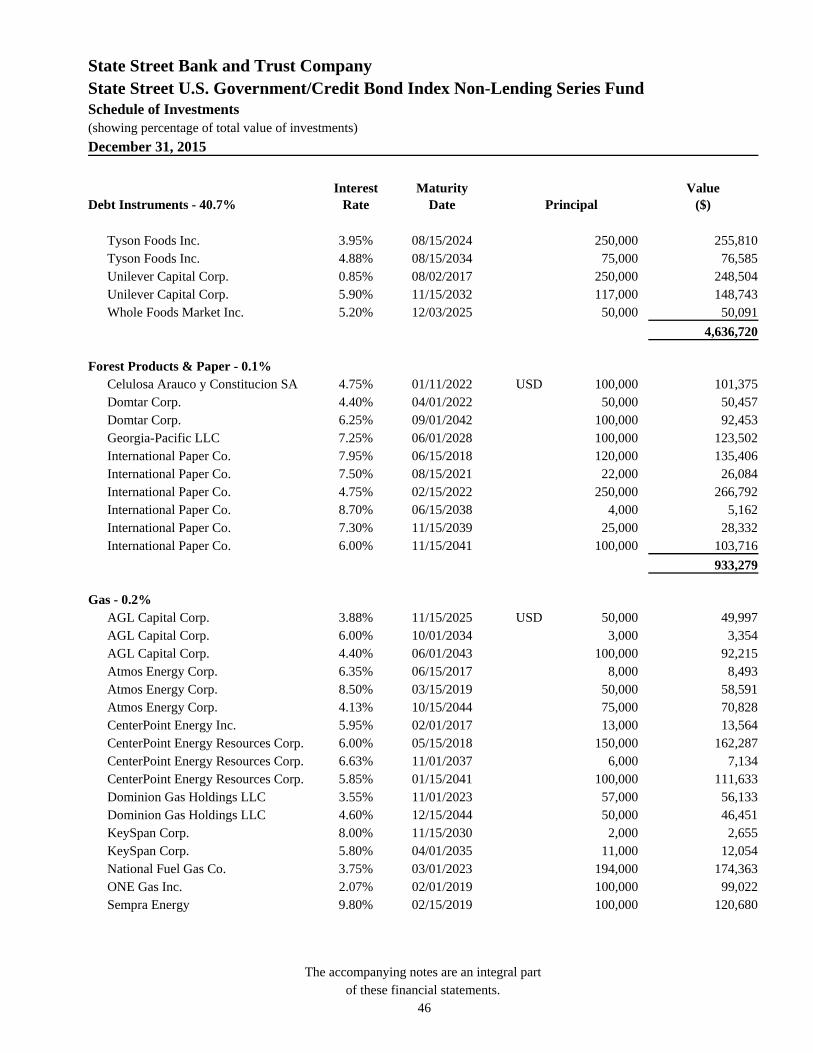
State Street Bank and Trust Company
State Street U.S. Government/Credit Bond Index Non-Lending Series Fund
Schedule of Investments (showing percentage of total value of investments)
December 31, 2015
The accompanying notes are an integral part
of these financial statements. 46
Debt Instruments - 40.7% Interest
Rate Maturity
Date Principal Value
($) Tyson Foods Inc. 3.95% 08/15/2024 250,000 255,810 Tyson Foods Inc. 4.88% 08/15/2034 75,000 76,585 Unilever Capital Corp. 0.85% 08/02/2017 250,000 248,504 Unilever Capital Corp. 5.90% 11/15/2032 117,000 148,743 Whole Foods Market Inc. 5.20% 12/03/2025 50,000 50,091
4,636,720
Forest Products & Paper - 0.1% Celulosa Arauco y Constitucion SA 4.75% 01/11/2022 USD 100,000 101,375 Domtar Corp. 4.40% 04/01/2022 50,000 50,457 Domtar Corp. 6.25% 09/01/2042 100,000 92,453 Georgia-Pacific LLC 7.25% 06/01/2028 100,000 123,502 International Paper Co. 7.95% 06/15/2018 120,000 135,406 International Paper Co. 7.50% 08/15/2021 22,000 26,084 International Paper Co. 4.75% 02/15/2022 250,000 266,792 International Paper Co. 8.70% 06/15/2038 4,000 5,162 International Paper Co. 7.30% 11/15/2039 25,000 28,332 International Paper Co. 6.00% 11/15/2041 100,000 103,716
933,279
Gas - 0.2% AGL Capital Corp. 3.88% 11/15/2025 USD 50,000 49,997 AGL Capital Corp. 6.00% 10/01/2034 3,000 3,354 AGL Capital Corp. 4.40% 06/01/2043 100,000 92,215 Atmos Energy Corp. 6.35% 06/15/2017 8,000 8,493 Atmos Energy Corp. 8.50% 03/15/2019 50,000 58,591 Atmos Energy Corp. 4.13% 10/15/2044 75,000 70,828 CenterPoint Energy Inc. 5.95% 02/01/2017 13,000 13,564 CenterPoint Energy Resources Corp. 6.00% 05/15/2018 150,000 162,287 CenterPoint Energy Resources Corp. 6.63% 11/01/2037 6,000 7,134 CenterPoint Energy Resources Corp. 5.85% 01/15/2041 100,000 111,633 Dominion Gas Holdings LLC 3.55% 11/01/2023 57,000 56,133 Dominion Gas Holdings LLC 4.60% 12/15/2044 50,000 46,451 KeySpan Corp. 8.00% 11/15/2030 2,000 2,655 KeySpan Corp. 5.80% 04/01/2035 11,000 12,054 National Fuel Gas Co. 3.75% 03/01/2023 194,000 174,363 ONE Gas Inc. 2.07% 02/01/2019 100,000 99,022 Sempra Energy 9.80% 02/15/2019 100,000 120,680

State Street Bank and Trust Company
State Street U.S. Government/Credit Bond Index Non-Lending Series Fund
Schedule of Investments (showing percentage of total value of investments)
December 31, 2015
The accompanying notes are an integral part
of these financial statements. 47
Debt Instruments - 40.7% Interest
Rate Maturity
Date Principal Value
($) Sempra Energy 2.88% 10/01/2022 100,000 96,410 Southern California Gas Co. 5.45% 04/15/2018 9,000 9,696 Southern California Gas Co. 3.15% 09/15/2024 100,000 100,179 Southern California Gas Co. 5.75% 11/15/2035 3,000 3,591 Southern California Gas Co. 5.13% 11/15/2040 100,000 112,521
1,411,851
Hand/Machine Tools - 0.0% Kennametal Inc. 2.65% 11/01/2019 USD 100,000 98,988 Stanley Black & Decker Inc. 2.45% 11/17/2018 100,000 99,658 Stanley Black & Decker Inc. 5.20% 09/01/2040 100,000 108,015
306,661
Healthcare - Products - 0.6% Baxter International Inc. 5.38% 06/01/2018 USD 8,000 8,580 Baxter International Inc. 4.50% 08/15/2019 70,000 74,317 Becton Dickinson and Co. 5.00% 05/15/2019 11,000 11,884 Becton Dickinson and Co. 6.38% 08/01/2019 113,000 127,294 Becton Dickinson and Co. 2.68% 12/15/2019 208,000 208,577 Becton Dickinson and Co. 3.25% 11/12/2020 50,000 50,786 Becton Dickinson and Co. 3.13% 11/08/2021 150,000 149,396 Becton Dickinson and Co. 3.73% 12/15/2024 300,000 302,860 Becton Dickinson and Co. 6.00% 05/15/2039 7,000 7,927 Boston Scientific Corp. 6.00% 01/15/2020 100,000 110,926 Boston Scientific Corp. 3.85% 05/15/2025 100,000 98,406 Boston Scientific Corp. 7.38% 01/15/2040 100,000 122,224 Covidien International Finance SA 6.00% 10/15/2017 70,000 75,367 Covidien International Finance SA 3.20% 06/15/2022 100,000 100,699 Covidien International Finance SA 2.95% 06/15/2023 100,000 97,860 Covidien International Finance SA 6.55% 10/15/2037 168,000 211,416 CR Bard Inc. 4.40% 01/15/2021 50,000 52,645 Danaher Corp. 5.40% 03/01/2019 22,000 24,176 Johnson & Johnson 5.55% 08/15/2017 30,000 32,099 Johnson & Johnson 5.15% 07/15/2018 14,000 15,259 Johnson & Johnson 2.95% 09/01/2020 100,000 103,530 Johnson & Johnson 6.95% 09/01/2029 8,000 11,272 Johnson & Johnson 4.95% 05/15/2033 12,000 13,876 Johnson & Johnson 4.38% 12/05/2033 65,000 71,477
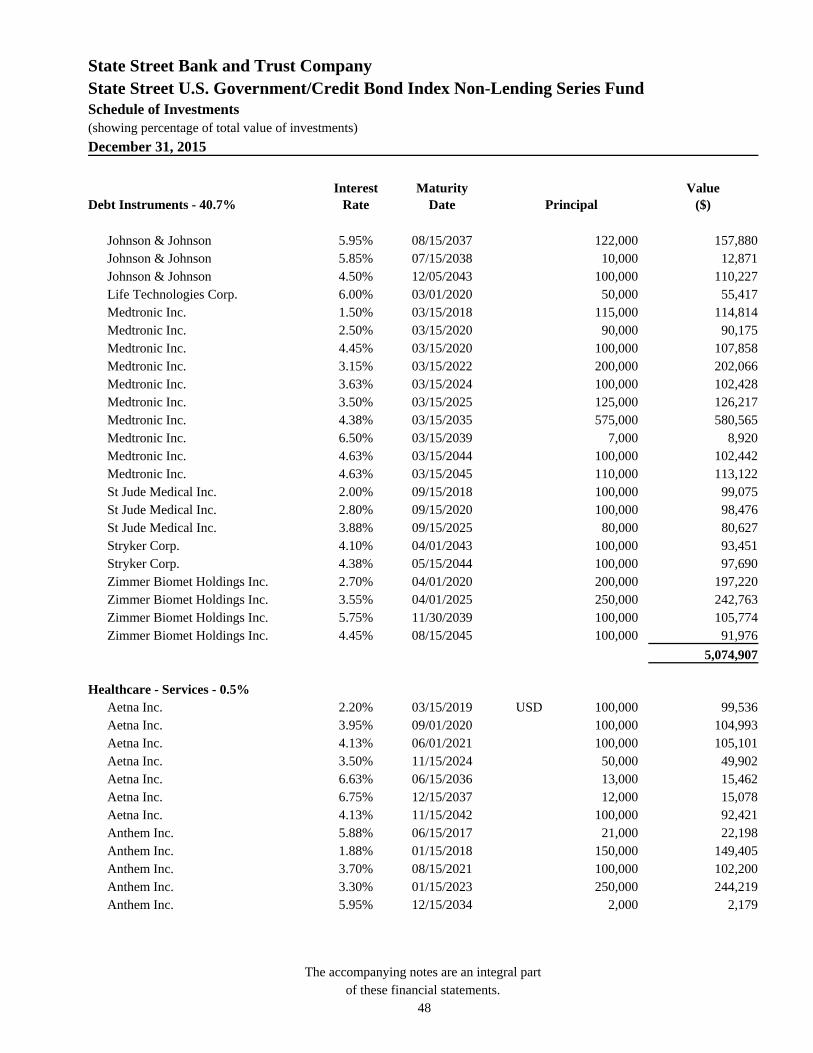
State Street Bank and Trust Company
State Street U.S. Government/Credit Bond Index Non-Lending Series Fund
Schedule of Investments (showing percentage of total value of investments)
December 31, 2015
The accompanying notes are an integral part
of these financial statements. 48
Debt Instruments - 40.7% Interest
Rate Maturity
Date Principal Value
($) Johnson & Johnson 5.95% 08/15/2037 122,000 157,880 Johnson & Johnson 5.85% 07/15/2038 10,000 12,871 Johnson & Johnson 4.50% 12/05/2043 100,000 110,227 Life Technologies Corp. 6.00% 03/01/2020 50,000 55,417 Medtronic Inc. 1.50% 03/15/2018 115,000 114,814 Medtronic Inc. 2.50% 03/15/2020 90,000 90,175 Medtronic Inc. 4.45% 03/15/2020 100,000 107,858 Medtronic Inc. 3.15% 03/15/2022 200,000 202,066 Medtronic Inc. 3.63% 03/15/2024 100,000 102,428 Medtronic Inc. 3.50% 03/15/2025 125,000 126,217 Medtronic Inc. 4.38% 03/15/2035 575,000 580,565 Medtronic Inc. 6.50% 03/15/2039 7,000 8,920 Medtronic Inc. 4.63% 03/15/2044 100,000 102,442 Medtronic Inc. 4.63% 03/15/2045 110,000 113,122 St Jude Medical Inc. 2.00% 09/15/2018 100,000 99,075 St Jude Medical Inc. 2.80% 09/15/2020 100,000 98,476 St Jude Medical Inc. 3.88% 09/15/2025 80,000 80,627 Stryker Corp. 4.10% 04/01/2043 100,000 93,451 Stryker Corp. 4.38% 05/15/2044 100,000 97,690 Zimmer Biomet Holdings Inc. 2.70% 04/01/2020 200,000 197,220 Zimmer Biomet Holdings Inc. 3.55% 04/01/2025 250,000 242,763 Zimmer Biomet Holdings Inc. 5.75% 11/30/2039 100,000 105,774 Zimmer Biomet Holdings Inc. 4.45% 08/15/2045 100,000 91,976
5,074,907
Healthcare - Services - 0.5% Aetna Inc. 2.20% 03/15/2019 USD 100,000 99,536 Aetna Inc. 3.95% 09/01/2020 100,000 104,993 Aetna Inc. 4.13% 06/01/2021 100,000 105,101 Aetna Inc. 3.50% 11/15/2024 50,000 49,902 Aetna Inc. 6.63% 06/15/2036 13,000 15,462 Aetna Inc. 6.75% 12/15/2037 12,000 15,078 Aetna Inc. 4.13% 11/15/2042 100,000 92,421 Anthem Inc. 5.88% 06/15/2017 21,000 22,198 Anthem Inc. 1.88% 01/15/2018 150,000 149,405 Anthem Inc. 3.70% 08/15/2021 100,000 102,200 Anthem Inc. 3.30% 01/15/2023 250,000 244,219 Anthem Inc. 5.95% 12/15/2034 2,000 2,179

State Street Bank and Trust Company
State Street U.S. Government/Credit Bond Index Non-Lending Series Fund
Schedule of Investments (showing percentage of total value of investments)
December 31, 2015
The accompanying notes are an integral part
of these financial statements. 49
Debt Instruments - 40.7% Interest
Rate Maturity
Date Principal Value
($) Anthem Inc. 5.85% 01/15/2036 23,000 24,491 Anthem Inc. 6.38% 06/15/2037 116,000 135,656 Anthem Inc. 4.63% 05/15/2042 150,000 142,432 Baylor Scott & White Holdings 4.19% 11/15/2045 100,000 94,534 Children's Hospital Medical Center 4.27% 05/15/2044 50,000 47,994 Cigna Corp. 5.38% 03/15/2017 10,000 10,420 Cigna Corp. 4.38% 12/15/2020 100,000 105,767 Cigna Corp. 3.25% 04/15/2025 200,000 193,345 Cigna Corp. 7.88% 05/15/2027 3,000 3,926 Cigna Corp. 6.15% 11/15/2036 9,000 10,305 Cigna Corp. 5.88% 03/15/2041 80,000 90,848 Coventry Health Care Inc. 5.95% 03/15/2017 11,000 11,551 Coventry Health Care Inc. 5.45% 06/15/2021 80,000 88,367 Humana Inc. 7.20% 06/15/2018 6,000 6,679 Humana Inc. 6.30% 08/01/2018 5,000 5,476 Humana Inc. 2.63% 10/01/2019 150,000 149,330 Humana Inc. 8.15% 06/15/2038 79,000 108,744
Laboratory Corp. of America Holdings
2.20%
08/23/2017
150,000
150,041
Laboratory Corp. of America Holdings
4.00%
11/01/2023
150,000
151,214
Laboratory Corp. of America Holdings
4.70%
02/01/2045
50,000
45,436
New York and Presbyterian Hospital 4.02% 08/01/2045 50,000 47,141 Quest Diagnostics Inc. 4.70% 04/01/2021 100,000 105,702 Quest Diagnostics Inc. 5.75% 01/30/2040 6,000 6,223 Quest Diagnostics Inc. 4.70% 03/30/2045 200,000 181,694 Texas Health Resources 4.33% 11/15/2055 30,000 28,695 UnitedHealth Group Inc. 1.40% 10/15/2017 150,000 149,388 UnitedHealth Group Inc. 6.00% 02/15/2018 23,000 24,965 UnitedHealth Group Inc. 1.90% 07/16/2018 120,000 120,343 UnitedHealth Group Inc. 2.70% 07/15/2020 60,000 60,639 UnitedHealth Group Inc. 4.70% 02/15/2021 100,000 109,310 UnitedHealth Group Inc. 2.88% 12/15/2021 300,000 298,443 UnitedHealth Group Inc. 2.75% 02/15/2023 107,000 104,449 UnitedHealth Group Inc. 3.75% 07/15/2025 125,000 128,788 UnitedHealth Group Inc. 5.80% 03/15/2036 19,000 22,198 UnitedHealth Group Inc. 6.50% 06/15/2037 13,000 16,304 UnitedHealth Group Inc. 6.63% 11/15/2037 109,000 138,876

State Street Bank and Trust Company
State Street U.S. Government/Credit Bond Index Non-Lending Series Fund
Schedule of Investments (showing percentage of total value of investments)
December 31, 2015
The accompanying notes are an integral part
of these financial statements. 50
Debt Instruments - 40.7% Interest
Rate Maturity
Date Principal Value
($) UnitedHealth Group Inc. 6.88% 02/15/2038 21,000 27,517 UnitedHealth Group Inc. 5.70% 10/15/2040 100,000 116,467 UnitedHealth Group Inc. 3.95% 10/15/2042 100,000 91,921 UnitedHealth Group Inc. 4.75% 07/15/2045 85,000 89,311
4,447,624
Holding Companies-Diversified - 0.0% Leucadia National Corp. 5.50% 10/18/2023 USD 80,000 77,648
Home Furnishings - 0.0% Whirlpool Corp. 2.40% 03/01/2019 USD 150,000 147,518 Whirlpool Corp. 4.00% 03/01/2024 100,000 102,266
249,784
Household Products/Wares - 0.1% Avery Dennison Corp. 3.35% 04/15/2023 USD 50,000 48,498 Church & Dwight Co. Inc. 2.45% 12/15/2019 50,000 49,403 Clorox Co. 5.95% 10/15/2017 57,000 61,058 Clorox Co. 3.50% 12/15/2024 100,000 99,045 Kimberly-Clark Corp. 6.13% 08/01/2017 4,000 4,298 Kimberly-Clark Corp. 6.25% 07/15/2018 9,000 9,993 Kimberly-Clark Corp. 7.50% 11/01/2018 11,000 12,689 Kimberly-Clark Corp. 3.63% 08/01/2020 100,000 105,595 Kimberly-Clark Corp. 2.15% 08/15/2020 50,000 49,584 Kimberly-Clark Corp. 2.40% 06/01/2023 100,000 97,038 Kimberly-Clark Corp. 6.63% 08/01/2037 14,000 18,312 Kimberly-Clark Corp. 5.30% 03/01/2041 100,000 112,784
668,297
Housewares - 0.0% Newell Rubbermaid Inc. 2.05% 12/01/2017 USD 100,000 98,366 Newell Rubbermaid Inc. 4.00% 12/01/2024 50,000 46,179 Tupperware Brands Corp. 4.75% 06/01/2021 50,000 51,032
195,577
Insurance - 1.3% ACE Capital Trust II 9.70% 04/01/2030 USD 5,000 7,250

State Street Bank and Trust Company
State Street U.S. Government/Credit Bond Index Non-Lending Series Fund
Schedule of Investments (showing percentage of total value of investments)
December 31, 2015
The accompanying notes are an integral part
of these financial statements. 51
Debt Instruments - 40.7% Interest
Rate Maturity
Date Principal Value
($) ACE INA Holdings Inc. 5.70% 02/15/2017 15,000 15,727 ACE INA Holdings Inc. 5.90% 06/15/2019 13,000 14,500 ACE INA Holdings Inc. 2.30% 11/03/2020 45,000 44,550 ACE INA Holdings Inc. 3.35% 05/15/2024 200,000 200,784 ACE INA Holdings Inc. 3.15% 03/15/2025 100,000 98,614 ACE INA Holdings Inc. 3.35% 05/03/2026 25,000 24,900 ACE INA Holdings Inc. 6.70% 05/15/2036 7,000 9,106 ACE INA Holdings Inc. 4.35% 11/03/2045 25,000 25,331 AEGON Funding Co. LLC 5.75% 12/15/2020 8,000 9,085 Aflac Inc. 2.65% 02/15/2017 100,000 101,350 Aflac Inc. 2.40% 03/16/2020 100,000 99,797 Aflac Inc. 3.63% 11/15/2024 100,000 101,511 Aflac Inc. 6.45% 08/15/2040 25,000 30,628 Alleghany Corp. 4.95% 06/27/2022 200,000 213,998
Allied World Assurance Co. Holdings Ltd.
5.50%
11/15/2020
100,000
109,021
Allstate Corp. 7.45% 05/16/2019 15,000 17,388 Allstate Corp. 5.35% 06/01/2033 13,000 14,593 Allstate Corp. 5.55% 05/09/2035 13,000 14,989 Allstate Corp. 5.95% 04/01/2036 16,000 19,324 Allstate Corp.1 5.75% 08/15/2053 200,000 204,000 Allstate Corp.1 6.50% 05/15/2067 6,000 6,660 American Financial Group Inc. 9.88% 06/15/2019 8,000 9,719 American International Group Inc. 5.85% 01/16/2018 121,000 130,211 American International Group Inc. 3.38% 08/15/2020 200,000 204,944 American International Group Inc. 6.40% 12/15/2020 100,000 115,047 American International Group Inc. 4.88% 06/01/2022 200,000 215,728 American International Group Inc. 4.13% 02/15/2024 250,000 256,051 American International Group Inc. 6.25% 05/01/2036 169,000 191,783 Aon PLC 2.80% 03/15/2021 100,000 99,518 Aon PLC 4.00% 11/27/2023 100,000 101,480 Aon PLC 4.60% 06/14/2044 100,000 95,863 Arch Capital Group Ltd. 7.35% 05/01/2034 4,000 4,970 Assurant Inc. 4.00% 03/15/2023 200,000 199,672 Assurant Inc. 6.75% 02/15/2034 7,000 8,110 AXA SA 8.60% 12/15/2030 21,000 28,665 Axis Specialty Finance LLC 5.88% 06/01/2020 150,000 165,746 Berkshire Hathaway Finance Corp. 1.30% 05/15/2018 100,000 99,248 Berkshire Hathaway Finance Corp. 5.40% 05/15/2018 153,000 165,939

State Street Bank and Trust Company
State Street U.S. Government/Credit Bond Index Non-Lending Series Fund
Schedule of Investments (showing percentage of total value of investments)
December 31, 2015
The accompanying notes are an integral part
of these financial statements. 52
Debt Instruments - 40.7% Interest
Rate Maturity
Date Principal Value
($) Berkshire Hathaway Finance Corp. 2.00% 08/15/2018 100,000 101,372 Berkshire Hathaway Finance Corp. 4.40% 05/15/2042 100,000 98,612 Berkshire Hathaway Inc. 1.90% 01/31/2017 350,000 352,877 Berkshire Hathaway Inc. 2.10% 08/14/2019 200,000 201,038 Brown & Brown Inc. 4.20% 09/15/2024 50,000 49,367 Chubb Corp. 5.75% 05/15/2018 108,000 117,533 Chubb Corp. 6.00% 05/11/2037 215,000 261,634 Chubb Corp. 6.50% 05/15/2038 13,000 16,772 Chubb Corp.1 6.38% 03/29/2067 21,000 19,950 Cincinnati Financial Corp. 6.92% 05/15/2028 7,000 8,687 Cincinnati Financial Corp. 6.13% 11/01/2034 5,000 5,668 CNA Financial Corp. 7.35% 11/15/2019 15,000 17,308 Endurance Specialty Holdings Ltd. 7.00% 07/15/2034 6,000 6,908
Hartford Financial Services Group Inc.
5.38%
03/15/2017
13,000
13,562
Hartford Financial Services Group Inc.
5.13%
04/15/2022
100,000
109,417
Hartford Financial Services Group Inc.
5.95%
10/15/2036
7,000
8,081
Hartford Financial Services Group Inc.
6.10%
10/01/2041
9,000
10,688
Hartford Financial Services Group Inc.
4.30%
04/15/2043
100,000
93,586
Horace Mann Educators Corp. 4.50% 12/01/2025 50,000 50,094 Infinity Property & Casualty Corp. 5.00% 09/19/2022 150,000 154,949 ING US Inc. 2.90% 02/15/2018 350,000 354,361 Kemper Corp. 6.00% 05/15/2017 13,000 13,550 Kemper Corp. 4.35% 02/15/2025 50,000 49,164 Lincoln National Corp. 8.75% 07/01/2019 7,000 8,405 Lincoln National Corp. 6.25% 02/15/2020 150,000 168,761 Lincoln National Corp. 4.20% 03/15/2022 150,000 156,012 Lincoln National Corp. 6.15% 04/07/2036 7,000 8,027 Lincoln National Corp. 6.30% 10/09/2037 8,000 9,346 Loews Corp. 6.00% 02/01/2035 6,000 6,820 Markel Corp. 3.63% 03/30/2023 200,000 197,472 Marsh & McLennan Companies Inc. 5.88% 08/01/2033 5,000 5,782 Marsh & McLennan Cos Inc. 2.35% 09/10/2019 75,000 74,813 Marsh & McLennan Cos Inc. 2.35% 03/06/2020 200,000 197,789 MetLife Inc. 6.82% 08/15/2018 21,000 23,557

State Street Bank and Trust Company
State Street U.S. Government/Credit Bond Index Non-Lending Series Fund
Schedule of Investments (showing percentage of total value of investments)
December 31, 2015
The accompanying notes are an integral part
of these financial statements. 53
Debt Instruments - 40.7% Interest
Rate Maturity
Date Principal Value
($) MetLife Inc. 7.72% 02/15/2019 122,000 141,914 MetLife Inc. 4.75% 02/08/2021 100,000 109,456 MetLife Inc. 3.05% 12/15/2022 100,000 99,468 MetLife Inc. 3.60% 11/13/2025 50,000 50,423 MetLife Inc. 6.50% 12/15/2032 209,000 257,638 MetLife Inc. 6.38% 06/15/2034 16,000 19,688 MetLife Inc. 5.70% 06/15/2035 14,000 16,083 MetLife Inc. 5.88% 02/06/2041 150,000 176,545 MetLife Inc. 4.88% 11/13/2043 100,000 103,648 MetLife Inc. 4.72% 12/15/2044 200,000 204,065 MetLife Inc. 4.60% 05/13/2046 50,000 50,486 MetLife Inc. 6.40% 12/15/2066 28,000 30,590 Montpelier Re Holdings Ltd. 4.70% 10/15/2022 100,000 100,134 Nationwide Financial Services 6.75% 05/15/2087 6,000 6,180 PartnerRe Finance A LLC 6.88% 06/01/2018 8,000 8,791 PartnerRe Finance B LLC 5.50% 06/01/2020 100,000 109,398 Platinum Underwriters Finance Inc. 7.50% 06/01/2017 2,000 2,130 Principal Financial Group Inc. 8.88% 05/15/2019 114,000 136,129 Principal Financial Group Inc. 3.40% 05/15/2025 100,000 97,441 Principal Financial Group Inc. 6.05% 10/15/2036 9,000 10,378 Progressive Corp. 3.75% 08/23/2021 150,000 157,785 Progressive Corp. 6.63% 03/01/2029 3,000 3,756 Progressive Corp. 6.25% 12/01/2032 11,000 13,424 Progressive Corp. 4.35% 04/25/2044 150,000 150,722 Protective Life Corp. 8.45% 10/15/2039 50,000 65,252 Prudential Financial Inc. 6.00% 12/01/2017 220,000 236,324 Prudential Financial Inc. 7.38% 06/15/2019 15,000 17,368 Prudential Financial Inc. 5.38% 06/21/2020 100,000 110,662 Prudential Financial Inc. 3.50% 05/15/2024 150,000 150,801 Prudential Financial Inc. 5.75% 07/15/2033 9,000 10,132 Prudential Financial Inc. 5.40% 06/13/2035 14,000 15,165 Prudential Financial Inc. 5.90% 03/17/2036 4,000 4,554 Prudential Financial Inc. 5.70% 12/14/2036 14,000 15,772 Prudential Financial Inc. 6.63% 12/01/2037 11,000 13,548 Prudential Financial Inc. 6.63% 06/21/2040 200,000 247,548 Prudential Financial Inc.1 5.88% 09/15/2042 150,000 157,500 Prudential Financial Inc.1 5.63% 06/15/2043 100,000 102,250 Reinsurance Group of America Inc. 5.63% 03/15/2017 2,000 2,084

State Street Bank and Trust Company
State Street U.S. Government/Credit Bond Index Non-Lending Series Fund
Schedule of Investments (showing percentage of total value of investments)
December 31, 2015
The accompanying notes are an integral part
of these financial statements. 54
Debt Instruments - 40.7% Interest
Rate Maturity
Date Principal Value
($) Reinsurance Group of America Inc. 5.00% 06/01/2021 60,000 64,556 Reinsurance Group of America Inc.1, 2 3.18% 12/15/2065 6,000 4,905 StanCorp. Financial Group Inc.1 6.90% 06/01/2067 13,000 10,790 Swiss Re Solutions Holding Corp. 7.00% 02/15/2026 15,000 18,678 Torchmark Corp. 9.25% 06/15/2019 41,000 49,500 Travelers Cos Inc. 5.75% 12/15/2017 5,000 5,390 Travelers Cos Inc. 5.80% 05/15/2018 8,000 8,725 Travelers Cos Inc. 5.90% 06/02/2019 11,000 12,314 Travelers Cos Inc. 6.75% 06/20/2036 6,000 7,870 Travelers Cos Inc. 6.25% 06/15/2037 171,000 214,909 Travelers Property Casualty Corp. 6.38% 03/15/2033 156,000 193,541 Unum Group 4.00% 03/15/2024 150,000 149,208 Willis North America Inc. 6.20% 03/28/2017 12,000 12,512 WR Berkley Corp. 4.63% 03/15/2022 50,000 52,412 WR Berkley Corp. 6.25% 02/15/2037 3,000 3,477 XL Group PLC 6.38% 11/15/2024 5,000 5,820 XL Group PLC 6.25% 05/15/2027 10,000 11,645 XLIT Ltd. 5.25% 12/15/2043 100,000 103,433 XLIT Ltd. 5.50% 03/31/2045 65,000 61,048
10,643,727
Internet - 0.3% Alibaba Group Holding Ltd. 2.50% 11/28/2019 USD 300,000 293,087 Alibaba Group Holding Ltd. 3.60% 11/28/2024 200,000 191,048 Amazon.com Inc. 2.60% 12/05/2019 300,000 303,509 Amazon.com Inc. 2.50% 11/29/2022 200,000 193,728 Amazon.com Inc. 3.80% 12/05/2024 50,000 51,776 Amazon.com Inc. 4.80% 12/05/2034 100,000 105,011 Amazon.com Inc. 4.95% 12/05/2044 100,000 106,341 Baidu Inc. 2.25% 11/28/2017 200,000 200,142 eBay Inc. 2.88% 08/01/2021 250,000 244,862 eBay Inc. 2.60% 07/15/2022 150,000 138,792 eBay Inc. 4.00% 07/15/2042 100,000 77,224 Expedia Inc. 7.46% 08/15/2018 100,000 111,220 Google Inc. 3.63% 05/19/2021 150,000 158,831 Google Inc. 3.38% 02/25/2024 100,000 104,342

State Street Bank and Trust Company
State Street U.S. Government/Credit Bond Index Non-Lending Series Fund
Schedule of Investments (showing percentage of total value of investments)
December 31, 2015
The accompanying notes are an integral part
of these financial statements. 55
Debt Instruments - 40.7% Interest
Rate Maturity
Date Principal Value
($) Symantec Corp. 2.75% 06/15/2017 100,000 100,292
2,380,205
Investment Companies - 0.0% Ares Capital Corp. 3.88% 01/15/2020 USD 60,000 60,824 FS Investment Corp. 4.75% 05/15/2022 100,000 97,126
157,950
Iron/Steel - 0.0% Nucor Corp. 5.75% 12/01/2017 USD 113,000 119,214 Nucor Corp. 5.85% 06/01/2018 9,000 9,599 Nucor Corp. 6.40% 12/01/2037 11,000 11,573 Reliance Steel & Aluminum Co. 4.50% 04/15/2023 100,000 91,930 Reliance Steel & Aluminum Co. 6.85% 11/15/2036 4,000 3,926 Vale SA 5.63% 09/11/2042 100,000 67,375 Worthington Industries Inc. 4.55% 04/15/2026 20,000 19,635
323,252
Leisure - 0.0% Carnival Corp. 3.95% 10/15/2020 USD 67,000 69,512 Harley-Davidson Inc. 3.50% 07/28/2025 50,000 49,896
119,408
Lodging - 0.1% Hyatt Hotels Corp. 3.38% 07/15/2023 USD 200,000 190,355 Marriott International Inc. 3.38% 10/15/2020 125,000 127,505
Starwood Hotels & Resorts Worldwide Inc.
3.13%
02/15/2023
78,000
75,805
Wyndham Worldwide Corp. 4.25% 03/01/2022 100,000 100,126 Wyndham Worldwide Corp. 5.10% 10/01/2025 60,000 60,556
554,347
Machinery - Construction & Mining - 0.2% Caterpillar Financial Services Corp. 1.00% 03/03/2017 USD 250,000 249,036 Caterpillar Financial Services Corp. 5.85% 09/01/2017 15,000 16,031 Caterpillar Financial Services Corp. 5.45% 04/15/2018 17,000 18,367 Caterpillar Financial Services Corp. 1.70% 06/16/2018 50,000 49,887 Caterpillar Financial Services Corp. 7.05% 10/01/2018 113,000 127,884 Caterpillar Financial Services Corp. 7.15% 02/15/2019 30,000 34,377

State Street Bank and Trust Company
State Street U.S. Government/Credit Bond Index Non-Lending Series Fund
Schedule of Investments (showing percentage of total value of investments)
December 31, 2015
The accompanying notes are an integral part
of these financial statements. 56
Debt Instruments - 40.7% Interest
Rate Maturity
Date Principal Value
($) Caterpillar Financial Services Corp. 2.85% 06/01/2022 100,000 99,443 Caterpillar Financial Services Corp. 3.25% 12/01/2024 50,000 49,329 Caterpillar Inc. 3.90% 05/27/2021 100,000 105,838 Caterpillar Inc. 3.40% 05/15/2024 100,000 100,809 Caterpillar Inc. 6.05% 08/15/2036 121,000 142,236 Caterpillar Inc. 5.20% 05/27/2041 50,000 53,916 Caterpillar Inc. 3.80% 08/15/2042 135,000 120,672 Caterpillar Inc. 4.30% 05/15/2044 100,000 96,342 Joy Global Inc. 5.13% 10/15/2021 80,000 64,000
1,328,167
Machinery - Diversified - 0.2% Cummins Inc. 7.13% 03/01/2028 USD 1,000 1,279 Deere & Co. 2.60% 06/08/2022 150,000 147,411 Deere & Co. 8.10% 05/15/2030 11,000 15,526 Deere & Co. 7.13% 03/03/2031 3,000 3,902 Deere & Co. 3.90% 06/09/2042 100,000 95,235 Flowserve Corp. 4.00% 11/15/2023 43,000 42,524 John Deere Capital Corp. 5.50% 04/13/2017 9,000 9,476 John Deere Capital Corp. 2.80% 09/18/2017 100,000 102,324 John Deere Capital Corp. 1.55% 12/15/2017 200,000 199,953 John Deere Capital Corp. 5.35% 04/03/2018 14,000 15,102 John Deere Capital Corp. 5.75% 09/10/2018 13,000 14,269 John Deere Capital Corp. 1.70% 01/15/2020 250,000 243,484 John Deere Capital Corp. 2.05% 03/10/2020 100,000 98,687 John Deere Capital Corp. 2.80% 03/04/2021 100,000 100,572 John Deere Capital Corp. 3.90% 07/12/2021 100,000 105,701 Rockwell Automation Inc. 2.05% 03/01/2020 100,000 98,499 Rockwell Automation Inc. 6.70% 01/15/2028 5,000 6,387 Rockwell Automation Inc. 6.25% 12/01/2037 2,000 2,478 Roper Technologies Inc. 1.85% 11/15/2017 200,000 198,859 Roper Technologies Inc. 3.00% 12/15/2020 50,000 49,884 Roper Technologies Inc. 3.85% 12/15/2025 25,000 25,070
1,576,622
Media - 1.5% 21st Century Fox America Inc. 7.25% 05/18/2018 USD 12,000 13,390 21st Century Fox America Inc. 8.25% 08/10/2018 2,000 2,301

State Street Bank and Trust Company
State Street U.S. Government/Credit Bond Index Non-Lending Series Fund
Schedule of Investments (showing percentage of total value of investments)
December 31, 2015
The accompanying notes are an integral part
of these financial statements. 57
Debt Instruments - 40.7% Interest
Rate Maturity
Date Principal Value
($) 21st Century Fox America Inc. 6.90% 03/01/2019 205,000 232,285 21st Century Fox America Inc. 4.50% 02/15/2021 100,000 107,313 21st Century Fox America Inc. 8.88% 04/26/2023 3,000 3,892 21st Century Fox America Inc. 3.70% 10/15/2025 20,000 19,796 21st Century Fox America Inc. 7.70% 10/30/2025 1,000 1,263 21st Century Fox America Inc. 6.55% 03/15/2033 12,000 14,098 21st Century Fox America Inc. 6.20% 12/15/2034 15,000 17,029 21st Century Fox America Inc. 6.40% 12/15/2035 27,000 31,362 21st Century Fox America Inc. 8.15% 10/17/2036 3,000 4,000 21st Century Fox America Inc. 6.15% 03/01/2037 20,000 22,419 21st Century Fox America Inc. 6.65% 11/15/2037 236,000 274,581 21st Century Fox America Inc. 7.85% 03/01/2039 11,000 14,327 21st Century Fox America Inc. 6.90% 08/15/2039 150,000 177,125 21st Century Fox America Inc. 6.15% 02/15/2041 100,000 112,623 21st Century Fox America Inc. 4.95% 10/15/2045 15,000 14,838 21st Century Fox America Inc. 7.75% 12/01/2045 7,000 9,122 CBS Corp. 4.63% 05/15/2018 13,000 13,671 CBS Corp. 5.75% 04/15/2020 100,000 110,431 CBS Corp. 3.38% 03/01/2022 250,000 248,331 CBS Corp. 7.88% 07/30/2030 29,000 36,599 CBS Corp. 5.50% 05/15/2033 4,000 3,925 CBS Corp. 5.90% 10/15/2040 100,000 102,337 CCO Safari II LLC 3.58% 07/23/2020 55,000 54,721 CCO Safari II LLC 4.46% 07/23/2022 100,000 99,761 CCO Safari II LLC 4.91% 07/23/2025 100,000 99,487 CCO Safari II LLC 6.38% 10/23/2035 50,000 50,293 CCO Safari II LLC 6.48% 10/23/2045 45,000 45,195 CCO Safari II LLC 6.83% 10/23/2055 35,000 34,496
Comcast Cable Communications Holdings Inc.
9.46%
11/15/2022
18,000
24,767
Comcast Corp. 6.50% 01/15/2017 267,000 281,330 Comcast Corp. 6.30% 11/15/2017 129,000 140,056 Comcast Corp. 5.88% 02/15/2018 17,000 18,482 Comcast Corp. 5.70% 05/15/2018 23,000 25,116 Comcast Corp. 5.70% 07/01/2019 14,000 15,667 Comcast Corp. 5.15% 03/01/2020 150,000 166,885 Comcast Corp. 3.13% 07/15/2022 300,000 305,145 Comcast Corp. 3.60% 03/01/2024 200,000 207,223 Comcast Corp. 7.05% 03/15/2033 12,000 15,484

State Street Bank and Trust Company
State Street U.S. Government/Credit Bond Index Non-Lending Series Fund
Schedule of Investments (showing percentage of total value of investments)
December 31, 2015
The accompanying notes are an integral part
of these financial statements. 58
Debt Instruments - 40.7% Interest
Rate Maturity
Date Principal Value
($) Comcast Corp. 4.20% 08/15/2034 83,000 81,731 Comcast Corp. 5.65% 06/15/2035 12,000 13,861 Comcast Corp. 6.50% 11/15/2035 21,000 26,318 Comcast Corp. 6.45% 03/15/2037 286,000 354,914 Comcast Corp. 6.95% 08/15/2037 111,000 145,211 Comcast Corp. 6.40% 05/15/2038 19,000 23,562 Comcast Corp. 6.55% 07/01/2039 25,000 31,621 Comcast Corp. 6.40% 03/01/2040 250,000 311,819 Comcast Corp. 4.65% 07/15/2042 24,000 24,516 DIRECTV Holdings LLC 1.75% 01/15/2018 30,000 29,866 DIRECTV Holdings LLC 5.20% 03/15/2020 150,000 162,629 DIRECTV Holdings LLC 5.00% 03/01/2021 200,000 216,015 DIRECTV Holdings LLC 4.45% 04/01/2024 250,000 256,330 DIRECTV Holdings LLC 6.00% 08/15/2040 100,000 102,323 DIRECTV Holdings LLC 5.15% 03/15/2042 350,000 328,002 Discovery Communications LLC 5.63% 08/15/2019 150,000 162,606 Discovery Communications LLC 3.25% 04/01/2023 200,000 183,788 Discovery Communications LLC 6.35% 06/01/2040 100,000 97,930 Grupo Televisa SA 6.63% 03/18/2025 5,000 5,682 Grupo Televisa SA 8.50% 03/11/2032 7,000 8,425 Grupo Televisa SA 6.63% 01/15/2040 25,000 26,094 Grupo Televisa SAB 6.00% 05/15/2018 9,000 9,690 Grupo Televisa SAB 5.00% 05/13/2045 200,000 170,577 Historic TW Inc. 6.88% 06/15/2018 15,000 16,658 Historic TW Inc. 9.15% 02/01/2023 8,000 10,447 Historic TW Inc. 6.63% 05/15/2029 15,000 17,636 McGraw-Hill Cos Inc. 5.90% 11/15/2017 17,000 18,056 McGraw-Hill Cos Inc. 6.55% 11/15/2037 5,000 5,718 NBCUniversal Media LLC 5.15% 04/30/2020 185,000 206,200 NBCUniversal Media LLC 4.38% 04/01/2021 250,000 270,354 NBCUniversal Media LLC 6.40% 04/30/2040 50,000 61,821 NBCUniversal Media LLC 5.95% 04/01/2041 100,000 119,694 NBCUniversal Media LLC 4.45% 01/15/2043 100,000 98,758 RELX Capital Inc. 8.63% 01/15/2019 100,000 116,694 Scripps Networks Interactive Inc. 3.50% 06/15/2022 100,000 96,153 Scripps Networks Interactive Inc. 3.90% 11/15/2024 100,000 95,465 TCI Communications Inc. 7.88% 02/15/2026 9,000 12,170 TCI Communications Inc. 7.13% 02/15/2028 3,000 3,912

State Street Bank and Trust Company
State Street U.S. Government/Credit Bond Index Non-Lending Series Fund
Schedule of Investments (showing percentage of total value of investments)
December 31, 2015
The accompanying notes are an integral part
of these financial statements. 59
Debt Instruments - 40.7% Interest
Rate Maturity
Date Principal Value
($) Thomson Reuters Corp. 6.50% 07/15/2018 121,000 133,543 Thomson Reuters Corp. 4.70% 10/15/2019 25,000 26,741 Thomson Reuters Corp. 3.85% 09/29/2024 200,000 196,990 Thomson Reuters Corp. 5.50% 08/15/2035 4,000 4,062 Thomson Reuters Corp. 5.65% 11/23/2043 71,000 70,797 Time Warner Cable Inc. 5.85% 05/01/2017 171,000 178,616 Time Warner Cable Inc. 6.75% 07/01/2018 271,000 295,819 Time Warner Cable Inc. 8.75% 02/14/2019 37,000 42,809 Time Warner Cable Inc. 8.25% 04/01/2019 155,000 178,188 Time Warner Cable Inc. 5.00% 02/01/2020 60,000 63,394 Time Warner Cable Inc. 6.55% 05/01/2037 30,000 30,272 Time Warner Cable Inc. 7.30% 07/01/2038 27,000 29,100 Time Warner Cable Inc. 6.75% 06/15/2039 129,000 132,221 Time Warner Cable Inc. 5.50% 09/01/2041 50,000 45,291 Time Warner Cable Inc. 4.50% 09/15/2042 200,000 160,070 Time Warner Cos Inc. 7.25% 10/15/2017 13,000 14,209 Time Warner Cos Inc. 7.57% 02/01/2024 7,000 8,546 Time Warner Cos Inc. 6.95% 01/15/2028 7,000 8,438 Time Warner Entertainment Co. LP 8.38% 03/15/2023 121,000 148,103 Time Warner Entertainment Co. LP 8.38% 07/15/2033 171,000 201,859 Time Warner Inc. 4.88% 03/15/2020 100,000 107,966 Time Warner Inc. 4.70% 01/15/2021 100,000 107,407 Time Warner Inc. 4.75% 03/29/2021 100,000 107,422 Time Warner Inc. 4.00% 01/15/2022 100,000 103,827 Time Warner Inc. 3.40% 06/15/2022 100,000 99,966 Time Warner Inc. 3.55% 06/01/2024 100,000 98,171 Time Warner Inc. 3.88% 01/15/2026 50,000 49,418 Time Warner Inc. 7.63% 04/15/2031 49,000 61,005 Time Warner Inc. 7.70% 05/01/2032 225,000 283,504 Time Warner Inc. 6.50% 11/15/2036 100,000 115,173 Time Warner Inc. 6.25% 03/29/2041 150,000 166,557 Time Warner Inc. 4.90% 06/15/2042 125,000 119,812 Time Warner Inc. 4.65% 06/01/2044 200,000 184,871 Viacom Inc. 6.13% 10/05/2017 108,000 114,926 Viacom Inc. 2.50% 09/01/2018 80,000 79,744 Viacom Inc. 3.25% 03/15/2023 150,000 137,470 Viacom Inc. 3.88% 04/01/2024 200,000 185,882 Viacom Inc. 4.85% 12/15/2034 70,000 57,382

State Street Bank and Trust Company
State Street U.S. Government/Credit Bond Index Non-Lending Series Fund
Schedule of Investments (showing percentage of total value of investments)
December 31, 2015
The accompanying notes are an integral part
of these financial statements. 60
Debt Instruments - 40.7% Interest
Rate Maturity
Date Principal Value
($) Viacom Inc. 4.38% 03/15/2043 199,000 142,971 Viacom Inc. 5.25% 04/01/2044 100,000 81,710 Walt Disney Co. 1.13% 02/15/2017 200,000 200,095 Walt Disney Co. 6.00% 07/17/2017 1,000 1,073 Walt Disney Co. 1.10% 12/01/2017 250,000 248,905 Walt Disney Co. 5.88% 12/15/2017 12,000 13,037 Walt Disney Co. 5.50% 03/15/2019 1,000 1,113 Walt Disney Co. 2.75% 08/16/2021 100,000 101,563 Walt Disney Co. 7.00% 03/01/2032 158,000 218,175
12,252,625
Metal Fabrication/Hardware - 0.0% Precision Castparts Corp. 1.25% 01/15/2018 USD 100,000 99,153 Precision Castparts Corp. 2.50% 01/15/2023 100,000 96,073 Timken Co. 3.88% 09/01/2024 70,000 66,060
261,286
Mining - 0.6% Barrick Gold Corp. 6.95% 04/01/2019 USD 10,000 10,202 Barrick Gold Corp. 4.10% 05/01/2023 32,000 27,279 Barrick North America Finance LLC 6.80% 09/15/2018 10,000 10,240 Barrick North America Finance LLC 4.40% 05/30/2021 50,000 44,846 Barrick North America Finance LLC 7.50% 09/15/2038 7,000 5,585 Barrick North America Finance LLC 5.70% 05/30/2041 100,000 65,676 Barrick PD Australia Finance Pty Ltd. 4.95% 01/15/2020 75,000 71,563 Barrick PD Australia Finance Pty Ltd. 5.95% 10/15/2039 200,000 135,931 BHP Billiton Finance USA Ltd. 1.63% 02/24/2017 200,000 199,643 BHP Billiton Finance USA Ltd. 5.40% 03/29/2017 17,000 17,732 BHP Billiton Finance USA Ltd. 6.50% 04/01/2019 240,000 265,809 BHP Billiton Finance USA Ltd. 3.25% 11/21/2021 100,000 94,583 BHP Billiton Finance USA Ltd. 6.42% 03/01/2026 4,000 4,366 BHP Billiton Finance USA Ltd. 4.13% 02/24/2042 100,000 80,219 BHP Billiton Finance USA Ltd. 5.00% 09/30/2043 250,000 226,697 Freeport-McMoRan Inc. 2.38% 03/15/2018 200,000 156,000 Freeport-McMoRan Inc. 3.55% 03/01/2022 500,000 290,000 Freeport-McMoRan Inc. 5.45% 03/15/2043 300,000 156,000 Glencore Canada Corp. 5.50% 06/15/2017 4,000 3,900 Goldcorp Inc. 2.13% 03/15/2018 250,000 242,117

State Street Bank and Trust Company
State Street U.S. Government/Credit Bond Index Non-Lending Series Fund
Schedule of Investments (showing percentage of total value of investments)
December 31, 2015
The accompanying notes are an integral part
of these financial statements. 61
Debt Instruments - 40.7% Interest
Rate Maturity
Date Principal Value
($) Goldcorp Inc. 3.63% 06/09/2021 150,000 139,598 Newmont Mining Corp. 5.13% 10/01/2019 5,000 5,203 Newmont Mining Corp. 3.50% 03/15/2022 150,000 133,846 Newmont Mining Corp. 5.88% 04/01/2035 13,000 10,128 Newmont Mining Corp. 6.25% 10/01/2039 100,000 79,556 Placer Dome Inc. 6.45% 10/15/2035 5,000 3,823 Rio Tinto Alcan Inc. 7.25% 03/15/2031 7,000 7,812 Rio Tinto Alcan Inc. 6.13% 12/15/2033 109,000 109,646 Rio Tinto Alcan Inc. 5.75% 06/01/2035 7,000 6,746 Rio Tinto Finance USA Ltd. 6.50% 07/15/2018 261,000 281,015 Rio Tinto Finance USA Ltd. 9.00% 05/01/2019 28,000 32,563 Rio Tinto Finance USA Ltd. 3.50% 11/02/2020 100,000 98,030 Rio Tinto Finance USA Ltd. 4.13% 05/20/2021 150,000 150,170 Rio Tinto Finance USA Ltd. 3.75% 09/20/2021 100,000 97,230 Rio Tinto Finance USA Ltd. 7.13% 07/15/2028 18,000 21,115 Rio Tinto Finance USA Ltd. 5.20% 11/02/2040 150,000 136,028 Rio Tinto Finance USA PLC 1.63% 08/21/2017 250,000 245,394 Rio Tinto Finance USA PLC 3.50% 03/22/2022 100,000 93,966 Southern Copper Corp. 3.88% 04/23/2025 90,000 81,122 Southern Copper Corp. 7.50% 07/27/2035 17,000 15,740 Southern Copper Corp. 6.75% 04/16/2040 100,000 84,170 Southern Copper Corp. 5.88% 04/23/2045 278,000 214,826 Vale Canada Ltd. 7.20% 09/15/2032 7,000 5,093 Vale Overseas Ltd. 6.25% 01/23/2017 181,000 179,416 Vale Overseas Ltd. 4.63% 09/15/2020 150,000 124,875 Vale Overseas Ltd. 4.38% 01/11/2022 250,000 189,375 Vale Overseas Ltd. 8.25% 01/17/2034 11,000 8,841 Vale Overseas Ltd. 6.88% 11/21/2036 105,000 73,763 Vale Overseas Ltd. 6.88% 11/10/2039 150,000 104,625 Xstrata Canada Corp. 6.20% 06/15/2035 6,000 4,710 Yamana Gold Inc. 4.95% 07/15/2024 50,000 42,132
4,888,945
Miscellaneous Manufacturing - 0.4% 3M Co. 6.38% 02/15/2028 USD 6,000 7,827 3M Co. 5.70% 03/15/2037 66,000 80,966 Acuity Brands Lighting Inc. 6.00% 12/15/2019 25,000 27,001 Crane Co. 4.45% 12/15/2023 50,000 51,395
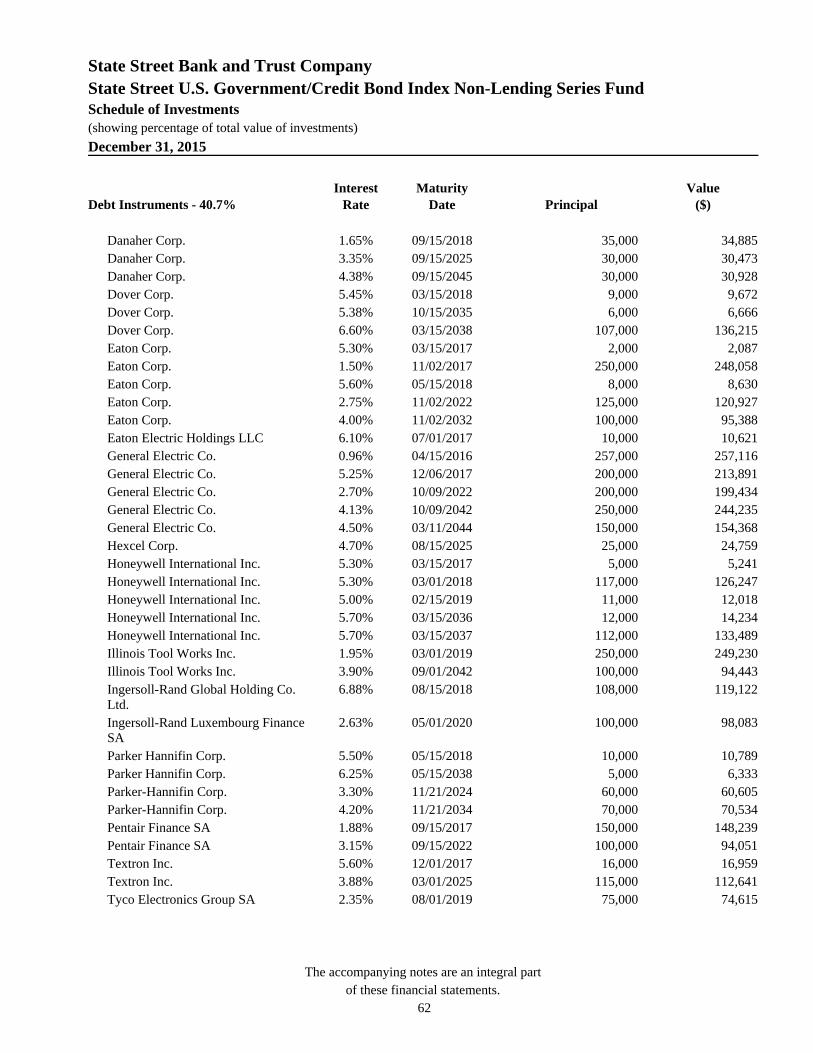
State Street Bank and Trust Company
State Street U.S. Government/Credit Bond Index Non-Lending Series Fund
Schedule of Investments (showing percentage of total value of investments)
December 31, 2015
The accompanying notes are an integral part
of these financial statements. 62
Debt Instruments - 40.7% Interest
Rate Maturity
Date Principal Value
($) Danaher Corp. 1.65% 09/15/2018 35,000 34,885 Danaher Corp. 3.35% 09/15/2025 30,000 30,473 Danaher Corp. 4.38% 09/15/2045 30,000 30,928 Dover Corp. 5.45% 03/15/2018 9,000 9,672 Dover Corp. 5.38% 10/15/2035 6,000 6,666 Dover Corp. 6.60% 03/15/2038 107,000 136,215 Eaton Corp. 5.30% 03/15/2017 2,000 2,087 Eaton Corp. 1.50% 11/02/2017 250,000 248,058 Eaton Corp. 5.60% 05/15/2018 8,000 8,630 Eaton Corp. 2.75% 11/02/2022 125,000 120,927 Eaton Corp. 4.00% 11/02/2032 100,000 95,388 Eaton Electric Holdings LLC 6.10% 07/01/2017 10,000 10,621 General Electric Co. 0.96% 04/15/2016 257,000 257,116 General Electric Co. 5.25% 12/06/2017 200,000 213,891 General Electric Co. 2.70% 10/09/2022 200,000 199,434 General Electric Co. 4.13% 10/09/2042 250,000 244,235 General Electric Co. 4.50% 03/11/2044 150,000 154,368 Hexcel Corp. 4.70% 08/15/2025 25,000 24,759 Honeywell International Inc. 5.30% 03/15/2017 5,000 5,241 Honeywell International Inc. 5.30% 03/01/2018 117,000 126,247 Honeywell International Inc. 5.00% 02/15/2019 11,000 12,018 Honeywell International Inc. 5.70% 03/15/2036 12,000 14,234 Honeywell International Inc. 5.70% 03/15/2037 112,000 133,489 Illinois Tool Works Inc. 1.95% 03/01/2019 250,000 249,230 Illinois Tool Works Inc. 3.90% 09/01/2042 100,000 94,443
Ingersoll-Rand Global Holding Co. Ltd.
6.88%
08/15/2018
108,000
119,122
Ingersoll-Rand Luxembourg Finance SA
2.63%
05/01/2020
100,000
98,083
Parker Hannifin Corp. 5.50% 05/15/2018 10,000 10,789 Parker Hannifin Corp. 6.25% 05/15/2038 5,000 6,333 Parker-Hannifin Corp. 3.30% 11/21/2024 60,000 60,605 Parker-Hannifin Corp. 4.20% 11/21/2034 70,000 70,534 Pentair Finance SA 1.88% 09/15/2017 150,000 148,239 Pentair Finance SA 3.15% 09/15/2022 100,000 94,051 Textron Inc. 5.60% 12/01/2017 16,000 16,959 Textron Inc. 3.88% 03/01/2025 115,000 112,641 Tyco Electronics Group SA 2.35% 08/01/2019 75,000 74,615

State Street Bank and Trust Company
State Street U.S. Government/Credit Bond Index Non-Lending Series Fund
Schedule of Investments (showing percentage of total value of investments)
December 31, 2015
The accompanying notes are an integral part
of these financial statements. 63
Debt Instruments - 40.7% Interest
Rate Maturity
Date Principal Value
($) Tyco Electronics Group SA 4.88% 01/15/2021 100,000 106,774
3,549,189
Multi-National - 2.3% African Development Bank 1.13% 03/15/2017 USD 150,000 150,020 African Development Bank 0.88% 05/15/2017 55,000 54,822 African Development Bank 0.88% 03/15/2018 150,000 148,676 African Development Bank 1.38% 02/12/2020 300,000 295,247 Asian Development Bank 1.13% 03/15/2017 250,000 250,030 Asian Development Bank 0.75% 07/28/2017 350,000 348,003 Asian Development Bank 5.59% 07/16/2018 23,000 25,302 Asian Development Bank 1.75% 09/11/2018 150,000 151,357 Asian Development Bank 1.88% 10/23/2018 100,000 101,216 Asian Development Bank 1.75% 03/21/2019 250,000 251,561 Asian Development Bank 1.88% 04/12/2019 150,000 151,356 Asian Development Bank 1.38% 03/23/2020 250,000 245,833 Asian Development Bank 2.00% 01/22/2025 250,000 241,637 Asian Development Bank 6.22% 08/15/2027 2,000 2,645 Asian Development Bank 5.82% 06/16/2028 214,000 271,093 Corp. Andina de Fomento 4.38% 06/15/2022 100,000 106,569 Corporacion Andina de Fomento 5.75% 01/12/2017 13,000 13,565 Corporacion Andina de Fomento 8.13% 06/04/2019 121,000 142,100 Council of Europe Development Bank 1.50% 02/22/2017 100,000 100,463 Council of Europe Development Bank 1.13% 05/31/2018 500,000 497,061
European Bank for Reconstruction & Development
1.00%
02/16/2017
100,000
99,855
European Bank for Reconstruction & Development
0.75%
09/01/2017
250,000
248,450
European Bank for Reconstruction & Development
1.63%
04/10/2018
200,000
201,332
European Bank for Reconstruction & Development
1.75%
06/14/2019
200,000
200,735
European Bank for Reconstruction & Development
1.50%
03/16/2020
100,000
98,724
European Bank for Reconstruction & Development
1.88%
02/23/2022
200,000
197,233
European Investment Bank 4.88% 01/17/2017 68,000 70,658 European Investment Bank 1.75% 03/15/2017 250,000 251,878 European Investment Bank 0.88% 04/18/2017 550,000 548,152

State Street Bank and Trust Company
State Street U.S. Government/Credit Bond Index Non-Lending Series Fund
Schedule of Investments (showing percentage of total value of investments)
December 31, 2015
The accompanying notes are an integral part
of these financial statements. 64
Debt Instruments - 40.7% Interest
Rate Maturity
Date Principal Value
($) European Investment Bank 5.13% 05/30/2017 59,000 62,230 European Investment Bank 1.63% 06/15/2017 150,000 150,979 European Investment Bank 1.13% 09/15/2017 150,000 149,737 European Investment Bank 1.00% 12/15/2017 200,000 198,949 European Investment Bank 1.00% 03/15/2018 575,000 570,608 European Investment Bank 1.25% 05/15/2018 750,000 747,488 European Investment Bank 1.00% 06/15/2018 500,000 495,159 European Investment Bank 1.13% 08/15/2018 250,000 247,961 European Investment Bank 1.75% 06/17/2019 500,000 501,257 European Investment Bank 1.38% 06/15/2020 750,000 732,291 European Investment Bank 2.88% 09/15/2020 250,000 260,233 European Investment Bank 2.50% 04/15/2021 200,000 204,201 European Investment Bank 2.13% 10/15/2021 250,000 249,629 European Investment Bank 3.25% 01/29/2024 250,000 266,081 European Investment Bank 1.88% 02/10/2025 300,000 285,801 European Investment Bank 4.88% 02/15/2036 19,000 23,540 FMS Wertmanagement AoeR 1.00% 11/21/2017 200,000 199,077 FMS Wertmanagement AoeR 1.63% 11/20/2018 200,000 200,674 FMS Wertmanagement AoeR 1.75% 03/17/2020 250,000 249,271 Inter-American Development Bank 1.13% 03/15/2017 100,000 100,048 Inter-American Development Bank 1.00% 07/14/2017 250,000 249,587 Inter-American Development Bank 2.38% 08/15/2017 250,000 254,987 Inter-American Development Bank 1.25% 01/16/2018 400,000 400,138 Inter-American Development Bank 0.88% 03/15/2018 150,000 148,676 Inter-American Development Bank 4.25% 09/10/2018 173,000 185,795 Inter-American Development Bank 3.88% 09/17/2019 250,000 269,358 Inter-American Development Bank 1.75% 10/15/2019 300,000 300,425 Inter-American Development Bank 3.88% 02/14/2020 150,000 162,280 Inter-American Development Bank 2.13% 11/09/2020 150,000 151,363 Inter-American Development Bank 1.75% 04/14/2022 350,000 341,889 Inter-American Development Bank 3.00% 02/21/2024 150,000 157,411 Inter-American Development Bank 7.00% 06/15/2025 3,000 4,017 Inter-American Development Bank 3.20% 08/07/2042 100,000 96,990
International Bank for Reconstruction & Development
0.88%
04/17/2017
400,000
398,613
International Bank for Reconstruction & Development
9.25%
07/15/2017
8,000
8,931
International Bank for Reconstruction & Development
1.38%
04/10/2018
150,000
150,303
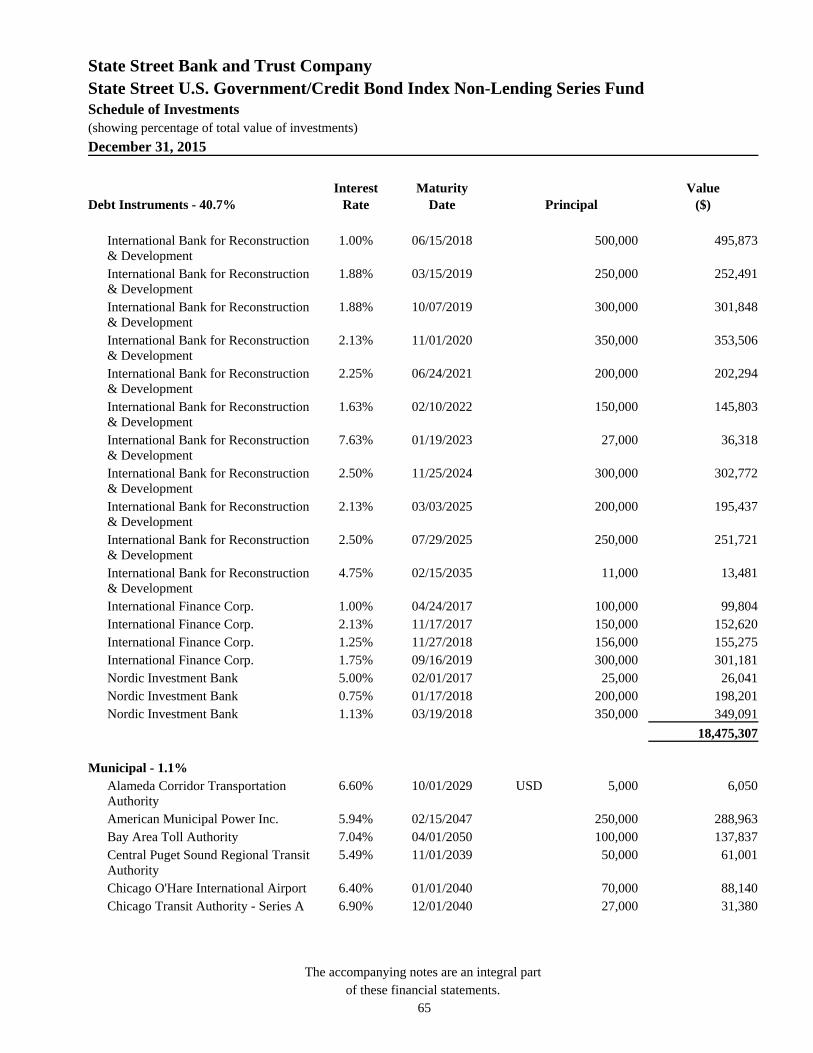
State Street Bank and Trust Company
State Street U.S. Government/Credit Bond Index Non-Lending Series Fund
Schedule of Investments (showing percentage of total value of investments)
December 31, 2015
The accompanying notes are an integral part
of these financial statements. 65
Debt Instruments - 40.7% Interest
Rate Maturity
Date Principal Value
($)
International Bank for Reconstruction & Development
1.00%
06/15/2018
500,000
495,873
International Bank for Reconstruction & Development
1.88%
03/15/2019
250,000
252,491
International Bank for Reconstruction & Development
1.88%
10/07/2019
300,000
301,848
International Bank for Reconstruction & Development
2.13%
11/01/2020
350,000
353,506
International Bank for Reconstruction & Development
2.25%
06/24/2021
200,000
202,294
International Bank for Reconstruction & Development
1.63%
02/10/2022
150,000
145,803
International Bank for Reconstruction & Development
7.63%
01/19/2023
27,000
36,318
International Bank for Reconstruction & Development
2.50%
11/25/2024
300,000
302,772
International Bank for Reconstruction & Development
2.13%
03/03/2025
200,000
195,437
International Bank for Reconstruction & Development
2.50%
07/29/2025
250,000
251,721
International Bank for Reconstruction & Development
4.75%
02/15/2035
11,000
13,481
International Finance Corp. 1.00% 04/24/2017 100,000 99,804 International Finance Corp. 2.13% 11/17/2017 150,000 152,620 International Finance Corp. 1.25% 11/27/2018 156,000 155,275 International Finance Corp. 1.75% 09/16/2019 300,000 301,181 Nordic Investment Bank 5.00% 02/01/2017 25,000 26,041 Nordic Investment Bank 0.75% 01/17/2018 200,000 198,201 Nordic Investment Bank 1.13% 03/19/2018 350,000 349,091
18,475,307
Municipal - 1.1%
Alameda Corridor Transportation Authority
6.60%
10/01/2029
USD
5,000
6,050
American Municipal Power Inc. 5.94% 02/15/2047 250,000 288,963 Bay Area Toll Authority 7.04% 04/01/2050 100,000 137,837
Central Puget Sound Regional Transit Authority
5.49%
11/01/2039
50,000
61,001
Chicago O'Hare International Airport 6.40% 01/01/2040 70,000 88,140 Chicago Transit Authority - Series A 6.90% 12/01/2040 27,000 31,380
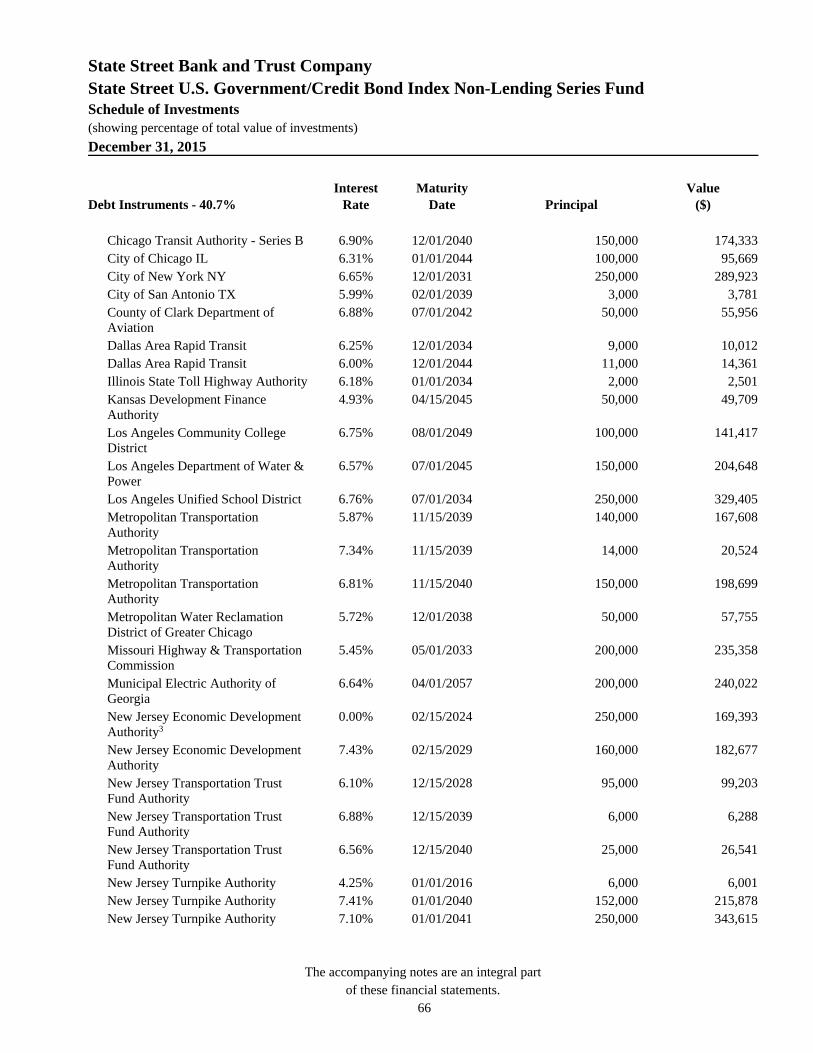
State Street Bank and Trust Company
State Street U.S. Government/Credit Bond Index Non-Lending Series Fund
Schedule of Investments (showing percentage of total value of investments)
December 31, 2015
The accompanying notes are an integral part
of these financial statements. 66
Debt Instruments - 40.7% Interest
Rate Maturity
Date Principal Value
($) Chicago Transit Authority - Series B 6.90% 12/01/2040 150,000 174,333 City of Chicago IL 6.31% 01/01/2044 100,000 95,669 City of New York NY 6.65% 12/01/2031 250,000 289,923 City of San Antonio TX 5.99% 02/01/2039 3,000 3,781
County of Clark Department of Aviation
6.88%
07/01/2042
50,000
55,956
Dallas Area Rapid Transit 6.25% 12/01/2034 9,000 10,012 Dallas Area Rapid Transit 6.00% 12/01/2044 11,000 14,361 Illinois State Toll Highway Authority 6.18% 01/01/2034 2,000 2,501
Kansas Development Finance Authority
4.93%
04/15/2045
50,000
49,709
Los Angeles Community College District
6.75%
08/01/2049
100,000
141,417
Los Angeles Department of Water & Power
6.57%
07/01/2045
150,000
204,648
Los Angeles Unified School District 6.76% 07/01/2034 250,000 329,405
Metropolitan Transportation Authority
5.87%
11/15/2039
140,000
167,608
Metropolitan Transportation Authority
7.34%
11/15/2039
14,000
20,524
Metropolitan Transportation Authority
6.81%
11/15/2040
150,000
198,699
Metropolitan Water Reclamation District of Greater Chicago
5.72%
12/01/2038
50,000
57,755
Missouri Highway & Transportation Commission
5.45%
05/01/2033
200,000
235,358
Municipal Electric Authority of Georgia
6.64%
04/01/2057
200,000
240,022
New Jersey Economic Development Authority3
0.00%
02/15/2024
250,000
169,393
New Jersey Economic Development Authority
7.43%
02/15/2029
160,000
182,677
New Jersey Transportation Trust Fund Authority
6.10%
12/15/2028
95,000
99,203
New Jersey Transportation Trust Fund Authority
6.88%
12/15/2039
6,000
6,288
New Jersey Transportation Trust Fund Authority
6.56%
12/15/2040
25,000
26,541
New Jersey Turnpike Authority 4.25% 01/01/2016 6,000 6,001 New Jersey Turnpike Authority 7.41% 01/01/2040 152,000 215,878 New Jersey Turnpike Authority 7.10% 01/01/2041 250,000 343,615

State Street Bank and Trust Company
State Street U.S. Government/Credit Bond Index Non-Lending Series Fund
Schedule of Investments (showing percentage of total value of investments)
December 31, 2015
The accompanying notes are an integral part
of these financial statements. 67
Debt Instruments - 40.7% Interest
Rate Maturity
Date Principal Value
($)
New York City Transitional Finance Authority
5.51%
08/01/2037
100,000
122,047
New York City Water & Sewer System
5.88%
06/15/2044
250,000
324,630
New York State Dormitory Authority 5.63% 03/15/2039 150,000 180,542 North Carolina Turnpike Authority 6.70% 01/01/2039 4,000 4,416 North Texas Tollway Authority 8.91% 02/01/2030 125,000 148,608 North Texas Tollway Authority 6.72% 01/01/2049 15,000 20,665 Oregon School Boards Association 5.53% 06/30/2028 3,000 3,484 Oregon School Boards Association 5.55% 06/30/2028 2,000 2,306 Oregon School Boards Association 5.68% 06/30/2028 10,000 11,903
Port Authority of New York & New Jersey
6.04%
12/01/2029
259,000
313,698
Port Authority of New York & New Jersey
4.46%
10/01/2062
100,000
96,107
Port of Seattle WA 7.00% 05/01/2036 7,000 7,892
Rutgers-State University of New Jersey
5.67%
05/01/2040
80,000
92,935
San Diego County Regional Transportation Commission
5.91%
04/01/2048
100,000
126,200
San Diego County Water Authority Financing Corp.
6.14%
05/01/2049
150,000
195,533
San Francisco City & County Public Utilities Commission
6.00%
11/01/2040
100,000
121,725
State Board of Administration Finance Corp.
3.00%
07/01/2020
100,000
101,352
State of California 6.20% 10/01/2019 100,000 114,686 State of California 7.70% 11/01/2030 250,000 303,850 State of California 7.50% 04/01/2034 42,000 58,606 State of California 7.55% 04/01/2039 314,000 456,088 State of California 7.30% 10/01/2039 250,000 349,898 State of California 7.60% 11/01/2040 150,000 222,638 State of Connecticut 5.85% 03/15/2032 22,000 25,932 State of Illinois 5.67% 03/01/2018 350,000 370,598 State of Illinois 4.35% 06/01/2018 11,000 11,245 State of Illinois 4.95% 06/01/2023 24,000 24,054 State of Illinois 5.10% 06/01/2033 595,000 562,662 State of Oregon 5.76% 06/01/2023 12,000 13,771 State of Oregon 5.89% 06/01/2027 13,000 15,562 State of Texas 5.52% 04/01/2039 90,000 112,553

State Street Bank and Trust Company
State Street U.S. Government/Credit Bond Index Non-Lending Series Fund
Schedule of Investments (showing percentage of total value of investments)
December 31, 2015
The accompanying notes are an integral part
of these financial statements. 68
Debt Instruments - 40.7% Interest
Rate Maturity
Date Principal Value
($) State of Utah 4.55% 07/01/2024 30,000 33,721 State of Wisconsin 5.70% 05/01/2026 6,000 6,954
Texas Transportation Commission State Highway Fund
5.18%
04/01/2030
100,000
117,717
University of California 5.77% 05/15/2043 250,000 306,335 University of California 4.86% 05/15/2112 100,000 95,037 University of Texas System 6.28% 08/15/2041 9,000 10,031 Utah Transit Authority 5.94% 06/15/2039 2,000 2,508
Virginia Commonwealth Transportation Board
5.35%
05/15/2035
100,000
113,956
9,157,093
Office/Business Equipment - 0.1% Pitney Bowes Inc. 5.75% 09/15/2017 USD 2,000 2,107 Pitney Bowes Inc. 5.60% 03/15/2018 100,000 105,780 Pitney Bowes Inc. 4.75% 05/15/2018 6,000 6,256 Pitney Bowes Inc. 4.63% 03/15/2024 100,000 98,182 Xerox Corp. 6.75% 02/01/2017 21,000 21,940 Xerox Corp. 2.95% 03/15/2017 50,000 50,305 Xerox Corp. 6.35% 05/15/2018 123,000 131,126 Xerox Corp. 2.80% 05/15/2020 100,000 95,032 Xerox Corp. 4.50% 05/15/2021 150,000 150,700
661,428
Oil & Gas - 2.6% Anadarko Petroleum Corp. 6.38% 09/15/2017 USD 150,000 157,881 Anadarko Petroleum Corp. 6.95% 06/15/2019 6,000 6,535 Anadarko Petroleum Corp. 7.50% 05/01/2031 19,000 20,593 Anadarko Petroleum Corp. 6.45% 09/15/2036 109,000 103,967 Anadarko Petroleum Corp. 7.95% 06/15/2039 154,000 162,114 Apache Corp. 6.90% 09/15/2018 8,000 8,766 Apache Corp. 6.00% 01/15/2037 23,000 21,766 Apache Corp. 5.10% 09/01/2040 150,000 128,938 Apache Corp. 4.75% 04/15/2043 100,000 86,057 Apache Corp. 4.25% 01/15/2044 150,000 121,160 Apache Finance Canada Corp. 7.75% 12/15/2029 3,000 3,727 BP Capital Markets PLC 1.38% 11/06/2017 200,000 198,526 BP Capital Markets PLC 4.75% 03/10/2019 21,000 22,473 BP Capital Markets PLC 2.24% 05/10/2019 100,000 99,155

State Street Bank and Trust Company
State Street U.S. Government/Credit Bond Index Non-Lending Series Fund
Schedule of Investments (showing percentage of total value of investments)
December 31, 2015
The accompanying notes are an integral part
of these financial statements. 69
Debt Instruments - 40.7% Interest
Rate Maturity
Date Principal Value
($) BP Capital Markets PLC 2.52% 01/15/2020 250,000 248,766 BP Capital Markets PLC 2.32% 02/13/2020 100,000 98,506 BP Capital Markets PLC 4.50% 10/01/2020 100,000 106,817 BP Capital Markets PLC 4.74% 03/11/2021 200,000 216,629 BP Capital Markets PLC 3.25% 05/06/2022 200,000 197,387 BP Capital Markets PLC 2.50% 11/06/2022 100,000 93,516 BP Capital Markets PLC 3.81% 02/10/2024 150,000 149,357 BP Capital Markets PLC 3.51% 03/17/2025 100,000 96,778 British Transco Finance Inc. 6.63% 06/01/2018 10,000 11,030 Burlington Resources Finance Co. 7.20% 08/15/2031 10,000 11,571 Burlington Resources Finance Co. 7.40% 12/01/2031 5,000 5,957 Canadian Natural Resources Ltd. 5.70% 05/15/2017 130,000 134,622 Canadian Natural Resources Ltd. 1.75% 01/15/2018 88,000 85,037 Canadian Natural Resources Ltd. 5.90% 02/01/2018 54,000 56,443 Canadian Natural Resources Ltd. 3.80% 04/15/2024 43,000 37,984 Canadian Natural Resources Ltd. 7.20% 01/15/2032 5,000 5,086 Canadian Natural Resources Ltd. 6.45% 06/30/2033 6,000 5,658 Canadian Natural Resources Ltd. 5.85% 02/01/2035 5,000 4,486 Canadian Natural Resources Ltd. 6.50% 02/15/2037 56,000 52,812 Canadian Natural Resources Ltd. 6.25% 03/15/2038 32,000 29,582 Canadian Natural Resources Ltd. 6.75% 02/01/2039 6,000 5,750 Cenovus Energy Inc. 5.70% 10/15/2019 150,000 156,990 Cenovus Energy Inc. 6.75% 11/15/2039 100,000 94,676 Chevron Corp. 1.34% 11/09/2017 50,000 49,783 Chevron Corp. 1.37% 03/02/2018 100,000 99,026 Chevron Corp. 1.72% 06/24/2018 300,000 298,146 Chevron Corp. 1.79% 11/16/2018 50,000 49,632 Chevron Corp. 4.95% 03/03/2019 135,000 146,093 Chevron Corp. 2.19% 11/15/2019 70,000 69,465 Chevron Corp. 1.96% 03/03/2020 100,000 98,068 Chevron Corp. 2.42% 11/17/2020 50,000 49,586 Chevron Corp. 2.41% 03/03/2022 100,000 96,778 Chevron Corp. 2.36% 12/05/2022 150,000 143,300 Chevron Corp. 3.19% 06/24/2023 250,000 251,055 Chevron Corp. 3.33% 11/17/2025 50,000 50,001 CNOOC Finance 2013 Ltd. 3.00% 05/09/2023 200,000 188,265 CNOOC Finance 2013 Ltd. 4.25% 05/09/2043 200,000 182,765 CNOOC Finance 2015 USA LLC 3.50% 05/05/2025 200,000 190,670

State Street Bank and Trust Company
State Street U.S. Government/Credit Bond Index Non-Lending Series Fund
Schedule of Investments (showing percentage of total value of investments)
December 31, 2015
The accompanying notes are an integral part
of these financial statements. 70
Debt Instruments - 40.7% Interest
Rate Maturity
Date Principal Value
($) CNOOC Nexen Finance 2014 ULC 4.25% 04/30/2024 250,000 253,041 Conoco Funding Co. 7.25% 10/15/2031 10,000 11,576 ConocoPhillips Canada Funding Co. 5.95% 10/15/2036 11,000 11,304 ConocoPhillips Co. 1.05% 12/15/2017 200,000 195,500 ConocoPhillips Co. 5.20% 05/15/2018 13,000 13,811 ConocoPhillips Co. 6.65% 07/15/2018 10,000 10,982 ConocoPhillips Co. 5.75% 02/01/2019 144,000 156,015 ConocoPhillips Co. 6.00% 01/15/2020 24,000 26,431 ConocoPhillips Co. 2.40% 12/15/2022 100,000 89,656 ConocoPhillips Co. 5.90% 10/15/2032 159,000 161,187 ConocoPhillips Co. 4.15% 11/15/2034 150,000 127,655 ConocoPhillips Co. 5.90% 05/15/2038 8,000 7,834 ConocoPhillips Co. 6.50% 02/01/2039 229,000 244,085 ConocoPhillips Co. 4.30% 11/15/2044 50,000 41,240 ConocoPhillips Holding Co. 6.95% 04/15/2029 233,000 263,925 Continental Resources Inc. 4.50% 04/15/2023 200,000 142,000 Continental Resources Inc. 3.80% 06/01/2024 270,000 189,000 Continental Resources Inc. 4.90% 06/01/2044 50,000 29,250 Devon Energy Corp. 3.25% 05/15/2022 150,000 130,398 Devon Energy Corp. 5.85% 12/15/2025 50,000 48,982 Devon Energy Corp. 7.95% 04/15/2032 119,000 123,738 Devon Energy Corp. 5.60% 07/15/2041 200,000 156,679 Devon Energy Corp. 5.00% 06/15/2045 35,000 26,247 Devon Financing Corp. ULC 7.88% 09/30/2031 23,000 23,850 Diamond Offshore Drilling Inc. 5.88% 05/01/2019 12,000 12,120 Ecopetrol SA 7.63% 07/23/2019 150,000 162,000 Ecopetrol SA 5.88% 09/18/2023 150,000 137,250 Ecopetrol SA 5.88% 05/28/2045 200,000 142,750 Encana Corp. 6.50% 05/15/2019 109,000 105,730 Encana Corp. 8.13% 09/15/2030 3,000 3,025 Encana Corp. 7.20% 11/01/2031 4,000 3,492 Encana Corp. 7.38% 11/01/2031 12,000 10,720 Encana Corp. 6.50% 08/15/2034 15,000 12,075 Encana Corp. 6.63% 08/15/2037 106,000 85,409 Encana Corp. 6.50% 02/01/2038 18,000 14,258 Eni Lasmo PLC 7.30% 11/15/2027 4,000 4,688 Ensco PLC 4.70% 03/15/2021 100,000 81,500 Ensco PLC 5.20% 03/15/2025 100,000 70,500

State Street Bank and Trust Company
State Street U.S. Government/Credit Bond Index Non-Lending Series Fund
Schedule of Investments (showing percentage of total value of investments)
December 31, 2015
The accompanying notes are an integral part
of these financial statements. 71
Debt Instruments - 40.7% Interest
Rate Maturity
Date Principal Value
($) Ensco PLC 5.75% 10/01/2044 95,000 61,275 EOG Resources Inc. 6.88% 10/01/2018 6,000 6,672 EOG Resources Inc. 5.63% 06/01/2019 30,000 32,589 EOG Resources Inc. 4.10% 02/01/2021 200,000 207,422 EOG Resources Inc. 3.15% 04/01/2025 100,000 93,658 EOG Resources Inc. 3.90% 04/01/2035 100,000 87,964 EQT Corp. 8.13% 06/01/2019 19,000 20,319 EQT Corp. 4.88% 11/15/2021 100,000 95,682 Exxon Mobil Corp. 0.92% 03/15/2017 150,000 149,711 Exxon Mobil Corp. 1.31% 03/06/2018 100,000 99,701 Exxon Mobil Corp. 1.91% 03/06/2020 100,000 99,050 Exxon Mobil Corp. 2.40% 03/06/2022 100,000 97,803 Exxon Mobil Corp. 3.18% 03/15/2024 100,000 101,765 Exxon Mobil Corp. 2.71% 03/06/2025 100,000 97,476 Exxon Mobil Corp. 3.57% 03/06/2045 45,000 41,881 Hess Corp. 1.30% 06/15/2017 67,000 65,453 Hess Corp. 8.13% 02/15/2019 28,000 31,531 Hess Corp. 7.88% 10/01/2029 113,000 121,355 Hess Corp. 7.30% 08/15/2031 16,000 15,895 Hess Corp. 7.13% 03/15/2033 11,000 10,634 Hess Corp. 6.00% 01/15/2040 25,000 22,323 Hess Corp. 5.60% 02/15/2041 100,000 82,828 Husky Energy Inc. 6.15% 06/15/2019 19,000 20,401 Husky Energy Inc. 7.25% 12/15/2019 16,000 17,669 Husky Energy Inc. 4.00% 04/15/2024 75,000 67,236 Husky Energy Inc. 6.80% 09/15/2037 11,000 10,912 Kerr-McGee Corp. 6.95% 07/01/2024 96,000 98,312 Kerr-McGee Corp. 7.88% 09/15/2031 7,000 7,425 Marathon Oil Corp. 6.00% 10/01/2017 24,000 24,564 Marathon Oil Corp. 5.90% 03/15/2018 46,000 46,635 Marathon Oil Corp. 2.80% 11/01/2022 250,000 201,090 Marathon Oil Corp. 6.80% 03/15/2032 11,000 9,613 Marathon Oil Corp. 6.60% 10/01/2037 17,000 14,228 Marathon Petroleum Corp. 2.70% 12/14/2018 50,000 49,545 Marathon Petroleum Corp. 3.40% 12/15/2020 50,000 49,213 Marathon Petroleum Corp. 6.50% 03/01/2041 100,000 100,972 Marathon Petroleum Corp. 4.75% 09/15/2044 250,000 206,847 Marathon Petroleum Corp. 5.85% 12/15/2045 50,000 47,825

State Street Bank and Trust Company
State Street U.S. Government/Credit Bond Index Non-Lending Series Fund
Schedule of Investments (showing percentage of total value of investments)
December 31, 2015
The accompanying notes are an integral part
of these financial statements. 72
Debt Instruments - 40.7% Interest
Rate Maturity
Date Principal Value
($) Murphy Oil Corp. 2.50% 12/01/2017 150,000 134,157 Murphy Oil Corp. 3.70% 12/01/2022 150,000 113,073 Murphy Oil Corp. 7.05% 05/01/2029 4,000 3,623 Nabors Industries Ltd. 6.15% 02/15/2018 23,000 23,230 Nabors Industries Ltd. 5.00% 09/15/2020 100,000 89,500 Nexen Energy ULC 6.20% 07/30/2019 21,000 22,490 Nexen Inc. 7.88% 03/15/2032 10,000 13,034 Nexen Inc. 5.88% 03/10/2035 112,000 120,816 Nexen Inc. 6.40% 05/15/2037 28,000 31,638 Nexen Inc. 7.50% 07/30/2039 11,000 14,342 Noble Energy Inc. 8.25% 03/01/2019 29,000 31,460 Noble Energy Inc. 4.15% 12/15/2021 100,000 95,663 Noble Energy Inc. 3.90% 11/15/2024 150,000 133,071 Noble Energy Inc. 8.00% 04/01/2027 2,000 2,292 Noble Energy Inc. 6.00% 03/01/2041 35,000 30,806 Noble Energy Inc. 5.05% 11/15/2044 150,000 119,036 Noble Holding International Ltd. 4.90% 08/01/2020 100,000 75,500 Noble Holding International Ltd. 5.25% 03/15/2042 100,000 59,000 Occidental Petroleum Corp. 1.75% 02/15/2017 150,000 150,361 Occidental Petroleum Corp. 4.10% 02/01/2021 100,000 104,914 Occidental Petroleum Corp. 3.13% 02/15/2022 150,000 146,713 Petro-Canada 6.05% 05/15/2018 8,000 8,569 Petro-Canada 7.88% 06/15/2026 5,000 6,148 Petro-Canada 5.35% 07/15/2033 8,000 8,118 Petro-Canada 5.95% 05/15/2035 10,000 10,507 Petro-Canada 6.80% 05/15/2038 131,000 150,533 Petroleos Mexicanos 5.75% 03/01/2018 61,000 63,546 Petroleos Mexicanos 8.00% 05/03/2019 280,000 309,397 Petroleos Mexicanos 5.50% 01/21/2021 250,000 253,061 Petroleos Mexicanos 4.88% 01/24/2022 150,000 144,649 Petroleos Mexicanos 3.50% 01/30/2023 200,000 173,742 Petroleos Mexicanos 4.88% 01/18/2024 250,000 233,220 Petroleos Mexicanos 4.50% 01/23/2026 500,000 440,287 Petroleos Mexicanos 6.63% 06/15/2035 186,000 167,545 Petroleos Mexicanos 6.63% 06/15/2038 8,000 7,047 Petroleos Mexicanos 6.50% 06/02/2041 250,000 217,722 Petroleos Mexicanos 5.50% 06/27/2044 100,000 75,947 Petroleos Mexicanos 5.50% 06/27/2044 400,000 303,040
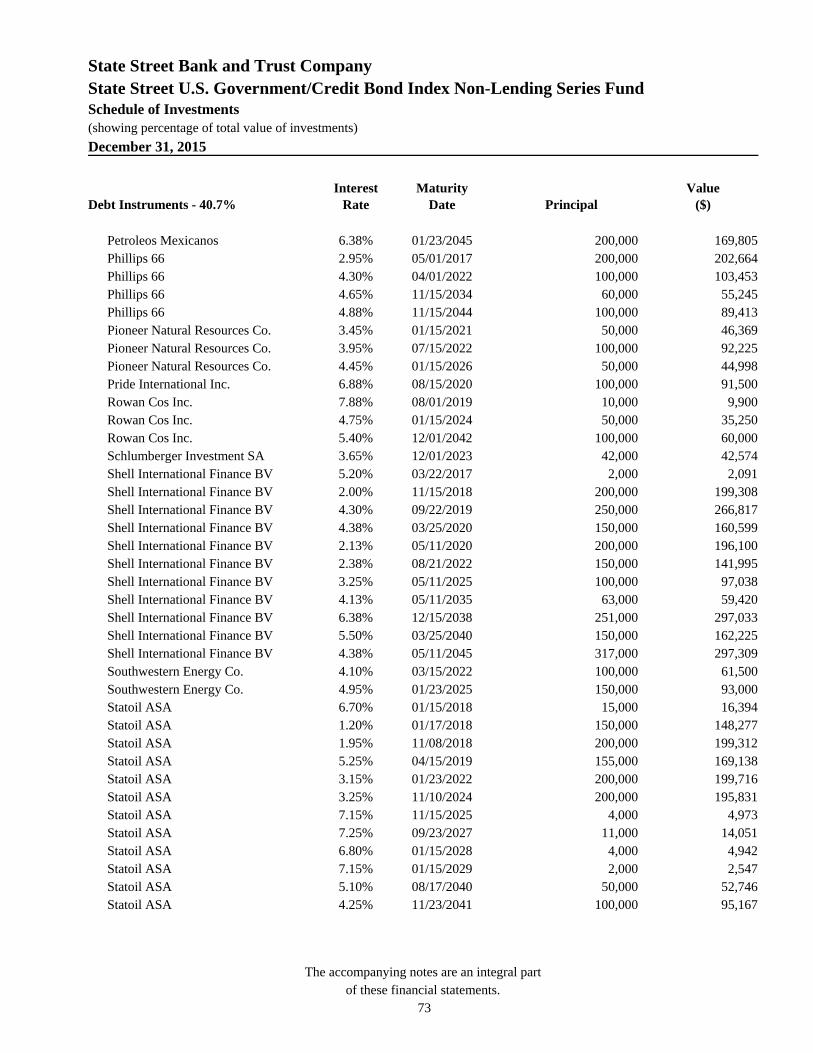
State Street Bank and Trust Company
State Street U.S. Government/Credit Bond Index Non-Lending Series Fund
Schedule of Investments (showing percentage of total value of investments)
December 31, 2015
The accompanying notes are an integral part
of these financial statements. 73
Debt Instruments - 40.7% Interest
Rate Maturity
Date Principal Value
($) Petroleos Mexicanos 6.38% 01/23/2045 200,000 169,805 Phillips 66 2.95% 05/01/2017 200,000 202,664 Phillips 66 4.30% 04/01/2022 100,000 103,453 Phillips 66 4.65% 11/15/2034 60,000 55,245 Phillips 66 4.88% 11/15/2044 100,000 89,413 Pioneer Natural Resources Co. 3.45% 01/15/2021 50,000 46,369 Pioneer Natural Resources Co. 3.95% 07/15/2022 100,000 92,225 Pioneer Natural Resources Co. 4.45% 01/15/2026 50,000 44,998 Pride International Inc. 6.88% 08/15/2020 100,000 91,500 Rowan Cos Inc. 7.88% 08/01/2019 10,000 9,900 Rowan Cos Inc. 4.75% 01/15/2024 50,000 35,250 Rowan Cos Inc. 5.40% 12/01/2042 100,000 60,000 Schlumberger Investment SA 3.65% 12/01/2023 42,000 42,574 Shell International Finance BV 5.20% 03/22/2017 2,000 2,091 Shell International Finance BV 2.00% 11/15/2018 200,000 199,308 Shell International Finance BV 4.30% 09/22/2019 250,000 266,817 Shell International Finance BV 4.38% 03/25/2020 150,000 160,599 Shell International Finance BV 2.13% 05/11/2020 200,000 196,100 Shell International Finance BV 2.38% 08/21/2022 150,000 141,995 Shell International Finance BV 3.25% 05/11/2025 100,000 97,038 Shell International Finance BV 4.13% 05/11/2035 63,000 59,420 Shell International Finance BV 6.38% 12/15/2038 251,000 297,033 Shell International Finance BV 5.50% 03/25/2040 150,000 162,225 Shell International Finance BV 4.38% 05/11/2045 317,000 297,309 Southwestern Energy Co. 4.10% 03/15/2022 100,000 61,500 Southwestern Energy Co. 4.95% 01/23/2025 150,000 93,000 Statoil ASA 6.70% 01/15/2018 15,000 16,394 Statoil ASA 1.20% 01/17/2018 150,000 148,277 Statoil ASA 1.95% 11/08/2018 200,000 199,312 Statoil ASA 5.25% 04/15/2019 155,000 169,138 Statoil ASA 3.15% 01/23/2022 200,000 199,716 Statoil ASA 3.25% 11/10/2024 200,000 195,831 Statoil ASA 7.15% 11/15/2025 4,000 4,973 Statoil ASA 7.25% 09/23/2027 11,000 14,051 Statoil ASA 6.80% 01/15/2028 4,000 4,942 Statoil ASA 7.15% 01/15/2029 2,000 2,547 Statoil ASA 5.10% 08/17/2040 50,000 52,746 Statoil ASA 4.25% 11/23/2041 100,000 95,167
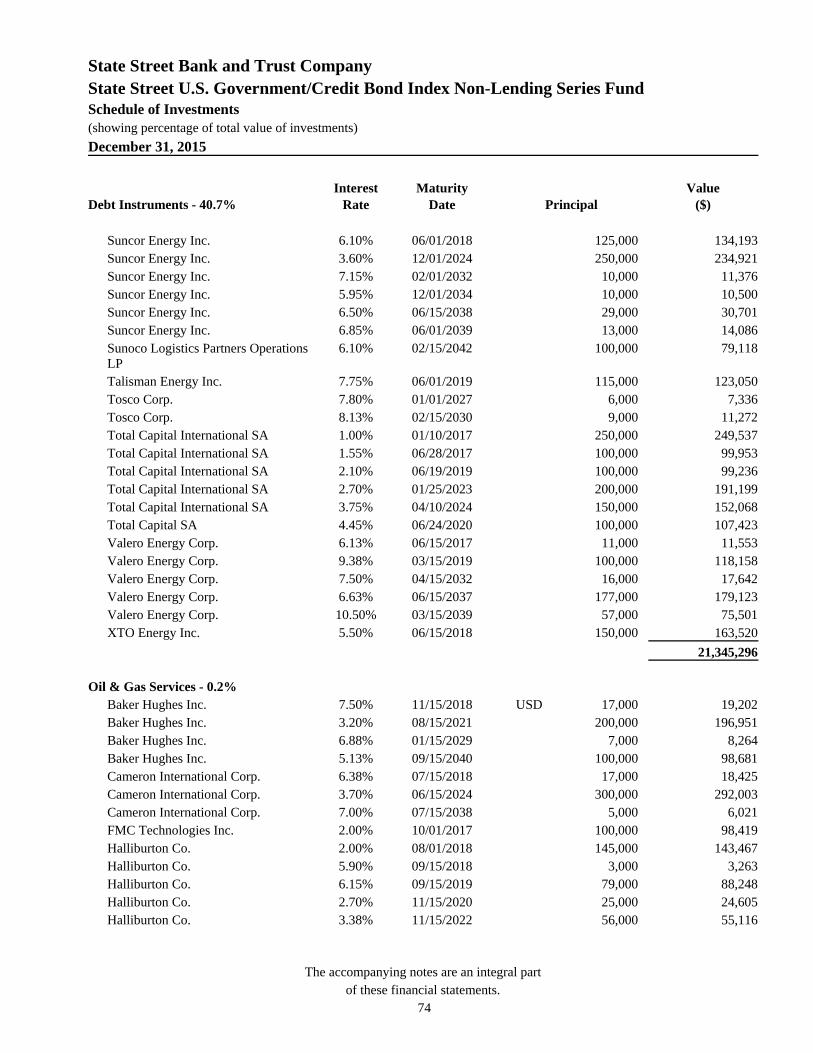
State Street Bank and Trust Company
State Street U.S. Government/Credit Bond Index Non-Lending Series Fund
Schedule of Investments (showing percentage of total value of investments)
December 31, 2015
The accompanying notes are an integral part
of these financial statements. 74
Debt Instruments - 40.7% Interest
Rate Maturity
Date Principal Value
($) Suncor Energy Inc. 6.10% 06/01/2018 125,000 134,193 Suncor Energy Inc. 3.60% 12/01/2024 250,000 234,921 Suncor Energy Inc. 7.15% 02/01/2032 10,000 11,376 Suncor Energy Inc. 5.95% 12/01/2034 10,000 10,500 Suncor Energy Inc. 6.50% 06/15/2038 29,000 30,701 Suncor Energy Inc. 6.85% 06/01/2039 13,000 14,086
Sunoco Logistics Partners Operations LP
6.10%
02/15/2042
100,000
79,118
Talisman Energy Inc. 7.75% 06/01/2019 115,000 123,050 Tosco Corp. 7.80% 01/01/2027 6,000 7,336 Tosco Corp. 8.13% 02/15/2030 9,000 11,272 Total Capital International SA 1.00% 01/10/2017 250,000 249,537 Total Capital International SA 1.55% 06/28/2017 100,000 99,953 Total Capital International SA 2.10% 06/19/2019 100,000 99,236 Total Capital International SA 2.70% 01/25/2023 200,000 191,199 Total Capital International SA 3.75% 04/10/2024 150,000 152,068 Total Capital SA 4.45% 06/24/2020 100,000 107,423 Valero Energy Corp. 6.13% 06/15/2017 11,000 11,553 Valero Energy Corp. 9.38% 03/15/2019 100,000 118,158 Valero Energy Corp. 7.50% 04/15/2032 16,000 17,642 Valero Energy Corp. 6.63% 06/15/2037 177,000 179,123 Valero Energy Corp. 10.50% 03/15/2039 57,000 75,501 XTO Energy Inc. 5.50% 06/15/2018 150,000 163,520
21,345,296
Oil & Gas Services - 0.2% Baker Hughes Inc. 7.50% 11/15/2018 USD 17,000 19,202 Baker Hughes Inc. 3.20% 08/15/2021 200,000 196,951 Baker Hughes Inc. 6.88% 01/15/2029 7,000 8,264 Baker Hughes Inc. 5.13% 09/15/2040 100,000 98,681 Cameron International Corp. 6.38% 07/15/2018 17,000 18,425 Cameron International Corp. 3.70% 06/15/2024 300,000 292,003 Cameron International Corp. 7.00% 07/15/2038 5,000 6,021 FMC Technologies Inc. 2.00% 10/01/2017 100,000 98,419 Halliburton Co. 2.00% 08/01/2018 145,000 143,467 Halliburton Co. 5.90% 09/15/2018 3,000 3,263 Halliburton Co. 6.15% 09/15/2019 79,000 88,248 Halliburton Co. 2.70% 11/15/2020 25,000 24,605 Halliburton Co. 3.38% 11/15/2022 56,000 55,116

State Street Bank and Trust Company
State Street U.S. Government/Credit Bond Index Non-Lending Series Fund
Schedule of Investments (showing percentage of total value of investments)
December 31, 2015
The accompanying notes are an integral part
of these financial statements. 75
Debt Instruments - 40.7% Interest
Rate Maturity
Date Principal Value
($) Halliburton Co. 3.80% 11/15/2025 45,000 43,998 Halliburton Co. 4.85% 11/15/2035 50,000 49,121 Halliburton Co. 6.70% 09/15/2038 15,000 17,062 Halliburton Co. 7.45% 09/15/2039 68,000 83,156 Halliburton Co. 4.50% 11/15/2041 150,000 138,354 Halliburton Co. 5.00% 11/15/2045 42,000 41,230 National Oilwell Varco Inc. 1.35% 12/01/2017 150,000 146,565 National Oilwell Varco Inc. 2.60% 12/01/2022 150,000 131,777 National Oilwell Varco Inc. 3.95% 12/01/2042 45,000 34,125 Oceaneering International Inc. 4.65% 11/15/2024 50,000 42,845 Western Atlas Inc. 6.00% 06/01/2018 11,000 11,877
1,792,775
Packaging & Containers - 0.0% Bemis Co. Inc. 6.80% 08/01/2019 USD 8,000 9,002 Packaging Corp. of America 3.90% 06/15/2022 50,000 50,702 Packaging Corp. of America 3.65% 09/15/2024 100,000 97,260 Sonoco Products Co. 4.38% 11/01/2021 150,000 155,828
312,792
Pharmaceuticals - 1.8% Abbott Laboratories 5.13% 04/01/2019 USD 57,000 62,293 Abbott Laboratories 4.13% 05/27/2020 50,000 53,367 Abbott Laboratories 2.95% 03/15/2025 200,000 197,203 Abbott Laboratories 6.15% 11/30/2037 110,000 134,767 AbbVie Inc. 1.75% 11/06/2017 250,000 249,536 AbbVie Inc. 1.80% 05/14/2018 130,000 129,268 AbbVie Inc. 2.00% 11/06/2018 150,000 149,280 AbbVie Inc. 2.50% 05/14/2020 200,000 197,379 AbbVie Inc. 2.90% 11/06/2022 150,000 145,488 AbbVie Inc. 3.20% 11/06/2022 440,000 434,492 AbbVie Inc. 3.60% 05/14/2025 100,000 98,621 AbbVie Inc. 4.50% 05/14/2035 80,000 78,075 AbbVie Inc. 4.40% 11/06/2042 200,000 187,413 AbbVie Inc. 4.70% 05/14/2045 215,000 210,956 Actavis Funding SCS 2.35% 03/12/2018 650,000 650,760 Actavis Funding SCS 2.45% 06/15/2019 85,000 84,025 Actavis Funding SCS 3.80% 03/15/2025 500,000 497,838

State Street Bank and Trust Company
State Street U.S. Government/Credit Bond Index Non-Lending Series Fund
Schedule of Investments (showing percentage of total value of investments)
December 31, 2015
The accompanying notes are an integral part
of these financial statements. 76
Debt Instruments - 40.7% Interest
Rate Maturity
Date Principal Value
($) Actavis Funding SCS 4.55% 03/15/2035 200,000 195,230 Actavis Funding SCS 4.85% 06/15/2044 100,000 98,931 Actavis Funding SCS 4.75% 03/15/2045 200,000 196,266 Actavis PLC 6.13% 08/15/2019 100,000 111,007 Allergan Inc. 1.35% 03/15/2018 50,000 48,958 AmerisourceBergen Corp. 3.50% 11/15/2021 100,000 100,760 AmerisourceBergen Corp. 3.40% 05/15/2024 100,000 97,673 AstraZeneca PLC 5.90% 09/15/2017 185,000 198,450 AstraZeneca PLC 1.75% 11/16/2018 50,000 49,785 AstraZeneca PLC 1.95% 09/18/2019 150,000 147,978 AstraZeneca PLC 2.38% 11/16/2020 100,000 98,972 AstraZeneca PLC 3.38% 11/16/2025 100,000 99,162 AstraZeneca PLC 6.45% 09/15/2037 154,000 195,318 AstraZeneca PLC 4.38% 11/16/2045 25,000 24,813 Baxalta Inc. 2.00% 06/22/2018 15,000 14,841 Baxalta Inc. 2.88% 06/23/2020 50,000 49,429 Baxalta Inc. 3.60% 06/23/2022 50,000 49,982 Baxalta Inc. 4.00% 06/23/2025 50,000 49,511 Baxalta Inc. 5.25% 06/23/2045 15,000 15,022 Bristol-Myers Squibb Co. 1.75% 03/01/2019 150,000 149,079 Bristol-Myers Squibb Co. 7.15% 06/15/2023 3,000 3,816 Bristol-Myers Squibb Co. 5.88% 11/15/2036 5,000 6,125 Bristol-Myers Squibb Co. 3.25% 08/01/2042 150,000 130,130 Bristol-Myers Squibb Co. 6.88% 08/01/2097 3,000 4,089 Cardinal Health Inc. 1.70% 03/15/2018 57,000 56,481 Cardinal Health Inc. 4.63% 12/15/2020 50,000 53,476 Cardinal Health Inc. 3.20% 03/15/2023 150,000 147,379 Cardinal Health Inc. 3.75% 09/15/2025 50,000 50,694 Cardinal Health Inc. 4.90% 09/15/2045 50,000 51,254 Eli Lilly & Co. 5.20% 03/15/2017 65,000 68,076 Eli Lilly & Co. 1.95% 03/15/2019 100,000 100,307 Eli Lilly & Co. 2.75% 06/01/2025 110,000 108,865 Eli Lilly & Co. 5.50% 03/15/2027 15,000 18,108 Eli Lilly & Co. 5.55% 03/15/2037 112,000 133,962 Express Scripts Holding Co. 2.25% 06/15/2019 100,000 99,011 Express Scripts Holding Co. 3.50% 06/15/2024 200,000 196,749 Express Scripts Holding Co. 6.13% 11/15/2041 200,000 225,517 Express Scripts Inc. 7.25% 06/15/2019 5,000 5,710

State Street Bank and Trust Company
State Street U.S. Government/Credit Bond Index Non-Lending Series Fund
Schedule of Investments (showing percentage of total value of investments)
December 31, 2015
The accompanying notes are an integral part
of these financial statements. 77
Debt Instruments - 40.7% Interest
Rate Maturity
Date Principal Value
($) GlaxoSmithKline Capital Inc. 5.65% 05/15/2018 282,000 307,754 GlaxoSmithKline Capital Inc. 5.38% 04/15/2034 6,000 6,754 GlaxoSmithKline Capital Inc. 6.38% 05/15/2038 155,000 196,477 GlaxoSmithKline Capital PLC 1.50% 05/08/2017 100,000 100,291 GlaxoSmithKline Capital PLC 2.85% 05/08/2022 150,000 151,078 Johnson & Johnson 1.13% 11/21/2017 150,000 149,561 Johnson & Johnson 1.65% 12/05/2018 200,000 199,860 McKesson Corp. 5.70% 03/01/2017 13,000 13,624 McKesson Corp. 1.29% 03/10/2017 200,000 199,387 McKesson Corp. 7.50% 02/15/2019 8,000 9,168 McKesson Corp. 2.28% 03/15/2019 150,000 149,461 McKesson Corp. 4.75% 03/01/2021 100,000 107,942 McKesson Corp. 2.70% 12/15/2022 150,000 143,312 Mead Johnson Nutrition Co. 3.00% 11/15/2020 30,000 29,931 Mead Johnson Nutrition Co. 4.13% 11/15/2025 30,000 30,116 Mead Johnson Nutrition Co. 4.60% 06/01/2044 100,000 92,254 Medco Health Solutions Inc. 7.13% 03/15/2018 1,000 1,100 Medco Health Solutions Inc. 4.13% 09/15/2020 100,000 104,450 Merck & Co. Inc. 1.10% 01/31/2018 300,000 298,316 Merck & Co. Inc. 2.40% 09/15/2022 200,000 194,829 Merck & Co. Inc. 2.80% 05/18/2023 200,000 198,996 Merck & Co. Inc. 6.55% 09/15/2037 100,000 131,197 Merck & Co. Inc. 3.60% 09/15/2042 100,000 91,318 Merck & Co. Inc. 3.70% 02/10/2045 500,000 462,166 Merck Sharp & Dohme Corp. 5.00% 06/30/2019 125,000 137,381 Mylan Inc. 2.55% 03/28/2019 56,000 54,801 Mylan Inc. 4.20% 11/29/2023 200,000 193,762 Novartis Capital Corp. 2.40% 09/21/2022 200,000 196,988 Novartis Capital Corp. 3.40% 05/06/2024 150,000 155,007 Novartis Capital Corp. 3.00% 11/20/2025 100,000 98,936 Novartis Capital Corp. 4.40% 05/06/2044 200,000 208,619 Novartis Capital Corp. 4.00% 11/20/2045 100,000 98,282 Novartis Securities Investment Ltd. 5.13% 02/10/2019 209,000 228,911 Owens & Minor Inc. 3.88% 09/15/2021 50,000 49,680 Pfizer Inc. 4.65% 03/01/2018 7,000 7,426 Pfizer Inc. 6.20% 03/15/2019 200,000 224,487 Pfizer Inc. 2.10% 05/15/2019 250,000 249,588 Pfizer Inc. 7.20% 03/15/2039 200,000 274,742

State Street Bank and Trust Company
State Street U.S. Government/Credit Bond Index Non-Lending Series Fund
Schedule of Investments (showing percentage of total value of investments)
December 31, 2015
The accompanying notes are an integral part
of these financial statements. 78
Debt Instruments - 40.7% Interest
Rate Maturity
Date Principal Value
($) Pfizer Inc. 4.40% 05/15/2044 53,000 53,861 Pharmacia Corp. 6.50% 12/01/2018 10,000 11,231 Pharmacia Corp. 6.60% 12/01/2028 12,000 15,582 Sanofi 1.25% 04/10/2018 204,000 202,978 Sanofi 4.00% 03/29/2021 100,000 106,816
Teva Pharmaceutical Finance Co. LLC
6.15%
02/01/2036
120,000
130,634
Teva Pharmaceutical Finance IV BV 3.65% 11/10/2021 100,000 99,994 Watson Pharmaceuticals Inc. 1.88% 10/01/2017 200,000 199,289 Wyeth 5.45% 04/01/2017 17,000 17,875 Wyeth 7.25% 03/01/2023 1,000 1,248 Wyeth 6.45% 02/01/2024 309,000 378,154 Wyeth 6.50% 02/01/2034 164,000 207,348 Wyeth 6.00% 02/15/2036 15,000 18,024 Wyeth 5.95% 04/01/2037 145,000 173,117 Zeneca Wilmington Inc. 7.00% 11/15/2023 3,000 3,669 Zoetis Inc. 1.88% 02/01/2018 150,000 148,184 Zoetis Inc. 4.70% 02/01/2043 250,000 219,758
14,547,391
Pipelines - 1.2% ANR Pipeline Co. 9.63% 11/01/2021 USD 2,000 2,586 Boardwalk Pipelines LP 5.50% 02/01/2017 9,000 9,053 Boardwalk Pipelines LP 3.38% 02/01/2023 100,000 81,113 Buckeye Partners LP 6.05% 01/15/2018 8,000 8,157 Buckeye Partners LP 2.65% 11/15/2018 100,000 93,465 Buckeye Partners LP 4.88% 02/01/2021 100,000 95,547 Columbia Pipeline Group Inc. 2.45% 06/01/2018 25,000 24,667 Columbia Pipeline Group Inc. 3.30% 06/01/2020 50,000 48,990 Columbia Pipeline Group Inc. 4.50% 06/01/2025 50,000 46,272 Columbia Pipeline Group Inc. 5.80% 06/01/2045 50,000 43,843 El Paso Natural Gas Co. 5.95% 04/15/2017 105,000 106,703 El Paso Natural Gas Co. 8.38% 06/15/2032 5,000 4,872 Enable Midstream Partners LP 3.90% 05/15/2024 150,000 114,700 Enbridge Energy Partners LP 5.88% 12/15/2016 3,000 3,058 Enbridge Energy Partners LP 6.50% 04/15/2018 11,000 11,515 Enbridge Energy Partners LP 9.88% 03/01/2019 8,000 9,115 Enbridge Energy Partners LP 7.50% 04/15/2038 108,000 107,173 Enbridge Inc. 5.60% 04/01/2017 8,000 8,220

State Street Bank and Trust Company
State Street U.S. Government/Credit Bond Index Non-Lending Series Fund
Schedule of Investments (showing percentage of total value of investments)
December 31, 2015
The accompanying notes are an integral part
of these financial statements. 79
Debt Instruments - 40.7% Interest
Rate Maturity
Date Principal Value
($) Enbridge Inc. 4.50% 06/10/2044 150,000 103,025 Energy Transfer Partners LP 6.13% 02/15/2017 7,000 7,147 Energy Transfer Partners LP 2.50% 06/15/2018 25,000 23,752 Energy Transfer Partners LP 6.70% 07/01/2018 112,000 116,758 Energy Transfer Partners LP 9.70% 03/15/2019 18,000 19,721 Energy Transfer Partners LP 9.00% 04/15/2019 100,000 107,737 Energy Transfer Partners LP 4.15% 10/01/2020 50,000 45,929 Energy Transfer Partners LP 5.20% 02/01/2022 100,000 91,777 Energy Transfer Partners LP 7.60% 02/01/2024 102,000 106,732 Energy Transfer Partners LP 4.05% 03/15/2025 400,000 329,806 Energy Transfer Partners LP 4.75% 01/15/2026 50,000 42,871 Energy Transfer Partners LP 8.25% 11/15/2029 9,000 9,956 Energy Transfer Partners LP 6.63% 10/15/2036 7,000 5,835 Energy Transfer Partners LP 7.50% 07/01/2038 11,000 10,194 Energy Transfer Partners LP 6.05% 06/01/2041 125,000 98,446 Energy Transfer Partners LP 6.50% 02/01/2042 200,000 161,450 Energy Transfer Partners LP 6.13% 12/15/2045 50,000 40,735 EnLink Midstream Partners LP 2.70% 04/01/2019 100,000 91,068 EnLink Midstream Partners LP 4.15% 06/01/2025 50,000 38,471 Enterprise Products Operating LLC 6.30% 09/15/2017 127,000 133,515 Enterprise Products Operating LLC 1.65% 05/07/2018 50,000 48,286 Enterprise Products Operating LLC 6.50% 01/31/2019 13,000 14,030 Enterprise Products Operating LLC 5.20% 09/01/2020 100,000 104,837 Enterprise Products Operating LLC 3.35% 03/15/2023 150,000 136,655 Enterprise Products Operating LLC 3.90% 02/15/2024 150,000 139,320 Enterprise Products Operating LLC 3.70% 02/15/2026 50,000 44,423 Enterprise Products Operating LLC 6.88% 03/01/2033 12,000 12,372 Enterprise Products Operating LLC 6.65% 10/15/2034 4,000 4,034 Enterprise Products Operating LLC 5.75% 03/01/2035 5,000 4,556 Enterprise Products Operating LLC 7.55% 04/15/2038 107,000 117,170 Enterprise Products Operating LLC 6.13% 10/15/2039 25,000 22,829 Enterprise Products Operating LLC 4.85% 08/15/2042 250,000 196,241 Enterprise Products Operating LLC 4.85% 03/15/2044 150,000 119,475 Enterprise Products Operating LLC 5.10% 02/15/2045 100,000 82,696 Enterprise Products Operating LLC 4.90% 05/15/2046 50,000 40,460 Enterprise Products Operating LLC 4.95% 10/15/2054 150,000 114,339 EQT Midstream Partners LP 4.00% 08/01/2024 30,000 24,766 Kinder Morgan Energy Partners LP 6.00% 02/01/2017 13,000 13,268

State Street Bank and Trust Company
State Street U.S. Government/Credit Bond Index Non-Lending Series Fund
Schedule of Investments (showing percentage of total value of investments)
December 31, 2015
The accompanying notes are an integral part
of these financial statements. 80
Debt Instruments - 40.7% Interest
Rate Maturity
Date Principal Value
($) Kinder Morgan Energy Partners LP 5.95% 02/15/2018 115,000 117,924 Kinder Morgan Energy Partners LP 9.00% 02/01/2019 10,000 10,803 Kinder Morgan Energy Partners LP 6.85% 02/15/2020 21,000 21,757 Kinder Morgan Energy Partners LP 5.30% 09/15/2020 25,000 24,489 Kinder Morgan Energy Partners LP 3.95% 09/01/2022 150,000 130,477 Kinder Morgan Energy Partners LP 3.45% 02/15/2023 500,000 417,272 Kinder Morgan Energy Partners LP 4.30% 05/01/2024 200,000 169,988 Kinder Morgan Energy Partners LP 4.25% 09/01/2024 150,000 127,219 Kinder Morgan Energy Partners LP 7.40% 03/15/2031 3,000 2,681 Kinder Morgan Energy Partners LP 7.75% 03/15/2032 3,000 2,823 Kinder Morgan Energy Partners LP 7.30% 08/15/2033 10,000 8,830 Kinder Morgan Energy Partners LP 5.80% 03/15/2035 10,000 8,050 Kinder Morgan Energy Partners LP 6.50% 02/01/2037 157,000 132,900 Kinder Morgan Energy Partners LP 6.95% 01/15/2038 3,000 2,670 Kinder Morgan Energy Partners LP 5.00% 08/15/2042 150,000 111,549 Kinder Morgan Inc. 2.00% 12/01/2017 85,000 81,616 Kinder Morgan Inc. 3.05% 12/01/2019 300,000 276,392 Kinder Morgan Inc. 4.30% 06/01/2025 300,000 258,901 Kinder Morgan Inc. 5.30% 12/01/2034 145,000 114,003 Magellan Midstream Partners LP 6.40% 07/15/2018 7,000 7,502 Magellan Midstream Partners LP 6.55% 07/15/2019 11,000 12,011 Magellan Midstream Partners LP 6.40% 05/01/2037 3,000 2,958 Magellan Midstream Partners LP 5.15% 10/15/2043 100,000 82,510 Magellan Midstream Partners LP 4.20% 03/15/2045 100,000 74,014 Northwest Pipeline LLC 6.05% 06/15/2018 5,000 5,380 ONEOK Partners LP 3.20% 09/15/2018 75,000 71,284 ONEOK Partners LP 8.63% 03/01/2019 15,000 16,439 ONEOK Partners LP 3.38% 10/01/2022 150,000 121,303 ONEOK Partners LP 4.90% 03/15/2025 100,000 84,249 ONEOK Partners LP 6.65% 10/01/2036 11,000 8,656 ONEOK Partners LP 6.85% 10/15/2037 13,000 10,431 ONEOK Partners LP 6.13% 02/01/2041 100,000 74,532 Panhandle Eastern Pipeline Co. LP 6.20% 11/01/2017 6,000 6,314 Phillips 66 Partners LP 2.65% 02/15/2020 50,000 46,994 Phillips 66 Partners LP 3.61% 02/15/2025 50,000 43,189 Phillips 66 Partners LP 4.68% 02/15/2045 10,000 7,509 Plains All American Pipeline LLC 8.75% 05/01/2019 4,000 4,346 Plains All American Pipeline LP 6.13% 01/15/2017 5,000 5,154

State Street Bank and Trust Company
State Street U.S. Government/Credit Bond Index Non-Lending Series Fund
Schedule of Investments (showing percentage of total value of investments)
December 31, 2015
The accompanying notes are an integral part
of these financial statements. 81
Debt Instruments - 40.7% Interest
Rate Maturity
Date Principal Value
($) Plains All American Pipeline LP 6.50% 05/01/2018 13,000 13,330 Plains All American Pipeline LP 5.75% 01/15/2020 18,000 17,808 Plains All American Pipeline LP 5.00% 02/01/2021 100,000 95,037 Plains All American Pipeline LP 2.85% 01/31/2023 200,000 161,806 Plains All American Pipeline LP 4.65% 10/15/2025 100,000 86,566 Plains All American Pipeline LP 6.70% 05/15/2036 11,000 9,804 Plains All American Pipeline LP 6.65% 01/15/2037 12,000 10,618 Plains All American Pipeline LP 5.15% 06/01/2042 50,000 37,162 Plains All American Pipeline LP 4.70% 06/15/2044 100,000 69,279 Southern Natural Gas Co. 5.90% 04/01/2017 21,000 21,318 Southern Natural Gas Co. 8.00% 03/01/2032 108,000 100,864 Spectra Energy Capital LLC 6.20% 04/15/2018 11,000 11,654 Spectra Energy Capital LLC 8.00% 10/01/2019 12,000 13,566 Spectra Energy Capital LLC 5.65% 03/01/2020 125,000 130,154 Spectra Energy Capital LLC 7.50% 09/15/2038 4,000 4,012 Spectra Energy Partners LP 2.95% 09/25/2018 100,000 97,494 Spectra Energy Partners LP 4.50% 03/15/2045 200,000 157,275
Sunoco Logistics Partners Operations LP
5.95%
12/01/2025
50,000
47,741
Sunoco Logistics Partners Operations LP
5.30%
04/01/2044
150,000
111,634
Tennessee Gas Pipeline Co. 7.00% 03/15/2027 6,000 5,807 Tennessee Gas Pipeline Co. 7.00% 10/15/2028 9,000 8,579 Texas Eastern Transmission LP 7.00% 07/15/2032 5,000 5,678 TransCanada PipeLines Ltd. 6.50% 08/15/2018 103,000 112,227 TransCanada PipeLines Ltd. 3.80% 10/01/2020 100,000 101,735 TransCanada PipeLines Ltd. 9.88% 01/01/2021 9,000 11,375 TransCanada PipeLines Ltd. 2.50% 08/01/2022 200,000 184,364 TransCanada PipeLines Ltd. 4.63% 03/01/2034 100,000 94,184 TransCanada PipeLines Ltd. 5.60% 03/31/2034 5,000 5,045 TransCanada PipeLines Ltd. 5.85% 03/15/2036 5,000 5,137 TransCanada PipeLines Ltd. 6.20% 10/15/2037 250,000 263,209 TransCanada PipeLines Ltd. 7.25% 08/15/2038 19,000 22,526 TransCanada PipeLines Ltd. 7.63% 01/15/2039 23,000 28,570 TransCanada PipeLines Ltd. 5.00% 10/16/2043 100,000 94,681 TransCanada PipeLines Ltd.1 6.35% 05/15/2067 30,000 22,500
Transcontinental Gas Pipe Line Co. LLC
6.05%
06/15/2018
11,000
11,782
Western Gas Partners LP 4.00% 07/01/2022 25,000 22,686

State Street Bank and Trust Company
State Street U.S. Government/Credit Bond Index Non-Lending Series Fund
Schedule of Investments (showing percentage of total value of investments)
December 31, 2015
The accompanying notes are an integral part
of these financial statements. 82
Debt Instruments - 40.7% Interest
Rate Maturity
Date Principal Value
($) Western Gas Partners LP 3.95% 06/01/2025 50,000 42,141 Western Gas Partners LP 5.45% 04/01/2044 100,000 78,778 Williams Cos Inc. 7.88% 09/01/2021 16,000 14,400 Williams Cos Inc. 3.70% 01/15/2023 150,000 100,500 Williams Cos Inc. 4.55% 06/24/2024 100,000 67,500 Williams Cos Inc. 7.50% 01/15/2031 10,000 7,400 Williams Cos Inc. 7.75% 06/15/2031 4,000 3,000 Williams Cos Inc. 8.75% 03/15/2032 9,000 7,110 Williams Partners LP 5.25% 03/15/2020 150,000 138,504 Williams Partners LP 4.00% 11/15/2021 100,000 82,565 Williams Partners LP 3.60% 03/15/2022 150,000 118,910 Williams Partners LP 3.35% 08/15/2022 200,000 154,842 Williams Partners LP 4.30% 03/04/2024 150,000 117,715 Williams Partners LP 4.00% 09/15/2025 150,000 111,888 Williams Partners LP 6.30% 04/15/2040 35,000 26,787 Williams Partners LP 5.10% 09/15/2045 150,000 97,662
9,715,759
Real Estate - 0.1%
American Campus Communities Operating Partnership LP
4.13%
07/01/2024
USD
150,000
149,461
Brookfield Asset Management Inc. 5.80% 04/25/2017 10,000 10,453 Brookfield Asset Management Inc. 4.00% 01/15/2025 100,000 97,219 Brookfield Asset Management Inc. 7.38% 03/01/2033 3,000 3,538 CBRE Services Inc. 4.88% 03/01/2026 100,000 99,590 Melisron Ltd. 7.75% 06/15/2023 4,000 5,025 ProLogis LP 3.35% 02/01/2021 200,000 202,225
567,511
Real Estate Investment Trusts (REITs) - 0.9% Alexandria Real Estate Equities Inc. 4.30% 01/15/2026 USD 100,000 99,377 Alexandria Real Estate Equities Inc. 4.50% 07/30/2029 65,000 63,540 American Tower Corp. 4.70% 03/15/2022 50,000 52,251 AvalonBay Communities Inc. 2.95% 09/15/2022 150,000 146,634 AvalonBay Communities Inc. 3.50% 11/15/2024 100,000 99,426 BioMed Realty LP 2.63% 05/01/2019 100,000 96,198 Boston Properties LP 5.88% 10/15/2019 150,000 165,992 Boston Properties LP 4.13% 05/15/2021 150,000 157,082 Boston Properties LP 3.13% 09/01/2023 100,000 97,195

State Street Bank and Trust Company
State Street U.S. Government/Credit Bond Index Non-Lending Series Fund
Schedule of Investments (showing percentage of total value of investments)
December 31, 2015
The accompanying notes are an integral part
of these financial statements. 83
Debt Instruments - 40.7% Interest
Rate Maturity
Date Principal Value
($) Brandywine Operating Partnership LP 5.70% 05/01/2017 13,000 13,562 Brandywine Operating Partnership LP 4.55% 10/01/2029 100,000 96,079 Brixmor Operating Partnership LP 3.88% 08/15/2022 30,000 29,893 Brixmor Operating Partnership LP 3.85% 02/01/2025 35,000 34,016 Camden Property Trust 2.95% 12/15/2022 150,000 144,264 Corporate Office Properties LP 3.70% 06/15/2021 100,000 97,106 CubeSmart LP 4.00% 11/15/2025 50,000 49,491 DDR Corp. 7.88% 09/01/2020 200,000 238,779 Digital Delta Holdings LLC 3.40% 10/01/2020 50,000 49,888 Digital Delta Holdings LLC 4.75% 10/01/2025 50,000 50,281 Digital Realty Trust LP 5.25% 03/15/2021 100,000 107,895 Duke Realty LP 5.95% 02/15/2017 6,000 6,280 Duke Realty LP 6.50% 01/15/2018 8,000 8,645 EPR Properties 4.50% 04/01/2025 100,000 95,430 Equity Commonwealth 6.65% 01/15/2018 8,000 8,427 Equity One Inc. 3.75% 11/15/2022 100,000 96,895 ERP Operating LP 5.75% 06/15/2017 12,000 12,672 ERP Operating LP 2.38% 07/01/2019 200,000 199,830 Essex Portfolio LP 5.50% 03/15/2017 10,000 10,411 Essex Portfolio LP 3.88% 05/01/2024 50,000 50,170 Federal Realty Investment Trust 4.50% 12/01/2044 100,000 100,476 HCP Inc. 6.00% 01/30/2017 11,000 11,482 HCP Inc. 5.63% 05/01/2017 8,000 8,371 HCP Inc. 6.70% 01/30/2018 15,000 16,309 HCP Inc. 2.63% 02/01/2020 150,000 147,282 HCP Inc. 5.38% 02/01/2021 100,000 108,743 HCP Inc. 4.25% 11/15/2023 93,000 92,838 HCP Inc. 4.20% 03/01/2024 100,000 99,342 HCP Inc. 6.75% 02/01/2041 35,000 42,366 Healthcare Realty Trust Inc. 5.75% 01/15/2021 50,000 54,791
Healthcare Trust of America Holdings LP
3.38%
07/15/2021
50,000
49,068
Highwoods Realty LP 5.85% 03/15/2017 5,000 5,217 Highwoods Realty LP 3.20% 06/15/2021 100,000 97,450 Hospitality Properties Trust 5.63% 03/15/2017 13,000 13,458 Hospitality Properties Trust 6.70% 01/15/2018 54,000 57,165 Hospitality Properties Trust 4.65% 03/15/2024 100,000 98,482 Host Hotels & Resorts Inc. 4.75% 03/01/2023 100,000 103,419 Host Hotels & Resorts LP 4.00% 06/15/2025 95,000 90,979

State Street Bank and Trust Company
State Street U.S. Government/Credit Bond Index Non-Lending Series Fund
Schedule of Investments (showing percentage of total value of investments)
December 31, 2015
The accompanying notes are an integral part
of these financial statements. 84
Debt Instruments - 40.7% Interest
Rate Maturity
Date Principal Value
($) Kilroy Realty LP 4.80% 07/15/2018 100,000 104,505 Kimco Realty Corp. 5.70% 05/01/2017 4,000 4,192 Kimco Realty Corp. 3.13% 06/01/2023 100,000 96,452 Kimco Realty Corp. 4.25% 04/01/2045 50,000 45,919 Lexington Realty Trust 4.40% 06/15/2024 60,000 59,682 Liberty Property LP 6.63% 10/01/2017 7,000 7,512 Liberty Property LP 4.75% 10/01/2020 50,000 53,115 Liberty Property LP 4.40% 02/15/2024 63,000 63,940 Liberty Property LP 3.75% 04/01/2025 50,000 48,192 Mack-Cali Realty LP 7.75% 08/15/2019 7,000 7,851 Mack-Cali Realty LP 3.15% 05/15/2023 100,000 85,496 Mid-America Apartments LP 3.75% 06/15/2024 100,000 97,689 National Retail Properties Inc. 6.88% 10/15/2017 8,000 8,633 National Retail Properties Inc. 3.80% 10/15/2022 150,000 150,208 National Retail Properties Inc. 4.00% 11/15/2025 35,000 34,504 Omega Healthcare Investors Inc. 4.50% 01/15/2025 100,000 97,707 Omega Healthcare Investors Inc. 5.25% 01/15/2026 100,000 101,722 Realty Income Corp. 6.75% 08/15/2019 10,000 11,351 Realty Income Corp. 3.88% 07/15/2024 95,000 93,299 Regency Centers LP 5.88% 06/15/2017 5,000 5,259 Regency Centers LP 3.75% 06/15/2024 100,000 99,456 Regency Centers LP 3.90% 11/01/2025 30,000 29,936
Retail Opportunity Investments Partnership LP
4.00%
12/15/2024
50,000
47,200
Simon Property Group LP 2.20% 02/01/2019 100,000 100,273 Simon Property Group LP 10.35% 04/01/2019 10,000 12,255 Simon Property Group LP 2.50% 09/01/2020 50,000 50,061 Simon Property Group LP 4.38% 03/01/2021 50,000 53,950 Simon Property Group LP 4.13% 12/01/2021 150,000 159,374 Simon Property Group LP 3.38% 03/15/2022 150,000 153,659 Simon Property Group LP 3.75% 02/01/2024 100,000 103,605 Simon Property Group LP 3.50% 09/01/2025 50,000 50,618 Simon Property Group LP 6.75% 02/01/2040 100,000 131,450 Tanger Properties LP 3.88% 12/01/2023 100,000 99,319 UDR Inc. 4.25% 06/01/2018 100,000 104,258 Ventas Realty LP 1.25% 04/17/2017 86,000 85,362 Ventas Realty LP 2.00% 02/15/2018 150,000 149,243 Ventas Realty LP 4.75% 06/01/2021 100,000 106,346 Ventas Realty LP 3.50% 02/01/2025 100,000 95,517

State Street Bank and Trust Company
State Street U.S. Government/Credit Bond Index Non-Lending Series Fund
Schedule of Investments (showing percentage of total value of investments)
December 31, 2015
The accompanying notes are an integral part
of these financial statements. 85
Debt Instruments - 40.7% Interest
Rate Maturity
Date Principal Value
($)
Washington Real Estate Investment Trust
3.95%
10/15/2022
100,000
98,383
Weingarten Realty Investors 3.50% 04/15/2023 100,000 97,011 Welltower Inc. 4.13% 04/01/2019 200,000 208,626 Welltower Inc. 4.00% 06/01/2025 200,000 196,823 Weyerhaeuser Co. 4.63% 09/15/2023 200,000 208,132 WP Carey Inc. 4.60% 04/01/2024 100,000 100,159
7,293,191
Regional - 0.5% Province of British Columbia Canada 1.20% 04/25/2017 USD 150,000 149,995 Province of British Columbia Canada 2.00% 10/23/2022 150,000 146,010 Province of British Columbia Canada 6.50% 01/15/2026 1,000 1,299 Province of British Columbia Canada 7.25% 09/01/2036 108,000 162,630 Province of Manitoba Canada 1.30% 04/03/2017 100,000 100,084 Province of Manitoba Canada 9.63% 12/01/2018 1,000 1,211 Province of Manitoba Canada 1.75% 05/30/2019 150,000 149,337 Province of Manitoba Canada 8.80% 01/15/2020 2,000 2,481 Province of Manitoba Canada 9.25% 04/01/2020 1,000 1,267 Province of Manitoba Canada 2.10% 09/06/2022 63,000 61,095 Province of Manitoba Canada 3.05% 05/14/2024 200,000 204,240 Province of New Brunswick Canada 5.20% 02/21/2017 14,000 14,618 Province of Nova Scotia Canada 5.13% 01/26/2017 116,000 120,719 Province of Nova Scotia Canada 9.25% 03/01/2020 3,000 3,758 Province of Nova Scotia Canada 8.75% 04/01/2022 1,000 1,330 Province of Nova Scotia Canada 8.25% 07/30/2022 2,000 2,636 Province of Ontario Canada 1.10% 10/25/2017 250,000 248,847 Province of Ontario Canada 3.15% 12/15/2017 250,000 258,084 Province of Ontario Canada 1.20% 02/14/2018 200,000 198,782 Province of Ontario Canada 2.00% 01/30/2019 250,000 251,003 Province of Ontario Canada 4.00% 10/07/2019 100,000 107,064 Province of Ontario Canada 4.40% 04/14/2020 200,000 218,464 Province of Ontario Canada 1.88% 05/21/2020 250,000 247,739 Province of Ontario Canada 2.45% 06/29/2022 200,000 198,083 Province of Ontario Canada 3.20% 05/16/2024 300,000 309,249 Province of Quebec Canada 4.63% 05/14/2018 21,000 22,485 Province of Quebec Canada 3.50% 07/29/2020 150,000 158,541 Province of Quebec Canada 2.75% 08/25/2021 150,000 152,058 Province of Quebec Canada 2.63% 02/13/2023 200,000 198,692
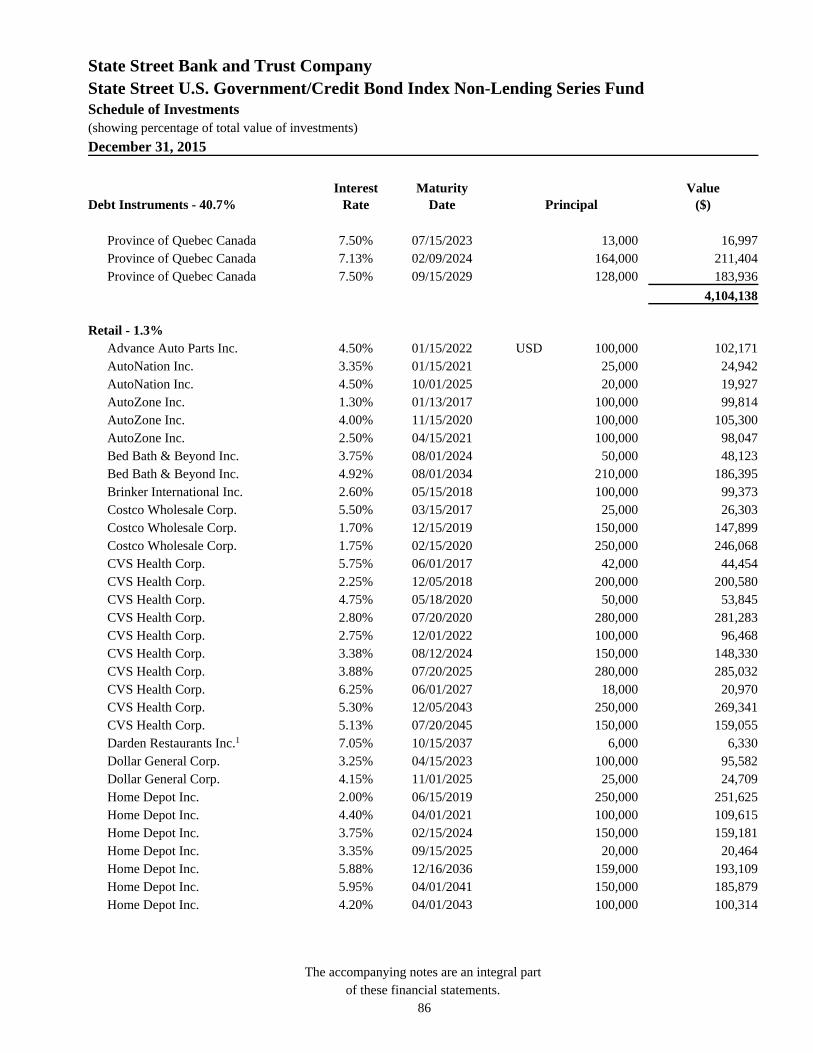
State Street Bank and Trust Company
State Street U.S. Government/Credit Bond Index Non-Lending Series Fund
Schedule of Investments (showing percentage of total value of investments)
December 31, 2015
The accompanying notes are an integral part
of these financial statements. 86
Debt Instruments - 40.7% Interest
Rate Maturity
Date Principal Value
($) Province of Quebec Canada 7.50% 07/15/2023 13,000 16,997 Province of Quebec Canada 7.13% 02/09/2024 164,000 211,404 Province of Quebec Canada 7.50% 09/15/2029 128,000 183,936
4,104,138
Retail - 1.3% Advance Auto Parts Inc. 4.50% 01/15/2022 USD 100,000 102,171 AutoNation Inc. 3.35% 01/15/2021 25,000 24,942 AutoNation Inc. 4.50% 10/01/2025 20,000 19,927 AutoZone Inc. 1.30% 01/13/2017 100,000 99,814 AutoZone Inc. 4.00% 11/15/2020 100,000 105,300 AutoZone Inc. 2.50% 04/15/2021 100,000 98,047 Bed Bath & Beyond Inc. 3.75% 08/01/2024 50,000 48,123 Bed Bath & Beyond Inc. 4.92% 08/01/2034 210,000 186,395 Brinker International Inc. 2.60% 05/15/2018 100,000 99,373 Costco Wholesale Corp. 5.50% 03/15/2017 25,000 26,303 Costco Wholesale Corp. 1.70% 12/15/2019 150,000 147,899 Costco Wholesale Corp. 1.75% 02/15/2020 250,000 246,068 CVS Health Corp. 5.75% 06/01/2017 42,000 44,454 CVS Health Corp. 2.25% 12/05/2018 200,000 200,580 CVS Health Corp. 4.75% 05/18/2020 50,000 53,845 CVS Health Corp. 2.80% 07/20/2020 280,000 281,283 CVS Health Corp. 2.75% 12/01/2022 100,000 96,468 CVS Health Corp. 3.38% 08/12/2024 150,000 148,330 CVS Health Corp. 3.88% 07/20/2025 280,000 285,032 CVS Health Corp. 6.25% 06/01/2027 18,000 20,970 CVS Health Corp. 5.30% 12/05/2043 250,000 269,341 CVS Health Corp. 5.13% 07/20/2045 150,000 159,055 Darden Restaurants Inc.1 7.05% 10/15/2037 6,000 6,330 Dollar General Corp. 3.25% 04/15/2023 100,000 95,582 Dollar General Corp. 4.15% 11/01/2025 25,000 24,709 Home Depot Inc. 2.00% 06/15/2019 250,000 251,625 Home Depot Inc. 4.40% 04/01/2021 100,000 109,615 Home Depot Inc. 3.75% 02/15/2024 150,000 159,181 Home Depot Inc. 3.35% 09/15/2025 20,000 20,464 Home Depot Inc. 5.88% 12/16/2036 159,000 193,109 Home Depot Inc. 5.95% 04/01/2041 150,000 185,879 Home Depot Inc. 4.20% 04/01/2043 100,000 100,314
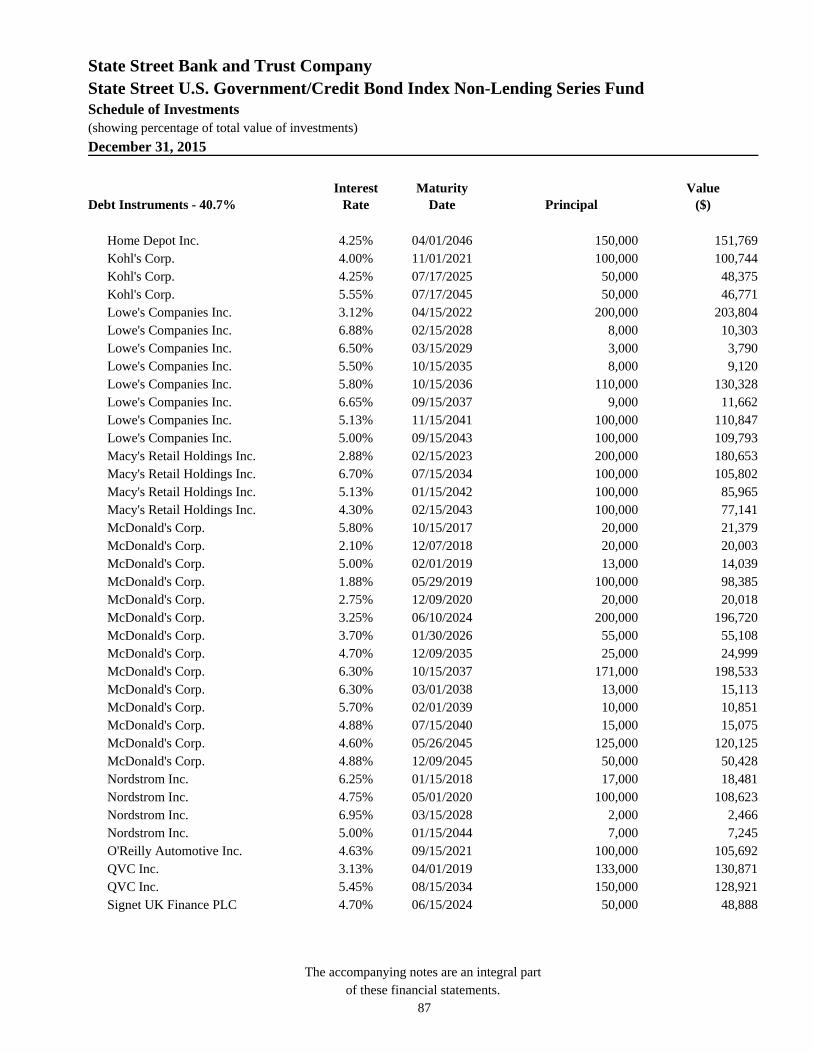
State Street Bank and Trust Company
State Street U.S. Government/Credit Bond Index Non-Lending Series Fund
Schedule of Investments (showing percentage of total value of investments)
December 31, 2015
The accompanying notes are an integral part
of these financial statements. 87
Debt Instruments - 40.7% Interest
Rate Maturity
Date Principal Value
($) Home Depot Inc. 4.25% 04/01/2046 150,000 151,769 Kohl's Corp. 4.00% 11/01/2021 100,000 100,744 Kohl's Corp. 4.25% 07/17/2025 50,000 48,375 Kohl's Corp. 5.55% 07/17/2045 50,000 46,771 Lowe's Companies Inc. 3.12% 04/15/2022 200,000 203,804 Lowe's Companies Inc. 6.88% 02/15/2028 8,000 10,303 Lowe's Companies Inc. 6.50% 03/15/2029 3,000 3,790 Lowe's Companies Inc. 5.50% 10/15/2035 8,000 9,120 Lowe's Companies Inc. 5.80% 10/15/2036 110,000 130,328 Lowe's Companies Inc. 6.65% 09/15/2037 9,000 11,662 Lowe's Companies Inc. 5.13% 11/15/2041 100,000 110,847 Lowe's Companies Inc. 5.00% 09/15/2043 100,000 109,793 Macy's Retail Holdings Inc. 2.88% 02/15/2023 200,000 180,653 Macy's Retail Holdings Inc. 6.70% 07/15/2034 100,000 105,802 Macy's Retail Holdings Inc. 5.13% 01/15/2042 100,000 85,965 Macy's Retail Holdings Inc. 4.30% 02/15/2043 100,000 77,141 McDonald's Corp. 5.80% 10/15/2017 20,000 21,379 McDonald's Corp. 2.10% 12/07/2018 20,000 20,003 McDonald's Corp. 5.00% 02/01/2019 13,000 14,039 McDonald's Corp. 1.88% 05/29/2019 100,000 98,385 McDonald's Corp. 2.75% 12/09/2020 20,000 20,018 McDonald's Corp. 3.25% 06/10/2024 200,000 196,720 McDonald's Corp. 3.70% 01/30/2026 55,000 55,108 McDonald's Corp. 4.70% 12/09/2035 25,000 24,999 McDonald's Corp. 6.30% 10/15/2037 171,000 198,533 McDonald's Corp. 6.30% 03/01/2038 13,000 15,113 McDonald's Corp. 5.70% 02/01/2039 10,000 10,851 McDonald's Corp. 4.88% 07/15/2040 15,000 15,075 McDonald's Corp. 4.60% 05/26/2045 125,000 120,125 McDonald's Corp. 4.88% 12/09/2045 50,000 50,428 Nordstrom Inc. 6.25% 01/15/2018 17,000 18,481 Nordstrom Inc. 4.75% 05/01/2020 100,000 108,623 Nordstrom Inc. 6.95% 03/15/2028 2,000 2,466 Nordstrom Inc. 5.00% 01/15/2044 7,000 7,245 O'Reilly Automotive Inc. 4.63% 09/15/2021 100,000 105,692 QVC Inc. 3.13% 04/01/2019 133,000 130,871 QVC Inc. 5.45% 08/15/2034 150,000 128,921 Signet UK Finance PLC 4.70% 06/15/2024 50,000 48,888

State Street Bank and Trust Company
State Street U.S. Government/Credit Bond Index Non-Lending Series Fund
Schedule of Investments (showing percentage of total value of investments)
December 31, 2015
The accompanying notes are an integral part
of these financial statements. 88
Debt Instruments - 40.7% Interest
Rate Maturity
Date Principal Value
($) Starbucks Corp. 2.70% 06/15/2022 50,000 49,894 Starbucks Corp. 3.85% 10/01/2023 100,000 106,184 Starbucks Corp. 4.30% 06/15/2045 35,000 36,059 Target Corp. 5.38% 05/01/2017 33,000 34,824 Target Corp. 6.00% 01/15/2018 170,000 185,396 Target Corp. 3.88% 07/15/2020 250,000 267,428 Target Corp. 2.90% 01/15/2022 100,000 101,410 Target Corp. 3.50% 07/01/2024 150,000 155,526 Target Corp. 6.35% 11/01/2032 21,000 26,205 Target Corp. 6.50% 10/15/2037 25,000 32,307 TJX Cos Inc. 6.95% 04/15/2019 53,000 60,851 TJX Cos Inc. 2.50% 05/15/2023 200,000 191,814 Walgreen Co. 5.25% 01/15/2019 30,000 32,081 Walgreen Co. 4.40% 09/15/2042 100,000 86,063 Walgreens Boots Alliance Inc. 4.50% 11/18/2034 180,000 164,547 Walgreens Boots Alliance Inc. 4.80% 11/18/2044 350,000 318,486 Wal-Mart Stores Inc. 5.38% 04/05/2017 116,000 122,294 Wal-Mart Stores Inc. 5.80% 02/15/2018 130,000 141,990 Wal-Mart Stores Inc. 4.13% 02/01/2019 11,000 11,798 Wal-Mart Stores Inc. 3.63% 07/08/2020 200,000 213,882 Wal-Mart Stores Inc. 3.25% 10/25/2020 150,000 157,856 Wal-Mart Stores Inc. 2.55% 04/11/2023 100,000 98,520 Wal-Mart Stores Inc. 6.75% 10/15/2023 3,000 3,728 Wal-Mart Stores Inc. 3.30% 04/22/2024 100,000 102,960 Wal-Mart Stores Inc. 5.88% 04/05/2027 31,000 37,913 Wal-Mart Stores Inc. 7.55% 02/15/2030 150,000 210,508 Wal-Mart Stores Inc. 5.25% 09/01/2035 60,000 68,460 Wal-Mart Stores Inc. 6.50% 08/15/2037 203,000 261,396 Wal-Mart Stores Inc. 6.20% 04/15/2038 200,000 250,128 Wal-Mart Stores Inc. 5.00% 10/25/2040 100,000 109,800 Wal-Mart Stores Inc. 5.63% 04/15/2041 200,000 237,485 Wal-Mart Stores Inc. 4.00% 04/11/2043 100,000 97,240 Wal-Mart Stores Inc. 4.30% 04/22/2044 150,000 152,686
10,837,077
Semiconductors - 0.3% Altera Corp. 2.50% 11/15/2018 USD 100,000 100,873 Analog Devices Inc. 3.90% 12/15/2025 30,000 30,350
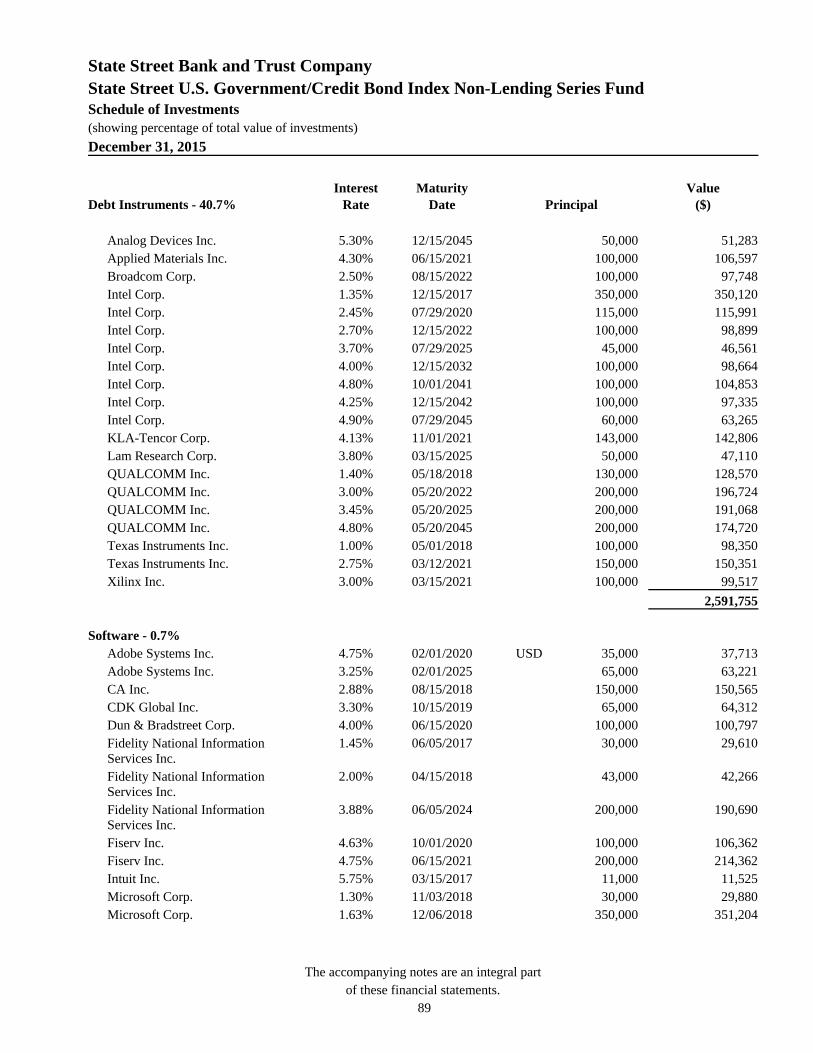
State Street Bank and Trust Company
State Street U.S. Government/Credit Bond Index Non-Lending Series Fund
Schedule of Investments (showing percentage of total value of investments)
December 31, 2015
The accompanying notes are an integral part
of these financial statements. 89
Debt Instruments - 40.7% Interest
Rate Maturity
Date Principal Value
($) Analog Devices Inc. 5.30% 12/15/2045 50,000 51,283 Applied Materials Inc. 4.30% 06/15/2021 100,000 106,597 Broadcom Corp. 2.50% 08/15/2022 100,000 97,748 Intel Corp. 1.35% 12/15/2017 350,000 350,120 Intel Corp. 2.45% 07/29/2020 115,000 115,991 Intel Corp. 2.70% 12/15/2022 100,000 98,899 Intel Corp. 3.70% 07/29/2025 45,000 46,561 Intel Corp. 4.00% 12/15/2032 100,000 98,664 Intel Corp. 4.80% 10/01/2041 100,000 104,853 Intel Corp. 4.25% 12/15/2042 100,000 97,335 Intel Corp. 4.90% 07/29/2045 60,000 63,265 KLA-Tencor Corp. 4.13% 11/01/2021 143,000 142,806 Lam Research Corp. 3.80% 03/15/2025 50,000 47,110 QUALCOMM Inc. 1.40% 05/18/2018 130,000 128,570 QUALCOMM Inc. 3.00% 05/20/2022 200,000 196,724 QUALCOMM Inc. 3.45% 05/20/2025 200,000 191,068 QUALCOMM Inc. 4.80% 05/20/2045 200,000 174,720 Texas Instruments Inc. 1.00% 05/01/2018 100,000 98,350 Texas Instruments Inc. 2.75% 03/12/2021 150,000 150,351 Xilinx Inc. 3.00% 03/15/2021 100,000 99,517
2,591,755
Software - 0.7% Adobe Systems Inc. 4.75% 02/01/2020 USD 35,000 37,713 Adobe Systems Inc. 3.25% 02/01/2025 65,000 63,221 CA Inc. 2.88% 08/15/2018 150,000 150,565 CDK Global Inc. 3.30% 10/15/2019 65,000 64,312 Dun & Bradstreet Corp. 4.00% 06/15/2020 100,000 100,797
Fidelity National Information Services Inc.
1.45%
06/05/2017
30,000
29,610
Fidelity National Information Services Inc.
2.00%
04/15/2018
43,000
42,266
Fidelity National Information Services Inc.
3.88%
06/05/2024
200,000
190,690
Fiserv Inc. 4.63% 10/01/2020 100,000 106,362 Fiserv Inc. 4.75% 06/15/2021 200,000 214,362 Intuit Inc. 5.75% 03/15/2017 11,000 11,525 Microsoft Corp. 1.30% 11/03/2018 30,000 29,880 Microsoft Corp. 1.63% 12/06/2018 350,000 351,204

State Street Bank and Trust Company
State Street U.S. Government/Credit Bond Index Non-Lending Series Fund
Schedule of Investments (showing percentage of total value of investments)
December 31, 2015
The accompanying notes are an integral part
of these financial statements. 90
Debt Instruments - 40.7% Interest
Rate Maturity
Date Principal Value
($) Microsoft Corp. 4.20% 06/01/2019 19,000 20,484 Microsoft Corp. 3.00% 10/01/2020 200,000 208,088 Microsoft Corp. 2.00% 11/03/2020 50,000 49,884 Microsoft Corp. 4.00% 02/08/2021 100,000 108,639 Microsoft Corp. 2.65% 11/03/2022 50,000 49,949 Microsoft Corp. 3.13% 11/03/2025 50,000 50,286 Microsoft Corp. 3.50% 02/12/2035 250,000 232,133 Microsoft Corp. 4.20% 11/03/2035 50,000 50,661 Microsoft Corp. 5.20% 06/01/2039 120,000 135,454 Microsoft Corp. 3.50% 11/15/2042 100,000 88,489 Microsoft Corp. 4.88% 12/15/2043 200,000 217,742 Microsoft Corp. 3.75% 02/12/2045 300,000 277,429 Microsoft Corp. 4.45% 11/03/2045 50,000 51,580 Microsoft Corp. 4.75% 11/03/2055 50,000 51,079 Oracle Corp. 1.20% 10/15/2017 250,000 249,417 Oracle Corp. 5.75% 04/15/2018 209,000 227,649 Oracle Corp. 5.00% 07/08/2019 100,000 109,608 Oracle Corp. 3.88% 07/15/2020 50,000 53,219 Oracle Corp. 2.80% 07/08/2021 155,000 155,785 Oracle Corp. 2.50% 10/15/2022 200,000 194,427 Oracle Corp. 2.95% 05/15/2025 250,000 243,272 Oracle Corp. 4.30% 07/08/2034 300,000 298,102 Oracle Corp. 3.90% 05/15/2035 145,000 137,056 Oracle Corp. 6.50% 04/15/2038 184,000 230,910 Oracle Corp. 6.13% 07/08/2039 124,000 150,595 Oracle Corp. 5.38% 07/15/2040 200,000 222,968 Oracle Corp. 4.38% 05/15/2055 250,000 232,520
5,489,932
Sovereign - 0.0% Export Development Canada 1.25% 12/10/2018 USD 200,000 198,966
Telecommunications - 2.1% America Movil SAB de CV 5.63% 11/15/2017 USD 17,000 18,100 America Movil SAB de CV 5.00% 10/16/2019 150,000 161,784 America Movil SAB de CV 5.00% 03/30/2020 150,000 163,244 America Movil SAB de CV 3.13% 07/16/2022 200,000 196,731

State Street Bank and Trust Company
State Street U.S. Government/Credit Bond Index Non-Lending Series Fund
Schedule of Investments (showing percentage of total value of investments)
December 31, 2015
The accompanying notes are an integral part
of these financial statements. 91
Debt Instruments - 40.7% Interest
Rate Maturity
Date Principal Value
($) America Movil SAB de CV 6.38% 03/01/2035 18,000 20,193 America Movil SAB de CV 6.13% 11/15/2037 9,000 9,901 America Movil SAB de CV 6.13% 03/30/2040 100,000 110,594 America Movil SAB de CV 4.38% 07/16/2042 200,000 179,301 American Tower Corp. 4.50% 01/15/2018 150,000 156,461 American Tower Corp. 3.40% 02/15/2019 200,000 203,857 American Tower Corp. 3.50% 01/31/2023 150,000 145,450 American Tower Corp. 4.00% 06/01/2025 100,000 98,641 AT&T Inc. 1.40% 12/01/2017 250,000 248,207 AT&T Inc. 5.50% 02/01/2018 9,000 9,644 AT&T Inc. 5.60% 05/15/2018 17,000 18,380 AT&T Inc. 2.38% 11/27/2018 100,000 100,561 AT&T Inc. 5.80% 02/15/2019 217,000 239,056 AT&T Inc. 2.45% 06/30/2020 125,000 122,901 AT&T Inc. 3.88% 08/15/2021 130,000 134,137 AT&T Inc. 3.00% 02/15/2022 150,000 147,066 AT&T Inc. 3.00% 06/30/2022 500,000 486,263 AT&T Inc. 2.63% 12/01/2022 100,000 94,749 AT&T Inc. 3.40% 05/15/2025 125,000 119,601 AT&T Inc. 8.25% 11/15/2031 202,000 264,882 AT&T Inc. 6.15% 09/15/2034 18,000 19,531 AT&T Inc. 4.50% 05/15/2035 260,000 240,325 AT&T Inc. 6.50% 09/01/2037 289,000 325,694 AT&T Inc. 6.30% 01/15/2038 299,000 330,140 AT&T Inc. 6.40% 05/15/2038 2,000 2,197 AT&T Inc. 6.55% 02/15/2039 40,000 45,284 AT&T Inc. 5.35% 09/01/2040 268,000 263,651 AT&T Inc. 5.55% 08/15/2041 100,000 100,950 AT&T Inc. 4.30% 12/15/2042 136,000 116,427 AT&T Inc. 4.80% 06/15/2044 200,000 184,284 AT&T Inc. 4.35% 06/15/2045 267,000 228,679 AT&T Inc. 4.75% 05/15/2046 85,000 77,617 British Telecommunications PLC 5.95% 01/15/2018 173,000 186,316 British Telecommunications PLC 9.63% 12/15/2030 150,000 216,898 Cisco Systems Inc. 1.10% 03/03/2017 200,000 200,041 Cisco Systems Inc. 4.95% 02/15/2019 25,000 27,300 Cisco Systems Inc. 4.45% 01/15/2020 200,000 216,891 Cisco Systems Inc. 2.45% 06/15/2020 100,000 100,671
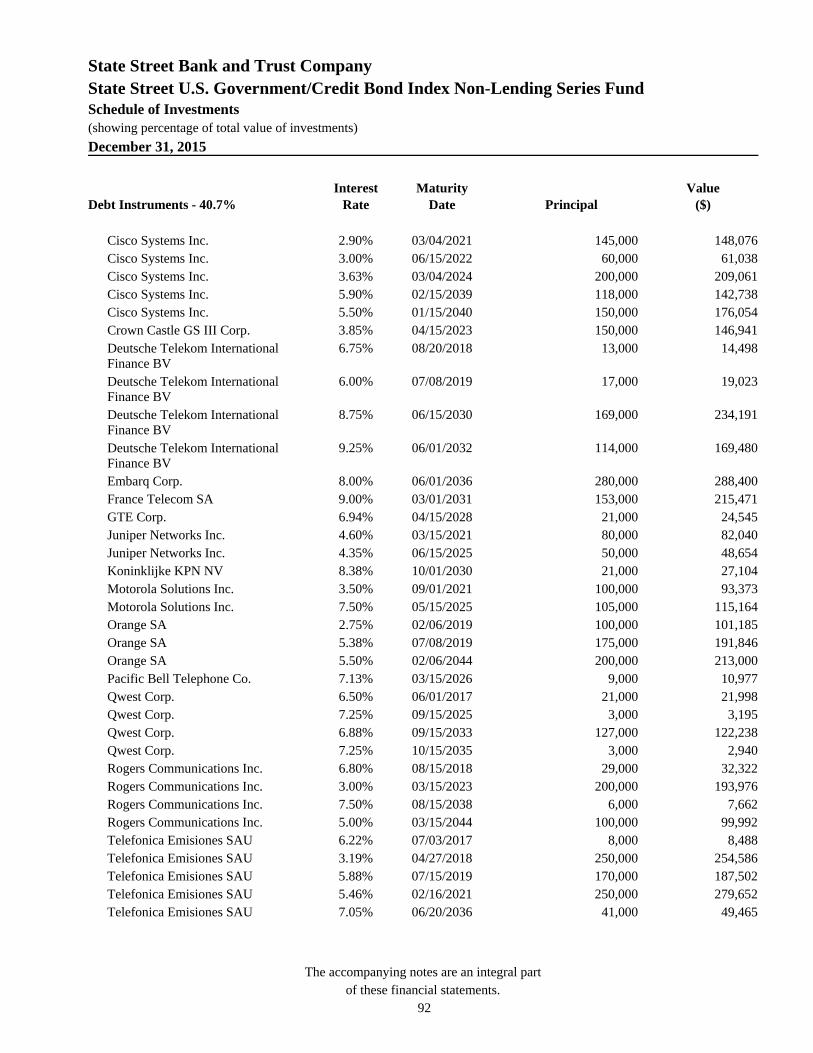
State Street Bank and Trust Company
State Street U.S. Government/Credit Bond Index Non-Lending Series Fund
Schedule of Investments (showing percentage of total value of investments)
December 31, 2015
The accompanying notes are an integral part
of these financial statements. 92
Debt Instruments - 40.7% Interest
Rate Maturity
Date Principal Value
($) Cisco Systems Inc. 2.90% 03/04/2021 145,000 148,076 Cisco Systems Inc. 3.00% 06/15/2022 60,000 61,038 Cisco Systems Inc. 3.63% 03/04/2024 200,000 209,061 Cisco Systems Inc. 5.90% 02/15/2039 118,000 142,738 Cisco Systems Inc. 5.50% 01/15/2040 150,000 176,054 Crown Castle GS III Corp. 3.85% 04/15/2023 150,000 146,941
Deutsche Telekom International Finance BV
6.75%
08/20/2018
13,000
14,498
Deutsche Telekom International Finance BV
6.00%
07/08/2019
17,000
19,023
Deutsche Telekom International Finance BV
8.75%
06/15/2030
169,000
234,191
Deutsche Telekom International Finance BV
9.25%
06/01/2032
114,000
169,480
Embarq Corp. 8.00% 06/01/2036 280,000 288,400 France Telecom SA 9.00% 03/01/2031 153,000 215,471 GTE Corp. 6.94% 04/15/2028 21,000 24,545 Juniper Networks Inc. 4.60% 03/15/2021 80,000 82,040 Juniper Networks Inc. 4.35% 06/15/2025 50,000 48,654 Koninklijke KPN NV 8.38% 10/01/2030 21,000 27,104 Motorola Solutions Inc. 3.50% 09/01/2021 100,000 93,373 Motorola Solutions Inc. 7.50% 05/15/2025 105,000 115,164 Orange SA 2.75% 02/06/2019 100,000 101,185 Orange SA 5.38% 07/08/2019 175,000 191,846 Orange SA 5.50% 02/06/2044 200,000 213,000 Pacific Bell Telephone Co. 7.13% 03/15/2026 9,000 10,977 Qwest Corp. 6.50% 06/01/2017 21,000 21,998 Qwest Corp. 7.25% 09/15/2025 3,000 3,195 Qwest Corp. 6.88% 09/15/2033 127,000 122,238 Qwest Corp. 7.25% 10/15/2035 3,000 2,940 Rogers Communications Inc. 6.80% 08/15/2018 29,000 32,322 Rogers Communications Inc. 3.00% 03/15/2023 200,000 193,976 Rogers Communications Inc. 7.50% 08/15/2038 6,000 7,662 Rogers Communications Inc. 5.00% 03/15/2044 100,000 99,992 Telefonica Emisiones SAU 6.22% 07/03/2017 8,000 8,488 Telefonica Emisiones SAU 3.19% 04/27/2018 250,000 254,586 Telefonica Emisiones SAU 5.88% 07/15/2019 170,000 187,502 Telefonica Emisiones SAU 5.46% 02/16/2021 250,000 279,652 Telefonica Emisiones SAU 7.05% 06/20/2036 41,000 49,465

State Street Bank and Trust Company
State Street U.S. Government/Credit Bond Index Non-Lending Series Fund
Schedule of Investments (showing percentage of total value of investments)
December 31, 2015
The accompanying notes are an integral part
of these financial statements. 93
Debt Instruments - 40.7% Interest
Rate Maturity
Date Principal Value
($) Telefonica Europe BV 8.25% 09/15/2030 127,000 166,838 Verizon Communications Inc. 3.65% 09/14/2018 300,000 312,757 Verizon Communications Inc. 6.35% 04/01/2019 189,000 212,195 Verizon Communications Inc. 2.55% 06/17/2019 300,000 302,475 Verizon Communications Inc. 2.63% 02/21/2020 250,000 250,723 Verizon Communications Inc. 4.50% 09/15/2020 286,000 306,626 Verizon Communications Inc. 3.45% 03/15/2021 350,000 358,368 Verizon Communications Inc. 3.00% 11/01/2021 145,000 144,607 Verizon Communications Inc. 3.50% 11/01/2021 250,000 254,615 Verizon Communications Inc. 2.45% 11/01/2022 250,000 237,006 Verizon Communications Inc. 5.15% 09/15/2023 500,000 547,995 Verizon Communications Inc. 4.15% 03/15/2024 300,000 308,900 Verizon Communications Inc. 6.40% 09/15/2033 246,000 282,973 Verizon Communications Inc. 5.05% 03/15/2034 200,000 199,984 Verizon Communications Inc. 5.85% 09/15/2035 30,000 32,345 Verizon Communications Inc. 4.27% 01/15/2036 173,000 156,763 Verizon Communications Inc. 6.25% 04/01/2037 14,000 15,779 Verizon Communications Inc. 6.40% 02/15/2038 125,000 143,312 Verizon Communications Inc. 6.90% 04/15/2038 14,000 16,887 Verizon Communications Inc. 3.85% 11/01/2042 150,000 124,081 Verizon Communications Inc. 6.55% 09/15/2043 449,000 532,938 Verizon Communications Inc. 4.86% 08/21/2046 317,000 300,648 Verizon Communications Inc. 4.52% 09/15/2048 447,000 398,917 Verizon Communications Inc. 4.67% 03/15/2055 472,000 408,699 Verizon Florida LLC 6.86% 02/01/2028 2,000 1,888 Verizon Maryland LLC 5.13% 06/15/2033 4,000 3,833 Verizon New England Inc. 7.88% 11/15/2029 2,000 2,444 Verizon New York Inc. 7.38% 04/01/2032 7,000 7,950 Vodafone Group PLC 5.63% 02/27/2017 10,000 10,457 Vodafone Group PLC 1.25% 09/26/2017 200,000 198,018 Vodafone Group PLC 1.50% 02/19/2018 200,000 197,902 Vodafone Group PLC 4.63% 07/15/2018 8,000 8,461 Vodafone Group PLC 5.45% 06/10/2019 28,000 30,610 Vodafone Group PLC 4.38% 03/16/2021 100,000 105,835 Vodafone Group PLC 2.50% 09/26/2022 275,000 255,855 Vodafone Group PLC 7.88% 02/15/2030 20,000 24,123 Vodafone Group PLC 6.25% 11/30/2032 5,000 5,202

State Street Bank and Trust Company
State Street U.S. Government/Credit Bond Index Non-Lending Series Fund
Schedule of Investments (showing percentage of total value of investments)
December 31, 2015
The accompanying notes are an integral part
of these financial statements. 94
Debt Instruments - 40.7% Interest
Rate Maturity
Date Principal Value
($) Vodafone Group PLC 6.15% 02/27/2037 135,000 133,569
17,332,053
Textiles - 0.0% Cintas Corp. No 2 6.15% 08/15/2036 USD 3,000 3,539
Toys/Games/Hobbies - 0.0% Hasbro Inc. 3.15% 05/15/2021 USD 75,000 73,182 Hasbro Inc. 5.10% 05/15/2044 45,000 42,120 Mattel Inc. 2.35% 05/06/2019 100,000 99,042 Mattel Inc. 3.15% 03/15/2023 100,000 94,566
308,910
Transportation - 0.7% BNSF Funding Trust I1 6.61% 12/15/2055 USD 8,000 8,920 Burlington Northern Santa Fe LLC 5.65% 05/01/2017 19,000 20,015 Burlington Northern Santa Fe LLC 5.75% 03/15/2018 108,000 116,268 Burlington Northern Santa Fe LLC 4.70% 10/01/2019 25,000 27,002 Burlington Northern Santa Fe LLC 3.45% 09/15/2021 150,000 152,612 Burlington Northern Santa Fe LLC 3.05% 09/01/2022 200,000 198,852 Burlington Northern Santa Fe LLC 3.75% 04/01/2024 100,000 102,393 Burlington Northern Santa Fe LLC 3.00% 04/01/2025 150,000 144,623 Burlington Northern Santa Fe LLC 7.00% 12/15/2025 5,000 6,280 Burlington Northern Santa Fe LLC 7.95% 08/15/2030 5,000 6,948 Burlington Northern Santa Fe LLC 6.20% 08/15/2036 106,000 124,056 Burlington Northern Santa Fe LLC 6.15% 05/01/2037 19,000 22,203 Burlington Northern Santa Fe LLC 5.40% 06/01/2041 100,000 108,356 Burlington Northern Santa Fe LLC 4.38% 09/01/2042 150,000 142,405 Burlington Northern Santa Fe LLC 4.15% 04/01/2045 68,000 62,083 Canadian National Railway Co. 5.55% 05/15/2018 8,000 8,669 Canadian National Railway Co. 5.55% 03/01/2019 100,000 109,930 Canadian National Railway Co. 2.25% 11/15/2022 100,000 96,183 Canadian National Railway Co. 6.90% 07/15/2028 14,000 18,619 Canadian National Railway Co. 6.25% 08/01/2034 5,000 6,283 Canadian National Railway Co. 6.20% 06/01/2036 5,000 6,298 Canadian National Railway Co. 6.71% 07/15/2036 1,000 1,328 Canadian National Railway Co. 6.38% 11/15/2037 5,000 6,478

State Street Bank and Trust Company
State Street U.S. Government/Credit Bond Index Non-Lending Series Fund
Schedule of Investments (showing percentage of total value of investments)
December 31, 2015
The accompanying notes are an integral part
of these financial statements. 95
Debt Instruments - 40.7% Interest
Rate Maturity
Date Principal Value
($) Canadian National Railway Co. 3.50% 11/15/2042 100,000 89,978 Canadian Pacific Railway Co. 2.90% 02/01/2025 150,000 140,970 Canadian Pacific Railway Co. 3.70% 02/01/2026 20,000 19,791 Canadian Pacific Railway Co. 4.80% 09/15/2035 20,000 19,723 Canadian Pacific Railway Co. 4.80% 08/01/2045 50,000 48,612 Canadian Pacific Railway Co. 6.13% 09/15/2115 30,000 30,021 Canadian Pacific Railway Ltd. 9.45% 08/01/2021 1,000 1,290 Canadian Pacific Railway Ltd. 4.45% 03/15/2023 100,000 105,531 Canadian Pacific Railway Ltd. 7.13% 10/15/2031 10,000 12,214 Canadian Pacific Railway Ltd. 5.75% 03/15/2033 3,000 3,232 Canadian Pacific Railway Ltd. 5.95% 05/15/2037 5,000 5,501 CSX Corp. 5.60% 05/01/2017 6,000 6,313 CSX Corp. 7.90% 05/01/2017 15,000 16,230 CSX Corp. 6.25% 03/15/2018 17,000 18,503 CSX Corp. 7.38% 02/01/2019 156,000 178,176 CSX Corp. 6.00% 10/01/2036 4,000 4,535 CSX Corp. 6.15% 05/01/2037 166,000 192,049 CSX Corp. 6.22% 04/30/2040 16,000 18,905 CSX Corp. 5.50% 04/15/2041 100,000 109,155 CSX Corp. 3.95% 05/01/2050 210,000 176,389 FedEx Corp. 8.00% 01/15/2019 10,000 11,600 FedEx Corp. 2.63% 08/01/2022 27,000 26,248 FedEx Corp. 2.70% 04/15/2023 100,000 96,481 FedEx Corp. 4.90% 01/15/2034 100,000 102,535 FedEx Corp. 3.90% 02/01/2035 250,000 227,920 FedEx Corp. 5.10% 01/15/2044 50,000 51,982 FedEx Corp. 4.75% 11/15/2045 100,000 98,731 JB Hunt Transport Services Inc. 2.40% 03/15/2019 50,000 49,769 Kansas City Southern 2.35% 05/15/2020 100,000 96,546 Kansas City Southern 3.00% 05/15/2023 48,000 45,594 Norfolk Southern Corp. 7.70% 05/15/2017 114,000 123,313 Norfolk Southern Corp. 5.75% 04/01/2018 17,000 18,327 Norfolk Southern Corp. 5.90% 06/15/2019 14,000 15,566 Norfolk Southern Corp. 3.00% 04/01/2022 59,000 57,955 Norfolk Southern Corp. 2.90% 02/15/2023 127,000 122,132 Norfolk Southern Corp. 5.59% 05/17/2025 1,000 1,134 Norfolk Southern Corp. 4.84% 10/01/2041 220,000 215,759 Norfolk Southern Corp. 4.45% 06/15/2045 100,000 92,581
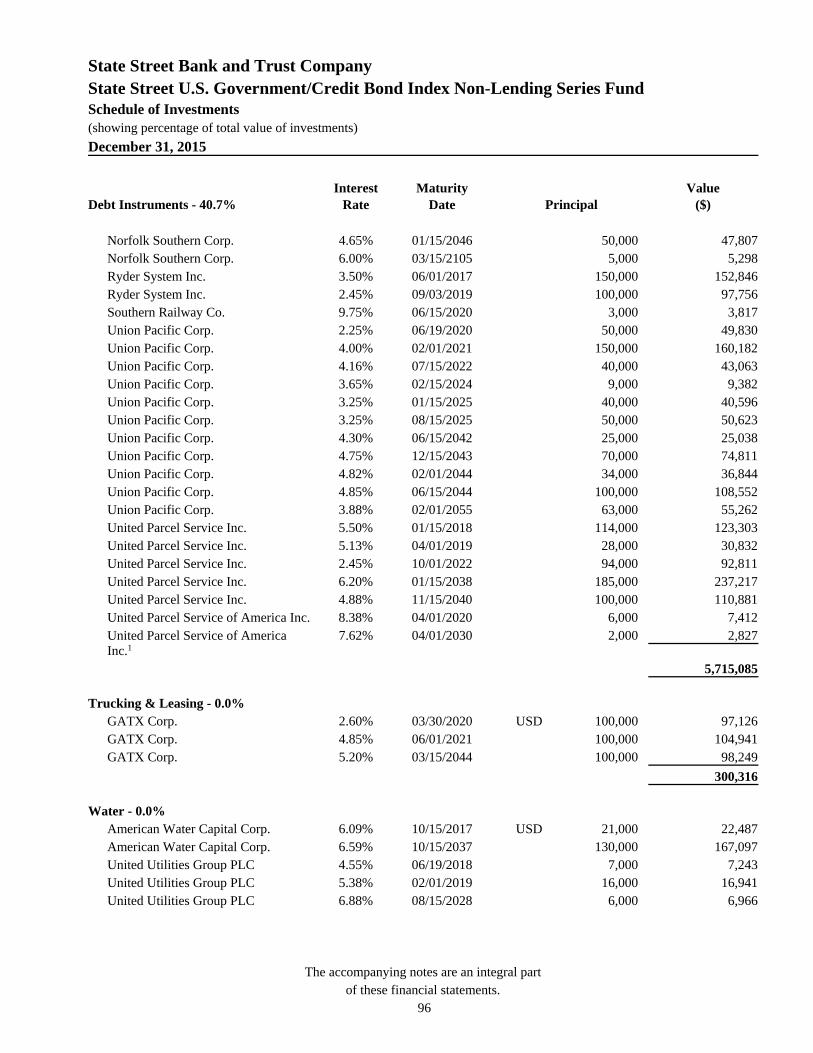
State Street Bank and Trust Company
State Street U.S. Government/Credit Bond Index Non-Lending Series Fund
Schedule of Investments (showing percentage of total value of investments)
December 31, 2015
The accompanying notes are an integral part
of these financial statements. 96
Debt Instruments - 40.7% Interest
Rate Maturity
Date Principal Value
($) Norfolk Southern Corp. 4.65% 01/15/2046 50,000 47,807 Norfolk Southern Corp. 6.00% 03/15/2105 5,000 5,298 Ryder System Inc. 3.50% 06/01/2017 150,000 152,846 Ryder System Inc. 2.45% 09/03/2019 100,000 97,756 Southern Railway Co. 9.75% 06/15/2020 3,000 3,817 Union Pacific Corp. 2.25% 06/19/2020 50,000 49,830 Union Pacific Corp. 4.00% 02/01/2021 150,000 160,182 Union Pacific Corp. 4.16% 07/15/2022 40,000 43,063 Union Pacific Corp. 3.65% 02/15/2024 9,000 9,382 Union Pacific Corp. 3.25% 01/15/2025 40,000 40,596 Union Pacific Corp. 3.25% 08/15/2025 50,000 50,623 Union Pacific Corp. 4.30% 06/15/2042 25,000 25,038 Union Pacific Corp. 4.75% 12/15/2043 70,000 74,811 Union Pacific Corp. 4.82% 02/01/2044 34,000 36,844 Union Pacific Corp. 4.85% 06/15/2044 100,000 108,552 Union Pacific Corp. 3.88% 02/01/2055 63,000 55,262 United Parcel Service Inc. 5.50% 01/15/2018 114,000 123,303 United Parcel Service Inc. 5.13% 04/01/2019 28,000 30,832 United Parcel Service Inc. 2.45% 10/01/2022 94,000 92,811 United Parcel Service Inc. 6.20% 01/15/2038 185,000 237,217 United Parcel Service Inc. 4.88% 11/15/2040 100,000 110,881 United Parcel Service of America Inc. 8.38% 04/01/2020 6,000 7,412
United Parcel Service of America Inc.1
7.62%
04/01/2030
2,000
2,827
5,715,085
Trucking & Leasing - 0.0% GATX Corp. 2.60% 03/30/2020 USD 100,000 97,126 GATX Corp. 4.85% 06/01/2021 100,000 104,941 GATX Corp. 5.20% 03/15/2044 100,000 98,249
300,316
Water - 0.0% American Water Capital Corp. 6.09% 10/15/2017 USD 21,000 22,487 American Water Capital Corp. 6.59% 10/15/2037 130,000 167,097 United Utilities Group PLC 4.55% 06/19/2018 7,000 7,243 United Utilities Group PLC 5.38% 02/01/2019 16,000 16,941 United Utilities Group PLC 6.88% 08/15/2028 6,000 6,966
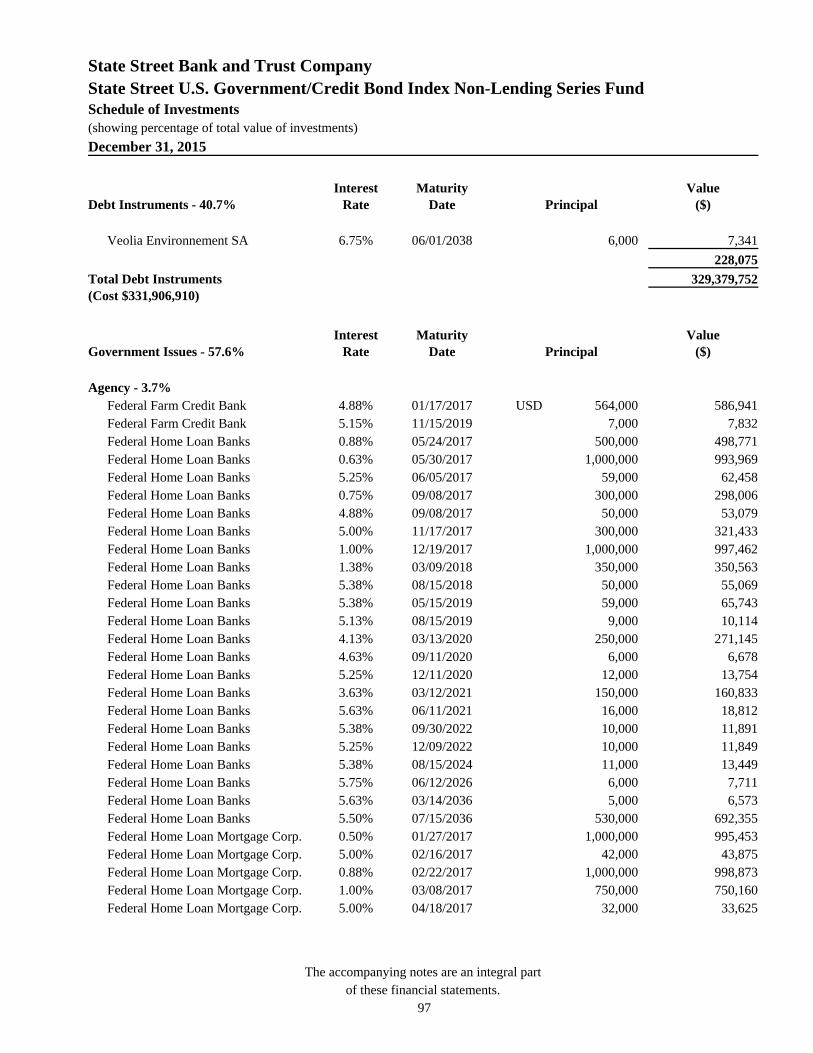
State Street Bank and Trust Company
State Street U.S. Government/Credit Bond Index Non-Lending Series Fund
Schedule of Investments (showing percentage of total value of investments)
December 31, 2015
The accompanying notes are an integral part
of these financial statements. 97
Debt Instruments - 40.7% Interest
Rate Maturity
Date Principal Value
($) Veolia Environnement SA 6.75% 06/01/2038 6,000 7,341
228,075
Total Debt Instruments (Cost $331,906,910)
329,379,752
Government Issues - 57.6% Interest
Rate Maturity
Date Principal Value
($) Agency - 3.7% Federal Farm Credit Bank 4.88% 01/17/2017 USD 564,000 586,941 Federal Farm Credit Bank 5.15% 11/15/2019 7,000 7,832 Federal Home Loan Banks 0.88% 05/24/2017 500,000 498,771 Federal Home Loan Banks 0.63% 05/30/2017 1,000,000 993,969 Federal Home Loan Banks 5.25% 06/05/2017 59,000 62,458 Federal Home Loan Banks 0.75% 09/08/2017 300,000 298,006 Federal Home Loan Banks 4.88% 09/08/2017 50,000 53,079 Federal Home Loan Banks 5.00% 11/17/2017 300,000 321,433 Federal Home Loan Banks 1.00% 12/19/2017 1,000,000 997,462 Federal Home Loan Banks 1.38% 03/09/2018 350,000 350,563 Federal Home Loan Banks 5.38% 08/15/2018 50,000 55,069 Federal Home Loan Banks 5.38% 05/15/2019 59,000 65,743 Federal Home Loan Banks 5.13% 08/15/2019 9,000 10,114 Federal Home Loan Banks 4.13% 03/13/2020 250,000 271,145 Federal Home Loan Banks 4.63% 09/11/2020 6,000 6,678 Federal Home Loan Banks 5.25% 12/11/2020 12,000 13,754 Federal Home Loan Banks 3.63% 03/12/2021 150,000 160,833 Federal Home Loan Banks 5.63% 06/11/2021 16,000 18,812 Federal Home Loan Banks 5.38% 09/30/2022 10,000 11,891 Federal Home Loan Banks 5.25% 12/09/2022 10,000 11,849 Federal Home Loan Banks 5.38% 08/15/2024 11,000 13,449 Federal Home Loan Banks 5.75% 06/12/2026 6,000 7,711 Federal Home Loan Banks 5.63% 03/14/2036 5,000 6,573 Federal Home Loan Banks 5.50% 07/15/2036 530,000 692,355 Federal Home Loan Mortgage Corp. 0.50% 01/27/2017 1,000,000 995,453 Federal Home Loan Mortgage Corp. 5.00% 02/16/2017 42,000 43,875 Federal Home Loan Mortgage Corp. 0.88% 02/22/2017 1,000,000 998,873 Federal Home Loan Mortgage Corp. 1.00% 03/08/2017 750,000 750,160 Federal Home Loan Mortgage Corp. 5.00% 04/18/2017 32,000 33,625

State Street Bank and Trust Company
State Street U.S. Government/Credit Bond Index Non-Lending Series Fund
Schedule of Investments (showing percentage of total value of investments)
December 31, 2015
The accompanying notes are an integral part
of these financial statements. 98
Government Issues - 57.6% Interest
Rate Maturity
Date Principal Value
($) Federal Home Loan Mortgage Corp. 1.00% 06/29/2017 250,000 249,653 Federal Home Loan Mortgage Corp. 5.50% 08/23/2017 58,000 62,162 Federal Home Loan Mortgage Corp. 1.00% 09/29/2017 250,000 249,547 Federal Home Loan Mortgage Corp. 0.75% 01/12/2018 1,500,000 1,487,467 Federal Home Loan Mortgage Corp. 0.88% 03/07/2018 350,000 347,536 Federal Home Loan Mortgage Corp. 3.75% 03/27/2019 338,000 361,866 Federal Home Loan Mortgage Corp. 1.75% 05/30/2019 1,000,000 1,007,128 Federal Home Loan Mortgage Corp. 2.00% 07/30/2019 250,000 252,931 Federal Home Loan Mortgage Corp. 1.25% 08/01/2019 500,000 493,985 Federal Home Loan Mortgage Corp. 1.25% 10/02/2019 250,000 246,510 Federal Home Loan Mortgage Corp.3 0.00% 11/29/2019 6,000 5,510 Federal Home Loan Mortgage Corp. 1.38% 05/01/2020 250,000 246,544 Federal Home Loan Mortgage Corp. 2.38% 01/13/2022 1,600,000 1,622,210 Federal Home Loan Mortgage Corp.3 0.00% 12/11/2025 18,000 13,412 Federal Home Loan Mortgage Corp. 6.75% 09/15/2029 272,000 388,927 Federal Home Loan Mortgage Corp. 6.75% 03/15/2031 60,000 86,082 Federal Home Loan Mortgage Corp. 6.25% 07/15/2032 250,000 347,589
Federal National Mortgage Association
1.25%
01/30/2017
1,000,000
1,003,370
Federal National Mortgage Association
5.00%
02/13/2017
104,000
108,611
Federal National Mortgage Association
1.13%
04/27/2017
750,000
750,916
Federal National Mortgage Association
5.00%
05/11/2017
426,000
448,579
Federal National Mortgage Association3
0.00%
06/01/2017
78,000
76,914
Federal National Mortgage Association
5.38%
06/12/2017
304,000
322,589
Federal National Mortgage Association
0.88%
08/28/2017
200,000
199,356
Federal National Mortgage Association
0.88%
10/26/2017
1,550,000
1,543,227
Federal National Mortgage Association
0.90%
11/07/2017
150,000
149,166
Federal National Mortgage Association
1.00%
11/15/2017
250,000
249,333
Federal National Mortgage Association
0.88%
12/20/2017
250,000
248,666

State Street Bank and Trust Company
State Street U.S. Government/Credit Bond Index Non-Lending Series Fund
Schedule of Investments (showing percentage of total value of investments)
December 31, 2015
The accompanying notes are an integral part
of these financial statements. 99
Government Issues - 57.6% Interest
Rate Maturity
Date Principal Value
($)
Federal National Mortgage Association
0.88%
02/08/2018
500,000
496,748
Federal National Mortgage Association
0.88%
05/21/2018
500,000
495,556
Federal National Mortgage Association
1.63%
11/27/2018
1,000,000
1,006,974
Federal National Mortgage Association
1.75%
01/30/2019
250,000
251,575
Federal National Mortgage Association3
0.00%
10/09/2019
65,000
60,142
Federal National Mortgage Association
1.50%
10/09/2019
100,000
99,069
Federal National Mortgage Association
1.75%
03/06/2020
500,000
499,037
Federal National Mortgage Association
1.50%
06/22/2020
500,000
493,859
Federal National Mortgage Association
5.45%
10/18/2021
10,000
10,351
Federal National Mortgage Association
2.63%
09/06/2024
750,000
759,232
Federal National Mortgage Association
6.16%
08/07/2028
9,000
11,935
Federal National Mortgage Association
6.25%
05/15/2029
298,000
405,003
Federal National Mortgage Association
7.13%
01/15/2030
209,000
305,507
Federal National Mortgage Association
7.25%
05/15/2030
73,000
108,183
Federal National Mortgage Association
6.63%
11/15/2030
439,000
622,565
Federal National Mortgage Association
6.00%
04/18/2036
30,000
30,457
Federal National Mortgage Association
5.63%
07/15/2037
20,000
26,343
Federal National Mortgage Association
6.21%
08/06/2038
9,000
12,675
Financing Corp. 10.70% 10/06/2017 15,000 17,426 Financing Corp. 9.80% 11/30/2017 26,000 30,158 Financing Corp. 9.40% 02/08/2018 25,000 29,148 Financing Corp. 9.80% 04/06/2018 4,000 4,745 Financing Corp. 10.35% 08/03/2018 7,000 8,570

State Street Bank and Trust Company
State Street U.S. Government/Credit Bond Index Non-Lending Series Fund
Schedule of Investments (showing percentage of total value of investments)
December 31, 2015
The accompanying notes are an integral part
of these financial statements. 100
Government Issues - 57.6% Interest
Rate Maturity
Date Principal Value
($) Financing Corp. 9.65% 11/02/2018 48,000 58,767 Financing Corp. 9.70% 04/05/2019 25,000 31,332 Financing Corp. 8.60% 09/26/2019 5,000 6,228 Israel Government AID Bond 5.50% 09/18/2023 35,000 42,239 Israel Government AID Bond 5.50% 12/04/2023 20,000 24,189 Israel Government AID Bond 5.50% 04/26/2024 69,000 83,661 Israel Government AID Bond 5.50% 09/18/2033 11,000 14,229 Private Export Funding Corp. 1.38% 02/15/2017 250,000 250,360 Private Export Funding Corp. 4.30% 12/15/2021 50,000 55,214 Private Export Funding Corp. 2.45% 07/15/2024 250,000 243,503 Tennessee Valley Authority 5.50% 07/18/2017 250,000 266,879 Tennessee Valley Authority 6.25% 12/15/2017 22,000 24,115 Tennessee Valley Authority 4.50% 04/01/2018 28,000 29,984 Tennessee Valley Authority 1.75% 10/15/2018 300,000 302,401 Tennessee Valley Authority 2.88% 09/15/2024 350,000 352,169 Tennessee Valley Authority 6.75% 11/01/2025 26,000 34,035 Tennessee Valley Authority 7.13% 05/01/2030 24,000 33,738 Tennessee Valley Authority 4.70% 07/15/2033 4,000 4,585 Tennessee Valley Authority 4.65% 06/15/2035 167,000 185,337 Tennessee Valley Authority 5.88% 04/01/2036 36,000 46,547 Tennessee Valley Authority 6.15% 01/15/2038 20,000 26,558 Tennessee Valley Authority 5.50% 06/15/2038 9,000 11,111 Tennessee Valley Authority 4.88% 01/15/2048 12,000 13,276 Tennessee Valley Authority 5.38% 04/01/2056 120,000 144,232 Tennessee Valley Authority 4.63% 09/15/2060 150,000 157,689 Ukraine Government AID Bonds 1.84% 05/16/2019 500,000 501,557
29,637,455
Sovereign - 2.2% Brazil Government Bond 8.88% 04/15/2024 USD 13,000 14,255 Brazil Government Bond2 8.75% 02/04/2025 36,000 39,600 Brazil Government Bond 10.13% 05/15/2027 115,000 136,850 Brazil Government Bond 12.25% 03/06/2030 11,000 15,276 Canada Government Bond 0.88% 02/14/2017 150,000 149,657 Canada Government Bond 1.13% 03/19/2018 300,000 299,221 Canada Government Bond 1.63% 02/27/2019 250,000 250,957 Chile Government Bond 3.25% 09/14/2021 150,000 155,451 Chile Government Bond 2.25% 10/30/2022 150,000 144,849

State Street Bank and Trust Company
State Street U.S. Government/Credit Bond Index Non-Lending Series Fund
Schedule of Investments (showing percentage of total value of investments)
December 31, 2015
The accompanying notes are an integral part
of these financial statements. 101
Government Issues - 57.6% Interest
Rate Maturity
Date Principal Value
($) Colombia Government Bond 7.38% 01/27/2017 250,000 262,802 Colombia Government Bond 7.38% 03/18/2019 100,000 112,386 Colombia Government Bond 4.38% 07/12/2021 350,000 352,637 Colombia Government Bond 7.38% 09/18/2037 150,000 166,069 Colombia Government Bond 6.13% 01/18/2041 150,000 146,155 Colombia Government Bond 5.63% 02/26/2044 200,000 183,271 Colombia Government Bond 5.00% 06/15/2045 250,000 210,500 Development Bank of Japan 5.13% 02/01/2017 28,000 29,096 Export Development Canada 0.88% 01/30/2017 150,000 149,724 Export Development Canada 1.00% 05/15/2017 150,000 149,705 Export-Import Bank of Korea 2.88% 09/17/2018 200,000 203,682 Export-Import Bank of Korea 2.38% 08/12/2019 200,000 200,051 Export-Import Bank of Korea 4.00% 01/29/2021 150,000 160,168 Finland Government Bond 6.95% 02/15/2026 2,000 2,665 Israel Government Bond 5.13% 03/26/2019 120,000 132,150 Israel Government Bond 3.15% 06/30/2023 200,000 202,500 Italy Government Bond 5.38% 06/12/2017 189,000 195,406 Italy Government Bond 6.88% 09/27/2023 167,000 206,294 Italy Government Bond 5.38% 06/15/2033 184,000 210,114
Japan Bank for International Cooperation
1.13%
07/19/2017
250,000
248,582
Japan Bank for International Cooperation
1.75%
11/13/2018
350,000
348,937
Japan Bank for International Cooperation
1.75%
05/29/2019
250,000
247,837
Japan Finance Organization for Municipalities
5.00%
05/16/2017
31,000
32,473
Japan Finance Organization for Municipalities
4.00%
01/13/2021
100,000
107,684
Korea Government Bond 5.63% 11/03/2025 5,000 6,146 Mexico Government Bond 5.63% 01/15/2017 300,000 312,383 Mexico Government Bond 5.13% 01/15/2020 300,000 327,411 Mexico Government Bond 3.63% 03/15/2022 550,000 553,305 Mexico Government Bond 3.60% 01/30/2025 350,000 341,879 Mexico Government Bond 6.75% 09/27/2034 200,000 240,316 Mexico Government Bond 6.05% 01/11/2040 286,000 314,123 Mexico Government Bond 4.75% 03/08/2044 468,000 428,599 Mexico Government Bond 4.60% 01/23/2046 200,000 178,510 Panama Government Bond 7.13% 01/29/2026 50,000 62,543

State Street Bank and Trust Company
State Street U.S. Government/Credit Bond Index Non-Lending Series Fund
Schedule of Investments (showing percentage of total value of investments)
December 31, 2015
The accompanying notes are an integral part
of these financial statements. 102
Government Issues - 57.6% Interest
Rate Maturity
Date Principal Value
($) Panama Government Bond 8.88% 09/30/2027 250,000 345,625 Panama Government Bond 6.70% 01/26/2036 250,000 300,948 Peru Government Bond 7.13% 03/30/2019 210,000 239,391 Peru Government Bond 7.35% 07/21/2025 43,000 54,089 Peru Government Bond 8.75% 11/21/2033 118,000 165,697 Peru Government Bond 6.55% 03/14/2037 28,000 32,533 Peru Government Bond 5.63% 11/18/2050 250,000 256,779 Philippine Government Bond 4.20% 01/21/2024 500,000 542,500 Philippine Government Bond 5.50% 03/30/2026 350,000 416,063 Philippine Government Bond 7.75% 01/14/2031 350,000 492,625 Philippine Government Bond 5.00% 01/13/2037 350,000 409,063 Poland Government Bond 6.38% 07/15/2019 251,000 286,768 Poland Government Bond 5.13% 04/21/2021 300,000 333,600 Poland Government Bond 5.00% 03/23/2022 150,000 166,350 Poland Government Bond 4.00% 01/22/2024 150,000 157,725 South Africa Government Bond 6.88% 05/27/2019 32,000 34,326 South Africa Government Bond 5.50% 03/09/2020 300,000 307,125 South Africa Government Bond 5.88% 05/30/2022 19,000 19,784 South Africa Government Bond 5.88% 09/16/2025 200,000 204,500 South Africa Government Bond 5.38% 07/24/2044 250,000 223,125 South Korea Government Bond 7.13% 04/16/2019 180,000 208,881 Svensk Exportkredit AB 5.13% 03/01/2017 25,000 26,137 Svensk Exportkredit AB 1.13% 04/05/2018 250,000 248,073 Svensk Exportkredit AB3 0.00% 05/11/2037 6,000 2,770 Turkey Government Bond 5.63% 03/30/2021 750,000 794,063 Turkey Government Bond 4.00% 10/02/2023 150,000 152,136 Turkey Government Bond 5.75% 03/22/2024 250,000 263,698 Turkey Government Bond 7.38% 02/05/2025 500,000 584,400 Turkey Government Bond 4.25% 04/14/2026 350,000 328,563 Turkey Government Bond 6.88% 03/17/2036 500,000 561,250 Turkey Government Bond 6.00% 01/14/2041 500,000 512,000 Turkey Government Bond 6.63% 02/17/2045 200,000 225,234 United Mexican States 3.50% 01/21/2021 300,000 305,141 Uruguay Government Bond2 4.38% 10/27/2027 50,000 49,375 Uruguay Government Bond 7.63% 03/21/2036 200,000 247,500 Uruguay Government Bond 5.10% 06/18/2050 250,000 216,875
17,946,931

State Street Bank and Trust Company
State Street U.S. Government/Credit Bond Index Non-Lending Series Fund
Schedule of Investments (showing percentage of total value of investments)
December 31, 2015
The accompanying notes are an integral part
of these financial statements. 103
Government Issues - 57.6% Interest
Rate Maturity
Date Principal Value
($) Treasury Bond - 7.6% United States Treasury Bond 6.00% 02/15/2026 USD 463,000 618,110 United States Treasury Bond 6.75% 08/15/2026 123,000 174,284 United States Treasury Bond 6.50% 11/15/2026 114,000 159,497 United States Treasury Bond 6.63% 02/15/2027 127,000 180,101 United States Treasury Bond 6.38% 08/15/2027 54,000 75,866 United States Treasury Bond 6.13% 11/15/2027 495,000 685,303 United States Treasury Bond 5.50% 08/15/2028 112,000 149,037 United States Treasury Bond 5.25% 11/15/2028 379,000 495,122 United States Treasury Bond 5.25% 02/15/2029 354,000 463,836 United States Treasury Bond 6.13% 08/15/2029 122,000 173,170 United States Treasury Bond 6.25% 05/15/2030 258,000 374,170 United States Treasury Bond 5.38% 02/15/2031 300,000 406,845 United States Treasury Bond 4.50% 02/15/2036 700,000 897,393 United States Treasury Bond 4.75% 02/15/2037 200,000 265,114 United States Treasury Bond 5.00% 05/15/2037 250,000 342,653 United States Treasury Bond 4.38% 02/15/2038 687,000 867,145 United States Treasury Bond 4.50% 05/15/2038 393,000 504,698 United States Treasury Bond 3.50% 02/15/2039 924,000 1,022,147 United States Treasury Bond 4.25% 05/15/2039 1,077,000 1,330,666 United States Treasury Bond 4.50% 08/15/2039 575,000 736,017 United States Treasury Bond 4.38% 11/15/2039 875,000 1,100,645 United States Treasury Bond 4.63% 02/15/2040 1,600,000 2,084,256 United States Treasury Bond 4.38% 05/15/2040 1,450,000 1,825,144 United States Treasury Bond 3.88% 08/15/2040 1,650,000 1,929,543 United States Treasury Bond 4.25% 11/15/2040 1,600,000 1,978,928 United States Treasury Bond 4.75% 02/15/2041 950,000 1,263,680 United States Treasury Bond 4.38% 05/15/2041 1,500,000 1,894,080 United States Treasury Bond 3.75% 08/15/2041 850,000 977,024 United States Treasury Bond 3.13% 11/15/2041 1,400,000 1,447,278 United States Treasury Bond 3.13% 02/15/2042 800,000 826,560 United States Treasury Bond 3.00% 05/15/2042 1,950,000 1,962,967 United States Treasury Bond 2.75% 08/15/2042 3,300,000 3,156,054 United States Treasury Bond 2.75% 11/15/2042 3,300,000 3,148,398 United States Treasury Bond 3.13% 02/15/2043 2,850,000 2,922,704 United States Treasury Bond 2.88% 05/15/2043 5,650,000 5,512,366 United States Treasury Bond 3.63% 08/15/2043 800,000 901,576 United States Treasury Bond 3.75% 11/15/2043 1,000,000 1,152,500

State Street Bank and Trust Company
State Street U.S. Government/Credit Bond Index Non-Lending Series Fund
Schedule of Investments (showing percentage of total value of investments)
December 31, 2015
The accompanying notes are an integral part
of these financial statements. 104
Government Issues - 57.6% Interest
Rate Maturity
Date Principal Value
($) United States Treasury Bond 3.63% 02/15/2044 2,250,000 2,532,150 United States Treasury Bond 3.38% 05/15/2044 2,500,000 2,684,475 United States Treasury Bond 3.13% 08/15/2044 3,250,000 3,323,808 United States Treasury Bond 3.00% 11/15/2044 2,250,000 2,243,003 United States Treasury Bond 2.50% 02/15/2045 3,250,000 2,918,013 United States Treasury Bond 3.00% 05/15/2045 1,000,000 995,890 United States Treasury Bond 2.88% 08/15/2045 1,000,000 971,720 United States Treasury Bond 3.00% 11/15/2045 2,000,000 1,992,031
61,665,967
Treasury Note - 44.1% United States Treasury Note 0.75% 01/15/2017 USD 2,000,000 1,999,200 United States Treasury Note 0.50% 01/31/2017 2,500,000 2,491,575 United States Treasury Note 0.88% 01/31/2017 2,000,000 2,001,080 United States Treasury Note 3.13% 01/31/2017 1,000,000 1,024,400 United States Treasury Note 0.63% 02/15/2017 2,500,000 2,494,375 United States Treasury Note 4.63% 02/15/2017 348,000 362,390 United States Treasury Note 0.88% 02/28/2017 2,650,000 2,651,113 United States Treasury Note 3.00% 02/28/2017 500,000 512,265 United States Treasury Note 0.75% 03/15/2017 1,750,000 1,747,917 United States Treasury Note 0.50% 03/31/2017 1,500,000 1,493,490 United States Treasury Note 1.00% 03/31/2017 1,500,000 1,502,610 United States Treasury Note 3.25% 03/31/2017 2,500,000 2,572,525 United States Treasury Note 0.88% 04/15/2017 2,000,000 1,999,760 United States Treasury Note 0.50% 04/30/2017 2,000,000 1,989,600 United States Treasury Note 0.88% 04/30/2017 1,250,000 1,249,663 United States Treasury Note 3.13% 04/30/2017 1,500,000 1,543,470 United States Treasury Note 0.88% 05/15/2017 1,500,000 1,499,010 United States Treasury Note 4.50% 05/15/2017 135,000 141,522 United States Treasury Note 8.75% 05/15/2017 184,000 203,511 United States Treasury Note 0.63% 05/31/2017 2,000,000 1,991,340 United States Treasury Note 2.75% 05/31/2017 850,000 871,718 United States Treasury Note 0.88% 06/15/2017 2,000,000 1,998,140 United States Treasury Note 0.63% 06/30/2017 2,000,000 1,990,100 United States Treasury Note 0.75% 06/30/2017 1,500,000 1,495,380 United States Treasury Note 2.50% 06/30/2017 1,250,000 1,278,037 United States Treasury Note 0.88% 07/15/2017 4,000,000 3,993,320 United States Treasury Note 0.50% 07/31/2017 3,250,000 3,225,657

State Street Bank and Trust Company
State Street U.S. Government/Credit Bond Index Non-Lending Series Fund
Schedule of Investments (showing percentage of total value of investments)
December 31, 2015
The accompanying notes are an integral part
of these financial statements. 105
Government Issues - 57.6% Interest
Rate Maturity
Date Principal Value
($) United States Treasury Note 0.63% 07/31/2017 1,500,000 1,491,735 United States Treasury Note 2.38% 07/31/2017 1,250,000 1,276,588 United States Treasury Note 4.75% 08/15/2017 248,000 262,969 United States Treasury Note 8.88% 08/15/2017 146,000 164,460 United States Treasury Note 0.63% 08/31/2017 3,500,000 3,477,915 United States Treasury Note 1.88% 08/31/2017 500,000 506,965 United States Treasury Note 1.00% 09/15/2017 4,000,000 3,998,040 United States Treasury Note 0.63% 09/30/2017 2,900,000 2,880,135 United States Treasury Note 1.88% 09/30/2017 500,000 507,045 United States Treasury Note 0.88% 10/15/2017 2,000,000 1,993,980 United States Treasury Note 0.75% 10/31/2017 1,000,000 994,660 United States Treasury Note 1.88% 10/31/2017 425,000 431,188 United States Treasury Note 4.25% 11/15/2017 314,000 332,520 United States Treasury Note 0.63% 11/30/2017 1,500,000 1,487,685 United States Treasury Note 2.25% 11/30/2017 1,900,000 1,942,351 United States Treasury Note 0.75% 12/31/2017 11,750,000 11,671,040 United States Treasury Note 2.75% 12/31/2017 500,000 516,140 United States Treasury Note 0.88% 01/15/2018 2,000,000 1,991,060 United States Treasury Note 0.88% 01/31/2018 1,000,000 995,140 United States Treasury Note 2.63% 01/31/2018 1,000,000 1,031,190 United States Treasury Note 1.00% 02/15/2018 1,000,000 997,070 United States Treasury Note 3.50% 02/15/2018 1,484,000 1,558,319 United States Treasury Note 0.75% 02/28/2018 1,500,000 1,487,295 United States Treasury Note 2.75% 02/28/2018 1,000,000 1,034,600 United States Treasury Note 1.00% 03/15/2018 4,250,000 4,236,145 United States Treasury Note 2.88% 03/31/2018 7,500,000 7,787,025 United States Treasury Note 0.75% 04/15/2018 1,000,000 990,310 United States Treasury Note 0.63% 04/30/2018 3,000,000 2,961,480 United States Treasury Note 3.88% 05/15/2018 10,418,000 11,087,878 United States Treasury Note 9.13% 05/15/2018 119,000 141,183 United States Treasury Note 1.00% 05/31/2018 1,000,000 995,030 United States Treasury Note 2.38% 05/31/2018 250,000 257,085 United States Treasury Note 1.13% 06/15/2018 2,000,000 1,995,703 United States Treasury Note 2.38% 06/30/2018 1,000,000 1,029,560 United States Treasury Note 0.88% 07/15/2018 1,500,000 1,486,665 United States Treasury Note 1.38% 07/31/2018 2,000,000 2,007,860 United States Treasury Note 2.25% 07/31/2018 1,250,000 1,282,900 United States Treasury Note 4.00% 08/15/2018 421,000 451,918

State Street Bank and Trust Company
State Street U.S. Government/Credit Bond Index Non-Lending Series Fund
Schedule of Investments (showing percentage of total value of investments)
December 31, 2015
The accompanying notes are an integral part
of these financial statements. 106
Government Issues - 57.6% Interest
Rate Maturity
Date Principal Value
($) United States Treasury Note 1.50% 08/31/2018 500,000 503,345 United States Treasury Note 1.00% 09/15/2018 1,000,000 992,920 United States Treasury Note 1.38% 09/30/2018 1,000,000 1,003,140 United States Treasury Note 0.88% 10/15/2018 1,500,000 1,483,560 United States Treasury Note 1.25% 10/31/2018 2,000,000 1,997,420 United States Treasury Note 1.75% 10/31/2018 1,000,000 1,013,020 United States Treasury Note 3.75% 11/15/2018 1,355,000 1,450,338 United States Treasury Note 9.00% 11/15/2018 71,000 86,417 United States Treasury Note 1.25% 11/30/2018 1,000,000 998,440 United States Treasury Note 1.38% 11/30/2018 1,250,000 1,252,750 United States Treasury Note 1.38% 12/31/2018 1,500,000 1,501,305 United States Treasury Note 1.50% 12/31/2018 3,000,000 3,013,740 United States Treasury Note 1.25% 01/31/2019 1,500,000 1,495,170 United States Treasury Note 1.50% 01/31/2019 1,000,000 1,003,570 United States Treasury Note 2.75% 02/15/2019 1,955,000 2,037,736 United States Treasury Note 8.88% 02/15/2019 193,000 237,421 United States Treasury Note 1.38% 02/28/2019 500,000 499,685 United States Treasury Note 1.50% 02/28/2019 1,850,000 1,856,012 United States Treasury Note 1.50% 03/31/2019 750,000 752,348 United States Treasury Note 1.63% 03/31/2019 750,000 754,860 United States Treasury Note 1.63% 04/30/2019 4,000,000 4,023,680 United States Treasury Note 3.13% 05/15/2019 1,004,000 1,059,330 United States Treasury Note 1.13% 05/31/2019 500,000 494,450 United States Treasury Note 1.50% 05/31/2019 3,000,000 3,003,180 United States Treasury Note 1.00% 06/30/2019 250,000 245,875 United States Treasury Note 1.63% 06/30/2019 3,000,000 3,013,830 United States Treasury Note 1.63% 07/31/2019 1,000,000 1,003,600 United States Treasury Note 3.63% 08/15/2019 1,650,000 1,771,424 United States Treasury Note 8.13% 08/15/2019 236,000 290,877 United States Treasury Note 1.00% 08/31/2019 250,000 245,075 United States Treasury Note 1.63% 08/31/2019 3,500,000 3,510,745 United States Treasury Note 1.00% 09/30/2019 1,300,000 1,273,025 United States Treasury Note 1.75% 09/30/2019 2,000,000 2,013,860 United States Treasury Note 1.25% 10/31/2019 500,000 494,215 United States Treasury Note 1.50% 10/31/2019 1,000,000 997,070 United States Treasury Note 3.38% 11/15/2019 3,050,000 3,257,949 United States Treasury Note 1.00% 11/30/2019 2,500,000 2,444,000 United States Treasury Note 1.50% 11/30/2019 5,000,000 4,981,450
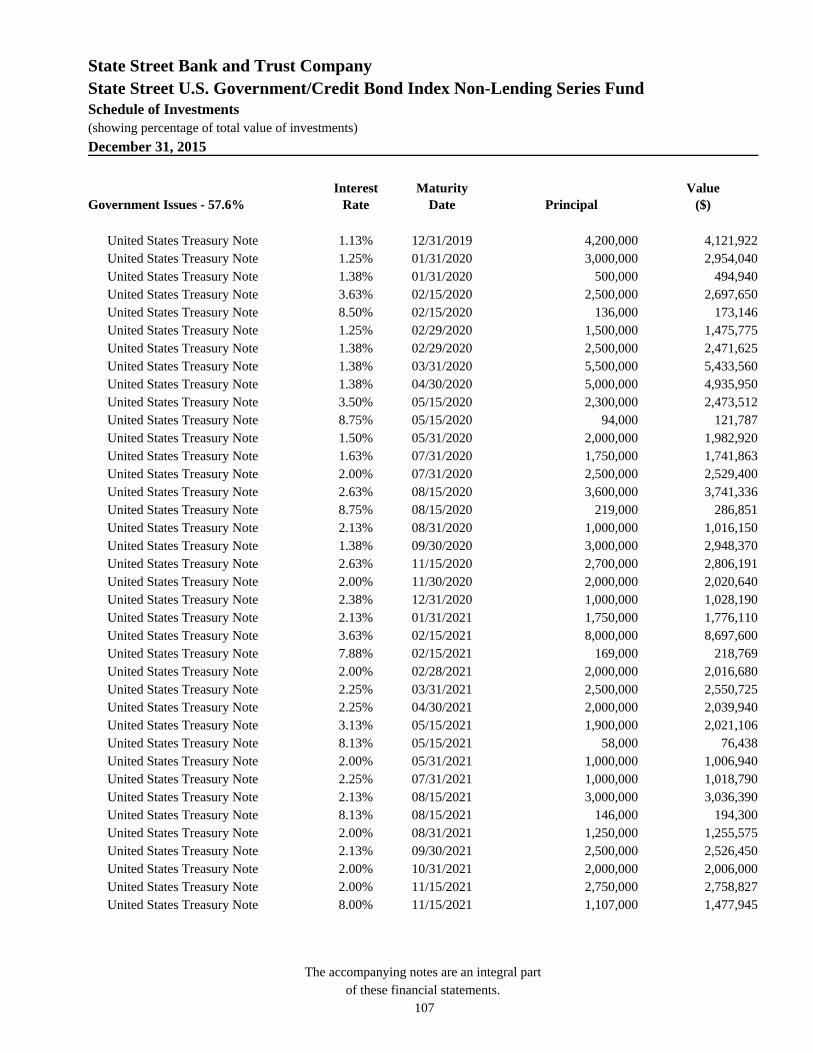
State Street Bank and Trust Company
State Street U.S. Government/Credit Bond Index Non-Lending Series Fund
Schedule of Investments (showing percentage of total value of investments)
December 31, 2015
The accompanying notes are an integral part
of these financial statements. 107
Government Issues - 57.6% Interest
Rate Maturity
Date Principal Value
($) United States Treasury Note 1.13% 12/31/2019 4,200,000 4,121,922 United States Treasury Note 1.25% 01/31/2020 3,000,000 2,954,040 United States Treasury Note 1.38% 01/31/2020 500,000 494,940 United States Treasury Note 3.63% 02/15/2020 2,500,000 2,697,650 United States Treasury Note 8.50% 02/15/2020 136,000 173,146 United States Treasury Note 1.25% 02/29/2020 1,500,000 1,475,775 United States Treasury Note 1.38% 02/29/2020 2,500,000 2,471,625 United States Treasury Note 1.38% 03/31/2020 5,500,000 5,433,560 United States Treasury Note 1.38% 04/30/2020 5,000,000 4,935,950 United States Treasury Note 3.50% 05/15/2020 2,300,000 2,473,512 United States Treasury Note 8.75% 05/15/2020 94,000 121,787 United States Treasury Note 1.50% 05/31/2020 2,000,000 1,982,920 United States Treasury Note 1.63% 07/31/2020 1,750,000 1,741,863 United States Treasury Note 2.00% 07/31/2020 2,500,000 2,529,400 United States Treasury Note 2.63% 08/15/2020 3,600,000 3,741,336 United States Treasury Note 8.75% 08/15/2020 219,000 286,851 United States Treasury Note 2.13% 08/31/2020 1,000,000 1,016,150 United States Treasury Note 1.38% 09/30/2020 3,000,000 2,948,370 United States Treasury Note 2.63% 11/15/2020 2,700,000 2,806,191 United States Treasury Note 2.00% 11/30/2020 2,000,000 2,020,640 United States Treasury Note 2.38% 12/31/2020 1,000,000 1,028,190 United States Treasury Note 2.13% 01/31/2021 1,750,000 1,776,110 United States Treasury Note 3.63% 02/15/2021 8,000,000 8,697,600 United States Treasury Note 7.88% 02/15/2021 169,000 218,769 United States Treasury Note 2.00% 02/28/2021 2,000,000 2,016,680 United States Treasury Note 2.25% 03/31/2021 2,500,000 2,550,725 United States Treasury Note 2.25% 04/30/2021 2,000,000 2,039,940 United States Treasury Note 3.13% 05/15/2021 1,900,000 2,021,106 United States Treasury Note 8.13% 05/15/2021 58,000 76,438 United States Treasury Note 2.00% 05/31/2021 1,000,000 1,006,940 United States Treasury Note 2.25% 07/31/2021 1,000,000 1,018,790 United States Treasury Note 2.13% 08/15/2021 3,000,000 3,036,390 United States Treasury Note 8.13% 08/15/2021 146,000 194,300 United States Treasury Note 2.00% 08/31/2021 1,250,000 1,255,575 United States Treasury Note 2.13% 09/30/2021 2,500,000 2,526,450 United States Treasury Note 2.00% 10/31/2021 2,000,000 2,006,000 United States Treasury Note 2.00% 11/15/2021 2,750,000 2,758,827 United States Treasury Note 8.00% 11/15/2021 1,107,000 1,477,945
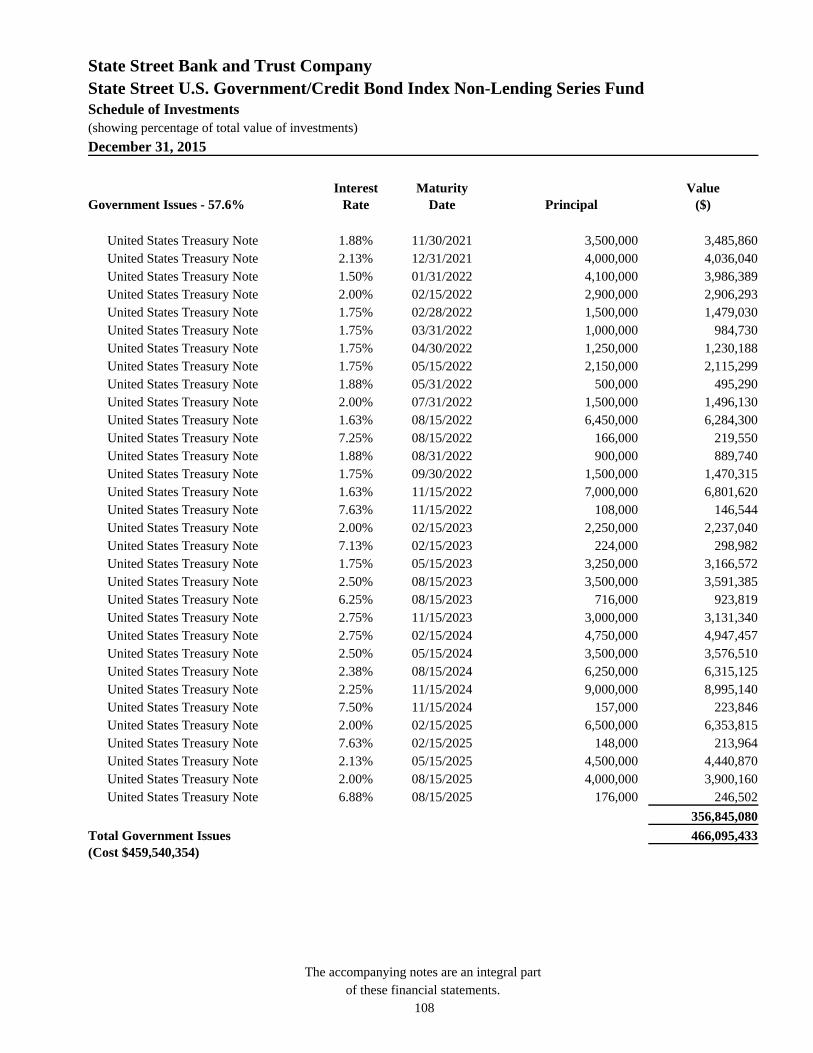
State Street Bank and Trust Company
State Street U.S. Government/Credit Bond Index Non-Lending Series Fund
Schedule of Investments (showing percentage of total value of investments)
December 31, 2015
The accompanying notes are an integral part
of these financial statements. 108
Government Issues - 57.6% Interest
Rate Maturity
Date Principal Value
($) United States Treasury Note 1.88% 11/30/2021 3,500,000 3,485,860 United States Treasury Note 2.13% 12/31/2021 4,000,000 4,036,040 United States Treasury Note 1.50% 01/31/2022 4,100,000 3,986,389 United States Treasury Note 2.00% 02/15/2022 2,900,000 2,906,293 United States Treasury Note 1.75% 02/28/2022 1,500,000 1,479,030 United States Treasury Note 1.75% 03/31/2022 1,000,000 984,730 United States Treasury Note 1.75% 04/30/2022 1,250,000 1,230,188 United States Treasury Note 1.75% 05/15/2022 2,150,000 2,115,299 United States Treasury Note 1.88% 05/31/2022 500,000 495,290 United States Treasury Note 2.00% 07/31/2022 1,500,000 1,496,130 United States Treasury Note 1.63% 08/15/2022 6,450,000 6,284,300 United States Treasury Note 7.25% 08/15/2022 166,000 219,550 United States Treasury Note 1.88% 08/31/2022 900,000 889,740 United States Treasury Note 1.75% 09/30/2022 1,500,000 1,470,315 United States Treasury Note 1.63% 11/15/2022 7,000,000 6,801,620 United States Treasury Note 7.63% 11/15/2022 108,000 146,544 United States Treasury Note 2.00% 02/15/2023 2,250,000 2,237,040 United States Treasury Note 7.13% 02/15/2023 224,000 298,982 United States Treasury Note 1.75% 05/15/2023 3,250,000 3,166,572 United States Treasury Note 2.50% 08/15/2023 3,500,000 3,591,385 United States Treasury Note 6.25% 08/15/2023 716,000 923,819 United States Treasury Note 2.75% 11/15/2023 3,000,000 3,131,340 United States Treasury Note 2.75% 02/15/2024 4,750,000 4,947,457 United States Treasury Note 2.50% 05/15/2024 3,500,000 3,576,510 United States Treasury Note 2.38% 08/15/2024 6,250,000 6,315,125 United States Treasury Note 2.25% 11/15/2024 9,000,000 8,995,140 United States Treasury Note 7.50% 11/15/2024 157,000 223,846 United States Treasury Note 2.00% 02/15/2025 6,500,000 6,353,815 United States Treasury Note 7.63% 02/15/2025 148,000 213,964 United States Treasury Note 2.13% 05/15/2025 4,500,000 4,440,870 United States Treasury Note 2.00% 08/15/2025 4,000,000 3,900,160 United States Treasury Note 6.88% 08/15/2025 176,000 246,502
356,845,080
Total Government Issues (Cost $459,540,354)
466,095,433

State Street Bank and Trust Company
State Street U.S. Government/Credit Bond Index Non-Lending Series Fund
Schedule of Investments (showing percentage of total value of investments)
December 31, 2015
The accompanying notes are an integral part
of these financial statements. 109
State Street Bank and Trust Company Collective Investment Funds - 1.7% Units Value
($)
State Street Short Term Investment Fund4 14,127,165 14,127,165
Total State Street Bank and Trust Company Collective Investment Funds (Cost $14,127,165)
14,127,165
TOTAL INVESTMENTS - 100.0% (Cost $805,574,429)
809,602,350
1 Variable rate security. 2 Valued by Trustee. 3 Denotes a zero coupon bond. 4 Collective investment fund advised by State Street Global Advisors. USD : United States Dollar

State Street Bank and Trust Company
State Street U.S. Government/Credit Bond Index Non-Lending Series Fund
Notes to Financial Statements December 31, 2015
110
1. Fund Organization and Investment Objective Effective January 1, 2016, State Street Bank and Trust Company ("State Street Bank") SSgA U.S. Government/Credit Bond Index Non-Lending Series Fund changed its name to State Street Bank and Trust Company State Street U.S. Government/Credit Bond Index Non-Lending Series Fund (the "Fund"), pursuant to an amended Fund Declaration. The Fund was formed by State Street Bank under the State Street Bank and Trust Company Investment Funds for Tax Exempt Retirement Plans Declaration of Trust (the "Trust"). These financial statements refer to the Fund by its amended name. State Street Bank is Trustee, Custodian, and Recordkeeper of the Fund and, as Trustee, has exclusive management and control of the Trust. State Street Global Advisors ("SSGA"), a division of State Street Bank, is the Fund's Investment Manager. The Fund is operated pursuant to the provisions of the Trust and other governing documents, which are available from the Trustee. The investment objective of the Fund is to approximate as closely as practicable, before expenses, the performance of the Barclays U.S. Government/Credit Bond Index over the long term, while providing participants the ability to purchase and redeem units on an "as of" basis. The Trustee has the authority to establish unlimited classes of units of the Fund (each a "Class") and issue an unlimited number of units of any such Class of the Fund. The following Class(es) of units of the Fund have been established and are currently funded: Class A and Class C.
2. Summary of Significant Accounting Policies The financial statements are prepared in accordance with accounting principles generally accepted in the United States of America ("U.S. GAAP") which require the use of management estimates. Actual results could differ from those estimates. The Fund qualifies as an investment company under U.S. GAAP and follows the accounting and reporting guidance applicable to investment companies. The policies described below are followed consistently in the preparation of the financial statements. A. Valuation Governance and Oversight The Trustee and the Investment Manager assign valuation oversight responsibility to SSGA's regional valuation committees for the assigned products managed within each specific region. These regional valuation committees are generally comprised of senior officers from the compliance, credit, information technology, investment operations, legal, portfolio management, risk management, and trading areas. These committees, or employees tasked with assisting the committees, perform a variety of functions including, but not limited to:
Responding to circumstances that require fair valuation and determining the fair value of portfolio instruments for which market quotations are not readily available, including where available market quotations are deemed unreliable;
Determining appropriate pricing services and sources for various securities or instruments, including secondary and tertiary source options;
Recommending changes to approved pricing sources, and monitoring pricing services' overall performance, including evaluating the pricing methodologies these pricing services employ;
Escalating valuation challenges; Reviewing results of fair value determinations; and Maintaining valuation records.
The regional valuation committees inquire of members of the investment team for input on an as-needed basis. SSGA’s North America Valuation Committee is responsible for valuation oversight of the Fund. SSGA regularly performs various controls and procedures to assess the appropriateness of the valuation of portfolio investments and other financial instruments. These controls and procedures include, but are not limited to, reviewing for

State Street Bank and Trust Company
State Street U.S. Government/Credit Bond Index Non-Lending Series Fund
Notes to Financial Statements December 31, 2015
111
occurrences where market quotations are not readily available, validating stale priced holdings, comparing executed trades to vendor prices, analyzing vendor-to-vendor valuation comparisons and reviewing market data and news to identify potential fair valuation considerations. These procedures and the results of these controls are reviewed periodically by SSGA’s North America Valuation Committee. B. Security Valuation The investment valuation policy of the Fund is to value investments at fair value, which is generally defined as the price that could reasonably be expected to be realized from an orderly transaction to sell an asset or paid to transfer a liability between market participants. By its nature, a fair value price is a good faith estimate of the valuation in a current sale and may not reflect an actual market price. Investments and other portfolio instruments are generally valued using a market approach. In accordance with valuation policies and procedures approved by the Trustee, fixed income investments are valued on the basis of valuations furnished by independent pricing services. These services determine valuations for normal institutional-size trading units of such securities using valuation models or matrix pricing, which incorporates yield and/or price with respect to bonds that are considered comparable in characteristics such as rating, interest rate and maturity date and quotations from securities dealers to determine current value. If these valuations are not readily available or deemed unreliable, the fair value will be determined in good faith by the Trustee. To the extent the inputs are observable, timely and/or consistent with other valuation inputs, these investments are classified within Level 2 of the fair value hierarchy. The Fund may invest directly or indirectly in securities with contractual cash flows, such as mortgage and asset-backed securities, collateralized mortgage obligations and commercial mortgage backed securities. The value, liquidity and related income of these securities are sensitive to changes in economic conditions, including real estate values, changes in interest rates, delinquencies and/or defaults, and may be affected by shifts in the market's perception of the issuers, including the issuers' creditworthiness. Early repayment of principal on some mortgage-related securities may expose the Fund to a lower rate of return upon reinvestment of principal. Short-term investments (with a remaining maturity of 60 days or less at the time of purchase and not credit impaired), if any, are stated at amortized cost, which approximates fair value, and are classified within Level 2 of the fair value hierarchy. Investments in registered investment companies (other than those that are exchange traded) or collective investment funds, if any, are valued at their respective net asset value and are classified within Level 2 of the fair value hierarchy. In the event current market prices or quotations are not readily available or are deemed unreliable by the Trustee, such as the occurrence of a significant event, the fair value will be determined in good faith by the Trustee using alternative fair valuation methods. A "significant event" is an event that the Trustee believes, with a reasonably high degree of certainty, has caused the closing market prices of a Fund's portfolio securities to no longer reflect their value at the time of the Fund's net asset value calculation. The use of alternative valuation methods would generally result in the investments being classified within Level 2 or Level 3 of the fair value hierarchy.

State Street Bank and Trust Company
State Street U.S. Government/Credit Bond Index Non-Lending Series Fund
Notes to Financial Statements December 31, 2015
112
Fair Value Hierarchy The Fund values its assets and liabilities at fair value using a hierarchy that prioritizes the inputs to valuation techniques giving the highest priority to readily available unadjusted quoted prices in active markets for identical assets or liabilities (Level 1 measurements) and the lowest priority to unobservable inputs (Level 3 measurements) when market prices are not readily available or reliable. The three levels of the hierarchy are described below: Level 1 Unadjusted quoted prices in active markets for identical assets or liabilities. Level 2
Prices determined using other significant observable inputs. Observable inputs are inputs that other market participants would use in valuing a portfolio instrument. These may include quoted prices for similar investments, interest rates, foreign exchange rates, prepayment speeds, credit risk and others.
Level 3
Prices determined using significant unobservable inputs. In situations where quoted prices or observable inputs are unavailable (for example, when there is little or no market activity for an investment at the end of the period), unobservable inputs may be used. Unobservable inputs reflect the Trustee's own assumptions about the factors market participants would use in valuing a portfolio instrument, and would be based on the best information available.
Changes in valuation techniques may result in transfers in or out of an investment's assigned level within the hierarchy. Transfers between fair value hierarchy levels are recognized at the end of the period. The following is a summary of the inputs used, as of December 31, 2015, involving the Fund's assets and liabilities carried at fair value. The inputs or methodologies used for valuing investments and other financial instruments may not be an indication of the risk associated with investing in those securities.
Level 1 Level 2 Level 3 Total
Investments in securities, long - Assets Debt Instruments $ - $ 329,379,752 $ - $ 329,379,752Government Issues - 466,095,433 - 466,095,433
Collective Investment Funds - 14,127,165 - 14,127,165
$ - $ 809,602,350 $ - $ 809,602,350
Please refer to the Schedule of Investments for additional information regarding composition of amounts listed above. C. Security Transactions and Investment Income Security transactions are accounted for as of the trade date. Realized gains and losses from investment transactions are determined using the average cost method. Distributions received from underlying funds, if any, are recorded on the ex-dividend date and retain the character of income as earned by the underlying funds. Dividend income, if any, is recorded on the ex-dividend date. Non-cash dividends, if any, are recorded at the fair value of the securities received. Interest income earned on securities, if any, is recorded on the accrual basis. Interest income includes accretion of discounts and amortization of premiums, if any. Paydown gains and losses on mortgage and asset-backed securities are included in interest income. Investment income and unrealized and realized gains or losses are allocated daily to each Class of the Fund based upon the relative proportion of net assets of each Class.

State Street Bank and Trust Company
State Street U.S. Government/Credit Bond Index Non-Lending Series Fund
Notes to Financial Statements December 31, 2015
113
D. Taxes It is the Fund's policy to comply with the requirements of Section 501(a) of the Internal Revenue Code relating to collective investment of employee benefit funds. Accordingly, the Fund is exempt from federal and state taxes and no federal or state tax provision is required. The Trustee has reviewed the Fund's tax positions for all open tax periods (current and prior tax periods) and has determined that no provision for income taxes is required in the Fund's financial statements. E. Issuances and Redemptions of Units of Participation The per unit net asset value of each Class is determined each business day. Issuances and redemptions of Class units may be made on such days, based upon the net asset value per unit as of the Class' valuation date last preceding the date on which such order to contribute or redeem assets is received. The Trustee, in its sole discretion, reserves the right to value any contribution or redemption as of the next succeeding valuation date or another date as the Trustee deems appropriate. Additional terms of participation are detailed in the Trust and the Fund’s other governing documents. Such terms may be implemented pursuant to the Trustee's prudent determination. F. Expenses Under the Trust, the Fund may pay certain expenses for services received. Each Class is charged its allocable share of the fees and expenses borne by the Fund that are not specifically allocated to one or more of the Classes. The Fund indirectly bears the expenses incurred by the underlying funds, if any. The Investment Manager charges a management fee to the Classes at the following rate of average daily net asset value:
Class Rate (%) Management Fees Class C 0.05 $ 88,360
Total Management Fees $ 88,360
Class A is not charged a direct management fee. SSGA receives investment fees from the Class participants and therefore, the Class makes no payments for these services. The Fund may be charged by the Trustee an annual administration fee equal to 0.01% of the average daily net asset value of the Fund and $5 per Fund transaction of securities and portfolio instruments. Alternatively, should the Fund, in the discretion of the Trustee, invest more than 50% of its assets directly in collective investment funds, the Trustee will instead charge an administration fee equal to $25,000 to each Class. This administration fee relates to the provision of custody, bookkeeping and accounting services, shareholder servicing, transfer agency and other services that the Trustee may from time to time consider necessary or appropriate. Please refer to the Additional Expense Information footnote for further disclosures regarding expenses. G. Treatment of Net Investment Income and Net Realized Gains Net investment income and net realized gains are retained by the Fund.

State Street Bank and Trust Company
State Street U.S. Government/Credit Bond Index Non-Lending Series Fund
Notes to Financial Statements December 31, 2015
114
3. Concentration of Ownership The following information illustrates concentration of ownership of participants owning units in excess of 10% of total units outstanding as well as units owned by other State Street Bank Collective Investment Funds. 10% or Greater Participants % of Units Outstanding held by other
# of Participants % of Units held State Street Bank Collective
Investment Funds
Class A 1 100% - % Class C 1 99% - %
4. Risks and Uncertainties A. Market and Credit Risk In the normal course of business, the Fund trades financial instruments and enters into financial transactions where risk of potential loss exists due to changes in the market (market risk) or failure of the counterparty to the transaction to perform (credit risk). The Fund may be exposed to additional credit risk that an institution or other entity with which the Fund has unsettled or open transactions will default. Additionally, if a counterparty is in bankruptcy, reorganization proceedings, becomes insolvent or otherwise fails to perform its obligations, the Fund may experience significant delays in obtaining any recovery.
5. Indemnifications In the normal course of business, the Fund enters into contracts that contain a variety of representations which provide general indemnifications. The Fund's maximum exposure under these arrangements is unknown as this would involve future claims that may be made against the Fund that have not yet occurred. However, based on experience, the Trustee expects the risk of loss to be remote.
6. Recent Accounting Pronouncements
In May 2015, the Financial Accounting Standards Board (“FASB”) issued an amendment to U.S. GAAP that removes the requirement to categorize within the fair value hierarchy investments for which fair value is measured using the net asset value per share practical expedient. The amendment is effective for the Fund on January 1, 2016. The Trustee does not anticipate that the adoption of the amendment will have a material effect on the Fund’s financial statements.
In August 2014, the FASB issued an amendment to U.S. GAAP which clarifies that management would be responsible for evaluating and disclosing conditions or events that raise substantial doubt about an entity’s ability to continue as a going concern. The amendment is effective for the Fund on January 1, 2017. The Trustee does not anticipate that the adoption of the amendment will have a material impact on the Fund’s financial statements.
7. Other
SSGA is involved in various industry-related and other regulatory, governmental and law enforcement inquiries and subpoenas. The Trustee has reviewed these matters in connection with these financial statements. Based upon that review, the Trustee has determined that no accrual or loss contingency is required on the Fund's financial statements.

State Street Bank and Trust Company
State Street U.S. Government/Credit Bond Index Non-Lending Series Fund
Notes to Financial Statements December 31, 2015
115
8. Subsequent Events The Trustee has evaluated subsequent events after December 31, 2015 through March 24, 2016, the date the financial statements were available to be issued, and has concluded that there is no impact requiring adjustment or disclosure in the financial statements, except for: Effective January 1, 2016, Class A will have a Total Annual Operating Expense Ratio equal to 0.012% of the Class' average daily net asset value. Effective January 1, 2016, Class C will have a Total Annual Operating Expense Ratio equal to 0.062% of the Class' average daily net asset value.
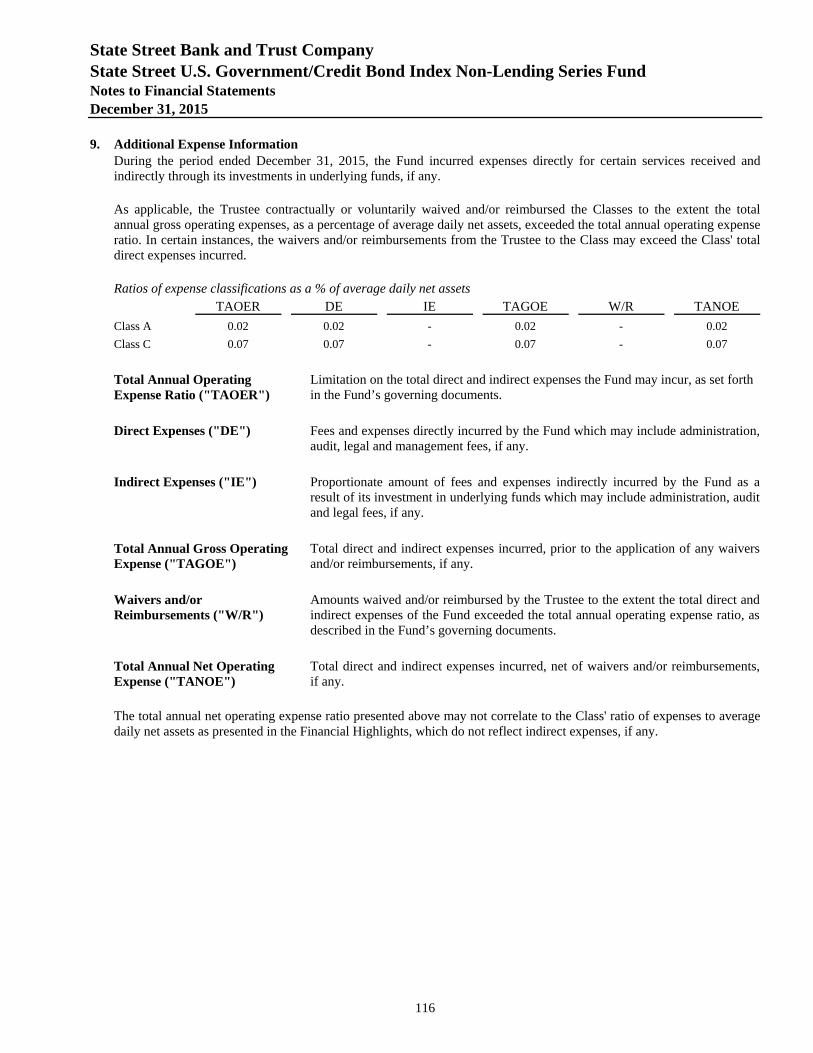
State Street Bank and Trust Company
State Street U.S. Government/Credit Bond Index Non-Lending Series Fund
Notes to Financial Statements December 31, 2015
116
9. Additional Expense Information During the period ended December 31, 2015, the Fund incurred expenses directly for certain services received and indirectly through its investments in underlying funds, if any. As applicable, the Trustee contractually or voluntarily waived and/or reimbursed the Classes to the extent the total annual gross operating expenses, as a percentage of average daily net assets, exceeded the total annual operating expense ratio. In certain instances, the waivers and/or reimbursements from the Trustee to the Class may exceed the Class' total direct expenses incurred. Ratios of expense classifications as a % of average daily net assets
TAOER DE IE TAGOE W/R TANOE
Class A 0.02 0.02 - 0.02 - 0.02 Class C 0.07 0.07 - 0.07 - 0.07 Total Annual Operating Expense Ratio ("TAOER")
Limitation on the total direct and indirect expenses the Fund may incur, as set forth in the Fund’s governing documents.
Direct Expenses ("DE")
Fees and expenses directly incurred by the Fund which may include administration, audit, legal and management fees, if any.
Indirect Expenses ("IE")
Proportionate amount of fees and expenses indirectly incurred by the Fund as a result of its investment in underlying funds which may include administration, audit and legal fees, if any.
Total Annual Gross Operating Expense ("TAGOE")
Total direct and indirect expenses incurred, prior to the application of any waivers and/or reimbursements, if any.
Waivers and/or Reimbursements ("W/R")
Amounts waived and/or reimbursed by the Trustee to the extent the total direct and indirect expenses of the Fund exceeded the total annual operating expense ratio, as described in the Fund’s governing documents.
Total Annual Net Operating Expense ("TANOE")
Total direct and indirect expenses incurred, net of waivers and/or reimbursements, if any.
The total annual net operating expense ratio presented above may not correlate to the Class' ratio of expenses to average daily net assets as presented in the Financial Highlights, which do not reflect indirect expenses, if any.